Stillwater, MN Map & Demographics
Stillwater Map
Stillwater Overview
$54,315
PER CAPITA INCOME
$117,686
AVG FAMILY INCOME
$107,986
AVG HOUSEHOLD INCOME
14.5%
WAGE / INCOME GAP [ % ]
85.5¢/ $1
WAGE / INCOME GAP [ $ ]
0.43
INEQUALITY / GINI INDEX
19,316
TOTAL POPULATION
9,784
MALE POPULATION
9,532
FEMALE POPULATION
102.64
MALES / 100 FEMALES
97.42
FEMALES / 100 MALES
41.8
MEDIAN AGE
2.9
AVG FAMILY SIZE
2.5
AVG HOUSEHOLD SIZE
10,336
LABOR FORCE [ PEOPLE ]
65.9%
PERCENT IN LABOR FORCE
2.6%
UNEMPLOYMENT RATE
Stillwater Zip Codes
Stillwater Area Codes
Income in Stillwater
Income Overview in Stillwater
Per Capita Income in Stillwater is $54,315, while median incomes of families and households are $117,686 and $107,986 respectively.
| Characteristic | Number | Measure |
| Per Capita Income | 19,316 | $54,315 |
| Median Family Income | 5,095 | $117,686 |
| Mean Family Income | 5,095 | $160,062 |
| Median Household Income | 7,586 | $107,986 |
| Mean Household Income | 7,586 | $138,201 |
| Income Deficit | 5,095 | $0 |
| Wage / Income Gap (%) | 19,316 | 14.48% |
| Wage / Income Gap ($) | 19,316 | 85.52¢ per $1 |
| Gini / Inequality Index | 19,316 | 0.43 |
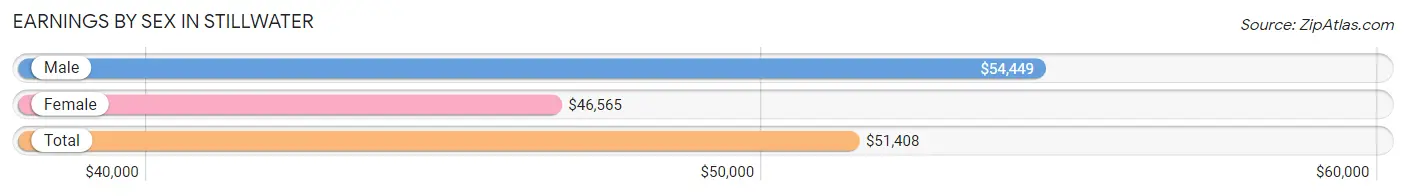
Earnings by Sex in Stillwater
Average Earnings in Stillwater are $51,408, $54,449 for men and $46,565 for women, a difference of 14.5%.
| Sex | Number | Average Earnings |
| Male | 6,251 (57.3%) | $54,449 |
| Female | 4,655 (42.7%) | $46,565 |
| Total | 10,906 (100.0%) | $51,408 |
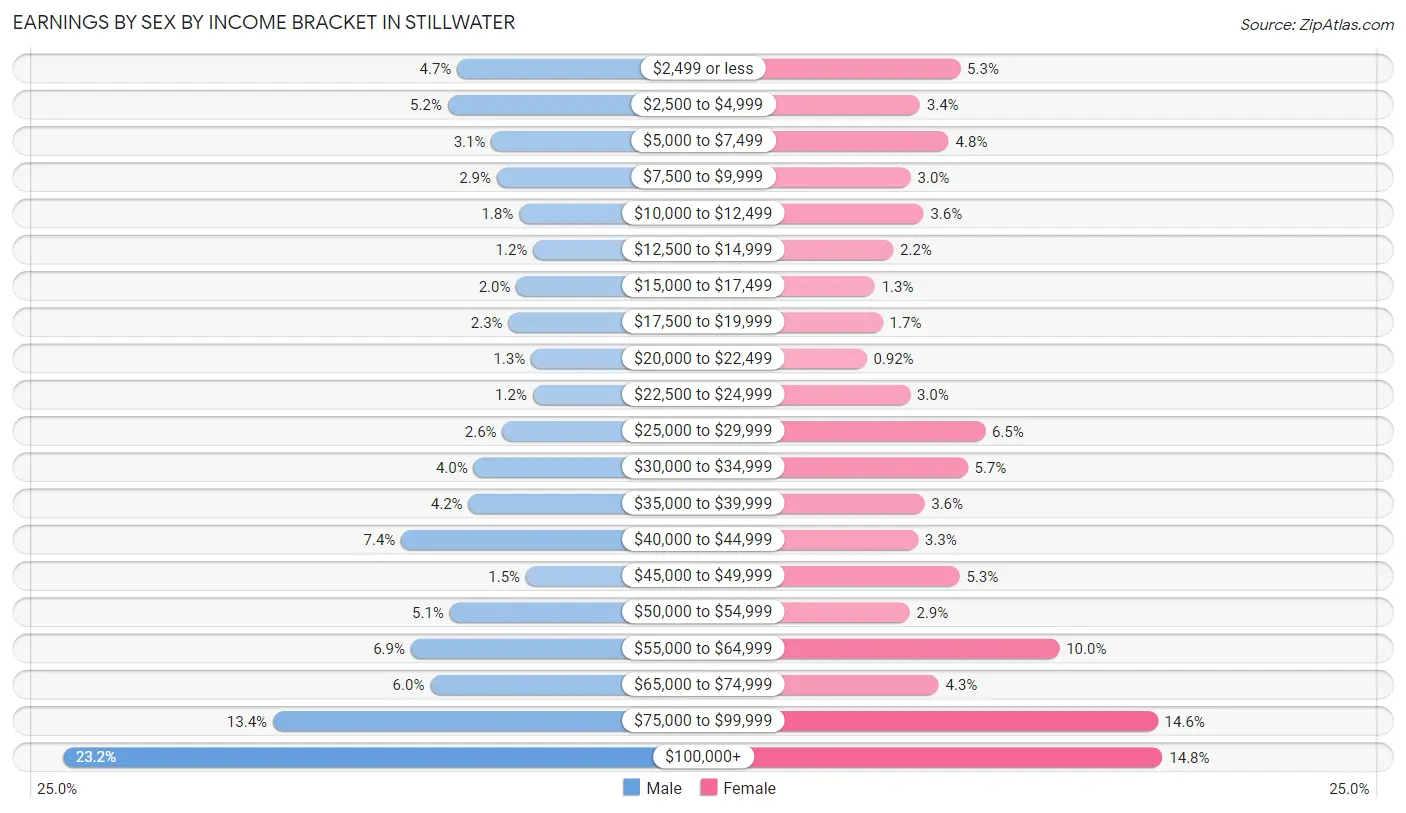
Earnings by Sex by Income Bracket in Stillwater
The most common earnings brackets in Stillwater are $100,000+ for men (1,451 | 23.2%) and $100,000+ for women (688 | 14.8%).
| Income | Male | Female |
| $2,499 or less | 296 (4.7%) | 247 (5.3%) |
| $2,500 to $4,999 | 324 (5.2%) | 159 (3.4%) |
| $5,000 to $7,499 | 196 (3.1%) | 222 (4.8%) |
| $7,500 to $9,999 | 180 (2.9%) | 139 (3.0%) |
| $10,000 to $12,499 | 115 (1.8%) | 167 (3.6%) |
| $12,500 to $14,999 | 74 (1.2%) | 101 (2.2%) |
| $15,000 to $17,499 | 123 (2.0%) | 61 (1.3%) |
| $17,500 to $19,999 | 146 (2.3%) | 78 (1.7%) |
| $20,000 to $22,499 | 80 (1.3%) | 43 (0.9%) |
| $22,500 to $24,999 | 75 (1.2%) | 138 (3.0%) |
| $25,000 to $29,999 | 164 (2.6%) | 301 (6.5%) |
| $30,000 to $34,999 | 248 (4.0%) | 263 (5.7%) |
| $35,000 to $39,999 | 263 (4.2%) | 169 (3.6%) |
| $40,000 to $44,999 | 460 (7.4%) | 155 (3.3%) |
| $45,000 to $49,999 | 95 (1.5%) | 246 (5.3%) |
| $50,000 to $54,999 | 318 (5.1%) | 137 (2.9%) |
| $55,000 to $64,999 | 432 (6.9%) | 463 (10.0%) |
| $65,000 to $74,999 | 375 (6.0%) | 200 (4.3%) |
| $75,000 to $99,999 | 836 (13.4%) | 678 (14.6%) |
| $100,000+ | 1,451 (23.2%) | 688 (14.8%) |
| Total | 6,251 (100.0%) | 4,655 (100.0%) |
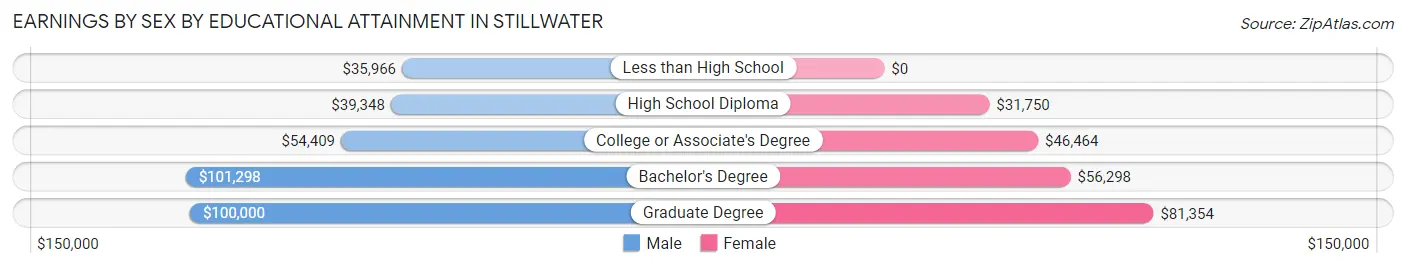
Earnings by Sex by Educational Attainment in Stillwater
Average earnings in Stillwater are $68,750 for men and $52,074 for women, a difference of 24.3%. Men with an educational attainment of bachelor's degree enjoy the highest average annual earnings of $101,298, while those with less than high school education earn the least with $35,966. Women with an educational attainment of graduate degree earn the most with the average annual earnings of $81,354, while those with high school diploma education have the smallest earnings of $31,750.
| Educational Attainment | Male Income | Female Income |
| Less than High School | $35,966 | $0 |
| High School Diploma | $39,348 | $31,750 |
| College or Associate's Degree | $54,409 | $46,464 |
| Bachelor's Degree | $101,298 | $56,298 |
| Graduate Degree | $100,000 | $81,354 |
| Total | $68,750 | $52,074 |
Family Income in Stillwater
Family Income Brackets in Stillwater
According to the Stillwater family income data, there are 1,406 families falling into the $100,000 to $149,999 income range, which is the most common income bracket and makes up 27.6% of all families. Conversely, the $10,000 to $14,999 income bracket is the least frequent group with only 41 families (0.8%) belonging to this category.
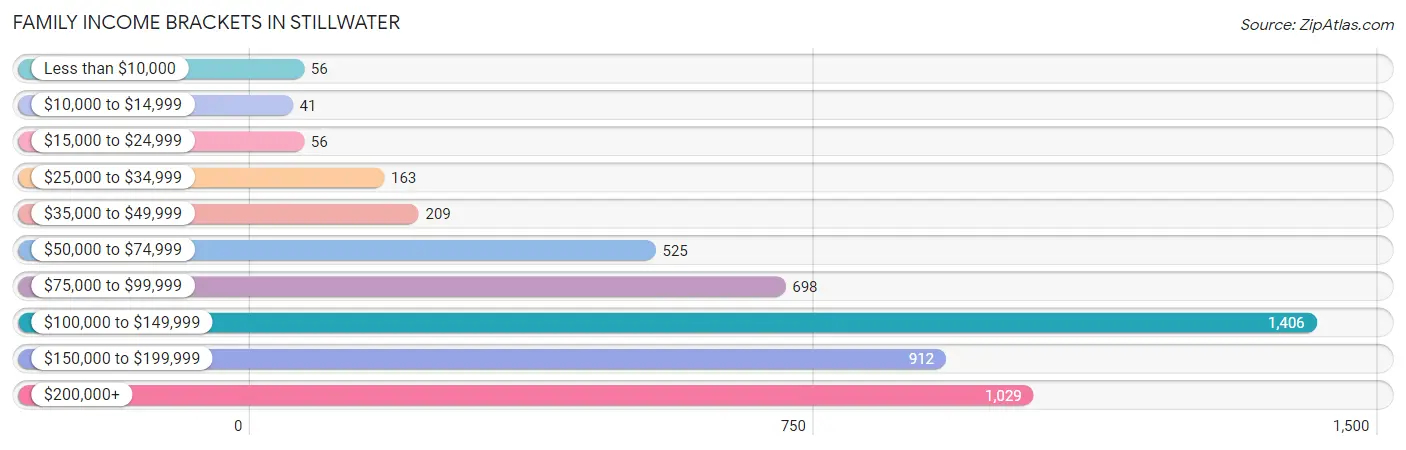
| Income Bracket | # Families | % Families |
| Less than $10,000 | 56 | 1.1% |
| $10,000 to $14,999 | 41 | 0.8% |
| $15,000 to $24,999 | 56 | 1.1% |
| $25,000 to $34,999 | 163 | 3.2% |
| $35,000 to $49,999 | 209 | 4.1% |
| $50,000 to $74,999 | 525 | 10.3% |
| $75,000 to $99,999 | 698 | 13.7% |
| $100,000 to $149,999 | 1,406 | 27.6% |
| $150,000 to $199,999 | 912 | 17.9% |
| $200,000+ | 1,029 | 20.2% |
Family Income by Famaliy Size in Stillwater
5-person families (485 | 9.5%) account for the highest median family income in Stillwater with $170,931 per family, while 2-person families (2,481 | 48.7%) have the highest median income of $56,447 per family member.
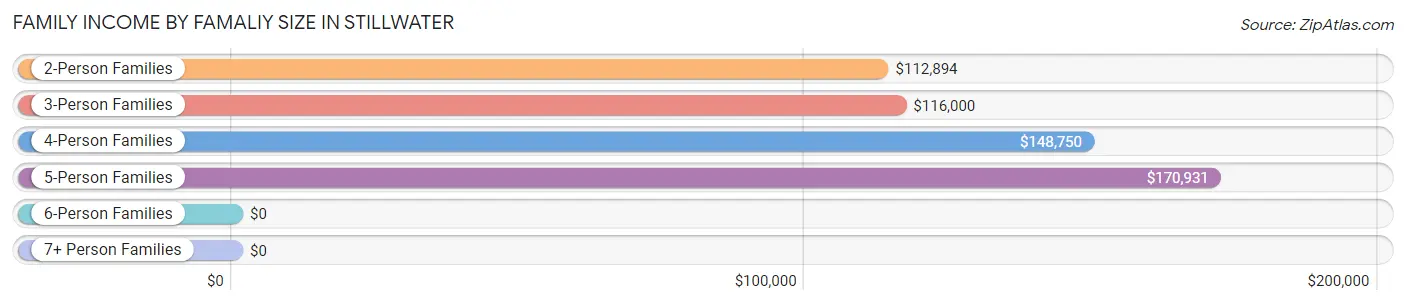
| Income Bracket | # Families | Median Income |
| 2-Person Families | 2,481 (48.7%) | $112,894 |
| 3-Person Families | 1,102 (21.6%) | $116,000 |
| 4-Person Families | 918 (18.0%) | $148,750 |
| 5-Person Families | 485 (9.5%) | $170,931 |
| 6-Person Families | 83 (1.6%) | $0 |
| 7+ Person Families | 26 (0.5%) | $0 |
| Total | 5,095 (100.0%) | $117,686 |
Family Income by Number of Earners in Stillwater
The median family income in Stillwater is $117,686, with families comprising 3+ earners (765) having the highest median family income of $166,458, while families with no earners (811) have the lowest median family income of $95,813, accounting for 15.0% and 15.9% of families, respectively.
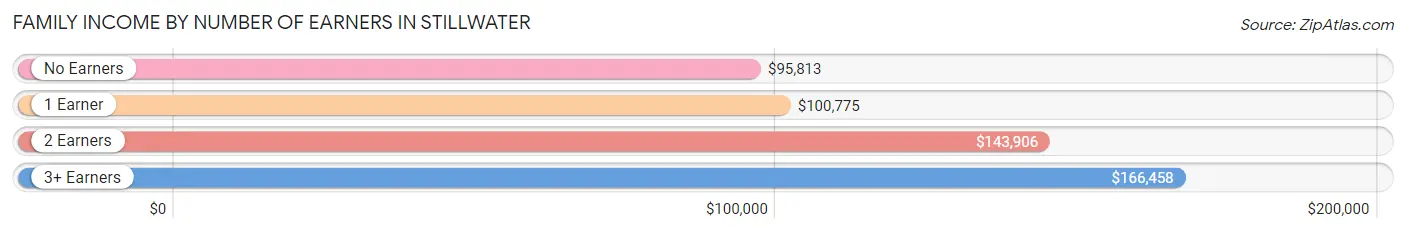
| Number of Earners | # Families | Median Income |
| No Earners | 811 (15.9%) | $95,813 |
| 1 Earner | 1,482 (29.1%) | $100,775 |
| 2 Earners | 2,037 (40.0%) | $143,906 |
| 3+ Earners | 765 (15.0%) | $166,458 |
| Total | 5,095 (100.0%) | $117,686 |
Household Income in Stillwater
Household Income Brackets in Stillwater
With 1,737 households falling in the category, the $100,000 to $149,999 income range is the most frequent in Stillwater, accounting for 22.9% of all households. In contrast, only 152 households (2.0%) fall into the $10,000 to $14,999 income bracket, making it the least populous group.
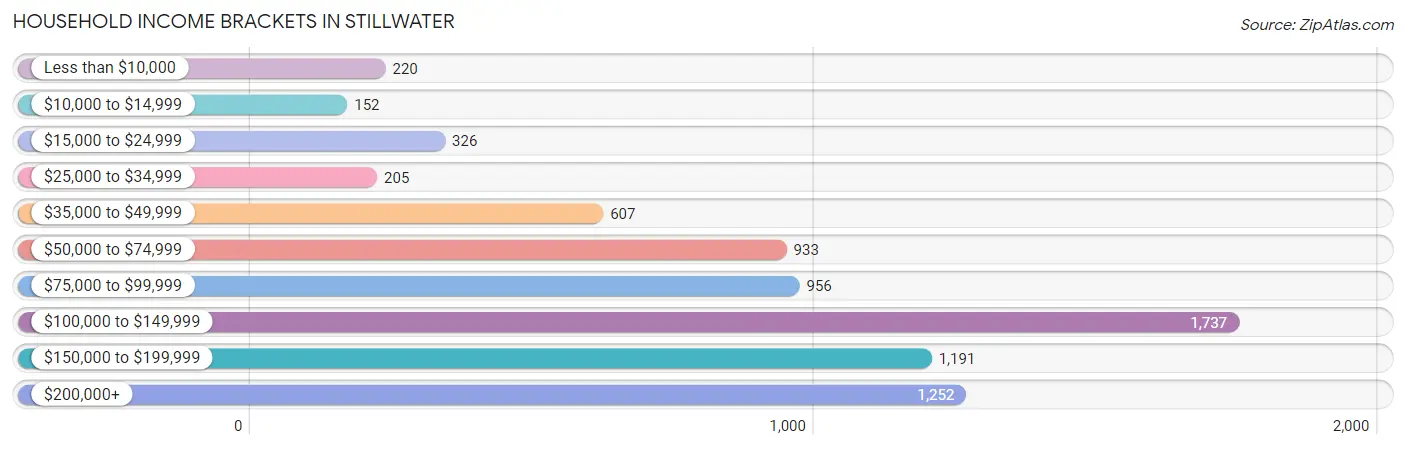
| Income Bracket | # Households | % Households |
| Less than $10,000 | 220 | 2.9% |
| $10,000 to $14,999 | 152 | 2.0% |
| $15,000 to $24,999 | 326 | 4.3% |
| $25,000 to $34,999 | 205 | 2.7% |
| $35,000 to $49,999 | 607 | 8.0% |
| $50,000 to $74,999 | 933 | 12.3% |
| $75,000 to $99,999 | 956 | 12.6% |
| $100,000 to $149,999 | 1,737 | 22.9% |
| $150,000 to $199,999 | 1,191 | 15.7% |
| $200,000+ | 1,252 | 16.5% |
Household Income by Householder Age in Stillwater
The median household income in Stillwater is $107,986, with the highest median household income of $130,490 found in the 45 to 64 years age bracket for the primary householder. A total of 2,778 households (36.6%) fall into this category. Meanwhile, the 15 to 24 years age bracket for the primary householder has the lowest median household income of $0, with 373 households (4.9%) in this group.
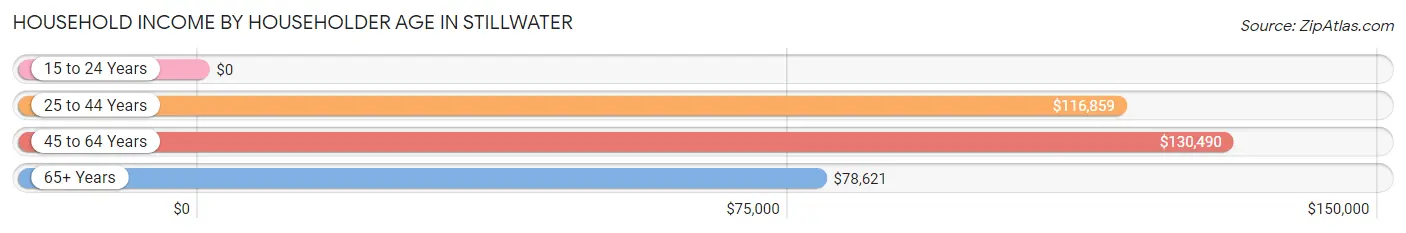
| Income Bracket | # Households | Median Income |
| 15 to 24 Years | 373 (4.9%) | $0 |
| 25 to 44 Years | 2,045 (27.0%) | $116,859 |
| 45 to 64 Years | 2,778 (36.6%) | $130,490 |
| 65+ Years | 2,390 (31.5%) | $78,621 |
| Total | 7,586 (100.0%) | $107,986 |
Poverty in Stillwater
Income Below Poverty by Sex and Age in Stillwater
With 5.5% poverty level for males and 6.8% for females among the residents of Stillwater, 5 year old males and 15 year old females are the most vulnerable to poverty, with 10 males (10.5%) and 21 females (22.1%) in their respective age groups living below the poverty level.
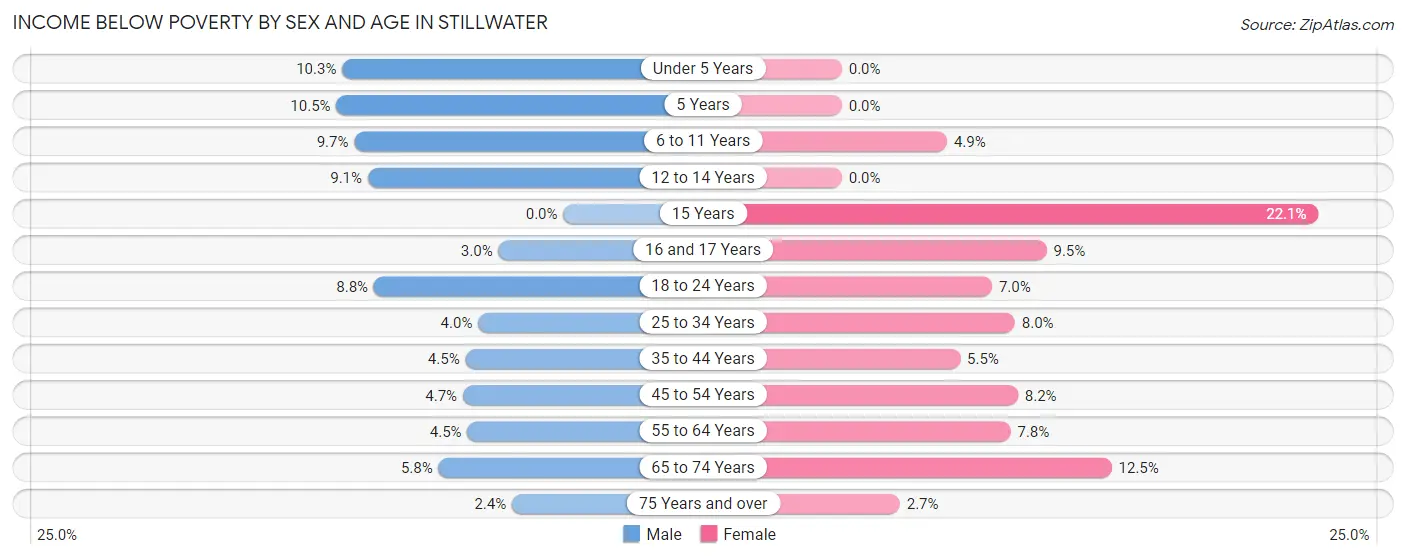
| Age Bracket | Male | Female |
| Under 5 Years | 32 (10.3%) | 0 (0.0%) |
| 5 Years | 10 (10.5%) | 0 (0.0%) |
| 6 to 11 Years | 46 (9.7%) | 49 (4.9%) |
| 12 to 14 Years | 38 (9.1%) | 0 (0.0%) |
| 15 Years | 0 (0.0%) | 21 (22.1%) |
| 16 and 17 Years | 10 (3.0%) | 21 (9.5%) |
| 18 to 24 Years | 95 (8.8%) | 38 (7.0%) |
| 25 to 34 Years | 59 (4.0%) | 75 (8.0%) |
| 35 to 44 Years | 52 (4.5%) | 60 (5.5%) |
| 45 to 54 Years | 56 (4.7%) | 90 (8.2%) |
| 55 to 64 Years | 52 (4.4%) | 111 (7.8%) |
| 65 to 74 Years | 56 (5.8%) | 149 (12.5%) |
| 75 Years and over | 17 (2.4%) | 20 (2.7%) |
| Total | 523 (5.5%) | 634 (6.8%) |
Income Above Poverty by Sex and Age in Stillwater
According to the poverty statistics in Stillwater, males aged 15 years and females aged under 5 years are the age groups that are most secure financially, with 100.0% of males and 100.0% of females in these age groups living above the poverty line.
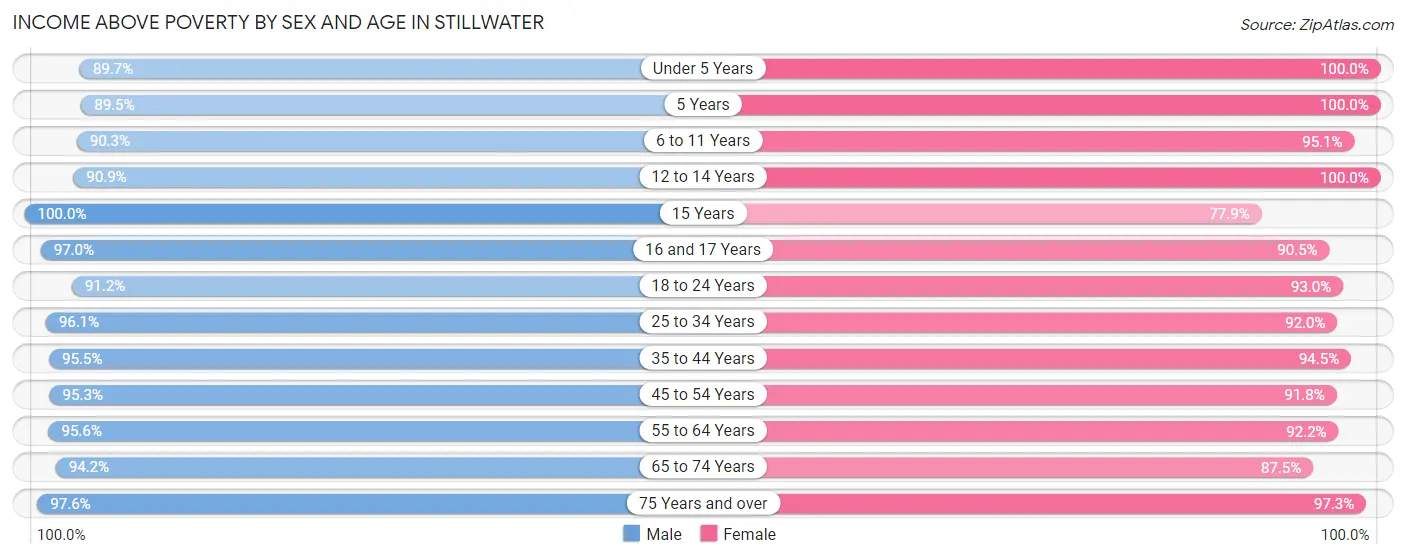
| Age Bracket | Male | Female |
| Under 5 Years | 280 (89.7%) | 513 (100.0%) |
| 5 Years | 85 (89.5%) | 84 (100.0%) |
| 6 to 11 Years | 428 (90.3%) | 955 (95.1%) |
| 12 to 14 Years | 381 (90.9%) | 446 (100.0%) |
| 15 Years | 127 (100.0%) | 74 (77.9%) |
| 16 and 17 Years | 322 (97.0%) | 200 (90.5%) |
| 18 to 24 Years | 986 (91.2%) | 507 (93.0%) |
| 25 to 34 Years | 1,436 (96.1%) | 859 (92.0%) |
| 35 to 44 Years | 1,094 (95.5%) | 1,032 (94.5%) |
| 45 to 54 Years | 1,146 (95.3%) | 1,012 (91.8%) |
| 55 to 64 Years | 1,116 (95.6%) | 1,306 (92.2%) |
| 65 to 74 Years | 911 (94.2%) | 1,041 (87.5%) |
| 75 Years and over | 697 (97.6%) | 723 (97.3%) |
| Total | 9,009 (94.5%) | 8,752 (93.2%) |
Income Below Poverty Among Married-Couple Families in Stillwater
The poverty statistics for married-couple families in Stillwater show that 2.3% or 93 of the total 3,993 families live below the poverty line. Families with 1 or 2 children have the highest poverty rate of 4.4%, comprising of 55 families. On the other hand, families with 3 or 4 children have the lowest poverty rate of 0.0%, which includes 0 families.
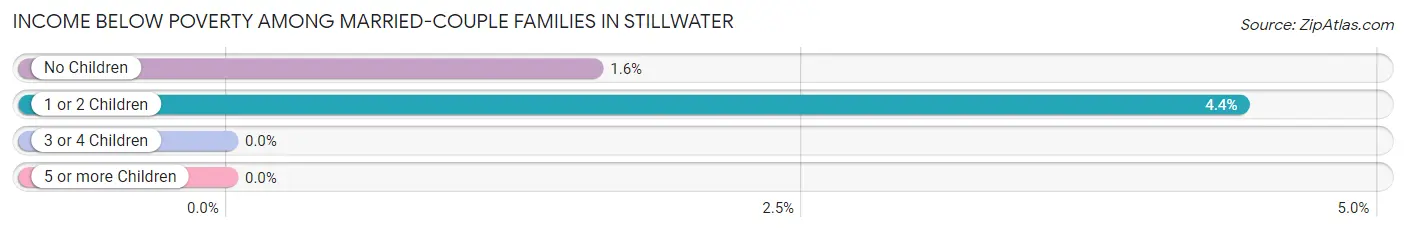
| Children | Above Poverty | Below Poverty |
| No Children | 2,355 (98.4%) | 38 (1.6%) |
| 1 or 2 Children | 1,195 (95.6%) | 55 (4.4%) |
| 3 or 4 Children | 324 (100.0%) | 0 (0.0%) |
| 5 or more Children | 26 (100.0%) | 0 (0.0%) |
| Total | 3,900 (97.7%) | 93 (2.3%) |
Income Below Poverty Among Single-Parent Households in Stillwater
According to the poverty data in Stillwater, 3.8% or 11 single-father households and 9.3% or 76 single-mother households are living below the poverty line. Among single-father households, those with 1 or 2 children have the highest poverty rate, with 11 households (5.9%) experiencing poverty. Likewise, among single-mother households, those with 3 or 4 children have the highest poverty rate, with 13 households (100.0%) falling below the poverty line.
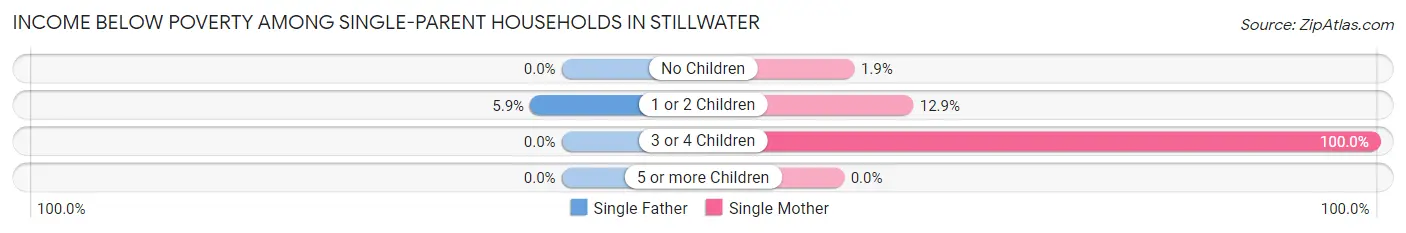
| Children | Single Father | Single Mother |
| No Children | 0 (0.0%) | 7 (1.9%) |
| 1 or 2 Children | 11 (5.9%) | 56 (12.9%) |
| 3 or 4 Children | 0 (0.0%) | 13 (100.0%) |
| 5 or more Children | 0 (0.0%) | 0 (0.0%) |
| Total | 11 (3.8%) | 76 (9.3%) |
Income Below Poverty Among Married-Couple vs Single-Parent Households in Stillwater
The poverty data for Stillwater shows that 93 of the married-couple family households (2.3%) and 87 of the single-parent households (7.9%) are living below the poverty level. Within the married-couple family households, those with 1 or 2 children have the highest poverty rate, with 55 households (4.4%) falling below the poverty line. Among the single-parent households, those with 3 or 4 children have the highest poverty rate, with 13 household (22.4%) living below poverty.
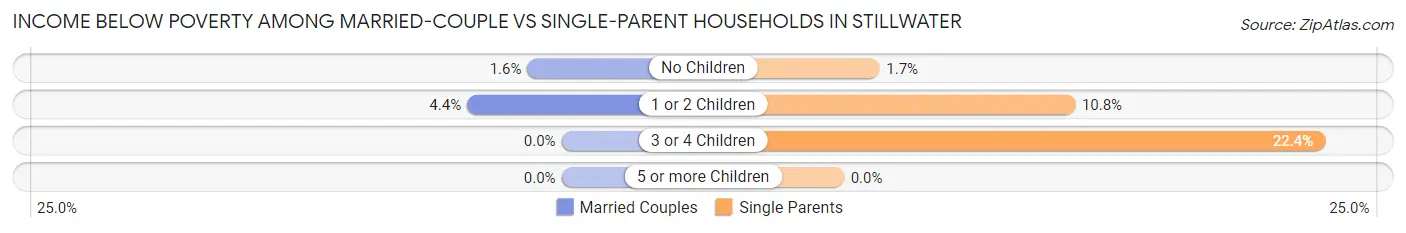
| Children | Married-Couple Families | Single-Parent Households |
| No Children | 38 (1.6%) | 7 (1.7%) |
| 1 or 2 Children | 55 (4.4%) | 67 (10.8%) |
| 3 or 4 Children | 0 (0.0%) | 13 (22.4%) |
| 5 or more Children | 0 (0.0%) | 0 (0.0%) |
| Total | 93 (2.3%) | 87 (7.9%) |
Race in Stillwater
The most populous races in Stillwater are White / Caucasian (16,836 | 87.2%), Hispanic or Latino (1,283 | 6.6%), and Two or more Races (1,010 | 5.2%).
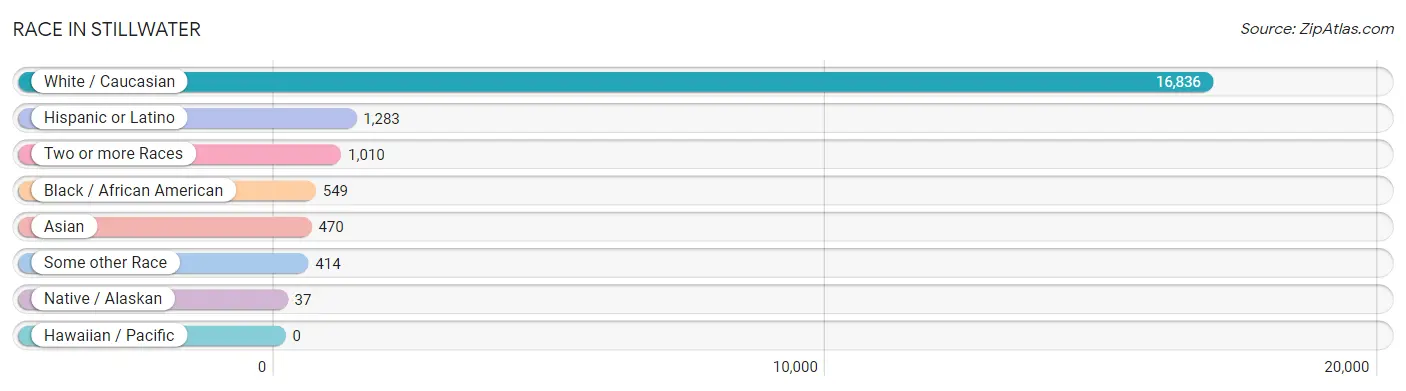
| Race | # Population | % Population |
| Asian | 470 | 2.4% |
| Black / African American | 549 | 2.8% |
| Hawaiian / Pacific | 0 | 0.0% |
| Hispanic or Latino | 1,283 | 6.6% |
| Native / Alaskan | 37 | 0.2% |
| White / Caucasian | 16,836 | 87.2% |
| Two or more Races | 1,010 | 5.2% |
| Some other Race | 414 | 2.1% |
| Total | 19,316 | 100.0% |
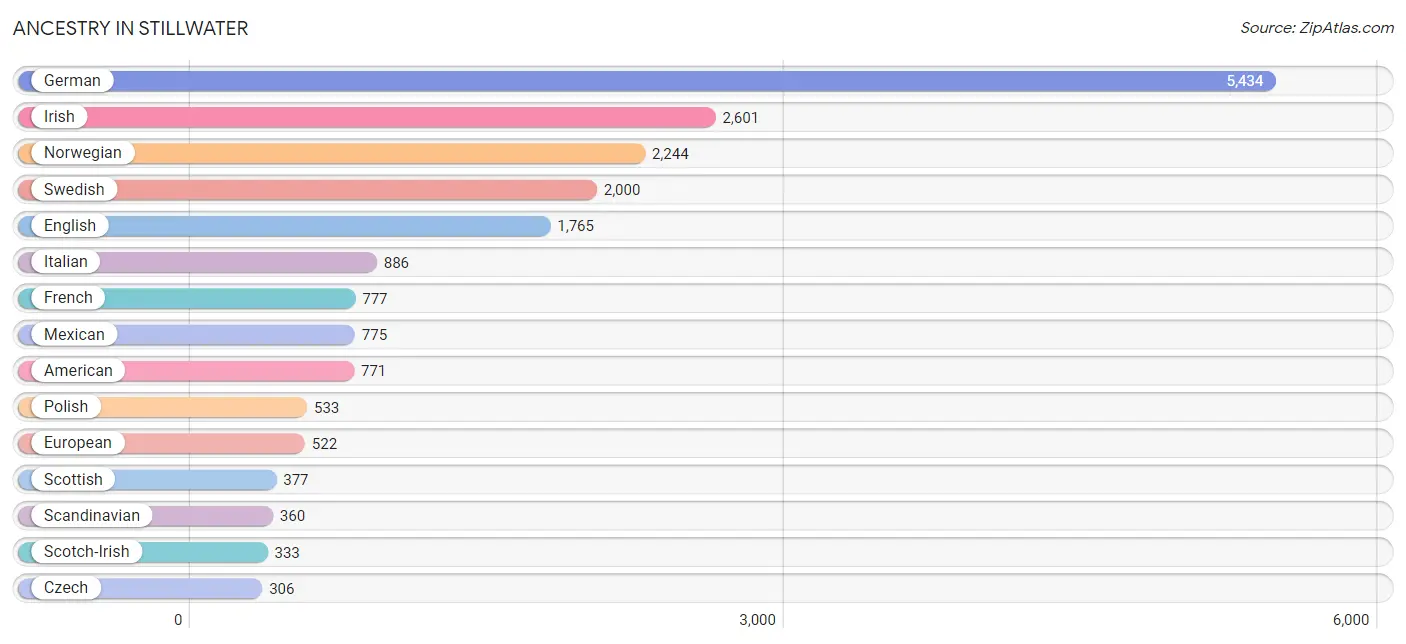
Ancestry in Stillwater
The most populous ancestries reported in Stillwater are German (5,434 | 28.1%), Irish (2,601 | 13.5%), Norwegian (2,244 | 11.6%), Swedish (2,000 | 10.3%), and English (1,765 | 9.1%), together accounting for 72.7% of all Stillwater residents.
| Ancestry | # Population | % Population |
| African | 173 | 0.9% |
| American | 771 | 4.0% |
| Apache | 15 | 0.1% |
| Arab | 115 | 0.6% |
| Argentinean | 14 | 0.1% |
| Australian | 18 | 0.1% |
| Austrian | 85 | 0.4% |
| Bangladeshi | 11 | 0.1% |
| Belgian | 135 | 0.7% |
| Bhutanese | 22 | 0.1% |
| British | 96 | 0.5% |
| Burmese | 103 | 0.5% |
| Canadian | 23 | 0.1% |
| Central American | 36 | 0.2% |
| Cherokee | 13 | 0.1% |
| Chickasaw | 22 | 0.1% |
| Chippewa | 72 | 0.4% |
| Colombian | 12 | 0.1% |
| Costa Rican | 14 | 0.1% |
| Cree | 2 | 0.0% |
| Croatian | 28 | 0.1% |
| Cuban | 31 | 0.2% |
| Czech | 306 | 1.6% |
| Czechoslovakian | 33 | 0.2% |
| Danish | 193 | 1.0% |
| Delaware | 28 | 0.1% |
| Dutch | 198 | 1.0% |
| Eastern European | 165 | 0.9% |
| Egyptian | 9 | 0.1% |
| English | 1,765 | 9.1% |
| European | 522 | 2.7% |
| Filipino | 1 | 0.0% |
| Finnish | 188 | 1.0% |
| French | 777 | 4.0% |
| French Canadian | 239 | 1.2% |
| German | 5,434 | 28.1% |
| Greek | 16 | 0.1% |
| Guatemalan | 22 | 0.1% |
| Haitian | 15 | 0.1% |
| Hungarian | 48 | 0.3% |
| Indian (Asian) | 266 | 1.4% |
| Irish | 2,601 | 13.5% |
| Italian | 886 | 4.6% |
| Japanese | 10 | 0.1% |
| Korean | 36 | 0.2% |
| Latvian | 13 | 0.1% |
| Lebanese | 54 | 0.3% |
| Lithuanian | 3 | 0.0% |
| Malaysian | 24 | 0.1% |
| Mexican | 775 | 4.0% |
| Nigerian | 14 | 0.1% |
| Northern European | 89 | 0.5% |
| Norwegian | 2,244 | 11.6% |
| Palestinian | 45 | 0.2% |
| Peruvian | 60 | 0.3% |
| Polish | 533 | 2.8% |
| Potawatomi | 11 | 0.1% |
| Puerto Rican | 10 | 0.1% |
| Romanian | 18 | 0.1% |
| Russian | 96 | 0.5% |
| Scandinavian | 360 | 1.9% |
| Scotch-Irish | 333 | 1.7% |
| Scottish | 377 | 1.9% |
| Serbian | 29 | 0.2% |
| Sioux | 25 | 0.1% |
| Slavic | 23 | 0.1% |
| Slovak | 4 | 0.0% |
| Slovene | 13 | 0.1% |
| South American | 86 | 0.4% |
| Spaniard | 221 | 1.1% |
| Spanish | 42 | 0.2% |
| Sri Lankan | 74 | 0.4% |
| Subsaharan African | 200 | 1.0% |
| Sudanese | 13 | 0.1% |
| Swedish | 2,000 | 10.3% |
| Swiss | 97 | 0.5% |
| Thai | 54 | 0.3% |
| Ukrainian | 12 | 0.1% |
| Welsh | 95 | 0.5% |
| Yugoslavian | 14 | 0.1% | View All 80 Rows |
Immigrants in Stillwater
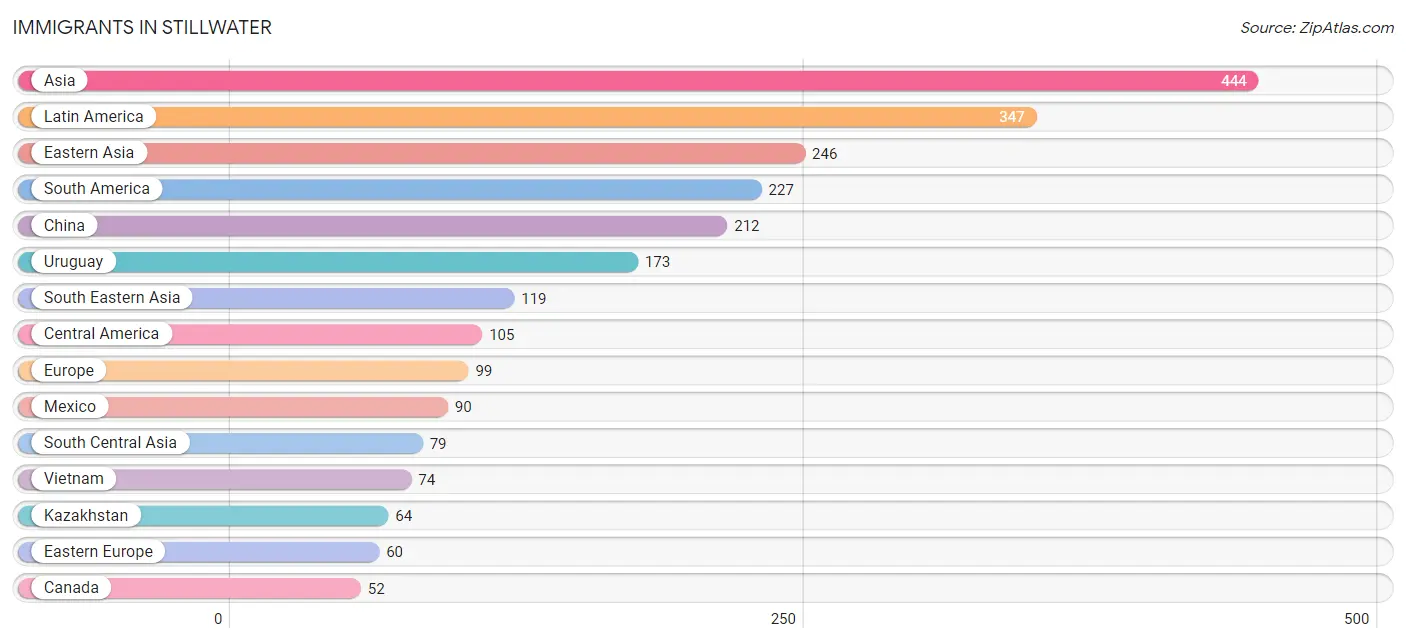
The most numerous immigrant groups reported in Stillwater came from Asia (444 | 2.3%), Latin America (347 | 1.8%), Eastern Asia (246 | 1.3%), South America (227 | 1.2%), and China (212 | 1.1%), together accounting for 7.6% of all Stillwater residents.
| Immigration Origin | # Population | % Population |
| Africa | 30 | 0.2% |
| Argentina | 14 | 0.1% |
| Asia | 444 | 2.3% |
| Cambodia | 10 | 0.1% |
| Canada | 52 | 0.3% |
| Caribbean | 15 | 0.1% |
| Central America | 105 | 0.5% |
| China | 212 | 1.1% |
| Czechoslovakia | 6 | 0.0% |
| Eastern Asia | 246 | 1.3% |
| Eastern Europe | 60 | 0.3% |
| Egypt | 9 | 0.1% |
| England | 6 | 0.0% |
| Europe | 99 | 0.5% |
| Germany | 11 | 0.1% |
| Guatemala | 15 | 0.1% |
| Haiti | 15 | 0.1% |
| Hong Kong | 25 | 0.1% |
| Italy | 13 | 0.1% |
| Kazakhstan | 64 | 0.3% |
| Korea | 34 | 0.2% |
| Laos | 34 | 0.2% |
| Latin America | 347 | 1.8% |
| Mexico | 90 | 0.5% |
| Nepal | 15 | 0.1% |
| Northern Africa | 29 | 0.2% |
| Northern Europe | 15 | 0.1% |
| Norway | 9 | 0.1% |
| Peru | 40 | 0.2% |
| Philippines | 1 | 0.0% |
| Russia | 25 | 0.1% |
| South Africa | 1 | 0.0% |
| South America | 227 | 1.2% |
| South Central Asia | 79 | 0.4% |
| South Eastern Asia | 119 | 0.6% |
| Southern Europe | 13 | 0.1% |
| Sudan | 20 | 0.1% |
| Taiwan | 1 | 0.0% |
| Ukraine | 6 | 0.0% |
| Uruguay | 173 | 0.9% |
| Vietnam | 74 | 0.4% |
| Western Europe | 11 | 0.1% | View All 42 Rows |
Sex and Age in Stillwater
Sex and Age in Stillwater
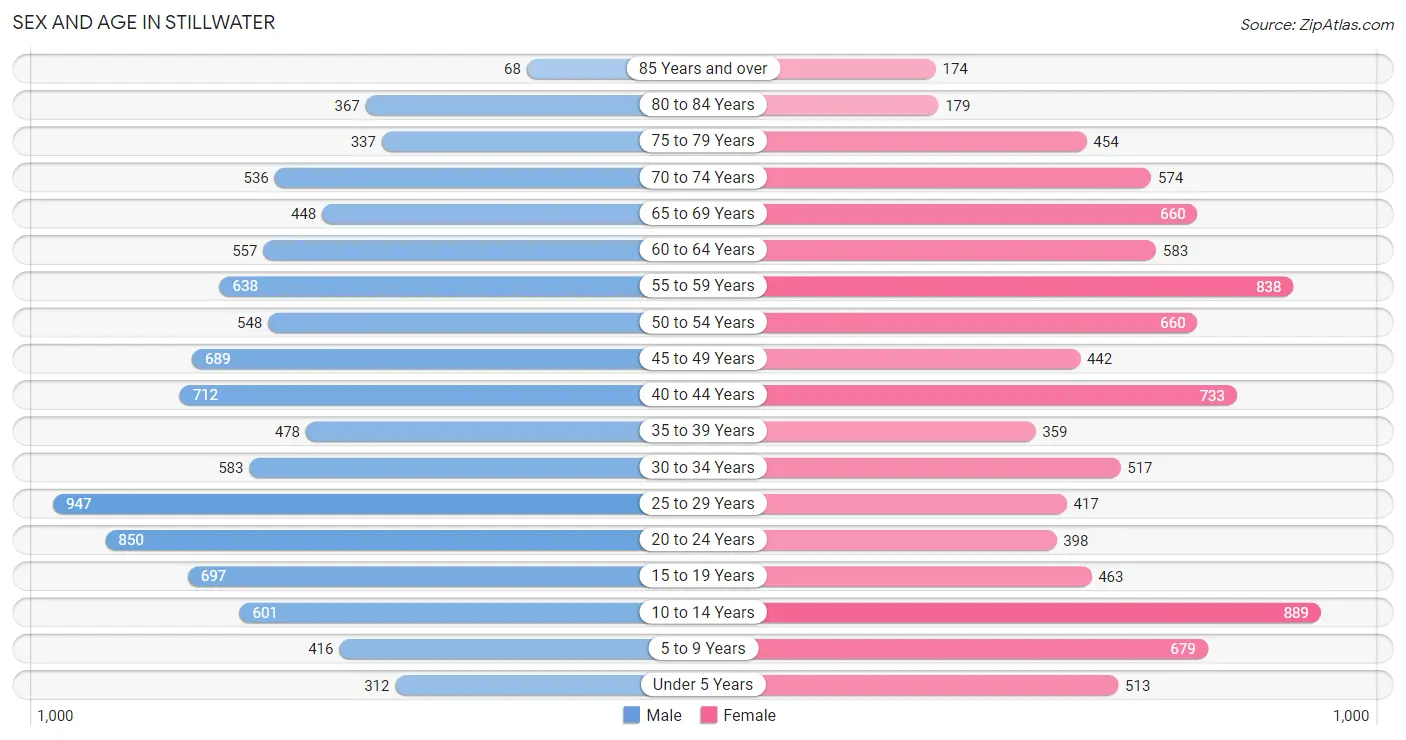
The most populous age groups in Stillwater are 25 to 29 Years (947 | 9.7%) for men and 10 to 14 Years (889 | 9.3%) for women.
| Age Bracket | Male | Female |
| Under 5 Years | 312 (3.2%) | 513 (5.4%) |
| 5 to 9 Years | 416 (4.3%) | 679 (7.1%) |
| 10 to 14 Years | 601 (6.1%) | 889 (9.3%) |
| 15 to 19 Years | 697 (7.1%) | 463 (4.9%) |
| 20 to 24 Years | 850 (8.7%) | 398 (4.2%) |
| 25 to 29 Years | 947 (9.7%) | 417 (4.4%) |
| 30 to 34 Years | 583 (6.0%) | 517 (5.4%) |
| 35 to 39 Years | 478 (4.9%) | 359 (3.8%) |
| 40 to 44 Years | 712 (7.3%) | 733 (7.7%) |
| 45 to 49 Years | 689 (7.0%) | 442 (4.6%) |
| 50 to 54 Years | 548 (5.6%) | 660 (6.9%) |
| 55 to 59 Years | 638 (6.5%) | 838 (8.8%) |
| 60 to 64 Years | 557 (5.7%) | 583 (6.1%) |
| 65 to 69 Years | 448 (4.6%) | 660 (6.9%) |
| 70 to 74 Years | 536 (5.5%) | 574 (6.0%) |
| 75 to 79 Years | 337 (3.4%) | 454 (4.8%) |
| 80 to 84 Years | 367 (3.7%) | 179 (1.9%) |
| 85 Years and over | 68 (0.7%) | 174 (1.8%) |
| Total | 9,784 (100.0%) | 9,532 (100.0%) |
Families and Households in Stillwater
Median Family Size in Stillwater
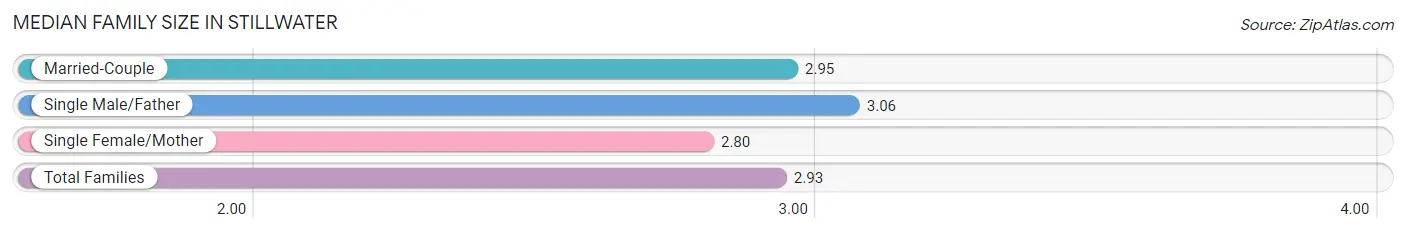
The median family size in Stillwater is 2.93 persons per family, with single male/father families (289 | 5.7%) accounting for the largest median family size of 3.06 persons per family. On the other hand, single female/mother families (813 | 16.0%) represent the smallest median family size with 2.80 persons per family.
| Family Type | # Families | Family Size |
| Married-Couple | 3,993 (78.4%) | 2.95 |
| Single Male/Father | 289 (5.7%) | 3.06 |
| Single Female/Mother | 813 (16.0%) | 2.80 |
| Total Families | 5,095 (100.0%) | 2.93 |
Median Household Size in Stillwater
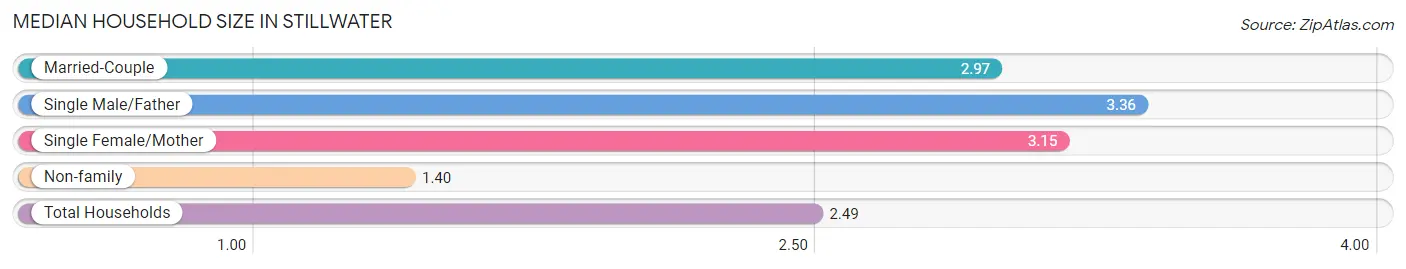
The median household size in Stillwater is 2.49 persons per household, with single male/father households (289 | 3.8%) accounting for the largest median household size of 3.36 persons per household. non-family households (2,491 | 32.8%) represent the smallest median household size with 1.40 persons per household.
| Household Type | # Households | Household Size |
| Married-Couple | 3,993 (52.6%) | 2.97 |
| Single Male/Father | 289 (3.8%) | 3.36 |
| Single Female/Mother | 813 (10.7%) | 3.15 |
| Non-family | 2,491 (32.8%) | 1.40 |
| Total Households | 7,586 (100.0%) | 2.49 |
Household Size by Marriage Status in Stillwater
Out of a total of 7,586 households in Stillwater, 5,095 (67.2%) are family households, while 2,491 (32.8%) are nonfamily households. The most numerous type of family households are 2-person households, comprising 2,255, and the most common type of nonfamily households are 1-person households, comprising 1,850.
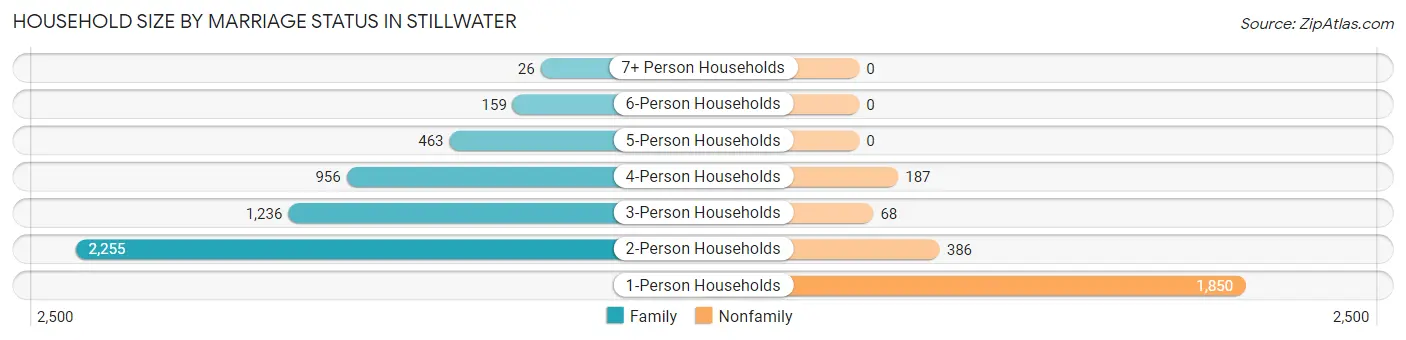
| Household Size | Family Households | Nonfamily Households |
| 1-Person Households | - | 1,850 (24.4%) |
| 2-Person Households | 2,255 (29.7%) | 386 (5.1%) |
| 3-Person Households | 1,236 (16.3%) | 68 (0.9%) |
| 4-Person Households | 956 (12.6%) | 187 (2.5%) |
| 5-Person Households | 463 (6.1%) | 0 (0.0%) |
| 6-Person Households | 159 (2.1%) | 0 (0.0%) |
| 7+ Person Households | 26 (0.3%) | 0 (0.0%) |
| Total | 5,095 (67.2%) | 2,491 (32.8%) |
Female Fertility in Stillwater
Fertility by Age in Stillwater
Average fertility rate in Stillwater is 58.0 births per 1,000 women. Women in the age bracket of 20 to 34 years have the highest fertility rate with 137.0 births per 1,000 women. Women in the age bracket of 20 to 34 years acount for 90.1% of all women with births.
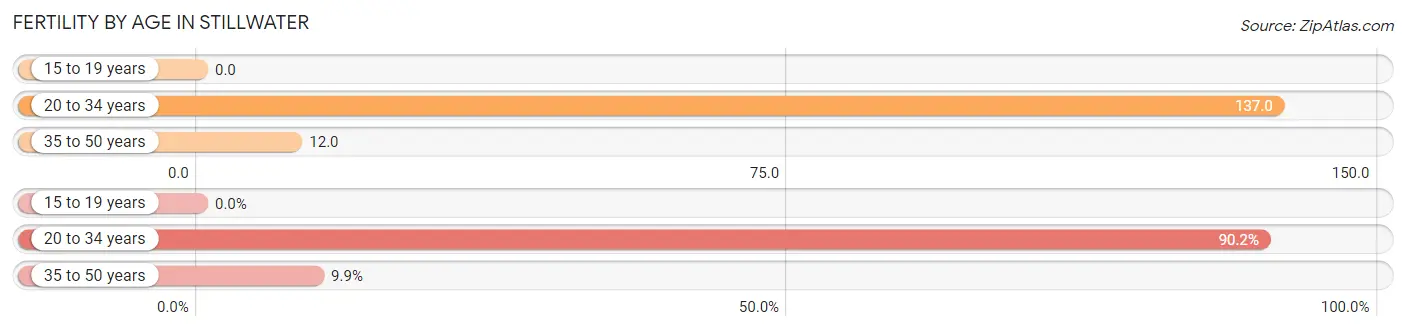
| Age Bracket | Women with Births | Births / 1,000 Women |
| 15 to 19 years | 0 (0.0%) | 0.0 |
| 20 to 34 years | 183 (90.1%) | 137.0 |
| 35 to 50 years | 20 (9.9%) | 12.0 |
| Total | 203 (100.0%) | 58.0 |
Fertility by Age by Marriage Status in Stillwater
96.1% of women with births (203) in Stillwater are married. The highest percentage of unmarried women with births falls into 20 to 34 years age bracket with 4.4% of them unmarried at the time of birth, while the lowest percentage of unmarried women with births belong to 35 to 50 years age bracket with 0.0% of them unmarried.
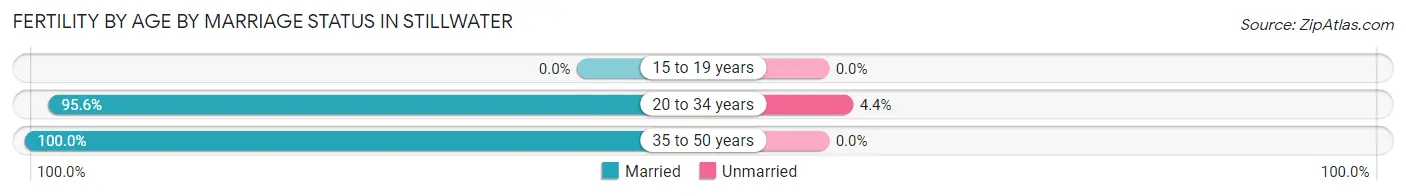
| Age Bracket | Married | Unmarried |
| 15 to 19 years | 0 (0.0%) | 0 (0.0%) |
| 20 to 34 years | 175 (95.6%) | 8 (4.4%) |
| 35 to 50 years | 20 (100.0%) | 0 (0.0%) |
| Total | 195 (96.1%) | 8 (3.9%) |
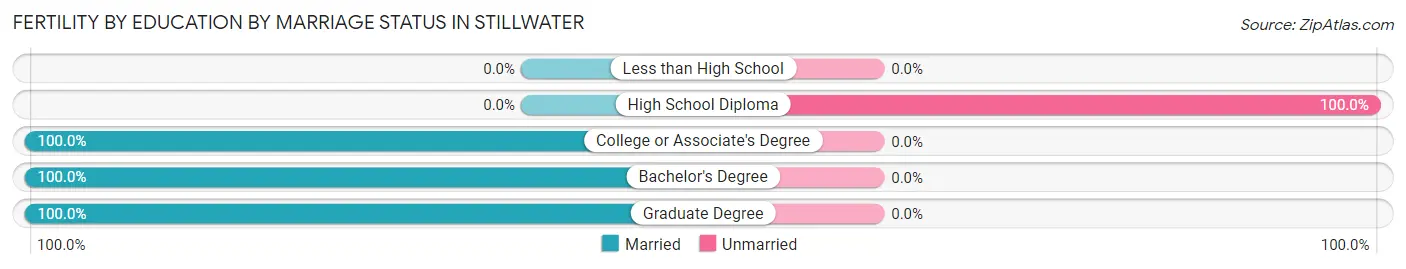
Fertility by Education in Stillwater
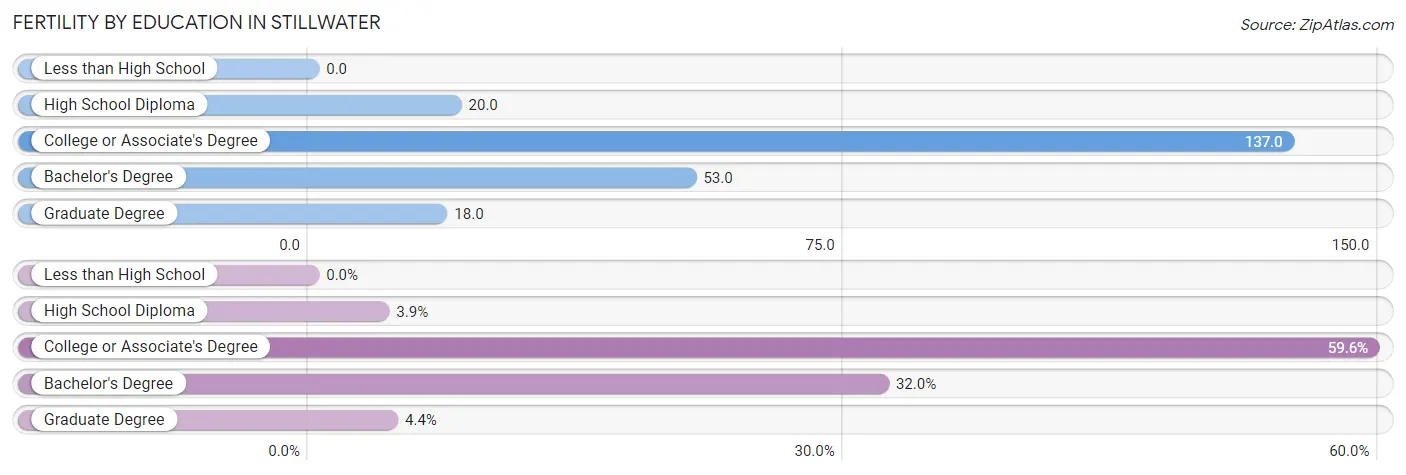
| Educational Attainment | Women with Births | Births / 1,000 Women |
| Less than High School | 0 (0.0%) | 0.0 |
| High School Diploma | 8 (3.9%) | 20.0 |
| College or Associate's Degree | 121 (59.6%) | 137.0 |
| Bachelor's Degree | 65 (32.0%) | 53.0 |
| Graduate Degree | 9 (4.4%) | 18.0 |
| Total | 203 (100.0%) | 58.0 |
Fertility by Education by Marriage Status in Stillwater
3.9% of women with births in Stillwater are unmarried. Women with the educational attainment of college or associate's degree are most likely to be married with 100.0% of them married at childbirth, while women with the educational attainment of high school diploma are least likely to be married with 100.0% of them unmarried at childbirth.
| Educational Attainment | Married | Unmarried |
| Less than High School | 0 (0.0%) | 0 (0.0%) |
| High School Diploma | 0 (0.0%) | 8 (100.0%) |
| College or Associate's Degree | 121 (100.0%) | 0 (0.0%) |
| Bachelor's Degree | 65 (100.0%) | 0 (0.0%) |
| Graduate Degree | 9 (100.0%) | 0 (0.0%) |
| Total | 195 (96.1%) | 8 (3.9%) |
Employment Characteristics in Stillwater
Employment by Class of Employer in Stillwater
Among the 9,808 employed individuals in Stillwater, private company employees (6,276 | 64.0%), not-for-profit organizations (1,301 | 13.3%), and local government employees (618 | 6.3%) make up the most common classes of employment.
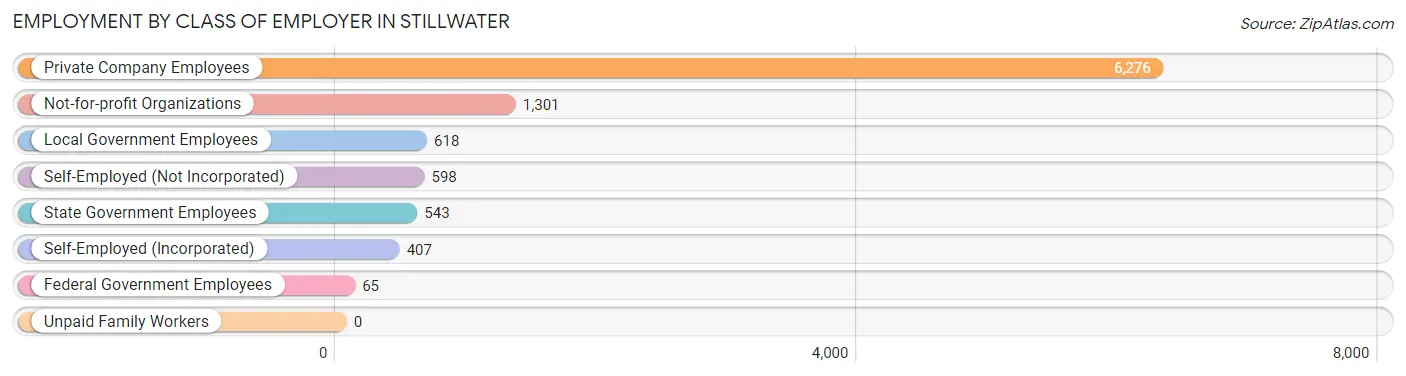
| Employer Class | # Employees | % Employees |
| Private Company Employees | 6,276 | 64.0% |
| Self-Employed (Incorporated) | 407 | 4.2% |
| Self-Employed (Not Incorporated) | 598 | 6.1% |
| Not-for-profit Organizations | 1,301 | 13.3% |
| Local Government Employees | 618 | 6.3% |
| State Government Employees | 543 | 5.5% |
| Federal Government Employees | 65 | 0.7% |
| Unpaid Family Workers | 0 | 0.0% |
| Total | 9,808 | 100.0% |
Employment Status by Age in Stillwater
According to the labor force statistics for Stillwater, out of the total population over 16 years of age (15,684), 65.9% or 10,336 individuals are in the labor force, with 2.6% or 269 of them unemployed. The age group with the highest labor force participation rate is 45 to 54 years, with 92.7% or 2,168 individuals in the labor force. Within the labor force, the 65 to 74 years age range has the highest percentage of unemployed individuals, with 9.0% or 39 of them being unemployed.
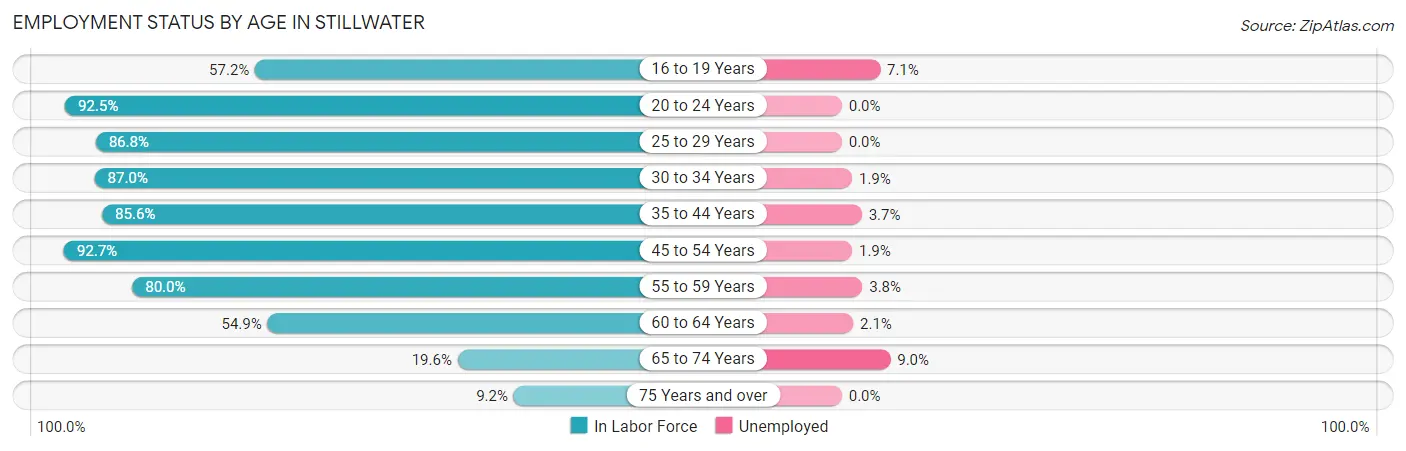
| Age Bracket | In Labor Force | Unemployed |
| 16 to 19 Years | 537 (57.2%) | 38 (7.1%) |
| 20 to 24 Years | 1,154 (92.5%) | 0 (0.0%) |
| 25 to 29 Years | 1,184 (86.8%) | 0 (0.0%) |
| 30 to 34 Years | 957 (87.0%) | 18 (1.9%) |
| 35 to 44 Years | 1,953 (85.6%) | 72 (3.7%) |
| 45 to 54 Years | 2,168 (92.7%) | 41 (1.9%) |
| 55 to 59 Years | 1,181 (80.0%) | 45 (3.8%) |
| 60 to 64 Years | 626 (54.9%) | 13 (2.1%) |
| 65 to 74 Years | 435 (19.6%) | 39 (9.0%) |
| 75 Years and over | 145 (9.2%) | 0 (0.0%) |
| Total | 10,336 (65.9%) | 269 (2.6%) |
Employment Status by Educational Attainment in Stillwater
According to labor force statistics for Stillwater, 83.2% of individuals (8,071) out of the total population between 25 and 64 years of age (9,701) are in the labor force, with 2.4% or 194 of them being unemployed. The group with the highest labor force participation rate are those with the educational attainment of bachelor's degree or higher, with 86.7% or 4,299 individuals in the labor force. Within the labor force, individuals with high school diploma education have the highest percentage of unemployment, with 9.9% or 119 of them being unemployed.
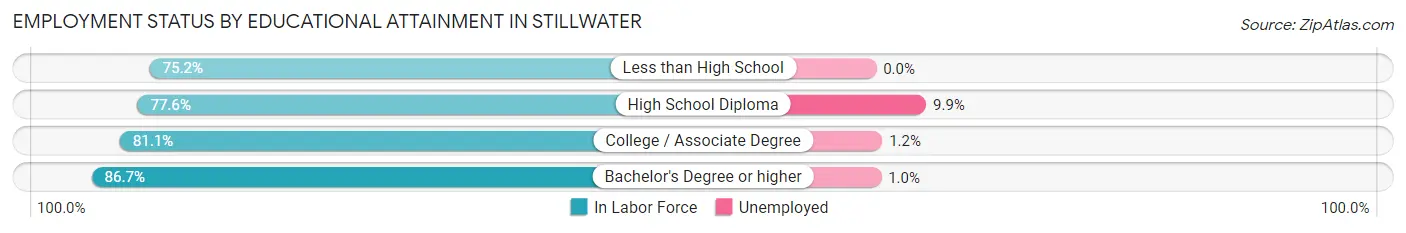
| Educational Attainment | In Labor Force | Unemployed |
| Less than High School | 231 (75.2%) | 0 (0.0%) |
| High School Diploma | 1,197 (77.6%) | 153 (9.9%) |
| College / Associate Degree | 2,346 (81.1%) | 35 (1.2%) |
| Bachelor's Degree or higher | 4,299 (86.7%) | 50 (1.0%) |
| Total | 8,071 (83.2%) | 233 (2.4%) |
Employment Occupations by Sex in Stillwater
Management, Business, Science and Arts Occupations
The most common Management, Business, Science and Arts occupations in Stillwater are Management (1,433 | 14.2%), Community & Social Service (1,287 | 12.8%), Computers, Engineering & Science (701 | 7.0%), Health Diagnosing & Treating (647 | 6.4%), and Education Instruction & Library (641 | 6.4%).

Management, Business, Science and Arts Occupations by Sex
Within the Management, Business, Science and Arts occupations in Stillwater, the most male-oriented occupations are Computers & Mathematics (86.7%), Computers, Engineering & Science (81.6%), and Architecture & Engineering (78.2%), while the most female-oriented occupations are Health Technologists (83.5%), Health Diagnosing & Treating (75.7%), and Education, Arts & Media (68.2%).
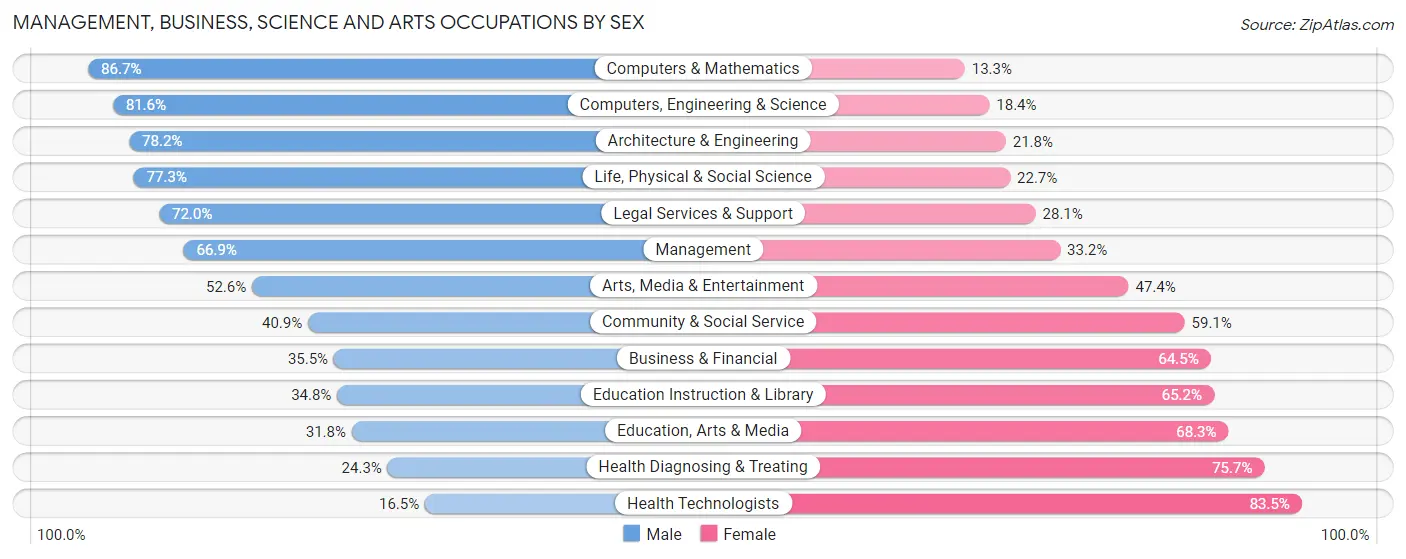
| Occupation | Male | Female |
| Management | 958 (66.8%) | 475 (33.2%) |
| Business & Financial | 216 (35.5%) | 393 (64.5%) |
| Computers, Engineering & Science | 572 (81.6%) | 129 (18.4%) |
| Computers & Mathematics | 255 (86.7%) | 39 (13.3%) |
| Architecture & Engineering | 215 (78.2%) | 60 (21.8%) |
| Life, Physical & Social Science | 102 (77.3%) | 30 (22.7%) |
| Community & Social Service | 526 (40.9%) | 761 (59.1%) |
| Education, Arts & Media | 80 (31.8%) | 172 (68.2%) |
| Legal Services & Support | 59 (72.0%) | 23 (28.1%) |
| Education Instruction & Library | 223 (34.8%) | 418 (65.2%) |
| Arts, Media & Entertainment | 164 (52.6%) | 148 (47.4%) |
| Health Diagnosing & Treating | 157 (24.3%) | 490 (75.7%) |
| Health Technologists | 78 (16.5%) | 396 (83.5%) |
| Total (Category) | 2,429 (51.9%) | 2,248 (48.1%) |
| Total (Overall) | 5,701 (56.6%) | 4,374 (43.4%) |
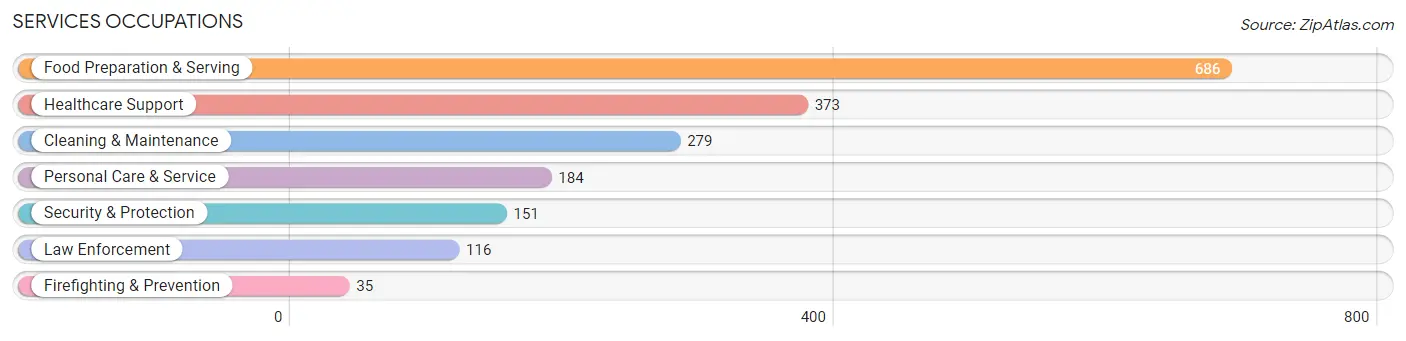
Services Occupations
The most common Services occupations in Stillwater are Food Preparation & Serving (686 | 6.8%), Healthcare Support (373 | 3.7%), Cleaning & Maintenance (279 | 2.8%), Personal Care & Service (184 | 1.8%), and Security & Protection (151 | 1.5%).
Services Occupations by Sex
Within the Services occupations in Stillwater, the most male-oriented occupations are Law Enforcement (94.0%), Security & Protection (90.7%), and Firefighting & Prevention (80.0%), while the most female-oriented occupations are Personal Care & Service (84.8%), Healthcare Support (55.2%), and Cleaning & Maintenance (44.8%).
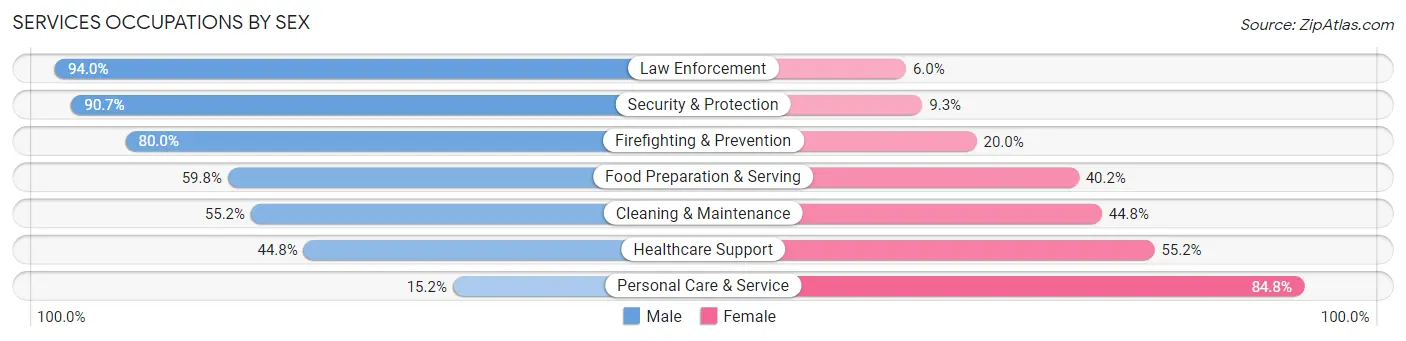
| Occupation | Male | Female |
| Healthcare Support | 167 (44.8%) | 206 (55.2%) |
| Security & Protection | 137 (90.7%) | 14 (9.3%) |
| Firefighting & Prevention | 28 (80.0%) | 7 (20.0%) |
| Law Enforcement | 109 (94.0%) | 7 (6.0%) |
| Food Preparation & Serving | 410 (59.8%) | 276 (40.2%) |
| Cleaning & Maintenance | 154 (55.2%) | 125 (44.8%) |
| Personal Care & Service | 28 (15.2%) | 156 (84.8%) |
| Total (Category) | 896 (53.6%) | 777 (46.4%) |
| Total (Overall) | 5,701 (56.6%) | 4,374 (43.4%) |
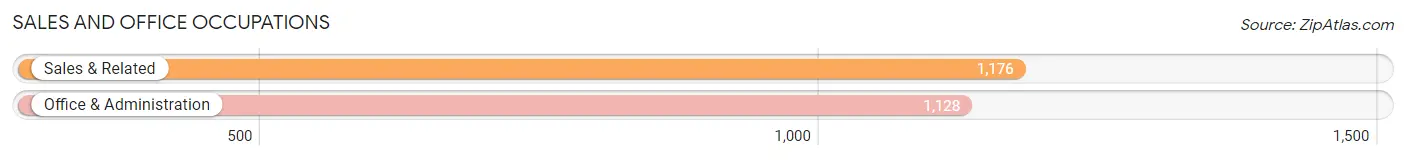
Sales and Office Occupations
The most common Sales and Office occupations in Stillwater are Sales & Related (1,176 | 11.7%), and Office & Administration (1,128 | 11.2%).
Sales and Office Occupations by Sex
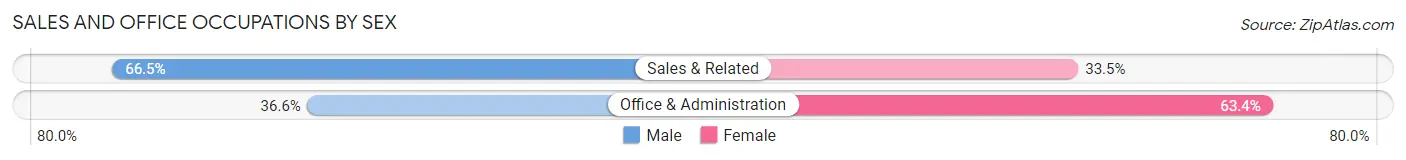
| Occupation | Male | Female |
| Sales & Related | 782 (66.5%) | 394 (33.5%) |
| Office & Administration | 413 (36.6%) | 715 (63.4%) |
| Total (Category) | 1,195 (51.9%) | 1,109 (48.1%) |
| Total (Overall) | 5,701 (56.6%) | 4,374 (43.4%) |
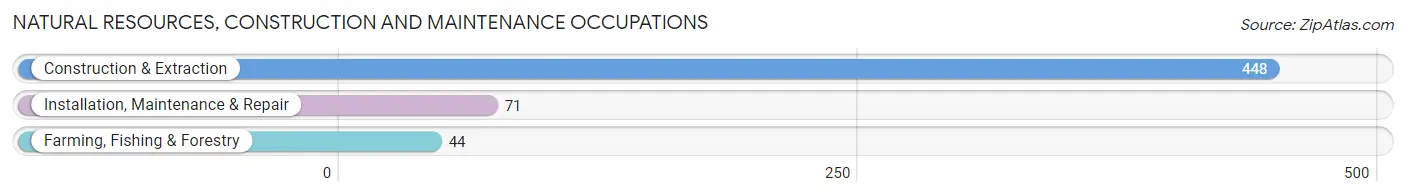
Natural Resources, Construction and Maintenance Occupations
The most common Natural Resources, Construction and Maintenance occupations in Stillwater are Construction & Extraction (448 | 4.4%), Installation, Maintenance & Repair (71 | 0.7%), and Farming, Fishing & Forestry (44 | 0.4%).
Natural Resources, Construction and Maintenance Occupations by Sex
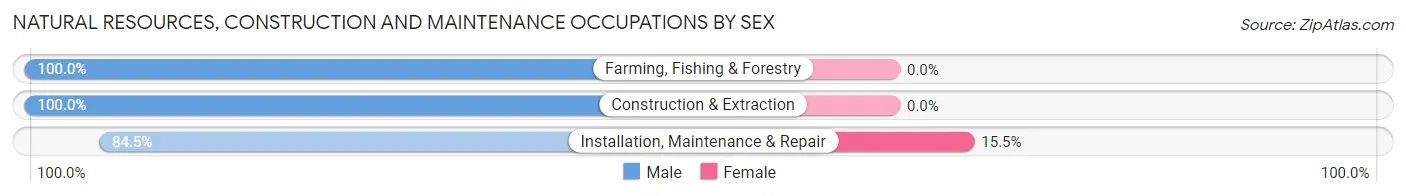
| Occupation | Male | Female |
| Farming, Fishing & Forestry | 44 (100.0%) | 0 (0.0%) |
| Construction & Extraction | 448 (100.0%) | 0 (0.0%) |
| Installation, Maintenance & Repair | 60 (84.5%) | 11 (15.5%) |
| Total (Category) | 552 (98.1%) | 11 (1.9%) |
| Total (Overall) | 5,701 (56.6%) | 4,374 (43.4%) |
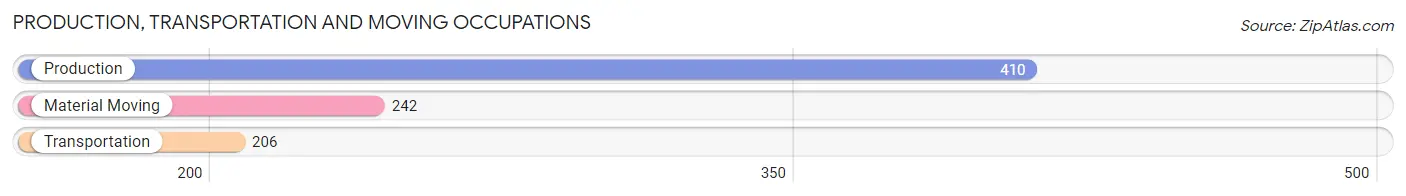
Production, Transportation and Moving Occupations
The most common Production, Transportation and Moving occupations in Stillwater are Production (410 | 4.1%), Material Moving (242 | 2.4%), and Transportation (206 | 2.0%).
Production, Transportation and Moving Occupations by Sex
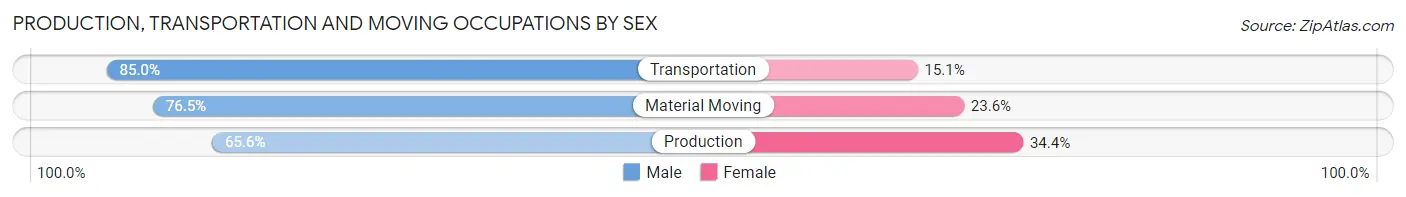
| Occupation | Male | Female |
| Production | 269 (65.6%) | 141 (34.4%) |
| Transportation | 175 (85.0%) | 31 (15.0%) |
| Material Moving | 185 (76.4%) | 57 (23.5%) |
| Total (Category) | 629 (73.3%) | 229 (26.7%) |
| Total (Overall) | 5,701 (56.6%) | 4,374 (43.4%) |
Employment Industries by Sex in Stillwater
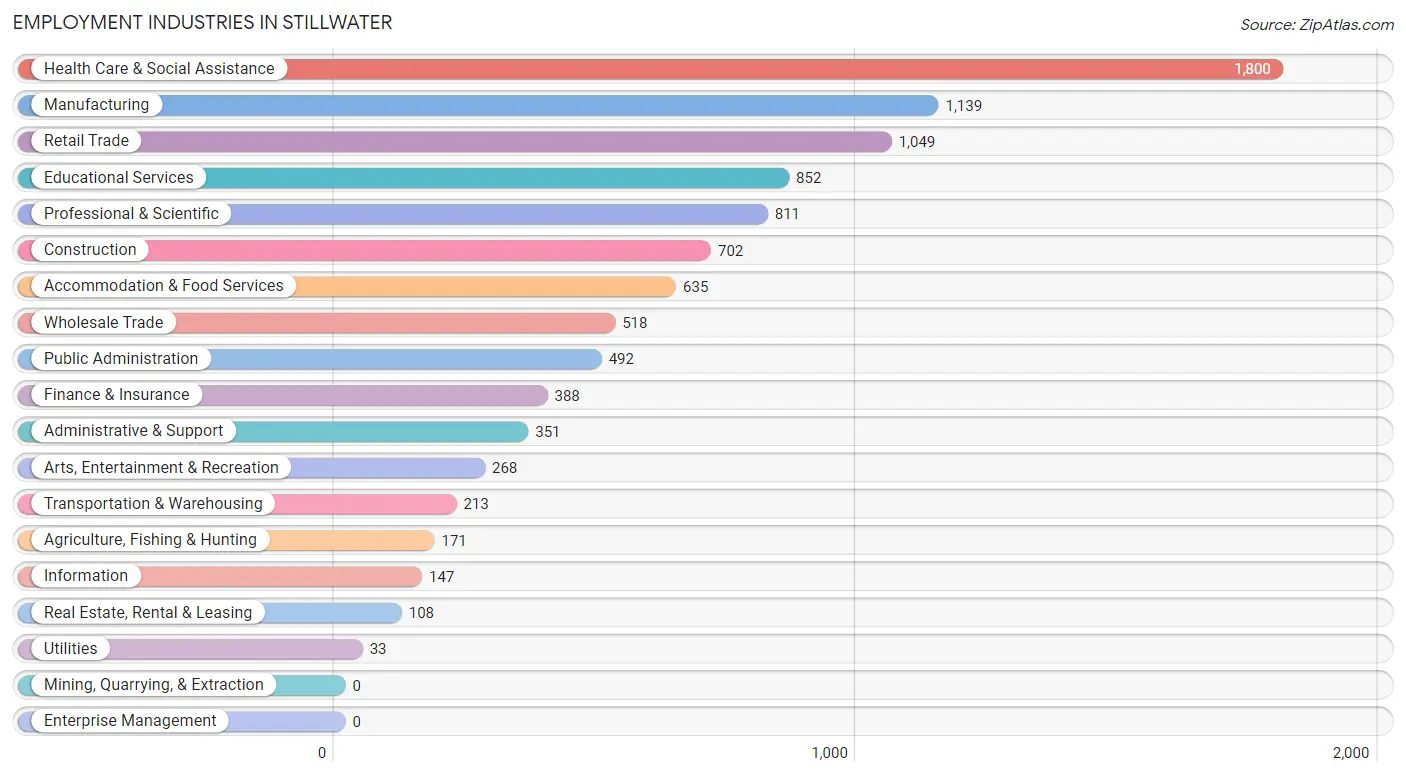
Employment Industries in Stillwater
The major employment industries in Stillwater include Health Care & Social Assistance (1,800 | 17.9%), Manufacturing (1,139 | 11.3%), Retail Trade (1,049 | 10.4%), Educational Services (852 | 8.5%), and Professional & Scientific (811 | 8.1%).
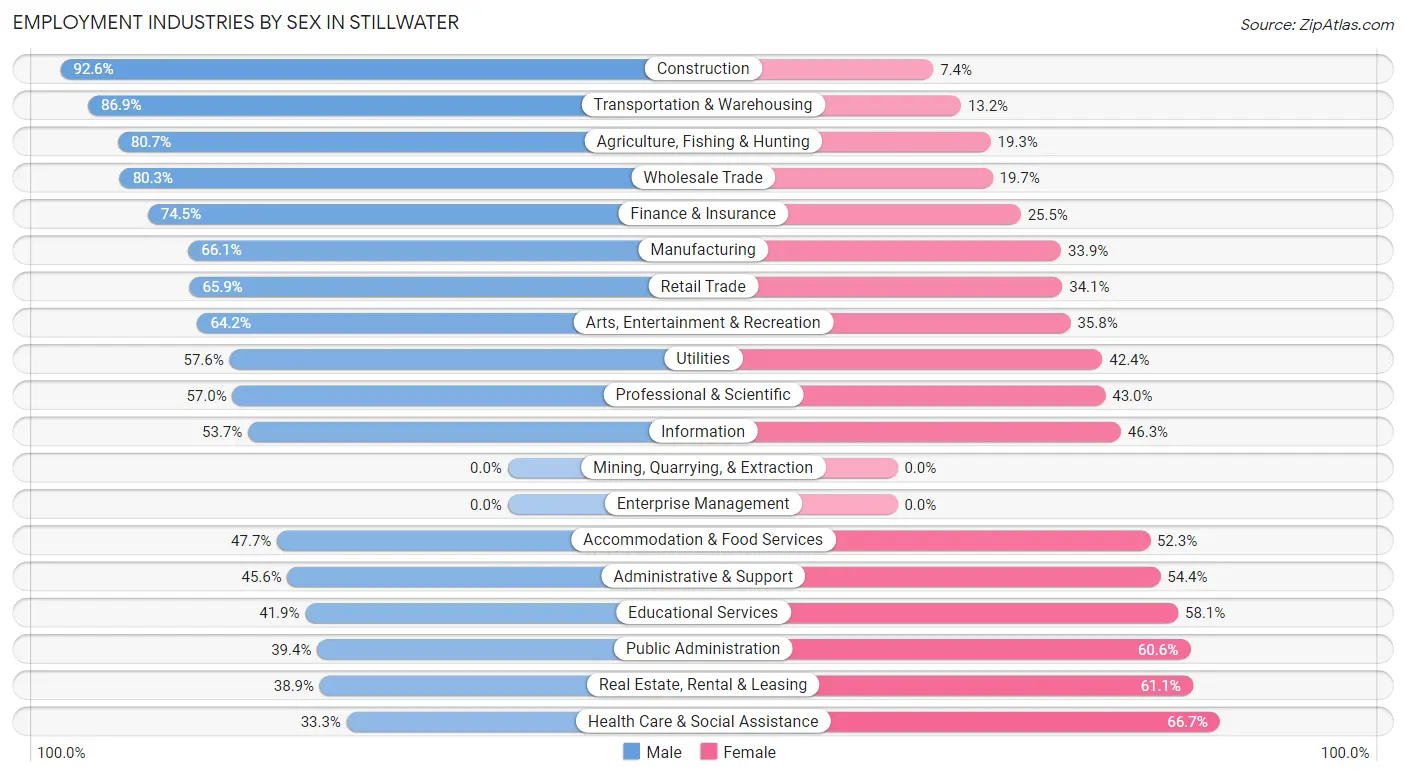
Employment Industries by Sex in Stillwater
The Stillwater industries that see more men than women are Construction (92.6%), Transportation & Warehousing (86.9%), and Agriculture, Fishing & Hunting (80.7%), whereas the industries that tend to have a higher number of women are Health Care & Social Assistance (66.7%), Real Estate, Rental & Leasing (61.1%), and Public Administration (60.6%).
| Industry | Male | Female |
| Agriculture, Fishing & Hunting | 138 (80.7%) | 33 (19.3%) |
| Mining, Quarrying, & Extraction | 0 (0.0%) | 0 (0.0%) |
| Construction | 650 (92.6%) | 52 (7.4%) |
| Manufacturing | 753 (66.1%) | 386 (33.9%) |
| Wholesale Trade | 416 (80.3%) | 102 (19.7%) |
| Retail Trade | 691 (65.9%) | 358 (34.1%) |
| Transportation & Warehousing | 185 (86.9%) | 28 (13.2%) |
| Utilities | 19 (57.6%) | 14 (42.4%) |
| Information | 79 (53.7%) | 68 (46.3%) |
| Finance & Insurance | 289 (74.5%) | 99 (25.5%) |
| Real Estate, Rental & Leasing | 42 (38.9%) | 66 (61.1%) |
| Professional & Scientific | 462 (57.0%) | 349 (43.0%) |
| Enterprise Management | 0 (0.0%) | 0 (0.0%) |
| Administrative & Support | 160 (45.6%) | 191 (54.4%) |
| Educational Services | 357 (41.9%) | 495 (58.1%) |
| Health Care & Social Assistance | 600 (33.3%) | 1,200 (66.7%) |
| Arts, Entertainment & Recreation | 172 (64.2%) | 96 (35.8%) |
| Accommodation & Food Services | 303 (47.7%) | 332 (52.3%) |
| Public Administration | 194 (39.4%) | 298 (60.6%) |
| Total | 5,701 (56.6%) | 4,374 (43.4%) |
Education in Stillwater
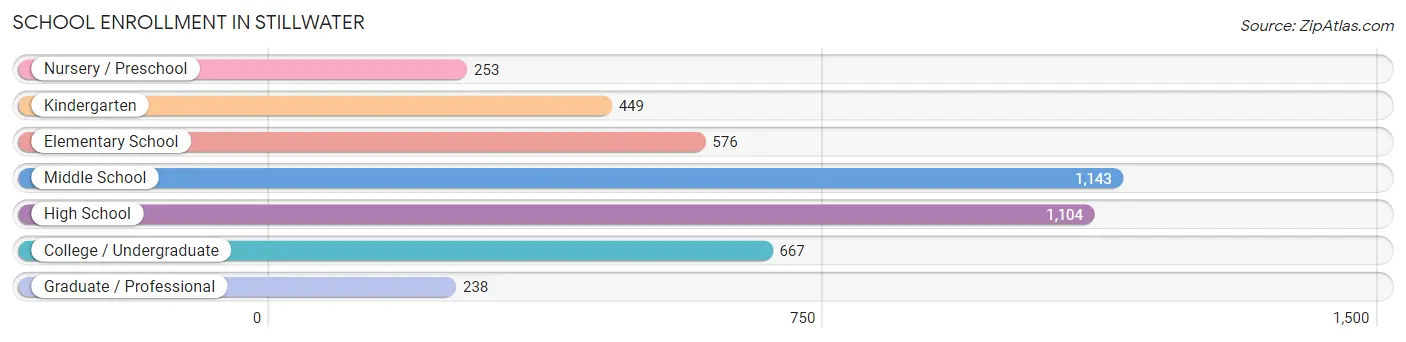
School Enrollment in Stillwater
The most common levels of schooling among the 4,430 students in Stillwater are middle school (1,143 | 25.8%), high school (1,104 | 24.9%), and college / undergraduate (667 | 15.1%).
| School Level | # Students | % Students |
| Nursery / Preschool | 253 | 5.7% |
| Kindergarten | 449 | 10.1% |
| Elementary School | 576 | 13.0% |
| Middle School | 1,143 | 25.8% |
| High School | 1,104 | 24.9% |
| College / Undergraduate | 667 | 15.1% |
| Graduate / Professional | 238 | 5.4% |
| Total | 4,430 | 100.0% |
School Enrollment by Age by Funding Source in Stillwater
Out of a total of 4,430 students who are enrolled in schools in Stillwater, 904 (20.4%) attend a private institution, while the remaining 3,526 (79.6%) are enrolled in public schools. The age group of 25 to 34 year olds has the highest likelihood of being enrolled in private schools, with 240 (61.2% in the age bracket) enrolled. Conversely, the age group of 10 to 14 year olds has the lowest likelihood of being enrolled in a private school, with 1,228 (93.9% in the age bracket) attending a public institution.
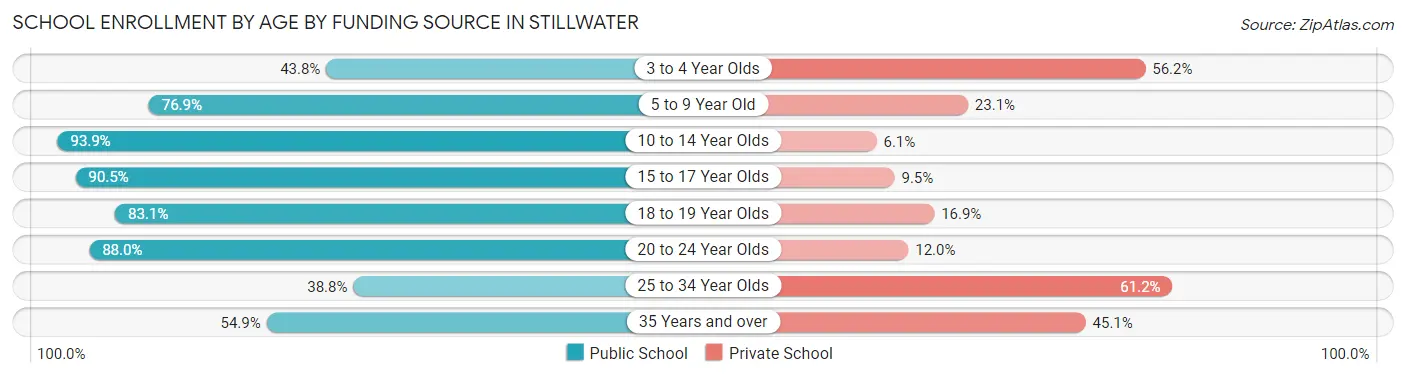
| Age Bracket | Public School | Private School |
| 3 to 4 Year Olds | 78 (43.8%) | 100 (56.2%) |
| 5 to 9 Year Old | 794 (76.9%) | 239 (23.1%) |
| 10 to 14 Year Olds | 1,228 (93.9%) | 80 (6.1%) |
| 15 to 17 Year Olds | 698 (90.5%) | 73 (9.5%) |
| 18 to 19 Year Olds | 217 (83.1%) | 44 (16.9%) |
| 20 to 24 Year Olds | 241 (88.0%) | 33 (12.0%) |
| 25 to 34 Year Olds | 152 (38.8%) | 240 (61.2%) |
| 35 Years and over | 117 (54.9%) | 96 (45.1%) |
| Total | 3,526 (79.6%) | 904 (20.4%) |
Educational Attainment by Field of Study in Stillwater
Business (1,262 | 17.3%), education (747 | 10.2%), science & technology (734 | 10.1%), social sciences (713 | 9.8%), and engineering (672 | 9.2%) are the most common fields of study among 7,286 individuals in Stillwater who have obtained a bachelor's degree or higher.
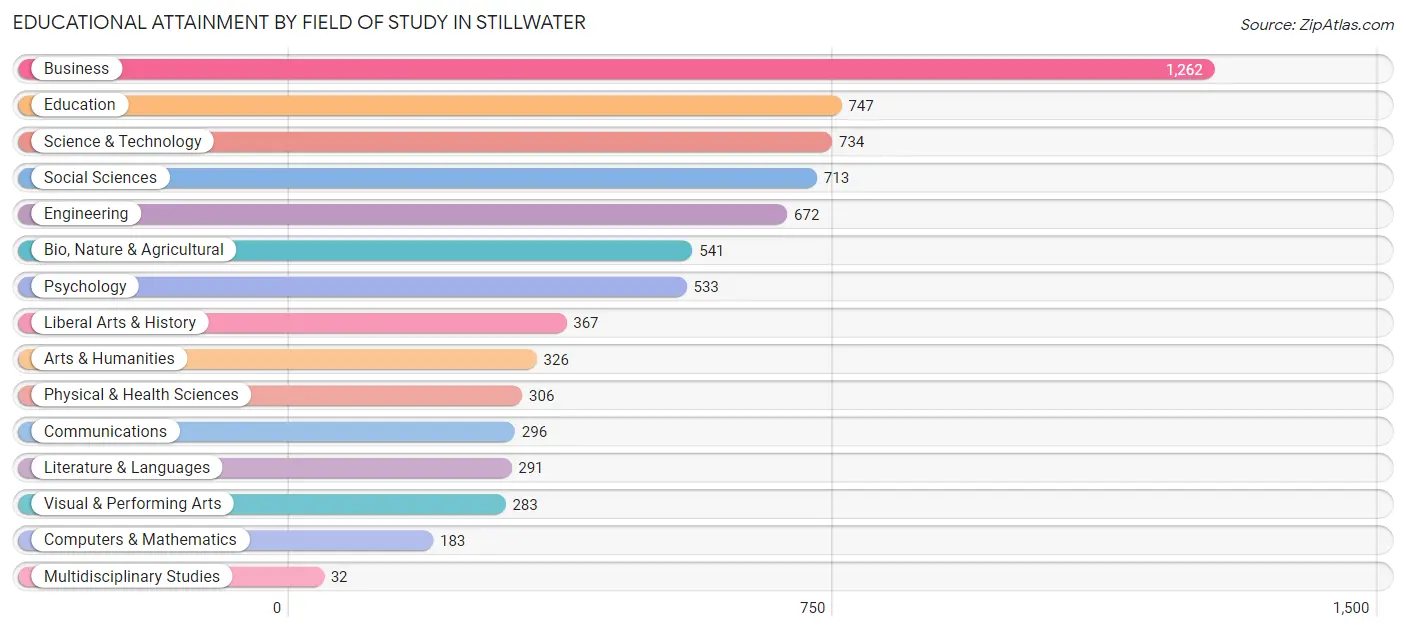
| Field of Study | # Graduates | % Graduates |
| Computers & Mathematics | 183 | 2.5% |
| Bio, Nature & Agricultural | 541 | 7.4% |
| Physical & Health Sciences | 306 | 4.2% |
| Psychology | 533 | 7.3% |
| Social Sciences | 713 | 9.8% |
| Engineering | 672 | 9.2% |
| Multidisciplinary Studies | 32 | 0.4% |
| Science & Technology | 734 | 10.1% |
| Business | 1,262 | 17.3% |
| Education | 747 | 10.2% |
| Literature & Languages | 291 | 4.0% |
| Liberal Arts & History | 367 | 5.0% |
| Visual & Performing Arts | 283 | 3.9% |
| Communications | 296 | 4.1% |
| Arts & Humanities | 326 | 4.5% |
| Total | 7,286 | 100.0% |
Transportation & Commute in Stillwater
Vehicle Availability by Sex in Stillwater
The most prevalent vehicle ownership categories in Stillwater are males with 2 vehicles (2,641, accounting for 46.9%) and females with 2 vehicles (2,032, making up 63.6%).
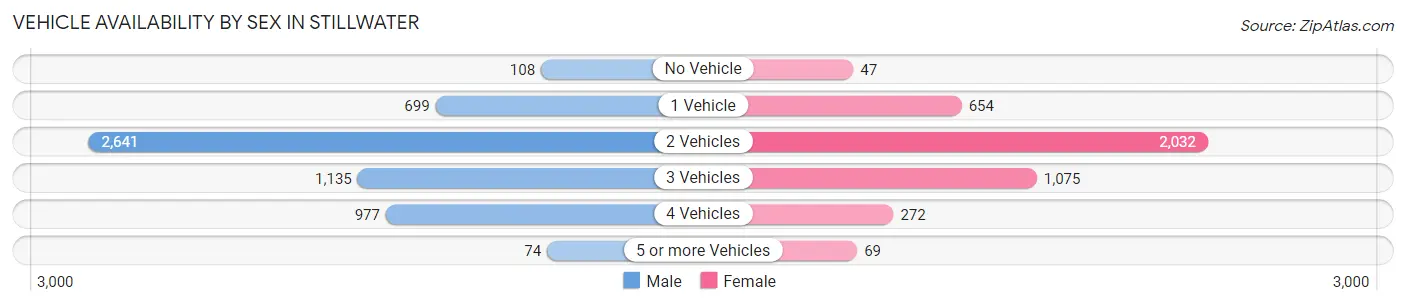
| Vehicles Available | Male | Female |
| No Vehicle | 108 (1.9%) | 47 (1.1%) |
| 1 Vehicle | 699 (12.4%) | 654 (15.8%) |
| 2 Vehicles | 2,641 (46.9%) | 2,032 (49.0%) |
| 3 Vehicles | 1,135 (20.2%) | 1,075 (25.9%) |
| 4 Vehicles | 977 (17.3%) | 272 (6.6%) |
| 5 or more Vehicles | 74 (1.3%) | 69 (1.7%) |
| Total | 5,634 (100.0%) | 4,149 (100.0%) |
Commute Time in Stillwater
The most frequently occuring commute durations in Stillwater are 5 to 9 minutes (1,806 commuters, 21.4%), 10 to 14 minutes (1,314 commuters, 15.6%), and 30 to 34 minutes (1,307 commuters, 15.5%).
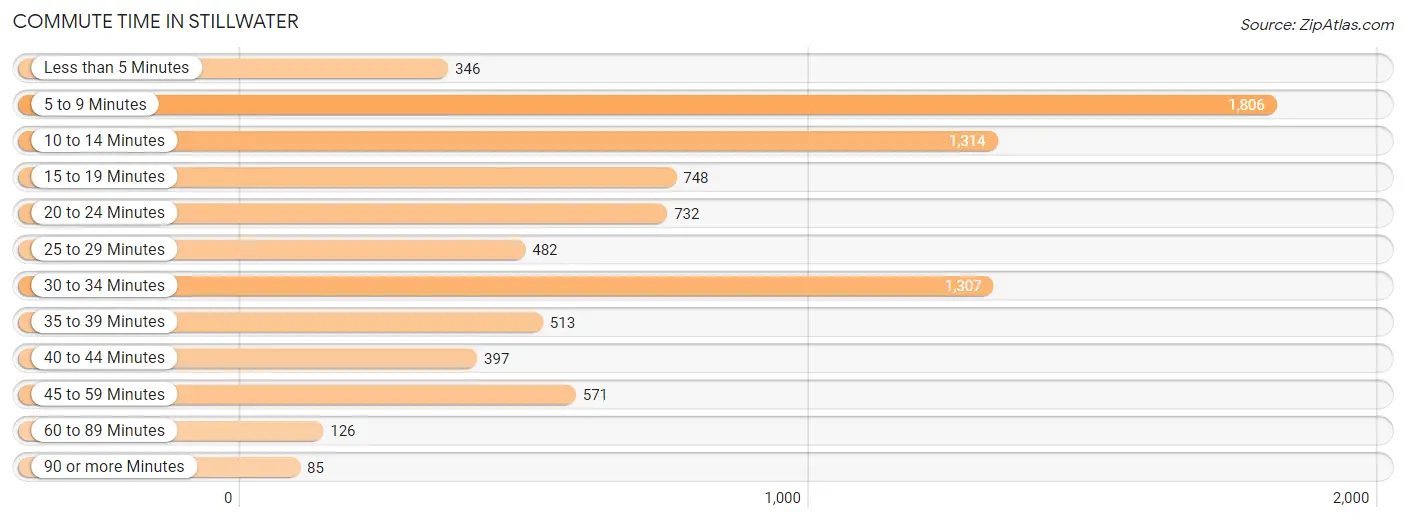
| Commute Time | # Commuters | % Commuters |
| Less than 5 Minutes | 346 | 4.1% |
| 5 to 9 Minutes | 1,806 | 21.4% |
| 10 to 14 Minutes | 1,314 | 15.6% |
| 15 to 19 Minutes | 748 | 8.9% |
| 20 to 24 Minutes | 732 | 8.7% |
| 25 to 29 Minutes | 482 | 5.7% |
| 30 to 34 Minutes | 1,307 | 15.5% |
| 35 to 39 Minutes | 513 | 6.1% |
| 40 to 44 Minutes | 397 | 4.7% |
| 45 to 59 Minutes | 571 | 6.8% |
| 60 to 89 Minutes | 126 | 1.5% |
| 90 or more Minutes | 85 | 1.0% |
Commute Time by Sex in Stillwater
The most common commute times in Stillwater are 5 to 9 minutes (1,140 commuters, 22.9%) for males and 5 to 9 minutes (666 commuters, 19.3%) for females.
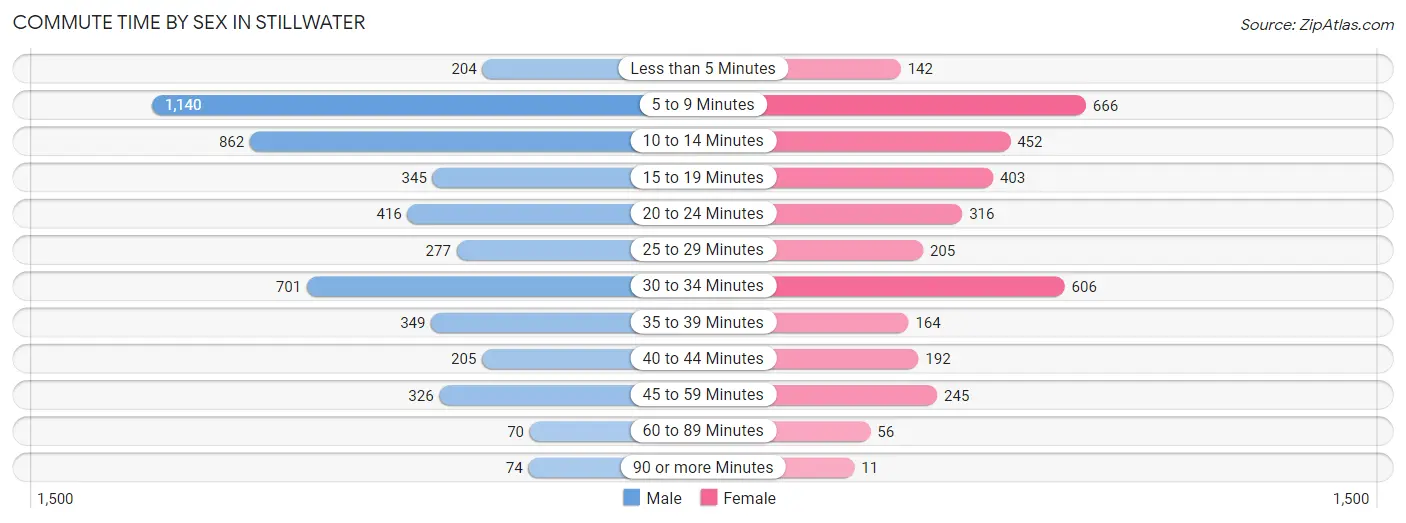
| Commute Time | Male | Female |
| Less than 5 Minutes | 204 (4.1%) | 142 (4.1%) |
| 5 to 9 Minutes | 1,140 (22.9%) | 666 (19.3%) |
| 10 to 14 Minutes | 862 (17.3%) | 452 (13.1%) |
| 15 to 19 Minutes | 345 (6.9%) | 403 (11.7%) |
| 20 to 24 Minutes | 416 (8.4%) | 316 (9.1%) |
| 25 to 29 Minutes | 277 (5.6%) | 205 (5.9%) |
| 30 to 34 Minutes | 701 (14.1%) | 606 (17.5%) |
| 35 to 39 Minutes | 349 (7.0%) | 164 (4.7%) |
| 40 to 44 Minutes | 205 (4.1%) | 192 (5.6%) |
| 45 to 59 Minutes | 326 (6.6%) | 245 (7.1%) |
| 60 to 89 Minutes | 70 (1.4%) | 56 (1.6%) |
| 90 or more Minutes | 74 (1.5%) | 11 (0.3%) |
Time of Departure to Work by Sex in Stillwater
The most frequent times of departure to work in Stillwater are 7:00 AM to 7:29 AM (1,001, 20.1%) for males and 7:00 AM to 7:29 AM (583, 16.9%) for females.
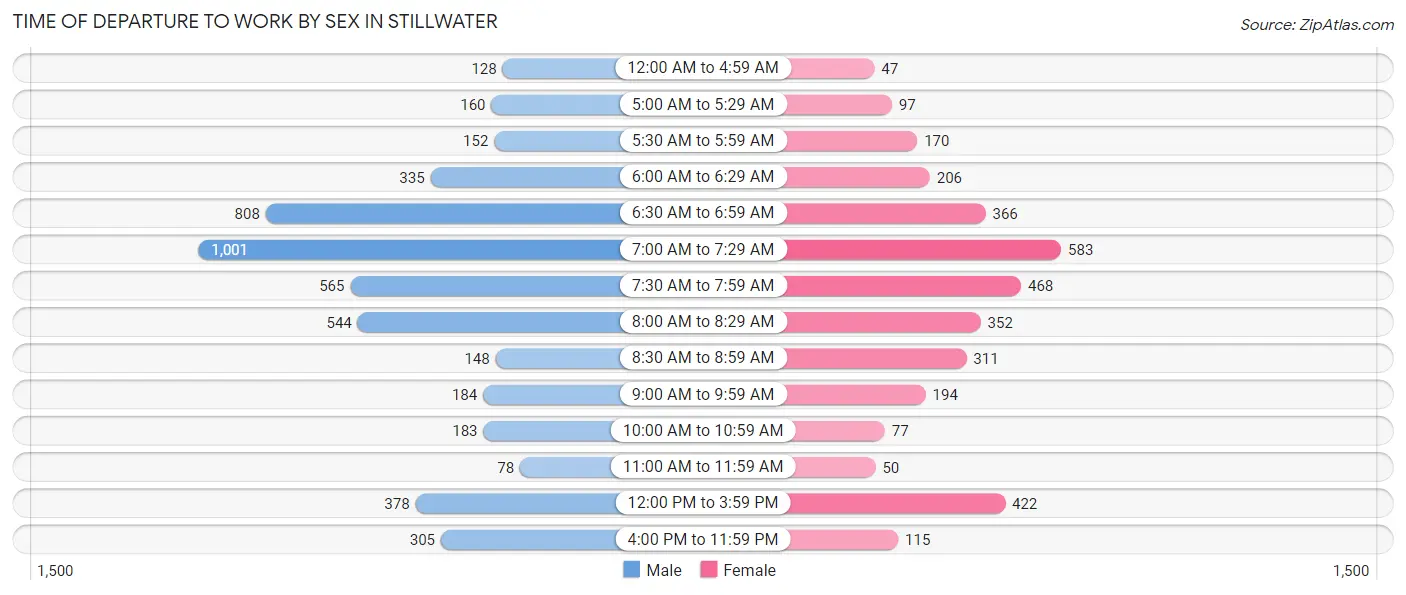
| Time of Departure | Male | Female |
| 12:00 AM to 4:59 AM | 128 (2.6%) | 47 (1.4%) |
| 5:00 AM to 5:29 AM | 160 (3.2%) | 97 (2.8%) |
| 5:30 AM to 5:59 AM | 152 (3.1%) | 170 (4.9%) |
| 6:00 AM to 6:29 AM | 335 (6.7%) | 206 (6.0%) |
| 6:30 AM to 6:59 AM | 808 (16.3%) | 366 (10.6%) |
| 7:00 AM to 7:29 AM | 1,001 (20.1%) | 583 (16.9%) |
| 7:30 AM to 7:59 AM | 565 (11.4%) | 468 (13.5%) |
| 8:00 AM to 8:29 AM | 544 (11.0%) | 352 (10.2%) |
| 8:30 AM to 8:59 AM | 148 (3.0%) | 311 (9.0%) |
| 9:00 AM to 9:59 AM | 184 (3.7%) | 194 (5.6%) |
| 10:00 AM to 10:59 AM | 183 (3.7%) | 77 (2.2%) |
| 11:00 AM to 11:59 AM | 78 (1.6%) | 50 (1.5%) |
| 12:00 PM to 3:59 PM | 378 (7.6%) | 422 (12.2%) |
| 4:00 PM to 11:59 PM | 305 (6.1%) | 115 (3.3%) |
| Total | 4,969 (100.0%) | 3,458 (100.0%) |
Housing Occupancy in Stillwater
Occupancy by Ownership in Stillwater
Of the total 7,586 dwellings in Stillwater, owner-occupied units account for 5,860 (77.2%), while renter-occupied units make up 1,726 (22.8%).
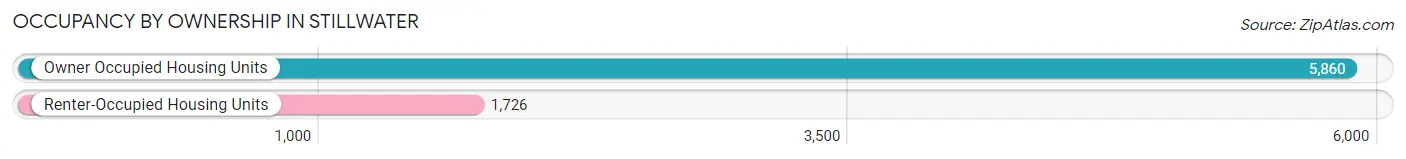
| Occupancy | # Housing Units | % Housing Units |
| Owner Occupied Housing Units | 5,860 | 77.2% |
| Renter-Occupied Housing Units | 1,726 | 22.8% |
| Total Occupied Housing Units | 7,586 | 100.0% |
Occupancy by Household Size in Stillwater
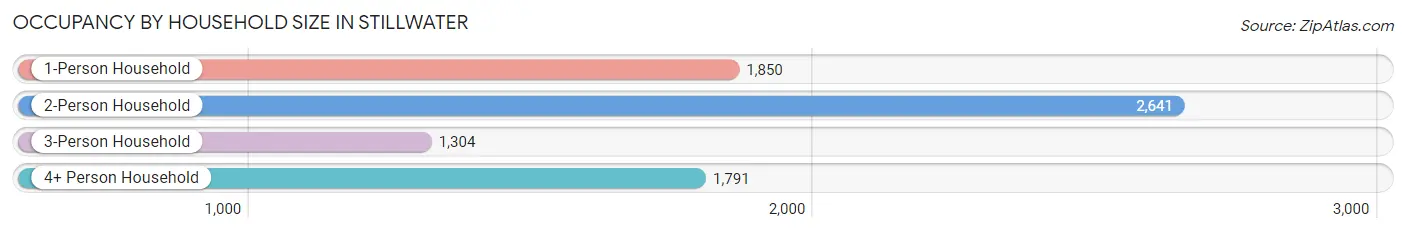
| Household Size | # Housing Units | % Housing Units |
| 1-Person Household | 1,850 | 24.4% |
| 2-Person Household | 2,641 | 34.8% |
| 3-Person Household | 1,304 | 17.2% |
| 4+ Person Household | 1,791 | 23.6% |
| Total Housing Units | 7,586 | 100.0% |
Occupancy by Ownership by Household Size in Stillwater
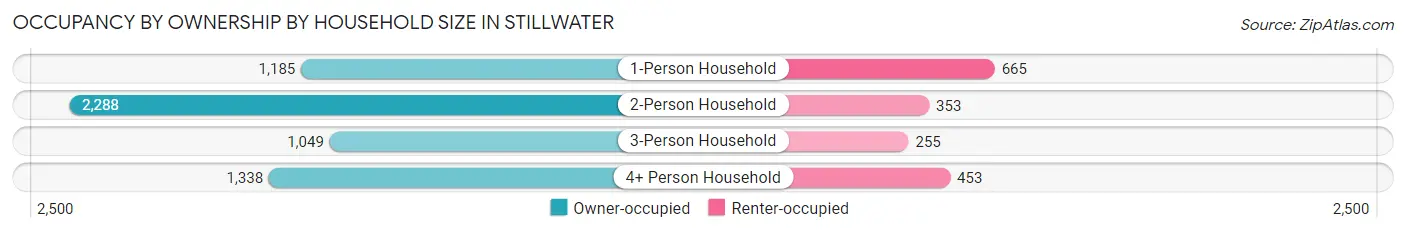
| Household Size | Owner-occupied | Renter-occupied |
| 1-Person Household | 1,185 (64.0%) | 665 (35.9%) |
| 2-Person Household | 2,288 (86.6%) | 353 (13.4%) |
| 3-Person Household | 1,049 (80.4%) | 255 (19.6%) |
| 4+ Person Household | 1,338 (74.7%) | 453 (25.3%) |
| Total Housing Units | 5,860 (77.2%) | 1,726 (22.8%) |
Occupancy by Educational Attainment in Stillwater
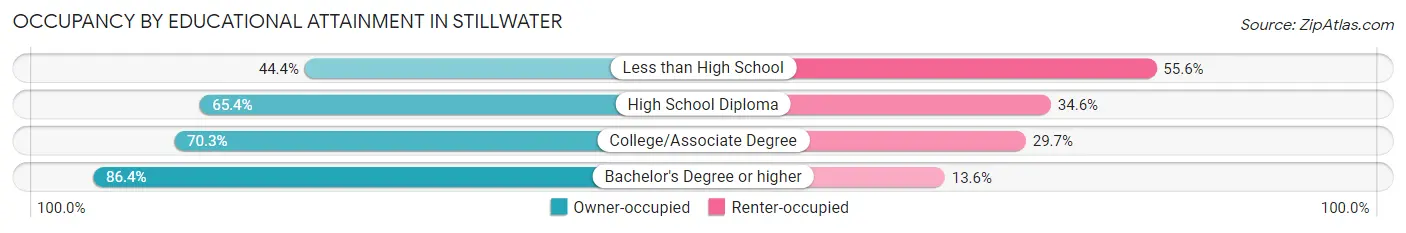
| Household Size | Owner-occupied | Renter-occupied |
| Less than High School | 76 (44.4%) | 95 (55.6%) |
| High School Diploma | 864 (65.4%) | 458 (34.6%) |
| College/Associate Degree | 1,508 (70.3%) | 636 (29.7%) |
| Bachelor's Degree or higher | 3,412 (86.4%) | 537 (13.6%) |
Occupancy by Age of Householder in Stillwater
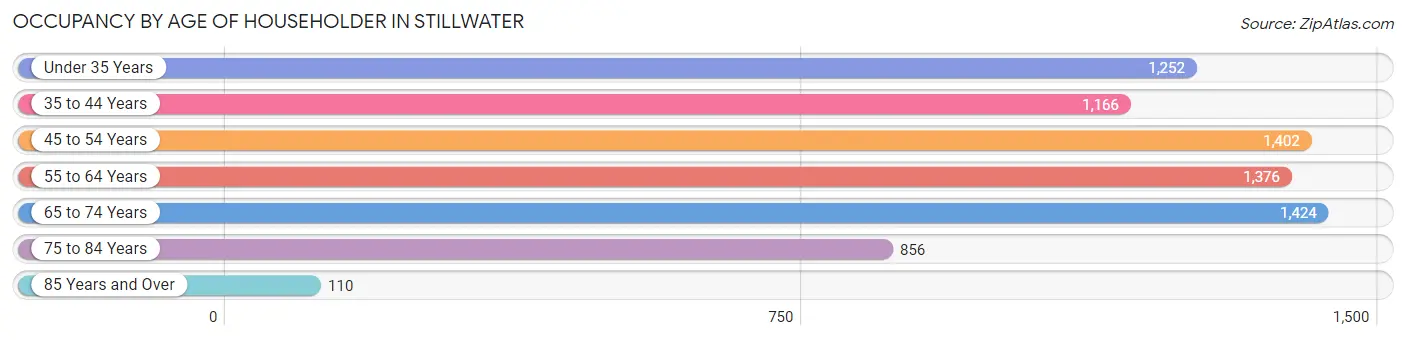
| Age Bracket | # Households | % Households |
| Under 35 Years | 1,252 | 16.5% |
| 35 to 44 Years | 1,166 | 15.4% |
| 45 to 54 Years | 1,402 | 18.5% |
| 55 to 64 Years | 1,376 | 18.1% |
| 65 to 74 Years | 1,424 | 18.8% |
| 75 to 84 Years | 856 | 11.3% |
| 85 Years and Over | 110 | 1.5% |
| Total | 7,586 | 100.0% |
Housing Finances in Stillwater
Median Income by Occupancy in Stillwater
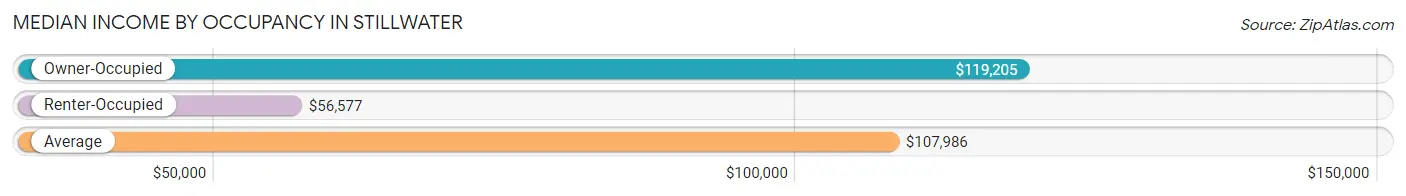
| Occupancy Type | # Households | Median Income |
| Owner-Occupied | 5,860 (77.2%) | $119,205 |
| Renter-Occupied | 1,726 (22.8%) | $56,577 |
| Average | 7,586 (100.0%) | $107,986 |
Occupancy by Householder Income Bracket in Stillwater
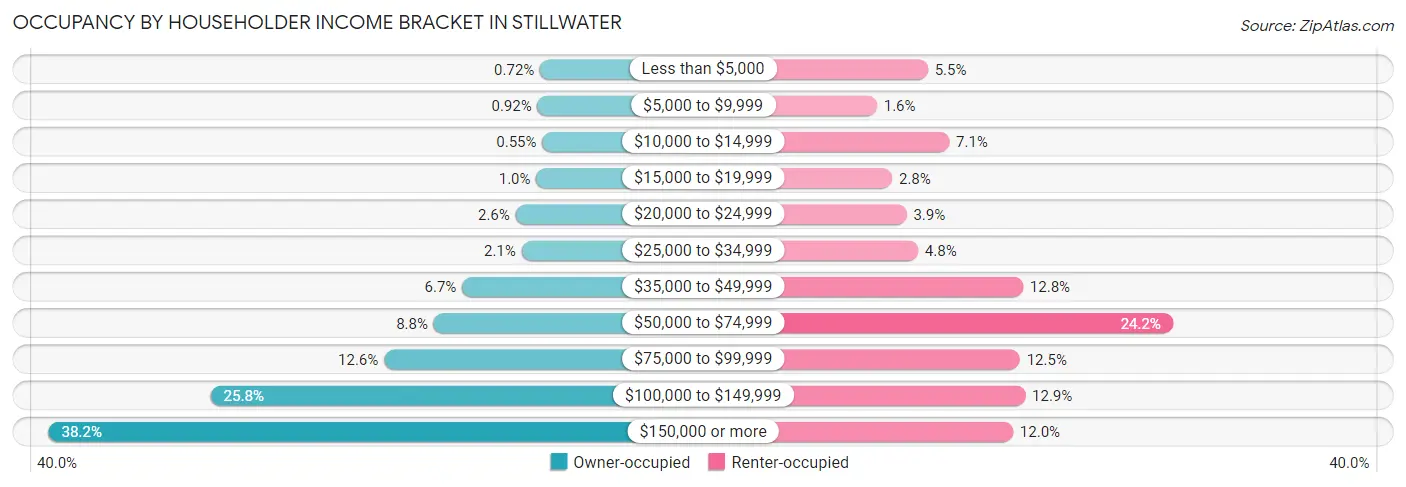
| Income Bracket | Owner-occupied | Renter-occupied |
| Less than $5,000 | 42 (0.7%) | 95 (5.5%) |
| $5,000 to $9,999 | 54 (0.9%) | 28 (1.6%) |
| $10,000 to $14,999 | 32 (0.5%) | 123 (7.1%) |
| $15,000 to $19,999 | 59 (1.0%) | 48 (2.8%) |
| $20,000 to $24,999 | 152 (2.6%) | 67 (3.9%) |
| $25,000 to $34,999 | 125 (2.1%) | 82 (4.8%) |
| $35,000 to $49,999 | 390 (6.7%) | 220 (12.8%) |
| $50,000 to $74,999 | 517 (8.8%) | 417 (24.2%) |
| $75,000 to $99,999 | 739 (12.6%) | 216 (12.5%) |
| $100,000 to $149,999 | 1,513 (25.8%) | 223 (12.9%) |
| $150,000 or more | 2,237 (38.2%) | 207 (12.0%) |
| Total | 5,860 (100.0%) | 1,726 (100.0%) |
Monthly Housing Cost Tiers in Stillwater
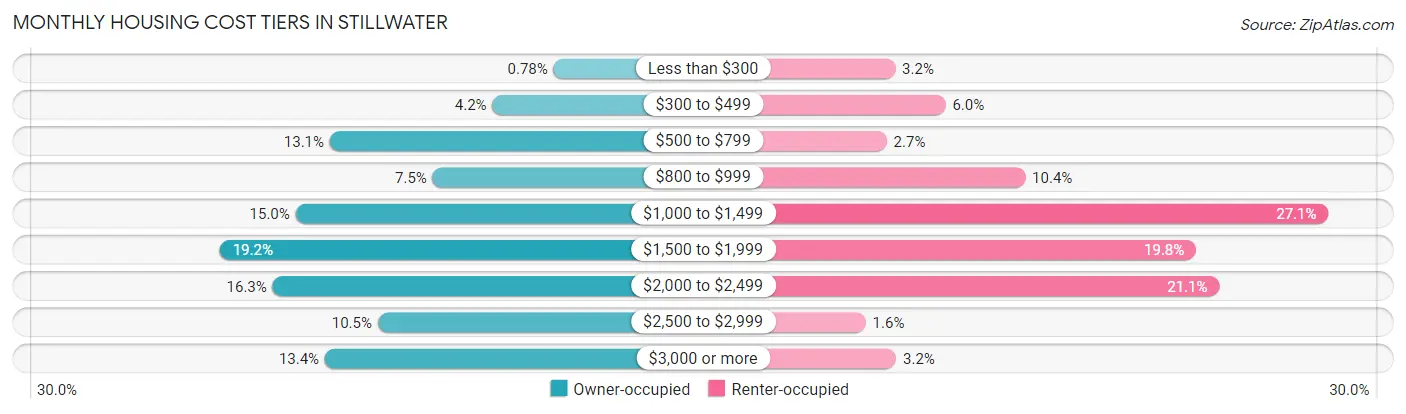
| Monthly Cost | Owner-occupied | Renter-occupied |
| Less than $300 | 46 (0.8%) | 55 (3.2%) |
| $300 to $499 | 244 (4.2%) | 103 (6.0%) |
| $500 to $799 | 770 (13.1%) | 47 (2.7%) |
| $800 to $999 | 437 (7.5%) | 179 (10.4%) |
| $1,000 to $1,499 | 881 (15.0%) | 468 (27.1%) |
| $1,500 to $1,999 | 1,126 (19.2%) | 342 (19.8%) |
| $2,000 to $2,499 | 955 (16.3%) | 364 (21.1%) |
| $2,500 to $2,999 | 615 (10.5%) | 27 (1.6%) |
| $3,000 or more | 786 (13.4%) | 56 (3.2%) |
| Total | 5,860 (100.0%) | 1,726 (100.0%) |
Physical Housing Characteristics in Stillwater
Housing Structures in Stillwater
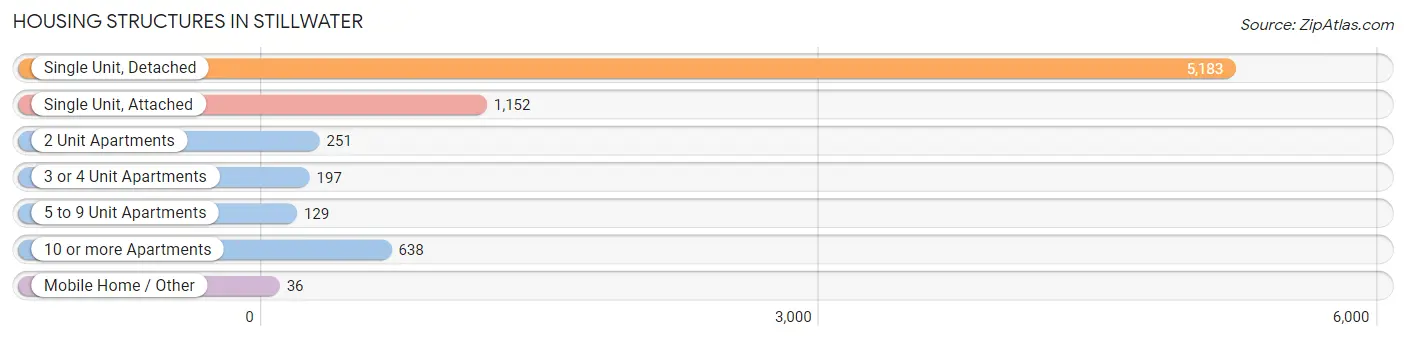
| Structure Type | # Housing Units | % Housing Units |
| Single Unit, Detached | 5,183 | 68.3% |
| Single Unit, Attached | 1,152 | 15.2% |
| 2 Unit Apartments | 251 | 3.3% |
| 3 or 4 Unit Apartments | 197 | 2.6% |
| 5 to 9 Unit Apartments | 129 | 1.7% |
| 10 or more Apartments | 638 | 8.4% |
| Mobile Home / Other | 36 | 0.5% |
| Total | 7,586 | 100.0% |
Housing Structures by Occupancy in Stillwater
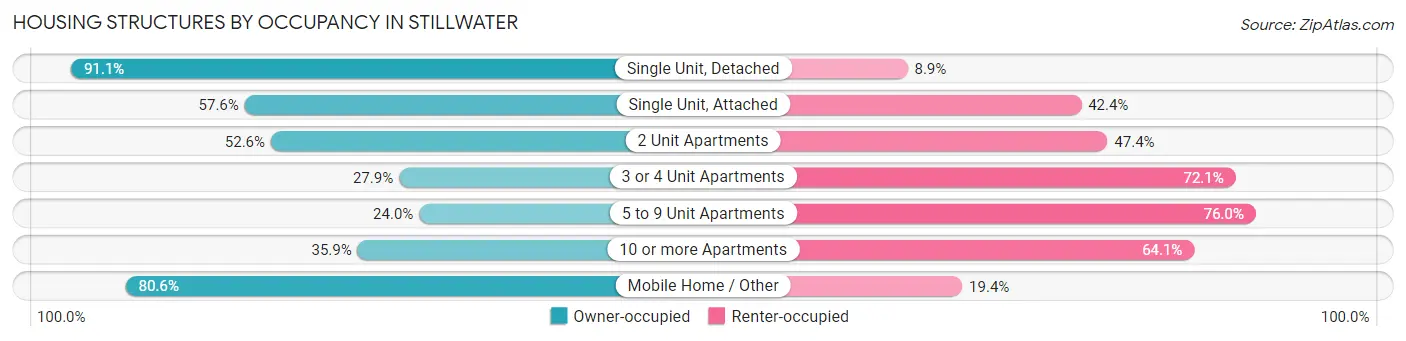
| Structure Type | Owner-occupied | Renter-occupied |
| Single Unit, Detached | 4,720 (91.1%) | 463 (8.9%) |
| Single Unit, Attached | 664 (57.6%) | 488 (42.4%) |
| 2 Unit Apartments | 132 (52.6%) | 119 (47.4%) |
| 3 or 4 Unit Apartments | 55 (27.9%) | 142 (72.1%) |
| 5 to 9 Unit Apartments | 31 (24.0%) | 98 (76.0%) |
| 10 or more Apartments | 229 (35.9%) | 409 (64.1%) |
| Mobile Home / Other | 29 (80.6%) | 7 (19.4%) |
| Total | 5,860 (77.2%) | 1,726 (22.8%) |
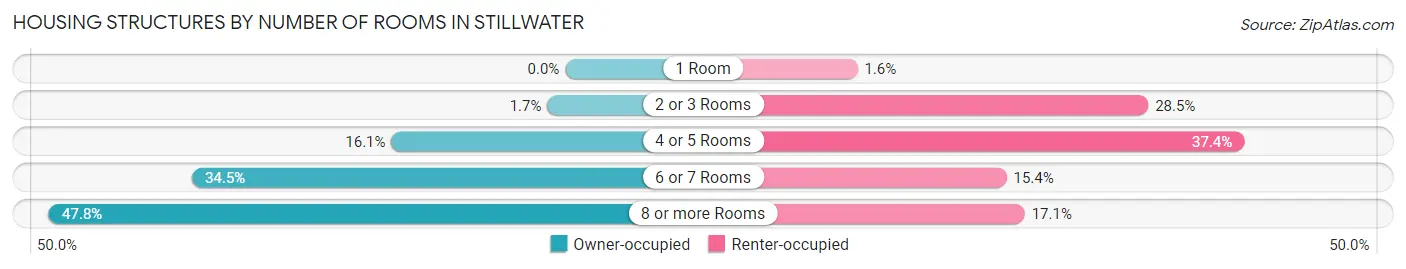
Housing Structures by Number of Rooms in Stillwater
| Number of Rooms | Owner-occupied | Renter-occupied |
| 1 Room | 0 (0.0%) | 28 (1.6%) |
| 2 or 3 Rooms | 97 (1.7%) | 492 (28.5%) |
| 4 or 5 Rooms | 942 (16.1%) | 645 (37.4%) |
| 6 or 7 Rooms | 2,023 (34.5%) | 266 (15.4%) |
| 8 or more Rooms | 2,798 (47.7%) | 295 (17.1%) |
| Total | 5,860 (100.0%) | 1,726 (100.0%) |
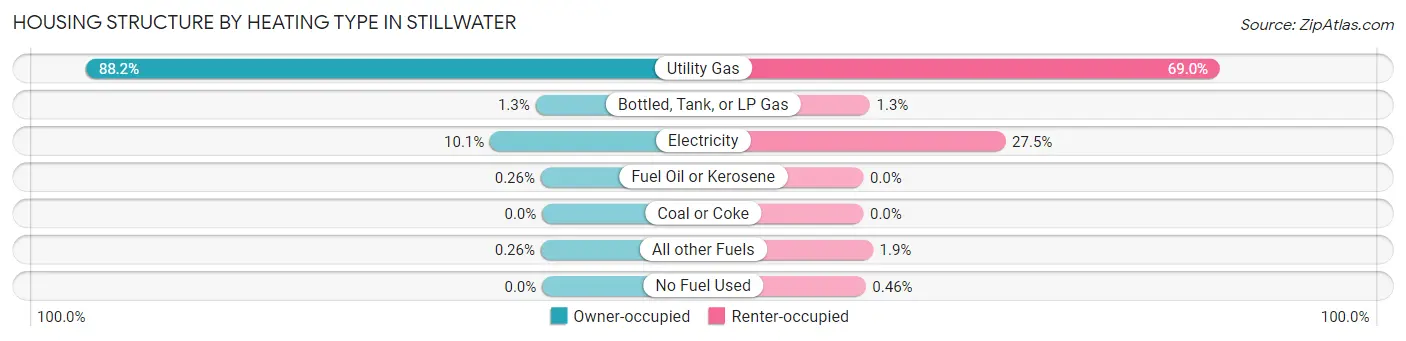
Housing Structure by Heating Type in Stillwater
| Heating Type | Owner-occupied | Renter-occupied |
| Utility Gas | 5,167 (88.2%) | 1,190 (69.0%) |
| Bottled, Tank, or LP Gas | 74 (1.3%) | 22 (1.3%) |
| Electricity | 589 (10.1%) | 474 (27.5%) |
| Fuel Oil or Kerosene | 15 (0.3%) | 0 (0.0%) |
| Coal or Coke | 0 (0.0%) | 0 (0.0%) |
| All other Fuels | 15 (0.3%) | 32 (1.8%) |
| No Fuel Used | 0 (0.0%) | 8 (0.5%) |
| Total | 5,860 (100.0%) | 1,726 (100.0%) |
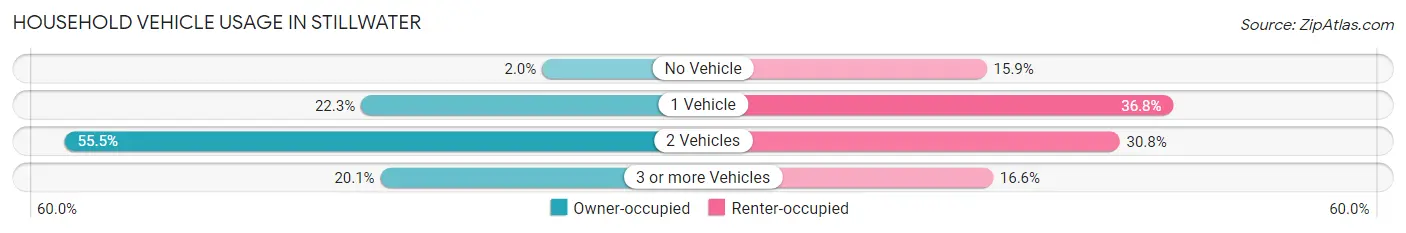
Household Vehicle Usage in Stillwater
| Vehicles per Household | Owner-occupied | Renter-occupied |
| No Vehicle | 119 (2.0%) | 274 (15.9%) |
| 1 Vehicle | 1,308 (22.3%) | 635 (36.8%) |
| 2 Vehicles | 3,253 (55.5%) | 531 (30.8%) |
| 3 or more Vehicles | 1,180 (20.1%) | 286 (16.6%) |
| Total | 5,860 (100.0%) | 1,726 (100.0%) |
Real Estate & Mortgages in Stillwater
Real Estate and Mortgage Overview in Stillwater
| Characteristic | Without Mortgage | With Mortgage |
| Housing Units | 1,525 | 4,335 |
| Median Property Value | $346,100 | $397,000 |
| Median Household Income | $94,612 | $1,815 |
| Monthly Housing Costs | $692 | $786 |
| Real Estate Taxes | $3,582 | $27 |
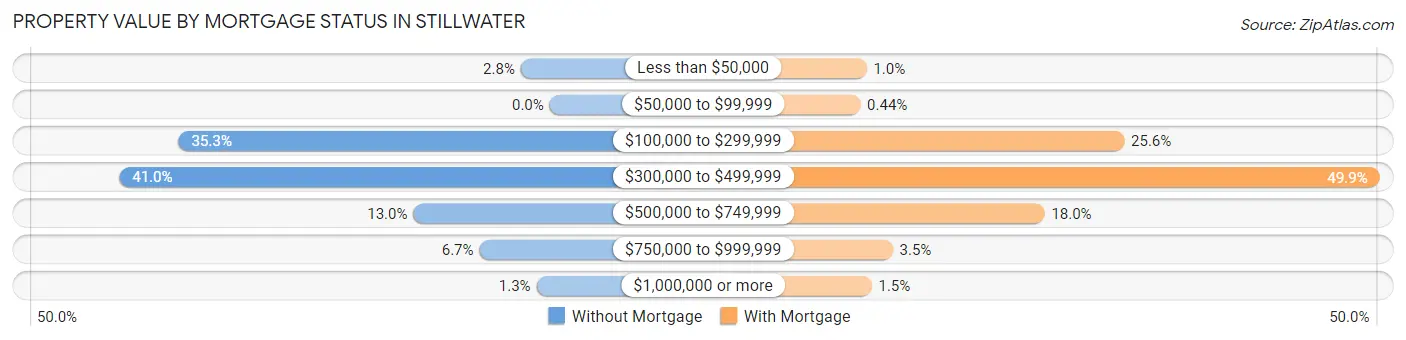
Property Value by Mortgage Status in Stillwater
| Property Value | Without Mortgage | With Mortgage |
| Less than $50,000 | 42 (2.8%) | 45 (1.0%) |
| $50,000 to $99,999 | 0 (0.0%) | 19 (0.4%) |
| $100,000 to $299,999 | 539 (35.3%) | 1,109 (25.6%) |
| $300,000 to $499,999 | 625 (41.0%) | 2,163 (49.9%) |
| $500,000 to $749,999 | 198 (13.0%) | 780 (18.0%) |
| $750,000 to $999,999 | 102 (6.7%) | 153 (3.5%) |
| $1,000,000 or more | 19 (1.3%) | 66 (1.5%) |
| Total | 1,525 (100.0%) | 4,335 (100.0%) |
Household Income by Mortgage Status in Stillwater
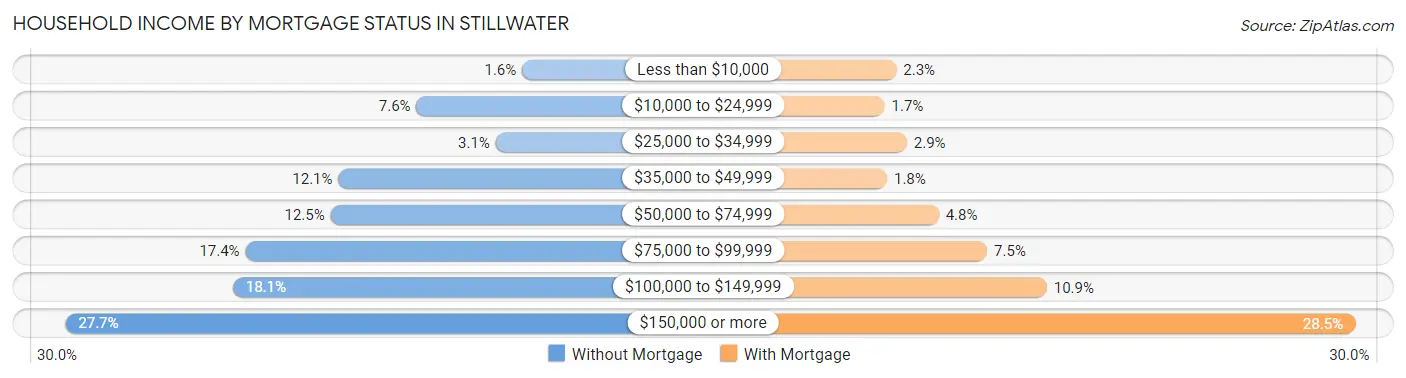
| Household Income | Without Mortgage | With Mortgage |
| Less than $10,000 | 24 (1.6%) | 101 (2.3%) |
| $10,000 to $24,999 | 116 (7.6%) | 72 (1.7%) |
| $25,000 to $34,999 | 47 (3.1%) | 127 (2.9%) |
| $35,000 to $49,999 | 184 (12.1%) | 78 (1.8%) |
| $50,000 to $74,999 | 191 (12.5%) | 206 (4.8%) |
| $75,000 to $99,999 | 265 (17.4%) | 326 (7.5%) |
| $100,000 to $149,999 | 276 (18.1%) | 474 (10.9%) |
| $150,000 or more | 422 (27.7%) | 1,237 (28.5%) |
| Total | 1,525 (100.0%) | 4,335 (100.0%) |
Property Value to Household Income Ratio in Stillwater
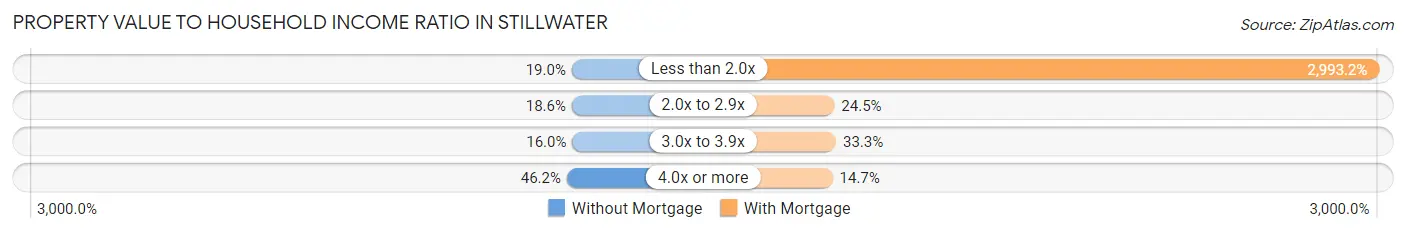
| Value-to-Income Ratio | Without Mortgage | With Mortgage |
| Less than 2.0x | 290 (19.0%) | 129,754 (2,993.2%) |
| 2.0x to 2.9x | 283 (18.6%) | 1,061 (24.5%) |
| 3.0x to 3.9x | 244 (16.0%) | 1,445 (33.3%) |
| 4.0x or more | 704 (46.2%) | 635 (14.6%) |
| Total | 1,525 (100.0%) | 4,335 (100.0%) |
Real Estate Taxes by Mortgage Status in Stillwater
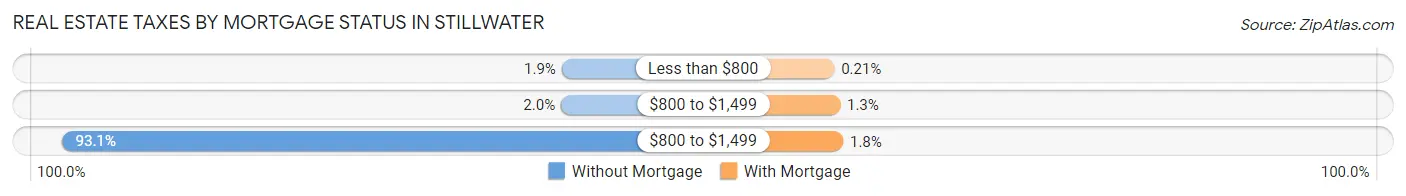
| Property Taxes | Without Mortgage | With Mortgage |
| Less than $800 | 29 (1.9%) | 9 (0.2%) |
| $800 to $1,499 | 31 (2.0%) | 55 (1.3%) |
| $800 to $1,499 | 1,419 (93.0%) | 79 (1.8%) |
| Total | 1,525 (100.0%) | 4,335 (100.0%) |
Health & Disability in Stillwater
Health Insurance Coverage by Age in Stillwater
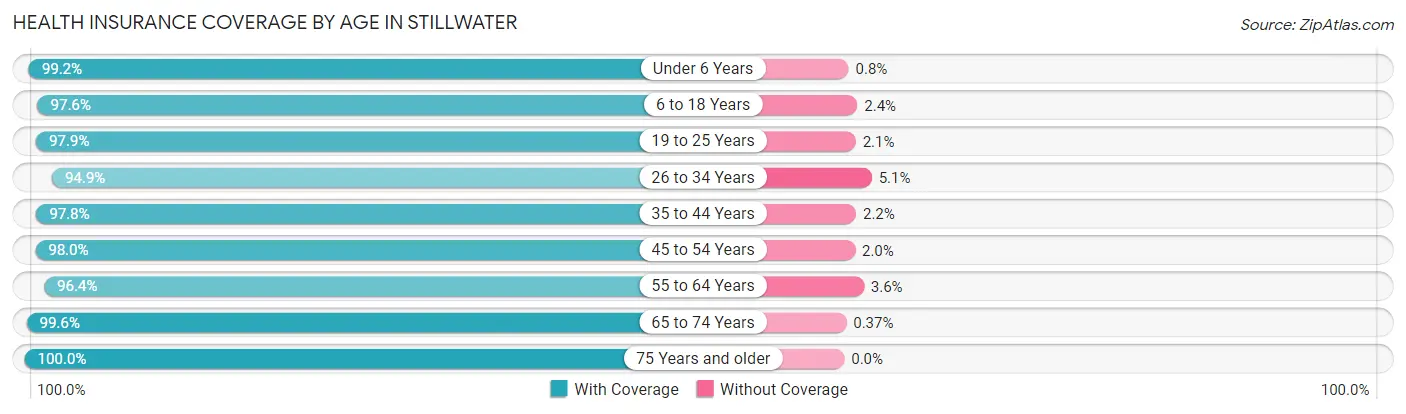
| Age Bracket | With Coverage | Without Coverage |
| Under 6 Years | 996 (99.2%) | 8 (0.8%) |
| 6 to 18 Years | 3,367 (97.6%) | 84 (2.4%) |
| 19 to 25 Years | 1,886 (97.9%) | 41 (2.1%) |
| 26 to 34 Years | 1,763 (94.9%) | 95 (5.1%) |
| 35 to 44 Years | 2,189 (97.8%) | 49 (2.2%) |
| 45 to 54 Years | 2,258 (98.0%) | 46 (2.0%) |
| 55 to 64 Years | 2,491 (96.4%) | 94 (3.6%) |
| 65 to 74 Years | 2,149 (99.6%) | 8 (0.4%) |
| 75 Years and older | 1,457 (100.0%) | 0 (0.0%) |
| Total | 18,556 (97.8%) | 425 (2.2%) |
Health Insurance Coverage by Citizenship Status in Stillwater
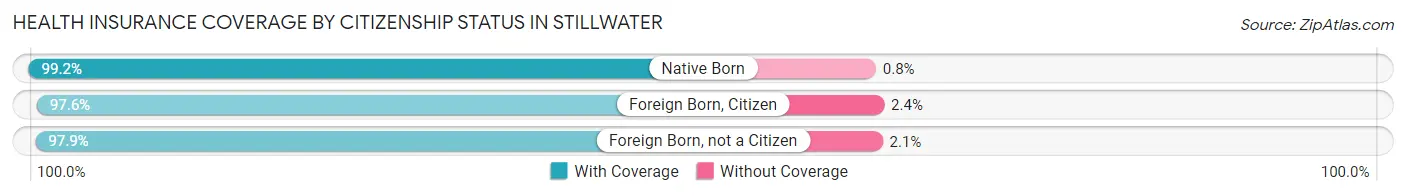
| Citizenship Status | With Coverage | Without Coverage |
| Native Born | 996 (99.2%) | 8 (0.8%) |
| Foreign Born, Citizen | 3,367 (97.6%) | 84 (2.4%) |
| Foreign Born, not a Citizen | 1,886 (97.9%) | 41 (2.1%) |
Health Insurance Coverage by Household Income in Stillwater
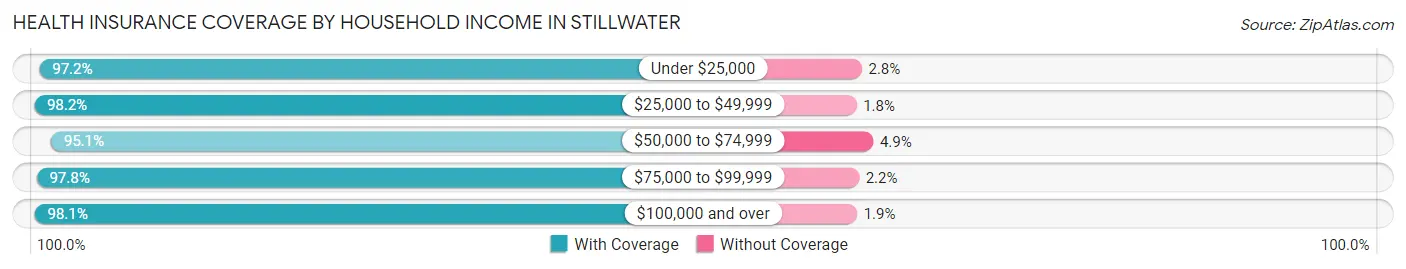
| Household Income | With Coverage | Without Coverage |
| Under $25,000 | 882 (97.2%) | 25 (2.8%) |
| $25,000 to $49,999 | 1,449 (98.2%) | 26 (1.8%) |
| $50,000 to $74,999 | 1,822 (95.1%) | 94 (4.9%) |
| $75,000 to $99,999 | 2,109 (97.8%) | 48 (2.2%) |
| $100,000 and over | 12,202 (98.1%) | 231 (1.9%) |
Public vs Private Health Insurance Coverage by Age in Stillwater
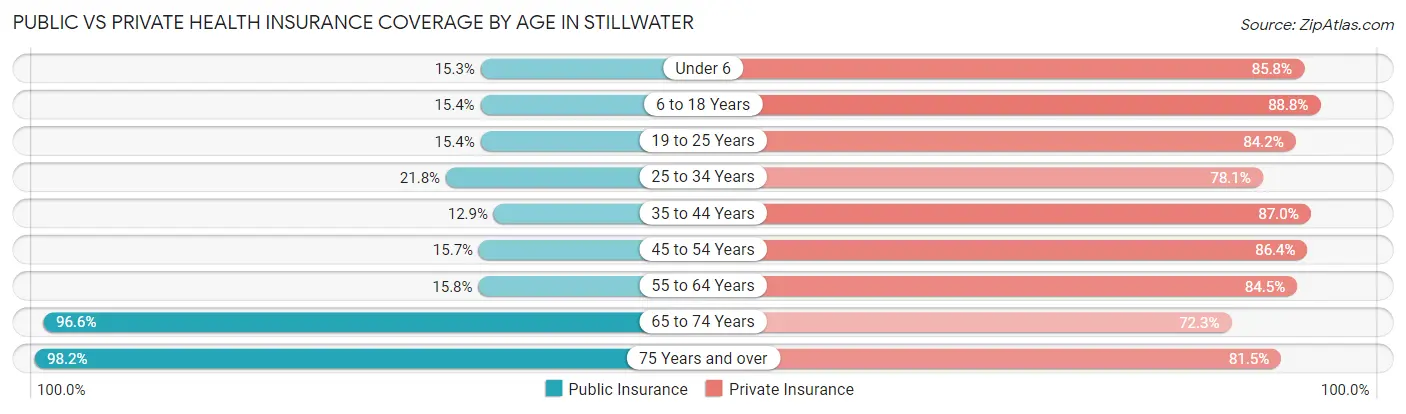
| Age Bracket | Public Insurance | Private Insurance |
| Under 6 | 154 (15.3%) | 861 (85.8%) |
| 6 to 18 Years | 531 (15.4%) | 3,064 (88.8%) |
| 19 to 25 Years | 296 (15.4%) | 1,623 (84.2%) |
| 25 to 34 Years | 405 (21.8%) | 1,451 (78.1%) |
| 35 to 44 Years | 289 (12.9%) | 1,947 (87.0%) |
| 45 to 54 Years | 361 (15.7%) | 1,991 (86.4%) |
| 55 to 64 Years | 408 (15.8%) | 2,184 (84.5%) |
| 65 to 74 Years | 2,083 (96.6%) | 1,559 (72.3%) |
| 75 Years and over | 1,431 (98.2%) | 1,188 (81.5%) |
| Total | 5,958 (31.4%) | 15,868 (83.6%) |
Disability Status by Sex by Age in Stillwater
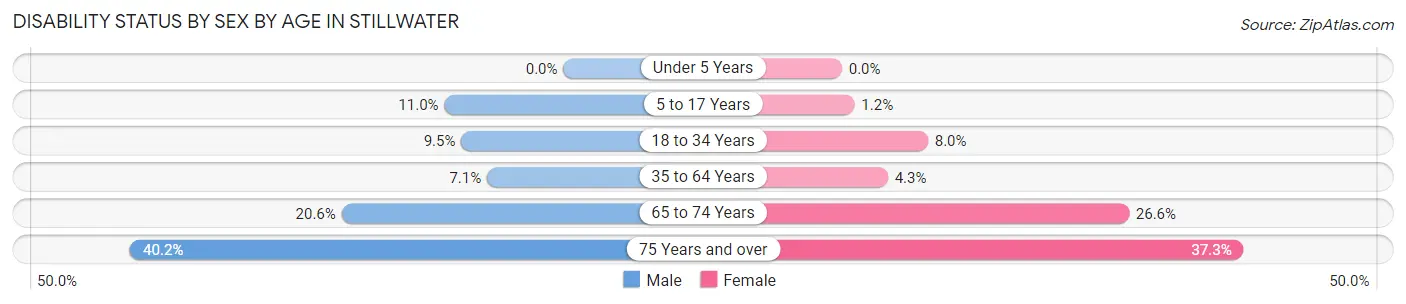
| Age Bracket | Male | Female |
| Under 5 Years | 0 (0.0%) | 0 (0.0%) |
| 5 to 17 Years | 163 (11.0%) | 22 (1.2%) |
| 18 to 34 Years | 244 (9.5%) | 118 (8.0%) |
| 35 to 64 Years | 249 (7.1%) | 154 (4.3%) |
| 65 to 74 Years | 199 (20.6%) | 317 (26.6%) |
| 75 Years and over | 287 (40.2%) | 277 (37.3%) |
Disability Class by Sex by Age in Stillwater
Disability Class: Hearing Difficulty
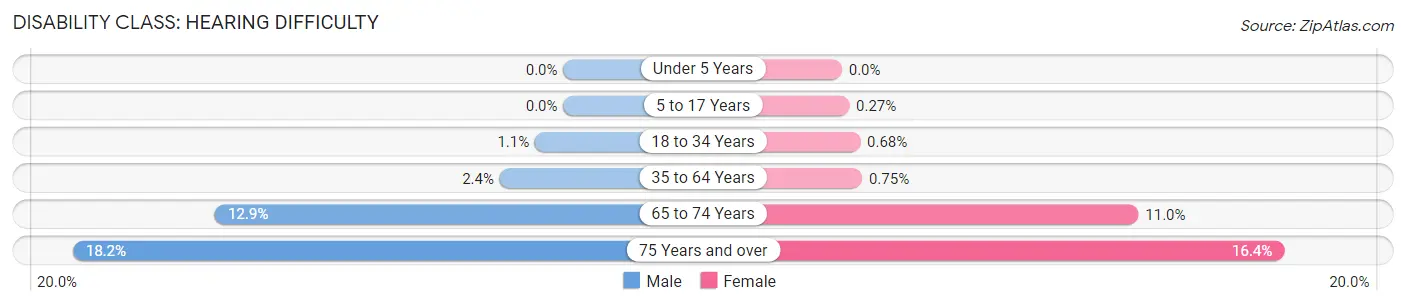
| Age Bracket | Male | Female |
| Under 5 Years | 0 (0.0%) | 0 (0.0%) |
| 5 to 17 Years | 0 (0.0%) | 5 (0.3%) |
| 18 to 34 Years | 27 (1.1%) | 10 (0.7%) |
| 35 to 64 Years | 83 (2.4%) | 27 (0.7%) |
| 65 to 74 Years | 125 (12.9%) | 131 (11.0%) |
| 75 Years and over | 130 (18.2%) | 122 (16.4%) |
Disability Class: Vision Difficulty
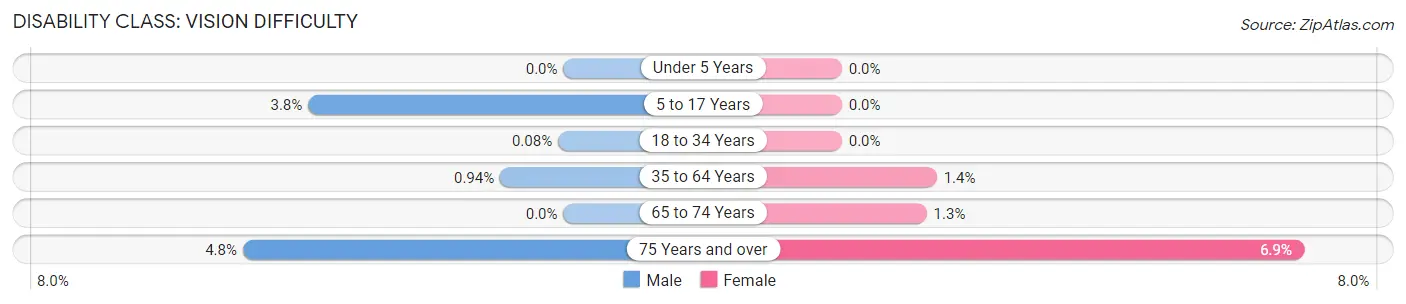
| Age Bracket | Male | Female |
| Under 5 Years | 0 (0.0%) | 0 (0.0%) |
| 5 to 17 Years | 56 (3.8%) | 0 (0.0%) |
| 18 to 34 Years | 2 (0.1%) | 0 (0.0%) |
| 35 to 64 Years | 33 (0.9%) | 51 (1.4%) |
| 65 to 74 Years | 0 (0.0%) | 15 (1.3%) |
| 75 Years and over | 34 (4.8%) | 51 (6.9%) |
Disability Class: Cognitive Difficulty
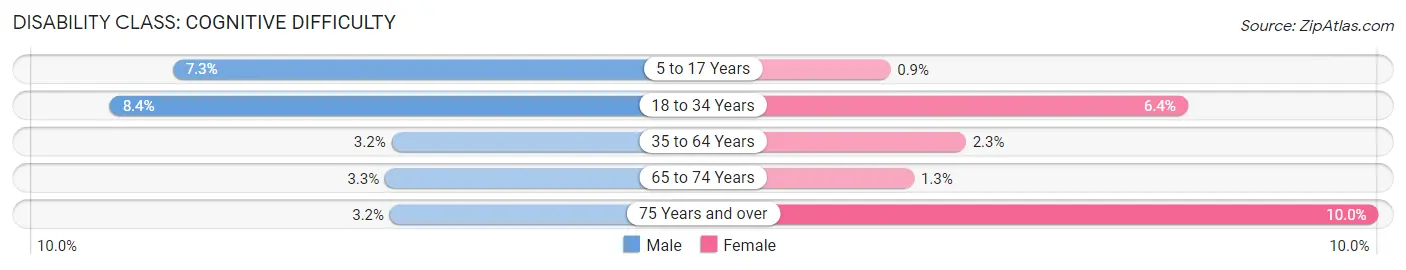
| Age Bracket | Male | Female |
| 5 to 17 Years | 107 (7.2%) | 17 (0.9%) |
| 18 to 34 Years | 217 (8.4%) | 95 (6.4%) |
| 35 to 64 Years | 112 (3.2%) | 83 (2.3%) |
| 65 to 74 Years | 32 (3.3%) | 16 (1.3%) |
| 75 Years and over | 23 (3.2%) | 74 (10.0%) |
Disability Class: Ambulatory Difficulty
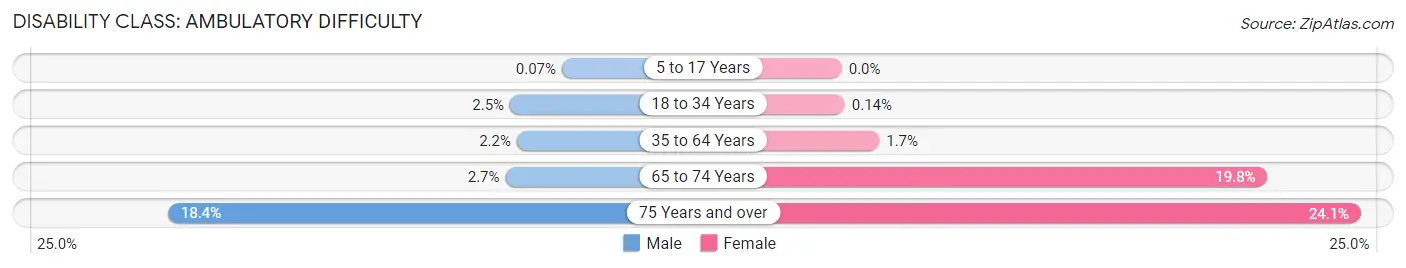
| Age Bracket | Male | Female |
| 5 to 17 Years | 1 (0.1%) | 0 (0.0%) |
| 18 to 34 Years | 64 (2.5%) | 2 (0.1%) |
| 35 to 64 Years | 76 (2.2%) | 63 (1.7%) |
| 65 to 74 Years | 26 (2.7%) | 235 (19.8%) |
| 75 Years and over | 131 (18.3%) | 179 (24.1%) |
Disability Class: Self-Care Difficulty
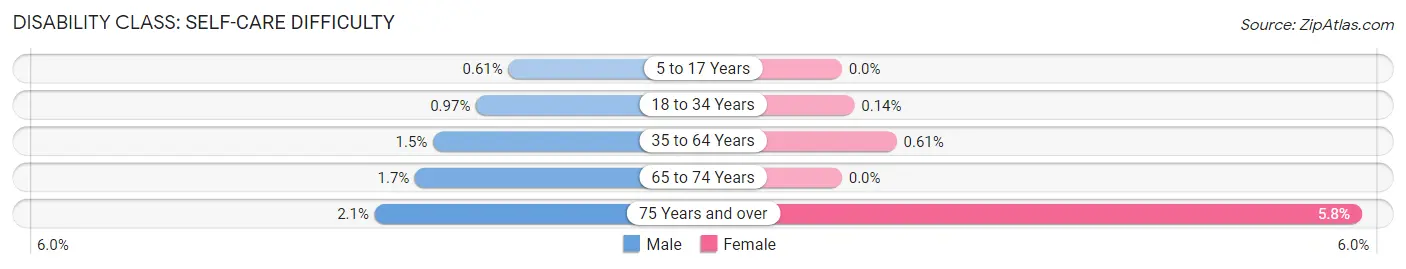
| Age Bracket | Male | Female |
| 5 to 17 Years | 9 (0.6%) | 0 (0.0%) |
| 18 to 34 Years | 25 (1.0%) | 2 (0.1%) |
| 35 to 64 Years | 51 (1.5%) | 22 (0.6%) |
| 65 to 74 Years | 16 (1.7%) | 0 (0.0%) |
| 75 Years and over | 15 (2.1%) | 43 (5.8%) |
Technology Access in Stillwater
Computing Device Access in Stillwater
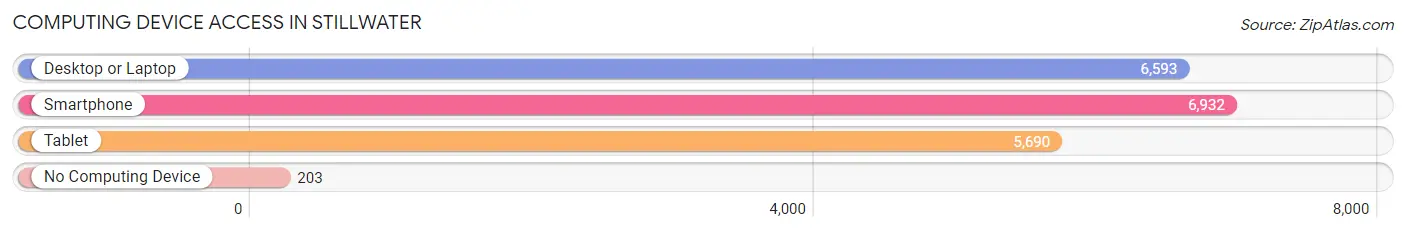
| Device Type | # Households | % Households |
| Desktop or Laptop | 6,593 | 86.9% |
| Smartphone | 6,932 | 91.4% |
| Tablet | 5,690 | 75.0% |
| No Computing Device | 203 | 2.7% |
| Total | 7,586 | 100.0% |
Internet Access in Stillwater
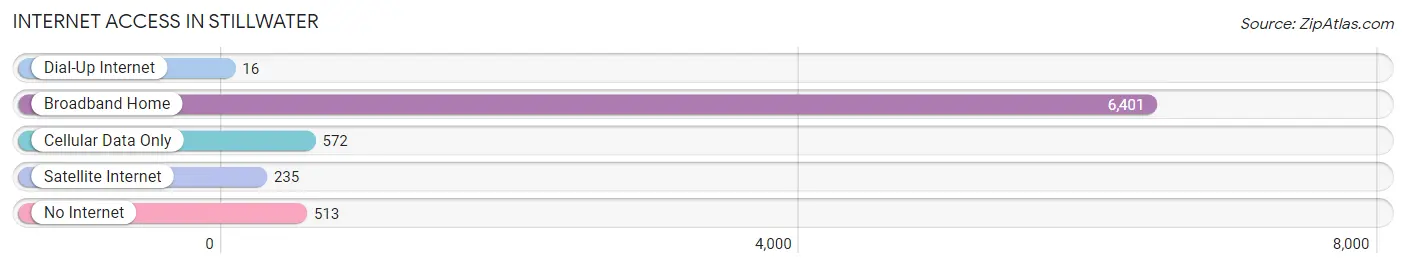
| Internet Type | # Households | % Households |
| Dial-Up Internet | 16 | 0.2% |
| Broadband Home | 6,401 | 84.4% |
| Cellular Data Only | 572 | 7.5% |
| Satellite Internet | 235 | 3.1% |
| No Internet | 513 | 6.8% |
| Total | 7,586 | 100.0% |
Stillwater Summary
History
Stillwater, Minnesota is a city located in Washington County, Minnesota, United States. It is situated on the St. Croix River, which forms the border between Minnesota and Wisconsin. The city is located approximately 20 miles east of the Twin Cities metropolitan area. Stillwater was founded in 1848 by settlers from the east coast of the United States. The city was named after the Stillwater River, which flows through the city.
The city of Stillwater was originally part of the Wisconsin Territory, but was annexed by the Minnesota Territory in 1848. The city was incorporated in 1854 and was the first city in Minnesota to be incorporated. The city was an important trading center for the lumber industry in the late 19th century. The lumber industry was the main source of employment for the city until the early 20th century.
The city of Stillwater has a rich history of industry and commerce. The city was home to the first paper mill in the United States, which was established in 1853. The city was also home to the first commercial steamboat on the St. Croix River, which was launched in 1854. The city was also home to the first railroad bridge across the St. Croix River, which was completed in 1876.
The city of Stillwater has a long history of education. The first school in the city was established in 1854. The Stillwater Public School District was established in 1872 and is the oldest public school district in the state of Minnesota. The city is also home to the Minnesota State University, which was established in 1868.
Geography
Stillwater is located in Washington County, Minnesota, United States. It is situated on the St. Croix River, which forms the border between Minnesota and Wisconsin. The city is located approximately 20 miles east of the Twin Cities metropolitan area. The city has a total area of 8.7 square miles, of which 8.3 square miles is land and 0.4 square miles is water.
The city of Stillwater is located in a region of rolling hills and valleys. The city is located on the banks of the St. Croix River, which is a major tributary of the Mississippi River. The city is located in a region of mixed forests and prairies. The city is located in a region of temperate climate, with warm summers and cold winters.
Economy
The economy of Stillwater is largely based on the service industry. The city is home to a number of businesses, including retail stores, restaurants, and professional services. The city is also home to a number of manufacturing companies, including paper mills, food processing plants, and medical device manufacturers.
The city of Stillwater is also home to a number of educational institutions, including the Minnesota State University and the Stillwater Public School District. The city is also home to a number of healthcare facilities, including the Stillwater Medical Center and the Stillwater Clinic.
Demographics
As of the 2010 census, the city of Stillwater had a population of 18,225. The population was spread out with a median age of 37.7 years. The racial makeup of the city was 94.2% White, 1.3% African American, 0.4% Native American, 1.7% Asian, 0.1% Pacific Islander, 0.7% from other races, and 1.6% from two or more races. Hispanic or Latino of any race were 2.7% of the population.
The median income for a household in the city was $54,945, and the median income for a family was $68,945. The per capita income for the city was $30,945. About 5.2% of families and 8.2% of the population were below the poverty line, including 10.2% of those under age 18 and 5.2% of those age 65 or over.
Common Questions
What is Per Capita Income in Stillwater?
Per Capita income in Stillwater is $54,315.
What is the Median Family Income in Stillwater?
Median Family Income in Stillwater is $117,686.
What is the Median Household income in Stillwater?
Median Household Income in Stillwater is $107,986.
What is Income or Wage Gap in Stillwater?
Income or Wage Gap in Stillwater is 14.5%.
Women in Stillwater earn 85.5 cents for every dollar earned by a man.
What is Inequality or Gini Index in Stillwater?
Inequality or Gini Index in Stillwater is 0.43.
What is the Total Population of Stillwater?
Total Population of Stillwater is 19,316.
What is the Total Male Population of Stillwater?
Total Male Population of Stillwater is 9,784.
What is the Total Female Population of Stillwater?
Total Female Population of Stillwater is 9,532.
What is the Ratio of Males per 100 Females in Stillwater?
There are 102.64 Males per 100 Females in Stillwater.
What is the Ratio of Females per 100 Males in Stillwater?
There are 97.42 Females per 100 Males in Stillwater.
What is the Median Population Age in Stillwater?
Median Population Age in Stillwater is 41.8 Years.
What is the Average Family Size in Stillwater
Average Family Size in Stillwater is 2.9 People.
What is the Average Household Size in Stillwater
Average Household Size in Stillwater is 2.5 People.
How Large is the Labor Force in Stillwater?
There are 10,336 People in the Labor Forcein in Stillwater.
What is the Percentage of People in the Labor Force in Stillwater?
65.9% of People are in the Labor Force in Stillwater.
What is the Unemployment Rate in Stillwater?
Unemployment Rate in Stillwater is 2.6%.