Zip Codes with the Highest Percentage of Families with Income Above $200,000 in Minnesota
RELATED REPORTS & OPTIONS
Family Income | $200k+
Minnesota
Compare Zip Codes
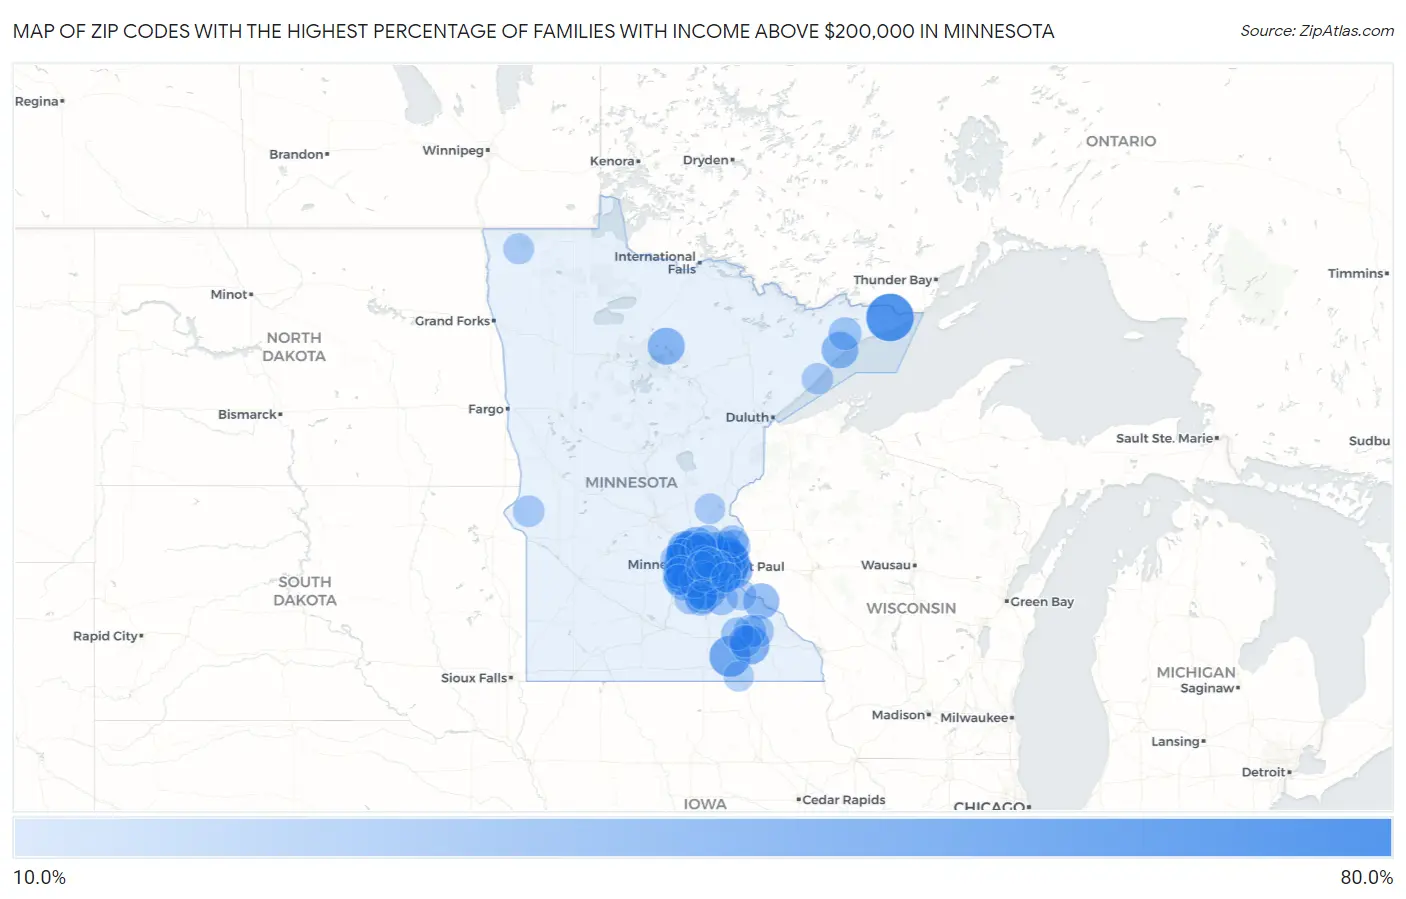
Map of Zip Codes with the Highest Percentage of Families with Income Above $200,000 in Minnesota
10.0%
80.0%
Zip Codes with the Highest Percentage of Families with Income Above $200,000 in Minnesota
| Zip Code | Families with Income > $200k | vs State | vs National | |
| 1. | 55424 | 61.8% | 16.5%(+45.3)#1 | 14.8%(+47.0)#250 |
| 2. | 55606 | 57.1% | 16.5%(+40.6)#2 | 14.8%(+42.3)#382 |
| 3. | 55436 | 51.3% | 16.5%(+34.8)#3 | 14.8%(+36.5)#602 |
| 4. | 55391 | 50.1% | 16.5%(+33.6)#4 | 14.8%(+35.3)#652 |
| 5. | 55446 | 49.7% | 16.5%(+33.2)#5 | 14.8%(+34.9)#685 |
| 6. | 55439 | 49.5% | 16.5%(+33.0)#6 | 14.8%(+34.7)#693 |
| 7. | 55415 | 47.9% | 16.5%(+31.4)#7 | 14.8%(+33.1)#768 |
| 8. | 55356 | 47.9% | 16.5%(+31.4)#8 | 14.8%(+33.1)#769 |
| 9. | 55347 | 47.4% | 16.5%(+30.9)#9 | 14.8%(+32.6)#791 |
| 10. | 55331 | 47.1% | 16.5%(+30.6)#10 | 14.8%(+32.3)#808 |
| 11. | 55042 | 46.1% | 16.5%(+29.6)#11 | 14.8%(+31.3)#865 |
| 12. | 55386 | 45.8% | 16.5%(+29.3)#12 | 14.8%(+31.0)#885 |
| 13. | 55410 | 45.5% | 16.5%(+29.0)#13 | 14.8%(+30.7)#904 |
| 14. | 55340 | 44.8% | 16.5%(+28.3)#14 | 14.8%(+30.0)#948 |
| 15. | 55982 | 43.1% | 16.5%(+26.6)#15 | 14.8%(+28.3)#1,050 |
| 16. | 55105 | 41.8% | 16.5%(+25.3)#16 | 14.8%(+27.0)#1,157 |
| 17. | 55419 | 41.5% | 16.5%(+25.0)#17 | 14.8%(+26.7)#1,184 |
| 18. | 55317 | 41.5% | 16.5%(+25.0)#18 | 14.8%(+26.7)#1,186 |
| 19. | 55401 | 41.2% | 16.5%(+24.7)#19 | 14.8%(+26.4)#1,208 |
| 20. | 55127 | 39.2% | 16.5%(+22.7)#20 | 14.8%(+24.4)#1,394 |
| 21. | 55129 | 38.8% | 16.5%(+22.3)#21 | 14.8%(+24.0)#1,430 |
| 22. | 55357 | 38.8% | 16.5%(+22.3)#22 | 14.8%(+24.0)#1,438 |
| 23. | 55359 | 38.6% | 16.5%(+22.1)#23 | 14.8%(+23.8)#1,453 |
| 24. | 55416 | 38.3% | 16.5%(+21.8)#24 | 14.8%(+23.5)#1,479 |
| 25. | 55902 | 38.0% | 16.5%(+21.5)#25 | 14.8%(+23.2)#1,502 |
| 26. | 55311 | 37.6% | 16.5%(+21.1)#26 | 14.8%(+22.8)#1,535 |
| 27. | 55345 | 37.6% | 16.5%(+21.1)#27 | 14.8%(+22.8)#1,540 |
| 28. | 55364 | 37.6% | 16.5%(+21.1)#28 | 14.8%(+22.8)#1,542 |
| 29. | 55115 | 37.6% | 16.5%(+21.1)#29 | 14.8%(+22.8)#1,545 |
| 30. | 55442 | 37.0% | 16.5%(+20.5)#30 | 14.8%(+22.2)#1,607 |
| 31. | 55120 | 36.8% | 16.5%(+20.3)#31 | 14.8%(+22.0)#1,629 |
| 32. | 55327 | 36.7% | 16.5%(+20.2)#32 | 14.8%(+21.9)#1,649 |
| 33. | 55447 | 35.6% | 16.5%(+19.1)#33 | 14.8%(+20.8)#1,772 |
| 34. | 55001 | 35.3% | 16.5%(+18.8)#34 | 14.8%(+20.5)#1,809 |
| 35. | 55372 | 34.8% | 16.5%(+18.3)#35 | 14.8%(+20.0)#1,859 |
| 36. | 56659 | 34.0% | 16.5%(+17.5)#36 | 14.8%(+19.2)#1,967 |
| 37. | 55346 | 33.8% | 16.5%(+17.3)#37 | 14.8%(+19.0)#1,990 |
| 38. | 55441 | 33.3% | 16.5%(+16.8)#38 | 14.8%(+18.5)#2,054 |
| 39. | 55613 | 33.3% | 16.5%(+16.8)#39 | 14.8%(+18.5)#2,069 |
| 40. | 55123 | 33.0% | 16.5%(+16.5)#40 | 14.8%(+18.2)#2,102 |
| 41. | 55044 | 32.1% | 16.5%(+15.6)#41 | 14.8%(+17.3)#2,210 |
| 42. | 55026 | 31.7% | 16.5%(+15.2)#42 | 14.8%(+16.9)#2,275 |
| 43. | 55341 | 30.5% | 16.5%(+14.0)#43 | 14.8%(+15.7)#2,445 |
| 44. | 55403 | 29.7% | 16.5%(+13.2)#44 | 14.8%(+14.9)#2,557 |
| 45. | 55077 | 29.4% | 16.5%(+12.9)#45 | 14.8%(+14.6)#2,603 |
| 46. | 55054 | 29.1% | 16.5%(+12.6)#46 | 14.8%(+14.3)#2,654 |
| 47. | 55438 | 28.8% | 16.5%(+12.3)#47 | 14.8%(+14.0)#2,711 |
| 48. | 55116 | 28.2% | 16.5%(+11.7)#48 | 14.8%(+13.4)#2,831 |
| 49. | 55374 | 28.1% | 16.5%(+11.6)#49 | 14.8%(+13.3)#2,852 |
| 50. | 55378 | 27.9% | 16.5%(+11.4)#50 | 14.8%(+13.1)#2,875 |
| 51. | 55082 | 27.2% | 16.5%(+10.7)#51 | 14.8%(+12.4)#3,015 |
| 52. | 55315 | 26.7% | 16.5%(+10.2)#52 | 14.8%(+11.9)#3,110 |
| 53. | 55405 | 26.4% | 16.5%(+9.90)#53 | 14.8%(+11.6)#3,163 |
| 54. | 55305 | 26.0% | 16.5%(+9.50)#54 | 14.8%(+11.2)#3,243 |
| 55. | 55038 | 25.9% | 16.5%(+9.40)#55 | 14.8%(+11.1)#3,268 |
| 56. | 55126 | 25.4% | 16.5%(+8.90)#56 | 14.8%(+10.6)#3,363 |
| 57. | 55047 | 25.4% | 16.5%(+8.90)#57 | 14.8%(+10.6)#3,375 |
| 58. | 55615 | 25.3% | 16.5%(+8.80)#58 | 14.8%(+10.5)#3,402 |
| 59. | 55449 | 25.2% | 16.5%(+8.70)#59 | 14.8%(+10.4)#3,404 |
| 60. | 55417 | 25.2% | 16.5%(+8.70)#60 | 14.8%(+10.4)#3,408 |
| 61. | 55065 | 25.1% | 16.5%(+8.60)#61 | 14.8%(+10.3)#3,450 |
| 62. | 55906 | 24.9% | 16.5%(+8.40)#62 | 14.8%(+10.1)#3,498 |
| 63. | 55409 | 24.9% | 16.5%(+8.40)#63 | 14.8%(+10.1)#3,503 |
| 64. | 55960 | 24.8% | 16.5%(+8.30)#64 | 14.8%(+10.00)#3,529 |
| 65. | 55373 | 24.6% | 16.5%(+8.10)#65 | 14.8%(+9.80)#3,578 |
| 66. | 55955 | 24.5% | 16.5%(+8.00)#66 | 14.8%(+9.70)#3,610 |
| 67. | 55369 | 24.4% | 16.5%(+7.90)#67 | 14.8%(+9.60)#3,619 |
| 68. | 55920 | 24.3% | 16.5%(+7.80)#68 | 14.8%(+9.50)#3,646 |
| 69. | 55304 | 23.8% | 16.5%(+7.30)#69 | 14.8%(+9.00)#3,755 |
| 70. | 55125 | 23.4% | 16.5%(+6.90)#70 | 14.8%(+8.60)#3,847 |
| 71. | 55068 | 23.4% | 16.5%(+6.90)#71 | 14.8%(+8.60)#3,848 |
| 72. | 55073 | 23.0% | 16.5%(+6.50)#72 | 14.8%(+8.20)#3,955 |
| 73. | 55150 | 22.9% | 16.5%(+6.40)#73 | 14.8%(+8.10)#3,986 |
| 74. | 55122 | 22.7% | 16.5%(+6.20)#74 | 14.8%(+7.90)#4,014 |
| 75. | 55318 | 22.7% | 16.5%(+6.20)#75 | 14.8%(+7.90)#4,015 |
| 76. | 55435 | 22.6% | 16.5%(+6.10)#76 | 14.8%(+7.80)#4,051 |
| 77. | 55328 | 22.6% | 16.5%(+6.10)#77 | 14.8%(+7.80)#4,054 |
| 78. | 55387 | 22.5% | 16.5%(+6.00)#78 | 14.8%(+7.70)#4,084 |
| 79. | 55088 | 22.5% | 16.5%(+6.00)#79 | 14.8%(+7.70)#4,092 |
| 80. | 55422 | 22.2% | 16.5%(+5.70)#80 | 14.8%(+7.40)#4,157 |
| 81. | 55114 | 22.2% | 16.5%(+5.70)#81 | 14.8%(+7.40)#4,164 |
| 82. | 56236 | 22.2% | 16.5%(+5.70)#82 | 14.8%(+7.40)#4,169 |
| 83. | 55101 | 22.0% | 16.5%(+5.50)#83 | 14.8%(+7.20)#4,211 |
| 84. | 55408 | 21.7% | 16.5%(+5.20)#84 | 14.8%(+6.90)#4,295 |
| 85. | 55601 | 21.7% | 16.5%(+5.20)#85 | 14.8%(+6.90)#4,316 |
| 86. | 56071 | 21.6% | 16.5%(+5.10)#86 | 14.8%(+6.80)#4,332 |
| 87. | 55118 | 21.4% | 16.5%(+4.90)#87 | 14.8%(+6.60)#4,377 |
| 88. | 55379 | 21.2% | 16.5%(+4.70)#88 | 14.8%(+6.40)#4,432 |
| 89. | 55316 | 21.2% | 16.5%(+4.70)#89 | 14.8%(+6.40)#4,441 |
| 90. | 55375 | 21.2% | 16.5%(+4.70)#90 | 14.8%(+6.40)#4,454 |
| 91. | 55437 | 21.0% | 16.5%(+4.50)#91 | 14.8%(+6.20)#4,504 |
| 92. | 55322 | 20.9% | 16.5%(+4.40)#92 | 14.8%(+6.10)#4,548 |
| 93. | 56734 | 20.8% | 16.5%(+4.30)#93 | 14.8%(+6.00)#4,592 |
| 94. | 55089 | 20.2% | 16.5%(+3.70)#94 | 14.8%(+5.40)#4,765 |
| 95. | 55080 | 20.1% | 16.5%(+3.60)#95 | 14.8%(+5.30)#4,791 |
| 96. | 55909 | 20.0% | 16.5%(+3.50)#96 | 14.8%(+5.20)#4,826 |
| 97. | 55426 | 19.9% | 16.5%(+3.40)#97 | 14.8%(+5.10)#4,849 |
| 98. | 55413 | 19.9% | 16.5%(+3.40)#98 | 14.8%(+5.10)#4,859 |
| 99. | 55020 | 19.9% | 16.5%(+3.40)#99 | 14.8%(+5.10)#4,869 |
| 100. | 55016 | 19.6% | 16.5%(+3.10)#100 | 14.8%(+4.80)#4,938 |
Common Questions
What are the Top 10 Zip Codes with the Highest Percentage of Families with Income Above $200,000 in Minnesota?
Top 10 Zip Codes with the Highest Percentage of Families with Income Above $200,000 in Minnesota are:
What zip code has the Highest Percentage of Families with Income Above $200,000 in Minnesota?
55424 has the Highest Percentage of Families with Income Above $200,000 in Minnesota with 61.8%.
What is the Percentage of Families with Income Above $200,000 in the State of Minnesota?
Percentage of Families with Income Above $200,000 in Minnesota is 16.5%.
What is the Percentage of Families with Income Above $200,000 in the United States?
Percentage of Families with Income Above $200,000 in the United States is 14.8%.