Lake St Croix Beach, MN Map & Demographics
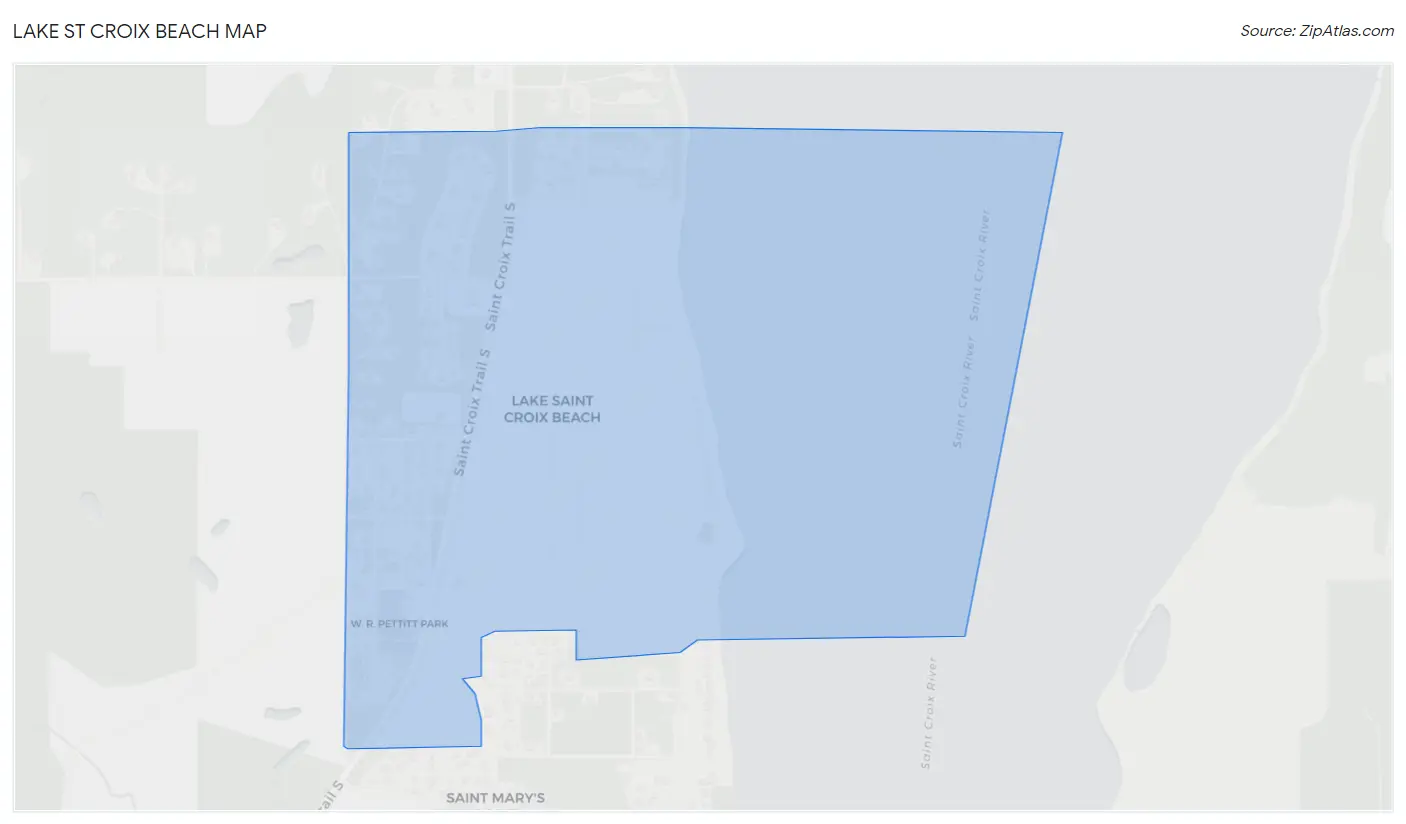
Lake St Croix Beach Map
Lake St Croix Beach Overview
$62,231
PER CAPITA INCOME
$112,188
AVG FAMILY INCOME
$95,313
AVG HOUSEHOLD INCOME
27.1%
WAGE / INCOME GAP [ % ]
72.9¢/ $1
WAGE / INCOME GAP [ $ ]
0.48
INEQUALITY / GINI INDEX
1,106
TOTAL POPULATION
514
MALE POPULATION
592
FEMALE POPULATION
86.82
MALES / 100 FEMALES
115.18
FEMALES / 100 MALES
53.4
MEDIAN AGE
2.7
AVG FAMILY SIZE
2.2
AVG HOUSEHOLD SIZE
699
LABOR FORCE [ PEOPLE ]
70.9%
PERCENT IN LABOR FORCE
1.4%
UNEMPLOYMENT RATE
Income in Lake St Croix Beach
Income Overview in Lake St Croix Beach
Per Capita Income in Lake St Croix Beach is $62,231, while median incomes of families and households are $112,188 and $95,313 respectively.
| Characteristic | Number | Measure |
| Per Capita Income | 1,106 | $62,231 |
| Median Family Income | 310 | $112,188 |
| Mean Family Income | 310 | $180,351 |
| Median Household Income | 506 | $95,313 |
| Mean Household Income | 506 | $140,731 |
| Income Deficit | 310 | $0 |
| Wage / Income Gap (%) | 1,106 | 27.09% |
| Wage / Income Gap ($) | 1,106 | 72.91¢ per $1 |
| Gini / Inequality Index | 1,106 | 0.48 |
Earnings by Sex in Lake St Croix Beach
Average Earnings in Lake St Croix Beach are $42,679, $52,656 for men and $38,393 for women, a difference of 27.1%.
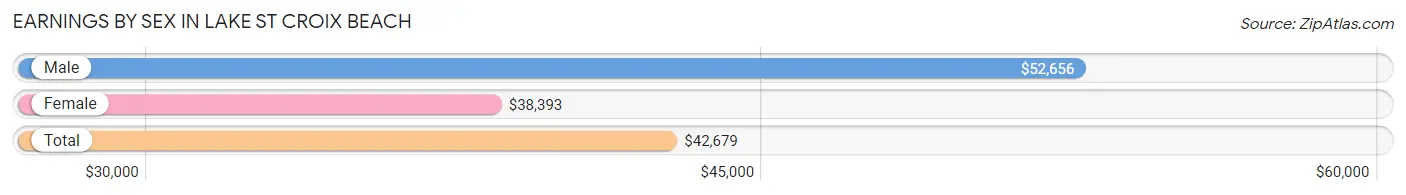
| Sex | Number | Average Earnings |
| Male | 335 (46.0%) | $52,656 |
| Female | 394 (54.0%) | $38,393 |
| Total | 729 (100.0%) | $42,679 |
Earnings by Sex by Income Bracket in Lake St Croix Beach
The most common earnings brackets in Lake St Croix Beach are $25,000 to $29,999 for men (66 | 19.7%) and $10,000 to $12,499 for women (72 | 18.3%).
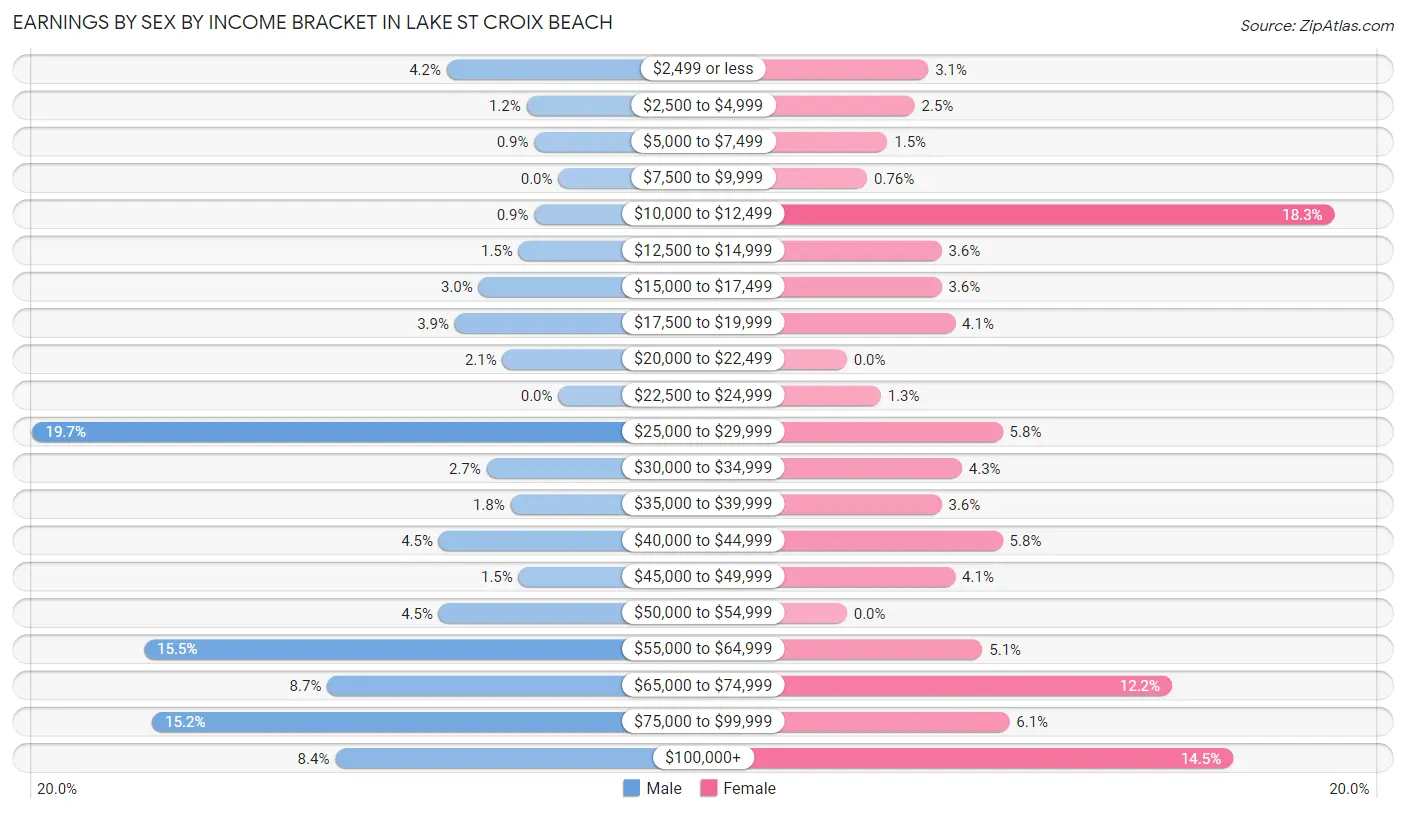
| Income | Male | Female |
| $2,499 or less | 14 (4.2%) | 12 (3.0%) |
| $2,500 to $4,999 | 4 (1.2%) | 10 (2.5%) |
| $5,000 to $7,499 | 3 (0.9%) | 6 (1.5%) |
| $7,500 to $9,999 | 0 (0.0%) | 3 (0.8%) |
| $10,000 to $12,499 | 3 (0.9%) | 72 (18.3%) |
| $12,500 to $14,999 | 5 (1.5%) | 14 (3.5%) |
| $15,000 to $17,499 | 10 (3.0%) | 14 (3.5%) |
| $17,500 to $19,999 | 13 (3.9%) | 16 (4.1%) |
| $20,000 to $22,499 | 7 (2.1%) | 0 (0.0%) |
| $22,500 to $24,999 | 0 (0.0%) | 5 (1.3%) |
| $25,000 to $29,999 | 66 (19.7%) | 23 (5.8%) |
| $30,000 to $34,999 | 9 (2.7%) | 17 (4.3%) |
| $35,000 to $39,999 | 6 (1.8%) | 14 (3.5%) |
| $40,000 to $44,999 | 15 (4.5%) | 23 (5.8%) |
| $45,000 to $49,999 | 5 (1.5%) | 16 (4.1%) |
| $50,000 to $54,999 | 15 (4.5%) | 0 (0.0%) |
| $55,000 to $64,999 | 52 (15.5%) | 20 (5.1%) |
| $65,000 to $74,999 | 29 (8.7%) | 48 (12.2%) |
| $75,000 to $99,999 | 51 (15.2%) | 24 (6.1%) |
| $100,000+ | 28 (8.4%) | 57 (14.5%) |
| Total | 335 (100.0%) | 394 (100.0%) |
Earnings by Sex by Educational Attainment in Lake St Croix Beach
Average earnings in Lake St Croix Beach are $54,688 for men and $41,442 for women, a difference of 24.2%. Men with an educational attainment of college or associate's degree enjoy the highest average annual earnings of $75,455, while those with graduate degree education earn the least with $26,349. Women with an educational attainment of bachelor's degree earn the most with the average annual earnings of $71,406, while those with high school diploma education have the smallest earnings of $27,045.
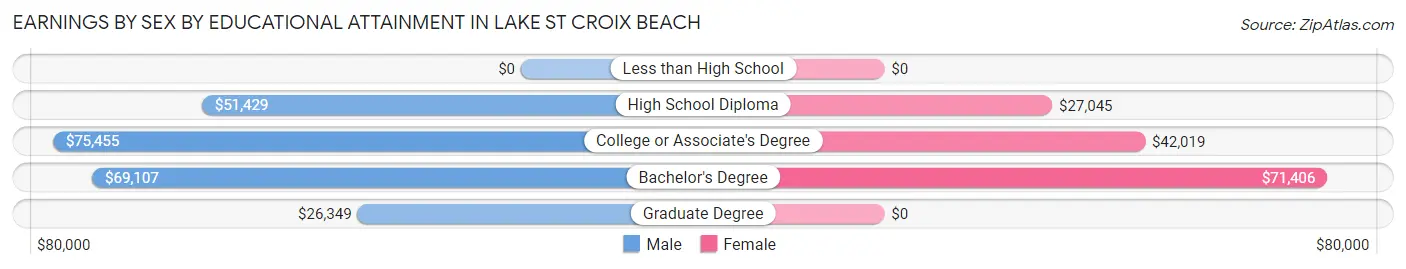
| Educational Attainment | Male Income | Female Income |
| Less than High School | - | - |
| High School Diploma | $51,429 | $27,045 |
| College or Associate's Degree | $75,455 | $42,019 |
| Bachelor's Degree | $69,107 | $71,406 |
| Graduate Degree | $26,349 | $0 |
| Total | $54,688 | $41,442 |
Family Income in Lake St Croix Beach
Family Income Brackets in Lake St Croix Beach
According to the Lake St Croix Beach family income data, there are 79 families falling into the $200,000+ income range, which is the most common income bracket and makes up 25.5% of all families.
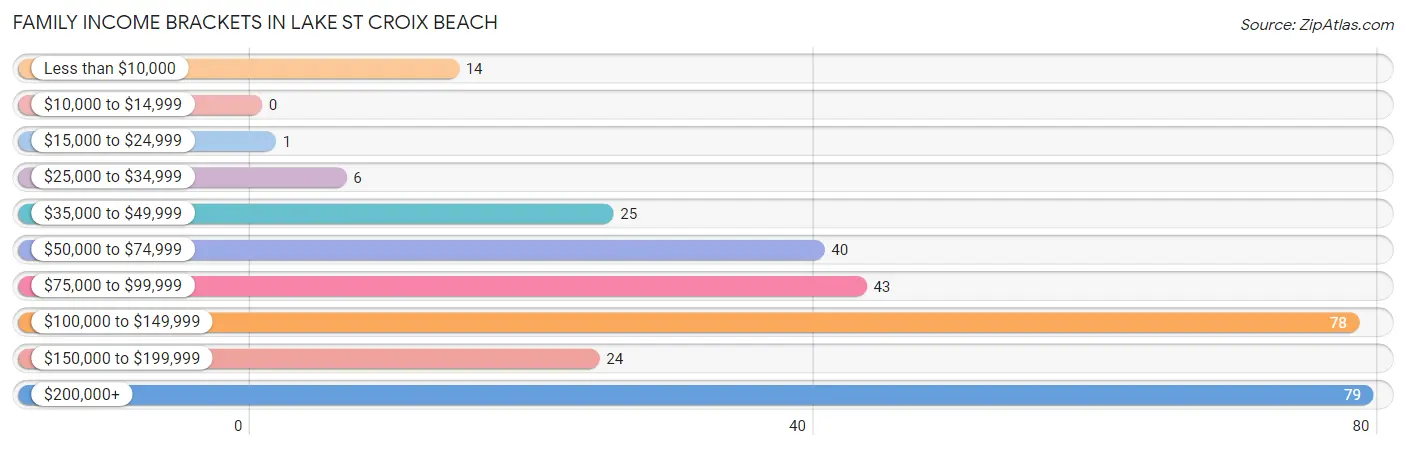
| Income Bracket | # Families | % Families |
| Less than $10,000 | 14 | 4.5% |
| $10,000 to $14,999 | 0 | 0.0% |
| $15,000 to $24,999 | 1 | 0.3% |
| $25,000 to $34,999 | 6 | 1.9% |
| $35,000 to $49,999 | 25 | 8.1% |
| $50,000 to $74,999 | 40 | 12.9% |
| $75,000 to $99,999 | 43 | 13.9% |
| $100,000 to $149,999 | 78 | 25.2% |
| $150,000 to $199,999 | 24 | 7.7% |
| $200,000+ | 79 | 25.5% |
Family Income by Famaliy Size in Lake St Croix Beach
3-person families (150 | 48.4%) account for the highest median family income in Lake St Croix Beach with $200,357 per family, while 3-person families (150 | 48.4%) have the highest median income of $66,786 per family member.
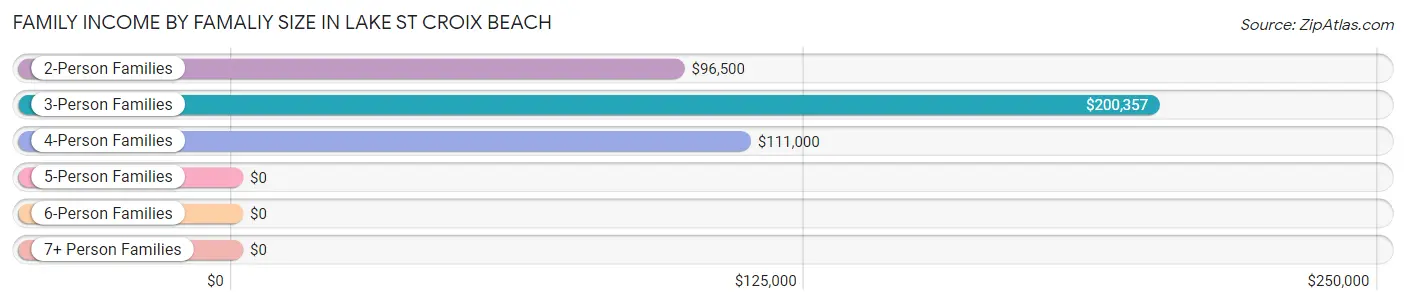
| Income Bracket | # Families | Median Income |
| 2-Person Families | 138 (44.5%) | $96,500 |
| 3-Person Families | 150 (48.4%) | $200,357 |
| 4-Person Families | 16 (5.2%) | $111,000 |
| 5-Person Families | 6 (1.9%) | $0 |
| 6-Person Families | 0 (0.0%) | $0 |
| 7+ Person Families | 0 (0.0%) | $0 |
| Total | 310 (100.0%) | $112,188 |
Family Income by Number of Earners in Lake St Croix Beach
The median family income in Lake St Croix Beach is $112,188, with families comprising 3+ earners (87) having the highest median family income of $250,001, while families with no earners (57) have the lowest median family income of $45,313, accounting for 28.1% and 18.4% of families, respectively.
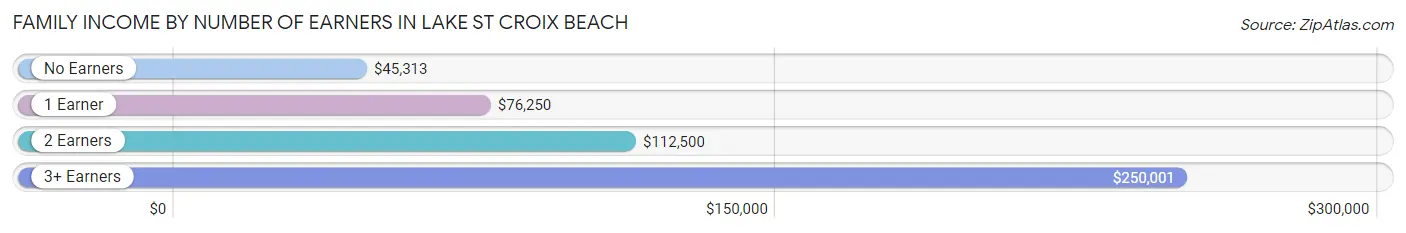
| Number of Earners | # Families | Median Income |
| No Earners | 57 (18.4%) | $45,313 |
| 1 Earner | 56 (18.1%) | $76,250 |
| 2 Earners | 110 (35.5%) | $112,500 |
| 3+ Earners | 87 (28.1%) | $250,001 |
| Total | 310 (100.0%) | $112,188 |
Household Income in Lake St Croix Beach
Household Income Brackets in Lake St Croix Beach
With 105 households falling in the category, the $75,000 to $99,999 income range is the most frequent in Lake St Croix Beach, accounting for 20.7% of all households.
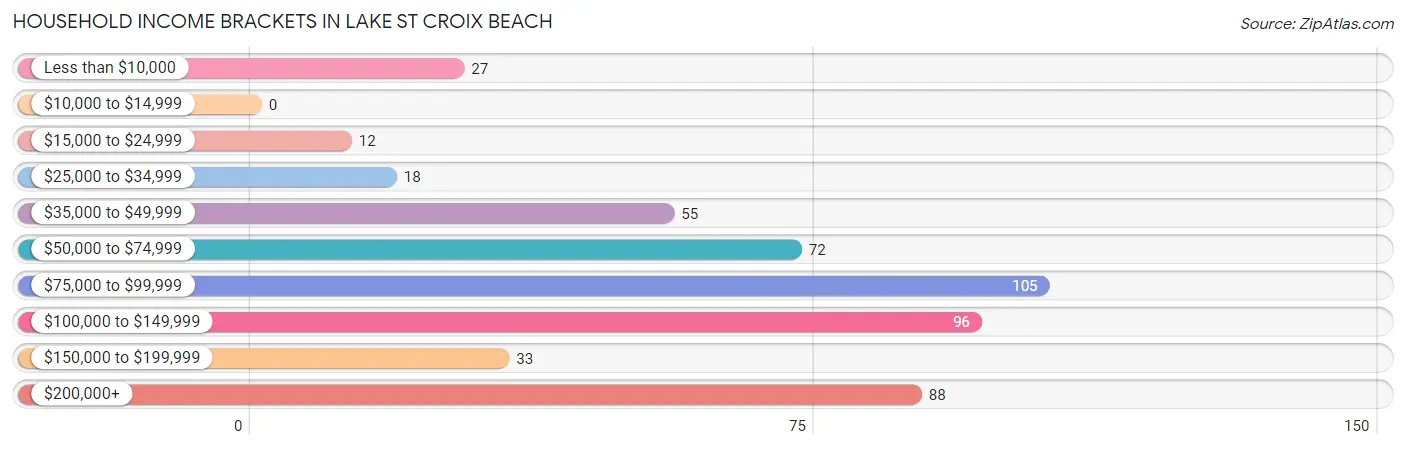
| Income Bracket | # Households | % Households |
| Less than $10,000 | 27 | 5.3% |
| $10,000 to $14,999 | 0 | 0.0% |
| $15,000 to $24,999 | 12 | 2.4% |
| $25,000 to $34,999 | 18 | 3.6% |
| $35,000 to $49,999 | 55 | 10.9% |
| $50,000 to $74,999 | 72 | 14.2% |
| $75,000 to $99,999 | 105 | 20.8% |
| $100,000 to $149,999 | 96 | 19.0% |
| $150,000 to $199,999 | 33 | 6.5% |
| $200,000+ | 88 | 17.4% |
Household Income by Householder Age in Lake St Croix Beach
The median household income in Lake St Croix Beach is $95,313, with the highest median household income of $102,500 found in the 65+ years age bracket for the primary householder. A total of 176 households (34.8%) fall into this category. Meanwhile, the 15 to 24 years age bracket for the primary householder has the lowest median household income of $0, with 21 households (4.2%) in this group.
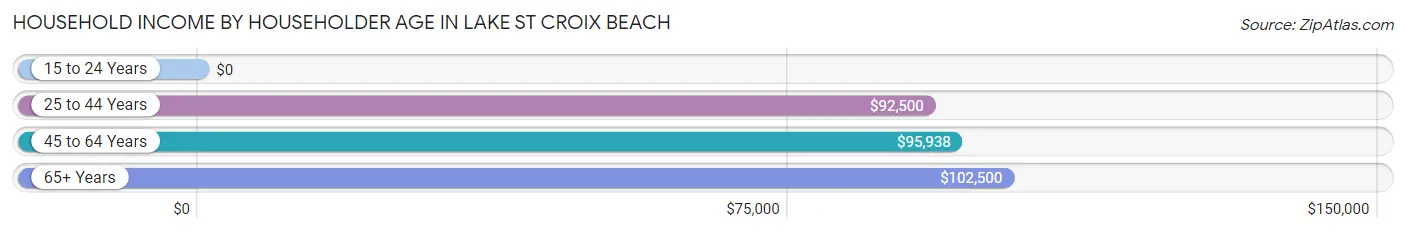
| Income Bracket | # Households | Median Income |
| 15 to 24 Years | 21 (4.2%) | $0 |
| 25 to 44 Years | 96 (19.0%) | $92,500 |
| 45 to 64 Years | 213 (42.1%) | $95,938 |
| 65+ Years | 176 (34.8%) | $102,500 |
| Total | 506 (100.0%) | $95,313 |
Poverty in Lake St Croix Beach
Income Below Poverty by Sex and Age in Lake St Croix Beach
With 6.2% poverty level for males and 9.1% for females among the residents of Lake St Croix Beach, 6 to 11 year old males and 16 and 17 year old females are the most vulnerable to poverty, with 12 males (42.9%) and 5 females (100.0%) in their respective age groups living below the poverty level.
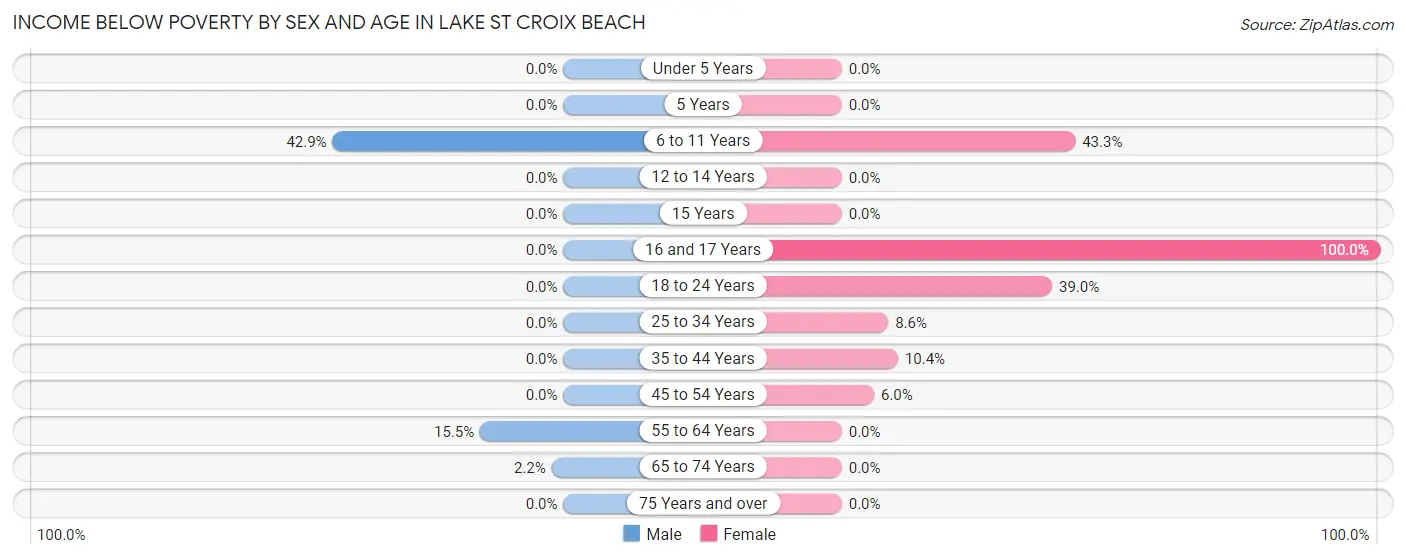
| Age Bracket | Male | Female |
| Under 5 Years | 0 (0.0%) | 0 (0.0%) |
| 5 Years | 0 (0.0%) | 0 (0.0%) |
| 6 to 11 Years | 12 (42.9%) | 13 (43.3%) |
| 12 to 14 Years | 0 (0.0%) | 0 (0.0%) |
| 15 Years | 0 (0.0%) | 0 (0.0%) |
| 16 and 17 Years | 0 (0.0%) | 5 (100.0%) |
| 18 to 24 Years | 0 (0.0%) | 16 (39.0%) |
| 25 to 34 Years | 0 (0.0%) | 5 (8.6%) |
| 35 to 44 Years | 0 (0.0%) | 10 (10.4%) |
| 45 to 54 Years | 0 (0.0%) | 4 (6.0%) |
| 55 to 64 Years | 17 (15.4%) | 0 (0.0%) |
| 65 to 74 Years | 3 (2.2%) | 0 (0.0%) |
| 75 Years and over | 0 (0.0%) | 0 (0.0%) |
| Total | 32 (6.2%) | 53 (9.1%) |
Income Above Poverty by Sex and Age in Lake St Croix Beach
According to the poverty statistics in Lake St Croix Beach, males aged under 5 years and females aged under 5 years are the age groups that are most secure financially, with 100.0% of males and 100.0% of females in these age groups living above the poverty line.
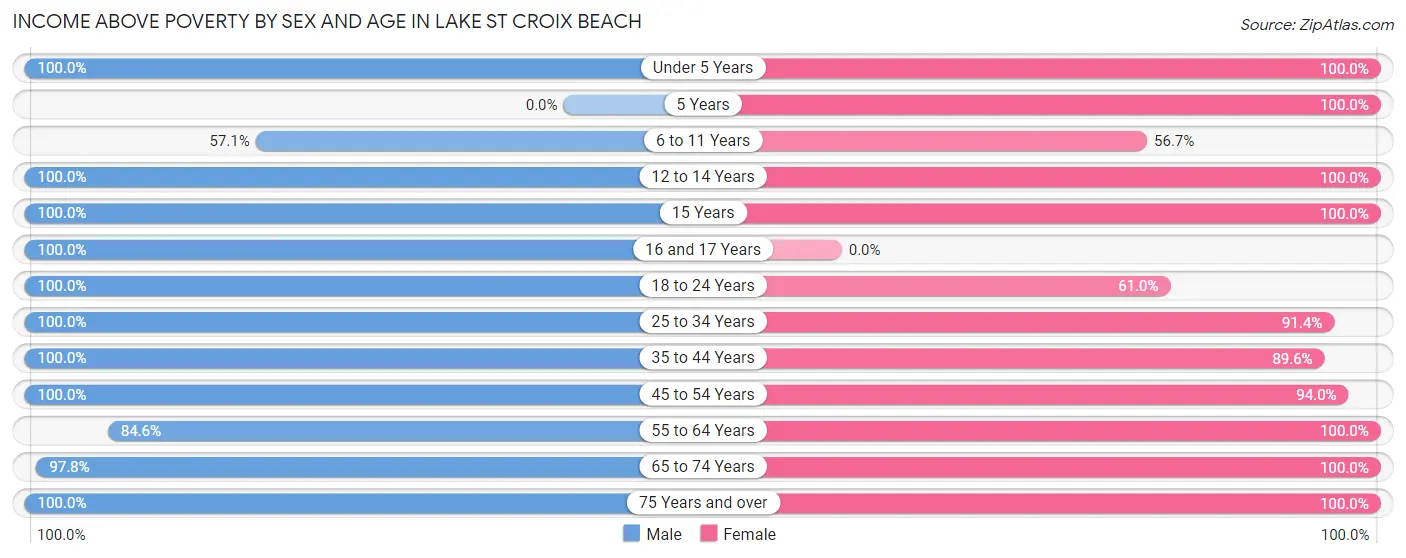
| Age Bracket | Male | Female |
| Under 5 Years | 17 (100.0%) | 12 (100.0%) |
| 5 Years | 0 (0.0%) | 3 (100.0%) |
| 6 to 11 Years | 16 (57.1%) | 17 (56.7%) |
| 12 to 14 Years | 2 (100.0%) | 2 (100.0%) |
| 15 Years | 3 (100.0%) | 12 (100.0%) |
| 16 and 17 Years | 24 (100.0%) | 0 (0.0%) |
| 18 to 24 Years | 33 (100.0%) | 25 (61.0%) |
| 25 to 34 Years | 44 (100.0%) | 53 (91.4%) |
| 35 to 44 Years | 44 (100.0%) | 86 (89.6%) |
| 45 to 54 Years | 52 (100.0%) | 63 (94.0%) |
| 55 to 64 Years | 93 (84.6%) | 117 (100.0%) |
| 65 to 74 Years | 134 (97.8%) | 124 (100.0%) |
| 75 Years and over | 20 (100.0%) | 14 (100.0%) |
| Total | 482 (93.8%) | 528 (90.9%) |
Income Below Poverty Among Married-Couple Families in Lake St Croix Beach
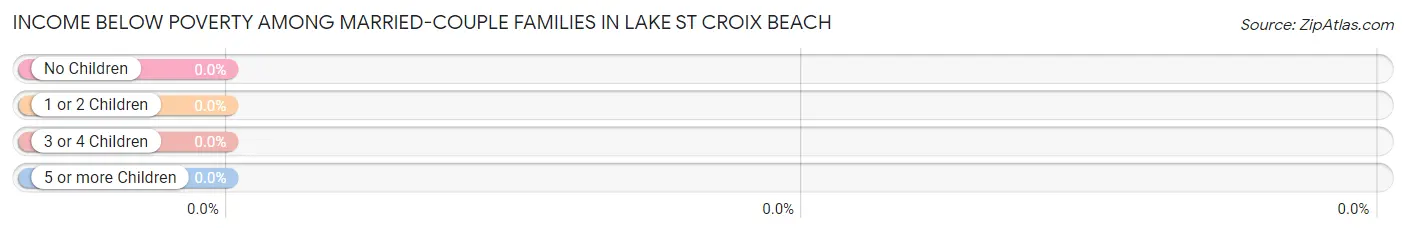
| Children | Above Poverty | Below Poverty |
| No Children | 220 (100.0%) | 0 (0.0%) |
| 1 or 2 Children | 43 (100.0%) | 0 (0.0%) |
| 3 or 4 Children | 0 (0.0%) | 0 (0.0%) |
| 5 or more Children | 0 (0.0%) | 0 (0.0%) |
| Total | 263 (100.0%) | 0 (0.0%) |
Income Below Poverty Among Single-Parent Households in Lake St Croix Beach
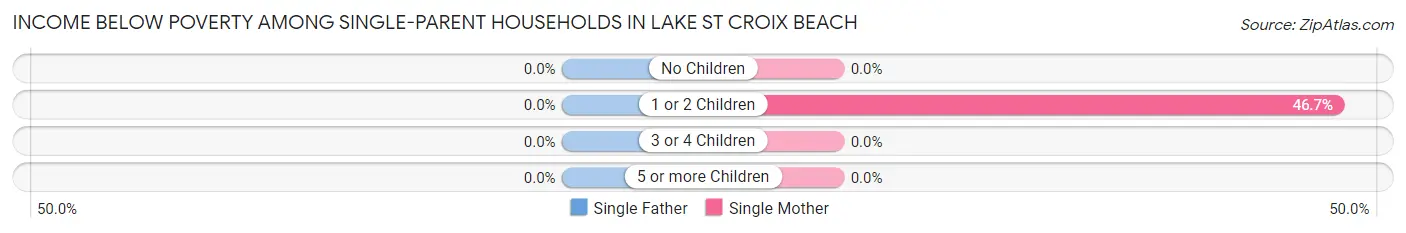
| Children | Single Father | Single Mother |
| No Children | 0 (0.0%) | 0 (0.0%) |
| 1 or 2 Children | 0 (0.0%) | 14 (46.7%) |
| 3 or 4 Children | 0 (0.0%) | 0 (0.0%) |
| 5 or more Children | 0 (0.0%) | 0 (0.0%) |
| Total | 0 (0.0%) | 14 (35.0%) |
Income Below Poverty Among Married-Couple vs Single-Parent Households in Lake St Croix Beach
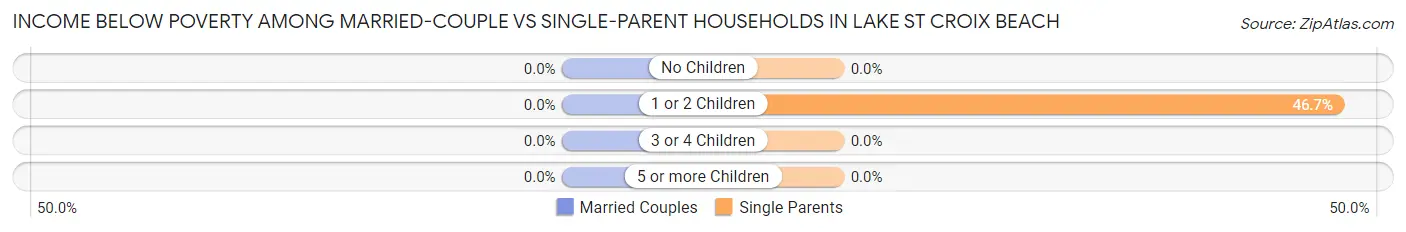
| Children | Married-Couple Families | Single-Parent Households |
| No Children | 0 (0.0%) | 0 (0.0%) |
| 1 or 2 Children | 0 (0.0%) | 14 (46.7%) |
| 3 or 4 Children | 0 (0.0%) | 0 (0.0%) |
| 5 or more Children | 0 (0.0%) | 0 (0.0%) |
| Total | 0 (0.0%) | 14 (29.8%) |
Race in Lake St Croix Beach
The most populous races in Lake St Croix Beach are White / Caucasian (963 | 87.1%), Two or more Races (95 | 8.6%), and Asian (48 | 4.3%).
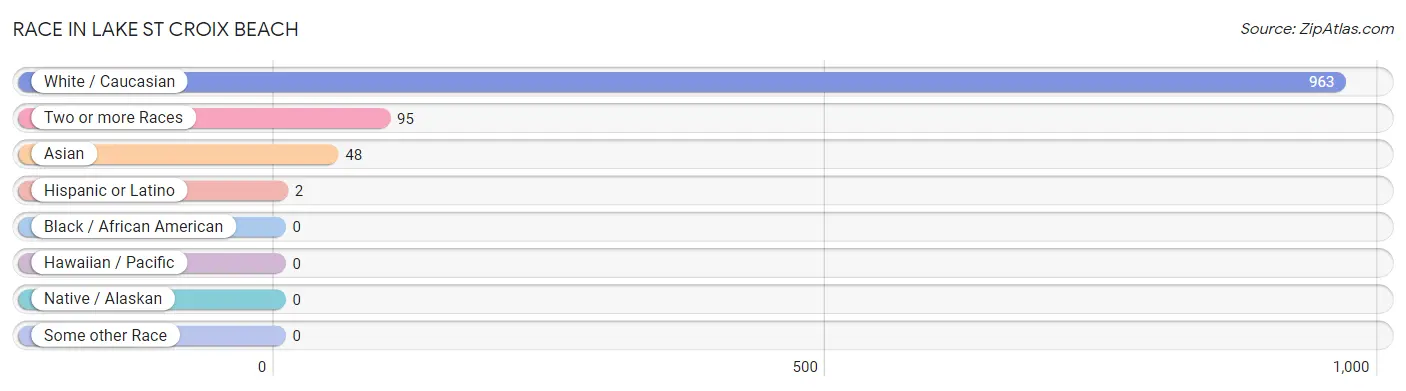
| Race | # Population | % Population |
| Asian | 48 | 4.3% |
| Black / African American | 0 | 0.0% |
| Hawaiian / Pacific | 0 | 0.0% |
| Hispanic or Latino | 2 | 0.2% |
| Native / Alaskan | 0 | 0.0% |
| White / Caucasian | 963 | 87.1% |
| Two or more Races | 95 | 8.6% |
| Some other Race | 0 | 0.0% |
| Total | 1,106 | 100.0% |
Ancestry in Lake St Croix Beach
The most populous ancestries reported in Lake St Croix Beach are German (361 | 32.6%), Irish (248 | 22.4%), Norwegian (185 | 16.7%), Swedish (90 | 8.1%), and English (62 | 5.6%), together accounting for 85.5% of all Lake St Croix Beach residents.
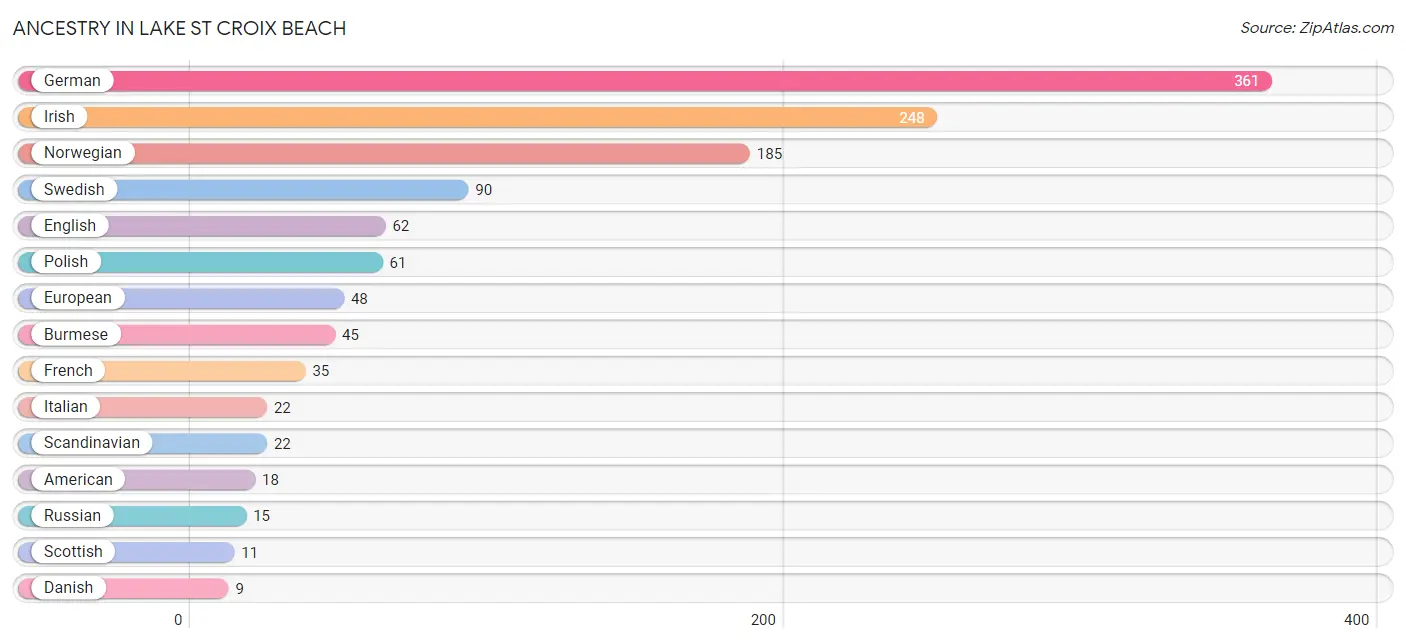
| Ancestry | # Population | % Population |
| American | 18 | 1.6% |
| Arab | 4 | 0.4% |
| Burmese | 45 | 4.1% |
| Creek | 8 | 0.7% |
| Croatian | 3 | 0.3% |
| Czech | 8 | 0.7% |
| Danish | 9 | 0.8% |
| Dutch | 5 | 0.4% |
| English | 62 | 5.6% |
| European | 48 | 4.3% |
| Finnish | 1 | 0.1% |
| French | 35 | 3.2% |
| French Canadian | 6 | 0.5% |
| German | 361 | 32.6% |
| Irish | 248 | 22.4% |
| Italian | 22 | 2.0% |
| Korean | 6 | 0.5% |
| Lebanese | 4 | 0.4% |
| Mexican | 2 | 0.2% |
| Native Hawaiian | 7 | 0.6% |
| Northern European | 8 | 0.7% |
| Norwegian | 185 | 16.7% |
| Polish | 61 | 5.5% |
| Russian | 15 | 1.4% |
| Scandinavian | 22 | 2.0% |
| Scottish | 11 | 1.0% |
| Slovak | 3 | 0.3% |
| Swedish | 90 | 8.1% |
| Welsh | 6 | 0.5% | View All 29 Rows |
Immigrants in Lake St Croix Beach
The most numerous immigrant groups reported in Lake St Croix Beach came from Asia (48 | 4.3%), Eastern Asia (45 | 4.1%), Korea (45 | 4.1%), Europe (6 | 0.5%), and Eastern Europe (4 | 0.4%), together accounting for 13.4% of all Lake St Croix Beach residents.
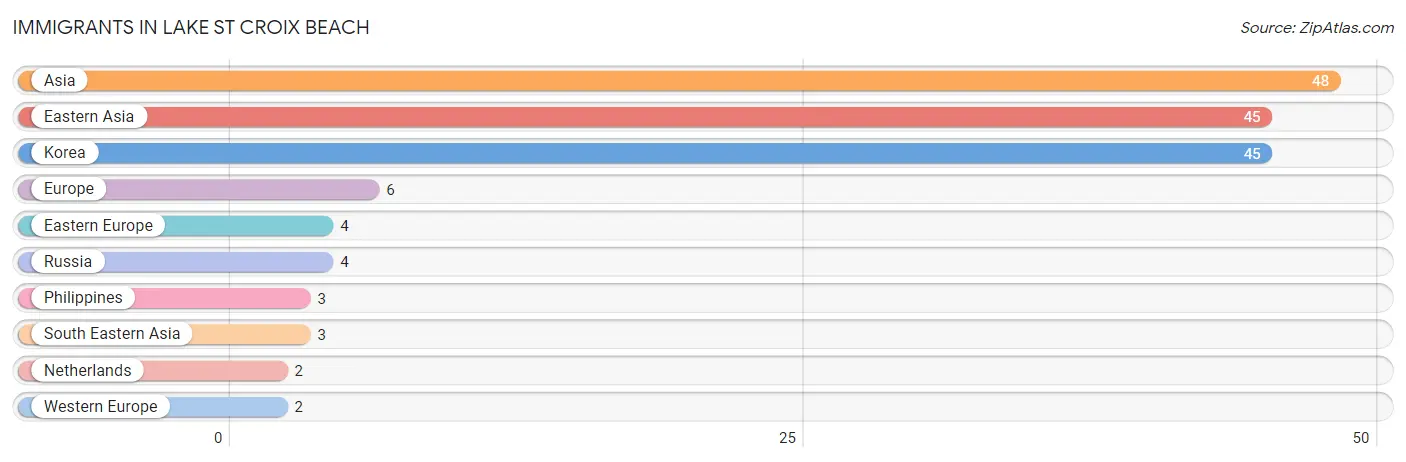
| Immigration Origin | # Population | % Population |
| Asia | 48 | 4.3% |
| Eastern Asia | 45 | 4.1% |
| Eastern Europe | 4 | 0.4% |
| Europe | 6 | 0.5% |
| Korea | 45 | 4.1% |
| Netherlands | 2 | 0.2% |
| Philippines | 3 | 0.3% |
| Russia | 4 | 0.4% |
| South Eastern Asia | 3 | 0.3% |
| Western Europe | 2 | 0.2% | View All 10 Rows |
Sex and Age in Lake St Croix Beach
Sex and Age in Lake St Croix Beach
The most populous age groups in Lake St Croix Beach are 70 to 74 Years (95 | 18.5%) for men and 70 to 74 Years (84 | 14.2%) for women.
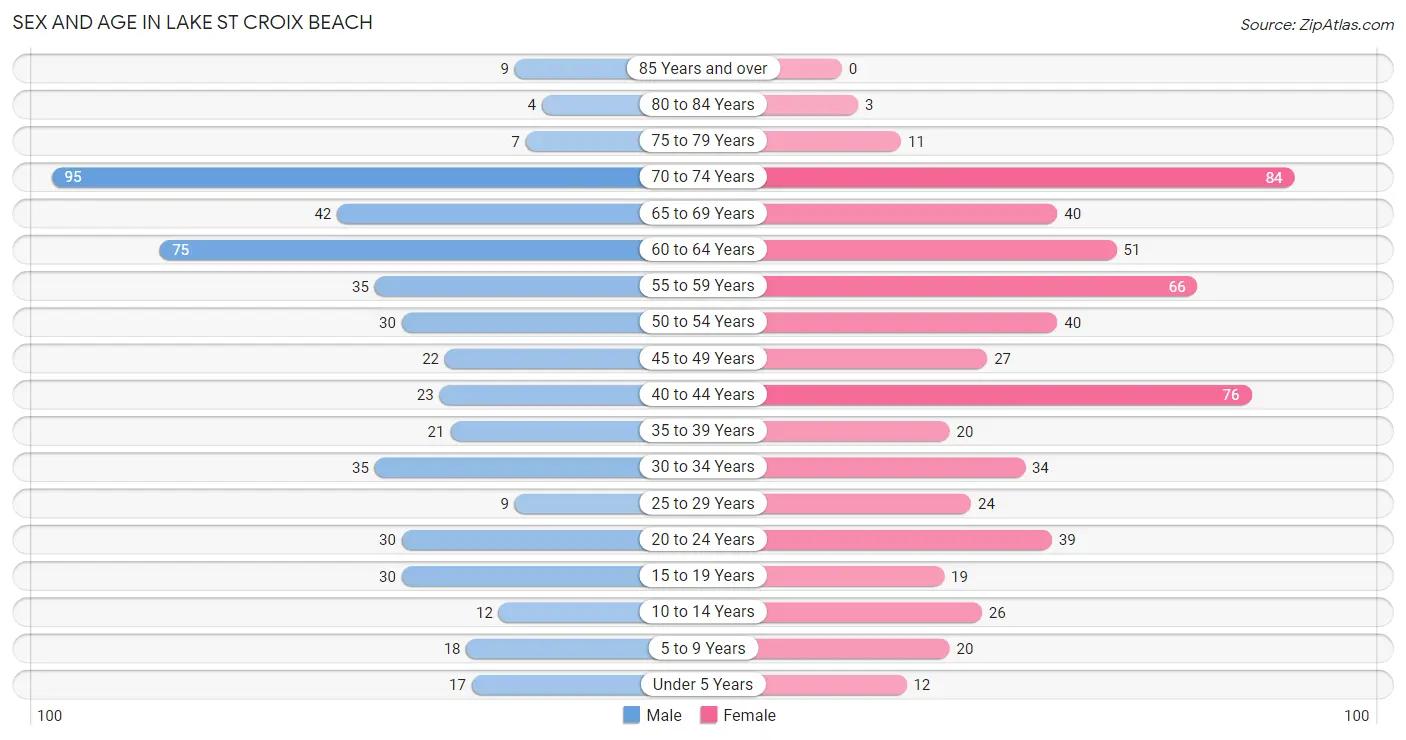
| Age Bracket | Male | Female |
| Under 5 Years | 17 (3.3%) | 12 (2.0%) |
| 5 to 9 Years | 18 (3.5%) | 20 (3.4%) |
| 10 to 14 Years | 12 (2.3%) | 26 (4.4%) |
| 15 to 19 Years | 30 (5.8%) | 19 (3.2%) |
| 20 to 24 Years | 30 (5.8%) | 39 (6.6%) |
| 25 to 29 Years | 9 (1.8%) | 24 (4.1%) |
| 30 to 34 Years | 35 (6.8%) | 34 (5.7%) |
| 35 to 39 Years | 21 (4.1%) | 20 (3.4%) |
| 40 to 44 Years | 23 (4.5%) | 76 (12.8%) |
| 45 to 49 Years | 22 (4.3%) | 27 (4.6%) |
| 50 to 54 Years | 30 (5.8%) | 40 (6.8%) |
| 55 to 59 Years | 35 (6.8%) | 66 (11.2%) |
| 60 to 64 Years | 75 (14.6%) | 51 (8.6%) |
| 65 to 69 Years | 42 (8.2%) | 40 (6.8%) |
| 70 to 74 Years | 95 (18.5%) | 84 (14.2%) |
| 75 to 79 Years | 7 (1.4%) | 11 (1.9%) |
| 80 to 84 Years | 4 (0.8%) | 3 (0.5%) |
| 85 Years and over | 9 (1.8%) | 0 (0.0%) |
| Total | 514 (100.0%) | 592 (100.0%) |
Families and Households in Lake St Croix Beach
Median Family Size in Lake St Croix Beach
The median family size in Lake St Croix Beach is 2.67 persons per family, with single female/mother families (40 | 12.9%) accounting for the largest median family size of 3.13 persons per family. On the other hand, married-couple families (263 | 84.8%) represent the smallest median family size with 2.60 persons per family.
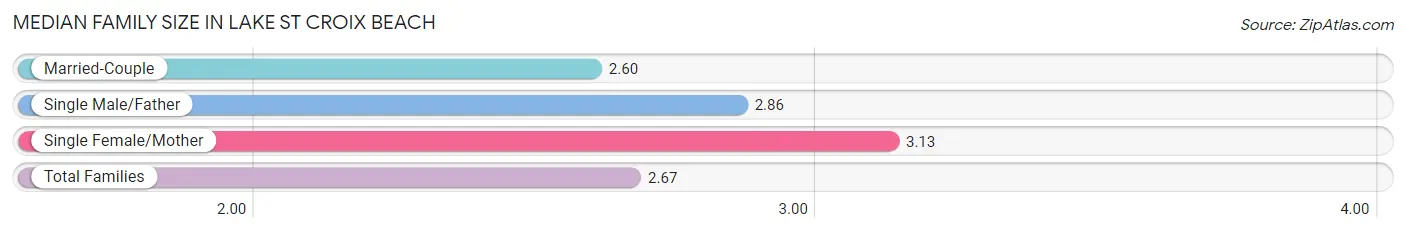
| Family Type | # Families | Family Size |
| Married-Couple | 263 (84.8%) | 2.60 |
| Single Male/Father | 7 (2.3%) | 2.86 |
| Single Female/Mother | 40 (12.9%) | 3.13 |
| Total Families | 310 (100.0%) | 2.67 |
Median Household Size in Lake St Croix Beach
The median household size in Lake St Croix Beach is 2.18 persons per household, with single female/mother households (40 | 7.9%) accounting for the largest median household size of 3.83 persons per household. non-family households (196 | 38.7%) represent the smallest median household size with 1.24 persons per household.
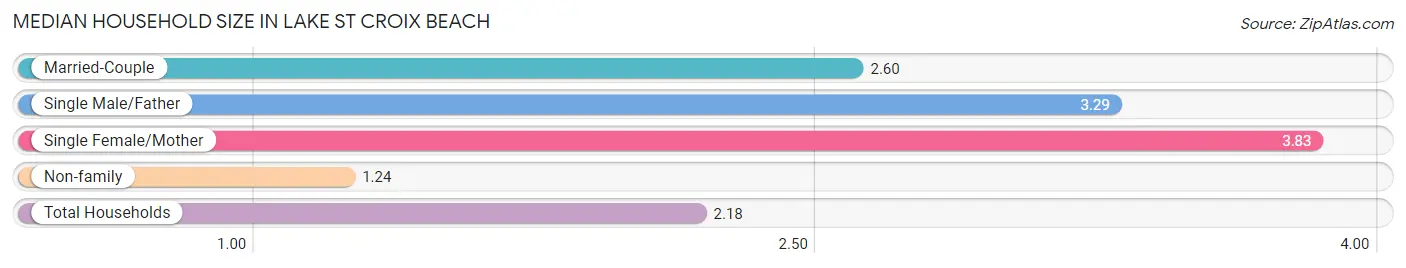
| Household Type | # Households | Household Size |
| Married-Couple | 263 (52.0%) | 2.60 |
| Single Male/Father | 7 (1.4%) | 3.29 |
| Single Female/Mother | 40 (7.9%) | 3.83 |
| Non-family | 196 (38.7%) | 1.24 |
| Total Households | 506 (100.0%) | 2.18 |
Household Size by Marriage Status in Lake St Croix Beach
Out of a total of 506 households in Lake St Croix Beach, 310 (61.3%) are family households, while 196 (38.7%) are nonfamily households. The most numerous type of family households are 3-person households, comprising 143, and the most common type of nonfamily households are 1-person households, comprising 151.
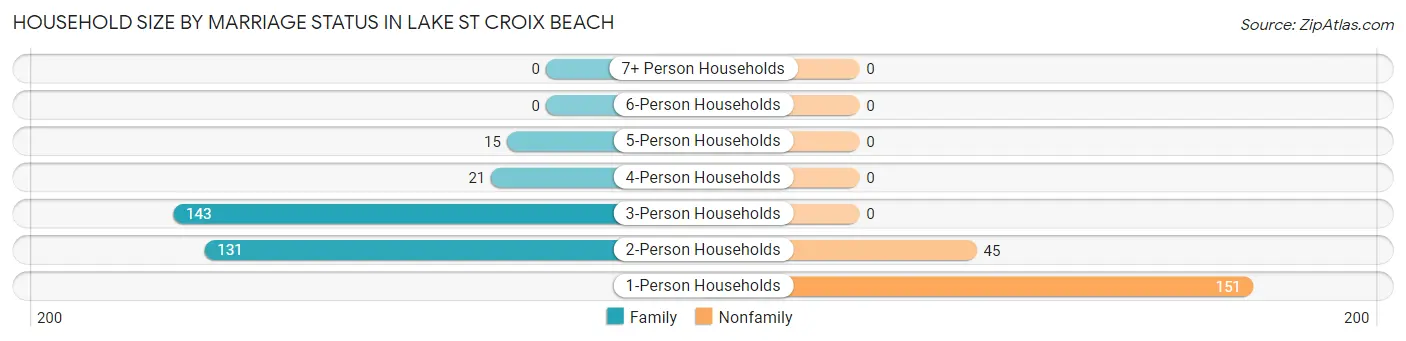
| Household Size | Family Households | Nonfamily Households |
| 1-Person Households | - | 151 (29.8%) |
| 2-Person Households | 131 (25.9%) | 45 (8.9%) |
| 3-Person Households | 143 (28.3%) | 0 (0.0%) |
| 4-Person Households | 21 (4.2%) | 0 (0.0%) |
| 5-Person Households | 15 (3.0%) | 0 (0.0%) |
| 6-Person Households | 0 (0.0%) | 0 (0.0%) |
| 7+ Person Households | 0 (0.0%) | 0 (0.0%) |
| Total | 310 (61.3%) | 196 (38.7%) |
Female Fertility in Lake St Croix Beach
Fertility by Age in Lake St Croix Beach
Average fertility rate in Lake St Croix Beach is 13.0 births per 1,000 women. Women in the age bracket of 35 to 50 years have the highest fertility rate with 24.0 births per 1,000 women. Women in the age bracket of 35 to 50 years acount for 100.0% of all women with births.
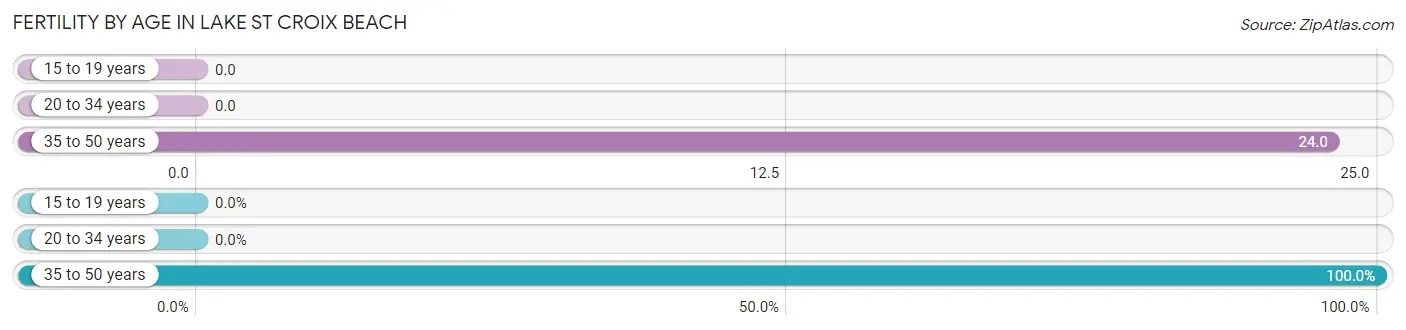
| Age Bracket | Women with Births | Births / 1,000 Women |
| 15 to 19 years | 0 (0.0%) | 0.0 |
| 20 to 34 years | 0 (0.0%) | 0.0 |
| 35 to 50 years | 3 (100.0%) | 24.0 |
| Total | 3 (100.0%) | 13.0 |
Fertility by Age by Marriage Status in Lake St Croix Beach
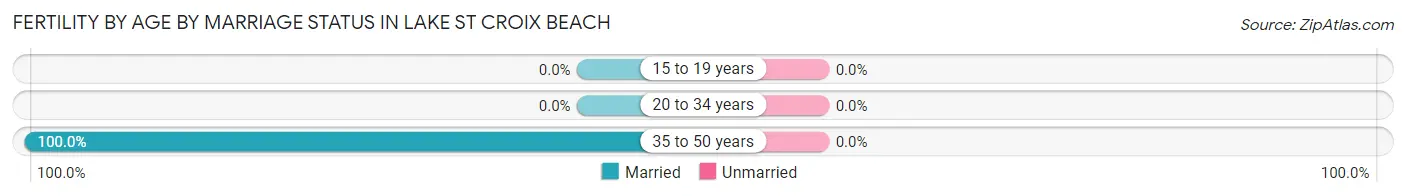
| Age Bracket | Married | Unmarried |
| 15 to 19 years | 0 (0.0%) | 0 (0.0%) |
| 20 to 34 years | 0 (0.0%) | 0 (0.0%) |
| 35 to 50 years | 3 (100.0%) | 0 (0.0%) |
| Total | 3 (100.0%) | 0 (0.0%) |
Fertility by Education in Lake St Croix Beach
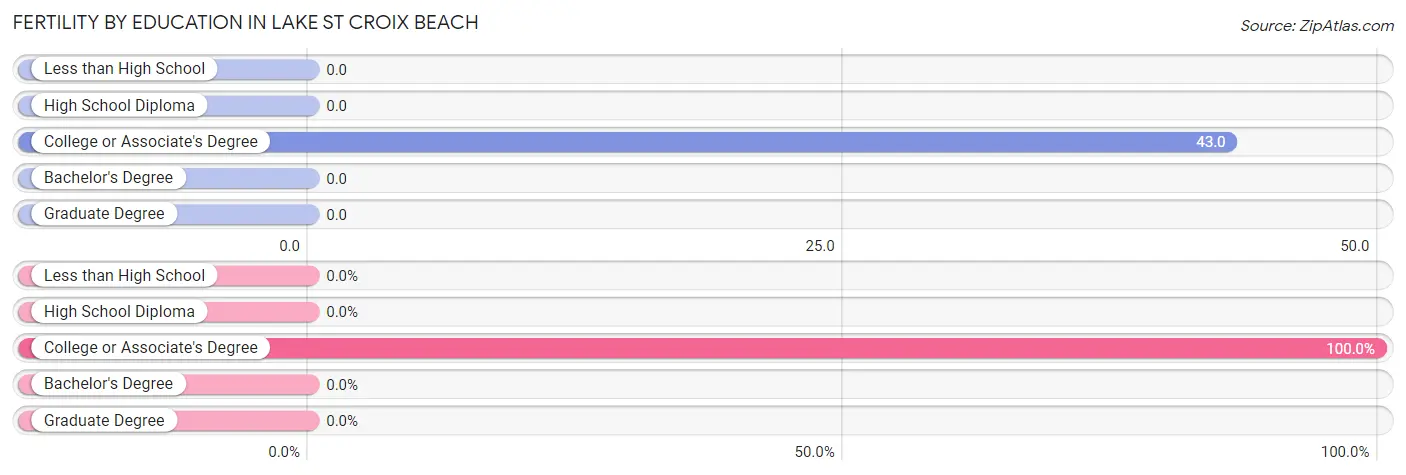
| Educational Attainment | Women with Births | Births / 1,000 Women |
| Less than High School | 0 (0.0%) | 0.0 |
| High School Diploma | 0 (0.0%) | 0.0 |
| College or Associate's Degree | 3 (100.0%) | 43.0 |
| Bachelor's Degree | 0 (0.0%) | 0.0 |
| Graduate Degree | 0 (0.0%) | 0.0 |
| Total | 3 (100.0%) | 13.0 |
Fertility by Education by Marriage Status in Lake St Croix Beach
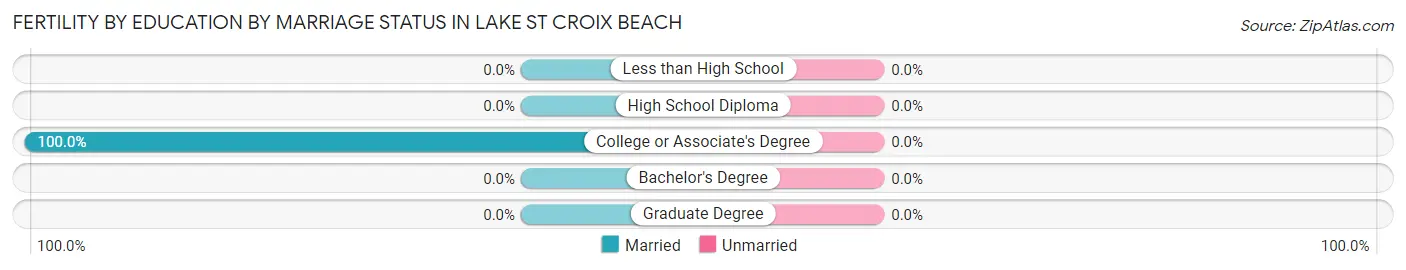
| Educational Attainment | Married | Unmarried |
| Less than High School | 0 (0.0%) | 0 (0.0%) |
| High School Diploma | 0 (0.0%) | 0 (0.0%) |
| College or Associate's Degree | 3 (100.0%) | 0 (0.0%) |
| Bachelor's Degree | 0 (0.0%) | 0 (0.0%) |
| Graduate Degree | 0 (0.0%) | 0 (0.0%) |
| Total | 3 (100.0%) | 0 (0.0%) |
Employment Characteristics in Lake St Croix Beach
Employment by Class of Employer in Lake St Croix Beach
Among the 687 employed individuals in Lake St Croix Beach, private company employees (398 | 57.9%), not-for-profit organizations (107 | 15.6%), and self-employed (incorporated) (76 | 11.1%) make up the most common classes of employment.
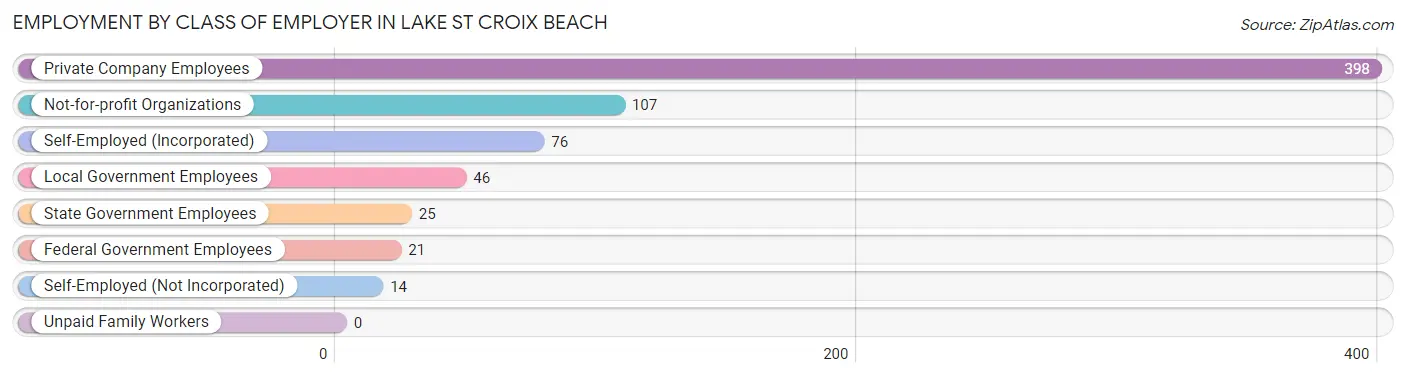
| Employer Class | # Employees | % Employees |
| Private Company Employees | 398 | 57.9% |
| Self-Employed (Incorporated) | 76 | 11.1% |
| Self-Employed (Not Incorporated) | 14 | 2.0% |
| Not-for-profit Organizations | 107 | 15.6% |
| Local Government Employees | 46 | 6.7% |
| State Government Employees | 25 | 3.6% |
| Federal Government Employees | 21 | 3.1% |
| Unpaid Family Workers | 0 | 0.0% |
| Total | 687 | 100.0% |
Employment Status by Age in Lake St Croix Beach
According to the labor force statistics for Lake St Croix Beach, out of the total population over 16 years of age (986), 70.9% or 699 individuals are in the labor force, with 1.4% or 10 of them unemployed. The age group with the highest labor force participation rate is 30 to 34 years, with 100.0% or 69 individuals in the labor force. Within the labor force, the 20 to 24 years age range has the highest percentage of unemployed individuals, with 9.5% or 6 of them being unemployed.
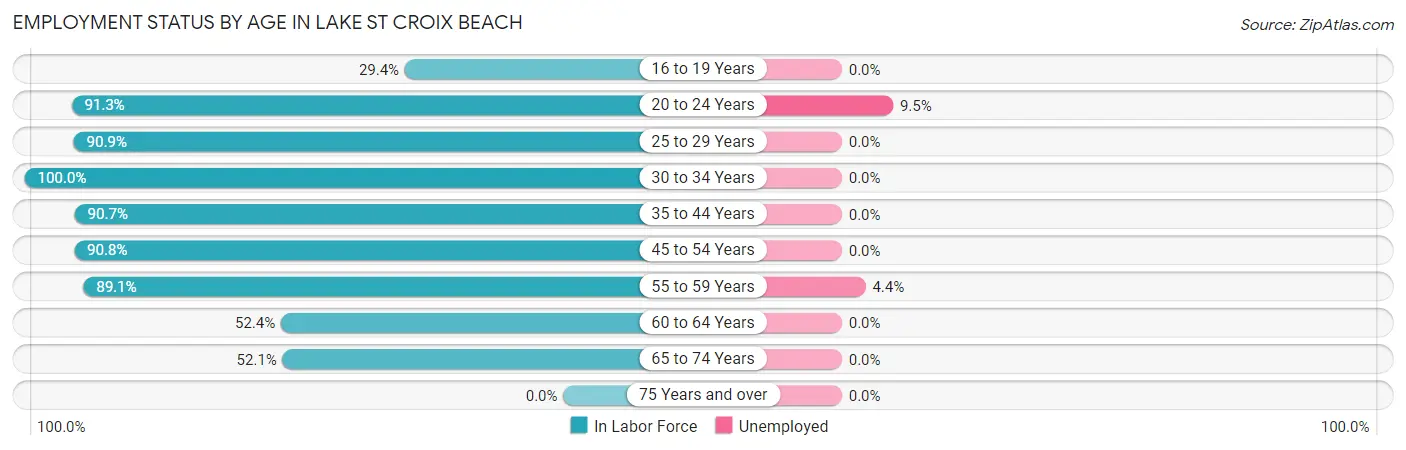
| Age Bracket | In Labor Force | Unemployed |
| 16 to 19 Years | 10 (29.4%) | 0 (0.0%) |
| 20 to 24 Years | 63 (91.3%) | 6 (9.5%) |
| 25 to 29 Years | 30 (90.9%) | 0 (0.0%) |
| 30 to 34 Years | 69 (100.0%) | 0 (0.0%) |
| 35 to 44 Years | 127 (90.7%) | 0 (0.0%) |
| 45 to 54 Years | 108 (90.8%) | 0 (0.0%) |
| 55 to 59 Years | 90 (89.1%) | 4 (4.4%) |
| 60 to 64 Years | 66 (52.4%) | 0 (0.0%) |
| 65 to 74 Years | 136 (52.1%) | 0 (0.0%) |
| 75 Years and over | 0 (0.0%) | 0 (0.0%) |
| Total | 699 (70.9%) | 10 (1.4%) |
Employment Status by Educational Attainment in Lake St Croix Beach
According to labor force statistics for Lake St Croix Beach, 83.3% of individuals (490) out of the total population between 25 and 64 years of age (588) are in the labor force, with 0.8% or 4 of them being unemployed. The group with the highest labor force participation rate are those with the educational attainment of bachelor's degree or higher, with 96.3% or 206 individuals in the labor force. Within the labor force, individuals with college / associate degree education have the highest percentage of unemployment, with 2.4% or 4 of them being unemployed.
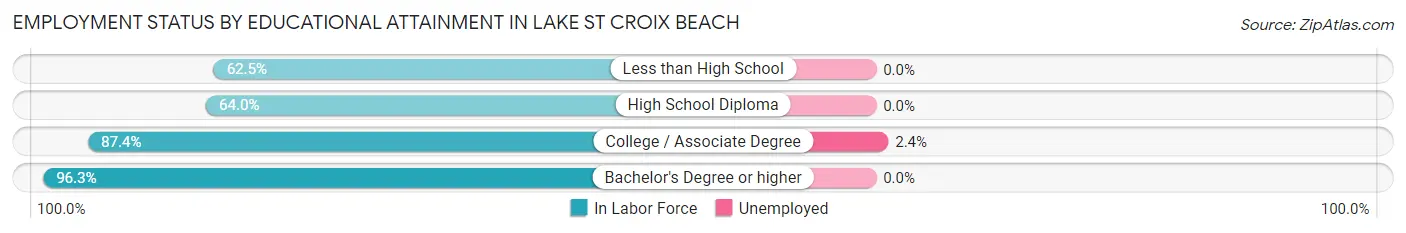
| Educational Attainment | In Labor Force | Unemployed |
| Less than High School | 5 (62.5%) | 0 (0.0%) |
| High School Diploma | 112 (64.0%) | 0 (0.0%) |
| College / Associate Degree | 167 (87.4%) | 5 (2.4%) |
| Bachelor's Degree or higher | 206 (96.3%) | 0 (0.0%) |
| Total | 490 (83.3%) | 5 (0.8%) |
Employment Occupations by Sex in Lake St Croix Beach
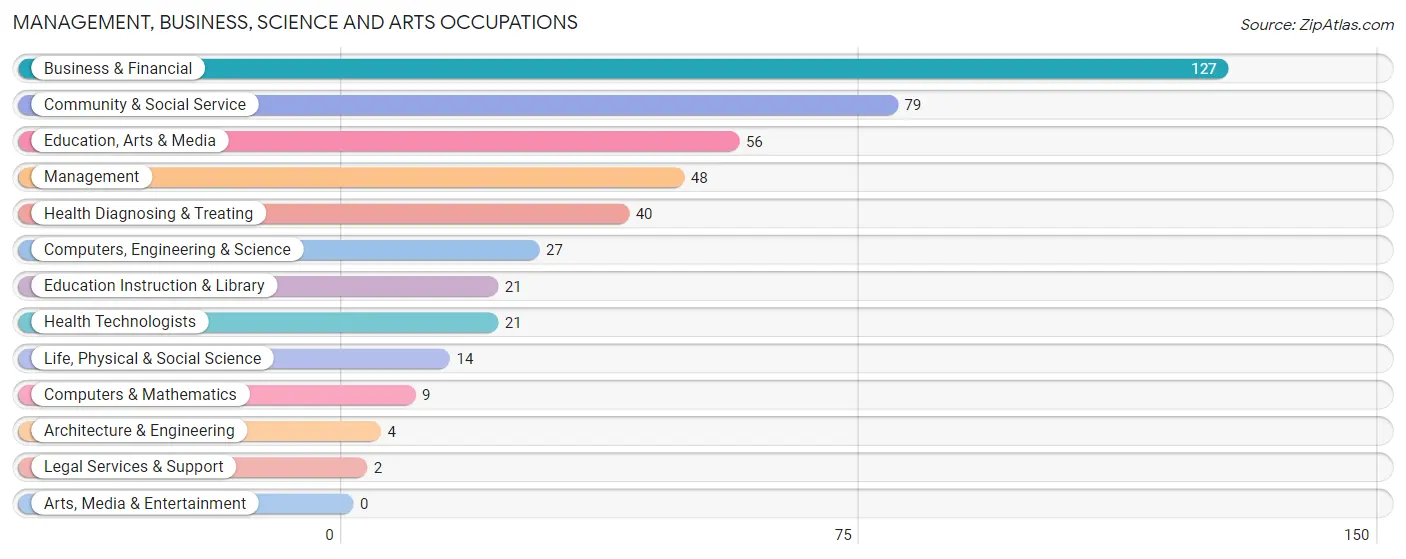
Management, Business, Science and Arts Occupations
The most common Management, Business, Science and Arts occupations in Lake St Croix Beach are Business & Financial (127 | 18.6%), Community & Social Service (79 | 11.6%), Education, Arts & Media (56 | 8.2%), Management (48 | 7.0%), and Health Diagnosing & Treating (40 | 5.9%).
Management, Business, Science and Arts Occupations by Sex
Within the Management, Business, Science and Arts occupations in Lake St Croix Beach, the most male-oriented occupations are Computers & Mathematics (100.0%), Architecture & Engineering (100.0%), and Management (54.2%), while the most female-oriented occupations are Life, Physical & Social Science (100.0%), Education, Arts & Media (100.0%), and Legal Services & Support (100.0%).
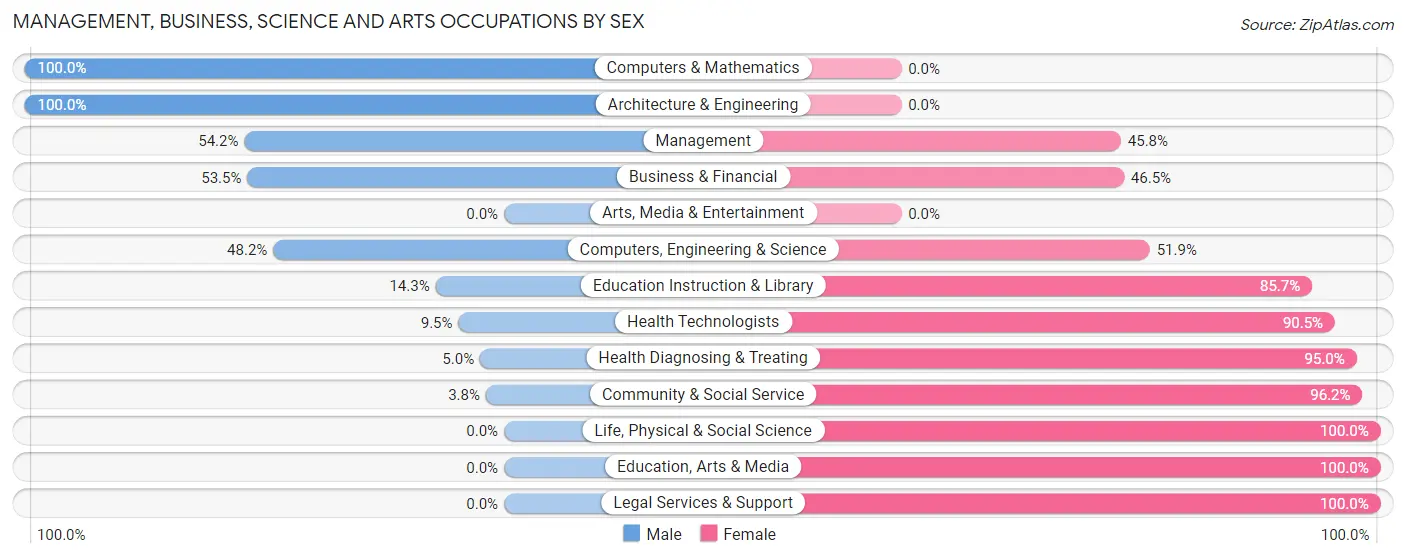
| Occupation | Male | Female |
| Management | 26 (54.2%) | 22 (45.8%) |
| Business & Financial | 68 (53.5%) | 59 (46.5%) |
| Computers, Engineering & Science | 13 (48.1%) | 14 (51.8%) |
| Computers & Mathematics | 9 (100.0%) | 0 (0.0%) |
| Architecture & Engineering | 4 (100.0%) | 0 (0.0%) |
| Life, Physical & Social Science | 0 (0.0%) | 14 (100.0%) |
| Community & Social Service | 3 (3.8%) | 76 (96.2%) |
| Education, Arts & Media | 0 (0.0%) | 56 (100.0%) |
| Legal Services & Support | 0 (0.0%) | 2 (100.0%) |
| Education Instruction & Library | 3 (14.3%) | 18 (85.7%) |
| Arts, Media & Entertainment | 0 (0.0%) | 0 (0.0%) |
| Health Diagnosing & Treating | 2 (5.0%) | 38 (95.0%) |
| Health Technologists | 2 (9.5%) | 19 (90.5%) |
| Total (Category) | 112 (34.9%) | 209 (65.1%) |
| Total (Overall) | 309 (45.2%) | 374 (54.8%) |
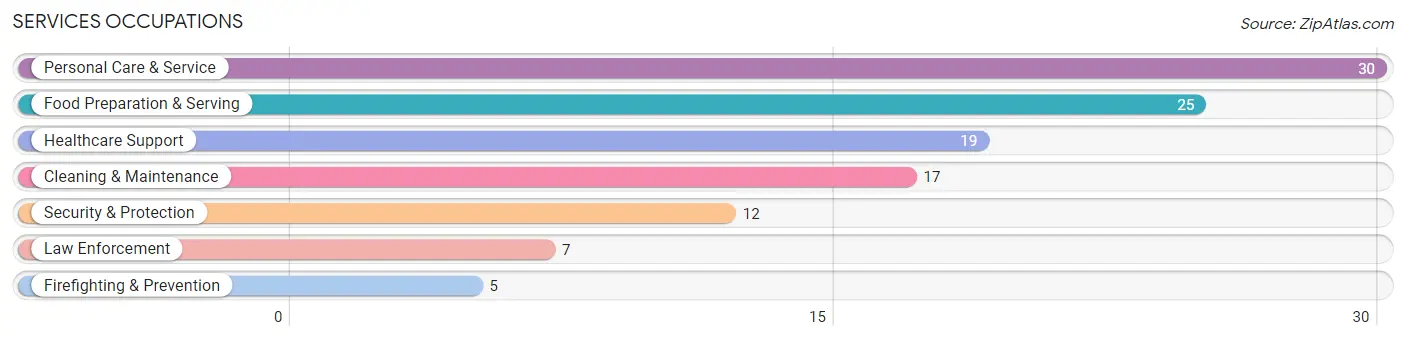
Services Occupations
The most common Services occupations in Lake St Croix Beach are Personal Care & Service (30 | 4.4%), Food Preparation & Serving (25 | 3.7%), Healthcare Support (19 | 2.8%), Cleaning & Maintenance (17 | 2.5%), and Security & Protection (12 | 1.8%).
Services Occupations by Sex
Within the Services occupations in Lake St Croix Beach, the most male-oriented occupations are Security & Protection (100.0%), Firefighting & Prevention (100.0%), and Law Enforcement (100.0%), while the most female-oriented occupations are Personal Care & Service (93.3%), Food Preparation & Serving (88.0%), and Healthcare Support (63.2%).
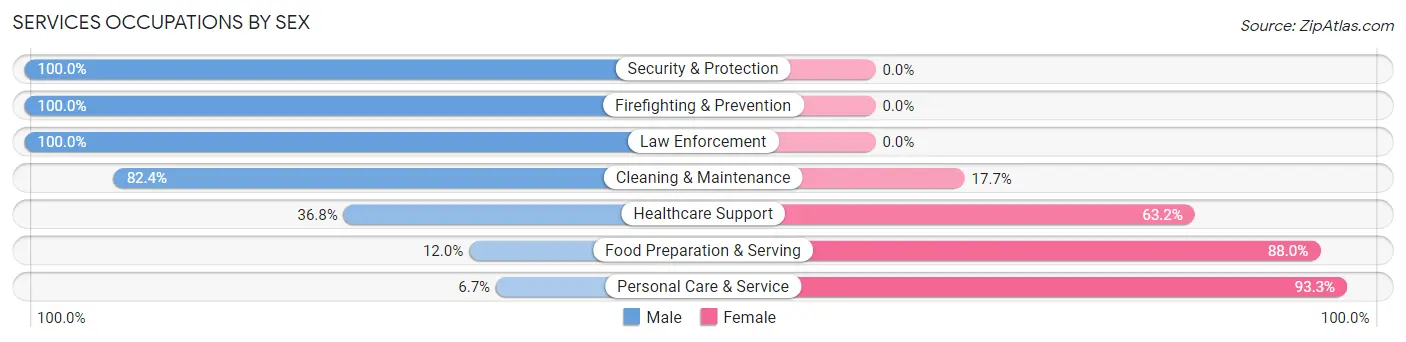
| Occupation | Male | Female |
| Healthcare Support | 7 (36.8%) | 12 (63.2%) |
| Security & Protection | 12 (100.0%) | 0 (0.0%) |
| Firefighting & Prevention | 5 (100.0%) | 0 (0.0%) |
| Law Enforcement | 7 (100.0%) | 0 (0.0%) |
| Food Preparation & Serving | 3 (12.0%) | 22 (88.0%) |
| Cleaning & Maintenance | 14 (82.4%) | 3 (17.6%) |
| Personal Care & Service | 2 (6.7%) | 28 (93.3%) |
| Total (Category) | 38 (36.9%) | 65 (63.1%) |
| Total (Overall) | 309 (45.2%) | 374 (54.8%) |
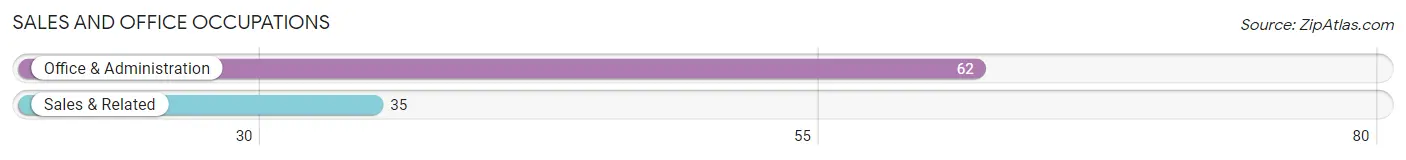
Sales and Office Occupations
The most common Sales and Office occupations in Lake St Croix Beach are Office & Administration (62 | 9.1%), and Sales & Related (35 | 5.1%).
Sales and Office Occupations by Sex
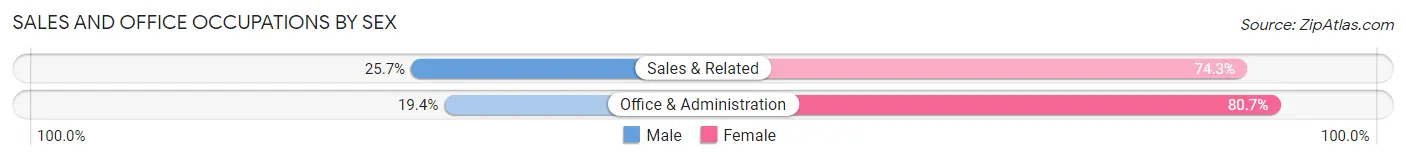
| Occupation | Male | Female |
| Sales & Related | 9 (25.7%) | 26 (74.3%) |
| Office & Administration | 12 (19.4%) | 50 (80.6%) |
| Total (Category) | 21 (21.6%) | 76 (78.3%) |
| Total (Overall) | 309 (45.2%) | 374 (54.8%) |
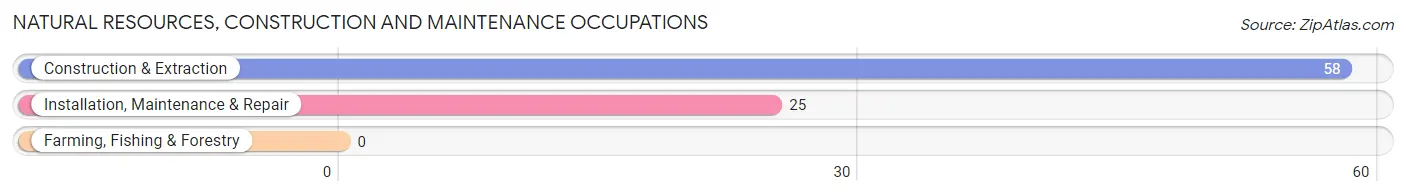
Natural Resources, Construction and Maintenance Occupations
The most common Natural Resources, Construction and Maintenance occupations in Lake St Croix Beach are Construction & Extraction (58 | 8.5%), and Installation, Maintenance & Repair (25 | 3.7%).
Natural Resources, Construction and Maintenance Occupations by Sex
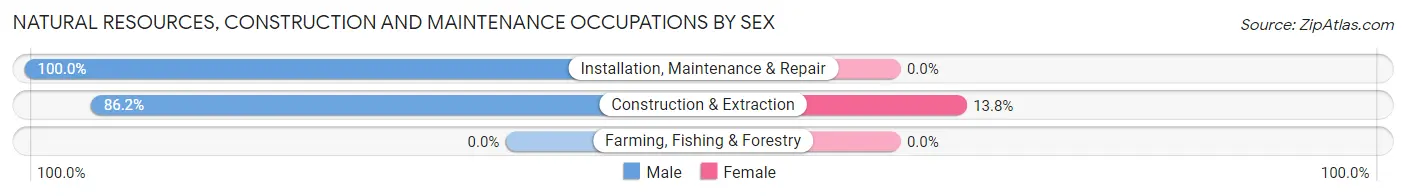
| Occupation | Male | Female |
| Farming, Fishing & Forestry | 0 (0.0%) | 0 (0.0%) |
| Construction & Extraction | 50 (86.2%) | 8 (13.8%) |
| Installation, Maintenance & Repair | 25 (100.0%) | 0 (0.0%) |
| Total (Category) | 75 (90.4%) | 8 (9.6%) |
| Total (Overall) | 309 (45.2%) | 374 (54.8%) |
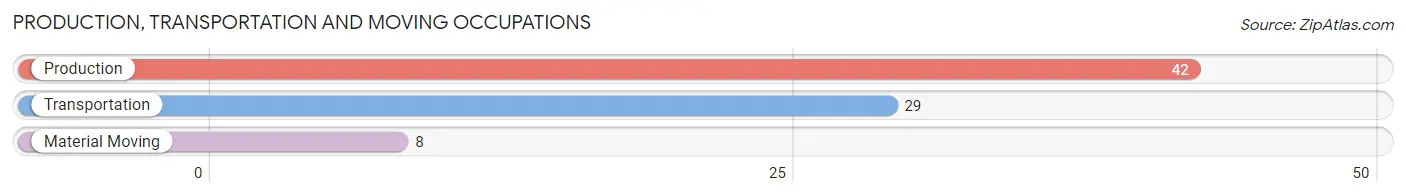
Production, Transportation and Moving Occupations
The most common Production, Transportation and Moving occupations in Lake St Croix Beach are Production (42 | 6.1%), Transportation (29 | 4.3%), and Material Moving (8 | 1.2%).
Production, Transportation and Moving Occupations by Sex
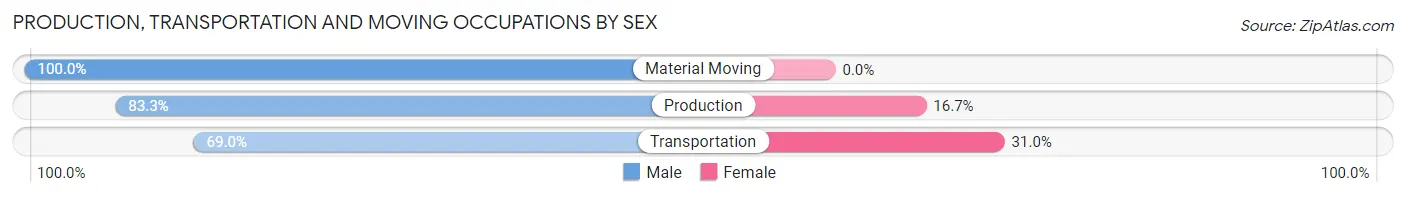
| Occupation | Male | Female |
| Production | 35 (83.3%) | 7 (16.7%) |
| Transportation | 20 (69.0%) | 9 (31.0%) |
| Material Moving | 8 (100.0%) | 0 (0.0%) |
| Total (Category) | 63 (79.7%) | 16 (20.3%) |
| Total (Overall) | 309 (45.2%) | 374 (54.8%) |
Employment Industries by Sex in Lake St Croix Beach
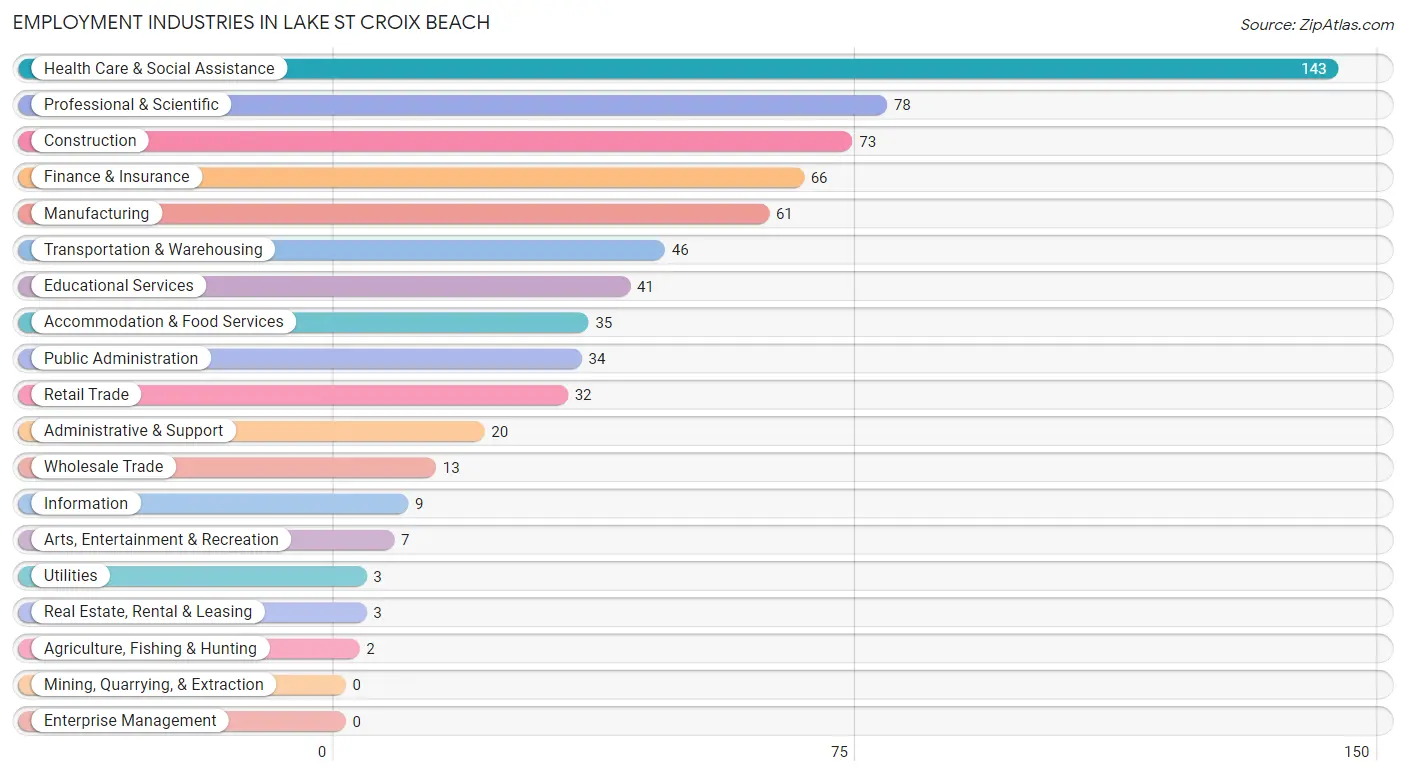
Employment Industries in Lake St Croix Beach
The major employment industries in Lake St Croix Beach include Health Care & Social Assistance (143 | 20.9%), Professional & Scientific (78 | 11.4%), Construction (73 | 10.7%), Finance & Insurance (66 | 9.7%), and Manufacturing (61 | 8.9%).
Employment Industries by Sex in Lake St Croix Beach
The Lake St Croix Beach industries that see more men than women are Wholesale Trade (100.0%), Utilities (100.0%), and Arts, Entertainment & Recreation (100.0%), whereas the industries that tend to have a higher number of women are Agriculture, Fishing & Hunting (100.0%), Real Estate, Rental & Leasing (100.0%), and Finance & Insurance (92.4%).
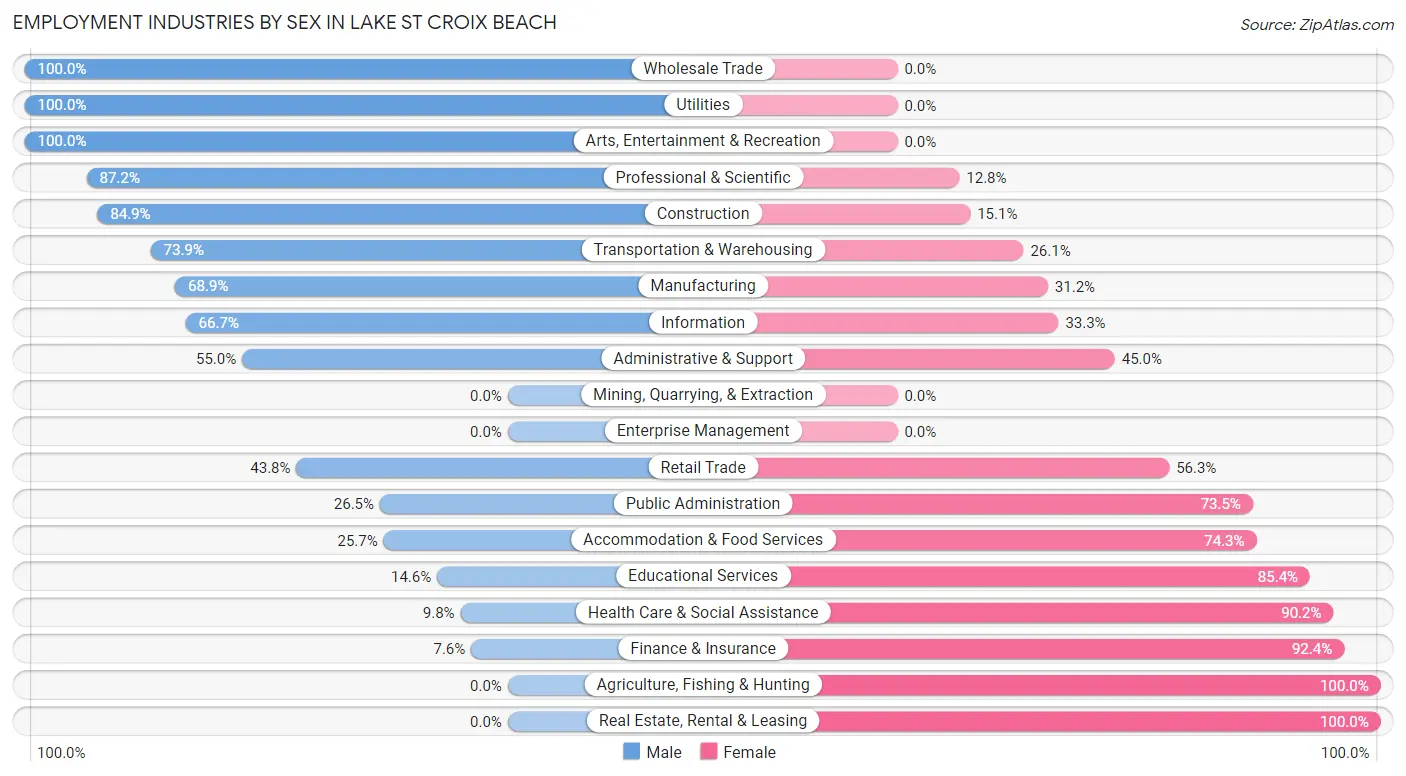
| Industry | Male | Female |
| Agriculture, Fishing & Hunting | 0 (0.0%) | 2 (100.0%) |
| Mining, Quarrying, & Extraction | 0 (0.0%) | 0 (0.0%) |
| Construction | 62 (84.9%) | 11 (15.1%) |
| Manufacturing | 42 (68.9%) | 19 (31.1%) |
| Wholesale Trade | 13 (100.0%) | 0 (0.0%) |
| Retail Trade | 14 (43.8%) | 18 (56.2%) |
| Transportation & Warehousing | 34 (73.9%) | 12 (26.1%) |
| Utilities | 3 (100.0%) | 0 (0.0%) |
| Information | 6 (66.7%) | 3 (33.3%) |
| Finance & Insurance | 5 (7.6%) | 61 (92.4%) |
| Real Estate, Rental & Leasing | 0 (0.0%) | 3 (100.0%) |
| Professional & Scientific | 68 (87.2%) | 10 (12.8%) |
| Enterprise Management | 0 (0.0%) | 0 (0.0%) |
| Administrative & Support | 11 (55.0%) | 9 (45.0%) |
| Educational Services | 6 (14.6%) | 35 (85.4%) |
| Health Care & Social Assistance | 14 (9.8%) | 129 (90.2%) |
| Arts, Entertainment & Recreation | 7 (100.0%) | 0 (0.0%) |
| Accommodation & Food Services | 9 (25.7%) | 26 (74.3%) |
| Public Administration | 9 (26.5%) | 25 (73.5%) |
| Total | 309 (45.2%) | 374 (54.8%) |
Education in Lake St Croix Beach
School Enrollment in Lake St Croix Beach
The most common levels of schooling among the 181 students in Lake St Croix Beach are high school (48 | 26.5%), college / undergraduate (48 | 26.5%), and middle school (38 | 21.0%).
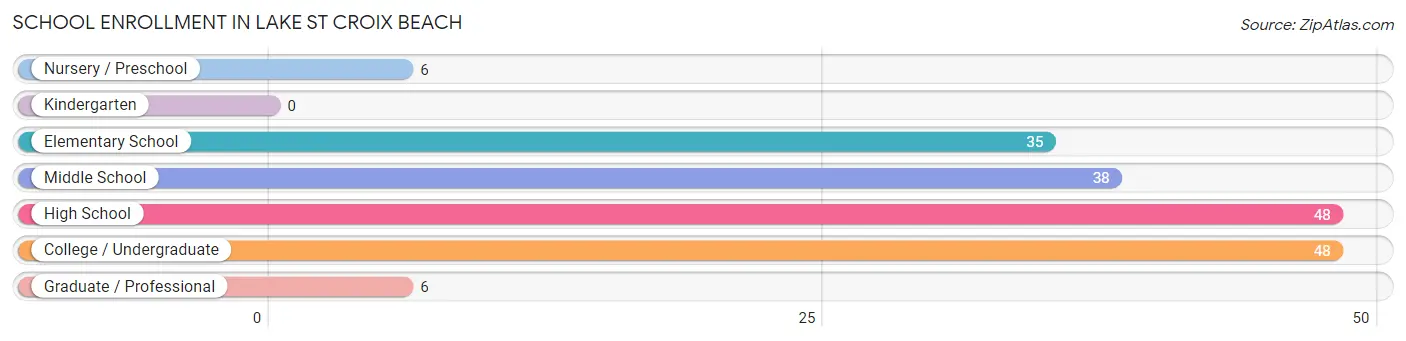
| School Level | # Students | % Students |
| Nursery / Preschool | 6 | 3.3% |
| Kindergarten | 0 | 0.0% |
| Elementary School | 35 | 19.3% |
| Middle School | 38 | 21.0% |
| High School | 48 | 26.5% |
| College / Undergraduate | 48 | 26.5% |
| Graduate / Professional | 6 | 3.3% |
| Total | 181 | 100.0% |
School Enrollment by Age by Funding Source in Lake St Croix Beach
Out of a total of 181 students who are enrolled in schools in Lake St Croix Beach, 27 (14.9%) attend a private institution, while the remaining 154 (85.1%) are enrolled in public schools. The age group of 25 to 34 year olds has the highest likelihood of being enrolled in private schools, with 10 (71.4% in the age bracket) enrolled. Conversely, the age group of 3 to 4 year olds has the lowest likelihood of being enrolled in a private school, with 3 (100.0% in the age bracket) attending a public institution.
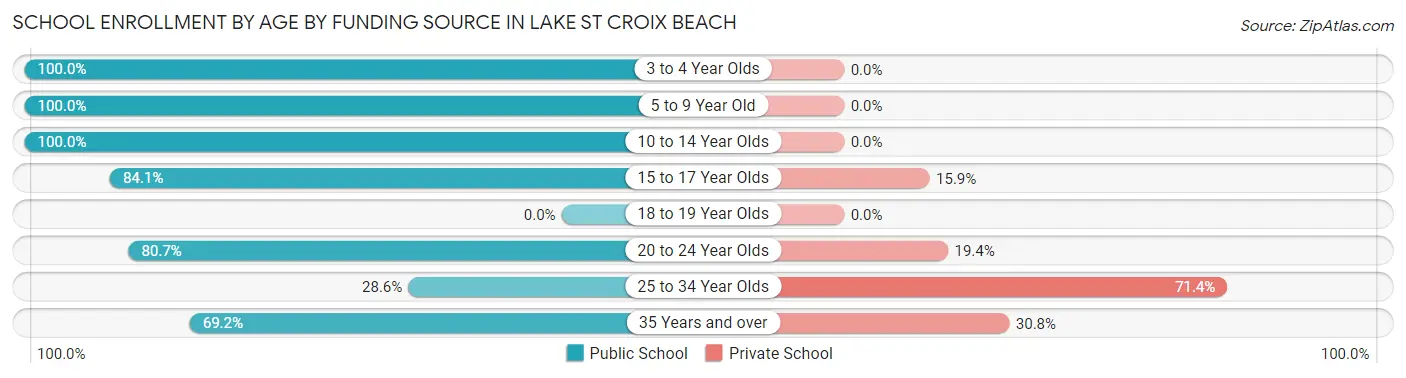
| Age Bracket | Public School | Private School |
| 3 to 4 Year Olds | 3 (100.0%) | 0 (0.0%) |
| 5 to 9 Year Old | 38 (100.0%) | 0 (0.0%) |
| 10 to 14 Year Olds | 38 (100.0%) | 0 (0.0%) |
| 15 to 17 Year Olds | 37 (84.1%) | 7 (15.9%) |
| 18 to 19 Year Olds | 0 (0.0%) | 0 (0.0%) |
| 20 to 24 Year Olds | 25 (80.6%) | 6 (19.4%) |
| 25 to 34 Year Olds | 4 (28.6%) | 10 (71.4%) |
| 35 Years and over | 9 (69.2%) | 4 (30.8%) |
| Total | 154 (85.1%) | 27 (14.9%) |
Educational Attainment by Field of Study in Lake St Croix Beach
Education (98 | 23.4%), science & technology (70 | 16.7%), communications (45 | 10.7%), business (38 | 9.1%), and bio, nature & agricultural (31 | 7.4%) are the most common fields of study among 419 individuals in Lake St Croix Beach who have obtained a bachelor's degree or higher.
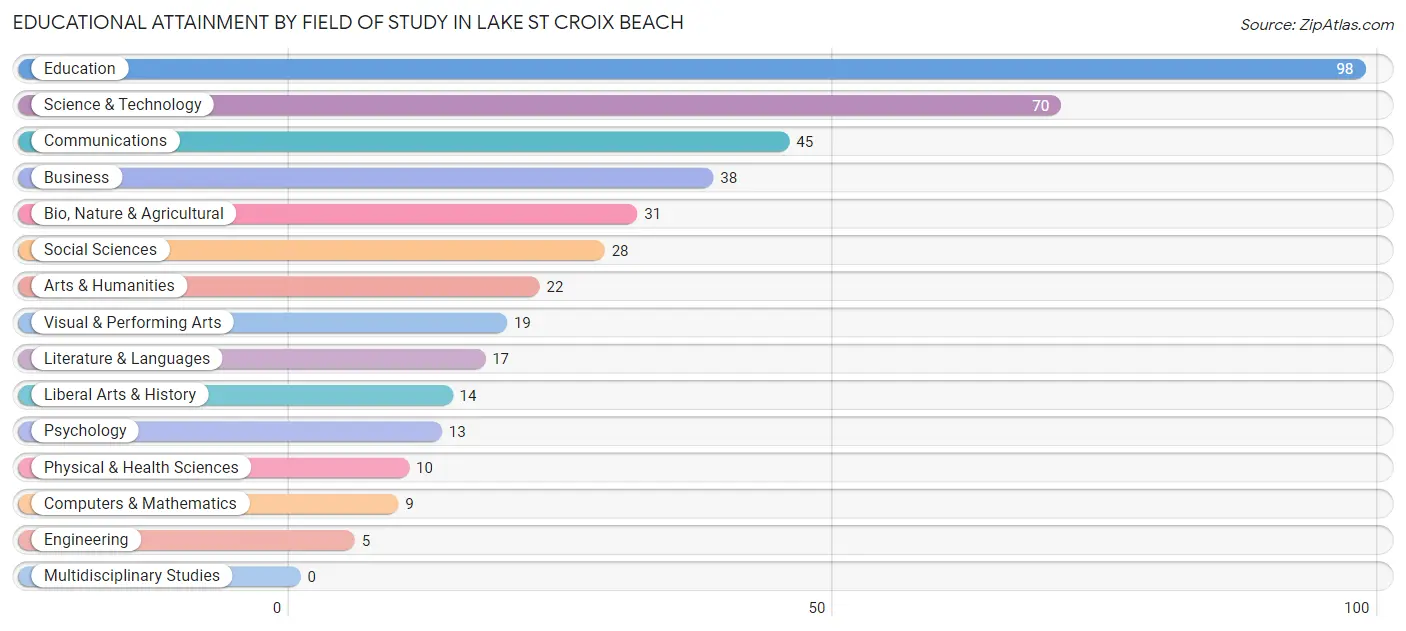
| Field of Study | # Graduates | % Graduates |
| Computers & Mathematics | 9 | 2.1% |
| Bio, Nature & Agricultural | 31 | 7.4% |
| Physical & Health Sciences | 10 | 2.4% |
| Psychology | 13 | 3.1% |
| Social Sciences | 28 | 6.7% |
| Engineering | 5 | 1.2% |
| Multidisciplinary Studies | 0 | 0.0% |
| Science & Technology | 70 | 16.7% |
| Business | 38 | 9.1% |
| Education | 98 | 23.4% |
| Literature & Languages | 17 | 4.1% |
| Liberal Arts & History | 14 | 3.3% |
| Visual & Performing Arts | 19 | 4.5% |
| Communications | 45 | 10.7% |
| Arts & Humanities | 22 | 5.2% |
| Total | 419 | 100.0% |
Transportation & Commute in Lake St Croix Beach
Vehicle Availability by Sex in Lake St Croix Beach
The most prevalent vehicle ownership categories in Lake St Croix Beach are males with 2 vehicles (137, accounting for 43.8%) and females with 2 vehicles (149, making up 36.7%).
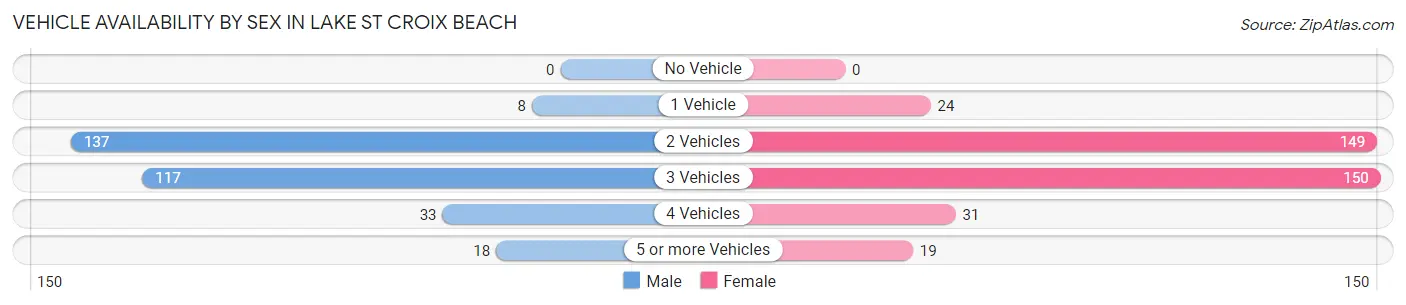
| Vehicles Available | Male | Female |
| No Vehicle | 0 (0.0%) | 0 (0.0%) |
| 1 Vehicle | 8 (2.6%) | 24 (6.4%) |
| 2 Vehicles | 137 (43.8%) | 149 (40.0%) |
| 3 Vehicles | 117 (37.4%) | 150 (40.2%) |
| 4 Vehicles | 33 (10.5%) | 31 (8.3%) |
| 5 or more Vehicles | 18 (5.8%) | 19 (5.1%) |
| Total | 313 (100.0%) | 373 (100.0%) |
Commute Time in Lake St Croix Beach
The most frequently occuring commute durations in Lake St Croix Beach are 30 to 34 minutes (132 commuters, 20.1%), 25 to 29 minutes (125 commuters, 19.0%), and 20 to 24 minutes (84 commuters, 12.8%).
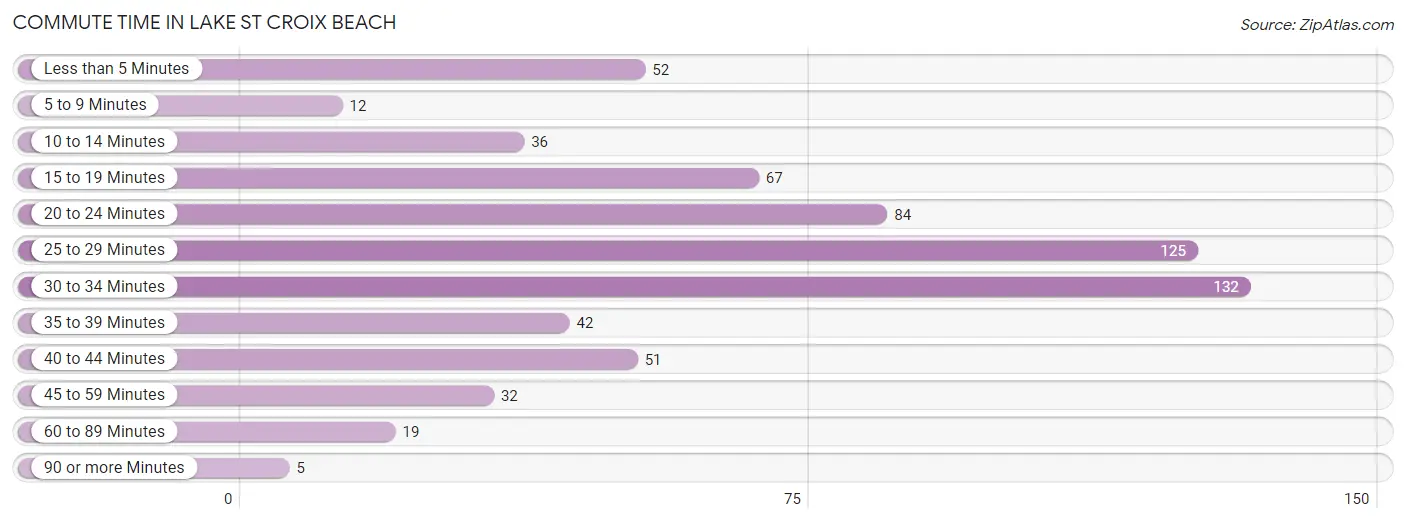
| Commute Time | # Commuters | % Commuters |
| Less than 5 Minutes | 52 | 7.9% |
| 5 to 9 Minutes | 12 | 1.8% |
| 10 to 14 Minutes | 36 | 5.5% |
| 15 to 19 Minutes | 67 | 10.2% |
| 20 to 24 Minutes | 84 | 12.8% |
| 25 to 29 Minutes | 125 | 19.0% |
| 30 to 34 Minutes | 132 | 20.1% |
| 35 to 39 Minutes | 42 | 6.4% |
| 40 to 44 Minutes | 51 | 7.8% |
| 45 to 59 Minutes | 32 | 4.9% |
| 60 to 89 Minutes | 19 | 2.9% |
| 90 or more Minutes | 5 | 0.8% |
Commute Time by Sex in Lake St Croix Beach
The most common commute times in Lake St Croix Beach are 25 to 29 minutes (81 commuters, 27.2%) for males and 30 to 34 minutes (74 commuters, 20.6%) for females.
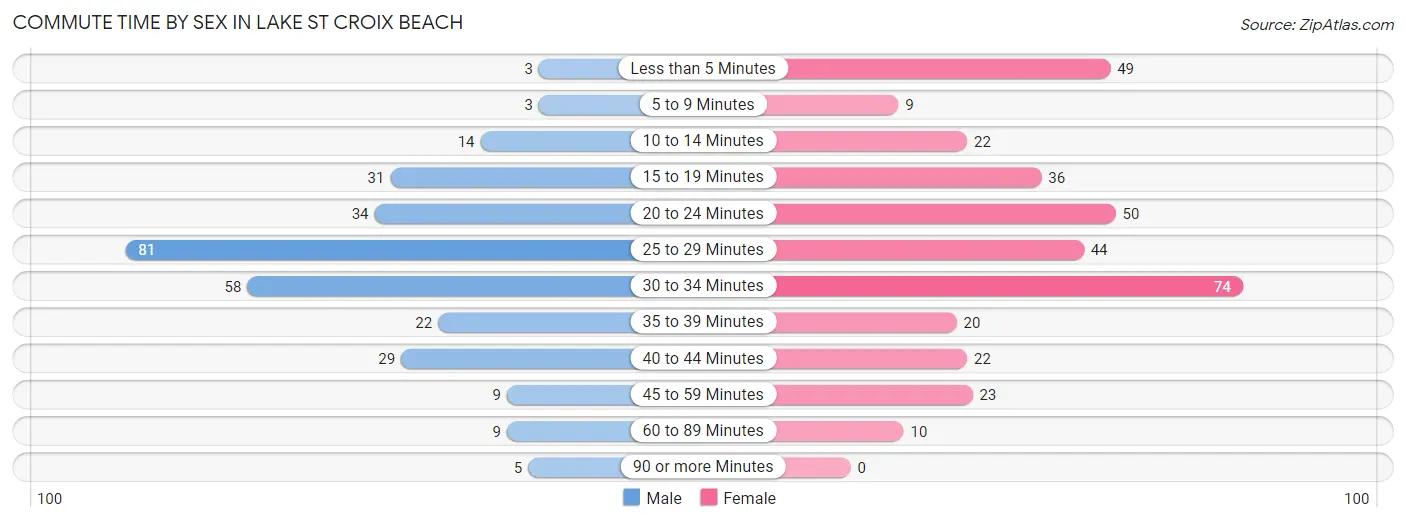
| Commute Time | Male | Female |
| Less than 5 Minutes | 3 (1.0%) | 49 (13.7%) |
| 5 to 9 Minutes | 3 (1.0%) | 9 (2.5%) |
| 10 to 14 Minutes | 14 (4.7%) | 22 (6.1%) |
| 15 to 19 Minutes | 31 (10.4%) | 36 (10.0%) |
| 20 to 24 Minutes | 34 (11.4%) | 50 (13.9%) |
| 25 to 29 Minutes | 81 (27.2%) | 44 (12.3%) |
| 30 to 34 Minutes | 58 (19.5%) | 74 (20.6%) |
| 35 to 39 Minutes | 22 (7.4%) | 20 (5.6%) |
| 40 to 44 Minutes | 29 (9.7%) | 22 (6.1%) |
| 45 to 59 Minutes | 9 (3.0%) | 23 (6.4%) |
| 60 to 89 Minutes | 9 (3.0%) | 10 (2.8%) |
| 90 or more Minutes | 5 (1.7%) | 0 (0.0%) |
Time of Departure to Work by Sex in Lake St Croix Beach
The most frequent times of departure to work in Lake St Croix Beach are 8:30 AM to 8:59 AM (67, 22.5%) for males and 8:00 AM to 8:29 AM (94, 26.2%) for females.
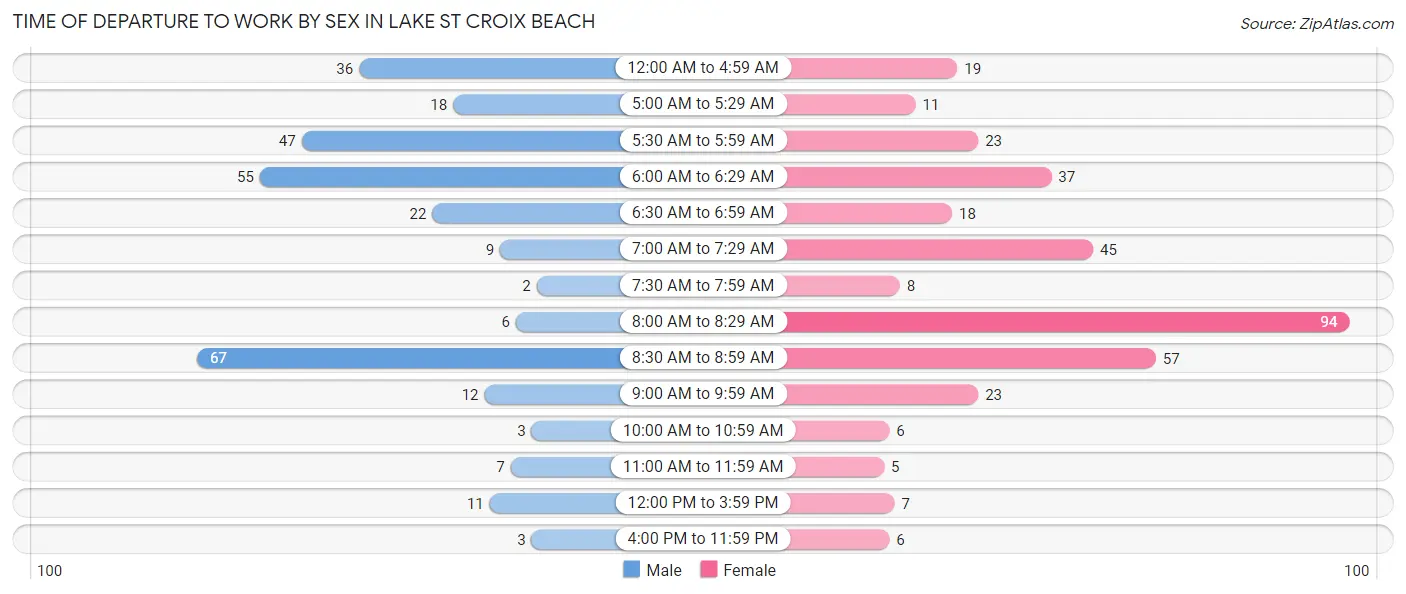
| Time of Departure | Male | Female |
| 12:00 AM to 4:59 AM | 36 (12.1%) | 19 (5.3%) |
| 5:00 AM to 5:29 AM | 18 (6.0%) | 11 (3.1%) |
| 5:30 AM to 5:59 AM | 47 (15.8%) | 23 (6.4%) |
| 6:00 AM to 6:29 AM | 55 (18.5%) | 37 (10.3%) |
| 6:30 AM to 6:59 AM | 22 (7.4%) | 18 (5.0%) |
| 7:00 AM to 7:29 AM | 9 (3.0%) | 45 (12.5%) |
| 7:30 AM to 7:59 AM | 2 (0.7%) | 8 (2.2%) |
| 8:00 AM to 8:29 AM | 6 (2.0%) | 94 (26.2%) |
| 8:30 AM to 8:59 AM | 67 (22.5%) | 57 (15.9%) |
| 9:00 AM to 9:59 AM | 12 (4.0%) | 23 (6.4%) |
| 10:00 AM to 10:59 AM | 3 (1.0%) | 6 (1.7%) |
| 11:00 AM to 11:59 AM | 7 (2.4%) | 5 (1.4%) |
| 12:00 PM to 3:59 PM | 11 (3.7%) | 7 (1.9%) |
| 4:00 PM to 11:59 PM | 3 (1.0%) | 6 (1.7%) |
| Total | 298 (100.0%) | 359 (100.0%) |
Housing Occupancy in Lake St Croix Beach
Occupancy by Ownership in Lake St Croix Beach
Of the total 506 dwellings in Lake St Croix Beach, owner-occupied units account for 460 (90.9%), while renter-occupied units make up 46 (9.1%).
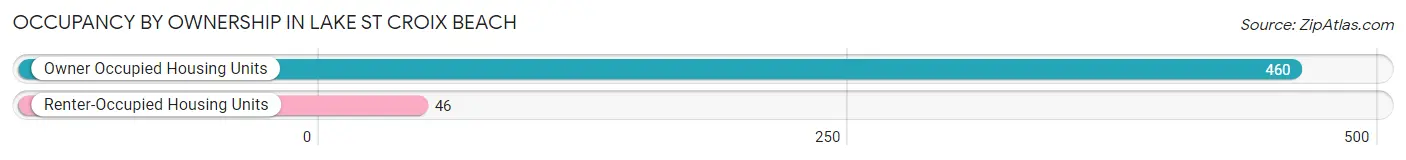
| Occupancy | # Housing Units | % Housing Units |
| Owner Occupied Housing Units | 460 | 90.9% |
| Renter-Occupied Housing Units | 46 | 9.1% |
| Total Occupied Housing Units | 506 | 100.0% |
Occupancy by Household Size in Lake St Croix Beach
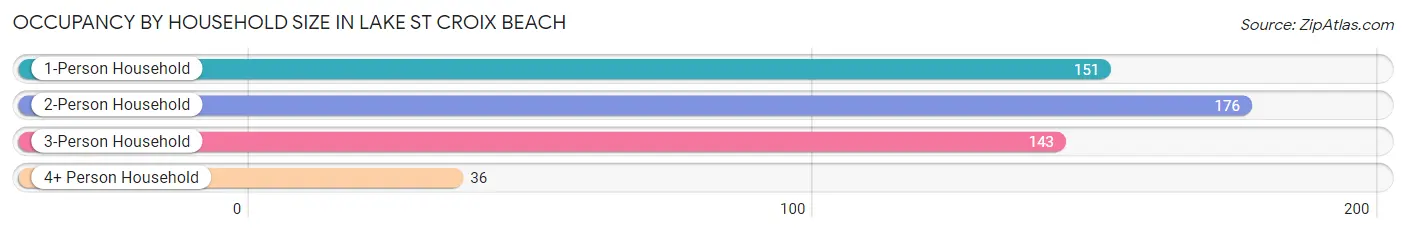
| Household Size | # Housing Units | % Housing Units |
| 1-Person Household | 151 | 29.8% |
| 2-Person Household | 176 | 34.8% |
| 3-Person Household | 143 | 28.3% |
| 4+ Person Household | 36 | 7.1% |
| Total Housing Units | 506 | 100.0% |
Occupancy by Ownership by Household Size in Lake St Croix Beach
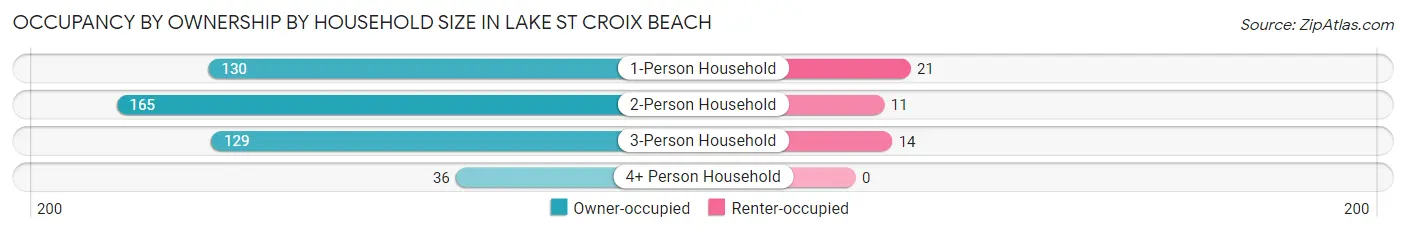
| Household Size | Owner-occupied | Renter-occupied |
| 1-Person Household | 130 (86.1%) | 21 (13.9%) |
| 2-Person Household | 165 (93.8%) | 11 (6.2%) |
| 3-Person Household | 129 (90.2%) | 14 (9.8%) |
| 4+ Person Household | 36 (100.0%) | 0 (0.0%) |
| Total Housing Units | 460 (90.9%) | 46 (9.1%) |
Occupancy by Educational Attainment in Lake St Croix Beach
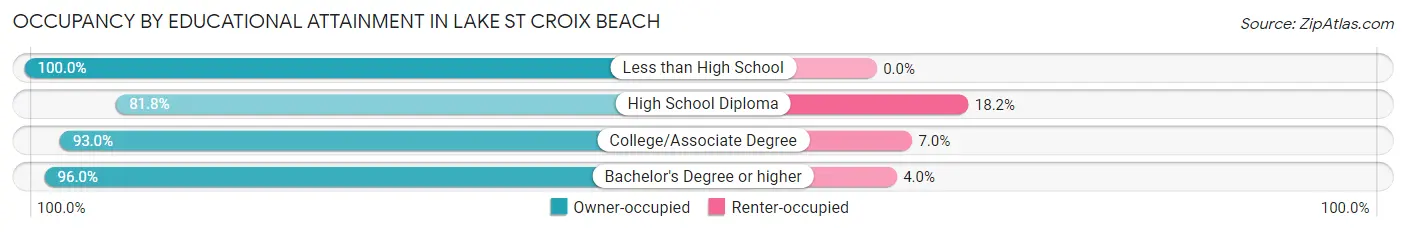
| Household Size | Owner-occupied | Renter-occupied |
| Less than High School | 8 (100.0%) | 0 (0.0%) |
| High School Diploma | 126 (81.8%) | 28 (18.2%) |
| College/Associate Degree | 133 (93.0%) | 10 (7.0%) |
| Bachelor's Degree or higher | 193 (96.0%) | 8 (4.0%) |
Occupancy by Age of Householder in Lake St Croix Beach
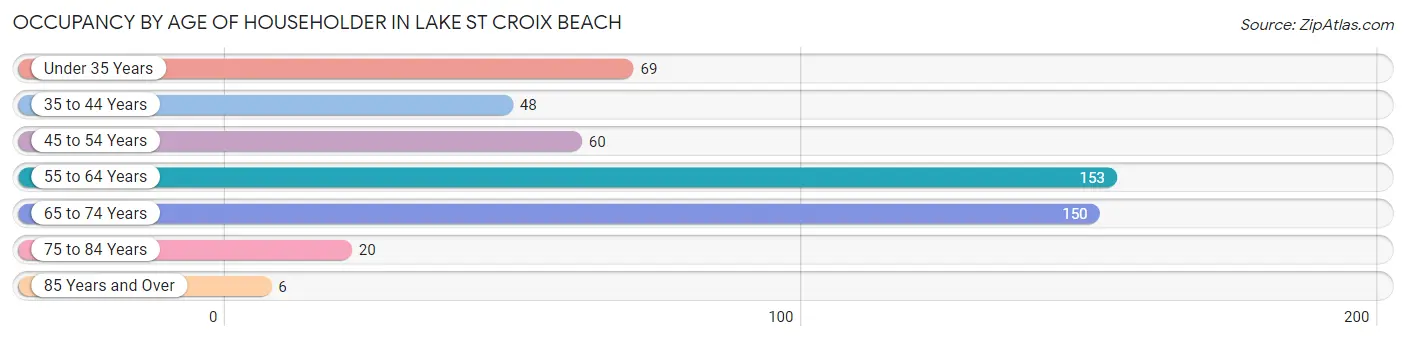
| Age Bracket | # Households | % Households |
| Under 35 Years | 69 | 13.6% |
| 35 to 44 Years | 48 | 9.5% |
| 45 to 54 Years | 60 | 11.9% |
| 55 to 64 Years | 153 | 30.2% |
| 65 to 74 Years | 150 | 29.6% |
| 75 to 84 Years | 20 | 4.0% |
| 85 Years and Over | 6 | 1.2% |
| Total | 506 | 100.0% |
Housing Finances in Lake St Croix Beach
Median Income by Occupancy in Lake St Croix Beach
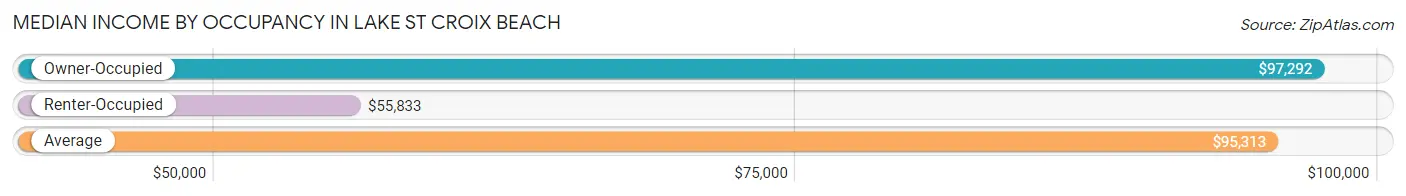
| Occupancy Type | # Households | Median Income |
| Owner-Occupied | 460 (90.9%) | $97,292 |
| Renter-Occupied | 46 (9.1%) | $55,833 |
| Average | 506 (100.0%) | $95,313 |
Occupancy by Householder Income Bracket in Lake St Croix Beach
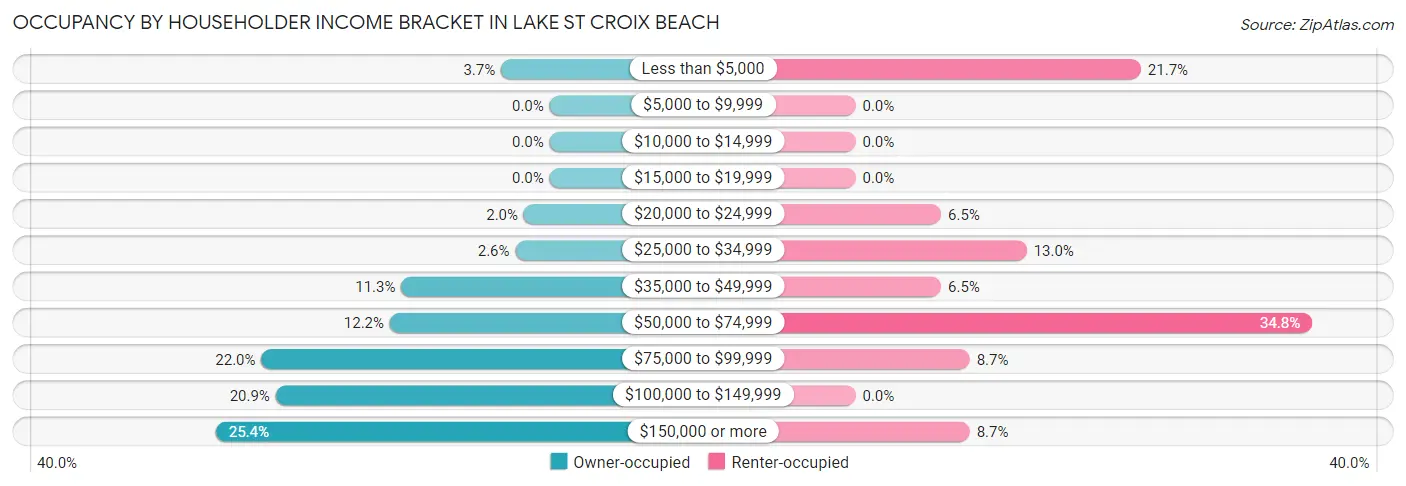
| Income Bracket | Owner-occupied | Renter-occupied |
| Less than $5,000 | 17 (3.7%) | 10 (21.7%) |
| $5,000 to $9,999 | 0 (0.0%) | 0 (0.0%) |
| $10,000 to $14,999 | 0 (0.0%) | 0 (0.0%) |
| $15,000 to $19,999 | 0 (0.0%) | 0 (0.0%) |
| $20,000 to $24,999 | 9 (2.0%) | 3 (6.5%) |
| $25,000 to $34,999 | 12 (2.6%) | 6 (13.0%) |
| $35,000 to $49,999 | 52 (11.3%) | 3 (6.5%) |
| $50,000 to $74,999 | 56 (12.2%) | 16 (34.8%) |
| $75,000 to $99,999 | 101 (22.0%) | 4 (8.7%) |
| $100,000 to $149,999 | 96 (20.9%) | 0 (0.0%) |
| $150,000 or more | 117 (25.4%) | 4 (8.7%) |
| Total | 460 (100.0%) | 46 (100.0%) |
Monthly Housing Cost Tiers in Lake St Croix Beach
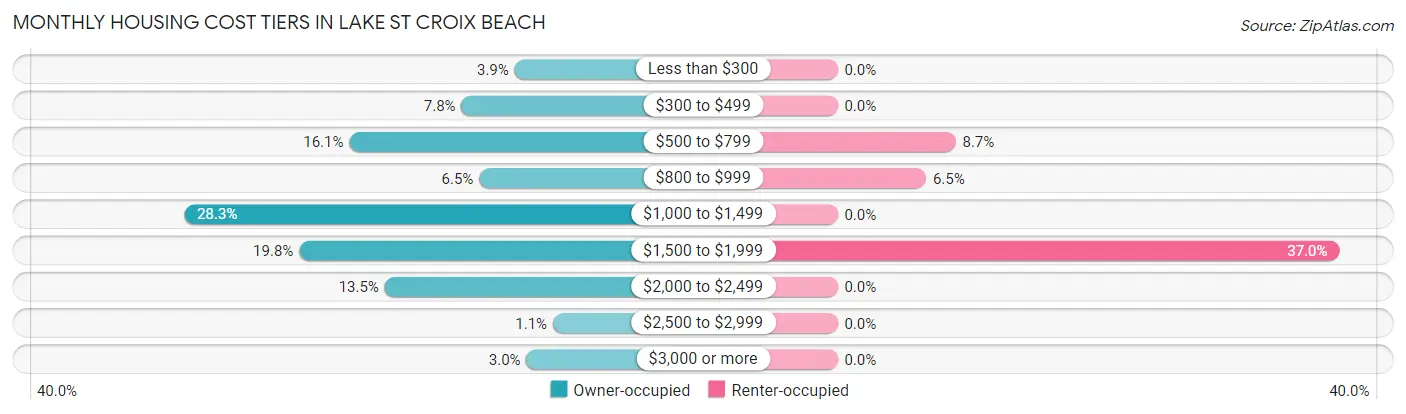
| Monthly Cost | Owner-occupied | Renter-occupied |
| Less than $300 | 18 (3.9%) | 0 (0.0%) |
| $300 to $499 | 36 (7.8%) | 0 (0.0%) |
| $500 to $799 | 74 (16.1%) | 4 (8.7%) |
| $800 to $999 | 30 (6.5%) | 3 (6.5%) |
| $1,000 to $1,499 | 130 (28.3%) | 0 (0.0%) |
| $1,500 to $1,999 | 91 (19.8%) | 17 (37.0%) |
| $2,000 to $2,499 | 62 (13.5%) | 0 (0.0%) |
| $2,500 to $2,999 | 5 (1.1%) | 0 (0.0%) |
| $3,000 or more | 14 (3.0%) | 0 (0.0%) |
| Total | 460 (100.0%) | 46 (100.0%) |
Physical Housing Characteristics in Lake St Croix Beach
Housing Structures in Lake St Croix Beach
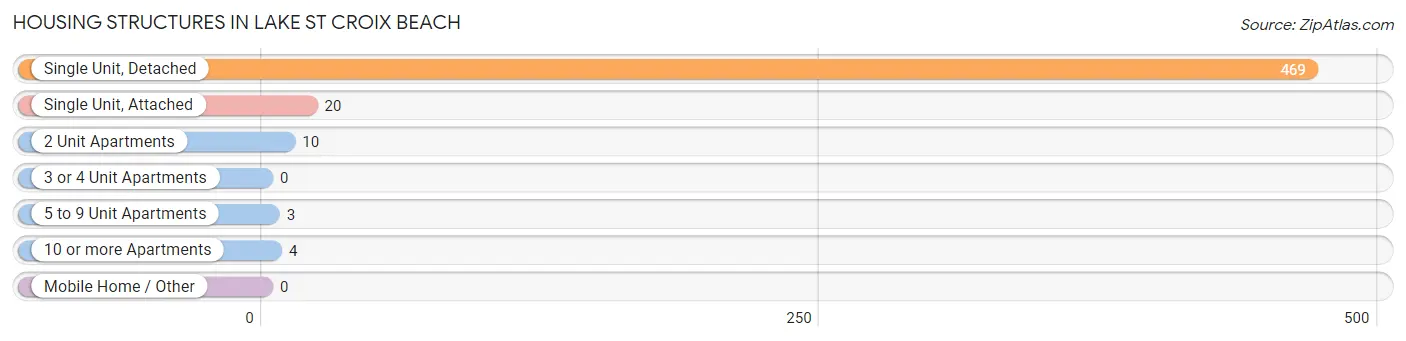
| Structure Type | # Housing Units | % Housing Units |
| Single Unit, Detached | 469 | 92.7% |
| Single Unit, Attached | 20 | 4.0% |
| 2 Unit Apartments | 10 | 2.0% |
| 3 or 4 Unit Apartments | 0 | 0.0% |
| 5 to 9 Unit Apartments | 3 | 0.6% |
| 10 or more Apartments | 4 | 0.8% |
| Mobile Home / Other | 0 | 0.0% |
| Total | 506 | 100.0% |
Housing Structures by Occupancy in Lake St Croix Beach
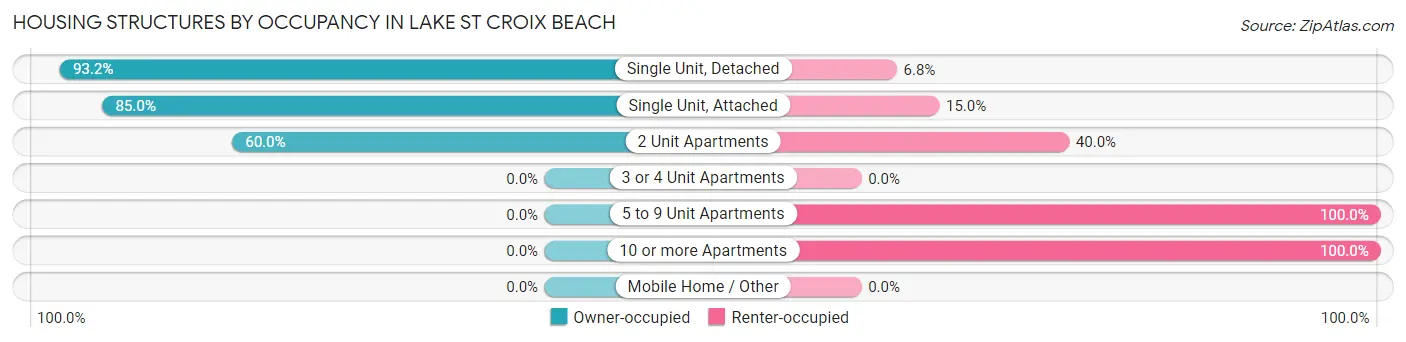
| Structure Type | Owner-occupied | Renter-occupied |
| Single Unit, Detached | 437 (93.2%) | 32 (6.8%) |
| Single Unit, Attached | 17 (85.0%) | 3 (15.0%) |
| 2 Unit Apartments | 6 (60.0%) | 4 (40.0%) |
| 3 or 4 Unit Apartments | 0 (0.0%) | 0 (0.0%) |
| 5 to 9 Unit Apartments | 0 (0.0%) | 3 (100.0%) |
| 10 or more Apartments | 0 (0.0%) | 4 (100.0%) |
| Mobile Home / Other | 0 (0.0%) | 0 (0.0%) |
| Total | 460 (90.9%) | 46 (9.1%) |
Housing Structures by Number of Rooms in Lake St Croix Beach
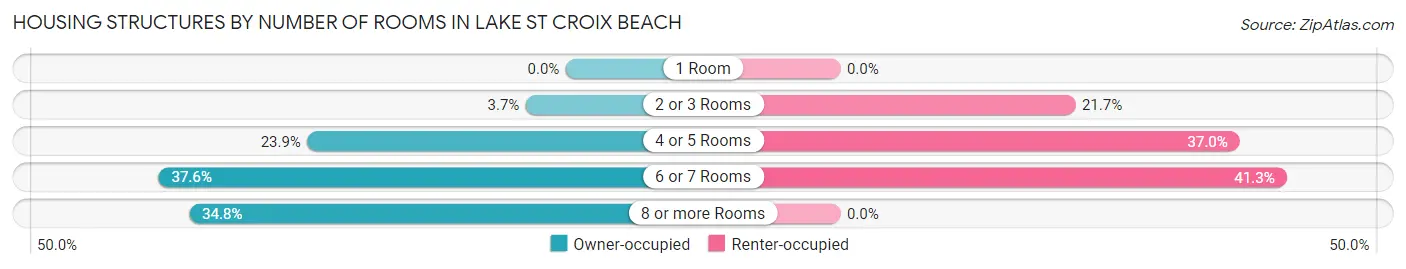
| Number of Rooms | Owner-occupied | Renter-occupied |
| 1 Room | 0 (0.0%) | 0 (0.0%) |
| 2 or 3 Rooms | 17 (3.7%) | 10 (21.7%) |
| 4 or 5 Rooms | 110 (23.9%) | 17 (37.0%) |
| 6 or 7 Rooms | 173 (37.6%) | 19 (41.3%) |
| 8 or more Rooms | 160 (34.8%) | 0 (0.0%) |
| Total | 460 (100.0%) | 46 (100.0%) |
Housing Structure by Heating Type in Lake St Croix Beach
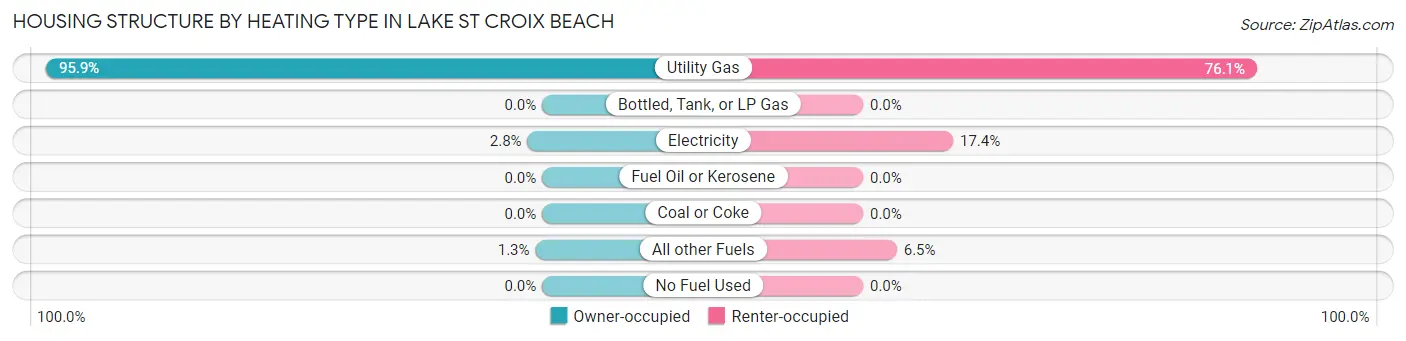
| Heating Type | Owner-occupied | Renter-occupied |
| Utility Gas | 441 (95.9%) | 35 (76.1%) |
| Bottled, Tank, or LP Gas | 0 (0.0%) | 0 (0.0%) |
| Electricity | 13 (2.8%) | 8 (17.4%) |
| Fuel Oil or Kerosene | 0 (0.0%) | 0 (0.0%) |
| Coal or Coke | 0 (0.0%) | 0 (0.0%) |
| All other Fuels | 6 (1.3%) | 3 (6.5%) |
| No Fuel Used | 0 (0.0%) | 0 (0.0%) |
| Total | 460 (100.0%) | 46 (100.0%) |
Household Vehicle Usage in Lake St Croix Beach
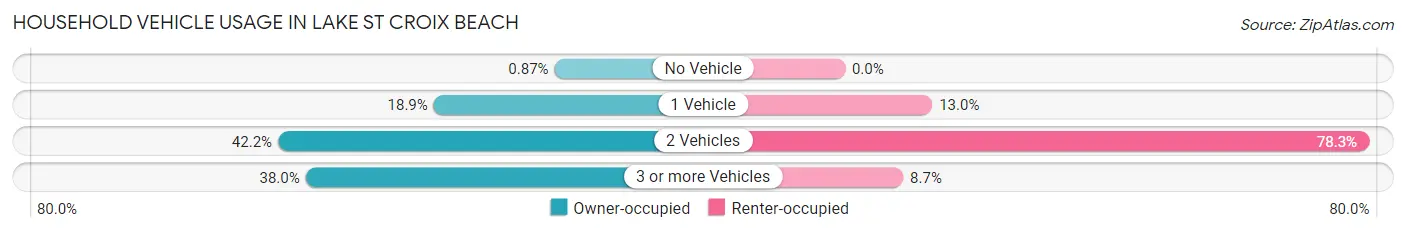
| Vehicles per Household | Owner-occupied | Renter-occupied |
| No Vehicle | 4 (0.9%) | 0 (0.0%) |
| 1 Vehicle | 87 (18.9%) | 6 (13.0%) |
| 2 Vehicles | 194 (42.2%) | 36 (78.3%) |
| 3 or more Vehicles | 175 (38.0%) | 4 (8.7%) |
| Total | 460 (100.0%) | 46 (100.0%) |
Real Estate & Mortgages in Lake St Croix Beach
Real Estate and Mortgage Overview in Lake St Croix Beach
| Characteristic | Without Mortgage | With Mortgage |
| Housing Units | 201 | 259 |
| Median Property Value | $387,200 | $283,200 |
| Median Household Income | $111,250 | $41 |
| Monthly Housing Costs | $705 | $14 |
| Real Estate Taxes | $3,814 | $0 |
Property Value by Mortgage Status in Lake St Croix Beach
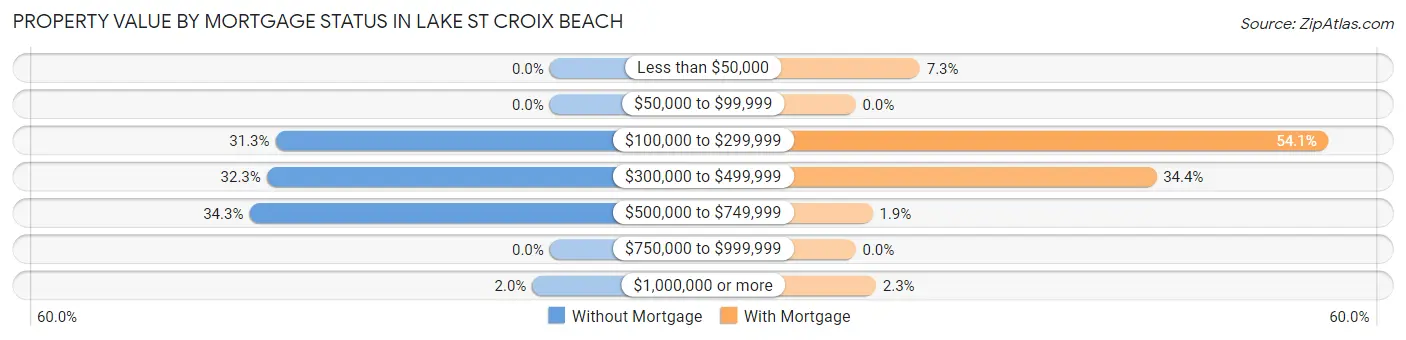
| Property Value | Without Mortgage | With Mortgage |
| Less than $50,000 | 0 (0.0%) | 19 (7.3%) |
| $50,000 to $99,999 | 0 (0.0%) | 0 (0.0%) |
| $100,000 to $299,999 | 63 (31.3%) | 140 (54.0%) |
| $300,000 to $499,999 | 65 (32.3%) | 89 (34.4%) |
| $500,000 to $749,999 | 69 (34.3%) | 5 (1.9%) |
| $750,000 to $999,999 | 0 (0.0%) | 0 (0.0%) |
| $1,000,000 or more | 4 (2.0%) | 6 (2.3%) |
| Total | 201 (100.0%) | 259 (100.0%) |
Household Income by Mortgage Status in Lake St Croix Beach
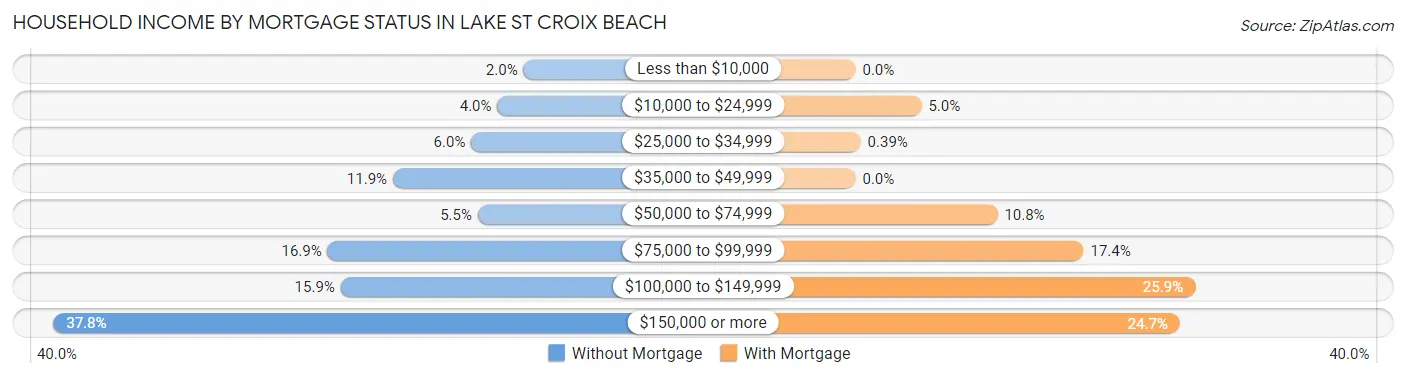
| Household Income | Without Mortgage | With Mortgage |
| Less than $10,000 | 4 (2.0%) | 0 (0.0%) |
| $10,000 to $24,999 | 8 (4.0%) | 13 (5.0%) |
| $25,000 to $34,999 | 12 (6.0%) | 1 (0.4%) |
| $35,000 to $49,999 | 24 (11.9%) | 0 (0.0%) |
| $50,000 to $74,999 | 11 (5.5%) | 28 (10.8%) |
| $75,000 to $99,999 | 34 (16.9%) | 45 (17.4%) |
| $100,000 to $149,999 | 32 (15.9%) | 67 (25.9%) |
| $150,000 or more | 76 (37.8%) | 64 (24.7%) |
| Total | 201 (100.0%) | 259 (100.0%) |
Property Value to Household Income Ratio in Lake St Croix Beach
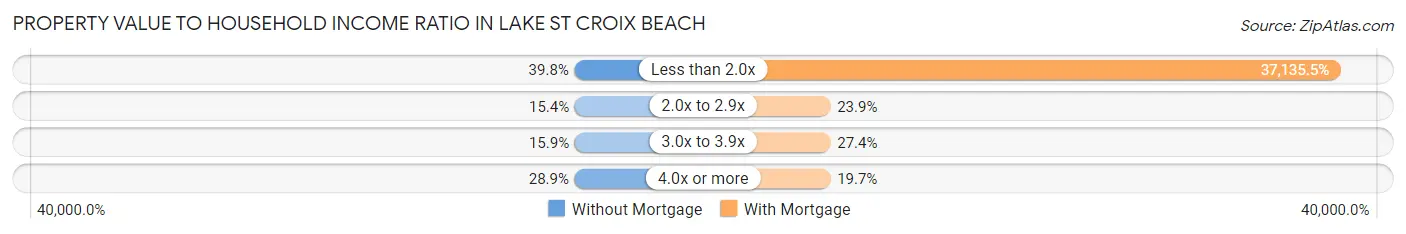
| Value-to-Income Ratio | Without Mortgage | With Mortgage |
| Less than 2.0x | 80 (39.8%) | 96,181 (37,135.5%) |
| 2.0x to 2.9x | 31 (15.4%) | 62 (23.9%) |
| 3.0x to 3.9x | 32 (15.9%) | 71 (27.4%) |
| 4.0x or more | 58 (28.9%) | 51 (19.7%) |
| Total | 201 (100.0%) | 259 (100.0%) |
Real Estate Taxes by Mortgage Status in Lake St Croix Beach
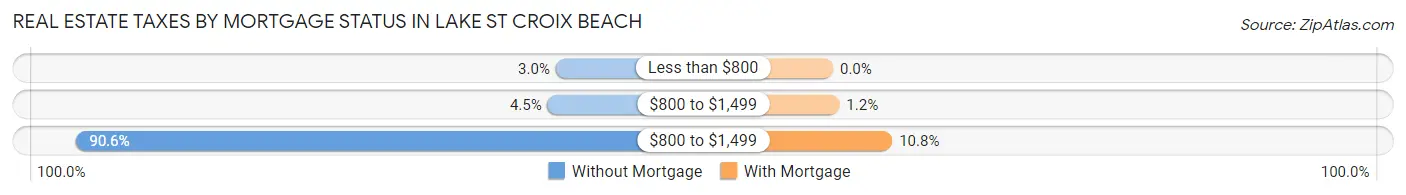
| Property Taxes | Without Mortgage | With Mortgage |
| Less than $800 | 6 (3.0%) | 0 (0.0%) |
| $800 to $1,499 | 9 (4.5%) | 3 (1.2%) |
| $800 to $1,499 | 182 (90.5%) | 28 (10.8%) |
| Total | 201 (100.0%) | 259 (100.0%) |
Health & Disability in Lake St Croix Beach
Health Insurance Coverage by Age in Lake St Croix Beach
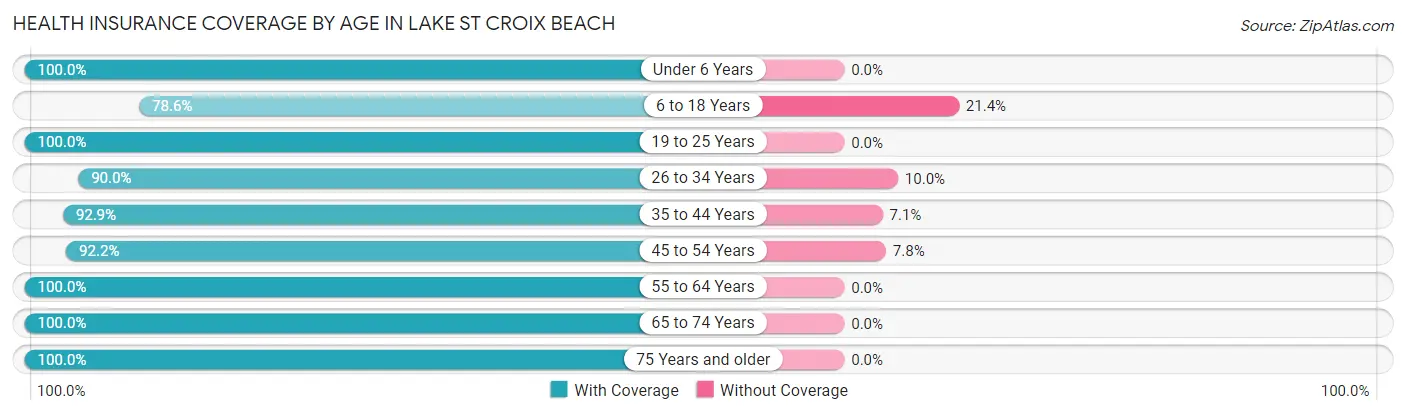
| Age Bracket | With Coverage | Without Coverage |
| Under 6 Years | 32 (100.0%) | 0 (0.0%) |
| 6 to 18 Years | 92 (78.6%) | 25 (21.4%) |
| 19 to 25 Years | 73 (100.0%) | 0 (0.0%) |
| 26 to 34 Years | 90 (90.0%) | 10 (10.0%) |
| 35 to 44 Years | 130 (92.9%) | 10 (7.1%) |
| 45 to 54 Years | 107 (92.2%) | 9 (7.8%) |
| 55 to 64 Years | 227 (100.0%) | 0 (0.0%) |
| 65 to 74 Years | 261 (100.0%) | 0 (0.0%) |
| 75 Years and older | 34 (100.0%) | 0 (0.0%) |
| Total | 1,046 (95.1%) | 54 (4.9%) |
Health Insurance Coverage by Citizenship Status in Lake St Croix Beach
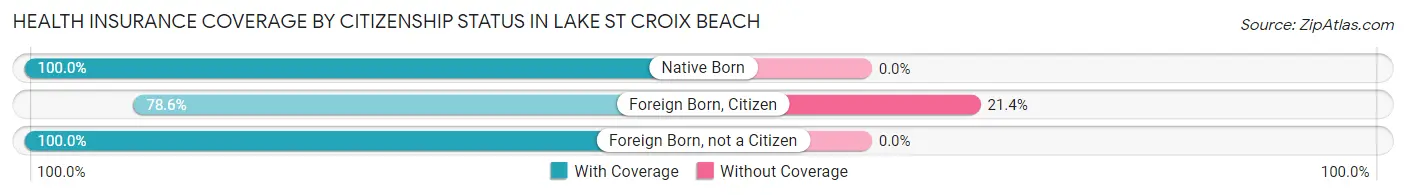
| Citizenship Status | With Coverage | Without Coverage |
| Native Born | 32 (100.0%) | 0 (0.0%) |
| Foreign Born, Citizen | 92 (78.6%) | 25 (21.4%) |
| Foreign Born, not a Citizen | 73 (100.0%) | 0 (0.0%) |
Health Insurance Coverage by Household Income in Lake St Croix Beach
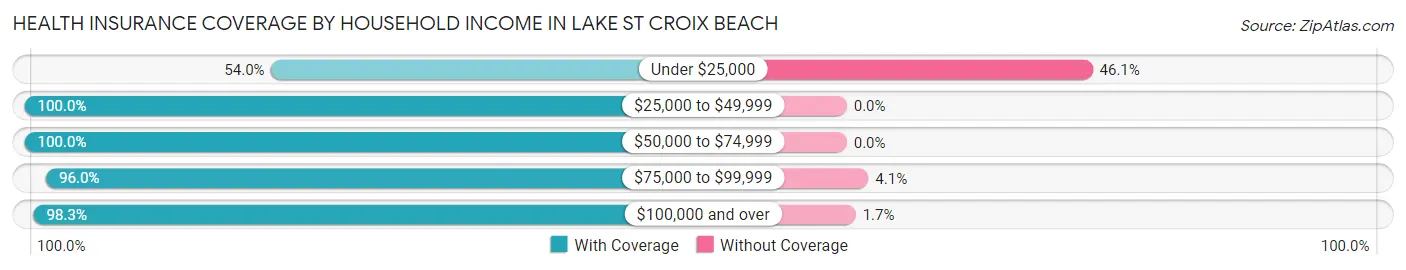
| Household Income | With Coverage | Without Coverage |
| Under $25,000 | 41 (53.9%) | 35 (46.1%) |
| $25,000 to $49,999 | 108 (100.0%) | 0 (0.0%) |
| $50,000 to $74,999 | 128 (100.0%) | 0 (0.0%) |
| $75,000 to $99,999 | 237 (96.0%) | 10 (4.1%) |
| $100,000 and over | 531 (98.3%) | 9 (1.7%) |
Public vs Private Health Insurance Coverage by Age in Lake St Croix Beach
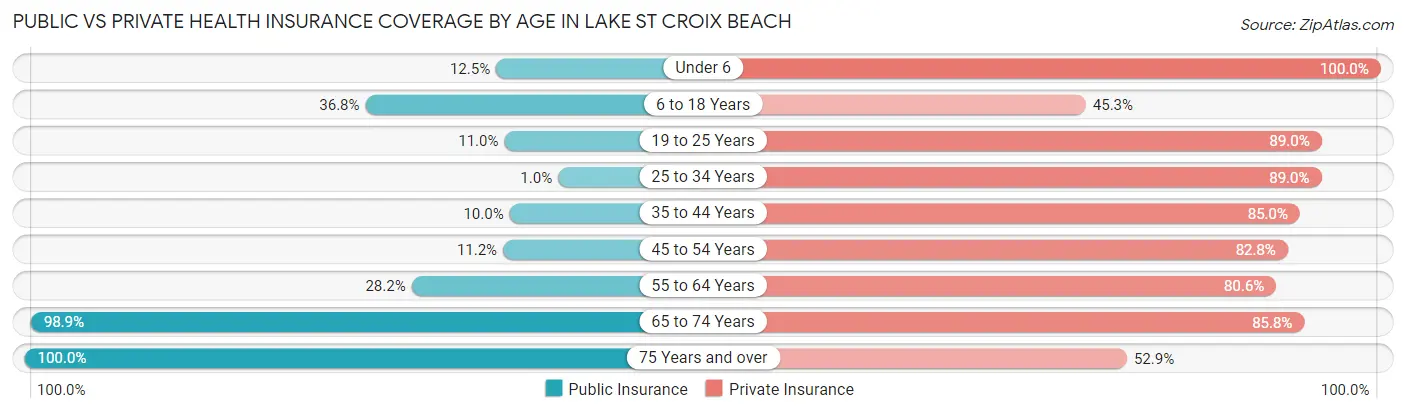
| Age Bracket | Public Insurance | Private Insurance |
| Under 6 | 4 (12.5%) | 32 (100.0%) |
| 6 to 18 Years | 43 (36.7%) | 53 (45.3%) |
| 19 to 25 Years | 8 (11.0%) | 65 (89.0%) |
| 25 to 34 Years | 1 (1.0%) | 89 (89.0%) |
| 35 to 44 Years | 14 (10.0%) | 119 (85.0%) |
| 45 to 54 Years | 13 (11.2%) | 96 (82.8%) |
| 55 to 64 Years | 64 (28.2%) | 183 (80.6%) |
| 65 to 74 Years | 258 (98.9%) | 224 (85.8%) |
| 75 Years and over | 34 (100.0%) | 18 (52.9%) |
| Total | 439 (39.9%) | 879 (79.9%) |
Disability Status by Sex by Age in Lake St Croix Beach
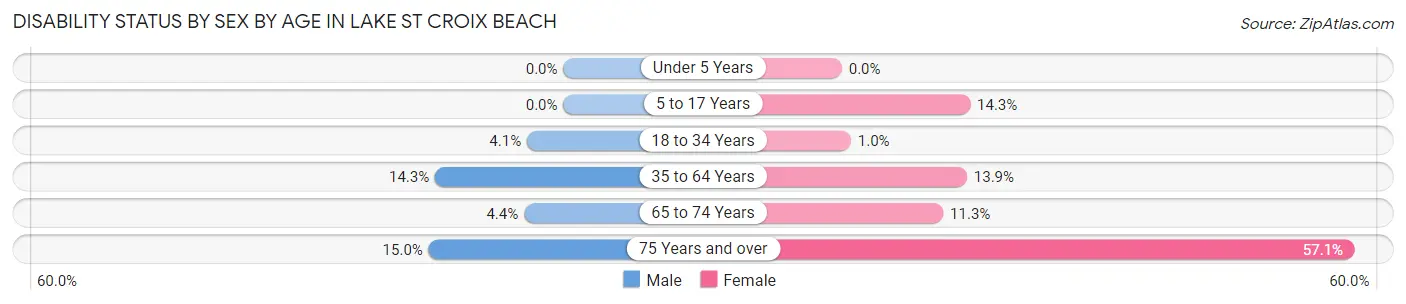
| Age Bracket | Male | Female |
| Under 5 Years | 0 (0.0%) | 0 (0.0%) |
| 5 to 17 Years | 0 (0.0%) | 9 (14.3%) |
| 18 to 34 Years | 3 (4.1%) | 1 (1.0%) |
| 35 to 64 Years | 29 (14.3%) | 39 (13.9%) |
| 65 to 74 Years | 6 (4.4%) | 14 (11.3%) |
| 75 Years and over | 3 (15.0%) | 8 (57.1%) |
Disability Class by Sex by Age in Lake St Croix Beach
Disability Class: Hearing Difficulty
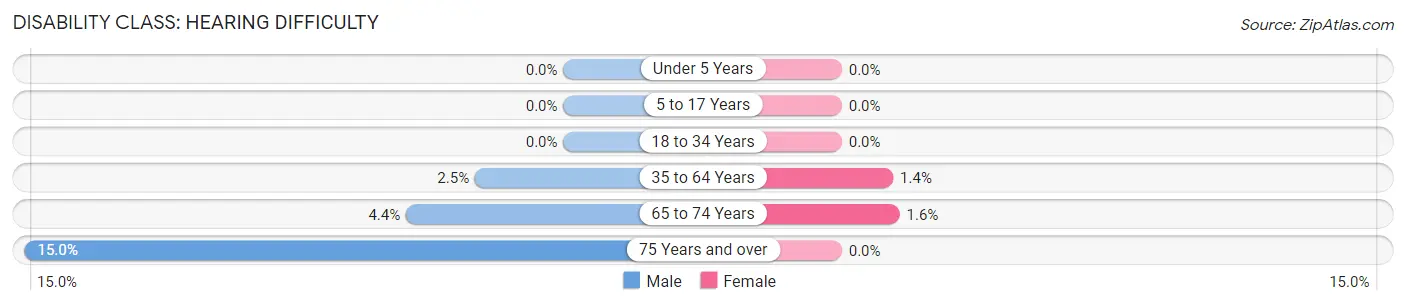
| Age Bracket | Male | Female |
| Under 5 Years | 0 (0.0%) | 0 (0.0%) |
| 5 to 17 Years | 0 (0.0%) | 0 (0.0%) |
| 18 to 34 Years | 0 (0.0%) | 0 (0.0%) |
| 35 to 64 Years | 5 (2.5%) | 4 (1.4%) |
| 65 to 74 Years | 6 (4.4%) | 2 (1.6%) |
| 75 Years and over | 3 (15.0%) | 0 (0.0%) |
Disability Class: Vision Difficulty
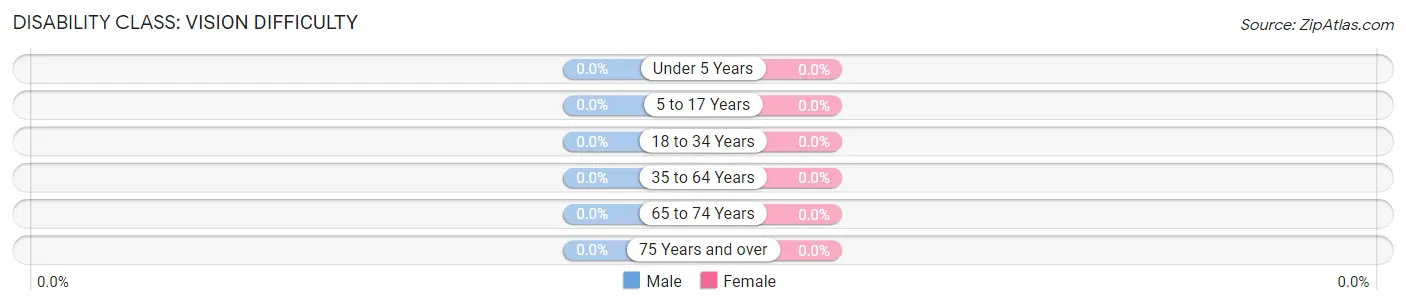
| Age Bracket | Male | Female |
| Under 5 Years | 0 (0.0%) | 0 (0.0%) |
| 5 to 17 Years | 0 (0.0%) | 0 (0.0%) |
| 18 to 34 Years | 0 (0.0%) | 0 (0.0%) |
| 35 to 64 Years | 0 (0.0%) | 0 (0.0%) |
| 65 to 74 Years | 0 (0.0%) | 0 (0.0%) |
| 75 Years and over | 0 (0.0%) | 0 (0.0%) |
Disability Class: Cognitive Difficulty
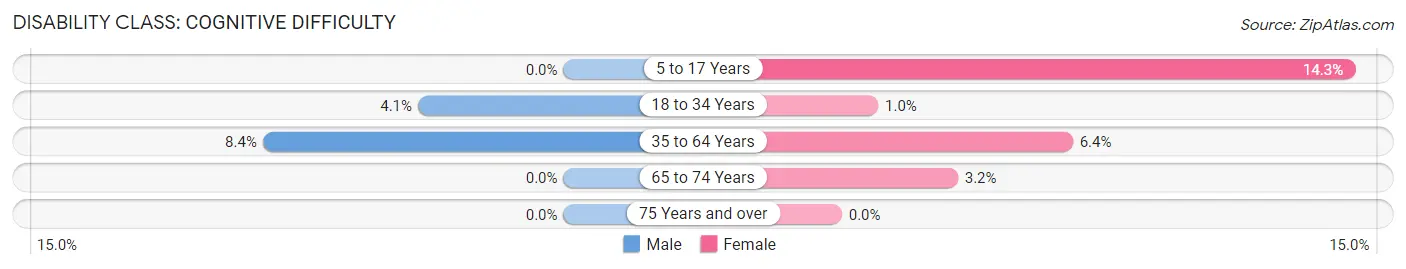
| Age Bracket | Male | Female |
| 5 to 17 Years | 0 (0.0%) | 9 (14.3%) |
| 18 to 34 Years | 3 (4.1%) | 1 (1.0%) |
| 35 to 64 Years | 17 (8.4%) | 18 (6.4%) |
| 65 to 74 Years | 0 (0.0%) | 4 (3.2%) |
| 75 Years and over | 0 (0.0%) | 0 (0.0%) |
Disability Class: Ambulatory Difficulty
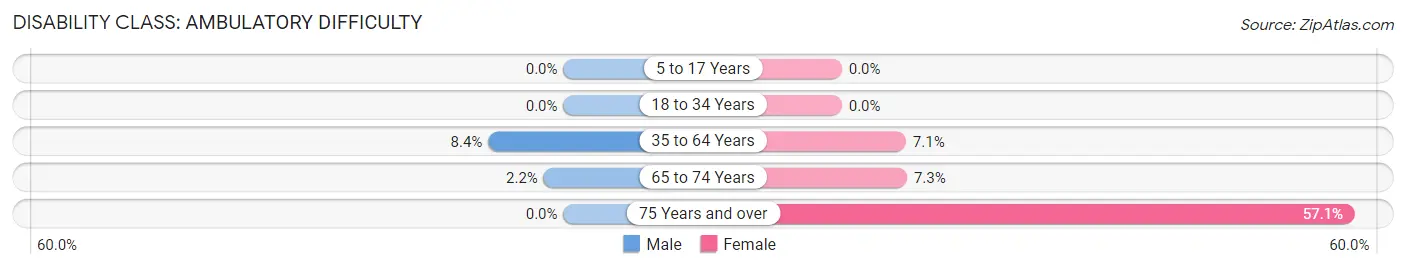
| Age Bracket | Male | Female |
| 5 to 17 Years | 0 (0.0%) | 0 (0.0%) |
| 18 to 34 Years | 0 (0.0%) | 0 (0.0%) |
| 35 to 64 Years | 17 (8.4%) | 20 (7.1%) |
| 65 to 74 Years | 3 (2.2%) | 9 (7.3%) |
| 75 Years and over | 0 (0.0%) | 8 (57.1%) |
Disability Class: Self-Care Difficulty
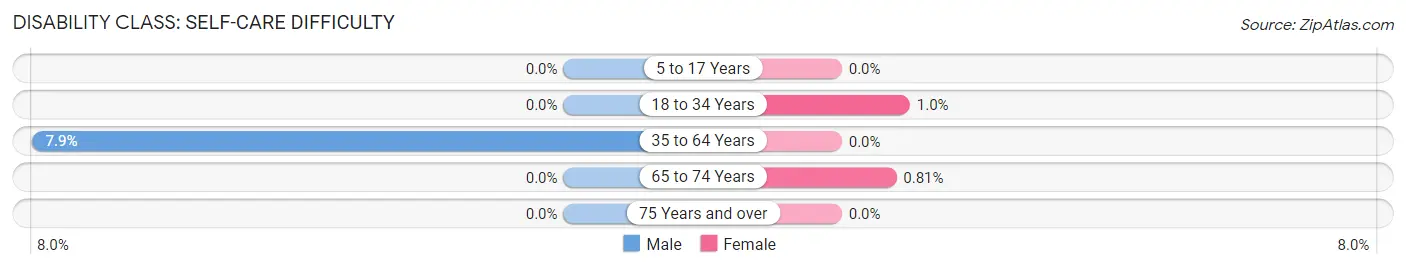
| Age Bracket | Male | Female |
| 5 to 17 Years | 0 (0.0%) | 0 (0.0%) |
| 18 to 34 Years | 0 (0.0%) | 1 (1.0%) |
| 35 to 64 Years | 16 (7.9%) | 0 (0.0%) |
| 65 to 74 Years | 0 (0.0%) | 1 (0.8%) |
| 75 Years and over | 0 (0.0%) | 0 (0.0%) |
Technology Access in Lake St Croix Beach
Computing Device Access in Lake St Croix Beach
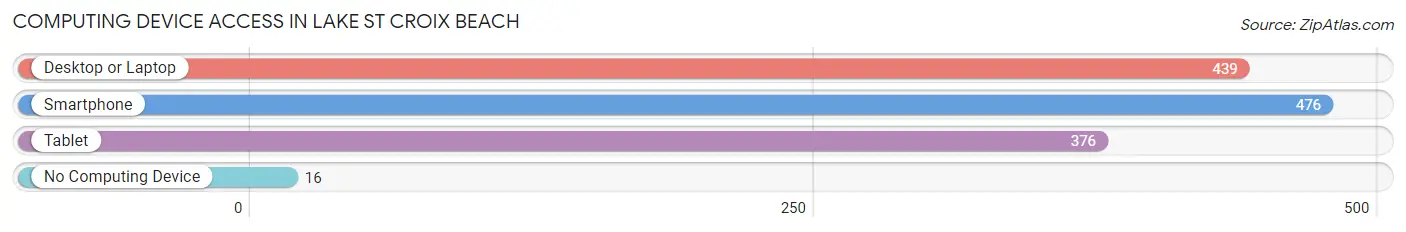
| Device Type | # Households | % Households |
| Desktop or Laptop | 439 | 86.8% |
| Smartphone | 476 | 94.1% |
| Tablet | 376 | 74.3% |
| No Computing Device | 16 | 3.2% |
| Total | 506 | 100.0% |
Internet Access in Lake St Croix Beach
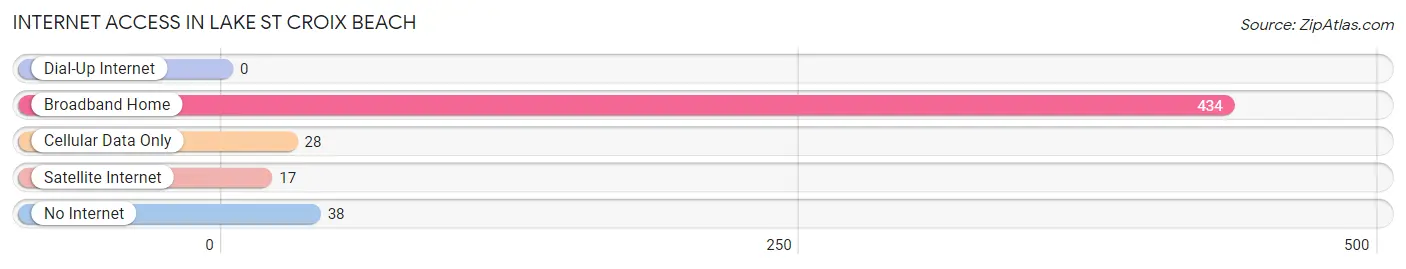
| Internet Type | # Households | % Households |
| Dial-Up Internet | 0 | 0.0% |
| Broadband Home | 434 | 85.8% |
| Cellular Data Only | 28 | 5.5% |
| Satellite Internet | 17 | 3.4% |
| No Internet | 38 | 7.5% |
| Total | 506 | 100.0% |
Lake St Croix Beach Summary
Lake St Croix Beach is a small city located in Washington County, Minnesota. It is situated on the banks of the St. Croix River, which forms the border between Minnesota and Wisconsin. The city has a population of approximately 1,500 people and is part of the Twin Cities metropolitan area.
History
The area around Lake St Croix Beach has been inhabited for thousands of years. The first known inhabitants were the Dakota and Ojibwe tribes, who lived in the area for centuries before the arrival of European settlers. The first Europeans to settle in the area were French fur traders, who established trading posts in the area in the late 1700s.
In the early 1800s, the area was surveyed and divided into townships. The area that is now Lake St Croix Beach was part of the township of St. Croix. The first permanent settlers arrived in the area in the 1840s, and the town of St. Croix Beach was officially established in 1856.
The town grew slowly over the next few decades, and by the early 1900s, it had become a popular summer resort destination. The town was incorporated in 1921, and the name was changed to Lake St Croix Beach in 1925.
Geography
Lake St Croix Beach is located in the St. Croix River Valley, which is part of the Driftless Area of Minnesota. The city is situated on the banks of the St. Croix River, which forms the border between Minnesota and Wisconsin. The city is surrounded by rolling hills and bluffs, and is located approximately 25 miles northeast of Minneapolis.
The city has a total area of 1.2 square miles, all of which is land. The city is located in a humid continental climate zone, with hot summers and cold winters. The average annual temperature is 45 degrees Fahrenheit, and the average annual precipitation is 33 inches.
Economy
The economy of Lake St Croix Beach is largely based on tourism and recreation. The city is home to several resorts and hotels, as well as a variety of restaurants and shops. The city is also home to several marinas, which provide access to the St. Croix River.
The city is also home to several manufacturing companies, including a paper mill and a plastics factory. The city is also home to several small businesses, including a grocery store, a hardware store, and a pharmacy.
Demographics
As of the 2010 census, the population of Lake St Croix Beach was 1,500 people. The racial makeup of the city was 97.3% White, 0.7% African American, 0.3% Native American, 0.3% Asian, and 1.3% from other races. The median household income was $50,000, and the median family income was $60,000.
The city is home to a variety of religious denominations, including Catholic, Lutheran, Methodist, and Presbyterian. The city is also home to a variety of cultural and recreational activities, including a summer concert series, a farmers market, and a variety of festivals and events.
Conclusion
Lake St Croix Beach is a small city located in Washington County, Minnesota. It is situated on the banks of the St. Croix River, which forms the border between Minnesota and Wisconsin. The city has a population of approximately 1,500 people and is part of the Twin Cities metropolitan area. The economy of the city is largely based on tourism and recreation, and the city is home to a variety of cultural and recreational activities. The city is also home to a variety of religious denominations, and the racial makeup of the city is predominantly White.
Common Questions
What is Per Capita Income in Lake St Croix Beach?
Per Capita income in Lake St Croix Beach is $62,231.
What is the Median Family Income in Lake St Croix Beach?
Median Family Income in Lake St Croix Beach is $112,188.
What is the Median Household income in Lake St Croix Beach?
Median Household Income in Lake St Croix Beach is $95,313.
What is Income or Wage Gap in Lake St Croix Beach?
Income or Wage Gap in Lake St Croix Beach is 27.1%.
Women in Lake St Croix Beach earn 72.9 cents for every dollar earned by a man.
What is Inequality or Gini Index in Lake St Croix Beach?
Inequality or Gini Index in Lake St Croix Beach is 0.48.
What is the Total Population of Lake St Croix Beach?
Total Population of Lake St Croix Beach is 1,106.
What is the Total Male Population of Lake St Croix Beach?
Total Male Population of Lake St Croix Beach is 514.
What is the Total Female Population of Lake St Croix Beach?
Total Female Population of Lake St Croix Beach is 592.
What is the Ratio of Males per 100 Females in Lake St Croix Beach?
There are 86.82 Males per 100 Females in Lake St Croix Beach.
What is the Ratio of Females per 100 Males in Lake St Croix Beach?
There are 115.18 Females per 100 Males in Lake St Croix Beach.
What is the Median Population Age in Lake St Croix Beach?
Median Population Age in Lake St Croix Beach is 53.4 Years.
What is the Average Family Size in Lake St Croix Beach
Average Family Size in Lake St Croix Beach is 2.7 People.
What is the Average Household Size in Lake St Croix Beach
Average Household Size in Lake St Croix Beach is 2.2 People.
How Large is the Labor Force in Lake St Croix Beach?
There are 699 People in the Labor Forcein in Lake St Croix Beach.
What is the Percentage of People in the Labor Force in Lake St Croix Beach?
70.9% of People are in the Labor Force in Lake St Croix Beach.
What is the Unemployment Rate in Lake St Croix Beach?
Unemployment Rate in Lake St Croix Beach is 1.4%.