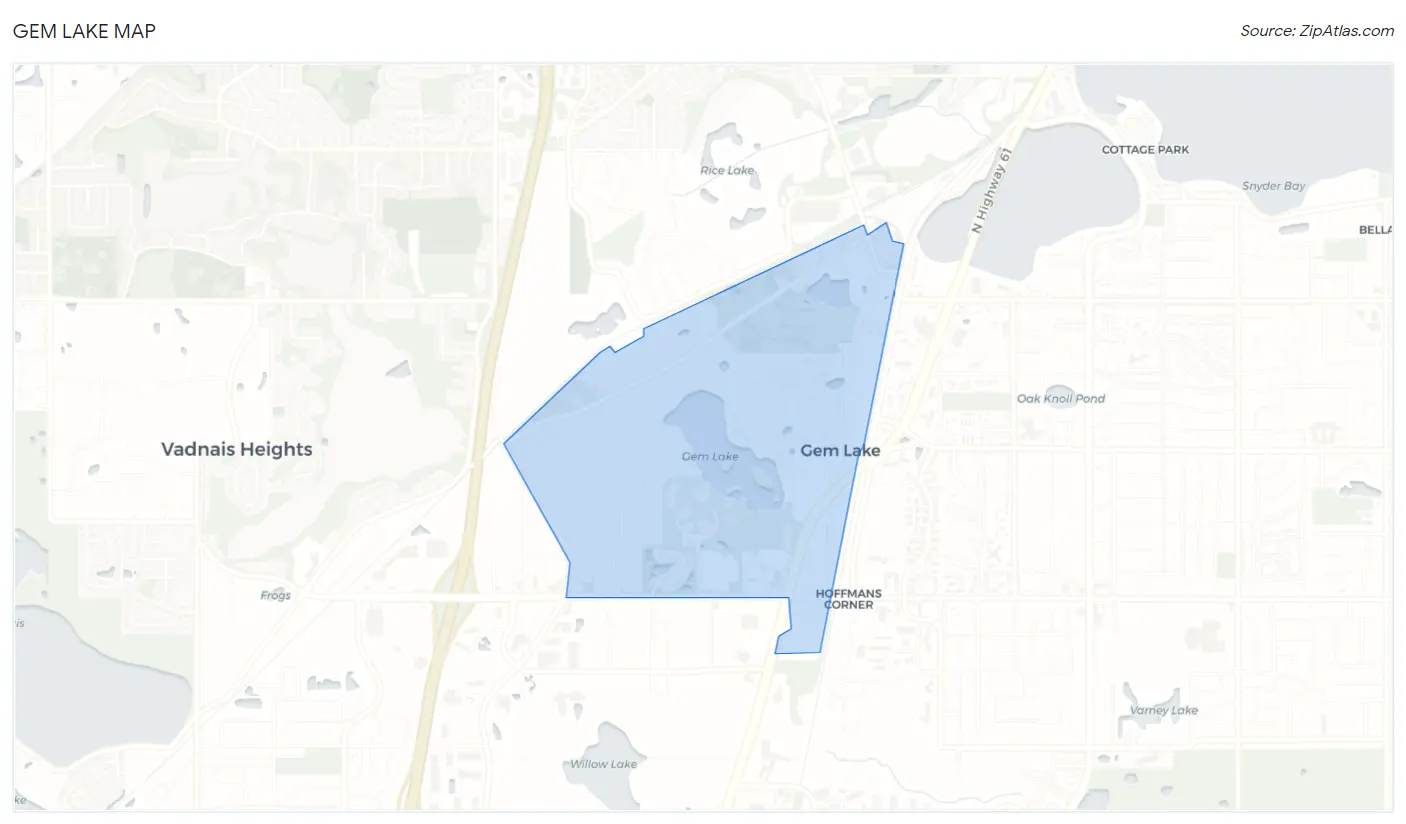
Gem Lake, MN Map & Demographics
Gem Lake Map
Gem Lake Overview
$72,123
PER CAPITA INCOME
$146,250
AVG FAMILY INCOME
$129,583
AVG HOUSEHOLD INCOME
32.0%
WAGE / INCOME GAP [ % ]
68.0¢/ $1
WAGE / INCOME GAP [ $ ]
0.47
INEQUALITY / GINI INDEX
475
TOTAL POPULATION
222
MALE POPULATION
253
FEMALE POPULATION
87.75
MALES / 100 FEMALES
113.96
FEMALES / 100 MALES
42.3
MEDIAN AGE
3.0
AVG FAMILY SIZE
2.7
AVG HOUSEHOLD SIZE
241
LABOR FORCE [ PEOPLE ]
67.1%
PERCENT IN LABOR FORCE
0.8%
UNEMPLOYMENT RATE
Income in Gem Lake
Income Overview in Gem Lake
Per Capita Income in Gem Lake is $72,123, while median incomes of families and households are $146,250 and $129,583 respectively.
| Characteristic | Number | Measure |
| Per Capita Income | 475 | $72,123 |
| Median Family Income | 143 | $146,250 |
| Mean Family Income | 143 | $219,859 |
| Median Household Income | 175 | $129,583 |
| Mean Household Income | 175 | $192,345 |
| Income Deficit | 143 | $0 |
| Wage / Income Gap (%) | 475 | 31.99% |
| Wage / Income Gap ($) | 475 | 68.01¢ per $1 |
| Gini / Inequality Index | 475 | 0.47 |
Earnings by Sex in Gem Lake
Average Earnings in Gem Lake are $69,063, $81,786 for men and $55,625 for women, a difference of 32.0%.
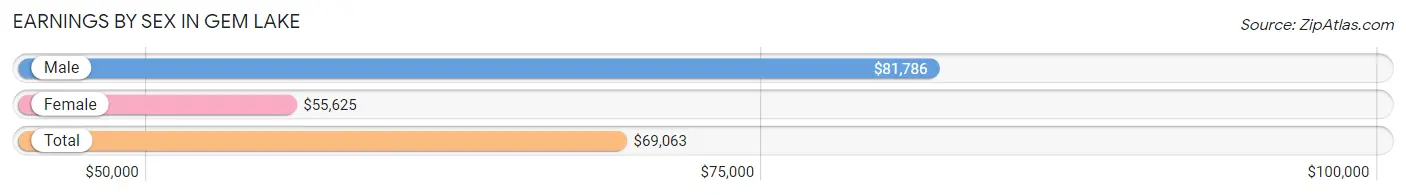
| Sex | Number | Average Earnings |
| Male | 140 (53.6%) | $81,786 |
| Female | 121 (46.4%) | $55,625 |
| Total | 261 (100.0%) | $69,063 |
Earnings by Sex by Income Bracket in Gem Lake
The most common earnings brackets in Gem Lake are $100,000+ for men (51 | 36.4%) and $100,000+ for women (29 | 24.0%).
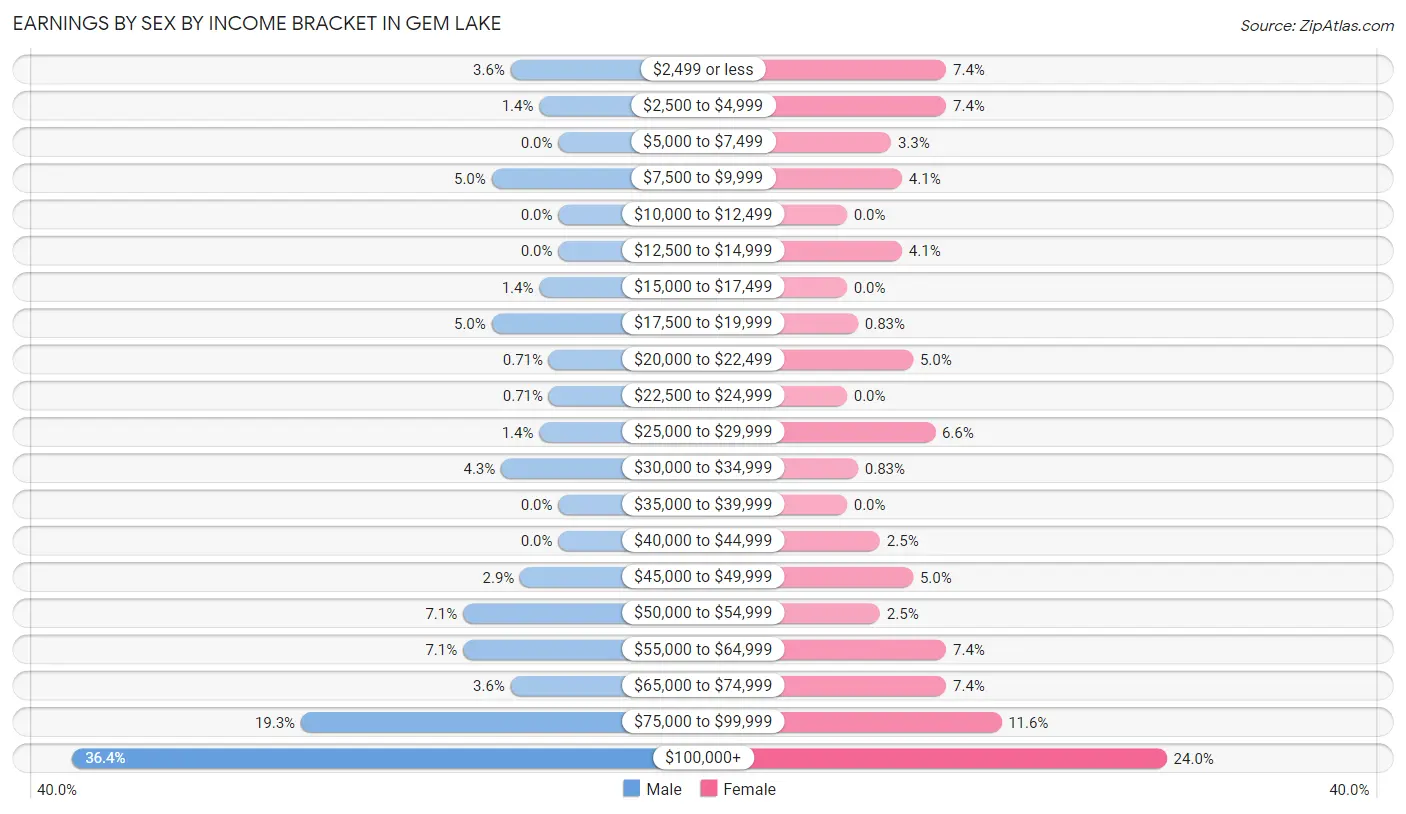
| Income | Male | Female |
| $2,499 or less | 5 (3.6%) | 9 (7.4%) |
| $2,500 to $4,999 | 2 (1.4%) | 9 (7.4%) |
| $5,000 to $7,499 | 0 (0.0%) | 4 (3.3%) |
| $7,500 to $9,999 | 7 (5.0%) | 5 (4.1%) |
| $10,000 to $12,499 | 0 (0.0%) | 0 (0.0%) |
| $12,500 to $14,999 | 0 (0.0%) | 5 (4.1%) |
| $15,000 to $17,499 | 2 (1.4%) | 0 (0.0%) |
| $17,500 to $19,999 | 7 (5.0%) | 1 (0.8%) |
| $20,000 to $22,499 | 1 (0.7%) | 6 (5.0%) |
| $22,500 to $24,999 | 1 (0.7%) | 0 (0.0%) |
| $25,000 to $29,999 | 2 (1.4%) | 8 (6.6%) |
| $30,000 to $34,999 | 6 (4.3%) | 1 (0.8%) |
| $35,000 to $39,999 | 0 (0.0%) | 0 (0.0%) |
| $40,000 to $44,999 | 0 (0.0%) | 3 (2.5%) |
| $45,000 to $49,999 | 4 (2.9%) | 6 (5.0%) |
| $50,000 to $54,999 | 10 (7.1%) | 3 (2.5%) |
| $55,000 to $64,999 | 10 (7.1%) | 9 (7.4%) |
| $65,000 to $74,999 | 5 (3.6%) | 9 (7.4%) |
| $75,000 to $99,999 | 27 (19.3%) | 14 (11.6%) |
| $100,000+ | 51 (36.4%) | 29 (24.0%) |
| Total | 140 (100.0%) | 121 (100.0%) |
Earnings by Sex by Educational Attainment in Gem Lake
Average earnings in Gem Lake are $92,250 for men and $58,125 for women, a difference of 37.0%. Men with an educational attainment of graduate degree enjoy the highest average annual earnings of $201,875, while those with high school diploma education earn the least with $54,375. Women with an educational attainment of graduate degree earn the most with the average annual earnings of $106,250, while those with high school diploma education have the smallest earnings of $25,938.
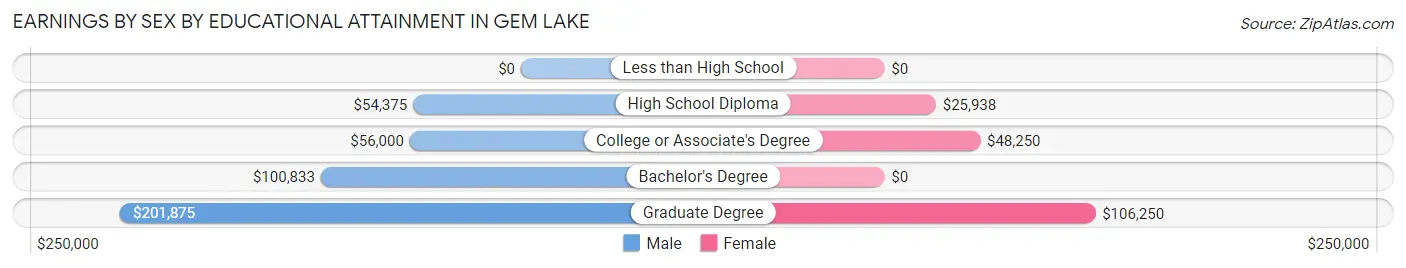
| Educational Attainment | Male Income | Female Income |
| Less than High School | - | - |
| High School Diploma | $54,375 | $25,938 |
| College or Associate's Degree | $56,000 | $48,250 |
| Bachelor's Degree | $100,833 | $0 |
| Graduate Degree | $201,875 | $106,250 |
| Total | $92,250 | $58,125 |
Family Income in Gem Lake
Family Income Brackets in Gem Lake
According to the Gem Lake family income data, there are 44 families falling into the $200,000+ income range, which is the most common income bracket and makes up 30.8% of all families.
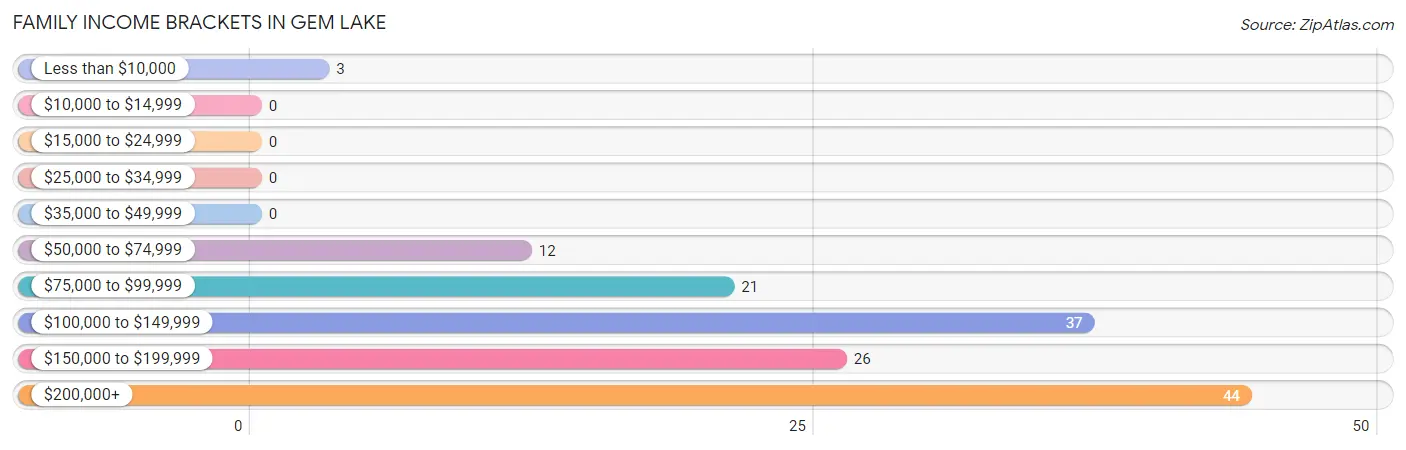
| Income Bracket | # Families | % Families |
| Less than $10,000 | 3 | 2.1% |
| $10,000 to $14,999 | 0 | 0.0% |
| $15,000 to $24,999 | 0 | 0.0% |
| $25,000 to $34,999 | 0 | 0.0% |
| $35,000 to $49,999 | 0 | 0.0% |
| $50,000 to $74,999 | 12 | 8.4% |
| $75,000 to $99,999 | 21 | 14.7% |
| $100,000 to $149,999 | 37 | 25.9% |
| $150,000 to $199,999 | 26 | 18.2% |
| $200,000+ | 44 | 30.8% |
Family Income by Famaliy Size in Gem Lake
5-person families (17 | 11.9%) account for the highest median family income in Gem Lake with $240,625 per family, while 3-person families (26 | 18.2%) have the highest median income of $58,333 per family member.
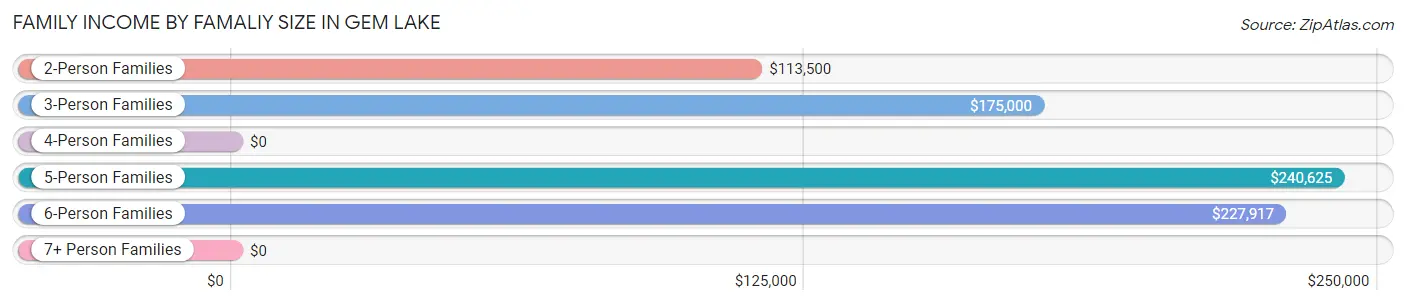
| Income Bracket | # Families | Median Income |
| 2-Person Families | 74 (51.7%) | $113,500 |
| 3-Person Families | 26 (18.2%) | $175,000 |
| 4-Person Families | 17 (11.9%) | $0 |
| 5-Person Families | 17 (11.9%) | $240,625 |
| 6-Person Families | 9 (6.3%) | $227,917 |
| 7+ Person Families | 0 (0.0%) | $0 |
| Total | 143 (100.0%) | $146,250 |
Family Income by Number of Earners in Gem Lake
The median family income in Gem Lake is $146,250, with families comprising 3+ earners (15) having the highest median family income of $227,917, while families with 1 earner (35) have the lowest median family income of $98,750, accounting for 10.5% and 24.5% of families, respectively.
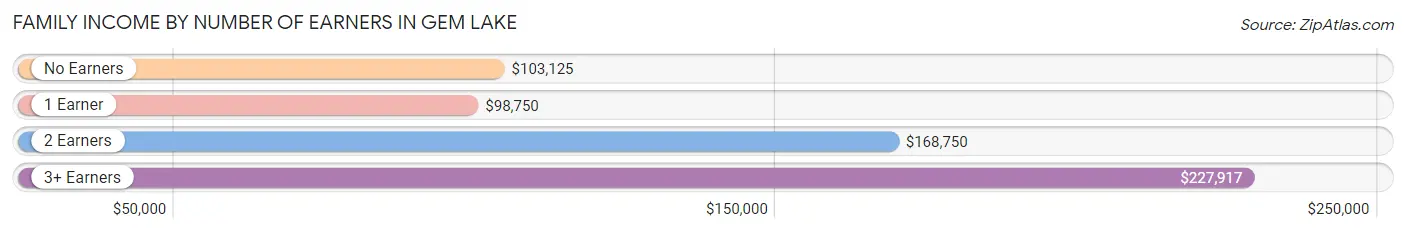
| Number of Earners | # Families | Median Income |
| No Earners | 15 (10.5%) | $103,125 |
| 1 Earner | 35 (24.5%) | $98,750 |
| 2 Earners | 78 (54.5%) | $168,750 |
| 3+ Earners | 15 (10.5%) | $227,917 |
| Total | 143 (100.0%) | $146,250 |
Household Income in Gem Lake
Household Income Brackets in Gem Lake
With 46 households falling in the category, the $200,000+ income range is the most frequent in Gem Lake, accounting for 26.3% of all households.
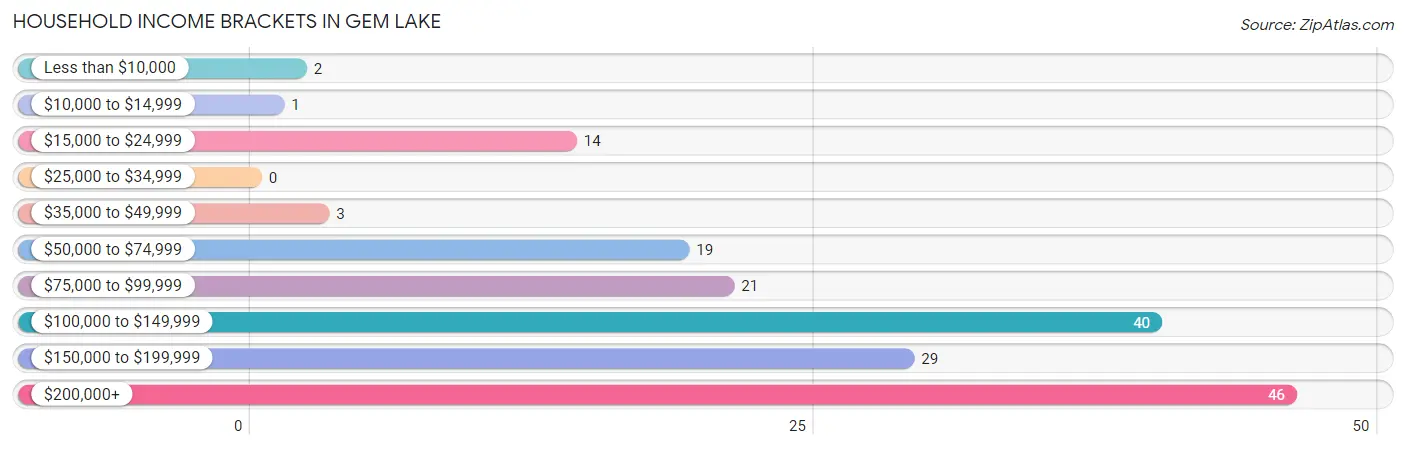
| Income Bracket | # Households | % Households |
| Less than $10,000 | 2 | 1.1% |
| $10,000 to $14,999 | 1 | 0.6% |
| $15,000 to $24,999 | 14 | 8.0% |
| $25,000 to $34,999 | 0 | 0.0% |
| $35,000 to $49,999 | 3 | 1.7% |
| $50,000 to $74,999 | 19 | 10.9% |
| $75,000 to $99,999 | 21 | 12.0% |
| $100,000 to $149,999 | 40 | 22.9% |
| $150,000 to $199,999 | 29 | 16.6% |
| $200,000+ | 46 | 26.3% |
Household Income by Householder Age in Gem Lake
The median household income in Gem Lake is $129,583, with the highest median household income of $180,208 found in the 25 to 44 years age bracket for the primary householder. A total of 49 households (28.0%) fall into this category.
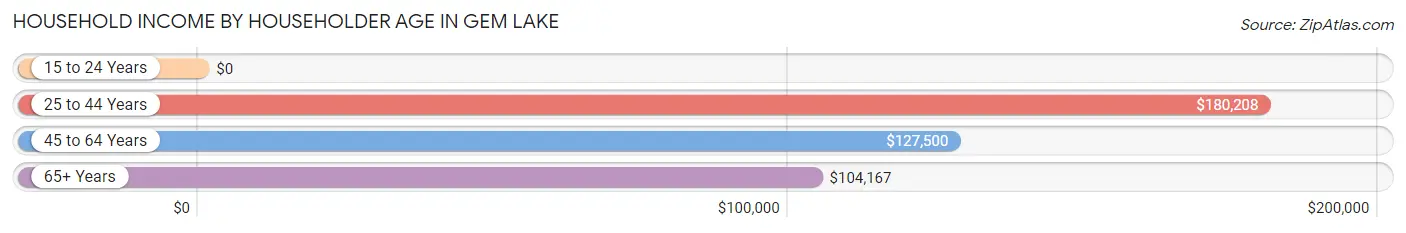
| Income Bracket | # Households | Median Income |
| 15 to 24 Years | 0 (0.0%) | $0 |
| 25 to 44 Years | 49 (28.0%) | $180,208 |
| 45 to 64 Years | 66 (37.7%) | $127,500 |
| 65+ Years | 60 (34.3%) | $104,167 |
| Total | 175 (100.0%) | $129,583 |
Poverty in Gem Lake
Income Below Poverty by Sex and Age in Gem Lake
With 2.2% poverty level for males and 3.6% for females among the residents of Gem Lake, 18 to 24 year old males and 18 to 24 year old females are the most vulnerable to poverty, with 3 males (30.0%) and 2 females (40.0%) in their respective age groups living below the poverty level.
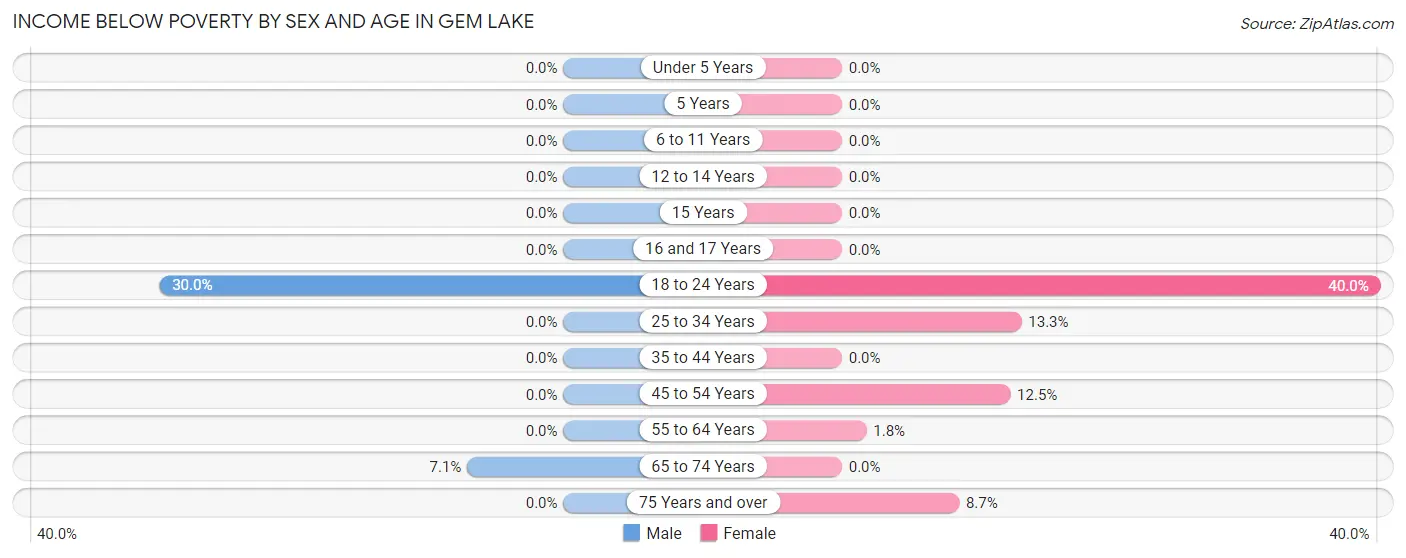
| Age Bracket | Male | Female |
| Under 5 Years | 0 (0.0%) | 0 (0.0%) |
| 5 Years | 0 (0.0%) | 0 (0.0%) |
| 6 to 11 Years | 0 (0.0%) | 0 (0.0%) |
| 12 to 14 Years | 0 (0.0%) | 0 (0.0%) |
| 15 Years | 0 (0.0%) | 0 (0.0%) |
| 16 and 17 Years | 0 (0.0%) | 0 (0.0%) |
| 18 to 24 Years | 3 (30.0%) | 2 (40.0%) |
| 25 to 34 Years | 0 (0.0%) | 2 (13.3%) |
| 35 to 44 Years | 0 (0.0%) | 0 (0.0%) |
| 45 to 54 Years | 0 (0.0%) | 2 (12.5%) |
| 55 to 64 Years | 0 (0.0%) | 1 (1.8%) |
| 65 to 74 Years | 2 (7.1%) | 0 (0.0%) |
| 75 Years and over | 0 (0.0%) | 2 (8.7%) |
| Total | 5 (2.2%) | 9 (3.6%) |
Income Above Poverty by Sex and Age in Gem Lake
According to the poverty statistics in Gem Lake, males aged under 5 years and females aged under 5 years are the age groups that are most secure financially, with 100.0% of males and 100.0% of females in these age groups living above the poverty line.
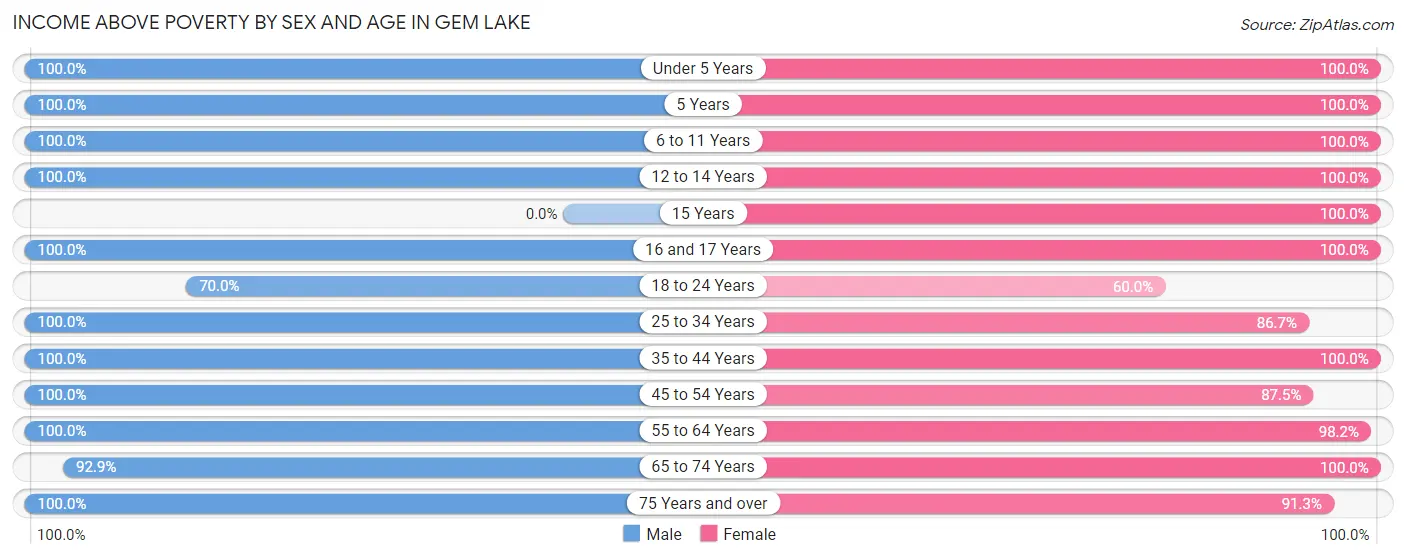
| Age Bracket | Male | Female |
| Under 5 Years | 12 (100.0%) | 30 (100.0%) |
| 5 Years | 3 (100.0%) | 10 (100.0%) |
| 6 to 11 Years | 12 (100.0%) | 32 (100.0%) |
| 12 to 14 Years | 10 (100.0%) | 3 (100.0%) |
| 15 Years | 0 (0.0%) | 4 (100.0%) |
| 16 and 17 Years | 4 (100.0%) | 4 (100.0%) |
| 18 to 24 Years | 7 (70.0%) | 3 (60.0%) |
| 25 to 34 Years | 13 (100.0%) | 13 (86.7%) |
| 35 to 44 Years | 40 (100.0%) | 39 (100.0%) |
| 45 to 54 Years | 9 (100.0%) | 14 (87.5%) |
| 55 to 64 Years | 52 (100.0%) | 54 (98.2%) |
| 65 to 74 Years | 26 (92.9%) | 17 (100.0%) |
| 75 Years and over | 29 (100.0%) | 21 (91.3%) |
| Total | 217 (97.8%) | 244 (96.4%) |
Income Below Poverty Among Married-Couple Families in Gem Lake
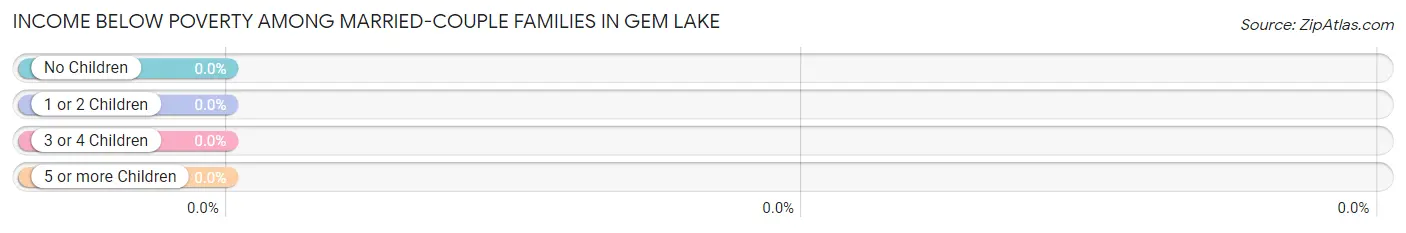
| Children | Above Poverty | Below Poverty |
| No Children | 79 (100.0%) | 0 (0.0%) |
| 1 or 2 Children | 37 (100.0%) | 0 (0.0%) |
| 3 or 4 Children | 19 (100.0%) | 0 (0.0%) |
| 5 or more Children | 0 (0.0%) | 0 (0.0%) |
| Total | 135 (100.0%) | 0 (0.0%) |
Income Below Poverty Among Single-Parent Households in Gem Lake
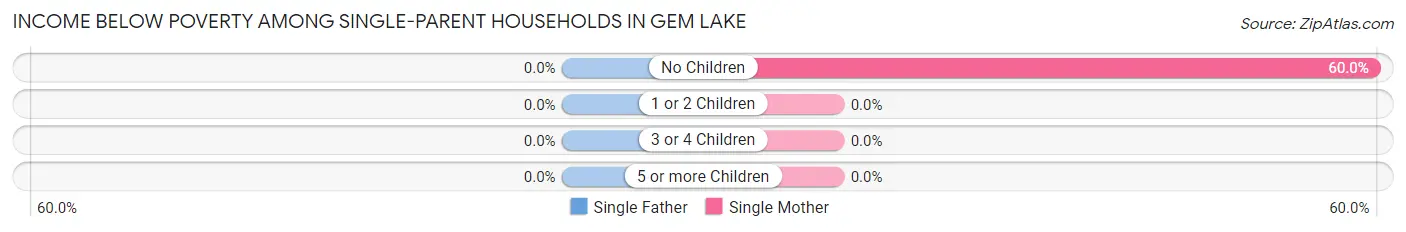
| Children | Single Father | Single Mother |
| No Children | 0 (0.0%) | 3 (60.0%) |
| 1 or 2 Children | 0 (0.0%) | 0 (0.0%) |
| 3 or 4 Children | 0 (0.0%) | 0 (0.0%) |
| 5 or more Children | 0 (0.0%) | 0 (0.0%) |
| Total | 0 (0.0%) | 3 (50.0%) |
Income Below Poverty Among Married-Couple vs Single-Parent Households in Gem Lake
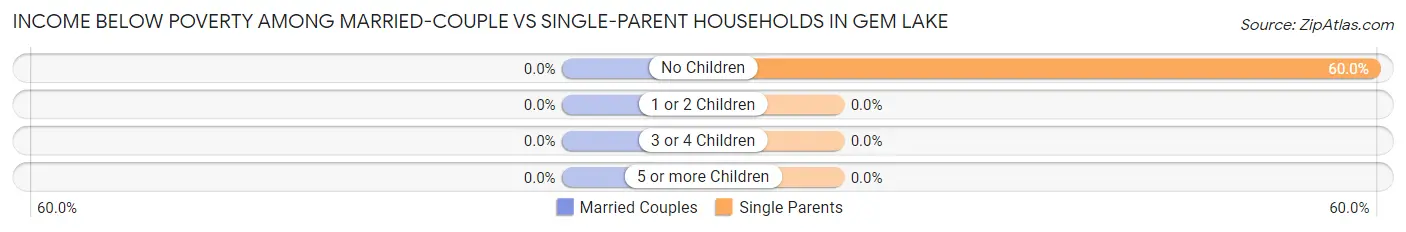
| Children | Married-Couple Families | Single-Parent Households |
| No Children | 0 (0.0%) | 3 (60.0%) |
| 1 or 2 Children | 0 (0.0%) | 0 (0.0%) |
| 3 or 4 Children | 0 (0.0%) | 0 (0.0%) |
| 5 or more Children | 0 (0.0%) | 0 (0.0%) |
| Total | 0 (0.0%) | 3 (37.5%) |
Race in Gem Lake
The most populous races in Gem Lake are White / Caucasian (441 | 92.8%), Two or more Races (23 | 4.8%), and Asian (11 | 2.3%).
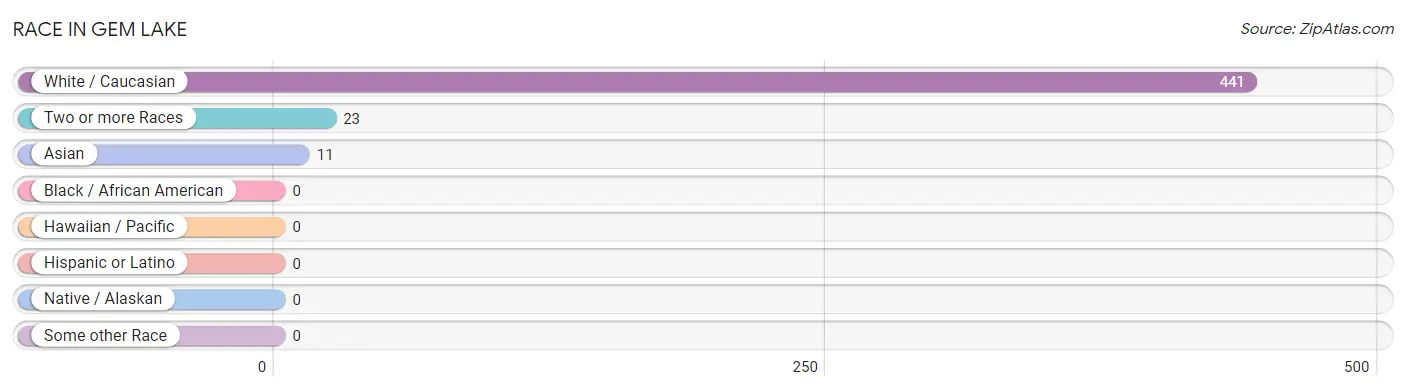
| Race | # Population | % Population |
| Asian | 11 | 2.3% |
| Black / African American | 0 | 0.0% |
| Hawaiian / Pacific | 0 | 0.0% |
| Hispanic or Latino | 0 | 0.0% |
| Native / Alaskan | 0 | 0.0% |
| White / Caucasian | 441 | 92.8% |
| Two or more Races | 23 | 4.8% |
| Some other Race | 0 | 0.0% |
| Total | 475 | 100.0% |
Ancestry in Gem Lake
The most populous ancestries reported in Gem Lake are German (163 | 34.3%), Norwegian (63 | 13.3%), Irish (60 | 12.6%), Swedish (55 | 11.6%), and European (27 | 5.7%), together accounting for 77.5% of all Gem Lake residents.
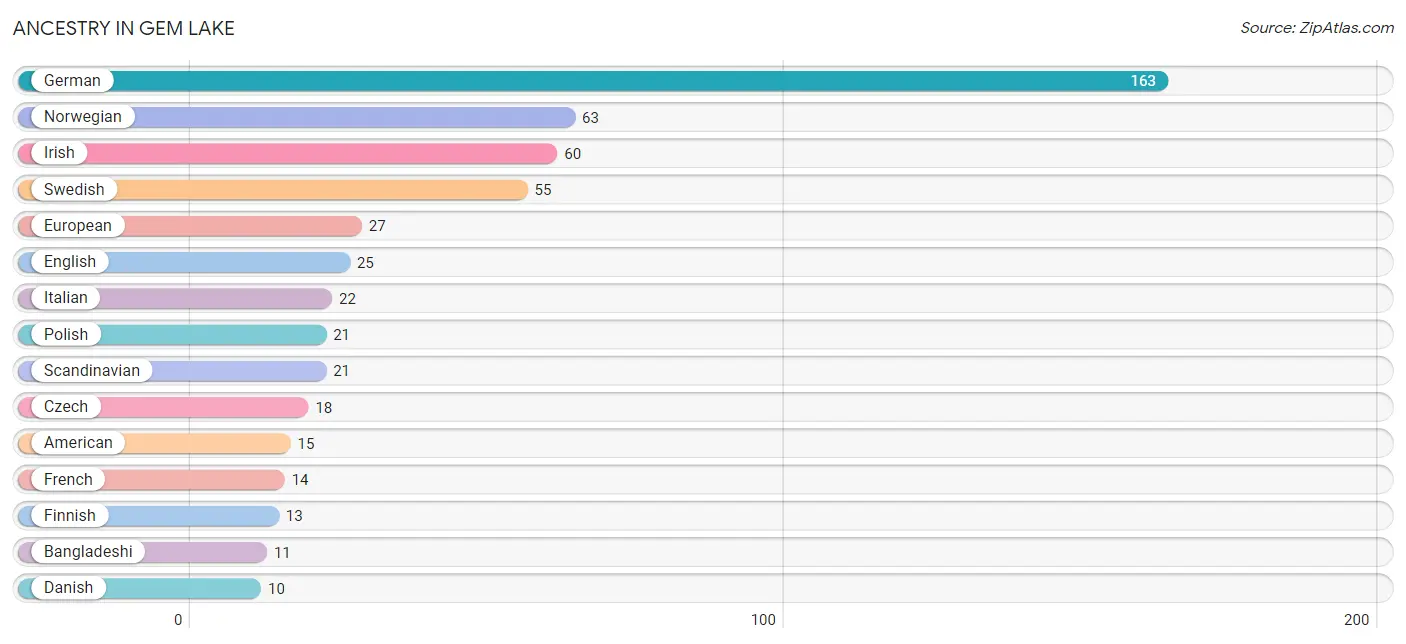
| Ancestry | # Population | % Population |
| American | 15 | 3.2% |
| Arab | 1 | 0.2% |
| Austrian | 3 | 0.6% |
| Bangladeshi | 11 | 2.3% |
| Croatian | 1 | 0.2% |
| Czech | 18 | 3.8% |
| Danish | 10 | 2.1% |
| Dutch | 8 | 1.7% |
| English | 25 | 5.3% |
| European | 27 | 5.7% |
| Finnish | 13 | 2.7% |
| French | 14 | 2.9% |
| French Canadian | 2 | 0.4% |
| German | 163 | 34.3% |
| Icelander | 2 | 0.4% |
| Irish | 60 | 12.6% |
| Italian | 22 | 4.6% |
| Lithuanian | 4 | 0.8% |
| Luxembourger | 2 | 0.4% |
| Norwegian | 63 | 13.3% |
| Polish | 21 | 4.4% |
| Romanian | 2 | 0.4% |
| Scandinavian | 21 | 4.4% |
| Scotch-Irish | 4 | 0.8% |
| Scottish | 1 | 0.2% |
| Sioux | 1 | 0.2% |
| Sri Lankan | 10 | 2.1% |
| Swedish | 55 | 11.6% |
| Welsh | 1 | 0.2% | View All 29 Rows |
Immigrants in Gem Lake
The most numerous immigrant groups reported in Gem Lake came from Asia (4 | 0.8%), Laos (4 | 0.8%), and South Eastern Asia (4 | 0.8%), together accounting for 2.5% of all Gem Lake residents.
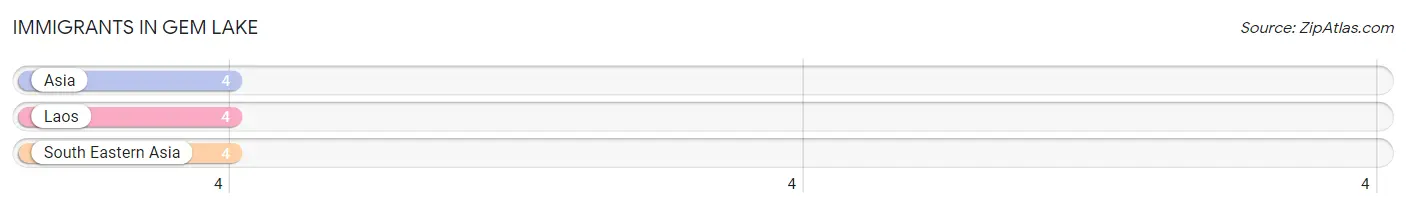
| Immigration Origin | # Population | % Population |
| Asia | 4 | 0.8% |
| Laos | 4 | 0.8% |
| South Eastern Asia | 4 | 0.8% | View All 3 Rows |
Sex and Age in Gem Lake
Sex and Age in Gem Lake
The most populous age groups in Gem Lake are 60 to 64 Years (37 | 16.7%) for men and 5 to 9 Years (39 | 15.4%) for women.
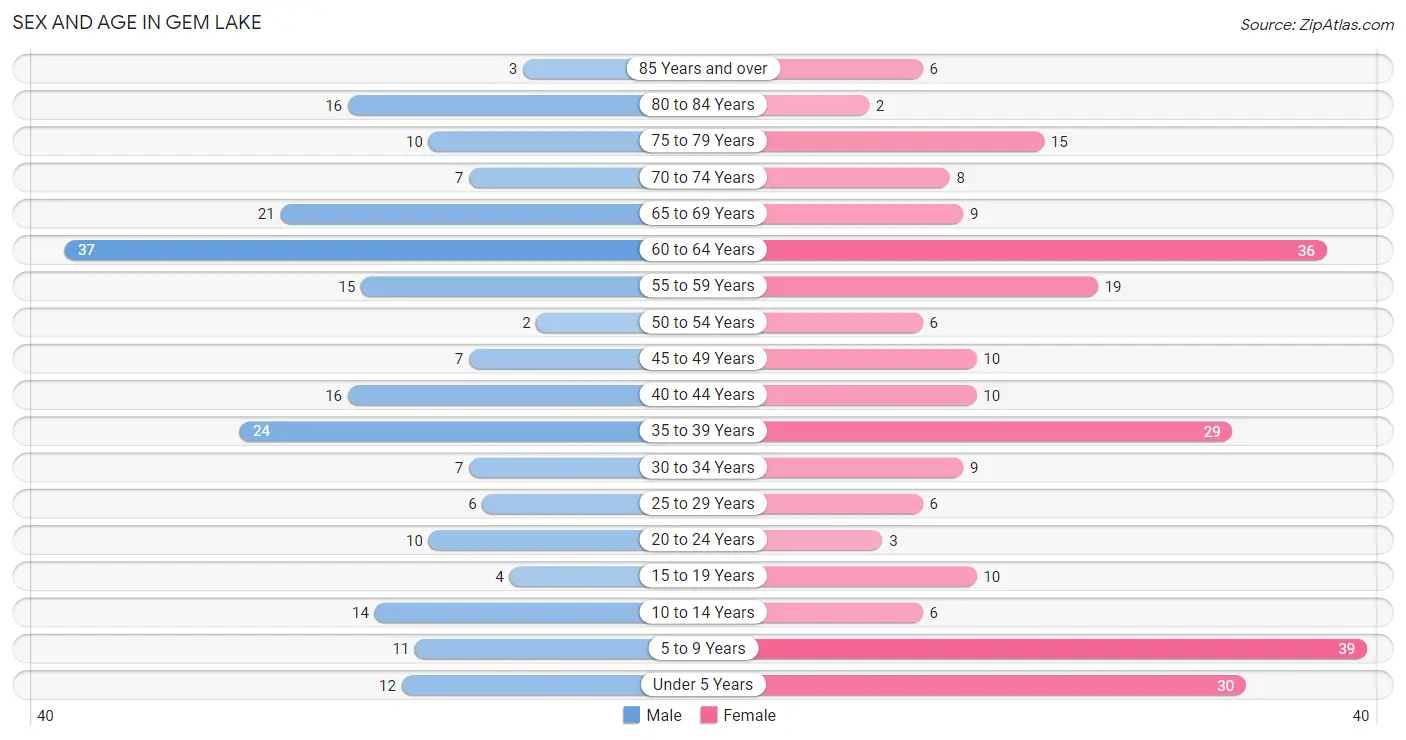
| Age Bracket | Male | Female |
| Under 5 Years | 12 (5.4%) | 30 (11.9%) |
| 5 to 9 Years | 11 (5.0%) | 39 (15.4%) |
| 10 to 14 Years | 14 (6.3%) | 6 (2.4%) |
| 15 to 19 Years | 4 (1.8%) | 10 (4.0%) |
| 20 to 24 Years | 10 (4.5%) | 3 (1.2%) |
| 25 to 29 Years | 6 (2.7%) | 6 (2.4%) |
| 30 to 34 Years | 7 (3.2%) | 9 (3.6%) |
| 35 to 39 Years | 24 (10.8%) | 29 (11.5%) |
| 40 to 44 Years | 16 (7.2%) | 10 (4.0%) |
| 45 to 49 Years | 7 (3.2%) | 10 (4.0%) |
| 50 to 54 Years | 2 (0.9%) | 6 (2.4%) |
| 55 to 59 Years | 15 (6.8%) | 19 (7.5%) |
| 60 to 64 Years | 37 (16.7%) | 36 (14.2%) |
| 65 to 69 Years | 21 (9.5%) | 9 (3.6%) |
| 70 to 74 Years | 7 (3.2%) | 8 (3.2%) |
| 75 to 79 Years | 10 (4.5%) | 15 (5.9%) |
| 80 to 84 Years | 16 (7.2%) | 2 (0.8%) |
| 85 Years and over | 3 (1.3%) | 6 (2.4%) |
| Total | 222 (100.0%) | 253 (100.0%) |
Families and Households in Gem Lake
Median Family Size in Gem Lake
The median family size in Gem Lake is 3.03 persons per family, with married-couple families (135 | 94.4%) accounting for the largest median family size of 3.07 persons per family. On the other hand, single female/mother families (6 | 4.2%) represent the smallest median family size with 2.33 persons per family.
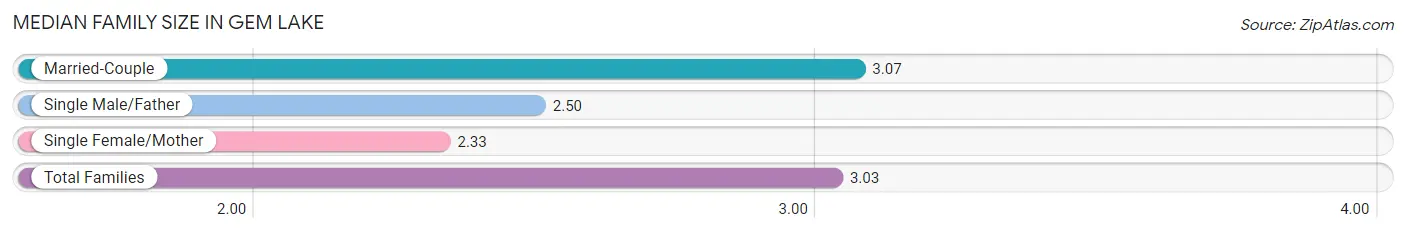
| Family Type | # Families | Family Size |
| Married-Couple | 135 (94.4%) | 3.07 |
| Single Male/Father | 2 (1.4%) | 2.50 |
| Single Female/Mother | 6 (4.2%) | 2.33 |
| Total Families | 143 (100.0%) | 3.03 |
Median Household Size in Gem Lake
The median household size in Gem Lake is 2.71 persons per household, with single male/father households (2 | 1.1%) accounting for the largest median household size of 4 persons per household. non-family households (32 | 18.3%) represent the smallest median household size with 1.13 persons per household.
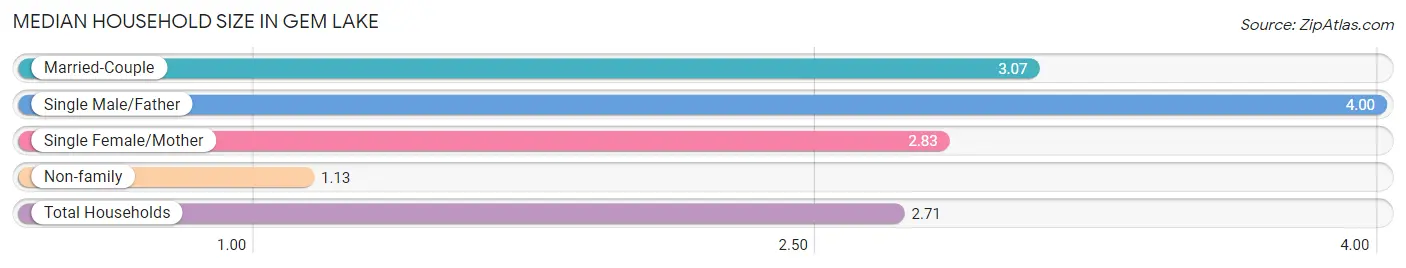
| Household Type | # Households | Household Size |
| Married-Couple | 135 (77.1%) | 3.07 |
| Single Male/Father | 2 (1.1%) | 4.00 |
| Single Female/Mother | 6 (3.4%) | 2.83 |
| Non-family | 32 (18.3%) | 1.13 |
| Total Households | 175 (100.0%) | 2.71 |
Household Size by Marriage Status in Gem Lake
Out of a total of 175 households in Gem Lake, 143 (81.7%) are family households, while 32 (18.3%) are nonfamily households. The most numerous type of family households are 2-person households, comprising 74, and the most common type of nonfamily households are 1-person households, comprising 29.
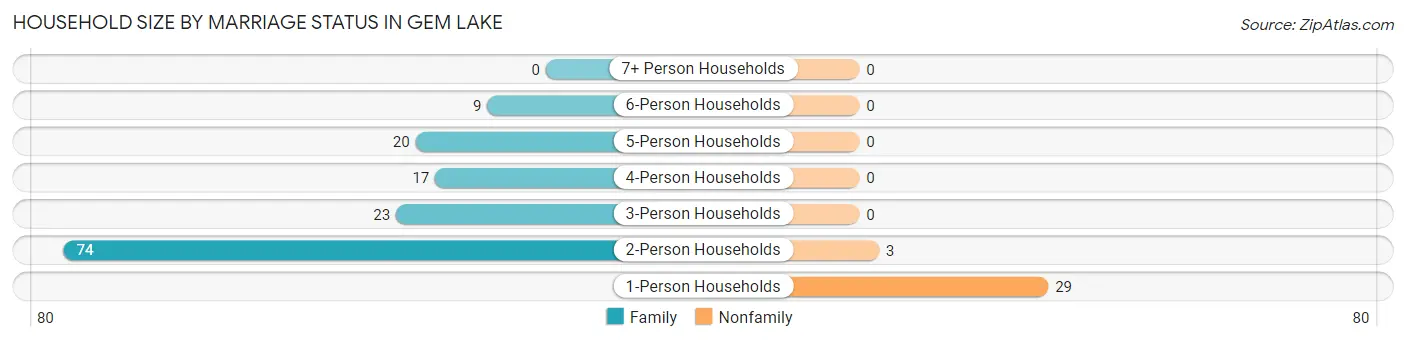
| Household Size | Family Households | Nonfamily Households |
| 1-Person Households | - | 29 (16.6%) |
| 2-Person Households | 74 (42.3%) | 3 (1.7%) |
| 3-Person Households | 23 (13.1%) | 0 (0.0%) |
| 4-Person Households | 17 (9.7%) | 0 (0.0%) |
| 5-Person Households | 20 (11.4%) | 0 (0.0%) |
| 6-Person Households | 9 (5.1%) | 0 (0.0%) |
| 7+ Person Households | 0 (0.0%) | 0 (0.0%) |
| Total | 143 (81.7%) | 32 (18.3%) |
Female Fertility in Gem Lake
Fertility by Age in Gem Lake
Average fertility rate in Gem Lake is 65.0 births per 1,000 women. Women in the age bracket of 35 to 50 years have the highest fertility rate with 102.0 births per 1,000 women. Women in the age bracket of 35 to 50 years acount for 100.0% of all women with births.
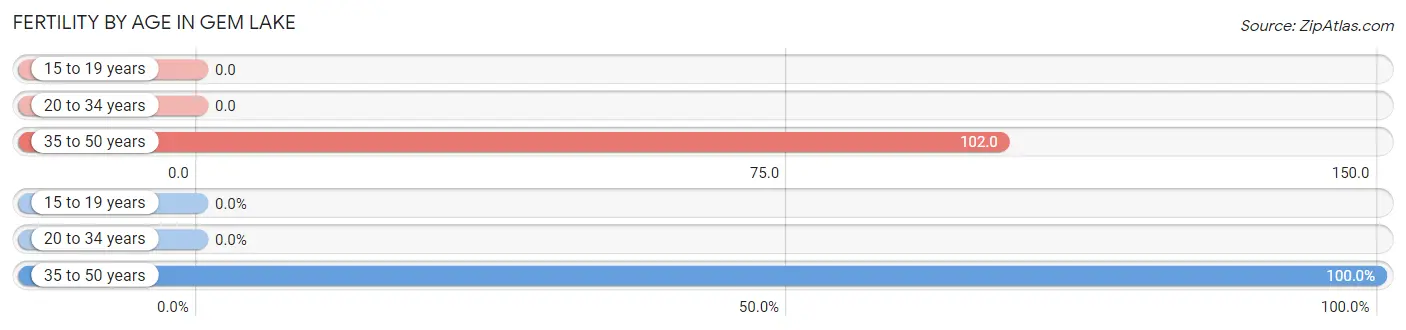
| Age Bracket | Women with Births | Births / 1,000 Women |
| 15 to 19 years | 0 (0.0%) | 0.0 |
| 20 to 34 years | 0 (0.0%) | 0.0 |
| 35 to 50 years | 5 (100.0%) | 102.0 |
| Total | 5 (100.0%) | 65.0 |
Fertility by Age by Marriage Status in Gem Lake
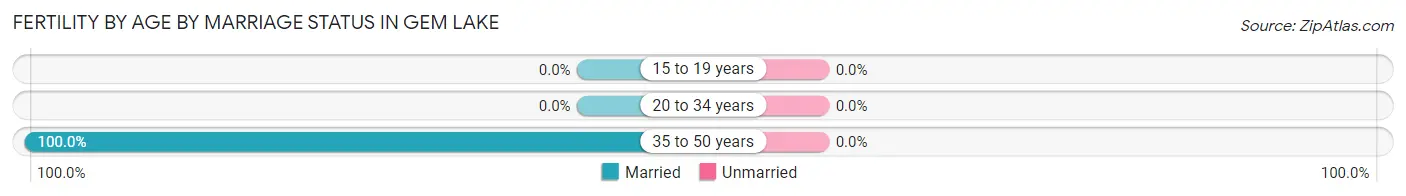
| Age Bracket | Married | Unmarried |
| 15 to 19 years | 0 (0.0%) | 0 (0.0%) |
| 20 to 34 years | 0 (0.0%) | 0 (0.0%) |
| 35 to 50 years | 5 (100.0%) | 0 (0.0%) |
| Total | 5 (100.0%) | 0 (0.0%) |
Fertility by Education in Gem Lake
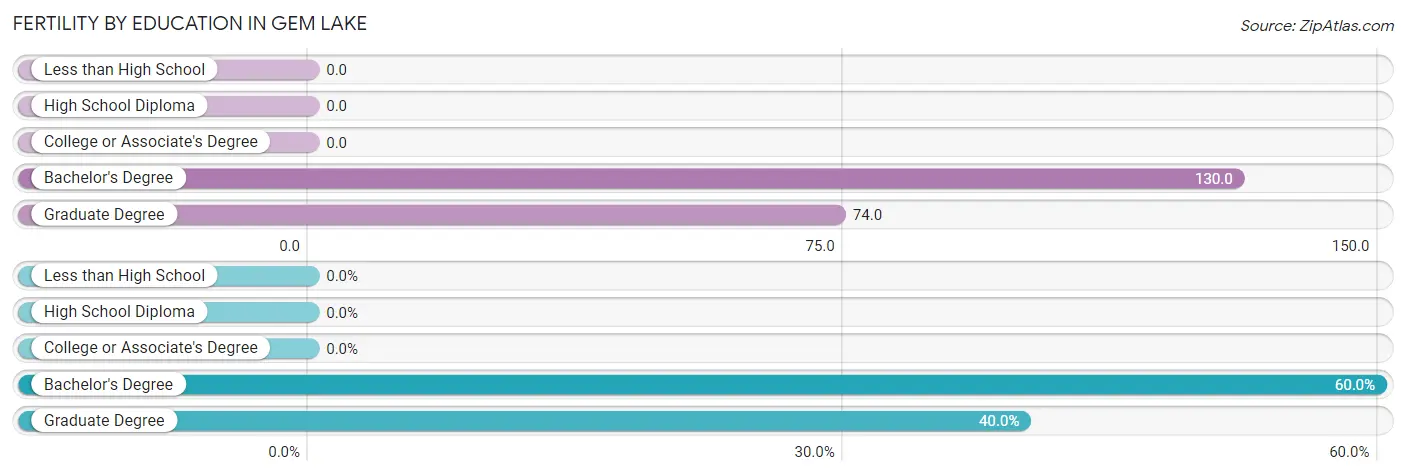
| Educational Attainment | Women with Births | Births / 1,000 Women |
| Less than High School | 0 (0.0%) | 0.0 |
| High School Diploma | 0 (0.0%) | 0.0 |
| College or Associate's Degree | 0 (0.0%) | 0.0 |
| Bachelor's Degree | 3 (60.0%) | 130.0 |
| Graduate Degree | 2 (40.0%) | 74.0 |
| Total | 5 (100.0%) | 65.0 |
Fertility by Education by Marriage Status in Gem Lake
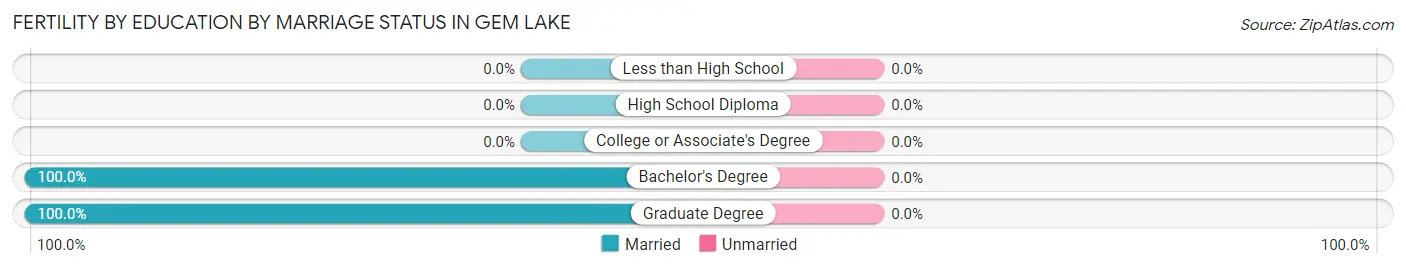
| Educational Attainment | Married | Unmarried |
| Less than High School | 0 (0.0%) | 0 (0.0%) |
| High School Diploma | 0 (0.0%) | 0 (0.0%) |
| College or Associate's Degree | 0 (0.0%) | 0 (0.0%) |
| Bachelor's Degree | 3 (100.0%) | 0 (0.0%) |
| Graduate Degree | 2 (100.0%) | 0 (0.0%) |
| Total | 5 (100.0%) | 0 (0.0%) |
Employment Characteristics in Gem Lake
Employment by Class of Employer in Gem Lake
Among the 232 employed individuals in Gem Lake, private company employees (151 | 65.1%), self-employed (incorporated) (33 | 14.2%), and not-for-profit organizations (20 | 8.6%) make up the most common classes of employment.
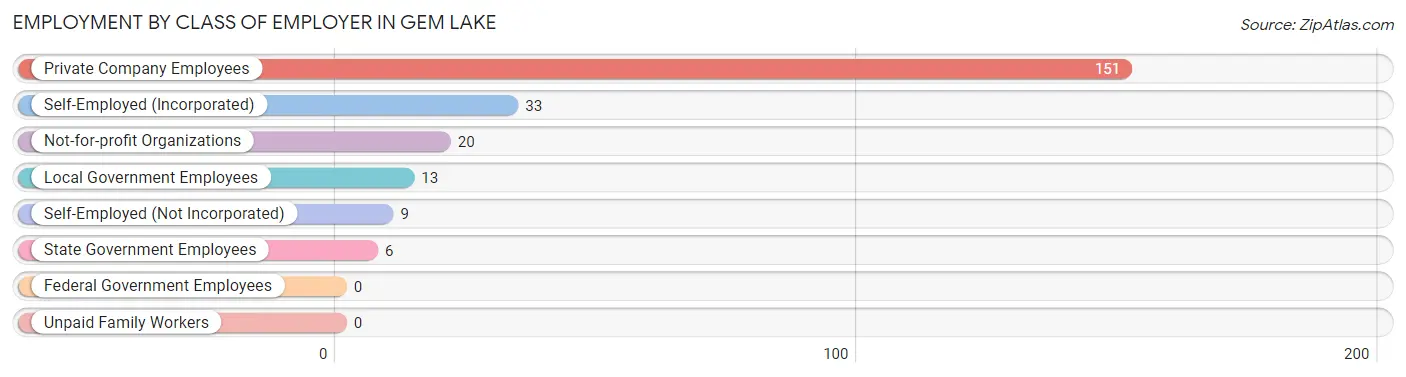
| Employer Class | # Employees | % Employees |
| Private Company Employees | 151 | 65.1% |
| Self-Employed (Incorporated) | 33 | 14.2% |
| Self-Employed (Not Incorporated) | 9 | 3.9% |
| Not-for-profit Organizations | 20 | 8.6% |
| Local Government Employees | 13 | 5.6% |
| State Government Employees | 6 | 2.6% |
| Federal Government Employees | 0 | 0.0% |
| Unpaid Family Workers | 0 | 0.0% |
| Total | 232 | 100.0% |
Employment Status by Age in Gem Lake
According to the labor force statistics for Gem Lake, out of the total population over 16 years of age (359), 67.1% or 241 individuals are in the labor force, with 0.8% or 2 of them unemployed. The age group with the highest labor force participation rate is 55 to 59 years, with 100.0% or 34 individuals in the labor force. Within the labor force, the 20 to 24 years age range has the highest percentage of unemployed individuals, with 9.1% or 1 of them being unemployed.
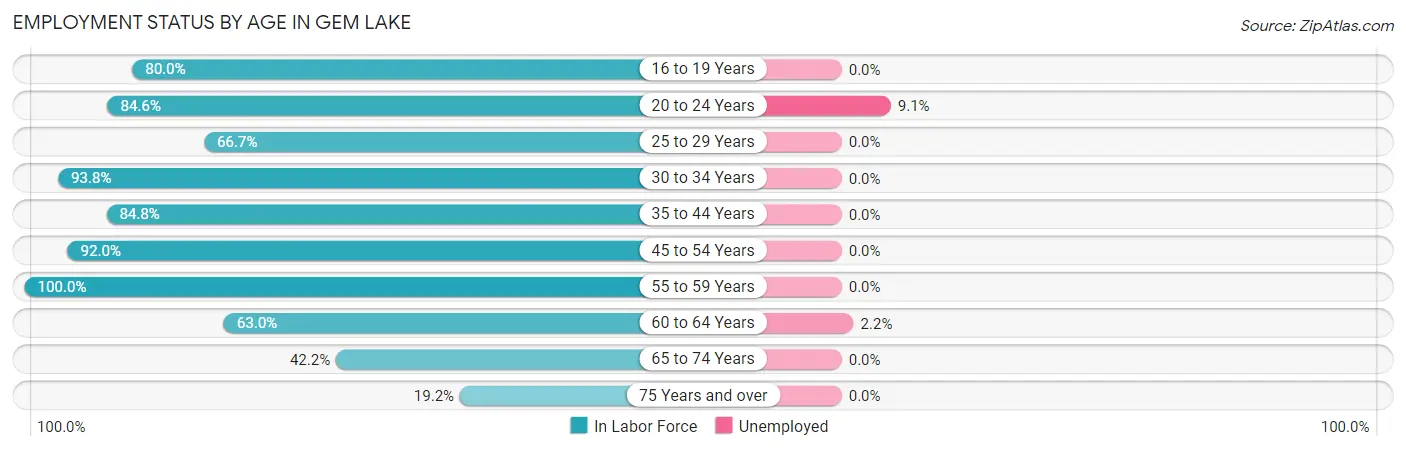
| Age Bracket | In Labor Force | Unemployed |
| 16 to 19 Years | 8 (80.0%) | 0 (0.0%) |
| 20 to 24 Years | 11 (84.6%) | 1 (9.1%) |
| 25 to 29 Years | 8 (66.7%) | 0 (0.0%) |
| 30 to 34 Years | 15 (93.8%) | 0 (0.0%) |
| 35 to 44 Years | 67 (84.8%) | 0 (0.0%) |
| 45 to 54 Years | 23 (92.0%) | 0 (0.0%) |
| 55 to 59 Years | 34 (100.0%) | 0 (0.0%) |
| 60 to 64 Years | 46 (63.0%) | 1 (2.2%) |
| 65 to 74 Years | 19 (42.2%) | 0 (0.0%) |
| 75 Years and over | 10 (19.2%) | 0 (0.0%) |
| Total | 241 (67.1%) | 2 (0.8%) |
Employment Status by Educational Attainment in Gem Lake
According to labor force statistics for Gem Lake, 80.8% of individuals (193) out of the total population between 25 and 64 years of age (239) are in the labor force, with 0.5% or 1 of them being unemployed. The group with the highest labor force participation rate are those with the educational attainment of less than high school, with 100.0% or 3 individuals in the labor force. Within the labor force, individuals with college / associate degree education have the highest percentage of unemployment, with 2.3% or 1 of them being unemployed.
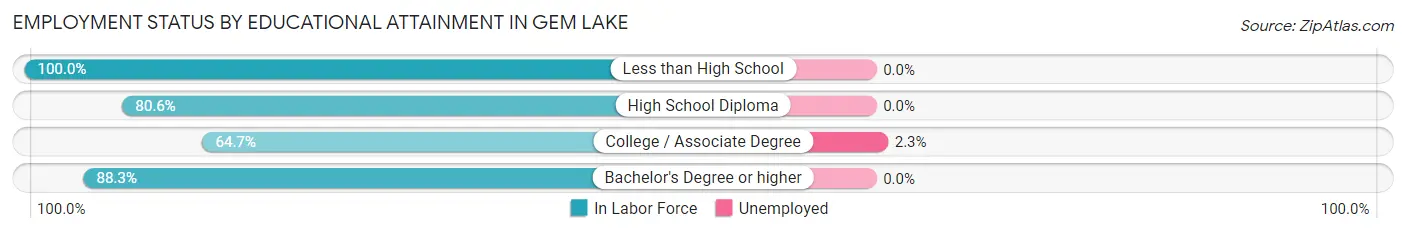
| Educational Attainment | In Labor Force | Unemployed |
| Less than High School | 3 (100.0%) | 0 (0.0%) |
| High School Diploma | 25 (80.6%) | 0 (0.0%) |
| College / Associate Degree | 44 (64.7%) | 2 (2.3%) |
| Bachelor's Degree or higher | 121 (88.3%) | 0 (0.0%) |
| Total | 193 (80.8%) | 1 (0.5%) |
Employment Occupations by Sex in Gem Lake
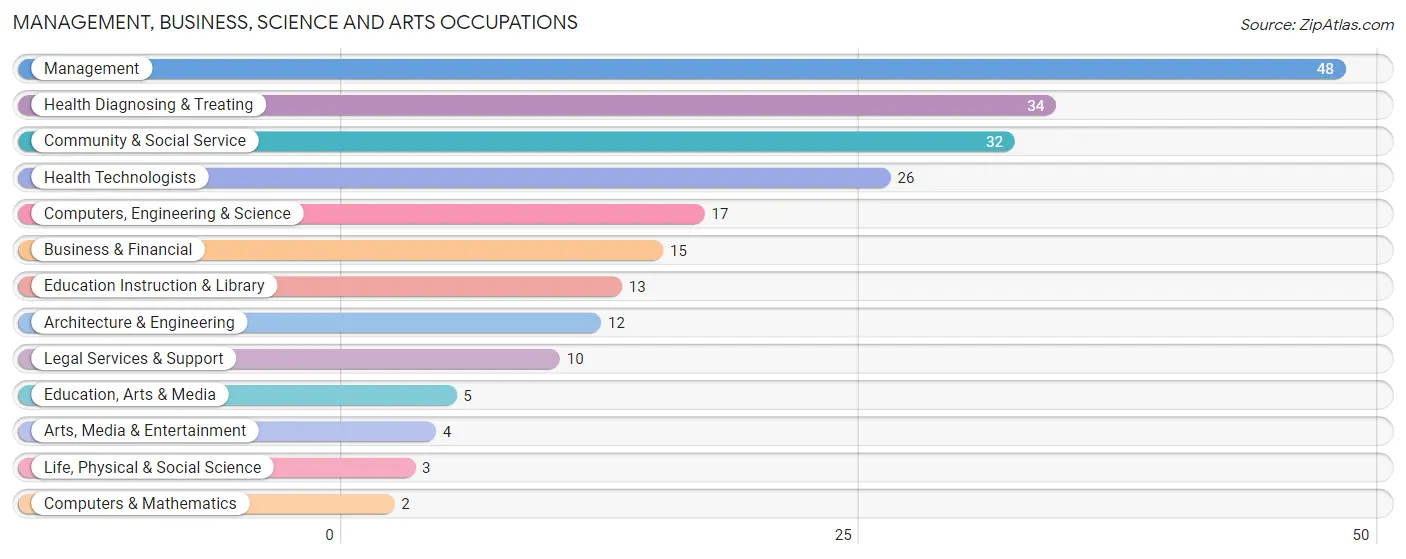
Management, Business, Science and Arts Occupations
The most common Management, Business, Science and Arts occupations in Gem Lake are Management (48 | 20.1%), Health Diagnosing & Treating (34 | 14.2%), Community & Social Service (32 | 13.4%), Health Technologists (26 | 10.9%), and Computers, Engineering & Science (17 | 7.1%).
Management, Business, Science and Arts Occupations by Sex
Within the Management, Business, Science and Arts occupations in Gem Lake, the most male-oriented occupations are Computers & Mathematics (100.0%), Architecture & Engineering (100.0%), and Computers, Engineering & Science (82.4%), while the most female-oriented occupations are Life, Physical & Social Science (100.0%), Education, Arts & Media (100.0%), and Health Diagnosing & Treating (76.5%).
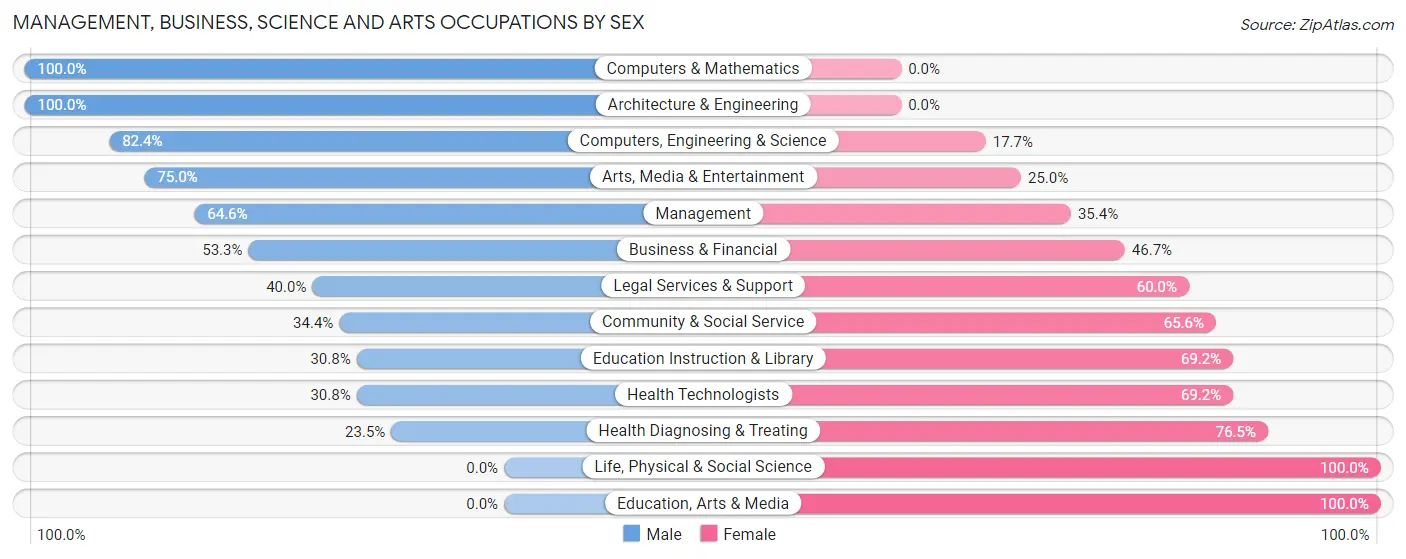
| Occupation | Male | Female |
| Management | 31 (64.6%) | 17 (35.4%) |
| Business & Financial | 8 (53.3%) | 7 (46.7%) |
| Computers, Engineering & Science | 14 (82.4%) | 3 (17.6%) |
| Computers & Mathematics | 2 (100.0%) | 0 (0.0%) |
| Architecture & Engineering | 12 (100.0%) | 0 (0.0%) |
| Life, Physical & Social Science | 0 (0.0%) | 3 (100.0%) |
| Community & Social Service | 11 (34.4%) | 21 (65.6%) |
| Education, Arts & Media | 0 (0.0%) | 5 (100.0%) |
| Legal Services & Support | 4 (40.0%) | 6 (60.0%) |
| Education Instruction & Library | 4 (30.8%) | 9 (69.2%) |
| Arts, Media & Entertainment | 3 (75.0%) | 1 (25.0%) |
| Health Diagnosing & Treating | 8 (23.5%) | 26 (76.5%) |
| Health Technologists | 8 (30.8%) | 18 (69.2%) |
| Total (Category) | 72 (49.3%) | 74 (50.7%) |
| Total (Overall) | 133 (55.6%) | 106 (44.4%) |
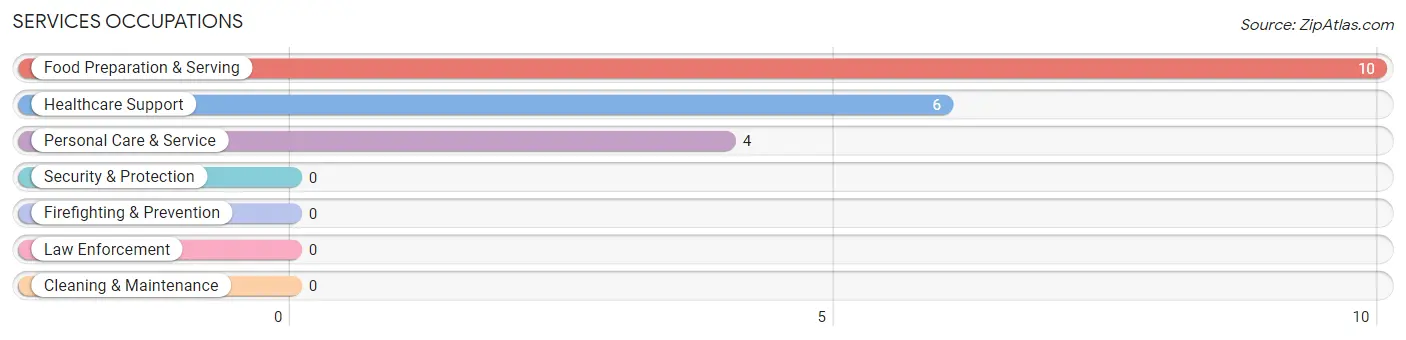
Services Occupations
The most common Services occupations in Gem Lake are Food Preparation & Serving (10 | 4.2%), Healthcare Support (6 | 2.5%), and Personal Care & Service (4 | 1.7%).
Services Occupations by Sex
Within the Services occupations in Gem Lake, the most male-oriented occupations are Food Preparation & Serving (70.0%), and Healthcare Support (50.0%), while the most female-oriented occupations are Personal Care & Service (100.0%), Healthcare Support (50.0%), and Food Preparation & Serving (30.0%).
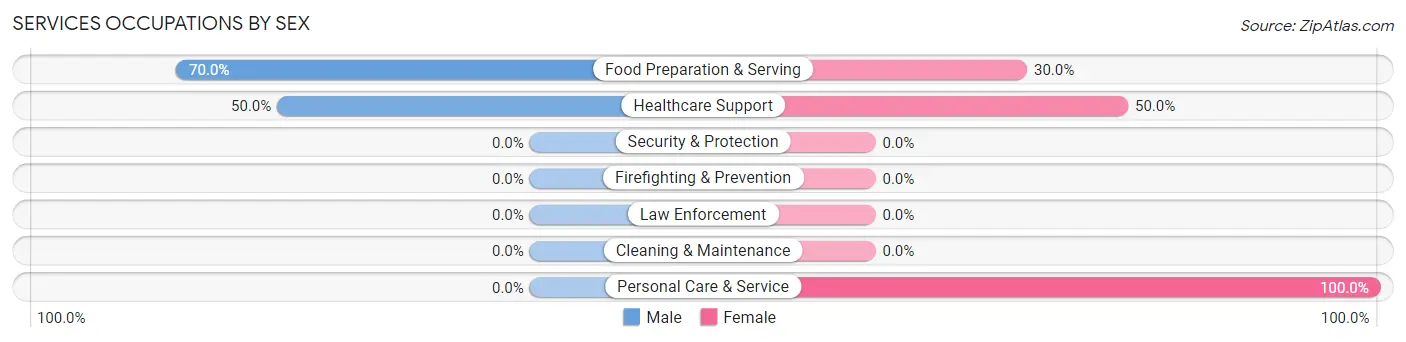
| Occupation | Male | Female |
| Healthcare Support | 3 (50.0%) | 3 (50.0%) |
| Security & Protection | 0 (0.0%) | 0 (0.0%) |
| Firefighting & Prevention | 0 (0.0%) | 0 (0.0%) |
| Law Enforcement | 0 (0.0%) | 0 (0.0%) |
| Food Preparation & Serving | 7 (70.0%) | 3 (30.0%) |
| Cleaning & Maintenance | 0 (0.0%) | 0 (0.0%) |
| Personal Care & Service | 0 (0.0%) | 4 (100.0%) |
| Total (Category) | 10 (50.0%) | 10 (50.0%) |
| Total (Overall) | 133 (55.6%) | 106 (44.4%) |
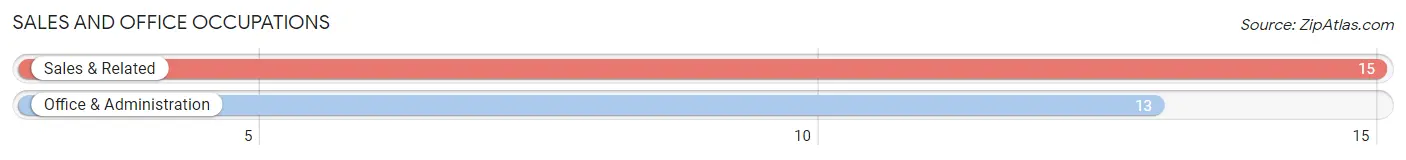
Sales and Office Occupations
The most common Sales and Office occupations in Gem Lake are Sales & Related (15 | 6.3%), and Office & Administration (13 | 5.4%).
Sales and Office Occupations by Sex
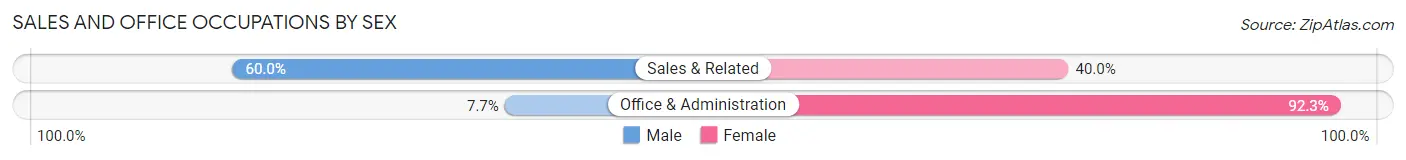
| Occupation | Male | Female |
| Sales & Related | 9 (60.0%) | 6 (40.0%) |
| Office & Administration | 1 (7.7%) | 12 (92.3%) |
| Total (Category) | 10 (35.7%) | 18 (64.3%) |
| Total (Overall) | 133 (55.6%) | 106 (44.4%) |
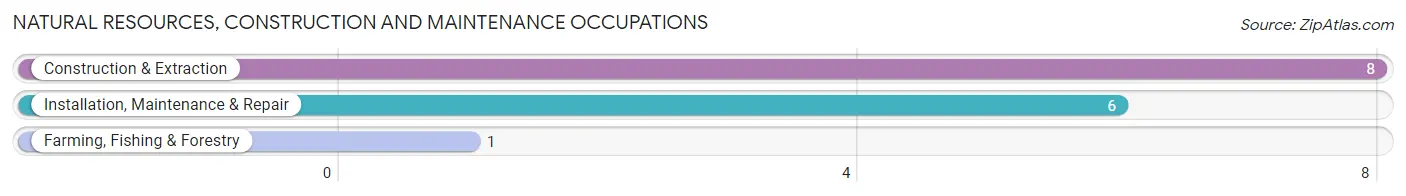
Natural Resources, Construction and Maintenance Occupations
The most common Natural Resources, Construction and Maintenance occupations in Gem Lake are Construction & Extraction (8 | 3.4%), Installation, Maintenance & Repair (6 | 2.5%), and Farming, Fishing & Forestry (1 | 0.4%).
Natural Resources, Construction and Maintenance Occupations by Sex
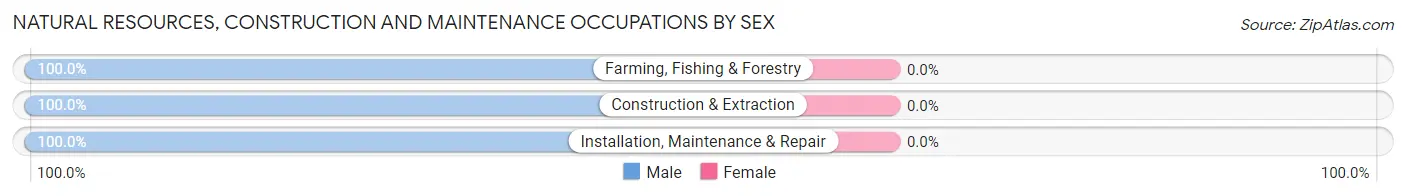
| Occupation | Male | Female |
| Farming, Fishing & Forestry | 1 (100.0%) | 0 (0.0%) |
| Construction & Extraction | 8 (100.0%) | 0 (0.0%) |
| Installation, Maintenance & Repair | 6 (100.0%) | 0 (0.0%) |
| Total (Category) | 15 (100.0%) | 0 (0.0%) |
| Total (Overall) | 133 (55.6%) | 106 (44.4%) |
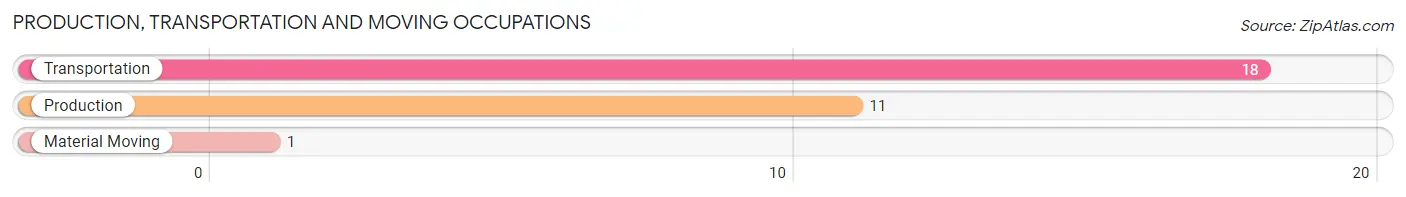
Production, Transportation and Moving Occupations
The most common Production, Transportation and Moving occupations in Gem Lake are Transportation (18 | 7.5%), Production (11 | 4.6%), and Material Moving (1 | 0.4%).
Production, Transportation and Moving Occupations by Sex
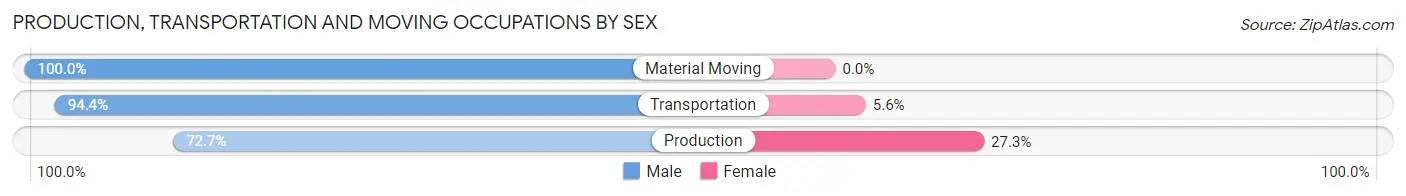
| Occupation | Male | Female |
| Production | 8 (72.7%) | 3 (27.3%) |
| Transportation | 17 (94.4%) | 1 (5.6%) |
| Material Moving | 1 (100.0%) | 0 (0.0%) |
| Total (Category) | 26 (86.7%) | 4 (13.3%) |
| Total (Overall) | 133 (55.6%) | 106 (44.4%) |
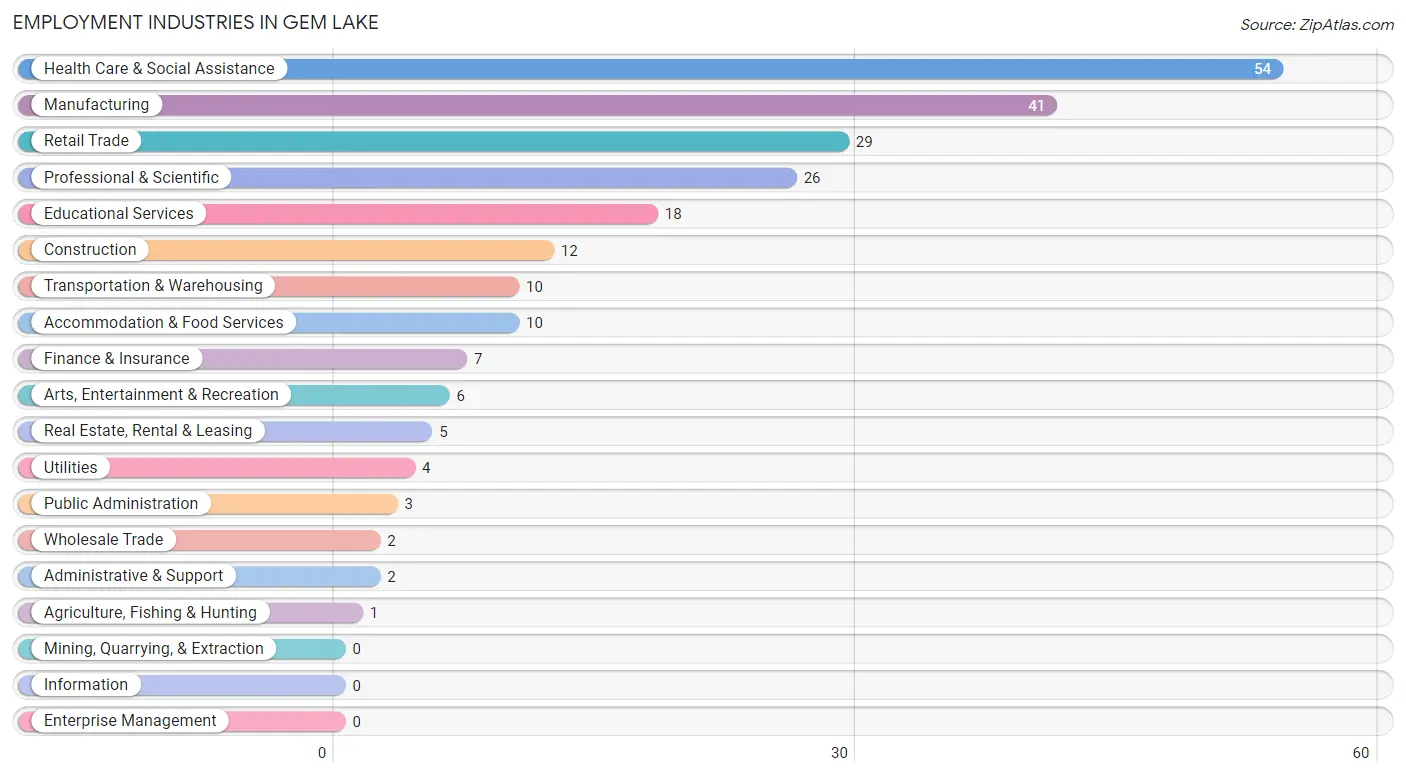
Employment Industries by Sex in Gem Lake
Employment Industries in Gem Lake
The major employment industries in Gem Lake include Health Care & Social Assistance (54 | 22.6%), Manufacturing (41 | 17.2%), Retail Trade (29 | 12.1%), Professional & Scientific (26 | 10.9%), and Educational Services (18 | 7.5%).
Employment Industries by Sex in Gem Lake
The Gem Lake industries that see more men than women are Agriculture, Fishing & Hunting (100.0%), Wholesale Trade (100.0%), and Utilities (100.0%), whereas the industries that tend to have a higher number of women are Administrative & Support (100.0%), Educational Services (77.8%), and Health Care & Social Assistance (72.2%).
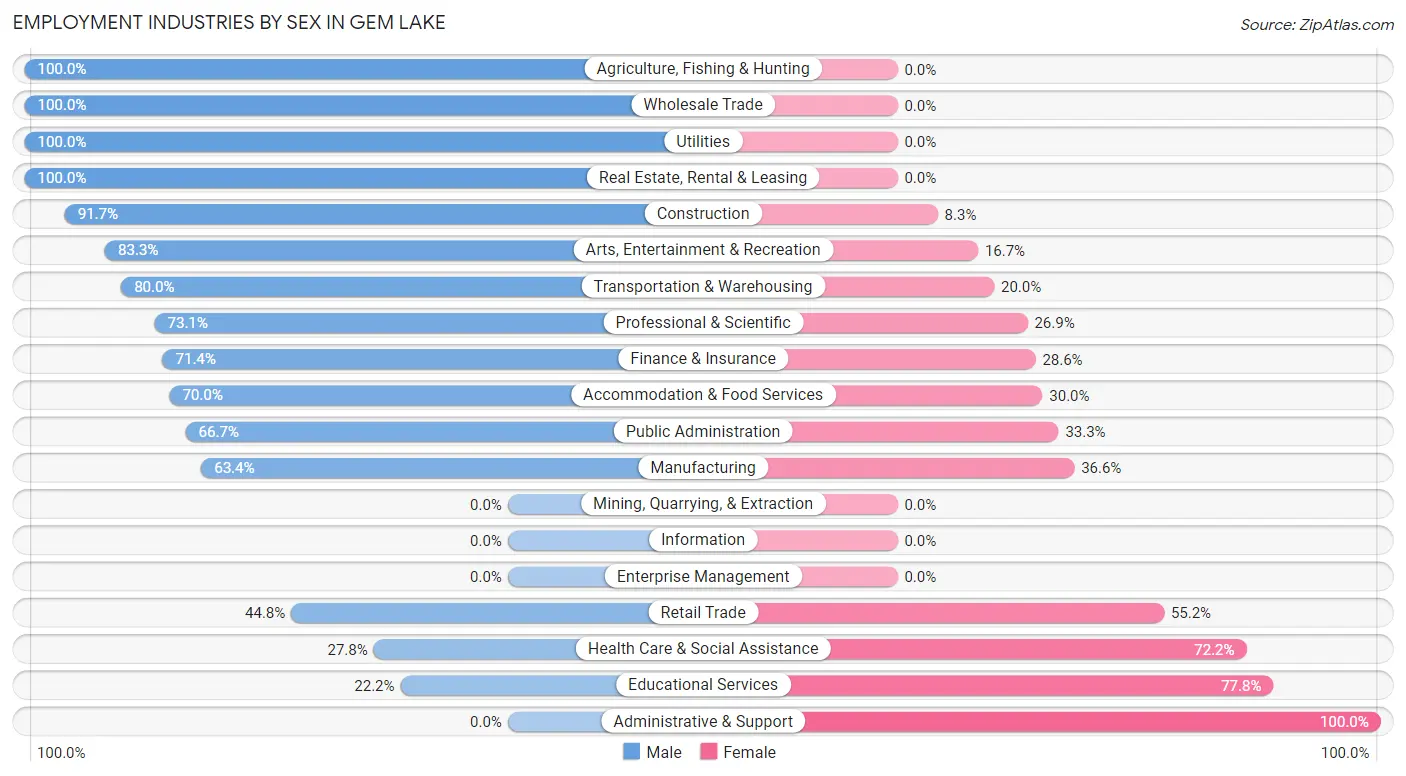
| Industry | Male | Female |
| Agriculture, Fishing & Hunting | 1 (100.0%) | 0 (0.0%) |
| Mining, Quarrying, & Extraction | 0 (0.0%) | 0 (0.0%) |
| Construction | 11 (91.7%) | 1 (8.3%) |
| Manufacturing | 26 (63.4%) | 15 (36.6%) |
| Wholesale Trade | 2 (100.0%) | 0 (0.0%) |
| Retail Trade | 13 (44.8%) | 16 (55.2%) |
| Transportation & Warehousing | 8 (80.0%) | 2 (20.0%) |
| Utilities | 4 (100.0%) | 0 (0.0%) |
| Information | 0 (0.0%) | 0 (0.0%) |
| Finance & Insurance | 5 (71.4%) | 2 (28.6%) |
| Real Estate, Rental & Leasing | 5 (100.0%) | 0 (0.0%) |
| Professional & Scientific | 19 (73.1%) | 7 (26.9%) |
| Enterprise Management | 0 (0.0%) | 0 (0.0%) |
| Administrative & Support | 0 (0.0%) | 2 (100.0%) |
| Educational Services | 4 (22.2%) | 14 (77.8%) |
| Health Care & Social Assistance | 15 (27.8%) | 39 (72.2%) |
| Arts, Entertainment & Recreation | 5 (83.3%) | 1 (16.7%) |
| Accommodation & Food Services | 7 (70.0%) | 3 (30.0%) |
| Public Administration | 2 (66.7%) | 1 (33.3%) |
| Total | 133 (55.6%) | 106 (44.4%) |
Education in Gem Lake
School Enrollment in Gem Lake
The most common levels of schooling among the 100 students in Gem Lake are elementary school (29 | 29.0%), middle school (20 | 20.0%), and nursery / preschool (15 | 15.0%).
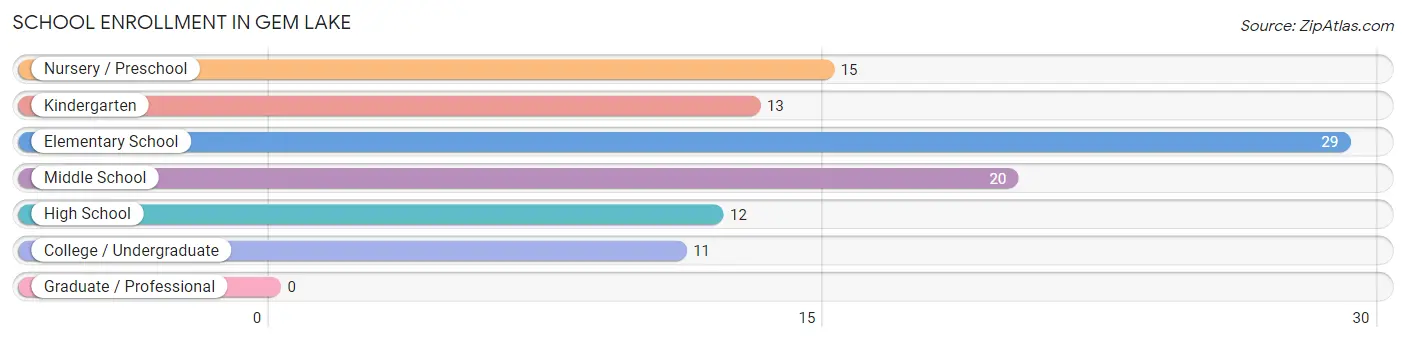
| School Level | # Students | % Students |
| Nursery / Preschool | 15 | 15.0% |
| Kindergarten | 13 | 13.0% |
| Elementary School | 29 | 29.0% |
| Middle School | 20 | 20.0% |
| High School | 12 | 12.0% |
| College / Undergraduate | 11 | 11.0% |
| Graduate / Professional | 0 | 0.0% |
| Total | 100 | 100.0% |
School Enrollment by Age by Funding Source in Gem Lake
Out of a total of 100 students who are enrolled in schools in Gem Lake, 33 (33.0%) attend a private institution, while the remaining 67 (67.0%) are enrolled in public schools. The age group of 35 years and over has the highest likelihood of being enrolled in private schools, with 5 (71.4% in the age bracket) enrolled. Conversely, the age group of 15 to 17 year olds has the lowest likelihood of being enrolled in a private school, with 12 (100.0% in the age bracket) attending a public institution.
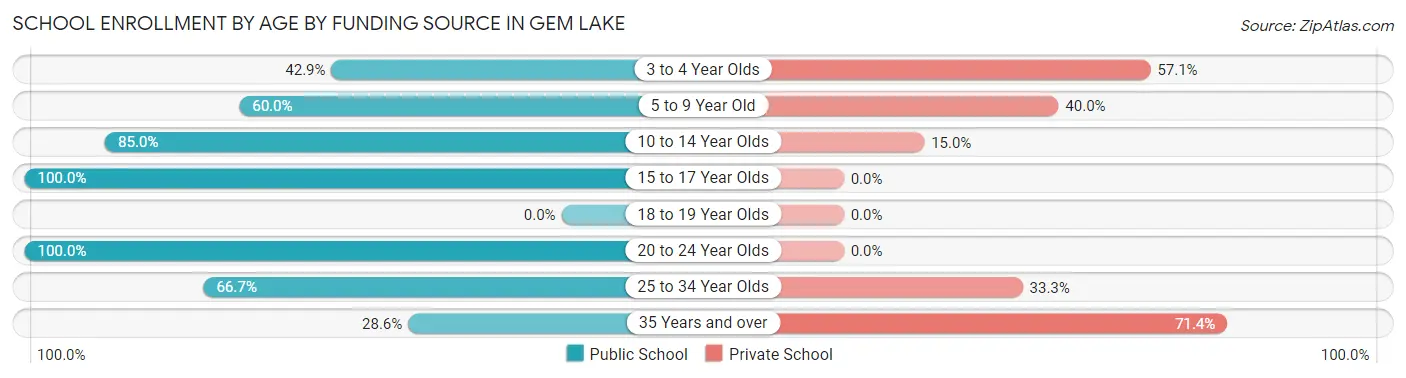
| Age Bracket | Public School | Private School |
| 3 to 4 Year Olds | 3 (42.9%) | 4 (57.1%) |
| 5 to 9 Year Old | 30 (60.0%) | 20 (40.0%) |
| 10 to 14 Year Olds | 17 (85.0%) | 3 (15.0%) |
| 15 to 17 Year Olds | 12 (100.0%) | 0 (0.0%) |
| 18 to 19 Year Olds | 0 (0.0%) | 0 (0.0%) |
| 20 to 24 Year Olds | 1 (100.0%) | 0 (0.0%) |
| 25 to 34 Year Olds | 2 (66.7%) | 1 (33.3%) |
| 35 Years and over | 2 (28.6%) | 5 (71.4%) |
| Total | 67 (67.0%) | 33 (33.0%) |
Educational Attainment by Field of Study in Gem Lake
Business (49 | 25.7%), science & technology (22 | 11.5%), social sciences (19 | 10.0%), engineering (17 | 8.9%), and liberal arts & history (16 | 8.4%) are the most common fields of study among 191 individuals in Gem Lake who have obtained a bachelor's degree or higher.
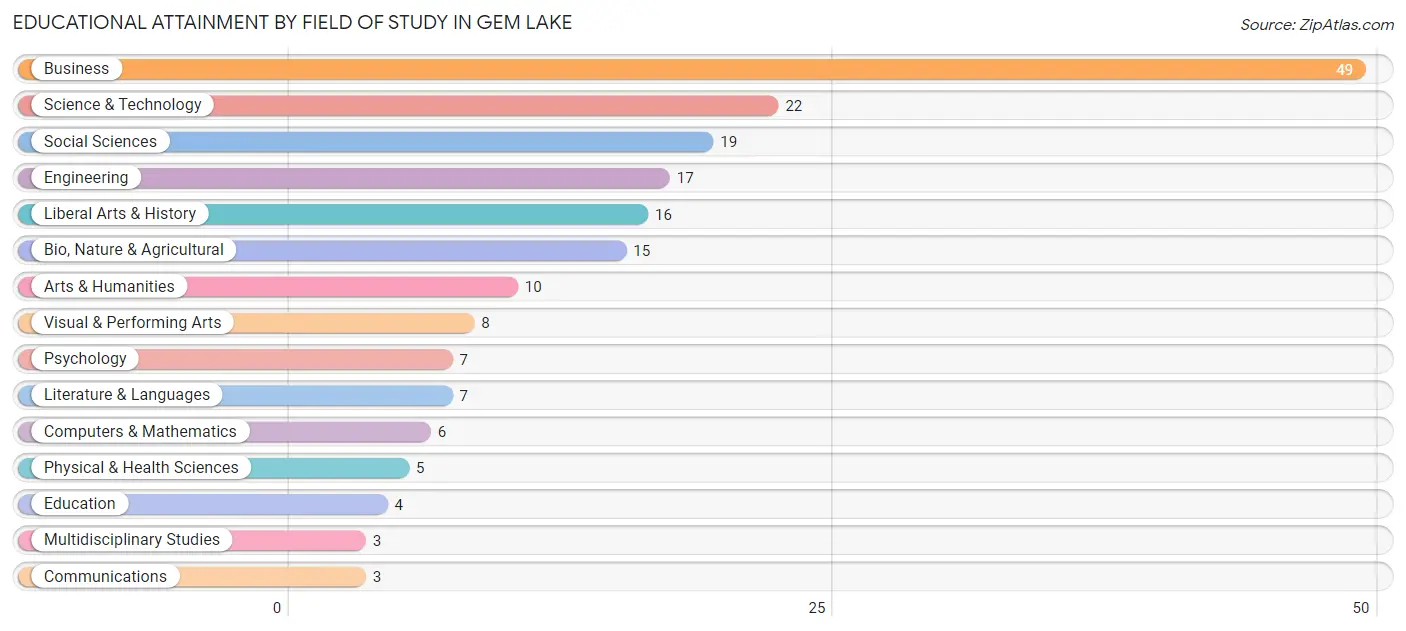
| Field of Study | # Graduates | % Graduates |
| Computers & Mathematics | 6 | 3.1% |
| Bio, Nature & Agricultural | 15 | 7.9% |
| Physical & Health Sciences | 5 | 2.6% |
| Psychology | 7 | 3.7% |
| Social Sciences | 19 | 10.0% |
| Engineering | 17 | 8.9% |
| Multidisciplinary Studies | 3 | 1.6% |
| Science & Technology | 22 | 11.5% |
| Business | 49 | 25.7% |
| Education | 4 | 2.1% |
| Literature & Languages | 7 | 3.7% |
| Liberal Arts & History | 16 | 8.4% |
| Visual & Performing Arts | 8 | 4.2% |
| Communications | 3 | 1.6% |
| Arts & Humanities | 10 | 5.2% |
| Total | 191 | 100.0% |
Transportation & Commute in Gem Lake
Vehicle Availability by Sex in Gem Lake
The most prevalent vehicle ownership categories in Gem Lake are males with 2 vehicles (56, accounting for 43.8%) and females with 2 vehicles (51, making up 53.8%).
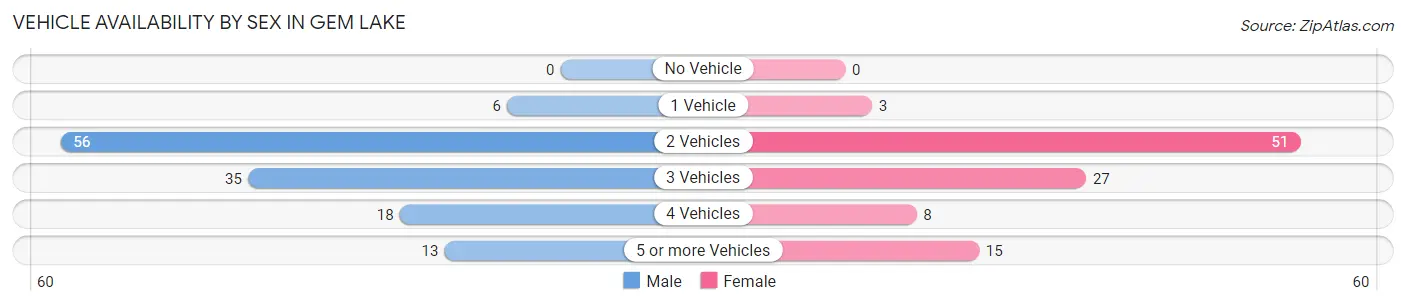
| Vehicles Available | Male | Female |
| No Vehicle | 0 (0.0%) | 0 (0.0%) |
| 1 Vehicle | 6 (4.7%) | 3 (2.9%) |
| 2 Vehicles | 56 (43.8%) | 51 (49.0%) |
| 3 Vehicles | 35 (27.3%) | 27 (26.0%) |
| 4 Vehicles | 18 (14.1%) | 8 (7.7%) |
| 5 or more Vehicles | 13 (10.2%) | 15 (14.4%) |
| Total | 128 (100.0%) | 104 (100.0%) |
Commute Time in Gem Lake
The most frequently occuring commute durations in Gem Lake are 25 to 29 minutes (29 commuters, 15.6%), 15 to 19 minutes (27 commuters, 14.5%), and 30 to 34 minutes (24 commuters, 12.9%).
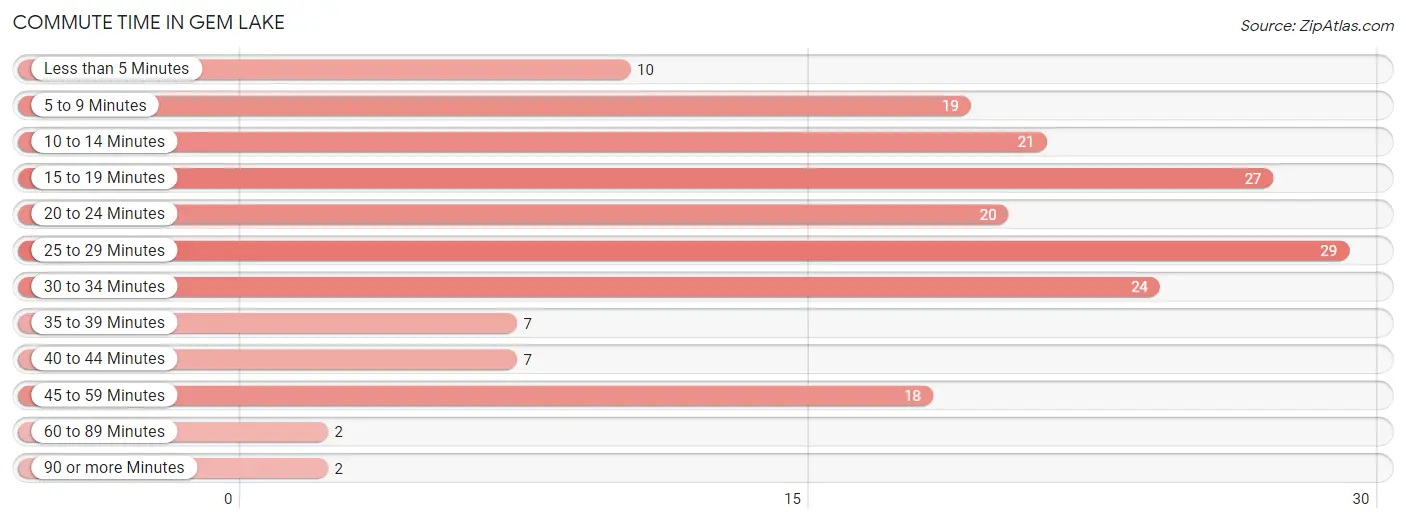
| Commute Time | # Commuters | % Commuters |
| Less than 5 Minutes | 10 | 5.4% |
| 5 to 9 Minutes | 19 | 10.2% |
| 10 to 14 Minutes | 21 | 11.3% |
| 15 to 19 Minutes | 27 | 14.5% |
| 20 to 24 Minutes | 20 | 10.7% |
| 25 to 29 Minutes | 29 | 15.6% |
| 30 to 34 Minutes | 24 | 12.9% |
| 35 to 39 Minutes | 7 | 3.8% |
| 40 to 44 Minutes | 7 | 3.8% |
| 45 to 59 Minutes | 18 | 9.7% |
| 60 to 89 Minutes | 2 | 1.1% |
| 90 or more Minutes | 2 | 1.1% |
Commute Time by Sex in Gem Lake
The most common commute times in Gem Lake are 25 to 29 minutes (17 commuters, 15.6%) for males and 15 to 19 minutes (13 commuters, 16.9%) for females.
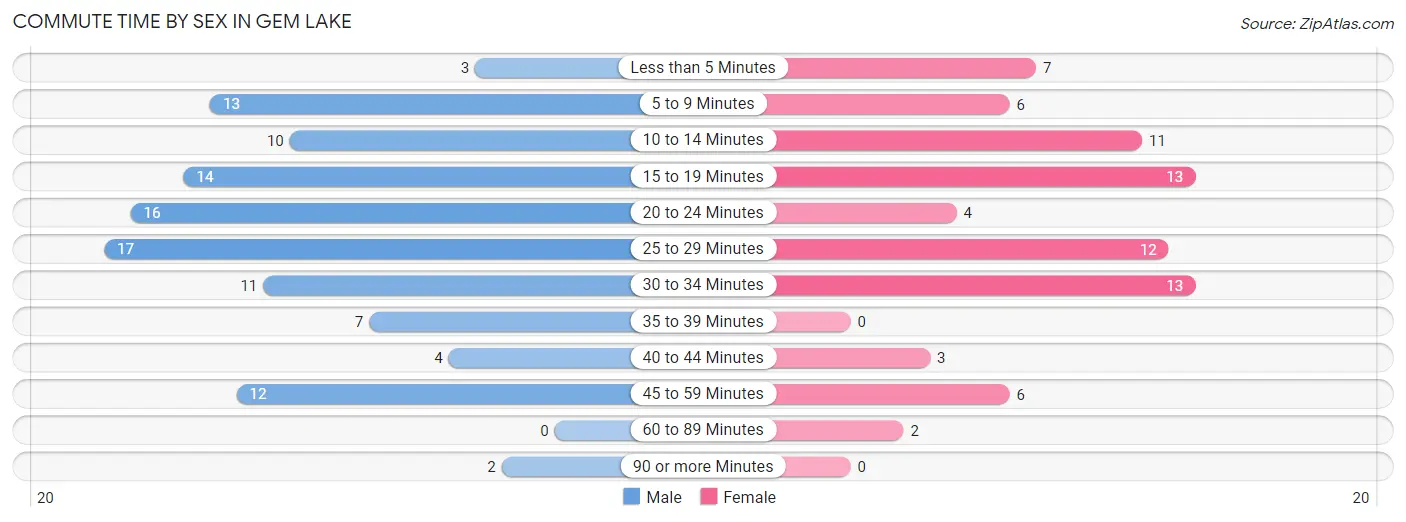
| Commute Time | Male | Female |
| Less than 5 Minutes | 3 (2.8%) | 7 (9.1%) |
| 5 to 9 Minutes | 13 (11.9%) | 6 (7.8%) |
| 10 to 14 Minutes | 10 (9.2%) | 11 (14.3%) |
| 15 to 19 Minutes | 14 (12.8%) | 13 (16.9%) |
| 20 to 24 Minutes | 16 (14.7%) | 4 (5.2%) |
| 25 to 29 Minutes | 17 (15.6%) | 12 (15.6%) |
| 30 to 34 Minutes | 11 (10.1%) | 13 (16.9%) |
| 35 to 39 Minutes | 7 (6.4%) | 0 (0.0%) |
| 40 to 44 Minutes | 4 (3.7%) | 3 (3.9%) |
| 45 to 59 Minutes | 12 (11.0%) | 6 (7.8%) |
| 60 to 89 Minutes | 0 (0.0%) | 2 (2.6%) |
| 90 or more Minutes | 2 (1.8%) | 0 (0.0%) |
Time of Departure to Work by Sex in Gem Lake
The most frequent times of departure to work in Gem Lake are 8:00 AM to 8:29 AM (19, 17.4%) for males and 9:00 AM to 9:59 AM (20, 26.0%) for females.
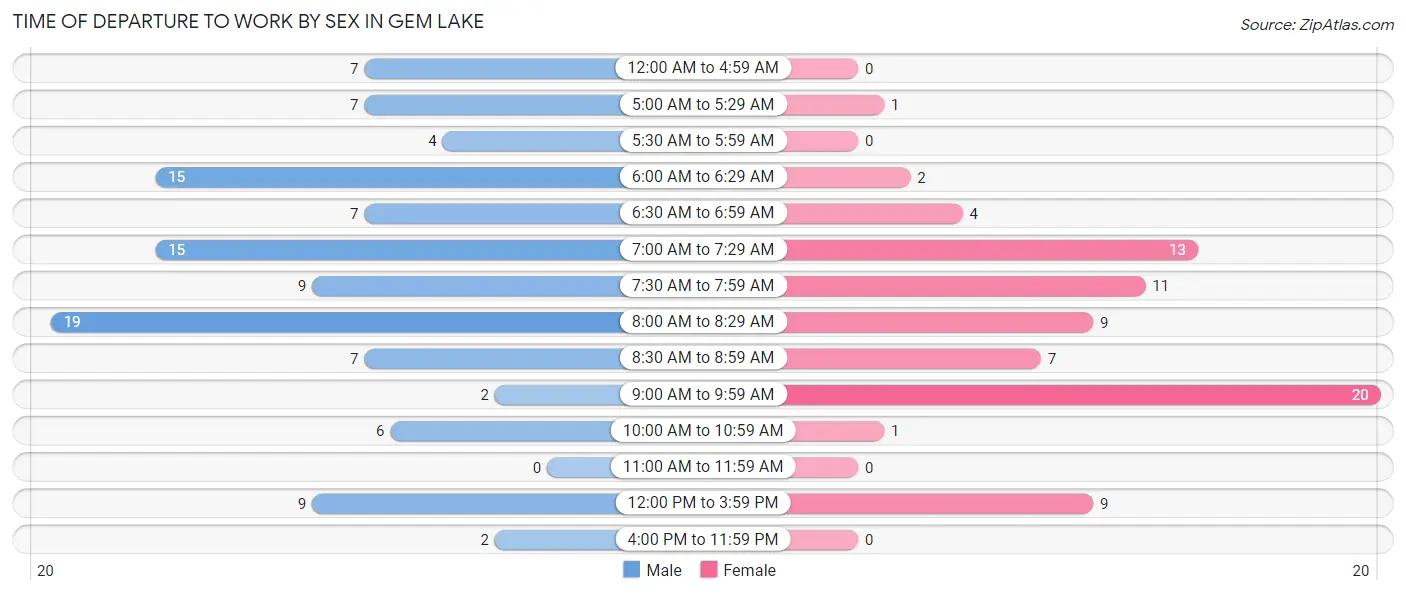
| Time of Departure | Male | Female |
| 12:00 AM to 4:59 AM | 7 (6.4%) | 0 (0.0%) |
| 5:00 AM to 5:29 AM | 7 (6.4%) | 1 (1.3%) |
| 5:30 AM to 5:59 AM | 4 (3.7%) | 0 (0.0%) |
| 6:00 AM to 6:29 AM | 15 (13.8%) | 2 (2.6%) |
| 6:30 AM to 6:59 AM | 7 (6.4%) | 4 (5.2%) |
| 7:00 AM to 7:29 AM | 15 (13.8%) | 13 (16.9%) |
| 7:30 AM to 7:59 AM | 9 (8.3%) | 11 (14.3%) |
| 8:00 AM to 8:29 AM | 19 (17.4%) | 9 (11.7%) |
| 8:30 AM to 8:59 AM | 7 (6.4%) | 7 (9.1%) |
| 9:00 AM to 9:59 AM | 2 (1.8%) | 20 (26.0%) |
| 10:00 AM to 10:59 AM | 6 (5.5%) | 1 (1.3%) |
| 11:00 AM to 11:59 AM | 0 (0.0%) | 0 (0.0%) |
| 12:00 PM to 3:59 PM | 9 (8.3%) | 9 (11.7%) |
| 4:00 PM to 11:59 PM | 2 (1.8%) | 0 (0.0%) |
| Total | 109 (100.0%) | 77 (100.0%) |
Housing Occupancy in Gem Lake
Occupancy by Ownership in Gem Lake
Of the total 175 dwellings in Gem Lake, owner-occupied units account for 160 (91.4%), while renter-occupied units make up 15 (8.6%).
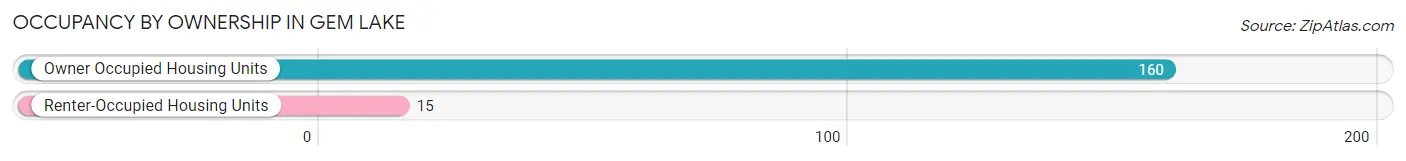
| Occupancy | # Housing Units | % Housing Units |
| Owner Occupied Housing Units | 160 | 91.4% |
| Renter-Occupied Housing Units | 15 | 8.6% |
| Total Occupied Housing Units | 175 | 100.0% |
Occupancy by Household Size in Gem Lake
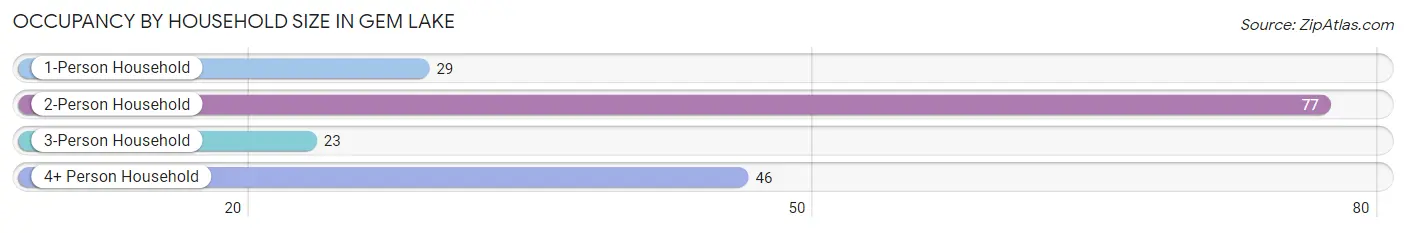
| Household Size | # Housing Units | % Housing Units |
| 1-Person Household | 29 | 16.6% |
| 2-Person Household | 77 | 44.0% |
| 3-Person Household | 23 | 13.1% |
| 4+ Person Household | 46 | 26.3% |
| Total Housing Units | 175 | 100.0% |
Occupancy by Ownership by Household Size in Gem Lake
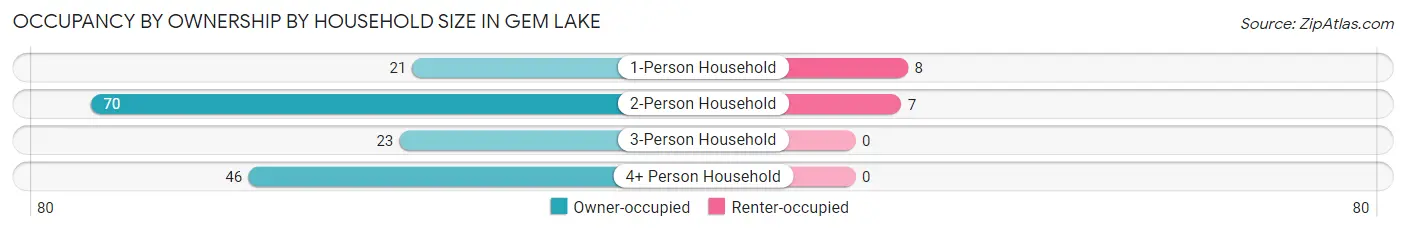
| Household Size | Owner-occupied | Renter-occupied |
| 1-Person Household | 21 (72.4%) | 8 (27.6%) |
| 2-Person Household | 70 (90.9%) | 7 (9.1%) |
| 3-Person Household | 23 (100.0%) | 0 (0.0%) |
| 4+ Person Household | 46 (100.0%) | 0 (0.0%) |
| Total Housing Units | 160 (91.4%) | 15 (8.6%) |
Occupancy by Educational Attainment in Gem Lake
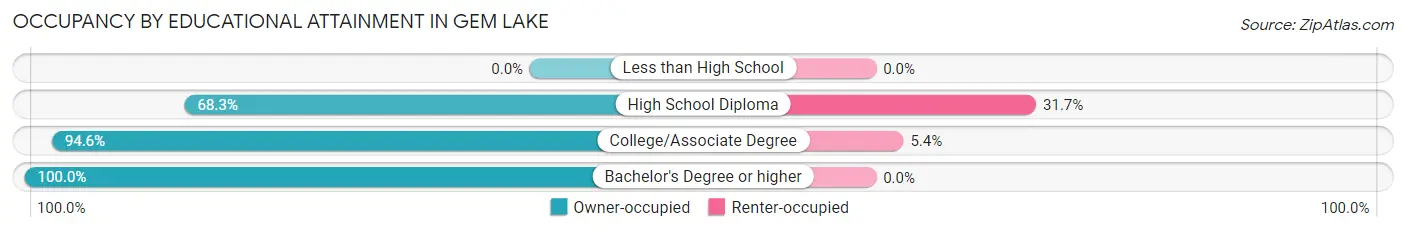
| Household Size | Owner-occupied | Renter-occupied |
| Less than High School | 0 (0.0%) | 0 (0.0%) |
| High School Diploma | 28 (68.3%) | 13 (31.7%) |
| College/Associate Degree | 35 (94.6%) | 2 (5.4%) |
| Bachelor's Degree or higher | 97 (100.0%) | 0 (0.0%) |
Occupancy by Age of Householder in Gem Lake
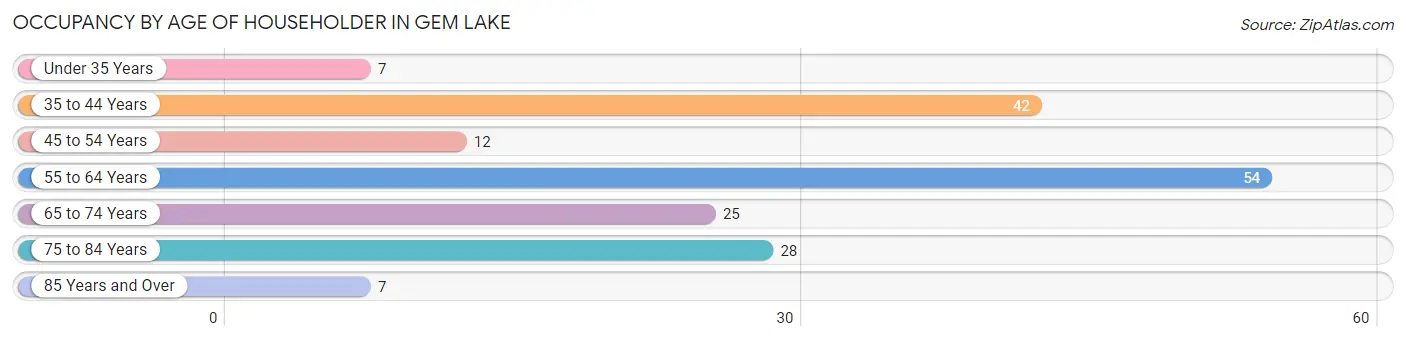
| Age Bracket | # Households | % Households |
| Under 35 Years | 7 | 4.0% |
| 35 to 44 Years | 42 | 24.0% |
| 45 to 54 Years | 12 | 6.9% |
| 55 to 64 Years | 54 | 30.9% |
| 65 to 74 Years | 25 | 14.3% |
| 75 to 84 Years | 28 | 16.0% |
| 85 Years and Over | 7 | 4.0% |
| Total | 175 | 100.0% |
Housing Finances in Gem Lake
Median Income by Occupancy in Gem Lake
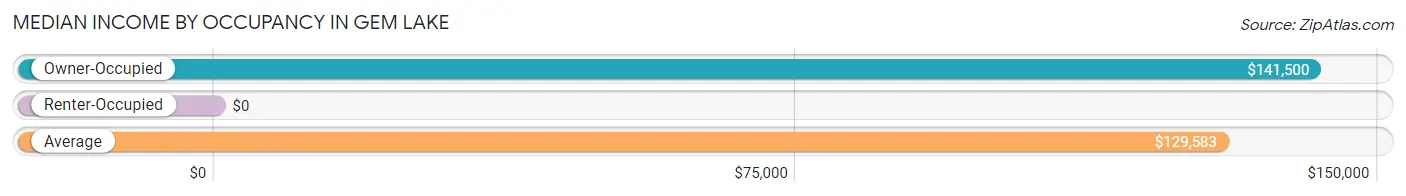
| Occupancy Type | # Households | Median Income |
| Owner-Occupied | 160 (91.4%) | $141,500 |
| Renter-Occupied | 15 (8.6%) | $0 |
| Average | 175 (100.0%) | $129,583 |
Occupancy by Householder Income Bracket in Gem Lake
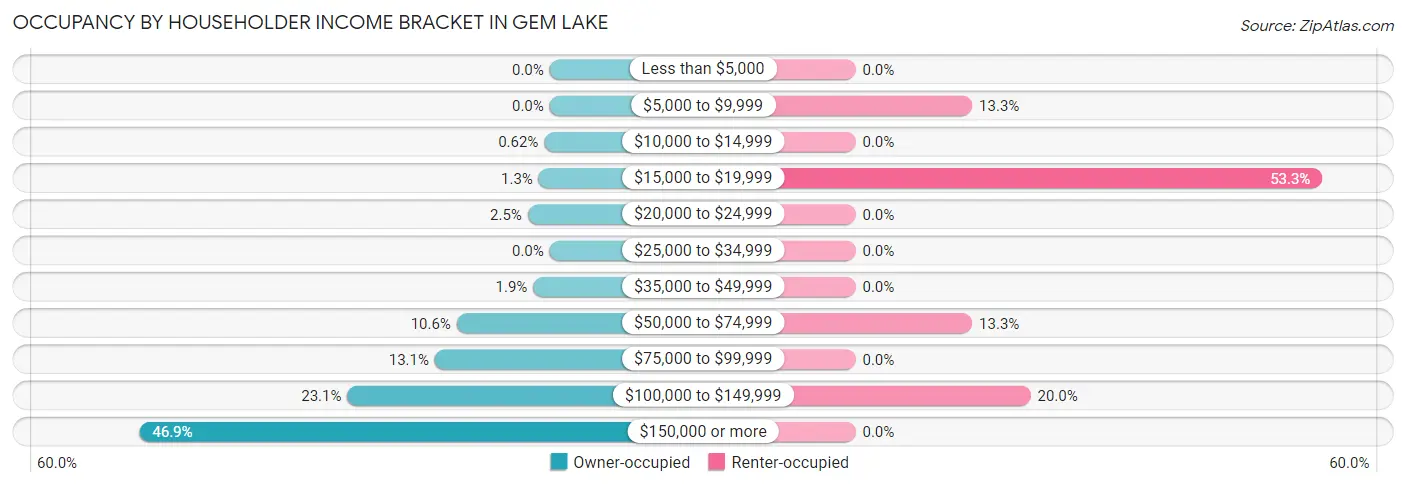
| Income Bracket | Owner-occupied | Renter-occupied |
| Less than $5,000 | 0 (0.0%) | 0 (0.0%) |
| $5,000 to $9,999 | 0 (0.0%) | 2 (13.3%) |
| $10,000 to $14,999 | 1 (0.6%) | 0 (0.0%) |
| $15,000 to $19,999 | 2 (1.3%) | 8 (53.3%) |
| $20,000 to $24,999 | 4 (2.5%) | 0 (0.0%) |
| $25,000 to $34,999 | 0 (0.0%) | 0 (0.0%) |
| $35,000 to $49,999 | 3 (1.9%) | 0 (0.0%) |
| $50,000 to $74,999 | 17 (10.6%) | 2 (13.3%) |
| $75,000 to $99,999 | 21 (13.1%) | 0 (0.0%) |
| $100,000 to $149,999 | 37 (23.1%) | 3 (20.0%) |
| $150,000 or more | 75 (46.9%) | 0 (0.0%) |
| Total | 160 (100.0%) | 15 (100.0%) |
Monthly Housing Cost Tiers in Gem Lake
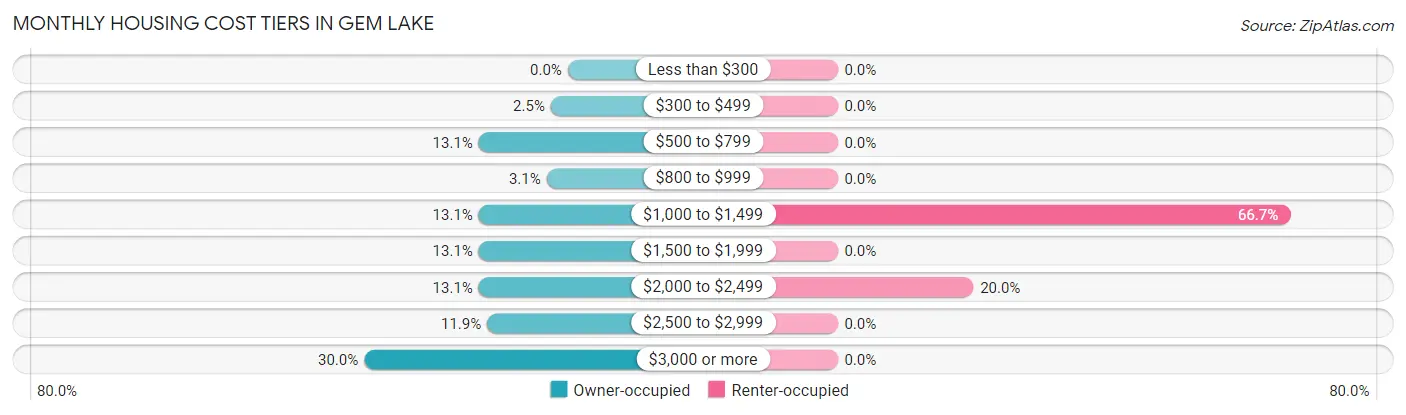
| Monthly Cost | Owner-occupied | Renter-occupied |
| Less than $300 | 0 (0.0%) | 0 (0.0%) |
| $300 to $499 | 4 (2.5%) | 0 (0.0%) |
| $500 to $799 | 21 (13.1%) | 0 (0.0%) |
| $800 to $999 | 5 (3.1%) | 0 (0.0%) |
| $1,000 to $1,499 | 21 (13.1%) | 10 (66.7%) |
| $1,500 to $1,999 | 21 (13.1%) | 0 (0.0%) |
| $2,000 to $2,499 | 21 (13.1%) | 3 (20.0%) |
| $2,500 to $2,999 | 19 (11.9%) | 0 (0.0%) |
| $3,000 or more | 48 (30.0%) | 0 (0.0%) |
| Total | 160 (100.0%) | 15 (100.0%) |
Physical Housing Characteristics in Gem Lake
Housing Structures in Gem Lake
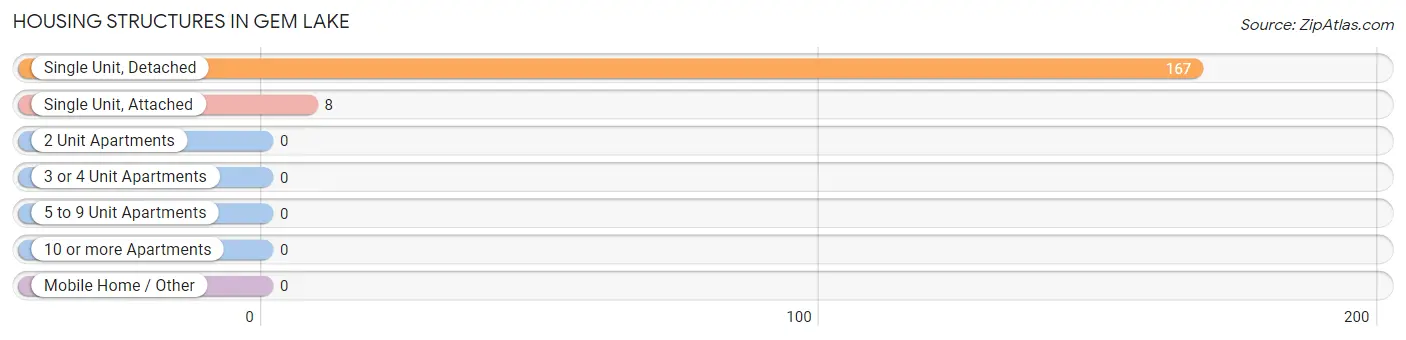
| Structure Type | # Housing Units | % Housing Units |
| Single Unit, Detached | 167 | 95.4% |
| Single Unit, Attached | 8 | 4.6% |
| 2 Unit Apartments | 0 | 0.0% |
| 3 or 4 Unit Apartments | 0 | 0.0% |
| 5 to 9 Unit Apartments | 0 | 0.0% |
| 10 or more Apartments | 0 | 0.0% |
| Mobile Home / Other | 0 | 0.0% |
| Total | 175 | 100.0% |
Housing Structures by Occupancy in Gem Lake
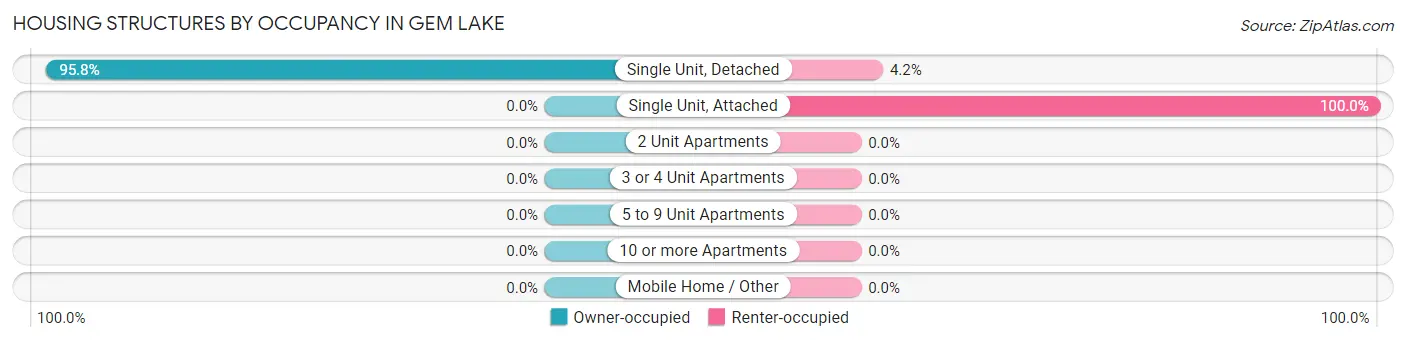
| Structure Type | Owner-occupied | Renter-occupied |
| Single Unit, Detached | 160 (95.8%) | 7 (4.2%) |
| Single Unit, Attached | 0 (0.0%) | 8 (100.0%) |
| 2 Unit Apartments | 0 (0.0%) | 0 (0.0%) |
| 3 or 4 Unit Apartments | 0 (0.0%) | 0 (0.0%) |
| 5 to 9 Unit Apartments | 0 (0.0%) | 0 (0.0%) |
| 10 or more Apartments | 0 (0.0%) | 0 (0.0%) |
| Mobile Home / Other | 0 (0.0%) | 0 (0.0%) |
| Total | 160 (91.4%) | 15 (8.6%) |
Housing Structures by Number of Rooms in Gem Lake
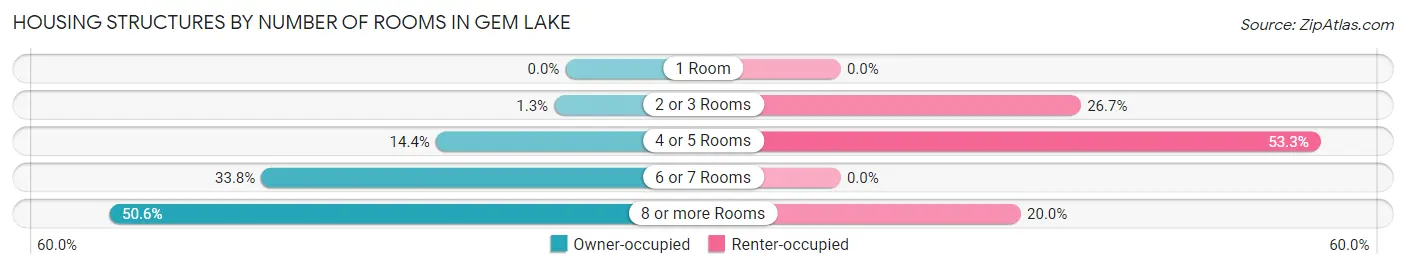
| Number of Rooms | Owner-occupied | Renter-occupied |
| 1 Room | 0 (0.0%) | 0 (0.0%) |
| 2 or 3 Rooms | 2 (1.3%) | 4 (26.7%) |
| 4 or 5 Rooms | 23 (14.4%) | 8 (53.3%) |
| 6 or 7 Rooms | 54 (33.8%) | 0 (0.0%) |
| 8 or more Rooms | 81 (50.6%) | 3 (20.0%) |
| Total | 160 (100.0%) | 15 (100.0%) |
Housing Structure by Heating Type in Gem Lake
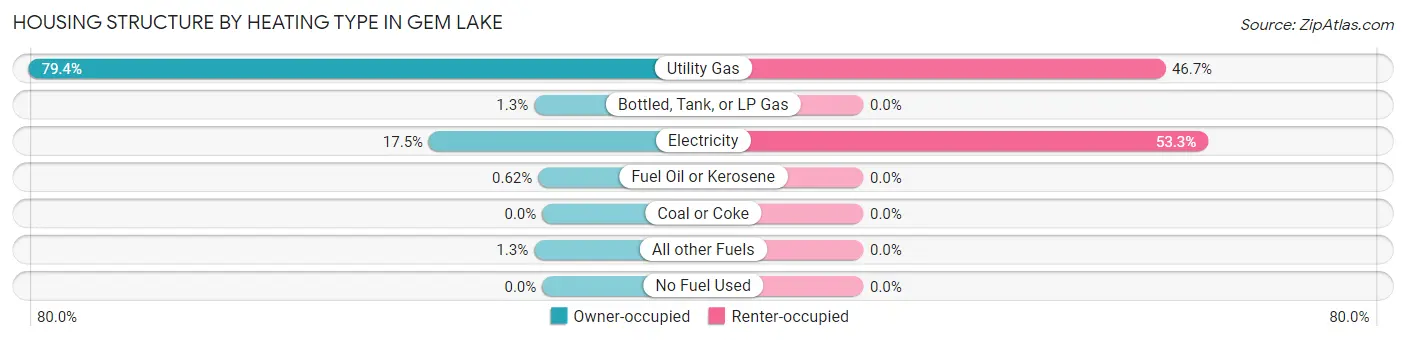
| Heating Type | Owner-occupied | Renter-occupied |
| Utility Gas | 127 (79.4%) | 7 (46.7%) |
| Bottled, Tank, or LP Gas | 2 (1.3%) | 0 (0.0%) |
| Electricity | 28 (17.5%) | 8 (53.3%) |
| Fuel Oil or Kerosene | 1 (0.6%) | 0 (0.0%) |
| Coal or Coke | 0 (0.0%) | 0 (0.0%) |
| All other Fuels | 2 (1.3%) | 0 (0.0%) |
| No Fuel Used | 0 (0.0%) | 0 (0.0%) |
| Total | 160 (100.0%) | 15 (100.0%) |
Household Vehicle Usage in Gem Lake
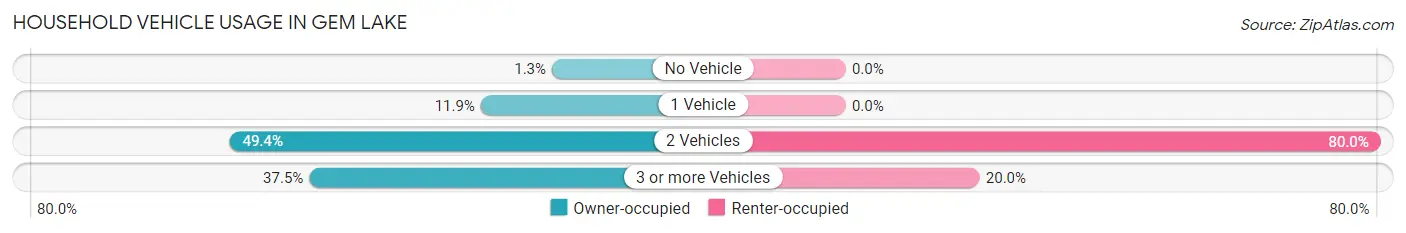
| Vehicles per Household | Owner-occupied | Renter-occupied |
| No Vehicle | 2 (1.3%) | 0 (0.0%) |
| 1 Vehicle | 19 (11.9%) | 0 (0.0%) |
| 2 Vehicles | 79 (49.4%) | 12 (80.0%) |
| 3 or more Vehicles | 60 (37.5%) | 3 (20.0%) |
| Total | 160 (100.0%) | 15 (100.0%) |
Real Estate & Mortgages in Gem Lake
Real Estate and Mortgage Overview in Gem Lake
| Characteristic | Without Mortgage | With Mortgage |
| Housing Units | 50 | 110 |
| Median Property Value | $300,000 | $494,100 |
| Median Household Income | $98,500 | $63 |
| Monthly Housing Costs | $850 | $47 |
| Real Estate Taxes | $4,286 | $0 |
Property Value by Mortgage Status in Gem Lake
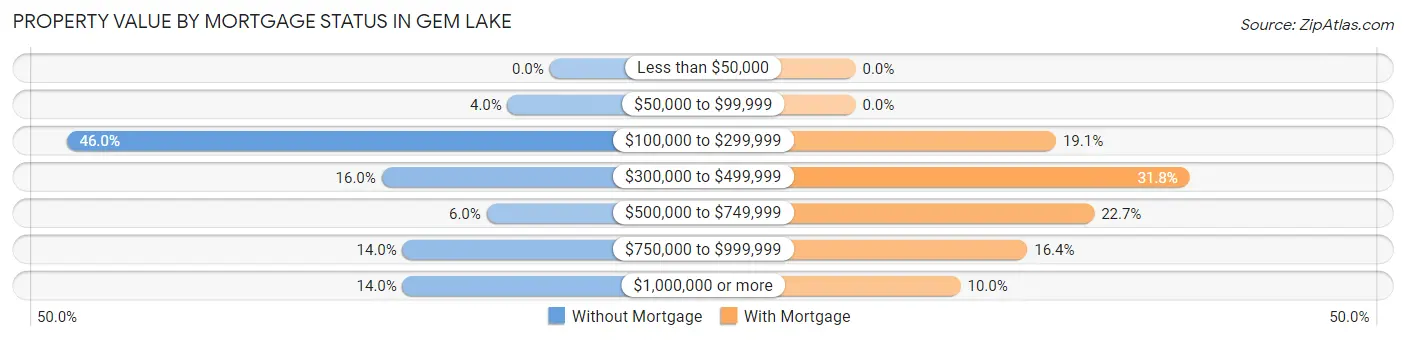
| Property Value | Without Mortgage | With Mortgage |
| Less than $50,000 | 0 (0.0%) | 0 (0.0%) |
| $50,000 to $99,999 | 2 (4.0%) | 0 (0.0%) |
| $100,000 to $299,999 | 23 (46.0%) | 21 (19.1%) |
| $300,000 to $499,999 | 8 (16.0%) | 35 (31.8%) |
| $500,000 to $749,999 | 3 (6.0%) | 25 (22.7%) |
| $750,000 to $999,999 | 7 (14.0%) | 18 (16.4%) |
| $1,000,000 or more | 7 (14.0%) | 11 (10.0%) |
| Total | 50 (100.0%) | 110 (100.0%) |
Household Income by Mortgage Status in Gem Lake
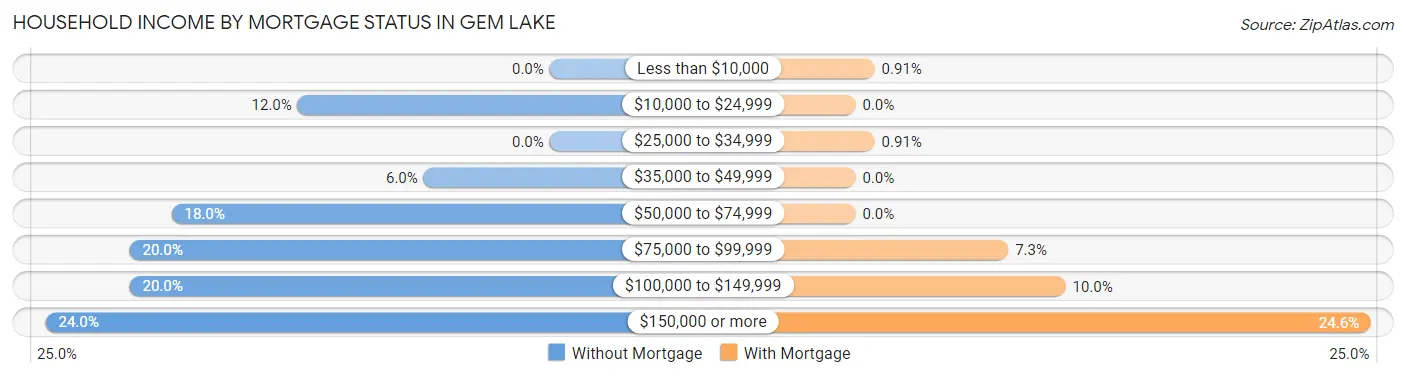
| Household Income | Without Mortgage | With Mortgage |
| Less than $10,000 | 0 (0.0%) | 1 (0.9%) |
| $10,000 to $24,999 | 6 (12.0%) | 0 (0.0%) |
| $25,000 to $34,999 | 0 (0.0%) | 1 (0.9%) |
| $35,000 to $49,999 | 3 (6.0%) | 0 (0.0%) |
| $50,000 to $74,999 | 9 (18.0%) | 0 (0.0%) |
| $75,000 to $99,999 | 10 (20.0%) | 8 (7.3%) |
| $100,000 to $149,999 | 10 (20.0%) | 11 (10.0%) |
| $150,000 or more | 12 (24.0%) | 27 (24.5%) |
| Total | 50 (100.0%) | 110 (100.0%) |
Property Value to Household Income Ratio in Gem Lake
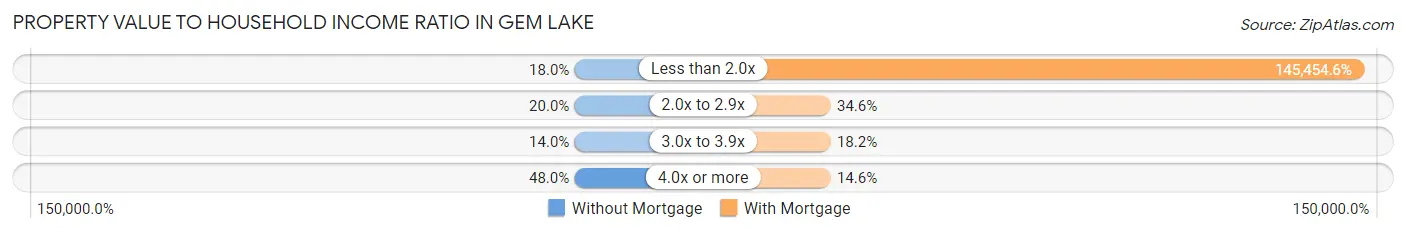
| Value-to-Income Ratio | Without Mortgage | With Mortgage |
| Less than 2.0x | 9 (18.0%) | 160,000 (145,454.5%) |
| 2.0x to 2.9x | 10 (20.0%) | 38 (34.5%) |
| 3.0x to 3.9x | 7 (14.0%) | 20 (18.2%) |
| 4.0x or more | 24 (48.0%) | 16 (14.5%) |
| Total | 50 (100.0%) | 110 (100.0%) |
Real Estate Taxes by Mortgage Status in Gem Lake
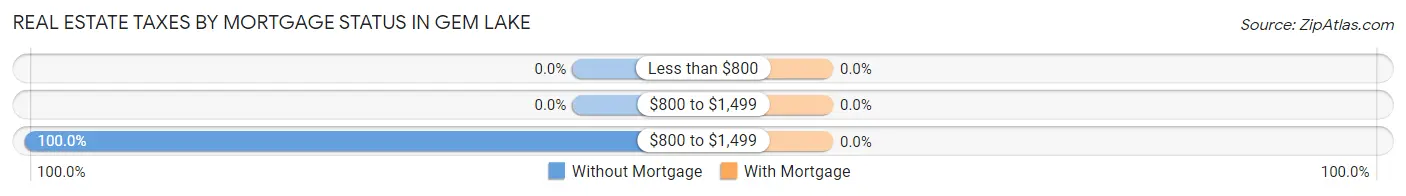
| Property Taxes | Without Mortgage | With Mortgage |
| Less than $800 | 0 (0.0%) | 0 (0.0%) |
| $800 to $1,499 | 0 (0.0%) | 0 (0.0%) |
| $800 to $1,499 | 50 (100.0%) | 0 (0.0%) |
| Total | 50 (100.0%) | 110 (100.0%) |
Health & Disability in Gem Lake
Health Insurance Coverage by Age in Gem Lake
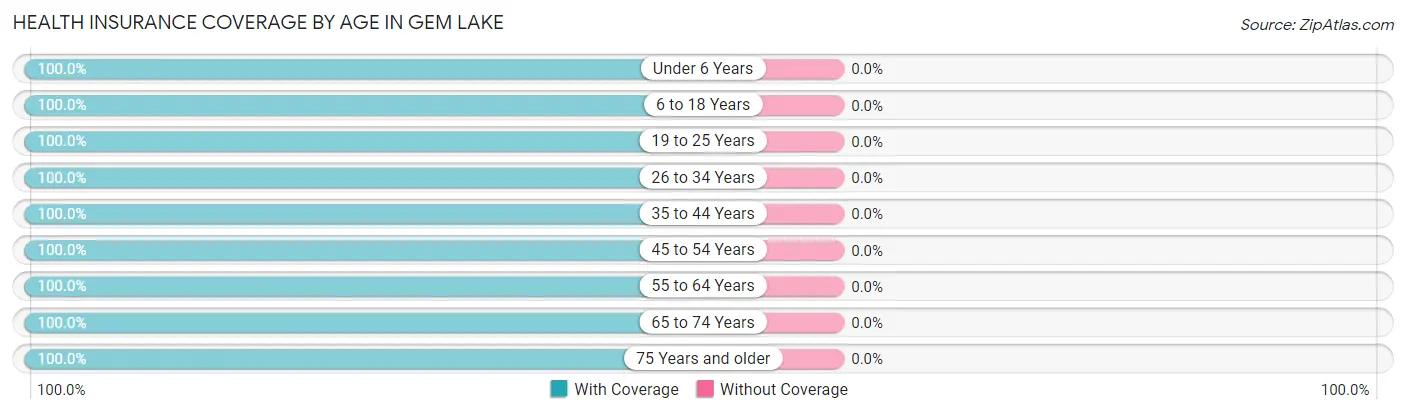
| Age Bracket | With Coverage | Without Coverage |
| Under 6 Years | 55 (100.0%) | 0 (0.0%) |
| 6 to 18 Years | 69 (100.0%) | 0 (0.0%) |
| 19 to 25 Years | 18 (100.0%) | 0 (0.0%) |
| 26 to 34 Years | 25 (100.0%) | 0 (0.0%) |
| 35 to 44 Years | 79 (100.0%) | 0 (0.0%) |
| 45 to 54 Years | 25 (100.0%) | 0 (0.0%) |
| 55 to 64 Years | 107 (100.0%) | 0 (0.0%) |
| 65 to 74 Years | 45 (100.0%) | 0 (0.0%) |
| 75 Years and older | 52 (100.0%) | 0 (0.0%) |
| Total | 475 (100.0%) | 0 (0.0%) |
Health Insurance Coverage by Citizenship Status in Gem Lake
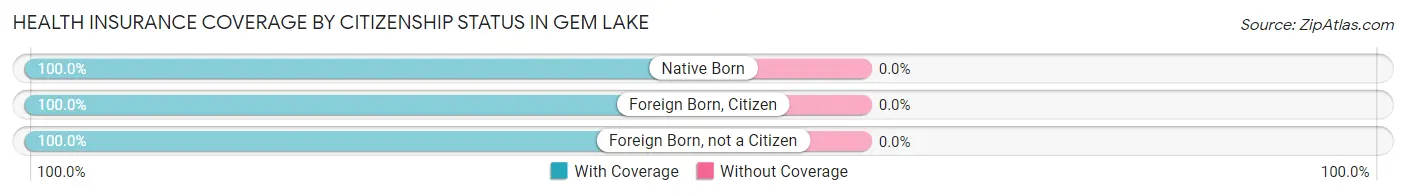
| Citizenship Status | With Coverage | Without Coverage |
| Native Born | 55 (100.0%) | 0 (0.0%) |
| Foreign Born, Citizen | 69 (100.0%) | 0 (0.0%) |
| Foreign Born, not a Citizen | 18 (100.0%) | 0 (0.0%) |
Health Insurance Coverage by Household Income in Gem Lake
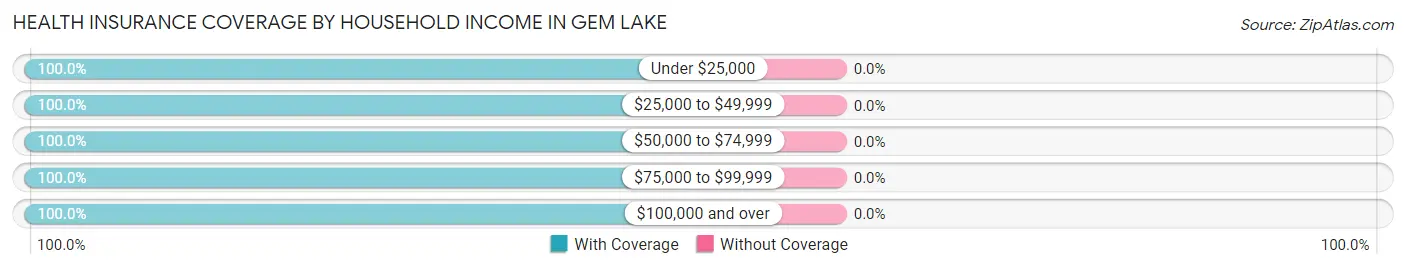
| Household Income | With Coverage | Without Coverage |
| Under $25,000 | 24 (100.0%) | 0 (0.0%) |
| $25,000 to $49,999 | 5 (100.0%) | 0 (0.0%) |
| $50,000 to $74,999 | 37 (100.0%) | 0 (0.0%) |
| $75,000 to $99,999 | 52 (100.0%) | 0 (0.0%) |
| $100,000 and over | 357 (100.0%) | 0 (0.0%) |
Public vs Private Health Insurance Coverage by Age in Gem Lake
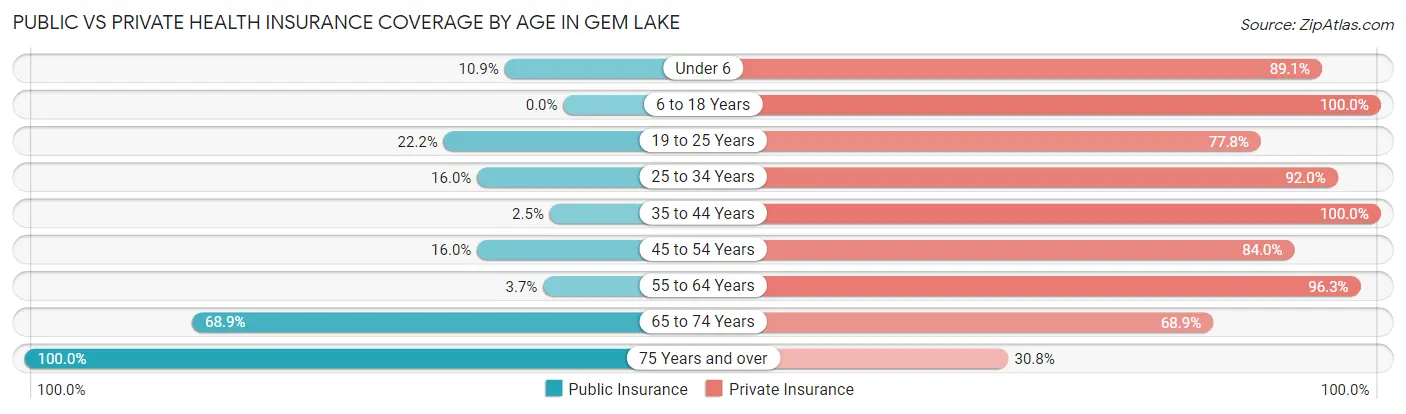
| Age Bracket | Public Insurance | Private Insurance |
| Under 6 | 6 (10.9%) | 49 (89.1%) |
| 6 to 18 Years | 0 (0.0%) | 69 (100.0%) |
| 19 to 25 Years | 4 (22.2%) | 14 (77.8%) |
| 25 to 34 Years | 4 (16.0%) | 23 (92.0%) |
| 35 to 44 Years | 2 (2.5%) | 79 (100.0%) |
| 45 to 54 Years | 4 (16.0%) | 21 (84.0%) |
| 55 to 64 Years | 4 (3.7%) | 103 (96.3%) |
| 65 to 74 Years | 31 (68.9%) | 31 (68.9%) |
| 75 Years and over | 52 (100.0%) | 16 (30.8%) |
| Total | 107 (22.5%) | 405 (85.3%) |
Disability Status by Sex by Age in Gem Lake
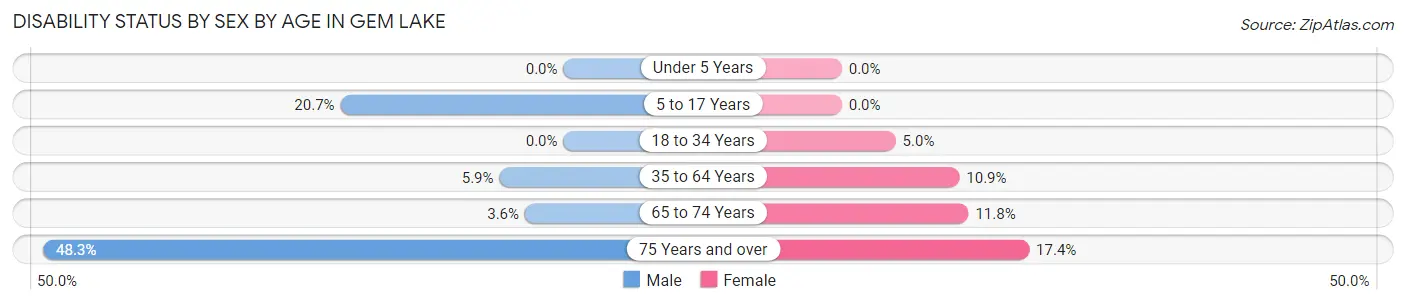
| Age Bracket | Male | Female |
| Under 5 Years | 0 (0.0%) | 0 (0.0%) |
| 5 to 17 Years | 6 (20.7%) | 0 (0.0%) |
| 18 to 34 Years | 0 (0.0%) | 1 (5.0%) |
| 35 to 64 Years | 6 (5.9%) | 12 (10.9%) |
| 65 to 74 Years | 1 (3.6%) | 2 (11.8%) |
| 75 Years and over | 14 (48.3%) | 4 (17.4%) |
Disability Class by Sex by Age in Gem Lake
Disability Class: Hearing Difficulty
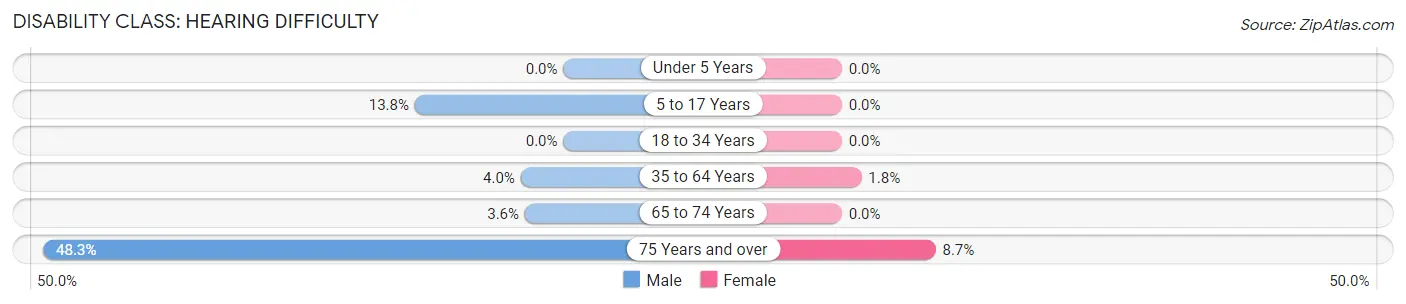
| Age Bracket | Male | Female |
| Under 5 Years | 0 (0.0%) | 0 (0.0%) |
| 5 to 17 Years | 4 (13.8%) | 0 (0.0%) |
| 18 to 34 Years | 0 (0.0%) | 0 (0.0%) |
| 35 to 64 Years | 4 (4.0%) | 2 (1.8%) |
| 65 to 74 Years | 1 (3.6%) | 0 (0.0%) |
| 75 Years and over | 14 (48.3%) | 2 (8.7%) |
Disability Class: Vision Difficulty
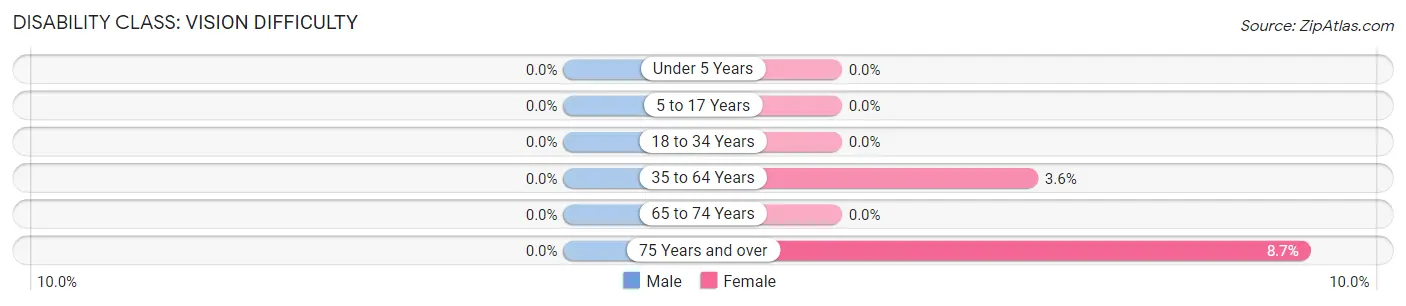
| Age Bracket | Male | Female |
| Under 5 Years | 0 (0.0%) | 0 (0.0%) |
| 5 to 17 Years | 0 (0.0%) | 0 (0.0%) |
| 18 to 34 Years | 0 (0.0%) | 0 (0.0%) |
| 35 to 64 Years | 0 (0.0%) | 4 (3.6%) |
| 65 to 74 Years | 0 (0.0%) | 0 (0.0%) |
| 75 Years and over | 0 (0.0%) | 2 (8.7%) |
Disability Class: Cognitive Difficulty
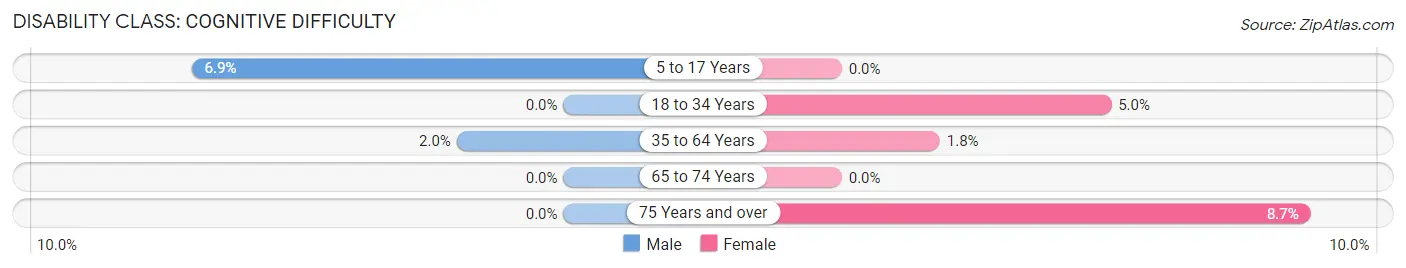
| Age Bracket | Male | Female |
| 5 to 17 Years | 2 (6.9%) | 0 (0.0%) |
| 18 to 34 Years | 0 (0.0%) | 1 (5.0%) |
| 35 to 64 Years | 2 (2.0%) | 2 (1.8%) |
| 65 to 74 Years | 0 (0.0%) | 0 (0.0%) |
| 75 Years and over | 0 (0.0%) | 2 (8.7%) |
Disability Class: Ambulatory Difficulty
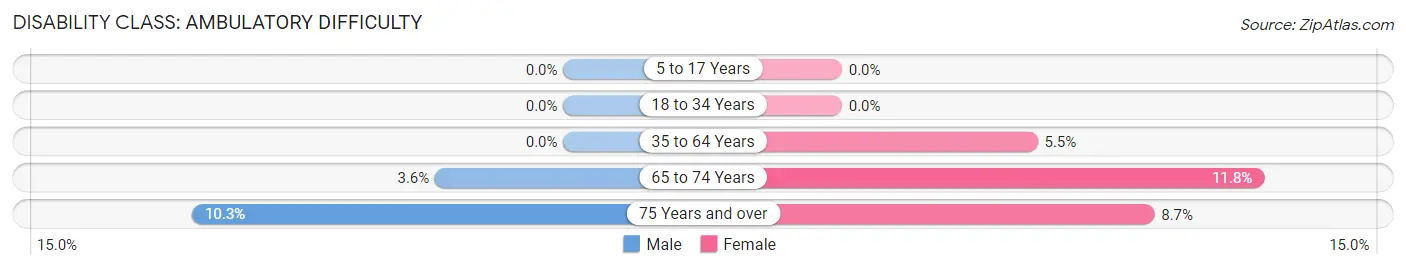
| Age Bracket | Male | Female |
| 5 to 17 Years | 0 (0.0%) | 0 (0.0%) |
| 18 to 34 Years | 0 (0.0%) | 0 (0.0%) |
| 35 to 64 Years | 0 (0.0%) | 6 (5.4%) |
| 65 to 74 Years | 1 (3.6%) | 2 (11.8%) |
| 75 Years and over | 3 (10.3%) | 2 (8.7%) |
Disability Class: Self-Care Difficulty
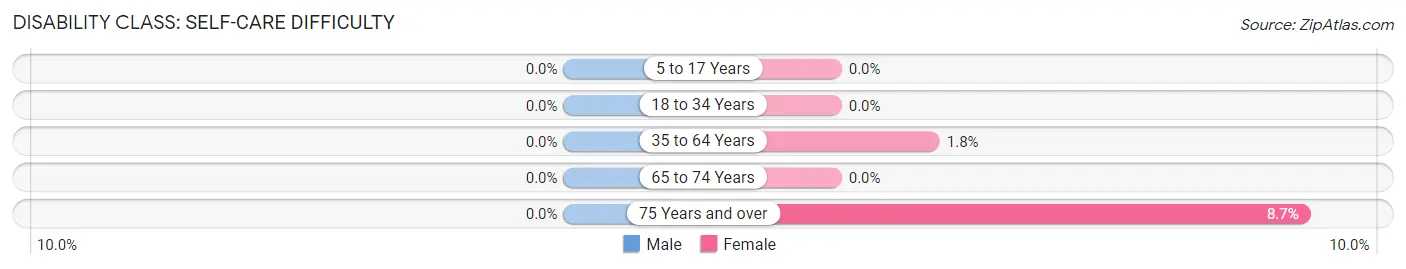
| Age Bracket | Male | Female |
| 5 to 17 Years | 0 (0.0%) | 0 (0.0%) |
| 18 to 34 Years | 0 (0.0%) | 0 (0.0%) |
| 35 to 64 Years | 0 (0.0%) | 2 (1.8%) |
| 65 to 74 Years | 0 (0.0%) | 0 (0.0%) |
| 75 Years and over | 0 (0.0%) | 2 (8.7%) |
Technology Access in Gem Lake
Computing Device Access in Gem Lake
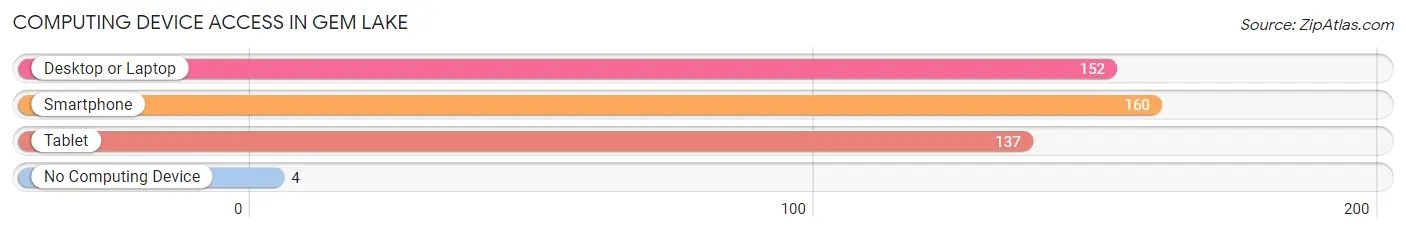
| Device Type | # Households | % Households |
| Desktop or Laptop | 152 | 86.9% |
| Smartphone | 160 | 91.4% |
| Tablet | 137 | 78.3% |
| No Computing Device | 4 | 2.3% |
| Total | 175 | 100.0% |
Internet Access in Gem Lake
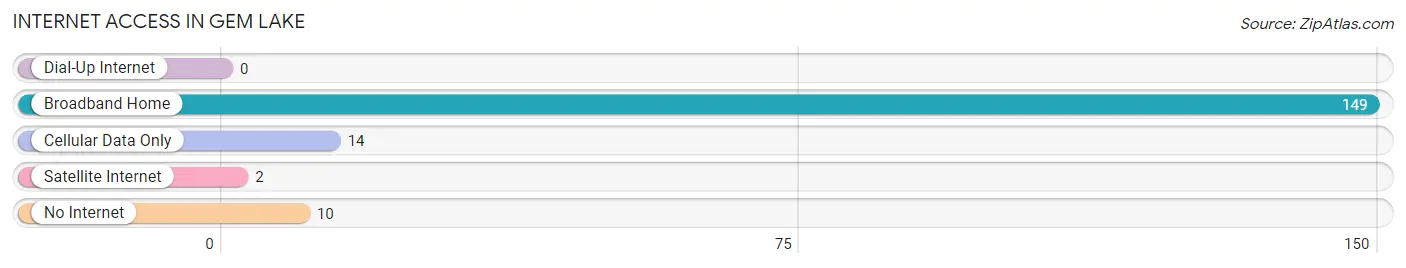
| Internet Type | # Households | % Households |
| Dial-Up Internet | 0 | 0.0% |
| Broadband Home | 149 | 85.1% |
| Cellular Data Only | 14 | 8.0% |
| Satellite Internet | 2 | 1.1% |
| No Internet | 10 | 5.7% |
| Total | 175 | 100.0% |
Gem Lake Summary
Gem Lake is a small city located in Ramsey County, Minnesota, United States. It is situated on the north shore of White Bear Lake, approximately 20 miles north of downtown Saint Paul. The city was incorporated in 1957 and has a population of approximately 4,000 people.
History
Gem Lake was first settled in the late 1800s by a group of German immigrants. The area was originally known as “Gemünden”, which translates to “gem village” in German. The name was later changed to Gem Lake when the city was incorporated in 1957.
The city was originally a farming community, but in the early 1900s, the area began to develop into a resort destination. The first resort was built in 1906 and was called the Gem Lake Hotel. The hotel was a popular destination for vacationers and was known for its beautiful views of White Bear Lake.
In the 1950s, the city began to experience rapid growth as more people moved to the area. This growth was largely due to the development of the nearby Twin Cities metropolitan area. The city was officially incorporated in 1957 and has since become a popular suburb of the Twin Cities.
Geography
Gem Lake is located in Ramsey County, Minnesota, approximately 20 miles north of downtown Saint Paul. The city is situated on the north shore of White Bear Lake and is bordered by the cities of White Bear Lake, Hugo, and Lino Lakes.
The city has a total area of 4.2 square miles, all of which is land. The terrain is mostly flat, with some rolling hills in the northern part of the city. The city is located in the St. Croix River Valley and is surrounded by several lakes, including White Bear Lake, Bald Eagle Lake, and Lake Elmo.
Economy
Gem Lake’s economy is largely based on tourism and retail. The city is home to several resorts and hotels, as well as a variety of restaurants and shops. The city is also home to several corporate offices, including those of 3M, Target, and Best Buy.
The city is also home to several manufacturing companies, including a paper mill and a plastics factory. The city is also home to several small businesses, including a variety of professional services, such as accounting and legal services.
Demographics
As of the 2010 census, the population of Gem Lake was 4,000 people. The racial makeup of the city was 94.2% White, 1.2% African American, 0.7% Native American, 1.2% Asian, 0.2% Pacific Islander, and 2.7% from other races. Hispanic or Latino of any race were 3.2% of the population.
The median household income in Gem Lake was $63,750, and the median family income was $76,250. The per capita income for the city was $30,945. About 4.2% of families and 5.7% of the population were below the poverty line, including 6.3% of those under age 18 and 4.2% of those age 65 or over.
Gem Lake is a small city with a rich history and a vibrant economy. The city is home to a variety of businesses, from resorts and hotels to manufacturing companies and professional services. The city is also home to a diverse population, with a variety of racial and ethnic backgrounds. Gem Lake is a great place to live, work, and play.
Common Questions
What is Per Capita Income in Gem Lake?
Per Capita income in Gem Lake is $72,123.
What is the Median Family Income in Gem Lake?
Median Family Income in Gem Lake is $146,250.
What is the Median Household income in Gem Lake?
Median Household Income in Gem Lake is $129,583.
What is Income or Wage Gap in Gem Lake?
Income or Wage Gap in Gem Lake is 32.0%.
Women in Gem Lake earn 68.0 cents for every dollar earned by a man.
What is Inequality or Gini Index in Gem Lake?
Inequality or Gini Index in Gem Lake is 0.47.
What is the Total Population of Gem Lake?
Total Population of Gem Lake is 475.
What is the Total Male Population of Gem Lake?
Total Male Population of Gem Lake is 222.
What is the Total Female Population of Gem Lake?
Total Female Population of Gem Lake is 253.
What is the Ratio of Males per 100 Females in Gem Lake?
There are 87.75 Males per 100 Females in Gem Lake.
What is the Ratio of Females per 100 Males in Gem Lake?
There are 113.96 Females per 100 Males in Gem Lake.
What is the Median Population Age in Gem Lake?
Median Population Age in Gem Lake is 42.3 Years.
What is the Average Family Size in Gem Lake
Average Family Size in Gem Lake is 3.0 People.
What is the Average Household Size in Gem Lake
Average Household Size in Gem Lake is 2.7 People.
How Large is the Labor Force in Gem Lake?
There are 241 People in the Labor Forcein in Gem Lake.
What is the Percentage of People in the Labor Force in Gem Lake?
67.1% of People are in the Labor Force in Gem Lake.
What is the Unemployment Rate in Gem Lake?
Unemployment Rate in Gem Lake is 0.8%.