Minnetonka Beach, MN Map & Demographics
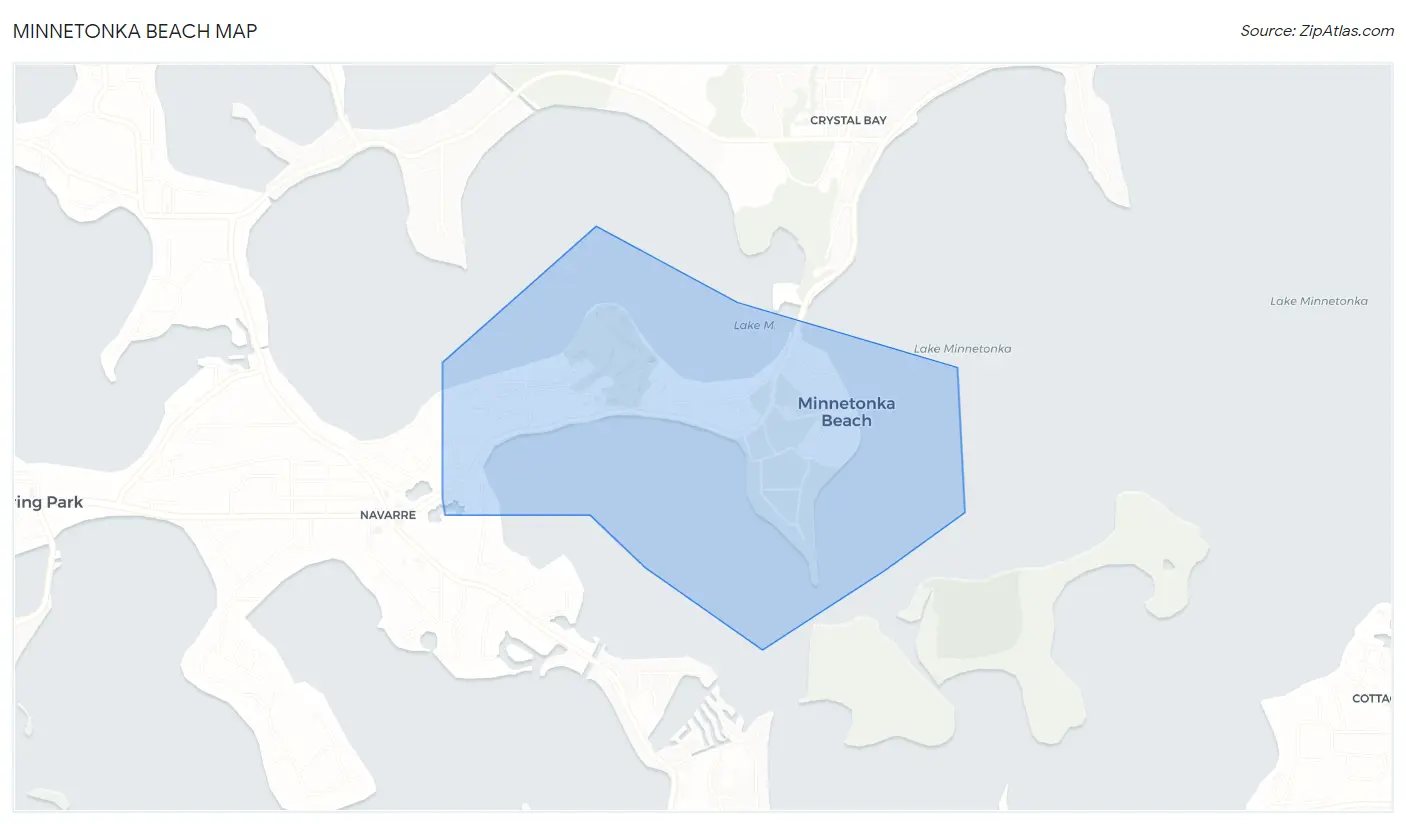
Minnetonka Beach Map
Minnetonka Beach Overview
$154,556
PER CAPITA INCOME
$250,001
AVG FAMILY INCOME
$250,001
AVG HOUSEHOLD INCOME
66.8%
WAGE / INCOME GAP [ % ]
33.2¢/ $1
WAGE / INCOME GAP [ $ ]
0.46
INEQUALITY / GINI INDEX
463
TOTAL POPULATION
230
MALE POPULATION
233
FEMALE POPULATION
98.71
MALES / 100 FEMALES
101.30
FEMALES / 100 MALES
45.3
MEDIAN AGE
3.1
AVG FAMILY SIZE
2.7
AVG HOUSEHOLD SIZE
240
LABOR FORCE [ PEOPLE ]
72.1%
PERCENT IN LABOR FORCE
Income in Minnetonka Beach
Income Overview in Minnetonka Beach
Per Capita Income in Minnetonka Beach is $154,556, while median incomes of families and households are $250,001 and $250,001 respectively.
| Characteristic | Number | Measure |
| Per Capita Income | 463 | $154,556 |
| Median Family Income | 134 | $250,001 |
| Mean Family Income | 134 | $426,593 |
| Median Household Income | 170 | $250,001 |
| Mean Household Income | 170 | $406,901 |
| Income Deficit | 134 | $0 |
| Wage / Income Gap (%) | 463 | 66.80% |
| Wage / Income Gap ($) | 463 | 33.20¢ per $1 |
| Gini / Inequality Index | 463 | 0.46 |
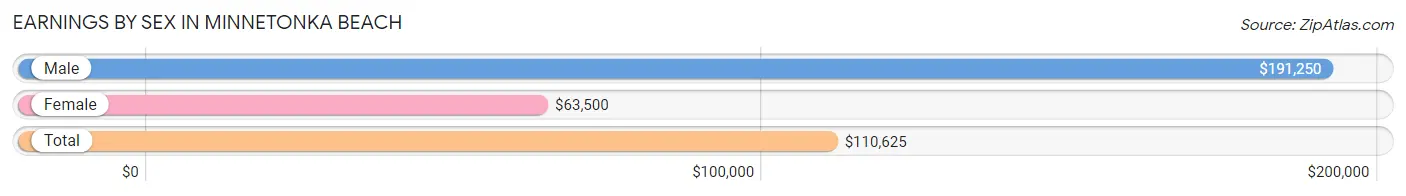
Earnings by Sex in Minnetonka Beach
Average Earnings in Minnetonka Beach are $110,625, $191,250 for men and $63,500 for women, a difference of 66.8%.
| Sex | Number | Average Earnings |
| Male | 142 (56.8%) | $191,250 |
| Female | 108 (43.2%) | $63,500 |
| Total | 250 (100.0%) | $110,625 |
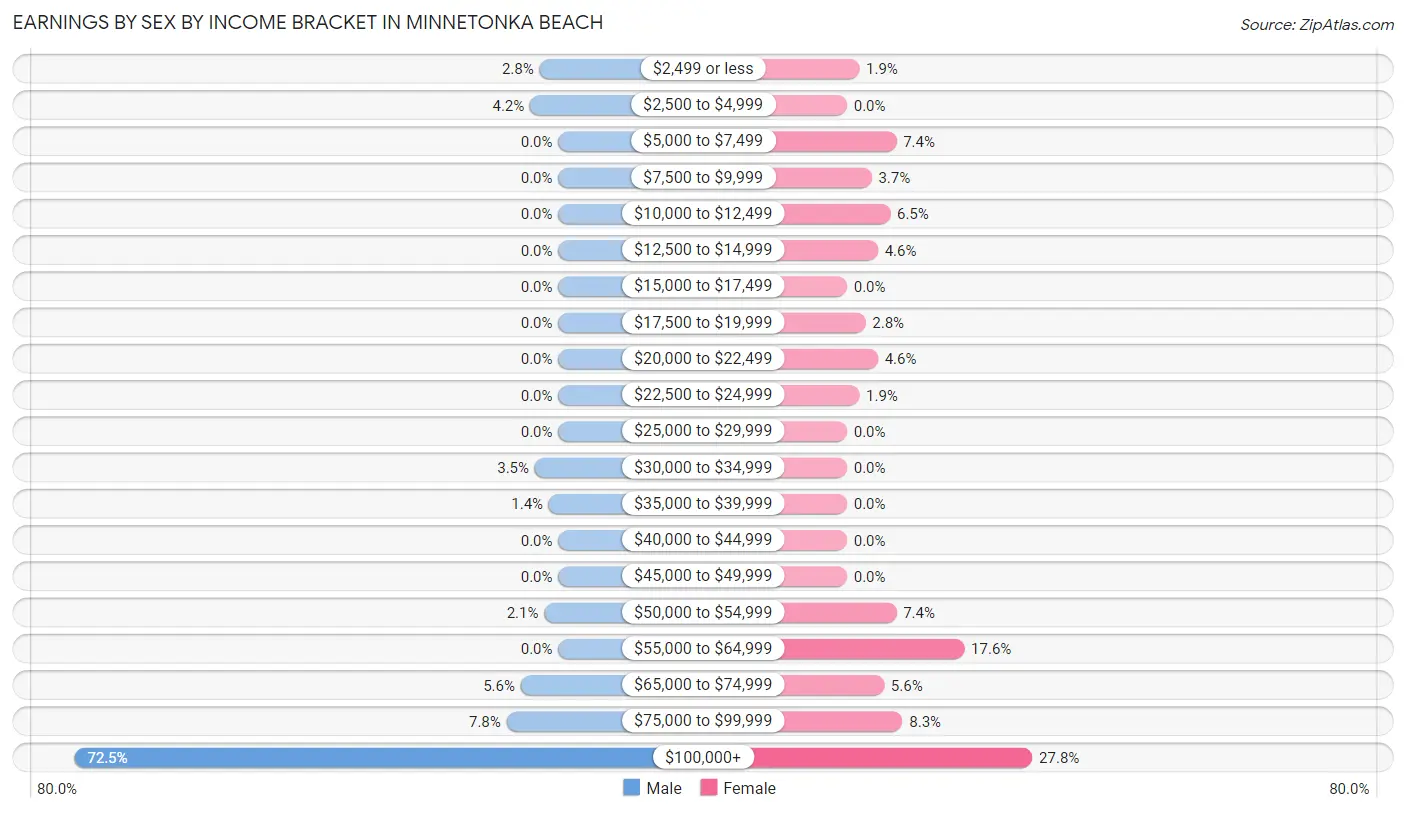
Earnings by Sex by Income Bracket in Minnetonka Beach
The most common earnings brackets in Minnetonka Beach are $100,000+ for men (103 | 72.5%) and $100,000+ for women (30 | 27.8%).
| Income | Male | Female |
| $2,499 or less | 4 (2.8%) | 2 (1.8%) |
| $2,500 to $4,999 | 6 (4.2%) | 0 (0.0%) |
| $5,000 to $7,499 | 0 (0.0%) | 8 (7.4%) |
| $7,500 to $9,999 | 0 (0.0%) | 4 (3.7%) |
| $10,000 to $12,499 | 0 (0.0%) | 7 (6.5%) |
| $12,500 to $14,999 | 0 (0.0%) | 5 (4.6%) |
| $15,000 to $17,499 | 0 (0.0%) | 0 (0.0%) |
| $17,500 to $19,999 | 0 (0.0%) | 3 (2.8%) |
| $20,000 to $22,499 | 0 (0.0%) | 5 (4.6%) |
| $22,500 to $24,999 | 0 (0.0%) | 2 (1.8%) |
| $25,000 to $29,999 | 0 (0.0%) | 0 (0.0%) |
| $30,000 to $34,999 | 5 (3.5%) | 0 (0.0%) |
| $35,000 to $39,999 | 2 (1.4%) | 0 (0.0%) |
| $40,000 to $44,999 | 0 (0.0%) | 0 (0.0%) |
| $45,000 to $49,999 | 0 (0.0%) | 0 (0.0%) |
| $50,000 to $54,999 | 3 (2.1%) | 8 (7.4%) |
| $55,000 to $64,999 | 0 (0.0%) | 19 (17.6%) |
| $65,000 to $74,999 | 8 (5.6%) | 6 (5.6%) |
| $75,000 to $99,999 | 11 (7.7%) | 9 (8.3%) |
| $100,000+ | 103 (72.5%) | 30 (27.8%) |
| Total | 142 (100.0%) | 108 (100.0%) |
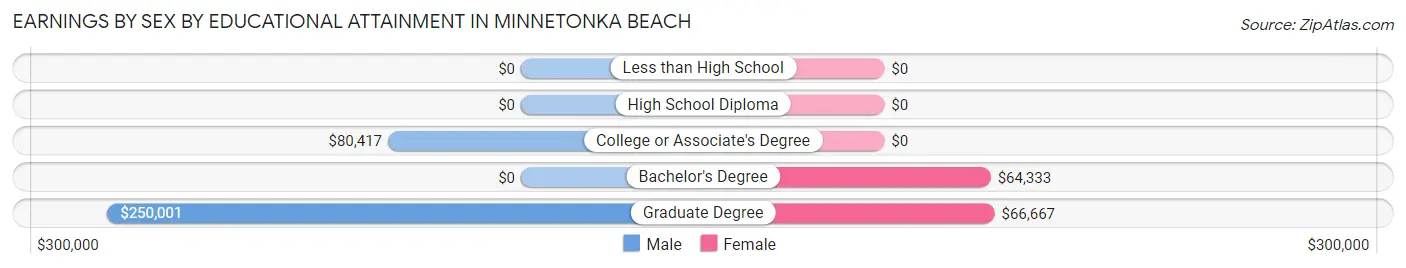
Earnings by Sex by Educational Attainment in Minnetonka Beach
Average earnings in Minnetonka Beach are $250,001 for men and $64,167 for women, a difference of 74.3%. Men with an educational attainment of graduate degree enjoy the highest average annual earnings of $250,001, while those with college or associate's degree education earn the least with $80,417. Women with an educational attainment of graduate degree earn the most with the average annual earnings of $66,667, while those with bachelor's degree education have the smallest earnings of $64,333.
| Educational Attainment | Male Income | Female Income |
| Less than High School | - | - |
| High School Diploma | - | - |
| College or Associate's Degree | $80,417 | $0 |
| Bachelor's Degree | - | - |
| Graduate Degree | $250,001 | $66,667 |
| Total | $250,001 | $64,167 |
Family Income in Minnetonka Beach
Family Income Brackets in Minnetonka Beach
According to the Minnetonka Beach family income data, there are 95 families falling into the $200,000+ income range, which is the most common income bracket and makes up 70.9% of all families.
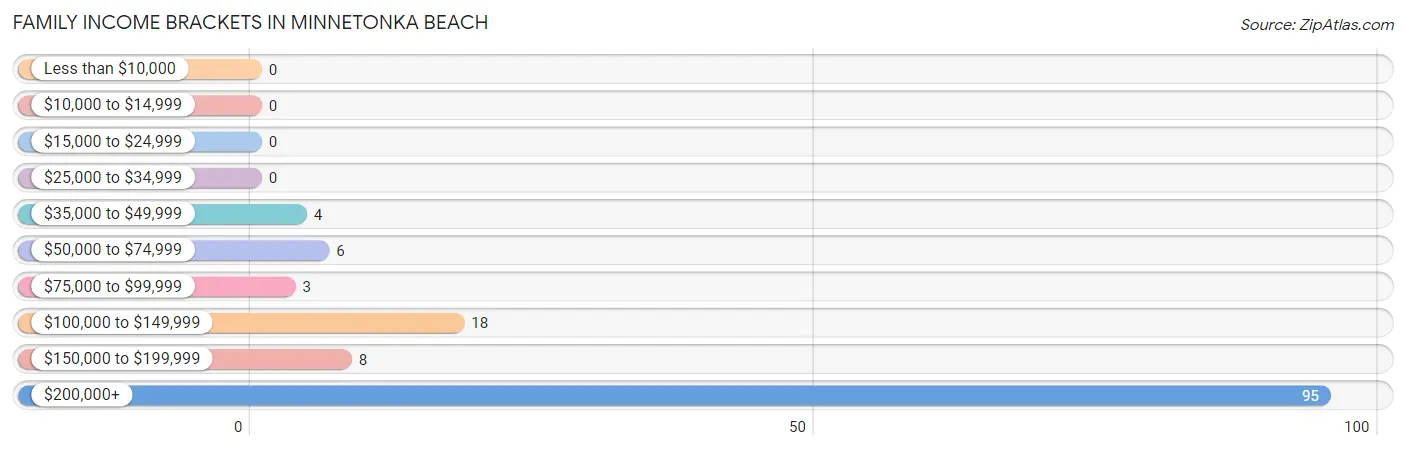
| Income Bracket | # Families | % Families |
| Less than $10,000 | 0 | 0.0% |
| $10,000 to $14,999 | 0 | 0.0% |
| $15,000 to $24,999 | 0 | 0.0% |
| $25,000 to $34,999 | 0 | 0.0% |
| $35,000 to $49,999 | 4 | 3.0% |
| $50,000 to $74,999 | 6 | 4.5% |
| $75,000 to $99,999 | 3 | 2.2% |
| $100,000 to $149,999 | 18 | 13.4% |
| $150,000 to $199,999 | 8 | 6.0% |
| $200,000+ | 95 | 70.9% |
Family Income by Famaliy Size in Minnetonka Beach
2-person families (54 | 40.3%) account for the highest median family income in Minnetonka Beach with $250,001 per family, while 2-person families (54 | 40.3%) have the highest median income of $125,000 per family member.
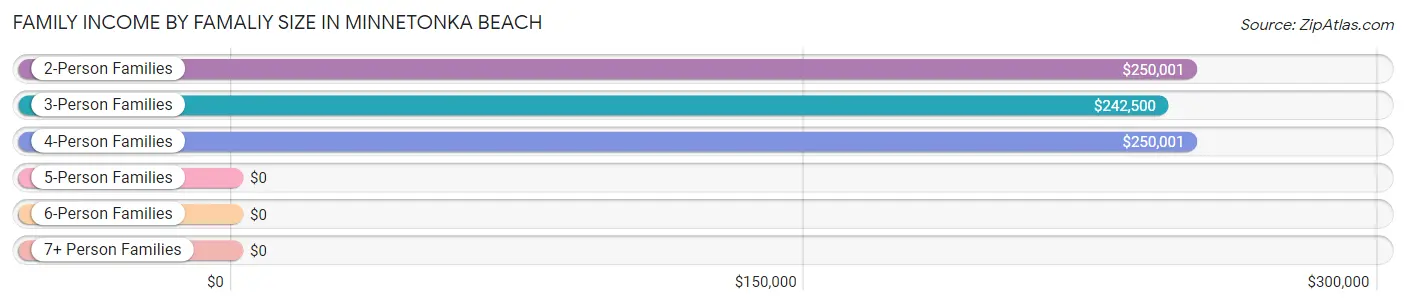
| Income Bracket | # Families | Median Income |
| 2-Person Families | 54 (40.3%) | $250,001 |
| 3-Person Families | 30 (22.4%) | $242,500 |
| 4-Person Families | 42 (31.3%) | $250,001 |
| 5-Person Families | 3 (2.2%) | $0 |
| 6-Person Families | 5 (3.7%) | $0 |
| 7+ Person Families | 0 (0.0%) | $0 |
| Total | 134 (100.0%) | $250,001 |
Family Income by Number of Earners in Minnetonka Beach
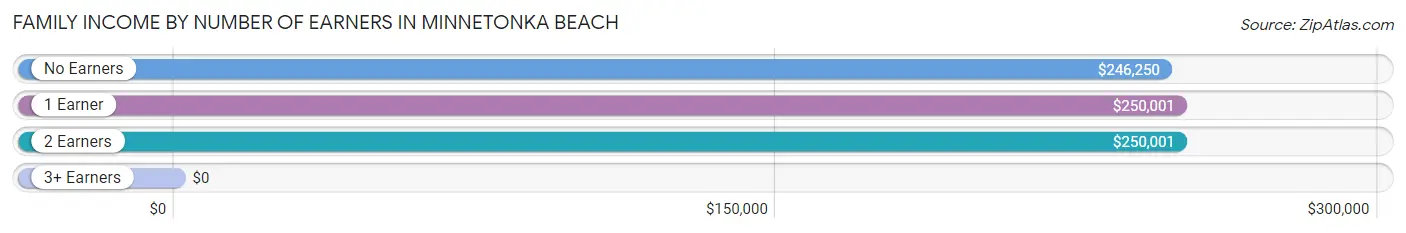
| Number of Earners | # Families | Median Income |
| No Earners | 8 (6.0%) | $246,250 |
| 1 Earner | 44 (32.8%) | $250,001 |
| 2 Earners | 80 (59.7%) | $250,001 |
| 3+ Earners | 2 (1.5%) | $0 |
| Total | 134 (100.0%) | $250,001 |
Household Income in Minnetonka Beach
Household Income Brackets in Minnetonka Beach
With 108 households falling in the category, the $200,000+ income range is the most frequent in Minnetonka Beach, accounting for 63.5% of all households.
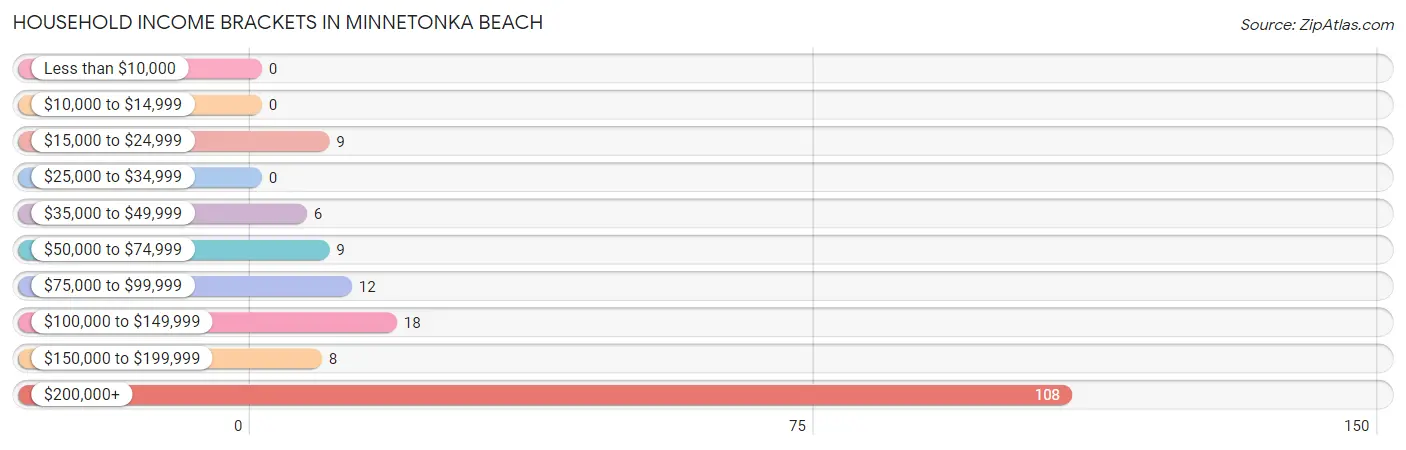
| Income Bracket | # Households | % Households |
| Less than $10,000 | 0 | 0.0% |
| $10,000 to $14,999 | 0 | 0.0% |
| $15,000 to $24,999 | 9 | 5.3% |
| $25,000 to $34,999 | 0 | 0.0% |
| $35,000 to $49,999 | 6 | 3.5% |
| $50,000 to $74,999 | 9 | 5.3% |
| $75,000 to $99,999 | 12 | 7.1% |
| $100,000 to $149,999 | 18 | 10.6% |
| $150,000 to $199,999 | 8 | 4.7% |
| $200,000+ | 108 | 63.5% |
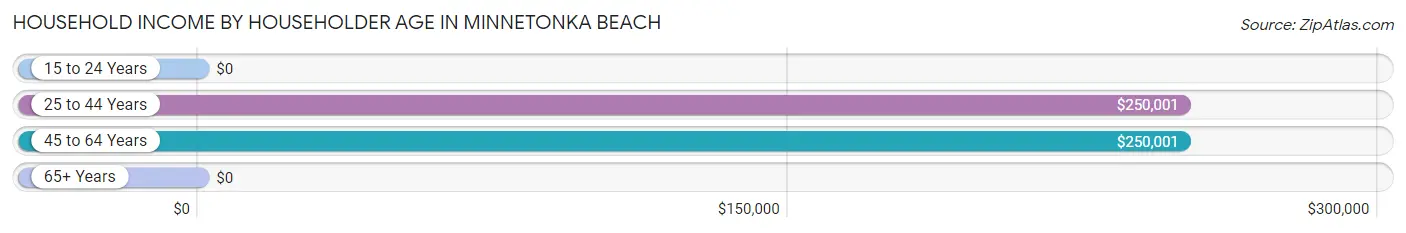
Household Income by Householder Age in Minnetonka Beach
The median household income in Minnetonka Beach is $250,001, with the highest median household income of $250,001 found in the 25 to 44 years age bracket for the primary householder. A total of 37 households (21.8%) fall into this category. Meanwhile, the 15 to 24 years age bracket for the primary householder has the lowest median household income of $0, with 3 households (1.8%) in this group.
| Income Bracket | # Households | Median Income |
| 15 to 24 Years | 3 (1.8%) | $0 |
| 25 to 44 Years | 37 (21.8%) | $250,001 |
| 45 to 64 Years | 89 (52.3%) | $250,001 |
| 65+ Years | 41 (24.1%) | $0 |
| Total | 170 (100.0%) | $250,001 |
Poverty in Minnetonka Beach
Income Below Poverty by Sex and Age in Minnetonka Beach
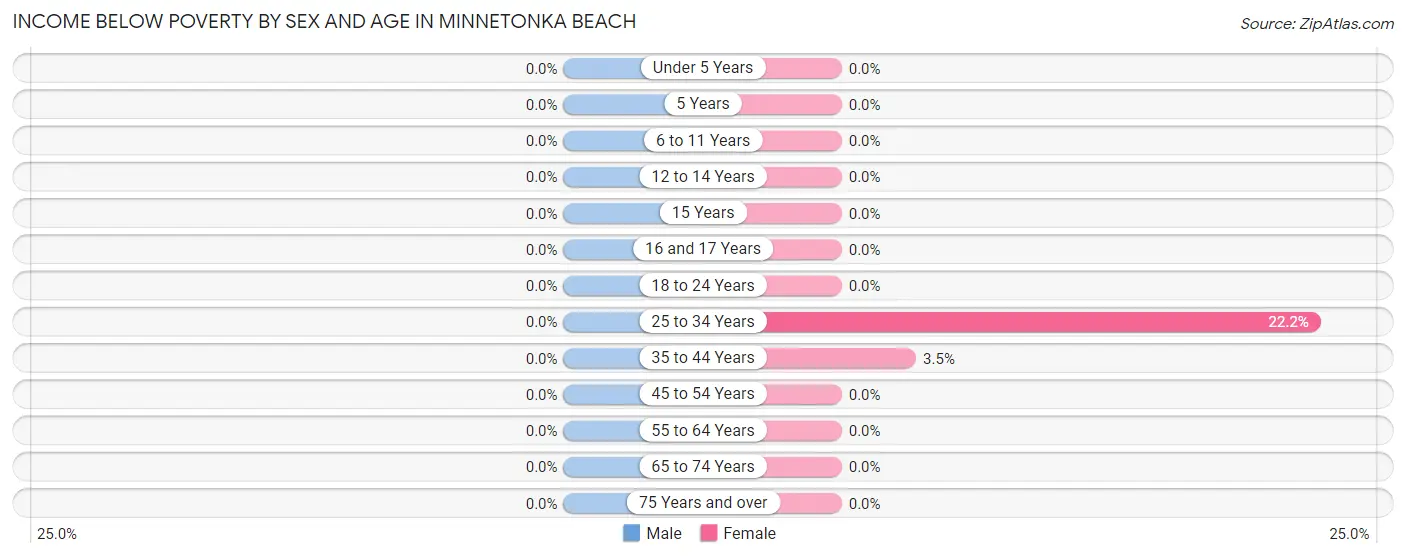
| Age Bracket | Male | Female |
| Under 5 Years | 0 (0.0%) | 0 (0.0%) |
| 5 Years | 0 (0.0%) | 0 (0.0%) |
| 6 to 11 Years | 0 (0.0%) | 0 (0.0%) |
| 12 to 14 Years | 0 (0.0%) | 0 (0.0%) |
| 15 Years | 0 (0.0%) | 0 (0.0%) |
| 16 and 17 Years | 0 (0.0%) | 0 (0.0%) |
| 18 to 24 Years | 0 (0.0%) | 0 (0.0%) |
| 25 to 34 Years | 0 (0.0%) | 2 (22.2%) |
| 35 to 44 Years | 0 (0.0%) | 1 (3.5%) |
| 45 to 54 Years | 0 (0.0%) | 0 (0.0%) |
| 55 to 64 Years | 0 (0.0%) | 0 (0.0%) |
| 65 to 74 Years | 0 (0.0%) | 0 (0.0%) |
| 75 Years and over | 0 (0.0%) | 0 (0.0%) |
| Total | 0 (0.0%) | 3 (1.3%) |
Income Above Poverty by Sex and Age in Minnetonka Beach
According to the poverty statistics in Minnetonka Beach, males aged under 5 years and females aged under 5 years are the age groups that are most secure financially, with 100.0% of males and 100.0% of females in these age groups living above the poverty line.
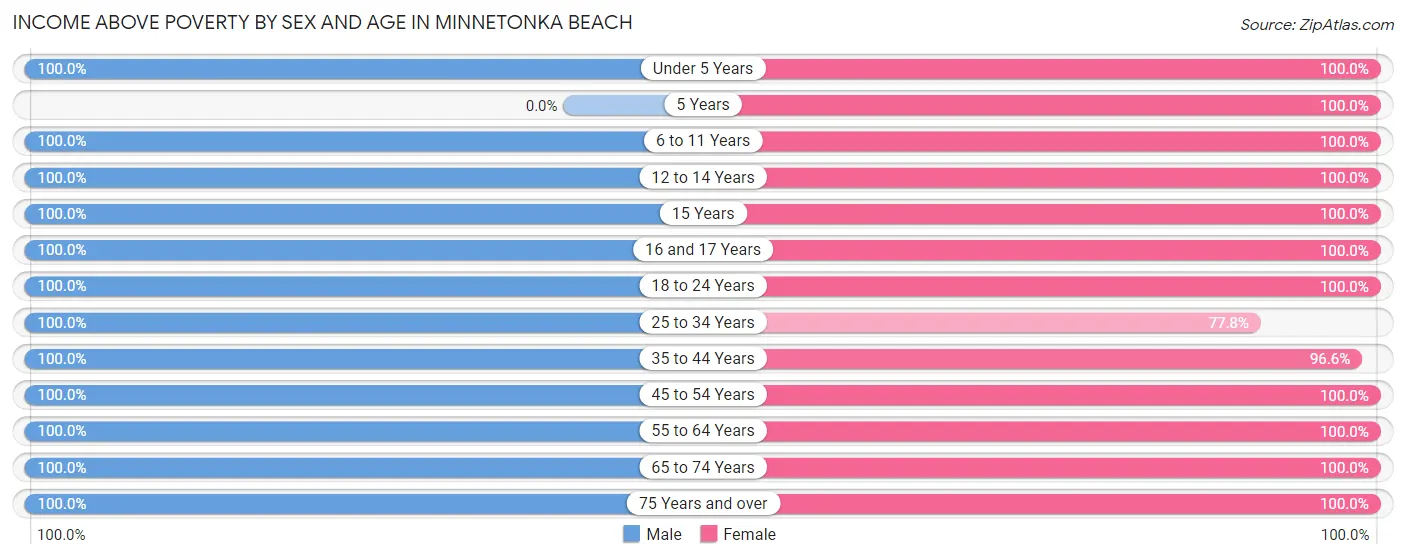
| Age Bracket | Male | Female |
| Under 5 Years | 11 (100.0%) | 6 (100.0%) |
| 5 Years | 0 (0.0%) | 10 (100.0%) |
| 6 to 11 Years | 36 (100.0%) | 19 (100.0%) |
| 12 to 14 Years | 15 (100.0%) | 19 (100.0%) |
| 15 Years | 2 (100.0%) | 9 (100.0%) |
| 16 and 17 Years | 2 (100.0%) | 4 (100.0%) |
| 18 to 24 Years | 13 (100.0%) | 9 (100.0%) |
| 25 to 34 Years | 8 (100.0%) | 7 (77.8%) |
| 35 to 44 Years | 25 (100.0%) | 28 (96.6%) |
| 45 to 54 Years | 47 (100.0%) | 59 (100.0%) |
| 55 to 64 Years | 38 (100.0%) | 27 (100.0%) |
| 65 to 74 Years | 22 (100.0%) | 16 (100.0%) |
| 75 Years and over | 9 (100.0%) | 16 (100.0%) |
| Total | 228 (100.0%) | 229 (98.7%) |
Income Below Poverty Among Married-Couple Families in Minnetonka Beach
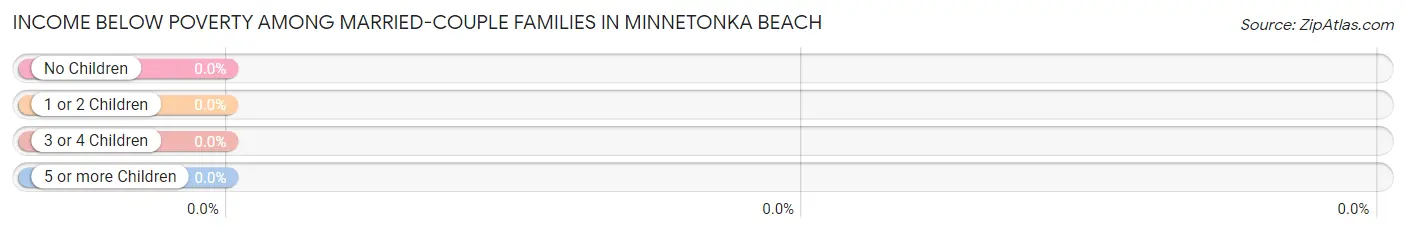
| Children | Above Poverty | Below Poverty |
| No Children | 59 (100.0%) | 0 (0.0%) |
| 1 or 2 Children | 57 (100.0%) | 0 (0.0%) |
| 3 or 4 Children | 7 (100.0%) | 0 (0.0%) |
| 5 or more Children | 0 (0.0%) | 0 (0.0%) |
| Total | 123 (100.0%) | 0 (0.0%) |
Income Below Poverty Among Single-Parent Households in Minnetonka Beach
| Children | Single Father | Single Mother |
| No Children | 0 (0.0%) | 0 (0.0%) |
| 1 or 2 Children | 0 (0.0%) | 0 (0.0%) |
| 3 or 4 Children | 0 (0.0%) | 0 (0.0%) |
| 5 or more Children | 0 (0.0%) | 0 (0.0%) |
| Total | 0 (0.0%) | 0 (0.0%) |
Income Below Poverty Among Married-Couple vs Single-Parent Households in Minnetonka Beach
| Children | Married-Couple Families | Single-Parent Households |
| No Children | 0 (0.0%) | 0 (0.0%) |
| 1 or 2 Children | 0 (0.0%) | 0 (0.0%) |
| 3 or 4 Children | 0 (0.0%) | 0 (0.0%) |
| 5 or more Children | 0 (0.0%) | 0 (0.0%) |
| Total | 0 (0.0%) | 0 (0.0%) |
Race in Minnetonka Beach
The most populous races in Minnetonka Beach are White / Caucasian (439 | 94.8%), Two or more Races (21 | 4.5%), and Hispanic or Latino (13 | 2.8%).
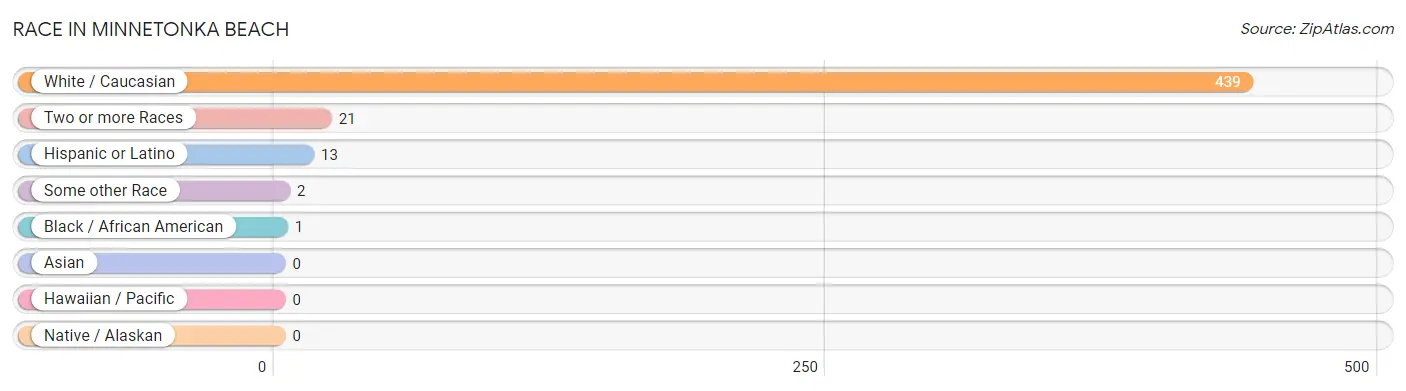
| Race | # Population | % Population |
| Asian | 0 | 0.0% |
| Black / African American | 1 | 0.2% |
| Hawaiian / Pacific | 0 | 0.0% |
| Hispanic or Latino | 13 | 2.8% |
| Native / Alaskan | 0 | 0.0% |
| White / Caucasian | 439 | 94.8% |
| Two or more Races | 21 | 4.5% |
| Some other Race | 2 | 0.4% |
| Total | 463 | 100.0% |
Ancestry in Minnetonka Beach
The most populous ancestries reported in Minnetonka Beach are German (141 | 30.4%), Irish (102 | 22.0%), English (61 | 13.2%), Norwegian (52 | 11.2%), and Polish (45 | 9.7%), together accounting for 86.6% of all Minnetonka Beach residents.
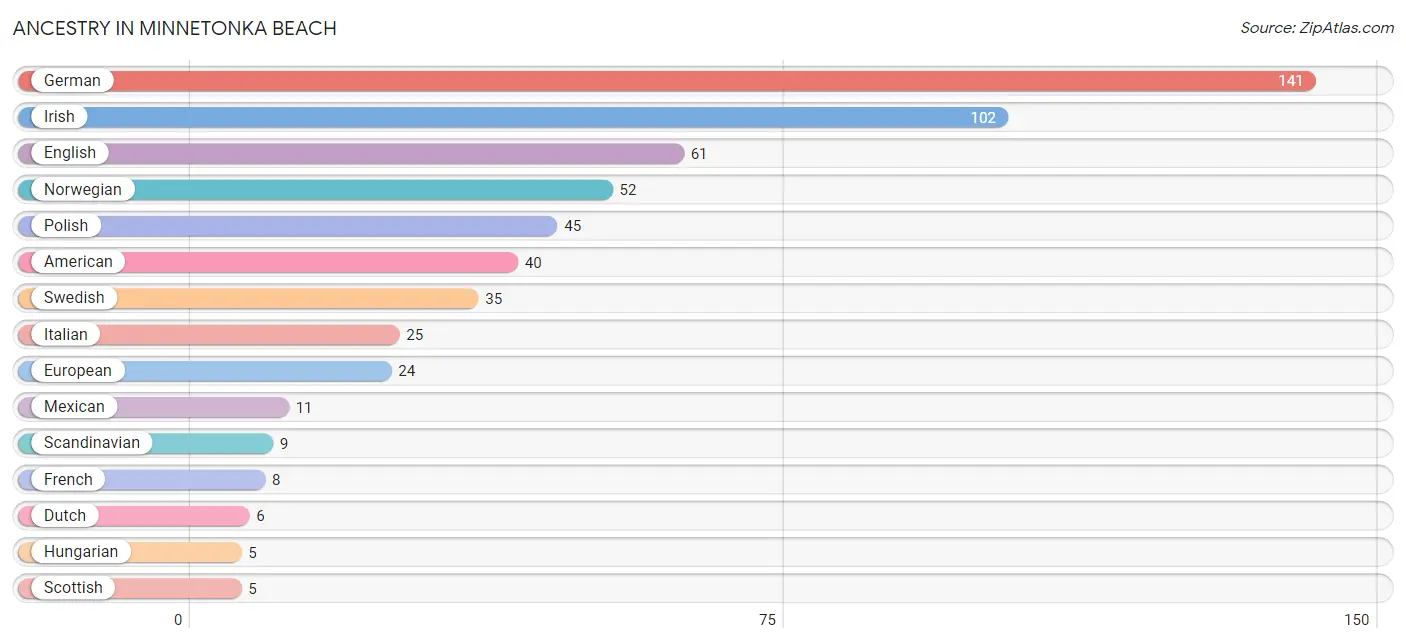
| Ancestry | # Population | % Population |
| American | 40 | 8.6% |
| Australian | 1 | 0.2% |
| Austrian | 3 | 0.6% |
| Burmese | 3 | 0.6% |
| Danish | 4 | 0.9% |
| Dutch | 6 | 1.3% |
| Ecuadorian | 2 | 0.4% |
| English | 61 | 13.2% |
| European | 24 | 5.2% |
| French | 8 | 1.7% |
| German | 141 | 30.4% |
| Hungarian | 5 | 1.1% |
| Irish | 102 | 22.0% |
| Italian | 25 | 5.4% |
| Lithuanian | 3 | 0.6% |
| Mexican | 11 | 2.4% |
| Norwegian | 52 | 11.2% |
| Polish | 45 | 9.7% |
| Russian | 2 | 0.4% |
| Scandinavian | 9 | 1.9% |
| Scottish | 5 | 1.1% |
| South American | 2 | 0.4% |
| Swedish | 35 | 7.6% |
| Swiss | 5 | 1.1% |
| Welsh | 3 | 0.6% | View All 25 Rows |
Immigrants in Minnetonka Beach
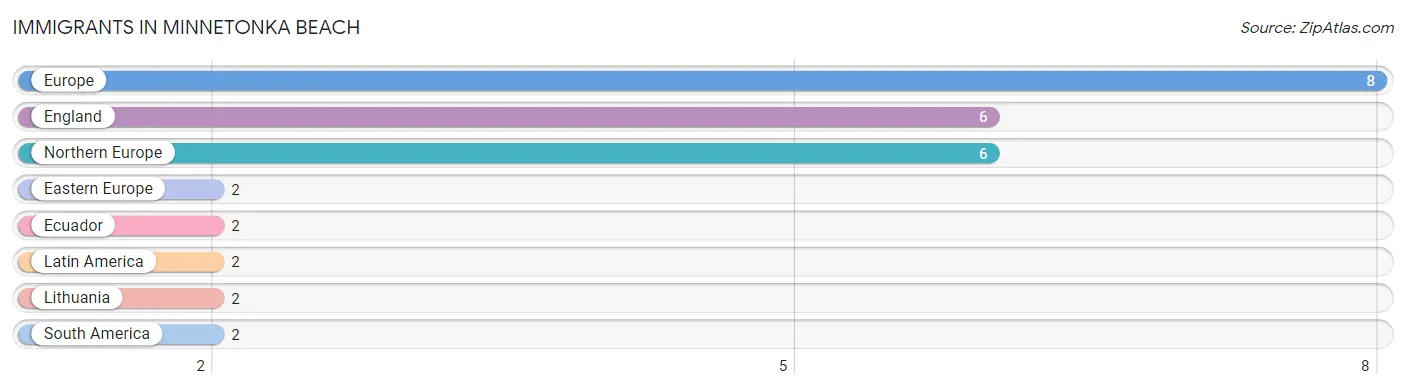
The most numerous immigrant groups reported in Minnetonka Beach came from Europe (8 | 1.7%), England (6 | 1.3%), Northern Europe (6 | 1.3%), Eastern Europe (2 | 0.4%), and Ecuador (2 | 0.4%), together accounting for 5.2% of all Minnetonka Beach residents.
| Immigration Origin | # Population | % Population |
| Eastern Europe | 2 | 0.4% |
| Ecuador | 2 | 0.4% |
| England | 6 | 1.3% |
| Europe | 8 | 1.7% |
| Latin America | 2 | 0.4% |
| Lithuania | 2 | 0.4% |
| Northern Europe | 6 | 1.3% |
| South America | 2 | 0.4% | View All 8 Rows |
Sex and Age in Minnetonka Beach
Sex and Age in Minnetonka Beach
The most populous age groups in Minnetonka Beach are 10 to 14 Years (35 | 15.2%) for men and 45 to 49 Years (36 | 15.4%) for women.
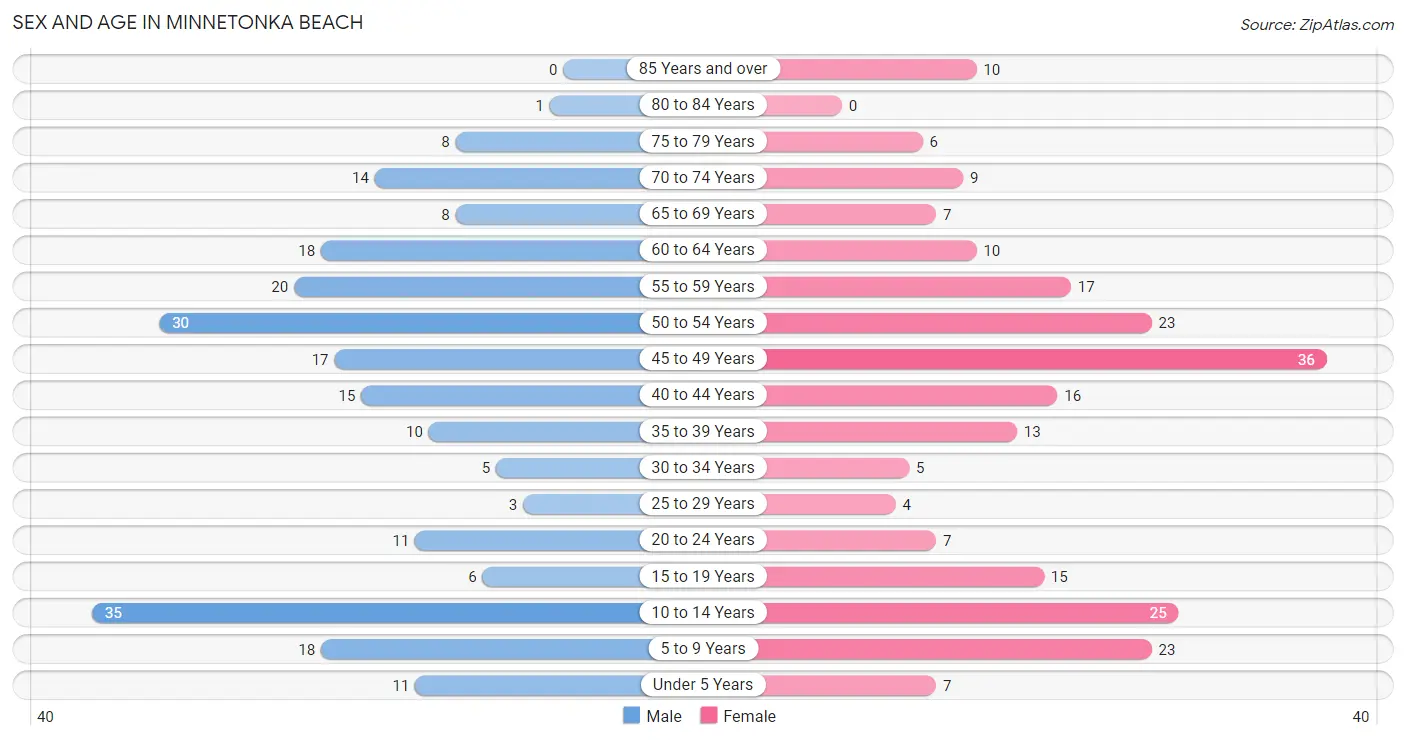
| Age Bracket | Male | Female |
| Under 5 Years | 11 (4.8%) | 7 (3.0%) |
| 5 to 9 Years | 18 (7.8%) | 23 (9.9%) |
| 10 to 14 Years | 35 (15.2%) | 25 (10.7%) |
| 15 to 19 Years | 6 (2.6%) | 15 (6.4%) |
| 20 to 24 Years | 11 (4.8%) | 7 (3.0%) |
| 25 to 29 Years | 3 (1.3%) | 4 (1.7%) |
| 30 to 34 Years | 5 (2.2%) | 5 (2.1%) |
| 35 to 39 Years | 10 (4.3%) | 13 (5.6%) |
| 40 to 44 Years | 15 (6.5%) | 16 (6.9%) |
| 45 to 49 Years | 17 (7.4%) | 36 (15.4%) |
| 50 to 54 Years | 30 (13.0%) | 23 (9.9%) |
| 55 to 59 Years | 20 (8.7%) | 17 (7.3%) |
| 60 to 64 Years | 18 (7.8%) | 10 (4.3%) |
| 65 to 69 Years | 8 (3.5%) | 7 (3.0%) |
| 70 to 74 Years | 14 (6.1%) | 9 (3.9%) |
| 75 to 79 Years | 8 (3.5%) | 6 (2.6%) |
| 80 to 84 Years | 1 (0.4%) | 0 (0.0%) |
| 85 Years and over | 0 (0.0%) | 10 (4.3%) |
| Total | 230 (100.0%) | 233 (100.0%) |
Families and Households in Minnetonka Beach
Median Family Size in Minnetonka Beach
The median family size in Minnetonka Beach is 3.11 persons per family, with single female/mother families (2 | 1.5%) accounting for the largest median family size of 4.5 persons per family. On the other hand, single male/father families (9 | 6.7%) represent the smallest median family size with 2.22 persons per family.
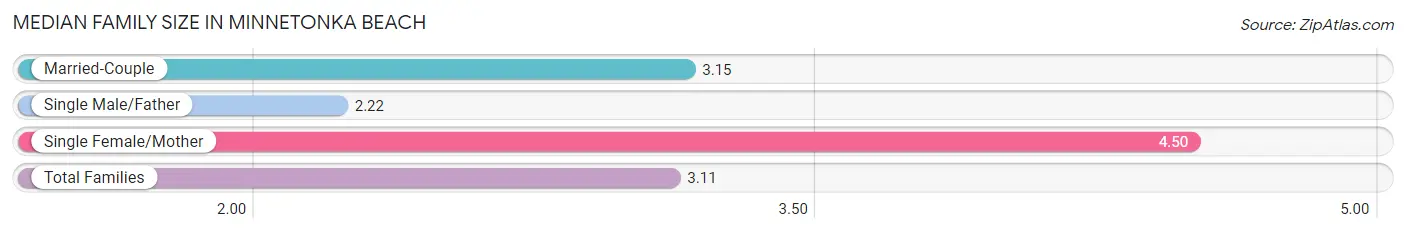
| Family Type | # Families | Family Size |
| Married-Couple | 123 (91.8%) | 3.15 |
| Single Male/Father | 9 (6.7%) | 2.22 |
| Single Female/Mother | 2 (1.5%) | 4.50 |
| Total Families | 134 (100.0%) | 3.11 |
Median Household Size in Minnetonka Beach
The median household size in Minnetonka Beach is 2.72 persons per household, with single female/mother households (2 | 1.2%) accounting for the largest median household size of 5.5 persons per household. non-family households (36 | 21.2%) represent the smallest median household size with 1.17 persons per household.
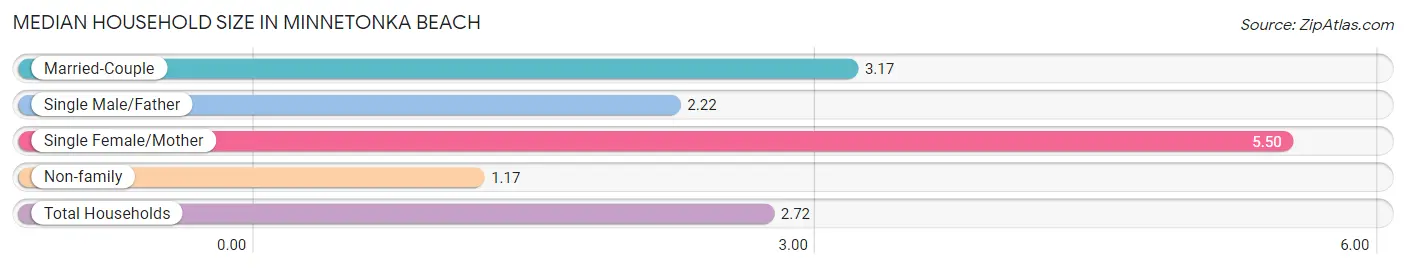
| Household Type | # Households | Household Size |
| Married-Couple | 123 (72.4%) | 3.17 |
| Single Male/Father | 9 (5.3%) | 2.22 |
| Single Female/Mother | 2 (1.2%) | 5.50 |
| Non-family | 36 (21.2%) | 1.17 |
| Total Households | 170 (100.0%) | 2.72 |
Household Size by Marriage Status in Minnetonka Beach
Out of a total of 170 households in Minnetonka Beach, 134 (78.8%) are family households, while 36 (21.2%) are nonfamily households. The most numerous type of family households are 2-person households, comprising 54, and the most common type of nonfamily households are 1-person households, comprising 35.
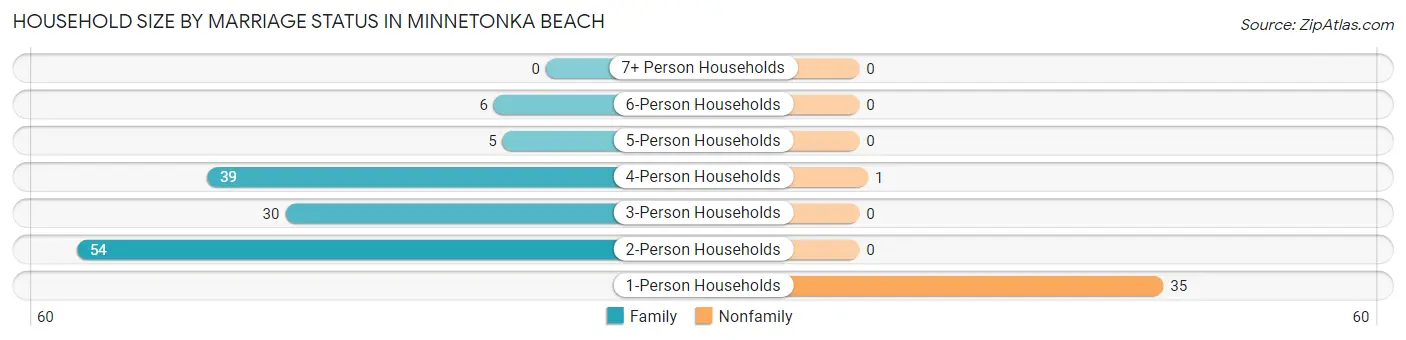
| Household Size | Family Households | Nonfamily Households |
| 1-Person Households | - | 35 (20.6%) |
| 2-Person Households | 54 (31.8%) | 0 (0.0%) |
| 3-Person Households | 30 (17.6%) | 0 (0.0%) |
| 4-Person Households | 39 (22.9%) | 1 (0.6%) |
| 5-Person Households | 5 (2.9%) | 0 (0.0%) |
| 6-Person Households | 6 (3.5%) | 0 (0.0%) |
| 7+ Person Households | 0 (0.0%) | 0 (0.0%) |
| Total | 134 (78.8%) | 36 (21.2%) |
Female Fertility in Minnetonka Beach
Fertility by Age in Minnetonka Beach
Average fertility rate in Minnetonka Beach is 31.0 births per 1,000 women. Women in the age bracket of 20 to 34 years have the highest fertility rate with 188.0 births per 1,000 women. Women in the age bracket of 20 to 34 years acount for 100.0% of all women with births.
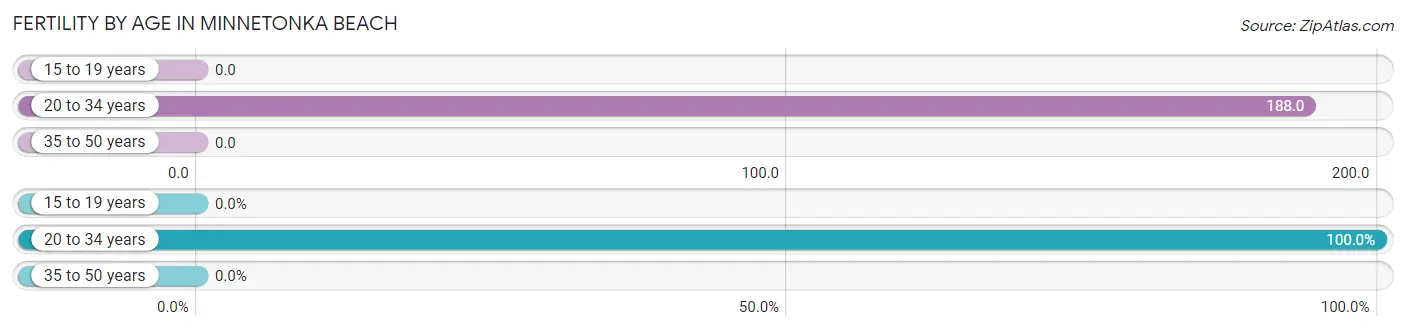
| Age Bracket | Women with Births | Births / 1,000 Women |
| 15 to 19 years | 0 (0.0%) | 0.0 |
| 20 to 34 years | 3 (100.0%) | 188.0 |
| 35 to 50 years | 0 (0.0%) | 0.0 |
| Total | 3 (100.0%) | 31.0 |
Fertility by Age by Marriage Status in Minnetonka Beach
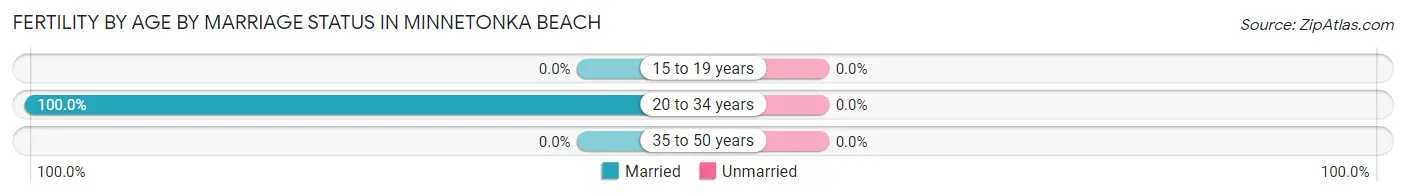
| Age Bracket | Married | Unmarried |
| 15 to 19 years | 0 (0.0%) | 0 (0.0%) |
| 20 to 34 years | 3 (100.0%) | 0 (0.0%) |
| 35 to 50 years | 0 (0.0%) | 0 (0.0%) |
| Total | 3 (100.0%) | 0 (0.0%) |
Fertility by Education in Minnetonka Beach
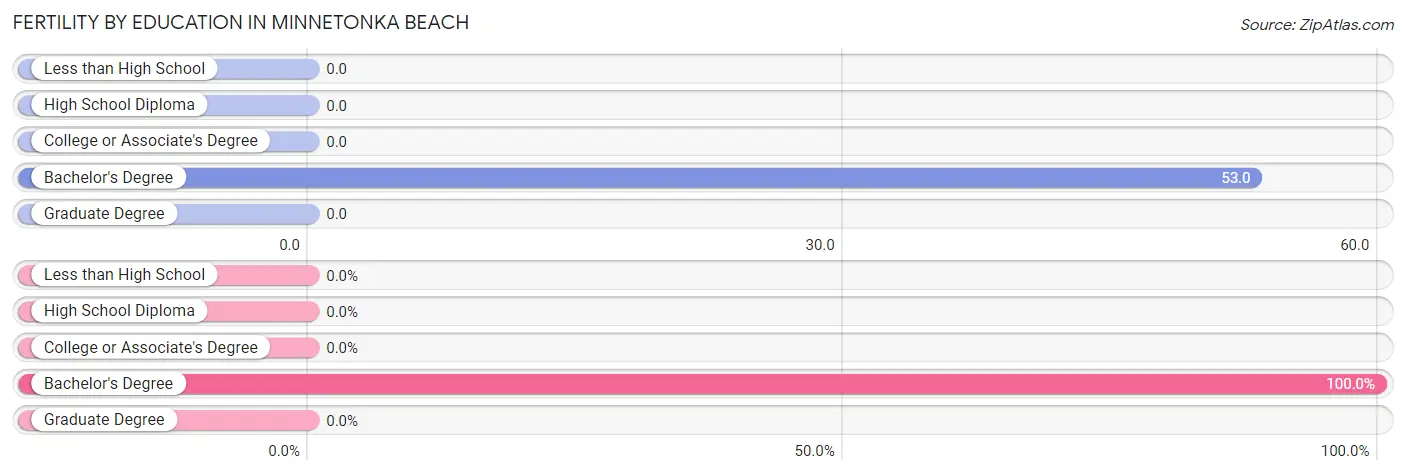
| Educational Attainment | Women with Births | Births / 1,000 Women |
| Less than High School | 0 (0.0%) | 0.0 |
| High School Diploma | 0 (0.0%) | 0.0 |
| College or Associate's Degree | 0 (0.0%) | 0.0 |
| Bachelor's Degree | 3 (100.0%) | 53.0 |
| Graduate Degree | 0 (0.0%) | 0.0 |
| Total | 3 (100.0%) | 31.0 |
Fertility by Education by Marriage Status in Minnetonka Beach
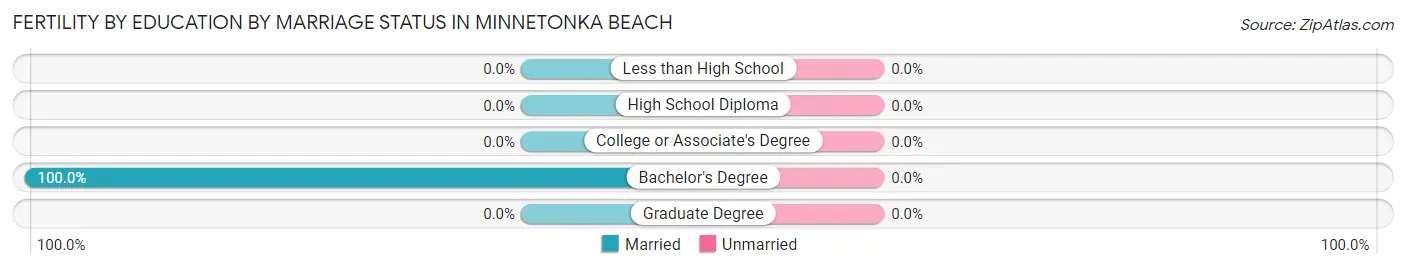
| Educational Attainment | Married | Unmarried |
| Less than High School | 0 (0.0%) | 0 (0.0%) |
| High School Diploma | 0 (0.0%) | 0 (0.0%) |
| College or Associate's Degree | 0 (0.0%) | 0 (0.0%) |
| Bachelor's Degree | 3 (100.0%) | 0 (0.0%) |
| Graduate Degree | 0 (0.0%) | 0 (0.0%) |
| Total | 3 (100.0%) | 0 (0.0%) |
Employment Characteristics in Minnetonka Beach
Employment by Class of Employer in Minnetonka Beach
Among the 240 employed individuals in Minnetonka Beach, private company employees (169 | 70.4%), self-employed (not incorporated) (23 | 9.6%), and self-employed (incorporated) (22 | 9.2%) make up the most common classes of employment.
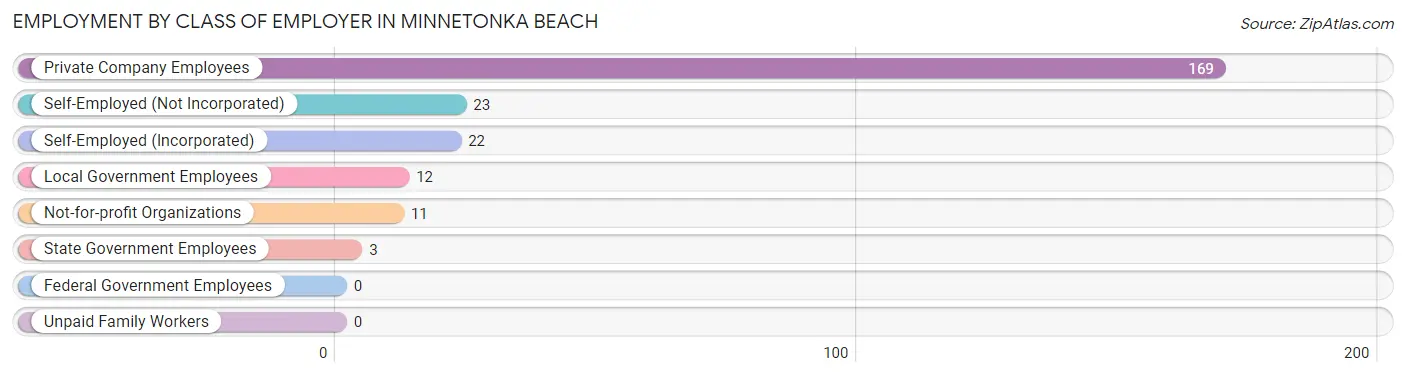
| Employer Class | # Employees | % Employees |
| Private Company Employees | 169 | 70.4% |
| Self-Employed (Incorporated) | 22 | 9.2% |
| Self-Employed (Not Incorporated) | 23 | 9.6% |
| Not-for-profit Organizations | 11 | 4.6% |
| Local Government Employees | 12 | 5.0% |
| State Government Employees | 3 | 1.3% |
| Federal Government Employees | 0 | 0.0% |
| Unpaid Family Workers | 0 | 0.0% |
| Total | 240 | 100.0% |
Employment Status by Age in Minnetonka Beach
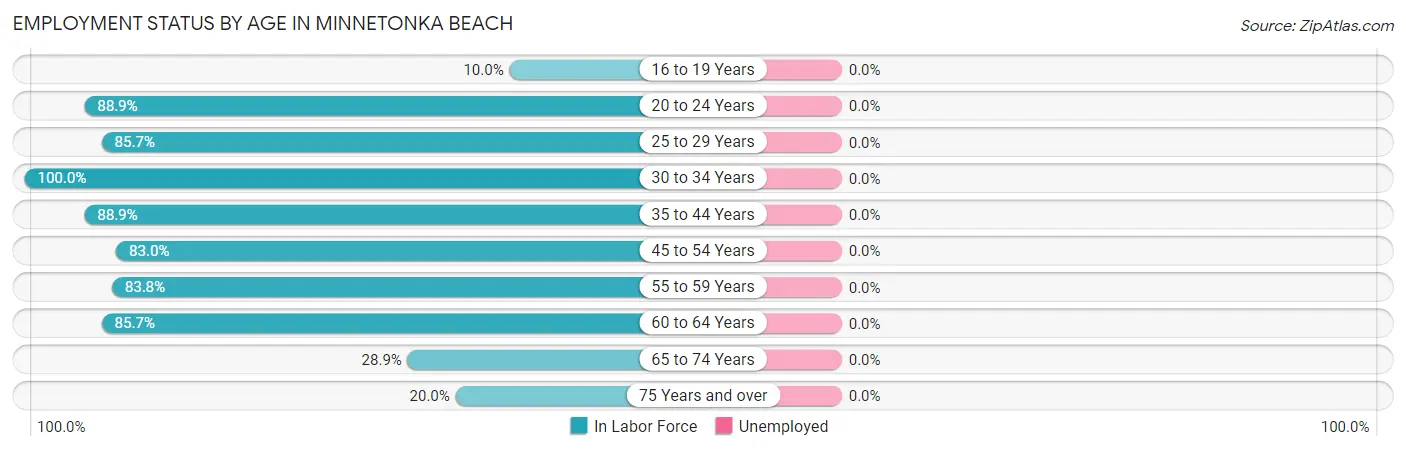
| Age Bracket | In Labor Force | Unemployed |
| 16 to 19 Years | 1 (10.0%) | 0 (0.0%) |
| 20 to 24 Years | 16 (88.9%) | 0 (0.0%) |
| 25 to 29 Years | 6 (85.7%) | 0 (0.0%) |
| 30 to 34 Years | 10 (100.0%) | 0 (0.0%) |
| 35 to 44 Years | 48 (88.9%) | 0 (0.0%) |
| 45 to 54 Years | 88 (83.0%) | 0 (0.0%) |
| 55 to 59 Years | 31 (83.8%) | 0 (0.0%) |
| 60 to 64 Years | 24 (85.7%) | 0 (0.0%) |
| 65 to 74 Years | 11 (28.9%) | 0 (0.0%) |
| 75 Years and over | 5 (20.0%) | 0 (0.0%) |
| Total | 240 (72.1%) | 0 (0.0%) |
Employment Status by Educational Attainment in Minnetonka Beach
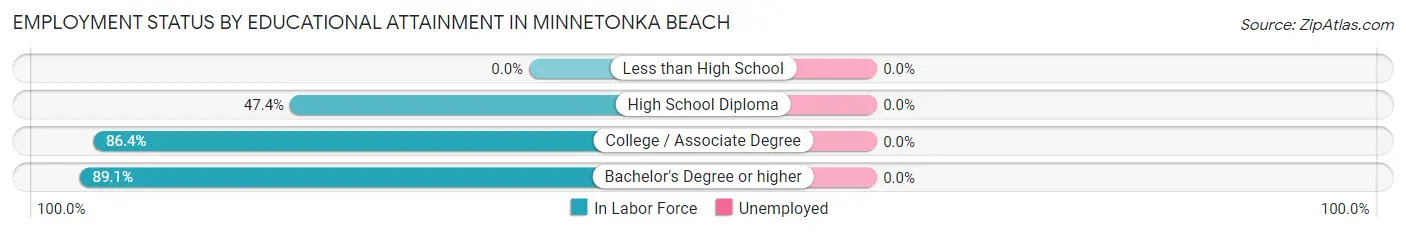
| Educational Attainment | In Labor Force | Unemployed |
| Less than High School | 0 (0.0%) | 0 (0.0%) |
| High School Diploma | 9 (47.4%) | 0 (0.0%) |
| College / Associate Degree | 19 (86.4%) | 0 (0.0%) |
| Bachelor's Degree or higher | 179 (89.1%) | 0 (0.0%) |
| Total | 207 (85.5%) | 0 (0.0%) |
Employment Occupations by Sex in Minnetonka Beach
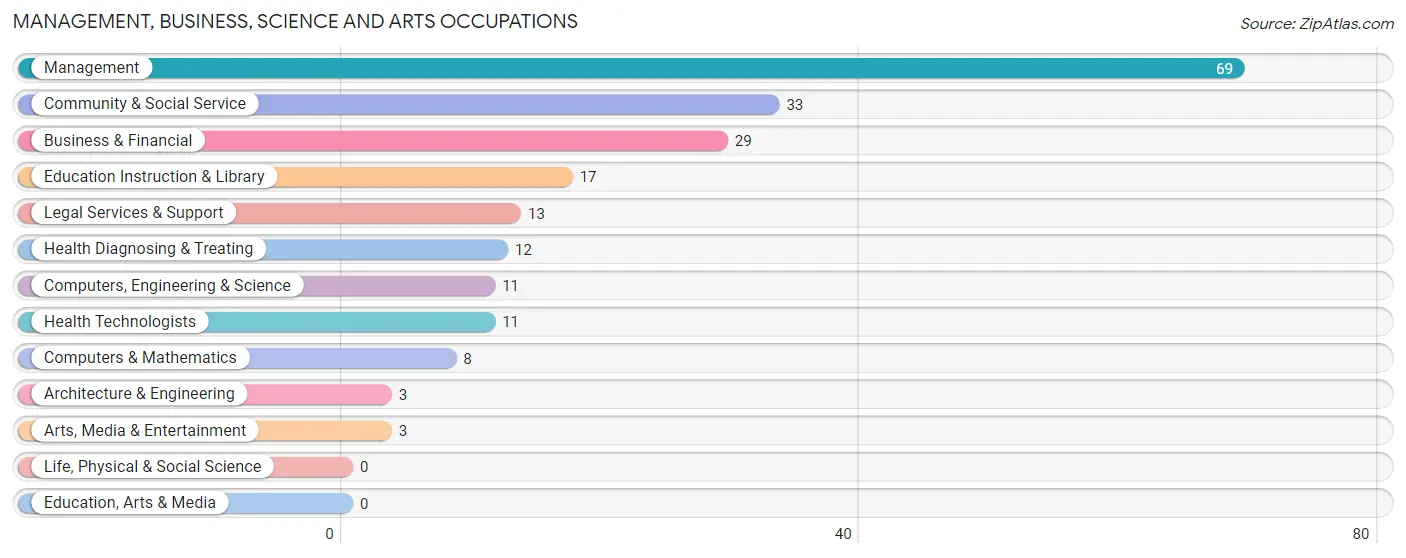
Management, Business, Science and Arts Occupations
The most common Management, Business, Science and Arts occupations in Minnetonka Beach are Management (69 | 28.7%), Community & Social Service (33 | 13.8%), Business & Financial (29 | 12.1%), Education Instruction & Library (17 | 7.1%), and Legal Services & Support (13 | 5.4%).
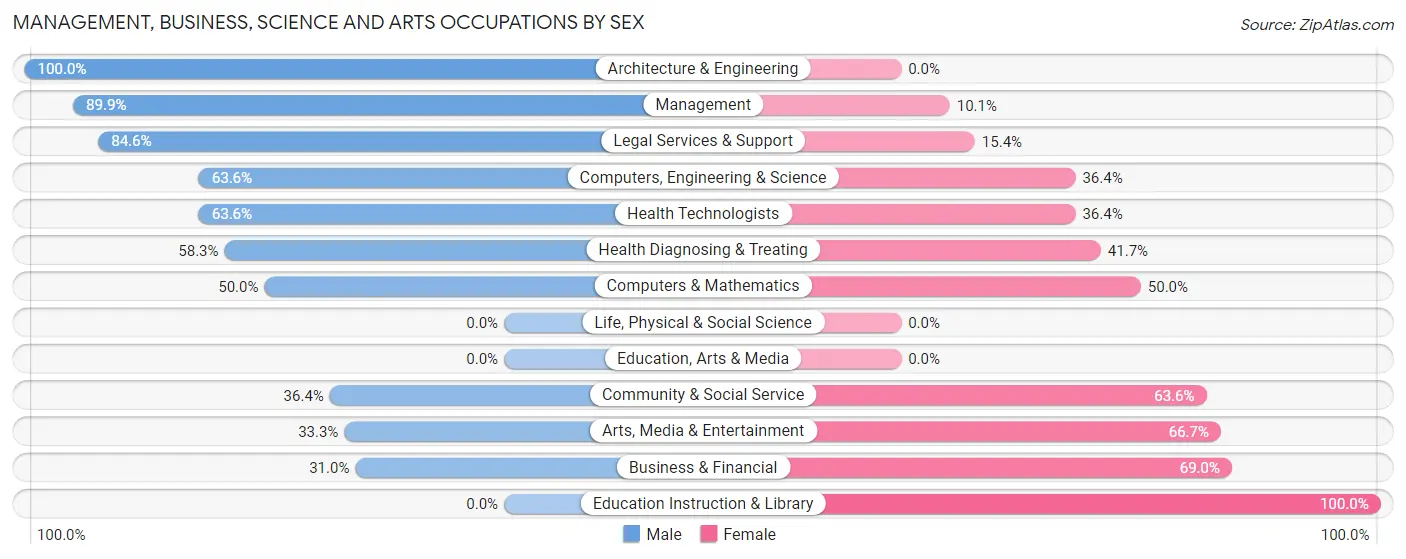
Management, Business, Science and Arts Occupations by Sex
Within the Management, Business, Science and Arts occupations in Minnetonka Beach, the most male-oriented occupations are Architecture & Engineering (100.0%), Management (89.9%), and Legal Services & Support (84.6%), while the most female-oriented occupations are Education Instruction & Library (100.0%), Business & Financial (69.0%), and Arts, Media & Entertainment (66.7%).
| Occupation | Male | Female |
| Management | 62 (89.9%) | 7 (10.1%) |
| Business & Financial | 9 (31.0%) | 20 (69.0%) |
| Computers, Engineering & Science | 7 (63.6%) | 4 (36.4%) |
| Computers & Mathematics | 4 (50.0%) | 4 (50.0%) |
| Architecture & Engineering | 3 (100.0%) | 0 (0.0%) |
| Life, Physical & Social Science | 0 (0.0%) | 0 (0.0%) |
| Community & Social Service | 12 (36.4%) | 21 (63.6%) |
| Education, Arts & Media | 0 (0.0%) | 0 (0.0%) |
| Legal Services & Support | 11 (84.6%) | 2 (15.4%) |
| Education Instruction & Library | 0 (0.0%) | 17 (100.0%) |
| Arts, Media & Entertainment | 1 (33.3%) | 2 (66.7%) |
| Health Diagnosing & Treating | 7 (58.3%) | 5 (41.7%) |
| Health Technologists | 7 (63.6%) | 4 (36.4%) |
| Total (Category) | 97 (63.0%) | 57 (37.0%) |
| Total (Overall) | 135 (56.2%) | 105 (43.8%) |
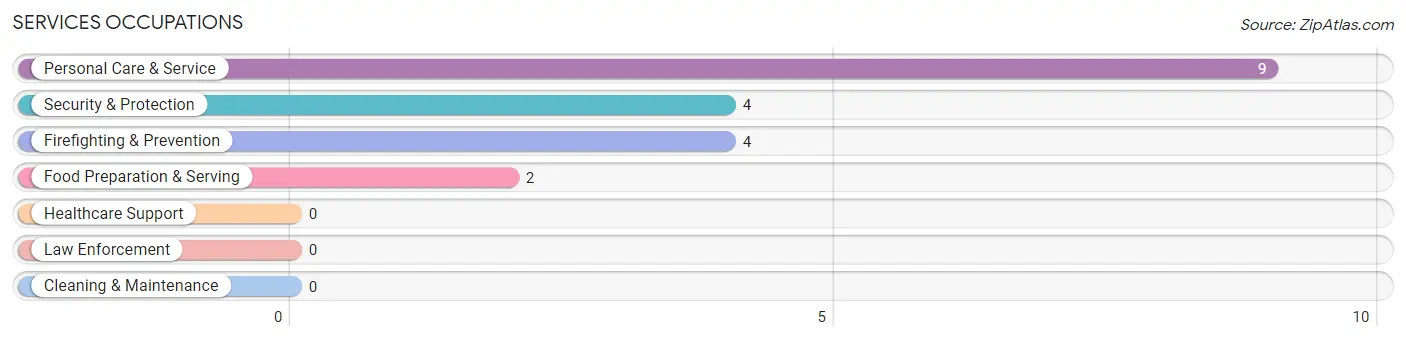
Services Occupations
The most common Services occupations in Minnetonka Beach are Personal Care & Service (9 | 3.7%), Security & Protection (4 | 1.7%), Firefighting & Prevention (4 | 1.7%), and Food Preparation & Serving (2 | 0.8%).
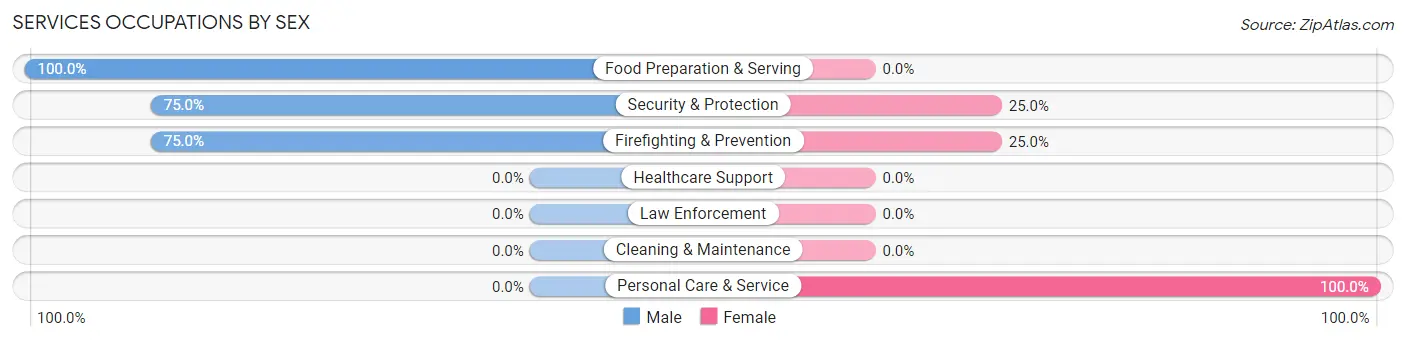
Services Occupations by Sex
Within the Services occupations in Minnetonka Beach, the most male-oriented occupations are Food Preparation & Serving (100.0%), Security & Protection (75.0%), and Firefighting & Prevention (75.0%), while the most female-oriented occupations are Personal Care & Service (100.0%), Security & Protection (25.0%), and Firefighting & Prevention (25.0%).
| Occupation | Male | Female |
| Healthcare Support | 0 (0.0%) | 0 (0.0%) |
| Security & Protection | 3 (75.0%) | 1 (25.0%) |
| Firefighting & Prevention | 3 (75.0%) | 1 (25.0%) |
| Law Enforcement | 0 (0.0%) | 0 (0.0%) |
| Food Preparation & Serving | 2 (100.0%) | 0 (0.0%) |
| Cleaning & Maintenance | 0 (0.0%) | 0 (0.0%) |
| Personal Care & Service | 0 (0.0%) | 9 (100.0%) |
| Total (Category) | 5 (33.3%) | 10 (66.7%) |
| Total (Overall) | 135 (56.2%) | 105 (43.8%) |
Sales and Office Occupations
The most common Sales and Office occupations in Minnetonka Beach are Office & Administration (35 | 14.6%), and Sales & Related (28 | 11.7%).
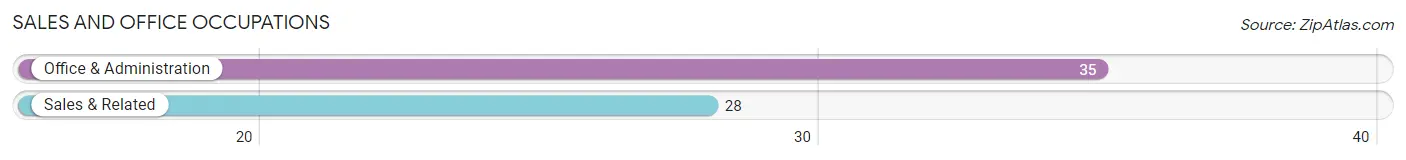
Sales and Office Occupations by Sex
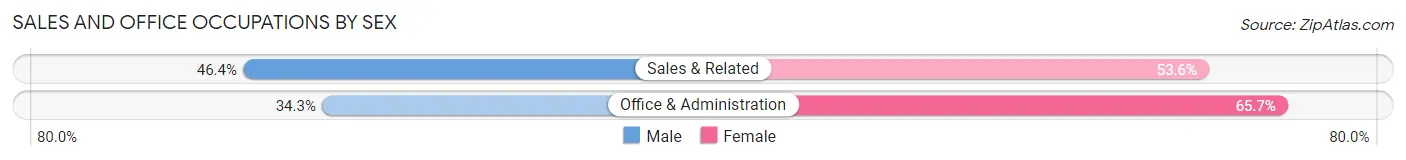
| Occupation | Male | Female |
| Sales & Related | 13 (46.4%) | 15 (53.6%) |
| Office & Administration | 12 (34.3%) | 23 (65.7%) |
| Total (Category) | 25 (39.7%) | 38 (60.3%) |
| Total (Overall) | 135 (56.2%) | 105 (43.8%) |
Natural Resources, Construction and Maintenance Occupations
The most common Natural Resources, Construction and Maintenance occupations in Minnetonka Beach are , and Construction & Extraction (3 | 1.3%).
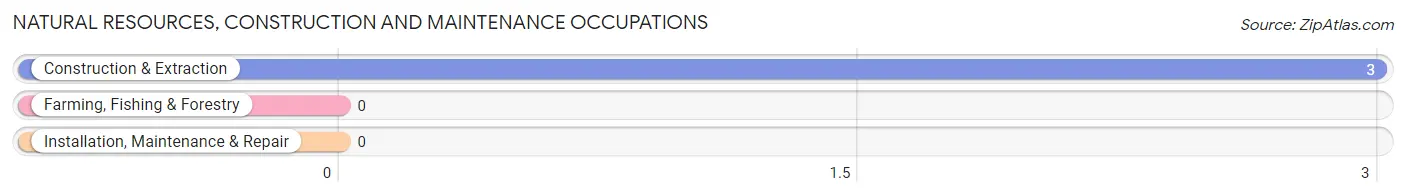
Natural Resources, Construction and Maintenance Occupations by Sex
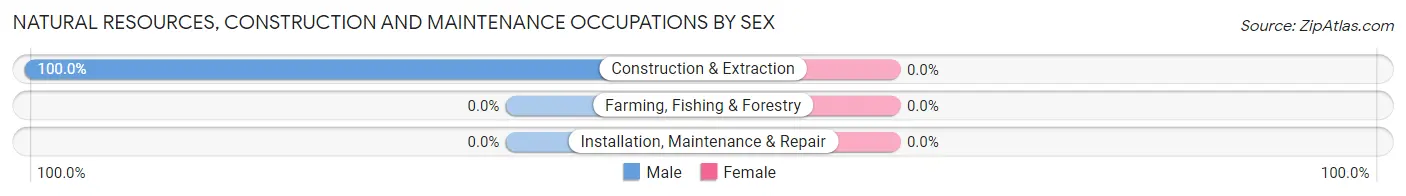
| Occupation | Male | Female |
| Farming, Fishing & Forestry | 0 (0.0%) | 0 (0.0%) |
| Construction & Extraction | 3 (100.0%) | 0 (0.0%) |
| Installation, Maintenance & Repair | 0 (0.0%) | 0 (0.0%) |
| Total (Category) | 3 (100.0%) | 0 (0.0%) |
| Total (Overall) | 135 (56.2%) | 105 (43.8%) |
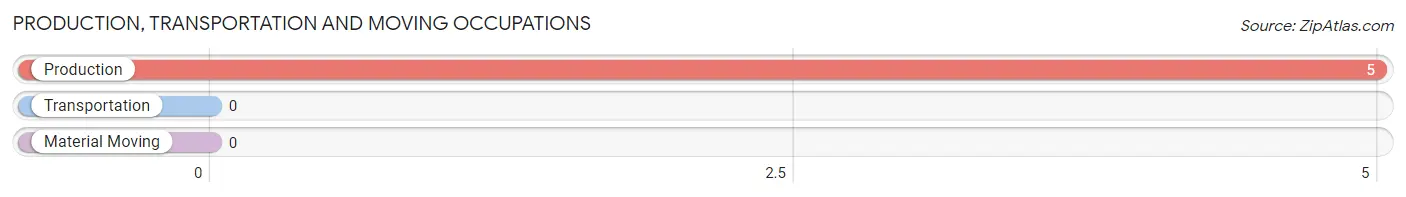
Production, Transportation and Moving Occupations
The most common Production, Transportation and Moving occupations in Minnetonka Beach are , and Production (5 | 2.1%).
Production, Transportation and Moving Occupations by Sex
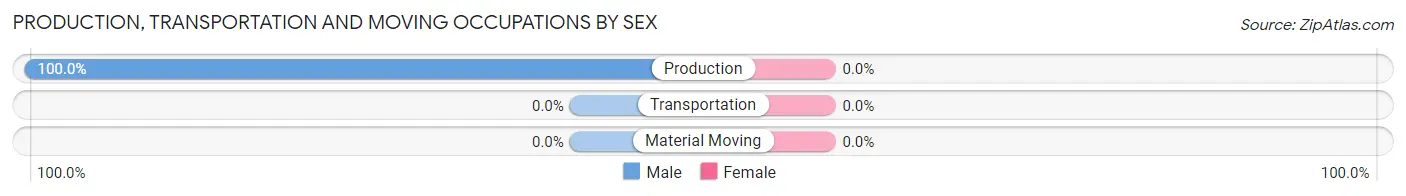
| Occupation | Male | Female |
| Production | 5 (100.0%) | 0 (0.0%) |
| Transportation | 0 (0.0%) | 0 (0.0%) |
| Material Moving | 0 (0.0%) | 0 (0.0%) |
| Total (Category) | 5 (100.0%) | 0 (0.0%) |
| Total (Overall) | 135 (56.2%) | 105 (43.8%) |
Employment Industries by Sex in Minnetonka Beach
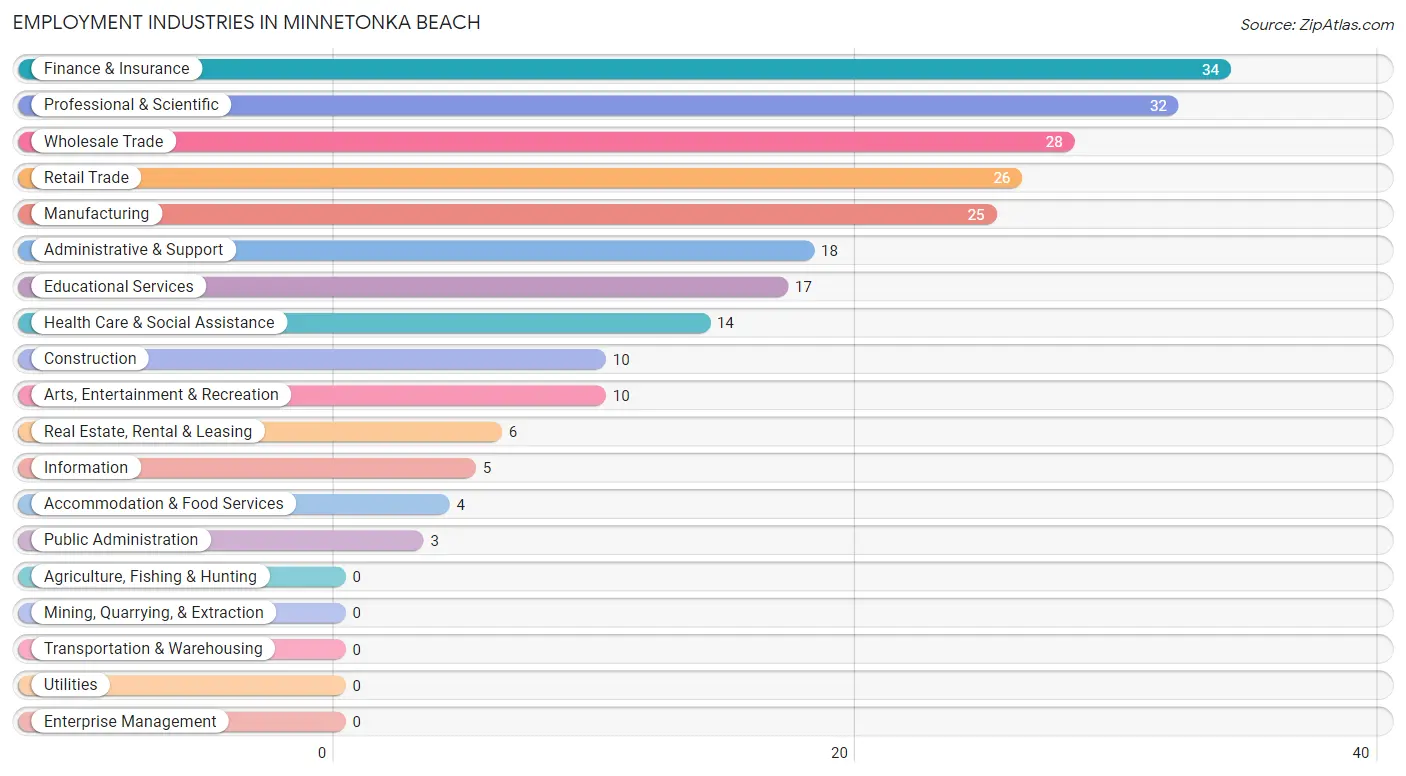
Employment Industries in Minnetonka Beach
The major employment industries in Minnetonka Beach include Finance & Insurance (34 | 14.2%), Professional & Scientific (32 | 13.3%), Wholesale Trade (28 | 11.7%), Retail Trade (26 | 10.8%), and Manufacturing (25 | 10.4%).
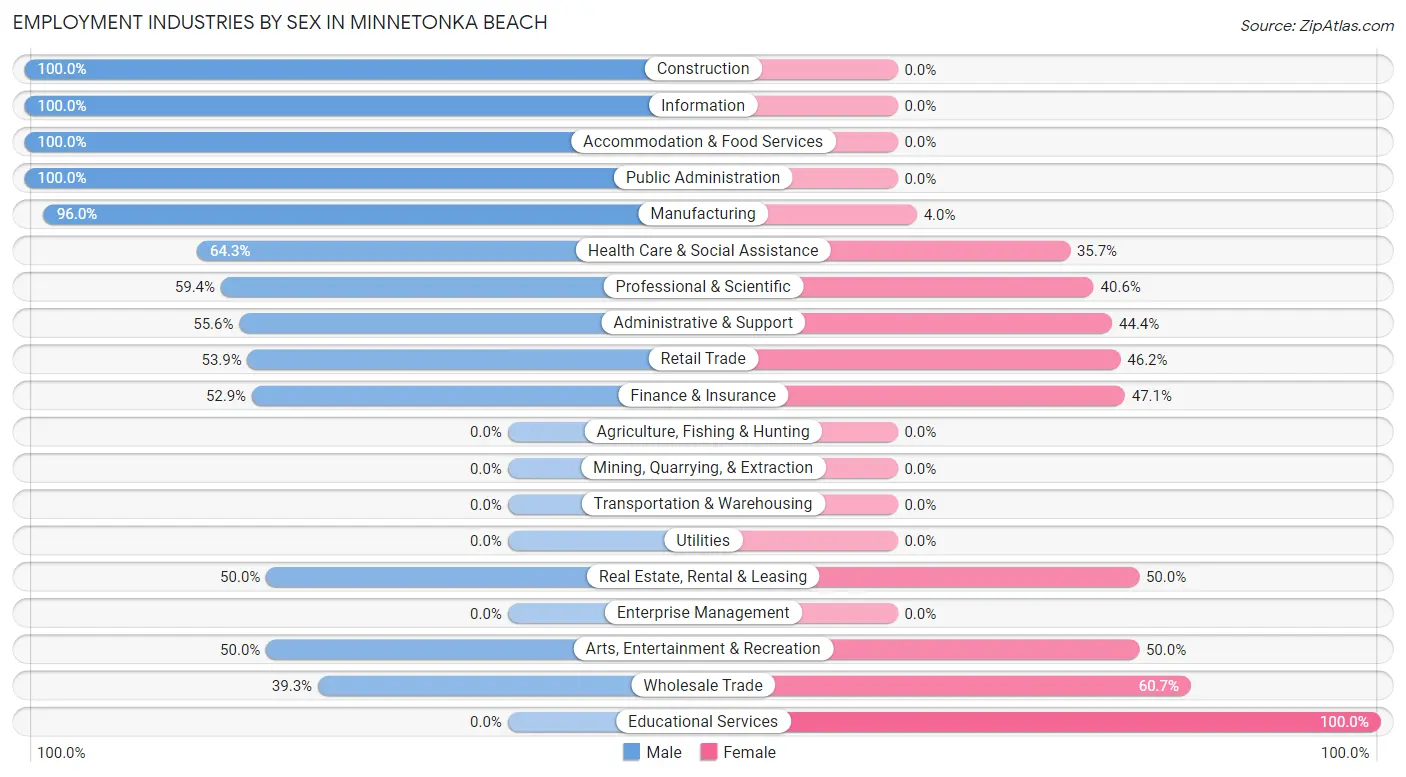
Employment Industries by Sex in Minnetonka Beach
The Minnetonka Beach industries that see more men than women are Construction (100.0%), Information (100.0%), and Accommodation & Food Services (100.0%), whereas the industries that tend to have a higher number of women are Educational Services (100.0%), Wholesale Trade (60.7%), and Real Estate, Rental & Leasing (50.0%).
| Industry | Male | Female |
| Agriculture, Fishing & Hunting | 0 (0.0%) | 0 (0.0%) |
| Mining, Quarrying, & Extraction | 0 (0.0%) | 0 (0.0%) |
| Construction | 10 (100.0%) | 0 (0.0%) |
| Manufacturing | 24 (96.0%) | 1 (4.0%) |
| Wholesale Trade | 11 (39.3%) | 17 (60.7%) |
| Retail Trade | 14 (53.8%) | 12 (46.2%) |
| Transportation & Warehousing | 0 (0.0%) | 0 (0.0%) |
| Utilities | 0 (0.0%) | 0 (0.0%) |
| Information | 5 (100.0%) | 0 (0.0%) |
| Finance & Insurance | 18 (52.9%) | 16 (47.1%) |
| Real Estate, Rental & Leasing | 3 (50.0%) | 3 (50.0%) |
| Professional & Scientific | 19 (59.4%) | 13 (40.6%) |
| Enterprise Management | 0 (0.0%) | 0 (0.0%) |
| Administrative & Support | 10 (55.6%) | 8 (44.4%) |
| Educational Services | 0 (0.0%) | 17 (100.0%) |
| Health Care & Social Assistance | 9 (64.3%) | 5 (35.7%) |
| Arts, Entertainment & Recreation | 5 (50.0%) | 5 (50.0%) |
| Accommodation & Food Services | 4 (100.0%) | 0 (0.0%) |
| Public Administration | 3 (100.0%) | 0 (0.0%) |
| Total | 135 (56.2%) | 105 (43.8%) |
Education in Minnetonka Beach
School Enrollment in Minnetonka Beach
The most common levels of schooling among the 141 students in Minnetonka Beach are middle school (51 | 36.2%), elementary school (37 | 26.2%), and high school (24 | 17.0%).
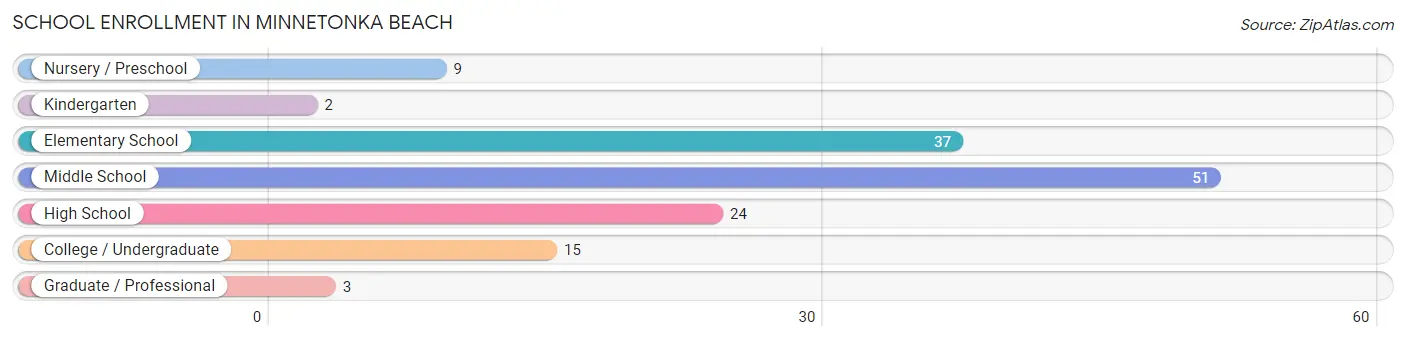
| School Level | # Students | % Students |
| Nursery / Preschool | 9 | 6.4% |
| Kindergarten | 2 | 1.4% |
| Elementary School | 37 | 26.2% |
| Middle School | 51 | 36.2% |
| High School | 24 | 17.0% |
| College / Undergraduate | 15 | 10.6% |
| Graduate / Professional | 3 | 2.1% |
| Total | 141 | 100.0% |
School Enrollment by Age by Funding Source in Minnetonka Beach
Out of a total of 141 students who are enrolled in schools in Minnetonka Beach, 21 (14.9%) attend a private institution, while the remaining 120 (85.1%) are enrolled in public schools. The age group of 20 to 24 year olds has the highest likelihood of being enrolled in private schools, with 4 (30.8% in the age bracket) enrolled. Conversely, the age group of 3 to 4 year olds has the lowest likelihood of being enrolled in a private school, with 5 (100.0% in the age bracket) attending a public institution.
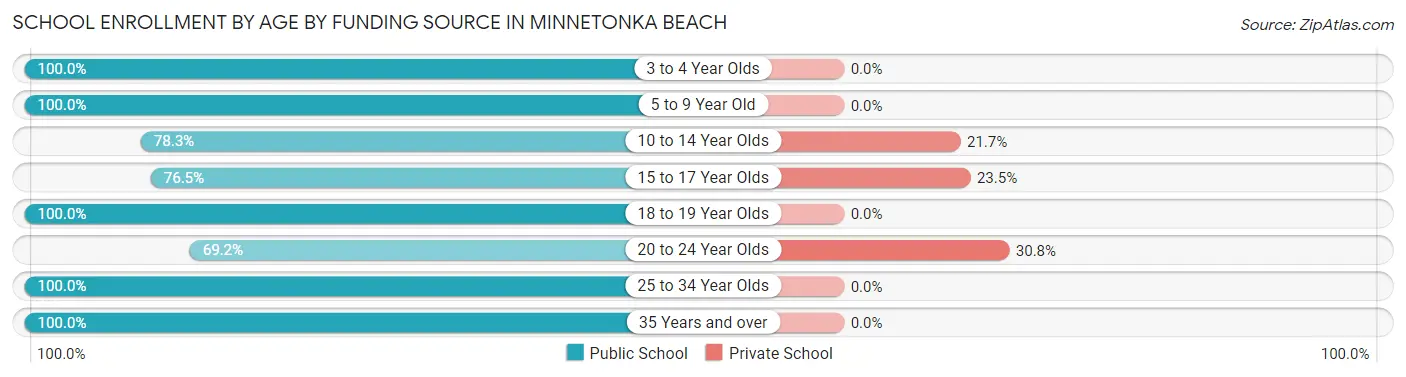
| Age Bracket | Public School | Private School |
| 3 to 4 Year Olds | 5 (100.0%) | 0 (0.0%) |
| 5 to 9 Year Old | 37 (100.0%) | 0 (0.0%) |
| 10 to 14 Year Olds | 47 (78.3%) | 13 (21.7%) |
| 15 to 17 Year Olds | 13 (76.5%) | 4 (23.5%) |
| 18 to 19 Year Olds | 4 (100.0%) | 0 (0.0%) |
| 20 to 24 Year Olds | 9 (69.2%) | 4 (30.8%) |
| 25 to 34 Year Olds | 2 (100.0%) | 0 (0.0%) |
| 35 Years and over | 3 (100.0%) | 0 (0.0%) |
| Total | 120 (85.1%) | 21 (14.9%) |
Educational Attainment by Field of Study in Minnetonka Beach
Business (66 | 25.5%), social sciences (36 | 13.9%), engineering (20 | 7.7%), liberal arts & history (20 | 7.7%), and communications (20 | 7.7%) are the most common fields of study among 259 individuals in Minnetonka Beach who have obtained a bachelor's degree or higher.
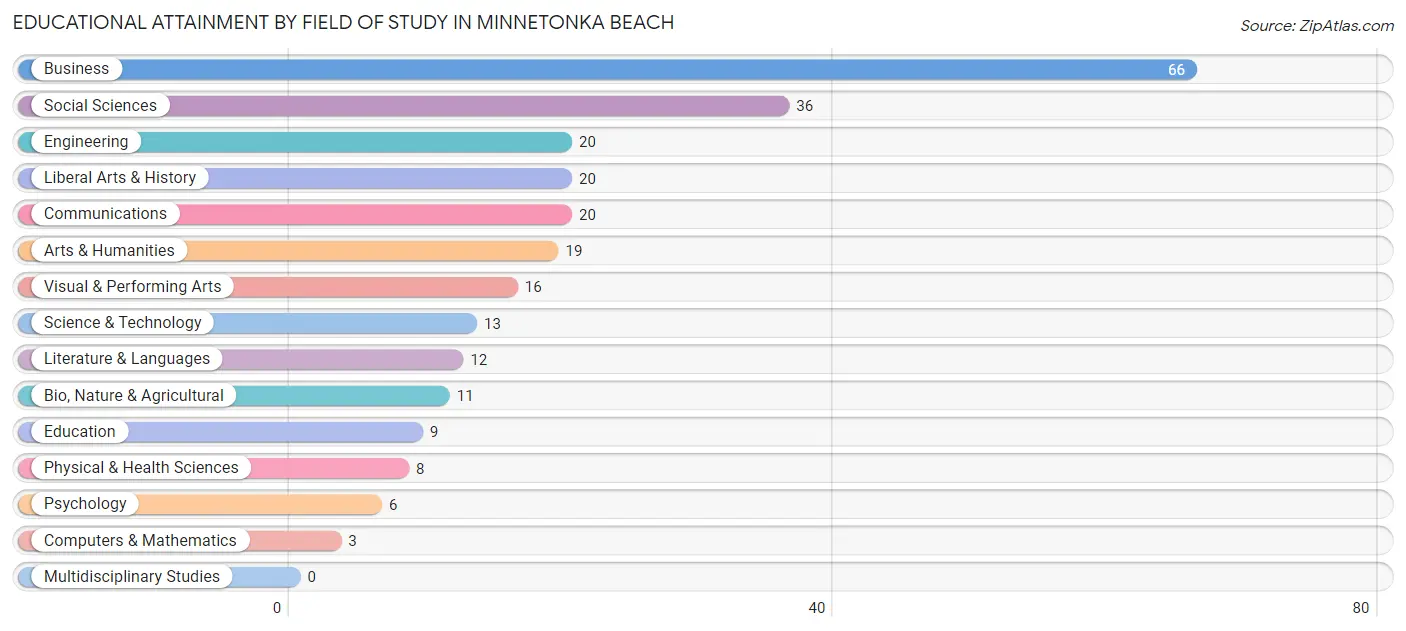
| Field of Study | # Graduates | % Graduates |
| Computers & Mathematics | 3 | 1.2% |
| Bio, Nature & Agricultural | 11 | 4.3% |
| Physical & Health Sciences | 8 | 3.1% |
| Psychology | 6 | 2.3% |
| Social Sciences | 36 | 13.9% |
| Engineering | 20 | 7.7% |
| Multidisciplinary Studies | 0 | 0.0% |
| Science & Technology | 13 | 5.0% |
| Business | 66 | 25.5% |
| Education | 9 | 3.5% |
| Literature & Languages | 12 | 4.6% |
| Liberal Arts & History | 20 | 7.7% |
| Visual & Performing Arts | 16 | 6.2% |
| Communications | 20 | 7.7% |
| Arts & Humanities | 19 | 7.3% |
| Total | 259 | 100.0% |
Transportation & Commute in Minnetonka Beach
Vehicle Availability by Sex in Minnetonka Beach
The most prevalent vehicle ownership categories in Minnetonka Beach are males with 2 vehicles (74, accounting for 54.8%) and females with 2 vehicles (60, making up 70.5%).
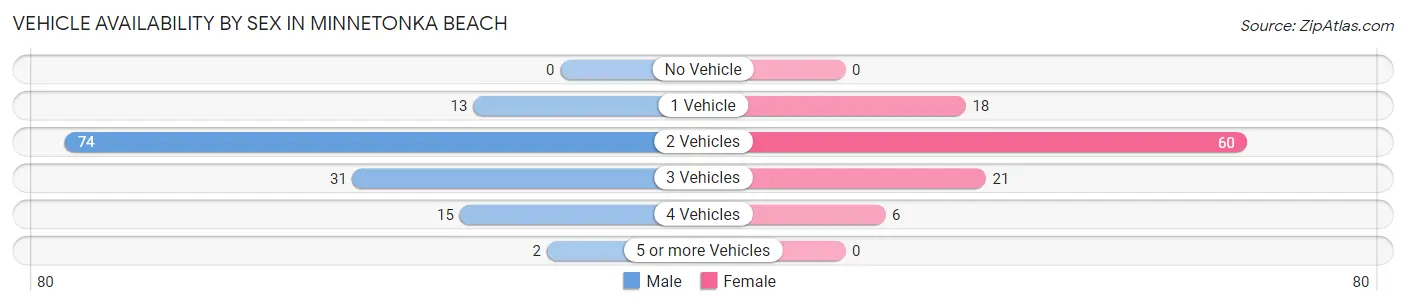
| Vehicles Available | Male | Female |
| No Vehicle | 0 (0.0%) | 0 (0.0%) |
| 1 Vehicle | 13 (9.6%) | 18 (17.1%) |
| 2 Vehicles | 74 (54.8%) | 60 (57.1%) |
| 3 Vehicles | 31 (23.0%) | 21 (20.0%) |
| 4 Vehicles | 15 (11.1%) | 6 (5.7%) |
| 5 or more Vehicles | 2 (1.5%) | 0 (0.0%) |
| Total | 135 (100.0%) | 105 (100.0%) |
Commute Time in Minnetonka Beach
The most frequently occuring commute durations in Minnetonka Beach are 20 to 24 minutes (59 commuters, 31.2%), 15 to 19 minutes (27 commuters, 14.3%), and 25 to 29 minutes (27 commuters, 14.3%).
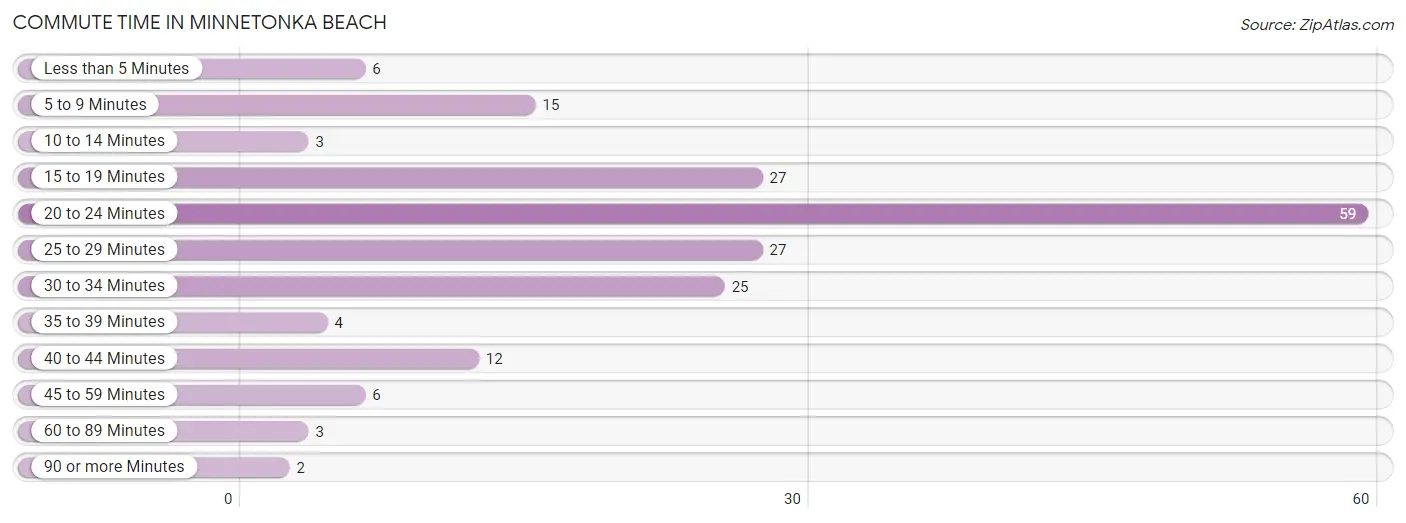
| Commute Time | # Commuters | % Commuters |
| Less than 5 Minutes | 6 | 3.2% |
| 5 to 9 Minutes | 15 | 7.9% |
| 10 to 14 Minutes | 3 | 1.6% |
| 15 to 19 Minutes | 27 | 14.3% |
| 20 to 24 Minutes | 59 | 31.2% |
| 25 to 29 Minutes | 27 | 14.3% |
| 30 to 34 Minutes | 25 | 13.2% |
| 35 to 39 Minutes | 4 | 2.1% |
| 40 to 44 Minutes | 12 | 6.4% |
| 45 to 59 Minutes | 6 | 3.2% |
| 60 to 89 Minutes | 3 | 1.6% |
| 90 or more Minutes | 2 | 1.1% |
Commute Time by Sex in Minnetonka Beach
The most common commute times in Minnetonka Beach are 20 to 24 minutes (36 commuters, 31.0%) for males and 20 to 24 minutes (23 commuters, 31.5%) for females.
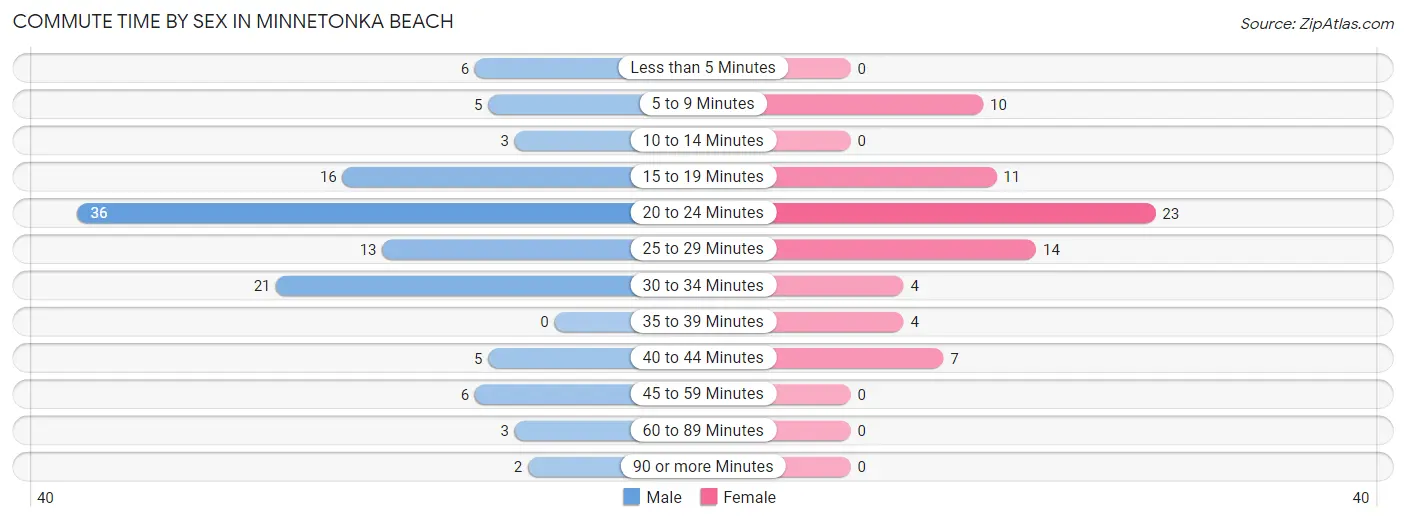
| Commute Time | Male | Female |
| Less than 5 Minutes | 6 (5.2%) | 0 (0.0%) |
| 5 to 9 Minutes | 5 (4.3%) | 10 (13.7%) |
| 10 to 14 Minutes | 3 (2.6%) | 0 (0.0%) |
| 15 to 19 Minutes | 16 (13.8%) | 11 (15.1%) |
| 20 to 24 Minutes | 36 (31.0%) | 23 (31.5%) |
| 25 to 29 Minutes | 13 (11.2%) | 14 (19.2%) |
| 30 to 34 Minutes | 21 (18.1%) | 4 (5.5%) |
| 35 to 39 Minutes | 0 (0.0%) | 4 (5.5%) |
| 40 to 44 Minutes | 5 (4.3%) | 7 (9.6%) |
| 45 to 59 Minutes | 6 (5.2%) | 0 (0.0%) |
| 60 to 89 Minutes | 3 (2.6%) | 0 (0.0%) |
| 90 or more Minutes | 2 (1.7%) | 0 (0.0%) |
Time of Departure to Work by Sex in Minnetonka Beach
The most frequent times of departure to work in Minnetonka Beach are 7:00 AM to 7:29 AM (32, 27.6%) for males and 7:30 AM to 7:59 AM (19, 26.0%) for females.
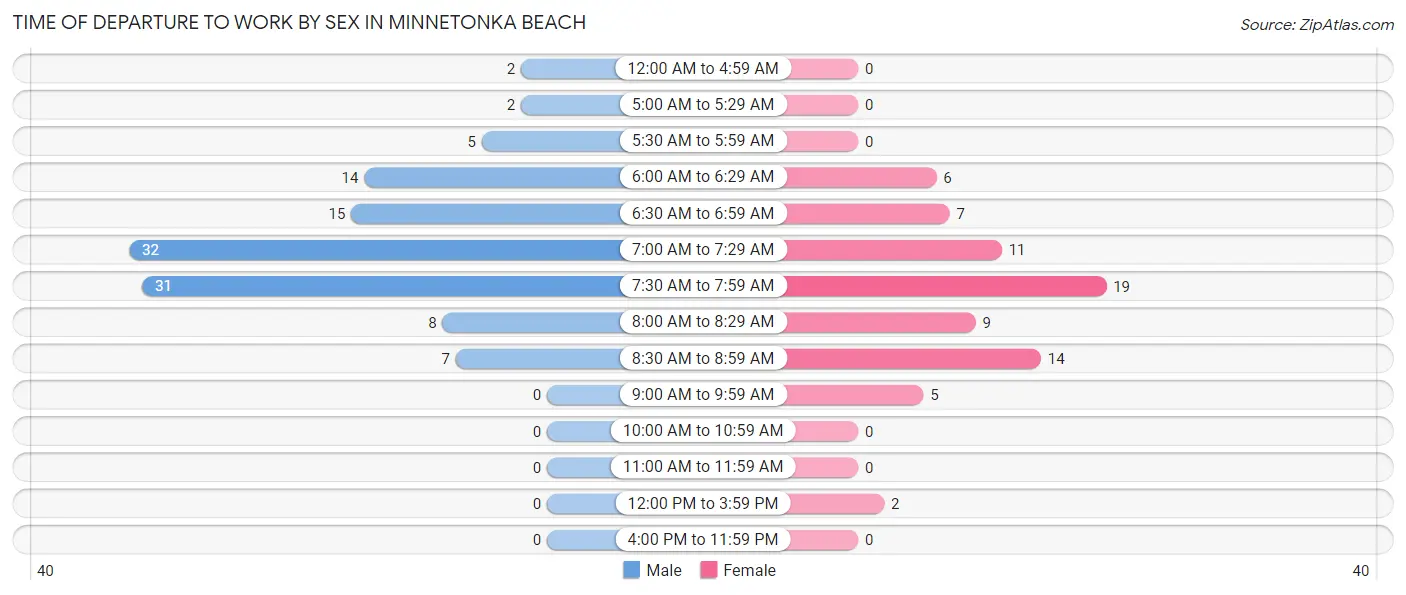
| Time of Departure | Male | Female |
| 12:00 AM to 4:59 AM | 2 (1.7%) | 0 (0.0%) |
| 5:00 AM to 5:29 AM | 2 (1.7%) | 0 (0.0%) |
| 5:30 AM to 5:59 AM | 5 (4.3%) | 0 (0.0%) |
| 6:00 AM to 6:29 AM | 14 (12.1%) | 6 (8.2%) |
| 6:30 AM to 6:59 AM | 15 (12.9%) | 7 (9.6%) |
| 7:00 AM to 7:29 AM | 32 (27.6%) | 11 (15.1%) |
| 7:30 AM to 7:59 AM | 31 (26.7%) | 19 (26.0%) |
| 8:00 AM to 8:29 AM | 8 (6.9%) | 9 (12.3%) |
| 8:30 AM to 8:59 AM | 7 (6.0%) | 14 (19.2%) |
| 9:00 AM to 9:59 AM | 0 (0.0%) | 5 (6.9%) |
| 10:00 AM to 10:59 AM | 0 (0.0%) | 0 (0.0%) |
| 11:00 AM to 11:59 AM | 0 (0.0%) | 0 (0.0%) |
| 12:00 PM to 3:59 PM | 0 (0.0%) | 2 (2.7%) |
| 4:00 PM to 11:59 PM | 0 (0.0%) | 0 (0.0%) |
| Total | 116 (100.0%) | 73 (100.0%) |
Housing Occupancy in Minnetonka Beach
Occupancy by Ownership in Minnetonka Beach
Of the total 170 dwellings in Minnetonka Beach, owner-occupied units account for 159 (93.5%), while renter-occupied units make up 11 (6.5%).
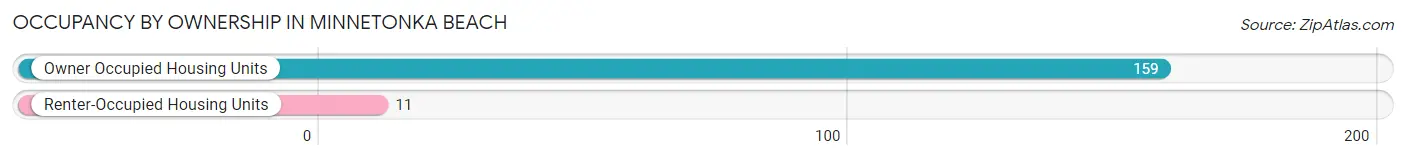
| Occupancy | # Housing Units | % Housing Units |
| Owner Occupied Housing Units | 159 | 93.5% |
| Renter-Occupied Housing Units | 11 | 6.5% |
| Total Occupied Housing Units | 170 | 100.0% |
Occupancy by Household Size in Minnetonka Beach
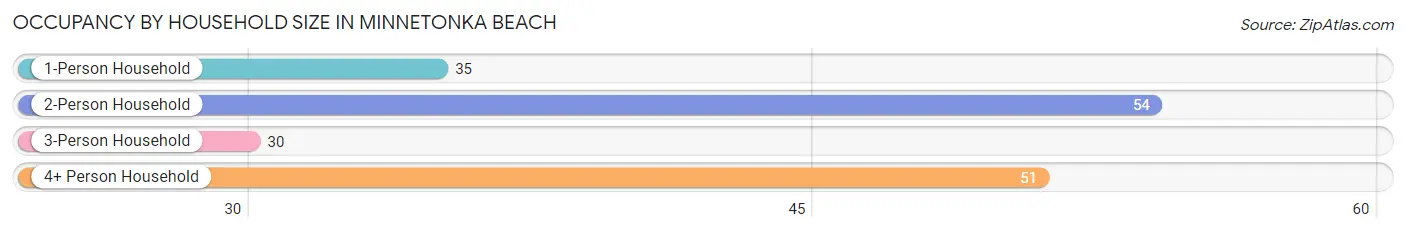
| Household Size | # Housing Units | % Housing Units |
| 1-Person Household | 35 | 20.6% |
| 2-Person Household | 54 | 31.8% |
| 3-Person Household | 30 | 17.6% |
| 4+ Person Household | 51 | 30.0% |
| Total Housing Units | 170 | 100.0% |
Occupancy by Ownership by Household Size in Minnetonka Beach
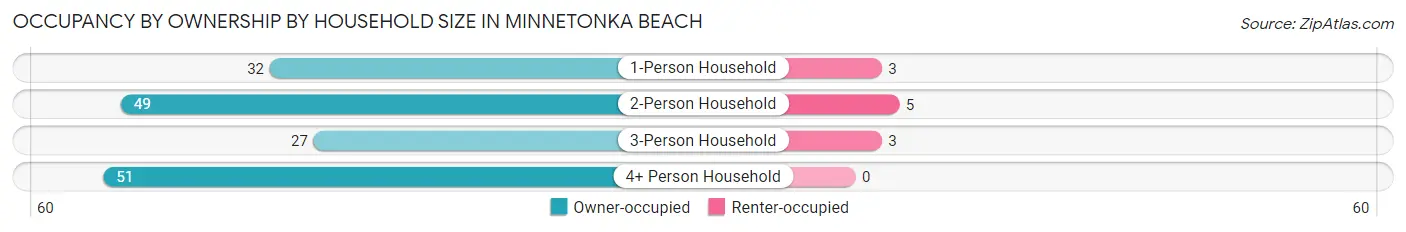
| Household Size | Owner-occupied | Renter-occupied |
| 1-Person Household | 32 (91.4%) | 3 (8.6%) |
| 2-Person Household | 49 (90.7%) | 5 (9.3%) |
| 3-Person Household | 27 (90.0%) | 3 (10.0%) |
| 4+ Person Household | 51 (100.0%) | 0 (0.0%) |
| Total Housing Units | 159 (93.5%) | 11 (6.5%) |
Occupancy by Educational Attainment in Minnetonka Beach
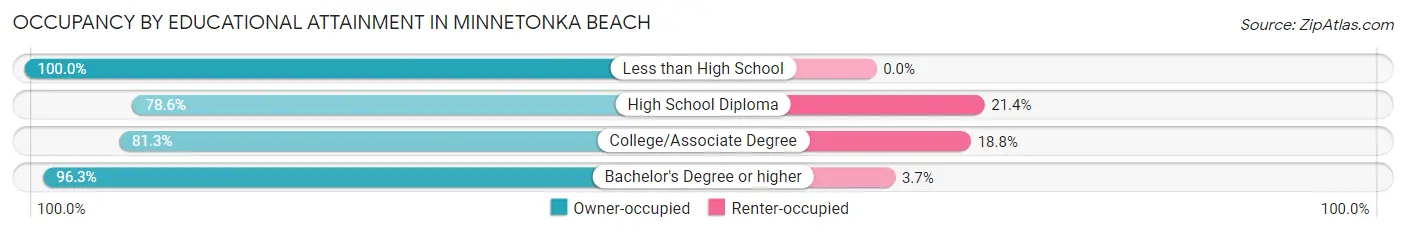
| Household Size | Owner-occupied | Renter-occupied |
| Less than High School | 6 (100.0%) | 0 (0.0%) |
| High School Diploma | 11 (78.6%) | 3 (21.4%) |
| College/Associate Degree | 13 (81.2%) | 3 (18.8%) |
| Bachelor's Degree or higher | 129 (96.3%) | 5 (3.7%) |
Occupancy by Age of Householder in Minnetonka Beach
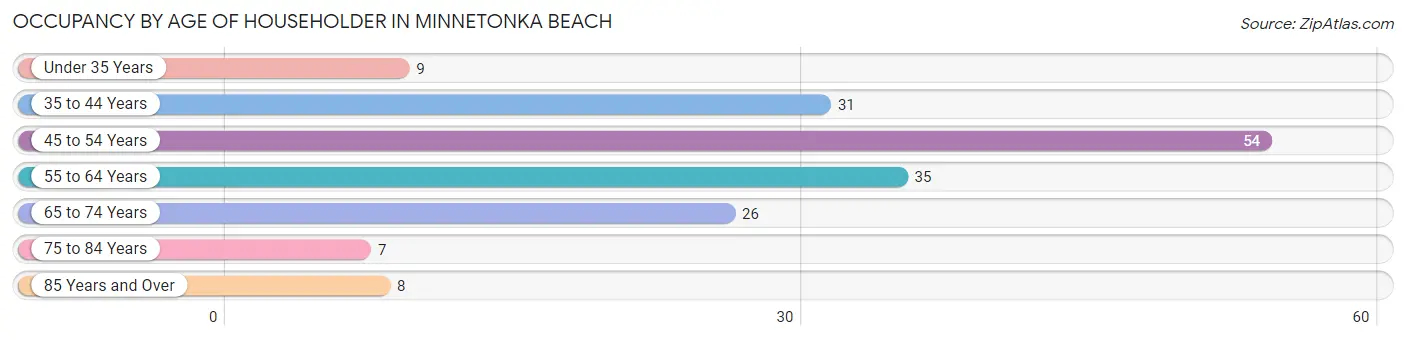
| Age Bracket | # Households | % Households |
| Under 35 Years | 9 | 5.3% |
| 35 to 44 Years | 31 | 18.2% |
| 45 to 54 Years | 54 | 31.8% |
| 55 to 64 Years | 35 | 20.6% |
| 65 to 74 Years | 26 | 15.3% |
| 75 to 84 Years | 7 | 4.1% |
| 85 Years and Over | 8 | 4.7% |
| Total | 170 | 100.0% |
Housing Finances in Minnetonka Beach
Median Income by Occupancy in Minnetonka Beach
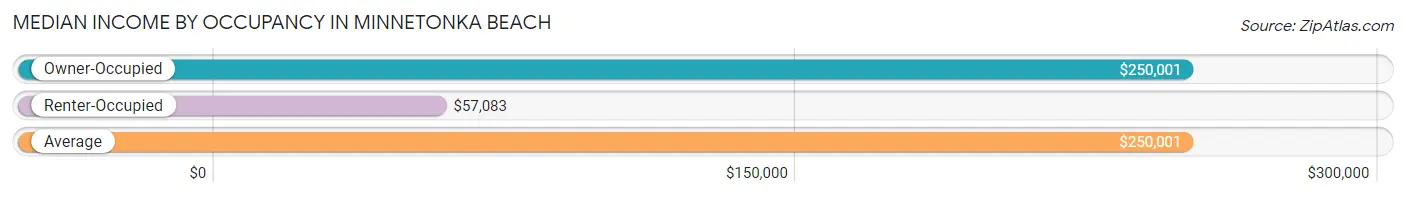
| Occupancy Type | # Households | Median Income |
| Owner-Occupied | 159 (93.5%) | $250,001 |
| Renter-Occupied | 11 (6.5%) | $57,083 |
| Average | 170 (100.0%) | $250,001 |
Occupancy by Householder Income Bracket in Minnetonka Beach
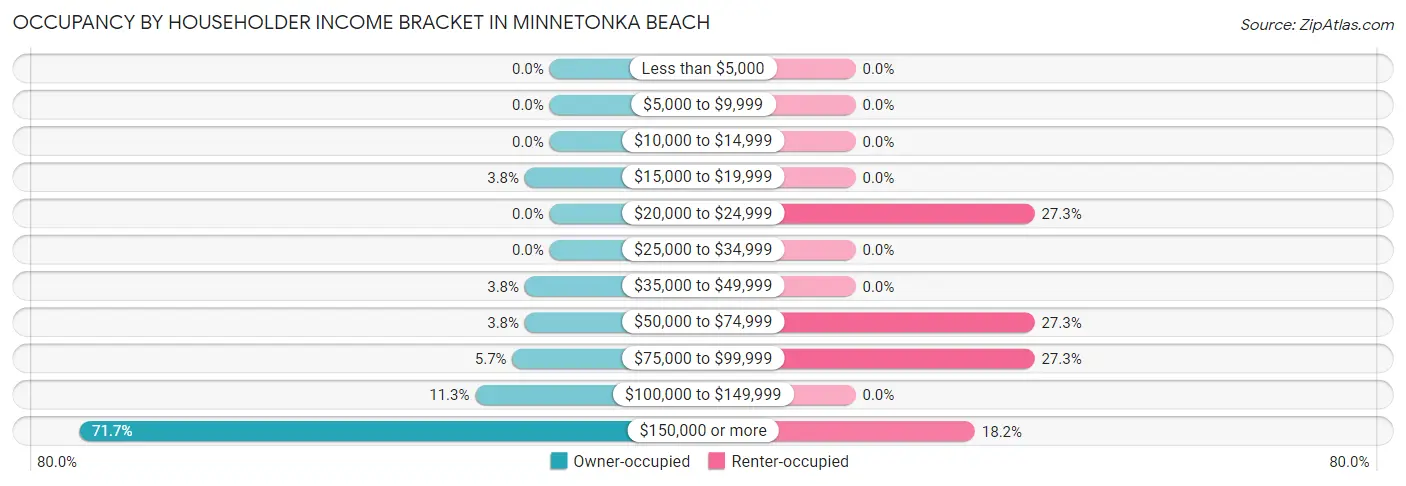
| Income Bracket | Owner-occupied | Renter-occupied |
| Less than $5,000 | 0 (0.0%) | 0 (0.0%) |
| $5,000 to $9,999 | 0 (0.0%) | 0 (0.0%) |
| $10,000 to $14,999 | 0 (0.0%) | 0 (0.0%) |
| $15,000 to $19,999 | 6 (3.8%) | 0 (0.0%) |
| $20,000 to $24,999 | 0 (0.0%) | 3 (27.3%) |
| $25,000 to $34,999 | 0 (0.0%) | 0 (0.0%) |
| $35,000 to $49,999 | 6 (3.8%) | 0 (0.0%) |
| $50,000 to $74,999 | 6 (3.8%) | 3 (27.3%) |
| $75,000 to $99,999 | 9 (5.7%) | 3 (27.3%) |
| $100,000 to $149,999 | 18 (11.3%) | 0 (0.0%) |
| $150,000 or more | 114 (71.7%) | 2 (18.2%) |
| Total | 159 (100.0%) | 11 (100.0%) |
Monthly Housing Cost Tiers in Minnetonka Beach
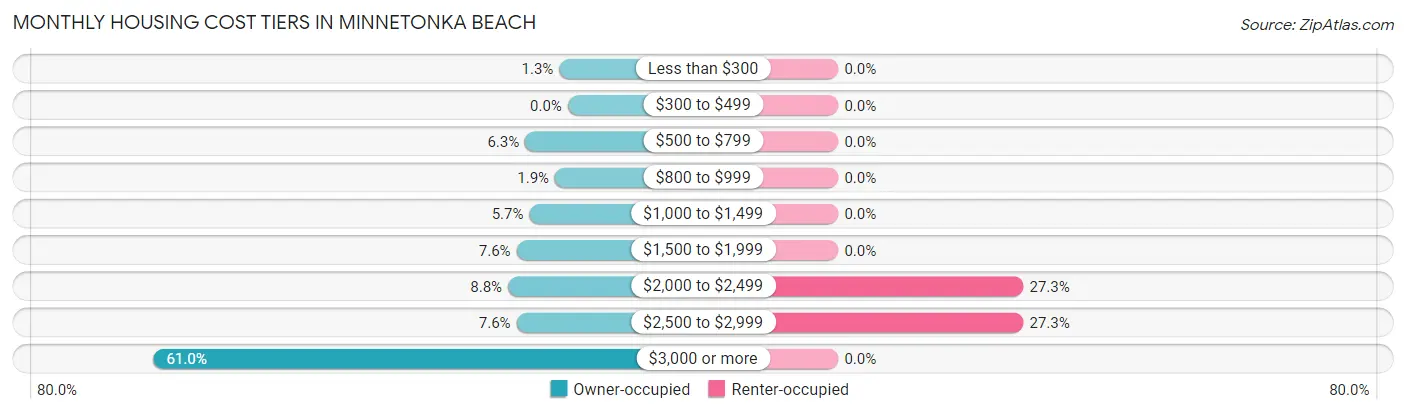
| Monthly Cost | Owner-occupied | Renter-occupied |
| Less than $300 | 2 (1.3%) | 0 (0.0%) |
| $300 to $499 | 0 (0.0%) | 0 (0.0%) |
| $500 to $799 | 10 (6.3%) | 0 (0.0%) |
| $800 to $999 | 3 (1.9%) | 0 (0.0%) |
| $1,000 to $1,499 | 9 (5.7%) | 0 (0.0%) |
| $1,500 to $1,999 | 12 (7.5%) | 0 (0.0%) |
| $2,000 to $2,499 | 14 (8.8%) | 3 (27.3%) |
| $2,500 to $2,999 | 12 (7.5%) | 3 (27.3%) |
| $3,000 or more | 97 (61.0%) | 0 (0.0%) |
| Total | 159 (100.0%) | 11 (100.0%) |
Physical Housing Characteristics in Minnetonka Beach
Housing Structures in Minnetonka Beach
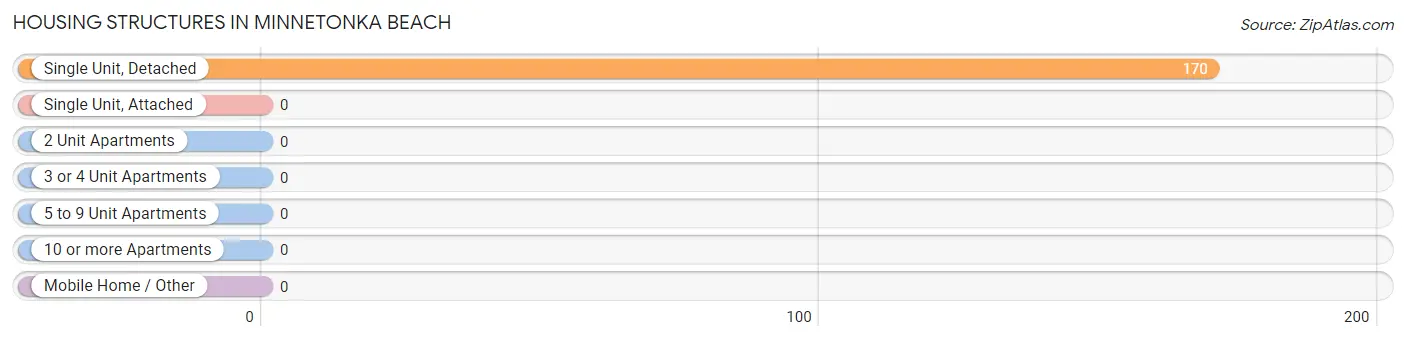
| Structure Type | # Housing Units | % Housing Units |
| Single Unit, Detached | 170 | 100.0% |
| Single Unit, Attached | 0 | 0.0% |
| 2 Unit Apartments | 0 | 0.0% |
| 3 or 4 Unit Apartments | 0 | 0.0% |
| 5 to 9 Unit Apartments | 0 | 0.0% |
| 10 or more Apartments | 0 | 0.0% |
| Mobile Home / Other | 0 | 0.0% |
| Total | 170 | 100.0% |
Housing Structures by Occupancy in Minnetonka Beach
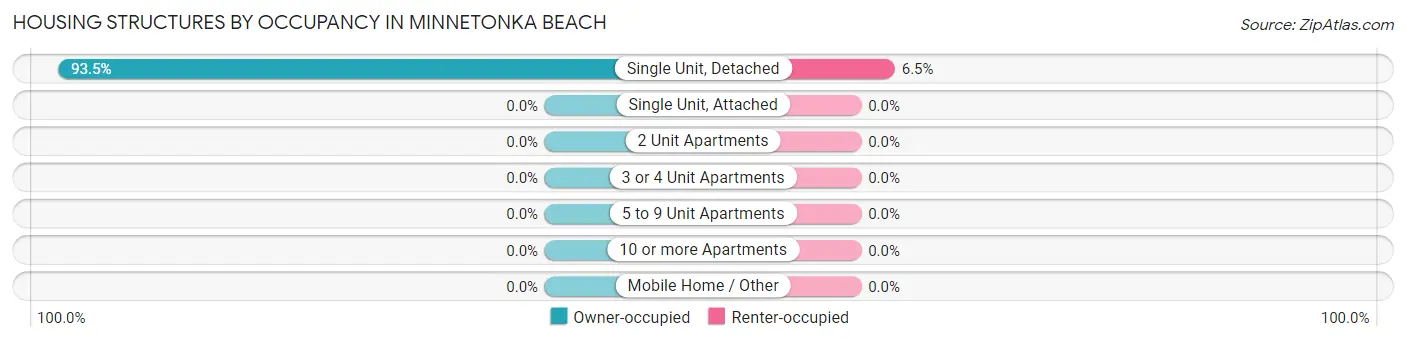
| Structure Type | Owner-occupied | Renter-occupied |
| Single Unit, Detached | 159 (93.5%) | 11 (6.5%) |
| Single Unit, Attached | 0 (0.0%) | 0 (0.0%) |
| 2 Unit Apartments | 0 (0.0%) | 0 (0.0%) |
| 3 or 4 Unit Apartments | 0 (0.0%) | 0 (0.0%) |
| 5 to 9 Unit Apartments | 0 (0.0%) | 0 (0.0%) |
| 10 or more Apartments | 0 (0.0%) | 0 (0.0%) |
| Mobile Home / Other | 0 (0.0%) | 0 (0.0%) |
| Total | 159 (93.5%) | 11 (6.5%) |
Housing Structures by Number of Rooms in Minnetonka Beach
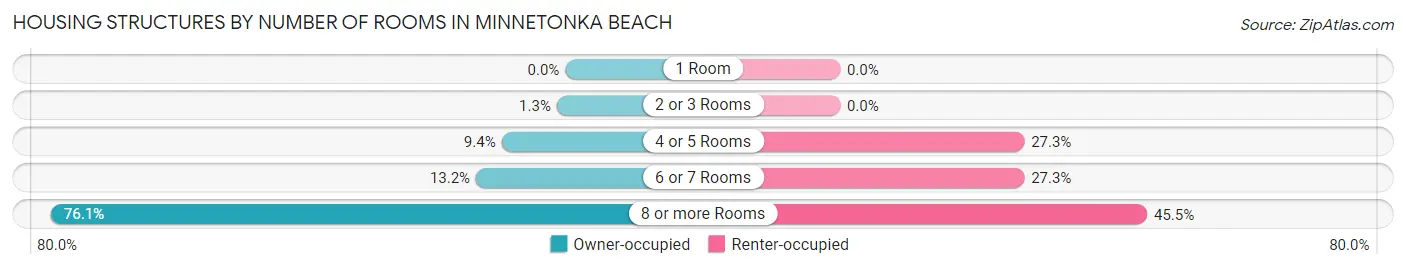
| Number of Rooms | Owner-occupied | Renter-occupied |
| 1 Room | 0 (0.0%) | 0 (0.0%) |
| 2 or 3 Rooms | 2 (1.3%) | 0 (0.0%) |
| 4 or 5 Rooms | 15 (9.4%) | 3 (27.3%) |
| 6 or 7 Rooms | 21 (13.2%) | 3 (27.3%) |
| 8 or more Rooms | 121 (76.1%) | 5 (45.5%) |
| Total | 159 (100.0%) | 11 (100.0%) |
Housing Structure by Heating Type in Minnetonka Beach
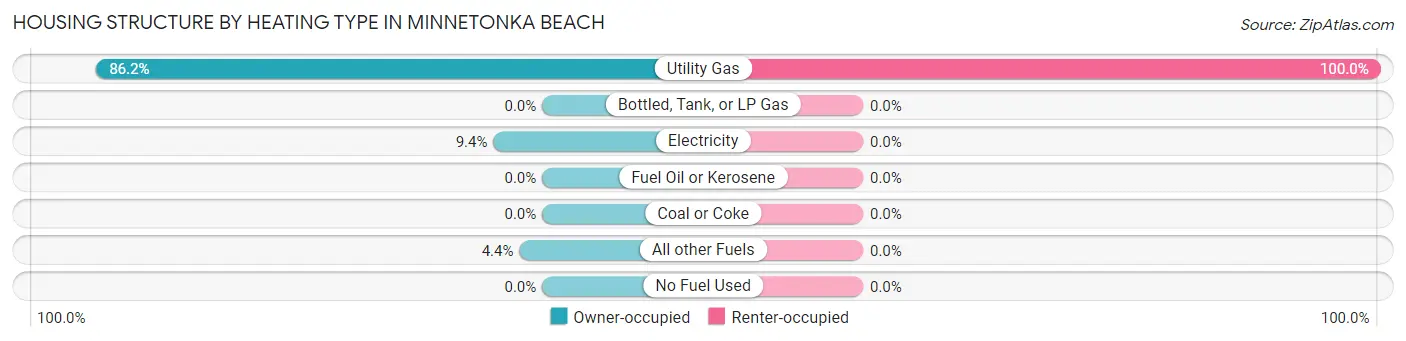
| Heating Type | Owner-occupied | Renter-occupied |
| Utility Gas | 137 (86.2%) | 11 (100.0%) |
| Bottled, Tank, or LP Gas | 0 (0.0%) | 0 (0.0%) |
| Electricity | 15 (9.4%) | 0 (0.0%) |
| Fuel Oil or Kerosene | 0 (0.0%) | 0 (0.0%) |
| Coal or Coke | 0 (0.0%) | 0 (0.0%) |
| All other Fuels | 7 (4.4%) | 0 (0.0%) |
| No Fuel Used | 0 (0.0%) | 0 (0.0%) |
| Total | 159 (100.0%) | 11 (100.0%) |
Household Vehicle Usage in Minnetonka Beach
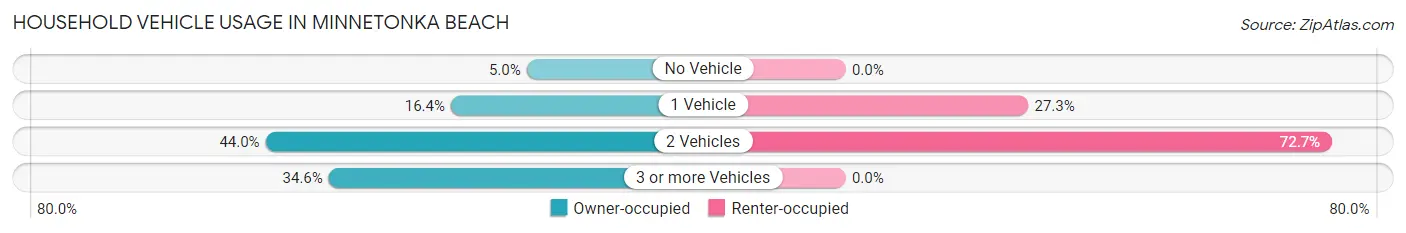
| Vehicles per Household | Owner-occupied | Renter-occupied |
| No Vehicle | 8 (5.0%) | 0 (0.0%) |
| 1 Vehicle | 26 (16.4%) | 3 (27.3%) |
| 2 Vehicles | 70 (44.0%) | 8 (72.7%) |
| 3 or more Vehicles | 55 (34.6%) | 0 (0.0%) |
| Total | 159 (100.0%) | 11 (100.0%) |
Real Estate & Mortgages in Minnetonka Beach
Real Estate and Mortgage Overview in Minnetonka Beach
| Characteristic | Without Mortgage | With Mortgage |
| Housing Units | 45 | 114 |
| Median Property Value | $1,437,500 | $1,187,500 |
| Median Household Income | $250,001 | $86 |
| Monthly Housing Costs | $1,501 | $82 |
| Real Estate Taxes | $10,001 | $0 |
Property Value by Mortgage Status in Minnetonka Beach
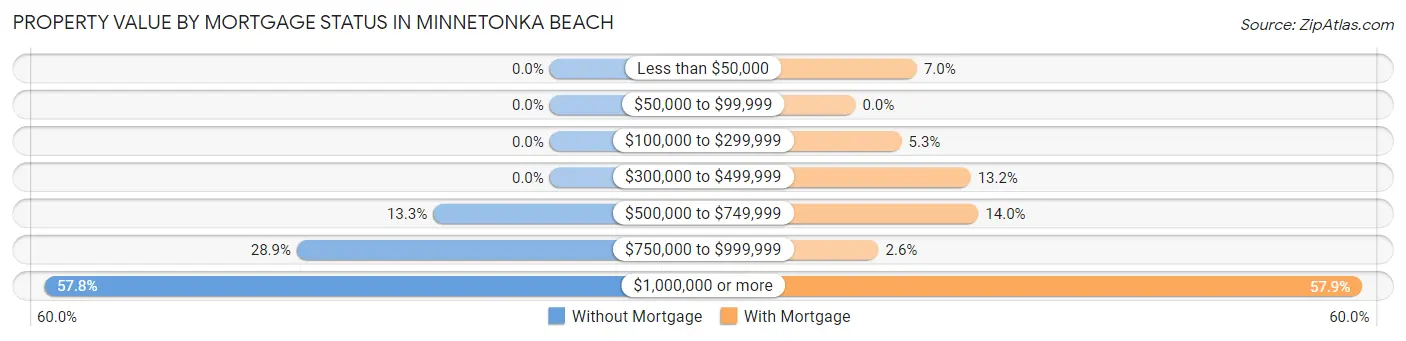
| Property Value | Without Mortgage | With Mortgage |
| Less than $50,000 | 0 (0.0%) | 8 (7.0%) |
| $50,000 to $99,999 | 0 (0.0%) | 0 (0.0%) |
| $100,000 to $299,999 | 0 (0.0%) | 6 (5.3%) |
| $300,000 to $499,999 | 0 (0.0%) | 15 (13.2%) |
| $500,000 to $749,999 | 6 (13.3%) | 16 (14.0%) |
| $750,000 to $999,999 | 13 (28.9%) | 3 (2.6%) |
| $1,000,000 or more | 26 (57.8%) | 66 (57.9%) |
| Total | 45 (100.0%) | 114 (100.0%) |
Household Income by Mortgage Status in Minnetonka Beach
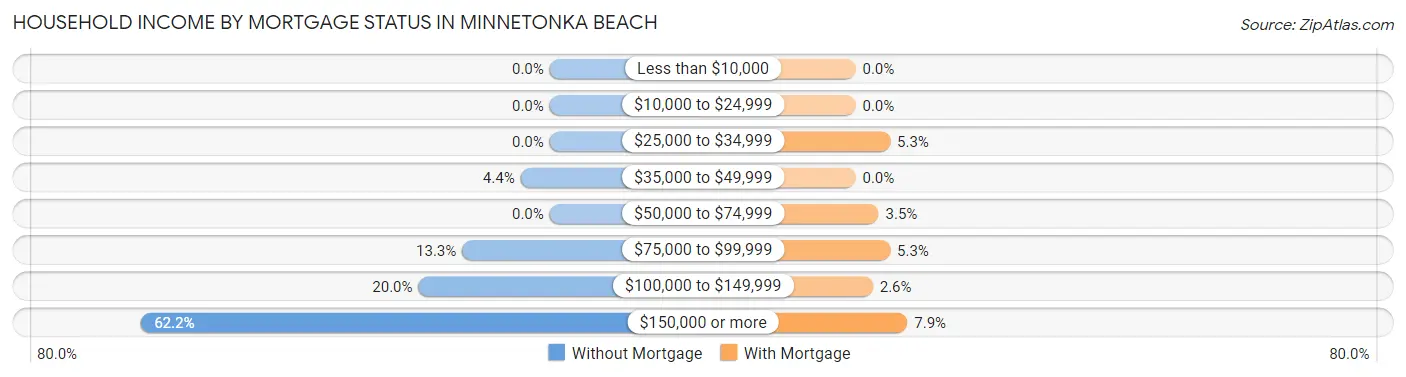
| Household Income | Without Mortgage | With Mortgage |
| Less than $10,000 | 0 (0.0%) | 0 (0.0%) |
| $10,000 to $24,999 | 0 (0.0%) | 0 (0.0%) |
| $25,000 to $34,999 | 0 (0.0%) | 6 (5.3%) |
| $35,000 to $49,999 | 2 (4.4%) | 0 (0.0%) |
| $50,000 to $74,999 | 0 (0.0%) | 4 (3.5%) |
| $75,000 to $99,999 | 6 (13.3%) | 6 (5.3%) |
| $100,000 to $149,999 | 9 (20.0%) | 3 (2.6%) |
| $150,000 or more | 28 (62.2%) | 9 (7.9%) |
| Total | 45 (100.0%) | 114 (100.0%) |
Property Value to Household Income Ratio in Minnetonka Beach
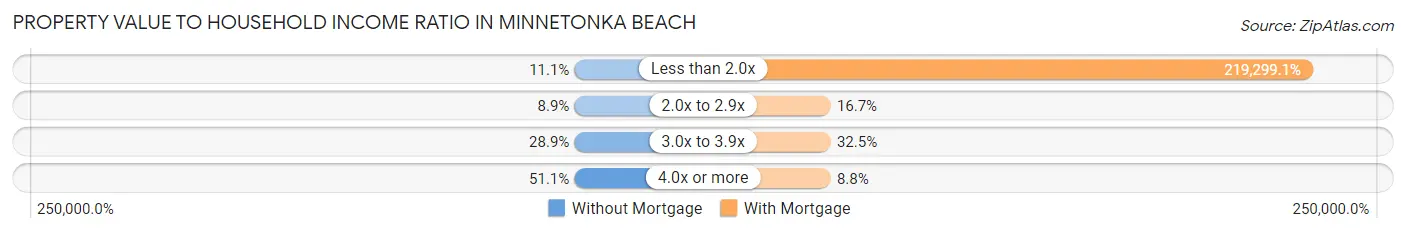
| Value-to-Income Ratio | Without Mortgage | With Mortgage |
| Less than 2.0x | 5 (11.1%) | 250,001 (219,299.1%) |
| 2.0x to 2.9x | 4 (8.9%) | 19 (16.7%) |
| 3.0x to 3.9x | 13 (28.9%) | 37 (32.5%) |
| 4.0x or more | 23 (51.1%) | 10 (8.8%) |
| Total | 45 (100.0%) | 114 (100.0%) |
Real Estate Taxes by Mortgage Status in Minnetonka Beach
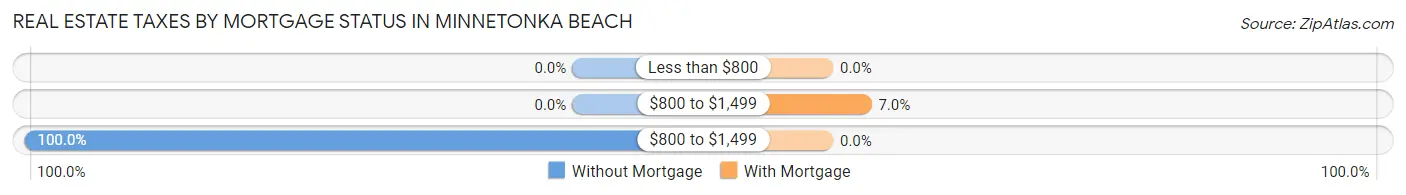
| Property Taxes | Without Mortgage | With Mortgage |
| Less than $800 | 0 (0.0%) | 0 (0.0%) |
| $800 to $1,499 | 0 (0.0%) | 8 (7.0%) |
| $800 to $1,499 | 45 (100.0%) | 0 (0.0%) |
| Total | 45 (100.0%) | 114 (100.0%) |
Health & Disability in Minnetonka Beach
Health Insurance Coverage by Age in Minnetonka Beach
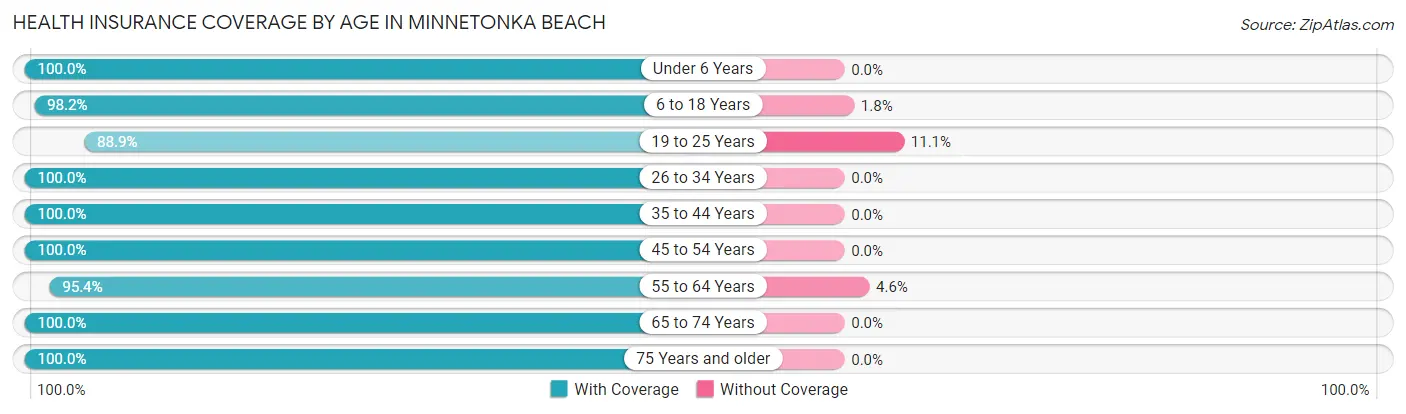
| Age Bracket | With Coverage | Without Coverage |
| Under 6 Years | 28 (100.0%) | 0 (0.0%) |
| 6 to 18 Years | 110 (98.2%) | 2 (1.8%) |
| 19 to 25 Years | 16 (88.9%) | 2 (11.1%) |
| 26 to 34 Years | 17 (100.0%) | 0 (0.0%) |
| 35 to 44 Years | 54 (100.0%) | 0 (0.0%) |
| 45 to 54 Years | 106 (100.0%) | 0 (0.0%) |
| 55 to 64 Years | 62 (95.4%) | 3 (4.6%) |
| 65 to 74 Years | 38 (100.0%) | 0 (0.0%) |
| 75 Years and older | 25 (100.0%) | 0 (0.0%) |
| Total | 456 (98.5%) | 7 (1.5%) |
Health Insurance Coverage by Citizenship Status in Minnetonka Beach
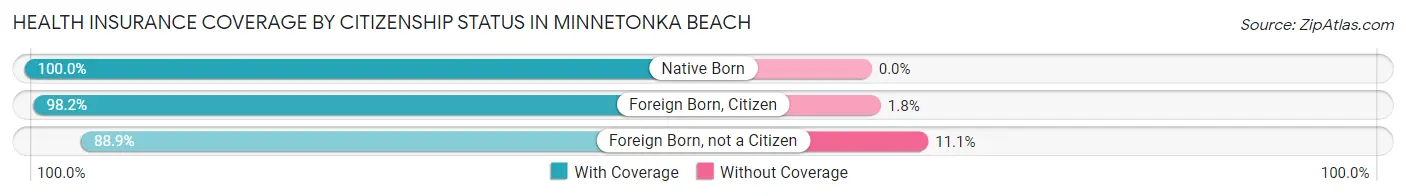
| Citizenship Status | With Coverage | Without Coverage |
| Native Born | 28 (100.0%) | 0 (0.0%) |
| Foreign Born, Citizen | 110 (98.2%) | 2 (1.8%) |
| Foreign Born, not a Citizen | 16 (88.9%) | 2 (11.1%) |
Health Insurance Coverage by Household Income in Minnetonka Beach
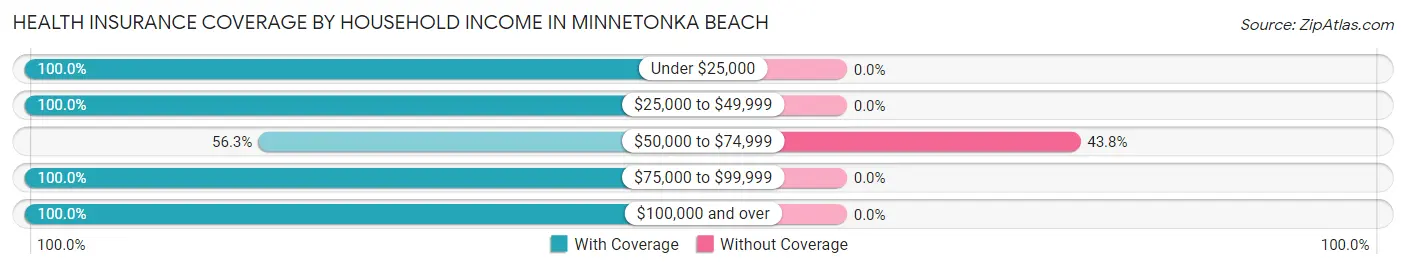
| Household Income | With Coverage | Without Coverage |
| Under $25,000 | 9 (100.0%) | 0 (0.0%) |
| $25,000 to $49,999 | 10 (100.0%) | 0 (0.0%) |
| $50,000 to $74,999 | 9 (56.2%) | 7 (43.8%) |
| $75,000 to $99,999 | 14 (100.0%) | 0 (0.0%) |
| $100,000 and over | 414 (100.0%) | 0 (0.0%) |
Public vs Private Health Insurance Coverage by Age in Minnetonka Beach
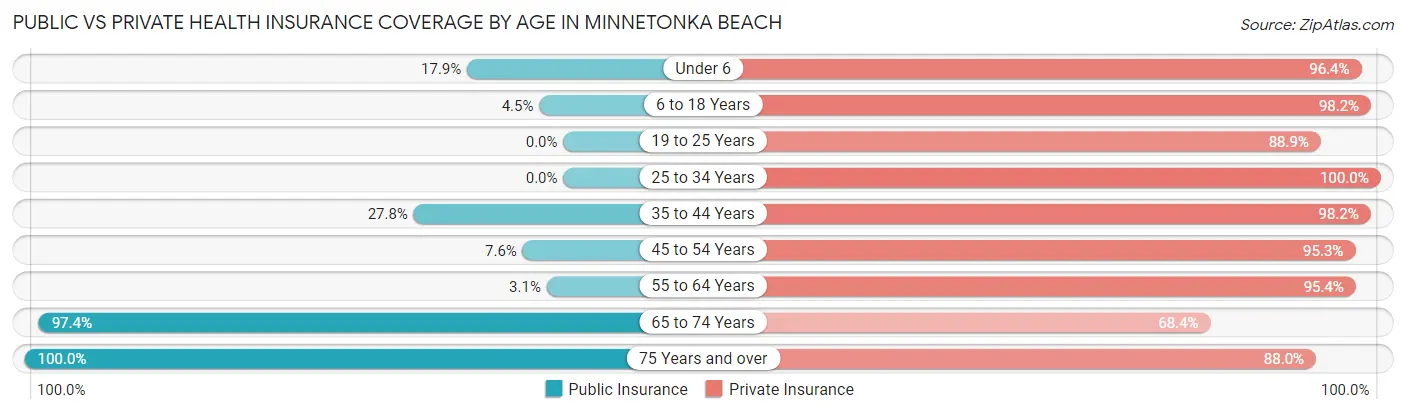
| Age Bracket | Public Insurance | Private Insurance |
| Under 6 | 5 (17.9%) | 27 (96.4%) |
| 6 to 18 Years | 5 (4.5%) | 110 (98.2%) |
| 19 to 25 Years | 0 (0.0%) | 16 (88.9%) |
| 25 to 34 Years | 0 (0.0%) | 17 (100.0%) |
| 35 to 44 Years | 15 (27.8%) | 53 (98.2%) |
| 45 to 54 Years | 8 (7.5%) | 101 (95.3%) |
| 55 to 64 Years | 2 (3.1%) | 62 (95.4%) |
| 65 to 74 Years | 37 (97.4%) | 26 (68.4%) |
| 75 Years and over | 25 (100.0%) | 22 (88.0%) |
| Total | 97 (20.9%) | 434 (93.7%) |
Disability Status by Sex by Age in Minnetonka Beach
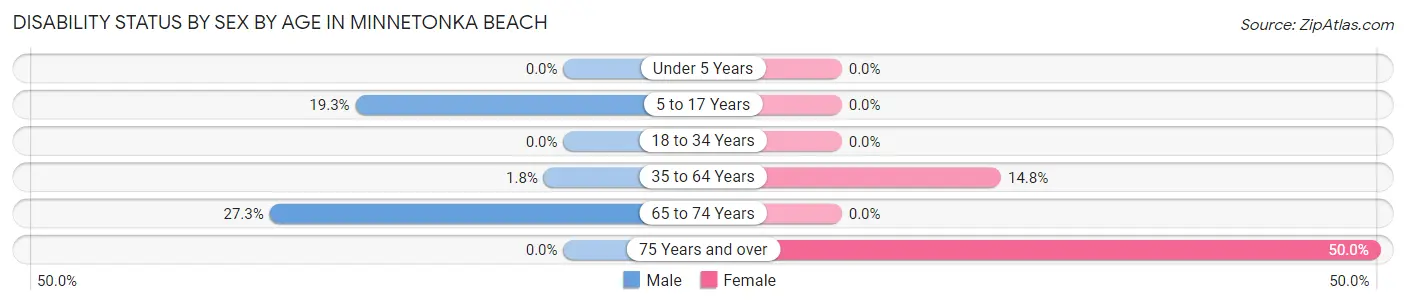
| Age Bracket | Male | Female |
| Under 5 Years | 0 (0.0%) | 0 (0.0%) |
| 5 to 17 Years | 11 (19.3%) | 0 (0.0%) |
| 18 to 34 Years | 0 (0.0%) | 0 (0.0%) |
| 35 to 64 Years | 2 (1.8%) | 17 (14.8%) |
| 65 to 74 Years | 6 (27.3%) | 0 (0.0%) |
| 75 Years and over | 0 (0.0%) | 8 (50.0%) |
Disability Class by Sex by Age in Minnetonka Beach
Disability Class: Hearing Difficulty
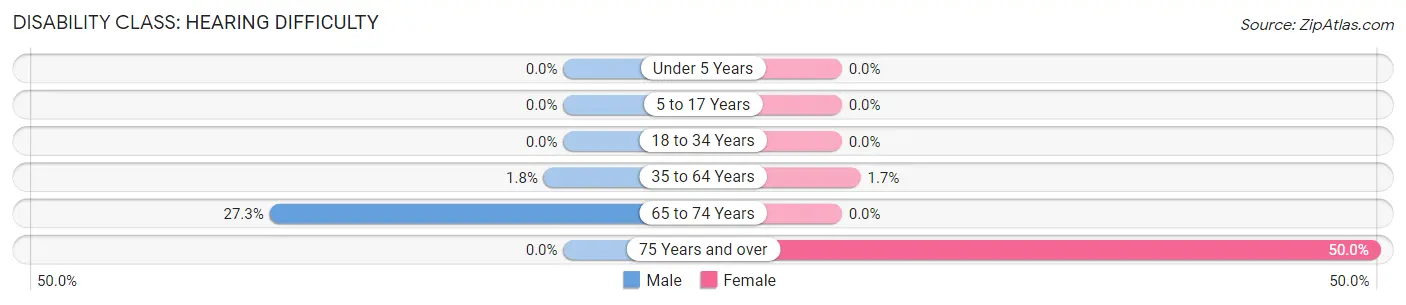
| Age Bracket | Male | Female |
| Under 5 Years | 0 (0.0%) | 0 (0.0%) |
| 5 to 17 Years | 0 (0.0%) | 0 (0.0%) |
| 18 to 34 Years | 0 (0.0%) | 0 (0.0%) |
| 35 to 64 Years | 2 (1.8%) | 2 (1.7%) |
| 65 to 74 Years | 6 (27.3%) | 0 (0.0%) |
| 75 Years and over | 0 (0.0%) | 8 (50.0%) |
Disability Class: Vision Difficulty
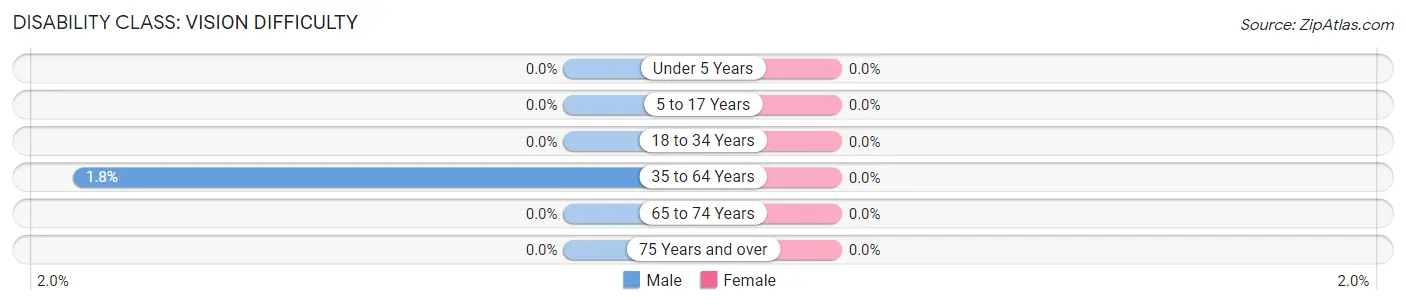
| Age Bracket | Male | Female |
| Under 5 Years | 0 (0.0%) | 0 (0.0%) |
| 5 to 17 Years | 0 (0.0%) | 0 (0.0%) |
| 18 to 34 Years | 0 (0.0%) | 0 (0.0%) |
| 35 to 64 Years | 2 (1.8%) | 0 (0.0%) |
| 65 to 74 Years | 0 (0.0%) | 0 (0.0%) |
| 75 Years and over | 0 (0.0%) | 0 (0.0%) |
Disability Class: Cognitive Difficulty
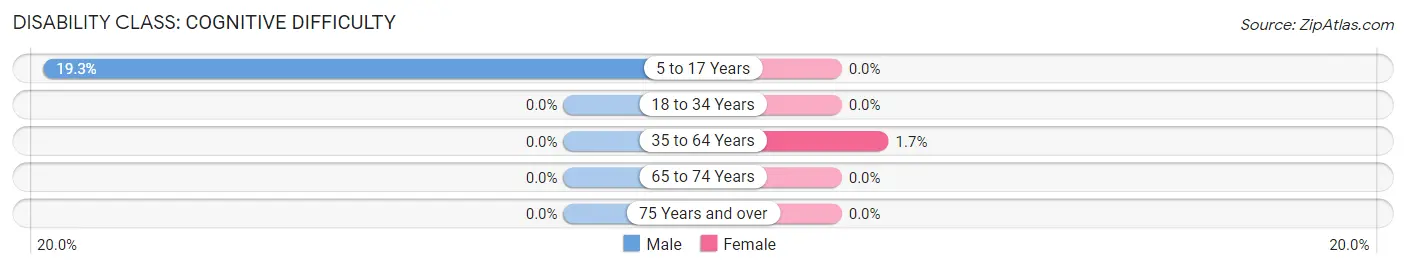
| Age Bracket | Male | Female |
| 5 to 17 Years | 11 (19.3%) | 0 (0.0%) |
| 18 to 34 Years | 0 (0.0%) | 0 (0.0%) |
| 35 to 64 Years | 0 (0.0%) | 2 (1.7%) |
| 65 to 74 Years | 0 (0.0%) | 0 (0.0%) |
| 75 Years and over | 0 (0.0%) | 0 (0.0%) |
Disability Class: Ambulatory Difficulty
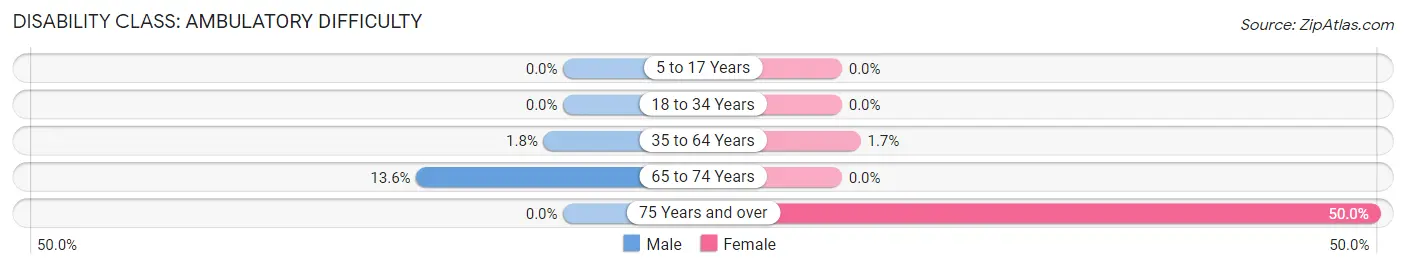
| Age Bracket | Male | Female |
| 5 to 17 Years | 0 (0.0%) | 0 (0.0%) |
| 18 to 34 Years | 0 (0.0%) | 0 (0.0%) |
| 35 to 64 Years | 2 (1.8%) | 2 (1.7%) |
| 65 to 74 Years | 3 (13.6%) | 0 (0.0%) |
| 75 Years and over | 0 (0.0%) | 8 (50.0%) |
Disability Class: Self-Care Difficulty
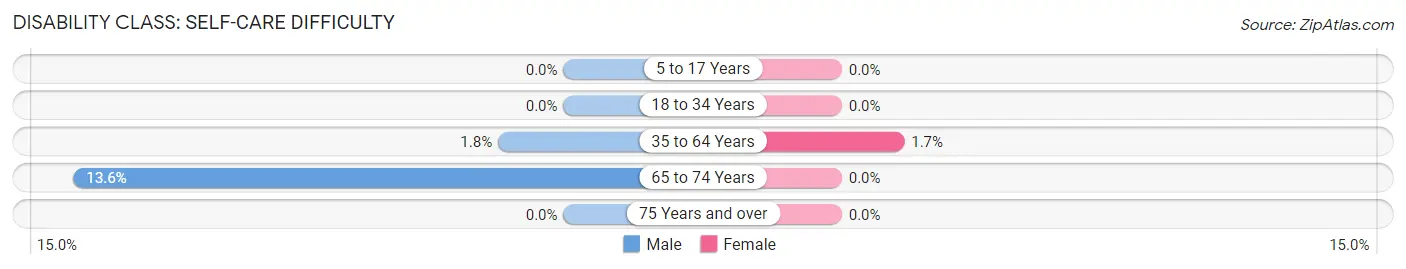
| Age Bracket | Male | Female |
| 5 to 17 Years | 0 (0.0%) | 0 (0.0%) |
| 18 to 34 Years | 0 (0.0%) | 0 (0.0%) |
| 35 to 64 Years | 2 (1.8%) | 2 (1.7%) |
| 65 to 74 Years | 3 (13.6%) | 0 (0.0%) |
| 75 Years and over | 0 (0.0%) | 0 (0.0%) |
Technology Access in Minnetonka Beach
Computing Device Access in Minnetonka Beach
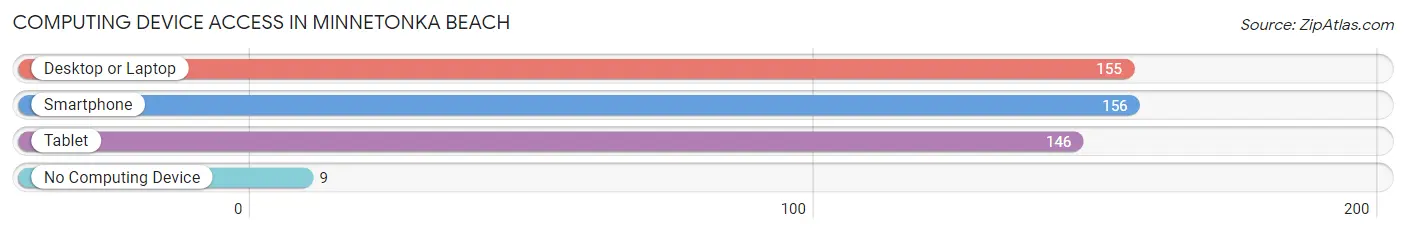
| Device Type | # Households | % Households |
| Desktop or Laptop | 155 | 91.2% |
| Smartphone | 156 | 91.8% |
| Tablet | 146 | 85.9% |
| No Computing Device | 9 | 5.3% |
| Total | 170 | 100.0% |
Internet Access in Minnetonka Beach
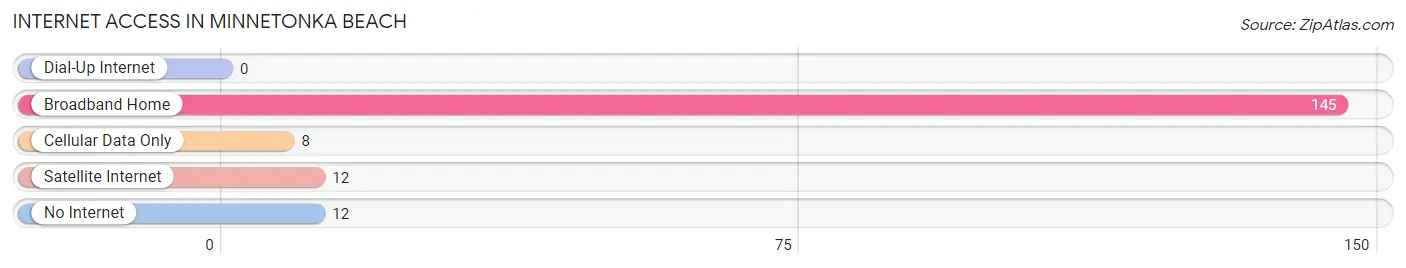
| Internet Type | # Households | % Households |
| Dial-Up Internet | 0 | 0.0% |
| Broadband Home | 145 | 85.3% |
| Cellular Data Only | 8 | 4.7% |
| Satellite Internet | 12 | 7.1% |
| No Internet | 12 | 7.1% |
| Total | 170 | 100.0% |
Minnetonka Beach Summary
Minnetonka Beach, Minnesota is a small city located in Hennepin County, Minnesota. It is situated on the western shore of Lake Minnetonka, approximately 20 miles west of Minneapolis. The city has a population of approximately 1,400 people and covers an area of 1.2 square miles.
History
The area that is now Minnetonka Beach was first settled in the mid-1800s by a group of German immigrants. The area was originally known as “Minnetonka Mills” and was a small farming community. In the late 1800s, the area began to develop as a resort destination, with the first hotel being built in 1887. The area was officially incorporated as a village in 1902 and was renamed “Minnetonka Beach” in 1906.
The city experienced a period of growth in the early 1900s, with the construction of several large resorts and the development of a streetcar line connecting the city to Minneapolis. The city also became a popular destination for wealthy families from the Twin Cities area, who built large summer homes in the area.
In the 1950s, the city began to decline as a resort destination, and many of the resorts and summer homes were abandoned. The city experienced a resurgence in the late 1970s and early 1980s, as the area was redeveloped and new businesses and homes were built.
Geography
Minnetonka Beach is located on the western shore of Lake Minnetonka, approximately 20 miles west of Minneapolis. The city is situated on a peninsula, with the lake to the east and the Minnehaha Creek to the west. The city is surrounded by the cities of Minnetonka, Deephaven, and Wayzata.
The city has a total area of 1.2 square miles, all of which is land. The terrain is mostly flat, with some rolling hills in the northern part of the city. The city has a total of 1.2 miles of shoreline on Lake Minnetonka.
Economy
The economy of Minnetonka Beach is largely based on tourism and recreation. The city is home to several resorts and hotels, as well as a variety of restaurants and shops. The city also has a marina, which provides access to Lake Minnetonka for boaters.
The city is also home to several small businesses, including a variety of professional services, retail stores, and restaurants. The city is also home to a number of corporate offices, including those of the Minnetonka Corporation and the Minnetonka Beach Resort.
Demographics
As of the 2010 census, the population of Minnetonka Beach was 1,400 people. The racial makeup of the city was 94.3% White, 1.9% African American, 0.3% Native American, 1.3% Asian, 0.1% Pacific Islander, 0.7% from other races, and 1.7% from two or more races. Hispanic or Latino of any race were 2.3% of the population.
The median household income in Minnetonka Beach was $76,250, and the median family income was $87,500. The per capita income for the city was $37,890. About 4.3% of families and 5.7% of the population were below the poverty line, including 6.3% of those under age 18 and 4.3% of those age 65 or over.
Common Questions
What is Per Capita Income in Minnetonka Beach?
Per Capita income in Minnetonka Beach is $154,556.
What is the Median Family Income in Minnetonka Beach?
Median Family Income in Minnetonka Beach is $250,001.
What is the Median Household income in Minnetonka Beach?
Median Household Income in Minnetonka Beach is $250,001.
What is Income or Wage Gap in Minnetonka Beach?
Income or Wage Gap in Minnetonka Beach is 66.8%.
Women in Minnetonka Beach earn 33.2 cents for every dollar earned by a man.
What is Inequality or Gini Index in Minnetonka Beach?
Inequality or Gini Index in Minnetonka Beach is 0.46.
What is the Total Population of Minnetonka Beach?
Total Population of Minnetonka Beach is 463.
What is the Total Male Population of Minnetonka Beach?
Total Male Population of Minnetonka Beach is 230.
What is the Total Female Population of Minnetonka Beach?
Total Female Population of Minnetonka Beach is 233.
What is the Ratio of Males per 100 Females in Minnetonka Beach?
There are 98.71 Males per 100 Females in Minnetonka Beach.
What is the Ratio of Females per 100 Males in Minnetonka Beach?
There are 101.30 Females per 100 Males in Minnetonka Beach.
What is the Median Population Age in Minnetonka Beach?
Median Population Age in Minnetonka Beach is 45.3 Years.
What is the Average Family Size in Minnetonka Beach
Average Family Size in Minnetonka Beach is 3.1 People.
What is the Average Household Size in Minnetonka Beach
Average Household Size in Minnetonka Beach is 2.7 People.
How Large is the Labor Force in Minnetonka Beach?
There are 240 People in the Labor Forcein in Minnetonka Beach.
What is the Percentage of People in the Labor Force in Minnetonka Beach?
72.1% of People are in the Labor Force in Minnetonka Beach.