North Oaks, MN Map & Demographics
North Oaks Map
North Oaks Overview
$95,366
PER CAPITA INCOME
$250,001
AVG FAMILY INCOME
$235,714
AVG HOUSEHOLD INCOME
61.6%
WAGE / INCOME GAP [ % ]
38.4¢/ $1
WAGE / INCOME GAP [ $ ]
0.44
INEQUALITY / GINI INDEX
5,193
TOTAL POPULATION
2,468
MALE POPULATION
2,725
FEMALE POPULATION
90.57
MALES / 100 FEMALES
110.41
FEMALES / 100 MALES
48.1
MEDIAN AGE
3.2
AVG FAMILY SIZE
2.9
AVG HOUSEHOLD SIZE
2,113
LABOR FORCE [ PEOPLE ]
54.3%
PERCENT IN LABOR FORCE
5.1%
UNEMPLOYMENT RATE
North Oaks Area Codes
Income in North Oaks
Income Overview in North Oaks
Per Capita Income in North Oaks is $95,366, while median incomes of families and households are $250,001 and $235,714 respectively.
| Characteristic | Number | Measure |
| Per Capita Income | 5,193 | $95,366 |
| Median Family Income | 1,466 | $250,001 |
| Mean Family Income | 1,466 | $305,086 |
| Median Household Income | 1,758 | $235,714 |
| Mean Household Income | 1,758 | $278,274 |
| Income Deficit | 1,466 | $0 |
| Wage / Income Gap (%) | 5,193 | 61.64% |
| Wage / Income Gap ($) | 5,193 | 38.36¢ per $1 |
| Gini / Inequality Index | 5,193 | 0.44 |
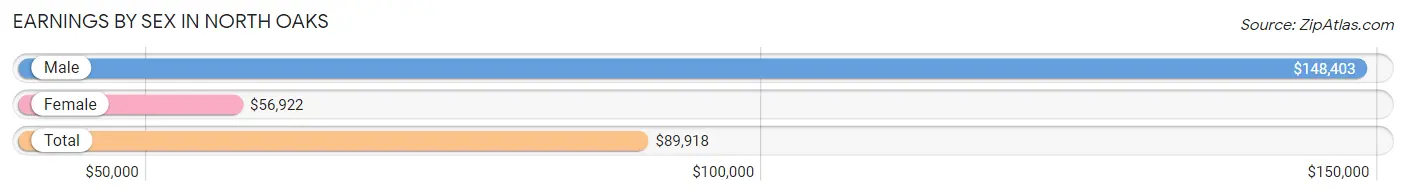
Earnings by Sex in North Oaks
Average Earnings in North Oaks are $89,918, $148,403 for men and $56,922 for women, a difference of 61.6%.
| Sex | Number | Average Earnings |
| Male | 1,207 (51.4%) | $148,403 |
| Female | 1,139 (48.5%) | $56,922 |
| Total | 2,346 (100.0%) | $89,918 |
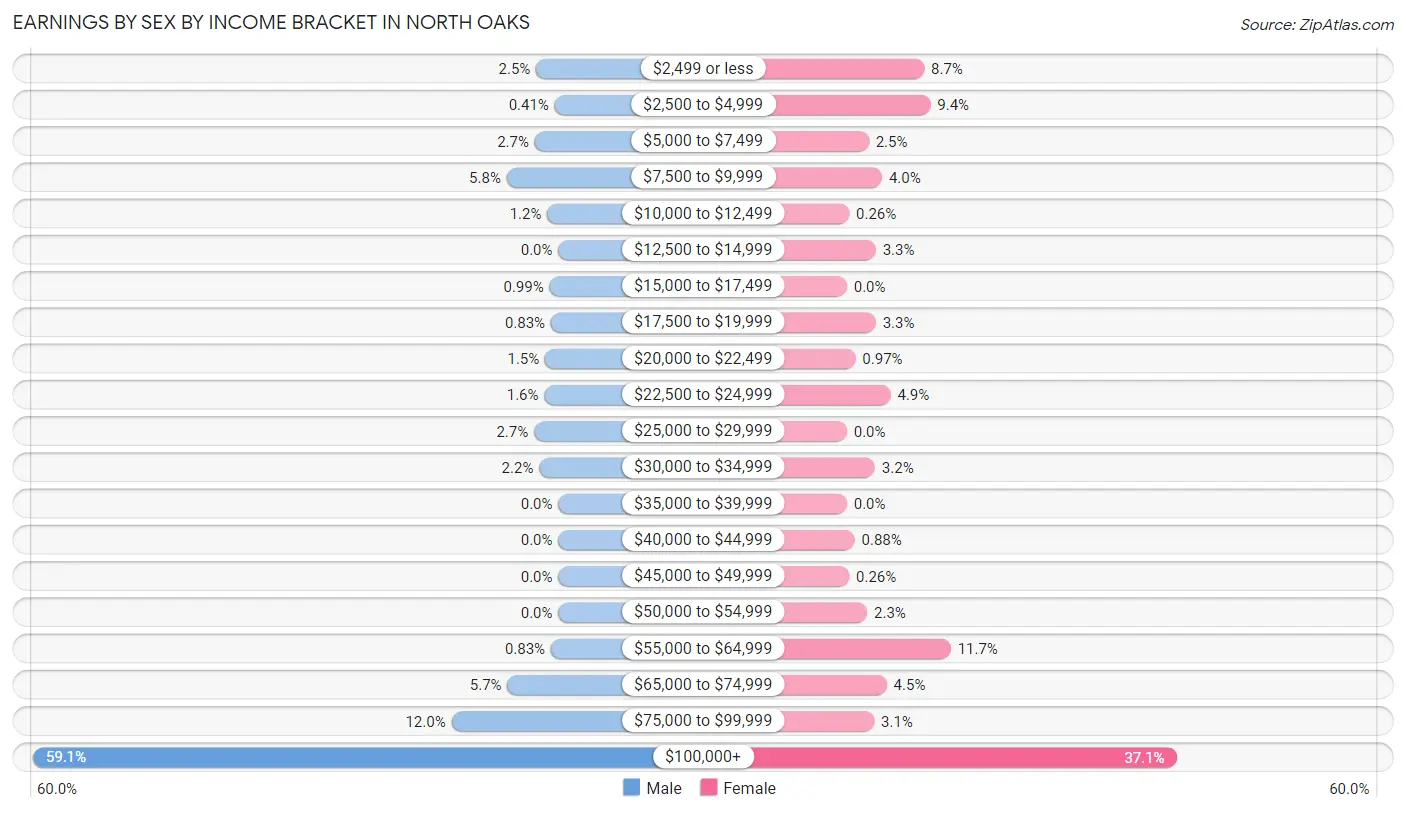
Earnings by Sex by Income Bracket in North Oaks
The most common earnings brackets in North Oaks are $100,000+ for men (713 | 59.1%) and $100,000+ for women (422 | 37.0%).
| Income | Male | Female |
| $2,499 or less | 30 (2.5%) | 99 (8.7%) |
| $2,500 to $4,999 | 5 (0.4%) | 107 (9.4%) |
| $5,000 to $7,499 | 32 (2.6%) | 28 (2.5%) |
| $7,500 to $9,999 | 70 (5.8%) | 45 (4.0%) |
| $10,000 to $12,499 | 15 (1.2%) | 3 (0.3%) |
| $12,500 to $14,999 | 0 (0.0%) | 37 (3.3%) |
| $15,000 to $17,499 | 12 (1.0%) | 0 (0.0%) |
| $17,500 to $19,999 | 10 (0.8%) | 37 (3.3%) |
| $20,000 to $22,499 | 18 (1.5%) | 11 (1.0%) |
| $22,500 to $24,999 | 19 (1.6%) | 56 (4.9%) |
| $25,000 to $29,999 | 33 (2.7%) | 0 (0.0%) |
| $30,000 to $34,999 | 26 (2.1%) | 36 (3.2%) |
| $35,000 to $39,999 | 0 (0.0%) | 0 (0.0%) |
| $40,000 to $44,999 | 0 (0.0%) | 10 (0.9%) |
| $45,000 to $49,999 | 0 (0.0%) | 3 (0.3%) |
| $50,000 to $54,999 | 0 (0.0%) | 26 (2.3%) |
| $55,000 to $64,999 | 10 (0.8%) | 133 (11.7%) |
| $65,000 to $74,999 | 69 (5.7%) | 51 (4.5%) |
| $75,000 to $99,999 | 145 (12.0%) | 35 (3.1%) |
| $100,000+ | 713 (59.1%) | 422 (37.0%) |
| Total | 1,207 (100.0%) | 1,139 (100.0%) |
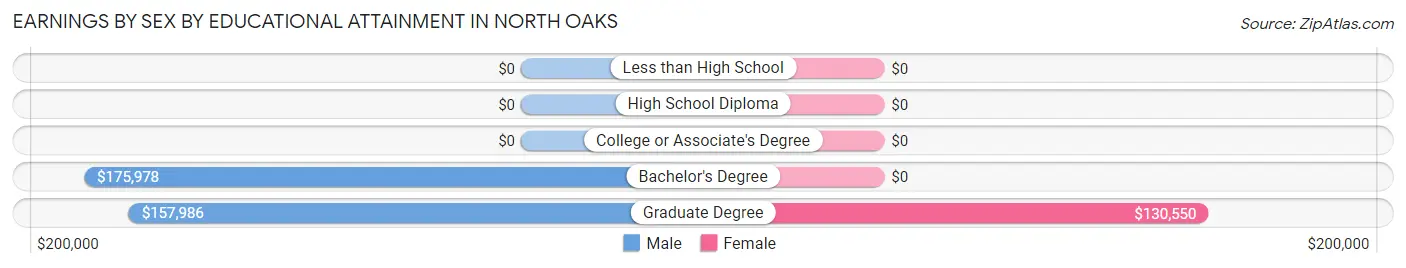
Earnings by Sex by Educational Attainment in North Oaks
Average earnings in North Oaks are $159,583 for men and $74,779 for women, a difference of 53.1%. Men with an educational attainment of bachelor's degree enjoy the highest average annual earnings of $175,978, while those with graduate degree education earn the least with $157,986. Women with an educational attainment of graduate degree earn the most with the average annual earnings of $130,550, while those with graduate degree education have the smallest earnings of $130,550.
| Educational Attainment | Male Income | Female Income |
| Less than High School | - | - |
| High School Diploma | - | - |
| College or Associate's Degree | - | - |
| Bachelor's Degree | $175,978 | $0 |
| Graduate Degree | $157,986 | $130,550 |
| Total | $159,583 | $74,779 |
Family Income in North Oaks
Family Income Brackets in North Oaks
According to the North Oaks family income data, there are 934 families falling into the $200,000+ income range, which is the most common income bracket and makes up 63.7% of all families.
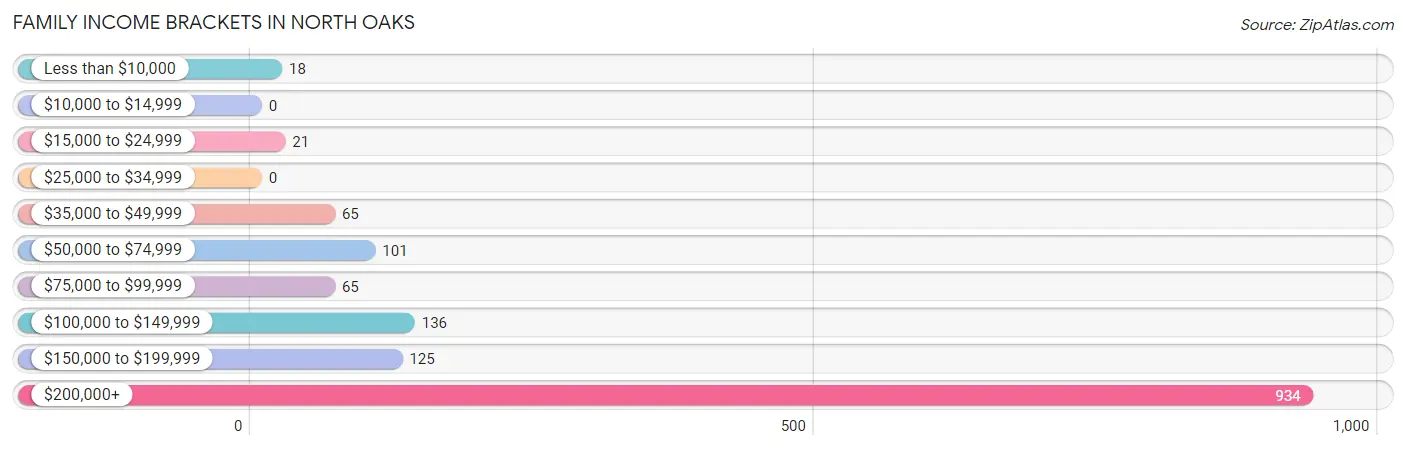
| Income Bracket | # Families | % Families |
| Less than $10,000 | 18 | 1.2% |
| $10,000 to $14,999 | 0 | 0.0% |
| $15,000 to $24,999 | 21 | 1.4% |
| $25,000 to $34,999 | 0 | 0.0% |
| $35,000 to $49,999 | 65 | 4.4% |
| $50,000 to $74,999 | 101 | 6.9% |
| $75,000 to $99,999 | 65 | 4.4% |
| $100,000 to $149,999 | 136 | 9.3% |
| $150,000 to $199,999 | 125 | 8.5% |
| $200,000+ | 934 | 63.7% |
Family Income by Famaliy Size in North Oaks
3-person families (232 | 15.8%) account for the highest median family income in North Oaks with $250,001 per family, while 2-person families (668 | 45.6%) have the highest median income of $118,214 per family member.
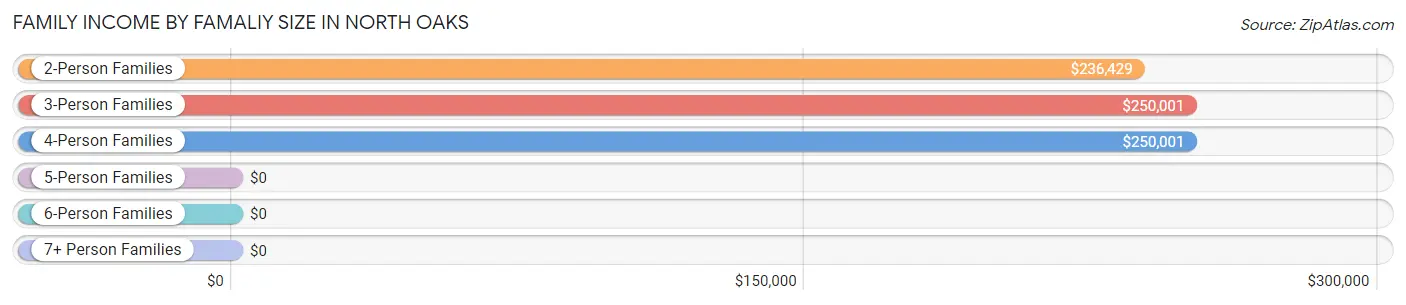
| Income Bracket | # Families | Median Income |
| 2-Person Families | 668 (45.6%) | $236,429 |
| 3-Person Families | 232 (15.8%) | $250,001 |
| 4-Person Families | 337 (23.0%) | $250,001 |
| 5-Person Families | 122 (8.3%) | $0 |
| 6-Person Families | 91 (6.2%) | $0 |
| 7+ Person Families | 16 (1.1%) | $0 |
| Total | 1,466 (100.0%) | $250,001 |
Family Income by Number of Earners in North Oaks
The median family income in North Oaks is $250,001, with families comprising 2 earners (595) having the highest median family income of $250,001, while families with no earners (229) have the lowest median family income of $188,162, accounting for 40.6% and 15.6% of families, respectively.
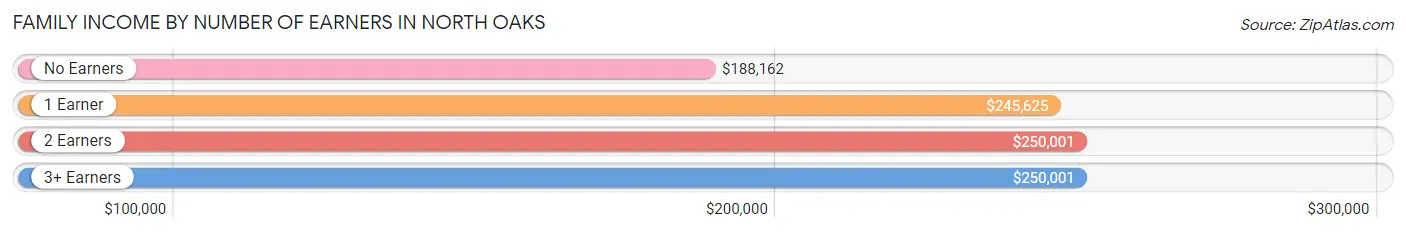
| Number of Earners | # Families | Median Income |
| No Earners | 229 (15.6%) | $188,162 |
| 1 Earner | 449 (30.6%) | $245,625 |
| 2 Earners | 595 (40.6%) | $250,001 |
| 3+ Earners | 193 (13.2%) | $250,001 |
| Total | 1,466 (100.0%) | $250,001 |
Household Income in North Oaks
Household Income Brackets in North Oaks
With 992 households falling in the category, the $200,000+ income range is the most frequent in North Oaks, accounting for 56.4% of all households. In contrast, only 16 households (0.9%) fall into the $25,000 to $34,999 income bracket, making it the least populous group.
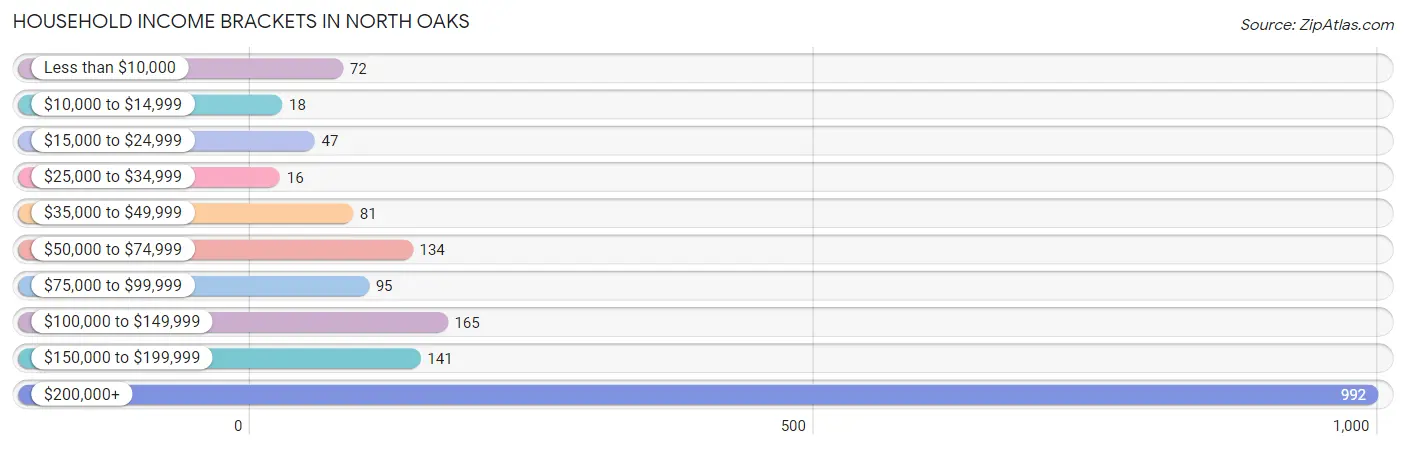
| Income Bracket | # Households | % Households |
| Less than $10,000 | 72 | 4.1% |
| $10,000 to $14,999 | 18 | 1.0% |
| $15,000 to $24,999 | 47 | 2.7% |
| $25,000 to $34,999 | 16 | 0.9% |
| $35,000 to $49,999 | 81 | 4.6% |
| $50,000 to $74,999 | 134 | 7.6% |
| $75,000 to $99,999 | 95 | 5.4% |
| $100,000 to $149,999 | 165 | 9.4% |
| $150,000 to $199,999 | 141 | 8.0% |
| $200,000+ | 992 | 56.4% |
Household Income by Householder Age in North Oaks
The median household income in North Oaks is $235,714, with the highest median household income of $250,001 found in the 25 to 44 years age bracket for the primary householder. A total of 379 households (21.6%) fall into this category.
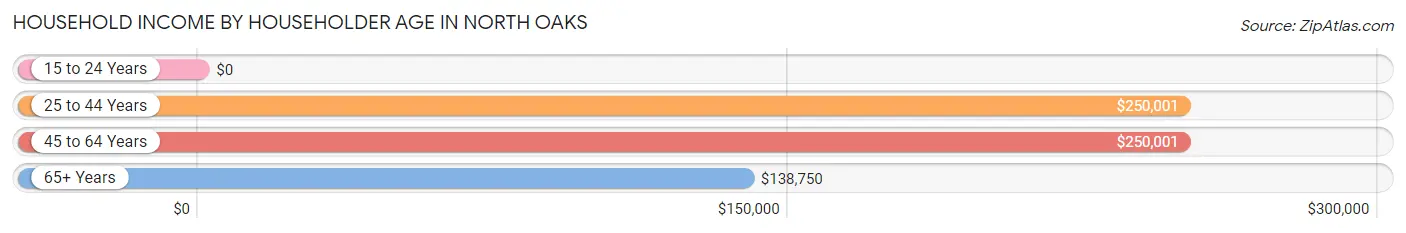
| Income Bracket | # Households | Median Income |
| 15 to 24 Years | 0 (0.0%) | $0 |
| 25 to 44 Years | 379 (21.6%) | $250,001 |
| 45 to 64 Years | 580 (33.0%) | $250,001 |
| 65+ Years | 799 (45.5%) | $138,750 |
| Total | 1,758 (100.0%) | $235,714 |
Poverty in North Oaks
Income Below Poverty by Sex and Age in North Oaks
With 2.2% poverty level for males and 4.9% for females among the residents of North Oaks, 35 to 44 year old males and 75 year old and over females are the most vulnerable to poverty, with 20 males (5.6%) and 67 females (17.3%) in their respective age groups living below the poverty level.
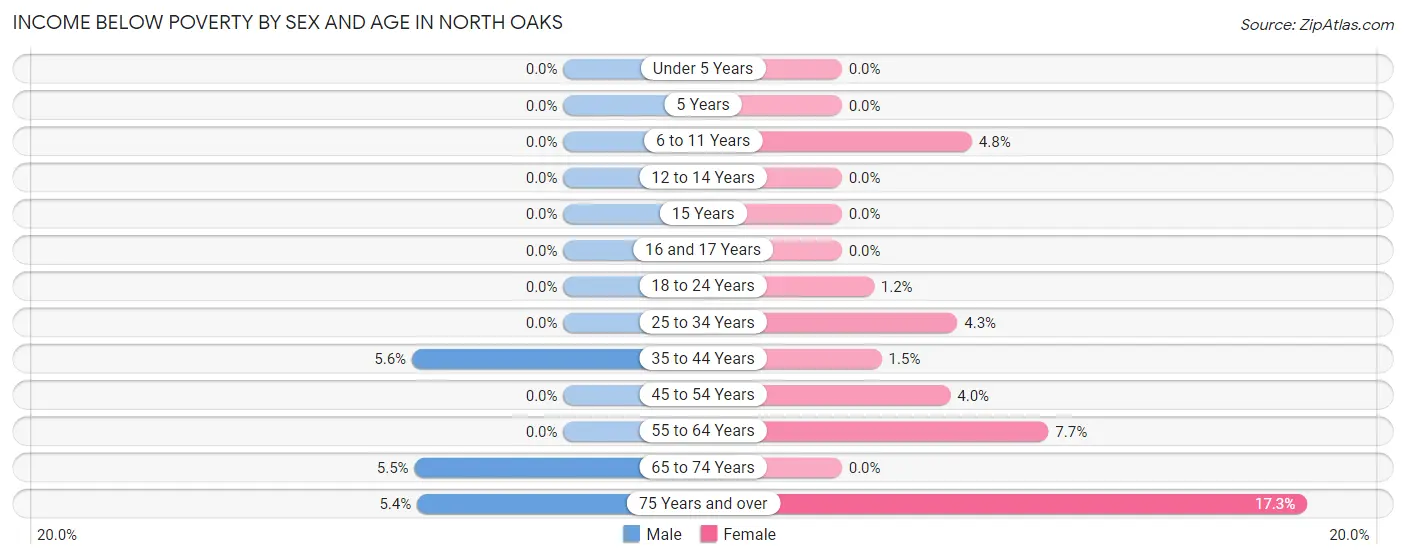
| Age Bracket | Male | Female |
| Under 5 Years | 0 (0.0%) | 0 (0.0%) |
| 5 Years | 0 (0.0%) | 0 (0.0%) |
| 6 to 11 Years | 0 (0.0%) | 13 (4.8%) |
| 12 to 14 Years | 0 (0.0%) | 0 (0.0%) |
| 15 Years | 0 (0.0%) | 0 (0.0%) |
| 16 and 17 Years | 0 (0.0%) | 0 (0.0%) |
| 18 to 24 Years | 0 (0.0%) | 2 (1.2%) |
| 25 to 34 Years | 0 (0.0%) | 3 (4.3%) |
| 35 to 44 Years | 20 (5.6%) | 6 (1.5%) |
| 45 to 54 Years | 0 (0.0%) | 11 (4.0%) |
| 55 to 64 Years | 0 (0.0%) | 28 (7.7%) |
| 65 to 74 Years | 21 (5.5%) | 0 (0.0%) |
| 75 Years and over | 14 (5.4%) | 67 (17.3%) |
| Total | 55 (2.2%) | 130 (4.9%) |
Income Above Poverty by Sex and Age in North Oaks
According to the poverty statistics in North Oaks, males aged under 5 years and females aged under 5 years are the age groups that are most secure financially, with 100.0% of males and 100.0% of females in these age groups living above the poverty line.
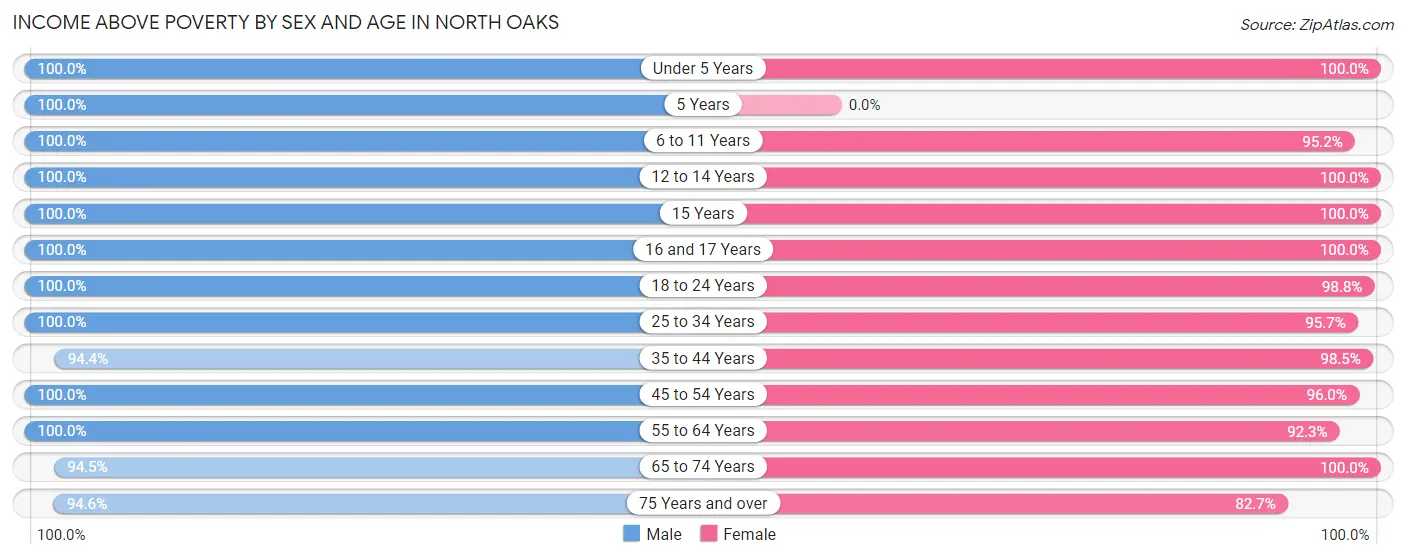
| Age Bracket | Male | Female |
| Under 5 Years | 305 (100.0%) | 79 (100.0%) |
| 5 Years | 23 (100.0%) | 0 (0.0%) |
| 6 to 11 Years | 263 (100.0%) | 256 (95.2%) |
| 12 to 14 Years | 136 (100.0%) | 72 (100.0%) |
| 15 Years | 19 (100.0%) | 135 (100.0%) |
| 16 and 17 Years | 27 (100.0%) | 117 (100.0%) |
| 18 to 24 Years | 87 (100.0%) | 166 (98.8%) |
| 25 to 34 Years | 9 (100.0%) | 67 (95.7%) |
| 35 to 44 Years | 336 (94.4%) | 399 (98.5%) |
| 45 to 54 Years | 275 (100.0%) | 262 (96.0%) |
| 55 to 64 Years | 319 (100.0%) | 337 (92.3%) |
| 65 to 74 Years | 359 (94.5%) | 293 (100.0%) |
| 75 Years and over | 244 (94.6%) | 321 (82.7%) |
| Total | 2,402 (97.8%) | 2,504 (95.1%) |
Income Below Poverty Among Married-Couple Families in North Oaks
The poverty statistics for married-couple families in North Oaks show that 2.0% or 28 of the total 1,379 families live below the poverty line. Families with no children have the highest poverty rate of 3.7%, comprising of 28 families. On the other hand, families with 1 or 2 children have the lowest poverty rate of 0.0%, which includes 0 families.
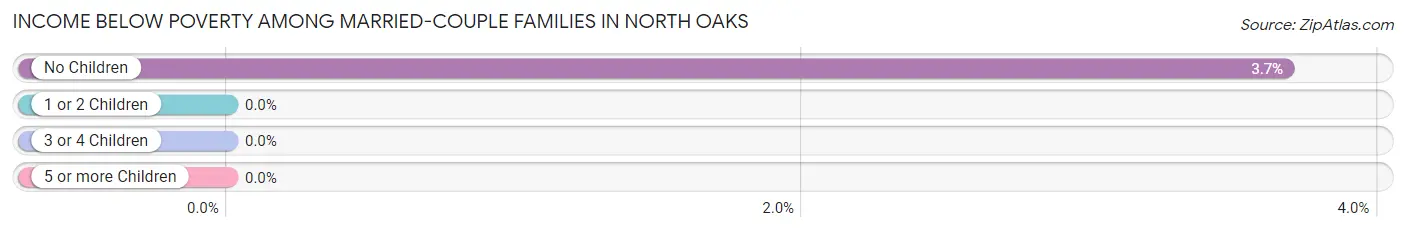
| Children | Above Poverty | Below Poverty |
| No Children | 732 (96.3%) | 28 (3.7%) |
| 1 or 2 Children | 473 (100.0%) | 0 (0.0%) |
| 3 or 4 Children | 146 (100.0%) | 0 (0.0%) |
| 5 or more Children | 0 (0.0%) | 0 (0.0%) |
| Total | 1,351 (98.0%) | 28 (2.0%) |
Income Below Poverty Among Single-Parent Households in North Oaks
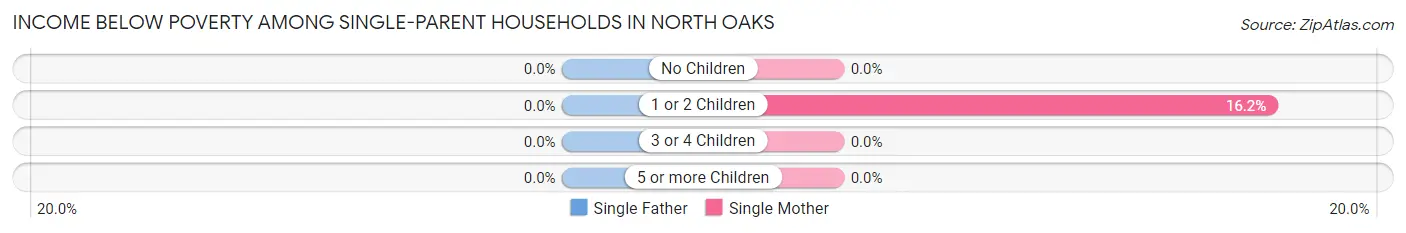
| Children | Single Father | Single Mother |
| No Children | 0 (0.0%) | 0 (0.0%) |
| 1 or 2 Children | 0 (0.0%) | 11 (16.2%) |
| 3 or 4 Children | 0 (0.0%) | 0 (0.0%) |
| 5 or more Children | 0 (0.0%) | 0 (0.0%) |
| Total | 0 (0.0%) | 11 (16.2%) |
Income Below Poverty Among Married-Couple vs Single-Parent Households in North Oaks
The poverty data for North Oaks shows that 28 of the married-couple family households (2.0%) and 11 of the single-parent households (12.6%) are living below the poverty level. Within the married-couple family households, those with no children have the highest poverty rate, with 28 households (3.7%) falling below the poverty line. Among the single-parent households, those with 1 or 2 children have the highest poverty rate, with 11 household (16.2%) living below poverty.
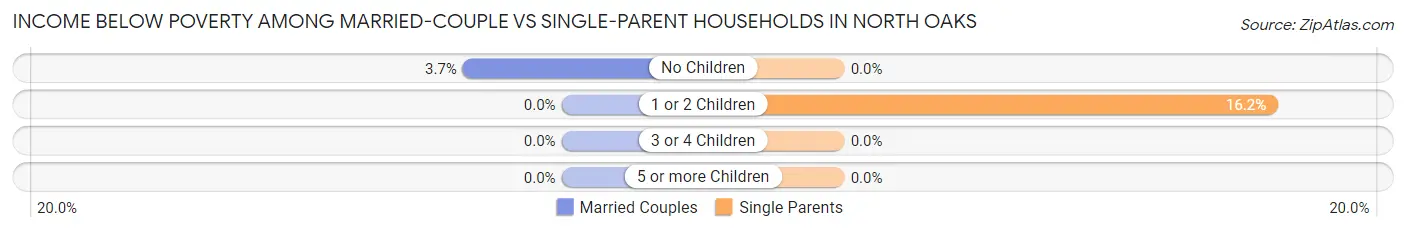
| Children | Married-Couple Families | Single-Parent Households |
| No Children | 28 (3.7%) | 0 (0.0%) |
| 1 or 2 Children | 0 (0.0%) | 11 (16.2%) |
| 3 or 4 Children | 0 (0.0%) | 0 (0.0%) |
| 5 or more Children | 0 (0.0%) | 0 (0.0%) |
| Total | 28 (2.0%) | 11 (12.6%) |
Race in North Oaks
The most populous races in North Oaks are White / Caucasian (4,371 | 84.2%), Asian (397 | 7.6%), and Hispanic or Latino (323 | 6.2%).
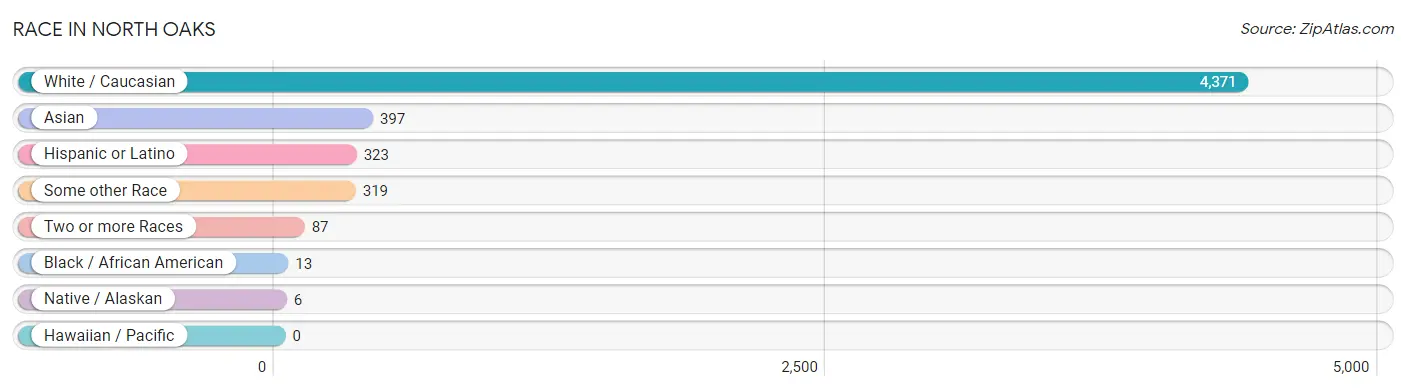
| Race | # Population | % Population |
| Asian | 397 | 7.6% |
| Black / African American | 13 | 0.3% |
| Hawaiian / Pacific | 0 | 0.0% |
| Hispanic or Latino | 323 | 6.2% |
| Native / Alaskan | 6 | 0.1% |
| White / Caucasian | 4,371 | 84.2% |
| Two or more Races | 87 | 1.7% |
| Some other Race | 319 | 6.1% |
| Total | 5,193 | 100.0% |
Ancestry in North Oaks
The most populous ancestries reported in North Oaks are German (2,072 | 39.9%), Irish (1,050 | 20.2%), English (775 | 14.9%), Scandinavian (529 | 10.2%), and Norwegian (443 | 8.5%), together accounting for 93.8% of all North Oaks residents.
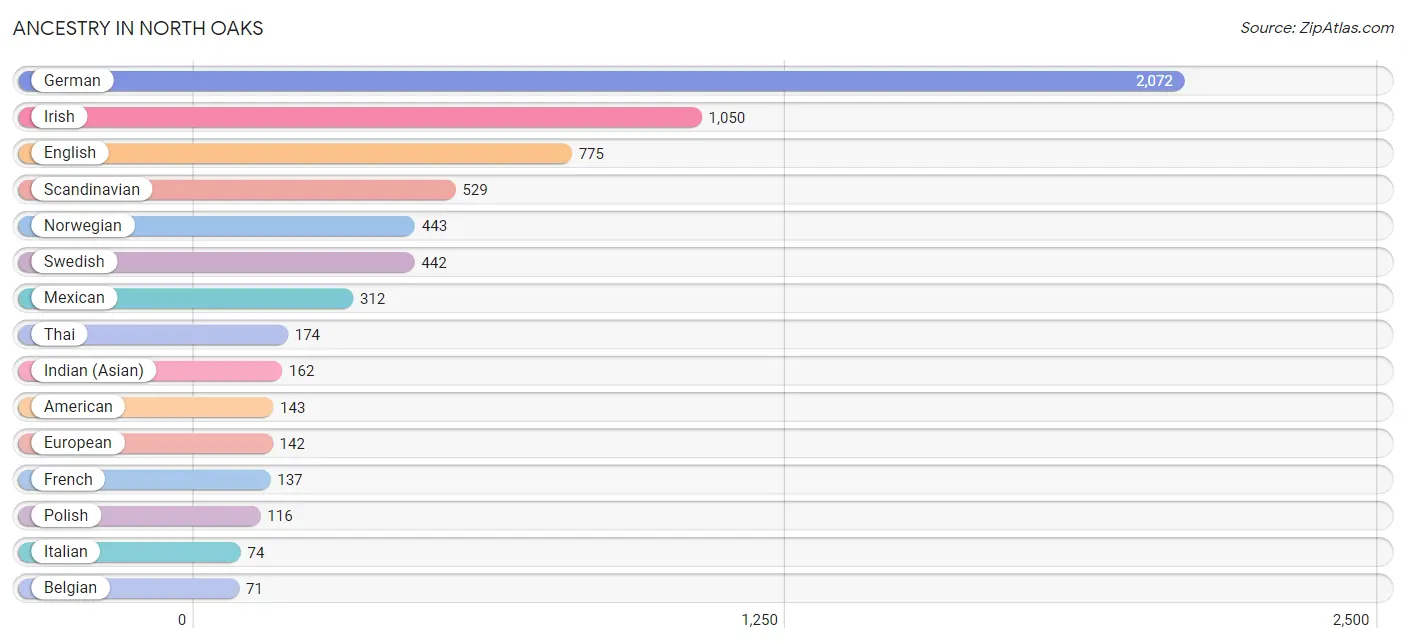
| Ancestry | # Population | % Population |
| American | 143 | 2.8% |
| Bangladeshi | 19 | 0.4% |
| Belgian | 71 | 1.4% |
| Blackfeet | 55 | 1.1% |
| British | 30 | 0.6% |
| Burmese | 42 | 0.8% |
| Chippewa | 6 | 0.1% |
| Colombian | 11 | 0.2% |
| Czech | 47 | 0.9% |
| Danish | 10 | 0.2% |
| Dutch | 44 | 0.9% |
| Eastern European | 19 | 0.4% |
| English | 775 | 14.9% |
| European | 142 | 2.7% |
| Finnish | 29 | 0.6% |
| French | 137 | 2.6% |
| German | 2,072 | 39.9% |
| Hungarian | 51 | 1.0% |
| Indian (Asian) | 162 | 3.1% |
| Iranian | 12 | 0.2% |
| Irish | 1,050 | 20.2% |
| Italian | 74 | 1.4% |
| Luxembourger | 8 | 0.2% |
| Mexican | 312 | 6.0% |
| Northern European | 12 | 0.2% |
| Norwegian | 443 | 8.5% |
| Polish | 116 | 2.2% |
| Russian | 57 | 1.1% |
| Scandinavian | 529 | 10.2% |
| Scotch-Irish | 31 | 0.6% |
| Scottish | 71 | 1.4% |
| South American | 11 | 0.2% |
| Subsaharan African | 11 | 0.2% |
| Swedish | 442 | 8.5% |
| Swiss | 18 | 0.4% |
| Thai | 174 | 3.4% | View All 36 Rows |
Immigrants in North Oaks
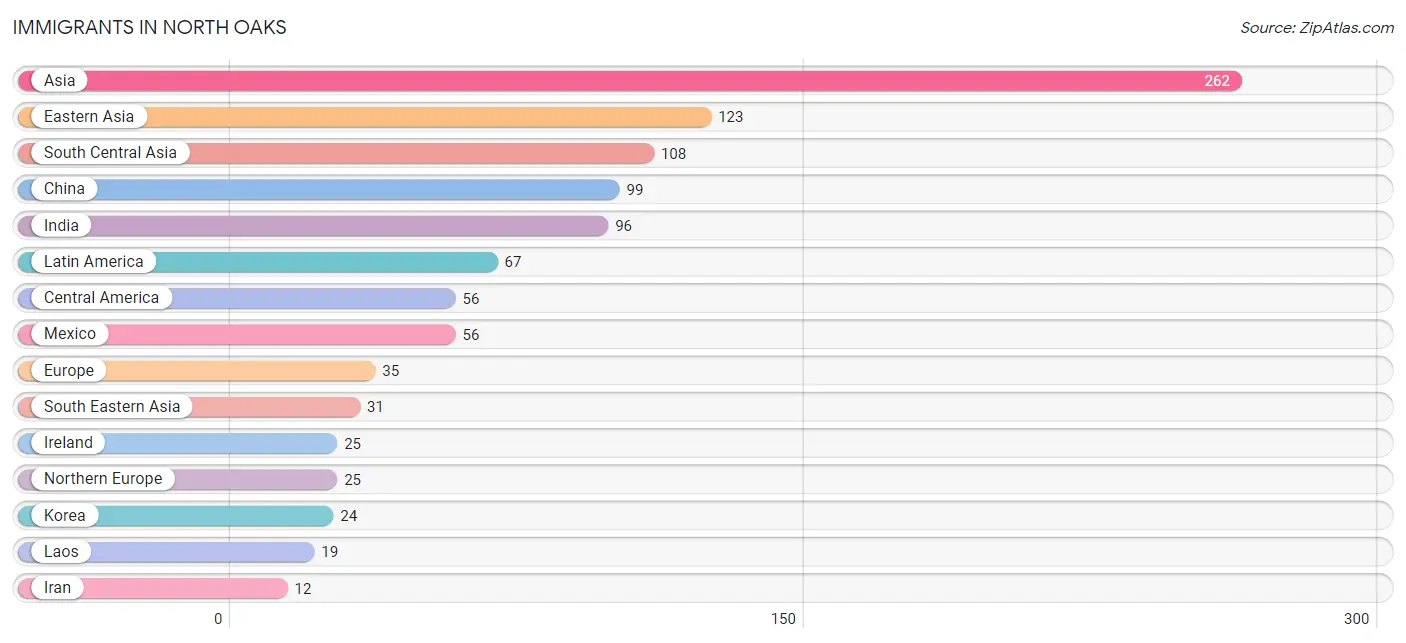
The most numerous immigrant groups reported in North Oaks came from Asia (262 | 5.1%), Eastern Asia (123 | 2.4%), South Central Asia (108 | 2.1%), China (99 | 1.9%), and India (96 | 1.8%), together accounting for 13.3% of all North Oaks residents.
| Immigration Origin | # Population | % Population |
| Africa | 11 | 0.2% |
| Asia | 262 | 5.1% |
| Cameroon | 11 | 0.2% |
| Central America | 56 | 1.1% |
| China | 99 | 1.9% |
| Colombia | 11 | 0.2% |
| Eastern Asia | 123 | 2.4% |
| Europe | 35 | 0.7% |
| India | 96 | 1.8% |
| Iran | 12 | 0.2% |
| Ireland | 25 | 0.5% |
| Korea | 24 | 0.5% |
| Laos | 19 | 0.4% |
| Latin America | 67 | 1.3% |
| Mexico | 56 | 1.1% |
| Middle Africa | 11 | 0.2% |
| Netherlands | 10 | 0.2% |
| Northern Europe | 25 | 0.5% |
| Singapore | 12 | 0.2% |
| South America | 11 | 0.2% |
| South Central Asia | 108 | 2.1% |
| South Eastern Asia | 31 | 0.6% |
| Western Europe | 10 | 0.2% | View All 23 Rows |
Sex and Age in North Oaks
Sex and Age in North Oaks
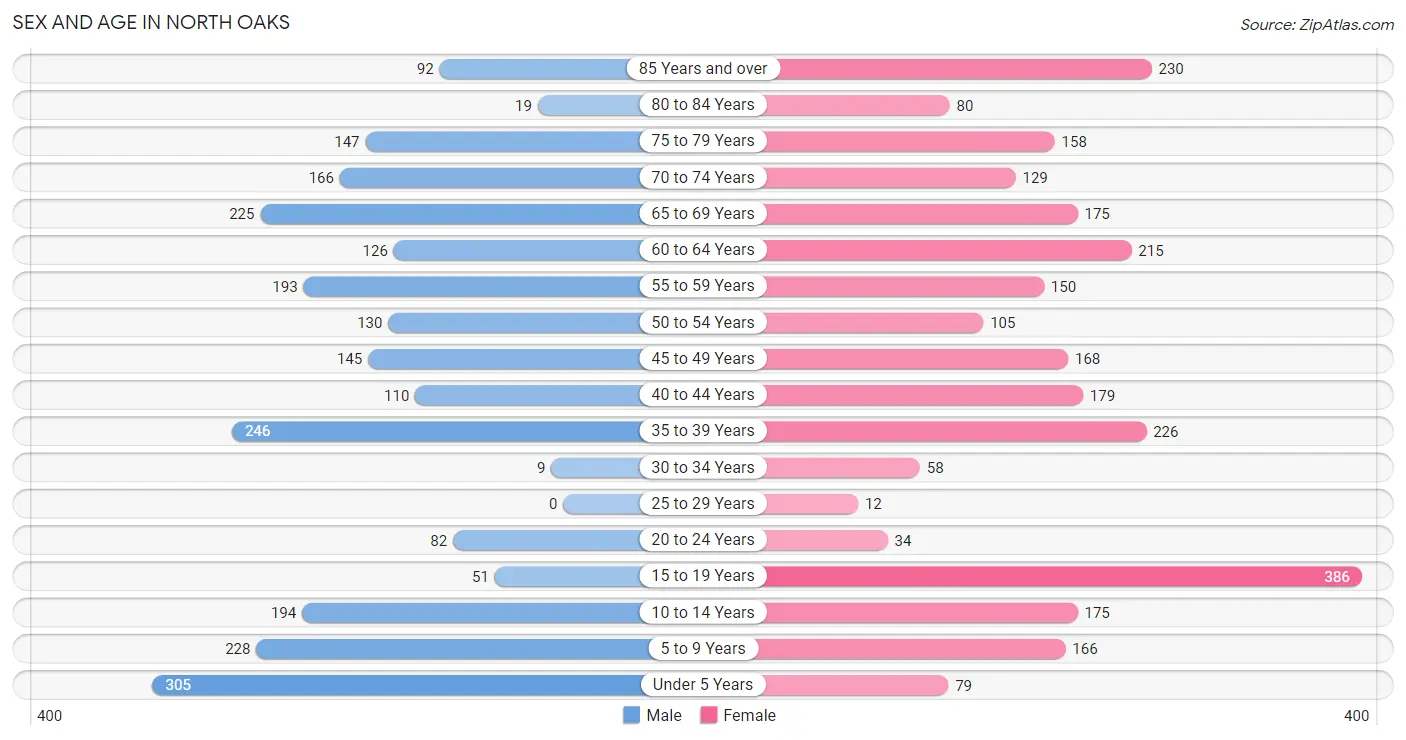
The most populous age groups in North Oaks are Under 5 Years (305 | 12.4%) for men and 15 to 19 Years (386 | 14.2%) for women.
| Age Bracket | Male | Female |
| Under 5 Years | 305 (12.4%) | 79 (2.9%) |
| 5 to 9 Years | 228 (9.2%) | 166 (6.1%) |
| 10 to 14 Years | 194 (7.9%) | 175 (6.4%) |
| 15 to 19 Years | 51 (2.1%) | 386 (14.2%) |
| 20 to 24 Years | 82 (3.3%) | 34 (1.3%) |
| 25 to 29 Years | 0 (0.0%) | 12 (0.4%) |
| 30 to 34 Years | 9 (0.4%) | 58 (2.1%) |
| 35 to 39 Years | 246 (10.0%) | 226 (8.3%) |
| 40 to 44 Years | 110 (4.5%) | 179 (6.6%) |
| 45 to 49 Years | 145 (5.9%) | 168 (6.2%) |
| 50 to 54 Years | 130 (5.3%) | 105 (3.8%) |
| 55 to 59 Years | 193 (7.8%) | 150 (5.5%) |
| 60 to 64 Years | 126 (5.1%) | 215 (7.9%) |
| 65 to 69 Years | 225 (9.1%) | 175 (6.4%) |
| 70 to 74 Years | 166 (6.7%) | 129 (4.7%) |
| 75 to 79 Years | 147 (6.0%) | 158 (5.8%) |
| 80 to 84 Years | 19 (0.8%) | 80 (2.9%) |
| 85 Years and over | 92 (3.7%) | 230 (8.4%) |
| Total | 2,468 (100.0%) | 2,725 (100.0%) |
Families and Households in North Oaks
Median Family Size in North Oaks
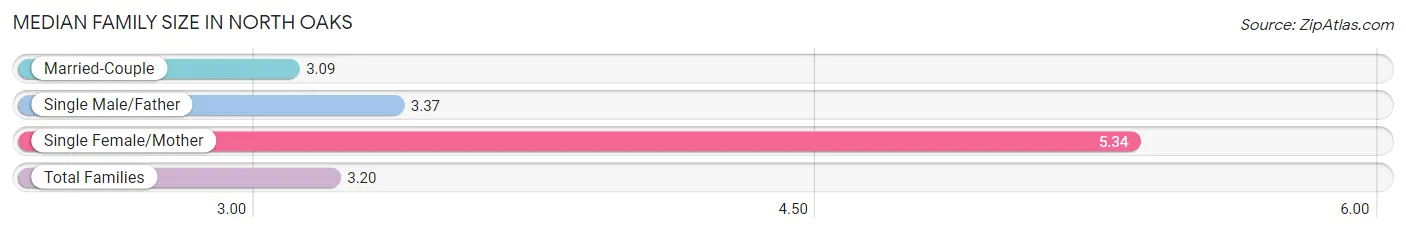
The median family size in North Oaks is 3.20 persons per family, with single female/mother families (68 | 4.6%) accounting for the largest median family size of 5.34 persons per family. On the other hand, married-couple families (1,379 | 94.1%) represent the smallest median family size with 3.09 persons per family.
| Family Type | # Families | Family Size |
| Married-Couple | 1,379 (94.1%) | 3.09 |
| Single Male/Father | 19 (1.3%) | 3.37 |
| Single Female/Mother | 68 (4.6%) | 5.34 |
| Total Families | 1,466 (100.0%) | 3.20 |
Median Household Size in North Oaks
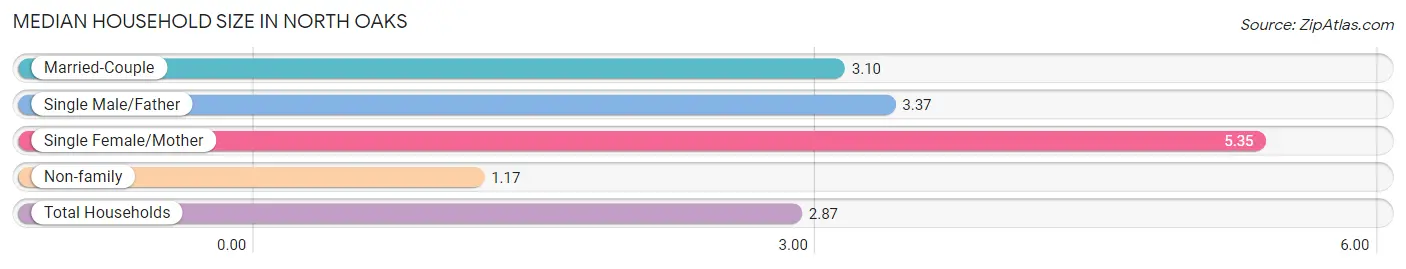
The median household size in North Oaks is 2.87 persons per household, with single female/mother households (68 | 3.9%) accounting for the largest median household size of 5.35 persons per household. non-family households (292 | 16.6%) represent the smallest median household size with 1.17 persons per household.
| Household Type | # Households | Household Size |
| Married-Couple | 1,379 (78.4%) | 3.10 |
| Single Male/Father | 19 (1.1%) | 3.37 |
| Single Female/Mother | 68 (3.9%) | 5.35 |
| Non-family | 292 (16.6%) | 1.17 |
| Total Households | 1,758 (100.0%) | 2.87 |
Household Size by Marriage Status in North Oaks
Out of a total of 1,758 households in North Oaks, 1,466 (83.4%) are family households, while 292 (16.6%) are nonfamily households. The most numerous type of family households are 2-person households, comprising 667, and the most common type of nonfamily households are 1-person households, comprising 250.
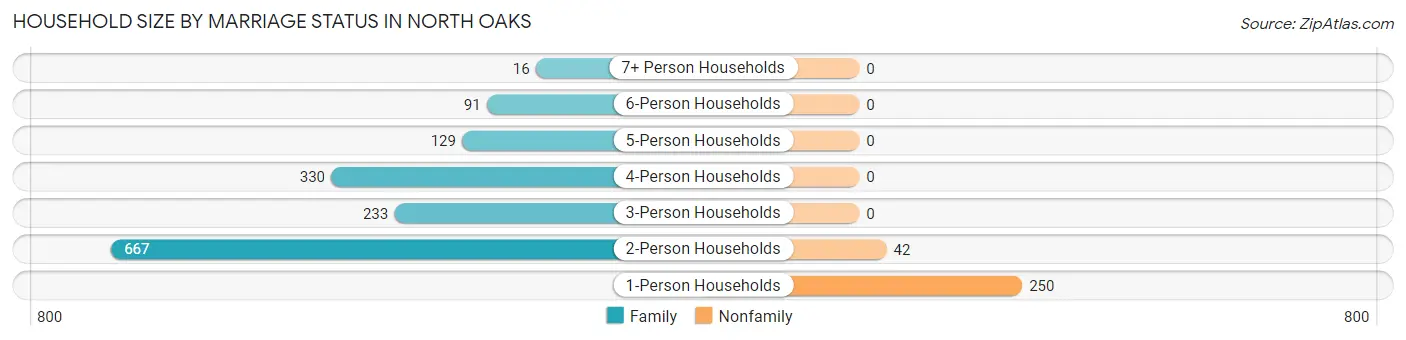
| Household Size | Family Households | Nonfamily Households |
| 1-Person Households | - | 250 (14.2%) |
| 2-Person Households | 667 (37.9%) | 42 (2.4%) |
| 3-Person Households | 233 (13.3%) | 0 (0.0%) |
| 4-Person Households | 330 (18.8%) | 0 (0.0%) |
| 5-Person Households | 129 (7.3%) | 0 (0.0%) |
| 6-Person Households | 91 (5.2%) | 0 (0.0%) |
| 7+ Person Households | 16 (0.9%) | 0 (0.0%) |
| Total | 1,466 (83.4%) | 292 (16.6%) |
Female Fertility in North Oaks
Fertility by Age in North Oaks
Average fertility rate in North Oaks is 28.0 births per 1,000 women. Women in the age bracket of 35 to 50 years have the highest fertility rate with 51.0 births per 1,000 women. Women in the age bracket of 35 to 50 years acount for 100.0% of all women with births.
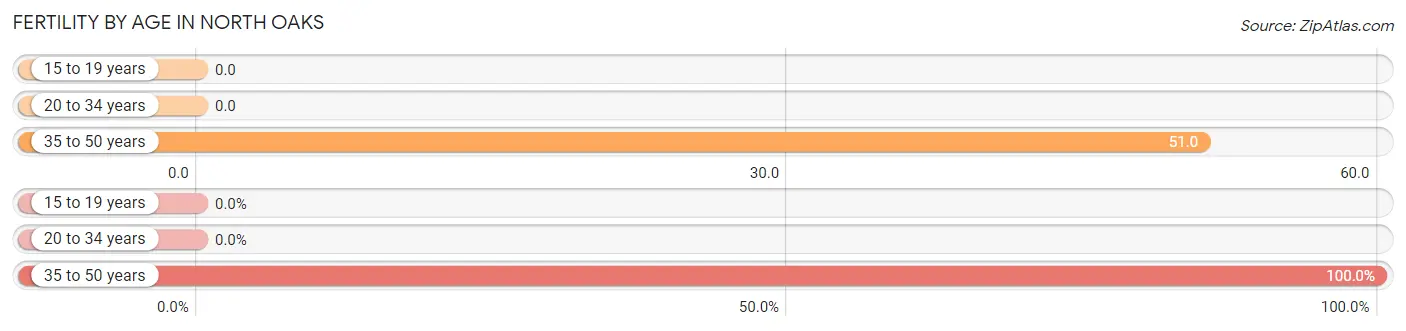
| Age Bracket | Women with Births | Births / 1,000 Women |
| 15 to 19 years | 0 (0.0%) | 0.0 |
| 20 to 34 years | 0 (0.0%) | 0.0 |
| 35 to 50 years | 30 (100.0%) | 51.0 |
| Total | 30 (100.0%) | 28.0 |
Fertility by Age by Marriage Status in North Oaks
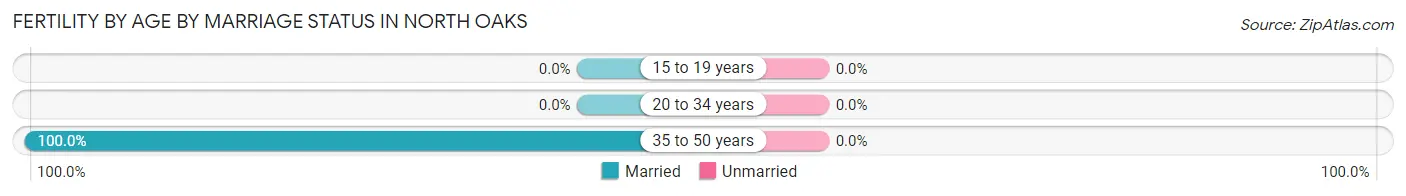
| Age Bracket | Married | Unmarried |
| 15 to 19 years | 0 (0.0%) | 0 (0.0%) |
| 20 to 34 years | 0 (0.0%) | 0 (0.0%) |
| 35 to 50 years | 30 (100.0%) | 0 (0.0%) |
| Total | 30 (100.0%) | 0 (0.0%) |
Fertility by Education in North Oaks
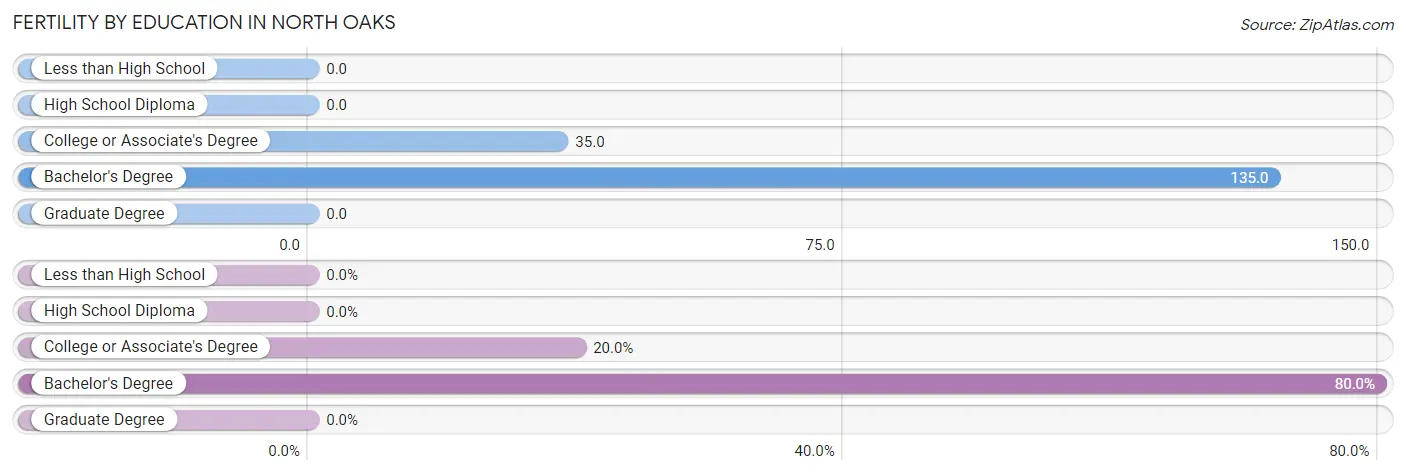
| Educational Attainment | Women with Births | Births / 1,000 Women |
| Less than High School | 0 (0.0%) | 0.0 |
| High School Diploma | 0 (0.0%) | 0.0 |
| College or Associate's Degree | 6 (20.0%) | 35.0 |
| Bachelor's Degree | 24 (80.0%) | 135.0 |
| Graduate Degree | 0 (0.0%) | 0.0 |
| Total | 30 (100.0%) | 28.0 |
Fertility by Education by Marriage Status in North Oaks
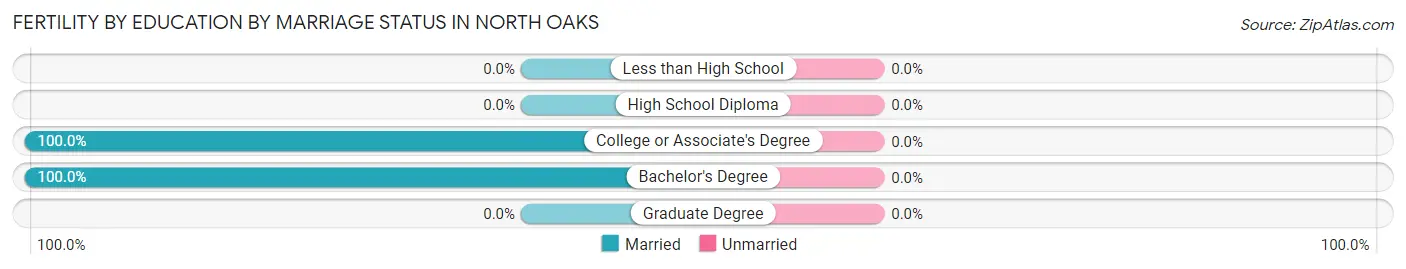
| Educational Attainment | Married | Unmarried |
| Less than High School | 0 (0.0%) | 0 (0.0%) |
| High School Diploma | 0 (0.0%) | 0 (0.0%) |
| College or Associate's Degree | 6 (100.0%) | 0 (0.0%) |
| Bachelor's Degree | 24 (100.0%) | 0 (0.0%) |
| Graduate Degree | 0 (0.0%) | 0 (0.0%) |
| Total | 30 (100.0%) | 0 (0.0%) |
Employment Characteristics in North Oaks
Employment by Class of Employer in North Oaks
Among the 1,989 employed individuals in North Oaks, private company employees (1,412 | 71.0%), self-employed (incorporated) (202 | 10.2%), and local government employees (118 | 5.9%) make up the most common classes of employment.
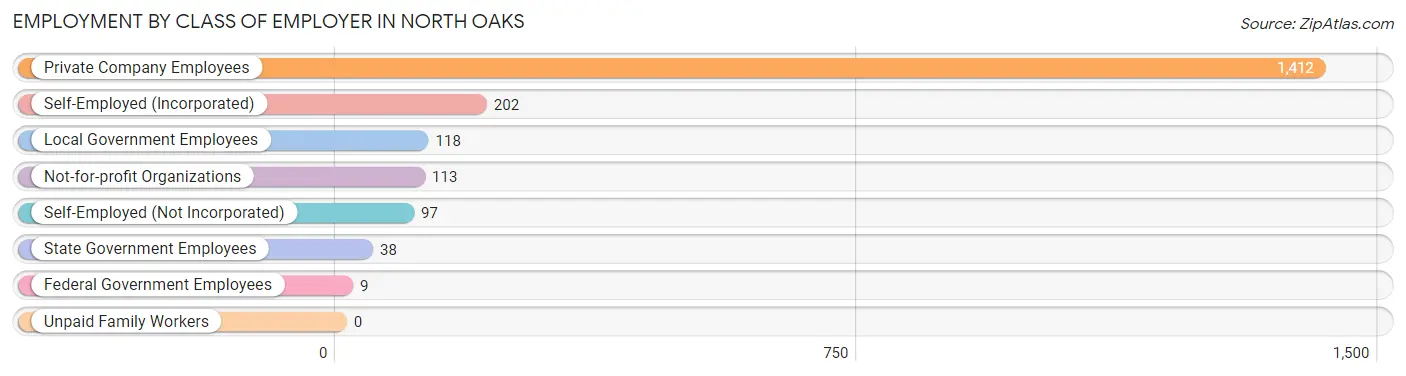
| Employer Class | # Employees | % Employees |
| Private Company Employees | 1,412 | 71.0% |
| Self-Employed (Incorporated) | 202 | 10.2% |
| Self-Employed (Not Incorporated) | 97 | 4.9% |
| Not-for-profit Organizations | 113 | 5.7% |
| Local Government Employees | 118 | 5.9% |
| State Government Employees | 38 | 1.9% |
| Federal Government Employees | 9 | 0.4% |
| Unpaid Family Workers | 0 | 0.0% |
| Total | 1,989 | 100.0% |
Employment Status by Age in North Oaks
According to the labor force statistics for North Oaks, out of the total population over 16 years of age (3,892), 54.3% or 2,113 individuals are in the labor force, with 5.1% or 108 of them unemployed. The age group with the highest labor force participation rate is 25 to 29 years, with 100.0% or 12 individuals in the labor force. Within the labor force, the 20 to 24 years age range has the highest percentage of unemployed individuals, with 80.5% or 70 of them being unemployed.
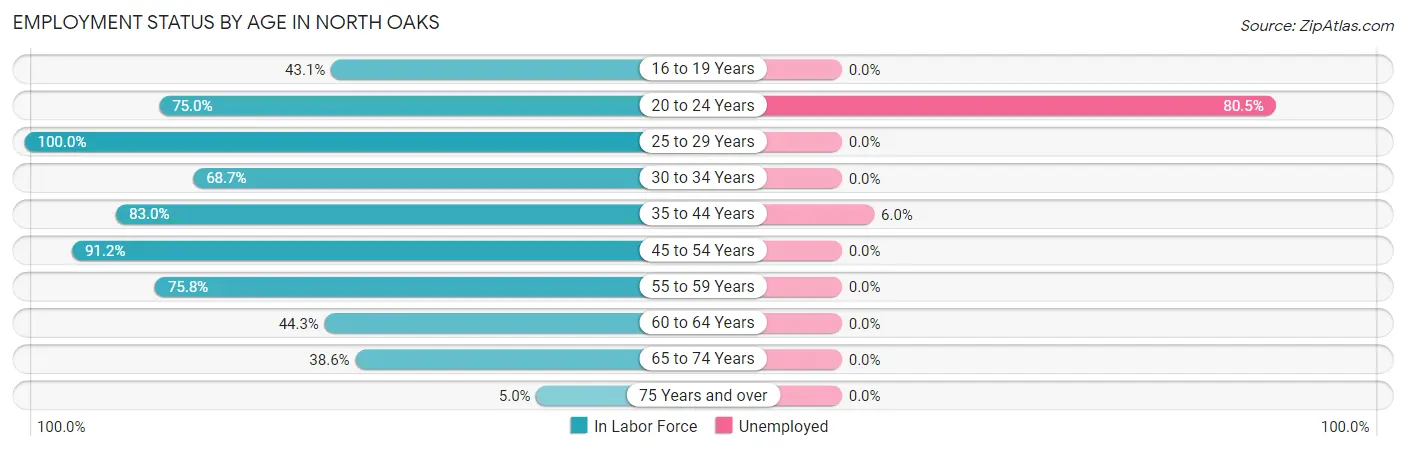
| Age Bracket | In Labor Force | Unemployed |
| 16 to 19 Years | 122 (43.1%) | 0 (0.0%) |
| 20 to 24 Years | 87 (75.0%) | 70 (80.5%) |
| 25 to 29 Years | 12 (100.0%) | 0 (0.0%) |
| 30 to 34 Years | 46 (68.7%) | 0 (0.0%) |
| 35 to 44 Years | 632 (83.0%) | 38 (6.0%) |
| 45 to 54 Years | 500 (91.2%) | 0 (0.0%) |
| 55 to 59 Years | 260 (75.8%) | 0 (0.0%) |
| 60 to 64 Years | 151 (44.3%) | 0 (0.0%) |
| 65 to 74 Years | 268 (38.6%) | 0 (0.0%) |
| 75 Years and over | 36 (5.0%) | 0 (0.0%) |
| Total | 2,113 (54.3%) | 108 (5.1%) |
Employment Status by Educational Attainment in North Oaks
According to labor force statistics for North Oaks, 77.3% of individuals (1,602) out of the total population between 25 and 64 years of age (2,072) are in the labor force, with 2.4% or 38 of them being unemployed. The group with the highest labor force participation rate are those with the educational attainment of bachelor's degree or higher, with 84.2% or 1,266 individuals in the labor force. Within the labor force, individuals with bachelor's degree or higher education have the highest percentage of unemployment, with 3.0% or 38 of them being unemployed.
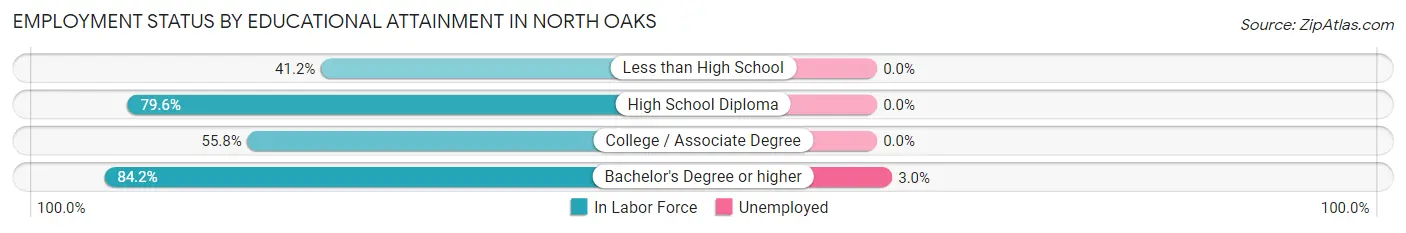
| Educational Attainment | In Labor Force | Unemployed |
| Less than High School | 14 (41.2%) | 0 (0.0%) |
| High School Diploma | 74 (79.6%) | 0 (0.0%) |
| College / Associate Degree | 246 (55.8%) | 0 (0.0%) |
| Bachelor's Degree or higher | 1,266 (84.2%) | 45 (3.0%) |
| Total | 1,602 (77.3%) | 50 (2.4%) |
Employment Occupations by Sex in North Oaks
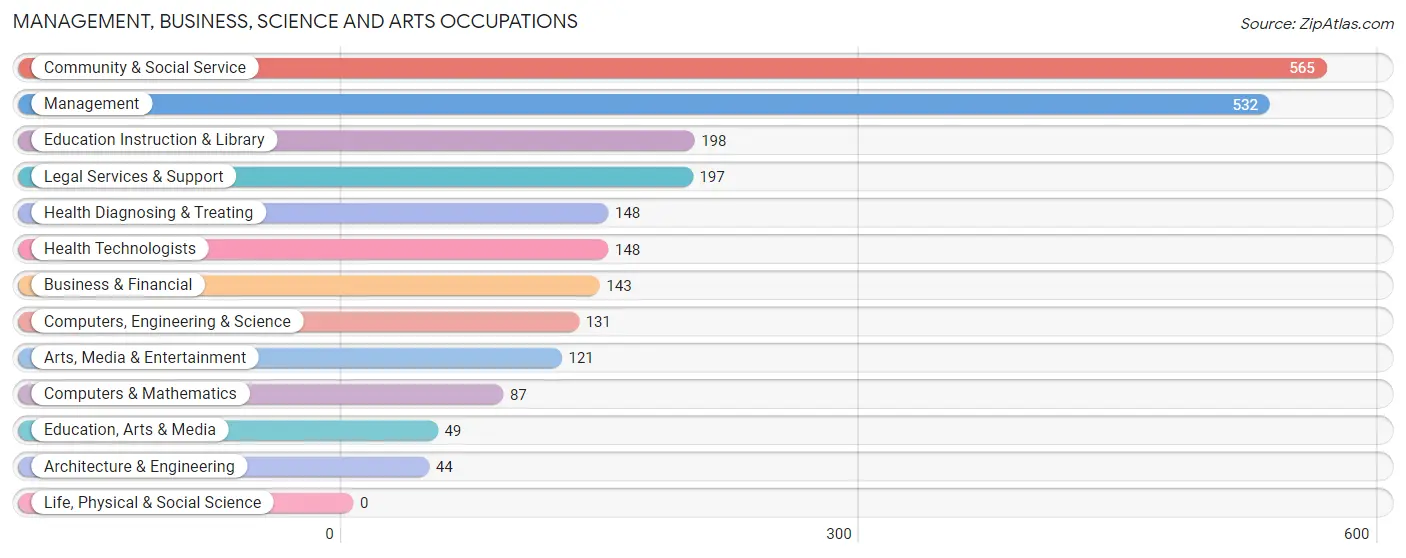
Management, Business, Science and Arts Occupations
The most common Management, Business, Science and Arts occupations in North Oaks are Community & Social Service (565 | 28.2%), Management (532 | 26.5%), Education Instruction & Library (198 | 9.9%), Legal Services & Support (197 | 9.8%), and Health Diagnosing & Treating (148 | 7.4%).
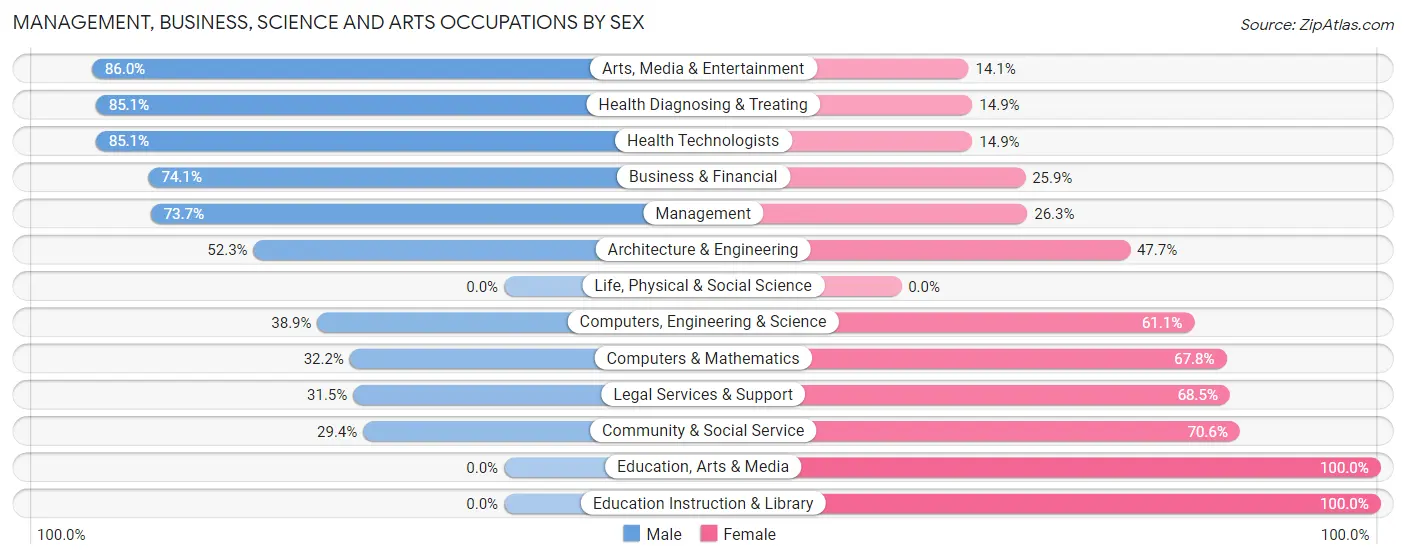
Management, Business, Science and Arts Occupations by Sex
Within the Management, Business, Science and Arts occupations in North Oaks, the most male-oriented occupations are Arts, Media & Entertainment (86.0%), Health Diagnosing & Treating (85.1%), and Health Technologists (85.1%), while the most female-oriented occupations are Education, Arts & Media (100.0%), Education Instruction & Library (100.0%), and Community & Social Service (70.6%).
| Occupation | Male | Female |
| Management | 392 (73.7%) | 140 (26.3%) |
| Business & Financial | 106 (74.1%) | 37 (25.9%) |
| Computers, Engineering & Science | 51 (38.9%) | 80 (61.1%) |
| Computers & Mathematics | 28 (32.2%) | 59 (67.8%) |
| Architecture & Engineering | 23 (52.3%) | 21 (47.7%) |
| Life, Physical & Social Science | 0 (0.0%) | 0 (0.0%) |
| Community & Social Service | 166 (29.4%) | 399 (70.6%) |
| Education, Arts & Media | 0 (0.0%) | 49 (100.0%) |
| Legal Services & Support | 62 (31.5%) | 135 (68.5%) |
| Education Instruction & Library | 0 (0.0%) | 198 (100.0%) |
| Arts, Media & Entertainment | 104 (86.0%) | 17 (14.1%) |
| Health Diagnosing & Treating | 126 (85.1%) | 22 (14.9%) |
| Health Technologists | 126 (85.1%) | 22 (14.9%) |
| Total (Category) | 841 (55.4%) | 678 (44.6%) |
| Total (Overall) | 1,057 (52.7%) | 949 (47.3%) |
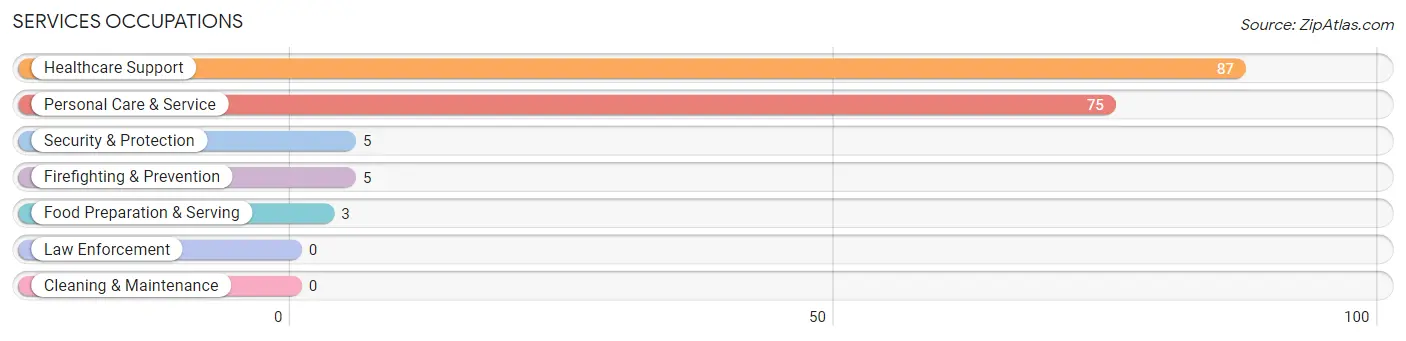
Services Occupations
The most common Services occupations in North Oaks are Healthcare Support (87 | 4.3%), Personal Care & Service (75 | 3.7%), Security & Protection (5 | 0.3%), Firefighting & Prevention (5 | 0.3%), and Food Preparation & Serving (3 | 0.2%).
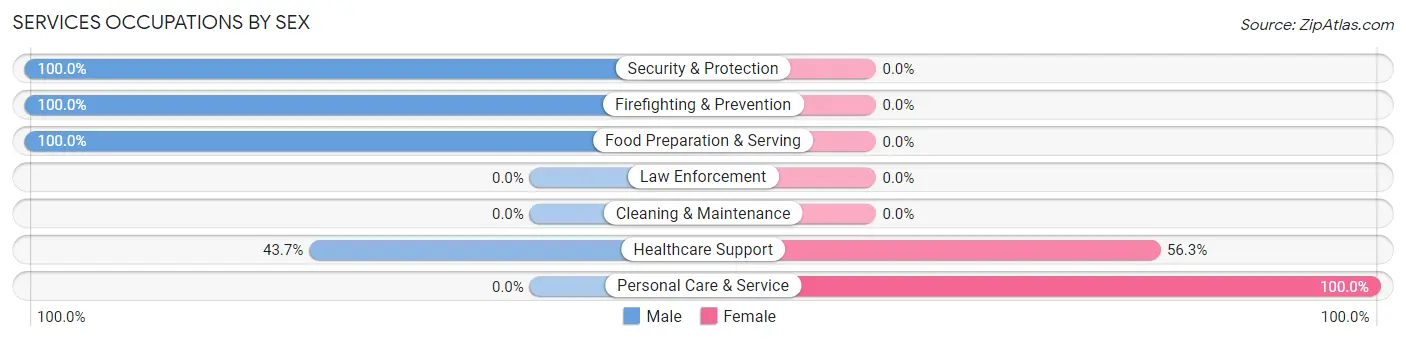
Services Occupations by Sex
Within the Services occupations in North Oaks, the most male-oriented occupations are Security & Protection (100.0%), Firefighting & Prevention (100.0%), and Food Preparation & Serving (100.0%), while the most female-oriented occupations are Personal Care & Service (100.0%), and Healthcare Support (56.3%).
| Occupation | Male | Female |
| Healthcare Support | 38 (43.7%) | 49 (56.3%) |
| Security & Protection | 5 (100.0%) | 0 (0.0%) |
| Firefighting & Prevention | 5 (100.0%) | 0 (0.0%) |
| Law Enforcement | 0 (0.0%) | 0 (0.0%) |
| Food Preparation & Serving | 3 (100.0%) | 0 (0.0%) |
| Cleaning & Maintenance | 0 (0.0%) | 0 (0.0%) |
| Personal Care & Service | 0 (0.0%) | 75 (100.0%) |
| Total (Category) | 46 (27.1%) | 124 (72.9%) |
| Total (Overall) | 1,057 (52.7%) | 949 (47.3%) |
Sales and Office Occupations
The most common Sales and Office occupations in North Oaks are Sales & Related (153 | 7.6%), and Office & Administration (54 | 2.7%).
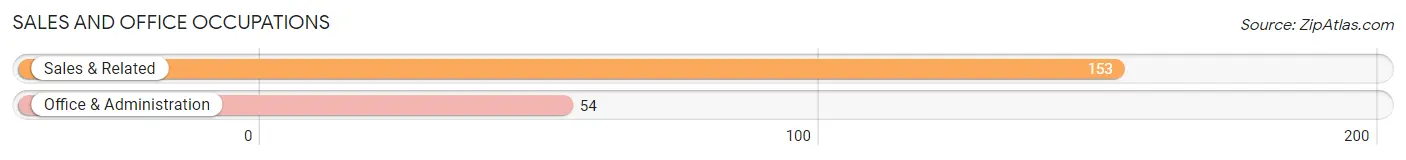
Sales and Office Occupations by Sex
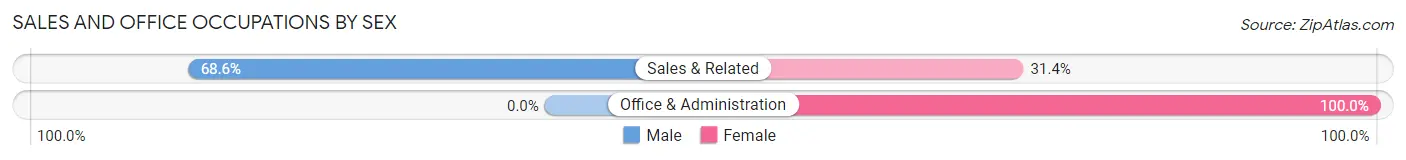
| Occupation | Male | Female |
| Sales & Related | 105 (68.6%) | 48 (31.4%) |
| Office & Administration | 0 (0.0%) | 54 (100.0%) |
| Total (Category) | 105 (50.7%) | 102 (49.3%) |
| Total (Overall) | 1,057 (52.7%) | 949 (47.3%) |
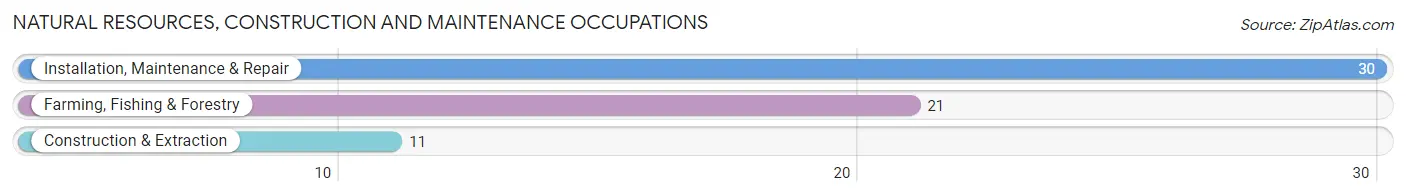
Natural Resources, Construction and Maintenance Occupations
The most common Natural Resources, Construction and Maintenance occupations in North Oaks are Installation, Maintenance & Repair (30 | 1.5%), Farming, Fishing & Forestry (21 | 1.1%), and Construction & Extraction (11 | 0.5%).
Natural Resources, Construction and Maintenance Occupations by Sex
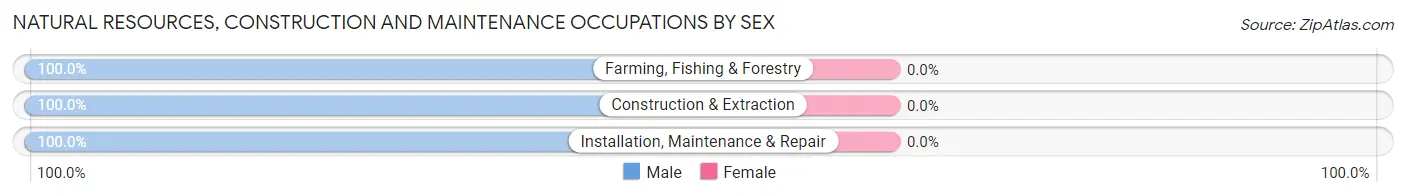
| Occupation | Male | Female |
| Farming, Fishing & Forestry | 21 (100.0%) | 0 (0.0%) |
| Construction & Extraction | 11 (100.0%) | 0 (0.0%) |
| Installation, Maintenance & Repair | 30 (100.0%) | 0 (0.0%) |
| Total (Category) | 62 (100.0%) | 0 (0.0%) |
| Total (Overall) | 1,057 (52.7%) | 949 (47.3%) |
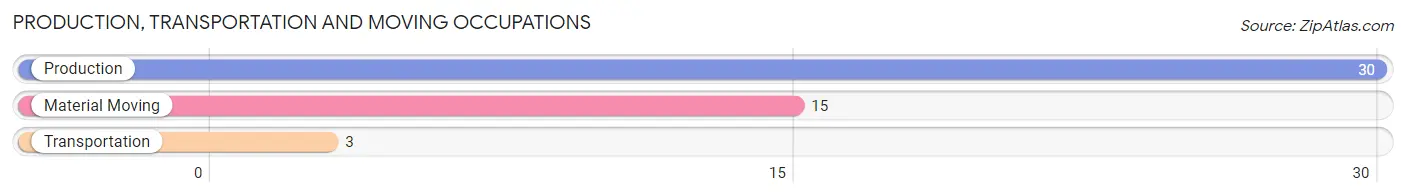
Production, Transportation and Moving Occupations
The most common Production, Transportation and Moving occupations in North Oaks are Production (30 | 1.5%), Material Moving (15 | 0.7%), and Transportation (3 | 0.2%).
Production, Transportation and Moving Occupations by Sex
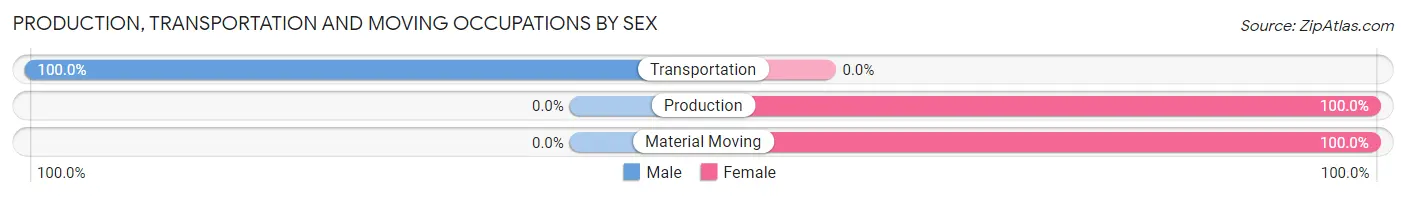
| Occupation | Male | Female |
| Production | 0 (0.0%) | 30 (100.0%) |
| Transportation | 3 (100.0%) | 0 (0.0%) |
| Material Moving | 0 (0.0%) | 15 (100.0%) |
| Total (Category) | 3 (6.2%) | 45 (93.8%) |
| Total (Overall) | 1,057 (52.7%) | 949 (47.3%) |
Employment Industries by Sex in North Oaks
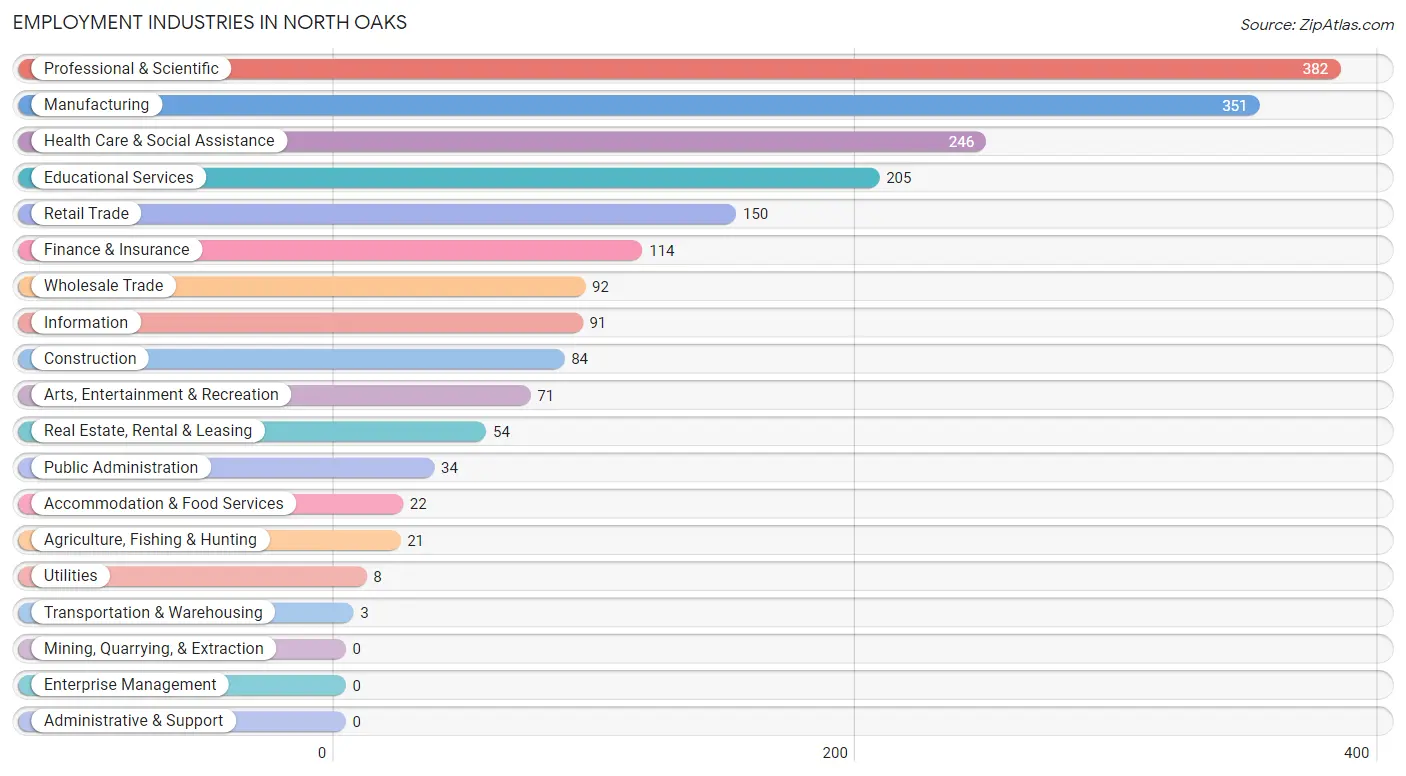
Employment Industries in North Oaks
The major employment industries in North Oaks include Professional & Scientific (382 | 19.0%), Manufacturing (351 | 17.5%), Health Care & Social Assistance (246 | 12.3%), Educational Services (205 | 10.2%), and Retail Trade (150 | 7.5%).
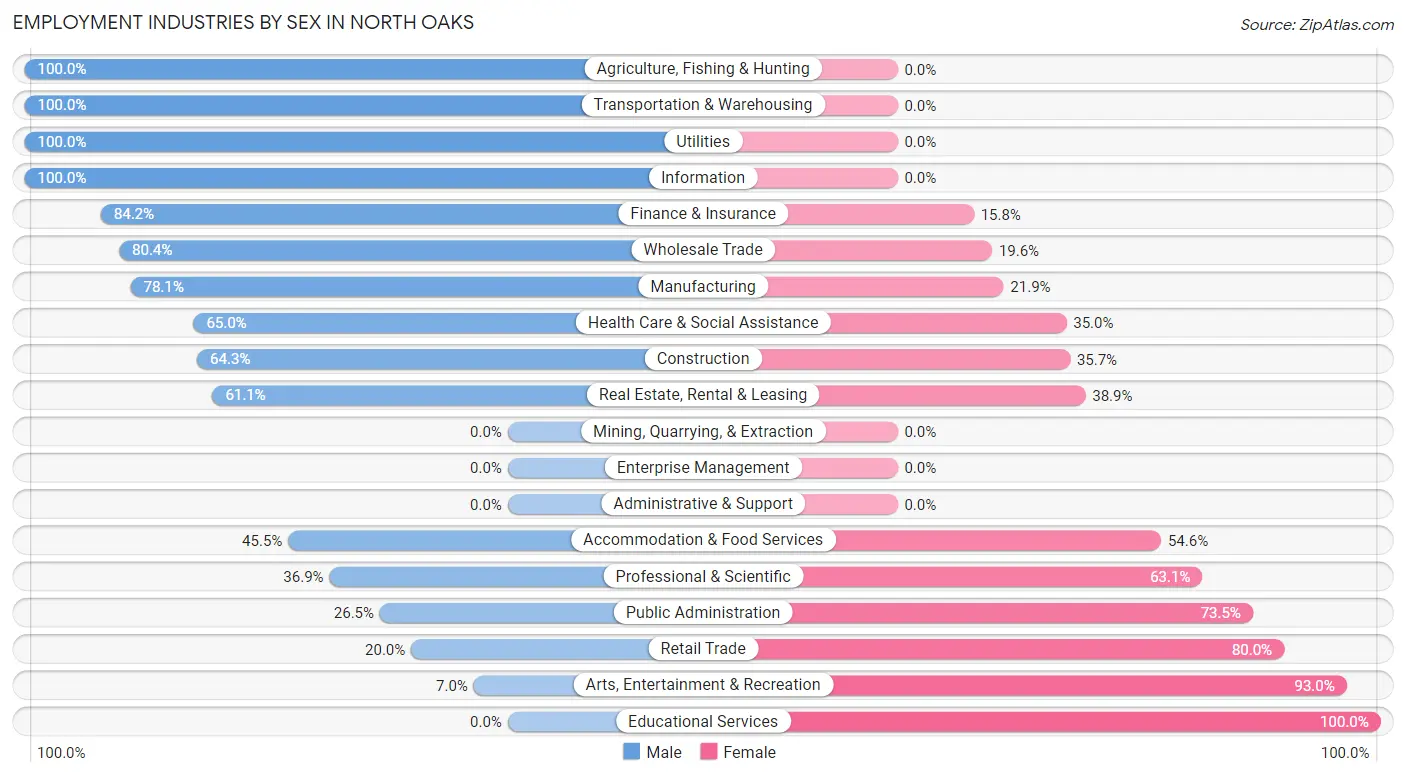
Employment Industries by Sex in North Oaks
The North Oaks industries that see more men than women are Agriculture, Fishing & Hunting (100.0%), Transportation & Warehousing (100.0%), and Utilities (100.0%), whereas the industries that tend to have a higher number of women are Educational Services (100.0%), Arts, Entertainment & Recreation (93.0%), and Retail Trade (80.0%).
| Industry | Male | Female |
| Agriculture, Fishing & Hunting | 21 (100.0%) | 0 (0.0%) |
| Mining, Quarrying, & Extraction | 0 (0.0%) | 0 (0.0%) |
| Construction | 54 (64.3%) | 30 (35.7%) |
| Manufacturing | 274 (78.1%) | 77 (21.9%) |
| Wholesale Trade | 74 (80.4%) | 18 (19.6%) |
| Retail Trade | 30 (20.0%) | 120 (80.0%) |
| Transportation & Warehousing | 3 (100.0%) | 0 (0.0%) |
| Utilities | 8 (100.0%) | 0 (0.0%) |
| Information | 91 (100.0%) | 0 (0.0%) |
| Finance & Insurance | 96 (84.2%) | 18 (15.8%) |
| Real Estate, Rental & Leasing | 33 (61.1%) | 21 (38.9%) |
| Professional & Scientific | 141 (36.9%) | 241 (63.1%) |
| Enterprise Management | 0 (0.0%) | 0 (0.0%) |
| Administrative & Support | 0 (0.0%) | 0 (0.0%) |
| Educational Services | 0 (0.0%) | 205 (100.0%) |
| Health Care & Social Assistance | 160 (65.0%) | 86 (35.0%) |
| Arts, Entertainment & Recreation | 5 (7.0%) | 66 (93.0%) |
| Accommodation & Food Services | 10 (45.5%) | 12 (54.5%) |
| Public Administration | 9 (26.5%) | 25 (73.5%) |
| Total | 1,057 (52.7%) | 949 (47.3%) |
Education in North Oaks
School Enrollment in North Oaks
The most common levels of schooling among the 1,427 students in North Oaks are high school (388 | 27.2%), middle school (339 | 23.8%), and elementary school (335 | 23.5%).
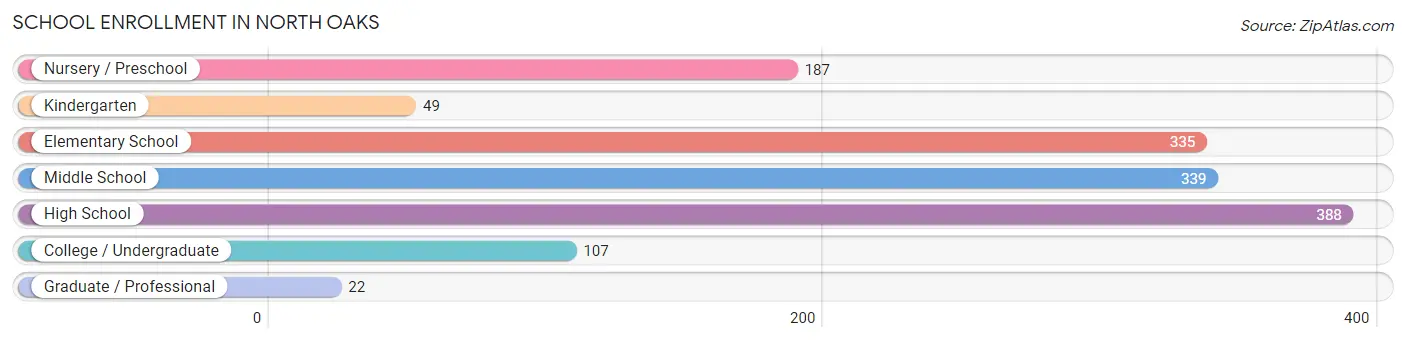
| School Level | # Students | % Students |
| Nursery / Preschool | 187 | 13.1% |
| Kindergarten | 49 | 3.4% |
| Elementary School | 335 | 23.5% |
| Middle School | 339 | 23.8% |
| High School | 388 | 27.2% |
| College / Undergraduate | 107 | 7.5% |
| Graduate / Professional | 22 | 1.5% |
| Total | 1,427 | 100.0% |
School Enrollment by Age by Funding Source in North Oaks
Out of a total of 1,427 students who are enrolled in schools in North Oaks, 257 (18.0%) attend a private institution, while the remaining 1,170 (82.0%) are enrolled in public schools. The age group of 3 to 4 year olds has the highest likelihood of being enrolled in private schools, with 132 (75.0% in the age bracket) enrolled. Conversely, the age group of 15 to 17 year olds has the lowest likelihood of being enrolled in a private school, with 288 (100.0% in the age bracket) attending a public institution.
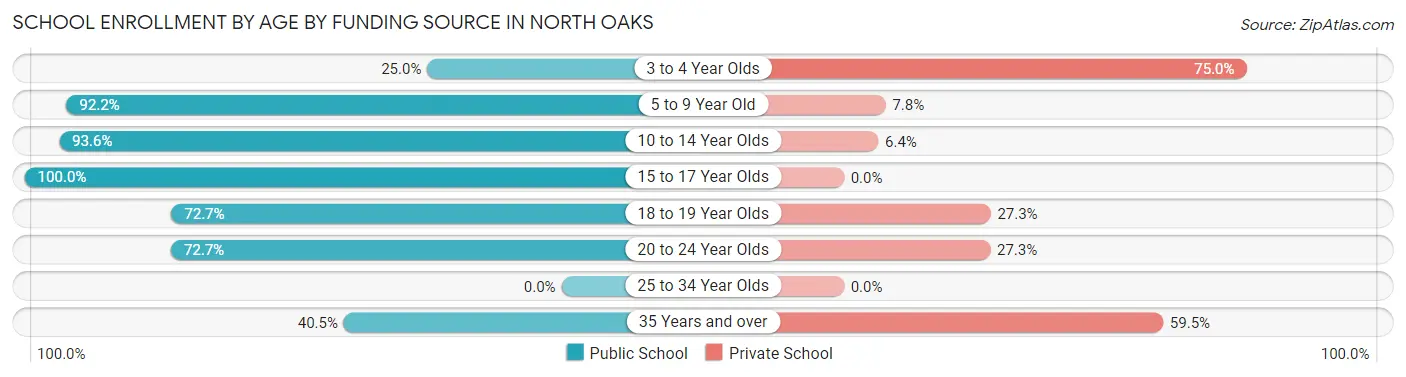
| Age Bracket | Public School | Private School |
| 3 to 4 Year Olds | 44 (25.0%) | 132 (75.0%) |
| 5 to 9 Year Old | 355 (92.2%) | 30 (7.8%) |
| 10 to 14 Year Olds | 335 (93.6%) | 23 (6.4%) |
| 15 to 17 Year Olds | 288 (100.0%) | 0 (0.0%) |
| 18 to 19 Year Olds | 101 (72.7%) | 38 (27.3%) |
| 20 to 24 Year Olds | 32 (72.7%) | 12 (27.3%) |
| 25 to 34 Year Olds | 0 (0.0%) | 0 (0.0%) |
| 35 Years and over | 15 (40.5%) | 22 (59.5%) |
| Total | 1,170 (82.0%) | 257 (18.0%) |
Educational Attainment by Field of Study in North Oaks
Business (404 | 14.4%), social sciences (335 | 12.0%), bio, nature & agricultural (272 | 9.7%), literature & languages (272 | 9.7%), and education (268 | 9.6%) are the most common fields of study among 2,795 individuals in North Oaks who have obtained a bachelor's degree or higher.
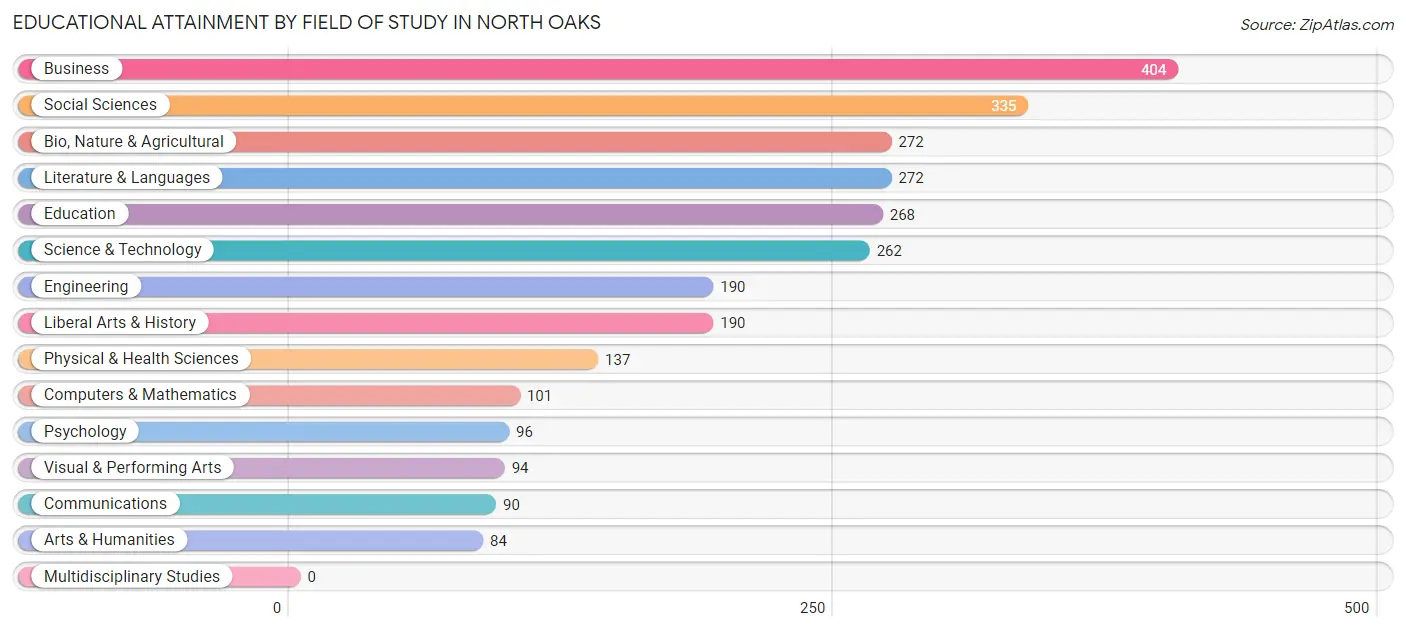
| Field of Study | # Graduates | % Graduates |
| Computers & Mathematics | 101 | 3.6% |
| Bio, Nature & Agricultural | 272 | 9.7% |
| Physical & Health Sciences | 137 | 4.9% |
| Psychology | 96 | 3.4% |
| Social Sciences | 335 | 12.0% |
| Engineering | 190 | 6.8% |
| Multidisciplinary Studies | 0 | 0.0% |
| Science & Technology | 262 | 9.4% |
| Business | 404 | 14.4% |
| Education | 268 | 9.6% |
| Literature & Languages | 272 | 9.7% |
| Liberal Arts & History | 190 | 6.8% |
| Visual & Performing Arts | 94 | 3.4% |
| Communications | 90 | 3.2% |
| Arts & Humanities | 84 | 3.0% |
| Total | 2,795 | 100.0% |
Transportation & Commute in North Oaks
Vehicle Availability by Sex in North Oaks
The most prevalent vehicle ownership categories in North Oaks are males with 2 vehicles (551, accounting for 52.8%) and females with 2 vehicles (508, making up 59.1%).
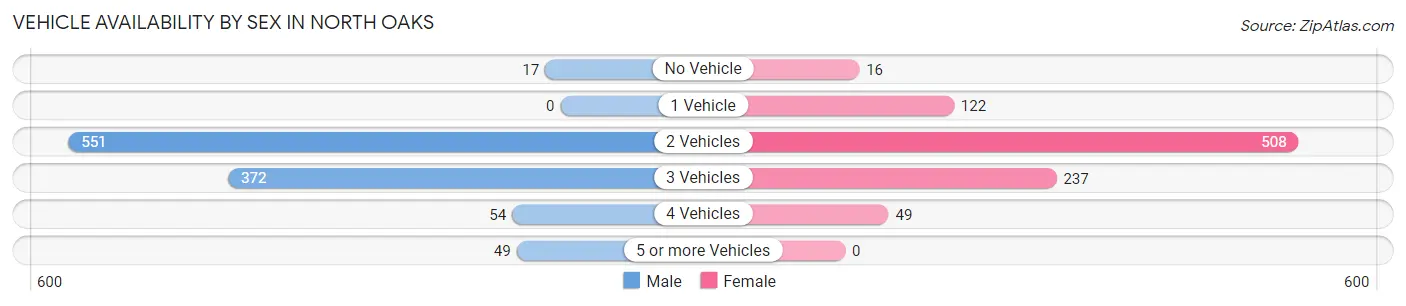
| Vehicles Available | Male | Female |
| No Vehicle | 17 (1.6%) | 16 (1.7%) |
| 1 Vehicle | 0 (0.0%) | 122 (13.1%) |
| 2 Vehicles | 551 (52.8%) | 508 (54.5%) |
| 3 Vehicles | 372 (35.7%) | 237 (25.4%) |
| 4 Vehicles | 54 (5.2%) | 49 (5.3%) |
| 5 or more Vehicles | 49 (4.7%) | 0 (0.0%) |
| Total | 1,043 (100.0%) | 932 (100.0%) |
Commute Time in North Oaks
The most frequently occuring commute durations in North Oaks are 30 to 34 minutes (290 commuters, 22.0%), 20 to 24 minutes (187 commuters, 14.2%), and 15 to 19 minutes (185 commuters, 14.0%).
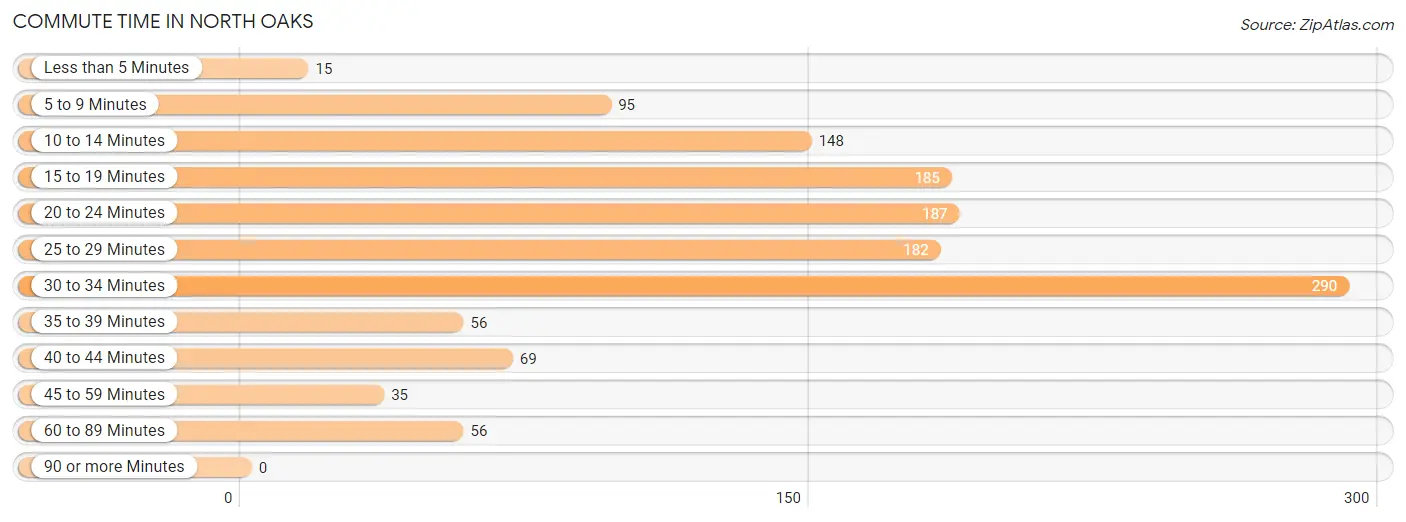
| Commute Time | # Commuters | % Commuters |
| Less than 5 Minutes | 15 | 1.1% |
| 5 to 9 Minutes | 95 | 7.2% |
| 10 to 14 Minutes | 148 | 11.2% |
| 15 to 19 Minutes | 185 | 14.0% |
| 20 to 24 Minutes | 187 | 14.2% |
| 25 to 29 Minutes | 182 | 13.8% |
| 30 to 34 Minutes | 290 | 22.0% |
| 35 to 39 Minutes | 56 | 4.3% |
| 40 to 44 Minutes | 69 | 5.2% |
| 45 to 59 Minutes | 35 | 2.7% |
| 60 to 89 Minutes | 56 | 4.3% |
| 90 or more Minutes | 0 | 0.0% |
Commute Time by Sex in North Oaks
The most common commute times in North Oaks are 30 to 34 minutes (187 commuters, 25.1%) for males and 30 to 34 minutes (103 commuters, 18.0%) for females.
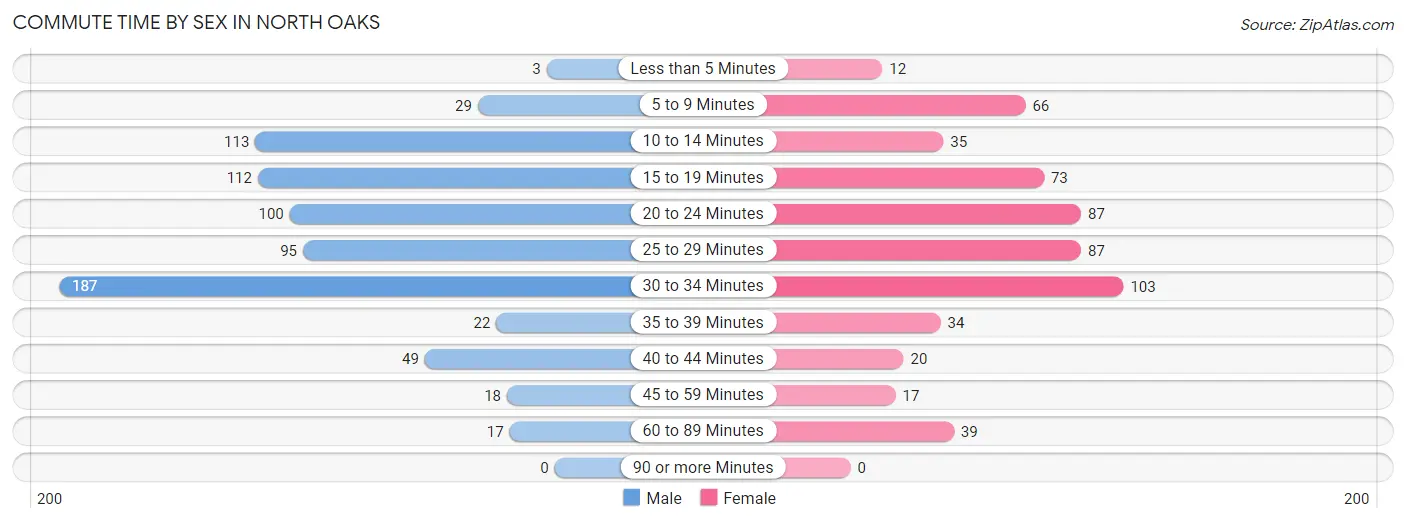
| Commute Time | Male | Female |
| Less than 5 Minutes | 3 (0.4%) | 12 (2.1%) |
| 5 to 9 Minutes | 29 (3.9%) | 66 (11.5%) |
| 10 to 14 Minutes | 113 (15.2%) | 35 (6.1%) |
| 15 to 19 Minutes | 112 (15.0%) | 73 (12.7%) |
| 20 to 24 Minutes | 100 (13.4%) | 87 (15.2%) |
| 25 to 29 Minutes | 95 (12.8%) | 87 (15.2%) |
| 30 to 34 Minutes | 187 (25.1%) | 103 (18.0%) |
| 35 to 39 Minutes | 22 (2.9%) | 34 (5.9%) |
| 40 to 44 Minutes | 49 (6.6%) | 20 (3.5%) |
| 45 to 59 Minutes | 18 (2.4%) | 17 (3.0%) |
| 60 to 89 Minutes | 17 (2.3%) | 39 (6.8%) |
| 90 or more Minutes | 0 (0.0%) | 0 (0.0%) |
Time of Departure to Work by Sex in North Oaks
The most frequent times of departure to work in North Oaks are 7:30 AM to 7:59 AM (198, 26.6%) for males and 7:30 AM to 7:59 AM (154, 26.9%) for females.
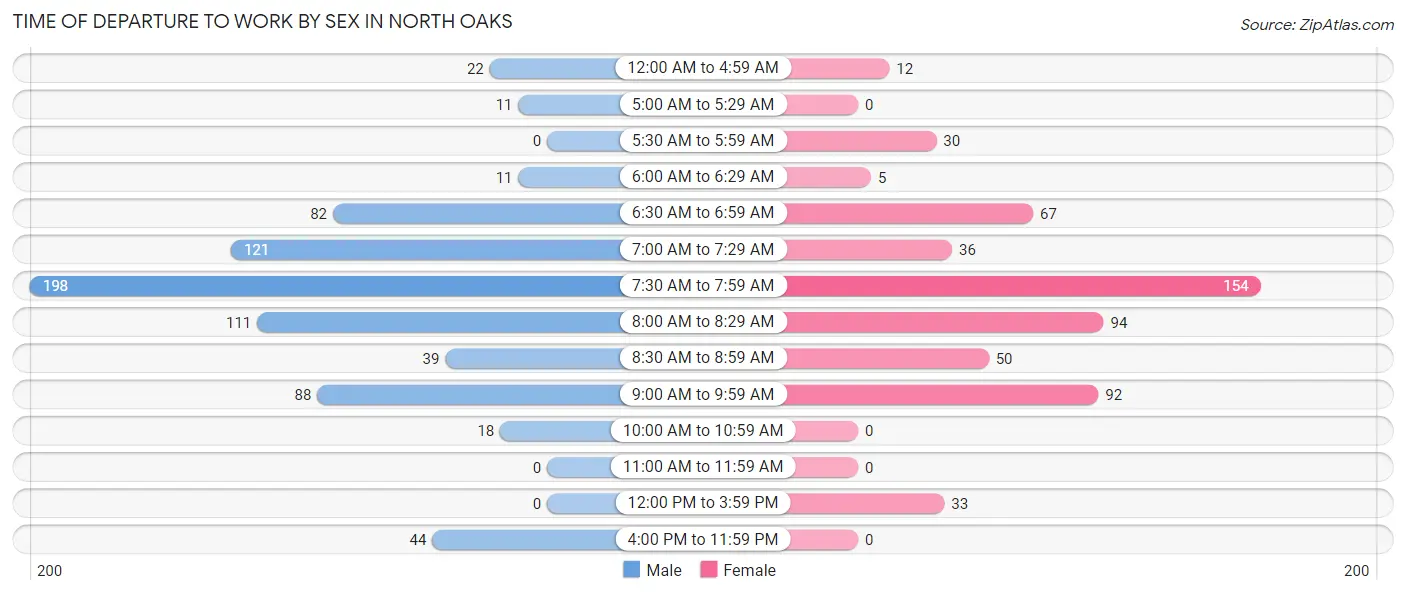
| Time of Departure | Male | Female |
| 12:00 AM to 4:59 AM | 22 (2.9%) | 12 (2.1%) |
| 5:00 AM to 5:29 AM | 11 (1.5%) | 0 (0.0%) |
| 5:30 AM to 5:59 AM | 0 (0.0%) | 30 (5.2%) |
| 6:00 AM to 6:29 AM | 11 (1.5%) | 5 (0.9%) |
| 6:30 AM to 6:59 AM | 82 (11.0%) | 67 (11.7%) |
| 7:00 AM to 7:29 AM | 121 (16.2%) | 36 (6.3%) |
| 7:30 AM to 7:59 AM | 198 (26.6%) | 154 (26.9%) |
| 8:00 AM to 8:29 AM | 111 (14.9%) | 94 (16.4%) |
| 8:30 AM to 8:59 AM | 39 (5.2%) | 50 (8.7%) |
| 9:00 AM to 9:59 AM | 88 (11.8%) | 92 (16.1%) |
| 10:00 AM to 10:59 AM | 18 (2.4%) | 0 (0.0%) |
| 11:00 AM to 11:59 AM | 0 (0.0%) | 0 (0.0%) |
| 12:00 PM to 3:59 PM | 0 (0.0%) | 33 (5.8%) |
| 4:00 PM to 11:59 PM | 44 (5.9%) | 0 (0.0%) |
| Total | 745 (100.0%) | 573 (100.0%) |
Housing Occupancy in North Oaks
Occupancy by Ownership in North Oaks
Of the total 1,758 dwellings in North Oaks, owner-occupied units account for 1,469 (83.6%), while renter-occupied units make up 289 (16.4%).
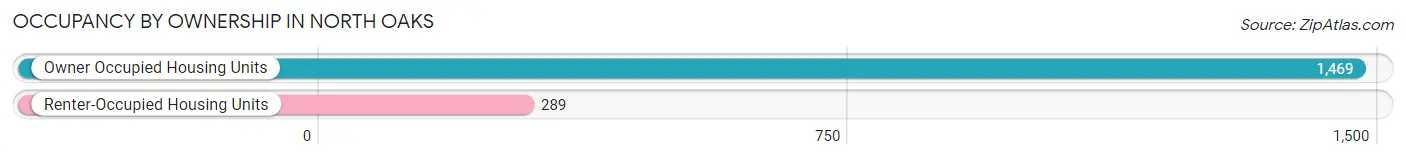
| Occupancy | # Housing Units | % Housing Units |
| Owner Occupied Housing Units | 1,469 | 83.6% |
| Renter-Occupied Housing Units | 289 | 16.4% |
| Total Occupied Housing Units | 1,758 | 100.0% |
Occupancy by Household Size in North Oaks
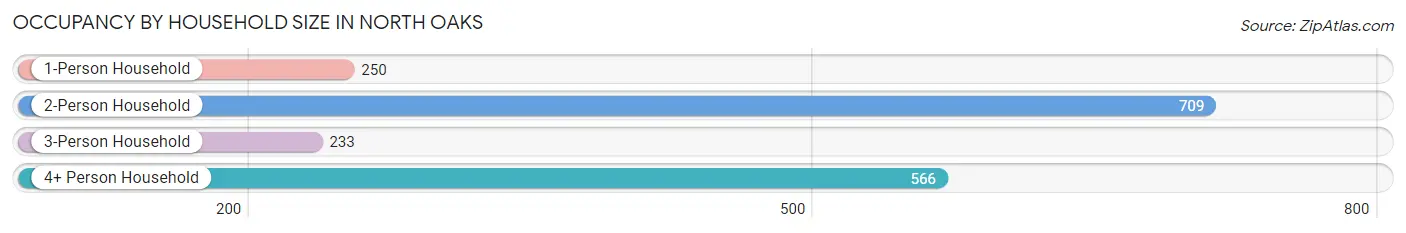
| Household Size | # Housing Units | % Housing Units |
| 1-Person Household | 250 | 14.2% |
| 2-Person Household | 709 | 40.3% |
| 3-Person Household | 233 | 13.3% |
| 4+ Person Household | 566 | 32.2% |
| Total Housing Units | 1,758 | 100.0% |
Occupancy by Ownership by Household Size in North Oaks
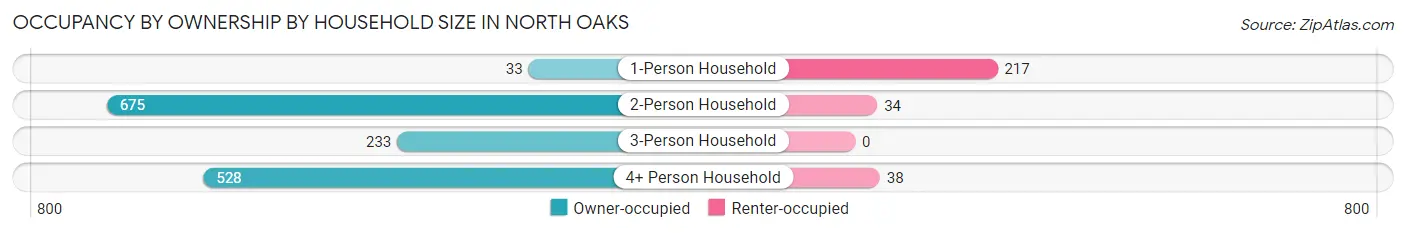
| Household Size | Owner-occupied | Renter-occupied |
| 1-Person Household | 33 (13.2%) | 217 (86.8%) |
| 2-Person Household | 675 (95.2%) | 34 (4.8%) |
| 3-Person Household | 233 (100.0%) | 0 (0.0%) |
| 4+ Person Household | 528 (93.3%) | 38 (6.7%) |
| Total Housing Units | 1,469 (83.6%) | 289 (16.4%) |
Occupancy by Educational Attainment in North Oaks
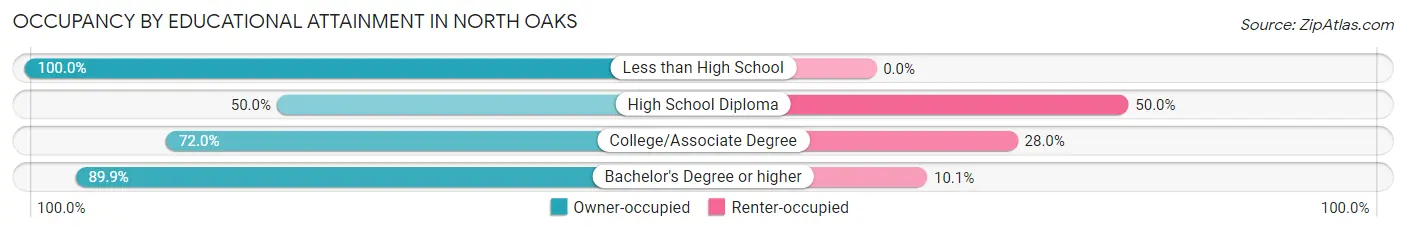
| Household Size | Owner-occupied | Renter-occupied |
| Less than High School | 6 (100.0%) | 0 (0.0%) |
| High School Diploma | 74 (50.0%) | 74 (50.0%) |
| College/Associate Degree | 213 (72.0%) | 83 (28.0%) |
| Bachelor's Degree or higher | 1,176 (89.9%) | 132 (10.1%) |
Occupancy by Age of Householder in North Oaks
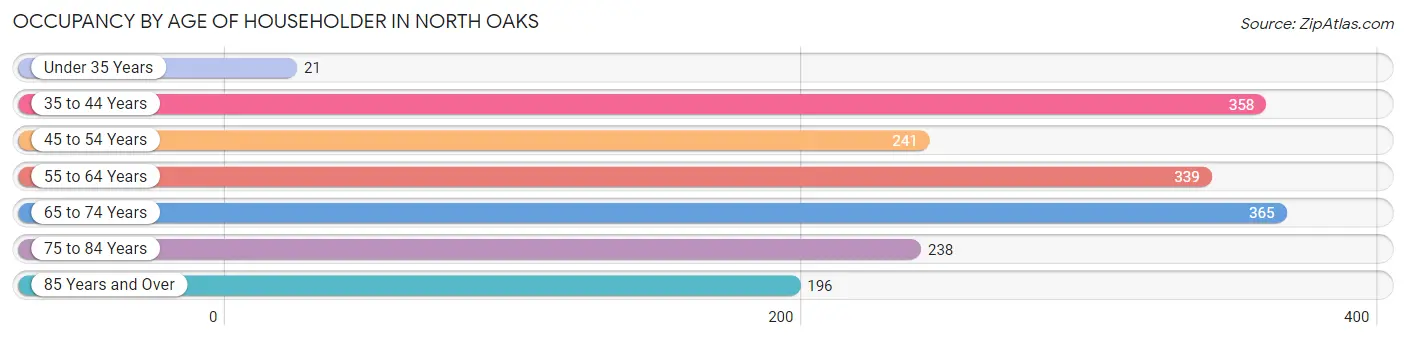
| Age Bracket | # Households | % Households |
| Under 35 Years | 21 | 1.2% |
| 35 to 44 Years | 358 | 20.4% |
| 45 to 54 Years | 241 | 13.7% |
| 55 to 64 Years | 339 | 19.3% |
| 65 to 74 Years | 365 | 20.8% |
| 75 to 84 Years | 238 | 13.5% |
| 85 Years and Over | 196 | 11.2% |
| Total | 1,758 | 100.0% |
Housing Finances in North Oaks
Median Income by Occupancy in North Oaks
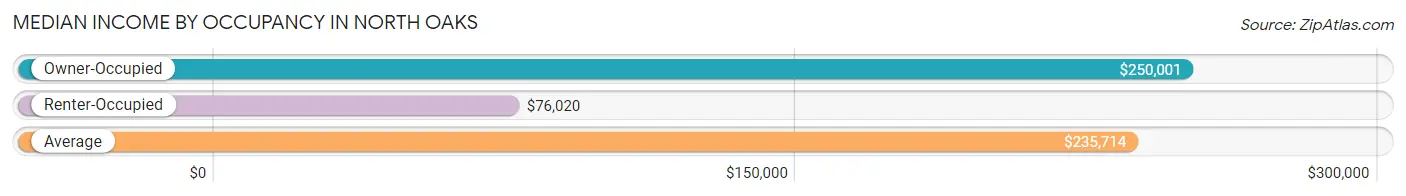
| Occupancy Type | # Households | Median Income |
| Owner-Occupied | 1,469 (83.6%) | $250,001 |
| Renter-Occupied | 289 (16.4%) | $76,020 |
| Average | 1,758 (100.0%) | $235,714 |
Occupancy by Householder Income Bracket in North Oaks
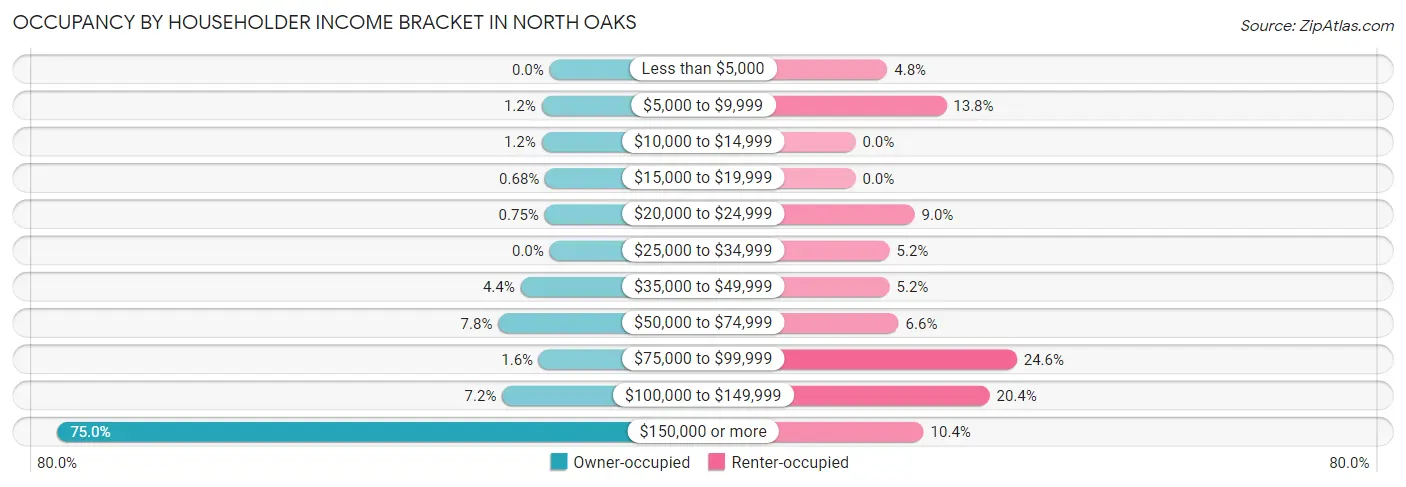
| Income Bracket | Owner-occupied | Renter-occupied |
| Less than $5,000 | 0 (0.0%) | 14 (4.8%) |
| $5,000 to $9,999 | 18 (1.2%) | 40 (13.8%) |
| $10,000 to $14,999 | 18 (1.2%) | 0 (0.0%) |
| $15,000 to $19,999 | 10 (0.7%) | 0 (0.0%) |
| $20,000 to $24,999 | 11 (0.7%) | 26 (9.0%) |
| $25,000 to $34,999 | 0 (0.0%) | 15 (5.2%) |
| $35,000 to $49,999 | 65 (4.4%) | 15 (5.2%) |
| $50,000 to $74,999 | 115 (7.8%) | 19 (6.6%) |
| $75,000 to $99,999 | 24 (1.6%) | 71 (24.6%) |
| $100,000 to $149,999 | 106 (7.2%) | 59 (20.4%) |
| $150,000 or more | 1,102 (75.0%) | 30 (10.4%) |
| Total | 1,469 (100.0%) | 289 (100.0%) |
Monthly Housing Cost Tiers in North Oaks
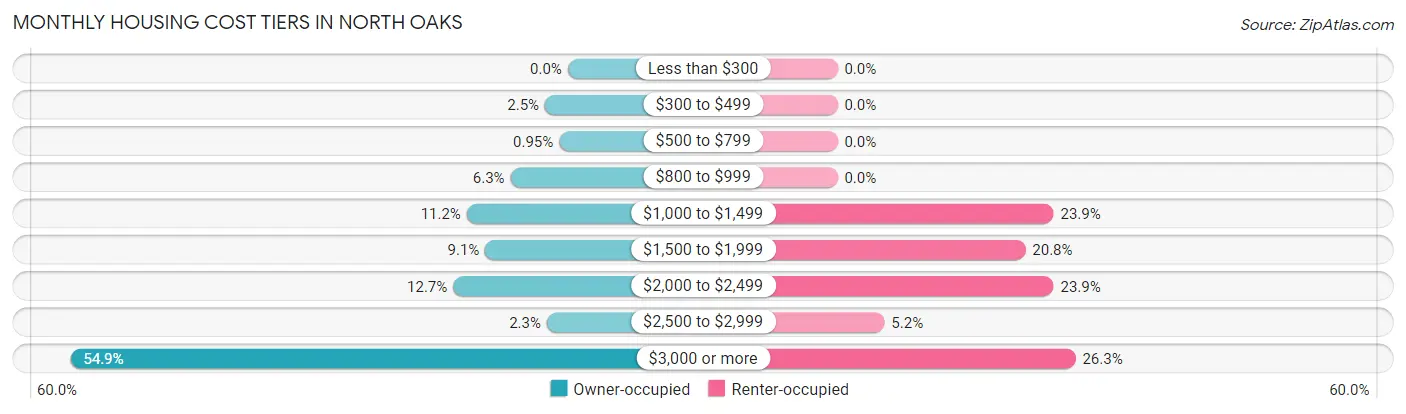
| Monthly Cost | Owner-occupied | Renter-occupied |
| Less than $300 | 0 (0.0%) | 0 (0.0%) |
| $300 to $499 | 37 (2.5%) | 0 (0.0%) |
| $500 to $799 | 14 (0.9%) | 0 (0.0%) |
| $800 to $999 | 93 (6.3%) | 0 (0.0%) |
| $1,000 to $1,499 | 164 (11.2%) | 69 (23.9%) |
| $1,500 to $1,999 | 134 (9.1%) | 60 (20.8%) |
| $2,000 to $2,499 | 186 (12.7%) | 69 (23.9%) |
| $2,500 to $2,999 | 34 (2.3%) | 15 (5.2%) |
| $3,000 or more | 807 (54.9%) | 76 (26.3%) |
| Total | 1,469 (100.0%) | 289 (100.0%) |
Physical Housing Characteristics in North Oaks
Housing Structures in North Oaks
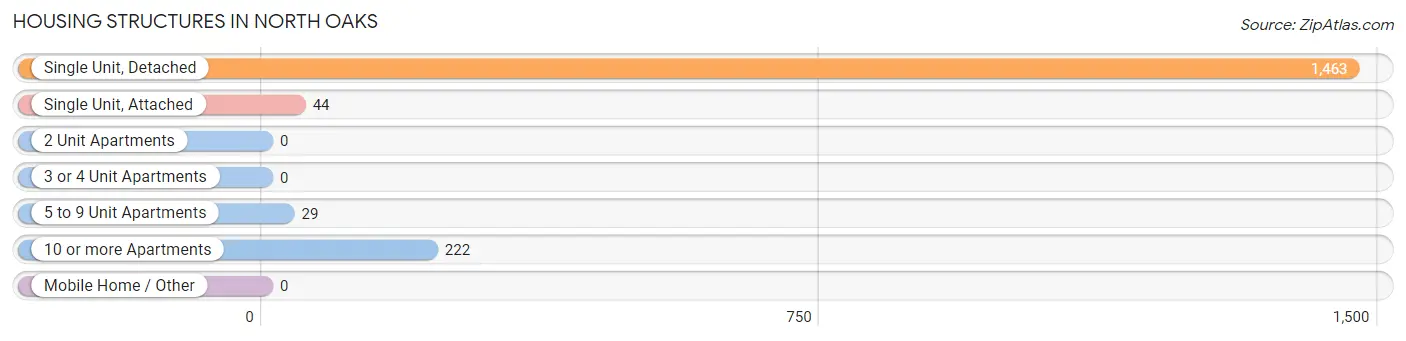
| Structure Type | # Housing Units | % Housing Units |
| Single Unit, Detached | 1,463 | 83.2% |
| Single Unit, Attached | 44 | 2.5% |
| 2 Unit Apartments | 0 | 0.0% |
| 3 or 4 Unit Apartments | 0 | 0.0% |
| 5 to 9 Unit Apartments | 29 | 1.7% |
| 10 or more Apartments | 222 | 12.6% |
| Mobile Home / Other | 0 | 0.0% |
| Total | 1,758 | 100.0% |
Housing Structures by Occupancy in North Oaks
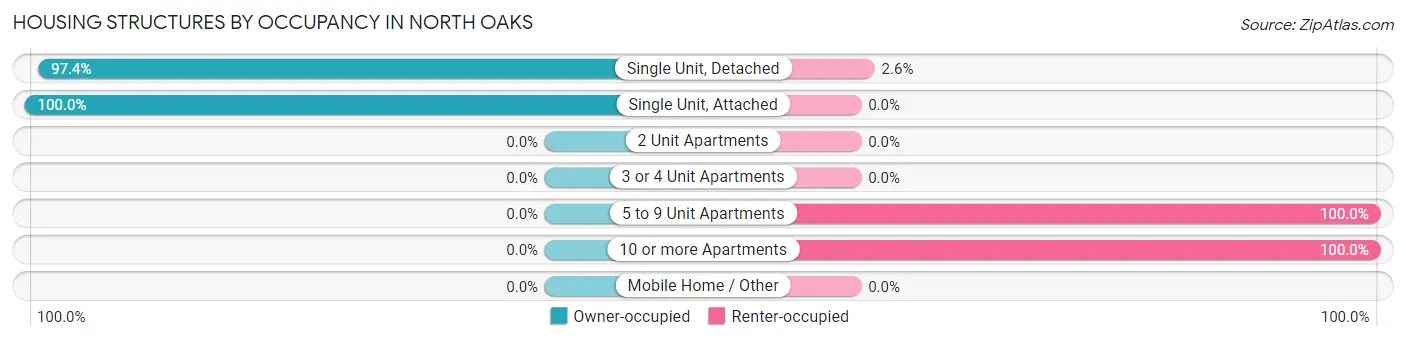
| Structure Type | Owner-occupied | Renter-occupied |
| Single Unit, Detached | 1,425 (97.4%) | 38 (2.6%) |
| Single Unit, Attached | 44 (100.0%) | 0 (0.0%) |
| 2 Unit Apartments | 0 (0.0%) | 0 (0.0%) |
| 3 or 4 Unit Apartments | 0 (0.0%) | 0 (0.0%) |
| 5 to 9 Unit Apartments | 0 (0.0%) | 29 (100.0%) |
| 10 or more Apartments | 0 (0.0%) | 222 (100.0%) |
| Mobile Home / Other | 0 (0.0%) | 0 (0.0%) |
| Total | 1,469 (83.6%) | 289 (16.4%) |
Housing Structures by Number of Rooms in North Oaks
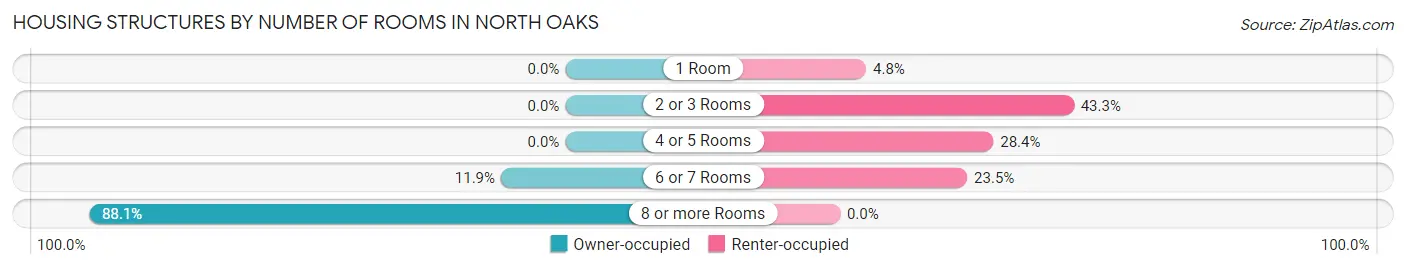
| Number of Rooms | Owner-occupied | Renter-occupied |
| 1 Room | 0 (0.0%) | 14 (4.8%) |
| 2 or 3 Rooms | 0 (0.0%) | 125 (43.2%) |
| 4 or 5 Rooms | 0 (0.0%) | 82 (28.4%) |
| 6 or 7 Rooms | 175 (11.9%) | 68 (23.5%) |
| 8 or more Rooms | 1,294 (88.1%) | 0 (0.0%) |
| Total | 1,469 (100.0%) | 289 (100.0%) |
Housing Structure by Heating Type in North Oaks
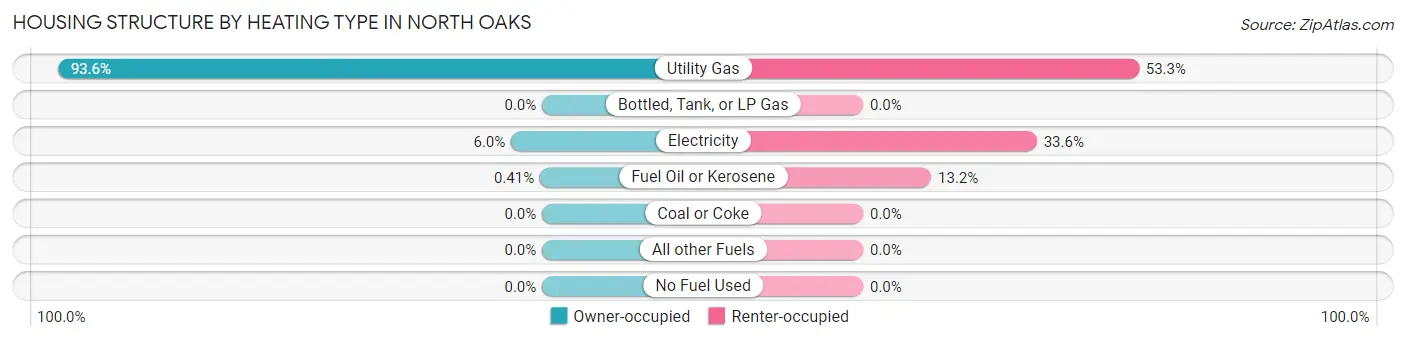
| Heating Type | Owner-occupied | Renter-occupied |
| Utility Gas | 1,375 (93.6%) | 154 (53.3%) |
| Bottled, Tank, or LP Gas | 0 (0.0%) | 0 (0.0%) |
| Electricity | 88 (6.0%) | 97 (33.6%) |
| Fuel Oil or Kerosene | 6 (0.4%) | 38 (13.2%) |
| Coal or Coke | 0 (0.0%) | 0 (0.0%) |
| All other Fuels | 0 (0.0%) | 0 (0.0%) |
| No Fuel Used | 0 (0.0%) | 0 (0.0%) |
| Total | 1,469 (100.0%) | 289 (100.0%) |
Household Vehicle Usage in North Oaks
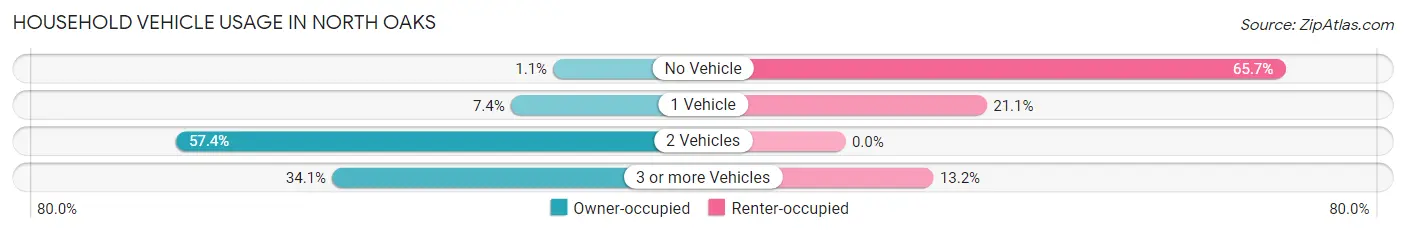
| Vehicles per Household | Owner-occupied | Renter-occupied |
| No Vehicle | 16 (1.1%) | 190 (65.7%) |
| 1 Vehicle | 109 (7.4%) | 61 (21.1%) |
| 2 Vehicles | 843 (57.4%) | 0 (0.0%) |
| 3 or more Vehicles | 501 (34.1%) | 38 (13.2%) |
| Total | 1,469 (100.0%) | 289 (100.0%) |
Real Estate & Mortgages in North Oaks
Real Estate and Mortgage Overview in North Oaks
| Characteristic | Without Mortgage | With Mortgage |
| Housing Units | 437 | 1,032 |
| Median Property Value | $741,600 | $705,900 |
| Median Household Income | $219,931 | $802 |
| Monthly Housing Costs | $1,236 | $793 |
| Real Estate Taxes | $7,960 | $0 |
Property Value by Mortgage Status in North Oaks
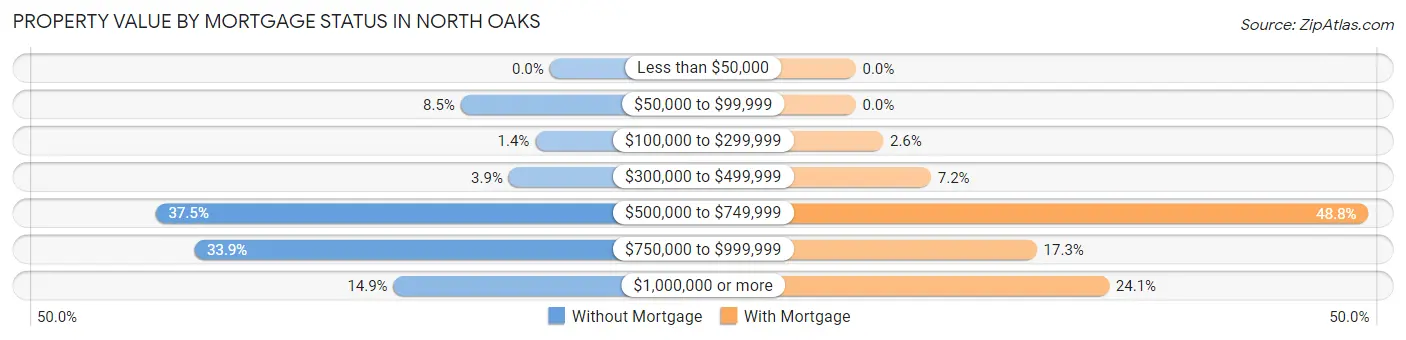
| Property Value | Without Mortgage | With Mortgage |
| Less than $50,000 | 0 (0.0%) | 0 (0.0%) |
| $50,000 to $99,999 | 37 (8.5%) | 0 (0.0%) |
| $100,000 to $299,999 | 6 (1.4%) | 27 (2.6%) |
| $300,000 to $499,999 | 17 (3.9%) | 74 (7.2%) |
| $500,000 to $749,999 | 164 (37.5%) | 504 (48.8%) |
| $750,000 to $999,999 | 148 (33.9%) | 178 (17.2%) |
| $1,000,000 or more | 65 (14.9%) | 249 (24.1%) |
| Total | 437 (100.0%) | 1,032 (100.0%) |
Household Income by Mortgage Status in North Oaks
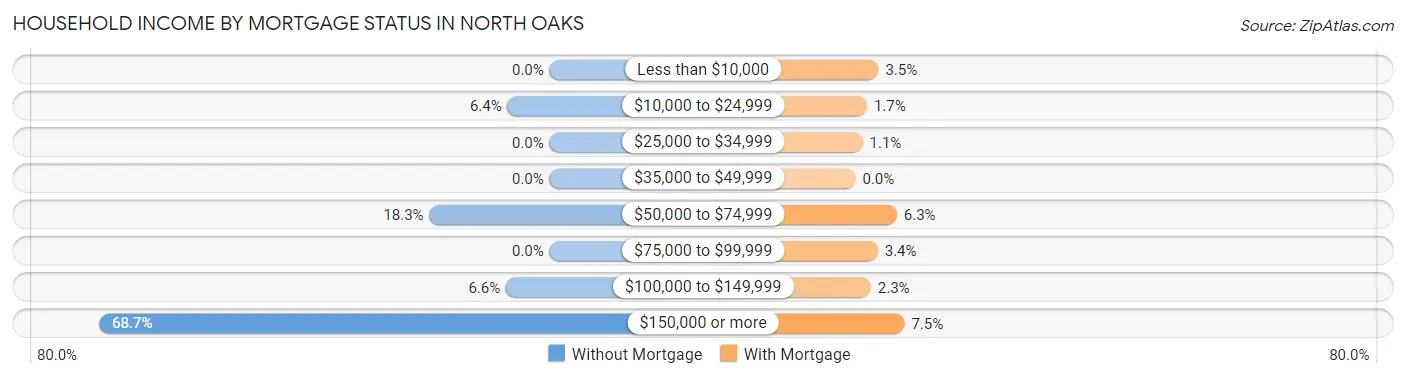
| Household Income | Without Mortgage | With Mortgage |
| Less than $10,000 | 0 (0.0%) | 36 (3.5%) |
| $10,000 to $24,999 | 28 (6.4%) | 18 (1.7%) |
| $25,000 to $34,999 | 0 (0.0%) | 11 (1.1%) |
| $35,000 to $49,999 | 0 (0.0%) | 0 (0.0%) |
| $50,000 to $74,999 | 80 (18.3%) | 65 (6.3%) |
| $75,000 to $99,999 | 0 (0.0%) | 35 (3.4%) |
| $100,000 to $149,999 | 29 (6.6%) | 24 (2.3%) |
| $150,000 or more | 300 (68.6%) | 77 (7.5%) |
| Total | 437 (100.0%) | 1,032 (100.0%) |
Property Value to Household Income Ratio in North Oaks
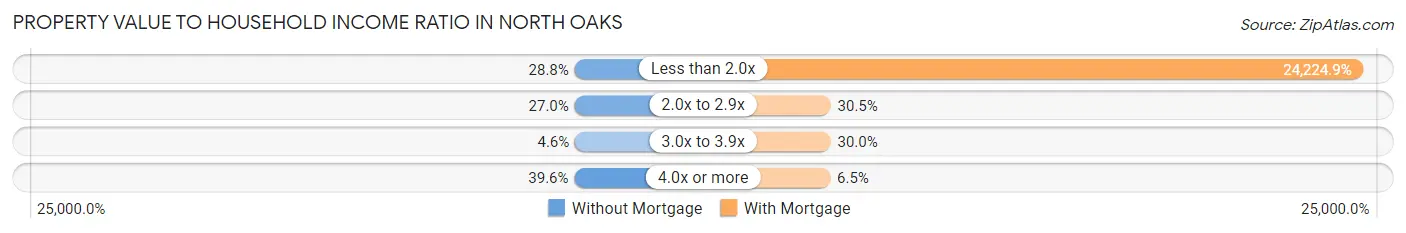
| Value-to-Income Ratio | Without Mortgage | With Mortgage |
| Less than 2.0x | 126 (28.8%) | 250,001 (24,224.9%) |
| 2.0x to 2.9x | 118 (27.0%) | 315 (30.5%) |
| 3.0x to 3.9x | 20 (4.6%) | 310 (30.0%) |
| 4.0x or more | 173 (39.6%) | 67 (6.5%) |
| Total | 437 (100.0%) | 1,032 (100.0%) |
Real Estate Taxes by Mortgage Status in North Oaks
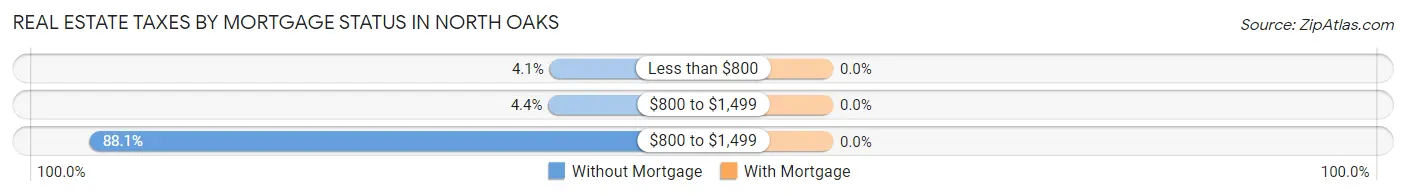
| Property Taxes | Without Mortgage | With Mortgage |
| Less than $800 | 18 (4.1%) | 0 (0.0%) |
| $800 to $1,499 | 19 (4.3%) | 0 (0.0%) |
| $800 to $1,499 | 385 (88.1%) | 0 (0.0%) |
| Total | 437 (100.0%) | 1,032 (100.0%) |
Health & Disability in North Oaks
Health Insurance Coverage by Age in North Oaks
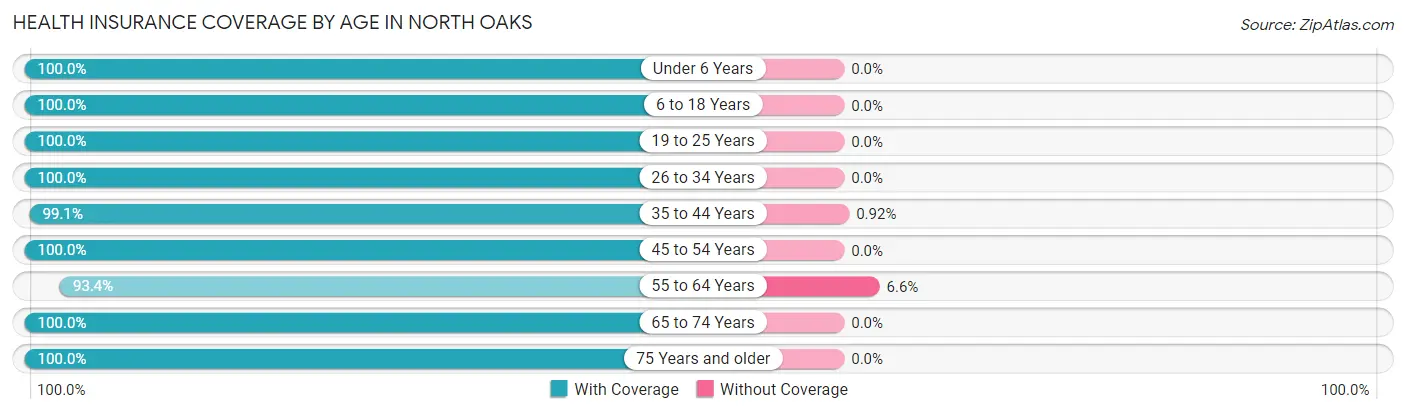
| Age Bracket | With Coverage | Without Coverage |
| Under 6 Years | 407 (100.0%) | 0 (0.0%) |
| 6 to 18 Years | 1,129 (100.0%) | 0 (0.0%) |
| 19 to 25 Years | 164 (100.0%) | 0 (0.0%) |
| 26 to 34 Years | 79 (100.0%) | 0 (0.0%) |
| 35 to 44 Years | 754 (99.1%) | 7 (0.9%) |
| 45 to 54 Years | 548 (100.0%) | 0 (0.0%) |
| 55 to 64 Years | 639 (93.4%) | 45 (6.6%) |
| 65 to 74 Years | 673 (100.0%) | 0 (0.0%) |
| 75 Years and older | 646 (100.0%) | 0 (0.0%) |
| Total | 5,039 (99.0%) | 52 (1.0%) |
Health Insurance Coverage by Citizenship Status in North Oaks
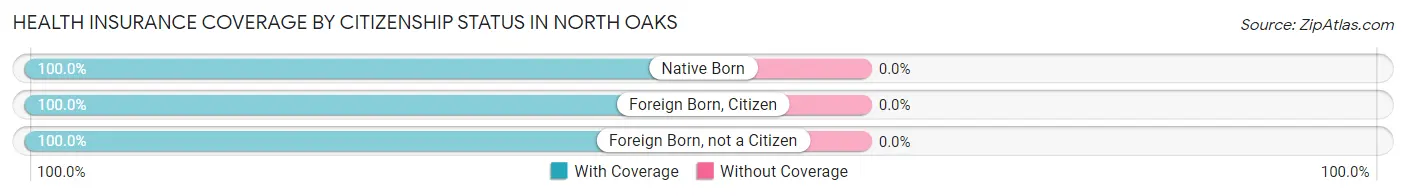
| Citizenship Status | With Coverage | Without Coverage |
| Native Born | 407 (100.0%) | 0 (0.0%) |
| Foreign Born, Citizen | 1,129 (100.0%) | 0 (0.0%) |
| Foreign Born, not a Citizen | 164 (100.0%) | 0 (0.0%) |
Health Insurance Coverage by Household Income in North Oaks
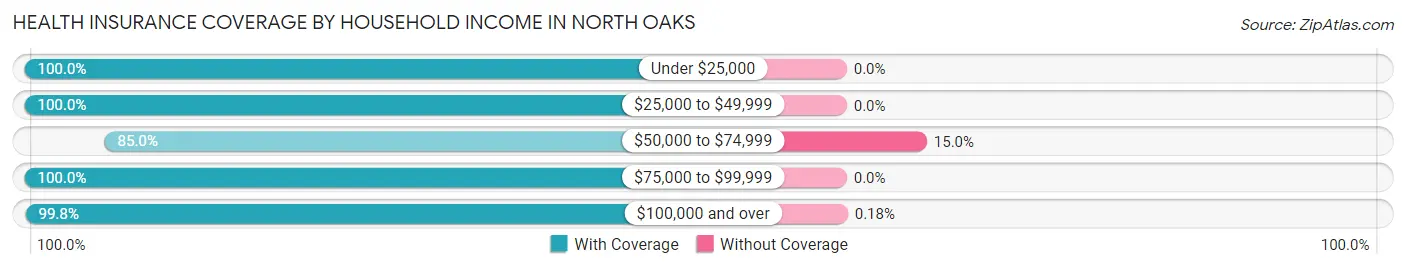
| Household Income | With Coverage | Without Coverage |
| Under $25,000 | 196 (100.0%) | 0 (0.0%) |
| $25,000 to $49,999 | 370 (100.0%) | 0 (0.0%) |
| $50,000 to $74,999 | 255 (85.0%) | 45 (15.0%) |
| $75,000 to $99,999 | 278 (100.0%) | 0 (0.0%) |
| $100,000 and over | 3,892 (99.8%) | 7 (0.2%) |
Public vs Private Health Insurance Coverage by Age in North Oaks
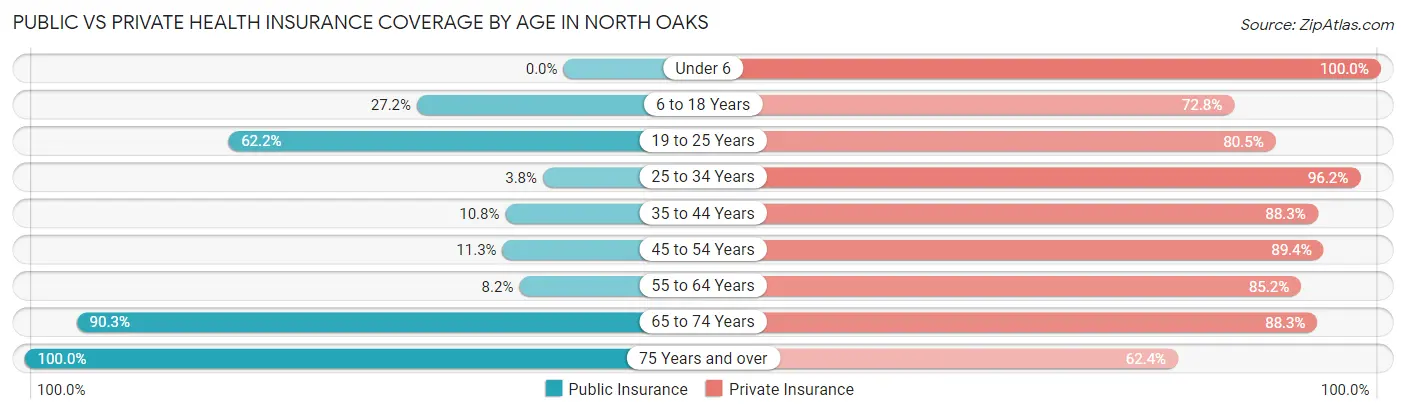
| Age Bracket | Public Insurance | Private Insurance |
| Under 6 | 0 (0.0%) | 407 (100.0%) |
| 6 to 18 Years | 307 (27.2%) | 822 (72.8%) |
| 19 to 25 Years | 102 (62.2%) | 132 (80.5%) |
| 25 to 34 Years | 3 (3.8%) | 76 (96.2%) |
| 35 to 44 Years | 82 (10.8%) | 672 (88.3%) |
| 45 to 54 Years | 62 (11.3%) | 490 (89.4%) |
| 55 to 64 Years | 56 (8.2%) | 583 (85.2%) |
| 65 to 74 Years | 608 (90.3%) | 594 (88.3%) |
| 75 Years and over | 646 (100.0%) | 403 (62.4%) |
| Total | 1,866 (36.6%) | 4,179 (82.1%) |
Disability Status by Sex by Age in North Oaks
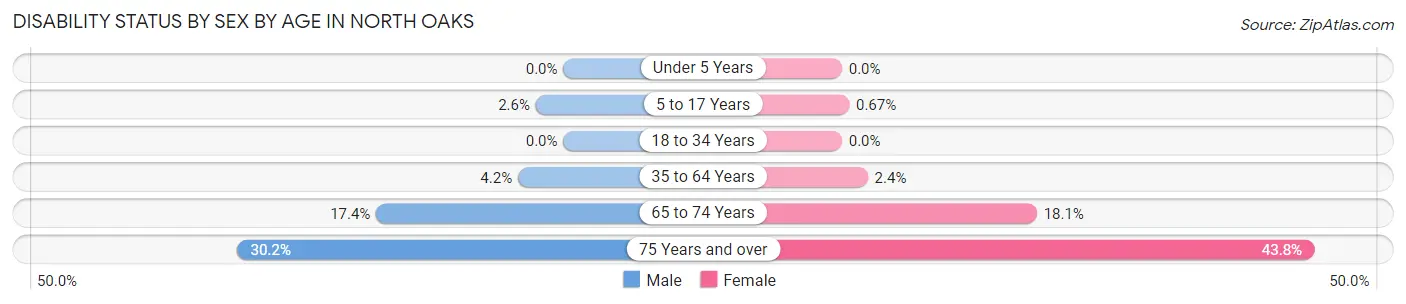
| Age Bracket | Male | Female |
| Under 5 Years | 0 (0.0%) | 0 (0.0%) |
| 5 to 17 Years | 12 (2.6%) | 4 (0.7%) |
| 18 to 34 Years | 0 (0.0%) | 0 (0.0%) |
| 35 to 64 Years | 40 (4.2%) | 25 (2.4%) |
| 65 to 74 Years | 66 (17.4%) | 53 (18.1%) |
| 75 Years and over | 78 (30.2%) | 170 (43.8%) |
Disability Class by Sex by Age in North Oaks
Disability Class: Hearing Difficulty
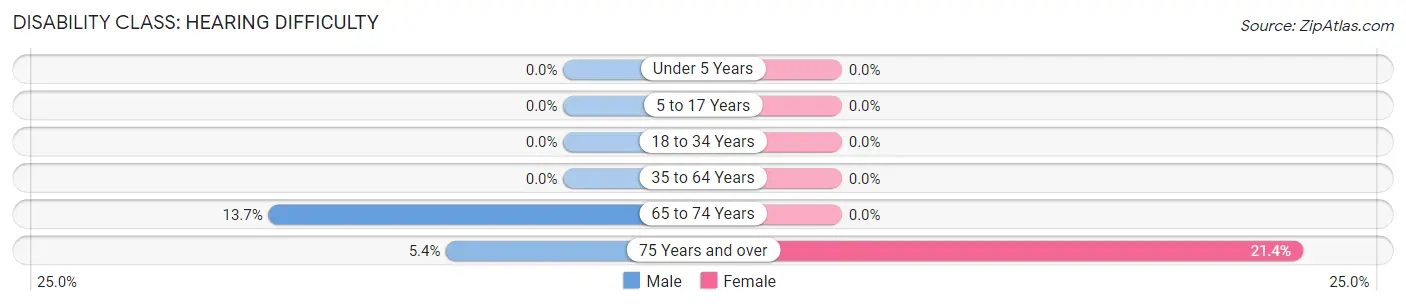
| Age Bracket | Male | Female |
| Under 5 Years | 0 (0.0%) | 0 (0.0%) |
| 5 to 17 Years | 0 (0.0%) | 0 (0.0%) |
| 18 to 34 Years | 0 (0.0%) | 0 (0.0%) |
| 35 to 64 Years | 0 (0.0%) | 0 (0.0%) |
| 65 to 74 Years | 52 (13.7%) | 0 (0.0%) |
| 75 Years and over | 14 (5.4%) | 83 (21.4%) |
Disability Class: Vision Difficulty
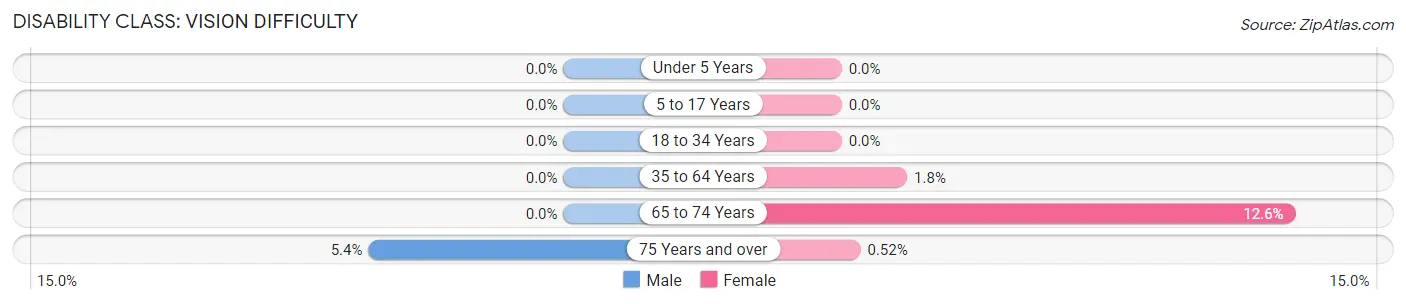
| Age Bracket | Male | Female |
| Under 5 Years | 0 (0.0%) | 0 (0.0%) |
| 5 to 17 Years | 0 (0.0%) | 0 (0.0%) |
| 18 to 34 Years | 0 (0.0%) | 0 (0.0%) |
| 35 to 64 Years | 0 (0.0%) | 19 (1.8%) |
| 65 to 74 Years | 0 (0.0%) | 37 (12.6%) |
| 75 Years and over | 14 (5.4%) | 2 (0.5%) |
Disability Class: Cognitive Difficulty
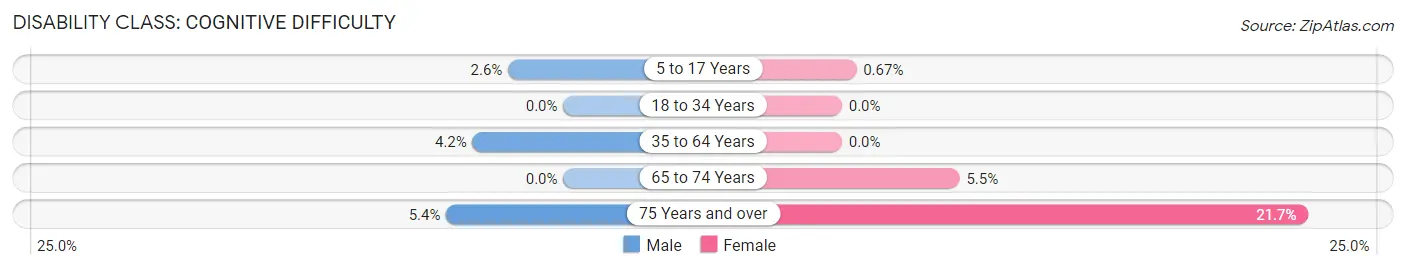
| Age Bracket | Male | Female |
| 5 to 17 Years | 12 (2.6%) | 4 (0.7%) |
| 18 to 34 Years | 0 (0.0%) | 0 (0.0%) |
| 35 to 64 Years | 40 (4.2%) | 0 (0.0%) |
| 65 to 74 Years | 0 (0.0%) | 16 (5.5%) |
| 75 Years and over | 14 (5.4%) | 84 (21.6%) |
Disability Class: Ambulatory Difficulty
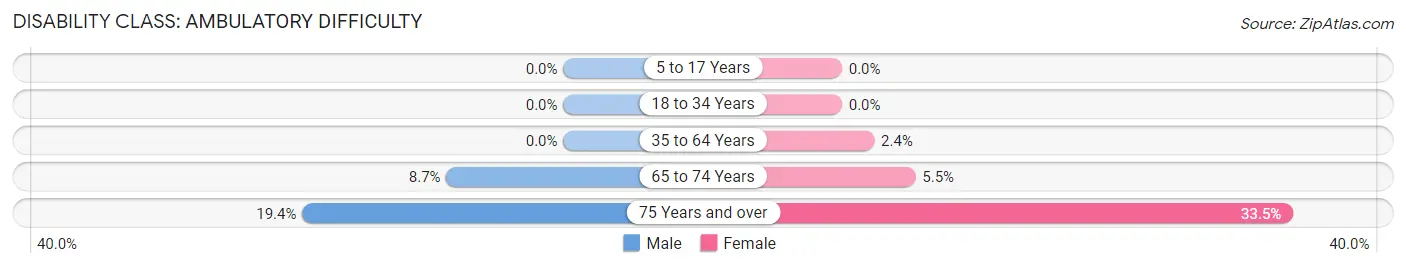
| Age Bracket | Male | Female |
| 5 to 17 Years | 0 (0.0%) | 0 (0.0%) |
| 18 to 34 Years | 0 (0.0%) | 0 (0.0%) |
| 35 to 64 Years | 0 (0.0%) | 25 (2.4%) |
| 65 to 74 Years | 33 (8.7%) | 16 (5.5%) |
| 75 Years and over | 50 (19.4%) | 130 (33.5%) |
Disability Class: Self-Care Difficulty
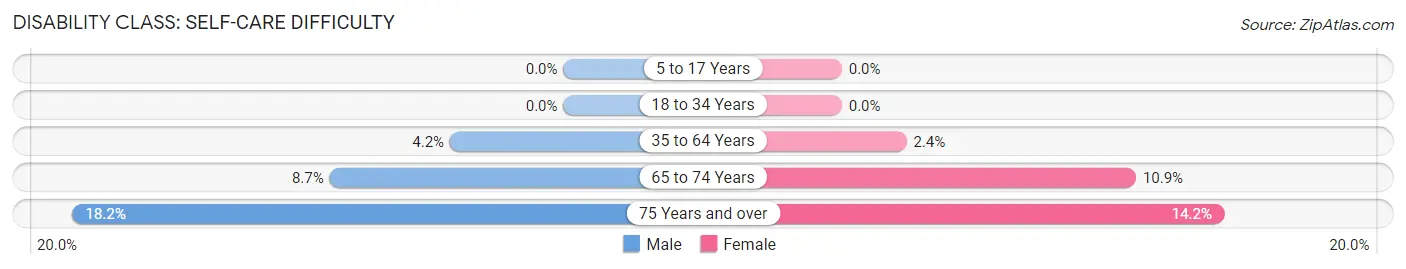
| Age Bracket | Male | Female |
| 5 to 17 Years | 0 (0.0%) | 0 (0.0%) |
| 18 to 34 Years | 0 (0.0%) | 0 (0.0%) |
| 35 to 64 Years | 40 (4.2%) | 25 (2.4%) |
| 65 to 74 Years | 33 (8.7%) | 32 (10.9%) |
| 75 Years and over | 47 (18.2%) | 55 (14.2%) |
Technology Access in North Oaks
Computing Device Access in North Oaks
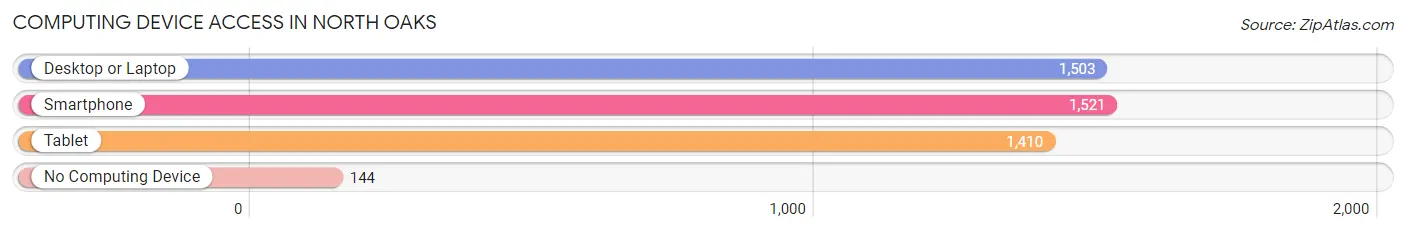
| Device Type | # Households | % Households |
| Desktop or Laptop | 1,503 | 85.5% |
| Smartphone | 1,521 | 86.5% |
| Tablet | 1,410 | 80.2% |
| No Computing Device | 144 | 8.2% |
| Total | 1,758 | 100.0% |
Internet Access in North Oaks
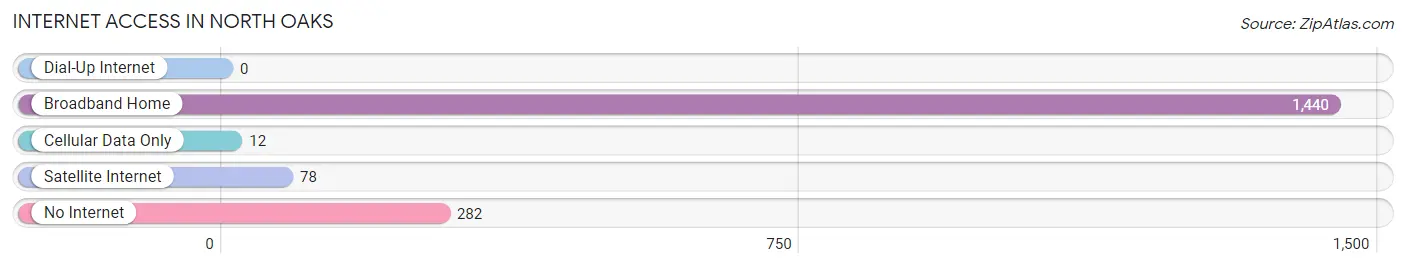
| Internet Type | # Households | % Households |
| Dial-Up Internet | 0 | 0.0% |
| Broadband Home | 1,440 | 81.9% |
| Cellular Data Only | 12 | 0.7% |
| Satellite Internet | 78 | 4.4% |
| No Internet | 282 | 16.0% |
| Total | 1,758 | 100.0% |
North Oaks Summary
History
North Oaks is a small city located in Ramsey County, Minnesota. It is a suburb of the Twin Cities metropolitan area and is located just north of the city of Saint Paul. The city was founded in 1956 and was originally known as the Village of North Oaks. It was incorporated as a city in 1972 and has since grown to a population of over 5,000 people.
The area that is now North Oaks was originally inhabited by the Dakota Sioux. The first European settlers arrived in the area in the early 1800s and began to farm the land. The area was known as “Oak Grove” and was part of the larger township of Mounds View. In the late 1800s, the area was divided into smaller townships and North Oaks was established.
The city was named after the many oak trees that grew in the area. The first post office was established in 1887 and the first school was built in 1895. The city was officially incorporated in 1972 and has since grown to its current population of over 5,000 people.
Geography
North Oaks is located in Ramsey County, Minnesota. It is situated just north of the city of Saint Paul and is part of the Twin Cities metropolitan area. The city is bordered by the cities of White Bear Lake, Shoreview, and Mounds View. The city covers an area of 4.2 square miles and has a population of over 5,000 people.
The city is located on the banks of the Mississippi River and is surrounded by several lakes, including White Bear Lake, Bald Eagle Lake, and Rice Lake. The city is also home to several parks, including North Oaks Park, which features a playground, picnic area, and walking trails.
Economy
North Oaks is a small city with a strong economy. The city is home to several businesses, including a variety of retail stores, restaurants, and professional services. The city is also home to several corporate headquarters, including the headquarters of the Minnesota Vikings football team.
The city is also home to several educational institutions, including North Oaks Elementary School, North Oaks Middle School, and North Oaks High School. The city is also home to several medical facilities, including North Oaks Medical Center and North Oaks Rehabilitation Center.
Demographics
As of the 2010 census, the population of North Oaks was 5,039. The racial makeup of the city was 94.3% White, 1.2% African American, 0.3% Native American, 1.7% Asian, 0.1% Pacific Islander, 0.9% from other races, and 1.7% from two or more races. Hispanic or Latino of any race were 2.3% of the population.
The median income for a household in the city was $90,945 and the median income for a family was $103,945. The per capita income for the city was $45,945. About 2.3% of families and 3.2% of the population were below the poverty line, including 3.7% of those under age 18 and 2.3% of those age 65 or over.
Common Questions
What is Per Capita Income in North Oaks?
Per Capita income in North Oaks is $95,366.
What is the Median Family Income in North Oaks?
Median Family Income in North Oaks is $250,001.
What is the Median Household income in North Oaks?
Median Household Income in North Oaks is $235,714.
What is Income or Wage Gap in North Oaks?
Income or Wage Gap in North Oaks is 61.6%.
Women in North Oaks earn 38.4 cents for every dollar earned by a man.
What is Inequality or Gini Index in North Oaks?
Inequality or Gini Index in North Oaks is 0.44.
What is the Total Population of North Oaks?
Total Population of North Oaks is 5,193.
What is the Total Male Population of North Oaks?
Total Male Population of North Oaks is 2,468.
What is the Total Female Population of North Oaks?
Total Female Population of North Oaks is 2,725.
What is the Ratio of Males per 100 Females in North Oaks?
There are 90.57 Males per 100 Females in North Oaks.
What is the Ratio of Females per 100 Males in North Oaks?
There are 110.41 Females per 100 Males in North Oaks.
What is the Median Population Age in North Oaks?
Median Population Age in North Oaks is 48.1 Years.
What is the Average Family Size in North Oaks
Average Family Size in North Oaks is 3.2 People.
What is the Average Household Size in North Oaks
Average Household Size in North Oaks is 2.9 People.
How Large is the Labor Force in North Oaks?
There are 2,113 People in the Labor Forcein in North Oaks.
What is the Percentage of People in the Labor Force in North Oaks?
54.3% of People are in the Labor Force in North Oaks.
What is the Unemployment Rate in North Oaks?
Unemployment Rate in North Oaks is 5.1%.