Carver, MN Map & Demographics
Carver Map
Carver Overview
$49,111
PER CAPITA INCOME
$141,094
AVG FAMILY INCOME
$125,123
AVG HOUSEHOLD INCOME
24.4%
WAGE / INCOME GAP [ % ]
75.6¢/ $1
WAGE / INCOME GAP [ $ ]
0.36
INEQUALITY / GINI INDEX
5,656
TOTAL POPULATION
2,853
MALE POPULATION
2,803
FEMALE POPULATION
101.78
MALES / 100 FEMALES
98.25
FEMALES / 100 MALES
36.9
MEDIAN AGE
3.5
AVG FAMILY SIZE
3.0
AVG HOUSEHOLD SIZE
3,183
LABOR FORCE [ PEOPLE ]
75.1%
PERCENT IN LABOR FORCE
5.5%
UNEMPLOYMENT RATE
Carver Zip Codes
Carver Area Codes
Income in Carver
Income Overview in Carver
Per Capita Income in Carver is $49,111, while median incomes of families and households are $141,094 and $125,123 respectively.
| Characteristic | Number | Measure |
| Per Capita Income | 5,656 | $49,111 |
| Median Family Income | 1,454 | $141,094 |
| Mean Family Income | 1,454 | $160,287 |
| Median Household Income | 1,891 | $125,123 |
| Mean Household Income | 1,891 | $140,373 |
| Income Deficit | 1,454 | $0 |
| Wage / Income Gap (%) | 5,656 | 24.38% |
| Wage / Income Gap ($) | 5,656 | 75.62¢ per $1 |
| Gini / Inequality Index | 5,656 | 0.36 |
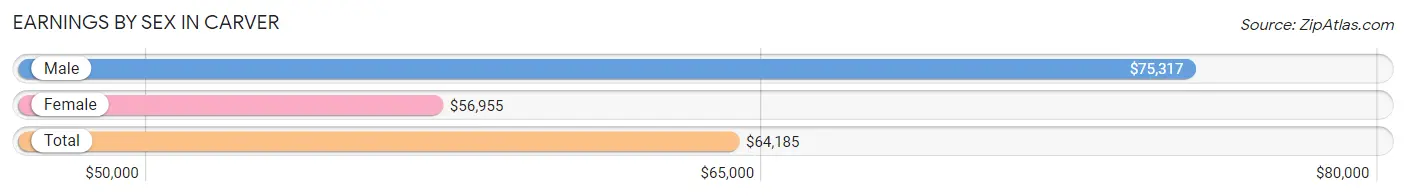
Earnings by Sex in Carver
Average Earnings in Carver are $64,185, $75,317 for men and $56,955 for women, a difference of 24.4%.
| Sex | Number | Average Earnings |
| Male | 1,682 (51.2%) | $75,317 |
| Female | 1,606 (48.8%) | $56,955 |
| Total | 3,288 (100.0%) | $64,185 |
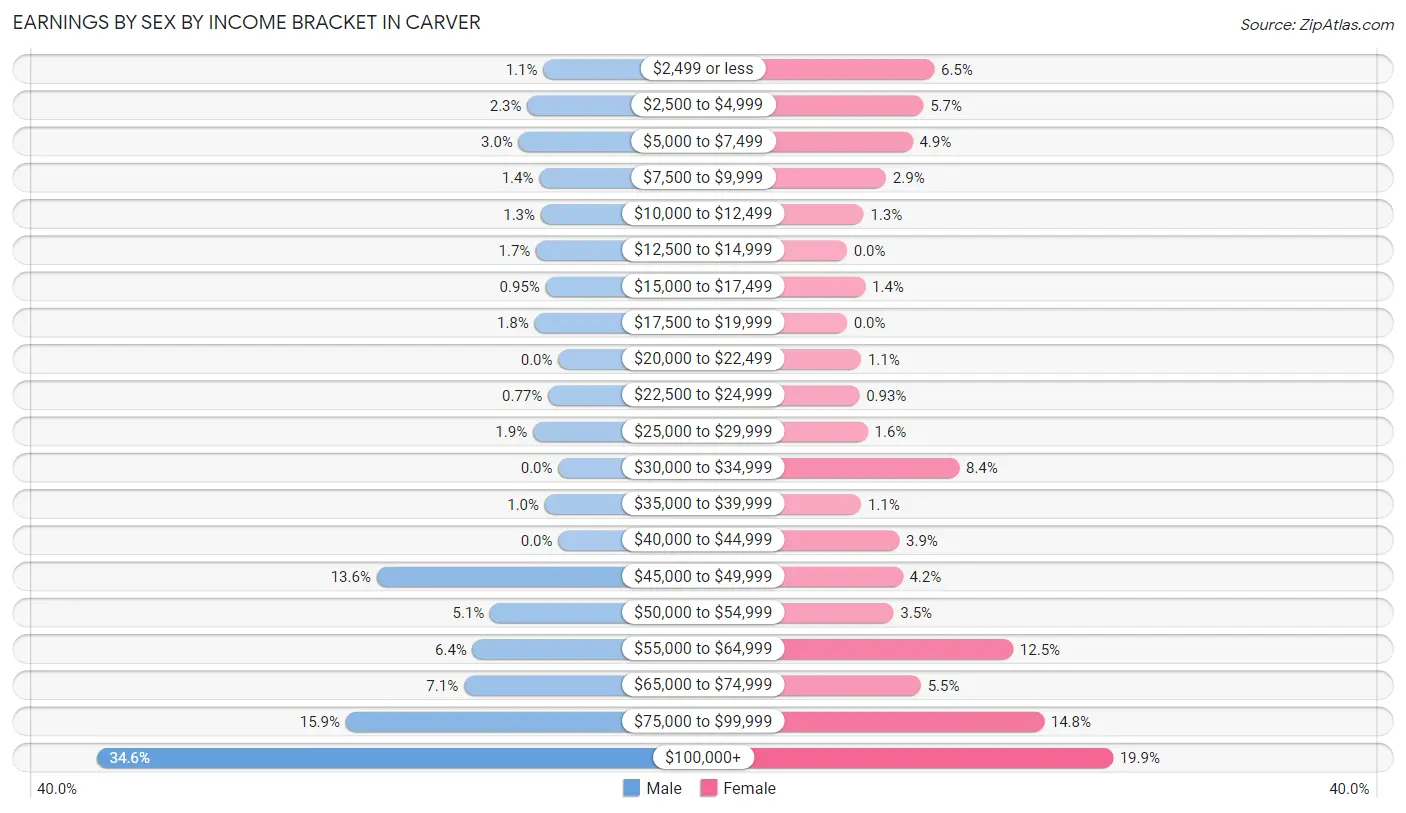
Earnings by Sex by Income Bracket in Carver
The most common earnings brackets in Carver are $100,000+ for men (582 | 34.6%) and $100,000+ for women (320 | 19.9%).
| Income | Male | Female |
| $2,499 or less | 19 (1.1%) | 105 (6.5%) |
| $2,500 to $4,999 | 39 (2.3%) | 92 (5.7%) |
| $5,000 to $7,499 | 50 (3.0%) | 79 (4.9%) |
| $7,500 to $9,999 | 24 (1.4%) | 47 (2.9%) |
| $10,000 to $12,499 | 22 (1.3%) | 20 (1.3%) |
| $12,500 to $14,999 | 28 (1.7%) | 0 (0.0%) |
| $15,000 to $17,499 | 16 (0.9%) | 22 (1.4%) |
| $17,500 to $19,999 | 30 (1.8%) | 0 (0.0%) |
| $20,000 to $22,499 | 0 (0.0%) | 17 (1.1%) |
| $22,500 to $24,999 | 13 (0.8%) | 15 (0.9%) |
| $25,000 to $29,999 | 32 (1.9%) | 25 (1.6%) |
| $30,000 to $34,999 | 0 (0.0%) | 135 (8.4%) |
| $35,000 to $39,999 | 17 (1.0%) | 17 (1.1%) |
| $40,000 to $44,999 | 0 (0.0%) | 63 (3.9%) |
| $45,000 to $49,999 | 229 (13.6%) | 67 (4.2%) |
| $50,000 to $54,999 | 86 (5.1%) | 56 (3.5%) |
| $55,000 to $64,999 | 108 (6.4%) | 200 (12.4%) |
| $65,000 to $74,999 | 119 (7.1%) | 89 (5.5%) |
| $75,000 to $99,999 | 268 (15.9%) | 237 (14.8%) |
| $100,000+ | 582 (34.6%) | 320 (19.9%) |
| Total | 1,682 (100.0%) | 1,606 (100.0%) |
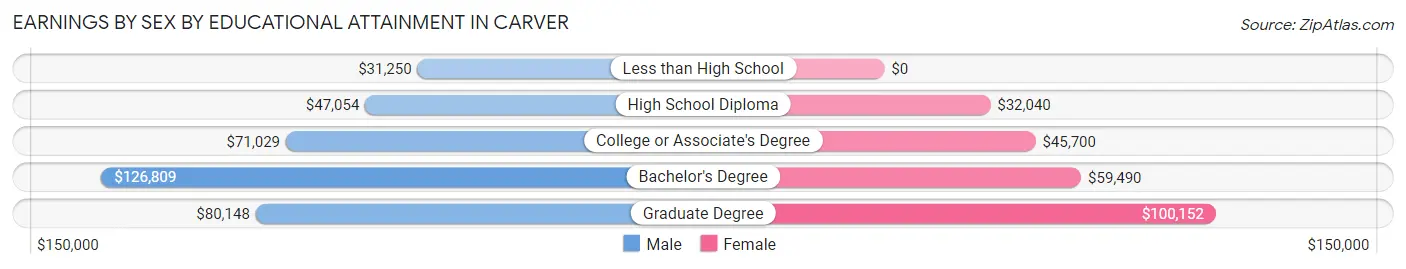
Earnings by Sex by Educational Attainment in Carver
Average earnings in Carver are $78,587 for men and $63,444 for women, a difference of 19.3%. Men with an educational attainment of bachelor's degree enjoy the highest average annual earnings of $126,809, while those with less than high school education earn the least with $31,250. Women with an educational attainment of graduate degree earn the most with the average annual earnings of $100,152, while those with high school diploma education have the smallest earnings of $32,040.
| Educational Attainment | Male Income | Female Income |
| Less than High School | $31,250 | $0 |
| High School Diploma | $47,054 | $32,040 |
| College or Associate's Degree | $71,029 | $45,700 |
| Bachelor's Degree | $126,809 | $59,490 |
| Graduate Degree | $80,148 | $100,152 |
| Total | $78,587 | $63,444 |
Family Income in Carver
Family Income Brackets in Carver
According to the Carver family income data, there are 441 families falling into the $100,000 to $149,999 income range, which is the most common income bracket and makes up 30.3% of all families.
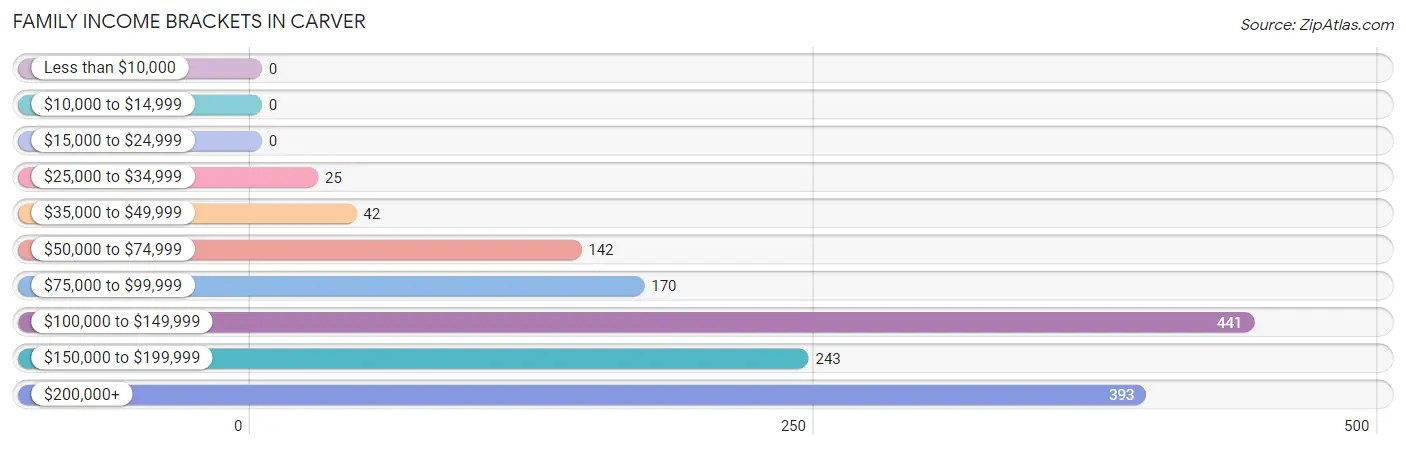
| Income Bracket | # Families | % Families |
| Less than $10,000 | 0 | 0.0% |
| $10,000 to $14,999 | 0 | 0.0% |
| $15,000 to $24,999 | 0 | 0.0% |
| $25,000 to $34,999 | 25 | 1.7% |
| $35,000 to $49,999 | 42 | 2.9% |
| $50,000 to $74,999 | 142 | 9.8% |
| $75,000 to $99,999 | 170 | 11.7% |
| $100,000 to $149,999 | 441 | 30.3% |
| $150,000 to $199,999 | 243 | 16.7% |
| $200,000+ | 393 | 27.0% |
Family Income by Famaliy Size in Carver
5-person families (53 | 3.6%) account for the highest median family income in Carver with $250,001 per family, while 2-person families (432 | 29.7%) have the highest median income of $53,666 per family member.
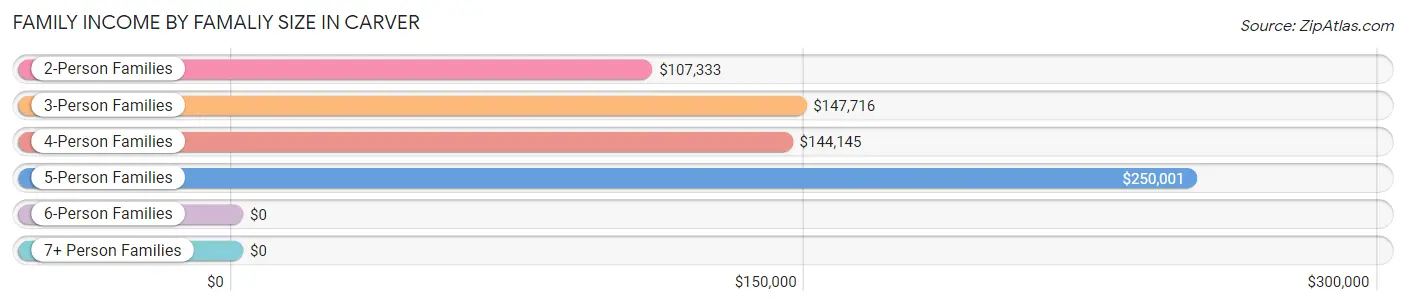
| Income Bracket | # Families | Median Income |
| 2-Person Families | 432 (29.7%) | $107,333 |
| 3-Person Families | 203 (14.0%) | $147,716 |
| 4-Person Families | 673 (46.3%) | $144,145 |
| 5-Person Families | 53 (3.6%) | $250,001 |
| 6-Person Families | 75 (5.2%) | $0 |
| 7+ Person Families | 18 (1.2%) | $0 |
| Total | 1,454 (100.0%) | $141,094 |
Family Income by Number of Earners in Carver
The median family income in Carver is $141,094, with families comprising 3+ earners (257) having the highest median family income of $171,229, while families with no earners (100) have the lowest median family income of $54,082, accounting for 17.7% and 6.9% of families, respectively.
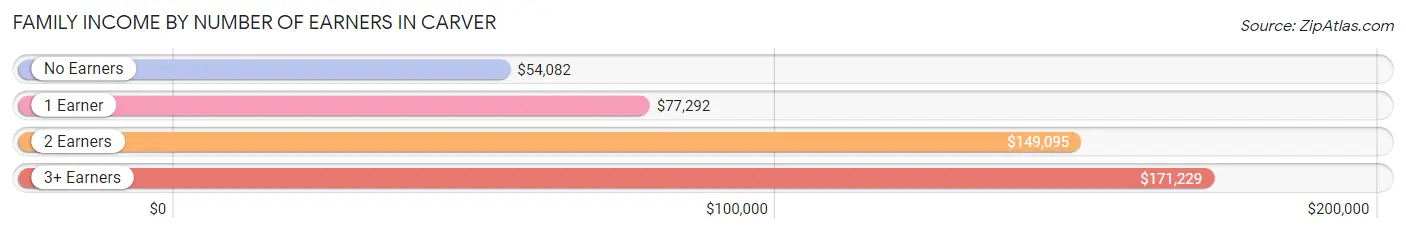
| Number of Earners | # Families | Median Income |
| No Earners | 100 (6.9%) | $54,082 |
| 1 Earner | 234 (16.1%) | $77,292 |
| 2 Earners | 863 (59.4%) | $149,095 |
| 3+ Earners | 257 (17.7%) | $171,229 |
| Total | 1,454 (100.0%) | $141,094 |
Household Income in Carver
Household Income Brackets in Carver
With 499 households falling in the category, the $100,000 to $149,999 income range is the most frequent in Carver, accounting for 26.4% of all households.
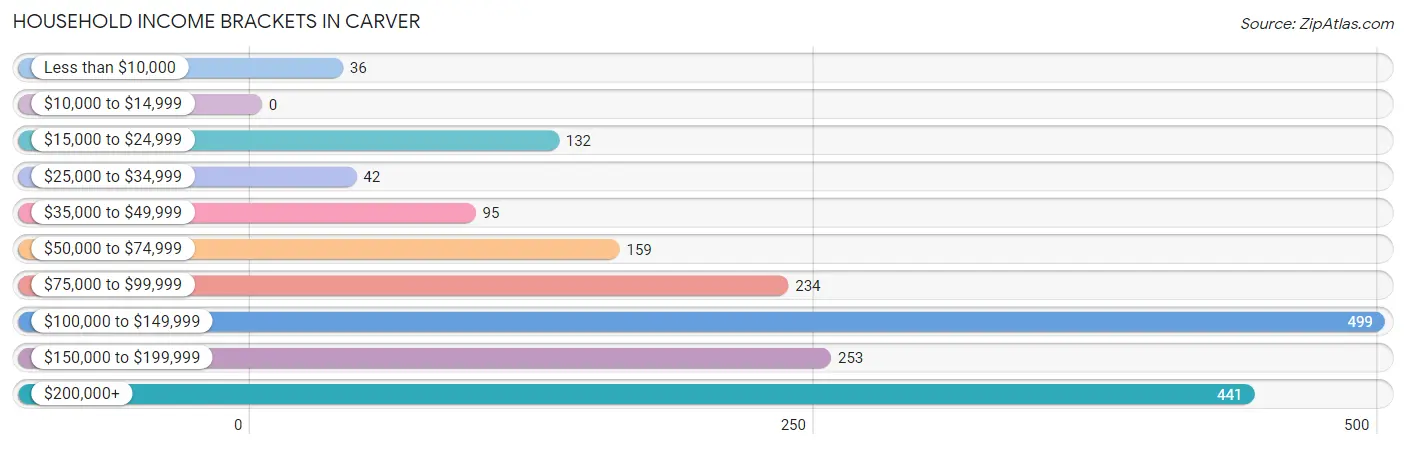
| Income Bracket | # Households | % Households |
| Less than $10,000 | 36 | 1.9% |
| $10,000 to $14,999 | 0 | 0.0% |
| $15,000 to $24,999 | 132 | 7.0% |
| $25,000 to $34,999 | 42 | 2.2% |
| $35,000 to $49,999 | 95 | 5.0% |
| $50,000 to $74,999 | 159 | 8.4% |
| $75,000 to $99,999 | 234 | 12.4% |
| $100,000 to $149,999 | 499 | 26.4% |
| $150,000 to $199,999 | 253 | 13.4% |
| $200,000+ | 441 | 23.3% |
Household Income by Householder Age in Carver
The median household income in Carver is $125,123, with the highest median household income of $146,875 found in the 25 to 44 years age bracket for the primary householder. A total of 788 households (41.7%) fall into this category.
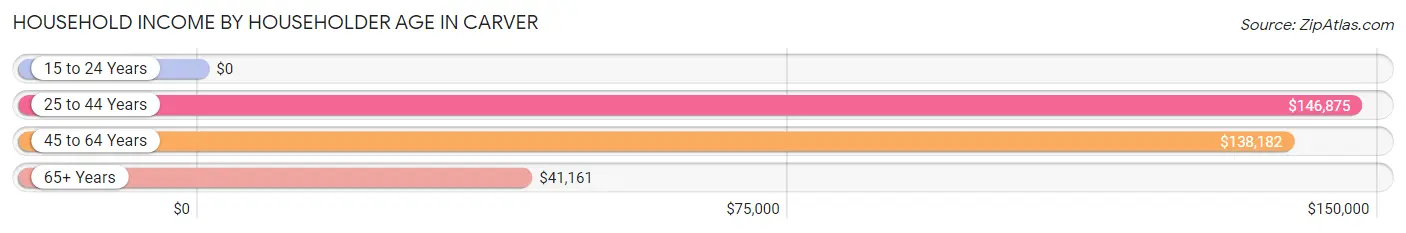
| Income Bracket | # Households | Median Income |
| 15 to 24 Years | 0 (0.0%) | $0 |
| 25 to 44 Years | 788 (41.7%) | $146,875 |
| 45 to 64 Years | 756 (40.0%) | $138,182 |
| 65+ Years | 347 (18.3%) | $41,161 |
| Total | 1,891 (100.0%) | $125,123 |
Poverty in Carver
Income Below Poverty by Sex and Age in Carver
With 1.3% poverty level for males and 0.1% for females among the residents of Carver, 65 to 74 year old males and 25 to 34 year old females are the most vulnerable to poverty, with 17 males (10.8%) and 1 females (0.4%) in their respective age groups living below the poverty level.
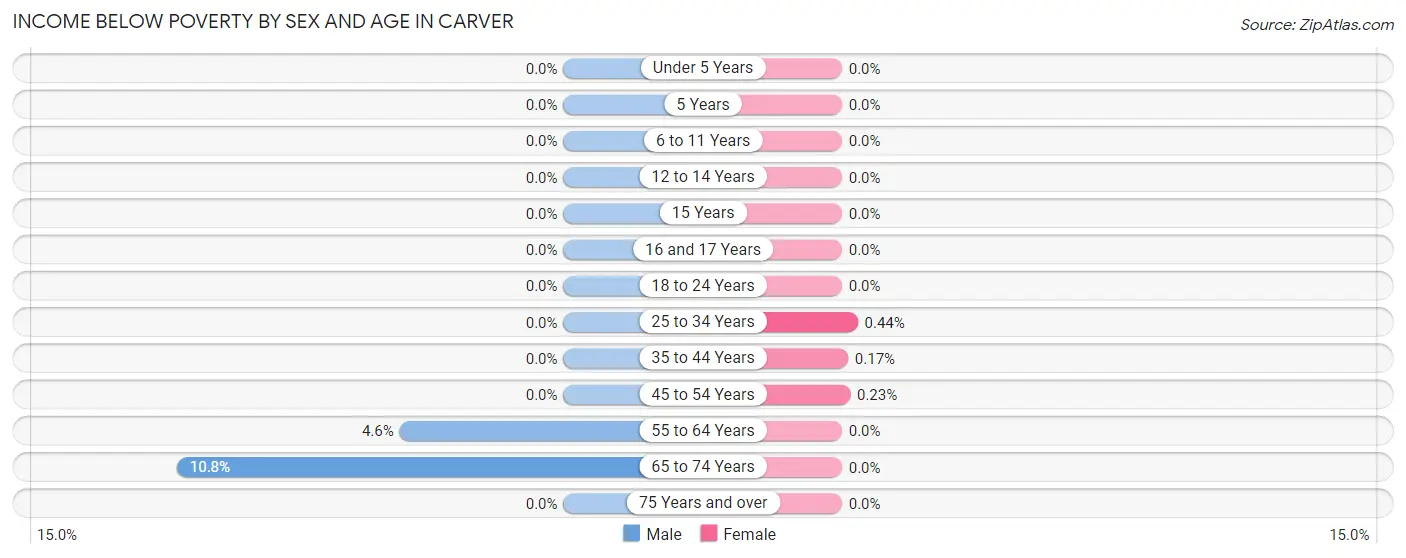
| Age Bracket | Male | Female |
| Under 5 Years | 0 (0.0%) | 0 (0.0%) |
| 5 Years | 0 (0.0%) | 0 (0.0%) |
| 6 to 11 Years | 0 (0.0%) | 0 (0.0%) |
| 12 to 14 Years | 0 (0.0%) | 0 (0.0%) |
| 15 Years | 0 (0.0%) | 0 (0.0%) |
| 16 and 17 Years | 0 (0.0%) | 0 (0.0%) |
| 18 to 24 Years | 0 (0.0%) | 0 (0.0%) |
| 25 to 34 Years | 0 (0.0%) | 1 (0.4%) |
| 35 to 44 Years | 0 (0.0%) | 1 (0.2%) |
| 45 to 54 Years | 0 (0.0%) | 1 (0.2%) |
| 55 to 64 Years | 19 (4.6%) | 0 (0.0%) |
| 65 to 74 Years | 17 (10.8%) | 0 (0.0%) |
| 75 Years and over | 0 (0.0%) | 0 (0.0%) |
| Total | 36 (1.3%) | 3 (0.1%) |
Income Above Poverty by Sex and Age in Carver
According to the poverty statistics in Carver, males aged under 5 years and females aged under 5 years are the age groups that are most secure financially, with 100.0% of males and 100.0% of females in these age groups living above the poverty line.
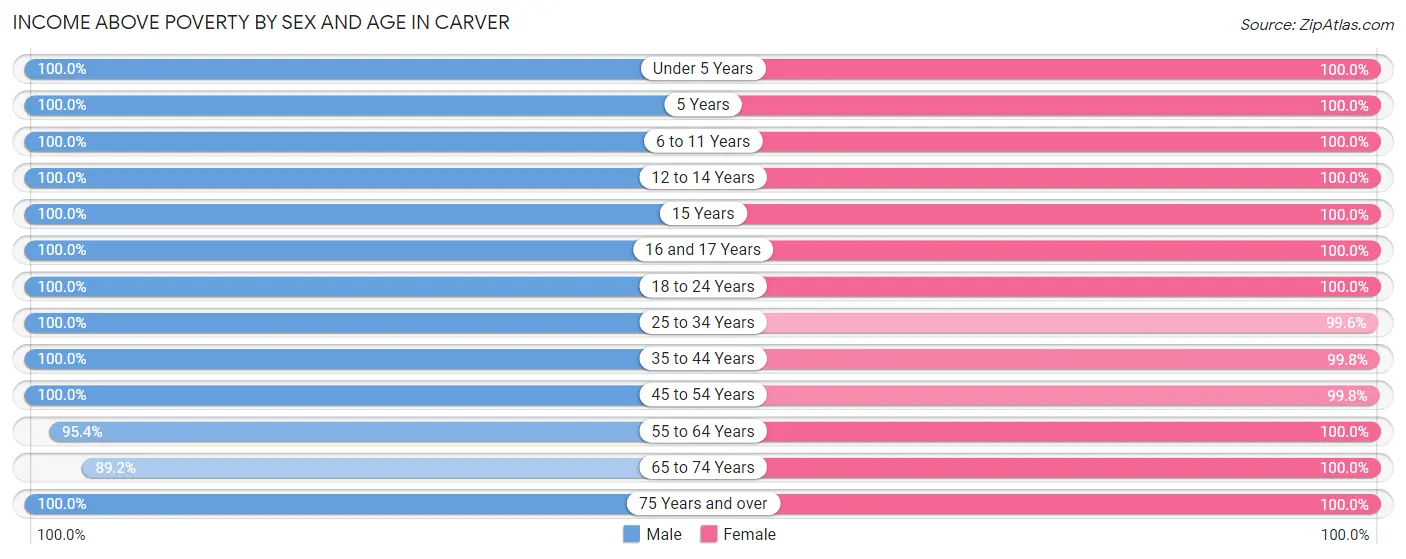
| Age Bracket | Male | Female |
| Under 5 Years | 114 (100.0%) | 136 (100.0%) |
| 5 Years | 13 (100.0%) | 72 (100.0%) |
| 6 to 11 Years | 405 (100.0%) | 333 (100.0%) |
| 12 to 14 Years | 163 (100.0%) | 51 (100.0%) |
| 15 Years | 67 (100.0%) | 64 (100.0%) |
| 16 and 17 Years | 111 (100.0%) | 164 (100.0%) |
| 18 to 24 Years | 276 (100.0%) | 186 (100.0%) |
| 25 to 34 Years | 292 (100.0%) | 224 (99.6%) |
| 35 to 44 Years | 436 (100.0%) | 590 (99.8%) |
| 45 to 54 Years | 392 (100.0%) | 441 (99.8%) |
| 55 to 64 Years | 398 (95.4%) | 238 (100.0%) |
| 65 to 74 Years | 141 (89.2%) | 151 (100.0%) |
| 75 Years and over | 9 (100.0%) | 150 (100.0%) |
| Total | 2,817 (98.7%) | 2,800 (99.9%) |
Income Below Poverty Among Married-Couple Families in Carver
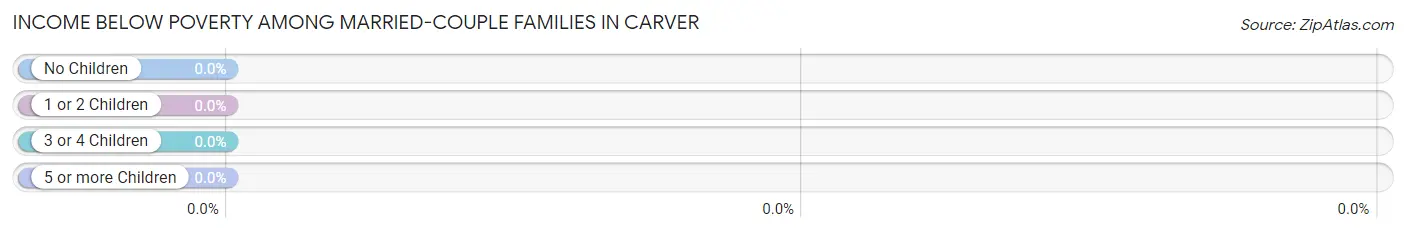
| Children | Above Poverty | Below Poverty |
| No Children | 515 (100.0%) | 0 (0.0%) |
| 1 or 2 Children | 662 (100.0%) | 0 (0.0%) |
| 3 or 4 Children | 128 (100.0%) | 0 (0.0%) |
| 5 or more Children | 18 (100.0%) | 0 (0.0%) |
| Total | 1,323 (100.0%) | 0 (0.0%) |
Income Below Poverty Among Single-Parent Households in Carver
| Children | Single Father | Single Mother |
| No Children | 0 (0.0%) | 0 (0.0%) |
| 1 or 2 Children | 0 (0.0%) | 0 (0.0%) |
| 3 or 4 Children | 0 (0.0%) | 0 (0.0%) |
| 5 or more Children | 0 (0.0%) | 0 (0.0%) |
| Total | 0 (0.0%) | 0 (0.0%) |
Income Below Poverty Among Married-Couple vs Single-Parent Households in Carver
| Children | Married-Couple Families | Single-Parent Households |
| No Children | 0 (0.0%) | 0 (0.0%) |
| 1 or 2 Children | 0 (0.0%) | 0 (0.0%) |
| 3 or 4 Children | 0 (0.0%) | 0 (0.0%) |
| 5 or more Children | 0 (0.0%) | 0 (0.0%) |
| Total | 0 (0.0%) | 0 (0.0%) |
Race in Carver
The most populous races in Carver are White / Caucasian (5,168 | 91.4%), Asian (250 | 4.4%), and Two or more Races (238 | 4.2%).
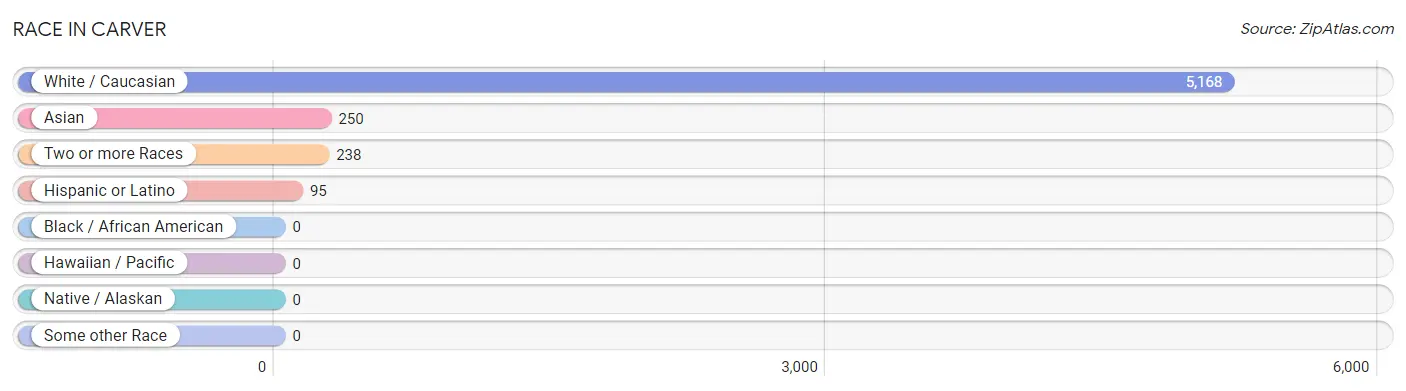
| Race | # Population | % Population |
| Asian | 250 | 4.4% |
| Black / African American | 0 | 0.0% |
| Hawaiian / Pacific | 0 | 0.0% |
| Hispanic or Latino | 95 | 1.7% |
| Native / Alaskan | 0 | 0.0% |
| White / Caucasian | 5,168 | 91.4% |
| Two or more Races | 238 | 4.2% |
| Some other Race | 0 | 0.0% |
| Total | 5,656 | 100.0% |
Ancestry in Carver
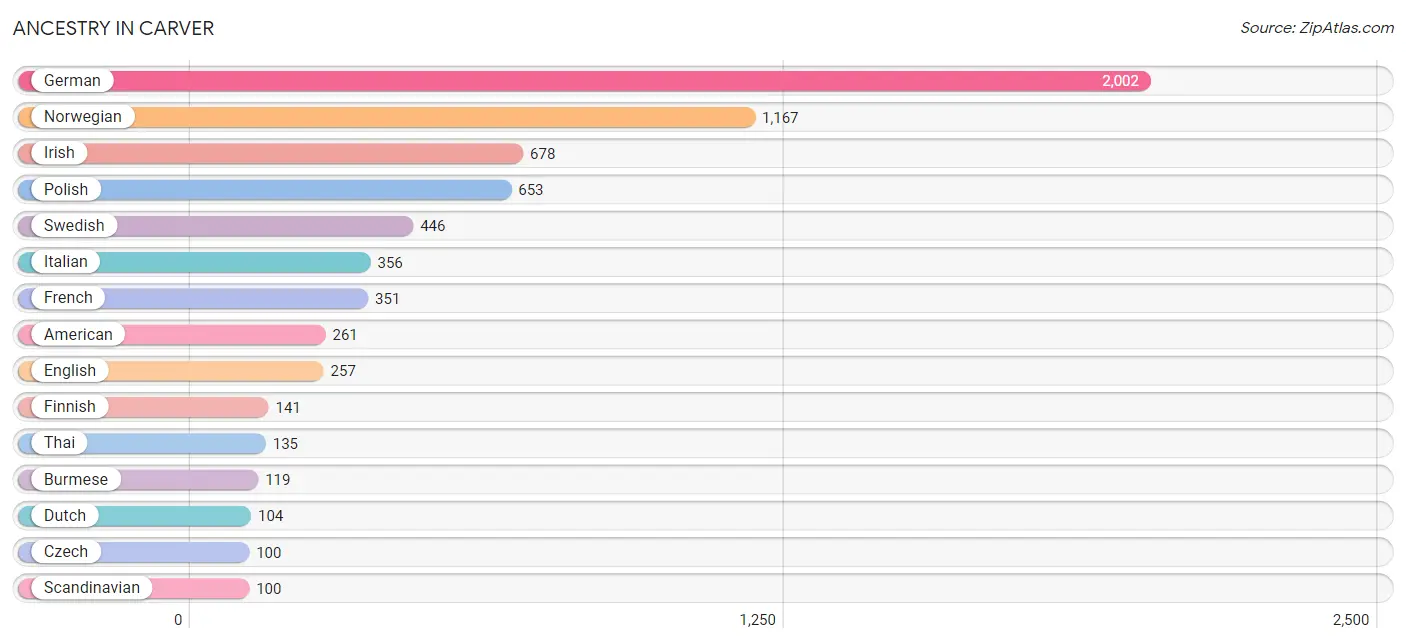
The most populous ancestries reported in Carver are German (2,002 | 35.4%), Norwegian (1,167 | 20.6%), Irish (678 | 12.0%), Polish (653 | 11.6%), and Swedish (446 | 7.9%), together accounting for 87.5% of all Carver residents.
| Ancestry | # Population | % Population |
| African | 76 | 1.3% |
| American | 261 | 4.6% |
| Belgian | 51 | 0.9% |
| Bhutanese | 41 | 0.7% |
| British | 52 | 0.9% |
| Burmese | 119 | 2.1% |
| Chippewa | 11 | 0.2% |
| Czech | 100 | 1.8% |
| Danish | 11 | 0.2% |
| Dutch | 104 | 1.8% |
| English | 257 | 4.5% |
| European | 76 | 1.3% |
| Finnish | 141 | 2.5% |
| French | 351 | 6.2% |
| French Canadian | 31 | 0.5% |
| German | 2,002 | 35.4% |
| Irish | 678 | 12.0% |
| Italian | 356 | 6.3% |
| Japanese | 46 | 0.8% |
| Mexican | 95 | 1.7% |
| Northern European | 12 | 0.2% |
| Norwegian | 1,167 | 20.6% |
| Pakistani | 2 | 0.0% |
| Polish | 653 | 11.6% |
| Russian | 50 | 0.9% |
| Scandinavian | 100 | 1.8% |
| Scottish | 29 | 0.5% |
| Subsaharan African | 76 | 1.3% |
| Swedish | 446 | 7.9% |
| Thai | 135 | 2.4% |
| Welsh | 24 | 0.4% | View All 31 Rows |
Immigrants in Carver
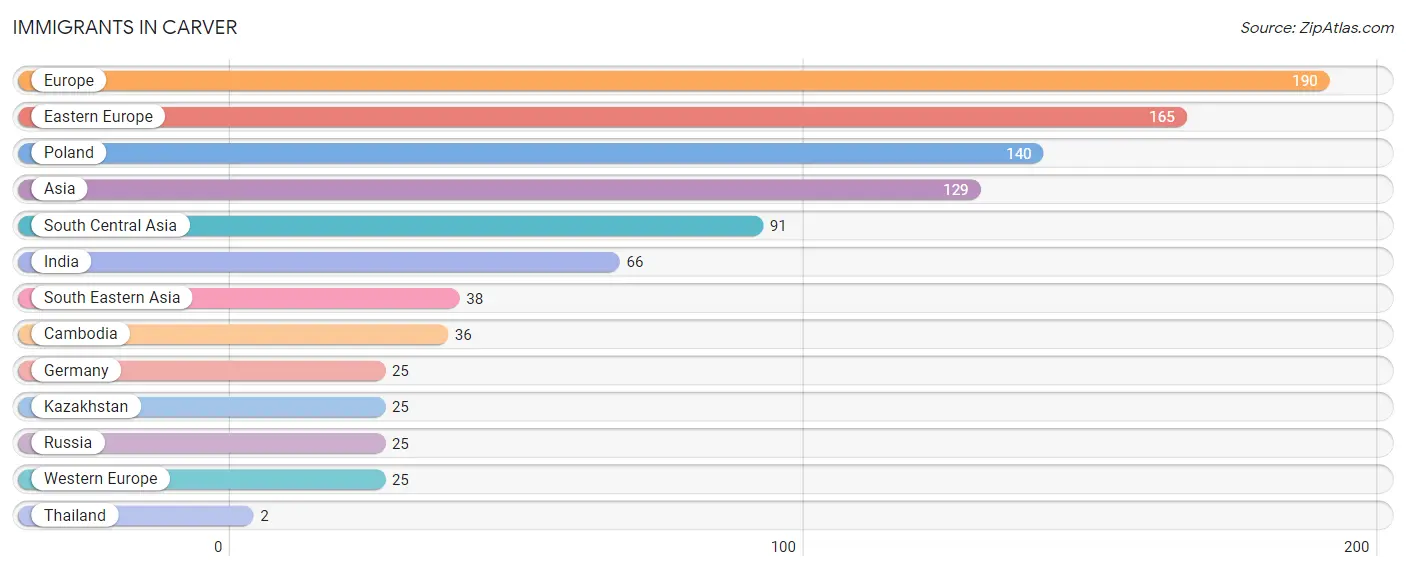
The most numerous immigrant groups reported in Carver came from Europe (190 | 3.4%), Eastern Europe (165 | 2.9%), Poland (140 | 2.5%), Asia (129 | 2.3%), and South Central Asia (91 | 1.6%), together accounting for 12.7% of all Carver residents.
| Immigration Origin | # Population | % Population |
| Asia | 129 | 2.3% |
| Cambodia | 36 | 0.6% |
| Eastern Europe | 165 | 2.9% |
| Europe | 190 | 3.4% |
| Germany | 25 | 0.4% |
| India | 66 | 1.2% |
| Kazakhstan | 25 | 0.4% |
| Poland | 140 | 2.5% |
| Russia | 25 | 0.4% |
| South Central Asia | 91 | 1.6% |
| South Eastern Asia | 38 | 0.7% |
| Thailand | 2 | 0.0% |
| Western Europe | 25 | 0.4% | View All 13 Rows |
Sex and Age in Carver
Sex and Age in Carver
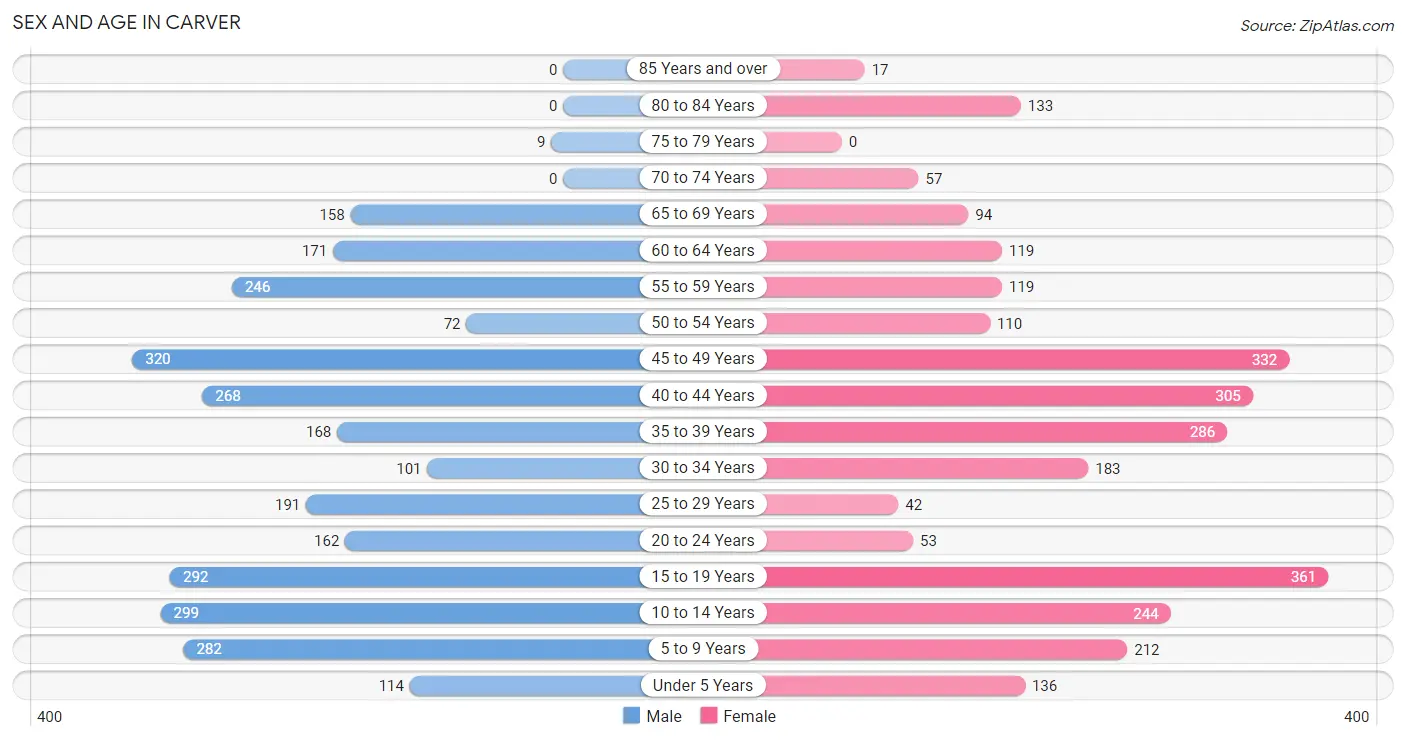
The most populous age groups in Carver are 45 to 49 Years (320 | 11.2%) for men and 15 to 19 Years (361 | 12.9%) for women.
| Age Bracket | Male | Female |
| Under 5 Years | 114 (4.0%) | 136 (4.9%) |
| 5 to 9 Years | 282 (9.9%) | 212 (7.6%) |
| 10 to 14 Years | 299 (10.5%) | 244 (8.7%) |
| 15 to 19 Years | 292 (10.2%) | 361 (12.9%) |
| 20 to 24 Years | 162 (5.7%) | 53 (1.9%) |
| 25 to 29 Years | 191 (6.7%) | 42 (1.5%) |
| 30 to 34 Years | 101 (3.5%) | 183 (6.5%) |
| 35 to 39 Years | 168 (5.9%) | 286 (10.2%) |
| 40 to 44 Years | 268 (9.4%) | 305 (10.9%) |
| 45 to 49 Years | 320 (11.2%) | 332 (11.8%) |
| 50 to 54 Years | 72 (2.5%) | 110 (3.9%) |
| 55 to 59 Years | 246 (8.6%) | 119 (4.3%) |
| 60 to 64 Years | 171 (6.0%) | 119 (4.3%) |
| 65 to 69 Years | 158 (5.5%) | 94 (3.4%) |
| 70 to 74 Years | 0 (0.0%) | 57 (2.0%) |
| 75 to 79 Years | 9 (0.3%) | 0 (0.0%) |
| 80 to 84 Years | 0 (0.0%) | 133 (4.7%) |
| 85 Years and over | 0 (0.0%) | 17 (0.6%) |
| Total | 2,853 (100.0%) | 2,803 (100.0%) |
Families and Households in Carver
Median Family Size in Carver
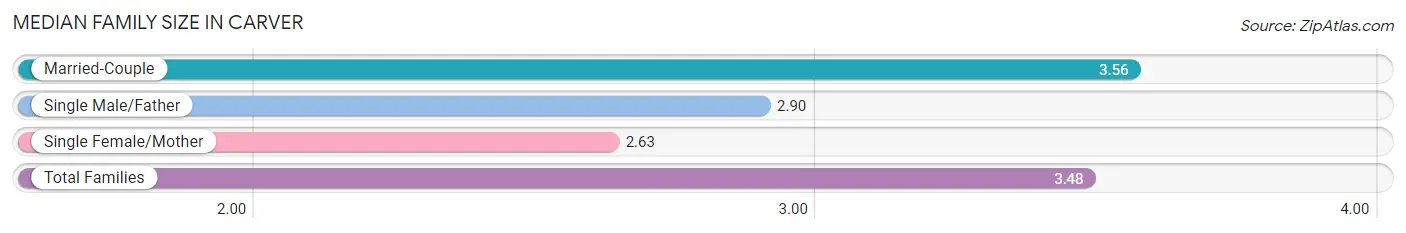
The median family size in Carver is 3.48 persons per family, with married-couple families (1,323 | 91.0%) accounting for the largest median family size of 3.56 persons per family. On the other hand, single female/mother families (90 | 6.2%) represent the smallest median family size with 2.63 persons per family.
| Family Type | # Families | Family Size |
| Married-Couple | 1,323 (91.0%) | 3.56 |
| Single Male/Father | 41 (2.8%) | 2.90 |
| Single Female/Mother | 90 (6.2%) | 2.63 |
| Total Families | 1,454 (100.0%) | 3.48 |
Median Household Size in Carver
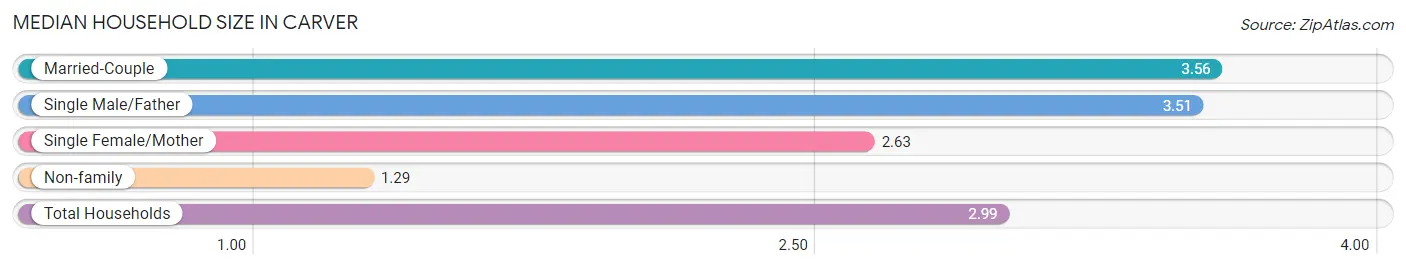
The median household size in Carver is 2.99 persons per household, with married-couple households (1,323 | 70.0%) accounting for the largest median household size of 3.56 persons per household. non-family households (437 | 23.1%) represent the smallest median household size with 1.29 persons per household.
| Household Type | # Households | Household Size |
| Married-Couple | 1,323 (70.0%) | 3.56 |
| Single Male/Father | 41 (2.2%) | 3.51 |
| Single Female/Mother | 90 (4.8%) | 2.63 |
| Non-family | 437 (23.1%) | 1.29 |
| Total Households | 1,891 (100.0%) | 2.99 |
Household Size by Marriage Status in Carver
Out of a total of 1,891 households in Carver, 1,454 (76.9%) are family households, while 437 (23.1%) are nonfamily households. The most numerous type of family households are 4-person households, comprising 673, and the most common type of nonfamily households are 1-person households, comprising 355.
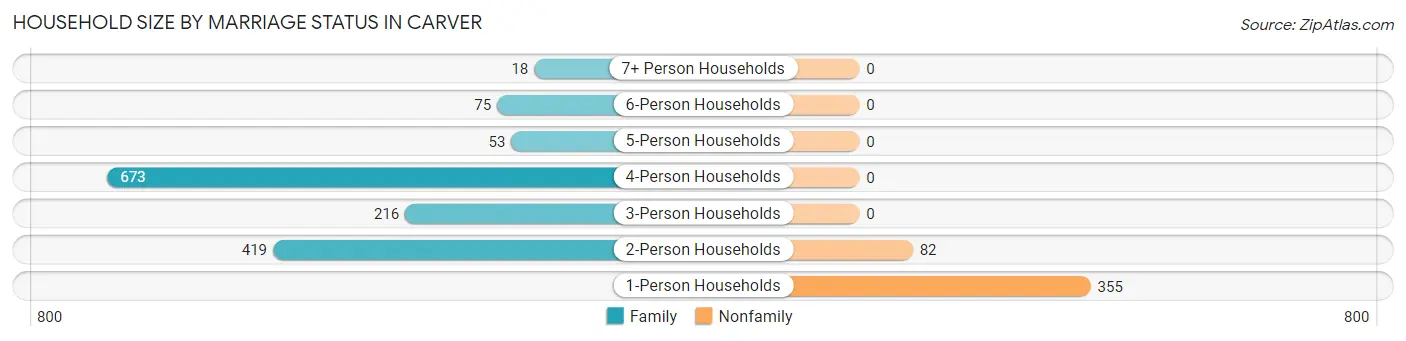
| Household Size | Family Households | Nonfamily Households |
| 1-Person Households | - | 355 (18.8%) |
| 2-Person Households | 419 (22.2%) | 82 (4.3%) |
| 3-Person Households | 216 (11.4%) | 0 (0.0%) |
| 4-Person Households | 673 (35.6%) | 0 (0.0%) |
| 5-Person Households | 53 (2.8%) | 0 (0.0%) |
| 6-Person Households | 75 (4.0%) | 0 (0.0%) |
| 7+ Person Households | 18 (0.9%) | 0 (0.0%) |
| Total | 1,454 (76.9%) | 437 (23.1%) |
Female Fertility in Carver
Fertility by Age in Carver
Average fertility rate in Carver is 18.0 births per 1,000 women. Women in the age bracket of 20 to 34 years have the highest fertility rate with 47.0 births per 1,000 women. Women in the age bracket of 35 to 50 years acount for 55.2% of all women with births.
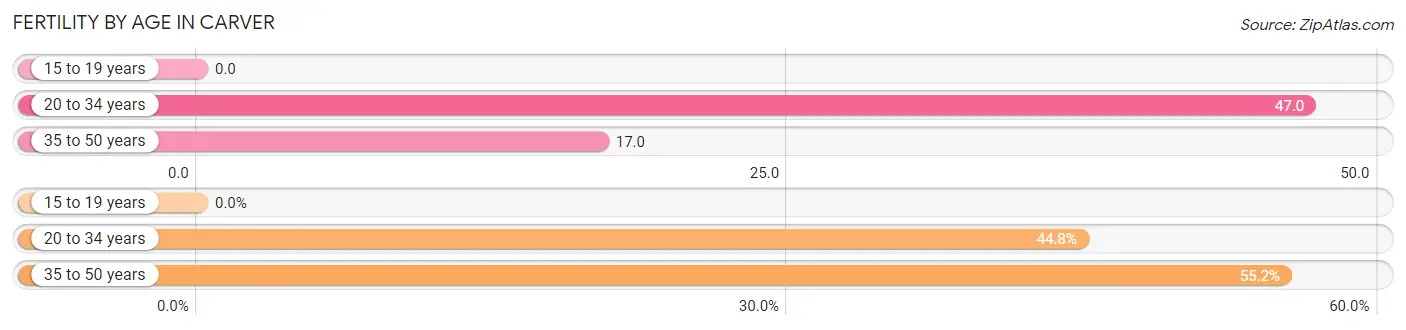
| Age Bracket | Women with Births | Births / 1,000 Women |
| 15 to 19 years | 0 (0.0%) | 0.0 |
| 20 to 34 years | 13 (44.8%) | 47.0 |
| 35 to 50 years | 16 (55.2%) | 17.0 |
| Total | 29 (100.0%) | 18.0 |
Fertility by Age by Marriage Status in Carver
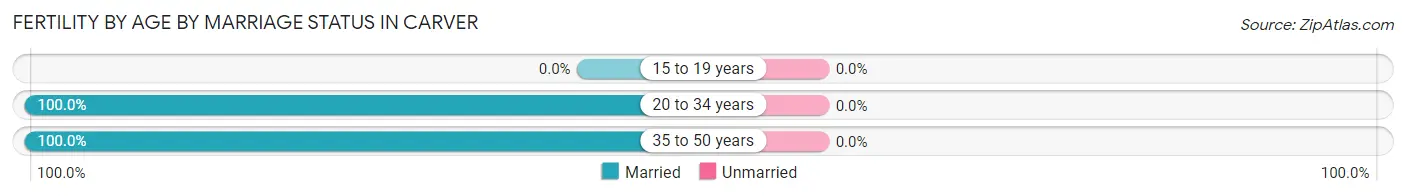
| Age Bracket | Married | Unmarried |
| 15 to 19 years | 0 (0.0%) | 0 (0.0%) |
| 20 to 34 years | 13 (100.0%) | 0 (0.0%) |
| 35 to 50 years | 16 (100.0%) | 0 (0.0%) |
| Total | 29 (100.0%) | 0 (0.0%) |
Fertility by Education in Carver
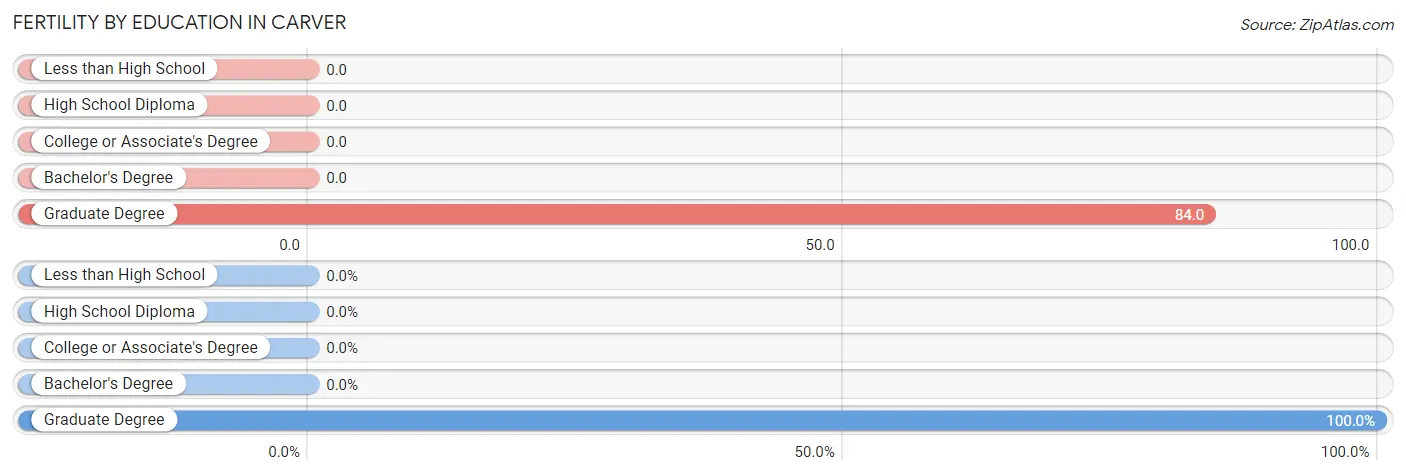
| Educational Attainment | Women with Births | Births / 1,000 Women |
| Less than High School | 0 (0.0%) | 0.0 |
| High School Diploma | 0 (0.0%) | 0.0 |
| College or Associate's Degree | 0 (0.0%) | 0.0 |
| Bachelor's Degree | 0 (0.0%) | 0.0 |
| Graduate Degree | 29 (100.0%) | 84.0 |
| Total | 29 (100.0%) | 18.0 |
Fertility by Education by Marriage Status in Carver
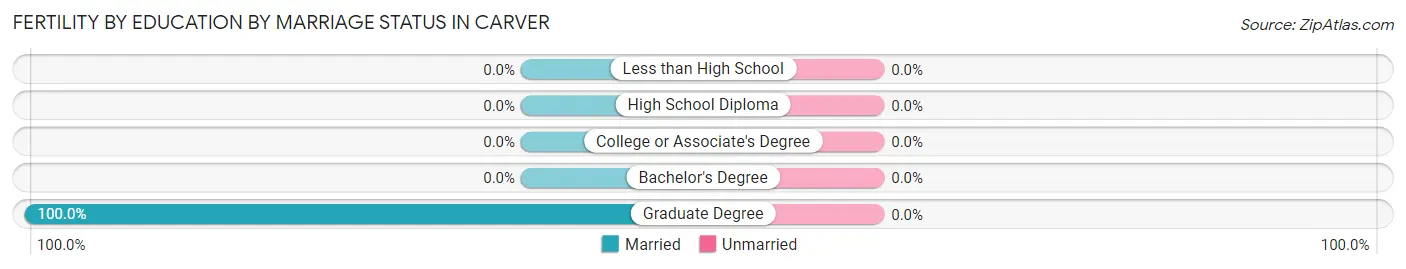
| Educational Attainment | Married | Unmarried |
| Less than High School | 0 (0.0%) | 0 (0.0%) |
| High School Diploma | 0 (0.0%) | 0 (0.0%) |
| College or Associate's Degree | 0 (0.0%) | 0 (0.0%) |
| Bachelor's Degree | 0 (0.0%) | 0 (0.0%) |
| Graduate Degree | 29 (100.0%) | 0 (0.0%) |
| Total | 29 (100.0%) | 0 (0.0%) |
Employment Characteristics in Carver
Employment by Class of Employer in Carver
Among the 3,007 employed individuals in Carver, private company employees (2,042 | 67.9%), local government employees (387 | 12.9%), and not-for-profit organizations (166 | 5.5%) make up the most common classes of employment.
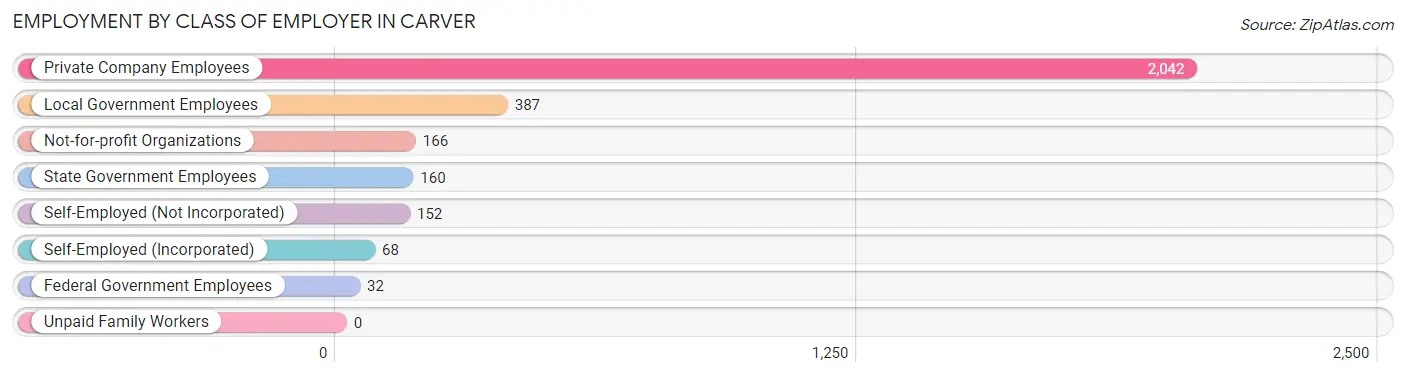
| Employer Class | # Employees | % Employees |
| Private Company Employees | 2,042 | 67.9% |
| Self-Employed (Incorporated) | 68 | 2.3% |
| Self-Employed (Not Incorporated) | 152 | 5.1% |
| Not-for-profit Organizations | 166 | 5.5% |
| Local Government Employees | 387 | 12.9% |
| State Government Employees | 160 | 5.3% |
| Federal Government Employees | 32 | 1.1% |
| Unpaid Family Workers | 0 | 0.0% |
| Total | 3,007 | 100.0% |
Employment Status by Age in Carver
According to the labor force statistics for Carver, out of the total population over 16 years of age (4,238), 75.1% or 3,183 individuals are in the labor force, with 5.5% or 175 of them unemployed. The age group with the highest labor force participation rate is 25 to 29 years, with 99.6% or 232 individuals in the labor force. Within the labor force, the 20 to 24 years age range has the highest percentage of unemployed individuals, with 52.7% or 69 of them being unemployed.
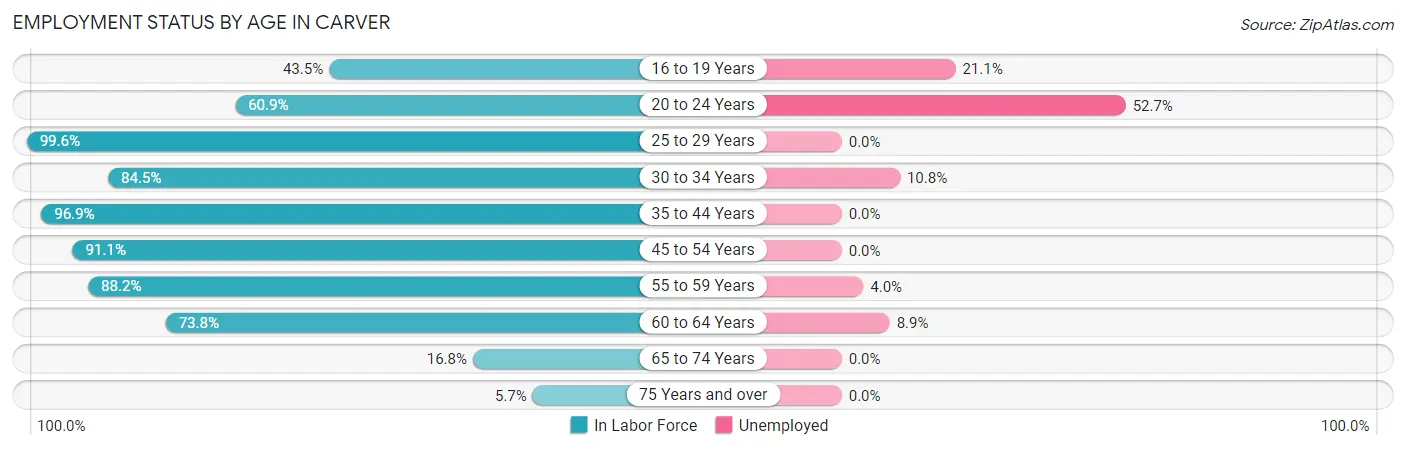
| Age Bracket | In Labor Force | Unemployed |
| 16 to 19 Years | 227 (43.5%) | 48 (21.1%) |
| 20 to 24 Years | 131 (60.9%) | 69 (52.7%) |
| 25 to 29 Years | 232 (99.6%) | 0 (0.0%) |
| 30 to 34 Years | 240 (84.5%) | 26 (10.8%) |
| 35 to 44 Years | 995 (96.9%) | 0 (0.0%) |
| 45 to 54 Years | 760 (91.1%) | 0 (0.0%) |
| 55 to 59 Years | 322 (88.2%) | 13 (4.0%) |
| 60 to 64 Years | 214 (73.8%) | 19 (8.9%) |
| 65 to 74 Years | 52 (16.8%) | 0 (0.0%) |
| 75 Years and over | 9 (5.7%) | 0 (0.0%) |
| Total | 3,183 (75.1%) | 175 (5.5%) |
Employment Status by Educational Attainment in Carver
According to labor force statistics for Carver, 91.1% of individuals (2,763) out of the total population between 25 and 64 years of age (3,033) are in the labor force, with 2.1% or 58 of them being unemployed. The group with the highest labor force participation rate are those with the educational attainment of high school diploma, with 98.6% or 292 individuals in the labor force. Within the labor force, individuals with college / associate degree education have the highest percentage of unemployment, with 6.1% or 39 of them being unemployed.
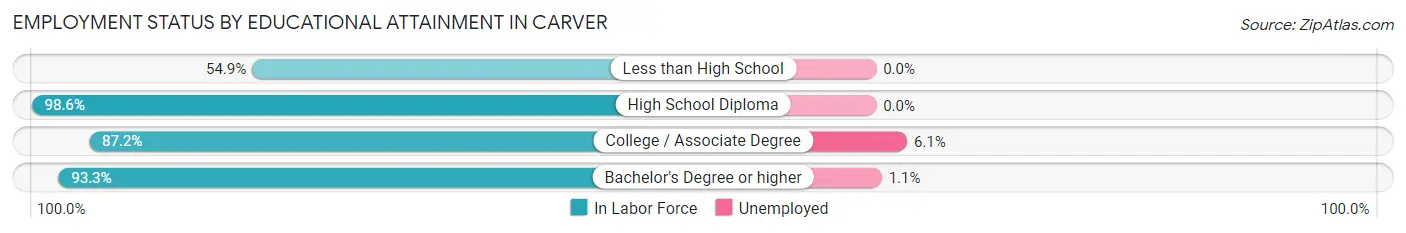
| Educational Attainment | In Labor Force | Unemployed |
| Less than High School | 56 (54.9%) | 0 (0.0%) |
| High School Diploma | 292 (98.6%) | 0 (0.0%) |
| College / Associate Degree | 636 (87.2%) | 44 (6.1%) |
| Bachelor's Degree or higher | 1,778 (93.3%) | 21 (1.1%) |
| Total | 2,763 (91.1%) | 64 (2.1%) |
Employment Occupations by Sex in Carver
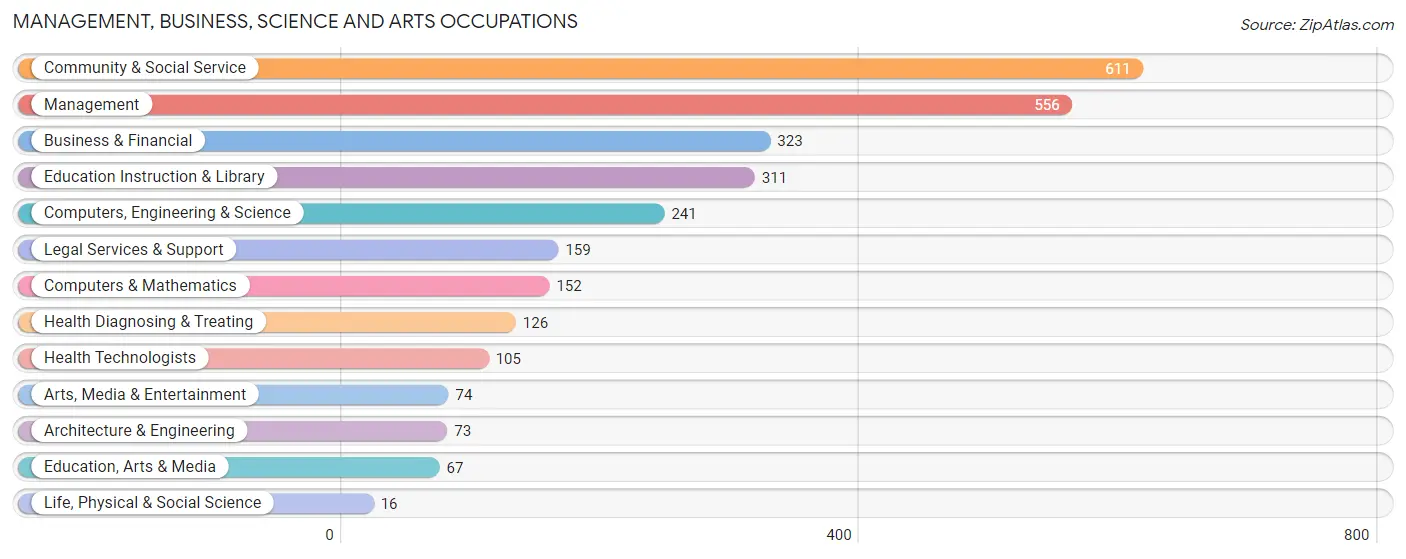
Management, Business, Science and Arts Occupations
The most common Management, Business, Science and Arts occupations in Carver are Community & Social Service (611 | 20.3%), Management (556 | 18.5%), Business & Financial (323 | 10.7%), Education Instruction & Library (311 | 10.3%), and Computers, Engineering & Science (241 | 8.0%).
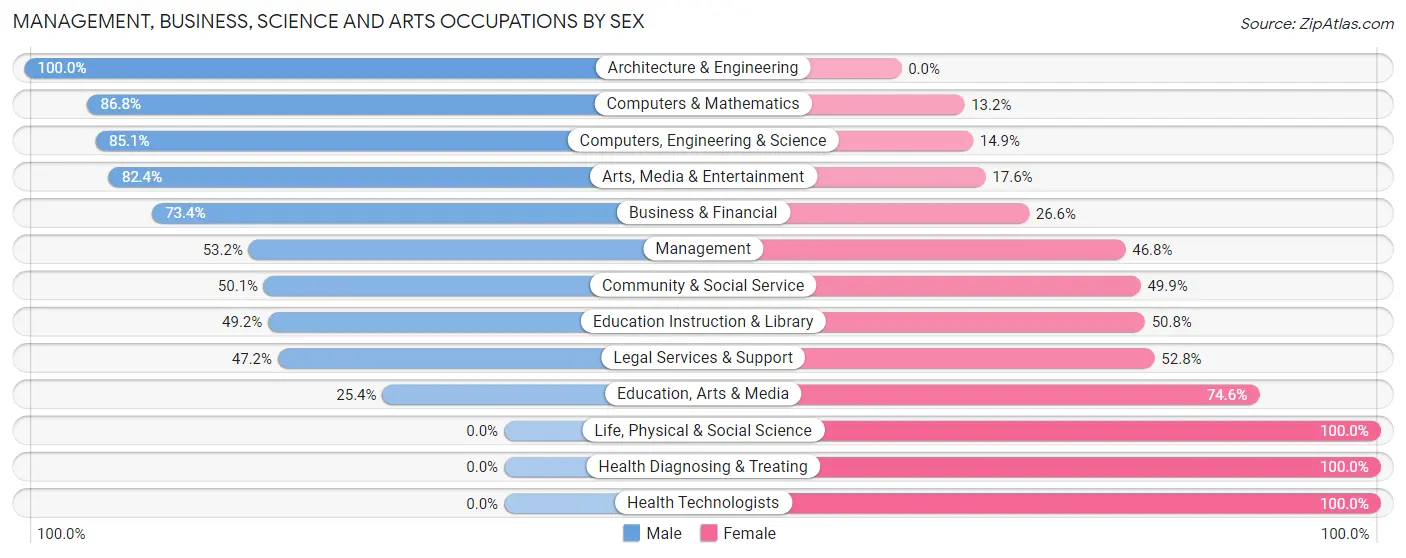
Management, Business, Science and Arts Occupations by Sex
Within the Management, Business, Science and Arts occupations in Carver, the most male-oriented occupations are Architecture & Engineering (100.0%), Computers & Mathematics (86.8%), and Computers, Engineering & Science (85.1%), while the most female-oriented occupations are Life, Physical & Social Science (100.0%), Health Diagnosing & Treating (100.0%), and Health Technologists (100.0%).
| Occupation | Male | Female |
| Management | 296 (53.2%) | 260 (46.8%) |
| Business & Financial | 237 (73.4%) | 86 (26.6%) |
| Computers, Engineering & Science | 205 (85.1%) | 36 (14.9%) |
| Computers & Mathematics | 132 (86.8%) | 20 (13.2%) |
| Architecture & Engineering | 73 (100.0%) | 0 (0.0%) |
| Life, Physical & Social Science | 0 (0.0%) | 16 (100.0%) |
| Community & Social Service | 306 (50.1%) | 305 (49.9%) |
| Education, Arts & Media | 17 (25.4%) | 50 (74.6%) |
| Legal Services & Support | 75 (47.2%) | 84 (52.8%) |
| Education Instruction & Library | 153 (49.2%) | 158 (50.8%) |
| Arts, Media & Entertainment | 61 (82.4%) | 13 (17.6%) |
| Health Diagnosing & Treating | 0 (0.0%) | 126 (100.0%) |
| Health Technologists | 0 (0.0%) | 105 (100.0%) |
| Total (Category) | 1,044 (56.2%) | 813 (43.8%) |
| Total (Overall) | 1,568 (52.1%) | 1,439 (47.9%) |
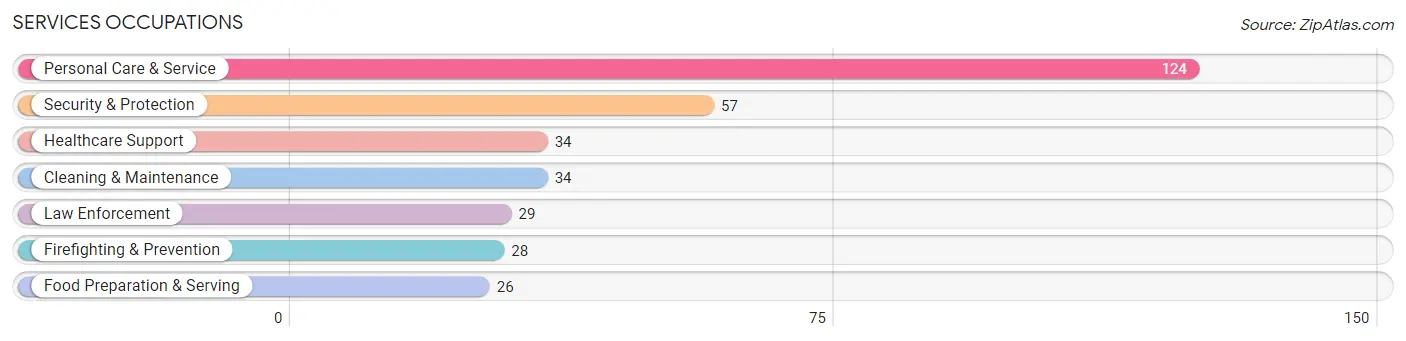
Services Occupations
The most common Services occupations in Carver are Personal Care & Service (124 | 4.1%), Security & Protection (57 | 1.9%), Healthcare Support (34 | 1.1%), Cleaning & Maintenance (34 | 1.1%), and Law Enforcement (29 | 1.0%).
Services Occupations by Sex
Within the Services occupations in Carver, the most male-oriented occupations are Security & Protection (100.0%), Firefighting & Prevention (100.0%), and Law Enforcement (100.0%), while the most female-oriented occupations are Healthcare Support (100.0%), Food Preparation & Serving (100.0%), and Personal Care & Service (75.0%).

| Occupation | Male | Female |
| Healthcare Support | 0 (0.0%) | 34 (100.0%) |
| Security & Protection | 57 (100.0%) | 0 (0.0%) |
| Firefighting & Prevention | 28 (100.0%) | 0 (0.0%) |
| Law Enforcement | 29 (100.0%) | 0 (0.0%) |
| Food Preparation & Serving | 0 (0.0%) | 26 (100.0%) |
| Cleaning & Maintenance | 34 (100.0%) | 0 (0.0%) |
| Personal Care & Service | 31 (25.0%) | 93 (75.0%) |
| Total (Category) | 122 (44.4%) | 153 (55.6%) |
| Total (Overall) | 1,568 (52.1%) | 1,439 (47.9%) |
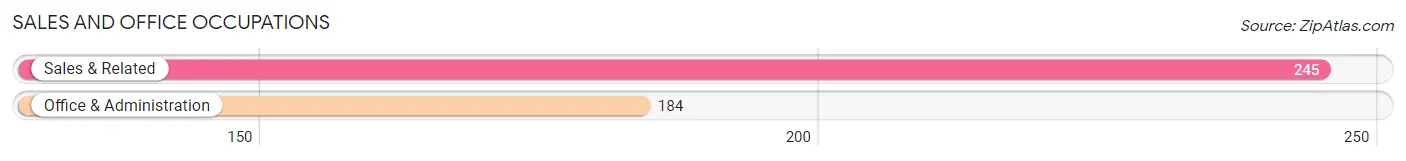
Sales and Office Occupations
The most common Sales and Office occupations in Carver are Sales & Related (245 | 8.2%), and Office & Administration (184 | 6.1%).
Sales and Office Occupations by Sex
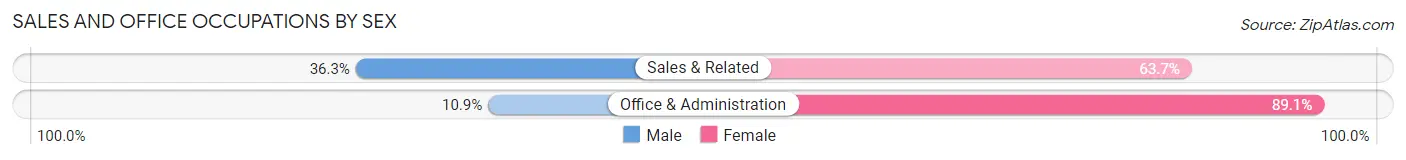
| Occupation | Male | Female |
| Sales & Related | 89 (36.3%) | 156 (63.7%) |
| Office & Administration | 20 (10.9%) | 164 (89.1%) |
| Total (Category) | 109 (25.4%) | 320 (74.6%) |
| Total (Overall) | 1,568 (52.1%) | 1,439 (47.9%) |
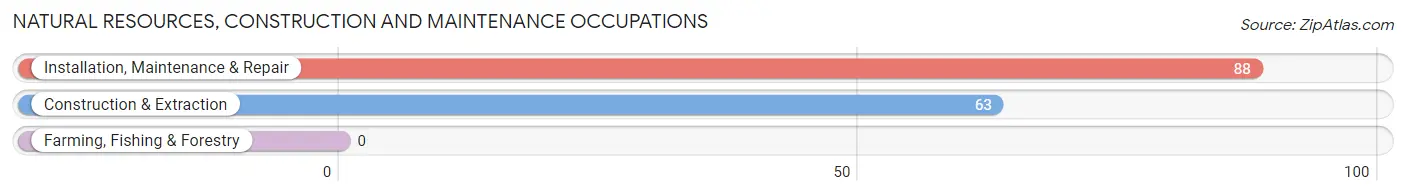
Natural Resources, Construction and Maintenance Occupations
The most common Natural Resources, Construction and Maintenance occupations in Carver are Installation, Maintenance & Repair (88 | 2.9%), and Construction & Extraction (63 | 2.1%).
Natural Resources, Construction and Maintenance Occupations by Sex
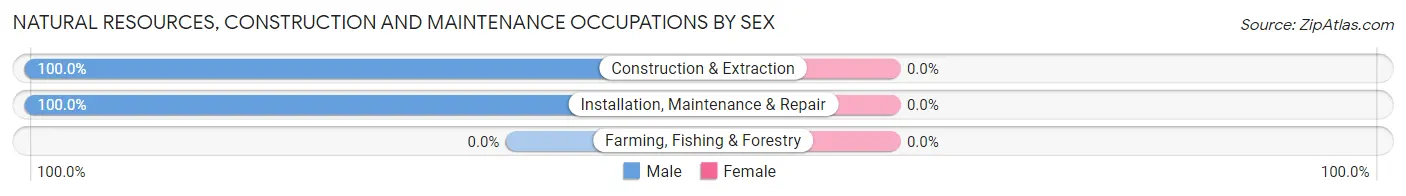
| Occupation | Male | Female |
| Farming, Fishing & Forestry | 0 (0.0%) | 0 (0.0%) |
| Construction & Extraction | 63 (100.0%) | 0 (0.0%) |
| Installation, Maintenance & Repair | 88 (100.0%) | 0 (0.0%) |
| Total (Category) | 151 (100.0%) | 0 (0.0%) |
| Total (Overall) | 1,568 (52.1%) | 1,439 (47.9%) |
Production, Transportation and Moving Occupations
The most common Production, Transportation and Moving occupations in Carver are Production (186 | 6.2%), Material Moving (64 | 2.1%), and Transportation (45 | 1.5%).
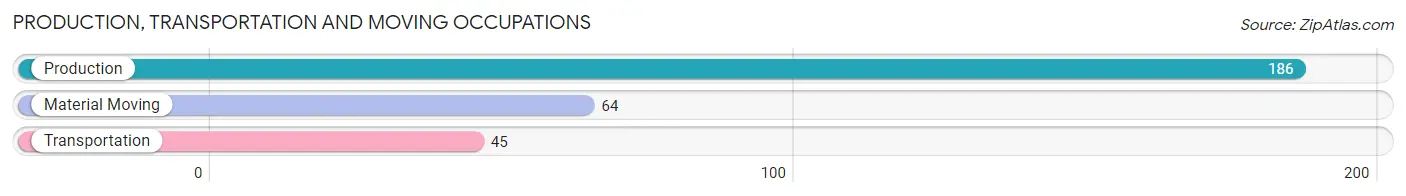
Production, Transportation and Moving Occupations by Sex
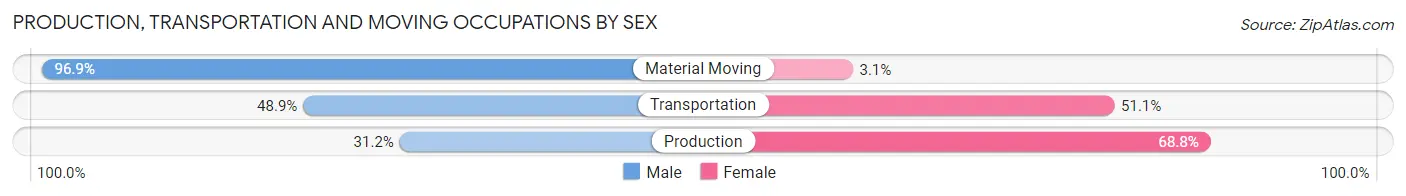
| Occupation | Male | Female |
| Production | 58 (31.2%) | 128 (68.8%) |
| Transportation | 22 (48.9%) | 23 (51.1%) |
| Material Moving | 62 (96.9%) | 2 (3.1%) |
| Total (Category) | 142 (48.1%) | 153 (51.9%) |
| Total (Overall) | 1,568 (52.1%) | 1,439 (47.9%) |
Employment Industries by Sex in Carver
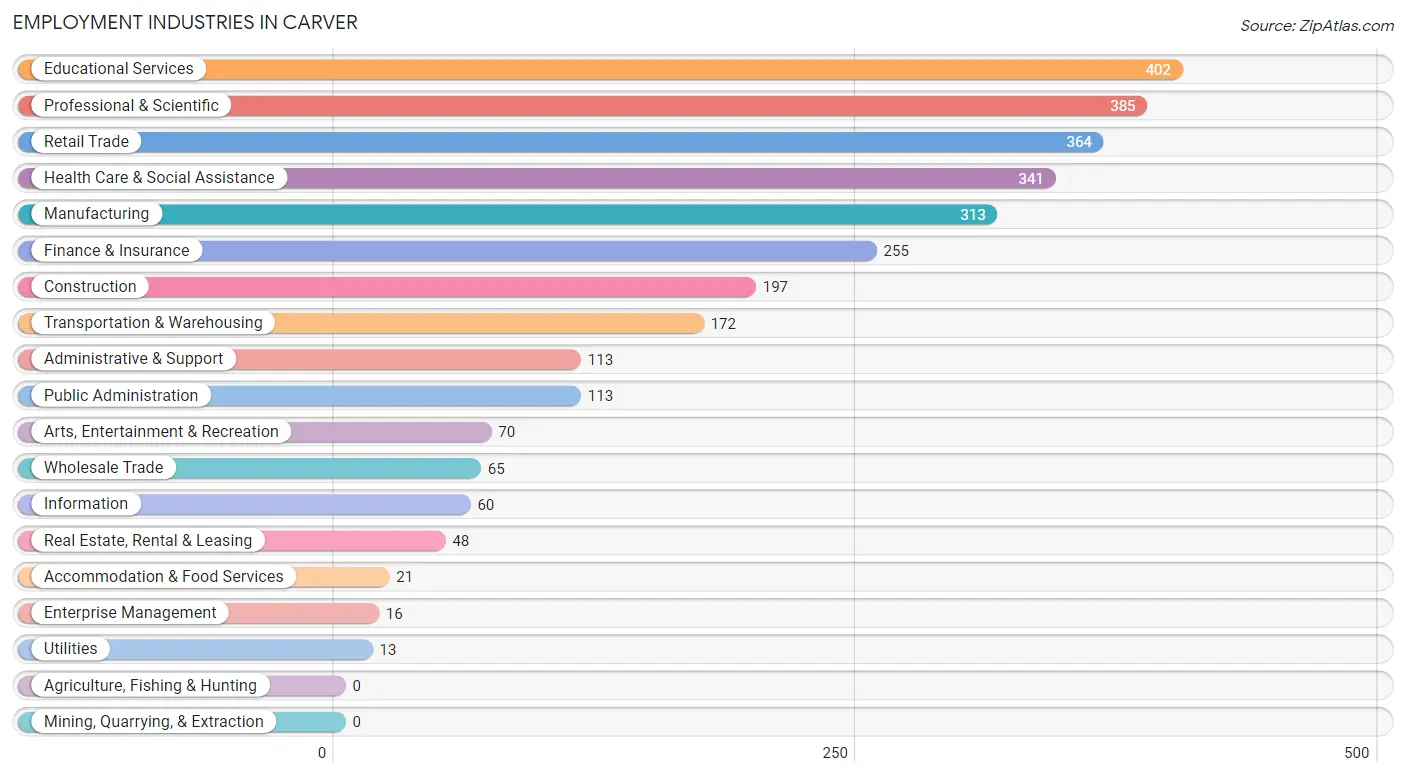
Employment Industries in Carver
The major employment industries in Carver include Educational Services (402 | 13.4%), Professional & Scientific (385 | 12.8%), Retail Trade (364 | 12.1%), Health Care & Social Assistance (341 | 11.3%), and Manufacturing (313 | 10.4%).
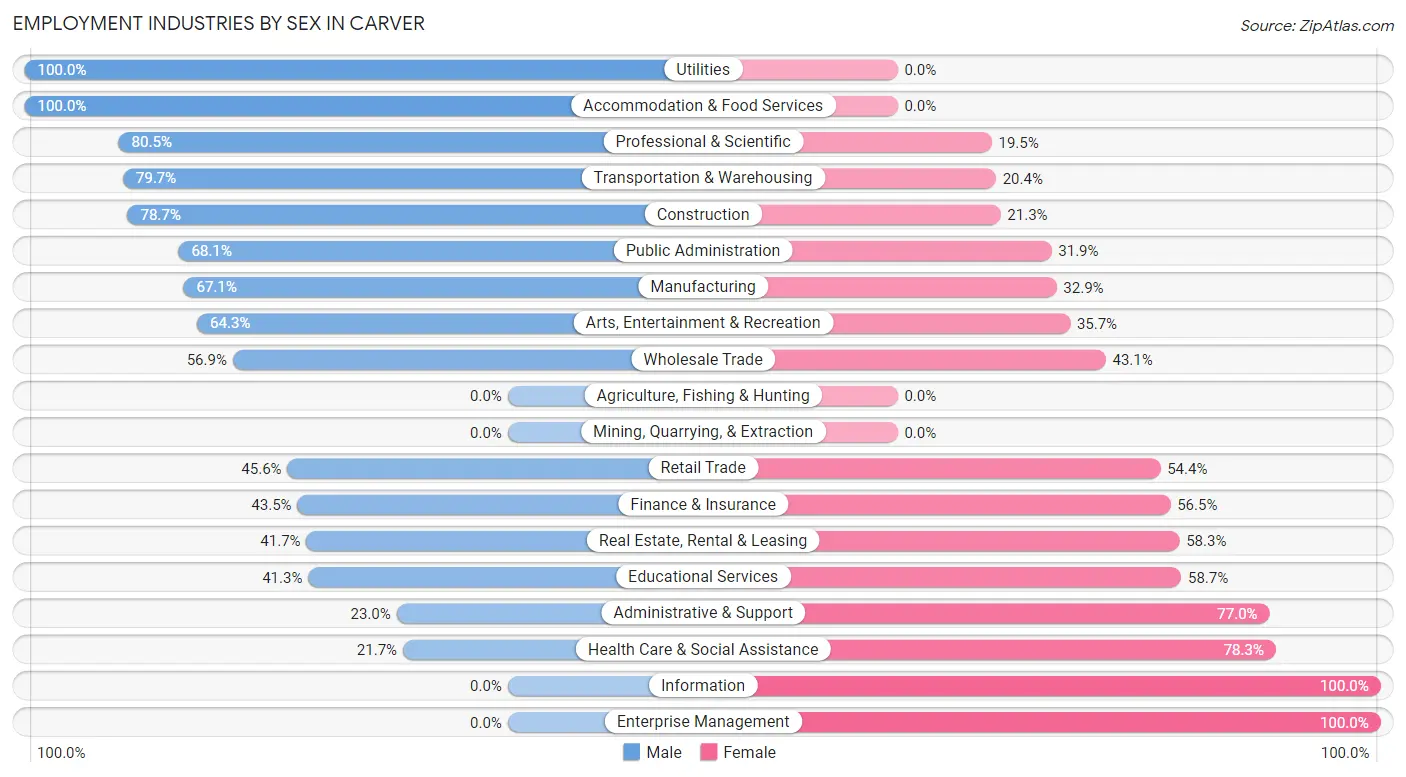
Employment Industries by Sex in Carver
The Carver industries that see more men than women are Utilities (100.0%), Accommodation & Food Services (100.0%), and Professional & Scientific (80.5%), whereas the industries that tend to have a higher number of women are Information (100.0%), Enterprise Management (100.0%), and Health Care & Social Assistance (78.3%).
| Industry | Male | Female |
| Agriculture, Fishing & Hunting | 0 (0.0%) | 0 (0.0%) |
| Mining, Quarrying, & Extraction | 0 (0.0%) | 0 (0.0%) |
| Construction | 155 (78.7%) | 42 (21.3%) |
| Manufacturing | 210 (67.1%) | 103 (32.9%) |
| Wholesale Trade | 37 (56.9%) | 28 (43.1%) |
| Retail Trade | 166 (45.6%) | 198 (54.4%) |
| Transportation & Warehousing | 137 (79.6%) | 35 (20.3%) |
| Utilities | 13 (100.0%) | 0 (0.0%) |
| Information | 0 (0.0%) | 60 (100.0%) |
| Finance & Insurance | 111 (43.5%) | 144 (56.5%) |
| Real Estate, Rental & Leasing | 20 (41.7%) | 28 (58.3%) |
| Professional & Scientific | 310 (80.5%) | 75 (19.5%) |
| Enterprise Management | 0 (0.0%) | 16 (100.0%) |
| Administrative & Support | 26 (23.0%) | 87 (77.0%) |
| Educational Services | 166 (41.3%) | 236 (58.7%) |
| Health Care & Social Assistance | 74 (21.7%) | 267 (78.3%) |
| Arts, Entertainment & Recreation | 45 (64.3%) | 25 (35.7%) |
| Accommodation & Food Services | 21 (100.0%) | 0 (0.0%) |
| Public Administration | 77 (68.1%) | 36 (31.9%) |
| Total | 1,568 (52.1%) | 1,439 (47.9%) |
Education in Carver
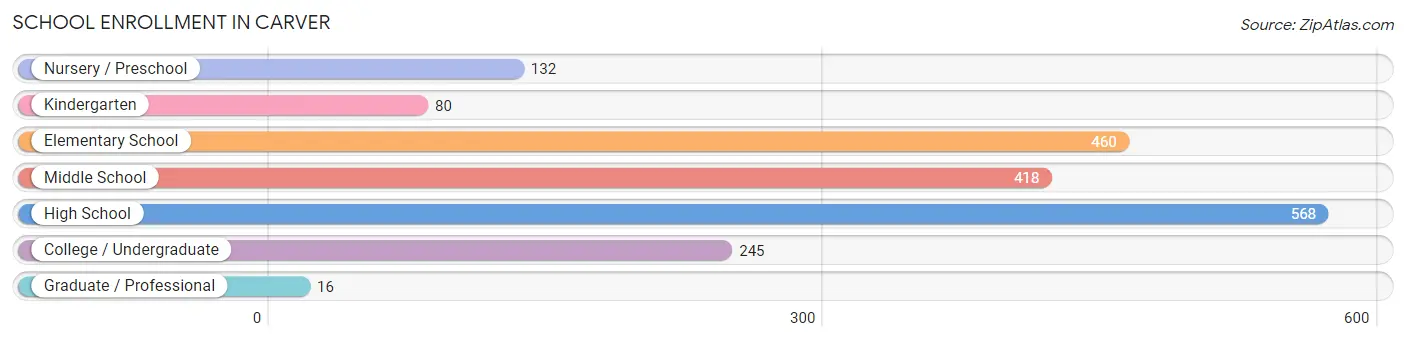
School Enrollment in Carver
The most common levels of schooling among the 1,919 students in Carver are high school (568 | 29.6%), elementary school (460 | 24.0%), and middle school (418 | 21.8%).
| School Level | # Students | % Students |
| Nursery / Preschool | 132 | 6.9% |
| Kindergarten | 80 | 4.2% |
| Elementary School | 460 | 24.0% |
| Middle School | 418 | 21.8% |
| High School | 568 | 29.6% |
| College / Undergraduate | 245 | 12.8% |
| Graduate / Professional | 16 | 0.8% |
| Total | 1,919 | 100.0% |
School Enrollment by Age by Funding Source in Carver
Out of a total of 1,919 students who are enrolled in schools in Carver, 251 (13.1%) attend a private institution, while the remaining 1,668 (86.9%) are enrolled in public schools. The age group of 3 to 4 year olds has the highest likelihood of being enrolled in private schools, with 50 (50.0% in the age bracket) enrolled. Conversely, the age group of 18 to 19 year olds has the lowest likelihood of being enrolled in a private school, with 224 (100.0% in the age bracket) attending a public institution.
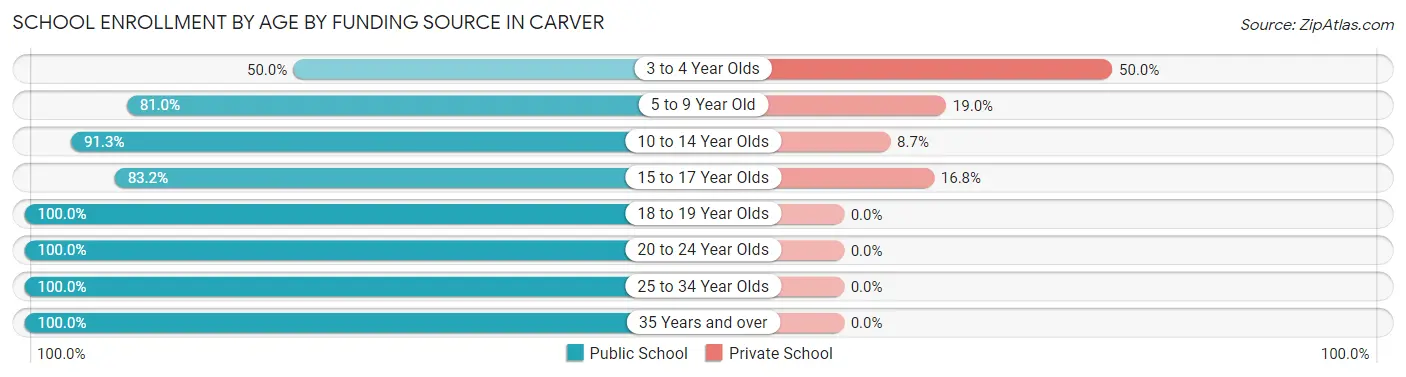
| Age Bracket | Public School | Private School |
| 3 to 4 Year Olds | 50 (50.0%) | 50 (50.0%) |
| 5 to 9 Year Old | 387 (81.0%) | 91 (19.0%) |
| 10 to 14 Year Olds | 496 (91.3%) | 47 (8.7%) |
| 15 to 17 Year Olds | 317 (83.2%) | 64 (16.8%) |
| 18 to 19 Year Olds | 224 (100.0%) | 0 (0.0%) |
| 20 to 24 Year Olds | 136 (100.0%) | 0 (0.0%) |
| 25 to 34 Year Olds | 21 (100.0%) | 0 (0.0%) |
| 35 Years and over | 36 (100.0%) | 0 (0.0%) |
| Total | 1,668 (86.9%) | 251 (13.1%) |
Educational Attainment by Field of Study in Carver
Business (570 | 24.0%), education (453 | 19.1%), social sciences (260 | 10.9%), science & technology (166 | 7.0%), and bio, nature & agricultural (159 | 6.7%) are the most common fields of study among 2,376 individuals in Carver who have obtained a bachelor's degree or higher.
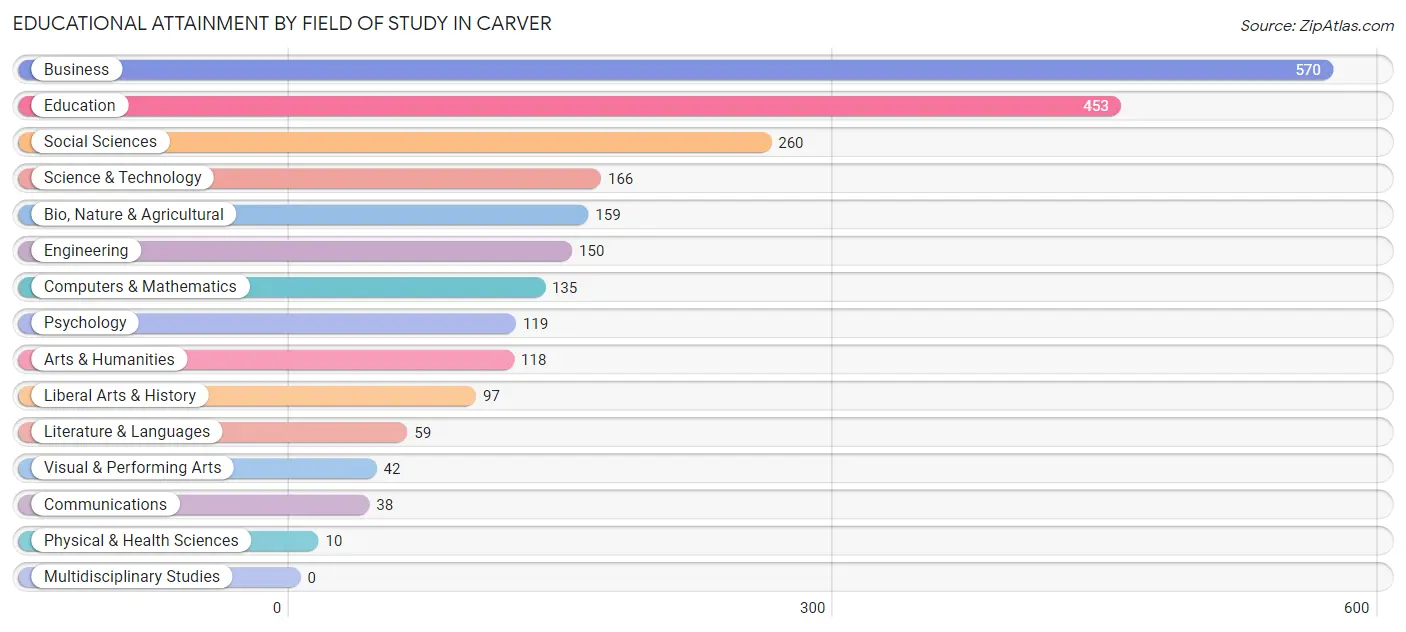
| Field of Study | # Graduates | % Graduates |
| Computers & Mathematics | 135 | 5.7% |
| Bio, Nature & Agricultural | 159 | 6.7% |
| Physical & Health Sciences | 10 | 0.4% |
| Psychology | 119 | 5.0% |
| Social Sciences | 260 | 10.9% |
| Engineering | 150 | 6.3% |
| Multidisciplinary Studies | 0 | 0.0% |
| Science & Technology | 166 | 7.0% |
| Business | 570 | 24.0% |
| Education | 453 | 19.1% |
| Literature & Languages | 59 | 2.5% |
| Liberal Arts & History | 97 | 4.1% |
| Visual & Performing Arts | 42 | 1.8% |
| Communications | 38 | 1.6% |
| Arts & Humanities | 118 | 5.0% |
| Total | 2,376 | 100.0% |
Transportation & Commute in Carver
Vehicle Availability by Sex in Carver
The most prevalent vehicle ownership categories in Carver are males with 2 vehicles (721, accounting for 46.0%) and females with 2 vehicles (561, making up 50.2%).
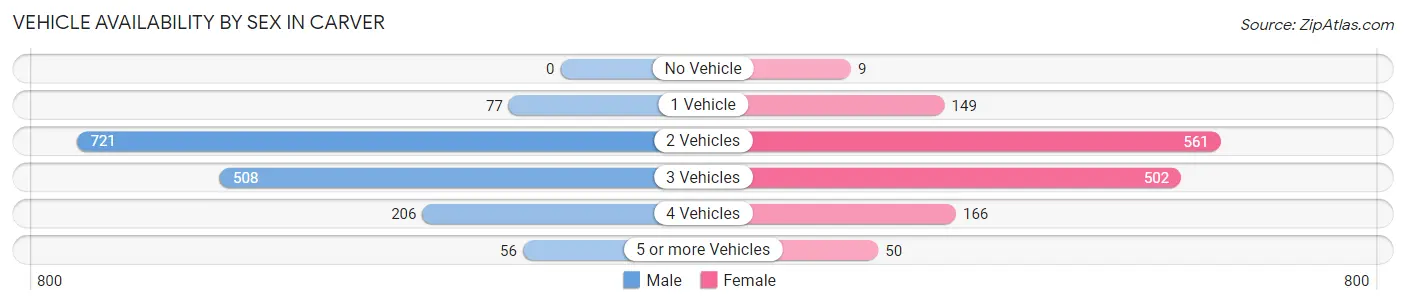
| Vehicles Available | Male | Female |
| No Vehicle | 0 (0.0%) | 9 (0.6%) |
| 1 Vehicle | 77 (4.9%) | 149 (10.4%) |
| 2 Vehicles | 721 (46.0%) | 561 (39.0%) |
| 3 Vehicles | 508 (32.4%) | 502 (34.9%) |
| 4 Vehicles | 206 (13.1%) | 166 (11.6%) |
| 5 or more Vehicles | 56 (3.6%) | 50 (3.5%) |
| Total | 1,568 (100.0%) | 1,437 (100.0%) |
Commute Time in Carver
The most frequently occuring commute durations in Carver are 30 to 34 minutes (554 commuters, 22.7%), 20 to 24 minutes (502 commuters, 20.5%), and 10 to 14 minutes (356 commuters, 14.6%).
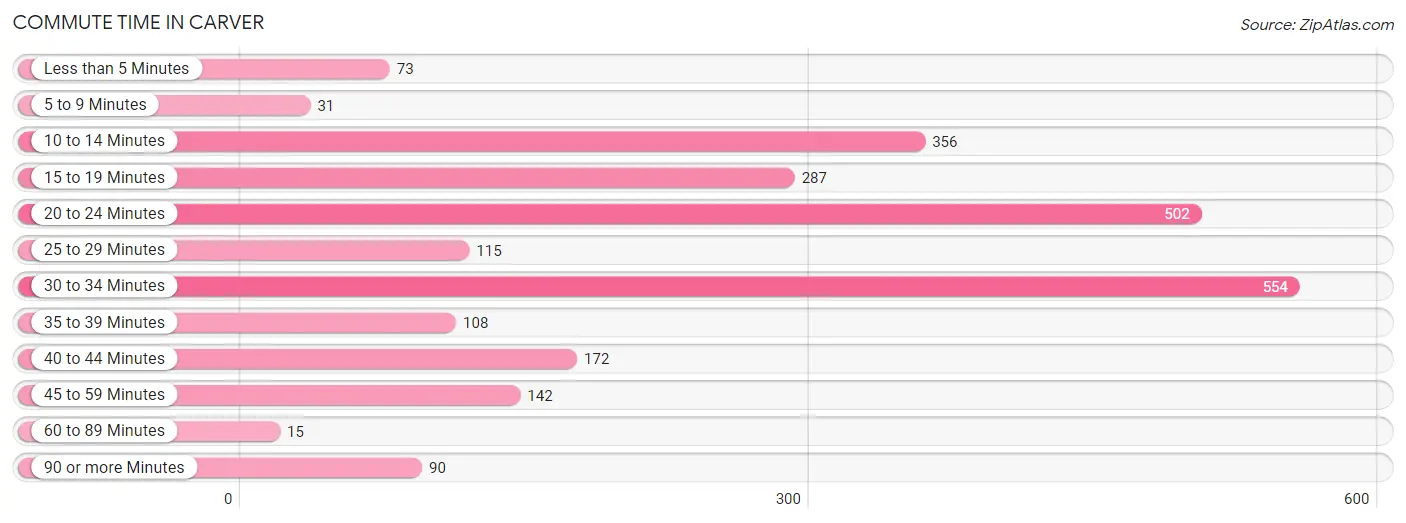
| Commute Time | # Commuters | % Commuters |
| Less than 5 Minutes | 73 | 3.0% |
| 5 to 9 Minutes | 31 | 1.3% |
| 10 to 14 Minutes | 356 | 14.6% |
| 15 to 19 Minutes | 287 | 11.7% |
| 20 to 24 Minutes | 502 | 20.5% |
| 25 to 29 Minutes | 115 | 4.7% |
| 30 to 34 Minutes | 554 | 22.7% |
| 35 to 39 Minutes | 108 | 4.4% |
| 40 to 44 Minutes | 172 | 7.0% |
| 45 to 59 Minutes | 142 | 5.8% |
| 60 to 89 Minutes | 15 | 0.6% |
| 90 or more Minutes | 90 | 3.7% |
Commute Time by Sex in Carver
The most common commute times in Carver are 30 to 34 minutes (330 commuters, 25.9%) for males and 20 to 24 minutes (232 commuters, 19.8%) for females.
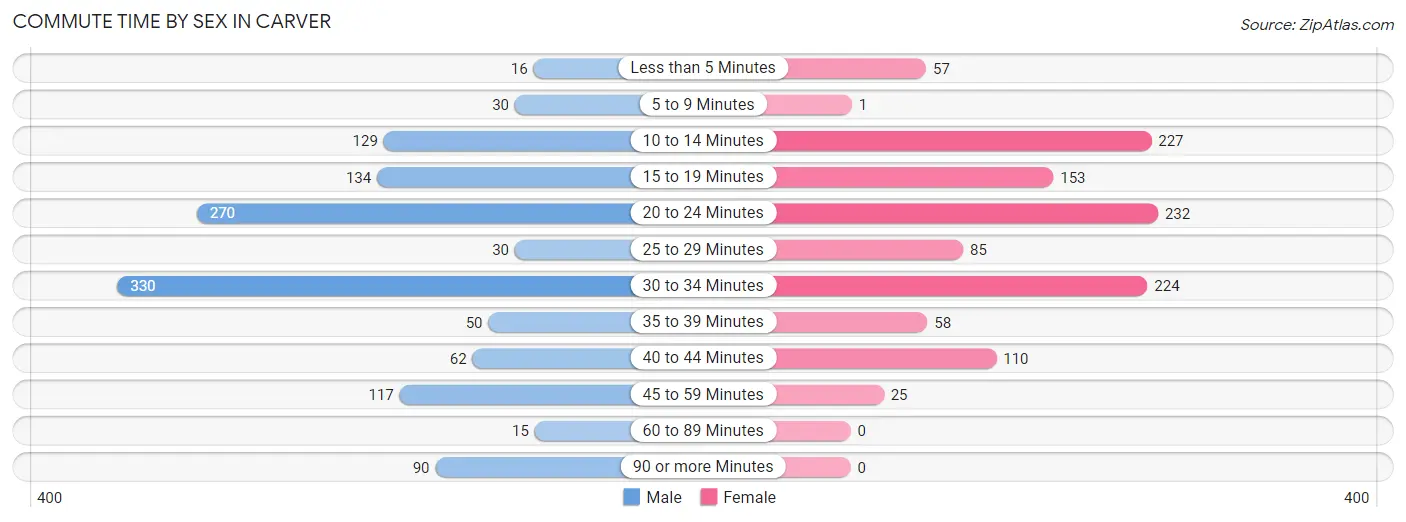
| Commute Time | Male | Female |
| Less than 5 Minutes | 16 (1.3%) | 57 (4.9%) |
| 5 to 9 Minutes | 30 (2.4%) | 1 (0.1%) |
| 10 to 14 Minutes | 129 (10.1%) | 227 (19.4%) |
| 15 to 19 Minutes | 134 (10.5%) | 153 (13.1%) |
| 20 to 24 Minutes | 270 (21.2%) | 232 (19.8%) |
| 25 to 29 Minutes | 30 (2.4%) | 85 (7.2%) |
| 30 to 34 Minutes | 330 (25.9%) | 224 (19.1%) |
| 35 to 39 Minutes | 50 (3.9%) | 58 (5.0%) |
| 40 to 44 Minutes | 62 (4.9%) | 110 (9.4%) |
| 45 to 59 Minutes | 117 (9.2%) | 25 (2.1%) |
| 60 to 89 Minutes | 15 (1.2%) | 0 (0.0%) |
| 90 or more Minutes | 90 (7.1%) | 0 (0.0%) |
Time of Departure to Work by Sex in Carver
The most frequent times of departure to work in Carver are 7:00 AM to 7:29 AM (282, 22.2%) for males and 8:00 AM to 8:29 AM (219, 18.7%) for females.
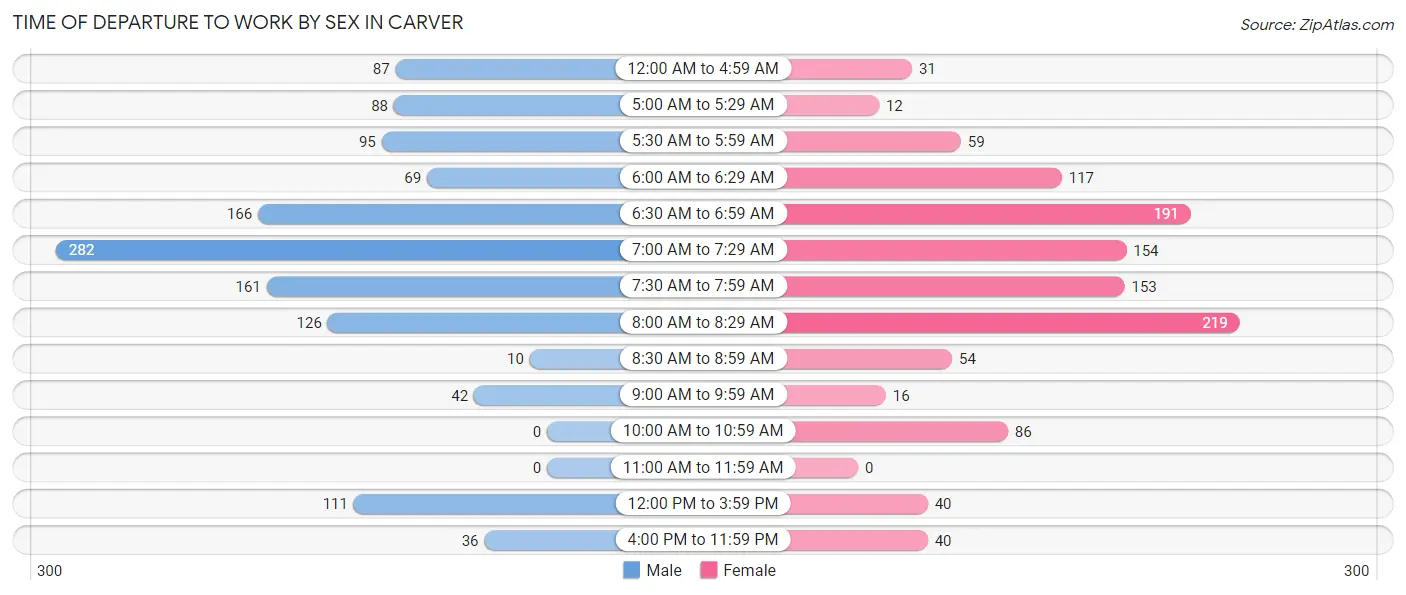
| Time of Departure | Male | Female |
| 12:00 AM to 4:59 AM | 87 (6.8%) | 31 (2.6%) |
| 5:00 AM to 5:29 AM | 88 (6.9%) | 12 (1.0%) |
| 5:30 AM to 5:59 AM | 95 (7.5%) | 59 (5.0%) |
| 6:00 AM to 6:29 AM | 69 (5.4%) | 117 (10.0%) |
| 6:30 AM to 6:59 AM | 166 (13.0%) | 191 (16.3%) |
| 7:00 AM to 7:29 AM | 282 (22.2%) | 154 (13.1%) |
| 7:30 AM to 7:59 AM | 161 (12.7%) | 153 (13.1%) |
| 8:00 AM to 8:29 AM | 126 (9.9%) | 219 (18.7%) |
| 8:30 AM to 8:59 AM | 10 (0.8%) | 54 (4.6%) |
| 9:00 AM to 9:59 AM | 42 (3.3%) | 16 (1.4%) |
| 10:00 AM to 10:59 AM | 0 (0.0%) | 86 (7.3%) |
| 11:00 AM to 11:59 AM | 0 (0.0%) | 0 (0.0%) |
| 12:00 PM to 3:59 PM | 111 (8.7%) | 40 (3.4%) |
| 4:00 PM to 11:59 PM | 36 (2.8%) | 40 (3.4%) |
| Total | 1,273 (100.0%) | 1,172 (100.0%) |
Housing Occupancy in Carver
Occupancy by Ownership in Carver
Of the total 1,891 dwellings in Carver, owner-occupied units account for 1,680 (88.8%), while renter-occupied units make up 211 (11.2%).
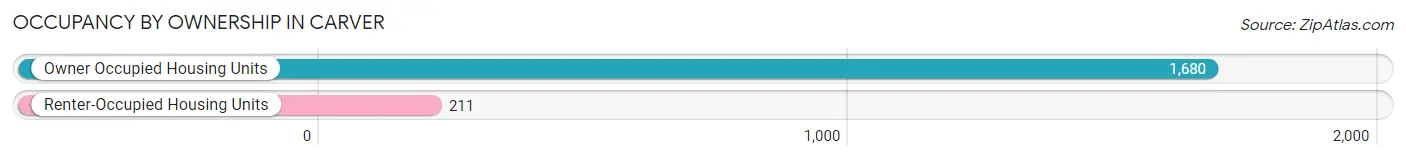
| Occupancy | # Housing Units | % Housing Units |
| Owner Occupied Housing Units | 1,680 | 88.8% |
| Renter-Occupied Housing Units | 211 | 11.2% |
| Total Occupied Housing Units | 1,891 | 100.0% |
Occupancy by Household Size in Carver
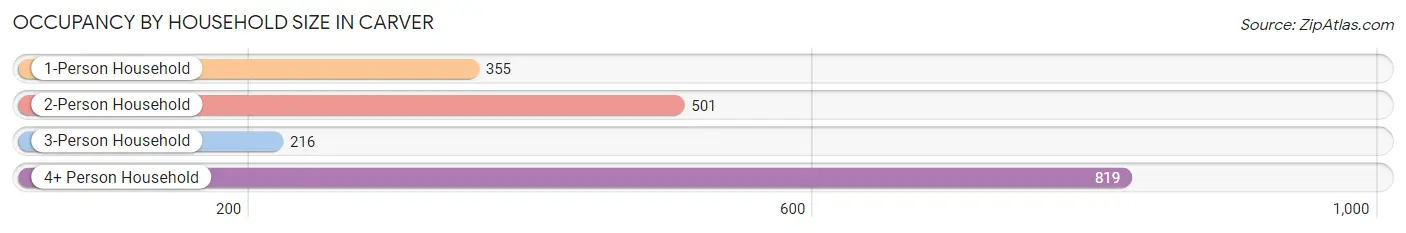
| Household Size | # Housing Units | % Housing Units |
| 1-Person Household | 355 | 18.8% |
| 2-Person Household | 501 | 26.5% |
| 3-Person Household | 216 | 11.4% |
| 4+ Person Household | 819 | 43.3% |
| Total Housing Units | 1,891 | 100.0% |
Occupancy by Ownership by Household Size in Carver
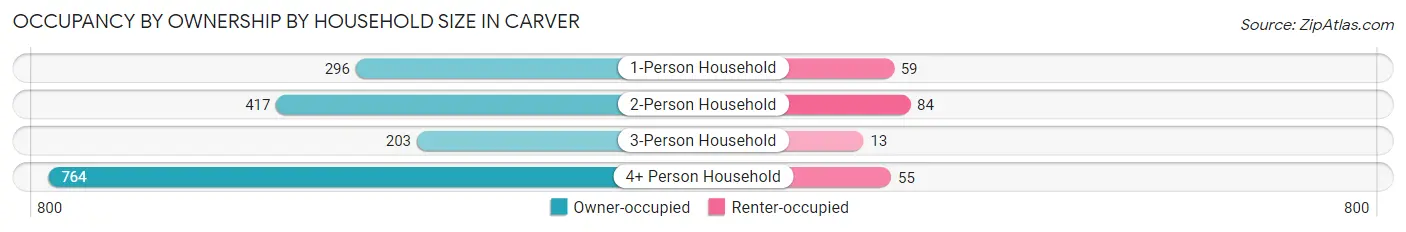
| Household Size | Owner-occupied | Renter-occupied |
| 1-Person Household | 296 (83.4%) | 59 (16.6%) |
| 2-Person Household | 417 (83.2%) | 84 (16.8%) |
| 3-Person Household | 203 (94.0%) | 13 (6.0%) |
| 4+ Person Household | 764 (93.3%) | 55 (6.7%) |
| Total Housing Units | 1,680 (88.8%) | 211 (11.2%) |
Occupancy by Educational Attainment in Carver
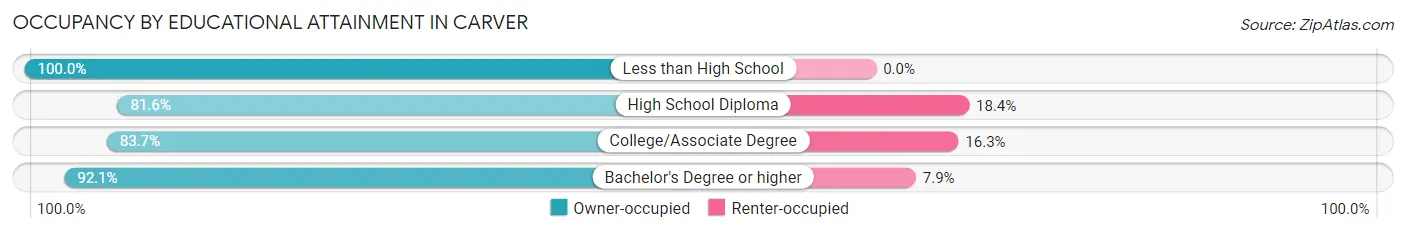
| Household Size | Owner-occupied | Renter-occupied |
| Less than High School | 40 (100.0%) | 0 (0.0%) |
| High School Diploma | 177 (81.6%) | 40 (18.4%) |
| College/Associate Degree | 421 (83.7%) | 82 (16.3%) |
| Bachelor's Degree or higher | 1,042 (92.1%) | 89 (7.9%) |
Occupancy by Age of Householder in Carver
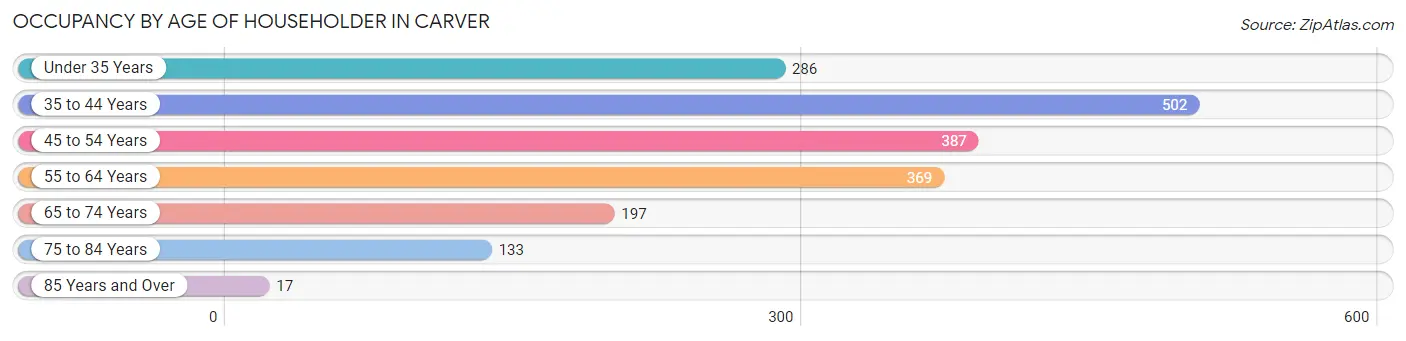
| Age Bracket | # Households | % Households |
| Under 35 Years | 286 | 15.1% |
| 35 to 44 Years | 502 | 26.6% |
| 45 to 54 Years | 387 | 20.5% |
| 55 to 64 Years | 369 | 19.5% |
| 65 to 74 Years | 197 | 10.4% |
| 75 to 84 Years | 133 | 7.0% |
| 85 Years and Over | 17 | 0.9% |
| Total | 1,891 | 100.0% |
Housing Finances in Carver
Median Income by Occupancy in Carver
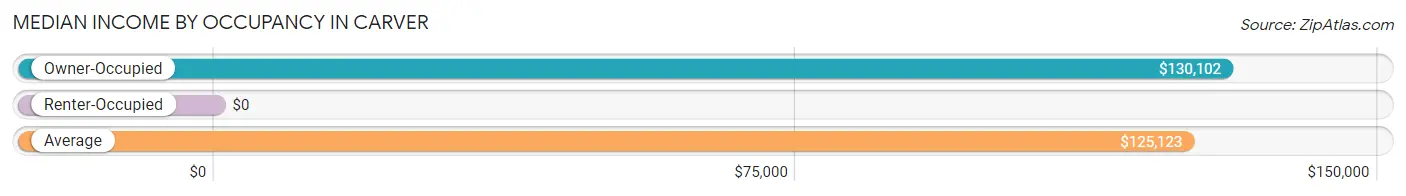
| Occupancy Type | # Households | Median Income |
| Owner-Occupied | 1,680 (88.8%) | $130,102 |
| Renter-Occupied | 211 (11.2%) | $0 |
| Average | 1,891 (100.0%) | $125,123 |
Occupancy by Householder Income Bracket in Carver
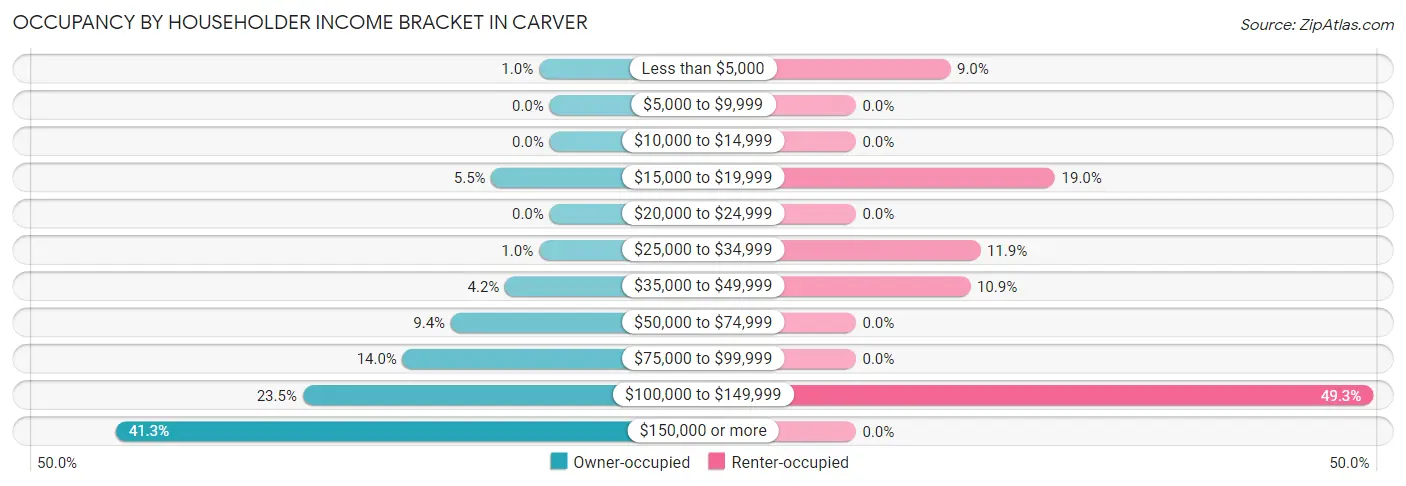
| Income Bracket | Owner-occupied | Renter-occupied |
| Less than $5,000 | 17 (1.0%) | 19 (9.0%) |
| $5,000 to $9,999 | 0 (0.0%) | 0 (0.0%) |
| $10,000 to $14,999 | 0 (0.0%) | 0 (0.0%) |
| $15,000 to $19,999 | 93 (5.5%) | 40 (19.0%) |
| $20,000 to $24,999 | 0 (0.0%) | 0 (0.0%) |
| $25,000 to $34,999 | 17 (1.0%) | 25 (11.8%) |
| $35,000 to $49,999 | 71 (4.2%) | 23 (10.9%) |
| $50,000 to $74,999 | 158 (9.4%) | 0 (0.0%) |
| $75,000 to $99,999 | 235 (14.0%) | 0 (0.0%) |
| $100,000 to $149,999 | 395 (23.5%) | 104 (49.3%) |
| $150,000 or more | 694 (41.3%) | 0 (0.0%) |
| Total | 1,680 (100.0%) | 211 (100.0%) |
Monthly Housing Cost Tiers in Carver
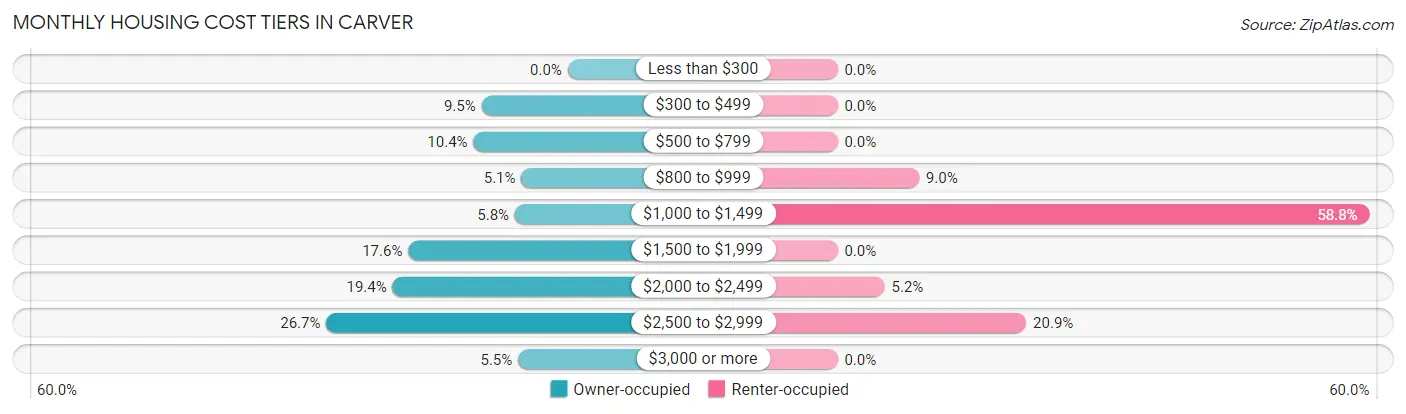
| Monthly Cost | Owner-occupied | Renter-occupied |
| Less than $300 | 0 (0.0%) | 0 (0.0%) |
| $300 to $499 | 160 (9.5%) | 0 (0.0%) |
| $500 to $799 | 175 (10.4%) | 0 (0.0%) |
| $800 to $999 | 86 (5.1%) | 19 (9.0%) |
| $1,000 to $1,499 | 98 (5.8%) | 124 (58.8%) |
| $1,500 to $1,999 | 296 (17.6%) | 0 (0.0%) |
| $2,000 to $2,499 | 325 (19.4%) | 11 (5.2%) |
| $2,500 to $2,999 | 448 (26.7%) | 44 (20.8%) |
| $3,000 or more | 92 (5.5%) | 0 (0.0%) |
| Total | 1,680 (100.0%) | 211 (100.0%) |
Physical Housing Characteristics in Carver
Housing Structures in Carver
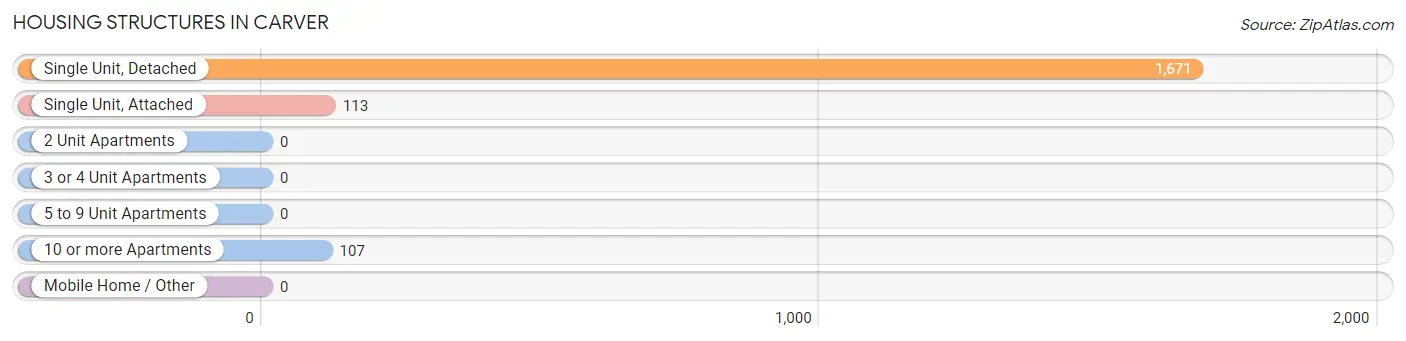
| Structure Type | # Housing Units | % Housing Units |
| Single Unit, Detached | 1,671 | 88.4% |
| Single Unit, Attached | 113 | 6.0% |
| 2 Unit Apartments | 0 | 0.0% |
| 3 or 4 Unit Apartments | 0 | 0.0% |
| 5 to 9 Unit Apartments | 0 | 0.0% |
| 10 or more Apartments | 107 | 5.7% |
| Mobile Home / Other | 0 | 0.0% |
| Total | 1,891 | 100.0% |
Housing Structures by Occupancy in Carver
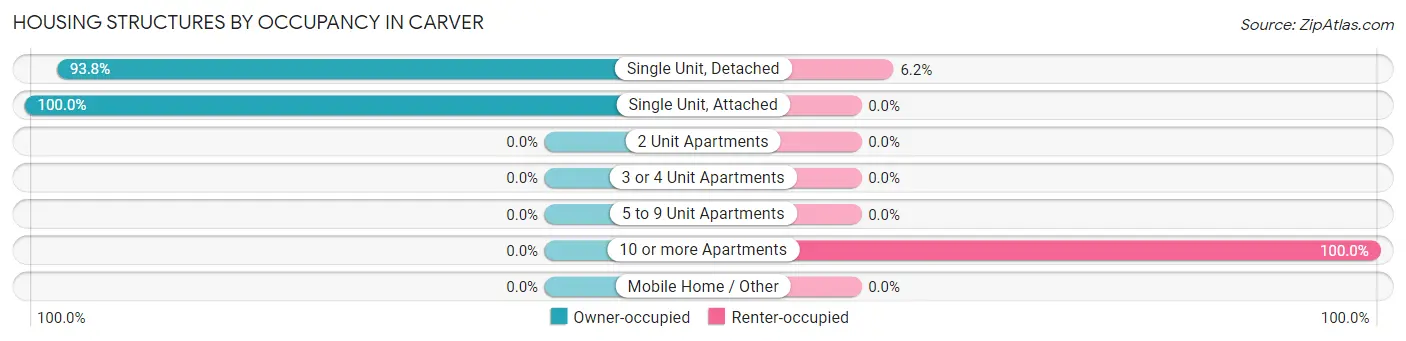
| Structure Type | Owner-occupied | Renter-occupied |
| Single Unit, Detached | 1,567 (93.8%) | 104 (6.2%) |
| Single Unit, Attached | 113 (100.0%) | 0 (0.0%) |
| 2 Unit Apartments | 0 (0.0%) | 0 (0.0%) |
| 3 or 4 Unit Apartments | 0 (0.0%) | 0 (0.0%) |
| 5 to 9 Unit Apartments | 0 (0.0%) | 0 (0.0%) |
| 10 or more Apartments | 0 (0.0%) | 107 (100.0%) |
| Mobile Home / Other | 0 (0.0%) | 0 (0.0%) |
| Total | 1,680 (88.8%) | 211 (11.2%) |
Housing Structures by Number of Rooms in Carver
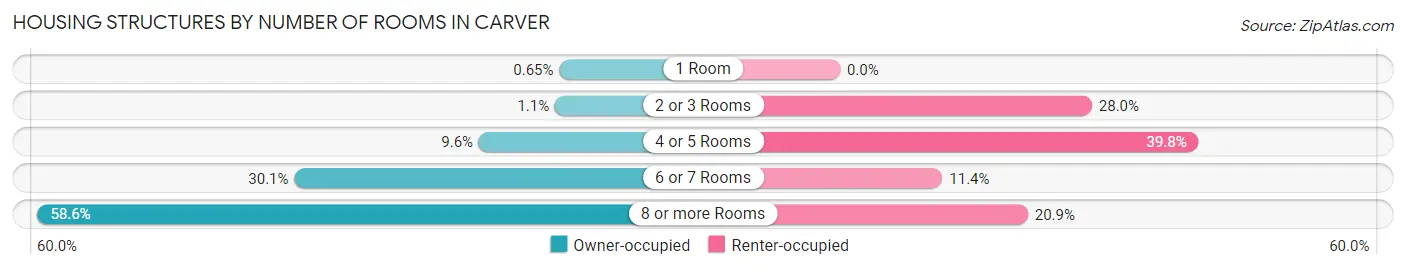
| Number of Rooms | Owner-occupied | Renter-occupied |
| 1 Room | 11 (0.6%) | 0 (0.0%) |
| 2 or 3 Rooms | 19 (1.1%) | 59 (28.0%) |
| 4 or 5 Rooms | 161 (9.6%) | 84 (39.8%) |
| 6 or 7 Rooms | 505 (30.1%) | 24 (11.4%) |
| 8 or more Rooms | 984 (58.6%) | 44 (20.8%) |
| Total | 1,680 (100.0%) | 211 (100.0%) |
Housing Structure by Heating Type in Carver
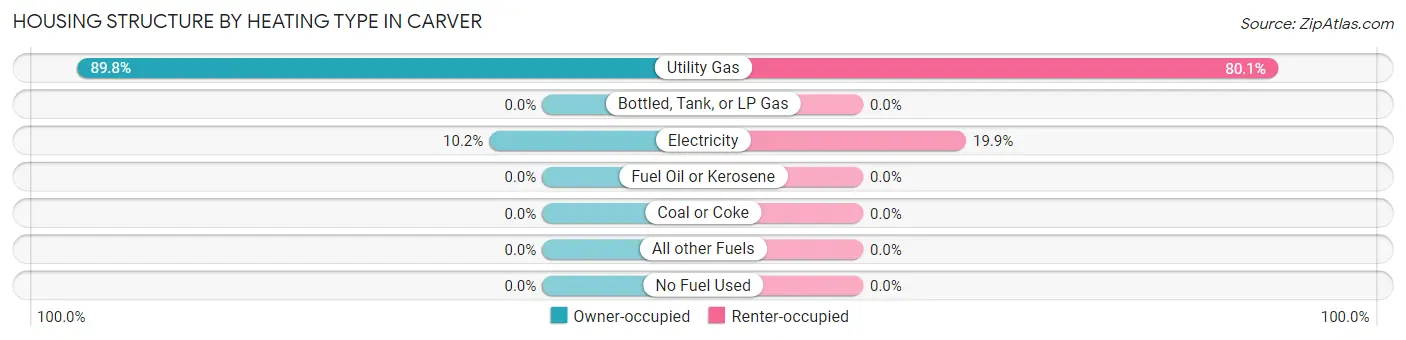
| Heating Type | Owner-occupied | Renter-occupied |
| Utility Gas | 1,508 (89.8%) | 169 (80.1%) |
| Bottled, Tank, or LP Gas | 0 (0.0%) | 0 (0.0%) |
| Electricity | 172 (10.2%) | 42 (19.9%) |
| Fuel Oil or Kerosene | 0 (0.0%) | 0 (0.0%) |
| Coal or Coke | 0 (0.0%) | 0 (0.0%) |
| All other Fuels | 0 (0.0%) | 0 (0.0%) |
| No Fuel Used | 0 (0.0%) | 0 (0.0%) |
| Total | 1,680 (100.0%) | 211 (100.0%) |
Household Vehicle Usage in Carver
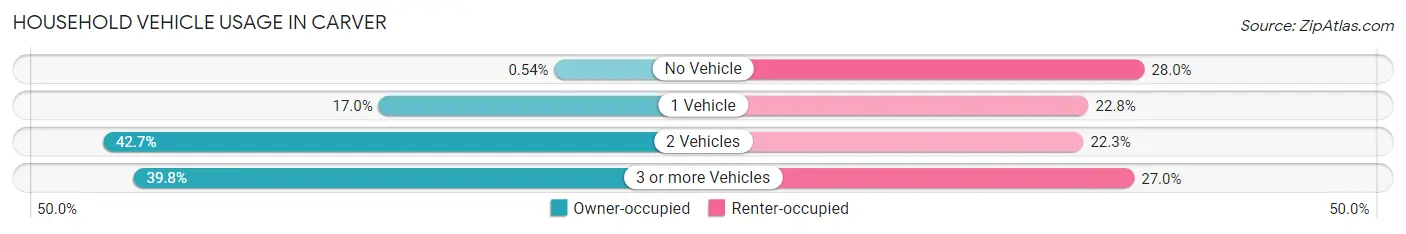
| Vehicles per Household | Owner-occupied | Renter-occupied |
| No Vehicle | 9 (0.5%) | 59 (28.0%) |
| 1 Vehicle | 285 (17.0%) | 48 (22.8%) |
| 2 Vehicles | 717 (42.7%) | 47 (22.3%) |
| 3 or more Vehicles | 669 (39.8%) | 57 (27.0%) |
| Total | 1,680 (100.0%) | 211 (100.0%) |
Real Estate & Mortgages in Carver
Real Estate and Mortgage Overview in Carver
| Characteristic | Without Mortgage | With Mortgage |
| Housing Units | 449 | 1,231 |
| Median Property Value | $289,600 | $420,900 |
| Median Household Income | $98,393 | $581 |
| Monthly Housing Costs | $587 | $92 |
| Real Estate Taxes | $3,018 | $0 |
Property Value by Mortgage Status in Carver
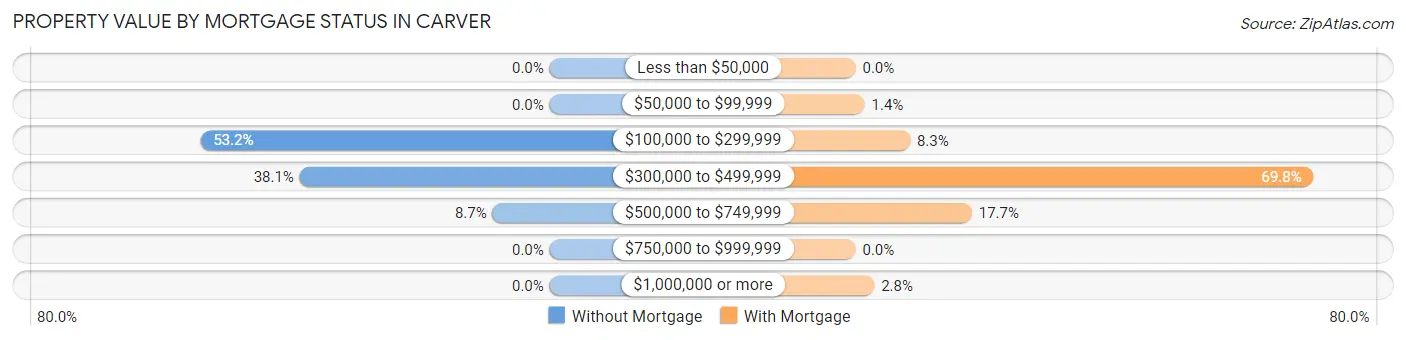
| Property Value | Without Mortgage | With Mortgage |
| Less than $50,000 | 0 (0.0%) | 0 (0.0%) |
| $50,000 to $99,999 | 0 (0.0%) | 17 (1.4%) |
| $100,000 to $299,999 | 239 (53.2%) | 102 (8.3%) |
| $300,000 to $499,999 | 171 (38.1%) | 859 (69.8%) |
| $500,000 to $749,999 | 39 (8.7%) | 218 (17.7%) |
| $750,000 to $999,999 | 0 (0.0%) | 0 (0.0%) |
| $1,000,000 or more | 0 (0.0%) | 35 (2.8%) |
| Total | 449 (100.0%) | 1,231 (100.0%) |
Household Income by Mortgage Status in Carver
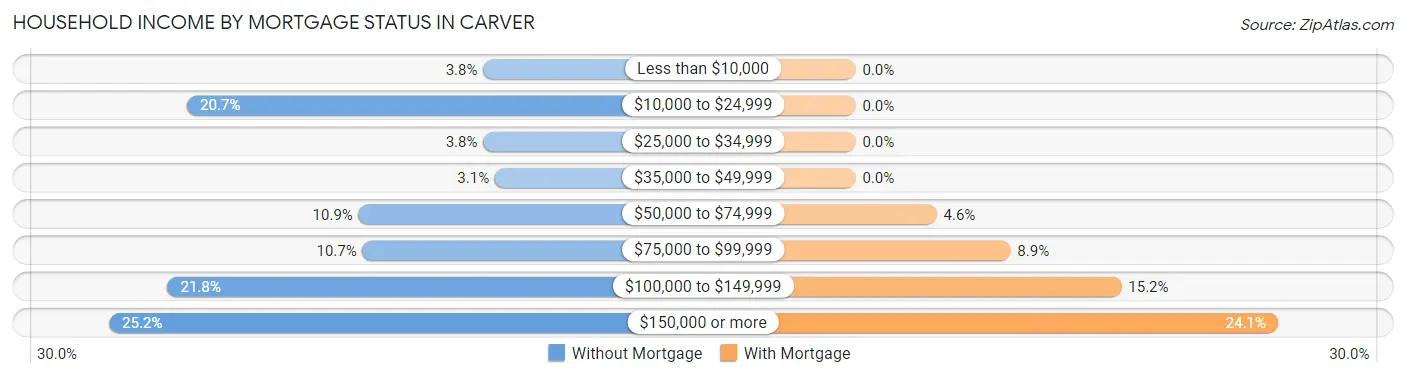
| Household Income | Without Mortgage | With Mortgage |
| Less than $10,000 | 17 (3.8%) | 0 (0.0%) |
| $10,000 to $24,999 | 93 (20.7%) | 0 (0.0%) |
| $25,000 to $34,999 | 17 (3.8%) | 0 (0.0%) |
| $35,000 to $49,999 | 14 (3.1%) | 0 (0.0%) |
| $50,000 to $74,999 | 49 (10.9%) | 57 (4.6%) |
| $75,000 to $99,999 | 48 (10.7%) | 109 (8.8%) |
| $100,000 to $149,999 | 98 (21.8%) | 187 (15.2%) |
| $150,000 or more | 113 (25.2%) | 297 (24.1%) |
| Total | 449 (100.0%) | 1,231 (100.0%) |
Property Value to Household Income Ratio in Carver
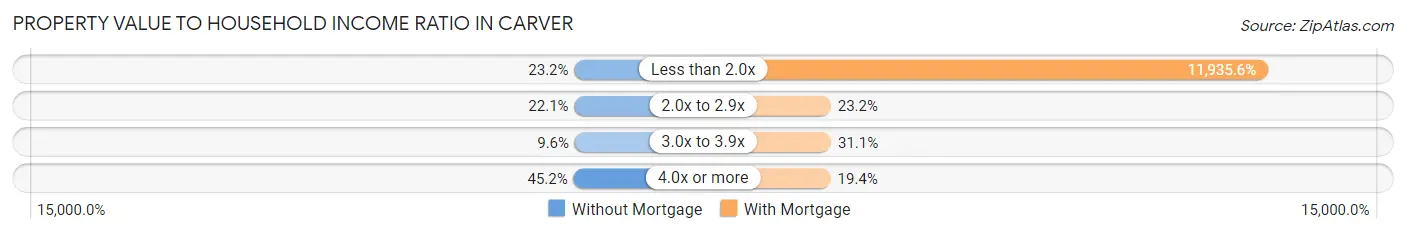
| Value-to-Income Ratio | Without Mortgage | With Mortgage |
| Less than 2.0x | 104 (23.2%) | 146,927 (11,935.6%) |
| 2.0x to 2.9x | 99 (22.1%) | 286 (23.2%) |
| 3.0x to 3.9x | 43 (9.6%) | 383 (31.1%) |
| 4.0x or more | 203 (45.2%) | 239 (19.4%) |
| Total | 449 (100.0%) | 1,231 (100.0%) |
Real Estate Taxes by Mortgage Status in Carver
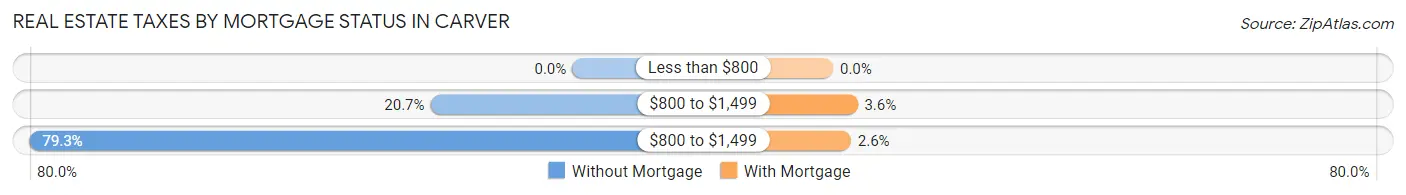
| Property Taxes | Without Mortgage | With Mortgage |
| Less than $800 | 0 (0.0%) | 0 (0.0%) |
| $800 to $1,499 | 93 (20.7%) | 44 (3.6%) |
| $800 to $1,499 | 356 (79.3%) | 32 (2.6%) |
| Total | 449 (100.0%) | 1,231 (100.0%) |
Health & Disability in Carver
Health Insurance Coverage by Age in Carver

| Age Bracket | With Coverage | Without Coverage |
| Under 6 Years | 335 (100.0%) | 0 (0.0%) |
| 6 to 18 Years | 1,553 (99.0%) | 16 (1.0%) |
| 19 to 25 Years | 276 (100.0%) | 0 (0.0%) |
| 26 to 34 Years | 466 (94.7%) | 26 (5.3%) |
| 35 to 44 Years | 1,027 (100.0%) | 0 (0.0%) |
| 45 to 54 Years | 834 (100.0%) | 0 (0.0%) |
| 55 to 64 Years | 628 (95.9%) | 27 (4.1%) |
| 65 to 74 Years | 309 (100.0%) | 0 (0.0%) |
| 75 Years and older | 159 (100.0%) | 0 (0.0%) |
| Total | 5,587 (98.8%) | 69 (1.2%) |
Health Insurance Coverage by Citizenship Status in Carver
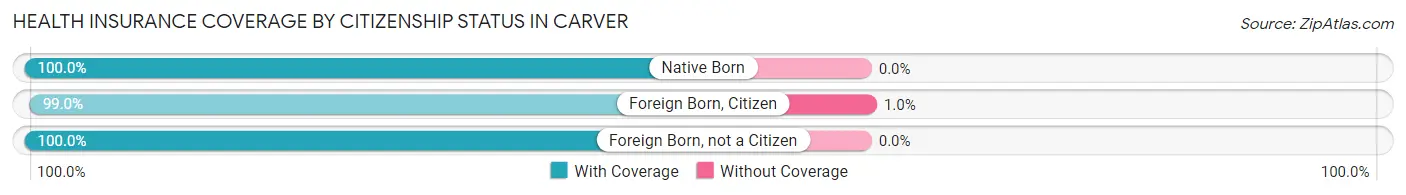
| Citizenship Status | With Coverage | Without Coverage |
| Native Born | 335 (100.0%) | 0 (0.0%) |
| Foreign Born, Citizen | 1,553 (99.0%) | 16 (1.0%) |
| Foreign Born, not a Citizen | 276 (100.0%) | 0 (0.0%) |
Health Insurance Coverage by Household Income in Carver
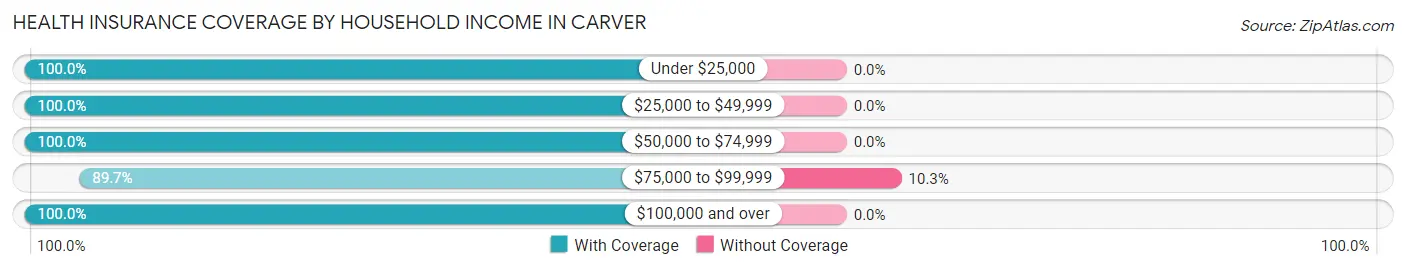
| Household Income | With Coverage | Without Coverage |
| Under $25,000 | 169 (100.0%) | 0 (0.0%) |
| $25,000 to $49,999 | 196 (100.0%) | 0 (0.0%) |
| $50,000 to $74,999 | 319 (100.0%) | 0 (0.0%) |
| $75,000 to $99,999 | 603 (89.7%) | 69 (10.3%) |
| $100,000 and over | 4,296 (100.0%) | 0 (0.0%) |
Public vs Private Health Insurance Coverage by Age in Carver
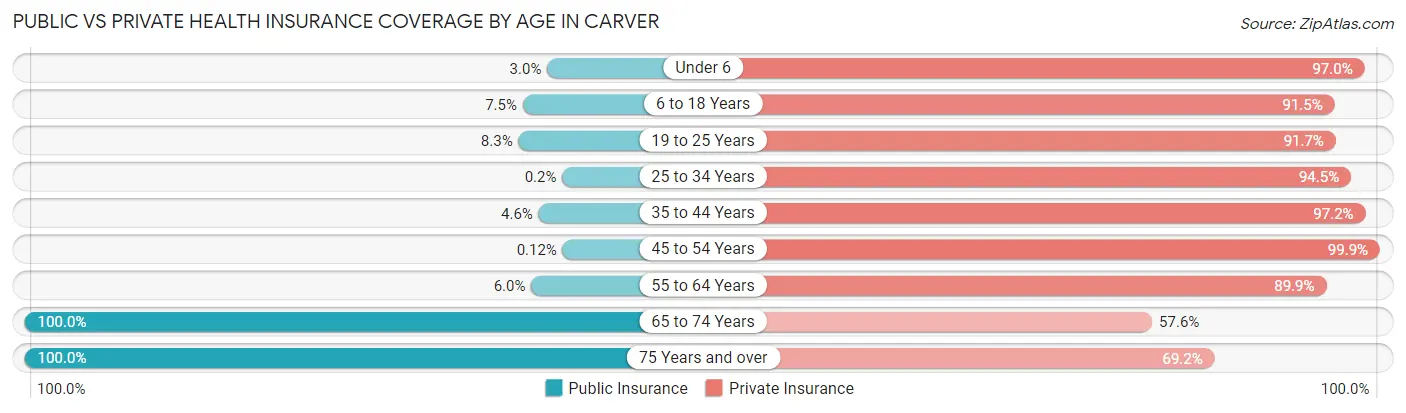
| Age Bracket | Public Insurance | Private Insurance |
| Under 6 | 10 (3.0%) | 325 (97.0%) |
| 6 to 18 Years | 118 (7.5%) | 1,435 (91.5%) |
| 19 to 25 Years | 23 (8.3%) | 253 (91.7%) |
| 25 to 34 Years | 1 (0.2%) | 465 (94.5%) |
| 35 to 44 Years | 47 (4.6%) | 998 (97.2%) |
| 45 to 54 Years | 1 (0.1%) | 833 (99.9%) |
| 55 to 64 Years | 39 (5.9%) | 589 (89.9%) |
| 65 to 74 Years | 309 (100.0%) | 178 (57.6%) |
| 75 Years and over | 159 (100.0%) | 110 (69.2%) |
| Total | 707 (12.5%) | 5,186 (91.7%) |
Disability Status by Sex by Age in Carver
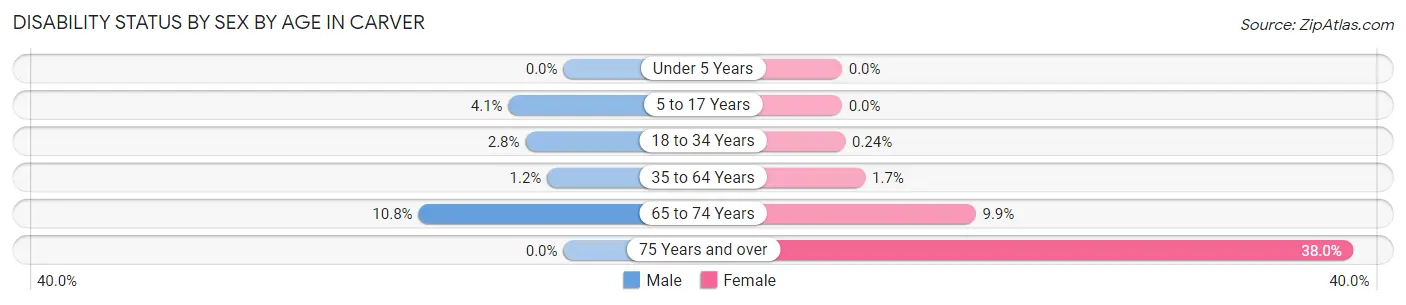
| Age Bracket | Male | Female |
| Under 5 Years | 0 (0.0%) | 0 (0.0%) |
| 5 to 17 Years | 31 (4.1%) | 0 (0.0%) |
| 18 to 34 Years | 16 (2.8%) | 1 (0.2%) |
| 35 to 64 Years | 15 (1.2%) | 22 (1.7%) |
| 65 to 74 Years | 17 (10.8%) | 15 (9.9%) |
| 75 Years and over | 0 (0.0%) | 57 (38.0%) |
Disability Class by Sex by Age in Carver
Disability Class: Hearing Difficulty
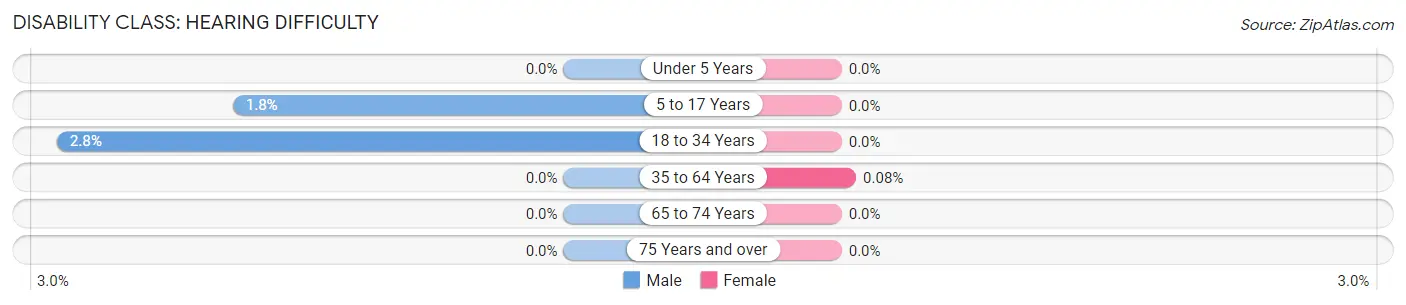
| Age Bracket | Male | Female |
| Under 5 Years | 0 (0.0%) | 0 (0.0%) |
| 5 to 17 Years | 14 (1.8%) | 0 (0.0%) |
| 18 to 34 Years | 16 (2.8%) | 0 (0.0%) |
| 35 to 64 Years | 0 (0.0%) | 1 (0.1%) |
| 65 to 74 Years | 0 (0.0%) | 0 (0.0%) |
| 75 Years and over | 0 (0.0%) | 0 (0.0%) |
Disability Class: Vision Difficulty
| Age Bracket | Male | Female |
| Under 5 Years | 0 (0.0%) | 0 (0.0%) |
| 5 to 17 Years | 0 (0.0%) | 0 (0.0%) |
| 18 to 34 Years | 0 (0.0%) | 0 (0.0%) |
| 35 to 64 Years | 0 (0.0%) | 0 (0.0%) |
| 65 to 74 Years | 0 (0.0%) | 0 (0.0%) |
| 75 Years and over | 0 (0.0%) | 0 (0.0%) |
Disability Class: Cognitive Difficulty
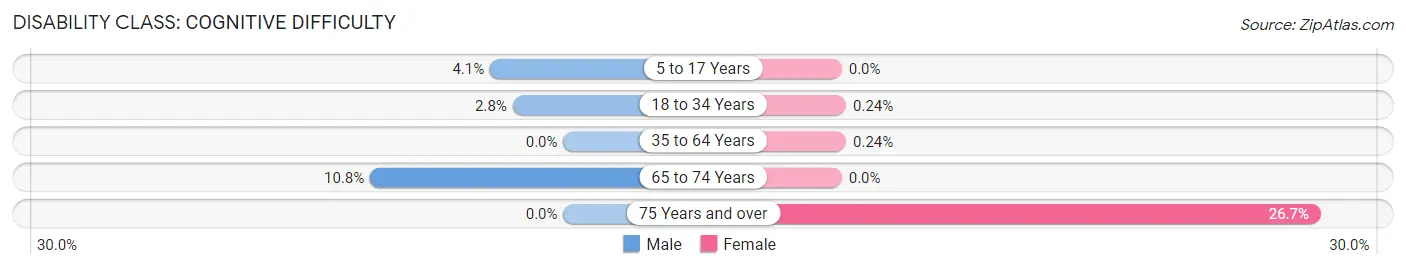
| Age Bracket | Male | Female |
| 5 to 17 Years | 31 (4.1%) | 0 (0.0%) |
| 18 to 34 Years | 16 (2.8%) | 1 (0.2%) |
| 35 to 64 Years | 0 (0.0%) | 3 (0.2%) |
| 65 to 74 Years | 17 (10.8%) | 0 (0.0%) |
| 75 Years and over | 0 (0.0%) | 40 (26.7%) |
Disability Class: Ambulatory Difficulty
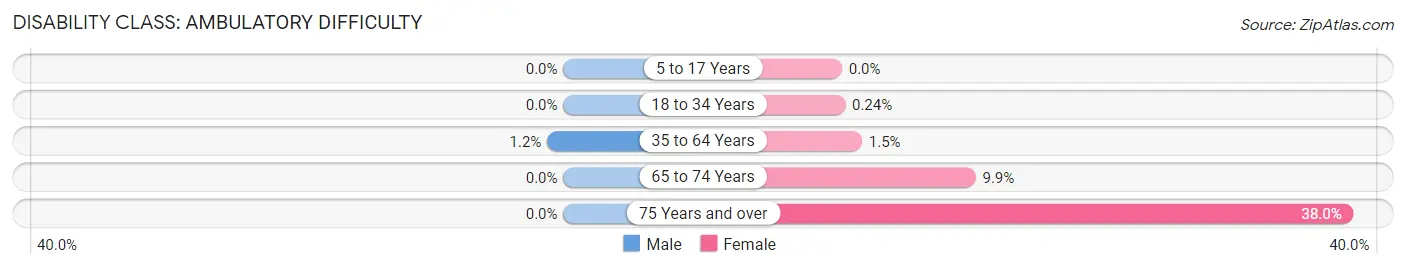
| Age Bracket | Male | Female |
| 5 to 17 Years | 0 (0.0%) | 0 (0.0%) |
| 18 to 34 Years | 0 (0.0%) | 1 (0.2%) |
| 35 to 64 Years | 15 (1.2%) | 19 (1.5%) |
| 65 to 74 Years | 0 (0.0%) | 15 (9.9%) |
| 75 Years and over | 0 (0.0%) | 57 (38.0%) |
Disability Class: Self-Care Difficulty
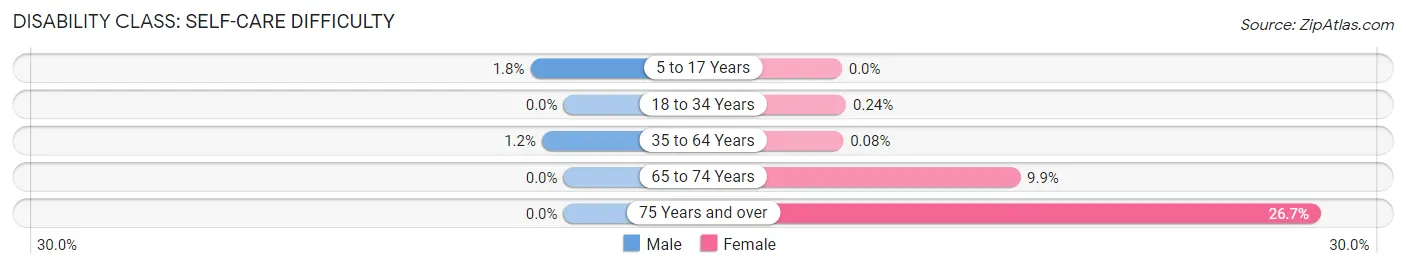
| Age Bracket | Male | Female |
| 5 to 17 Years | 14 (1.8%) | 0 (0.0%) |
| 18 to 34 Years | 0 (0.0%) | 1 (0.2%) |
| 35 to 64 Years | 15 (1.2%) | 1 (0.1%) |
| 65 to 74 Years | 0 (0.0%) | 15 (9.9%) |
| 75 Years and over | 0 (0.0%) | 40 (26.7%) |
Technology Access in Carver
Computing Device Access in Carver
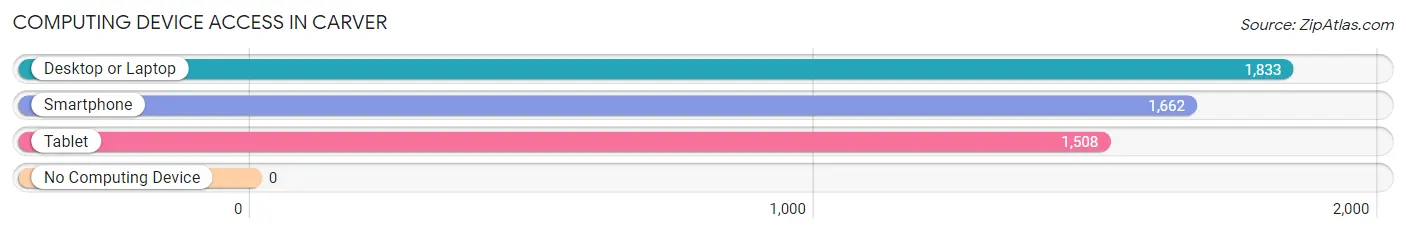
| Device Type | # Households | % Households |
| Desktop or Laptop | 1,833 | 96.9% |
| Smartphone | 1,662 | 87.9% |
| Tablet | 1,508 | 79.7% |
| No Computing Device | 0 | 0.0% |
| Total | 1,891 | 100.0% |
Internet Access in Carver
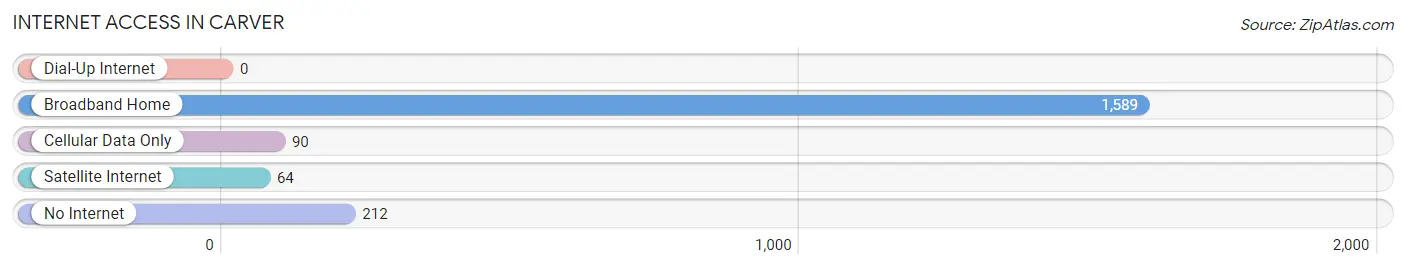
| Internet Type | # Households | % Households |
| Dial-Up Internet | 0 | 0.0% |
| Broadband Home | 1,589 | 84.0% |
| Cellular Data Only | 90 | 4.8% |
| Satellite Internet | 64 | 3.4% |
| No Internet | 212 | 11.2% |
| Total | 1,891 | 100.0% |
Carver Summary
Carver, Minnesota is a small city located in Carver County, Minnesota, United States. The city is situated on the south bank of the Minnesota River, approximately 25 miles southwest of Minneapolis. As of the 2010 census, the population of Carver was 2,561.
History
The area that is now Carver was first settled in 1855 by a group of German immigrants. The town was originally known as Carver Station, named after Jonathan Carver, an explorer who traveled through the area in the late 1700s. The town was officially incorporated in 1887.
In the early 1900s, Carver was a thriving agricultural community. The town was home to several grain elevators, a creamery, and a cheese factory. The town also had a railroad station, which connected it to the larger cities of Minneapolis and St. Paul.
In the 1950s, Carver began to experience a population boom as people moved to the area from the cities. This growth was largely due to the construction of the Minnesota Valley State Recreation Area, which was completed in 1959. The recreation area provided a variety of outdoor activities, such as fishing, boating, and camping.
Geography
Carver is located in Carver County, Minnesota, approximately 25 miles southwest of Minneapolis. The city is situated on the south bank of the Minnesota River. The city has a total area of 2.2 square miles, all of which is land.
The city is located in the Minnesota River Valley, which is a region of rolling hills and wooded areas. The area is known for its natural beauty and is home to a variety of wildlife, including deer, foxes, and bald eagles.
Economy
The economy of Carver is largely based on agriculture and tourism. The city is home to several farms, which produce a variety of crops, including corn, soybeans, and wheat. The city is also home to several wineries, which produce a variety of wines.
The city is also home to several businesses, including a variety of restaurants, retail stores, and service providers. The city is also home to several manufacturing companies, which produce a variety of products, including furniture, clothing, and electronics.
Demographics
As of the 2010 census, the population of Carver was 2,561. The racial makeup of the city was 94.3% White, 0.7% African American, 0.3% Native American, 0.7% Asian, 0.1% Pacific Islander, 1.7% from other races, and 2.1% from two or more races. Hispanic or Latino of any race were 4.2% of the population.
The median household income in Carver was $60,938, and the median family income was $68,958. The per capita income for the city was $25,945. About 4.3% of families and 5.7% of the population were below the poverty line, including 6.3% of those under age 18 and 4.2% of those age 65 or over.
Conclusion
Carver, Minnesota is a small city located in Carver County, Minnesota, United States. The city is situated on the south bank of the Minnesota River, approximately 25 miles southwest of Minneapolis. The city has a long history, dating back to the 1800s when it was first settled by German immigrants. The economy of Carver is largely based on agriculture and tourism, and the city is home to several businesses, including restaurants, retail stores, and manufacturing companies. As of the 2010 census, the population of Carver was 2,561, with a median household income of $60,938.
Common Questions
What is Per Capita Income in Carver?
Per Capita income in Carver is $49,111.
What is the Median Family Income in Carver?
Median Family Income in Carver is $141,094.
What is the Median Household income in Carver?
Median Household Income in Carver is $125,123.
What is Income or Wage Gap in Carver?
Income or Wage Gap in Carver is 24.4%.
Women in Carver earn 75.6 cents for every dollar earned by a man.
What is Inequality or Gini Index in Carver?
Inequality or Gini Index in Carver is 0.36.
What is the Total Population of Carver?
Total Population of Carver is 5,656.
What is the Total Male Population of Carver?
Total Male Population of Carver is 2,853.
What is the Total Female Population of Carver?
Total Female Population of Carver is 2,803.
What is the Ratio of Males per 100 Females in Carver?
There are 101.78 Males per 100 Females in Carver.
What is the Ratio of Females per 100 Males in Carver?
There are 98.25 Females per 100 Males in Carver.
What is the Median Population Age in Carver?
Median Population Age in Carver is 36.9 Years.
What is the Average Family Size in Carver
Average Family Size in Carver is 3.5 People.
What is the Average Household Size in Carver
Average Household Size in Carver is 3.0 People.
How Large is the Labor Force in Carver?
There are 3,183 People in the Labor Forcein in Carver.
What is the Percentage of People in the Labor Force in Carver?
75.1% of People are in the Labor Force in Carver.
What is the Unemployment Rate in Carver?
Unemployment Rate in Carver is 5.5%.