Beaulieu, MN Map & Demographics
Beaulieu Map
Beaulieu Overview
$30,457
PER CAPITA INCOME
$73,125
AVG FAMILY INCOME
$50,000
AVG HOUSEHOLD INCOME
22.0%
WAGE / INCOME GAP [ % ]
78.0¢/ $1
WAGE / INCOME GAP [ $ ]
0.43
INEQUALITY / GINI INDEX
47
TOTAL POPULATION
21
MALE POPULATION
26
FEMALE POPULATION
80.77
MALES / 100 FEMALES
123.81
FEMALES / 100 MALES
55.5
MEDIAN AGE
4.4
AVG FAMILY SIZE
2.9
AVG HOUSEHOLD SIZE
25
LABOR FORCE [ PEOPLE ]
58.1%
PERCENT IN LABOR FORCE
12.0%
UNEMPLOYMENT RATE
Income in Beaulieu
Income Overview in Beaulieu
Per Capita Income in Beaulieu is $30,457, while median incomes of families and households are $73,125 and $50,000 respectively.
| Characteristic | Number | Measure |
| Per Capita Income | 47 | $30,457 |
| Median Family Income | 9 | $73,125 |
| Mean Family Income | 9 | $98,644 |
| Median Household Income | 16 | $50,000 |
| Mean Household Income | 16 | $80,938 |
| Income Deficit | 9 | $0 |
| Wage / Income Gap (%) | 47 | 22.00% |
| Wage / Income Gap ($) | 47 | 78.00¢ per $1 |
| Gini / Inequality Index | 47 | 0.43 |
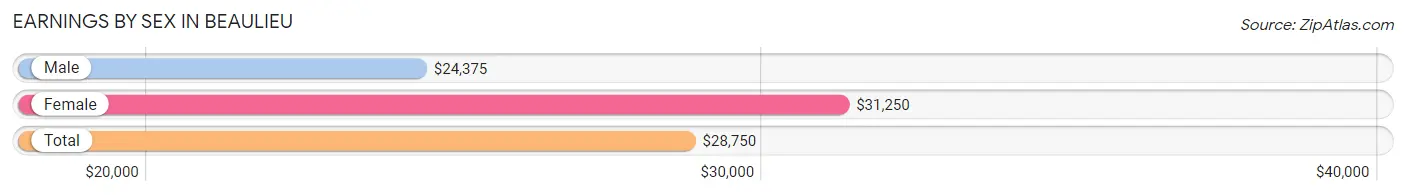
Earnings by Sex in Beaulieu
Average Earnings in Beaulieu are $28,750, $24,375 for men and $31,250 for women, a difference of 22.0%.
| Sex | Number | Average Earnings |
| Male | 9 (36.0%) | $24,375 |
| Female | 16 (64.0%) | $31,250 |
| Total | 25 (100.0%) | $28,750 |
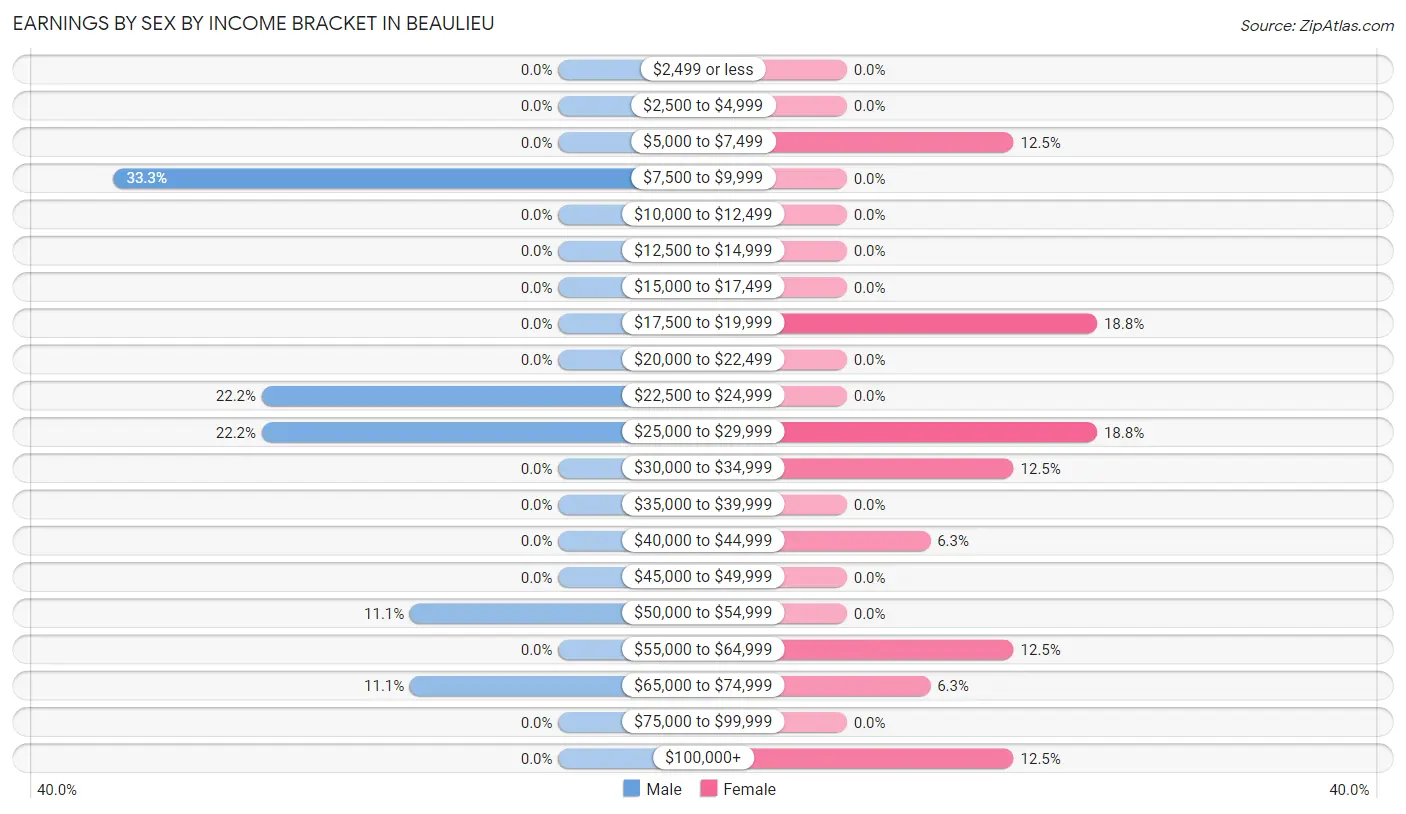
Earnings by Sex by Income Bracket in Beaulieu
The most common earnings brackets in Beaulieu are $7,500 to $9,999 for men (3 | 33.3%) and $17,500 to $19,999 for women (3 | 18.8%).
| Income | Male | Female |
| $2,499 or less | 0 (0.0%) | 0 (0.0%) |
| $2,500 to $4,999 | 0 (0.0%) | 0 (0.0%) |
| $5,000 to $7,499 | 0 (0.0%) | 2 (12.5%) |
| $7,500 to $9,999 | 3 (33.3%) | 0 (0.0%) |
| $10,000 to $12,499 | 0 (0.0%) | 0 (0.0%) |
| $12,500 to $14,999 | 0 (0.0%) | 0 (0.0%) |
| $15,000 to $17,499 | 0 (0.0%) | 0 (0.0%) |
| $17,500 to $19,999 | 0 (0.0%) | 3 (18.8%) |
| $20,000 to $22,499 | 0 (0.0%) | 0 (0.0%) |
| $22,500 to $24,999 | 2 (22.2%) | 0 (0.0%) |
| $25,000 to $29,999 | 2 (22.2%) | 3 (18.8%) |
| $30,000 to $34,999 | 0 (0.0%) | 2 (12.5%) |
| $35,000 to $39,999 | 0 (0.0%) | 0 (0.0%) |
| $40,000 to $44,999 | 0 (0.0%) | 1 (6.2%) |
| $45,000 to $49,999 | 0 (0.0%) | 0 (0.0%) |
| $50,000 to $54,999 | 1 (11.1%) | 0 (0.0%) |
| $55,000 to $64,999 | 0 (0.0%) | 2 (12.5%) |
| $65,000 to $74,999 | 1 (11.1%) | 1 (6.2%) |
| $75,000 to $99,999 | 0 (0.0%) | 0 (0.0%) |
| $100,000+ | 0 (0.0%) | 2 (12.5%) |
| Total | 9 (100.0%) | 16 (100.0%) |
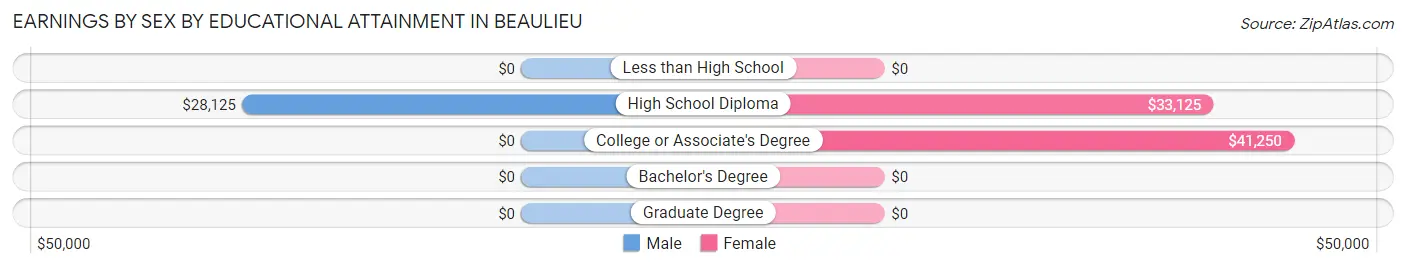
Earnings by Sex by Educational Attainment in Beaulieu
Average earnings in Beaulieu are $28,750 for men and $34,375 for women, a difference of 16.4%. Men with an educational attainment of high school diploma enjoy the highest average annual earnings of $28,125, while those with high school diploma education earn the least with $28,125. Women with an educational attainment of college or associate's degree earn the most with the average annual earnings of $41,250, while those with high school diploma education have the smallest earnings of $33,125.
| Educational Attainment | Male Income | Female Income |
| Less than High School | - | - |
| High School Diploma | $28,125 | $33,125 |
| College or Associate's Degree | - | - |
| Bachelor's Degree | - | - |
| Graduate Degree | - | - |
| Total | $28,750 | $34,375 |
Family Income in Beaulieu
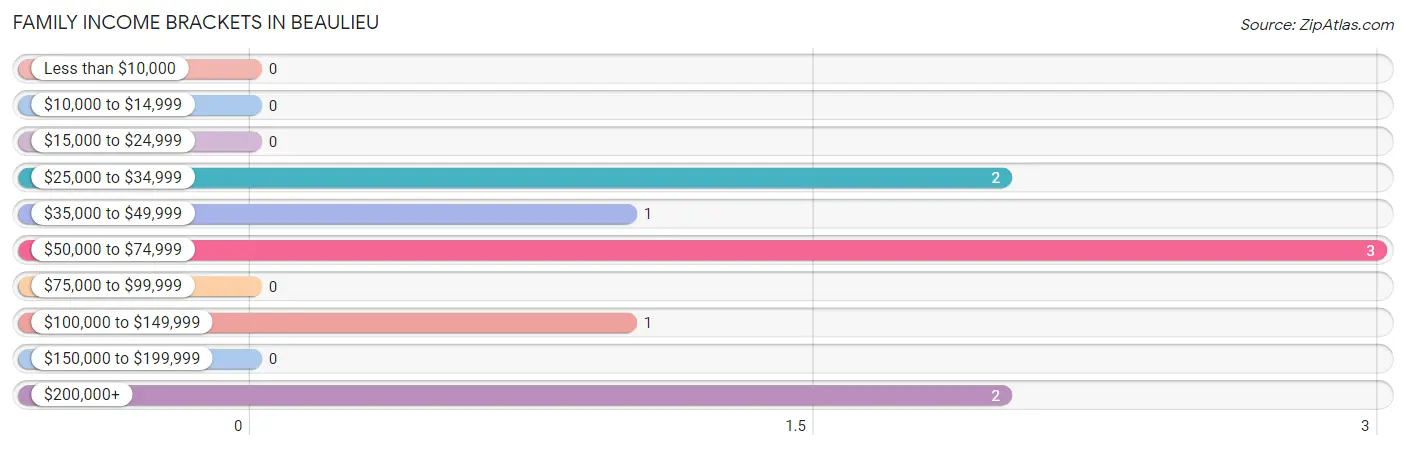
Family Income Brackets in Beaulieu
According to the Beaulieu family income data, there are 3 families falling into the $50,000 to $74,999 income range, which is the most common income bracket and makes up 33.3% of all families.
| Income Bracket | # Families | % Families |
| Less than $10,000 | 0 | 0.0% |
| $10,000 to $14,999 | 0 | 0.0% |
| $15,000 to $24,999 | 0 | 0.0% |
| $25,000 to $34,999 | 2 | 22.2% |
| $35,000 to $49,999 | 1 | 11.1% |
| $50,000 to $74,999 | 3 | 33.3% |
| $75,000 to $99,999 | 0 | 0.0% |
| $100,000 to $149,999 | 1 | 11.1% |
| $150,000 to $199,999 | 0 | 0.0% |
| $200,000+ | 2 | 22.2% |
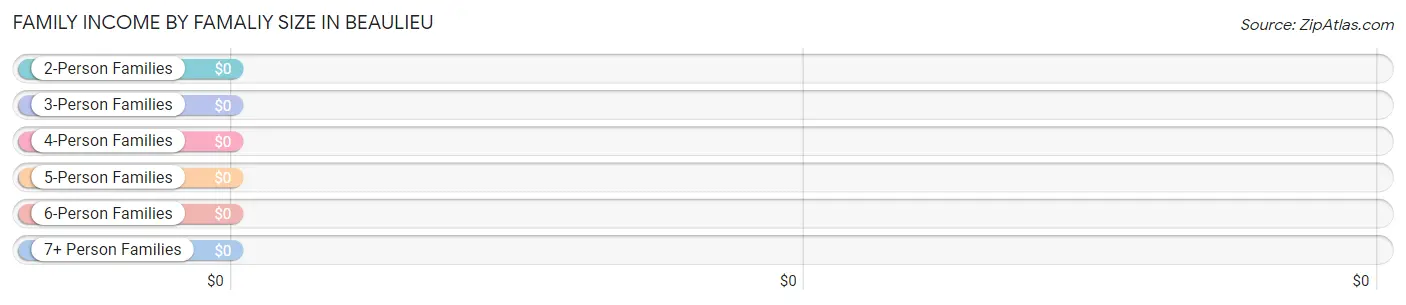
Family Income by Famaliy Size in Beaulieu
| Income Bracket | # Families | Median Income |
| 2-Person Families | 4 (44.4%) | $0 |
| 3-Person Families | 2 (22.2%) | $0 |
| 4-Person Families | 1 (11.1%) | $0 |
| 5-Person Families | 2 (22.2%) | $0 |
| 6-Person Families | 0 (0.0%) | $0 |
| 7+ Person Families | 0 (0.0%) | $0 |
| Total | 9 (100.0%) | $73,125 |
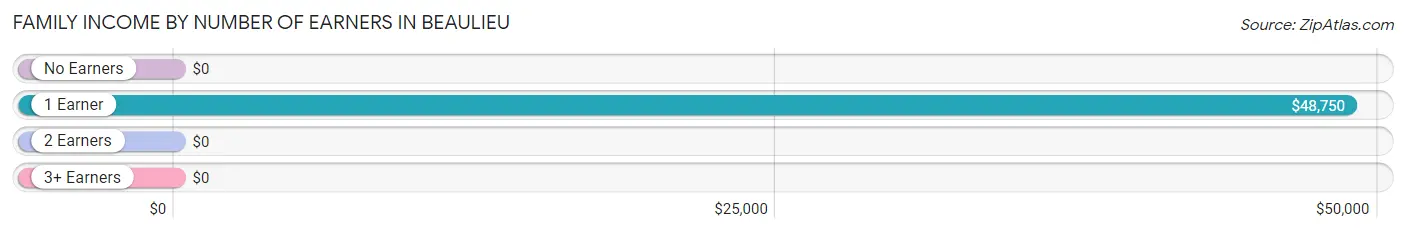
Family Income by Number of Earners in Beaulieu
| Number of Earners | # Families | Median Income |
| No Earners | 1 (11.1%) | $0 |
| 1 Earner | 3 (33.3%) | $48,750 |
| 2 Earners | 1 (11.1%) | $0 |
| 3+ Earners | 4 (44.4%) | $0 |
| Total | 9 (100.0%) | $73,125 |
Household Income in Beaulieu
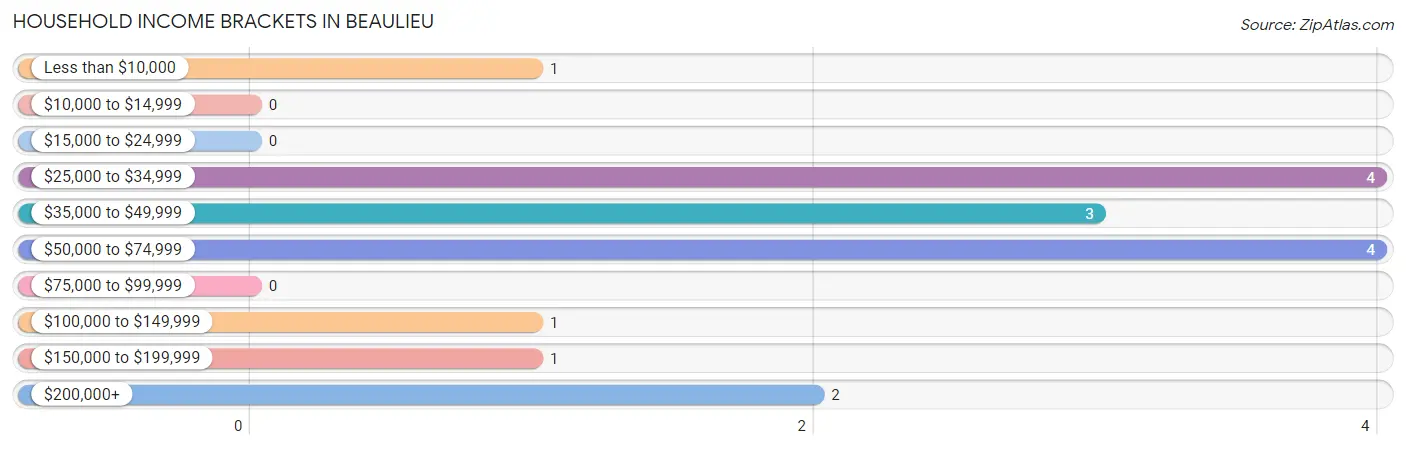
Household Income Brackets in Beaulieu
With 4 households falling in the category, the $25,000 to $34,999 income range is the most frequent in Beaulieu, accounting for 25.0% of all households.
| Income Bracket | # Households | % Households |
| Less than $10,000 | 1 | 6.3% |
| $10,000 to $14,999 | 0 | 0.0% |
| $15,000 to $24,999 | 0 | 0.0% |
| $25,000 to $34,999 | 4 | 25.0% |
| $35,000 to $49,999 | 3 | 18.8% |
| $50,000 to $74,999 | 4 | 25.0% |
| $75,000 to $99,999 | 0 | 0.0% |
| $100,000 to $149,999 | 1 | 6.3% |
| $150,000 to $199,999 | 1 | 6.3% |
| $200,000+ | 2 | 12.5% |
Household Income by Householder Age in Beaulieu
The median household income in Beaulieu is $50,000, with the highest median household income of $73,125 found in the 45 to 64 years age bracket for the primary householder. A total of 7 households (43.8%) fall into this category.
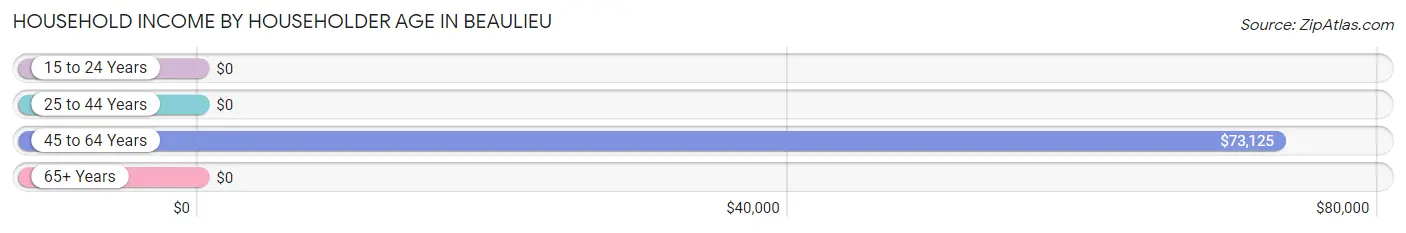
| Income Bracket | # Households | Median Income |
| 15 to 24 Years | 0 (0.0%) | $0 |
| 25 to 44 Years | 1 (6.2%) | $0 |
| 45 to 64 Years | 7 (43.8%) | $73,125 |
| 65+ Years | 8 (50.0%) | $0 |
| Total | 16 (100.0%) | $50,000 |
Poverty in Beaulieu
Income Below Poverty by Sex and Age in Beaulieu
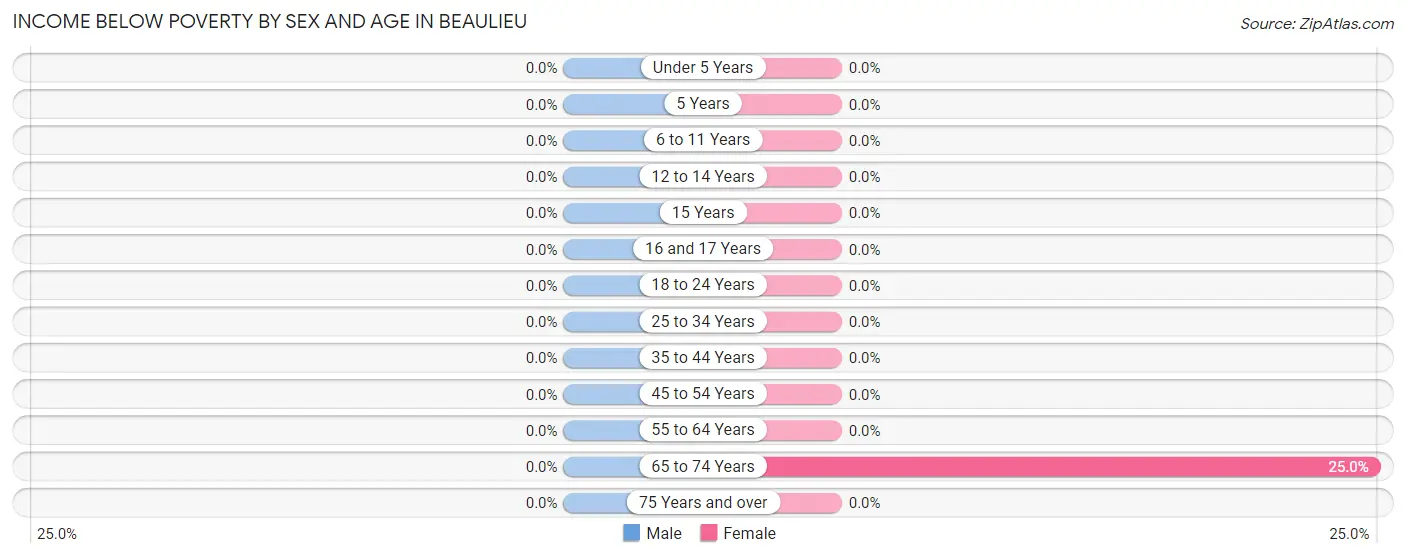
| Age Bracket | Male | Female |
| Under 5 Years | 0 (0.0%) | 0 (0.0%) |
| 5 Years | 0 (0.0%) | 0 (0.0%) |
| 6 to 11 Years | 0 (0.0%) | 0 (0.0%) |
| 12 to 14 Years | 0 (0.0%) | 0 (0.0%) |
| 15 Years | 0 (0.0%) | 0 (0.0%) |
| 16 and 17 Years | 0 (0.0%) | 0 (0.0%) |
| 18 to 24 Years | 0 (0.0%) | 0 (0.0%) |
| 25 to 34 Years | 0 (0.0%) | 0 (0.0%) |
| 35 to 44 Years | 0 (0.0%) | 0 (0.0%) |
| 45 to 54 Years | 0 (0.0%) | 0 (0.0%) |
| 55 to 64 Years | 0 (0.0%) | 0 (0.0%) |
| 65 to 74 Years | 0 (0.0%) | 1 (25.0%) |
| 75 Years and over | 0 (0.0%) | 0 (0.0%) |
| Total | 0 (0.0%) | 1 (3.8%) |
Income Above Poverty by Sex and Age in Beaulieu
According to the poverty statistics in Beaulieu, males aged under 5 years and females aged 5 years are the age groups that are most secure financially, with 100.0% of males and 100.0% of females in these age groups living above the poverty line.
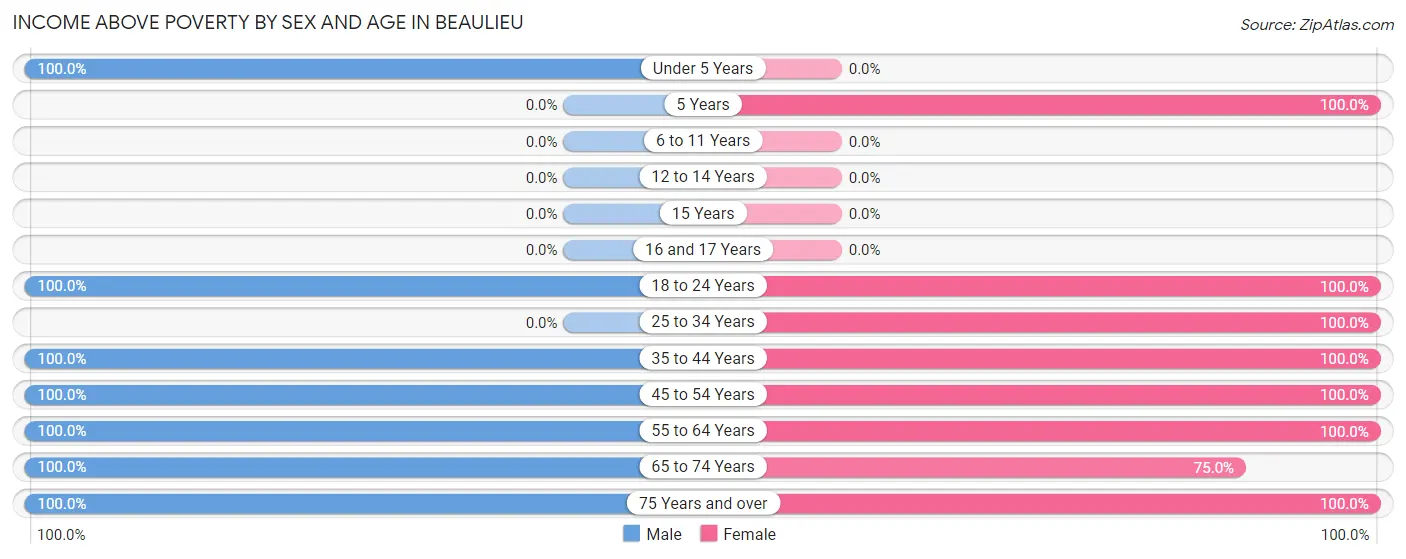
| Age Bracket | Male | Female |
| Under 5 Years | 2 (100.0%) | 0 (0.0%) |
| 5 Years | 0 (0.0%) | 2 (100.0%) |
| 6 to 11 Years | 0 (0.0%) | 0 (0.0%) |
| 12 to 14 Years | 0 (0.0%) | 0 (0.0%) |
| 15 Years | 0 (0.0%) | 0 (0.0%) |
| 16 and 17 Years | 0 (0.0%) | 0 (0.0%) |
| 18 to 24 Years | 3 (100.0%) | 3 (100.0%) |
| 25 to 34 Years | 0 (0.0%) | 3 (100.0%) |
| 35 to 44 Years | 1 (100.0%) | 5 (100.0%) |
| 45 to 54 Years | 2 (100.0%) | 2 (100.0%) |
| 55 to 64 Years | 3 (100.0%) | 2 (100.0%) |
| 65 to 74 Years | 1 (100.0%) | 3 (75.0%) |
| 75 Years and over | 9 (100.0%) | 5 (100.0%) |
| Total | 21 (100.0%) | 25 (96.2%) |
Income Below Poverty Among Married-Couple Families in Beaulieu
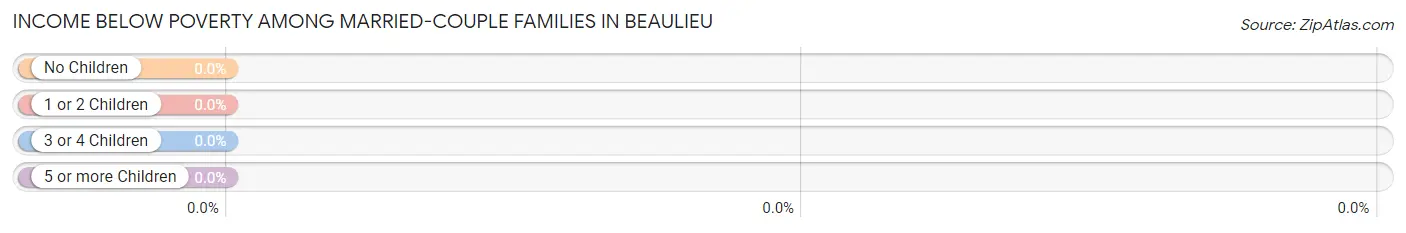
| Children | Above Poverty | Below Poverty |
| No Children | 4 (100.0%) | 0 (0.0%) |
| 1 or 2 Children | 0 (0.0%) | 0 (0.0%) |
| 3 or 4 Children | 0 (0.0%) | 0 (0.0%) |
| 5 or more Children | 0 (0.0%) | 0 (0.0%) |
| Total | 4 (100.0%) | 0 (0.0%) |
Income Below Poverty Among Single-Parent Households in Beaulieu
| Children | Single Father | Single Mother |
| No Children | 0 (0.0%) | 0 (0.0%) |
| 1 or 2 Children | 0 (0.0%) | 0 (0.0%) |
| 3 or 4 Children | 0 (0.0%) | 0 (0.0%) |
| 5 or more Children | 0 (0.0%) | 0 (0.0%) |
| Total | 0 (0.0%) | 0 (0.0%) |
Income Below Poverty Among Married-Couple vs Single-Parent Households in Beaulieu
| Children | Married-Couple Families | Single-Parent Households |
| No Children | 0 (0.0%) | 0 (0.0%) |
| 1 or 2 Children | 0 (0.0%) | 0 (0.0%) |
| 3 or 4 Children | 0 (0.0%) | 0 (0.0%) |
| 5 or more Children | 0 (0.0%) | 0 (0.0%) |
| Total | 0 (0.0%) | 0 (0.0%) |
Race in Beaulieu
The most populous races in Beaulieu are White / Caucasian (25 | 53.2%), Two or more Races (14 | 29.8%), and Some other Race (7 | 14.9%).
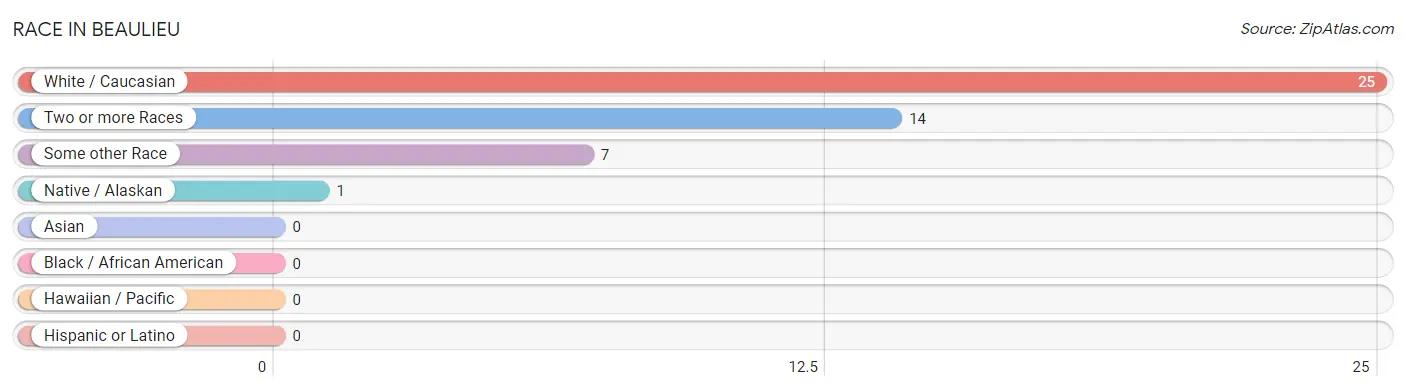
| Race | # Population | % Population |
| Asian | 0 | 0.0% |
| Black / African American | 0 | 0.0% |
| Hawaiian / Pacific | 0 | 0.0% |
| Hispanic or Latino | 0 | 0.0% |
| Native / Alaskan | 1 | 2.1% |
| White / Caucasian | 25 | 53.2% |
| Two or more Races | 14 | 29.8% |
| Some other Race | 7 | 14.9% |
| Total | 47 | 100.0% |
Ancestry in Beaulieu
The most populous ancestries reported in Beaulieu are German (19 | 40.4%), Norwegian (8 | 17.0%), Chippewa (6 | 12.8%), Swiss (6 | 12.8%), and English (4 | 8.5%), together accounting for 91.5% of all Beaulieu residents.
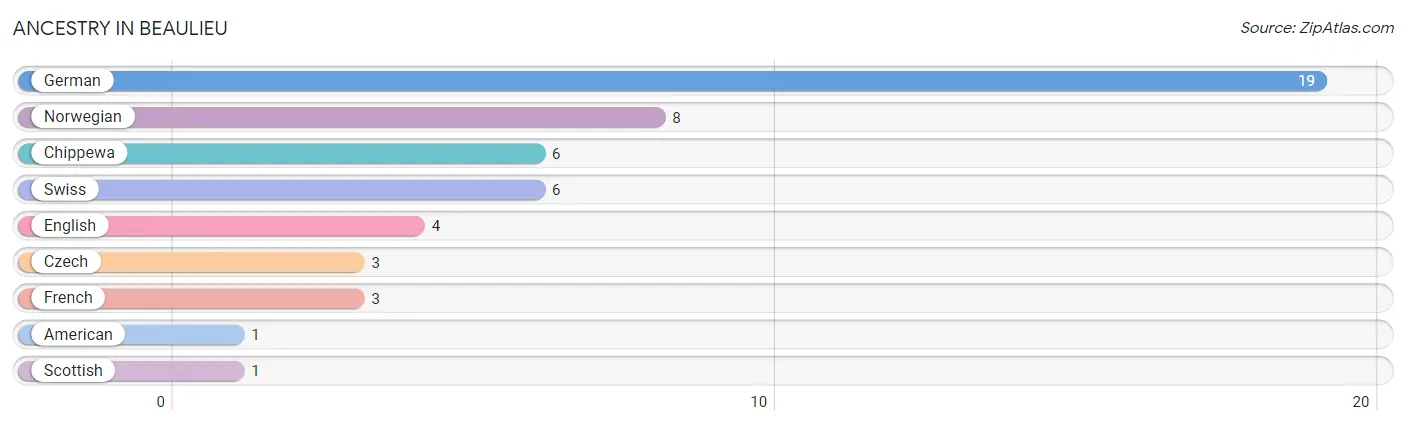
| Ancestry | # Population | % Population |
| American | 1 | 2.1% |
| Chippewa | 6 | 12.8% |
| Czech | 3 | 6.4% |
| English | 4 | 8.5% |
| French | 3 | 6.4% |
| German | 19 | 40.4% |
| Norwegian | 8 | 17.0% |
| Scottish | 1 | 2.1% |
| Swiss | 6 | 12.8% | View All 9 Rows |
Immigrants in Beaulieu

| Immigration Origin | # Population | % Population | View All 0 Rows |
Sex and Age in Beaulieu
Sex and Age in Beaulieu
The most populous age groups in Beaulieu are 80 to 84 Years (7 | 33.3%) for men and 20 to 24 Years (3 | 11.5%) for women.
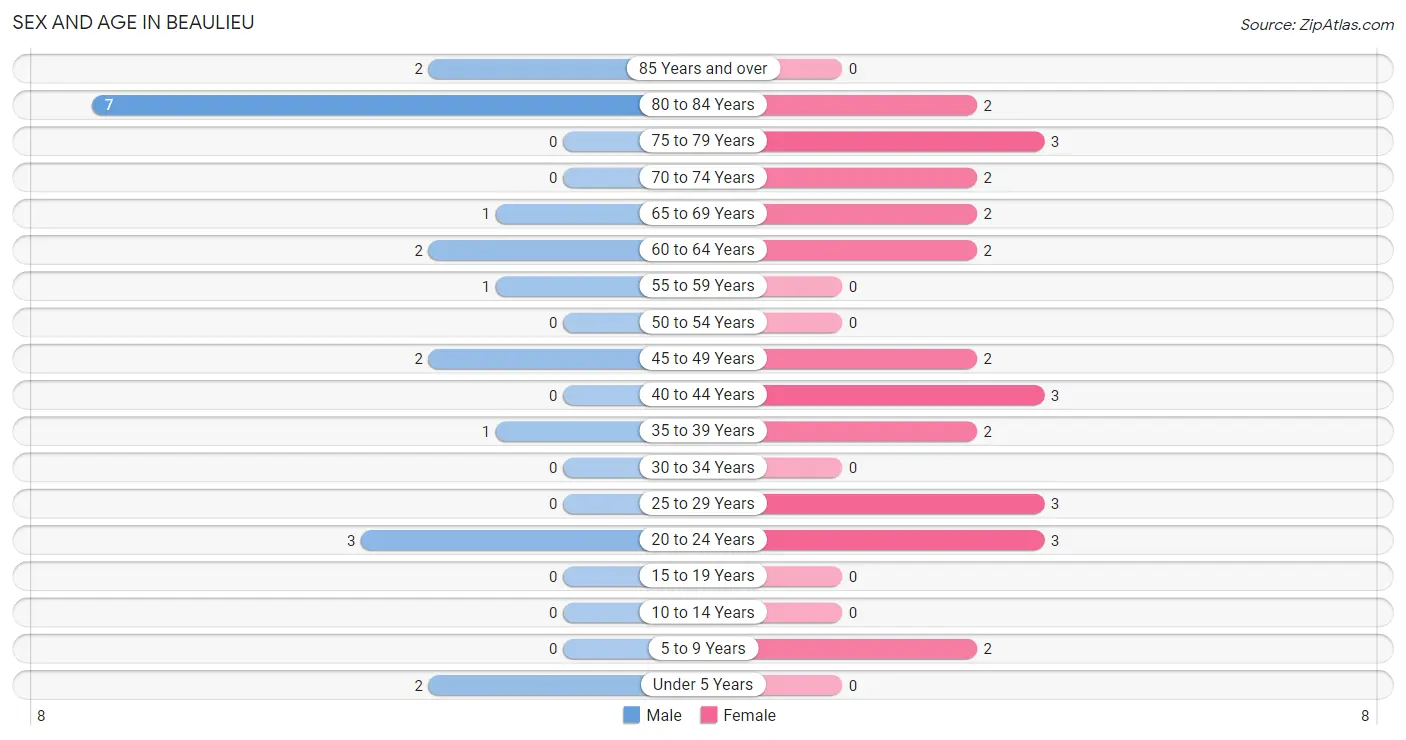
| Age Bracket | Male | Female |
| Under 5 Years | 2 (9.5%) | 0 (0.0%) |
| 5 to 9 Years | 0 (0.0%) | 2 (7.7%) |
| 10 to 14 Years | 0 (0.0%) | 0 (0.0%) |
| 15 to 19 Years | 0 (0.0%) | 0 (0.0%) |
| 20 to 24 Years | 3 (14.3%) | 3 (11.5%) |
| 25 to 29 Years | 0 (0.0%) | 3 (11.5%) |
| 30 to 34 Years | 0 (0.0%) | 0 (0.0%) |
| 35 to 39 Years | 1 (4.8%) | 2 (7.7%) |
| 40 to 44 Years | 0 (0.0%) | 3 (11.5%) |
| 45 to 49 Years | 2 (9.5%) | 2 (7.7%) |
| 50 to 54 Years | 0 (0.0%) | 0 (0.0%) |
| 55 to 59 Years | 1 (4.8%) | 0 (0.0%) |
| 60 to 64 Years | 2 (9.5%) | 2 (7.7%) |
| 65 to 69 Years | 1 (4.8%) | 2 (7.7%) |
| 70 to 74 Years | 0 (0.0%) | 2 (7.7%) |
| 75 to 79 Years | 0 (0.0%) | 3 (11.5%) |
| 80 to 84 Years | 7 (33.3%) | 2 (7.7%) |
| 85 Years and over | 2 (9.5%) | 0 (0.0%) |
| Total | 21 (100.0%) | 26 (100.0%) |
Families and Households in Beaulieu
Median Family Size in Beaulieu
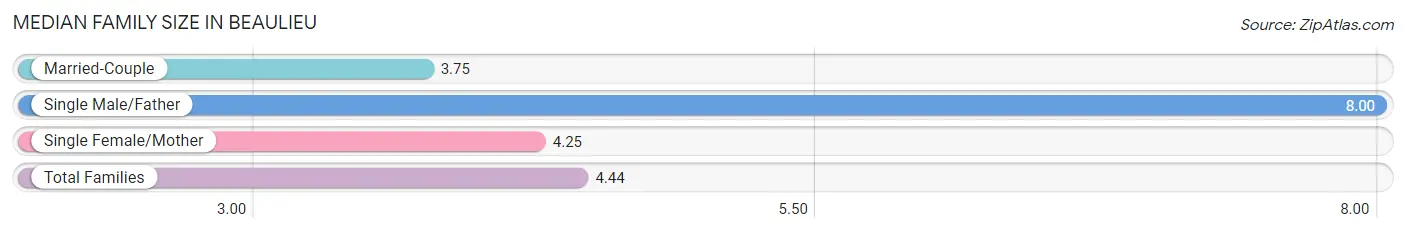
The median family size in Beaulieu is 4.44 persons per family, with single male/father families (1 | 11.1%) accounting for the largest median family size of 8 persons per family. On the other hand, married-couple families (4 | 44.4%) represent the smallest median family size with 3.75 persons per family.
| Family Type | # Families | Family Size |
| Married-Couple | 4 (44.4%) | 3.75 |
| Single Male/Father | 1 (11.1%) | 8.00 |
| Single Female/Mother | 4 (44.4%) | 4.25 |
| Total Families | 9 (100.0%) | 4.44 |
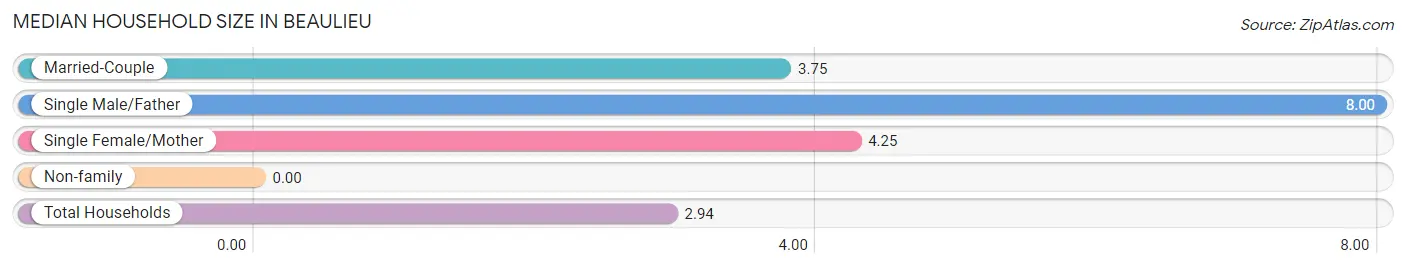
Median Household Size in Beaulieu
| Household Type | # Households | Household Size |
| Married-Couple | 4 (25.0%) | 3.75 |
| Single Male/Father | 1 (6.2%) | 8.00 |
| Single Female/Mother | 4 (25.0%) | 4.25 |
| Non-family | 7 (43.8%) | - |
| Total Households | 16 (100.0%) | 2.94 |
Household Size by Marriage Status in Beaulieu
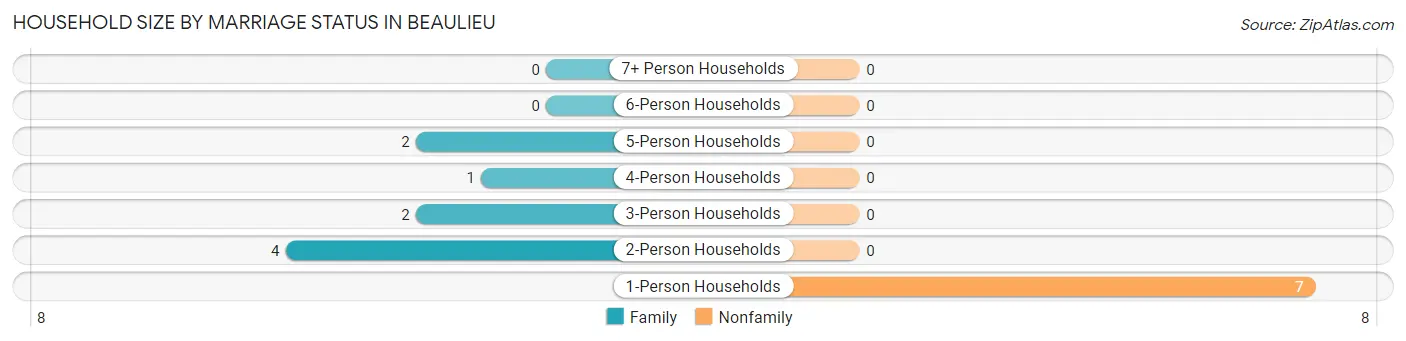
Out of a total of 16 households in Beaulieu, 9 (56.2%) are family households, while 7 (43.8%) are nonfamily households. The most numerous type of family households are 2-person households, comprising 4, and the most common type of nonfamily households are 1-person households, comprising 7.
| Household Size | Family Households | Nonfamily Households |
| 1-Person Households | - | 7 (43.8%) |
| 2-Person Households | 4 (25.0%) | 0 (0.0%) |
| 3-Person Households | 2 (12.5%) | 0 (0.0%) |
| 4-Person Households | 1 (6.2%) | 0 (0.0%) |
| 5-Person Households | 2 (12.5%) | 0 (0.0%) |
| 6-Person Households | 0 (0.0%) | 0 (0.0%) |
| 7+ Person Households | 0 (0.0%) | 0 (0.0%) |
| Total | 9 (56.2%) | 7 (43.8%) |
Female Fertility in Beaulieu
Fertility by Age in Beaulieu
| Age Bracket | Women with Births | Births / 1,000 Women |
| 15 to 19 years | 0 (0.0%) | 0.0 |
| 20 to 34 years | 0 (0.0%) | 0.0 |
| 35 to 50 years | 0 (0.0%) | 0.0 |
| Total | 0 (0.0%) | 0.0 |
Fertility by Age by Marriage Status in Beaulieu
| Age Bracket | Married | Unmarried |
| 15 to 19 years | 0 (0.0%) | 0 (0.0%) |
| 20 to 34 years | 0 (0.0%) | 0 (0.0%) |
| 35 to 50 years | 0 (0.0%) | 0 (0.0%) |
| Total | 0 (0.0%) | 0 (0.0%) |
Fertility by Education in Beaulieu
| Educational Attainment | Women with Births | Births / 1,000 Women |
| Less than High School | 0 (0.0%) | 0.0 |
| High School Diploma | 0 (0.0%) | 0.0 |
| College or Associate's Degree | 0 (0.0%) | 0.0 |
| Bachelor's Degree | 0 (0.0%) | 0.0 |
| Graduate Degree | 0 (0.0%) | 0.0 |
| Total | 0 (0.0%) | 0.0 |
Fertility by Education by Marriage Status in Beaulieu
| Educational Attainment | Married | Unmarried |
| Less than High School | 0 (0.0%) | 0 (0.0%) |
| High School Diploma | 0 (0.0%) | 0 (0.0%) |
| College or Associate's Degree | 0 (0.0%) | 0 (0.0%) |
| Bachelor's Degree | 0 (0.0%) | 0 (0.0%) |
| Graduate Degree | 0 (0.0%) | 0 (0.0%) |
| Total | 0 (0.0%) | 0 (0.0%) |
Employment Characteristics in Beaulieu
Employment by Class of Employer in Beaulieu
Among the 20 employed individuals in Beaulieu, not-for-profit organizations (5 | 25.0%), self-employed (incorporated) (4 | 20.0%), and local government employees (4 | 20.0%) make up the most common classes of employment.
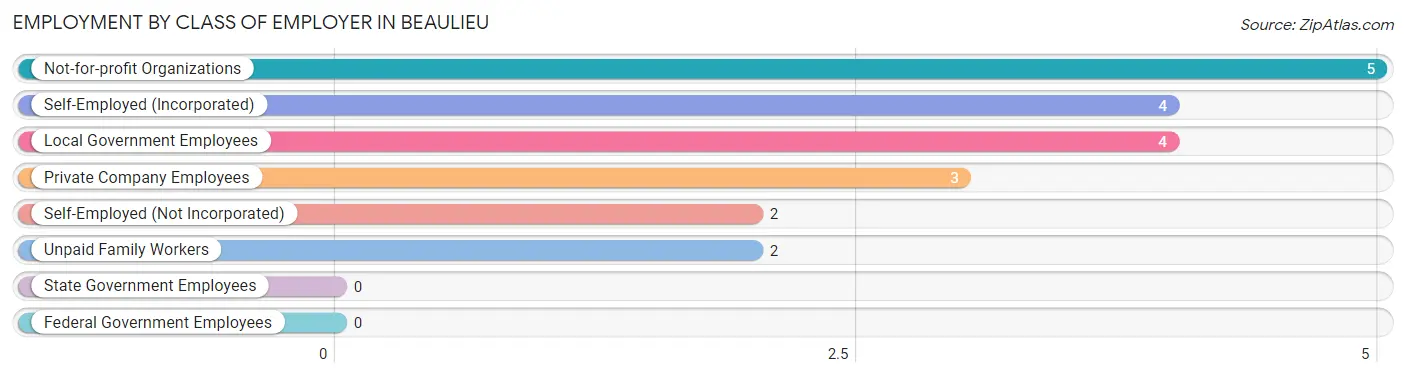
| Employer Class | # Employees | % Employees |
| Private Company Employees | 3 | 15.0% |
| Self-Employed (Incorporated) | 4 | 20.0% |
| Self-Employed (Not Incorporated) | 2 | 10.0% |
| Not-for-profit Organizations | 5 | 25.0% |
| Local Government Employees | 4 | 20.0% |
| State Government Employees | 0 | 0.0% |
| Federal Government Employees | 0 | 0.0% |
| Unpaid Family Workers | 2 | 10.0% |
| Total | 20 | 100.0% |
Employment Status by Age in Beaulieu
According to the labor force statistics for Beaulieu, out of the total population over 16 years of age (43), 58.1% or 25 individuals are in the labor force, with 12.0% or 3 of them unemployed. The age group with the highest labor force participation rate is 20 to 24 years, with 100.0% or 6 individuals in the labor force. Within the labor force, the 20 to 24 years age range has the highest percentage of unemployed individuals, with 50.0% or 3 of them being unemployed.
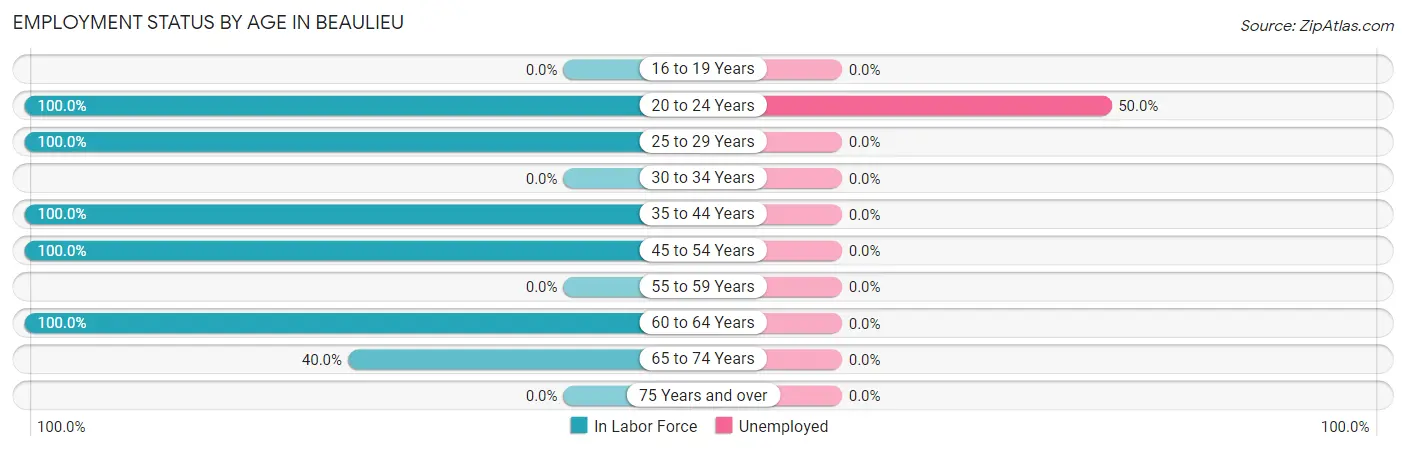
| Age Bracket | In Labor Force | Unemployed |
| 16 to 19 Years | 0 (0.0%) | 0 (0.0%) |
| 20 to 24 Years | 6 (100.0%) | 3 (50.0%) |
| 25 to 29 Years | 3 (100.0%) | 0 (0.0%) |
| 30 to 34 Years | 0 (0.0%) | 0 (0.0%) |
| 35 to 44 Years | 6 (100.0%) | 0 (0.0%) |
| 45 to 54 Years | 4 (100.0%) | 0 (0.0%) |
| 55 to 59 Years | 0 (0.0%) | 0 (0.0%) |
| 60 to 64 Years | 4 (100.0%) | 0 (0.0%) |
| 65 to 74 Years | 2 (40.0%) | 0 (0.0%) |
| 75 Years and over | 0 (0.0%) | 0 (0.0%) |
| Total | 25 (58.1%) | 3 (12.0%) |
Employment Status by Educational Attainment in Beaulieu
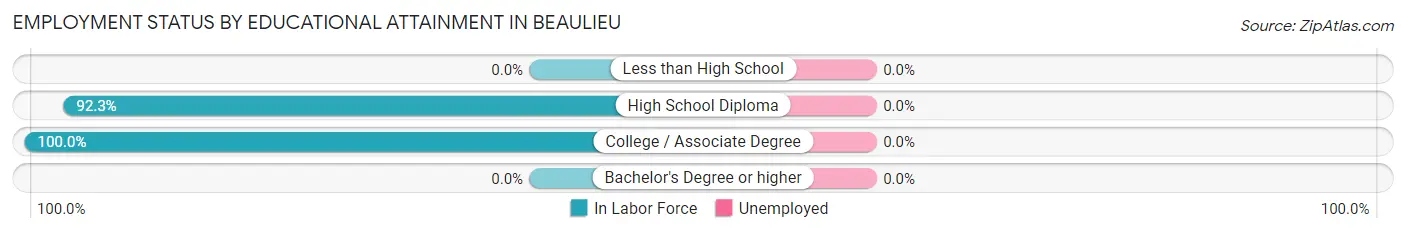
| Educational Attainment | In Labor Force | Unemployed |
| Less than High School | 0 (0.0%) | 0 (0.0%) |
| High School Diploma | 12 (92.3%) | 0 (0.0%) |
| College / Associate Degree | 5 (100.0%) | 0 (0.0%) |
| Bachelor's Degree or higher | 0 (0.0%) | 0 (0.0%) |
| Total | 17 (94.4%) | 0 (0.0%) |
Employment Occupations by Sex in Beaulieu
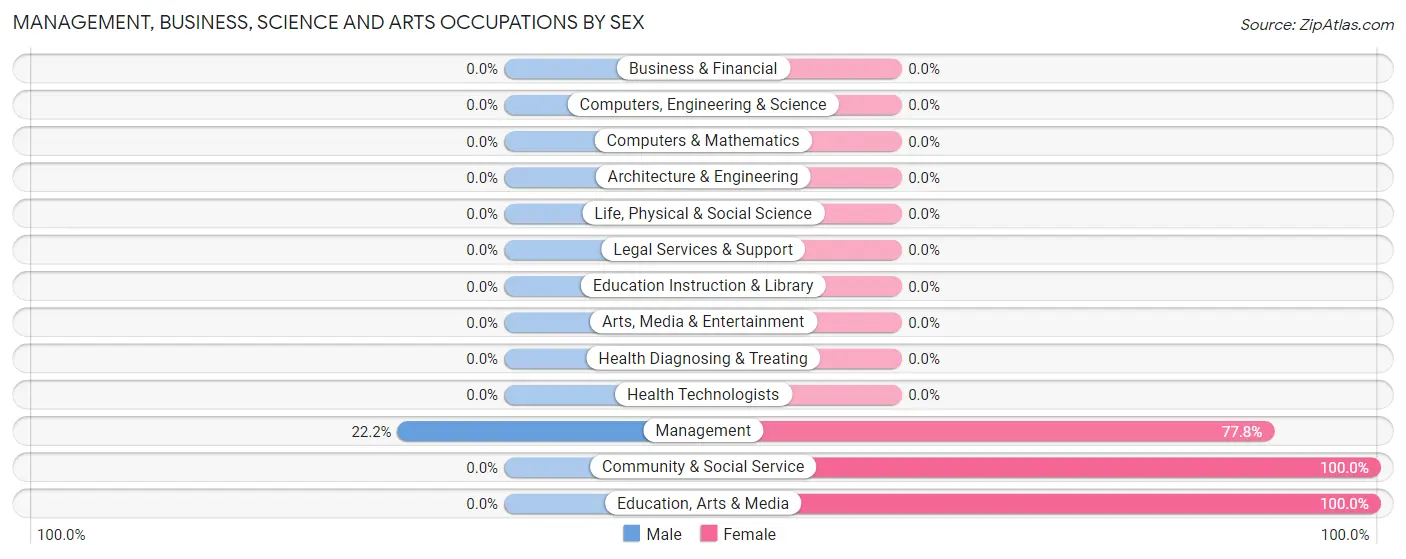
Management, Business, Science and Arts Occupations
The most common Management, Business, Science and Arts occupations in Beaulieu are Management (9 | 40.9%), Community & Social Service (1 | 4.5%), and Education, Arts & Media (1 | 4.5%).
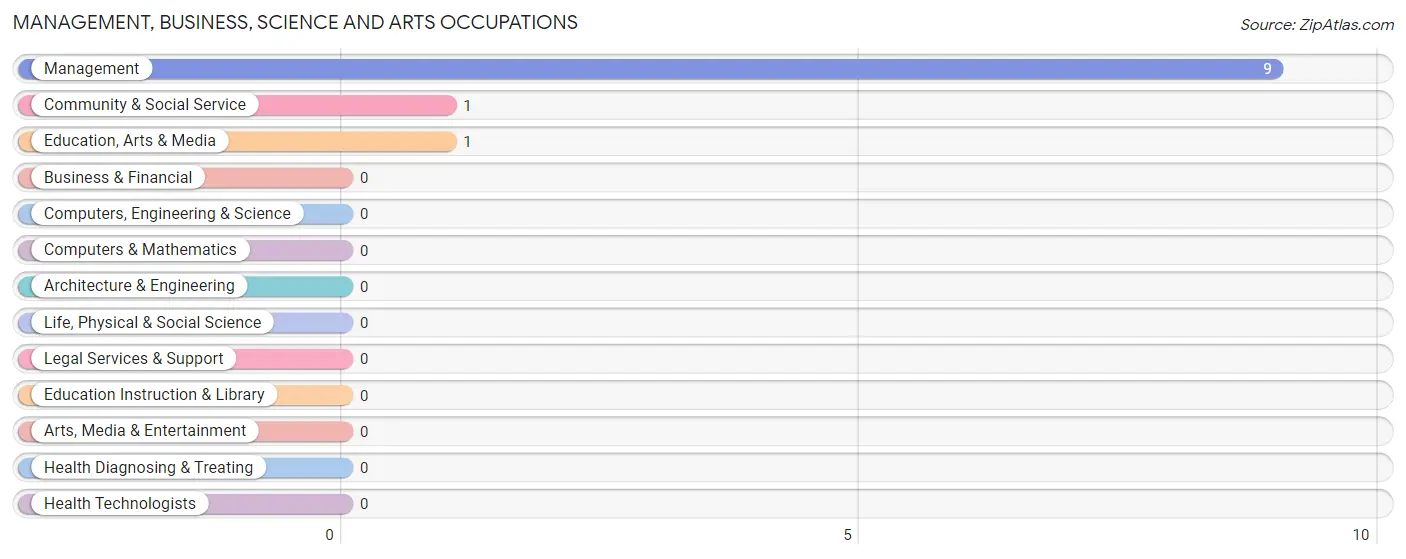
Management, Business, Science and Arts Occupations by Sex
| Occupation | Male | Female |
| Management | 2 (22.2%) | 7 (77.8%) |
| Business & Financial | 0 (0.0%) | 0 (0.0%) |
| Computers, Engineering & Science | 0 (0.0%) | 0 (0.0%) |
| Computers & Mathematics | 0 (0.0%) | 0 (0.0%) |
| Architecture & Engineering | 0 (0.0%) | 0 (0.0%) |
| Life, Physical & Social Science | 0 (0.0%) | 0 (0.0%) |
| Community & Social Service | 0 (0.0%) | 1 (100.0%) |
| Education, Arts & Media | 0 (0.0%) | 1 (100.0%) |
| Legal Services & Support | 0 (0.0%) | 0 (0.0%) |
| Education Instruction & Library | 0 (0.0%) | 0 (0.0%) |
| Arts, Media & Entertainment | 0 (0.0%) | 0 (0.0%) |
| Health Diagnosing & Treating | 0 (0.0%) | 0 (0.0%) |
| Health Technologists | 0 (0.0%) | 0 (0.0%) |
| Total (Category) | 2 (20.0%) | 8 (80.0%) |
| Total (Overall) | 9 (40.9%) | 13 (59.1%) |
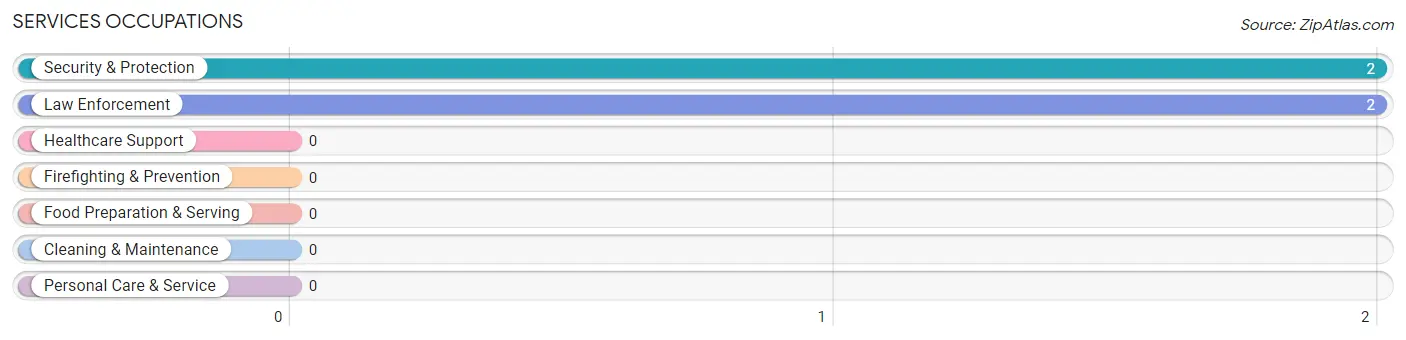
Services Occupations
The most common Services occupations in Beaulieu are Security & Protection (2 | 9.1%), and Law Enforcement (2 | 9.1%).
Services Occupations by Sex
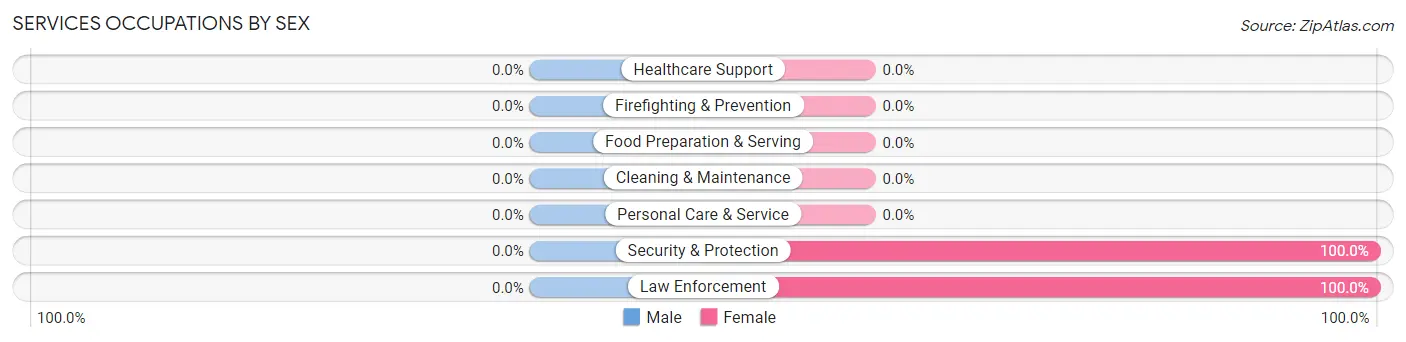
| Occupation | Male | Female |
| Healthcare Support | 0 (0.0%) | 0 (0.0%) |
| Security & Protection | 0 (0.0%) | 2 (100.0%) |
| Firefighting & Prevention | 0 (0.0%) | 0 (0.0%) |
| Law Enforcement | 0 (0.0%) | 2 (100.0%) |
| Food Preparation & Serving | 0 (0.0%) | 0 (0.0%) |
| Cleaning & Maintenance | 0 (0.0%) | 0 (0.0%) |
| Personal Care & Service | 0 (0.0%) | 0 (0.0%) |
| Total (Category) | 0 (0.0%) | 2 (100.0%) |
| Total (Overall) | 9 (40.9%) | 13 (59.1%) |
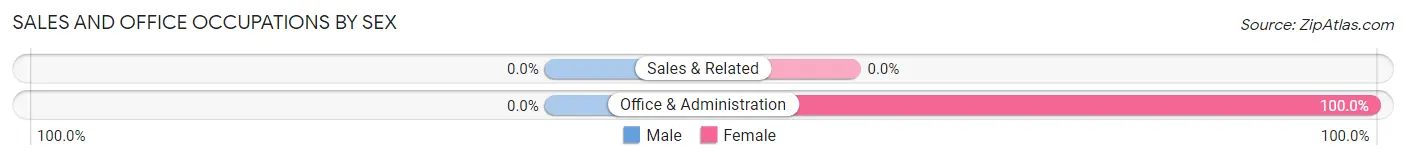
Sales and Office Occupations
The most common Sales and Office occupations in Beaulieu are , and Office & Administration (3 | 13.6%).

Sales and Office Occupations by Sex
| Occupation | Male | Female |
| Sales & Related | 0 (0.0%) | 0 (0.0%) |
| Office & Administration | 0 (0.0%) | 3 (100.0%) |
| Total (Category) | 0 (0.0%) | 3 (100.0%) |
| Total (Overall) | 9 (40.9%) | 13 (59.1%) |
Natural Resources, Construction and Maintenance Occupations
The most common Natural Resources, Construction and Maintenance occupations in Beaulieu are , and Installation, Maintenance & Repair (2 | 9.1%).
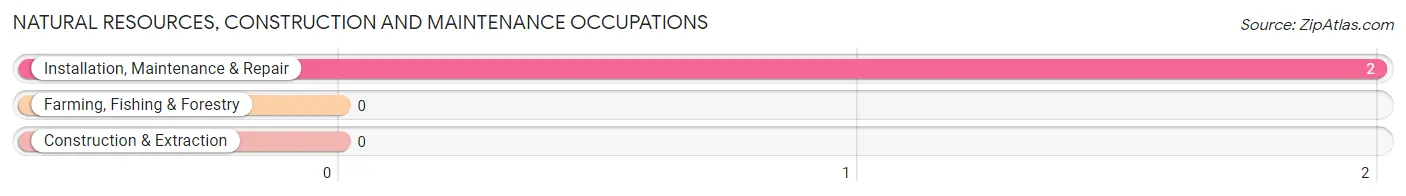
Natural Resources, Construction and Maintenance Occupations by Sex
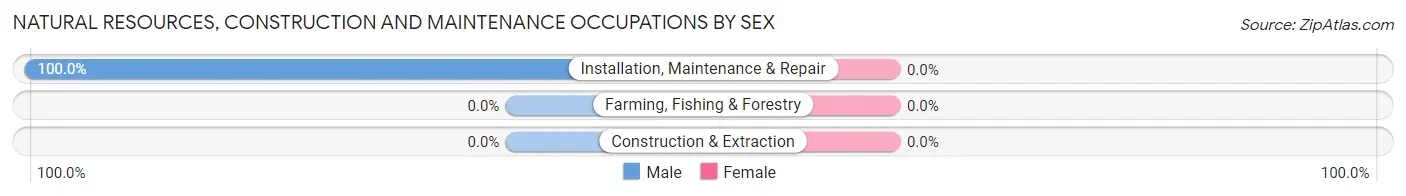
| Occupation | Male | Female |
| Farming, Fishing & Forestry | 0 (0.0%) | 0 (0.0%) |
| Construction & Extraction | 0 (0.0%) | 0 (0.0%) |
| Installation, Maintenance & Repair | 2 (100.0%) | 0 (0.0%) |
| Total (Category) | 2 (100.0%) | 0 (0.0%) |
| Total (Overall) | 9 (40.9%) | 13 (59.1%) |
Production, Transportation and Moving Occupations
The most common Production, Transportation and Moving occupations in Beaulieu are , and Transportation (5 | 22.7%).
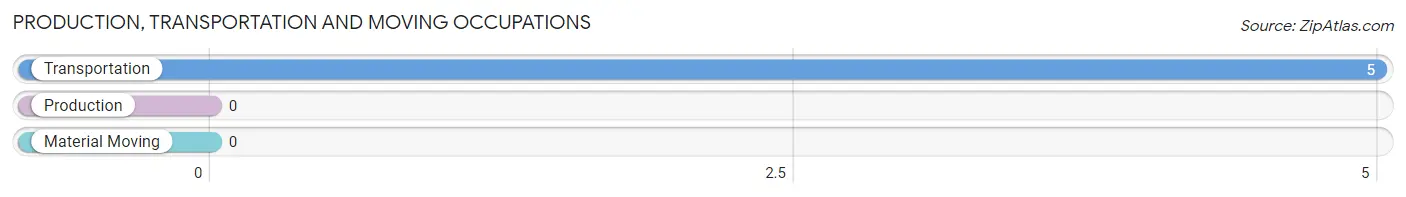
Production, Transportation and Moving Occupations by Sex
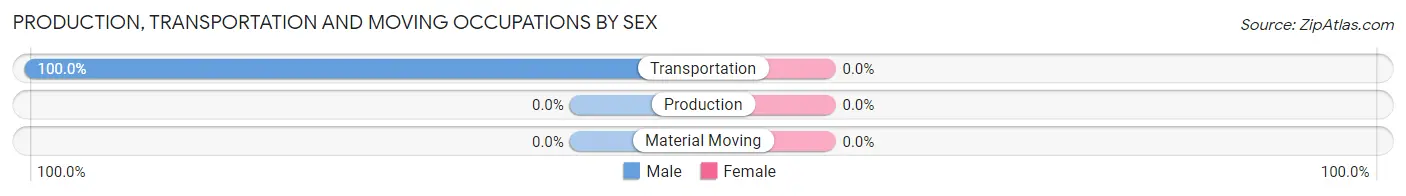
| Occupation | Male | Female |
| Production | 0 (0.0%) | 0 (0.0%) |
| Transportation | 5 (100.0%) | 0 (0.0%) |
| Material Moving | 0 (0.0%) | 0 (0.0%) |
| Total (Category) | 5 (100.0%) | 0 (0.0%) |
| Total (Overall) | 9 (40.9%) | 13 (59.1%) |
Employment Industries by Sex in Beaulieu
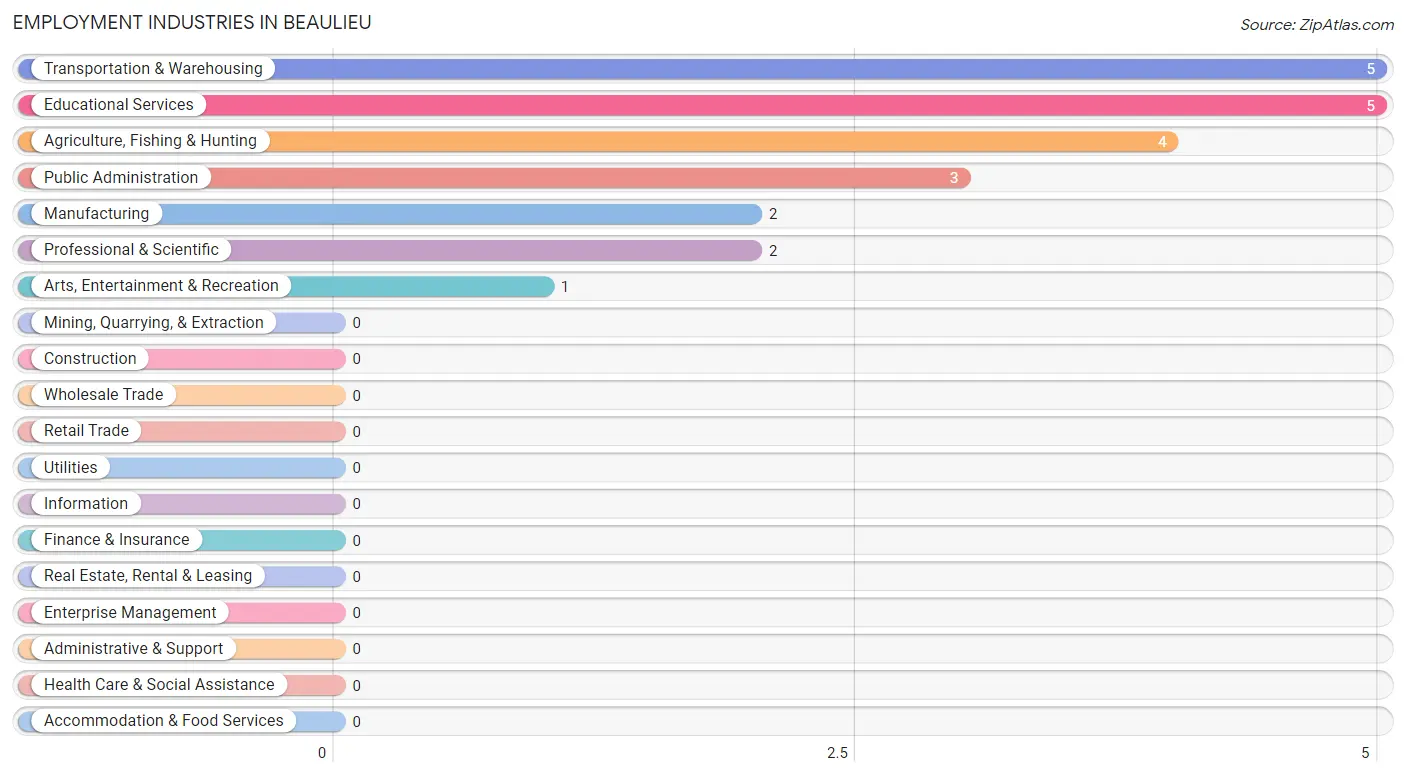
Employment Industries in Beaulieu
The major employment industries in Beaulieu include Transportation & Warehousing (5 | 22.7%), Educational Services (5 | 22.7%), Agriculture, Fishing & Hunting (4 | 18.2%), Public Administration (3 | 13.6%), and Manufacturing (2 | 9.1%).
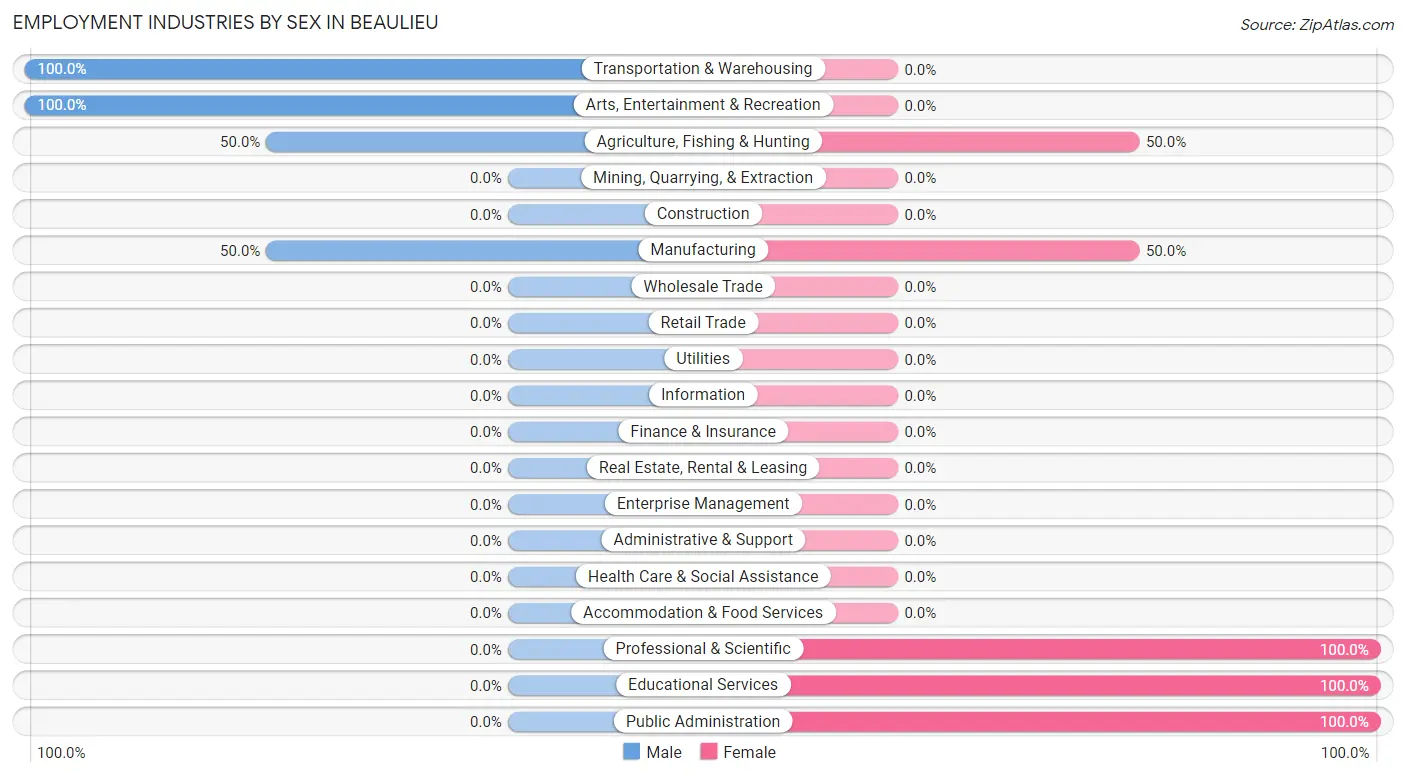
Employment Industries by Sex in Beaulieu
The Beaulieu industries that see more men than women are Transportation & Warehousing (100.0%), Arts, Entertainment & Recreation (100.0%), and Agriculture, Fishing & Hunting (50.0%), whereas the industries that tend to have a higher number of women are Professional & Scientific (100.0%), Educational Services (100.0%), and Public Administration (100.0%).
| Industry | Male | Female |
| Agriculture, Fishing & Hunting | 2 (50.0%) | 2 (50.0%) |
| Mining, Quarrying, & Extraction | 0 (0.0%) | 0 (0.0%) |
| Construction | 0 (0.0%) | 0 (0.0%) |
| Manufacturing | 1 (50.0%) | 1 (50.0%) |
| Wholesale Trade | 0 (0.0%) | 0 (0.0%) |
| Retail Trade | 0 (0.0%) | 0 (0.0%) |
| Transportation & Warehousing | 5 (100.0%) | 0 (0.0%) |
| Utilities | 0 (0.0%) | 0 (0.0%) |
| Information | 0 (0.0%) | 0 (0.0%) |
| Finance & Insurance | 0 (0.0%) | 0 (0.0%) |
| Real Estate, Rental & Leasing | 0 (0.0%) | 0 (0.0%) |
| Professional & Scientific | 0 (0.0%) | 2 (100.0%) |
| Enterprise Management | 0 (0.0%) | 0 (0.0%) |
| Administrative & Support | 0 (0.0%) | 0 (0.0%) |
| Educational Services | 0 (0.0%) | 5 (100.0%) |
| Health Care & Social Assistance | 0 (0.0%) | 0 (0.0%) |
| Arts, Entertainment & Recreation | 1 (100.0%) | 0 (0.0%) |
| Accommodation & Food Services | 0 (0.0%) | 0 (0.0%) |
| Public Administration | 0 (0.0%) | 3 (100.0%) |
| Total | 9 (40.9%) | 13 (59.1%) |
Education in Beaulieu
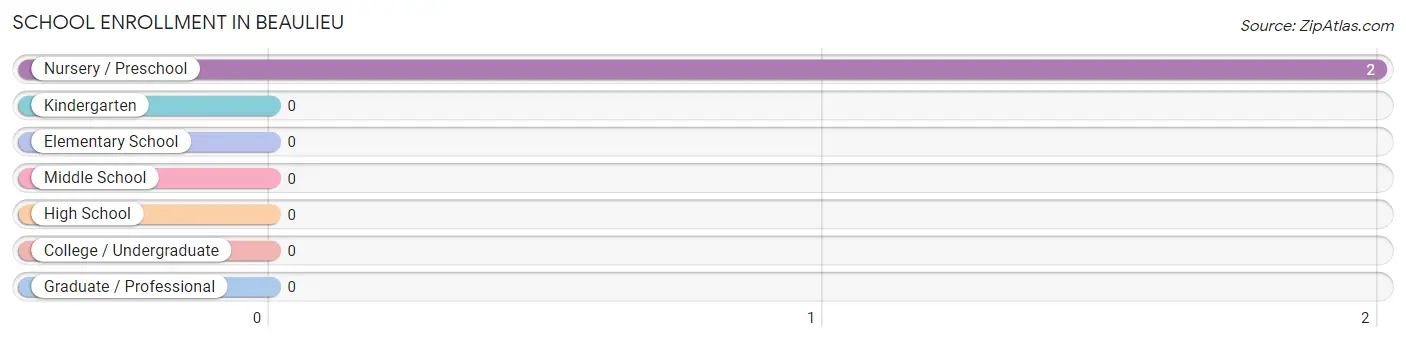
School Enrollment in Beaulieu
| School Level | # Students | % Students |
| Nursery / Preschool | 2 | 100.0% |
| Kindergarten | 0 | 0.0% |
| Elementary School | 0 | 0.0% |
| Middle School | 0 | 0.0% |
| High School | 0 | 0.0% |
| College / Undergraduate | 0 | 0.0% |
| Graduate / Professional | 0 | 0.0% |
| Total | 2 | 100.0% |
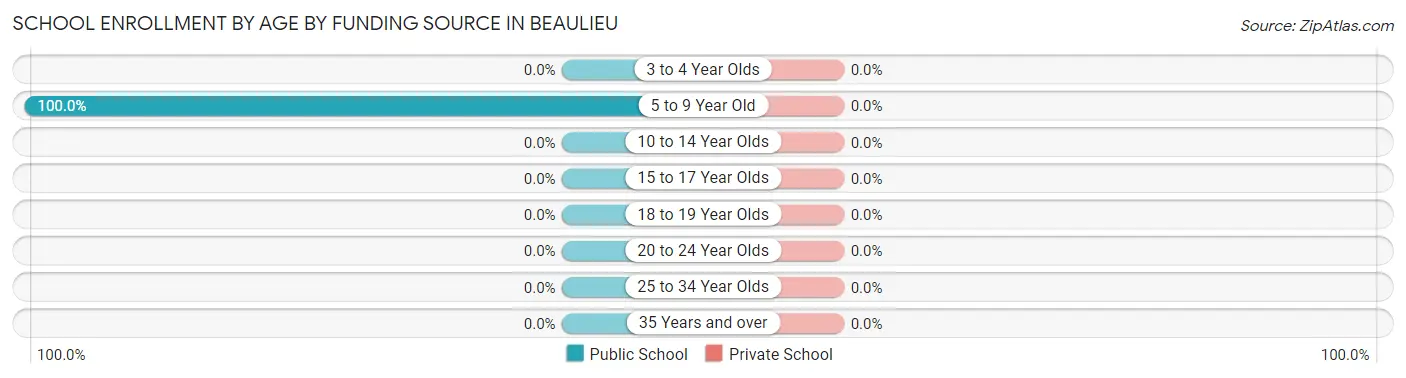
School Enrollment by Age by Funding Source in Beaulieu
| Age Bracket | Public School | Private School |
| 3 to 4 Year Olds | 0 (0.0%) | 0 (0.0%) |
| 5 to 9 Year Old | 2 (100.0%) | 0 (0.0%) |
| 10 to 14 Year Olds | 0 (0.0%) | 0 (0.0%) |
| 15 to 17 Year Olds | 0 (0.0%) | 0 (0.0%) |
| 18 to 19 Year Olds | 0 (0.0%) | 0 (0.0%) |
| 20 to 24 Year Olds | 0 (0.0%) | 0 (0.0%) |
| 25 to 34 Year Olds | 0 (0.0%) | 0 (0.0%) |
| 35 Years and over | 0 (0.0%) | 0 (0.0%) |
| Total | 2 (100.0%) | 0 (0.0%) |
Educational Attainment by Field of Study in Beaulieu
Psychology (1 | 25.0%), science & technology (1 | 25.0%), business (1 | 25.0%), and education (1 | 25.0%) are the most common fields of study among 4 individuals in Beaulieu who have obtained a bachelor's degree or higher.
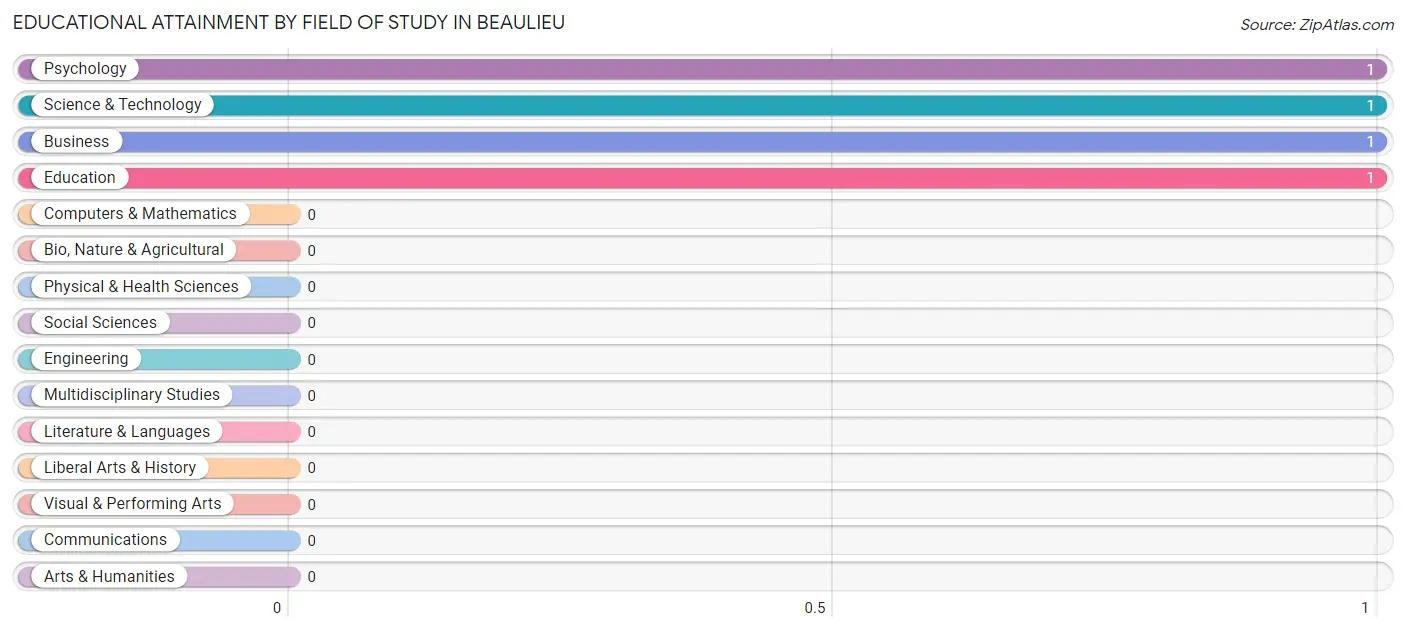
| Field of Study | # Graduates | % Graduates |
| Computers & Mathematics | 0 | 0.0% |
| Bio, Nature & Agricultural | 0 | 0.0% |
| Physical & Health Sciences | 0 | 0.0% |
| Psychology | 1 | 25.0% |
| Social Sciences | 0 | 0.0% |
| Engineering | 0 | 0.0% |
| Multidisciplinary Studies | 0 | 0.0% |
| Science & Technology | 1 | 25.0% |
| Business | 1 | 25.0% |
| Education | 1 | 25.0% |
| Literature & Languages | 0 | 0.0% |
| Liberal Arts & History | 0 | 0.0% |
| Visual & Performing Arts | 0 | 0.0% |
| Communications | 0 | 0.0% |
| Arts & Humanities | 0 | 0.0% |
| Total | 4 | 100.0% |
Transportation & Commute in Beaulieu
Vehicle Availability by Sex in Beaulieu
The most prevalent vehicle ownership categories in Beaulieu are males with 3 vehicles (6, accounting for 66.7%) and females with 3 vehicles (1, making up 54.5%).
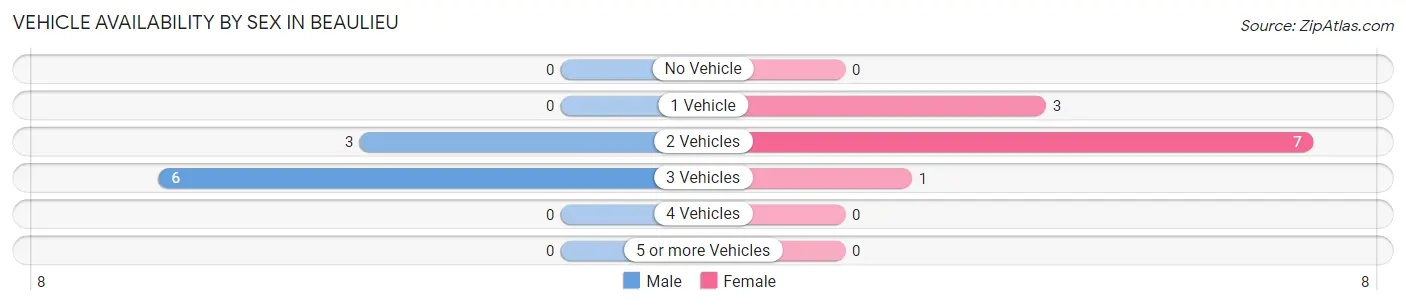
| Vehicles Available | Male | Female |
| No Vehicle | 0 (0.0%) | 0 (0.0%) |
| 1 Vehicle | 0 (0.0%) | 3 (27.3%) |
| 2 Vehicles | 3 (33.3%) | 7 (63.6%) |
| 3 Vehicles | 6 (66.7%) | 1 (9.1%) |
| 4 Vehicles | 0 (0.0%) | 0 (0.0%) |
| 5 or more Vehicles | 0 (0.0%) | 0 (0.0%) |
| Total | 9 (100.0%) | 11 (100.0%) |
Commute Time in Beaulieu
The most frequently occuring commute durations in Beaulieu are 5 to 9 minutes (8 commuters, 44.4%), 10 to 14 minutes (3 commuters, 16.7%), and less than 5 minutes (2 commuters, 11.1%).
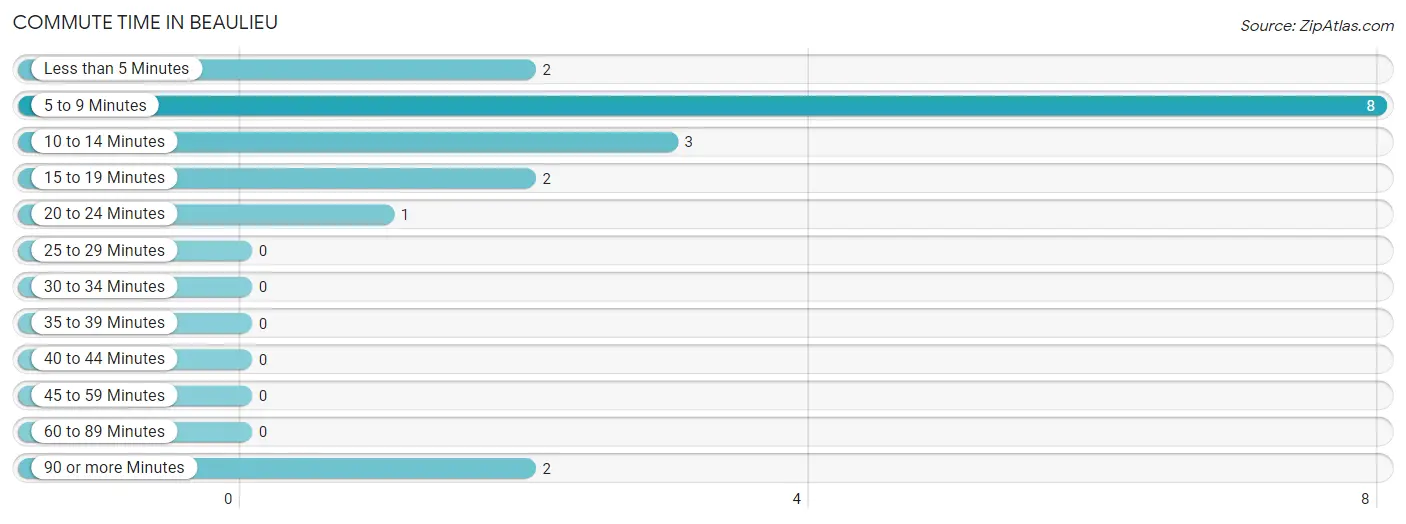
| Commute Time | # Commuters | % Commuters |
| Less than 5 Minutes | 2 | 11.1% |
| 5 to 9 Minutes | 8 | 44.4% |
| 10 to 14 Minutes | 3 | 16.7% |
| 15 to 19 Minutes | 2 | 11.1% |
| 20 to 24 Minutes | 1 | 5.6% |
| 25 to 29 Minutes | 0 | 0.0% |
| 30 to 34 Minutes | 0 | 0.0% |
| 35 to 39 Minutes | 0 | 0.0% |
| 40 to 44 Minutes | 0 | 0.0% |
| 45 to 59 Minutes | 0 | 0.0% |
| 60 to 89 Minutes | 0 | 0.0% |
| 90 or more Minutes | 2 | 11.1% |
Commute Time by Sex in Beaulieu
The most common commute times in Beaulieu are 5 to 9 minutes (3 commuters, 37.5%) for males and 5 to 9 minutes (5 commuters, 50.0%) for females.
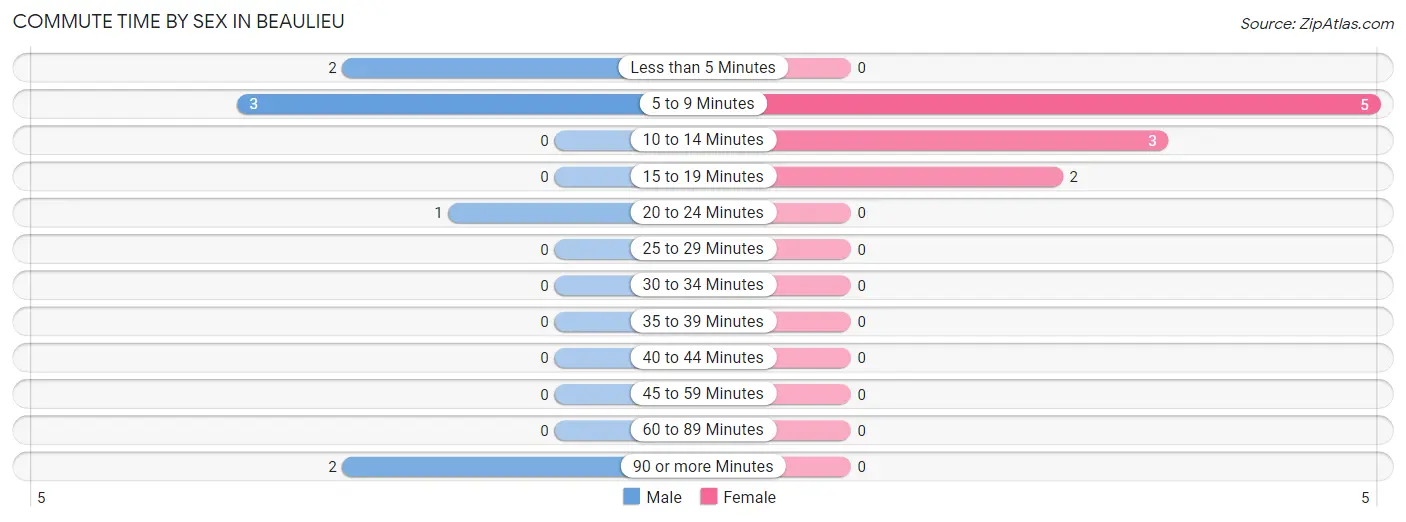
| Commute Time | Male | Female |
| Less than 5 Minutes | 2 (25.0%) | 0 (0.0%) |
| 5 to 9 Minutes | 3 (37.5%) | 5 (50.0%) |
| 10 to 14 Minutes | 0 (0.0%) | 3 (30.0%) |
| 15 to 19 Minutes | 0 (0.0%) | 2 (20.0%) |
| 20 to 24 Minutes | 1 (12.5%) | 0 (0.0%) |
| 25 to 29 Minutes | 0 (0.0%) | 0 (0.0%) |
| 30 to 34 Minutes | 0 (0.0%) | 0 (0.0%) |
| 35 to 39 Minutes | 0 (0.0%) | 0 (0.0%) |
| 40 to 44 Minutes | 0 (0.0%) | 0 (0.0%) |
| 45 to 59 Minutes | 0 (0.0%) | 0 (0.0%) |
| 60 to 89 Minutes | 0 (0.0%) | 0 (0.0%) |
| 90 or more Minutes | 2 (25.0%) | 0 (0.0%) |
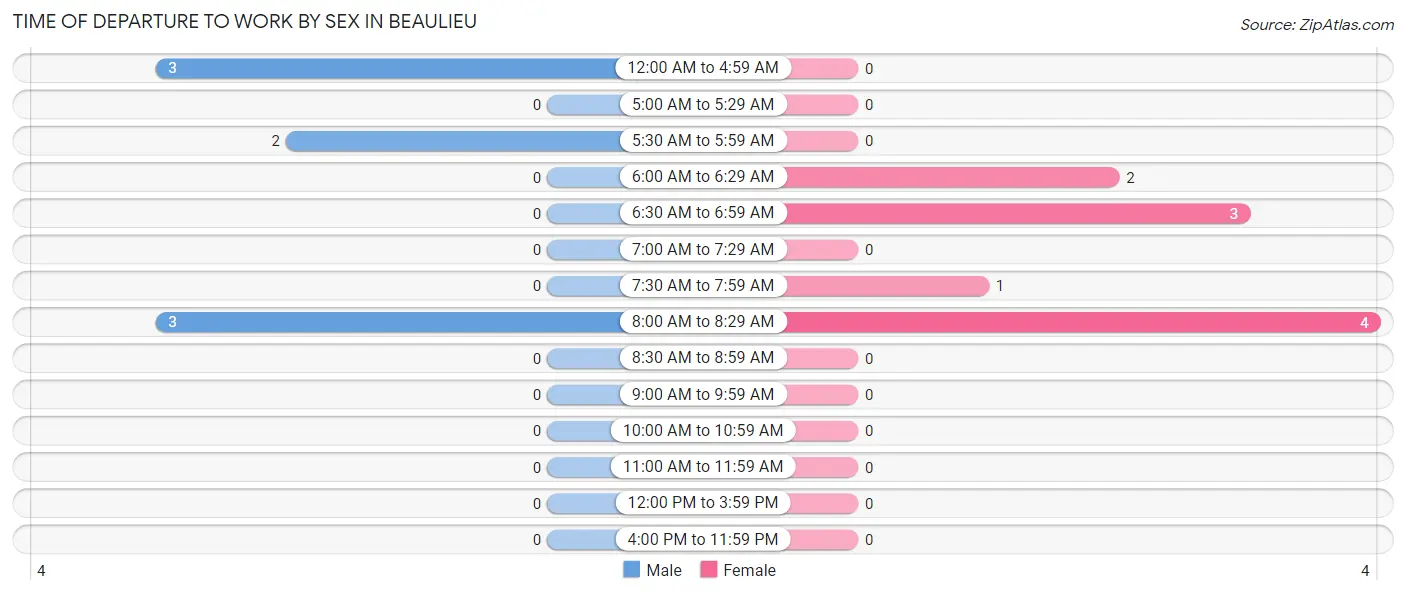
Time of Departure to Work by Sex in Beaulieu
The most frequent times of departure to work in Beaulieu are 12:00 AM to 4:59 AM (3, 37.5%) for males and 8:00 AM to 8:29 AM (4, 40.0%) for females.
| Time of Departure | Male | Female |
| 12:00 AM to 4:59 AM | 3 (37.5%) | 0 (0.0%) |
| 5:00 AM to 5:29 AM | 0 (0.0%) | 0 (0.0%) |
| 5:30 AM to 5:59 AM | 2 (25.0%) | 0 (0.0%) |
| 6:00 AM to 6:29 AM | 0 (0.0%) | 2 (20.0%) |
| 6:30 AM to 6:59 AM | 0 (0.0%) | 3 (30.0%) |
| 7:00 AM to 7:29 AM | 0 (0.0%) | 0 (0.0%) |
| 7:30 AM to 7:59 AM | 0 (0.0%) | 1 (10.0%) |
| 8:00 AM to 8:29 AM | 3 (37.5%) | 4 (40.0%) |
| 8:30 AM to 8:59 AM | 0 (0.0%) | 0 (0.0%) |
| 9:00 AM to 9:59 AM | 0 (0.0%) | 0 (0.0%) |
| 10:00 AM to 10:59 AM | 0 (0.0%) | 0 (0.0%) |
| 11:00 AM to 11:59 AM | 0 (0.0%) | 0 (0.0%) |
| 12:00 PM to 3:59 PM | 0 (0.0%) | 0 (0.0%) |
| 4:00 PM to 11:59 PM | 0 (0.0%) | 0 (0.0%) |
| Total | 8 (100.0%) | 10 (100.0%) |
Housing Occupancy in Beaulieu
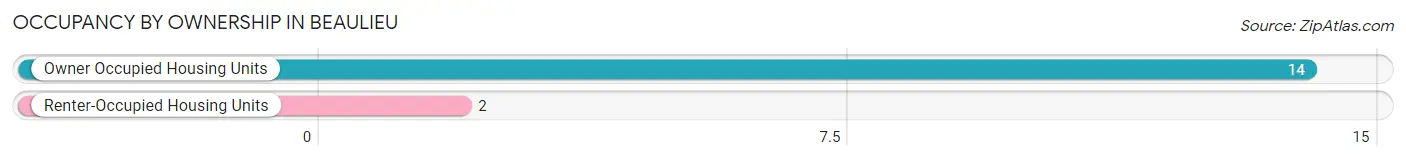
Occupancy by Ownership in Beaulieu
Of the total 16 dwellings in Beaulieu, owner-occupied units account for 14 (87.5%), while renter-occupied units make up 2 (12.5%).
| Occupancy | # Housing Units | % Housing Units |
| Owner Occupied Housing Units | 14 | 87.5% |
| Renter-Occupied Housing Units | 2 | 12.5% |
| Total Occupied Housing Units | 16 | 100.0% |
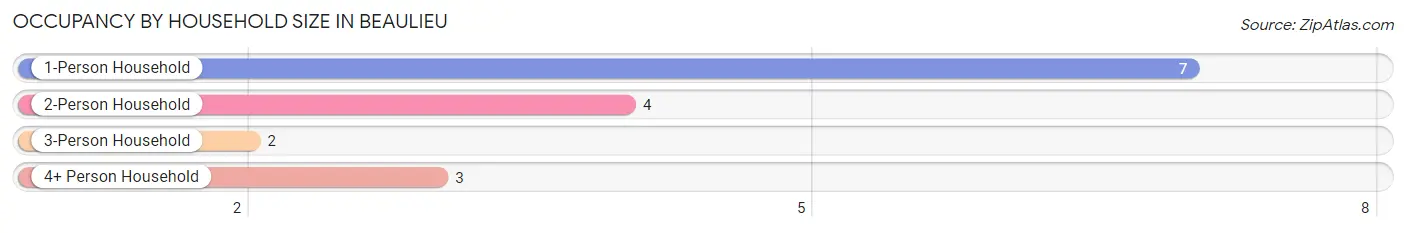
Occupancy by Household Size in Beaulieu
| Household Size | # Housing Units | % Housing Units |
| 1-Person Household | 7 | 43.8% |
| 2-Person Household | 4 | 25.0% |
| 3-Person Household | 2 | 12.5% |
| 4+ Person Household | 3 | 18.8% |
| Total Housing Units | 16 | 100.0% |
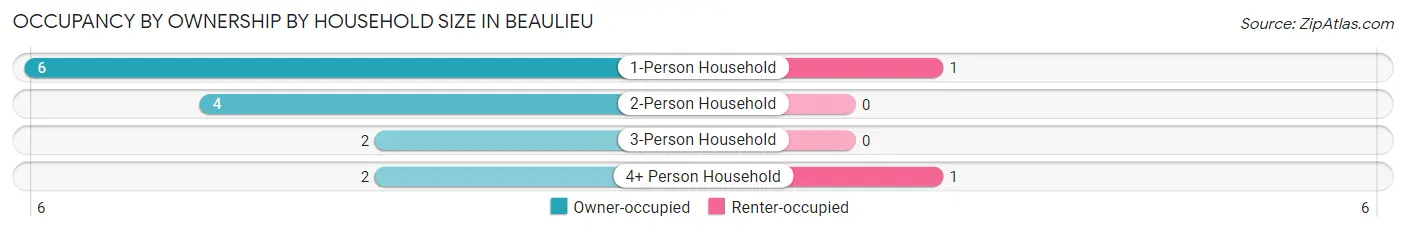
Occupancy by Ownership by Household Size in Beaulieu
| Household Size | Owner-occupied | Renter-occupied |
| 1-Person Household | 6 (85.7%) | 1 (14.3%) |
| 2-Person Household | 4 (100.0%) | 0 (0.0%) |
| 3-Person Household | 2 (100.0%) | 0 (0.0%) |
| 4+ Person Household | 2 (66.7%) | 1 (33.3%) |
| Total Housing Units | 14 (87.5%) | 2 (12.5%) |
Occupancy by Educational Attainment in Beaulieu
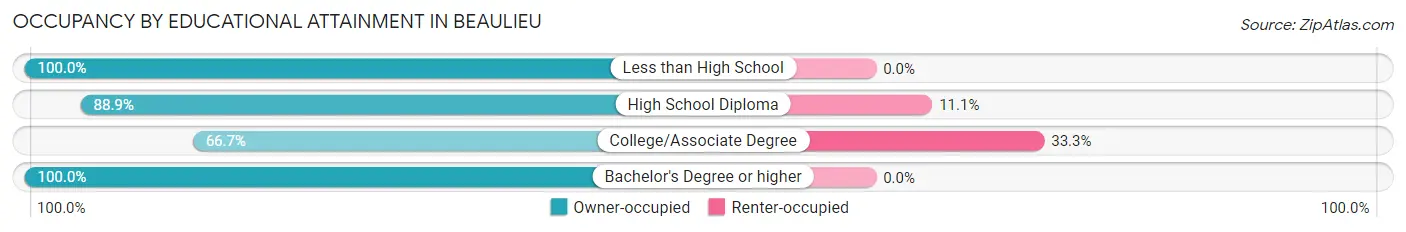
| Household Size | Owner-occupied | Renter-occupied |
| Less than High School | 2 (100.0%) | 0 (0.0%) |
| High School Diploma | 8 (88.9%) | 1 (11.1%) |
| College/Associate Degree | 2 (66.7%) | 1 (33.3%) |
| Bachelor's Degree or higher | 2 (100.0%) | 0 (0.0%) |
Occupancy by Age of Householder in Beaulieu
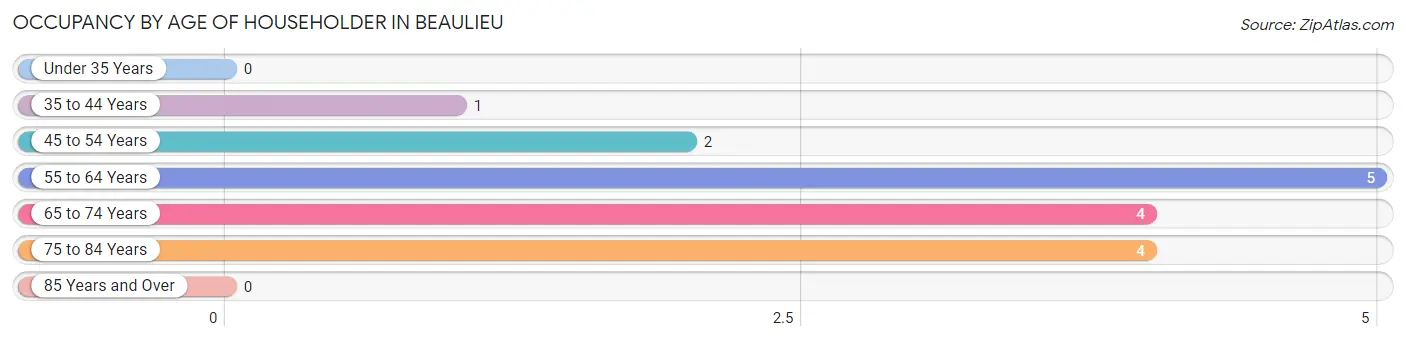
| Age Bracket | # Households | % Households |
| Under 35 Years | 0 | 0.0% |
| 35 to 44 Years | 1 | 6.2% |
| 45 to 54 Years | 2 | 12.5% |
| 55 to 64 Years | 5 | 31.2% |
| 65 to 74 Years | 4 | 25.0% |
| 75 to 84 Years | 4 | 25.0% |
| 85 Years and Over | 0 | 0.0% |
| Total | 16 | 100.0% |
Housing Finances in Beaulieu
Median Income by Occupancy in Beaulieu
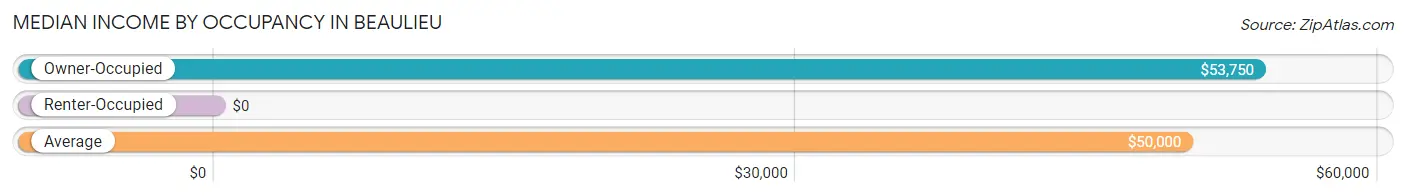
| Occupancy Type | # Households | Median Income |
| Owner-Occupied | 14 (87.5%) | $53,750 |
| Renter-Occupied | 2 (12.5%) | $0 |
| Average | 16 (100.0%) | $50,000 |
Occupancy by Householder Income Bracket in Beaulieu
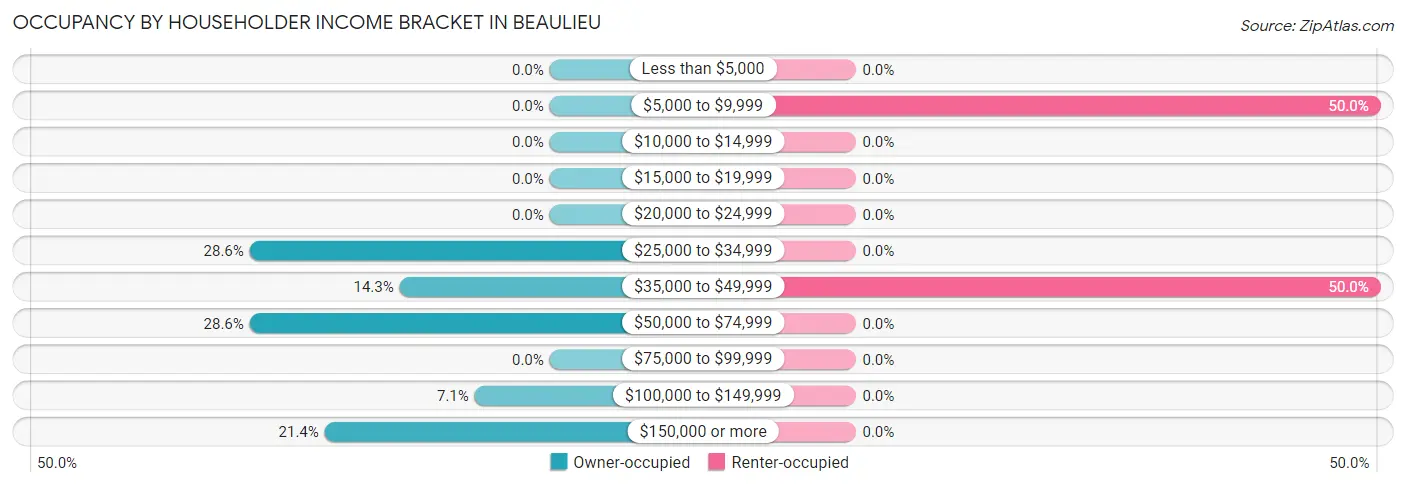
| Income Bracket | Owner-occupied | Renter-occupied |
| Less than $5,000 | 0 (0.0%) | 0 (0.0%) |
| $5,000 to $9,999 | 0 (0.0%) | 1 (50.0%) |
| $10,000 to $14,999 | 0 (0.0%) | 0 (0.0%) |
| $15,000 to $19,999 | 0 (0.0%) | 0 (0.0%) |
| $20,000 to $24,999 | 0 (0.0%) | 0 (0.0%) |
| $25,000 to $34,999 | 4 (28.6%) | 0 (0.0%) |
| $35,000 to $49,999 | 2 (14.3%) | 1 (50.0%) |
| $50,000 to $74,999 | 4 (28.6%) | 0 (0.0%) |
| $75,000 to $99,999 | 0 (0.0%) | 0 (0.0%) |
| $100,000 to $149,999 | 1 (7.1%) | 0 (0.0%) |
| $150,000 or more | 3 (21.4%) | 0 (0.0%) |
| Total | 14 (100.0%) | 2 (100.0%) |
Monthly Housing Cost Tiers in Beaulieu
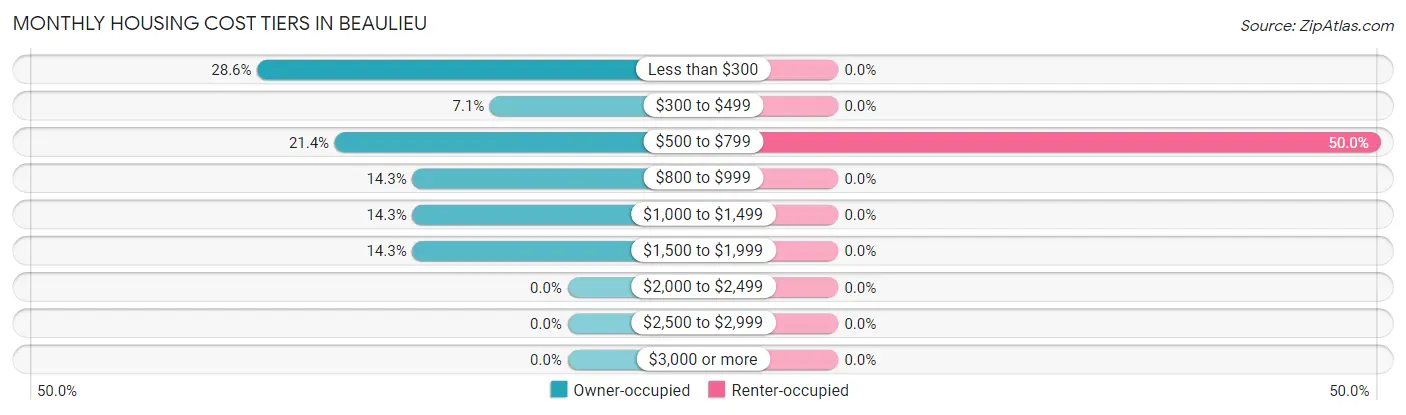
| Monthly Cost | Owner-occupied | Renter-occupied |
| Less than $300 | 4 (28.6%) | 0 (0.0%) |
| $300 to $499 | 1 (7.1%) | 0 (0.0%) |
| $500 to $799 | 3 (21.4%) | 1 (50.0%) |
| $800 to $999 | 2 (14.3%) | 0 (0.0%) |
| $1,000 to $1,499 | 2 (14.3%) | 0 (0.0%) |
| $1,500 to $1,999 | 2 (14.3%) | 0 (0.0%) |
| $2,000 to $2,499 | 0 (0.0%) | 0 (0.0%) |
| $2,500 to $2,999 | 0 (0.0%) | 0 (0.0%) |
| $3,000 or more | 0 (0.0%) | 0 (0.0%) |
| Total | 14 (100.0%) | 2 (100.0%) |
Physical Housing Characteristics in Beaulieu
Housing Structures in Beaulieu
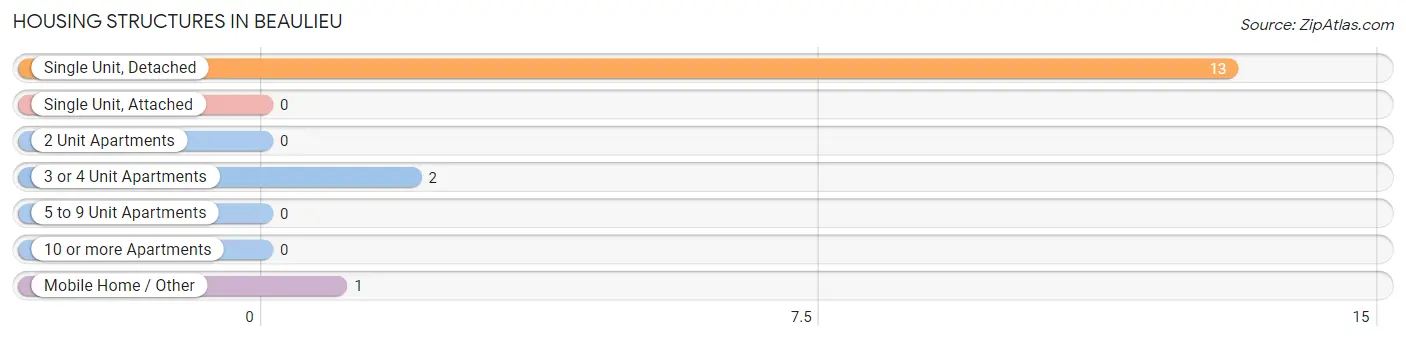
| Structure Type | # Housing Units | % Housing Units |
| Single Unit, Detached | 13 | 81.2% |
| Single Unit, Attached | 0 | 0.0% |
| 2 Unit Apartments | 0 | 0.0% |
| 3 or 4 Unit Apartments | 2 | 12.5% |
| 5 to 9 Unit Apartments | 0 | 0.0% |
| 10 or more Apartments | 0 | 0.0% |
| Mobile Home / Other | 1 | 6.2% |
| Total | 16 | 100.0% |
Housing Structures by Occupancy in Beaulieu
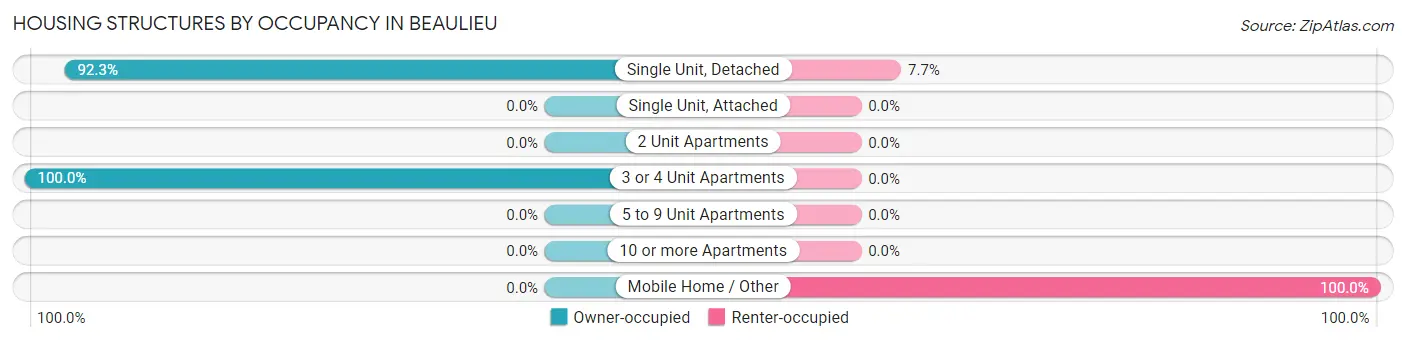
| Structure Type | Owner-occupied | Renter-occupied |
| Single Unit, Detached | 12 (92.3%) | 1 (7.7%) |
| Single Unit, Attached | 0 (0.0%) | 0 (0.0%) |
| 2 Unit Apartments | 0 (0.0%) | 0 (0.0%) |
| 3 or 4 Unit Apartments | 2 (100.0%) | 0 (0.0%) |
| 5 to 9 Unit Apartments | 0 (0.0%) | 0 (0.0%) |
| 10 or more Apartments | 0 (0.0%) | 0 (0.0%) |
| Mobile Home / Other | 0 (0.0%) | 1 (100.0%) |
| Total | 14 (87.5%) | 2 (12.5%) |
Housing Structures by Number of Rooms in Beaulieu
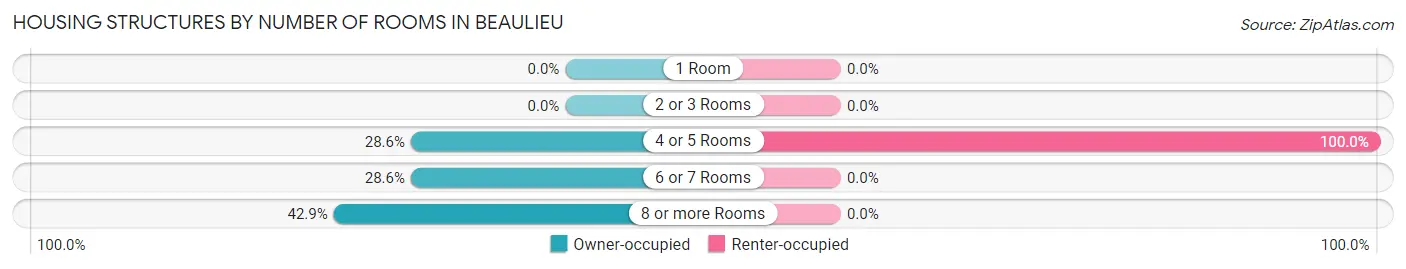
| Number of Rooms | Owner-occupied | Renter-occupied |
| 1 Room | 0 (0.0%) | 0 (0.0%) |
| 2 or 3 Rooms | 0 (0.0%) | 0 (0.0%) |
| 4 or 5 Rooms | 4 (28.6%) | 2 (100.0%) |
| 6 or 7 Rooms | 4 (28.6%) | 0 (0.0%) |
| 8 or more Rooms | 6 (42.9%) | 0 (0.0%) |
| Total | 14 (100.0%) | 2 (100.0%) |
Housing Structure by Heating Type in Beaulieu
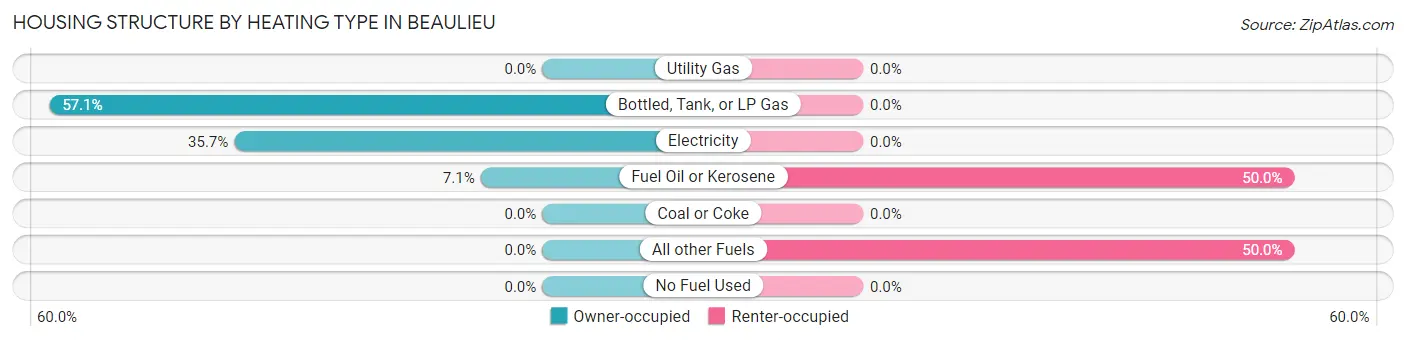
| Heating Type | Owner-occupied | Renter-occupied |
| Utility Gas | 0 (0.0%) | 0 (0.0%) |
| Bottled, Tank, or LP Gas | 8 (57.1%) | 0 (0.0%) |
| Electricity | 5 (35.7%) | 0 (0.0%) |
| Fuel Oil or Kerosene | 1 (7.1%) | 1 (50.0%) |
| Coal or Coke | 0 (0.0%) | 0 (0.0%) |
| All other Fuels | 0 (0.0%) | 1 (50.0%) |
| No Fuel Used | 0 (0.0%) | 0 (0.0%) |
| Total | 14 (100.0%) | 2 (100.0%) |
Household Vehicle Usage in Beaulieu
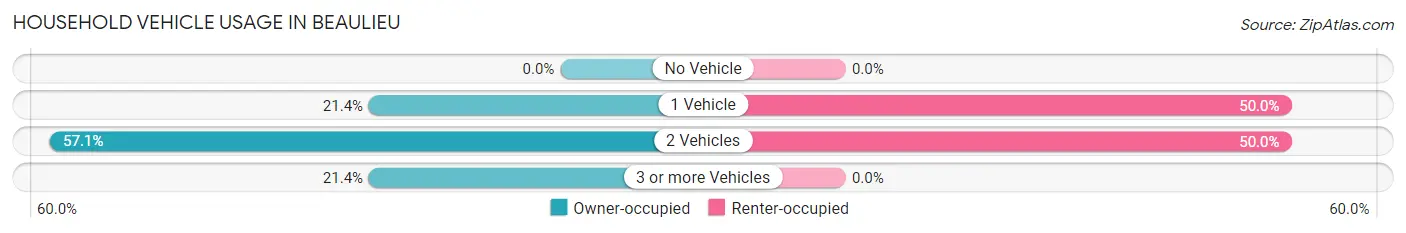
| Vehicles per Household | Owner-occupied | Renter-occupied |
| No Vehicle | 0 (0.0%) | 0 (0.0%) |
| 1 Vehicle | 3 (21.4%) | 1 (50.0%) |
| 2 Vehicles | 8 (57.1%) | 1 (50.0%) |
| 3 or more Vehicles | 3 (21.4%) | 0 (0.0%) |
| Total | 14 (100.0%) | 2 (100.0%) |
Real Estate & Mortgages in Beaulieu
Real Estate and Mortgage Overview in Beaulieu
| Characteristic | Without Mortgage | With Mortgage |
| Housing Units | 12 | 2 |
| Median Property Value | - | - |
| Median Household Income | - | - |
| Monthly Housing Costs | $650 | $0 |
| Real Estate Taxes | - | - |
Property Value by Mortgage Status in Beaulieu
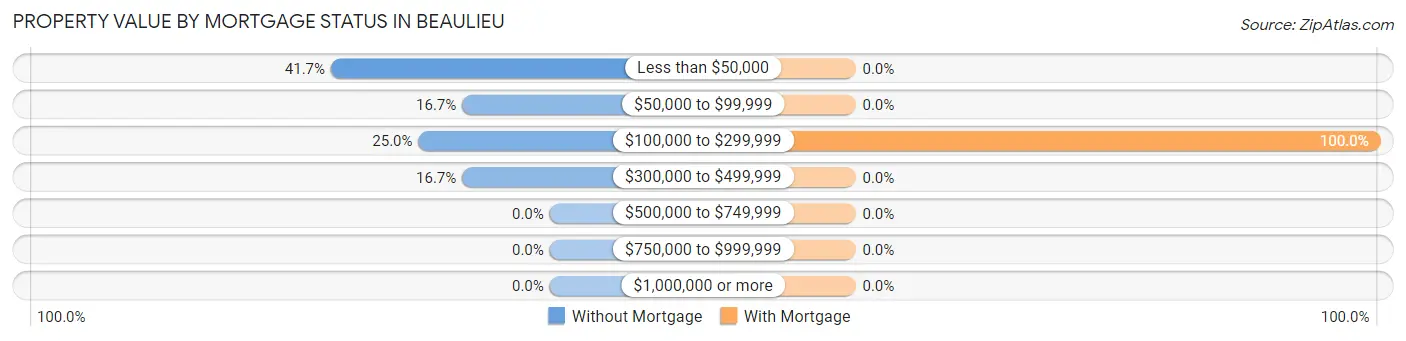
| Property Value | Without Mortgage | With Mortgage |
| Less than $50,000 | 5 (41.7%) | 0 (0.0%) |
| $50,000 to $99,999 | 2 (16.7%) | 0 (0.0%) |
| $100,000 to $299,999 | 3 (25.0%) | 2 (100.0%) |
| $300,000 to $499,999 | 2 (16.7%) | 0 (0.0%) |
| $500,000 to $749,999 | 0 (0.0%) | 0 (0.0%) |
| $750,000 to $999,999 | 0 (0.0%) | 0 (0.0%) |
| $1,000,000 or more | 0 (0.0%) | 0 (0.0%) |
| Total | 12 (100.0%) | 2 (100.0%) |
Household Income by Mortgage Status in Beaulieu
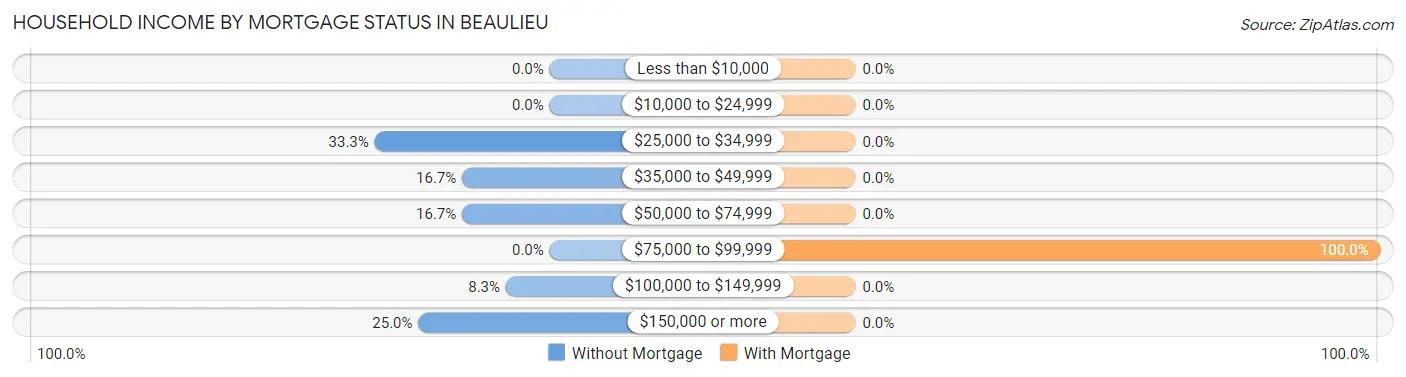
| Household Income | Without Mortgage | With Mortgage |
| Less than $10,000 | 0 (0.0%) | 0 (0.0%) |
| $10,000 to $24,999 | 0 (0.0%) | 0 (0.0%) |
| $25,000 to $34,999 | 4 (33.3%) | 0 (0.0%) |
| $35,000 to $49,999 | 2 (16.7%) | 0 (0.0%) |
| $50,000 to $74,999 | 2 (16.7%) | 0 (0.0%) |
| $75,000 to $99,999 | 0 (0.0%) | 2 (100.0%) |
| $100,000 to $149,999 | 1 (8.3%) | 0 (0.0%) |
| $150,000 or more | 3 (25.0%) | 0 (0.0%) |
| Total | 12 (100.0%) | 2 (100.0%) |
Property Value to Household Income Ratio in Beaulieu
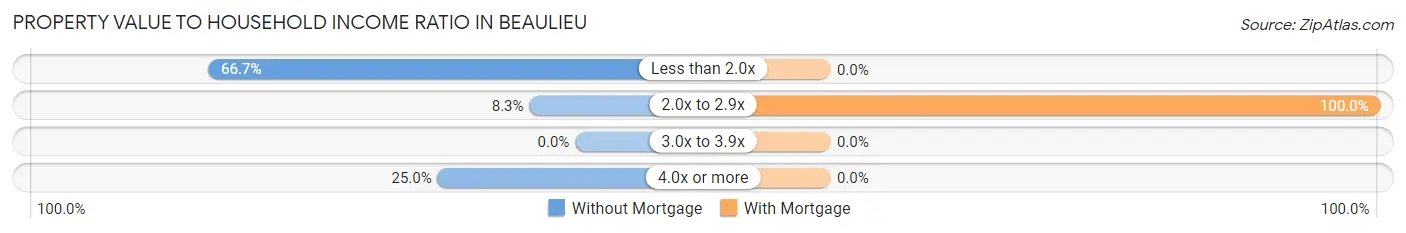
| Value-to-Income Ratio | Without Mortgage | With Mortgage |
| Less than 2.0x | 8 (66.7%) | 0 (0.0%) |
| 2.0x to 2.9x | 1 (8.3%) | 2 (100.0%) |
| 3.0x to 3.9x | 0 (0.0%) | 0 (0.0%) |
| 4.0x or more | 3 (25.0%) | 0 (0.0%) |
| Total | 12 (100.0%) | 2 (100.0%) |
Real Estate Taxes by Mortgage Status in Beaulieu
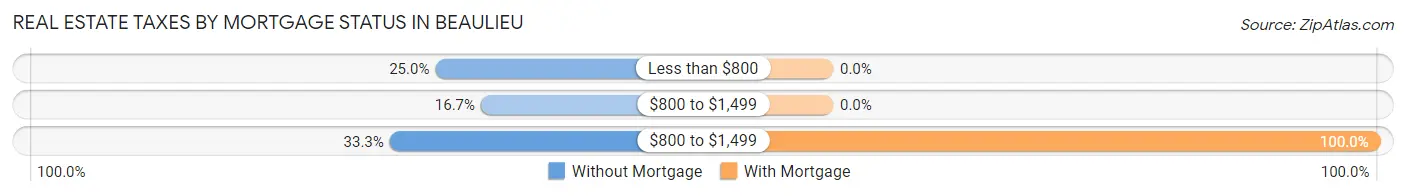
| Property Taxes | Without Mortgage | With Mortgage |
| Less than $800 | 3 (25.0%) | 0 (0.0%) |
| $800 to $1,499 | 2 (16.7%) | 0 (0.0%) |
| $800 to $1,499 | 4 (33.3%) | 2 (100.0%) |
| Total | 12 (100.0%) | 2 (100.0%) |
Health & Disability in Beaulieu
Health Insurance Coverage by Age in Beaulieu
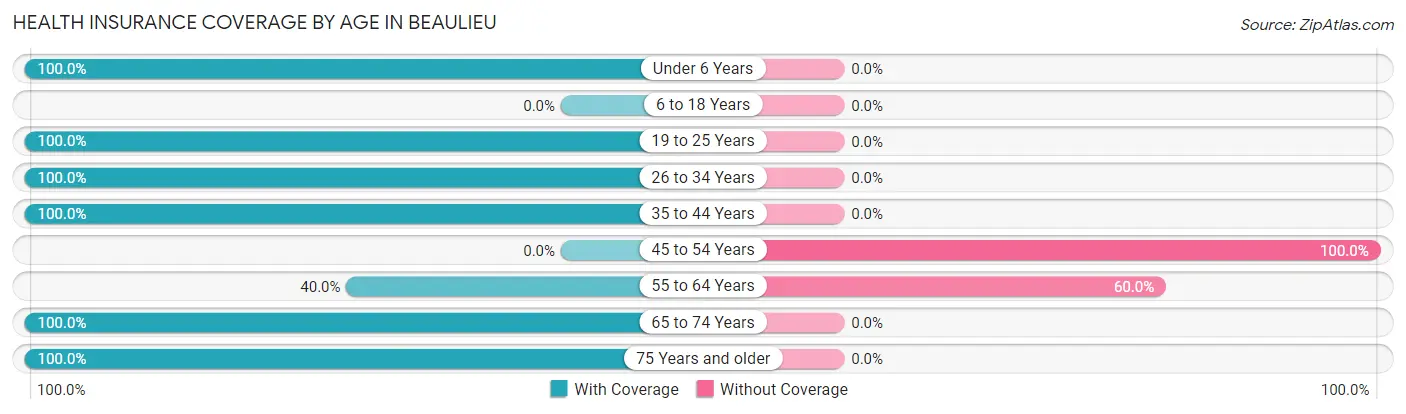
| Age Bracket | With Coverage | Without Coverage |
| Under 6 Years | 4 (100.0%) | 0 (0.0%) |
| 6 to 18 Years | 0 (0.0%) | 0 (0.0%) |
| 19 to 25 Years | 6 (100.0%) | 0 (0.0%) |
| 26 to 34 Years | 3 (100.0%) | 0 (0.0%) |
| 35 to 44 Years | 6 (100.0%) | 0 (0.0%) |
| 45 to 54 Years | 0 (0.0%) | 4 (100.0%) |
| 55 to 64 Years | 2 (40.0%) | 3 (60.0%) |
| 65 to 74 Years | 5 (100.0%) | 0 (0.0%) |
| 75 Years and older | 14 (100.0%) | 0 (0.0%) |
| Total | 40 (85.1%) | 7 (14.9%) |
Health Insurance Coverage by Citizenship Status in Beaulieu
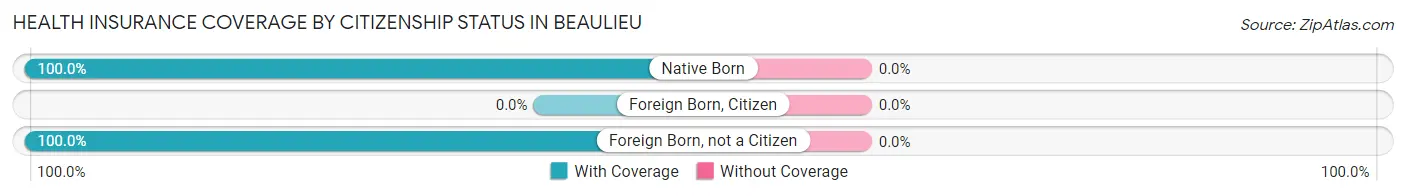
| Citizenship Status | With Coverage | Without Coverage |
| Native Born | 4 (100.0%) | 0 (0.0%) |
| Foreign Born, Citizen | 0 (0.0%) | 0 (0.0%) |
| Foreign Born, not a Citizen | 6 (100.0%) | 0 (0.0%) |
Health Insurance Coverage by Household Income in Beaulieu
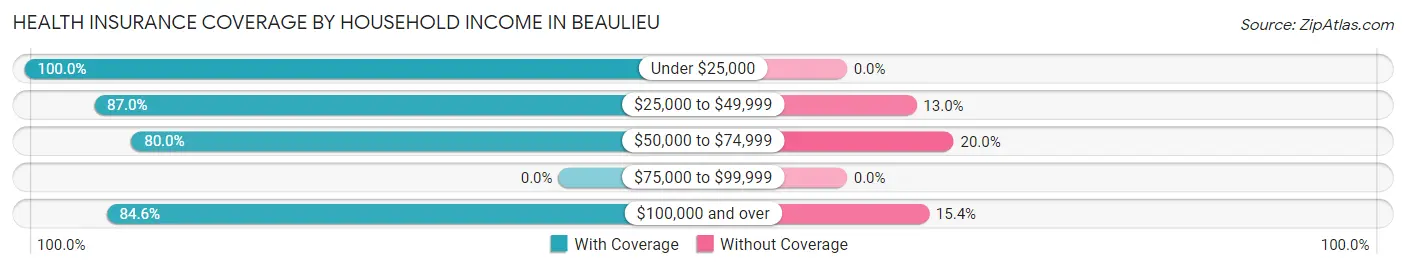
| Household Income | With Coverage | Without Coverage |
| Under $25,000 | 1 (100.0%) | 0 (0.0%) |
| $25,000 to $49,999 | 20 (87.0%) | 3 (13.0%) |
| $50,000 to $74,999 | 8 (80.0%) | 2 (20.0%) |
| $75,000 to $99,999 | 0 (0.0%) | 0 (0.0%) |
| $100,000 and over | 11 (84.6%) | 2 (15.4%) |
Public vs Private Health Insurance Coverage by Age in Beaulieu
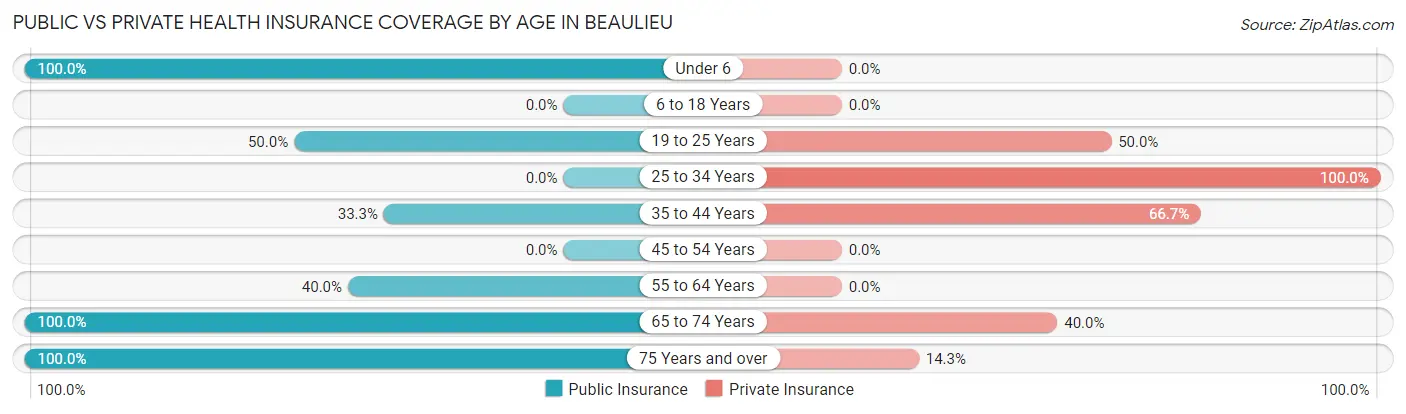
| Age Bracket | Public Insurance | Private Insurance |
| Under 6 | 4 (100.0%) | 0 (0.0%) |
| 6 to 18 Years | 0 (0.0%) | 0 (0.0%) |
| 19 to 25 Years | 3 (50.0%) | 3 (50.0%) |
| 25 to 34 Years | 0 (0.0%) | 3 (100.0%) |
| 35 to 44 Years | 2 (33.3%) | 4 (66.7%) |
| 45 to 54 Years | 0 (0.0%) | 0 (0.0%) |
| 55 to 64 Years | 2 (40.0%) | 0 (0.0%) |
| 65 to 74 Years | 5 (100.0%) | 2 (40.0%) |
| 75 Years and over | 14 (100.0%) | 2 (14.3%) |
| Total | 30 (63.8%) | 14 (29.8%) |
Disability Status by Sex by Age in Beaulieu
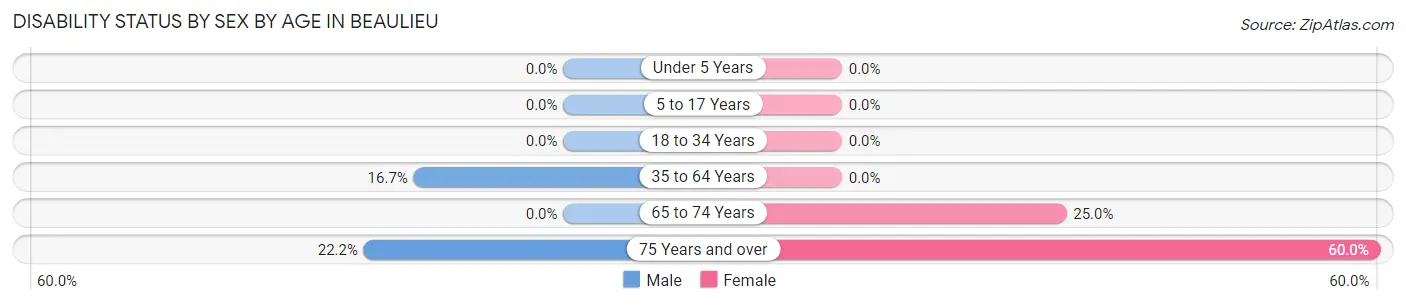
| Age Bracket | Male | Female |
| Under 5 Years | 0 (0.0%) | 0 (0.0%) |
| 5 to 17 Years | 0 (0.0%) | 0 (0.0%) |
| 18 to 34 Years | 0 (0.0%) | 0 (0.0%) |
| 35 to 64 Years | 1 (16.7%) | 0 (0.0%) |
| 65 to 74 Years | 0 (0.0%) | 1 (25.0%) |
| 75 Years and over | 2 (22.2%) | 3 (60.0%) |
Disability Class by Sex by Age in Beaulieu
Disability Class: Hearing Difficulty
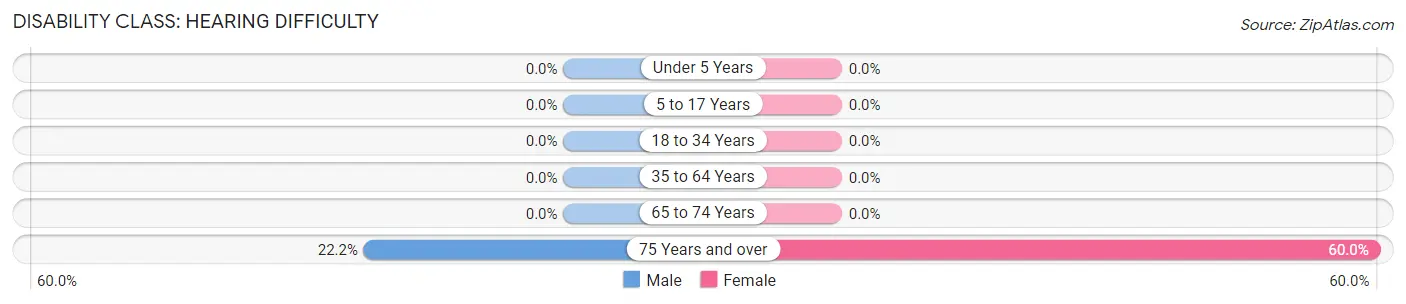
| Age Bracket | Male | Female |
| Under 5 Years | 0 (0.0%) | 0 (0.0%) |
| 5 to 17 Years | 0 (0.0%) | 0 (0.0%) |
| 18 to 34 Years | 0 (0.0%) | 0 (0.0%) |
| 35 to 64 Years | 0 (0.0%) | 0 (0.0%) |
| 65 to 74 Years | 0 (0.0%) | 0 (0.0%) |
| 75 Years and over | 2 (22.2%) | 3 (60.0%) |
Disability Class: Vision Difficulty
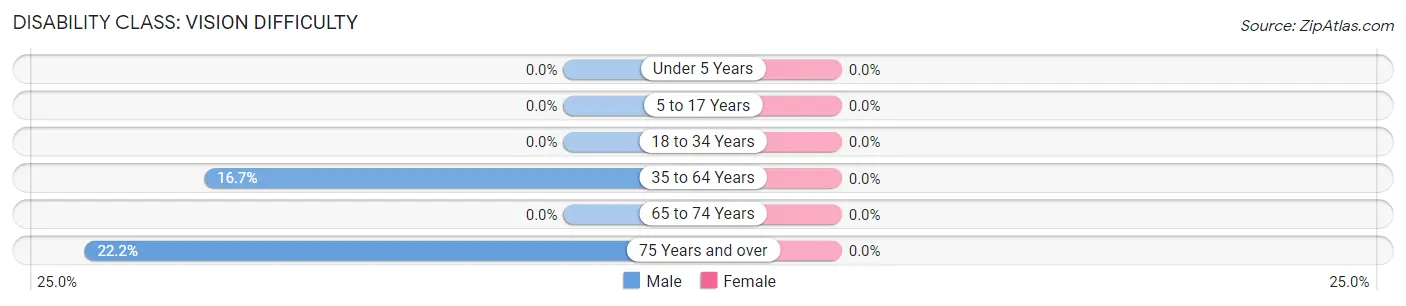
| Age Bracket | Male | Female |
| Under 5 Years | 0 (0.0%) | 0 (0.0%) |
| 5 to 17 Years | 0 (0.0%) | 0 (0.0%) |
| 18 to 34 Years | 0 (0.0%) | 0 (0.0%) |
| 35 to 64 Years | 1 (16.7%) | 0 (0.0%) |
| 65 to 74 Years | 0 (0.0%) | 0 (0.0%) |
| 75 Years and over | 2 (22.2%) | 0 (0.0%) |
Disability Class: Cognitive Difficulty
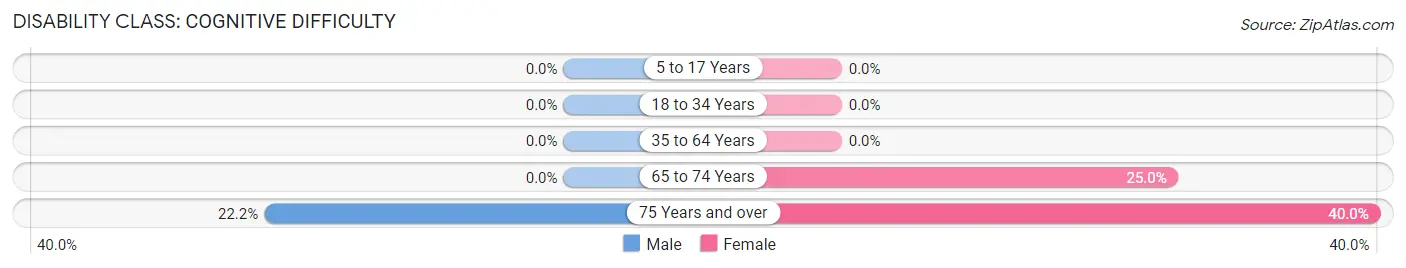
| Age Bracket | Male | Female |
| 5 to 17 Years | 0 (0.0%) | 0 (0.0%) |
| 18 to 34 Years | 0 (0.0%) | 0 (0.0%) |
| 35 to 64 Years | 0 (0.0%) | 0 (0.0%) |
| 65 to 74 Years | 0 (0.0%) | 1 (25.0%) |
| 75 Years and over | 2 (22.2%) | 2 (40.0%) |
Disability Class: Ambulatory Difficulty
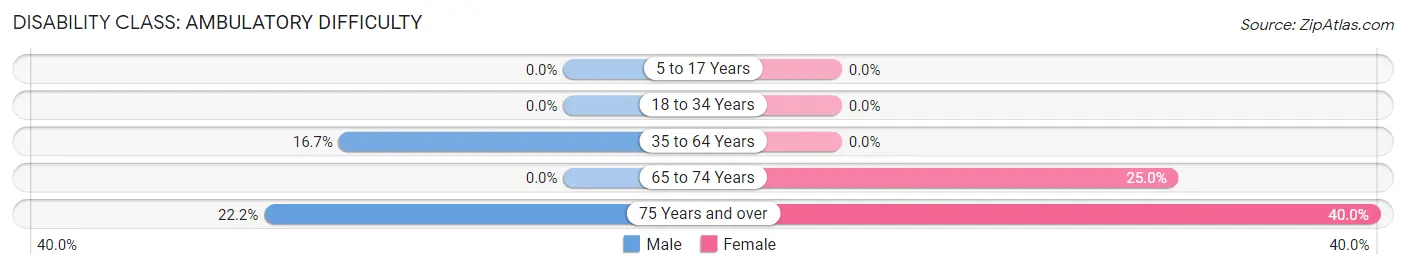
| Age Bracket | Male | Female |
| 5 to 17 Years | 0 (0.0%) | 0 (0.0%) |
| 18 to 34 Years | 0 (0.0%) | 0 (0.0%) |
| 35 to 64 Years | 1 (16.7%) | 0 (0.0%) |
| 65 to 74 Years | 0 (0.0%) | 1 (25.0%) |
| 75 Years and over | 2 (22.2%) | 2 (40.0%) |
Disability Class: Self-Care Difficulty
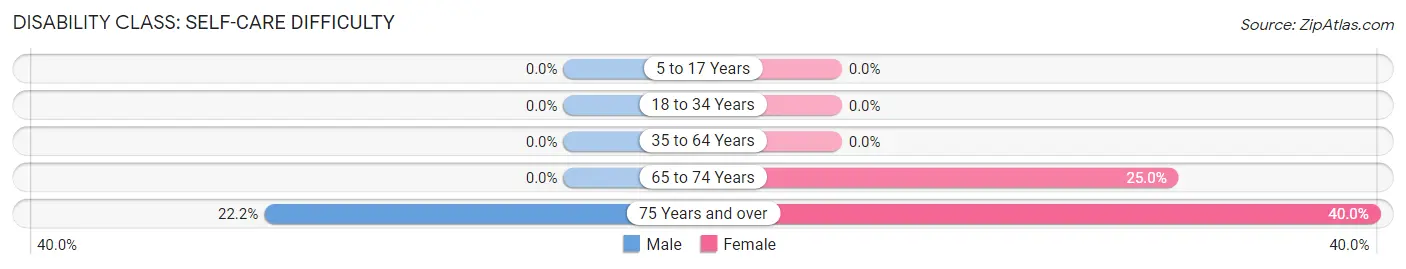
| Age Bracket | Male | Female |
| 5 to 17 Years | 0 (0.0%) | 0 (0.0%) |
| 18 to 34 Years | 0 (0.0%) | 0 (0.0%) |
| 35 to 64 Years | 0 (0.0%) | 0 (0.0%) |
| 65 to 74 Years | 0 (0.0%) | 1 (25.0%) |
| 75 Years and over | 2 (22.2%) | 2 (40.0%) |
Technology Access in Beaulieu
Computing Device Access in Beaulieu
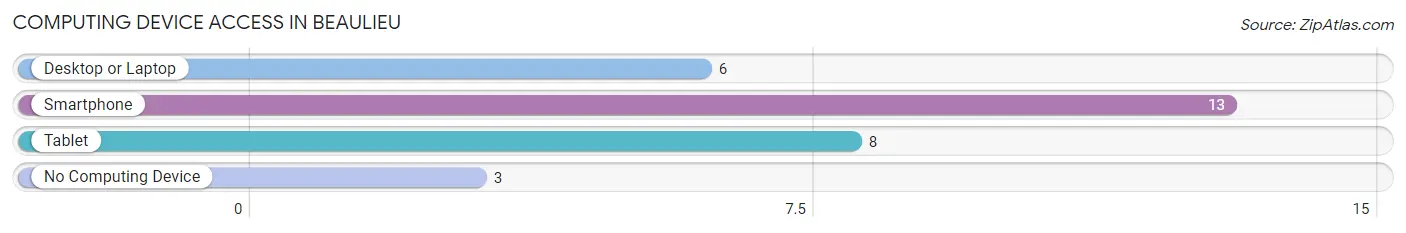
| Device Type | # Households | % Households |
| Desktop or Laptop | 6 | 37.5% |
| Smartphone | 13 | 81.2% |
| Tablet | 8 | 50.0% |
| No Computing Device | 3 | 18.8% |
| Total | 16 | 100.0% |
Internet Access in Beaulieu
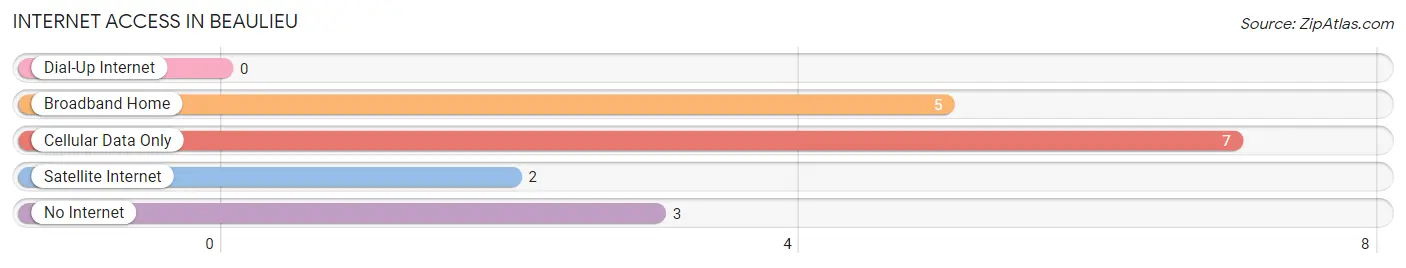
| Internet Type | # Households | % Households |
| Dial-Up Internet | 0 | 0.0% |
| Broadband Home | 5 | 31.2% |
| Cellular Data Only | 7 | 43.8% |
| Satellite Internet | 2 | 12.5% |
| No Internet | 3 | 18.8% |
| Total | 16 | 100.0% |
Beaulieu Summary
Beaulieu is a small town located in the state of Minnesota, in the United States. It is situated in the northern part of the state, in the county of Beltrami. The town has a population of around 500 people, and is located on the banks of the Mississippi River.
History
Beaulieu was founded in 1883 by French-Canadian settlers who had come to the area in search of a better life. The town was named after the French word for “beautiful”, and was originally a small farming community. The town grew slowly over the years, and by the early 1900s, it had become a bustling center of commerce and industry.
The town was home to a number of businesses, including a sawmill, a flour mill, a creamery, and a general store. The town also had a post office, a bank, and a hotel. In the early 1900s, the town was also home to a number of churches, including the Catholic Church of St. Mary’s, the Methodist Church, and the Presbyterian Church.
In the 1920s, the town began to experience a decline in population, as many of the town’s residents moved away in search of better opportunities elsewhere. By the 1950s, the population had dropped to just over 200 people.
Geography
Beaulieu is located in the northern part of Minnesota, in the county of Beltrami. The town is situated on the banks of the Mississippi River, and is surrounded by a number of lakes, including Lake Bemidji, Lake Winnibigoshish, and Lake of the Woods. The town is located approximately 30 miles north of Bemidji, and is about a two-hour drive from Minneapolis.
The town is located in a rural area, and is surrounded by forests and farmland. The town is also home to a number of parks, including the Beaulieu State Park, which is located on the banks of the Mississippi River.
Economy
Beaulieu’s economy is largely based on agriculture and tourism. The town is home to a number of farms, which produce a variety of crops, including corn, soybeans, and wheat. The town is also home to a number of tourist attractions, including the Beaulieu State Park, which is a popular destination for camping, fishing, and hiking.
The town is also home to a number of small businesses, including restaurants, shops, and a grocery store. The town is also home to a number of manufacturing companies, which produce a variety of products, including furniture, clothing, and electronics.
Demographics
As of the 2010 census, the population of Beaulieu was 498 people. The town is predominantly white, with a small percentage of African-American and Native American residents. The median age of the town’s residents is 44.7 years, and the median household income is $41,250. The town has a high rate of poverty, with nearly 20% of the population living below the poverty line.
Common Questions
What is Per Capita Income in Beaulieu?
Per Capita income in Beaulieu is $30,457.
What is the Median Family Income in Beaulieu?
Median Family Income in Beaulieu is $73,125.
What is the Median Household income in Beaulieu?
Median Household Income in Beaulieu is $50,000.
What is Income or Wage Gap in Beaulieu?
Income or Wage Gap in Beaulieu is 22.0%.
Women in Beaulieu earn 78.0 cents for every dollar earned by a man.
What is Inequality or Gini Index in Beaulieu?
Inequality or Gini Index in Beaulieu is 0.43.
What is the Total Population of Beaulieu?
Total Population of Beaulieu is 47.
What is the Total Male Population of Beaulieu?
Total Male Population of Beaulieu is 21.
What is the Total Female Population of Beaulieu?
Total Female Population of Beaulieu is 26.
What is the Ratio of Males per 100 Females in Beaulieu?
There are 80.77 Males per 100 Females in Beaulieu.
What is the Ratio of Females per 100 Males in Beaulieu?
There are 123.81 Females per 100 Males in Beaulieu.
What is the Median Population Age in Beaulieu?
Median Population Age in Beaulieu is 55.5 Years.
What is the Average Family Size in Beaulieu
Average Family Size in Beaulieu is 4.4 People.
What is the Average Household Size in Beaulieu
Average Household Size in Beaulieu is 2.9 People.
How Large is the Labor Force in Beaulieu?
There are 25 People in the Labor Forcein in Beaulieu.
What is the Percentage of People in the Labor Force in Beaulieu?
58.1% of People are in the Labor Force in Beaulieu.
What is the Unemployment Rate in Beaulieu?
Unemployment Rate in Beaulieu is 12.0%.