Mantorville, MN Map & Demographics
Mantorville Map
Mantorville Overview
$46,144
PER CAPITA INCOME
$135,000
AVG FAMILY INCOME
$113,036
AVG HOUSEHOLD INCOME
5.3%
WAGE / INCOME GAP [ % ]
94.7¢/ $1
WAGE / INCOME GAP [ $ ]
0.36
INEQUALITY / GINI INDEX
997
TOTAL POPULATION
472
MALE POPULATION
525
FEMALE POPULATION
89.90
MALES / 100 FEMALES
111.23
FEMALES / 100 MALES
41.7
MEDIAN AGE
3.0
AVG FAMILY SIZE
2.6
AVG HOUSEHOLD SIZE
602
LABOR FORCE [ PEOPLE ]
74.4%
PERCENT IN LABOR FORCE
2.8%
UNEMPLOYMENT RATE
Mantorville Zip Codes
Mantorville Area Codes
Income in Mantorville
Income Overview in Mantorville
Per Capita Income in Mantorville is $46,144, while median incomes of families and households are $135,000 and $113,036 respectively.
| Characteristic | Number | Measure |
| Per Capita Income | 997 | $46,144 |
| Median Family Income | 260 | $135,000 |
| Mean Family Income | 260 | $137,235 |
| Median Household Income | 379 | $113,036 |
| Mean Household Income | 379 | $118,291 |
| Income Deficit | 260 | $0 |
| Wage / Income Gap (%) | 997 | 5.27% |
| Wage / Income Gap ($) | 997 | 94.73¢ per $1 |
| Gini / Inequality Index | 997 | 0.36 |
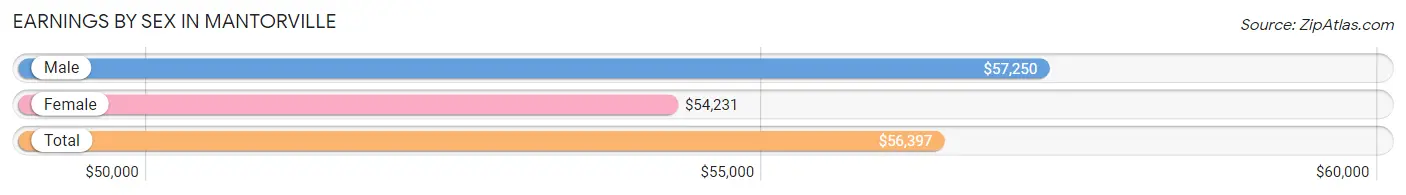
Earnings by Sex in Mantorville
Average Earnings in Mantorville are $56,397, $57,250 for men and $54,231 for women, a difference of 5.3%.
| Sex | Number | Average Earnings |
| Male | 307 (50.1%) | $57,250 |
| Female | 306 (49.9%) | $54,231 |
| Total | 613 (100.0%) | $56,397 |
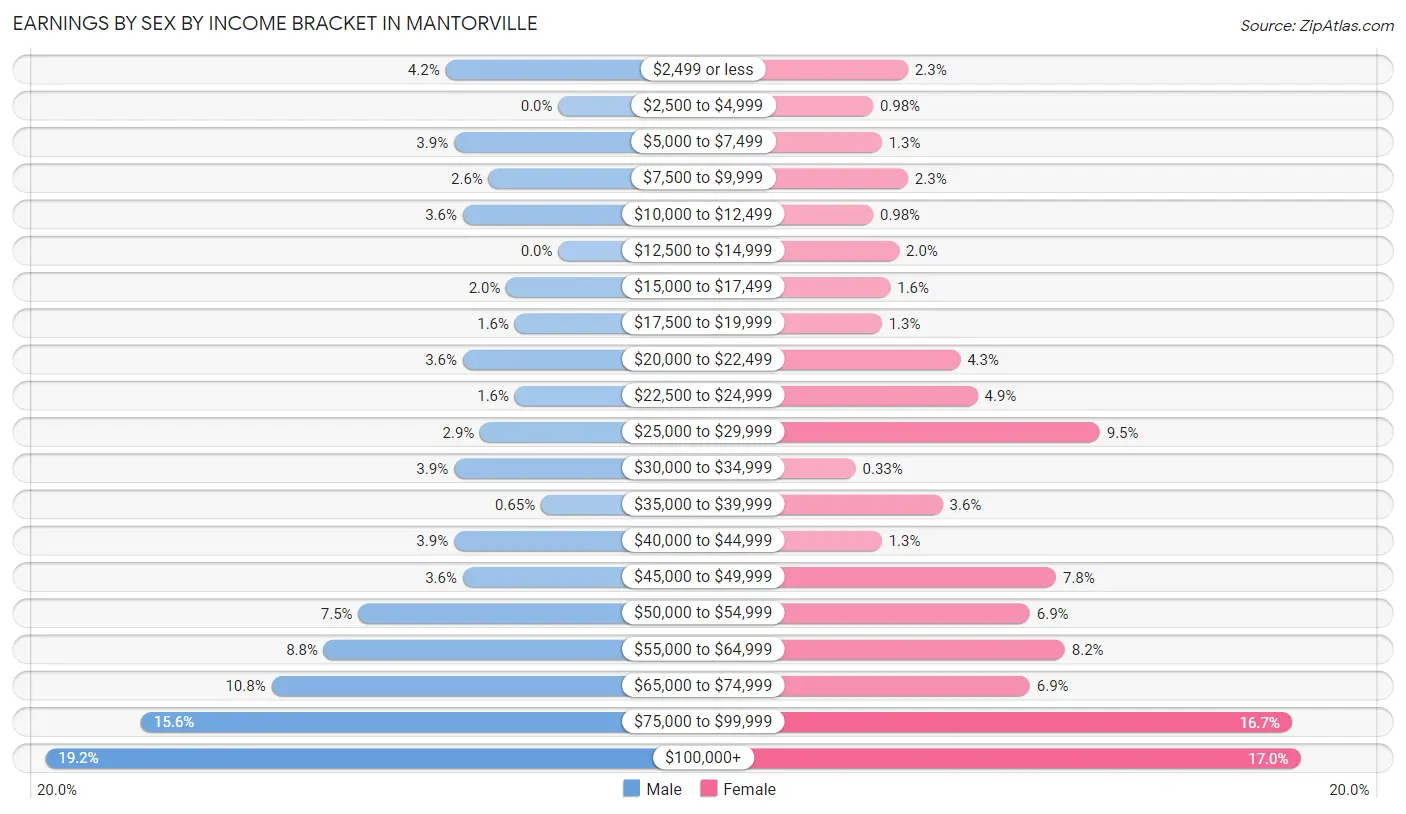
Earnings by Sex by Income Bracket in Mantorville
The most common earnings brackets in Mantorville are $100,000+ for men (59 | 19.2%) and $100,000+ for women (52 | 17.0%).
| Income | Male | Female |
| $2,499 or less | 13 (4.2%) | 7 (2.3%) |
| $2,500 to $4,999 | 0 (0.0%) | 3 (1.0%) |
| $5,000 to $7,499 | 12 (3.9%) | 4 (1.3%) |
| $7,500 to $9,999 | 8 (2.6%) | 7 (2.3%) |
| $10,000 to $12,499 | 11 (3.6%) | 3 (1.0%) |
| $12,500 to $14,999 | 0 (0.0%) | 6 (2.0%) |
| $15,000 to $17,499 | 6 (1.9%) | 5 (1.6%) |
| $17,500 to $19,999 | 5 (1.6%) | 4 (1.3%) |
| $20,000 to $22,499 | 11 (3.6%) | 13 (4.3%) |
| $22,500 to $24,999 | 5 (1.6%) | 15 (4.9%) |
| $25,000 to $29,999 | 9 (2.9%) | 29 (9.5%) |
| $30,000 to $34,999 | 12 (3.9%) | 1 (0.3%) |
| $35,000 to $39,999 | 2 (0.6%) | 11 (3.6%) |
| $40,000 to $44,999 | 12 (3.9%) | 4 (1.3%) |
| $45,000 to $49,999 | 11 (3.6%) | 24 (7.8%) |
| $50,000 to $54,999 | 23 (7.5%) | 21 (6.9%) |
| $55,000 to $64,999 | 27 (8.8%) | 25 (8.2%) |
| $65,000 to $74,999 | 33 (10.7%) | 21 (6.9%) |
| $75,000 to $99,999 | 48 (15.6%) | 51 (16.7%) |
| $100,000+ | 59 (19.2%) | 52 (17.0%) |
| Total | 307 (100.0%) | 306 (100.0%) |
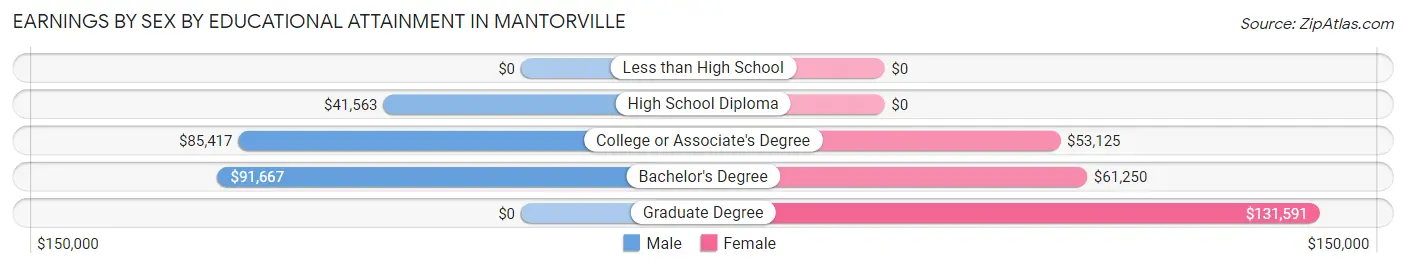
Earnings by Sex by Educational Attainment in Mantorville
Average earnings in Mantorville are $68,854 for men and $61,250 for women, a difference of 11.0%. Men with an educational attainment of bachelor's degree enjoy the highest average annual earnings of $91,667, while those with high school diploma education earn the least with $41,563. Women with an educational attainment of graduate degree earn the most with the average annual earnings of $131,591, while those with college or associate's degree education have the smallest earnings of $53,125.
| Educational Attainment | Male Income | Female Income |
| Less than High School | - | - |
| High School Diploma | $41,563 | $0 |
| College or Associate's Degree | $85,417 | $53,125 |
| Bachelor's Degree | $91,667 | $61,250 |
| Graduate Degree | - | - |
| Total | $68,854 | $61,250 |
Family Income in Mantorville
Family Income Brackets in Mantorville
According to the Mantorville family income data, there are 67 families falling into the $100,000 to $149,999 income range, which is the most common income bracket and makes up 25.8% of all families.
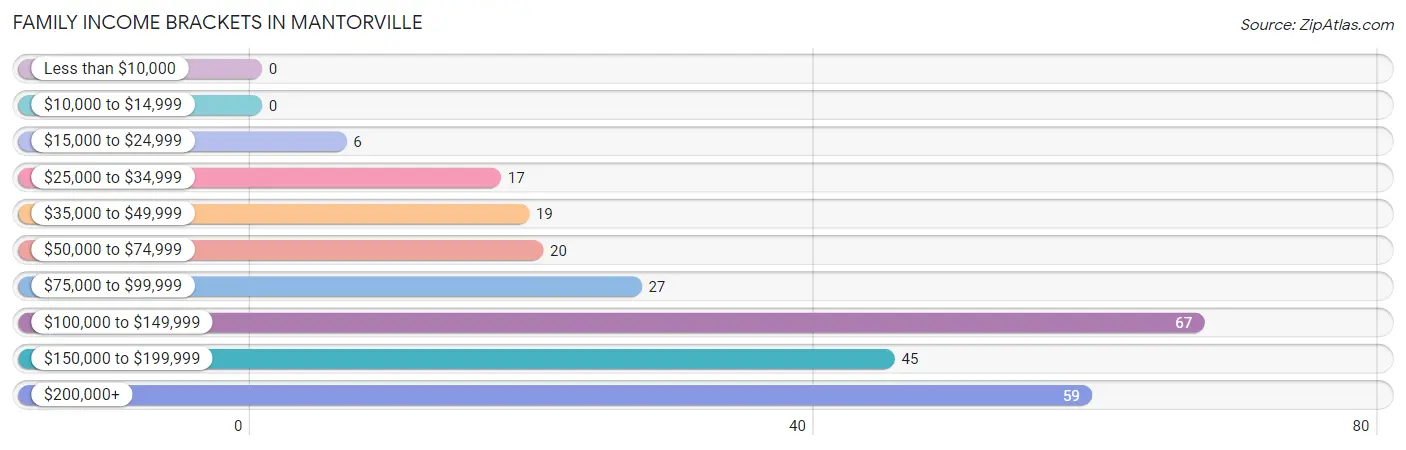
| Income Bracket | # Families | % Families |
| Less than $10,000 | 0 | 0.0% |
| $10,000 to $14,999 | 0 | 0.0% |
| $15,000 to $24,999 | 6 | 2.3% |
| $25,000 to $34,999 | 17 | 6.5% |
| $35,000 to $49,999 | 19 | 7.3% |
| $50,000 to $74,999 | 20 | 7.7% |
| $75,000 to $99,999 | 27 | 10.4% |
| $100,000 to $149,999 | 67 | 25.8% |
| $150,000 to $199,999 | 45 | 17.3% |
| $200,000+ | 59 | 22.7% |
Family Income by Famaliy Size in Mantorville
4-person families (53 | 20.4%) account for the highest median family income in Mantorville with $211,750 per family, while 4-person families (53 | 20.4%) have the highest median income of $52,938 per family member.
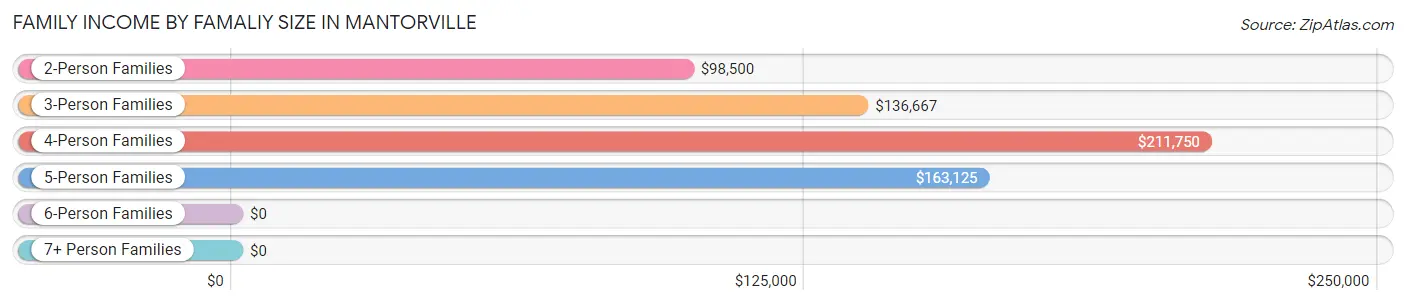
| Income Bracket | # Families | Median Income |
| 2-Person Families | 112 (43.1%) | $98,500 |
| 3-Person Families | 72 (27.7%) | $136,667 |
| 4-Person Families | 53 (20.4%) | $211,750 |
| 5-Person Families | 20 (7.7%) | $163,125 |
| 6-Person Families | 3 (1.1%) | $0 |
| 7+ Person Families | 0 (0.0%) | $0 |
| Total | 260 (100.0%) | $135,000 |
Family Income by Number of Earners in Mantorville
The median family income in Mantorville is $135,000, with families comprising 3+ earners (55) having the highest median family income of $188,125, while families with no earners (39) have the lowest median family income of $46,563, accounting for 21.1% and 15.0% of families, respectively.
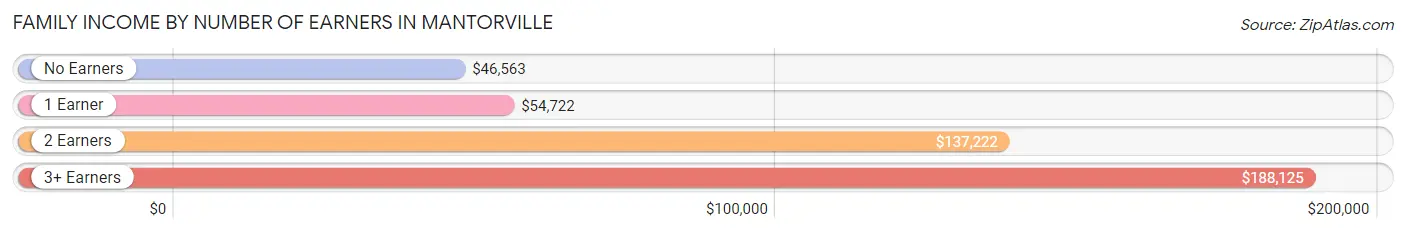
| Number of Earners | # Families | Median Income |
| No Earners | 39 (15.0%) | $46,563 |
| 1 Earner | 58 (22.3%) | $54,722 |
| 2 Earners | 108 (41.5%) | $137,222 |
| 3+ Earners | 55 (21.1%) | $188,125 |
| Total | 260 (100.0%) | $135,000 |
Household Income in Mantorville
Household Income Brackets in Mantorville
With 87 households falling in the category, the $100,000 to $149,999 income range is the most frequent in Mantorville, accounting for 23.0% of all households.
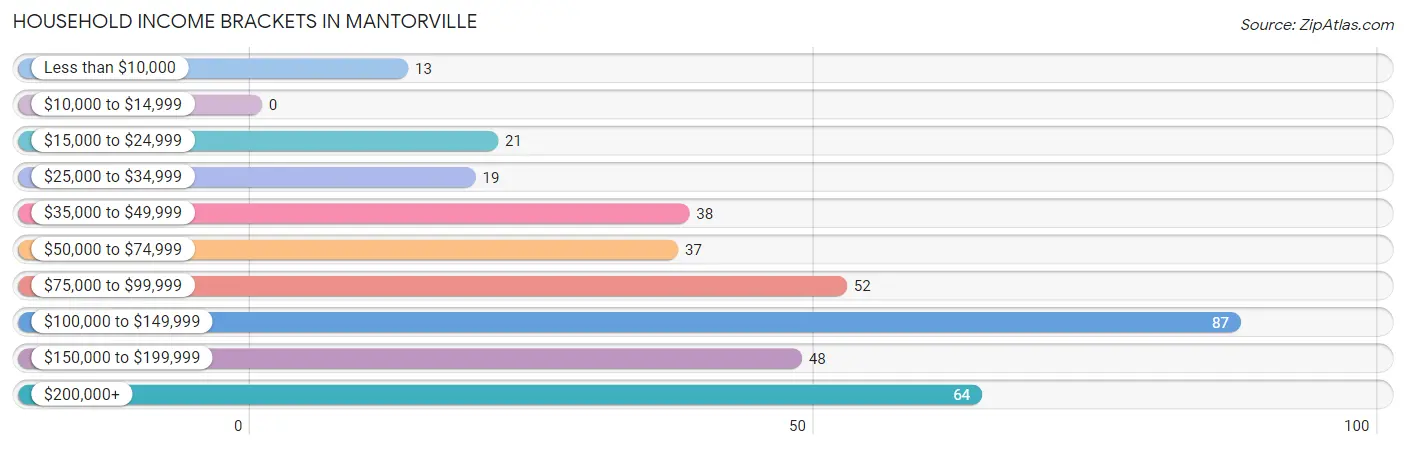
| Income Bracket | # Households | % Households |
| Less than $10,000 | 13 | 3.4% |
| $10,000 to $14,999 | 0 | 0.0% |
| $15,000 to $24,999 | 21 | 5.5% |
| $25,000 to $34,999 | 19 | 5.0% |
| $35,000 to $49,999 | 38 | 10.0% |
| $50,000 to $74,999 | 37 | 9.8% |
| $75,000 to $99,999 | 52 | 13.7% |
| $100,000 to $149,999 | 87 | 23.0% |
| $150,000 to $199,999 | 48 | 12.7% |
| $200,000+ | 64 | 16.9% |
Household Income by Householder Age in Mantorville
The median household income in Mantorville is $113,036, with the highest median household income of $136,000 found in the 45 to 64 years age bracket for the primary householder. A total of 166 households (43.8%) fall into this category. Meanwhile, the 15 to 24 years age bracket for the primary householder has the lowest median household income of $0, with 15 households (4.0%) in this group.
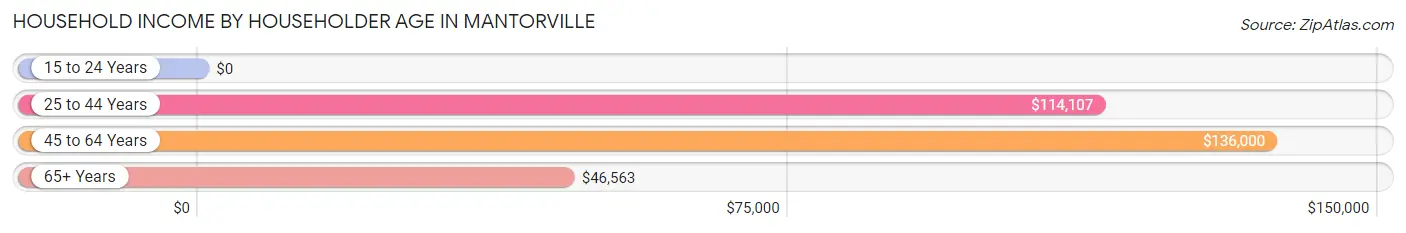
| Income Bracket | # Households | Median Income |
| 15 to 24 Years | 15 (4.0%) | $0 |
| 25 to 44 Years | 97 (25.6%) | $114,107 |
| 45 to 64 Years | 166 (43.8%) | $136,000 |
| 65+ Years | 101 (26.7%) | $46,563 |
| Total | 379 (100.0%) | $113,036 |
Poverty in Mantorville
Income Below Poverty by Sex and Age in Mantorville
With 3.8% poverty level for males and 0.4% for females among the residents of Mantorville, 55 to 64 year old males and 65 to 74 year old females are the most vulnerable to poverty, with 11 males (12.4%) and 2 females (4.3%) in their respective age groups living below the poverty level.
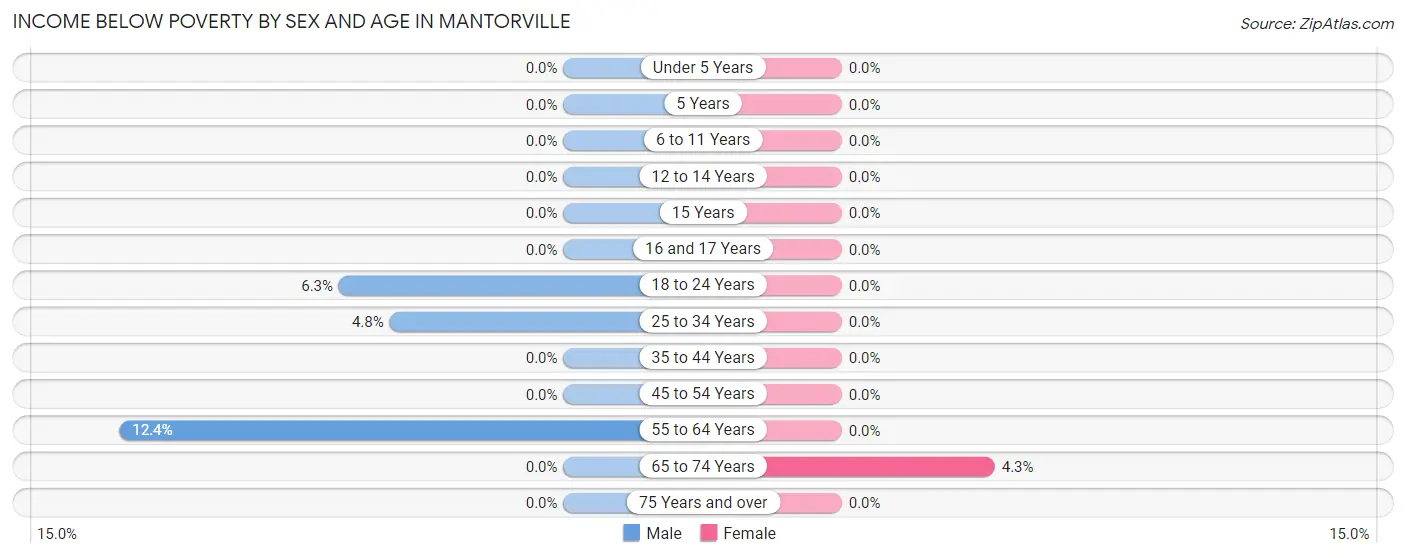
| Age Bracket | Male | Female |
| Under 5 Years | 0 (0.0%) | 0 (0.0%) |
| 5 Years | 0 (0.0%) | 0 (0.0%) |
| 6 to 11 Years | 0 (0.0%) | 0 (0.0%) |
| 12 to 14 Years | 0 (0.0%) | 0 (0.0%) |
| 15 Years | 0 (0.0%) | 0 (0.0%) |
| 16 and 17 Years | 0 (0.0%) | 0 (0.0%) |
| 18 to 24 Years | 4 (6.2%) | 0 (0.0%) |
| 25 to 34 Years | 3 (4.8%) | 0 (0.0%) |
| 35 to 44 Years | 0 (0.0%) | 0 (0.0%) |
| 45 to 54 Years | 0 (0.0%) | 0 (0.0%) |
| 55 to 64 Years | 11 (12.4%) | 0 (0.0%) |
| 65 to 74 Years | 0 (0.0%) | 2 (4.3%) |
| 75 Years and over | 0 (0.0%) | 0 (0.0%) |
| Total | 18 (3.8%) | 2 (0.4%) |
Income Above Poverty by Sex and Age in Mantorville
According to the poverty statistics in Mantorville, males aged under 5 years and females aged under 5 years are the age groups that are most secure financially, with 100.0% of males and 100.0% of females in these age groups living above the poverty line.
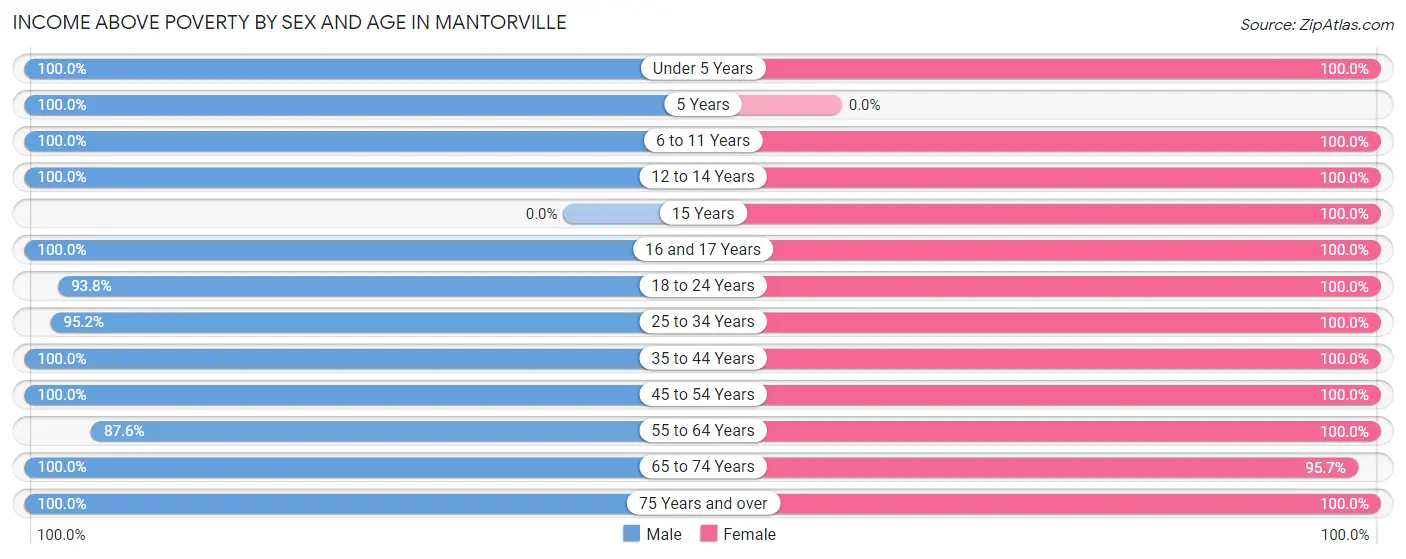
| Age Bracket | Male | Female |
| Under 5 Years | 21 (100.0%) | 11 (100.0%) |
| 5 Years | 7 (100.0%) | 0 (0.0%) |
| 6 to 11 Years | 26 (100.0%) | 52 (100.0%) |
| 12 to 14 Years | 31 (100.0%) | 20 (100.0%) |
| 15 Years | 0 (0.0%) | 12 (100.0%) |
| 16 and 17 Years | 9 (100.0%) | 14 (100.0%) |
| 18 to 24 Years | 60 (93.8%) | 48 (100.0%) |
| 25 to 34 Years | 59 (95.2%) | 56 (100.0%) |
| 35 to 44 Years | 50 (100.0%) | 49 (100.0%) |
| 45 to 54 Years | 47 (100.0%) | 68 (100.0%) |
| 55 to 64 Years | 78 (87.6%) | 100 (100.0%) |
| 65 to 74 Years | 54 (100.0%) | 45 (95.7%) |
| 75 Years and over | 12 (100.0%) | 40 (100.0%) |
| Total | 454 (96.2%) | 515 (99.6%) |
Income Below Poverty Among Married-Couple Families in Mantorville
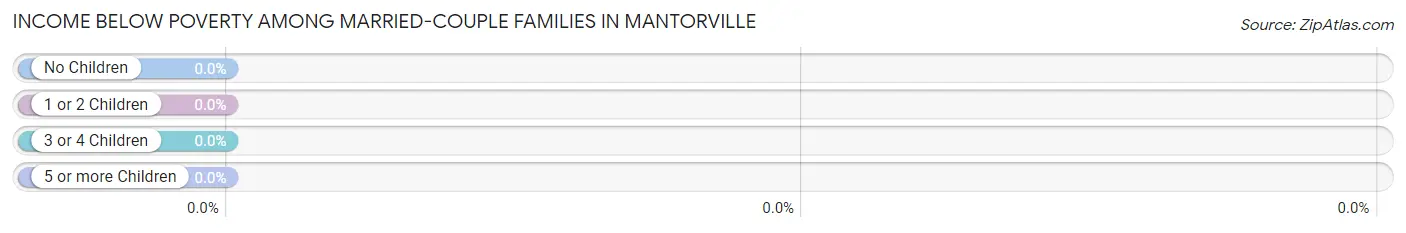
| Children | Above Poverty | Below Poverty |
| No Children | 139 (100.0%) | 0 (0.0%) |
| 1 or 2 Children | 51 (100.0%) | 0 (0.0%) |
| 3 or 4 Children | 16 (100.0%) | 0 (0.0%) |
| 5 or more Children | 0 (0.0%) | 0 (0.0%) |
| Total | 206 (100.0%) | 0 (0.0%) |
Income Below Poverty Among Single-Parent Households in Mantorville
| Children | Single Father | Single Mother |
| No Children | 0 (0.0%) | 0 (0.0%) |
| 1 or 2 Children | 0 (0.0%) | 0 (0.0%) |
| 3 or 4 Children | 0 (0.0%) | 0 (0.0%) |
| 5 or more Children | 0 (0.0%) | 0 (0.0%) |
| Total | 0 (0.0%) | 0 (0.0%) |
Income Below Poverty Among Married-Couple vs Single-Parent Households in Mantorville
| Children | Married-Couple Families | Single-Parent Households |
| No Children | 0 (0.0%) | 0 (0.0%) |
| 1 or 2 Children | 0 (0.0%) | 0 (0.0%) |
| 3 or 4 Children | 0 (0.0%) | 0 (0.0%) |
| 5 or more Children | 0 (0.0%) | 0 (0.0%) |
| Total | 0 (0.0%) | 0 (0.0%) |
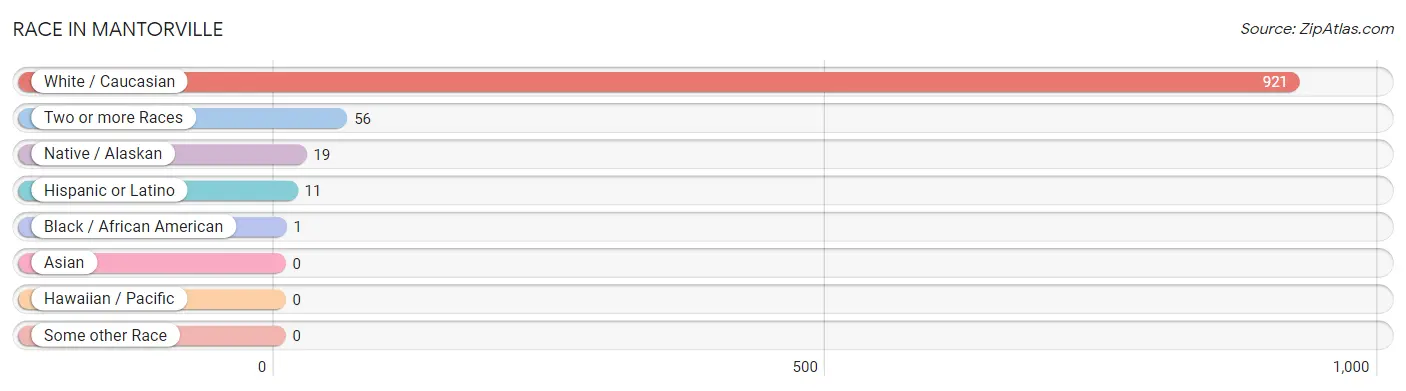
Race in Mantorville
The most populous races in Mantorville are White / Caucasian (921 | 92.4%), Two or more Races (56 | 5.6%), and Native / Alaskan (19 | 1.9%).
| Race | # Population | % Population |
| Asian | 0 | 0.0% |
| Black / African American | 1 | 0.1% |
| Hawaiian / Pacific | 0 | 0.0% |
| Hispanic or Latino | 11 | 1.1% |
| Native / Alaskan | 19 | 1.9% |
| White / Caucasian | 921 | 92.4% |
| Two or more Races | 56 | 5.6% |
| Some other Race | 0 | 0.0% |
| Total | 997 | 100.0% |
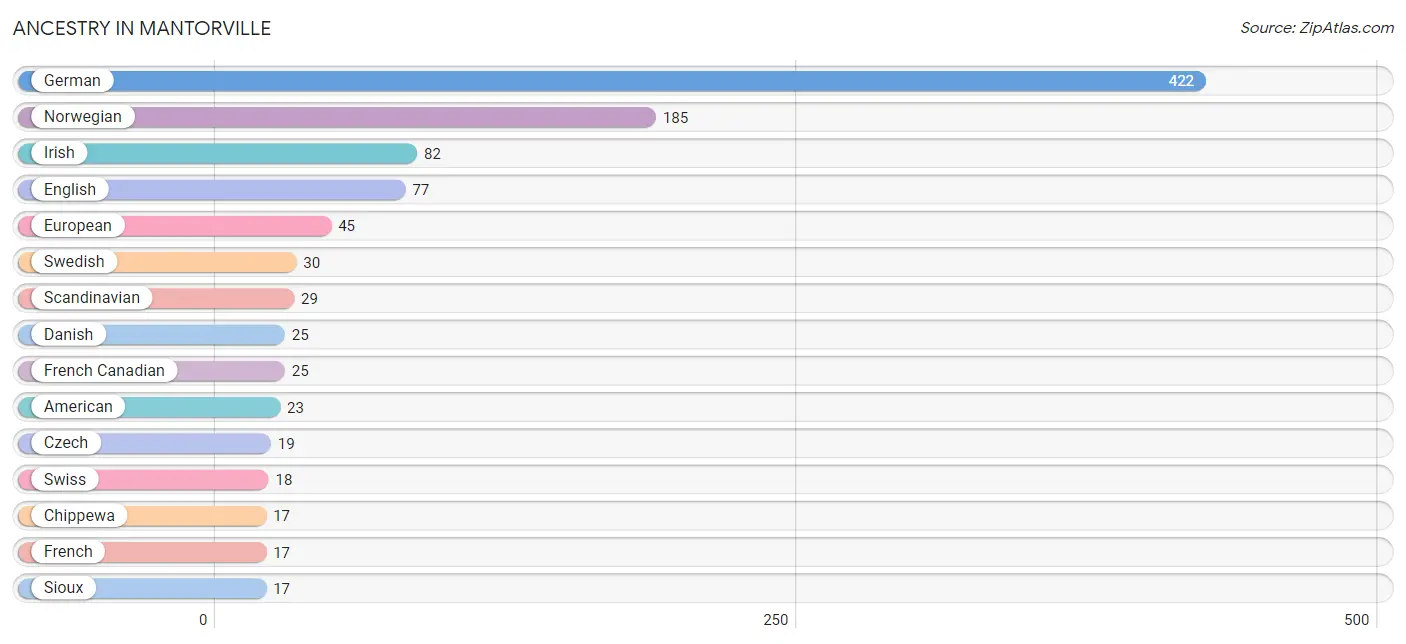
Ancestry in Mantorville
The most populous ancestries reported in Mantorville are German (422 | 42.3%), Norwegian (185 | 18.6%), Irish (82 | 8.2%), English (77 | 7.7%), and European (45 | 4.5%), together accounting for 81.3% of all Mantorville residents.
| Ancestry | # Population | % Population |
| American | 23 | 2.3% |
| Belgian | 11 | 1.1% |
| British | 4 | 0.4% |
| Chippewa | 17 | 1.7% |
| Czech | 19 | 1.9% |
| Czechoslovakian | 8 | 0.8% |
| Danish | 25 | 2.5% |
| Dutch | 15 | 1.5% |
| English | 77 | 7.7% |
| European | 45 | 4.5% |
| French | 17 | 1.7% |
| French Canadian | 25 | 2.5% |
| German | 422 | 42.3% |
| Irish | 82 | 8.2% |
| Italian | 4 | 0.4% |
| Mexican | 11 | 1.1% |
| Norwegian | 185 | 18.6% |
| Polish | 11 | 1.1% |
| Scandinavian | 29 | 2.9% |
| Scottish | 7 | 0.7% |
| Sioux | 17 | 1.7% |
| Swedish | 30 | 3.0% |
| Swiss | 18 | 1.8% |
| Welsh | 13 | 1.3% | View All 24 Rows |
Immigrants in Mantorville
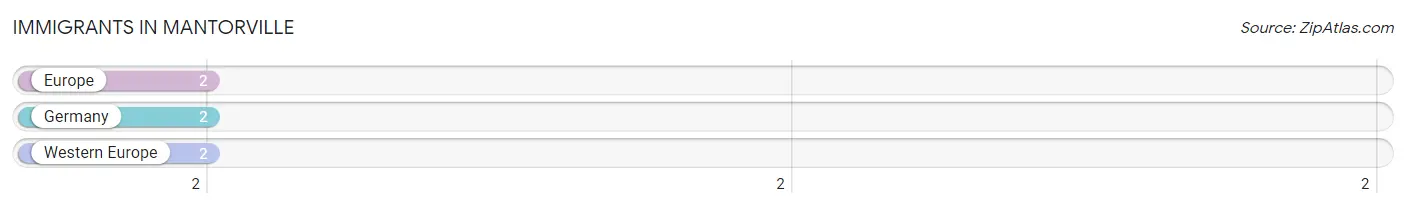
The most numerous immigrant groups reported in Mantorville came from Europe (2 | 0.2%), Germany (2 | 0.2%), and Western Europe (2 | 0.2%), together accounting for 0.6% of all Mantorville residents.
| Immigration Origin | # Population | % Population |
| Europe | 2 | 0.2% |
| Germany | 2 | 0.2% |
| Western Europe | 2 | 0.2% | View All 3 Rows |
Sex and Age in Mantorville
Sex and Age in Mantorville
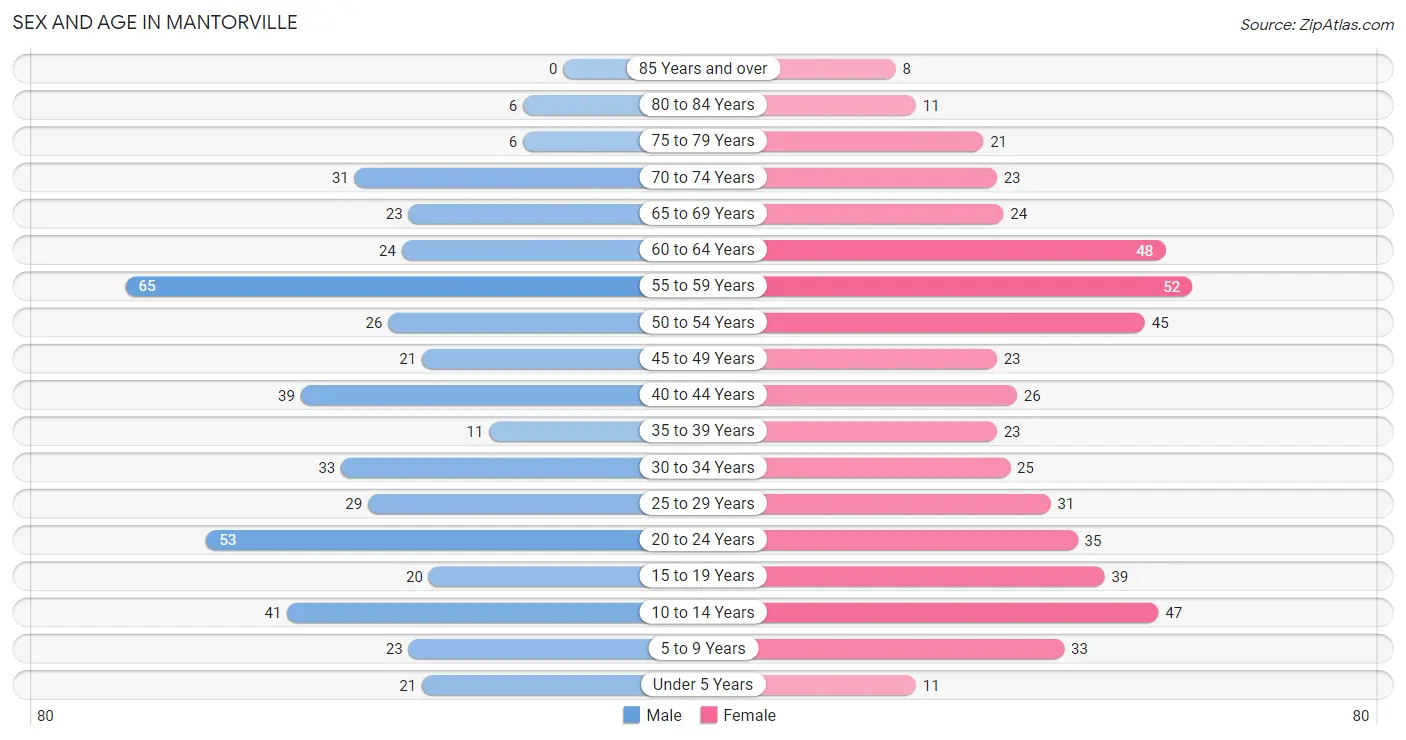
The most populous age groups in Mantorville are 55 to 59 Years (65 | 13.8%) for men and 55 to 59 Years (52 | 9.9%) for women.
| Age Bracket | Male | Female |
| Under 5 Years | 21 (4.4%) | 11 (2.1%) |
| 5 to 9 Years | 23 (4.9%) | 33 (6.3%) |
| 10 to 14 Years | 41 (8.7%) | 47 (8.9%) |
| 15 to 19 Years | 20 (4.2%) | 39 (7.4%) |
| 20 to 24 Years | 53 (11.2%) | 35 (6.7%) |
| 25 to 29 Years | 29 (6.1%) | 31 (5.9%) |
| 30 to 34 Years | 33 (7.0%) | 25 (4.8%) |
| 35 to 39 Years | 11 (2.3%) | 23 (4.4%) |
| 40 to 44 Years | 39 (8.3%) | 26 (5.0%) |
| 45 to 49 Years | 21 (4.4%) | 23 (4.4%) |
| 50 to 54 Years | 26 (5.5%) | 45 (8.6%) |
| 55 to 59 Years | 65 (13.8%) | 52 (9.9%) |
| 60 to 64 Years | 24 (5.1%) | 48 (9.1%) |
| 65 to 69 Years | 23 (4.9%) | 24 (4.6%) |
| 70 to 74 Years | 31 (6.6%) | 23 (4.4%) |
| 75 to 79 Years | 6 (1.3%) | 21 (4.0%) |
| 80 to 84 Years | 6 (1.3%) | 11 (2.1%) |
| 85 Years and over | 0 (0.0%) | 8 (1.5%) |
| Total | 472 (100.0%) | 525 (100.0%) |
Families and Households in Mantorville
Median Family Size in Mantorville
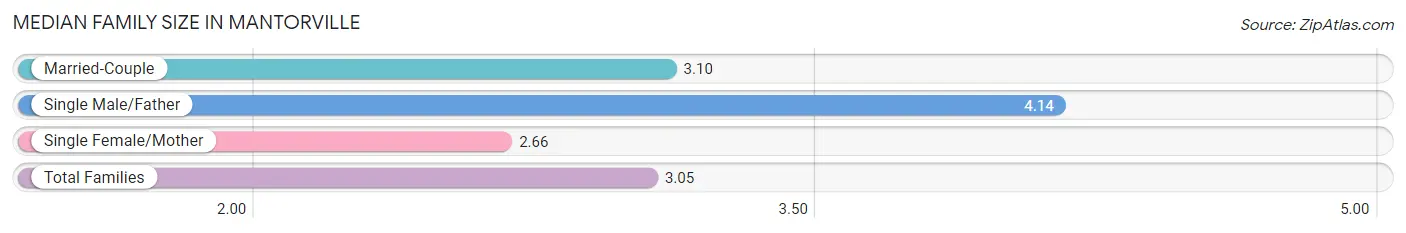
The median family size in Mantorville is 3.05 persons per family, with single male/father families (7 | 2.7%) accounting for the largest median family size of 4.14 persons per family. On the other hand, single female/mother families (47 | 18.1%) represent the smallest median family size with 2.66 persons per family.
| Family Type | # Families | Family Size |
| Married-Couple | 206 (79.2%) | 3.10 |
| Single Male/Father | 7 (2.7%) | 4.14 |
| Single Female/Mother | 47 (18.1%) | 2.66 |
| Total Families | 260 (100.0%) | 3.05 |
Median Household Size in Mantorville
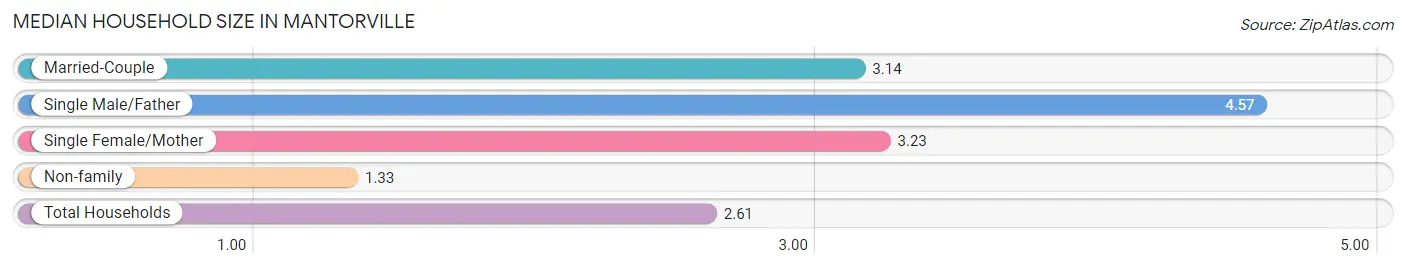
The median household size in Mantorville is 2.61 persons per household, with single male/father households (7 | 1.8%) accounting for the largest median household size of 4.57 persons per household. non-family households (119 | 31.4%) represent the smallest median household size with 1.33 persons per household.
| Household Type | # Households | Household Size |
| Married-Couple | 206 (54.3%) | 3.14 |
| Single Male/Father | 7 (1.8%) | 4.57 |
| Single Female/Mother | 47 (12.4%) | 3.23 |
| Non-family | 119 (31.4%) | 1.33 |
| Total Households | 379 (100.0%) | 2.61 |
Household Size by Marriage Status in Mantorville
Out of a total of 379 households in Mantorville, 260 (68.6%) are family households, while 119 (31.4%) are nonfamily households. The most numerous type of family households are 2-person households, comprising 106, and the most common type of nonfamily households are 1-person households, comprising 85.
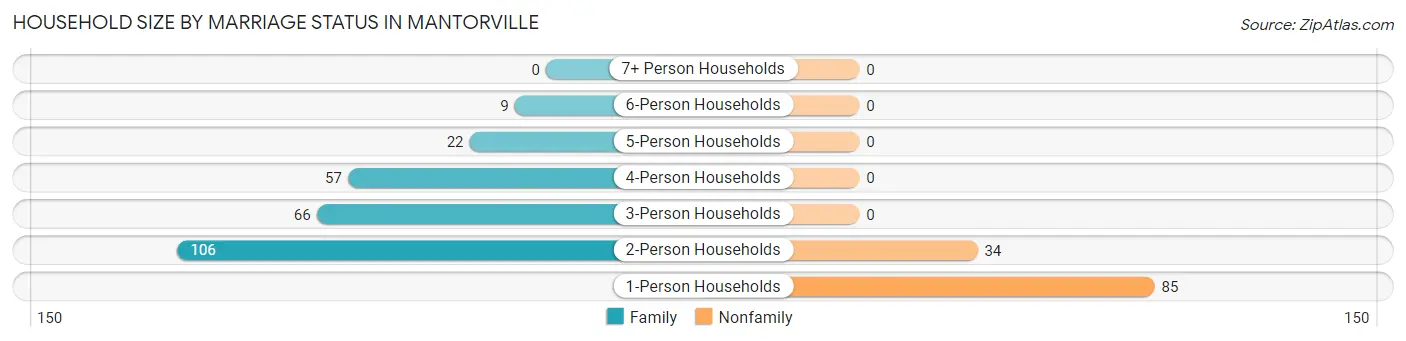
| Household Size | Family Households | Nonfamily Households |
| 1-Person Households | - | 85 (22.4%) |
| 2-Person Households | 106 (28.0%) | 34 (9.0%) |
| 3-Person Households | 66 (17.4%) | 0 (0.0%) |
| 4-Person Households | 57 (15.0%) | 0 (0.0%) |
| 5-Person Households | 22 (5.8%) | 0 (0.0%) |
| 6-Person Households | 9 (2.4%) | 0 (0.0%) |
| 7+ Person Households | 0 (0.0%) | 0 (0.0%) |
| Total | 260 (68.6%) | 119 (31.4%) |
Female Fertility in Mantorville
Fertility by Age in Mantorville
Average fertility rate in Mantorville is 14.0 births per 1,000 women. Women in the age bracket of 20 to 34 years have the highest fertility rate with 33.0 births per 1,000 women. Women in the age bracket of 20 to 34 years acount for 100.0% of all women with births.
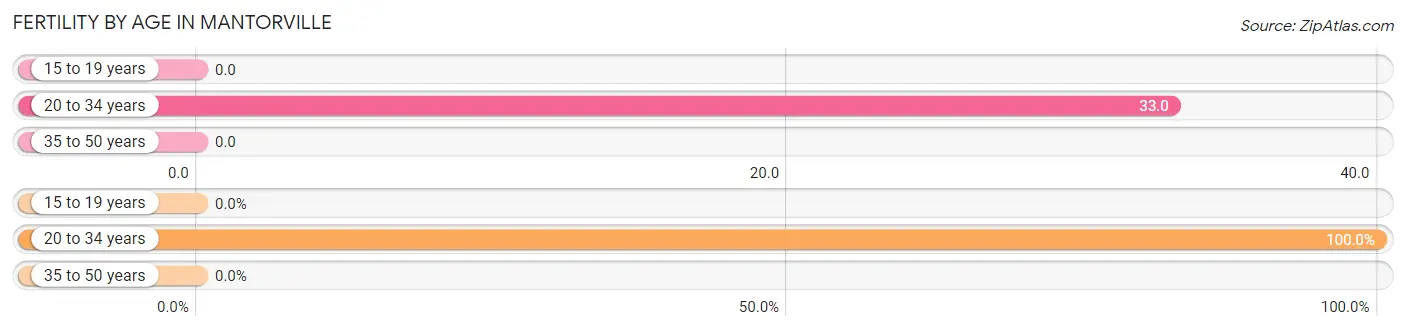
| Age Bracket | Women with Births | Births / 1,000 Women |
| 15 to 19 years | 0 (0.0%) | 0.0 |
| 20 to 34 years | 3 (100.0%) | 33.0 |
| 35 to 50 years | 0 (0.0%) | 0.0 |
| Total | 3 (100.0%) | 14.0 |
Fertility by Age by Marriage Status in Mantorville
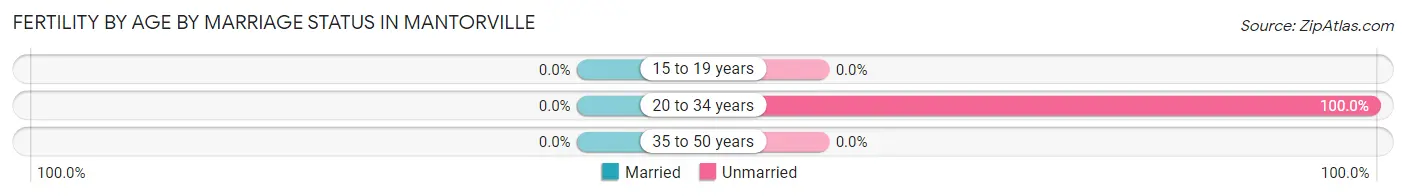
| Age Bracket | Married | Unmarried |
| 15 to 19 years | 0 (0.0%) | 0 (0.0%) |
| 20 to 34 years | 0 (0.0%) | 3 (100.0%) |
| 35 to 50 years | 0 (0.0%) | 0 (0.0%) |
| Total | 0 (0.0%) | 3 (100.0%) |
Fertility by Education in Mantorville
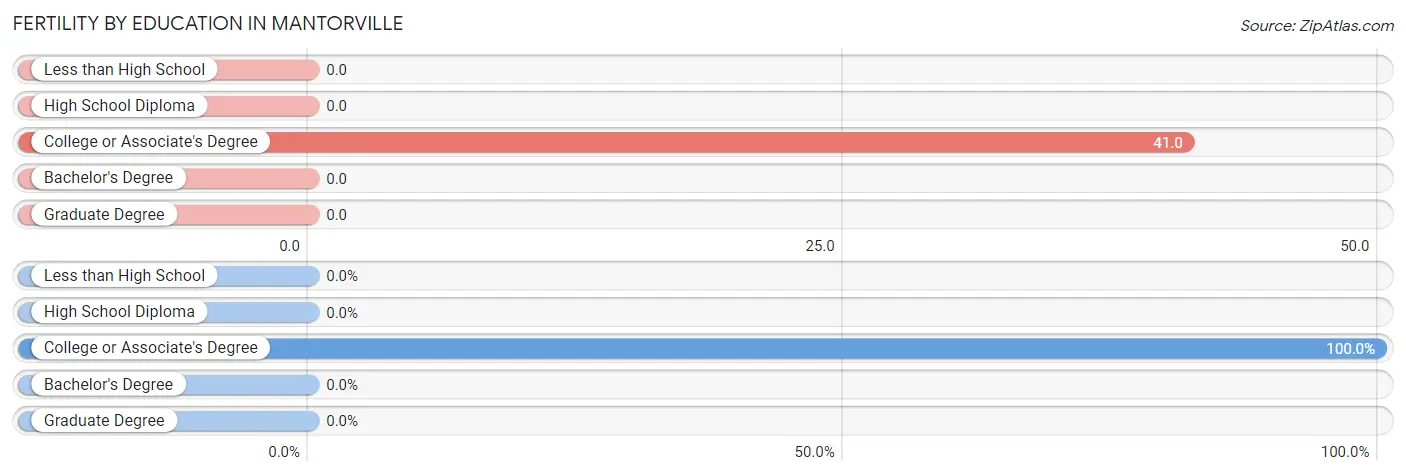
| Educational Attainment | Women with Births | Births / 1,000 Women |
| Less than High School | 0 (0.0%) | 0.0 |
| High School Diploma | 0 (0.0%) | 0.0 |
| College or Associate's Degree | 3 (100.0%) | 41.0 |
| Bachelor's Degree | 0 (0.0%) | 0.0 |
| Graduate Degree | 0 (0.0%) | 0.0 |
| Total | 3 (100.0%) | 14.0 |
Fertility by Education by Marriage Status in Mantorville
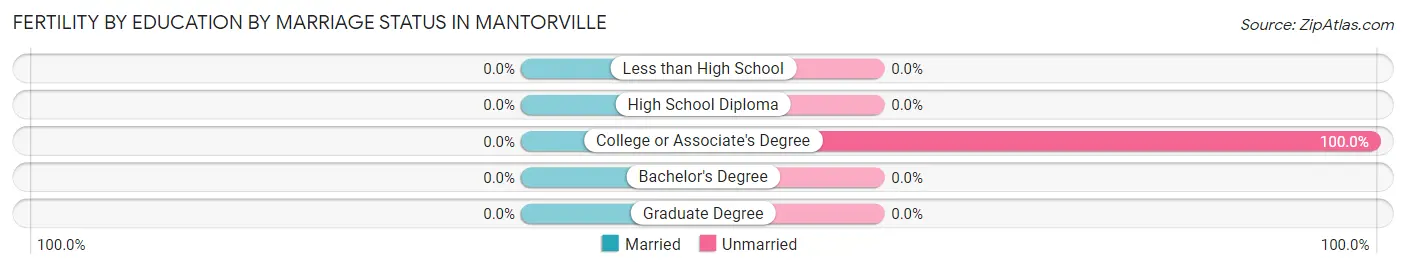
| Educational Attainment | Married | Unmarried |
| Less than High School | 0 (0.0%) | 0 (0.0%) |
| High School Diploma | 0 (0.0%) | 0 (0.0%) |
| College or Associate's Degree | 0 (0.0%) | 3 (100.0%) |
| Bachelor's Degree | 0 (0.0%) | 0 (0.0%) |
| Graduate Degree | 0 (0.0%) | 0 (0.0%) |
| Total | 0 (0.0%) | 3 (100.0%) |
Employment Characteristics in Mantorville
Employment by Class of Employer in Mantorville
Among the 579 employed individuals in Mantorville, private company employees (303 | 52.3%), not-for-profit organizations (185 | 32.0%), and local government employees (47 | 8.1%) make up the most common classes of employment.
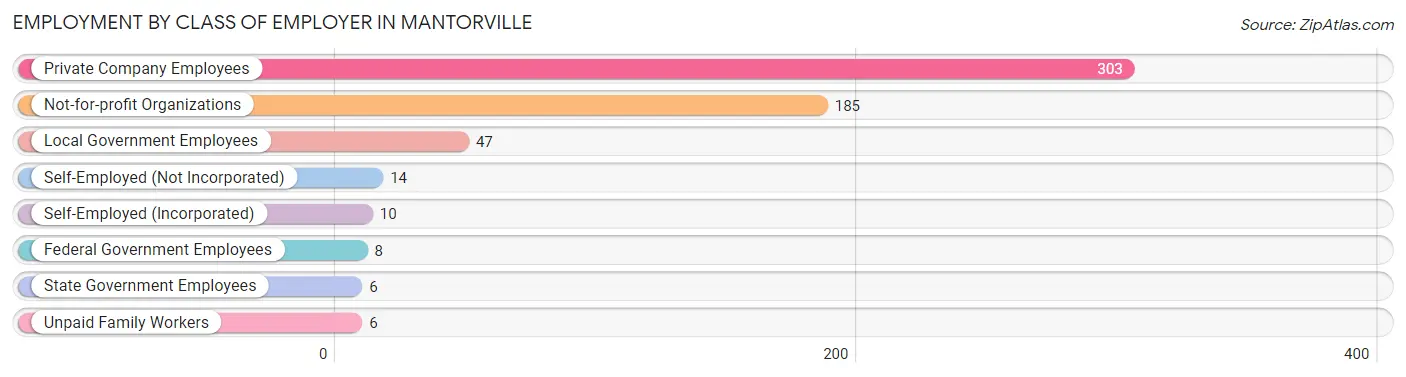
| Employer Class | # Employees | % Employees |
| Private Company Employees | 303 | 52.3% |
| Self-Employed (Incorporated) | 10 | 1.7% |
| Self-Employed (Not Incorporated) | 14 | 2.4% |
| Not-for-profit Organizations | 185 | 32.0% |
| Local Government Employees | 47 | 8.1% |
| State Government Employees | 6 | 1.0% |
| Federal Government Employees | 8 | 1.4% |
| Unpaid Family Workers | 6 | 1.0% |
| Total | 579 | 100.0% |
Employment Status by Age in Mantorville
According to the labor force statistics for Mantorville, out of the total population over 16 years of age (809), 74.4% or 602 individuals are in the labor force, with 2.8% or 17 of them unemployed. The age group with the highest labor force participation rate is 35 to 44 years, with 100.0% or 99 individuals in the labor force. Within the labor force, the 65 to 74 years age range has the highest percentage of unemployed individuals, with 30.6% or 11 of them being unemployed.
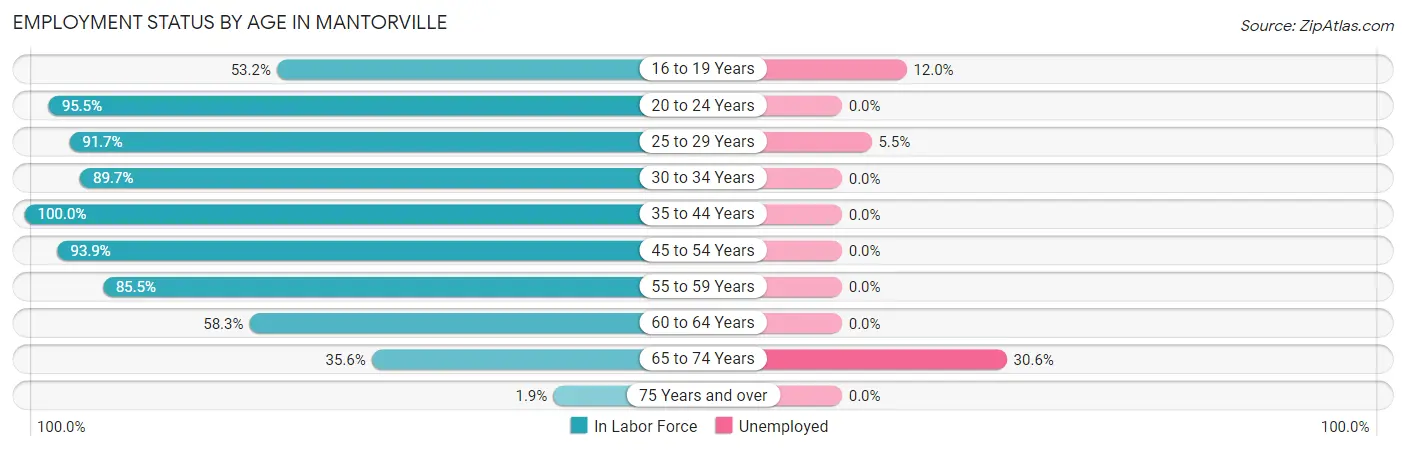
| Age Bracket | In Labor Force | Unemployed |
| 16 to 19 Years | 25 (53.2%) | 3 (12.0%) |
| 20 to 24 Years | 84 (95.5%) | 0 (0.0%) |
| 25 to 29 Years | 55 (91.7%) | 3 (5.5%) |
| 30 to 34 Years | 52 (89.7%) | 0 (0.0%) |
| 35 to 44 Years | 99 (100.0%) | 0 (0.0%) |
| 45 to 54 Years | 108 (93.9%) | 0 (0.0%) |
| 55 to 59 Years | 100 (85.5%) | 0 (0.0%) |
| 60 to 64 Years | 42 (58.3%) | 0 (0.0%) |
| 65 to 74 Years | 36 (35.6%) | 11 (30.6%) |
| 75 Years and over | 1 (1.9%) | 0 (0.0%) |
| Total | 602 (74.4%) | 17 (2.8%) |
Employment Status by Educational Attainment in Mantorville
According to labor force statistics for Mantorville, 87.5% of individuals (456) out of the total population between 25 and 64 years of age (521) are in the labor force, with 0.7% or 3 of them being unemployed. The group with the highest labor force participation rate are those with the educational attainment of bachelor's degree or higher, with 92.5% or 186 individuals in the labor force. Within the labor force, individuals with bachelor's degree or higher education have the highest percentage of unemployment, with 1.6% or 3 of them being unemployed.
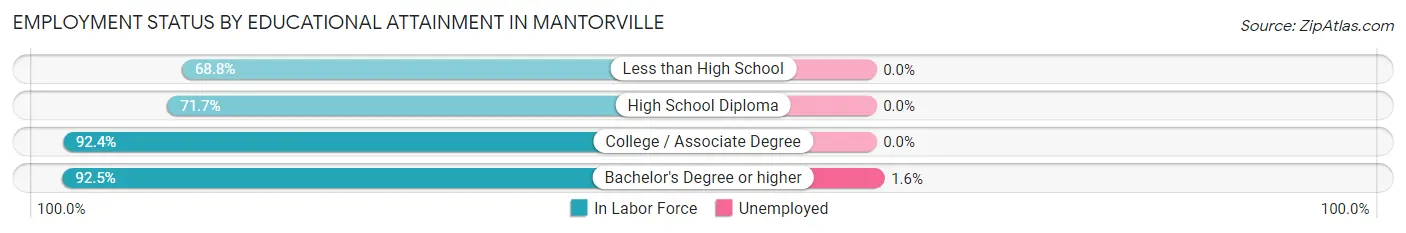
| Educational Attainment | In Labor Force | Unemployed |
| Less than High School | 11 (68.8%) | 0 (0.0%) |
| High School Diploma | 76 (71.7%) | 0 (0.0%) |
| College / Associate Degree | 183 (92.4%) | 0 (0.0%) |
| Bachelor's Degree or higher | 186 (92.5%) | 3 (1.6%) |
| Total | 456 (87.5%) | 4 (0.7%) |
Employment Occupations by Sex in Mantorville
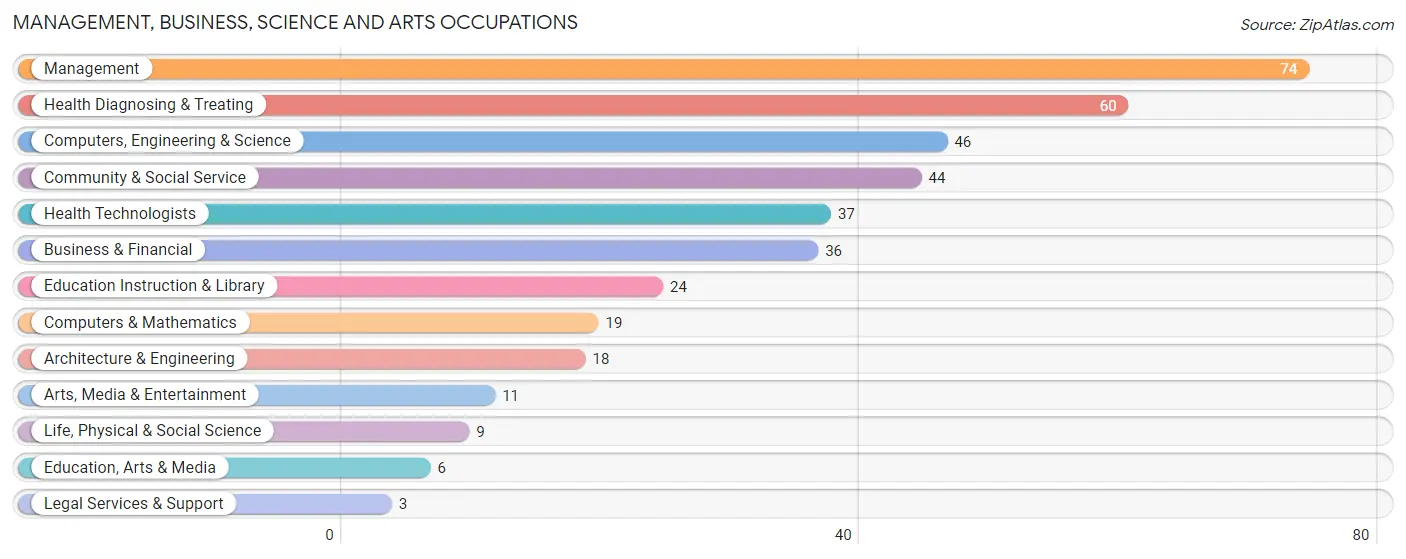
Management, Business, Science and Arts Occupations
The most common Management, Business, Science and Arts occupations in Mantorville are Management (74 | 12.7%), Health Diagnosing & Treating (60 | 10.3%), Computers, Engineering & Science (46 | 7.9%), Community & Social Service (44 | 7.5%), and Health Technologists (37 | 6.3%).
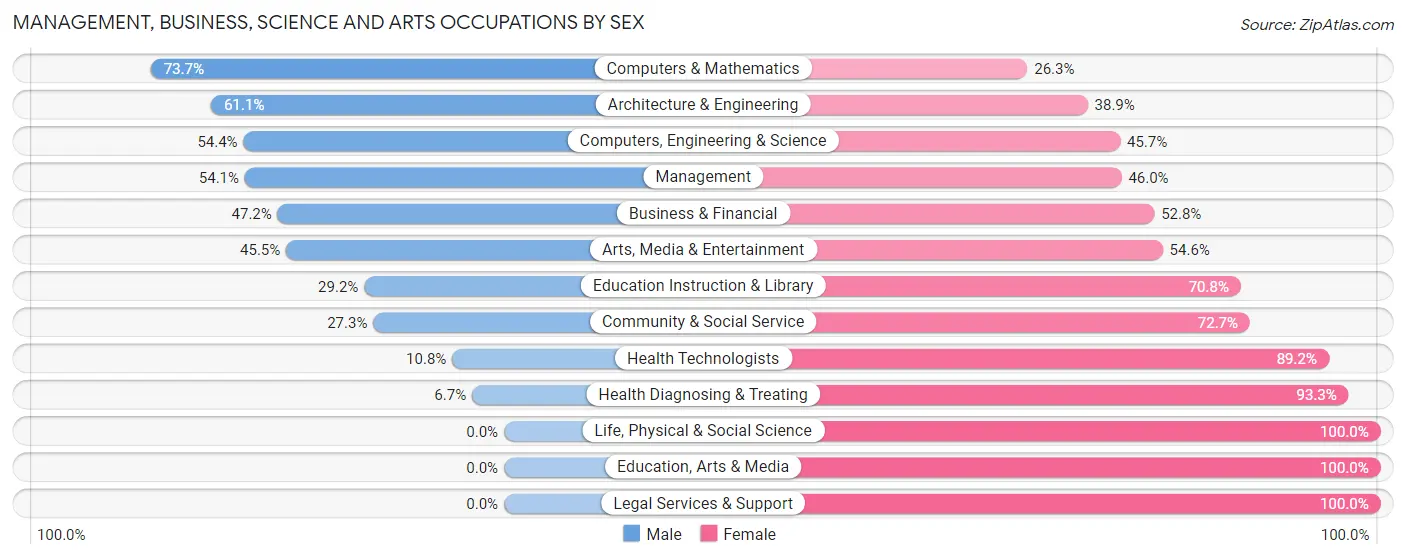
Management, Business, Science and Arts Occupations by Sex
Within the Management, Business, Science and Arts occupations in Mantorville, the most male-oriented occupations are Computers & Mathematics (73.7%), Architecture & Engineering (61.1%), and Computers, Engineering & Science (54.3%), while the most female-oriented occupations are Life, Physical & Social Science (100.0%), Education, Arts & Media (100.0%), and Legal Services & Support (100.0%).
| Occupation | Male | Female |
| Management | 40 (54.0%) | 34 (46.0%) |
| Business & Financial | 17 (47.2%) | 19 (52.8%) |
| Computers, Engineering & Science | 25 (54.3%) | 21 (45.7%) |
| Computers & Mathematics | 14 (73.7%) | 5 (26.3%) |
| Architecture & Engineering | 11 (61.1%) | 7 (38.9%) |
| Life, Physical & Social Science | 0 (0.0%) | 9 (100.0%) |
| Community & Social Service | 12 (27.3%) | 32 (72.7%) |
| Education, Arts & Media | 0 (0.0%) | 6 (100.0%) |
| Legal Services & Support | 0 (0.0%) | 3 (100.0%) |
| Education Instruction & Library | 7 (29.2%) | 17 (70.8%) |
| Arts, Media & Entertainment | 5 (45.5%) | 6 (54.5%) |
| Health Diagnosing & Treating | 4 (6.7%) | 56 (93.3%) |
| Health Technologists | 4 (10.8%) | 33 (89.2%) |
| Total (Category) | 98 (37.7%) | 162 (62.3%) |
| Total (Overall) | 288 (49.2%) | 297 (50.8%) |
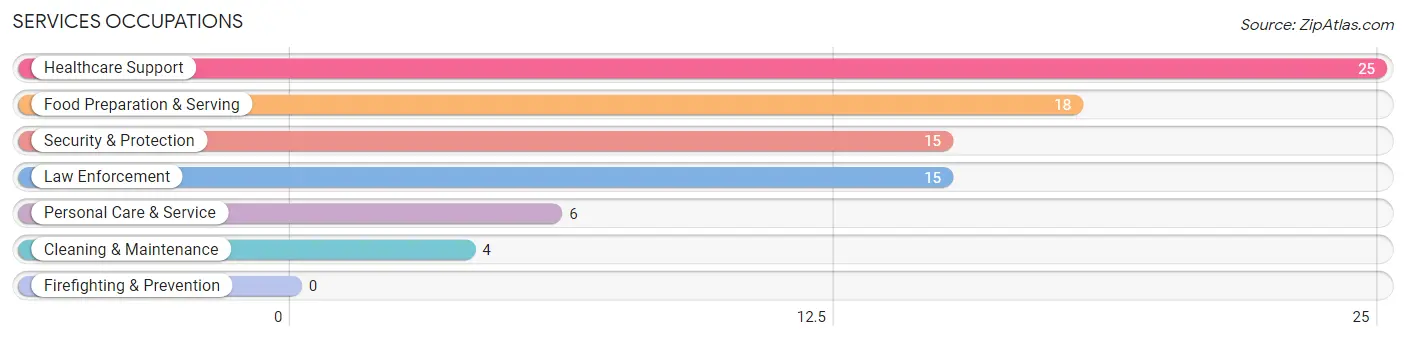
Services Occupations
The most common Services occupations in Mantorville are Healthcare Support (25 | 4.3%), Food Preparation & Serving (18 | 3.1%), Security & Protection (15 | 2.6%), Law Enforcement (15 | 2.6%), and Personal Care & Service (6 | 1.0%).
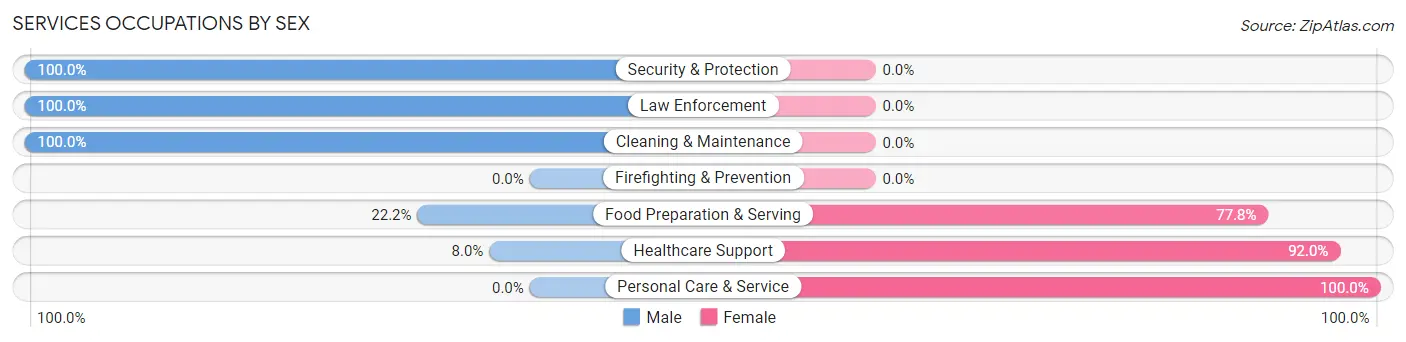
Services Occupations by Sex
Within the Services occupations in Mantorville, the most male-oriented occupations are Security & Protection (100.0%), Law Enforcement (100.0%), and Cleaning & Maintenance (100.0%), while the most female-oriented occupations are Personal Care & Service (100.0%), Healthcare Support (92.0%), and Food Preparation & Serving (77.8%).
| Occupation | Male | Female |
| Healthcare Support | 2 (8.0%) | 23 (92.0%) |
| Security & Protection | 15 (100.0%) | 0 (0.0%) |
| Firefighting & Prevention | 0 (0.0%) | 0 (0.0%) |
| Law Enforcement | 15 (100.0%) | 0 (0.0%) |
| Food Preparation & Serving | 4 (22.2%) | 14 (77.8%) |
| Cleaning & Maintenance | 4 (100.0%) | 0 (0.0%) |
| Personal Care & Service | 0 (0.0%) | 6 (100.0%) |
| Total (Category) | 25 (36.8%) | 43 (63.2%) |
| Total (Overall) | 288 (49.2%) | 297 (50.8%) |
Sales and Office Occupations
The most common Sales and Office occupations in Mantorville are Office & Administration (63 | 10.8%), and Sales & Related (29 | 5.0%).

Sales and Office Occupations by Sex

| Occupation | Male | Female |
| Sales & Related | 15 (51.7%) | 14 (48.3%) |
| Office & Administration | 11 (17.5%) | 52 (82.5%) |
| Total (Category) | 26 (28.3%) | 66 (71.7%) |
| Total (Overall) | 288 (49.2%) | 297 (50.8%) |
Natural Resources, Construction and Maintenance Occupations
The most common Natural Resources, Construction and Maintenance occupations in Mantorville are Construction & Extraction (43 | 7.3%), Installation, Maintenance & Repair (9 | 1.5%), and Farming, Fishing & Forestry (6 | 1.0%).
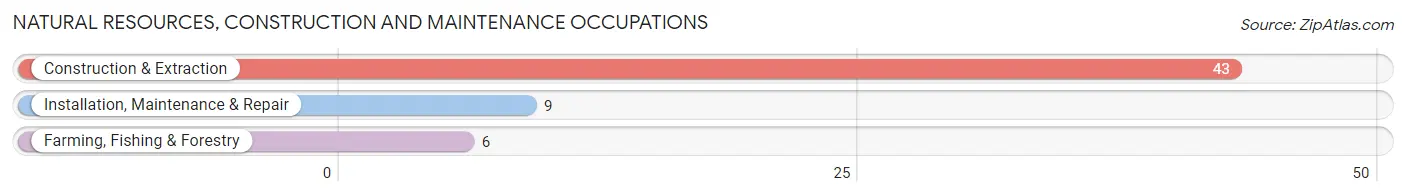
Natural Resources, Construction and Maintenance Occupations by Sex

| Occupation | Male | Female |
| Farming, Fishing & Forestry | 0 (0.0%) | 6 (100.0%) |
| Construction & Extraction | 43 (100.0%) | 0 (0.0%) |
| Installation, Maintenance & Repair | 9 (100.0%) | 0 (0.0%) |
| Total (Category) | 52 (89.7%) | 6 (10.3%) |
| Total (Overall) | 288 (49.2%) | 297 (50.8%) |
Production, Transportation and Moving Occupations
The most common Production, Transportation and Moving occupations in Mantorville are Production (51 | 8.7%), Material Moving (31 | 5.3%), and Transportation (25 | 4.3%).
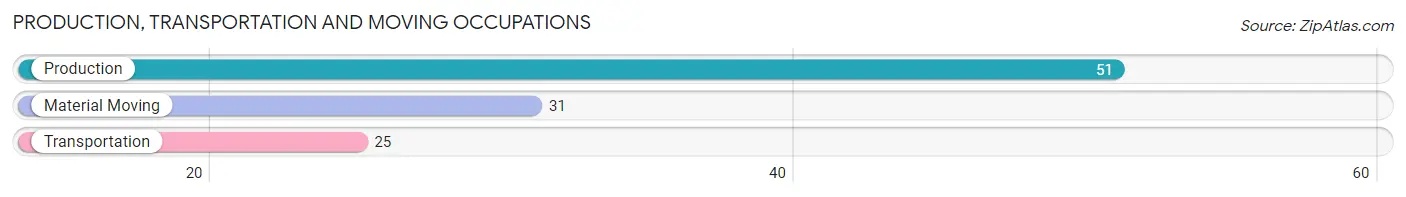
Production, Transportation and Moving Occupations by Sex
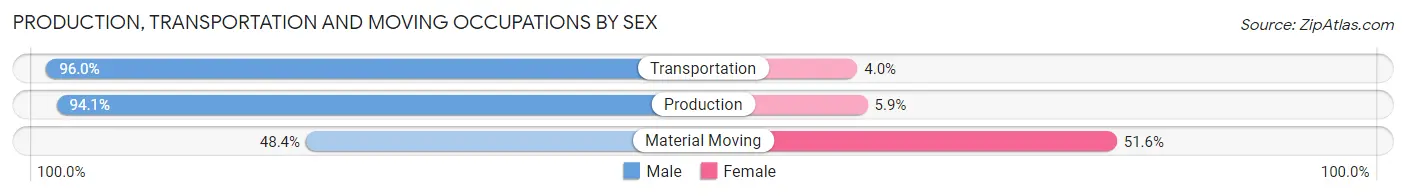
| Occupation | Male | Female |
| Production | 48 (94.1%) | 3 (5.9%) |
| Transportation | 24 (96.0%) | 1 (4.0%) |
| Material Moving | 15 (48.4%) | 16 (51.6%) |
| Total (Category) | 87 (81.3%) | 20 (18.7%) |
| Total (Overall) | 288 (49.2%) | 297 (50.8%) |
Employment Industries by Sex in Mantorville
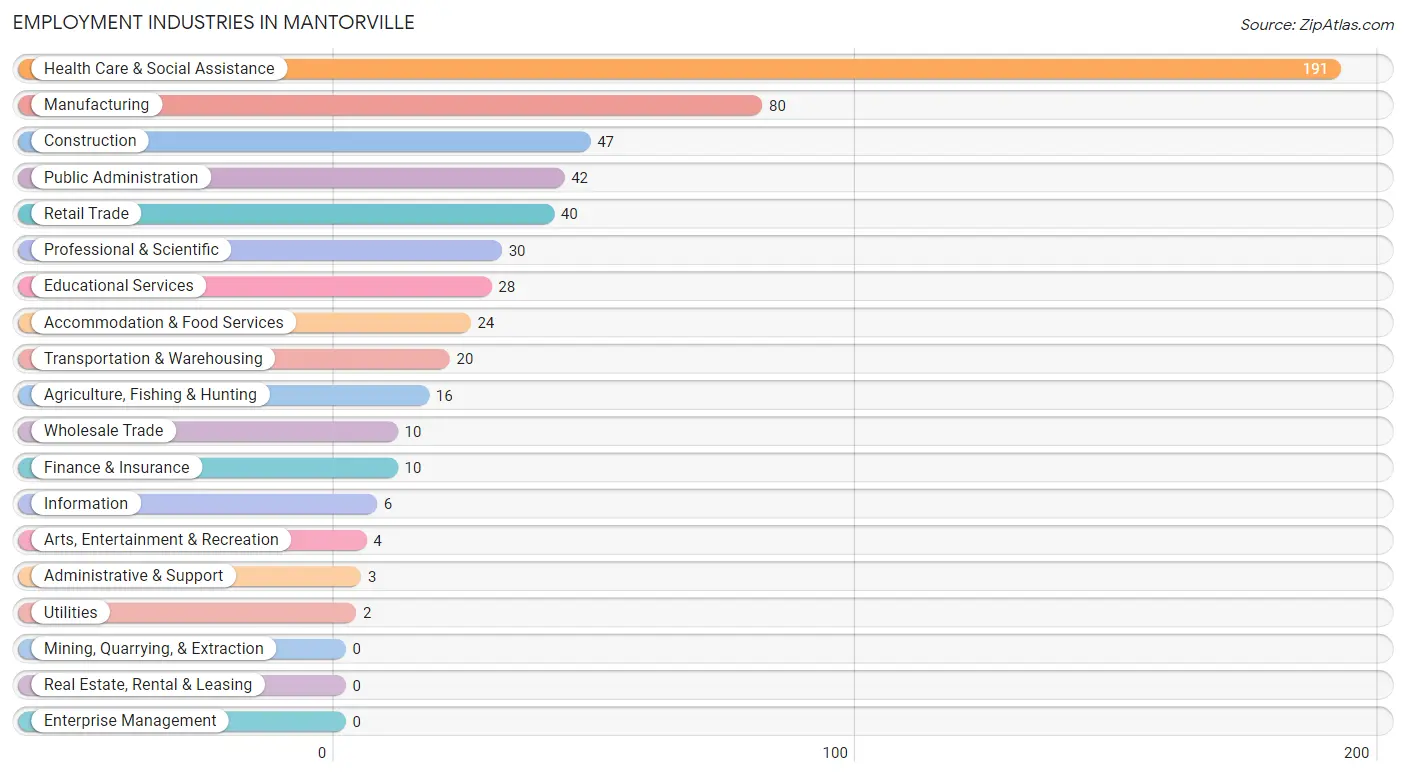
Employment Industries in Mantorville
The major employment industries in Mantorville include Health Care & Social Assistance (191 | 32.7%), Manufacturing (80 | 13.7%), Construction (47 | 8.0%), Public Administration (42 | 7.2%), and Retail Trade (40 | 6.8%).
Employment Industries by Sex in Mantorville
The Mantorville industries that see more men than women are Wholesale Trade (100.0%), Transportation & Warehousing (100.0%), and Utilities (100.0%), whereas the industries that tend to have a higher number of women are Administrative & Support (100.0%), Arts, Entertainment & Recreation (100.0%), and Health Care & Social Assistance (94.2%).
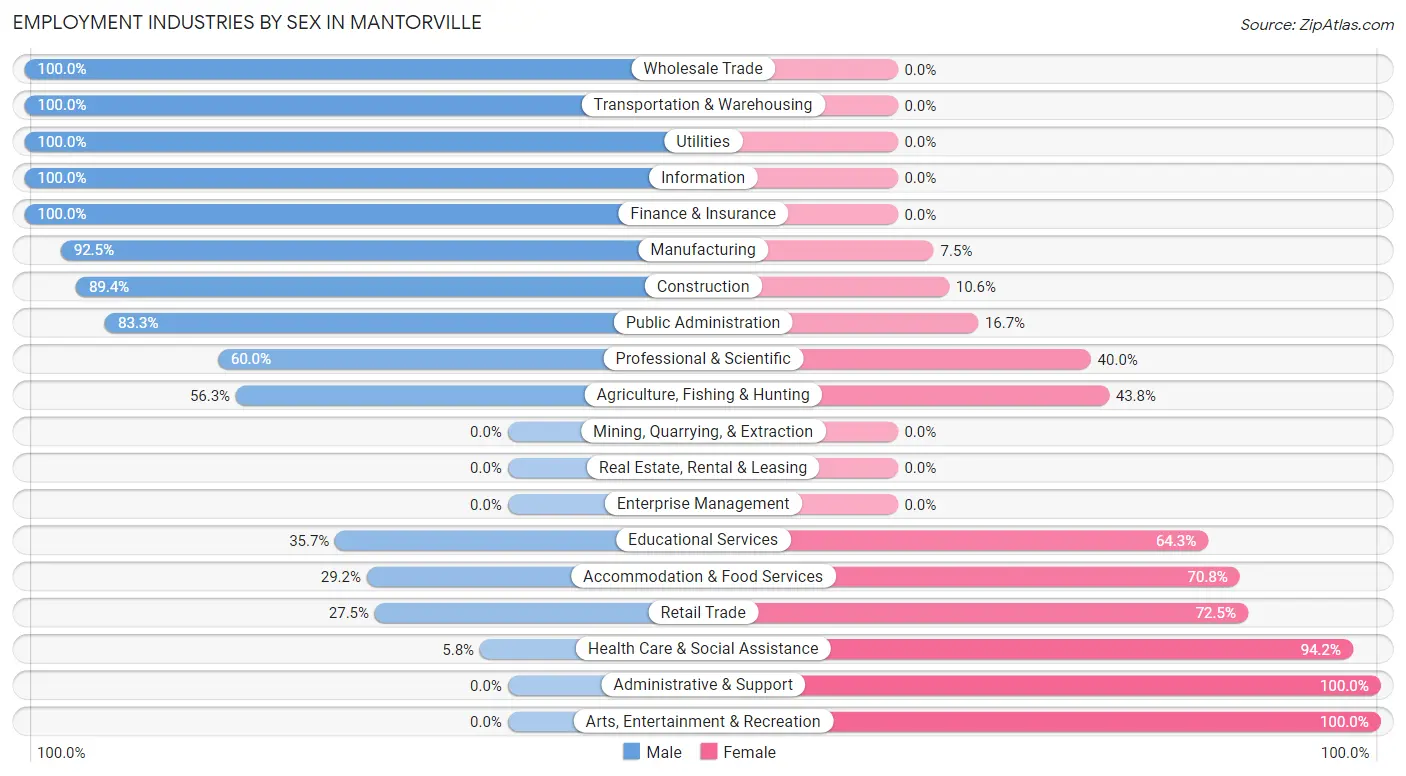
| Industry | Male | Female |
| Agriculture, Fishing & Hunting | 9 (56.2%) | 7 (43.8%) |
| Mining, Quarrying, & Extraction | 0 (0.0%) | 0 (0.0%) |
| Construction | 42 (89.4%) | 5 (10.6%) |
| Manufacturing | 74 (92.5%) | 6 (7.5%) |
| Wholesale Trade | 10 (100.0%) | 0 (0.0%) |
| Retail Trade | 11 (27.5%) | 29 (72.5%) |
| Transportation & Warehousing | 20 (100.0%) | 0 (0.0%) |
| Utilities | 2 (100.0%) | 0 (0.0%) |
| Information | 6 (100.0%) | 0 (0.0%) |
| Finance & Insurance | 10 (100.0%) | 0 (0.0%) |
| Real Estate, Rental & Leasing | 0 (0.0%) | 0 (0.0%) |
| Professional & Scientific | 18 (60.0%) | 12 (40.0%) |
| Enterprise Management | 0 (0.0%) | 0 (0.0%) |
| Administrative & Support | 0 (0.0%) | 3 (100.0%) |
| Educational Services | 10 (35.7%) | 18 (64.3%) |
| Health Care & Social Assistance | 11 (5.8%) | 180 (94.2%) |
| Arts, Entertainment & Recreation | 0 (0.0%) | 4 (100.0%) |
| Accommodation & Food Services | 7 (29.2%) | 17 (70.8%) |
| Public Administration | 35 (83.3%) | 7 (16.7%) |
| Total | 288 (49.2%) | 297 (50.8%) |
Education in Mantorville
School Enrollment in Mantorville
The most common levels of schooling among the 230 students in Mantorville are middle school (68 | 29.6%), elementary school (56 | 24.3%), and high school (54 | 23.5%).
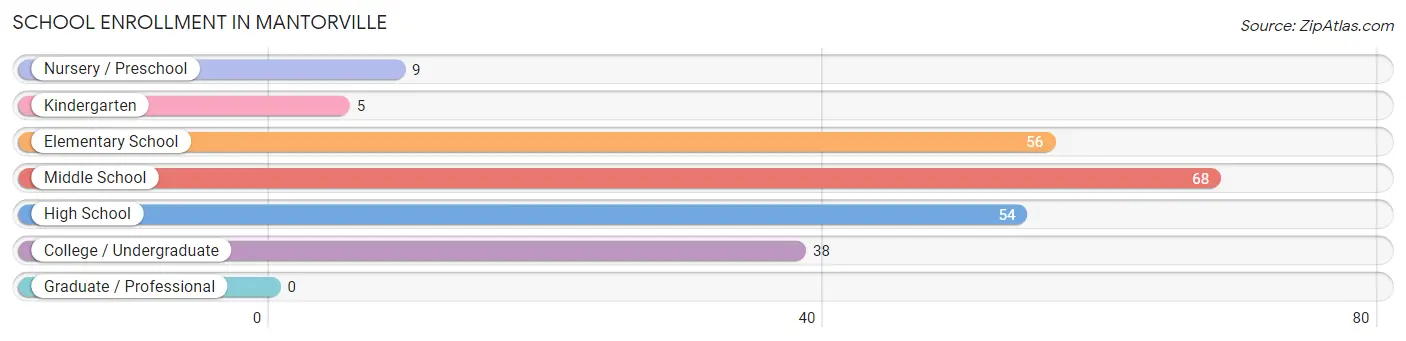
| School Level | # Students | % Students |
| Nursery / Preschool | 9 | 3.9% |
| Kindergarten | 5 | 2.2% |
| Elementary School | 56 | 24.3% |
| Middle School | 68 | 29.6% |
| High School | 54 | 23.5% |
| College / Undergraduate | 38 | 16.5% |
| Graduate / Professional | 0 | 0.0% |
| Total | 230 | 100.0% |
School Enrollment by Age by Funding Source in Mantorville
Out of a total of 230 students who are enrolled in schools in Mantorville, 9 (3.9%) attend a private institution, while the remaining 221 (96.1%) are enrolled in public schools. The age group of 25 to 34 year olds has the highest likelihood of being enrolled in private schools, with 3 (33.3% in the age bracket) enrolled. Conversely, the age group of 3 to 4 year olds has the lowest likelihood of being enrolled in a private school, with 5 (100.0% in the age bracket) attending a public institution.
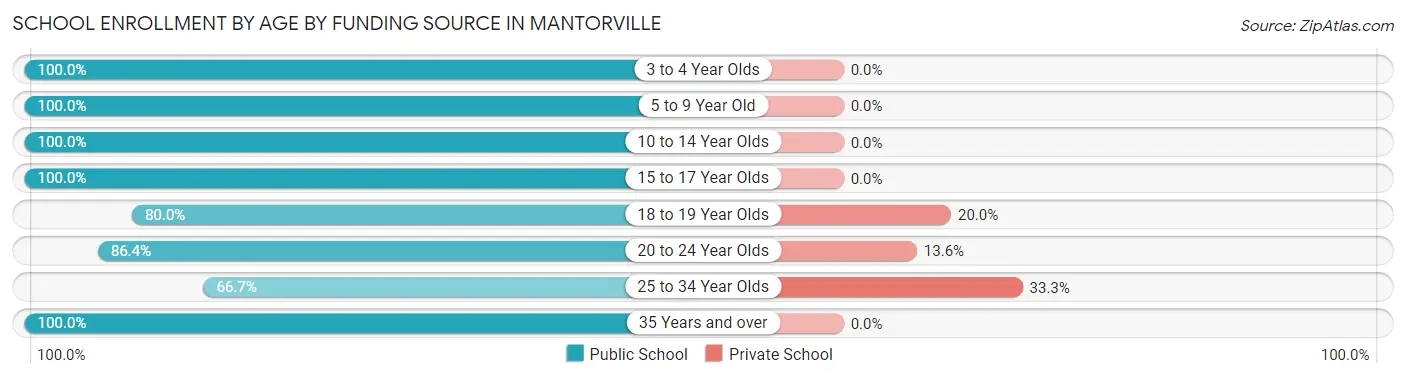
| Age Bracket | Public School | Private School |
| 3 to 4 Year Olds | 5 (100.0%) | 0 (0.0%) |
| 5 to 9 Year Old | 53 (100.0%) | 0 (0.0%) |
| 10 to 14 Year Olds | 84 (100.0%) | 0 (0.0%) |
| 15 to 17 Year Olds | 35 (100.0%) | 0 (0.0%) |
| 18 to 19 Year Olds | 12 (80.0%) | 3 (20.0%) |
| 20 to 24 Year Olds | 19 (86.4%) | 3 (13.6%) |
| 25 to 34 Year Olds | 6 (66.7%) | 3 (33.3%) |
| 35 Years and over | 7 (100.0%) | 0 (0.0%) |
| Total | 221 (96.1%) | 9 (3.9%) |
Educational Attainment by Field of Study in Mantorville
Business (44 | 15.9%), science & technology (36 | 13.0%), arts & humanities (36 | 13.0%), bio, nature & agricultural (28 | 10.1%), and education (25 | 9.1%) are the most common fields of study among 276 individuals in Mantorville who have obtained a bachelor's degree or higher.
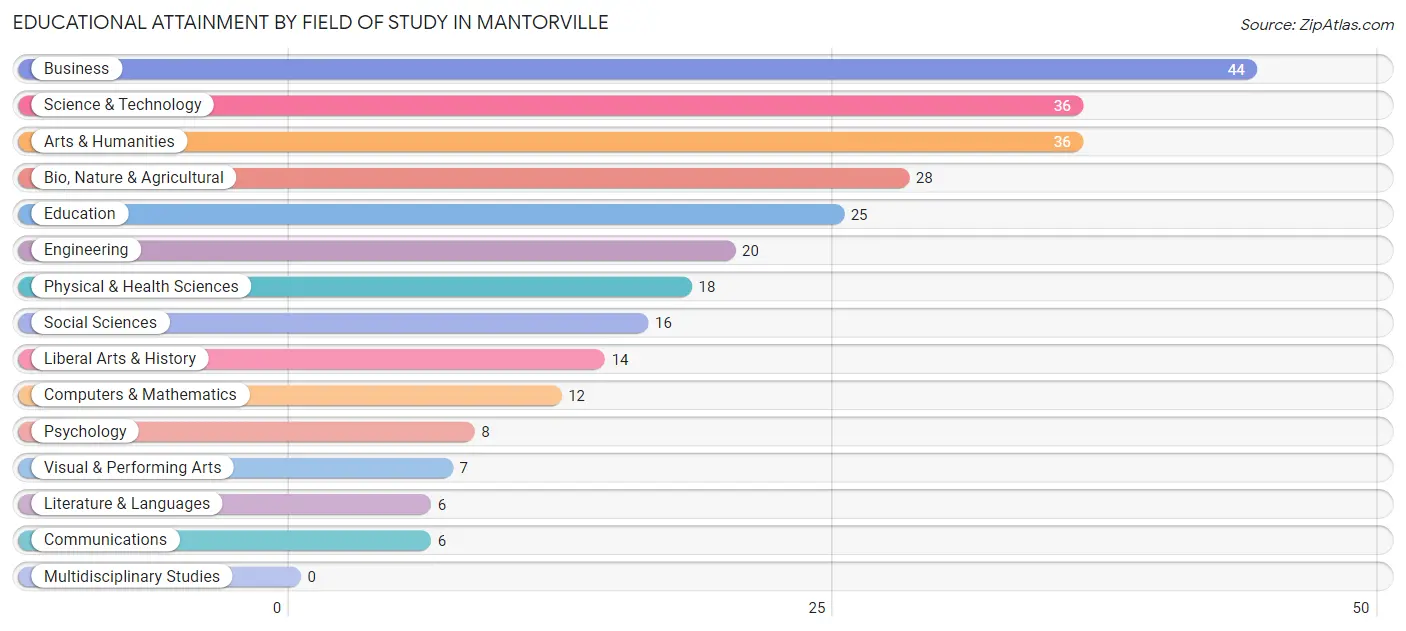
| Field of Study | # Graduates | % Graduates |
| Computers & Mathematics | 12 | 4.3% |
| Bio, Nature & Agricultural | 28 | 10.1% |
| Physical & Health Sciences | 18 | 6.5% |
| Psychology | 8 | 2.9% |
| Social Sciences | 16 | 5.8% |
| Engineering | 20 | 7.2% |
| Multidisciplinary Studies | 0 | 0.0% |
| Science & Technology | 36 | 13.0% |
| Business | 44 | 15.9% |
| Education | 25 | 9.1% |
| Literature & Languages | 6 | 2.2% |
| Liberal Arts & History | 14 | 5.1% |
| Visual & Performing Arts | 7 | 2.5% |
| Communications | 6 | 2.2% |
| Arts & Humanities | 36 | 13.0% |
| Total | 276 | 100.0% |
Transportation & Commute in Mantorville
Vehicle Availability by Sex in Mantorville
The most prevalent vehicle ownership categories in Mantorville are males with 2 vehicles (104, accounting for 36.7%) and females with 2 vehicles (85, making up 35.6%).
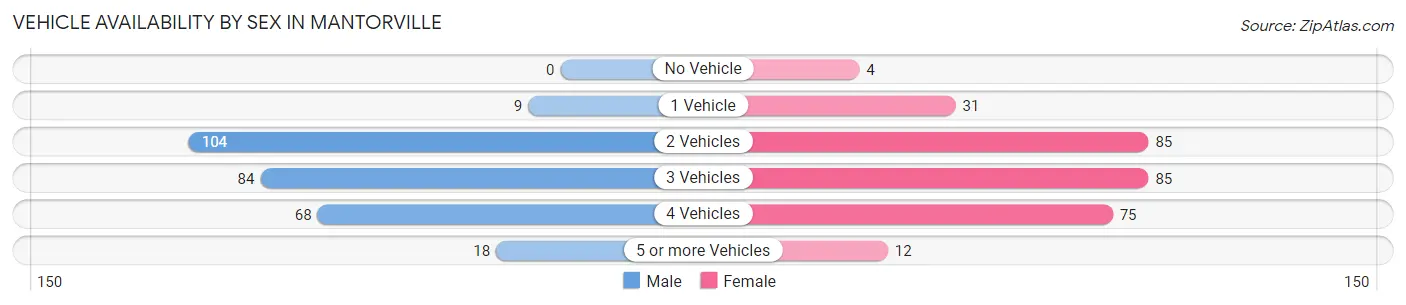
| Vehicles Available | Male | Female |
| No Vehicle | 0 (0.0%) | 4 (1.4%) |
| 1 Vehicle | 9 (3.2%) | 31 (10.6%) |
| 2 Vehicles | 104 (36.7%) | 85 (29.1%) |
| 3 Vehicles | 84 (29.7%) | 85 (29.1%) |
| 4 Vehicles | 68 (24.0%) | 75 (25.7%) |
| 5 or more Vehicles | 18 (6.4%) | 12 (4.1%) |
| Total | 283 (100.0%) | 292 (100.0%) |
Commute Time in Mantorville
The most frequently occuring commute durations in Mantorville are 25 to 29 minutes (101 commuters, 19.9%), 30 to 34 minutes (90 commuters, 17.7%), and 10 to 14 minutes (85 commuters, 16.7%).
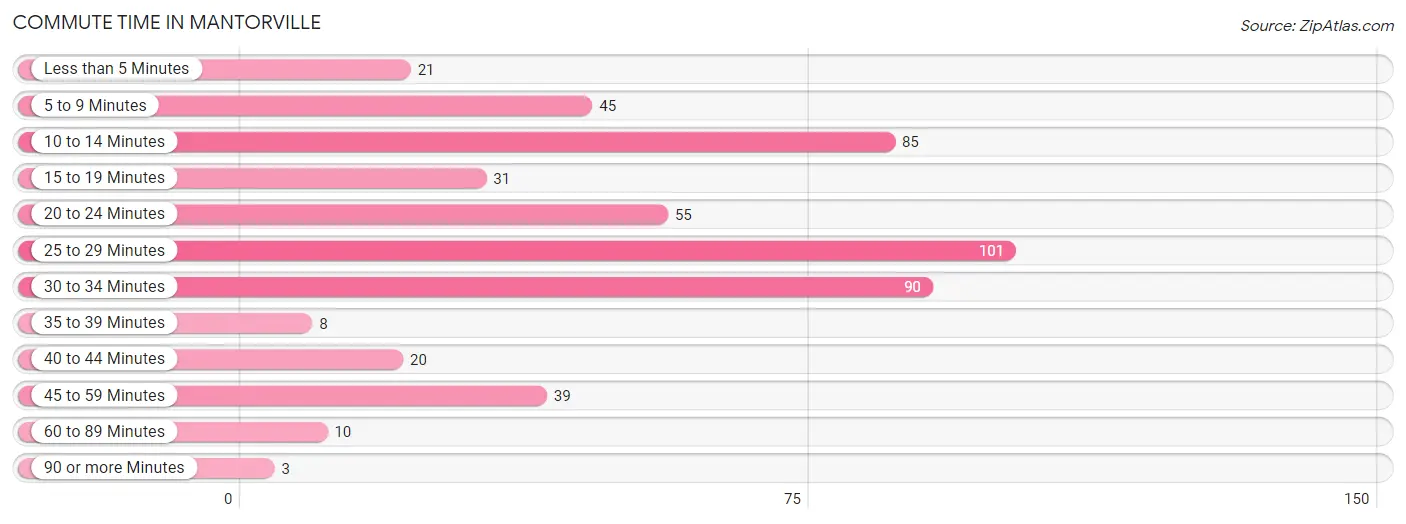
| Commute Time | # Commuters | % Commuters |
| Less than 5 Minutes | 21 | 4.1% |
| 5 to 9 Minutes | 45 | 8.9% |
| 10 to 14 Minutes | 85 | 16.7% |
| 15 to 19 Minutes | 31 | 6.1% |
| 20 to 24 Minutes | 55 | 10.8% |
| 25 to 29 Minutes | 101 | 19.9% |
| 30 to 34 Minutes | 90 | 17.7% |
| 35 to 39 Minutes | 8 | 1.6% |
| 40 to 44 Minutes | 20 | 3.9% |
| 45 to 59 Minutes | 39 | 7.7% |
| 60 to 89 Minutes | 10 | 2.0% |
| 90 or more Minutes | 3 | 0.6% |
Commute Time by Sex in Mantorville
The most common commute times in Mantorville are 10 to 14 minutes (61 commuters, 22.9%) for males and 25 to 29 minutes (74 commuters, 30.6%) for females.
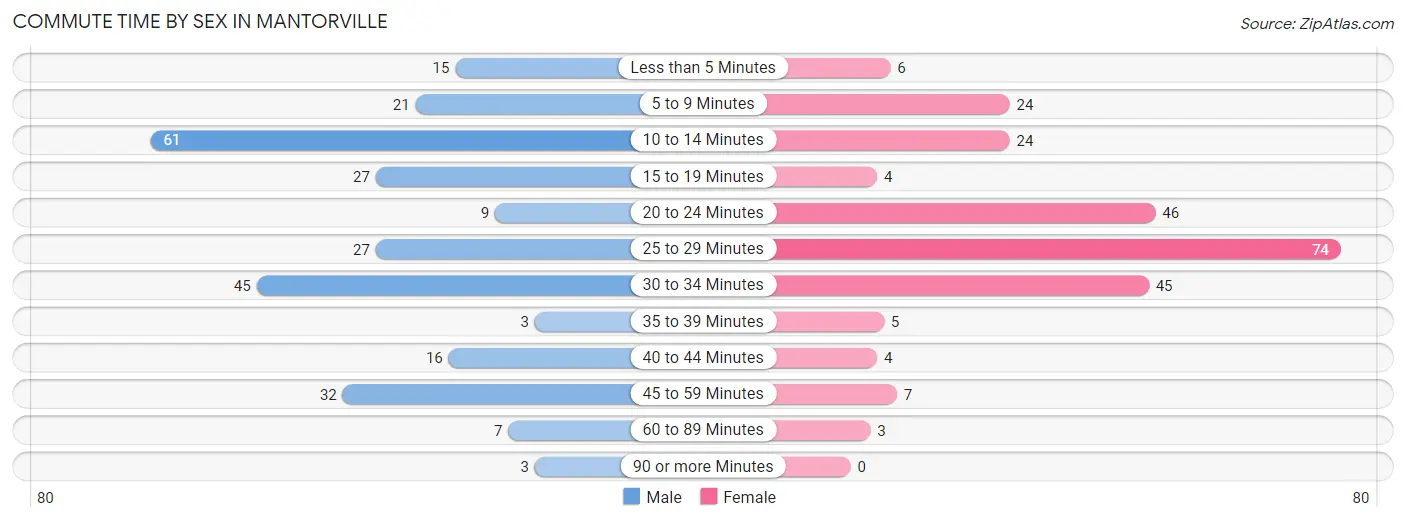
| Commute Time | Male | Female |
| Less than 5 Minutes | 15 (5.6%) | 6 (2.5%) |
| 5 to 9 Minutes | 21 (7.9%) | 24 (9.9%) |
| 10 to 14 Minutes | 61 (22.9%) | 24 (9.9%) |
| 15 to 19 Minutes | 27 (10.2%) | 4 (1.7%) |
| 20 to 24 Minutes | 9 (3.4%) | 46 (19.0%) |
| 25 to 29 Minutes | 27 (10.2%) | 74 (30.6%) |
| 30 to 34 Minutes | 45 (16.9%) | 45 (18.6%) |
| 35 to 39 Minutes | 3 (1.1%) | 5 (2.1%) |
| 40 to 44 Minutes | 16 (6.0%) | 4 (1.7%) |
| 45 to 59 Minutes | 32 (12.0%) | 7 (2.9%) |
| 60 to 89 Minutes | 7 (2.6%) | 3 (1.2%) |
| 90 or more Minutes | 3 (1.1%) | 0 (0.0%) |
Time of Departure to Work by Sex in Mantorville
The most frequent times of departure to work in Mantorville are 6:00 AM to 6:29 AM (58, 21.8%) for males and 7:00 AM to 7:29 AM (67, 27.7%) for females.
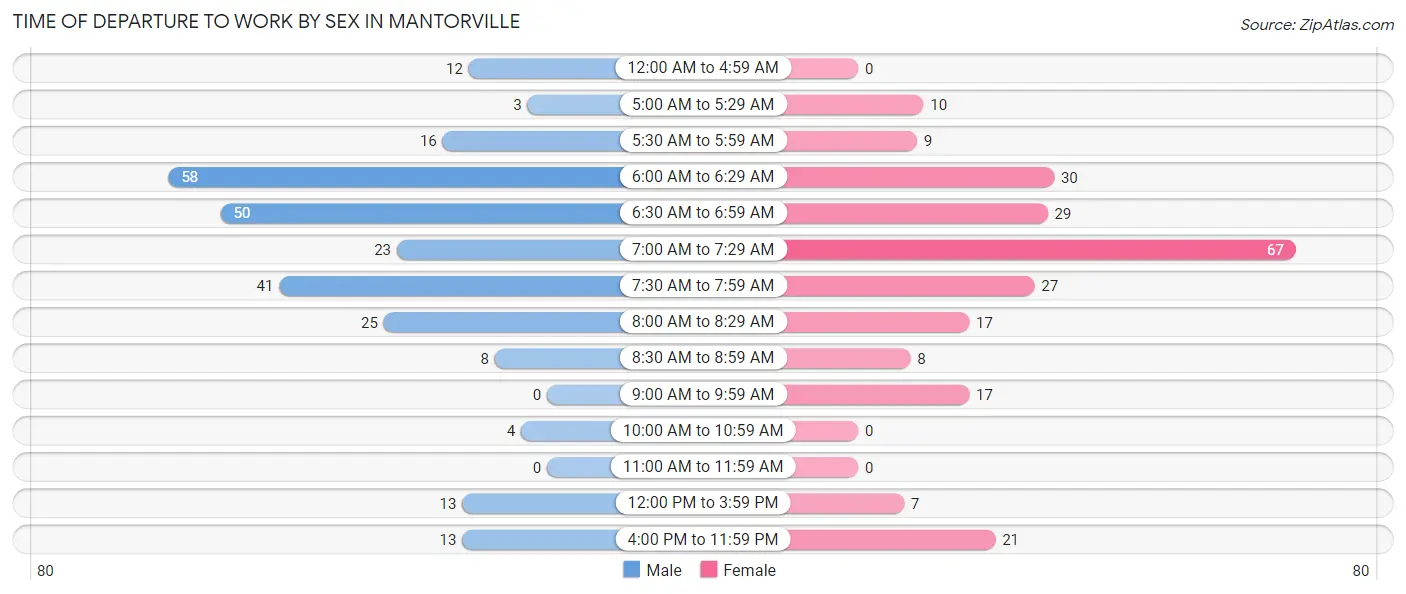
| Time of Departure | Male | Female |
| 12:00 AM to 4:59 AM | 12 (4.5%) | 0 (0.0%) |
| 5:00 AM to 5:29 AM | 3 (1.1%) | 10 (4.1%) |
| 5:30 AM to 5:59 AM | 16 (6.0%) | 9 (3.7%) |
| 6:00 AM to 6:29 AM | 58 (21.8%) | 30 (12.4%) |
| 6:30 AM to 6:59 AM | 50 (18.8%) | 29 (12.0%) |
| 7:00 AM to 7:29 AM | 23 (8.6%) | 67 (27.7%) |
| 7:30 AM to 7:59 AM | 41 (15.4%) | 27 (11.2%) |
| 8:00 AM to 8:29 AM | 25 (9.4%) | 17 (7.0%) |
| 8:30 AM to 8:59 AM | 8 (3.0%) | 8 (3.3%) |
| 9:00 AM to 9:59 AM | 0 (0.0%) | 17 (7.0%) |
| 10:00 AM to 10:59 AM | 4 (1.5%) | 0 (0.0%) |
| 11:00 AM to 11:59 AM | 0 (0.0%) | 0 (0.0%) |
| 12:00 PM to 3:59 PM | 13 (4.9%) | 7 (2.9%) |
| 4:00 PM to 11:59 PM | 13 (4.9%) | 21 (8.7%) |
| Total | 266 (100.0%) | 242 (100.0%) |
Housing Occupancy in Mantorville
Occupancy by Ownership in Mantorville
Of the total 379 dwellings in Mantorville, owner-occupied units account for 348 (91.8%), while renter-occupied units make up 31 (8.2%).
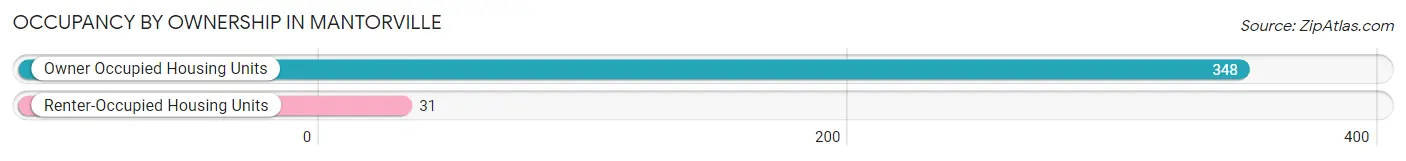
| Occupancy | # Housing Units | % Housing Units |
| Owner Occupied Housing Units | 348 | 91.8% |
| Renter-Occupied Housing Units | 31 | 8.2% |
| Total Occupied Housing Units | 379 | 100.0% |
Occupancy by Household Size in Mantorville
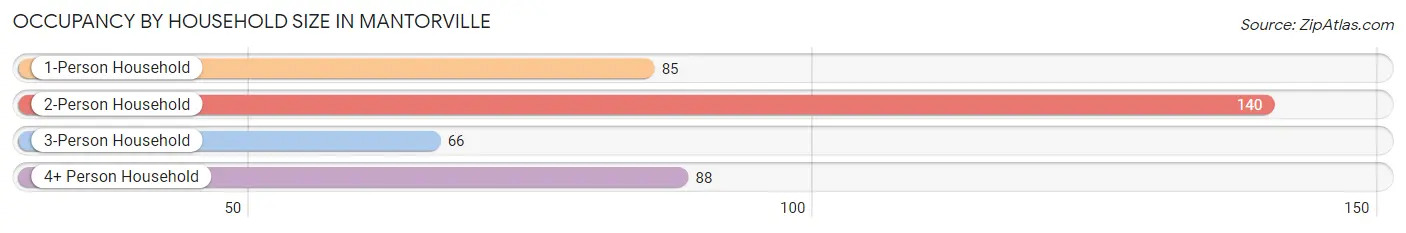
| Household Size | # Housing Units | % Housing Units |
| 1-Person Household | 85 | 22.4% |
| 2-Person Household | 140 | 36.9% |
| 3-Person Household | 66 | 17.4% |
| 4+ Person Household | 88 | 23.2% |
| Total Housing Units | 379 | 100.0% |
Occupancy by Ownership by Household Size in Mantorville
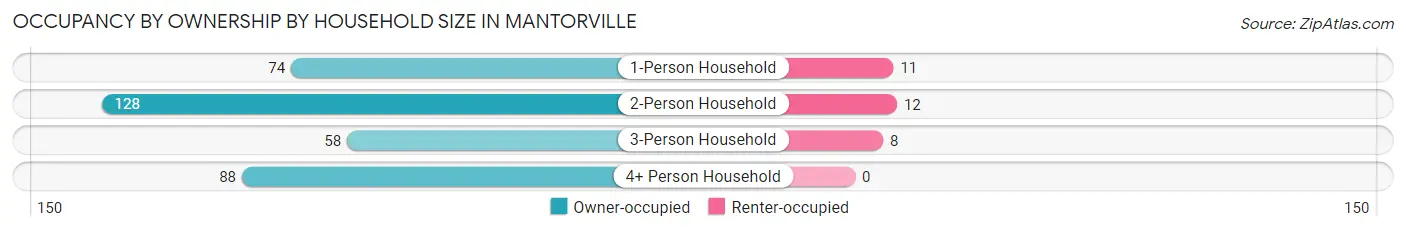
| Household Size | Owner-occupied | Renter-occupied |
| 1-Person Household | 74 (87.1%) | 11 (12.9%) |
| 2-Person Household | 128 (91.4%) | 12 (8.6%) |
| 3-Person Household | 58 (87.9%) | 8 (12.1%) |
| 4+ Person Household | 88 (100.0%) | 0 (0.0%) |
| Total Housing Units | 348 (91.8%) | 31 (8.2%) |
Occupancy by Educational Attainment in Mantorville
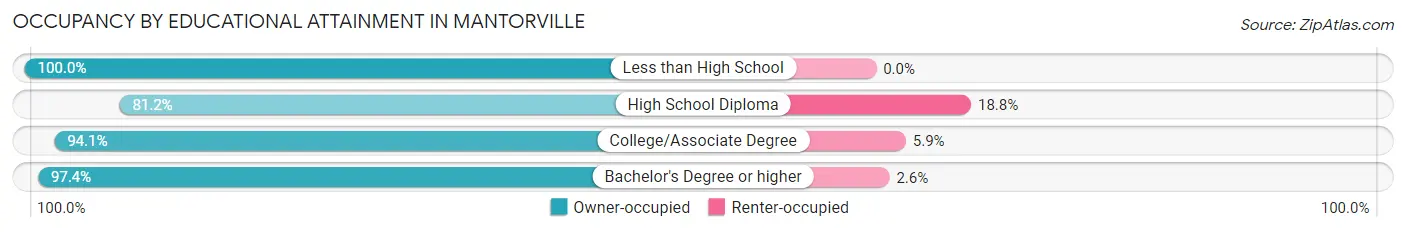
| Household Size | Owner-occupied | Renter-occupied |
| Less than High School | 11 (100.0%) | 0 (0.0%) |
| High School Diploma | 82 (81.2%) | 19 (18.8%) |
| College/Associate Degree | 144 (94.1%) | 9 (5.9%) |
| Bachelor's Degree or higher | 111 (97.4%) | 3 (2.6%) |
Occupancy by Age of Householder in Mantorville
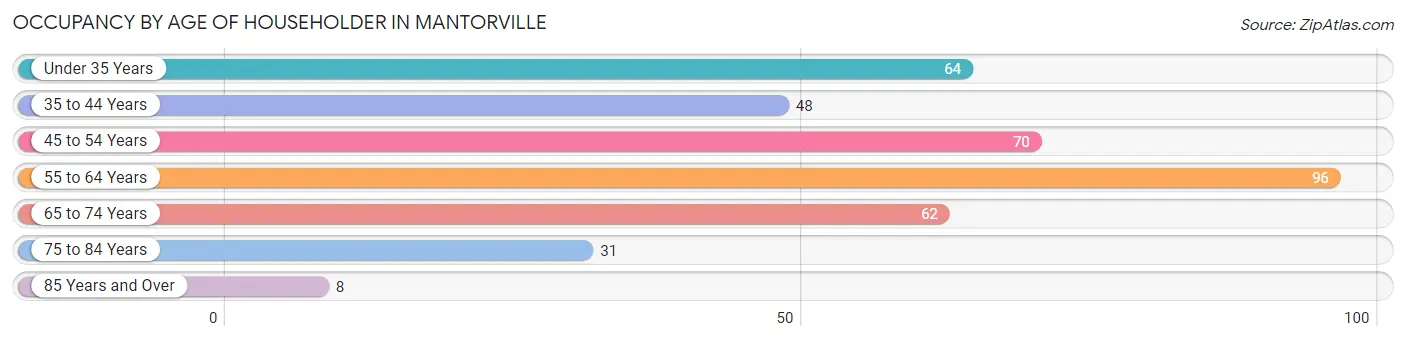
| Age Bracket | # Households | % Households |
| Under 35 Years | 64 | 16.9% |
| 35 to 44 Years | 48 | 12.7% |
| 45 to 54 Years | 70 | 18.5% |
| 55 to 64 Years | 96 | 25.3% |
| 65 to 74 Years | 62 | 16.4% |
| 75 to 84 Years | 31 | 8.2% |
| 85 Years and Over | 8 | 2.1% |
| Total | 379 | 100.0% |
Housing Finances in Mantorville
Median Income by Occupancy in Mantorville
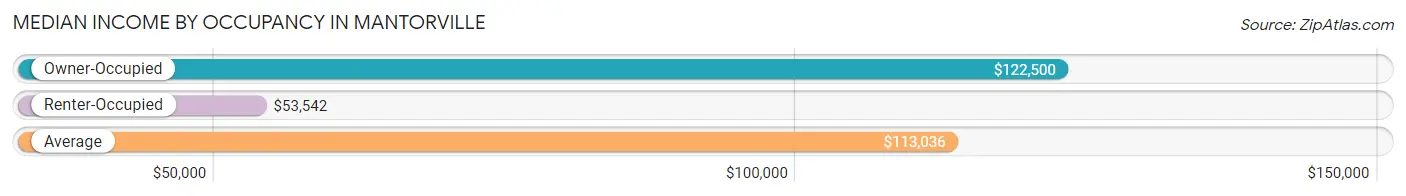
| Occupancy Type | # Households | Median Income |
| Owner-Occupied | 348 (91.8%) | $122,500 |
| Renter-Occupied | 31 (8.2%) | $53,542 |
| Average | 379 (100.0%) | $113,036 |
Occupancy by Householder Income Bracket in Mantorville
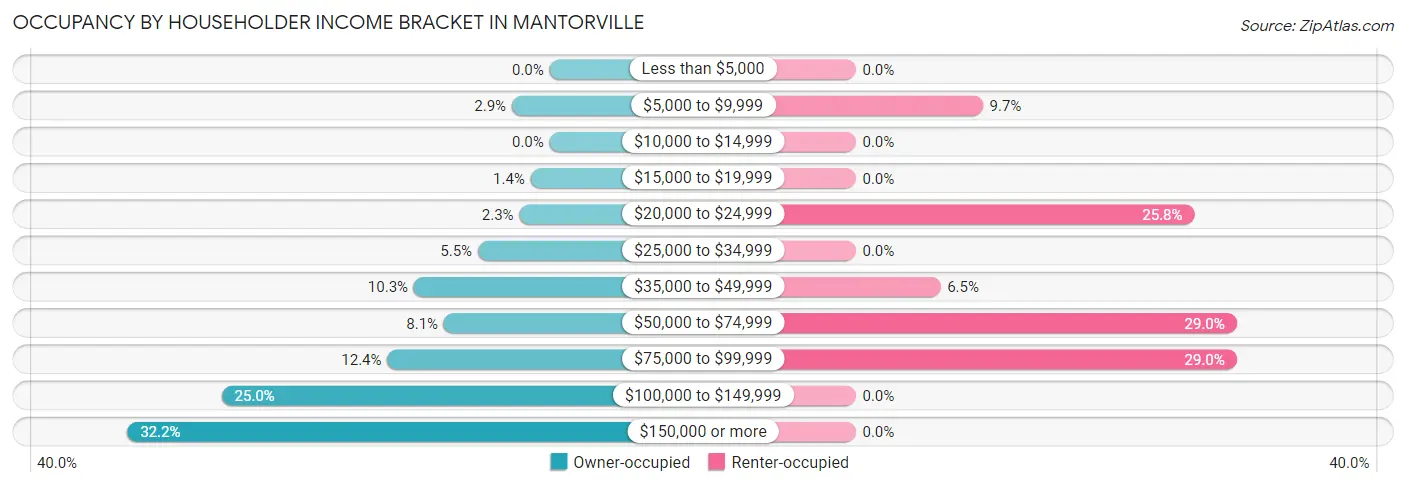
| Income Bracket | Owner-occupied | Renter-occupied |
| Less than $5,000 | 0 (0.0%) | 0 (0.0%) |
| $5,000 to $9,999 | 10 (2.9%) | 3 (9.7%) |
| $10,000 to $14,999 | 0 (0.0%) | 0 (0.0%) |
| $15,000 to $19,999 | 5 (1.4%) | 0 (0.0%) |
| $20,000 to $24,999 | 8 (2.3%) | 8 (25.8%) |
| $25,000 to $34,999 | 19 (5.5%) | 0 (0.0%) |
| $35,000 to $49,999 | 36 (10.3%) | 2 (6.5%) |
| $50,000 to $74,999 | 28 (8.1%) | 9 (29.0%) |
| $75,000 to $99,999 | 43 (12.4%) | 9 (29.0%) |
| $100,000 to $149,999 | 87 (25.0%) | 0 (0.0%) |
| $150,000 or more | 112 (32.2%) | 0 (0.0%) |
| Total | 348 (100.0%) | 31 (100.0%) |
Monthly Housing Cost Tiers in Mantorville
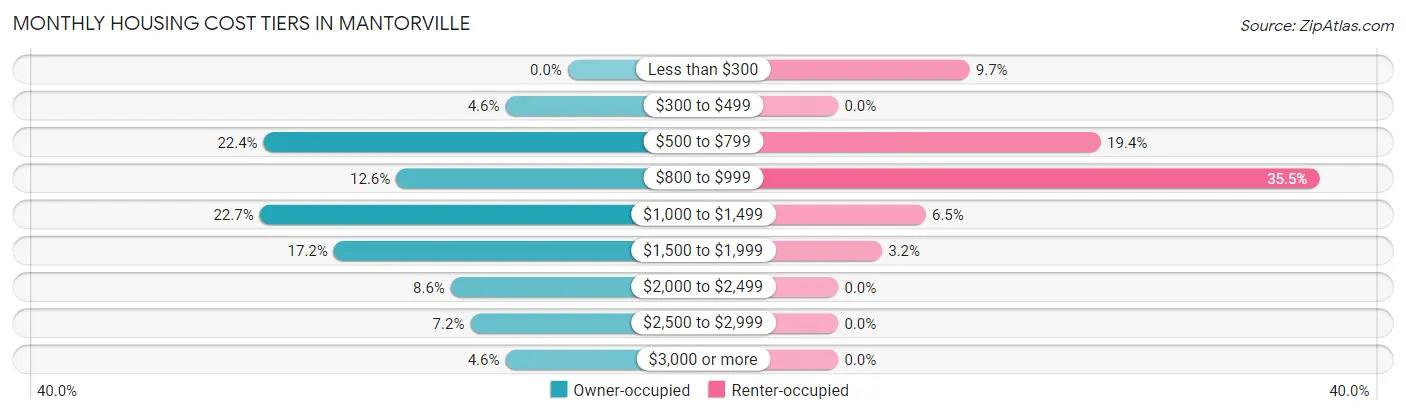
| Monthly Cost | Owner-occupied | Renter-occupied |
| Less than $300 | 0 (0.0%) | 3 (9.7%) |
| $300 to $499 | 16 (4.6%) | 0 (0.0%) |
| $500 to $799 | 78 (22.4%) | 6 (19.4%) |
| $800 to $999 | 44 (12.6%) | 11 (35.5%) |
| $1,000 to $1,499 | 79 (22.7%) | 2 (6.5%) |
| $1,500 to $1,999 | 60 (17.2%) | 1 (3.2%) |
| $2,000 to $2,499 | 30 (8.6%) | 0 (0.0%) |
| $2,500 to $2,999 | 25 (7.2%) | 0 (0.0%) |
| $3,000 or more | 16 (4.6%) | 0 (0.0%) |
| Total | 348 (100.0%) | 31 (100.0%) |
Physical Housing Characteristics in Mantorville
Housing Structures in Mantorville
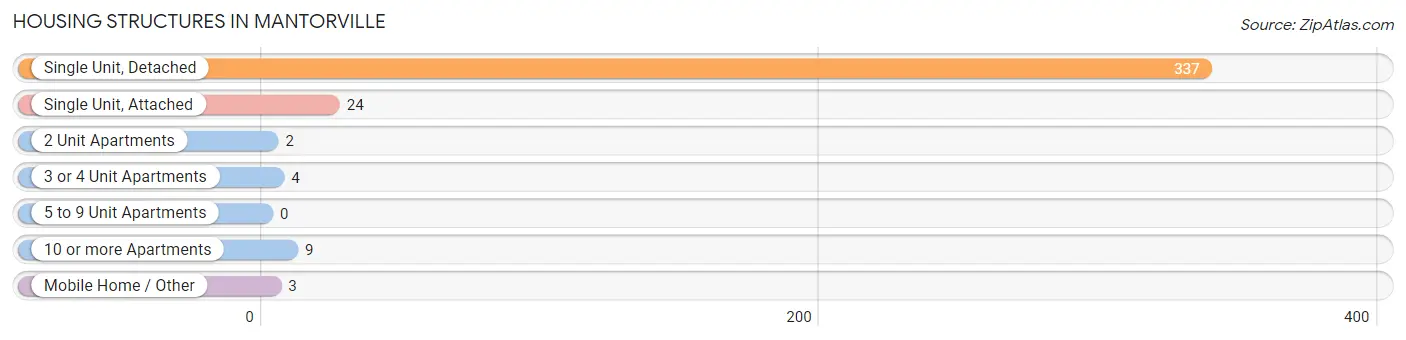
| Structure Type | # Housing Units | % Housing Units |
| Single Unit, Detached | 337 | 88.9% |
| Single Unit, Attached | 24 | 6.3% |
| 2 Unit Apartments | 2 | 0.5% |
| 3 or 4 Unit Apartments | 4 | 1.1% |
| 5 to 9 Unit Apartments | 0 | 0.0% |
| 10 or more Apartments | 9 | 2.4% |
| Mobile Home / Other | 3 | 0.8% |
| Total | 379 | 100.0% |
Housing Structures by Occupancy in Mantorville
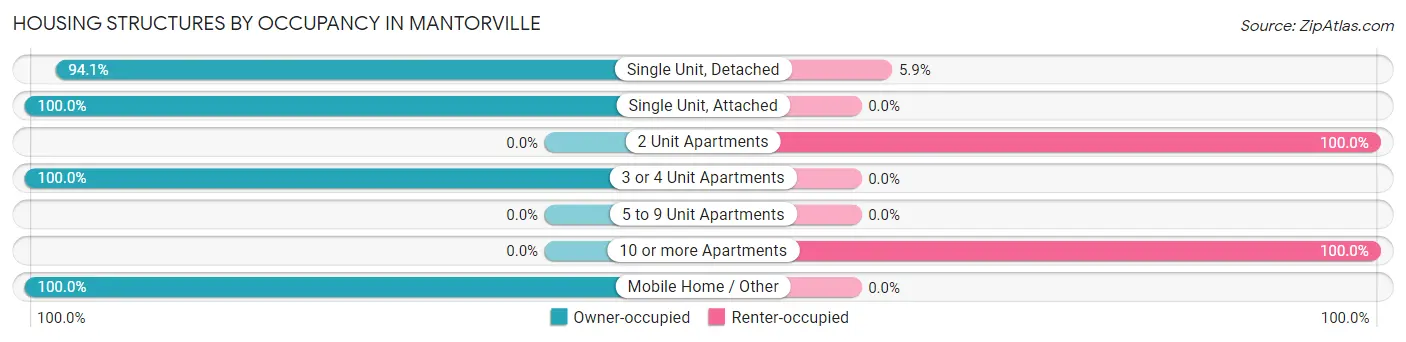
| Structure Type | Owner-occupied | Renter-occupied |
| Single Unit, Detached | 317 (94.1%) | 20 (5.9%) |
| Single Unit, Attached | 24 (100.0%) | 0 (0.0%) |
| 2 Unit Apartments | 0 (0.0%) | 2 (100.0%) |
| 3 or 4 Unit Apartments | 4 (100.0%) | 0 (0.0%) |
| 5 to 9 Unit Apartments | 0 (0.0%) | 0 (0.0%) |
| 10 or more Apartments | 0 (0.0%) | 9 (100.0%) |
| Mobile Home / Other | 3 (100.0%) | 0 (0.0%) |
| Total | 348 (91.8%) | 31 (8.2%) |
Housing Structures by Number of Rooms in Mantorville
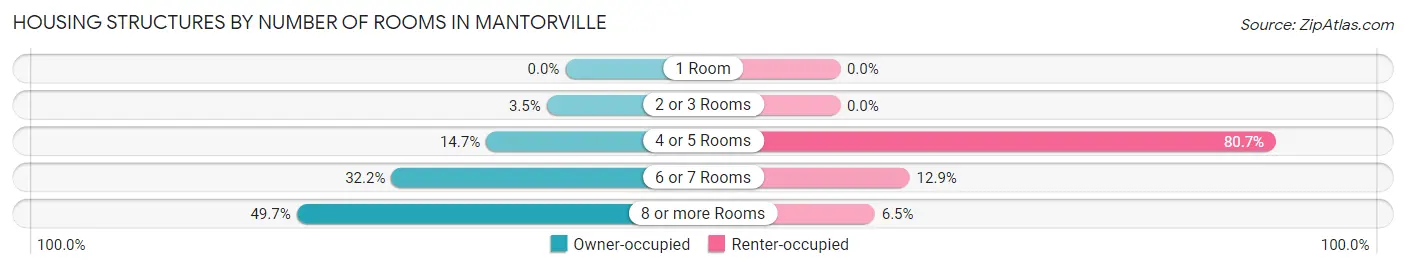
| Number of Rooms | Owner-occupied | Renter-occupied |
| 1 Room | 0 (0.0%) | 0 (0.0%) |
| 2 or 3 Rooms | 12 (3.5%) | 0 (0.0%) |
| 4 or 5 Rooms | 51 (14.7%) | 25 (80.6%) |
| 6 or 7 Rooms | 112 (32.2%) | 4 (12.9%) |
| 8 or more Rooms | 173 (49.7%) | 2 (6.5%) |
| Total | 348 (100.0%) | 31 (100.0%) |
Housing Structure by Heating Type in Mantorville
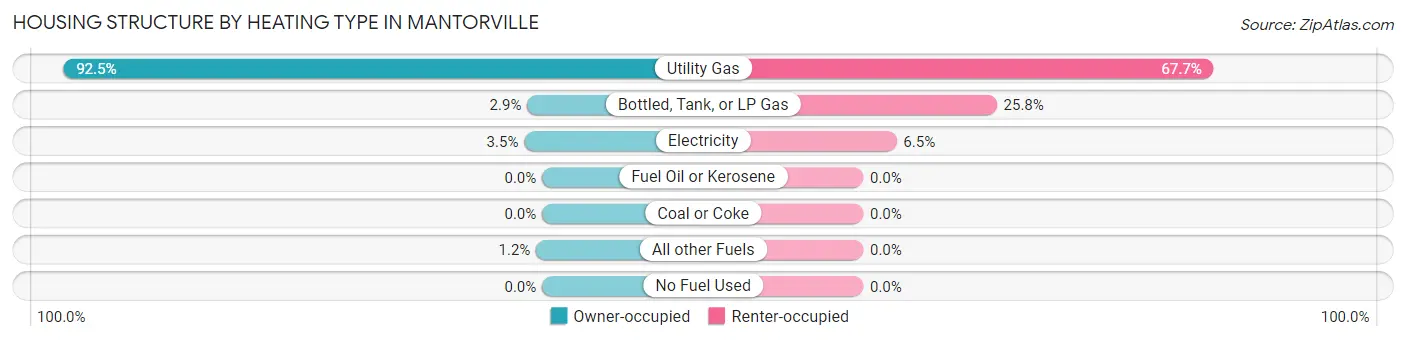
| Heating Type | Owner-occupied | Renter-occupied |
| Utility Gas | 322 (92.5%) | 21 (67.7%) |
| Bottled, Tank, or LP Gas | 10 (2.9%) | 8 (25.8%) |
| Electricity | 12 (3.5%) | 2 (6.5%) |
| Fuel Oil or Kerosene | 0 (0.0%) | 0 (0.0%) |
| Coal or Coke | 0 (0.0%) | 0 (0.0%) |
| All other Fuels | 4 (1.1%) | 0 (0.0%) |
| No Fuel Used | 0 (0.0%) | 0 (0.0%) |
| Total | 348 (100.0%) | 31 (100.0%) |
Household Vehicle Usage in Mantorville
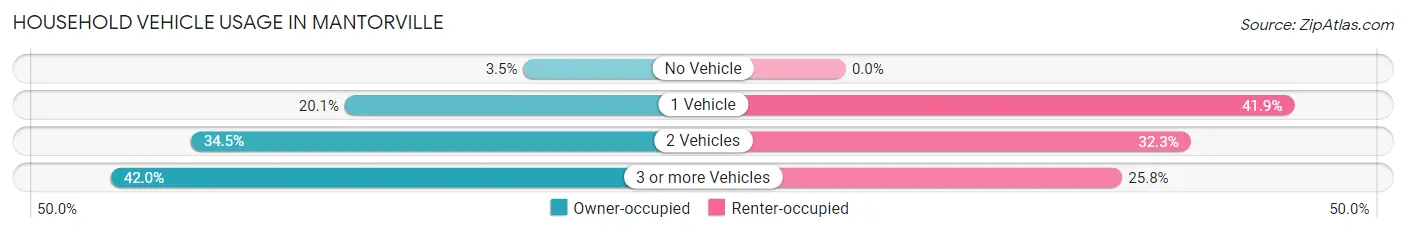
| Vehicles per Household | Owner-occupied | Renter-occupied |
| No Vehicle | 12 (3.5%) | 0 (0.0%) |
| 1 Vehicle | 70 (20.1%) | 13 (41.9%) |
| 2 Vehicles | 120 (34.5%) | 10 (32.3%) |
| 3 or more Vehicles | 146 (41.9%) | 8 (25.8%) |
| Total | 348 (100.0%) | 31 (100.0%) |
Real Estate & Mortgages in Mantorville
Real Estate and Mortgage Overview in Mantorville
| Characteristic | Without Mortgage | With Mortgage |
| Housing Units | 108 | 240 |
| Median Property Value | $230,000 | $273,700 |
| Median Household Income | $70,000 | $91 |
| Monthly Housing Costs | $674 | $16 |
| Real Estate Taxes | $3,000 | $3 |
Property Value by Mortgage Status in Mantorville
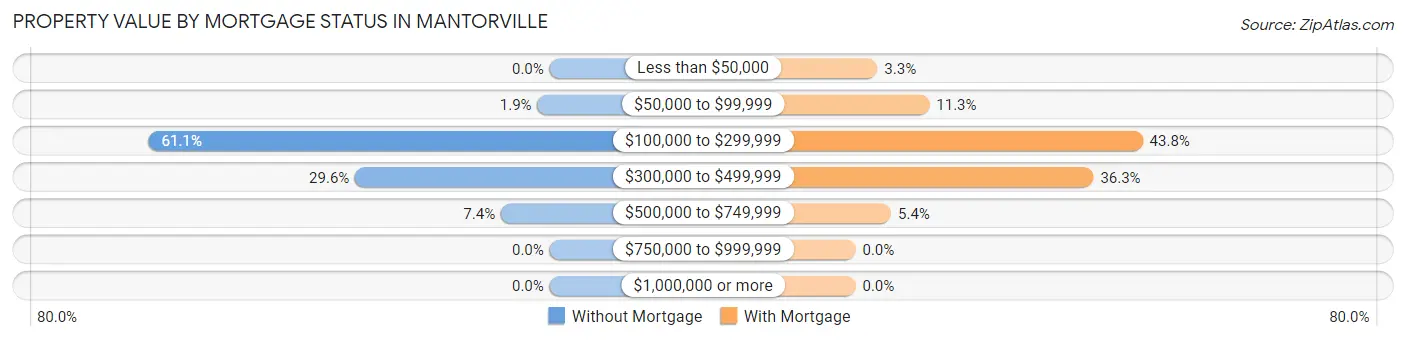
| Property Value | Without Mortgage | With Mortgage |
| Less than $50,000 | 0 (0.0%) | 8 (3.3%) |
| $50,000 to $99,999 | 2 (1.8%) | 27 (11.3%) |
| $100,000 to $299,999 | 66 (61.1%) | 105 (43.8%) |
| $300,000 to $499,999 | 32 (29.6%) | 87 (36.2%) |
| $500,000 to $749,999 | 8 (7.4%) | 13 (5.4%) |
| $750,000 to $999,999 | 0 (0.0%) | 0 (0.0%) |
| $1,000,000 or more | 0 (0.0%) | 0 (0.0%) |
| Total | 108 (100.0%) | 240 (100.0%) |
Household Income by Mortgage Status in Mantorville
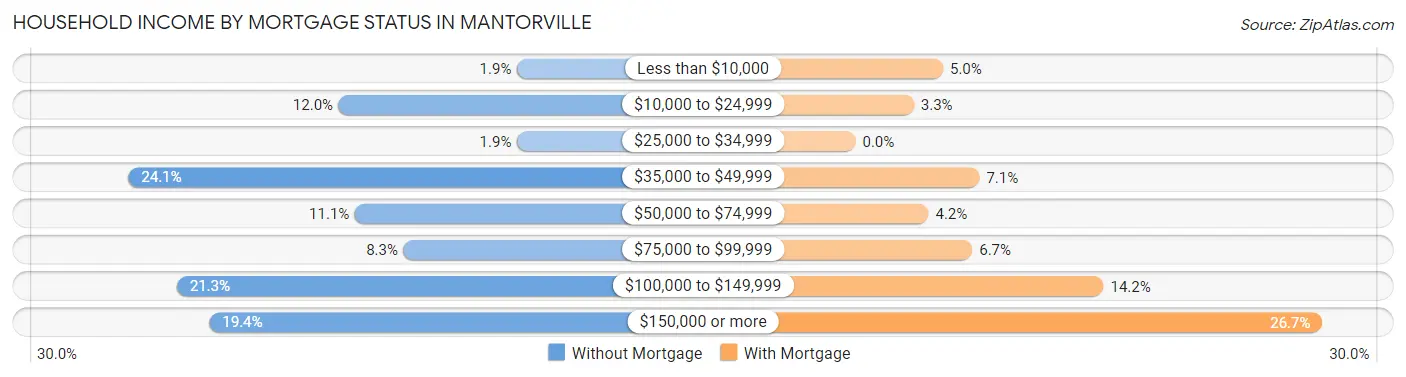
| Household Income | Without Mortgage | With Mortgage |
| Less than $10,000 | 2 (1.8%) | 12 (5.0%) |
| $10,000 to $24,999 | 13 (12.0%) | 8 (3.3%) |
| $25,000 to $34,999 | 2 (1.8%) | 0 (0.0%) |
| $35,000 to $49,999 | 26 (24.1%) | 17 (7.1%) |
| $50,000 to $74,999 | 12 (11.1%) | 10 (4.2%) |
| $75,000 to $99,999 | 9 (8.3%) | 16 (6.7%) |
| $100,000 to $149,999 | 23 (21.3%) | 34 (14.2%) |
| $150,000 or more | 21 (19.4%) | 64 (26.7%) |
| Total | 108 (100.0%) | 240 (100.0%) |
Property Value to Household Income Ratio in Mantorville
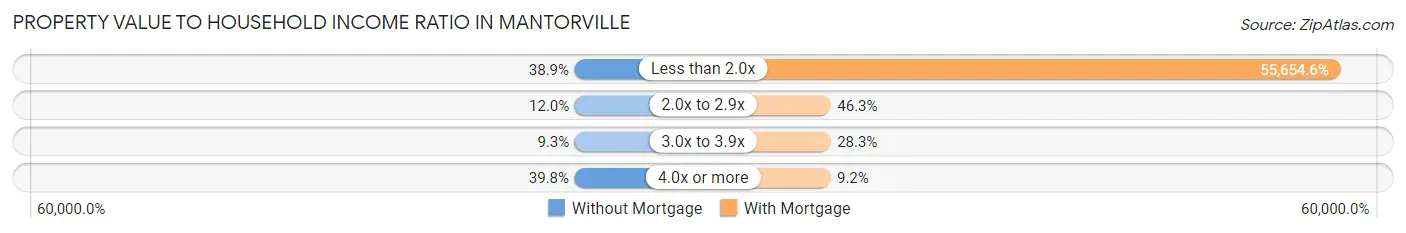
| Value-to-Income Ratio | Without Mortgage | With Mortgage |
| Less than 2.0x | 42 (38.9%) | 133,571 (55,654.6%) |
| 2.0x to 2.9x | 13 (12.0%) | 111 (46.3%) |
| 3.0x to 3.9x | 10 (9.3%) | 68 (28.3%) |
| 4.0x or more | 43 (39.8%) | 22 (9.2%) |
| Total | 108 (100.0%) | 240 (100.0%) |
Real Estate Taxes by Mortgage Status in Mantorville

| Property Taxes | Without Mortgage | With Mortgage |
| Less than $800 | 0 (0.0%) | 0 (0.0%) |
| $800 to $1,499 | 4 (3.7%) | 18 (7.5%) |
| $800 to $1,499 | 104 (96.3%) | 19 (7.9%) |
| Total | 108 (100.0%) | 240 (100.0%) |
Health & Disability in Mantorville
Health Insurance Coverage by Age in Mantorville
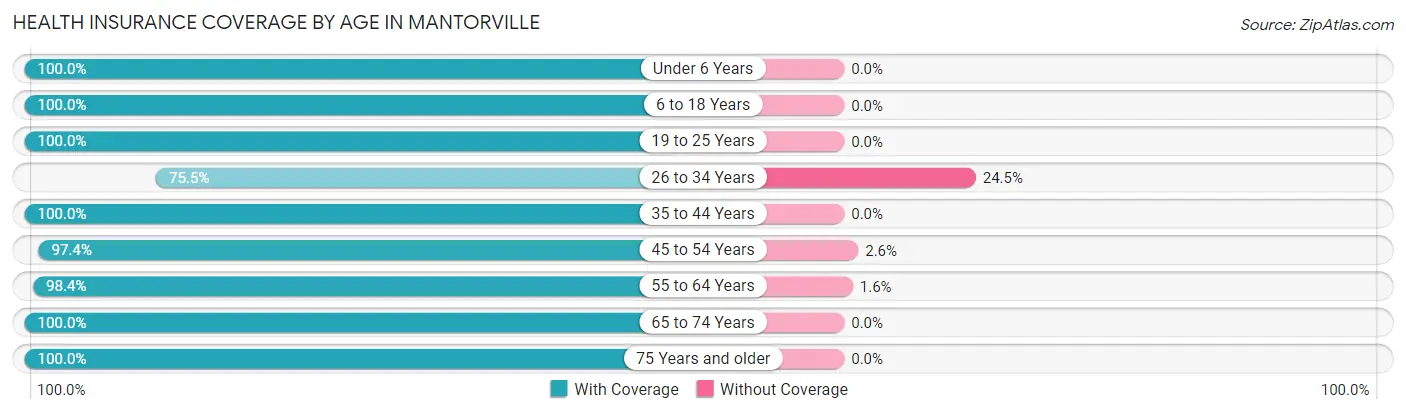
| Age Bracket | With Coverage | Without Coverage |
| Under 6 Years | 39 (100.0%) | 0 (0.0%) |
| 6 to 18 Years | 185 (100.0%) | 0 (0.0%) |
| 19 to 25 Years | 111 (100.0%) | 0 (0.0%) |
| 26 to 34 Years | 80 (75.5%) | 26 (24.5%) |
| 35 to 44 Years | 99 (100.0%) | 0 (0.0%) |
| 45 to 54 Years | 112 (97.4%) | 3 (2.6%) |
| 55 to 64 Years | 186 (98.4%) | 3 (1.6%) |
| 65 to 74 Years | 101 (100.0%) | 0 (0.0%) |
| 75 Years and older | 52 (100.0%) | 0 (0.0%) |
| Total | 965 (96.8%) | 32 (3.2%) |
Health Insurance Coverage by Citizenship Status in Mantorville

| Citizenship Status | With Coverage | Without Coverage |
| Native Born | 39 (100.0%) | 0 (0.0%) |
| Foreign Born, Citizen | 185 (100.0%) | 0 (0.0%) |
| Foreign Born, not a Citizen | 111 (100.0%) | 0 (0.0%) |
Health Insurance Coverage by Household Income in Mantorville
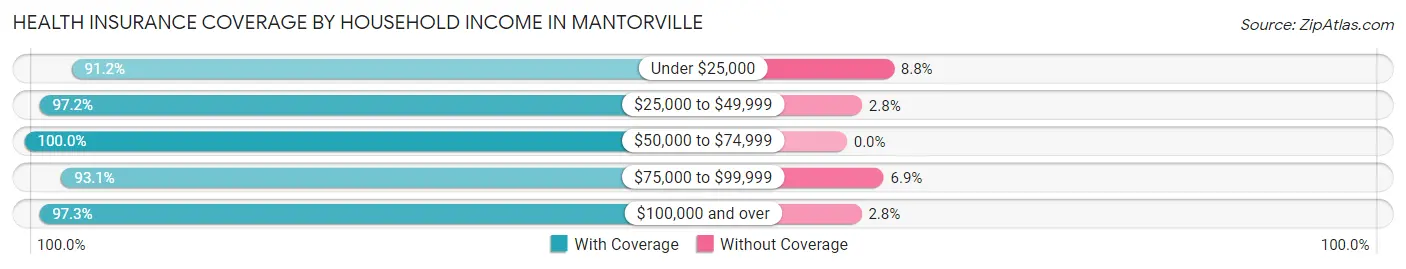
| Household Income | With Coverage | Without Coverage |
| Under $25,000 | 31 (91.2%) | 3 (8.8%) |
| $25,000 to $49,999 | 103 (97.2%) | 3 (2.8%) |
| $50,000 to $74,999 | 78 (100.0%) | 0 (0.0%) |
| $75,000 to $99,999 | 108 (93.1%) | 8 (6.9%) |
| $100,000 and over | 636 (97.3%) | 18 (2.8%) |
Public vs Private Health Insurance Coverage by Age in Mantorville
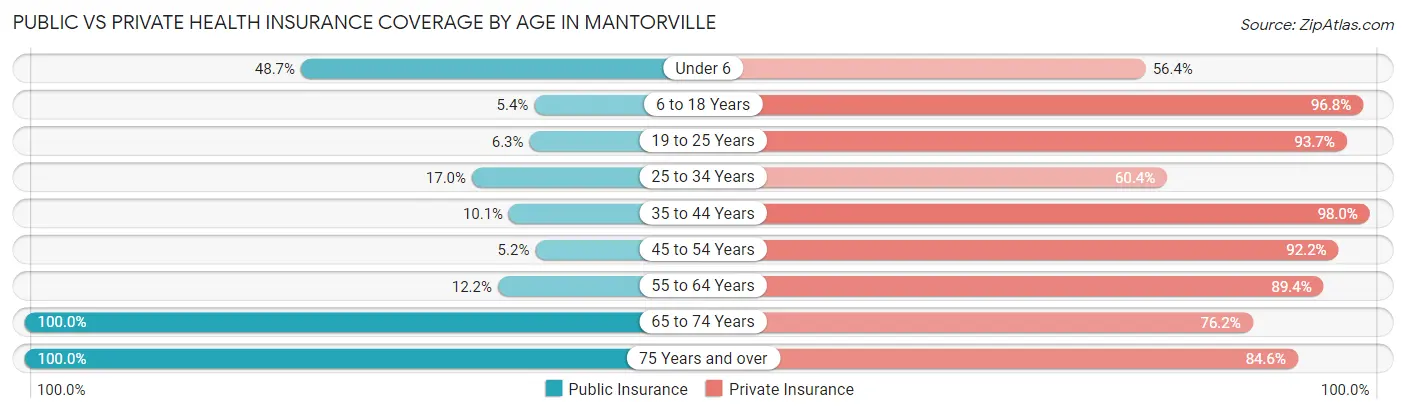
| Age Bracket | Public Insurance | Private Insurance |
| Under 6 | 19 (48.7%) | 22 (56.4%) |
| 6 to 18 Years | 10 (5.4%) | 179 (96.8%) |
| 19 to 25 Years | 7 (6.3%) | 104 (93.7%) |
| 25 to 34 Years | 18 (17.0%) | 64 (60.4%) |
| 35 to 44 Years | 10 (10.1%) | 97 (98.0%) |
| 45 to 54 Years | 6 (5.2%) | 106 (92.2%) |
| 55 to 64 Years | 23 (12.2%) | 169 (89.4%) |
| 65 to 74 Years | 101 (100.0%) | 77 (76.2%) |
| 75 Years and over | 52 (100.0%) | 44 (84.6%) |
| Total | 246 (24.7%) | 862 (86.5%) |
Disability Status by Sex by Age in Mantorville
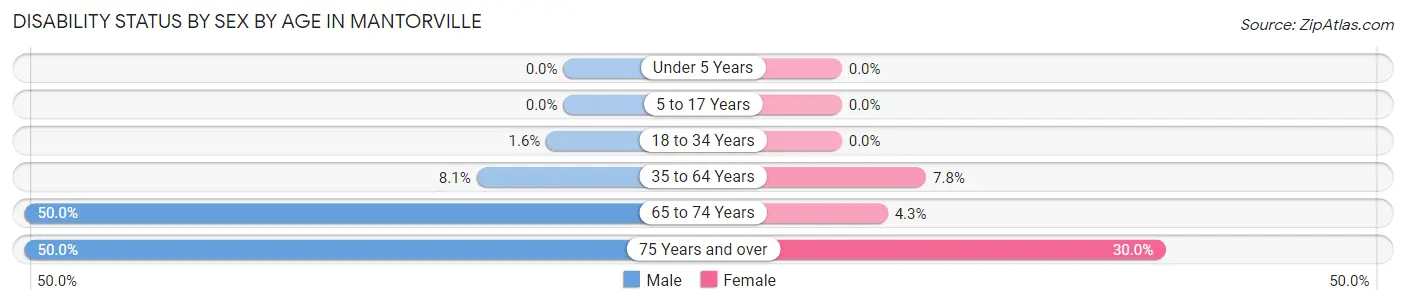
| Age Bracket | Male | Female |
| Under 5 Years | 0 (0.0%) | 0 (0.0%) |
| 5 to 17 Years | 0 (0.0%) | 0 (0.0%) |
| 18 to 34 Years | 2 (1.6%) | 0 (0.0%) |
| 35 to 64 Years | 15 (8.1%) | 17 (7.8%) |
| 65 to 74 Years | 27 (50.0%) | 2 (4.3%) |
| 75 Years and over | 6 (50.0%) | 12 (30.0%) |
Disability Class by Sex by Age in Mantorville
Disability Class: Hearing Difficulty
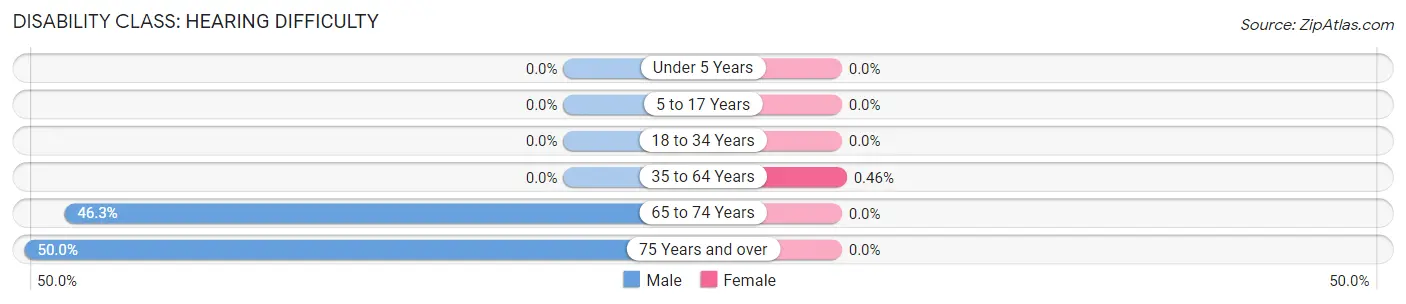
| Age Bracket | Male | Female |
| Under 5 Years | 0 (0.0%) | 0 (0.0%) |
| 5 to 17 Years | 0 (0.0%) | 0 (0.0%) |
| 18 to 34 Years | 0 (0.0%) | 0 (0.0%) |
| 35 to 64 Years | 0 (0.0%) | 1 (0.5%) |
| 65 to 74 Years | 25 (46.3%) | 0 (0.0%) |
| 75 Years and over | 6 (50.0%) | 0 (0.0%) |
Disability Class: Vision Difficulty
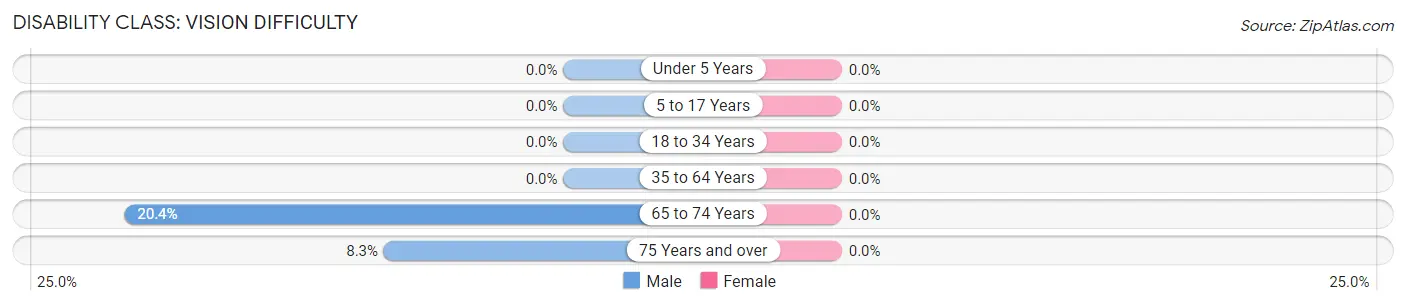
| Age Bracket | Male | Female |
| Under 5 Years | 0 (0.0%) | 0 (0.0%) |
| 5 to 17 Years | 0 (0.0%) | 0 (0.0%) |
| 18 to 34 Years | 0 (0.0%) | 0 (0.0%) |
| 35 to 64 Years | 0 (0.0%) | 0 (0.0%) |
| 65 to 74 Years | 11 (20.4%) | 0 (0.0%) |
| 75 Years and over | 1 (8.3%) | 0 (0.0%) |
Disability Class: Cognitive Difficulty
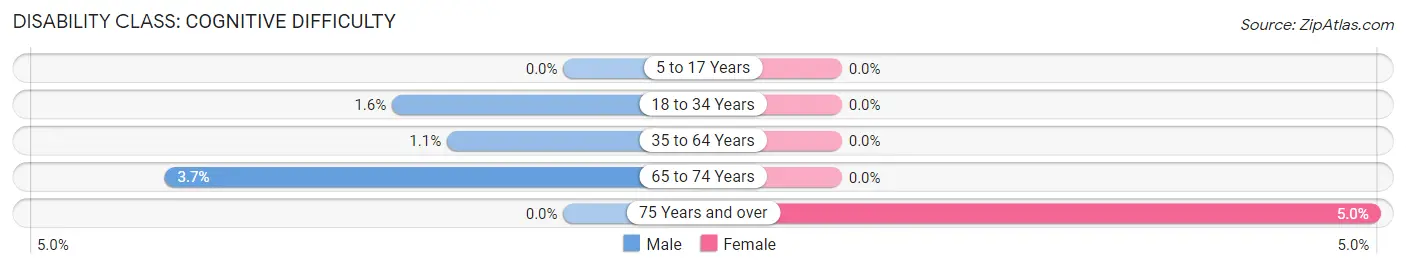
| Age Bracket | Male | Female |
| 5 to 17 Years | 0 (0.0%) | 0 (0.0%) |
| 18 to 34 Years | 2 (1.6%) | 0 (0.0%) |
| 35 to 64 Years | 2 (1.1%) | 0 (0.0%) |
| 65 to 74 Years | 2 (3.7%) | 0 (0.0%) |
| 75 Years and over | 0 (0.0%) | 2 (5.0%) |
Disability Class: Ambulatory Difficulty
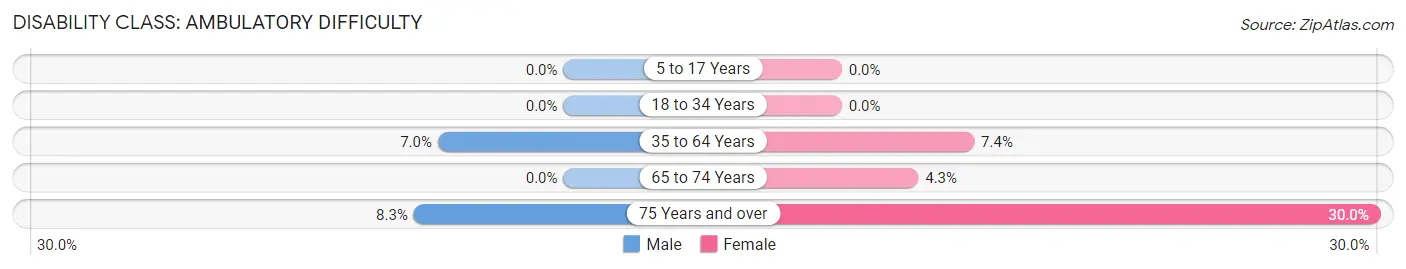
| Age Bracket | Male | Female |
| 5 to 17 Years | 0 (0.0%) | 0 (0.0%) |
| 18 to 34 Years | 0 (0.0%) | 0 (0.0%) |
| 35 to 64 Years | 13 (7.0%) | 16 (7.4%) |
| 65 to 74 Years | 0 (0.0%) | 2 (4.3%) |
| 75 Years and over | 1 (8.3%) | 12 (30.0%) |
Disability Class: Self-Care Difficulty
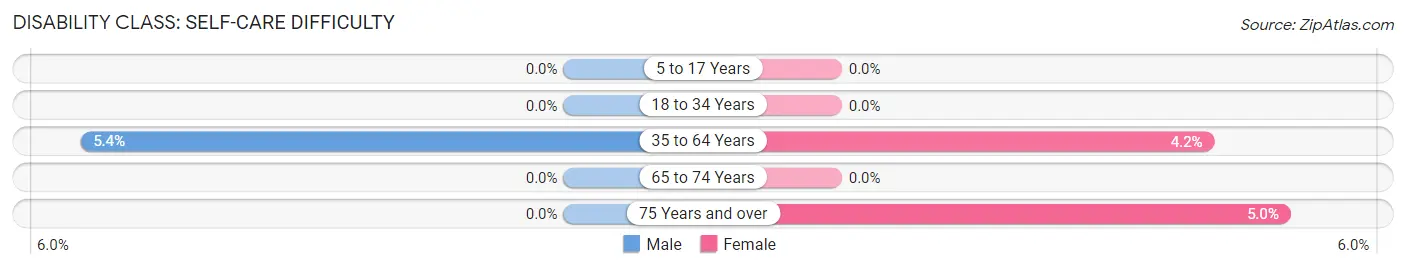
| Age Bracket | Male | Female |
| 5 to 17 Years | 0 (0.0%) | 0 (0.0%) |
| 18 to 34 Years | 0 (0.0%) | 0 (0.0%) |
| 35 to 64 Years | 10 (5.4%) | 9 (4.2%) |
| 65 to 74 Years | 0 (0.0%) | 0 (0.0%) |
| 75 Years and over | 0 (0.0%) | 2 (5.0%) |
Technology Access in Mantorville
Computing Device Access in Mantorville
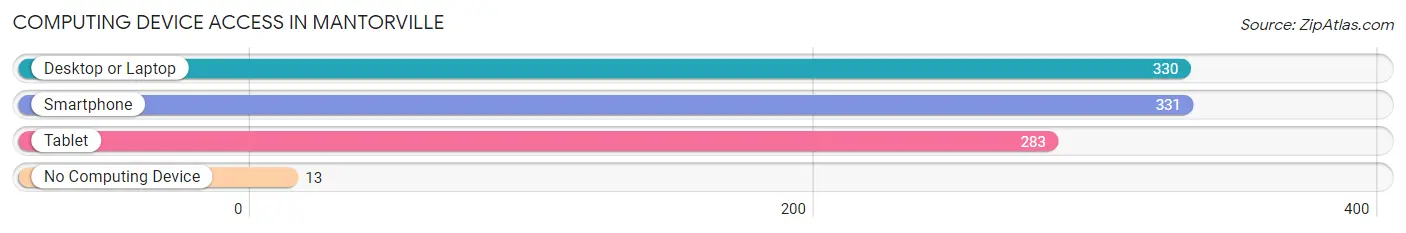
| Device Type | # Households | % Households |
| Desktop or Laptop | 330 | 87.1% |
| Smartphone | 331 | 87.3% |
| Tablet | 283 | 74.7% |
| No Computing Device | 13 | 3.4% |
| Total | 379 | 100.0% |
Internet Access in Mantorville
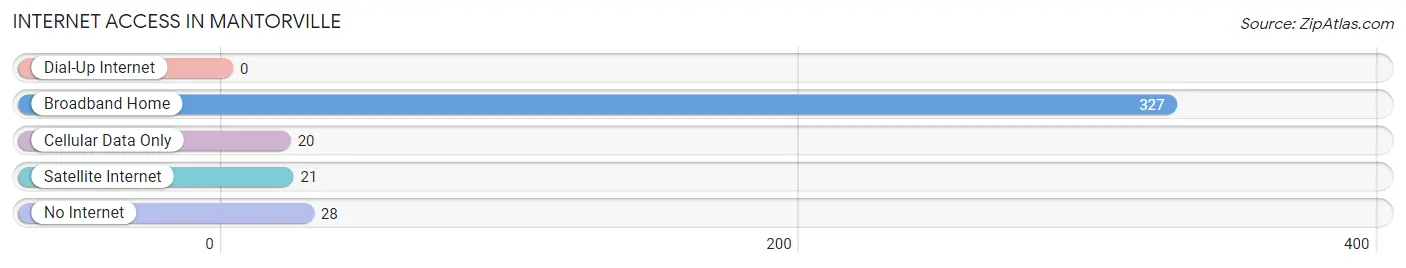
| Internet Type | # Households | % Households |
| Dial-Up Internet | 0 | 0.0% |
| Broadband Home | 327 | 86.3% |
| Cellular Data Only | 20 | 5.3% |
| Satellite Internet | 21 | 5.5% |
| No Internet | 28 | 7.4% |
| Total | 379 | 100.0% |
Mantorville Summary
Mantorville, Minnesota is a small town located in Dodge County, Minnesota. It is situated on the banks of the Zumbro River, about 25 miles south of Rochester. The town was founded in 1854 by William Mantor, a settler from New York. The town was named after him and has since become a popular tourist destination due to its historic buildings, quaint downtown, and beautiful scenery.
History
Mantorville was founded in 1854 by William Mantor, a settler from New York. He purchased the land from the government and began to build a small settlement. The town was named after him and soon became a popular destination for settlers and travelers. The town was incorporated in 1858 and soon became a thriving community.
In the late 1800s, Mantorville was a bustling town with a variety of businesses, including a flour mill, a sawmill, a blacksmith shop, and a hotel. The town also had a school, a post office, and a newspaper. The town was also home to a variety of churches, including the Methodist Episcopal Church, the Congregational Church, and the Catholic Church.
In the early 1900s, Mantorville experienced a period of growth and prosperity. The town was home to a variety of businesses, including a bank, a hardware store, a grocery store, and a movie theater. The town also had a variety of churches, including the Methodist Episcopal Church, the Congregational Church, and the Catholic Church.
Geography
Mantorville is located in Dodge County, Minnesota. It is situated on the banks of the Zumbro River, about 25 miles south of Rochester. The town is surrounded by rolling hills and farmland. The town is located in the Driftless Area, which is characterized by its rugged terrain and steep valleys.
The climate in Mantorville is typical of the Midwest, with hot summers and cold winters. The average temperature in the summer is around 75 degrees Fahrenheit, while the average temperature in the winter is around 20 degrees Fahrenheit. The town receives an average of 30 inches of precipitation each year.
Economy
Mantorville’s economy is largely based on agriculture and tourism. The town is home to a variety of farms, including dairy farms, beef farms, and vegetable farms. The town is also home to a variety of businesses, including restaurants, shops, and hotels.
The town is also home to a variety of tourist attractions, including the Mantorville Historic District, the Mantorville Opera House, and the Mantorville Museum. The town is also home to a variety of festivals, including the Mantorville Music Festival and the Mantorville Art Festival.
Demographics
As of the 2010 census, the population of Mantorville was 1,219. The town has a median age of 39.7 years, with 51.2% of the population being female and 48.8% being male. The median household income is $50,938, and the median home value is $150,000. The town is predominantly white, with 92.3% of the population being white and 7.7% being of other races.
Mantorville is a small town with a rich history and a vibrant economy. The town is home to a variety of businesses, farms, and tourist attractions. The town is also home to a variety of churches, schools, and other amenities. The town is a great place to live, work, and visit.
Common Questions
What is Per Capita Income in Mantorville?
Per Capita income in Mantorville is $46,144.
What is the Median Family Income in Mantorville?
Median Family Income in Mantorville is $135,000.
What is the Median Household income in Mantorville?
Median Household Income in Mantorville is $113,036.
What is Income or Wage Gap in Mantorville?
Income or Wage Gap in Mantorville is 5.3%.
Women in Mantorville earn 94.7 cents for every dollar earned by a man.
What is Inequality or Gini Index in Mantorville?
Inequality or Gini Index in Mantorville is 0.36.
What is the Total Population of Mantorville?
Total Population of Mantorville is 997.
What is the Total Male Population of Mantorville?
Total Male Population of Mantorville is 472.
What is the Total Female Population of Mantorville?
Total Female Population of Mantorville is 525.
What is the Ratio of Males per 100 Females in Mantorville?
There are 89.90 Males per 100 Females in Mantorville.
What is the Ratio of Females per 100 Males in Mantorville?
There are 111.23 Females per 100 Males in Mantorville.
What is the Median Population Age in Mantorville?
Median Population Age in Mantorville is 41.7 Years.
What is the Average Family Size in Mantorville
Average Family Size in Mantorville is 3.0 People.
What is the Average Household Size in Mantorville
Average Household Size in Mantorville is 2.6 People.
How Large is the Labor Force in Mantorville?
There are 602 People in the Labor Forcein in Mantorville.
What is the Percentage of People in the Labor Force in Mantorville?
74.4% of People are in the Labor Force in Mantorville.
What is the Unemployment Rate in Mantorville?
Unemployment Rate in Mantorville is 2.8%.