Deephaven, MN Map & Demographics
Deephaven Map
Deephaven Overview
$134,031
PER CAPITA INCOME
$208,958
AVG FAMILY INCOME
$164,149
AVG HOUSEHOLD INCOME
7.1%
WAGE / INCOME GAP [ % ]
92.9¢/ $1
WAGE / INCOME GAP [ $ ]
0.59
INEQUALITY / GINI INDEX
3,852
TOTAL POPULATION
1,938
MALE POPULATION
1,914
FEMALE POPULATION
101.25
MALES / 100 FEMALES
98.76
FEMALES / 100 MALES
45.9
MEDIAN AGE
3.1
AVG FAMILY SIZE
2.5
AVG HOUSEHOLD SIZE
1,828
LABOR FORCE [ PEOPLE ]
59.8%
PERCENT IN LABOR FORCE
1.4%
UNEMPLOYMENT RATE
Income in Deephaven
Income Overview in Deephaven
Per Capita Income in Deephaven is $134,031, while median incomes of families and households are $208,958 and $164,149 respectively.
| Characteristic | Number | Measure |
| Per Capita Income | 3,852 | $134,031 |
| Median Family Income | 1,078 | $208,958 |
| Mean Family Income | 1,078 | $418,179 |
| Median Household Income | 1,523 | $164,149 |
| Mean Household Income | 1,523 | $333,727 |
| Income Deficit | 1,078 | $0 |
| Wage / Income Gap (%) | 3,852 | 7.06% |
| Wage / Income Gap ($) | 3,852 | 92.94¢ per $1 |
| Gini / Inequality Index | 3,852 | 0.59 |
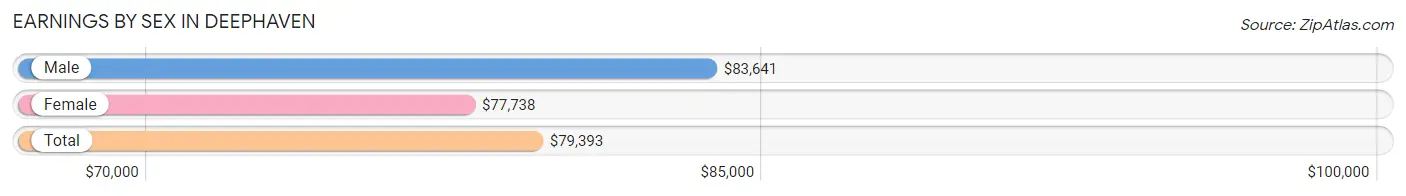
Earnings by Sex in Deephaven
Average Earnings in Deephaven are $79,393, $83,641 for men and $77,738 for women, a difference of 7.1%.
| Sex | Number | Average Earnings |
| Male | 1,165 (54.3%) | $83,641 |
| Female | 980 (45.7%) | $77,738 |
| Total | 2,145 (100.0%) | $79,393 |
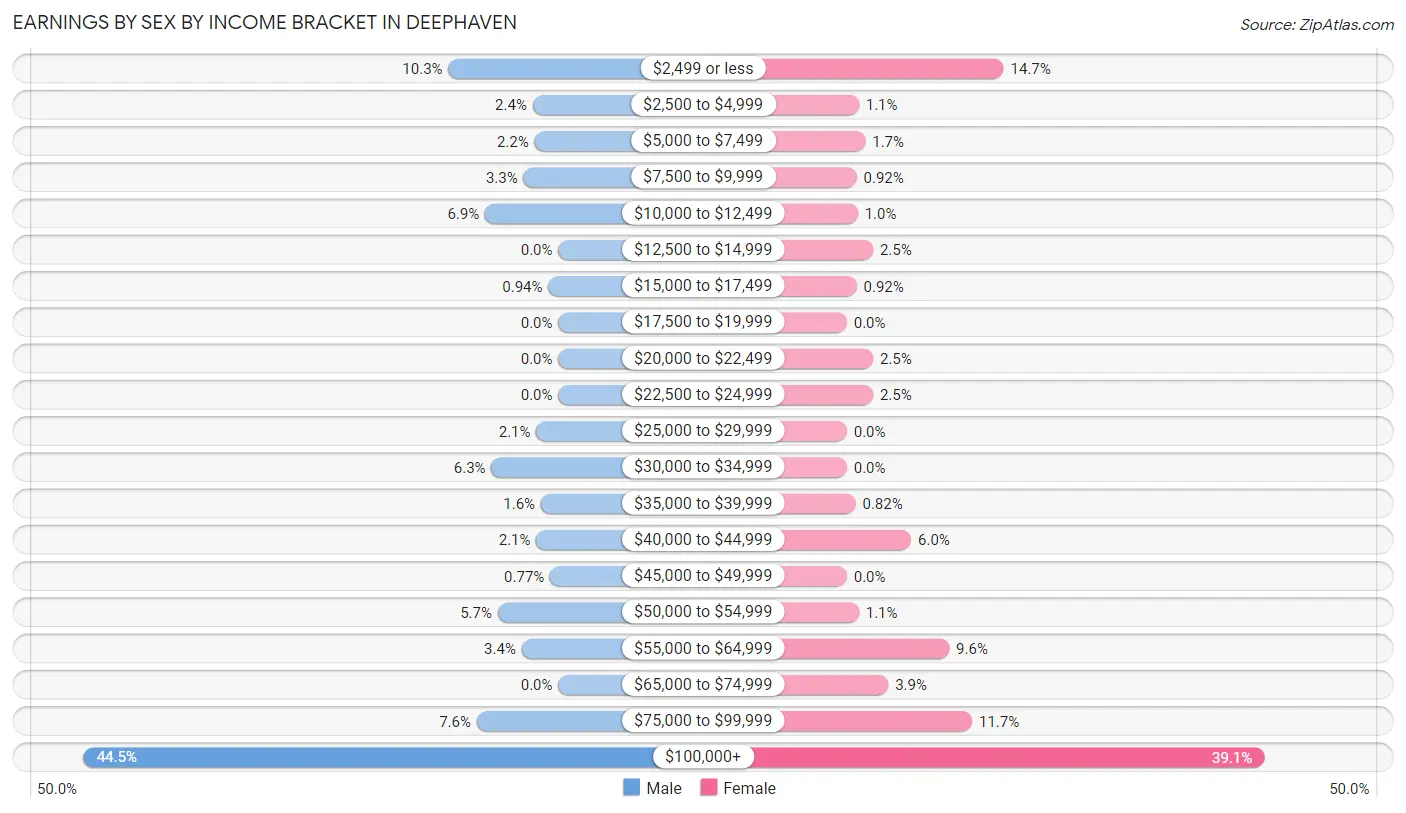
Earnings by Sex by Income Bracket in Deephaven
The most common earnings brackets in Deephaven are $100,000+ for men (518 | 44.5%) and $100,000+ for women (383 | 39.1%).
| Income | Male | Female |
| $2,499 or less | 120 (10.3%) | 144 (14.7%) |
| $2,500 to $4,999 | 28 (2.4%) | 11 (1.1%) |
| $5,000 to $7,499 | 26 (2.2%) | 17 (1.7%) |
| $7,500 to $9,999 | 38 (3.3%) | 9 (0.9%) |
| $10,000 to $12,499 | 80 (6.9%) | 10 (1.0%) |
| $12,500 to $14,999 | 0 (0.0%) | 24 (2.5%) |
| $15,000 to $17,499 | 11 (0.9%) | 9 (0.9%) |
| $17,500 to $19,999 | 0 (0.0%) | 0 (0.0%) |
| $20,000 to $22,499 | 0 (0.0%) | 24 (2.5%) |
| $22,500 to $24,999 | 0 (0.0%) | 24 (2.5%) |
| $25,000 to $29,999 | 24 (2.1%) | 0 (0.0%) |
| $30,000 to $34,999 | 73 (6.3%) | 0 (0.0%) |
| $35,000 to $39,999 | 19 (1.6%) | 8 (0.8%) |
| $40,000 to $44,999 | 24 (2.1%) | 59 (6.0%) |
| $45,000 to $49,999 | 9 (0.8%) | 0 (0.0%) |
| $50,000 to $54,999 | 66 (5.7%) | 11 (1.1%) |
| $55,000 to $64,999 | 40 (3.4%) | 94 (9.6%) |
| $65,000 to $74,999 | 0 (0.0%) | 38 (3.9%) |
| $75,000 to $99,999 | 89 (7.6%) | 115 (11.7%) |
| $100,000+ | 518 (44.5%) | 383 (39.1%) |
| Total | 1,165 (100.0%) | 980 (100.0%) |
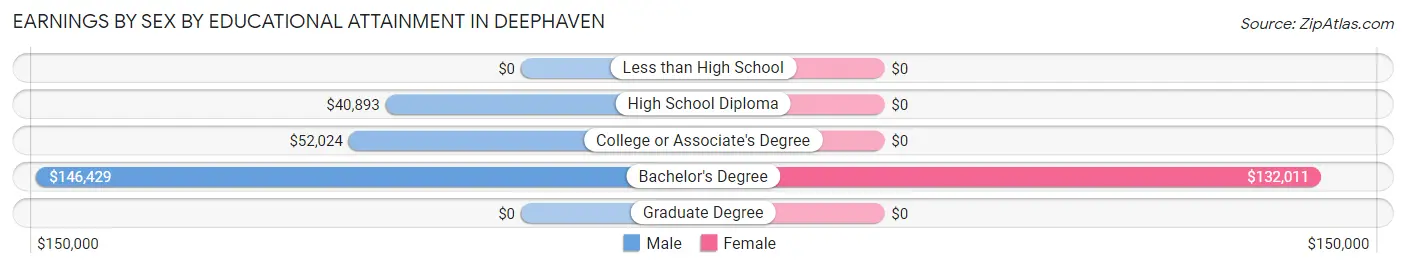
Earnings by Sex by Educational Attainment in Deephaven
Average earnings in Deephaven are $91,250 for men and $89,567 for women, a difference of 1.8%. Men with an educational attainment of bachelor's degree enjoy the highest average annual earnings of $146,429, while those with high school diploma education earn the least with $40,893. Women with an educational attainment of bachelor's degree earn the most with the average annual earnings of $132,011, while those with bachelor's degree education have the smallest earnings of $132,011.
| Educational Attainment | Male Income | Female Income |
| Less than High School | - | - |
| High School Diploma | $40,893 | $0 |
| College or Associate's Degree | $52,024 | $0 |
| Bachelor's Degree | $146,429 | $132,011 |
| Graduate Degree | - | - |
| Total | $91,250 | $89,567 |
Family Income in Deephaven
Family Income Brackets in Deephaven
According to the Deephaven family income data, there are 562 families falling into the $200,000+ income range, which is the most common income bracket and makes up 52.1% of all families.
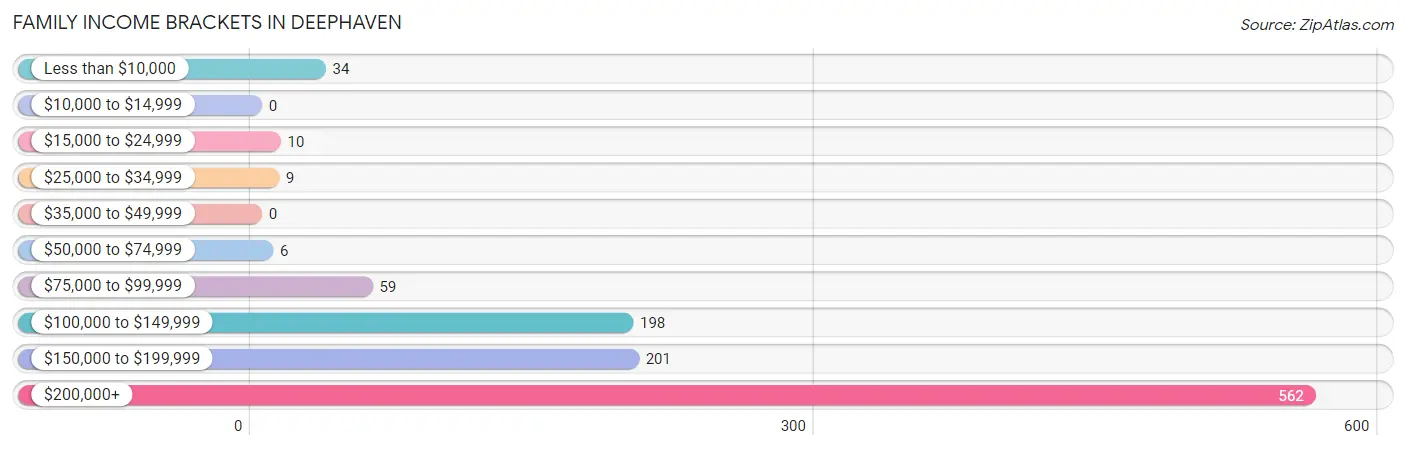
| Income Bracket | # Families | % Families |
| Less than $10,000 | 34 | 3.2% |
| $10,000 to $14,999 | 0 | 0.0% |
| $15,000 to $24,999 | 10 | 0.9% |
| $25,000 to $34,999 | 9 | 0.8% |
| $35,000 to $49,999 | 0 | 0.0% |
| $50,000 to $74,999 | 6 | 0.6% |
| $75,000 to $99,999 | 59 | 5.5% |
| $100,000 to $149,999 | 198 | 18.4% |
| $150,000 to $199,999 | 201 | 18.6% |
| $200,000+ | 562 | 52.1% |
Family Income by Famaliy Size in Deephaven
4-person families (363 | 33.7%) account for the highest median family income in Deephaven with $250,001 per family, while 2-person families (402 | 37.3%) have the highest median income of $93,611 per family member.
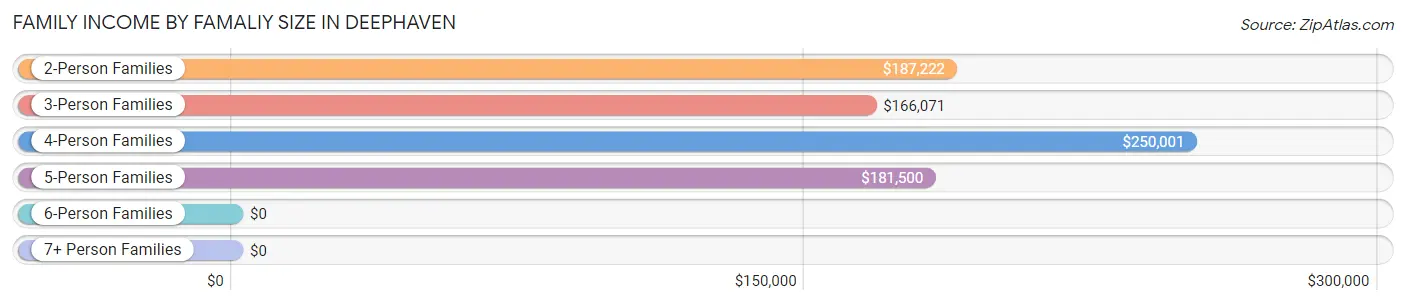
| Income Bracket | # Families | Median Income |
| 2-Person Families | 402 (37.3%) | $187,222 |
| 3-Person Families | 254 (23.6%) | $166,071 |
| 4-Person Families | 363 (33.7%) | $250,001 |
| 5-Person Families | 40 (3.7%) | $181,500 |
| 6-Person Families | 11 (1.0%) | $0 |
| 7+ Person Families | 8 (0.7%) | $0 |
| Total | 1,078 (100.0%) | $208,958 |
Family Income by Number of Earners in Deephaven
The median family income in Deephaven is $208,958, with families comprising 2 earners (497) having the highest median family income of $244,306, while families with 3+ earners (193) have the lowest median family income of $172,679, accounting for 46.1% and 17.9% of families, respectively.
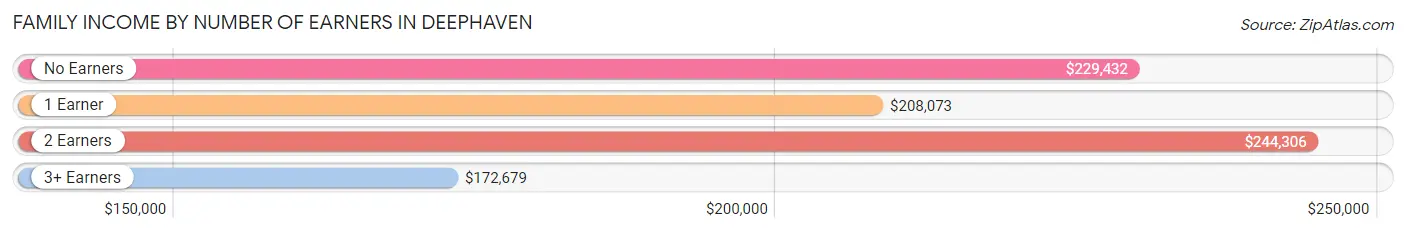
| Number of Earners | # Families | Median Income |
| No Earners | 135 (12.5%) | $229,432 |
| 1 Earner | 253 (23.5%) | $208,073 |
| 2 Earners | 497 (46.1%) | $244,306 |
| 3+ Earners | 193 (17.9%) | $172,679 |
| Total | 1,078 (100.0%) | $208,958 |
Household Income in Deephaven
Household Income Brackets in Deephaven
With 627 households falling in the category, the $200,000+ income range is the most frequent in Deephaven, accounting for 41.2% of all households.
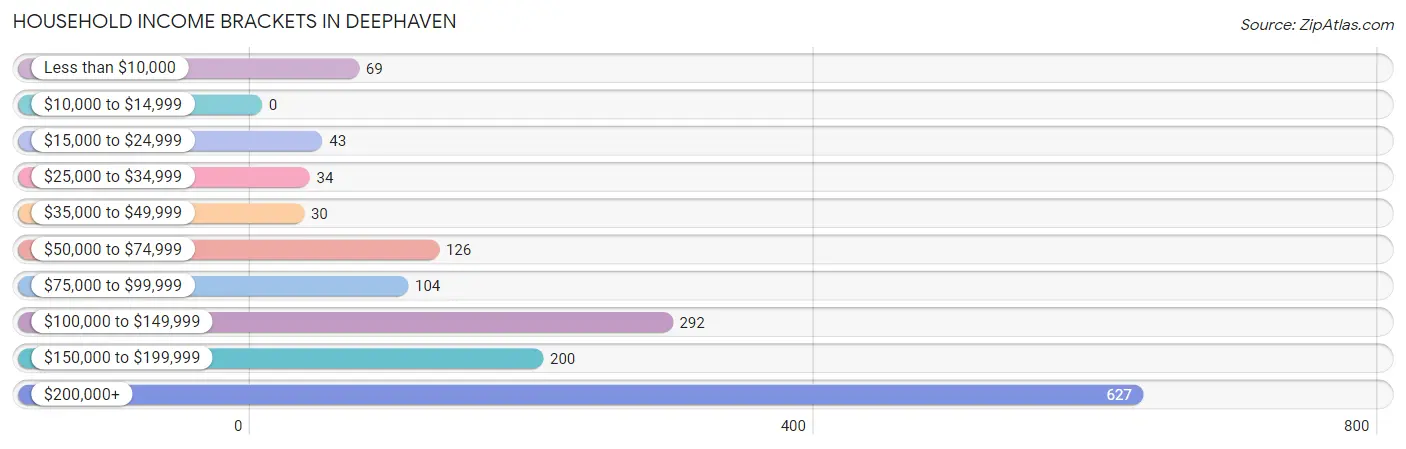
| Income Bracket | # Households | % Households |
| Less than $10,000 | 69 | 4.5% |
| $10,000 to $14,999 | 0 | 0.0% |
| $15,000 to $24,999 | 43 | 2.8% |
| $25,000 to $34,999 | 34 | 2.2% |
| $35,000 to $49,999 | 30 | 2.0% |
| $50,000 to $74,999 | 126 | 8.3% |
| $75,000 to $99,999 | 104 | 6.8% |
| $100,000 to $149,999 | 292 | 19.2% |
| $150,000 to $199,999 | 200 | 13.1% |
| $200,000+ | 627 | 41.2% |
Household Income by Householder Age in Deephaven
The median household income in Deephaven is $164,149, with the highest median household income of $208,854 found in the 45 to 64 years age bracket for the primary householder. A total of 674 households (44.3%) fall into this category.
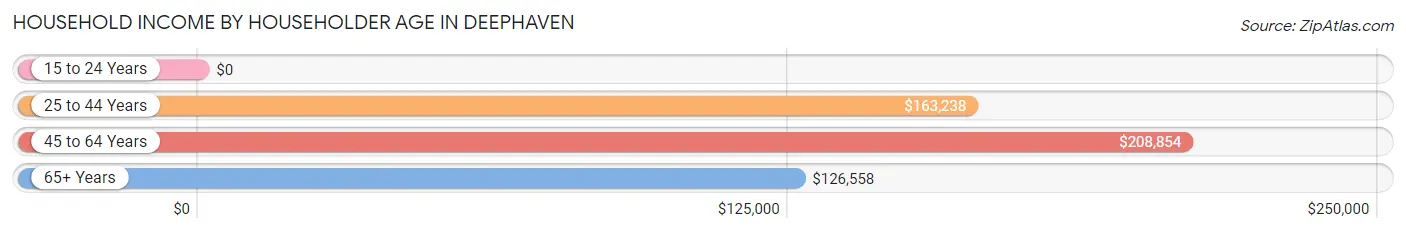
| Income Bracket | # Households | Median Income |
| 15 to 24 Years | 0 (0.0%) | $0 |
| 25 to 44 Years | 354 (23.2%) | $163,238 |
| 45 to 64 Years | 674 (44.3%) | $208,854 |
| 65+ Years | 495 (32.5%) | $126,558 |
| Total | 1,523 (100.0%) | $164,149 |
Poverty in Deephaven
Income Below Poverty by Sex and Age in Deephaven
With 2.9% poverty level for males and 3.0% for females among the residents of Deephaven, 25 to 34 year old males and 12 to 14 year old females are the most vulnerable to poverty, with 19 males (14.3%) and 12 females (14.1%) in their respective age groups living below the poverty level.
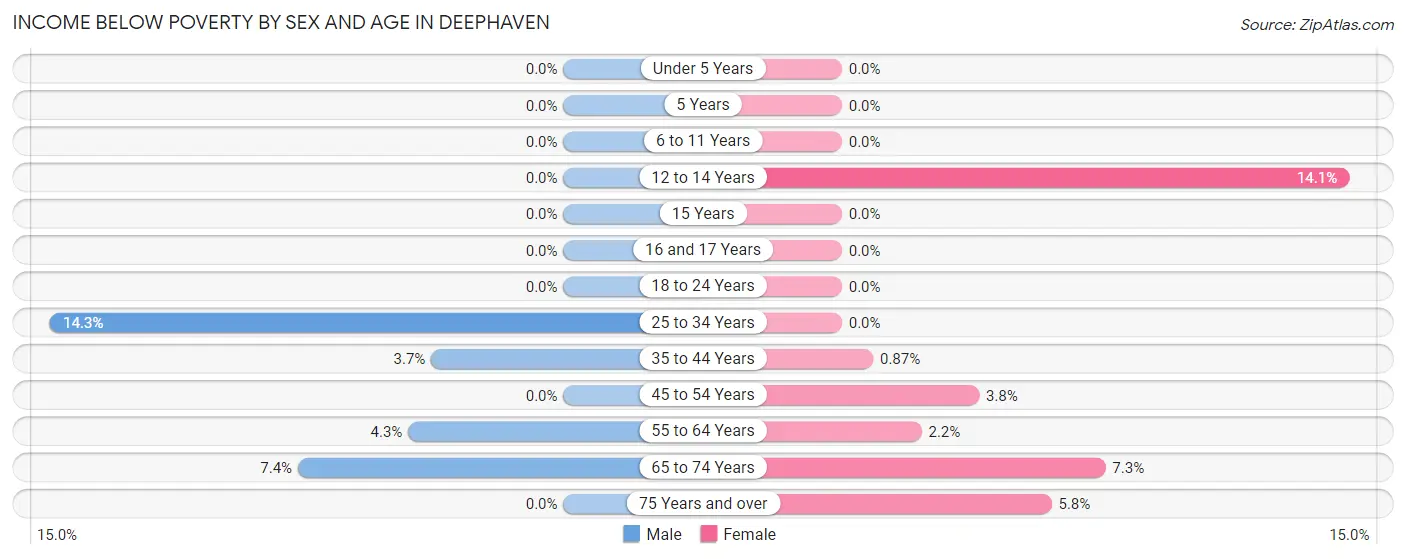
| Age Bracket | Male | Female |
| Under 5 Years | 0 (0.0%) | 0 (0.0%) |
| 5 Years | 0 (0.0%) | 0 (0.0%) |
| 6 to 11 Years | 0 (0.0%) | 0 (0.0%) |
| 12 to 14 Years | 0 (0.0%) | 12 (14.1%) |
| 15 Years | 0 (0.0%) | 0 (0.0%) |
| 16 and 17 Years | 0 (0.0%) | 0 (0.0%) |
| 18 to 24 Years | 0 (0.0%) | 0 (0.0%) |
| 25 to 34 Years | 19 (14.3%) | 0 (0.0%) |
| 35 to 44 Years | 10 (3.7%) | 2 (0.9%) |
| 45 to 54 Years | 0 (0.0%) | 13 (3.8%) |
| 55 to 64 Years | 14 (4.3%) | 8 (2.2%) |
| 65 to 74 Years | 13 (7.4%) | 13 (7.3%) |
| 75 Years and over | 0 (0.0%) | 9 (5.8%) |
| Total | 56 (2.9%) | 57 (3.0%) |
Income Above Poverty by Sex and Age in Deephaven
According to the poverty statistics in Deephaven, males aged under 5 years and females aged under 5 years are the age groups that are most secure financially, with 100.0% of males and 100.0% of females in these age groups living above the poverty line.
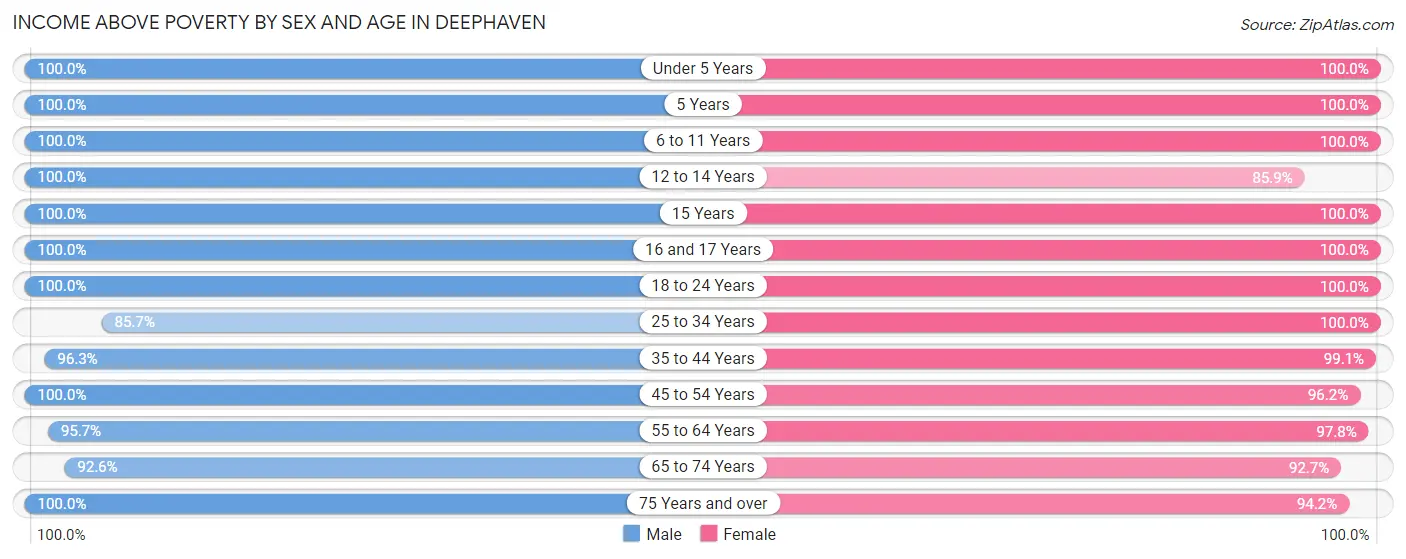
| Age Bracket | Male | Female |
| Under 5 Years | 72 (100.0%) | 74 (100.0%) |
| 5 Years | 10 (100.0%) | 41 (100.0%) |
| 6 to 11 Years | 192 (100.0%) | 159 (100.0%) |
| 12 to 14 Years | 59 (100.0%) | 73 (85.9%) |
| 15 Years | 67 (100.0%) | 33 (100.0%) |
| 16 and 17 Years | 110 (100.0%) | 59 (100.0%) |
| 18 to 24 Years | 79 (100.0%) | 128 (100.0%) |
| 25 to 34 Years | 114 (85.7%) | 49 (100.0%) |
| 35 to 44 Years | 262 (96.3%) | 227 (99.1%) |
| 45 to 54 Years | 256 (100.0%) | 327 (96.2%) |
| 55 to 64 Years | 310 (95.7%) | 352 (97.8%) |
| 65 to 74 Years | 163 (92.6%) | 164 (92.7%) |
| 75 Years and over | 188 (100.0%) | 145 (94.2%) |
| Total | 1,882 (97.1%) | 1,831 (97.0%) |
Income Below Poverty Among Married-Couple Families in Deephaven
The poverty statistics for married-couple families in Deephaven show that 1.3% or 13 of the total 997 families live below the poverty line. Families with no children have the highest poverty rate of 2.6%, comprising of 13 families. On the other hand, families with 1 or 2 children have the lowest poverty rate of 0.0%, which includes 0 families.
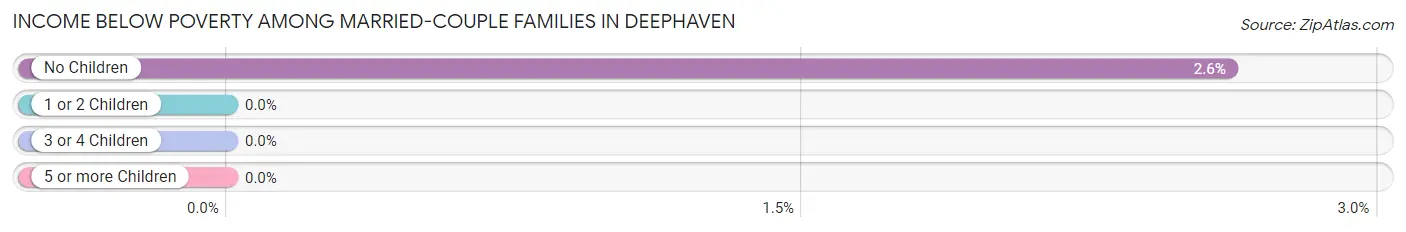
| Children | Above Poverty | Below Poverty |
| No Children | 486 (97.4%) | 13 (2.6%) |
| 1 or 2 Children | 461 (100.0%) | 0 (0.0%) |
| 3 or 4 Children | 37 (100.0%) | 0 (0.0%) |
| 5 or more Children | 0 (0.0%) | 0 (0.0%) |
| Total | 984 (98.7%) | 13 (1.3%) |
Income Below Poverty Among Single-Parent Households in Deephaven
According to the poverty data in Deephaven, 30.8% or 8 single-father households and 23.6% or 13 single-mother households are living below the poverty line. Among single-father households, those with no children have the highest poverty rate, with 8 households (100.0%) experiencing poverty. Likewise, among single-mother households, those with 1 or 2 children have the highest poverty rate, with 13 households (28.9%) falling below the poverty line.
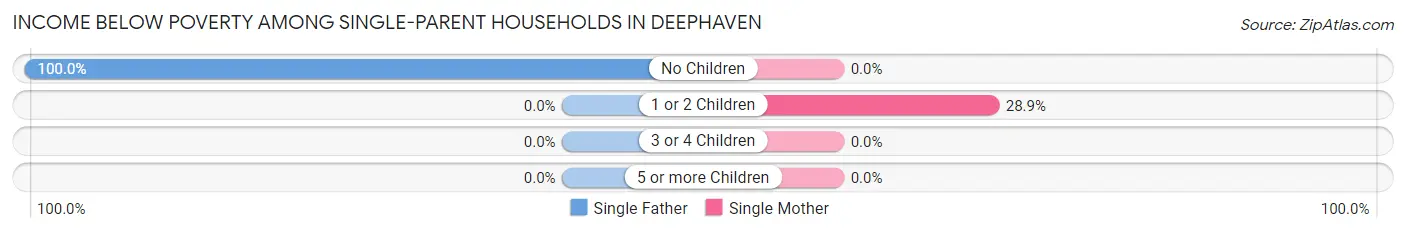
| Children | Single Father | Single Mother |
| No Children | 8 (100.0%) | 0 (0.0%) |
| 1 or 2 Children | 0 (0.0%) | 13 (28.9%) |
| 3 or 4 Children | 0 (0.0%) | 0 (0.0%) |
| 5 or more Children | 0 (0.0%) | 0 (0.0%) |
| Total | 8 (30.8%) | 13 (23.6%) |
Income Below Poverty Among Married-Couple vs Single-Parent Households in Deephaven
The poverty data for Deephaven shows that 13 of the married-couple family households (1.3%) and 21 of the single-parent households (25.9%) are living below the poverty level. Within the married-couple family households, those with no children have the highest poverty rate, with 13 households (2.6%) falling below the poverty line. Among the single-parent households, those with no children have the highest poverty rate, with 8 household (44.4%) living below poverty.
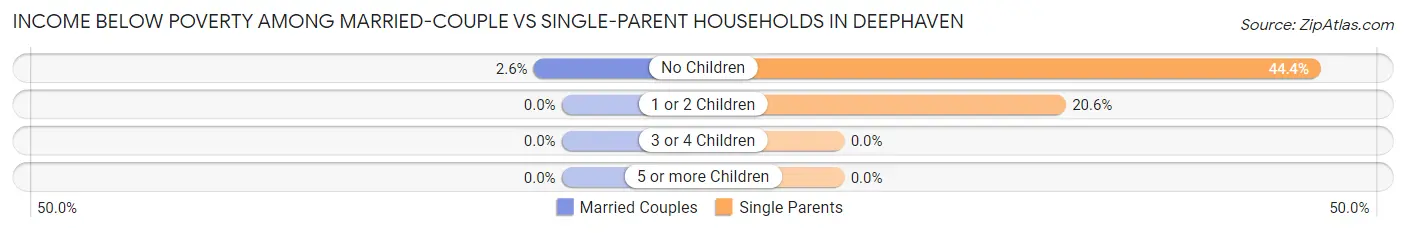
| Children | Married-Couple Families | Single-Parent Households |
| No Children | 13 (2.6%) | 8 (44.4%) |
| 1 or 2 Children | 0 (0.0%) | 13 (20.6%) |
| 3 or 4 Children | 0 (0.0%) | 0 (0.0%) |
| 5 or more Children | 0 (0.0%) | 0 (0.0%) |
| Total | 13 (1.3%) | 21 (25.9%) |
Race in Deephaven
The most populous races in Deephaven are White / Caucasian (3,628 | 94.2%), Two or more Races (102 | 2.6%), and Hispanic or Latino (84 | 2.2%).
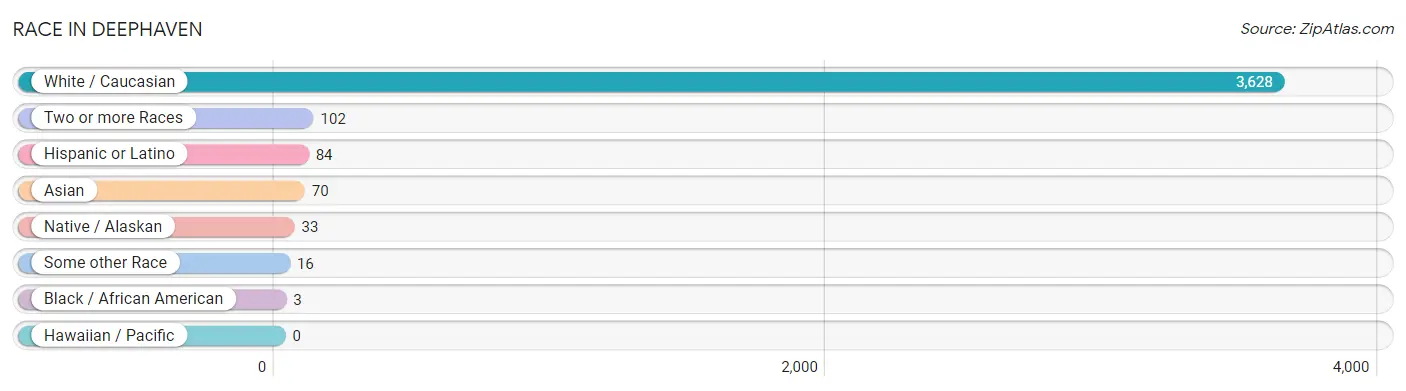
| Race | # Population | % Population |
| Asian | 70 | 1.8% |
| Black / African American | 3 | 0.1% |
| Hawaiian / Pacific | 0 | 0.0% |
| Hispanic or Latino | 84 | 2.2% |
| Native / Alaskan | 33 | 0.9% |
| White / Caucasian | 3,628 | 94.2% |
| Two or more Races | 102 | 2.6% |
| Some other Race | 16 | 0.4% |
| Total | 3,852 | 100.0% |
Ancestry in Deephaven
The most populous ancestries reported in Deephaven are German (816 | 21.2%), Norwegian (487 | 12.6%), Irish (407 | 10.6%), English (386 | 10.0%), and Italian (167 | 4.3%), together accounting for 58.8% of all Deephaven residents.
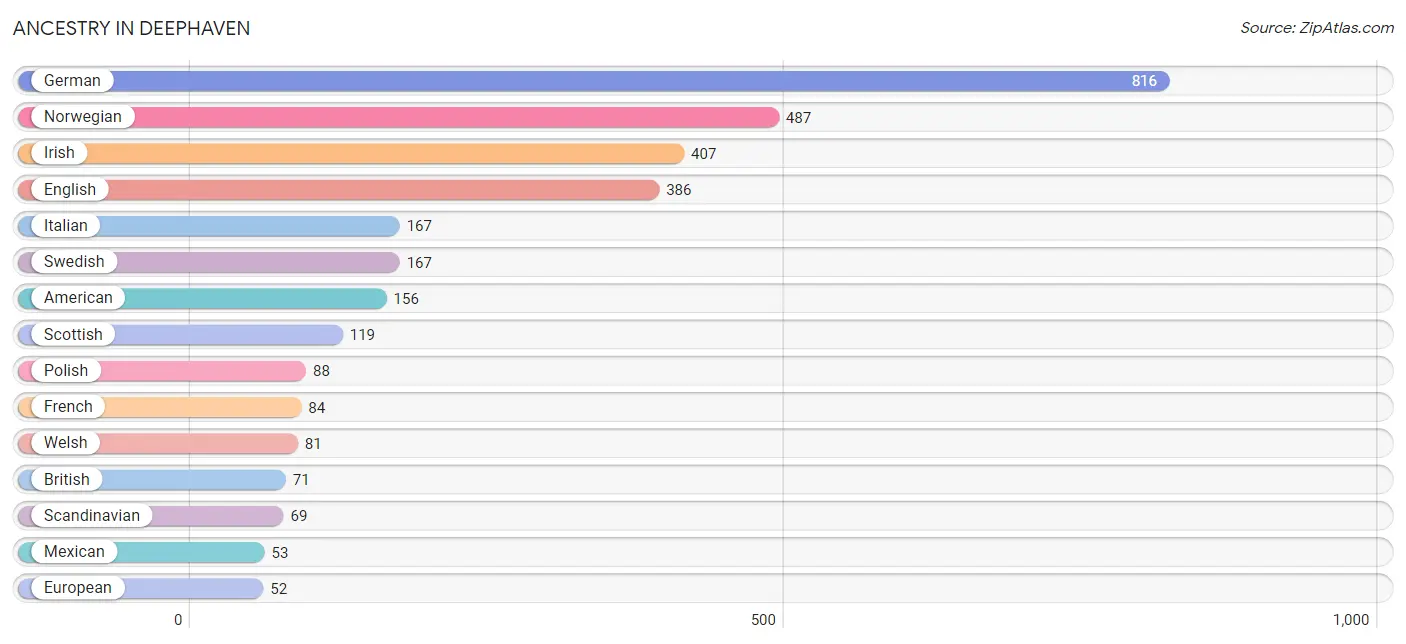
| Ancestry | # Population | % Population |
| American | 156 | 4.1% |
| Belgian | 3 | 0.1% |
| Bhutanese | 11 | 0.3% |
| British | 71 | 1.8% |
| Burmese | 29 | 0.7% |
| Central American | 31 | 0.8% |
| Central American Indian | 31 | 0.8% |
| Chippewa | 1 | 0.0% |
| Croatian | 31 | 0.8% |
| Czech | 23 | 0.6% |
| Danish | 21 | 0.5% |
| Dutch | 28 | 0.7% |
| Eastern European | 31 | 0.8% |
| English | 386 | 10.0% |
| European | 52 | 1.3% |
| Finnish | 16 | 0.4% |
| French | 84 | 2.2% |
| French Canadian | 9 | 0.2% |
| German | 816 | 21.2% |
| Guatemalan | 31 | 0.8% |
| Hungarian | 27 | 0.7% |
| Indian (Asian) | 1 | 0.0% |
| Irish | 407 | 10.6% |
| Italian | 167 | 4.3% |
| Latvian | 10 | 0.3% |
| Luxembourger | 8 | 0.2% |
| Mexican | 53 | 1.4% |
| Northern European | 41 | 1.1% |
| Norwegian | 487 | 12.6% |
| Polish | 88 | 2.3% |
| Portuguese | 10 | 0.3% |
| Scandinavian | 69 | 1.8% |
| Scotch-Irish | 22 | 0.6% |
| Scottish | 119 | 3.1% |
| Sioux | 1 | 0.0% |
| Slovene | 3 | 0.1% |
| Sri Lankan | 29 | 0.7% |
| Swedish | 167 | 4.3% |
| Swiss | 25 | 0.6% |
| Ukrainian | 18 | 0.5% |
| Welsh | 81 | 2.1% | View All 41 Rows |
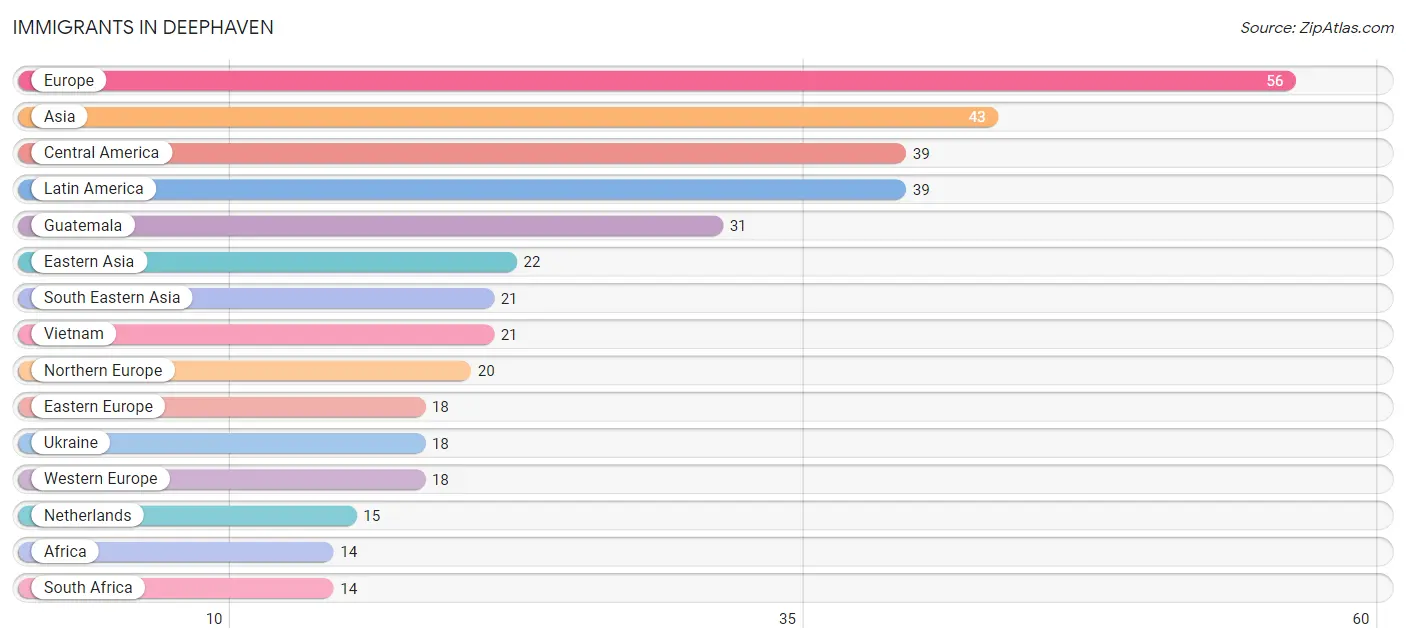
Immigrants in Deephaven
The most numerous immigrant groups reported in Deephaven came from Europe (56 | 1.5%), Asia (43 | 1.1%), Central America (39 | 1.0%), Latin America (39 | 1.0%), and Guatemala (31 | 0.8%), together accounting for 5.4% of all Deephaven residents.
| Immigration Origin | # Population | % Population |
| Africa | 14 | 0.4% |
| Asia | 43 | 1.1% |
| Belgium | 3 | 0.1% |
| Central America | 39 | 1.0% |
| Eastern Asia | 22 | 0.6% |
| Eastern Europe | 18 | 0.5% |
| Europe | 56 | 1.5% |
| Guatemala | 31 | 0.8% |
| Japan | 11 | 0.3% |
| Korea | 11 | 0.3% |
| Latin America | 39 | 1.0% |
| Mexico | 8 | 0.2% |
| Netherlands | 15 | 0.4% |
| Northern Europe | 20 | 0.5% |
| South Africa | 14 | 0.4% |
| South Eastern Asia | 21 | 0.5% |
| Ukraine | 18 | 0.5% |
| Vietnam | 21 | 0.5% |
| Western Europe | 18 | 0.5% | View All 19 Rows |
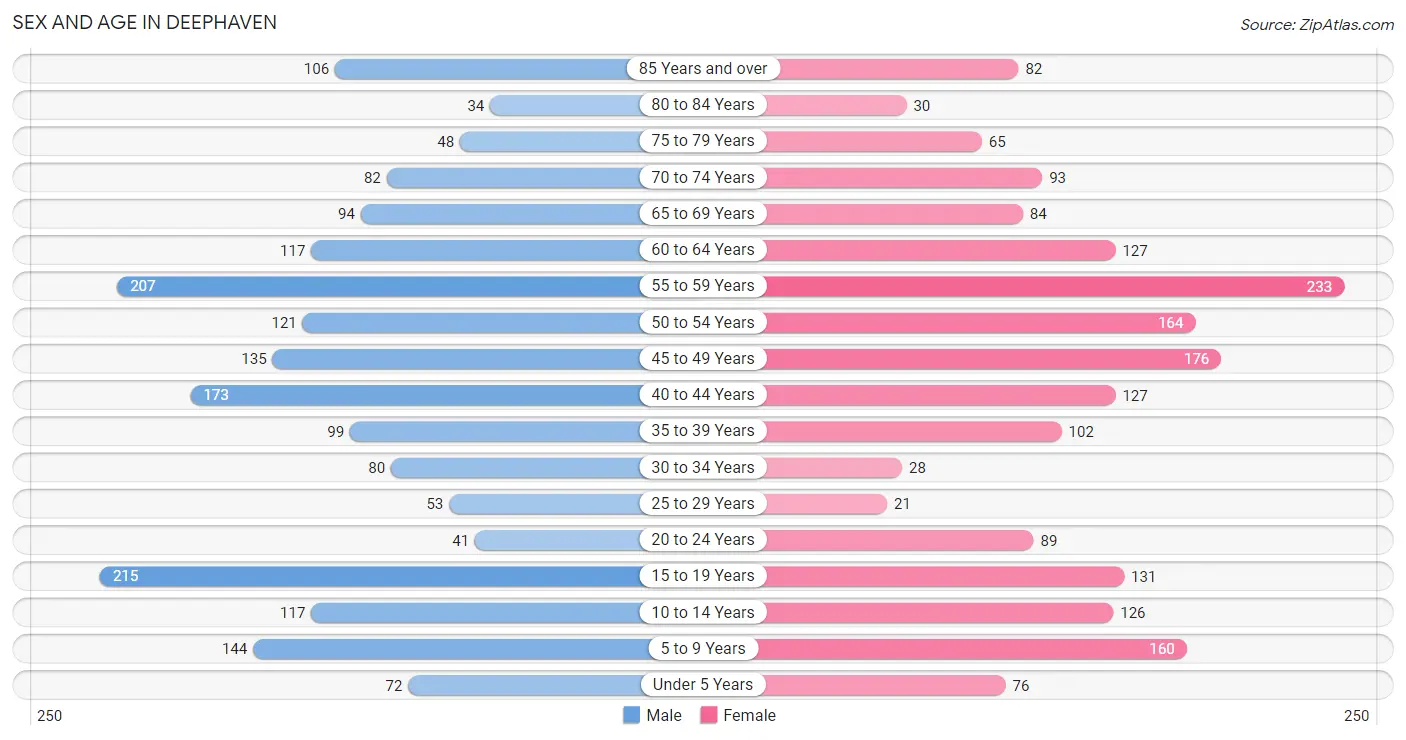
Sex and Age in Deephaven
Sex and Age in Deephaven
The most populous age groups in Deephaven are 15 to 19 Years (215 | 11.1%) for men and 55 to 59 Years (233 | 12.2%) for women.
| Age Bracket | Male | Female |
| Under 5 Years | 72 (3.7%) | 76 (4.0%) |
| 5 to 9 Years | 144 (7.4%) | 160 (8.4%) |
| 10 to 14 Years | 117 (6.0%) | 126 (6.6%) |
| 15 to 19 Years | 215 (11.1%) | 131 (6.8%) |
| 20 to 24 Years | 41 (2.1%) | 89 (4.6%) |
| 25 to 29 Years | 53 (2.7%) | 21 (1.1%) |
| 30 to 34 Years | 80 (4.1%) | 28 (1.5%) |
| 35 to 39 Years | 99 (5.1%) | 102 (5.3%) |
| 40 to 44 Years | 173 (8.9%) | 127 (6.6%) |
| 45 to 49 Years | 135 (7.0%) | 176 (9.2%) |
| 50 to 54 Years | 121 (6.2%) | 164 (8.6%) |
| 55 to 59 Years | 207 (10.7%) | 233 (12.2%) |
| 60 to 64 Years | 117 (6.0%) | 127 (6.6%) |
| 65 to 69 Years | 94 (4.9%) | 84 (4.4%) |
| 70 to 74 Years | 82 (4.2%) | 93 (4.9%) |
| 75 to 79 Years | 48 (2.5%) | 65 (3.4%) |
| 80 to 84 Years | 34 (1.8%) | 30 (1.6%) |
| 85 Years and over | 106 (5.5%) | 82 (4.3%) |
| Total | 1,938 (100.0%) | 1,914 (100.0%) |
Families and Households in Deephaven
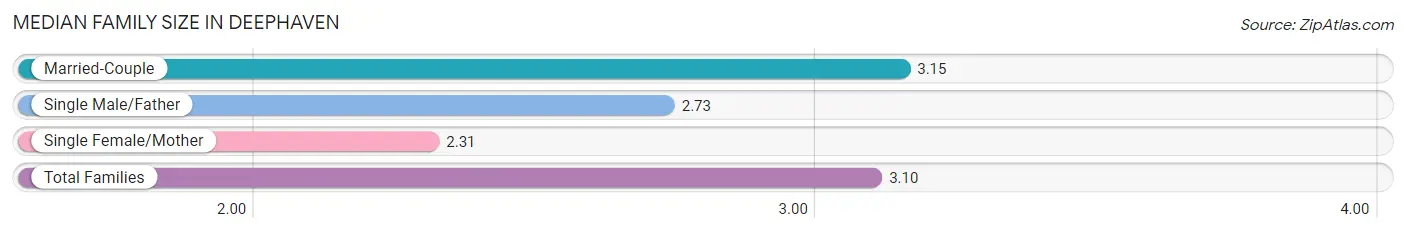
Median Family Size in Deephaven
The median family size in Deephaven is 3.10 persons per family, with married-couple families (997 | 92.5%) accounting for the largest median family size of 3.15 persons per family. On the other hand, single female/mother families (55 | 5.1%) represent the smallest median family size with 2.31 persons per family.
| Family Type | # Families | Family Size |
| Married-Couple | 997 (92.5%) | 3.15 |
| Single Male/Father | 26 (2.4%) | 2.73 |
| Single Female/Mother | 55 (5.1%) | 2.31 |
| Total Families | 1,078 (100.0%) | 3.10 |
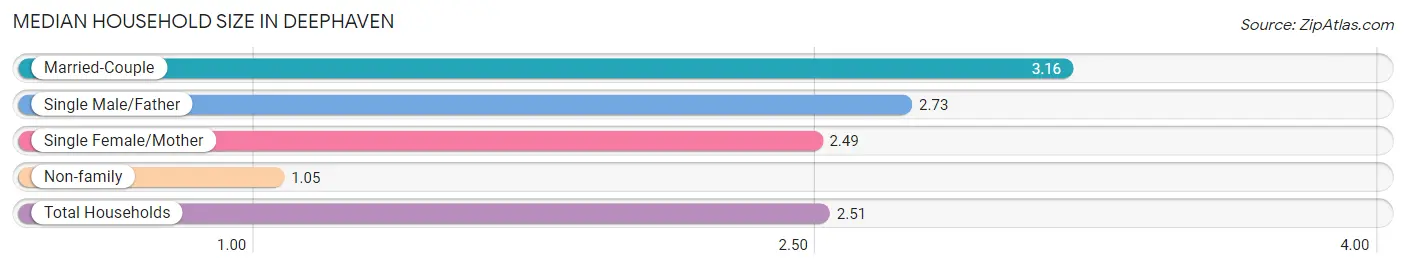
Median Household Size in Deephaven
The median household size in Deephaven is 2.51 persons per household, with married-couple households (997 | 65.5%) accounting for the largest median household size of 3.16 persons per household. non-family households (445 | 29.2%) represent the smallest median household size with 1.05 persons per household.
| Household Type | # Households | Household Size |
| Married-Couple | 997 (65.5%) | 3.16 |
| Single Male/Father | 26 (1.7%) | 2.73 |
| Single Female/Mother | 55 (3.6%) | 2.49 |
| Non-family | 445 (29.2%) | 1.05 |
| Total Households | 1,523 (100.0%) | 2.51 |
Household Size by Marriage Status in Deephaven
Out of a total of 1,523 households in Deephaven, 1,078 (70.8%) are family households, while 445 (29.2%) are nonfamily households. The most numerous type of family households are 2-person households, comprising 402, and the most common type of nonfamily households are 1-person households, comprising 426.
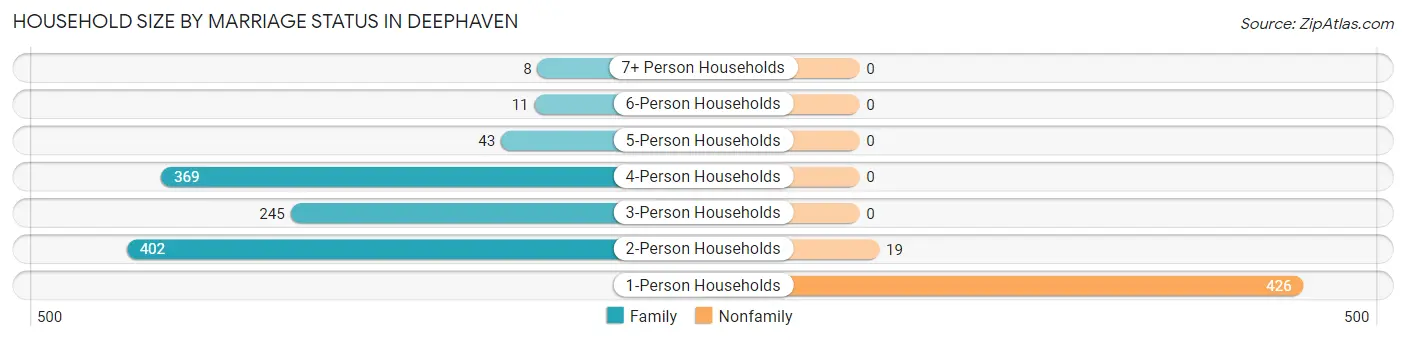
| Household Size | Family Households | Nonfamily Households |
| 1-Person Households | - | 426 (28.0%) |
| 2-Person Households | 402 (26.4%) | 19 (1.3%) |
| 3-Person Households | 245 (16.1%) | 0 (0.0%) |
| 4-Person Households | 369 (24.2%) | 0 (0.0%) |
| 5-Person Households | 43 (2.8%) | 0 (0.0%) |
| 6-Person Households | 11 (0.7%) | 0 (0.0%) |
| 7+ Person Households | 8 (0.5%) | 0 (0.0%) |
| Total | 1,078 (70.8%) | 445 (29.2%) |
Female Fertility in Deephaven
Fertility by Age in Deephaven
Average fertility rate in Deephaven is 36.0 births per 1,000 women. Women in the age bracket of 35 to 50 years have the highest fertility rate with 44.0 births per 1,000 women. Women in the age bracket of 35 to 50 years acount for 76.0% of all women with births.
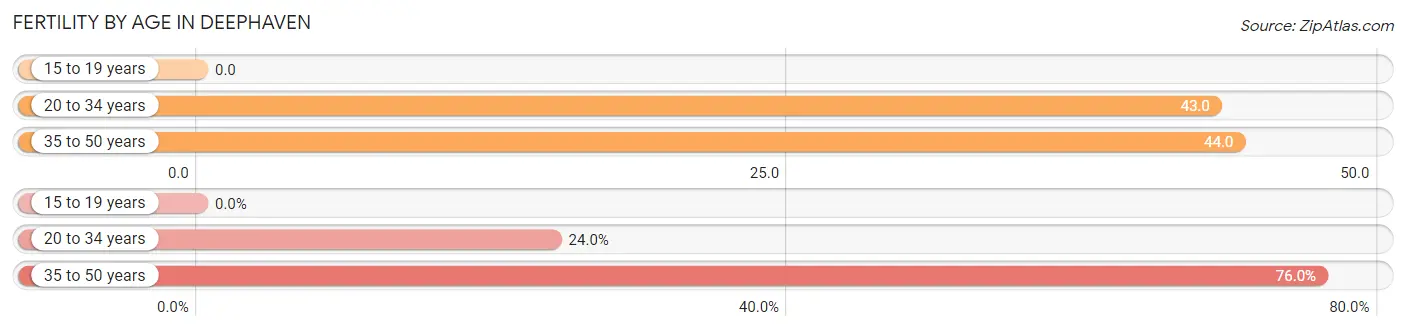
| Age Bracket | Women with Births | Births / 1,000 Women |
| 15 to 19 years | 0 (0.0%) | 0.0 |
| 20 to 34 years | 6 (24.0%) | 43.0 |
| 35 to 50 years | 19 (76.0%) | 44.0 |
| Total | 25 (100.0%) | 36.0 |
Fertility by Age by Marriage Status in Deephaven
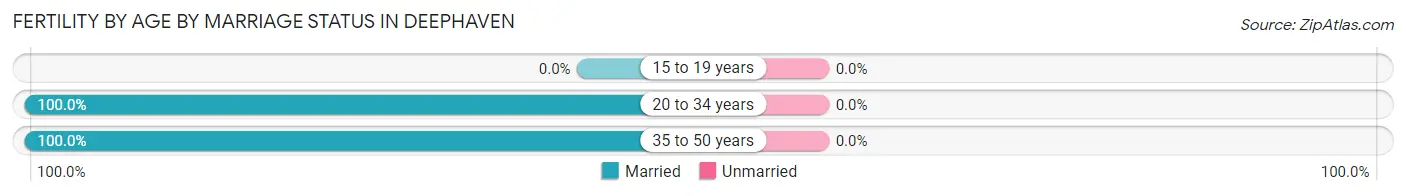
| Age Bracket | Married | Unmarried |
| 15 to 19 years | 0 (0.0%) | 0 (0.0%) |
| 20 to 34 years | 6 (100.0%) | 0 (0.0%) |
| 35 to 50 years | 19 (100.0%) | 0 (0.0%) |
| Total | 25 (100.0%) | 0 (0.0%) |
Fertility by Education in Deephaven
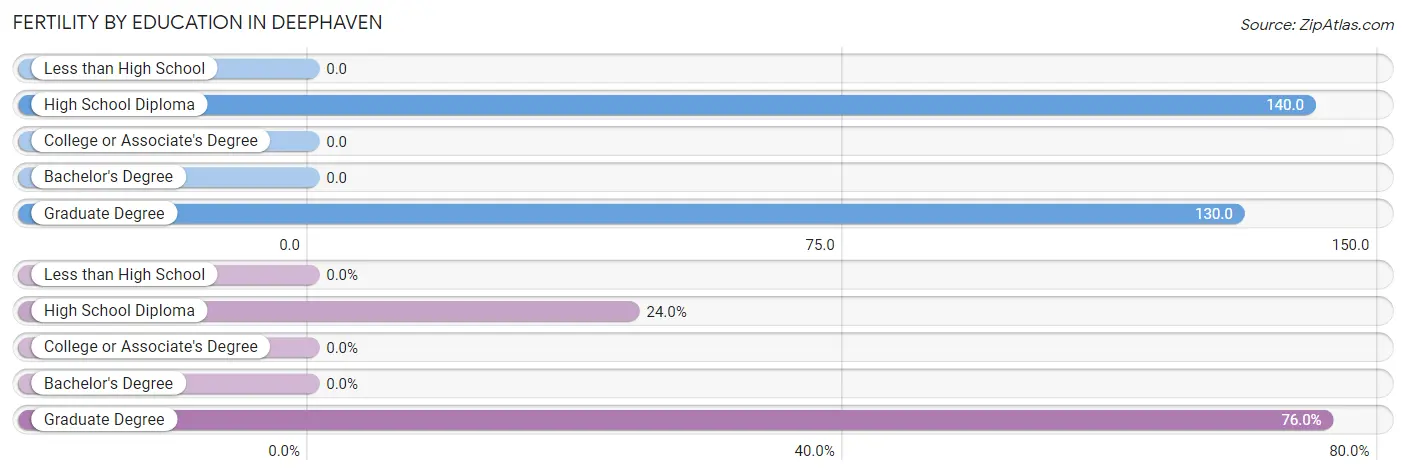
| Educational Attainment | Women with Births | Births / 1,000 Women |
| Less than High School | 0 (0.0%) | 0.0 |
| High School Diploma | 6 (24.0%) | 140.0 |
| College or Associate's Degree | 0 (0.0%) | 0.0 |
| Bachelor's Degree | 0 (0.0%) | 0.0 |
| Graduate Degree | 19 (76.0%) | 130.0 |
| Total | 25 (100.0%) | 36.0 |
Fertility by Education by Marriage Status in Deephaven
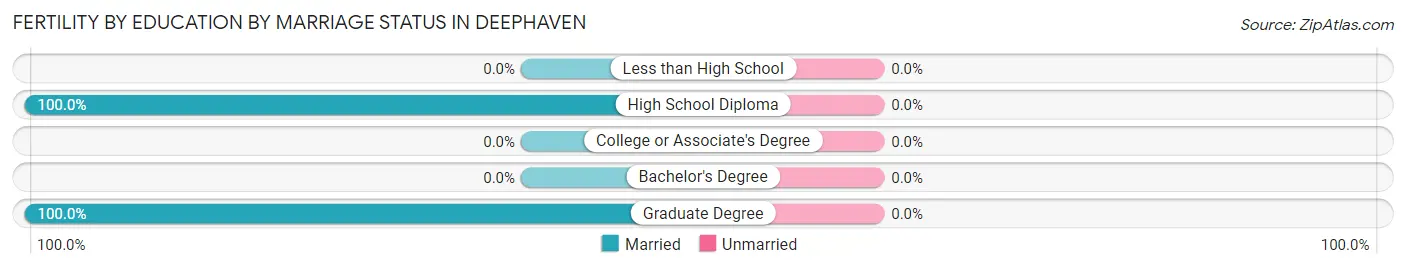
| Educational Attainment | Married | Unmarried |
| Less than High School | 0 (0.0%) | 0 (0.0%) |
| High School Diploma | 6 (100.0%) | 0 (0.0%) |
| College or Associate's Degree | 0 (0.0%) | 0 (0.0%) |
| Bachelor's Degree | 0 (0.0%) | 0 (0.0%) |
| Graduate Degree | 19 (100.0%) | 0 (0.0%) |
| Total | 25 (100.0%) | 0 (0.0%) |
Employment Characteristics in Deephaven
Employment by Class of Employer in Deephaven
Among the 1,801 employed individuals in Deephaven, private company employees (1,059 | 58.8%), self-employed (not incorporated) (251 | 13.9%), and not-for-profit organizations (177 | 9.8%) make up the most common classes of employment.
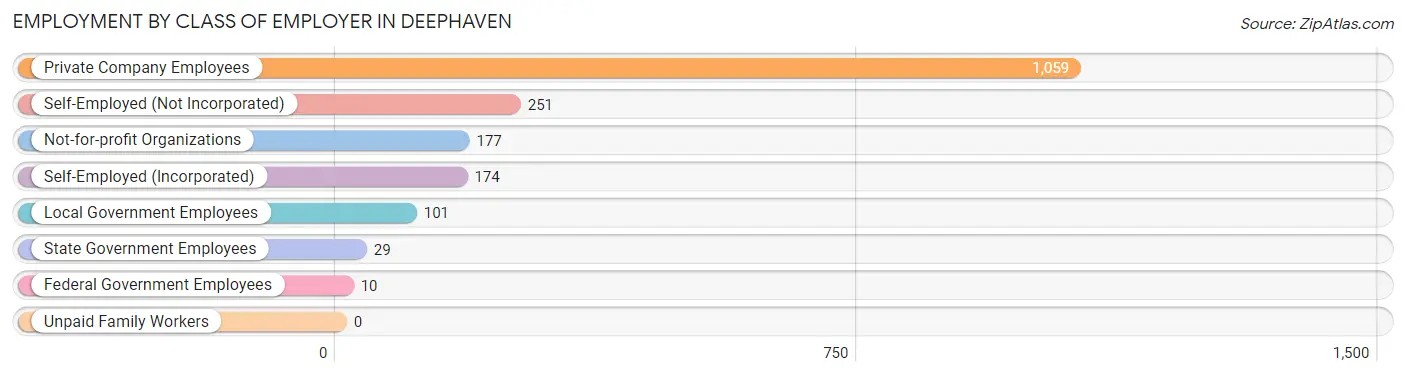
| Employer Class | # Employees | % Employees |
| Private Company Employees | 1,059 | 58.8% |
| Self-Employed (Incorporated) | 174 | 9.7% |
| Self-Employed (Not Incorporated) | 251 | 13.9% |
| Not-for-profit Organizations | 177 | 9.8% |
| Local Government Employees | 101 | 5.6% |
| State Government Employees | 29 | 1.6% |
| Federal Government Employees | 10 | 0.6% |
| Unpaid Family Workers | 0 | 0.0% |
| Total | 1,801 | 100.0% |
Employment Status by Age in Deephaven
According to the labor force statistics for Deephaven, out of the total population over 16 years of age (3,057), 59.8% or 1,828 individuals are in the labor force, with 1.4% or 26 of them unemployed. The age group with the highest labor force participation rate is 30 to 34 years, with 88.0% or 95 individuals in the labor force. Within the labor force, the 20 to 24 years age range has the highest percentage of unemployed individuals, with 100.0% or 16 of them being unemployed.
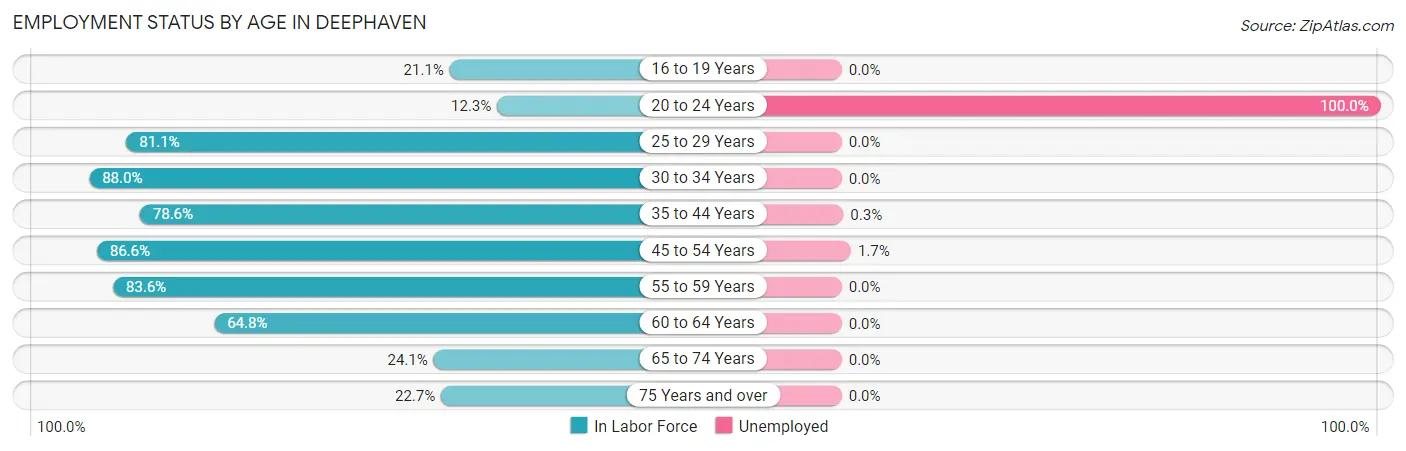
| Age Bracket | In Labor Force | Unemployed |
| 16 to 19 Years | 52 (21.1%) | 0 (0.0%) |
| 20 to 24 Years | 16 (12.3%) | 16 (100.0%) |
| 25 to 29 Years | 60 (81.1%) | 0 (0.0%) |
| 30 to 34 Years | 95 (88.0%) | 0 (0.0%) |
| 35 to 44 Years | 394 (78.6%) | 1 (0.3%) |
| 45 to 54 Years | 516 (86.6%) | 9 (1.7%) |
| 55 to 59 Years | 368 (83.6%) | 0 (0.0%) |
| 60 to 64 Years | 158 (64.8%) | 0 (0.0%) |
| 65 to 74 Years | 85 (24.1%) | 0 (0.0%) |
| 75 Years and over | 83 (22.7%) | 0 (0.0%) |
| Total | 1,828 (59.8%) | 26 (1.4%) |
Employment Status by Educational Attainment in Deephaven
According to labor force statistics for Deephaven, 81.0% of individuals (1,590) out of the total population between 25 and 64 years of age (1,963) are in the labor force, with 0.6% or 10 of them being unemployed. The group with the highest labor force participation rate are those with the educational attainment of college / associate degree, with 89.7% or 270 individuals in the labor force. Within the labor force, individuals with less than high school education have the highest percentage of unemployment, with 4.5% or 1 of them being unemployed.
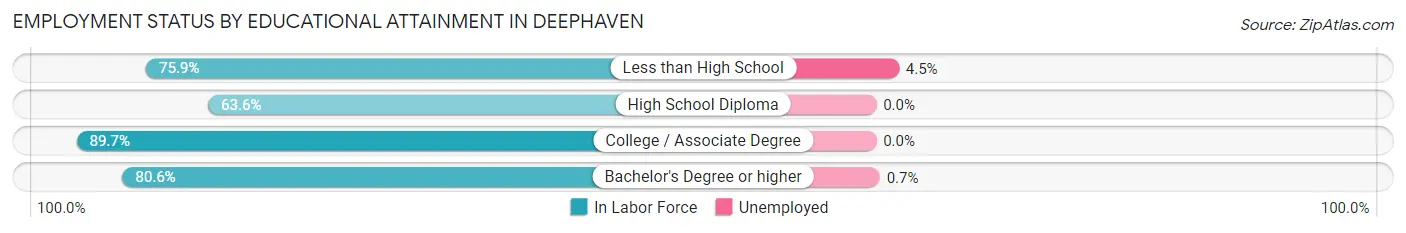
| Educational Attainment | In Labor Force | Unemployed |
| Less than High School | 22 (75.9%) | 1 (4.5%) |
| High School Diploma | 63 (63.6%) | 0 (0.0%) |
| College / Associate Degree | 270 (89.7%) | 0 (0.0%) |
| Bachelor's Degree or higher | 1,236 (80.6%) | 11 (0.7%) |
| Total | 1,590 (81.0%) | 12 (0.6%) |
Employment Occupations by Sex in Deephaven
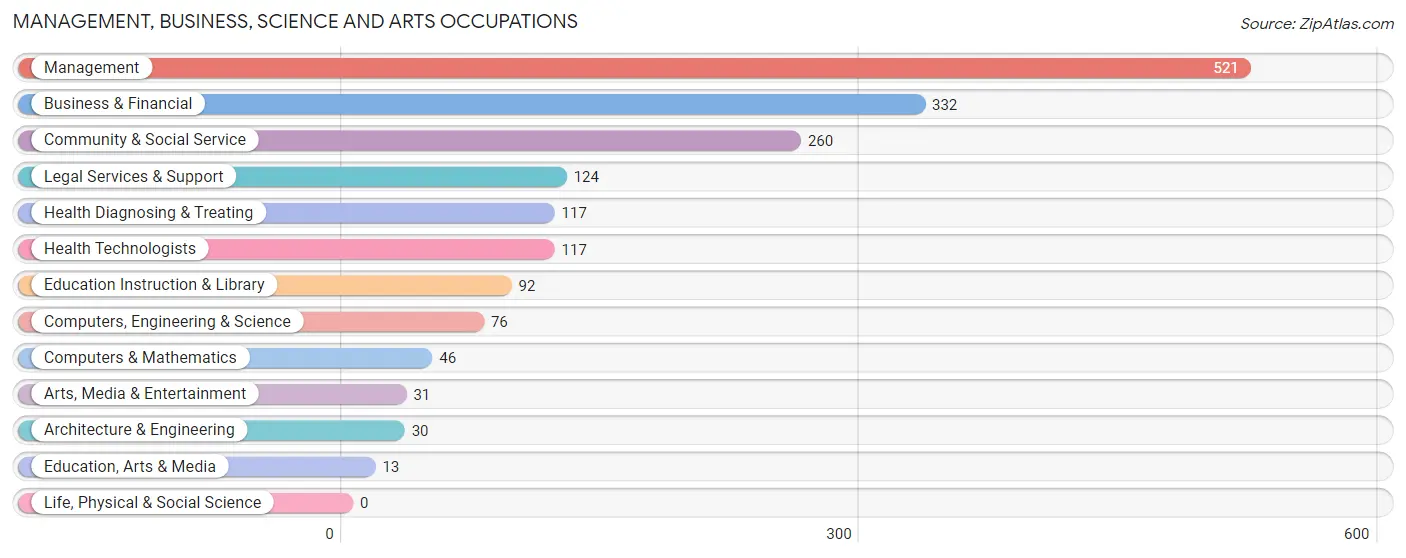
Management, Business, Science and Arts Occupations
The most common Management, Business, Science and Arts occupations in Deephaven are Management (521 | 28.9%), Business & Financial (332 | 18.4%), Community & Social Service (260 | 14.4%), Legal Services & Support (124 | 6.9%), and Health Diagnosing & Treating (117 | 6.5%).
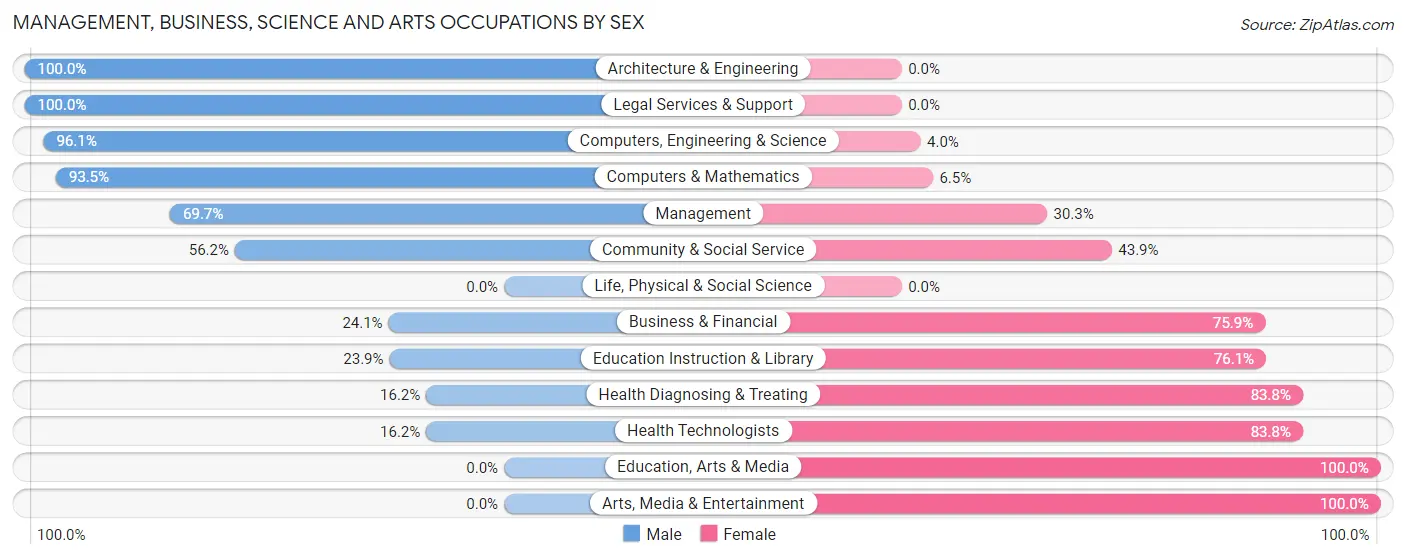
Management, Business, Science and Arts Occupations by Sex
Within the Management, Business, Science and Arts occupations in Deephaven, the most male-oriented occupations are Architecture & Engineering (100.0%), Legal Services & Support (100.0%), and Computers, Engineering & Science (96.1%), while the most female-oriented occupations are Education, Arts & Media (100.0%), Arts, Media & Entertainment (100.0%), and Health Diagnosing & Treating (83.8%).
| Occupation | Male | Female |
| Management | 363 (69.7%) | 158 (30.3%) |
| Business & Financial | 80 (24.1%) | 252 (75.9%) |
| Computers, Engineering & Science | 73 (96.1%) | 3 (4.0%) |
| Computers & Mathematics | 43 (93.5%) | 3 (6.5%) |
| Architecture & Engineering | 30 (100.0%) | 0 (0.0%) |
| Life, Physical & Social Science | 0 (0.0%) | 0 (0.0%) |
| Community & Social Service | 146 (56.1%) | 114 (43.9%) |
| Education, Arts & Media | 0 (0.0%) | 13 (100.0%) |
| Legal Services & Support | 124 (100.0%) | 0 (0.0%) |
| Education Instruction & Library | 22 (23.9%) | 70 (76.1%) |
| Arts, Media & Entertainment | 0 (0.0%) | 31 (100.0%) |
| Health Diagnosing & Treating | 19 (16.2%) | 98 (83.8%) |
| Health Technologists | 19 (16.2%) | 98 (83.8%) |
| Total (Category) | 681 (52.1%) | 625 (47.9%) |
| Total (Overall) | 1,007 (55.9%) | 794 (44.1%) |
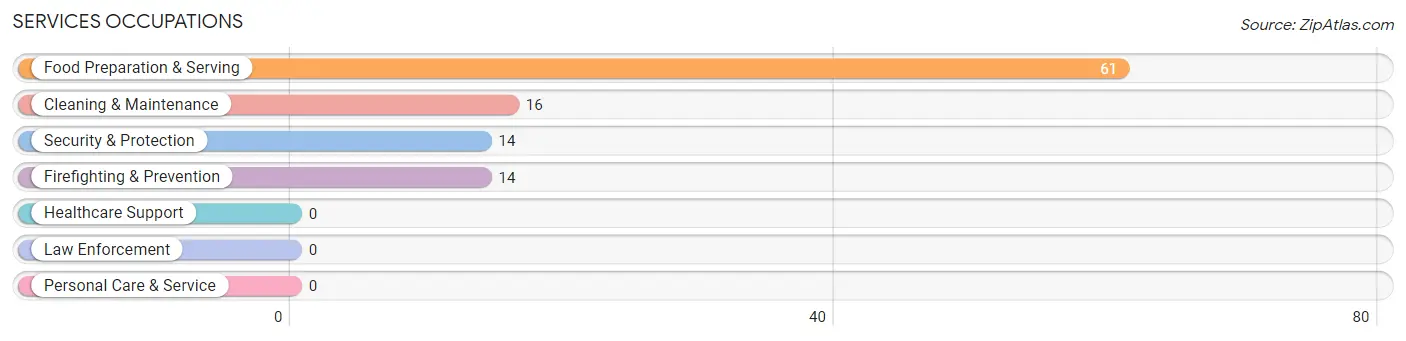
Services Occupations
The most common Services occupations in Deephaven are Food Preparation & Serving (61 | 3.4%), Cleaning & Maintenance (16 | 0.9%), Security & Protection (14 | 0.8%), and Firefighting & Prevention (14 | 0.8%).
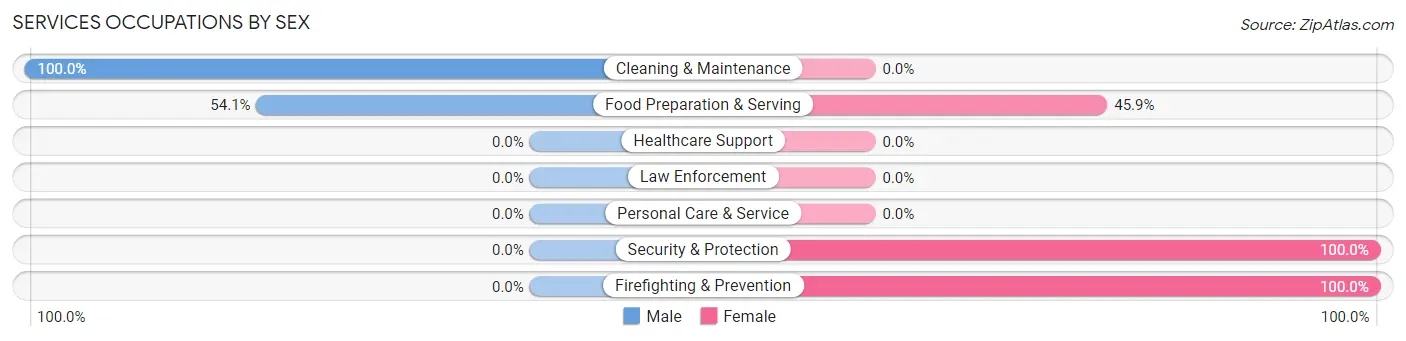
Services Occupations by Sex
Within the Services occupations in Deephaven, the most male-oriented occupations are Cleaning & Maintenance (100.0%), and Food Preparation & Serving (54.1%), while the most female-oriented occupations are Security & Protection (100.0%), Firefighting & Prevention (100.0%), and Food Preparation & Serving (45.9%).
| Occupation | Male | Female |
| Healthcare Support | 0 (0.0%) | 0 (0.0%) |
| Security & Protection | 0 (0.0%) | 14 (100.0%) |
| Firefighting & Prevention | 0 (0.0%) | 14 (100.0%) |
| Law Enforcement | 0 (0.0%) | 0 (0.0%) |
| Food Preparation & Serving | 33 (54.1%) | 28 (45.9%) |
| Cleaning & Maintenance | 16 (100.0%) | 0 (0.0%) |
| Personal Care & Service | 0 (0.0%) | 0 (0.0%) |
| Total (Category) | 49 (53.8%) | 42 (46.2%) |
| Total (Overall) | 1,007 (55.9%) | 794 (44.1%) |
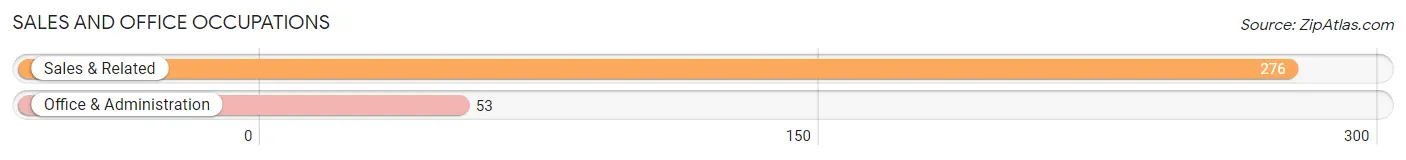
Sales and Office Occupations
The most common Sales and Office occupations in Deephaven are Sales & Related (276 | 15.3%), and Office & Administration (53 | 2.9%).
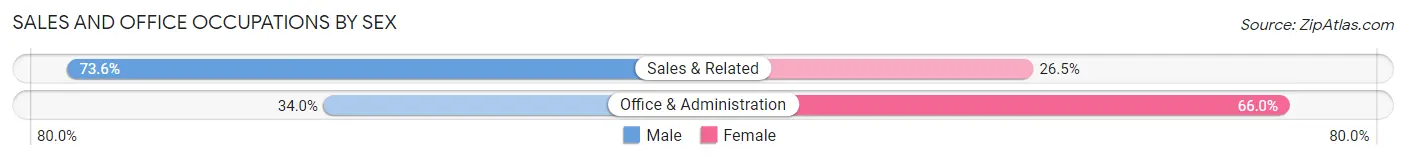
Sales and Office Occupations by Sex
| Occupation | Male | Female |
| Sales & Related | 203 (73.6%) | 73 (26.5%) |
| Office & Administration | 18 (34.0%) | 35 (66.0%) |
| Total (Category) | 221 (67.2%) | 108 (32.8%) |
| Total (Overall) | 1,007 (55.9%) | 794 (44.1%) |
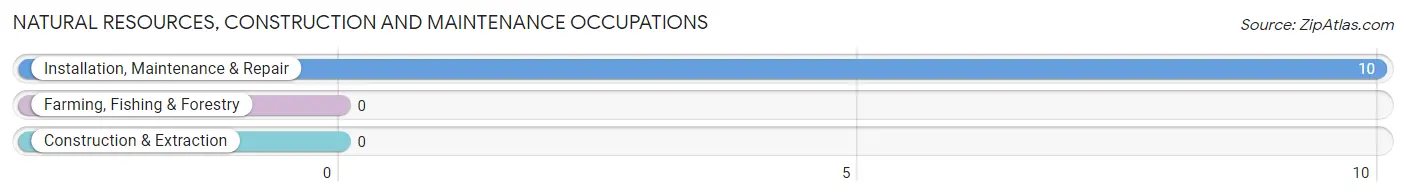
Natural Resources, Construction and Maintenance Occupations
The most common Natural Resources, Construction and Maintenance occupations in Deephaven are , and Installation, Maintenance & Repair (10 | 0.6%).
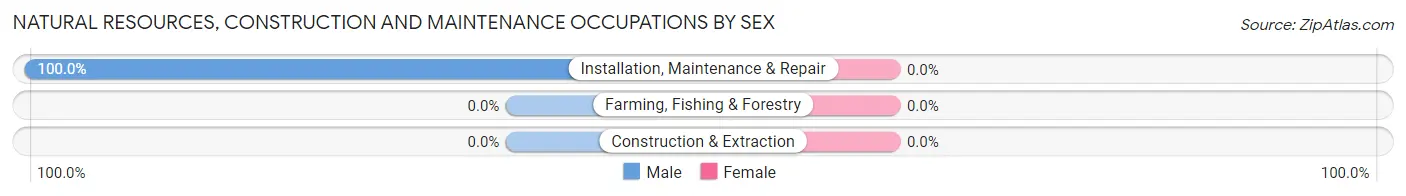
Natural Resources, Construction and Maintenance Occupations by Sex
| Occupation | Male | Female |
| Farming, Fishing & Forestry | 0 (0.0%) | 0 (0.0%) |
| Construction & Extraction | 0 (0.0%) | 0 (0.0%) |
| Installation, Maintenance & Repair | 10 (100.0%) | 0 (0.0%) |
| Total (Category) | 10 (100.0%) | 0 (0.0%) |
| Total (Overall) | 1,007 (55.9%) | 794 (44.1%) |
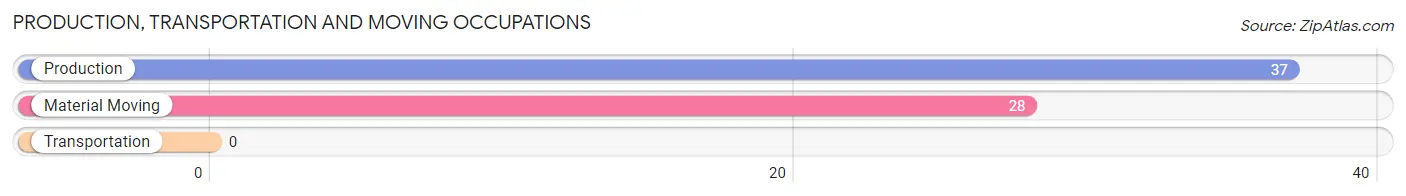
Production, Transportation and Moving Occupations
The most common Production, Transportation and Moving occupations in Deephaven are Production (37 | 2.1%), and Material Moving (28 | 1.5%).
Production, Transportation and Moving Occupations by Sex
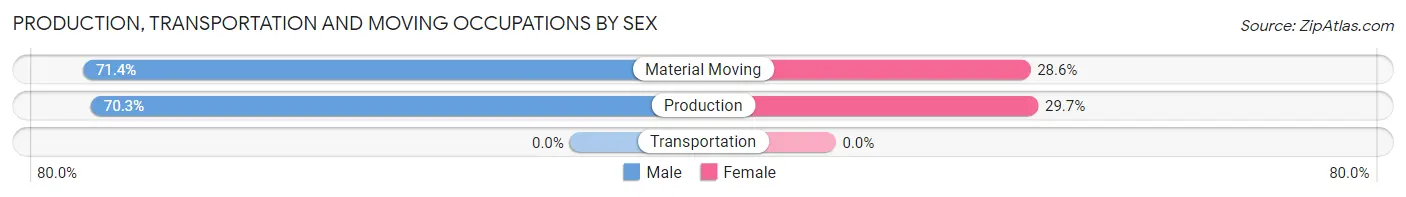
| Occupation | Male | Female |
| Production | 26 (70.3%) | 11 (29.7%) |
| Transportation | 0 (0.0%) | 0 (0.0%) |
| Material Moving | 20 (71.4%) | 8 (28.6%) |
| Total (Category) | 46 (70.8%) | 19 (29.2%) |
| Total (Overall) | 1,007 (55.9%) | 794 (44.1%) |
Employment Industries by Sex in Deephaven
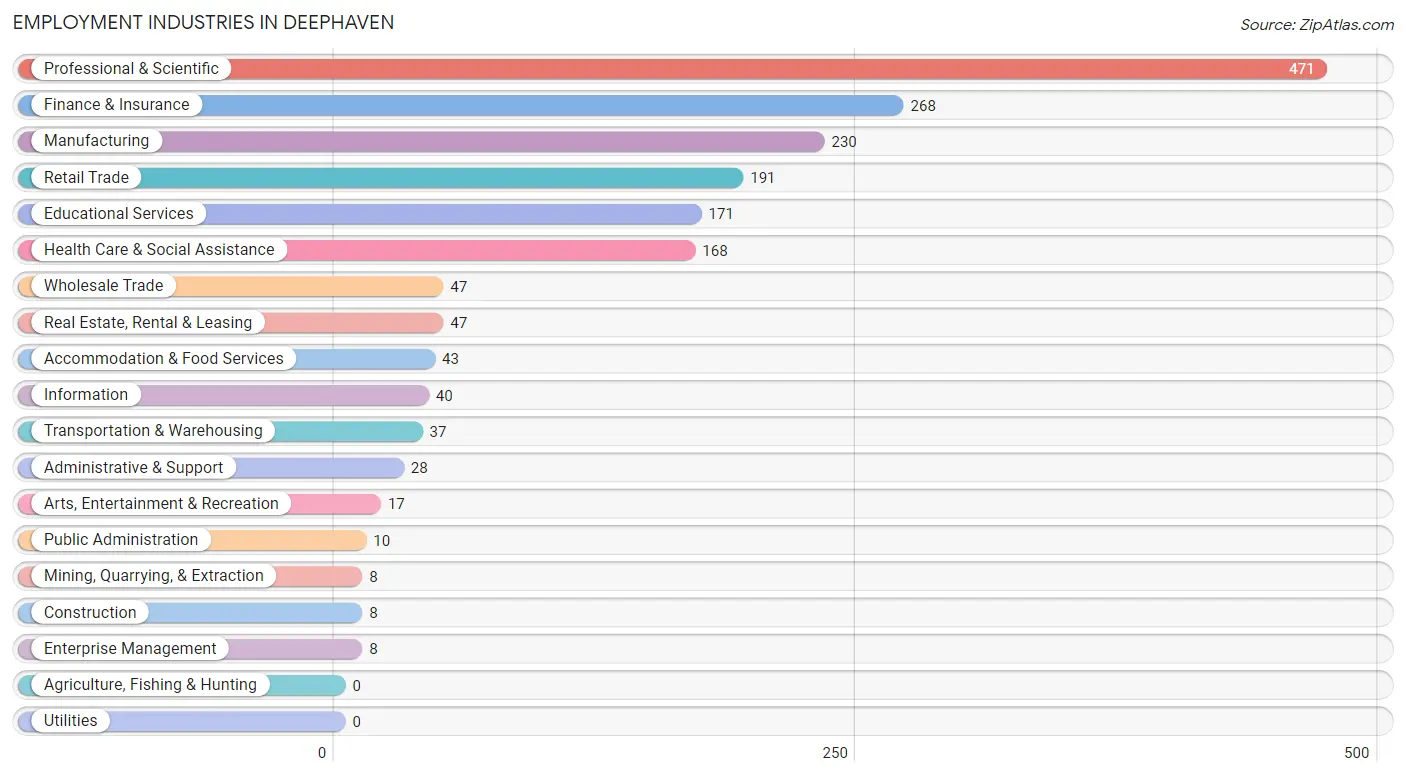
Employment Industries in Deephaven
The major employment industries in Deephaven include Professional & Scientific (471 | 26.2%), Finance & Insurance (268 | 14.9%), Manufacturing (230 | 12.8%), Retail Trade (191 | 10.6%), and Educational Services (171 | 9.5%).
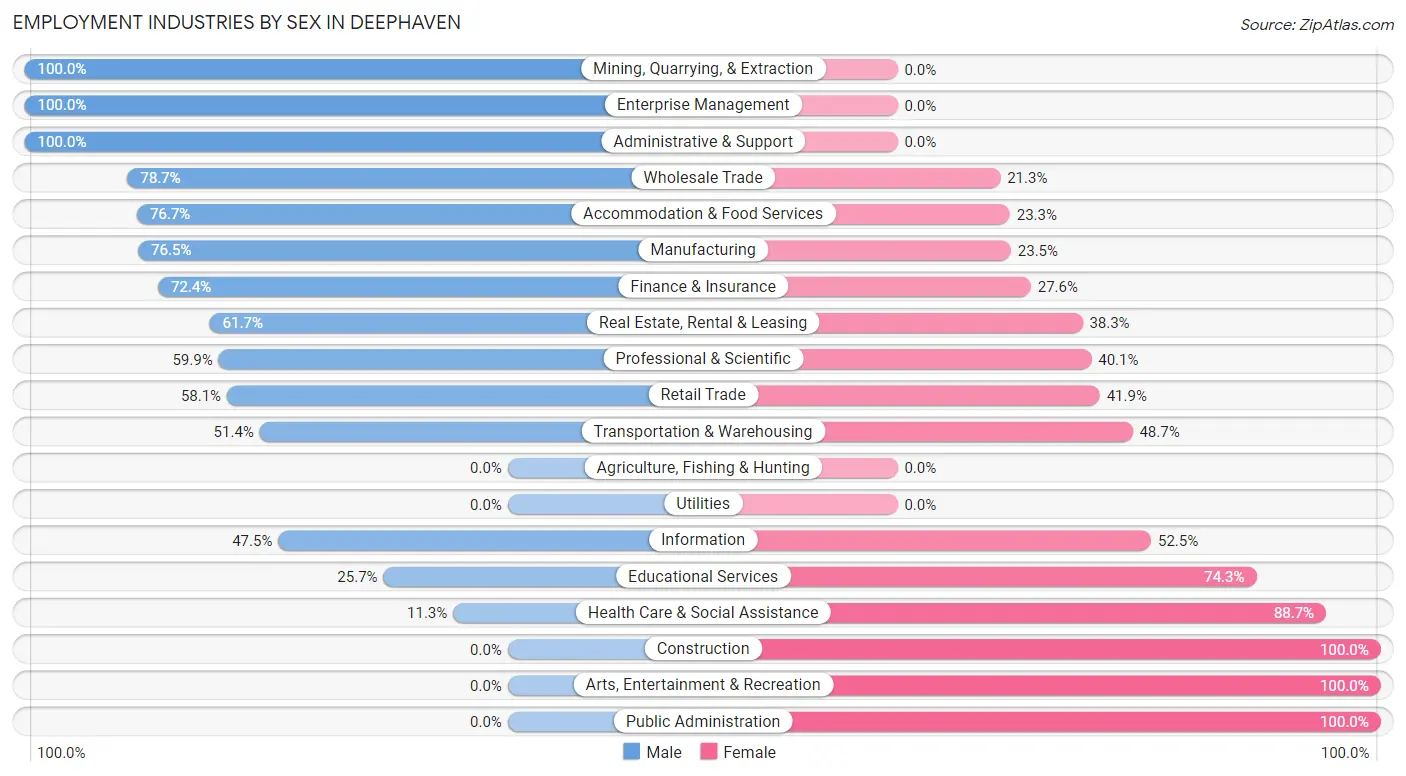
Employment Industries by Sex in Deephaven
The Deephaven industries that see more men than women are Mining, Quarrying, & Extraction (100.0%), Enterprise Management (100.0%), and Administrative & Support (100.0%), whereas the industries that tend to have a higher number of women are Construction (100.0%), Arts, Entertainment & Recreation (100.0%), and Public Administration (100.0%).
| Industry | Male | Female |
| Agriculture, Fishing & Hunting | 0 (0.0%) | 0 (0.0%) |
| Mining, Quarrying, & Extraction | 8 (100.0%) | 0 (0.0%) |
| Construction | 0 (0.0%) | 8 (100.0%) |
| Manufacturing | 176 (76.5%) | 54 (23.5%) |
| Wholesale Trade | 37 (78.7%) | 10 (21.3%) |
| Retail Trade | 111 (58.1%) | 80 (41.9%) |
| Transportation & Warehousing | 19 (51.3%) | 18 (48.6%) |
| Utilities | 0 (0.0%) | 0 (0.0%) |
| Information | 19 (47.5%) | 21 (52.5%) |
| Finance & Insurance | 194 (72.4%) | 74 (27.6%) |
| Real Estate, Rental & Leasing | 29 (61.7%) | 18 (38.3%) |
| Professional & Scientific | 282 (59.9%) | 189 (40.1%) |
| Enterprise Management | 8 (100.0%) | 0 (0.0%) |
| Administrative & Support | 28 (100.0%) | 0 (0.0%) |
| Educational Services | 44 (25.7%) | 127 (74.3%) |
| Health Care & Social Assistance | 19 (11.3%) | 149 (88.7%) |
| Arts, Entertainment & Recreation | 0 (0.0%) | 17 (100.0%) |
| Accommodation & Food Services | 33 (76.7%) | 10 (23.3%) |
| Public Administration | 0 (0.0%) | 10 (100.0%) |
| Total | 1,007 (55.9%) | 794 (44.1%) |
Education in Deephaven
School Enrollment in Deephaven
The most common levels of schooling among the 1,072 students in Deephaven are high school (318 | 29.7%), middle school (214 | 20.0%), and elementary school (209 | 19.5%).
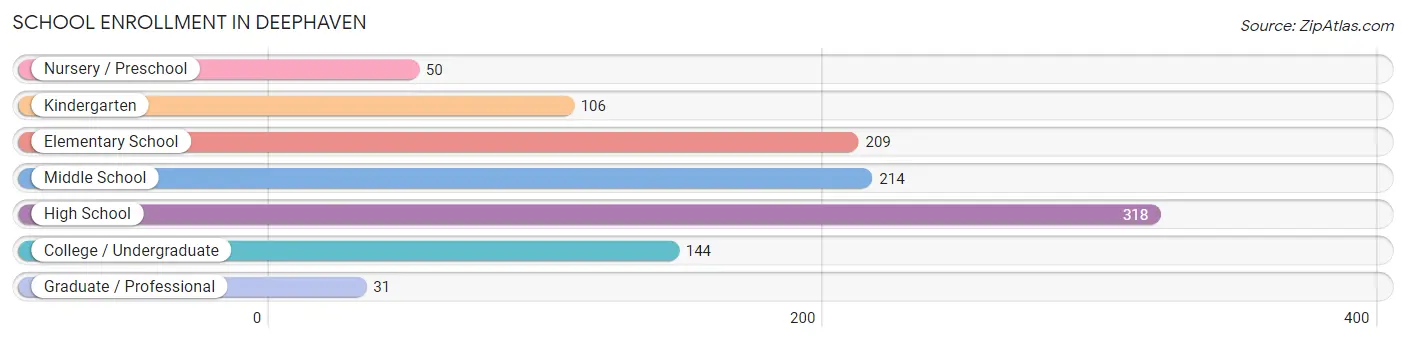
| School Level | # Students | % Students |
| Nursery / Preschool | 50 | 4.7% |
| Kindergarten | 106 | 9.9% |
| Elementary School | 209 | 19.5% |
| Middle School | 214 | 20.0% |
| High School | 318 | 29.7% |
| College / Undergraduate | 144 | 13.4% |
| Graduate / Professional | 31 | 2.9% |
| Total | 1,072 | 100.0% |
School Enrollment by Age by Funding Source in Deephaven
Out of a total of 1,072 students who are enrolled in schools in Deephaven, 219 (20.4%) attend a private institution, while the remaining 853 (79.6%) are enrolled in public schools. The age group of 25 to 34 year olds has the highest likelihood of being enrolled in private schools, with 10 (100.0% in the age bracket) enrolled. Conversely, the age group of 20 to 24 year olds has the lowest likelihood of being enrolled in a private school, with 108 (100.0% in the age bracket) attending a public institution.
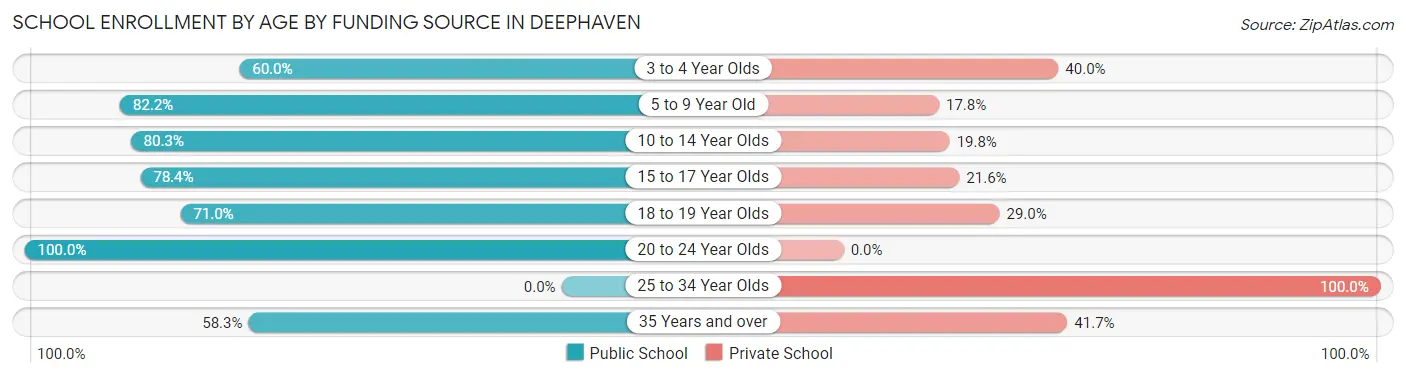
| Age Bracket | Public School | Private School |
| 3 to 4 Year Olds | 24 (60.0%) | 16 (40.0%) |
| 5 to 9 Year Old | 250 (82.2%) | 54 (17.8%) |
| 10 to 14 Year Olds | 195 (80.2%) | 48 (19.8%) |
| 15 to 17 Year Olds | 211 (78.4%) | 58 (21.6%) |
| 18 to 19 Year Olds | 44 (71.0%) | 18 (29.0%) |
| 20 to 24 Year Olds | 108 (100.0%) | 0 (0.0%) |
| 25 to 34 Year Olds | 0 (0.0%) | 10 (100.0%) |
| 35 Years and over | 21 (58.3%) | 15 (41.7%) |
| Total | 853 (79.6%) | 219 (20.4%) |
Educational Attainment by Field of Study in Deephaven
Business (557 | 24.5%), social sciences (295 | 13.0%), science & technology (257 | 11.3%), literature & languages (156 | 6.9%), and psychology (150 | 6.6%) are the most common fields of study among 2,272 individuals in Deephaven who have obtained a bachelor's degree or higher.
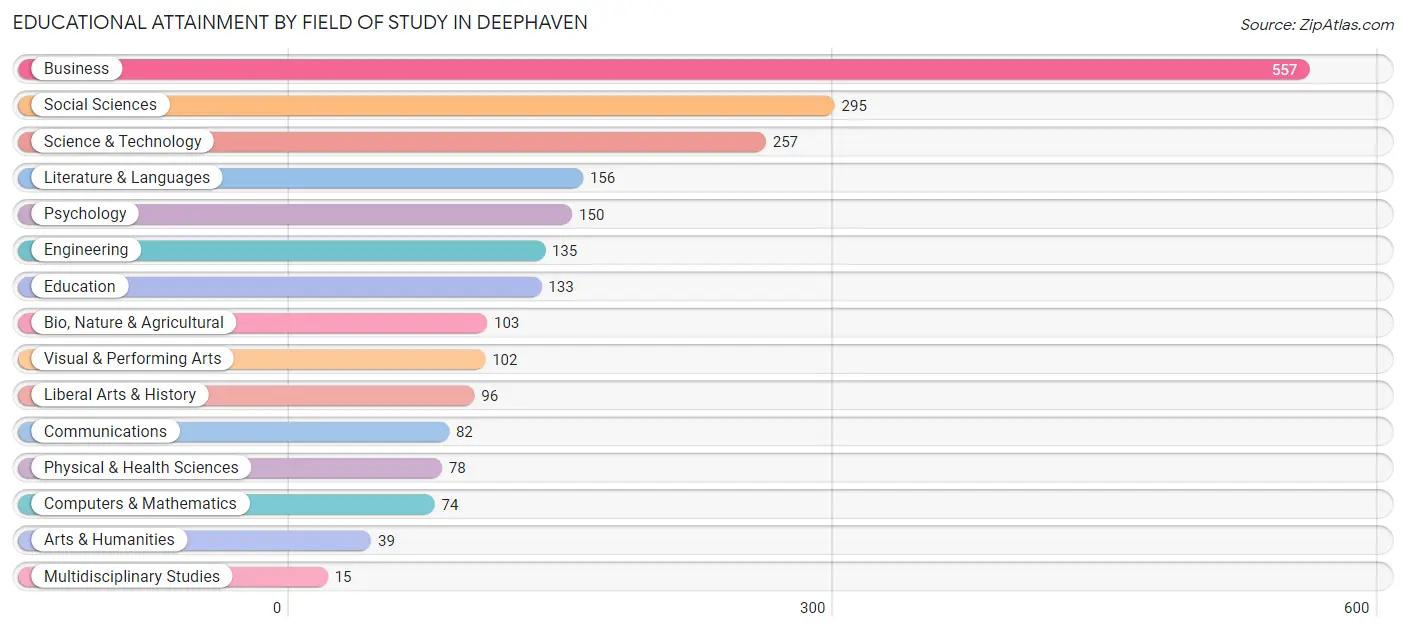
| Field of Study | # Graduates | % Graduates |
| Computers & Mathematics | 74 | 3.3% |
| Bio, Nature & Agricultural | 103 | 4.5% |
| Physical & Health Sciences | 78 | 3.4% |
| Psychology | 150 | 6.6% |
| Social Sciences | 295 | 13.0% |
| Engineering | 135 | 5.9% |
| Multidisciplinary Studies | 15 | 0.7% |
| Science & Technology | 257 | 11.3% |
| Business | 557 | 24.5% |
| Education | 133 | 5.9% |
| Literature & Languages | 156 | 6.9% |
| Liberal Arts & History | 96 | 4.2% |
| Visual & Performing Arts | 102 | 4.5% |
| Communications | 82 | 3.6% |
| Arts & Humanities | 39 | 1.7% |
| Total | 2,272 | 100.0% |
Transportation & Commute in Deephaven
Vehicle Availability by Sex in Deephaven
The most prevalent vehicle ownership categories in Deephaven are males with 3 vehicles (437, accounting for 43.4%) and females with 3 vehicles (386, making up 55.1%).
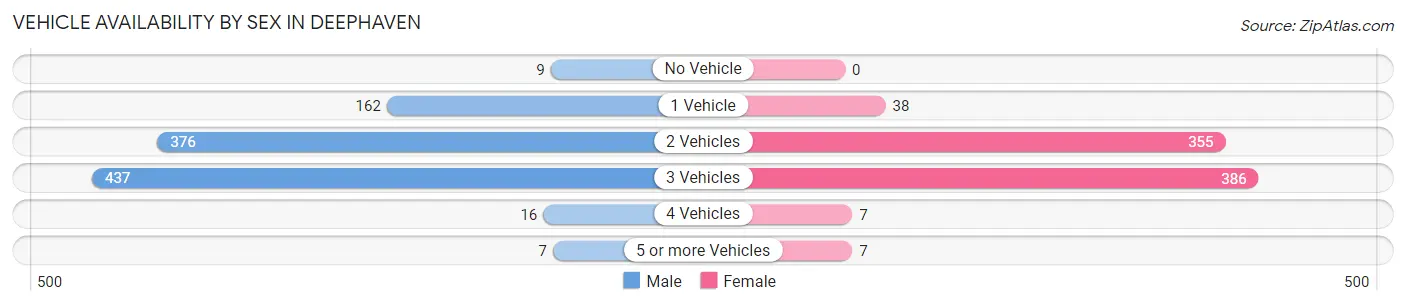
| Vehicles Available | Male | Female |
| No Vehicle | 9 (0.9%) | 0 (0.0%) |
| 1 Vehicle | 162 (16.1%) | 38 (4.8%) |
| 2 Vehicles | 376 (37.3%) | 355 (44.8%) |
| 3 Vehicles | 437 (43.4%) | 386 (48.7%) |
| 4 Vehicles | 16 (1.6%) | 7 (0.9%) |
| 5 or more Vehicles | 7 (0.7%) | 7 (0.9%) |
| Total | 1,007 (100.0%) | 793 (100.0%) |
Commute Time in Deephaven
The most frequently occuring commute durations in Deephaven are 15 to 19 minutes (268 commuters, 22.2%), 20 to 24 minutes (244 commuters, 20.2%), and 25 to 29 minutes (189 commuters, 15.7%).
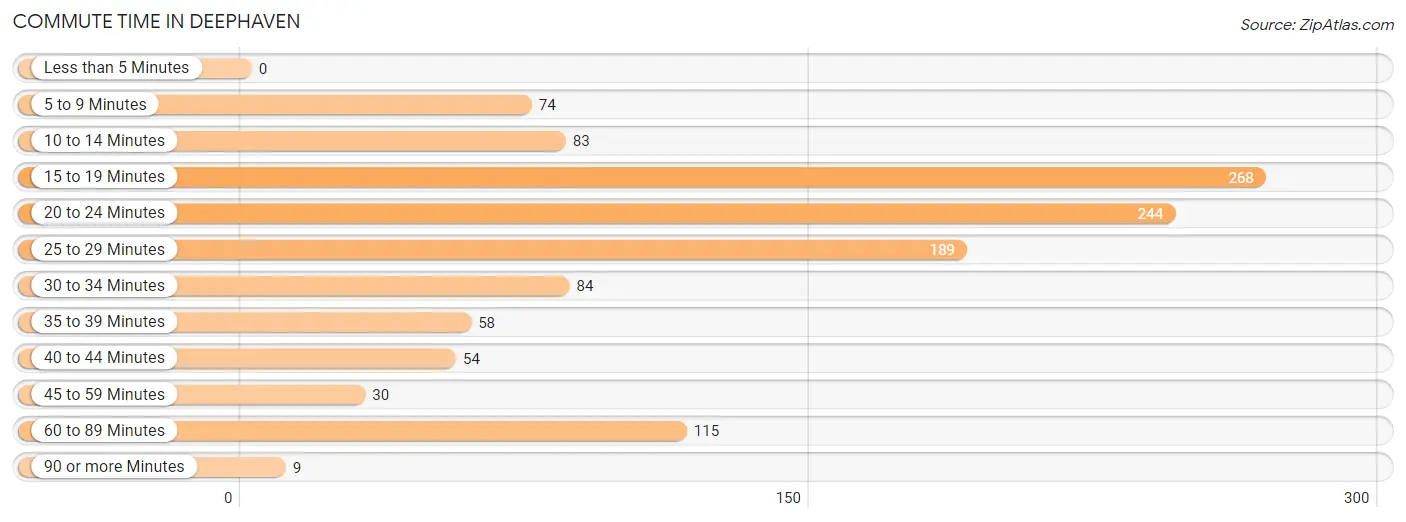
| Commute Time | # Commuters | % Commuters |
| Less than 5 Minutes | 0 | 0.0% |
| 5 to 9 Minutes | 74 | 6.1% |
| 10 to 14 Minutes | 83 | 6.9% |
| 15 to 19 Minutes | 268 | 22.2% |
| 20 to 24 Minutes | 244 | 20.2% |
| 25 to 29 Minutes | 189 | 15.7% |
| 30 to 34 Minutes | 84 | 7.0% |
| 35 to 39 Minutes | 58 | 4.8% |
| 40 to 44 Minutes | 54 | 4.5% |
| 45 to 59 Minutes | 30 | 2.5% |
| 60 to 89 Minutes | 115 | 9.5% |
| 90 or more Minutes | 9 | 0.7% |
Commute Time by Sex in Deephaven
The most common commute times in Deephaven are 20 to 24 minutes (176 commuters, 23.7%) for males and 15 to 19 minutes (132 commuters, 28.3%) for females.
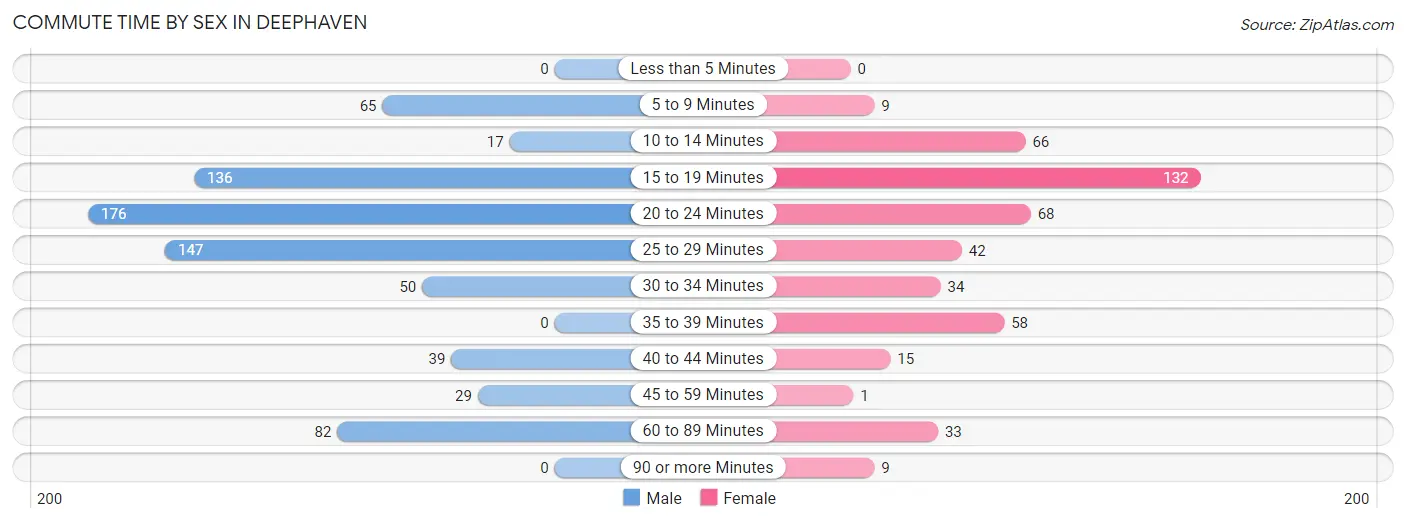
| Commute Time | Male | Female |
| Less than 5 Minutes | 0 (0.0%) | 0 (0.0%) |
| 5 to 9 Minutes | 65 (8.8%) | 9 (1.9%) |
| 10 to 14 Minutes | 17 (2.3%) | 66 (14.1%) |
| 15 to 19 Minutes | 136 (18.3%) | 132 (28.3%) |
| 20 to 24 Minutes | 176 (23.7%) | 68 (14.6%) |
| 25 to 29 Minutes | 147 (19.8%) | 42 (9.0%) |
| 30 to 34 Minutes | 50 (6.8%) | 34 (7.3%) |
| 35 to 39 Minutes | 0 (0.0%) | 58 (12.4%) |
| 40 to 44 Minutes | 39 (5.3%) | 15 (3.2%) |
| 45 to 59 Minutes | 29 (3.9%) | 1 (0.2%) |
| 60 to 89 Minutes | 82 (11.1%) | 33 (7.1%) |
| 90 or more Minutes | 0 (0.0%) | 9 (1.9%) |
Time of Departure to Work by Sex in Deephaven
The most frequent times of departure to work in Deephaven are 7:00 AM to 7:29 AM (160, 21.6%) for males and 7:30 AM to 7:59 AM (127, 27.2%) for females.
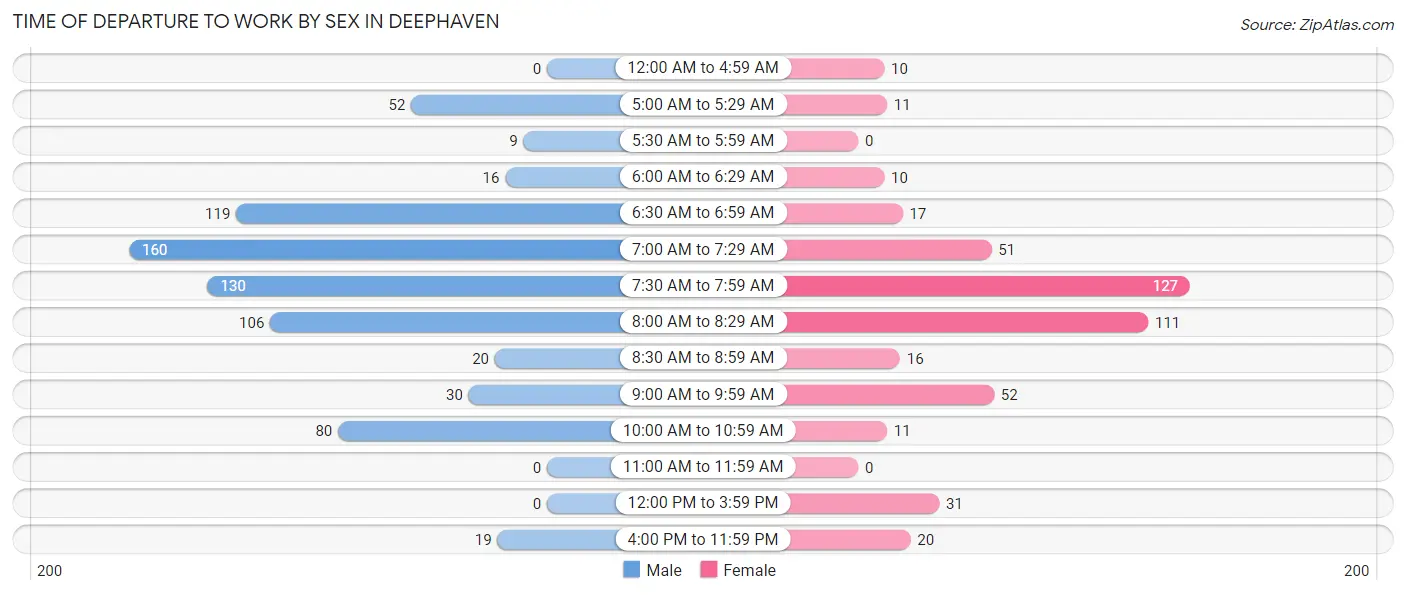
| Time of Departure | Male | Female |
| 12:00 AM to 4:59 AM | 0 (0.0%) | 10 (2.1%) |
| 5:00 AM to 5:29 AM | 52 (7.0%) | 11 (2.4%) |
| 5:30 AM to 5:59 AM | 9 (1.2%) | 0 (0.0%) |
| 6:00 AM to 6:29 AM | 16 (2.2%) | 10 (2.1%) |
| 6:30 AM to 6:59 AM | 119 (16.1%) | 17 (3.6%) |
| 7:00 AM to 7:29 AM | 160 (21.6%) | 51 (10.9%) |
| 7:30 AM to 7:59 AM | 130 (17.5%) | 127 (27.2%) |
| 8:00 AM to 8:29 AM | 106 (14.3%) | 111 (23.8%) |
| 8:30 AM to 8:59 AM | 20 (2.7%) | 16 (3.4%) |
| 9:00 AM to 9:59 AM | 30 (4.1%) | 52 (11.1%) |
| 10:00 AM to 10:59 AM | 80 (10.8%) | 11 (2.4%) |
| 11:00 AM to 11:59 AM | 0 (0.0%) | 0 (0.0%) |
| 12:00 PM to 3:59 PM | 0 (0.0%) | 31 (6.6%) |
| 4:00 PM to 11:59 PM | 19 (2.6%) | 20 (4.3%) |
| Total | 741 (100.0%) | 467 (100.0%) |
Housing Occupancy in Deephaven
Occupancy by Ownership in Deephaven
Of the total 1,523 dwellings in Deephaven, owner-occupied units account for 1,346 (88.4%), while renter-occupied units make up 177 (11.6%).
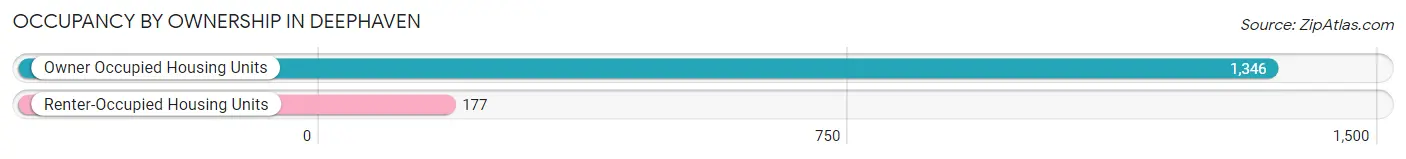
| Occupancy | # Housing Units | % Housing Units |
| Owner Occupied Housing Units | 1,346 | 88.4% |
| Renter-Occupied Housing Units | 177 | 11.6% |
| Total Occupied Housing Units | 1,523 | 100.0% |
Occupancy by Household Size in Deephaven
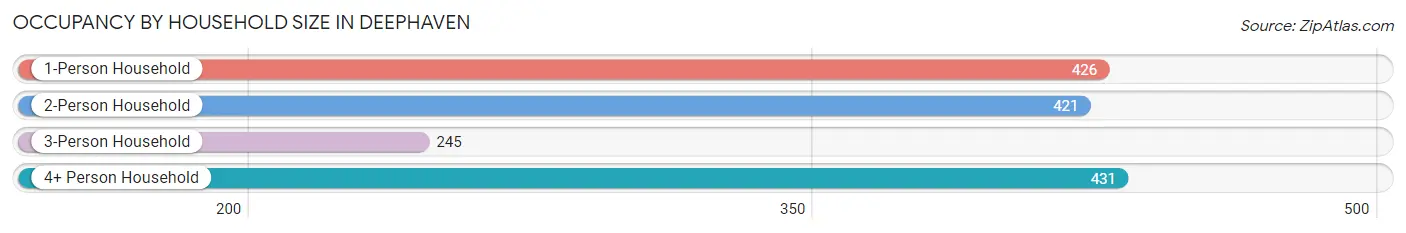
| Household Size | # Housing Units | % Housing Units |
| 1-Person Household | 426 | 28.0% |
| 2-Person Household | 421 | 27.6% |
| 3-Person Household | 245 | 16.1% |
| 4+ Person Household | 431 | 28.3% |
| Total Housing Units | 1,523 | 100.0% |
Occupancy by Ownership by Household Size in Deephaven
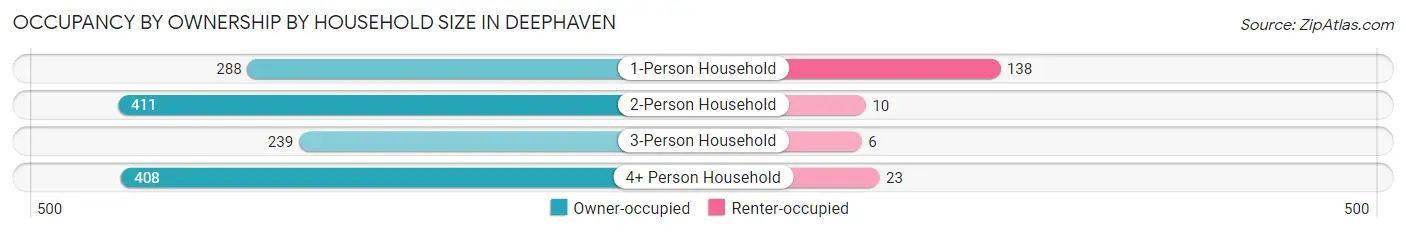
| Household Size | Owner-occupied | Renter-occupied |
| 1-Person Household | 288 (67.6%) | 138 (32.4%) |
| 2-Person Household | 411 (97.6%) | 10 (2.4%) |
| 3-Person Household | 239 (97.6%) | 6 (2.5%) |
| 4+ Person Household | 408 (94.7%) | 23 (5.3%) |
| Total Housing Units | 1,346 (88.4%) | 177 (11.6%) |
Occupancy by Educational Attainment in Deephaven
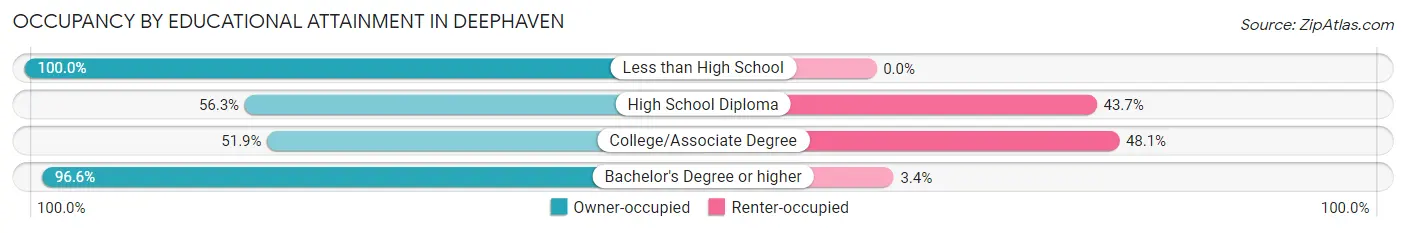
| Household Size | Owner-occupied | Renter-occupied |
| Less than High School | 10 (100.0%) | 0 (0.0%) |
| High School Diploma | 58 (56.3%) | 45 (43.7%) |
| College/Associate Degree | 97 (51.9%) | 90 (48.1%) |
| Bachelor's Degree or higher | 1,181 (96.6%) | 42 (3.4%) |
Occupancy by Age of Householder in Deephaven
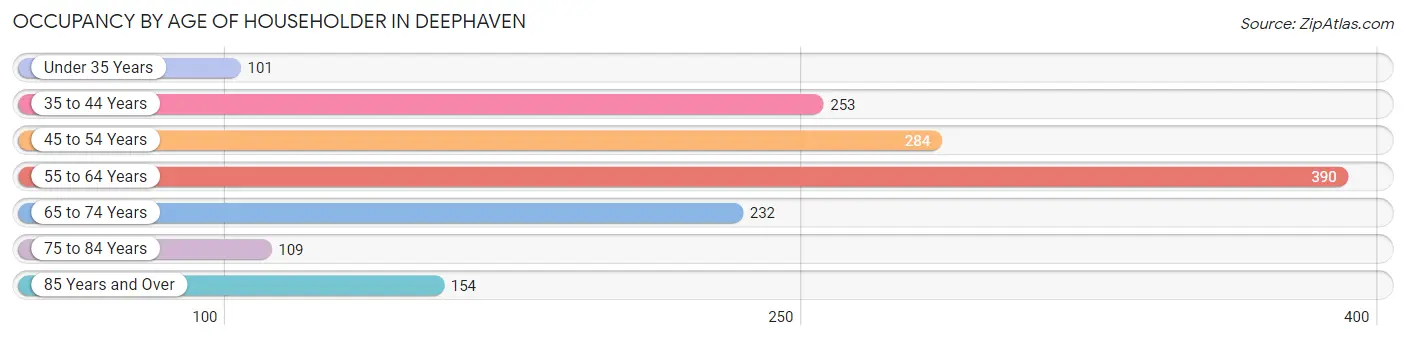
| Age Bracket | # Households | % Households |
| Under 35 Years | 101 | 6.6% |
| 35 to 44 Years | 253 | 16.6% |
| 45 to 54 Years | 284 | 18.6% |
| 55 to 64 Years | 390 | 25.6% |
| 65 to 74 Years | 232 | 15.2% |
| 75 to 84 Years | 109 | 7.2% |
| 85 Years and Over | 154 | 10.1% |
| Total | 1,523 | 100.0% |
Housing Finances in Deephaven
Median Income by Occupancy in Deephaven
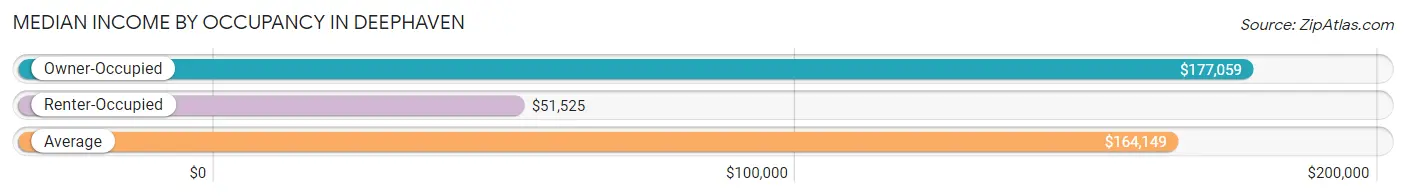
| Occupancy Type | # Households | Median Income |
| Owner-Occupied | 1,346 (88.4%) | $177,059 |
| Renter-Occupied | 177 (11.6%) | $51,525 |
| Average | 1,523 (100.0%) | $164,149 |
Occupancy by Householder Income Bracket in Deephaven
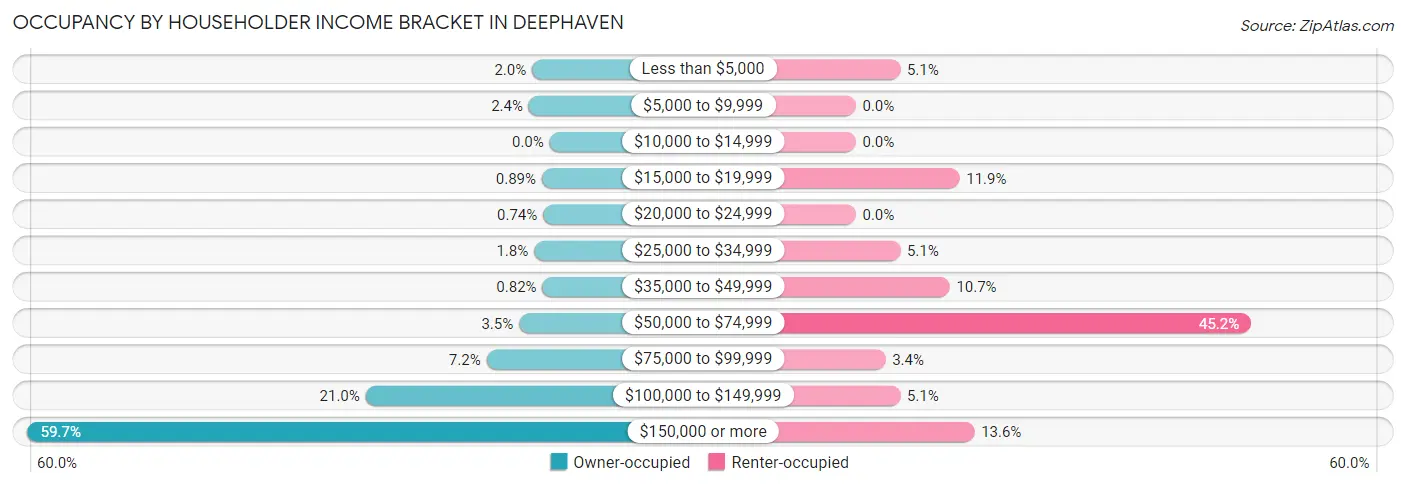
| Income Bracket | Owner-occupied | Renter-occupied |
| Less than $5,000 | 27 (2.0%) | 9 (5.1%) |
| $5,000 to $9,999 | 32 (2.4%) | 0 (0.0%) |
| $10,000 to $14,999 | 0 (0.0%) | 0 (0.0%) |
| $15,000 to $19,999 | 12 (0.9%) | 21 (11.9%) |
| $20,000 to $24,999 | 10 (0.7%) | 0 (0.0%) |
| $25,000 to $34,999 | 24 (1.8%) | 9 (5.1%) |
| $35,000 to $49,999 | 11 (0.8%) | 19 (10.7%) |
| $50,000 to $74,999 | 47 (3.5%) | 80 (45.2%) |
| $75,000 to $99,999 | 97 (7.2%) | 6 (3.4%) |
| $100,000 to $149,999 | 283 (21.0%) | 9 (5.1%) |
| $150,000 or more | 803 (59.7%) | 24 (13.6%) |
| Total | 1,346 (100.0%) | 177 (100.0%) |
Monthly Housing Cost Tiers in Deephaven
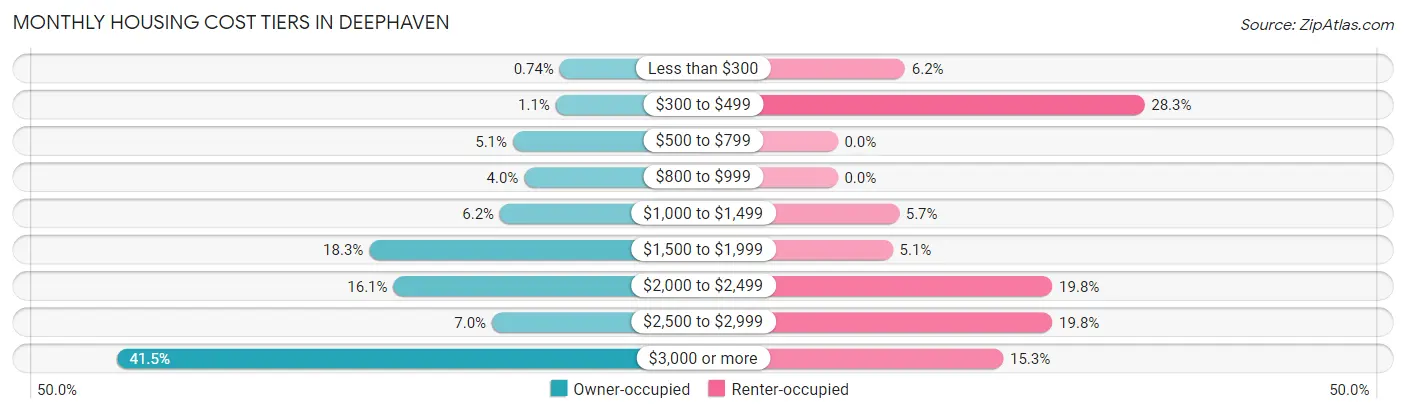
| Monthly Cost | Owner-occupied | Renter-occupied |
| Less than $300 | 10 (0.7%) | 11 (6.2%) |
| $300 to $499 | 15 (1.1%) | 50 (28.2%) |
| $500 to $799 | 68 (5.1%) | 0 (0.0%) |
| $800 to $999 | 54 (4.0%) | 0 (0.0%) |
| $1,000 to $1,499 | 84 (6.2%) | 10 (5.7%) |
| $1,500 to $1,999 | 246 (18.3%) | 9 (5.1%) |
| $2,000 to $2,499 | 216 (16.1%) | 35 (19.8%) |
| $2,500 to $2,999 | 94 (7.0%) | 35 (19.8%) |
| $3,000 or more | 559 (41.5%) | 27 (15.2%) |
| Total | 1,346 (100.0%) | 177 (100.0%) |
Physical Housing Characteristics in Deephaven
Housing Structures in Deephaven
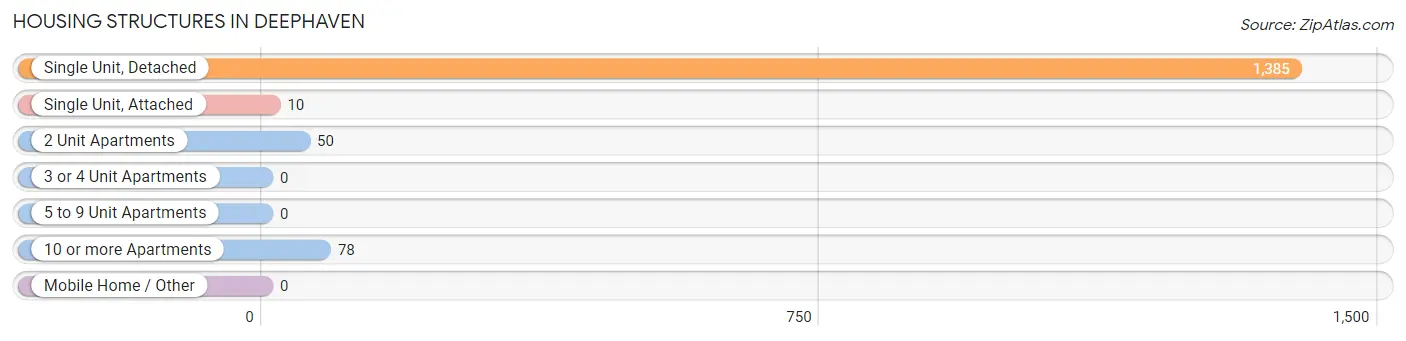
| Structure Type | # Housing Units | % Housing Units |
| Single Unit, Detached | 1,385 | 90.9% |
| Single Unit, Attached | 10 | 0.7% |
| 2 Unit Apartments | 50 | 3.3% |
| 3 or 4 Unit Apartments | 0 | 0.0% |
| 5 to 9 Unit Apartments | 0 | 0.0% |
| 10 or more Apartments | 78 | 5.1% |
| Mobile Home / Other | 0 | 0.0% |
| Total | 1,523 | 100.0% |
Housing Structures by Occupancy in Deephaven
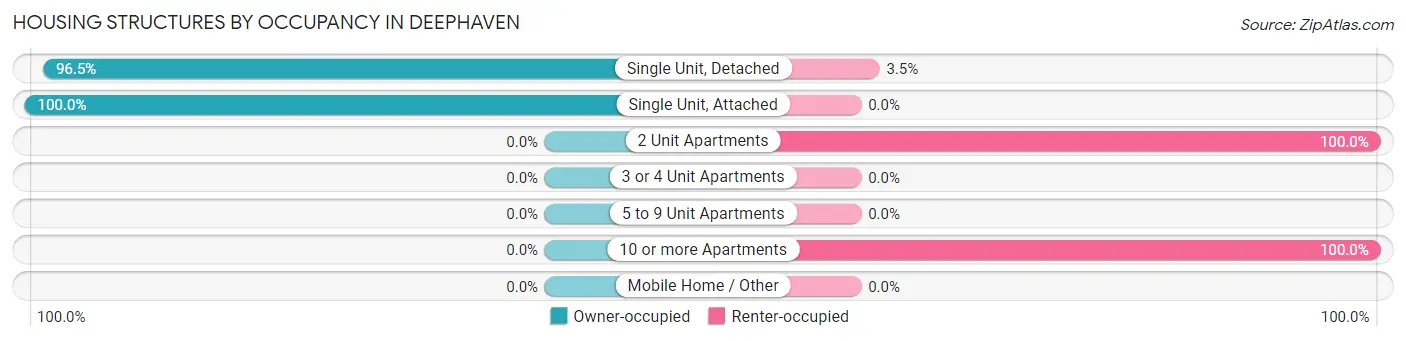
| Structure Type | Owner-occupied | Renter-occupied |
| Single Unit, Detached | 1,336 (96.5%) | 49 (3.5%) |
| Single Unit, Attached | 10 (100.0%) | 0 (0.0%) |
| 2 Unit Apartments | 0 (0.0%) | 50 (100.0%) |
| 3 or 4 Unit Apartments | 0 (0.0%) | 0 (0.0%) |
| 5 to 9 Unit Apartments | 0 (0.0%) | 0 (0.0%) |
| 10 or more Apartments | 0 (0.0%) | 78 (100.0%) |
| Mobile Home / Other | 0 (0.0%) | 0 (0.0%) |
| Total | 1,346 (88.4%) | 177 (11.6%) |
Housing Structures by Number of Rooms in Deephaven
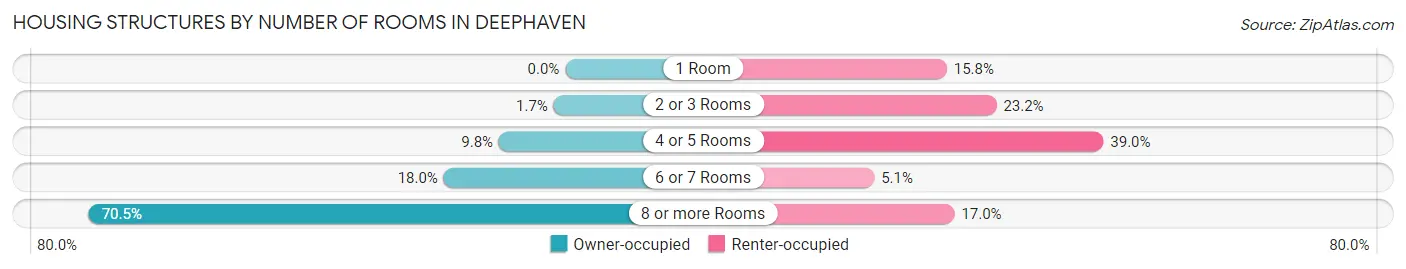
| Number of Rooms | Owner-occupied | Renter-occupied |
| 1 Room | 0 (0.0%) | 28 (15.8%) |
| 2 or 3 Rooms | 23 (1.7%) | 41 (23.2%) |
| 4 or 5 Rooms | 132 (9.8%) | 69 (39.0%) |
| 6 or 7 Rooms | 242 (18.0%) | 9 (5.1%) |
| 8 or more Rooms | 949 (70.5%) | 30 (17.0%) |
| Total | 1,346 (100.0%) | 177 (100.0%) |
Housing Structure by Heating Type in Deephaven
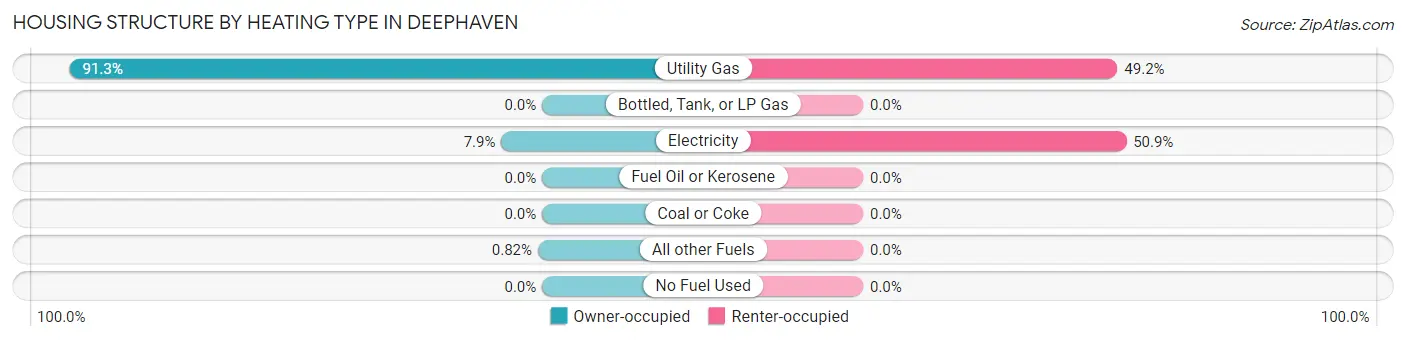
| Heating Type | Owner-occupied | Renter-occupied |
| Utility Gas | 1,229 (91.3%) | 87 (49.1%) |
| Bottled, Tank, or LP Gas | 0 (0.0%) | 0 (0.0%) |
| Electricity | 106 (7.9%) | 90 (50.8%) |
| Fuel Oil or Kerosene | 0 (0.0%) | 0 (0.0%) |
| Coal or Coke | 0 (0.0%) | 0 (0.0%) |
| All other Fuels | 11 (0.8%) | 0 (0.0%) |
| No Fuel Used | 0 (0.0%) | 0 (0.0%) |
| Total | 1,346 (100.0%) | 177 (100.0%) |
Household Vehicle Usage in Deephaven
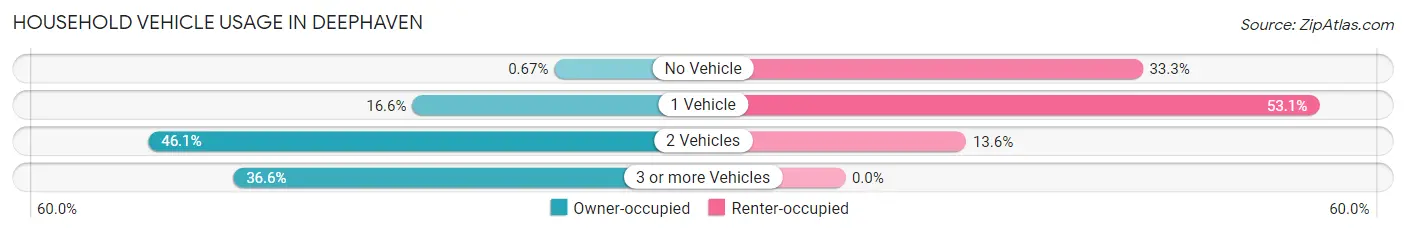
| Vehicles per Household | Owner-occupied | Renter-occupied |
| No Vehicle | 9 (0.7%) | 59 (33.3%) |
| 1 Vehicle | 223 (16.6%) | 94 (53.1%) |
| 2 Vehicles | 621 (46.1%) | 24 (13.6%) |
| 3 or more Vehicles | 493 (36.6%) | 0 (0.0%) |
| Total | 1,346 (100.0%) | 177 (100.0%) |
Real Estate & Mortgages in Deephaven
Real Estate and Mortgage Overview in Deephaven
| Characteristic | Without Mortgage | With Mortgage |
| Housing Units | 446 | 900 |
| Median Property Value | $920,200 | $729,800 |
| Median Household Income | $250,001 | $520 |
| Monthly Housing Costs | $1,501 | $459 |
| Real Estate Taxes | $10,001 | $0 |
Property Value by Mortgage Status in Deephaven
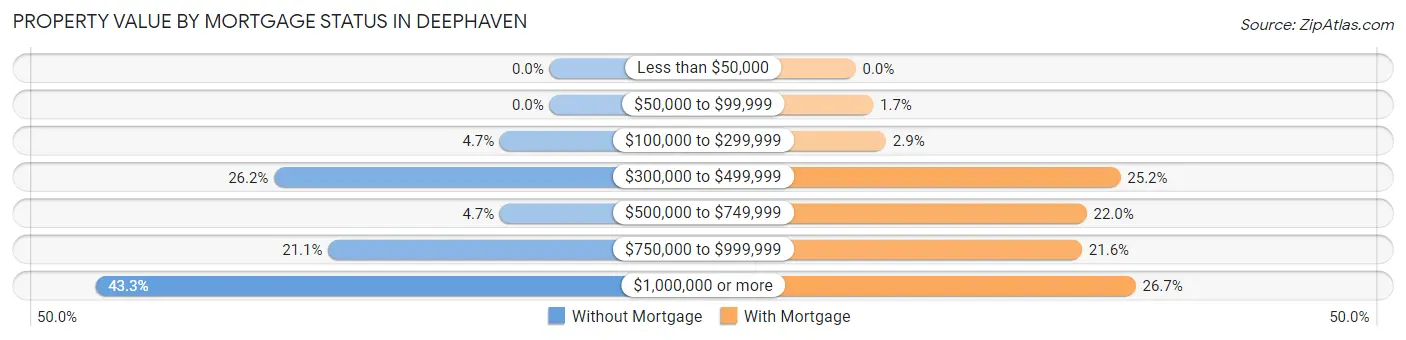
| Property Value | Without Mortgage | With Mortgage |
| Less than $50,000 | 0 (0.0%) | 0 (0.0%) |
| $50,000 to $99,999 | 0 (0.0%) | 15 (1.7%) |
| $100,000 to $299,999 | 21 (4.7%) | 26 (2.9%) |
| $300,000 to $499,999 | 117 (26.2%) | 227 (25.2%) |
| $500,000 to $749,999 | 21 (4.7%) | 198 (22.0%) |
| $750,000 to $999,999 | 94 (21.1%) | 194 (21.6%) |
| $1,000,000 or more | 193 (43.3%) | 240 (26.7%) |
| Total | 446 (100.0%) | 900 (100.0%) |
Household Income by Mortgage Status in Deephaven
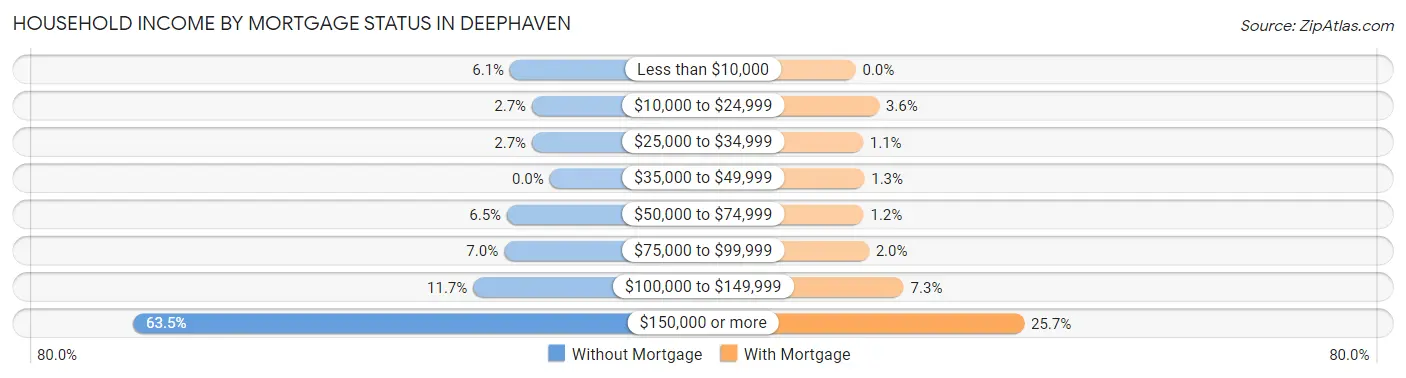
| Household Income | Without Mortgage | With Mortgage |
| Less than $10,000 | 27 (6.0%) | 0 (0.0%) |
| $10,000 to $24,999 | 12 (2.7%) | 32 (3.6%) |
| $25,000 to $34,999 | 12 (2.7%) | 10 (1.1%) |
| $35,000 to $49,999 | 0 (0.0%) | 12 (1.3%) |
| $50,000 to $74,999 | 29 (6.5%) | 11 (1.2%) |
| $75,000 to $99,999 | 31 (7.0%) | 18 (2.0%) |
| $100,000 to $149,999 | 52 (11.7%) | 66 (7.3%) |
| $150,000 or more | 283 (63.4%) | 231 (25.7%) |
| Total | 446 (100.0%) | 900 (100.0%) |
Property Value to Household Income Ratio in Deephaven
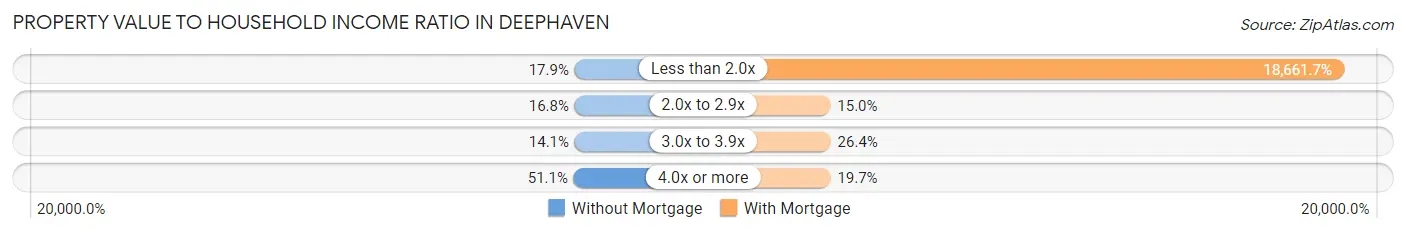
| Value-to-Income Ratio | Without Mortgage | With Mortgage |
| Less than 2.0x | 80 (17.9%) | 167,955 (18,661.7%) |
| 2.0x to 2.9x | 75 (16.8%) | 135 (15.0%) |
| 3.0x to 3.9x | 63 (14.1%) | 238 (26.4%) |
| 4.0x or more | 228 (51.1%) | 177 (19.7%) |
| Total | 446 (100.0%) | 900 (100.0%) |
Real Estate Taxes by Mortgage Status in Deephaven
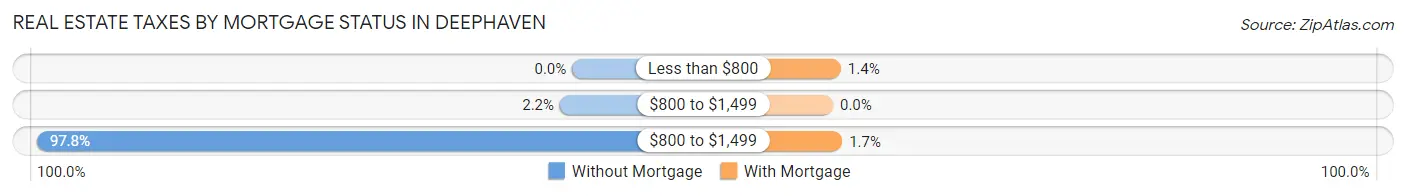
| Property Taxes | Without Mortgage | With Mortgage |
| Less than $800 | 0 (0.0%) | 13 (1.4%) |
| $800 to $1,499 | 10 (2.2%) | 0 (0.0%) |
| $800 to $1,499 | 436 (97.8%) | 15 (1.7%) |
| Total | 446 (100.0%) | 900 (100.0%) |
Health & Disability in Deephaven
Health Insurance Coverage by Age in Deephaven
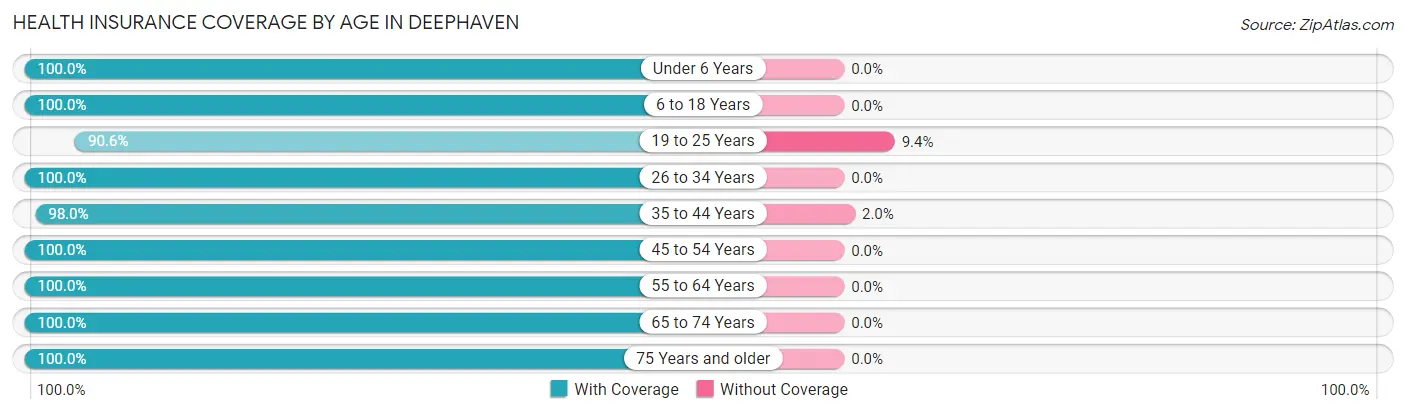
| Age Bracket | With Coverage | Without Coverage |
| Under 6 Years | 199 (100.0%) | 0 (0.0%) |
| 6 to 18 Years | 819 (100.0%) | 0 (0.0%) |
| 19 to 25 Years | 154 (90.6%) | 16 (9.4%) |
| 26 to 34 Years | 165 (100.0%) | 0 (0.0%) |
| 35 to 44 Years | 491 (98.0%) | 10 (2.0%) |
| 45 to 54 Years | 596 (100.0%) | 0 (0.0%) |
| 55 to 64 Years | 684 (100.0%) | 0 (0.0%) |
| 65 to 74 Years | 353 (100.0%) | 0 (0.0%) |
| 75 Years and older | 342 (100.0%) | 0 (0.0%) |
| Total | 3,803 (99.3%) | 26 (0.7%) |
Health Insurance Coverage by Citizenship Status in Deephaven
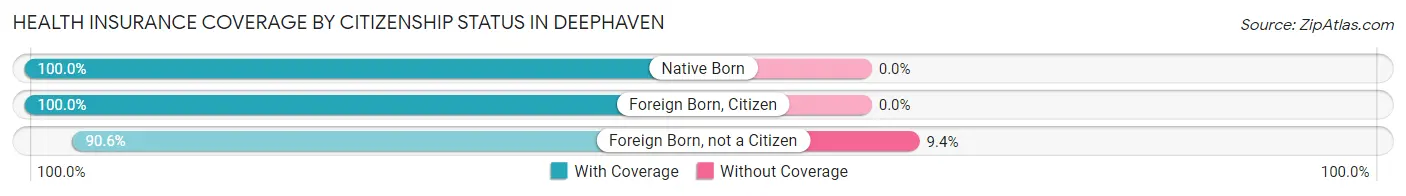
| Citizenship Status | With Coverage | Without Coverage |
| Native Born | 199 (100.0%) | 0 (0.0%) |
| Foreign Born, Citizen | 819 (100.0%) | 0 (0.0%) |
| Foreign Born, not a Citizen | 154 (90.6%) | 16 (9.4%) |
Health Insurance Coverage by Household Income in Deephaven
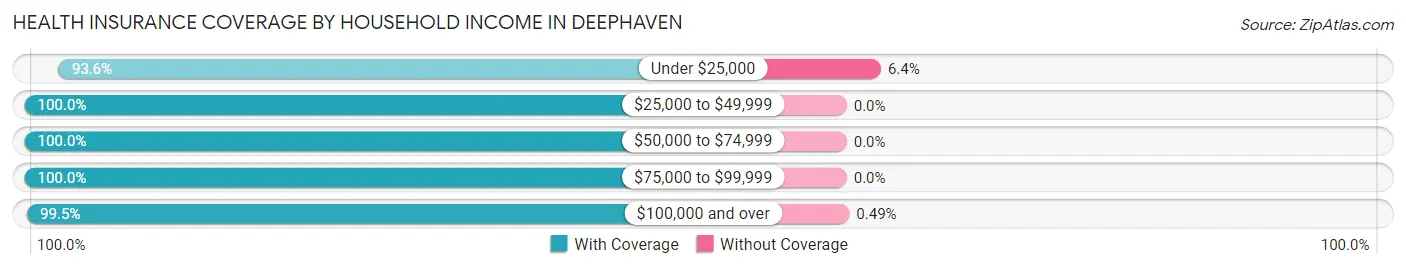
| Household Income | With Coverage | Without Coverage |
| Under $25,000 | 146 (93.6%) | 10 (6.4%) |
| $25,000 to $49,999 | 63 (100.0%) | 0 (0.0%) |
| $50,000 to $74,999 | 146 (100.0%) | 0 (0.0%) |
| $75,000 to $99,999 | 219 (100.0%) | 0 (0.0%) |
| $100,000 and over | 3,224 (99.5%) | 16 (0.5%) |
Public vs Private Health Insurance Coverage by Age in Deephaven
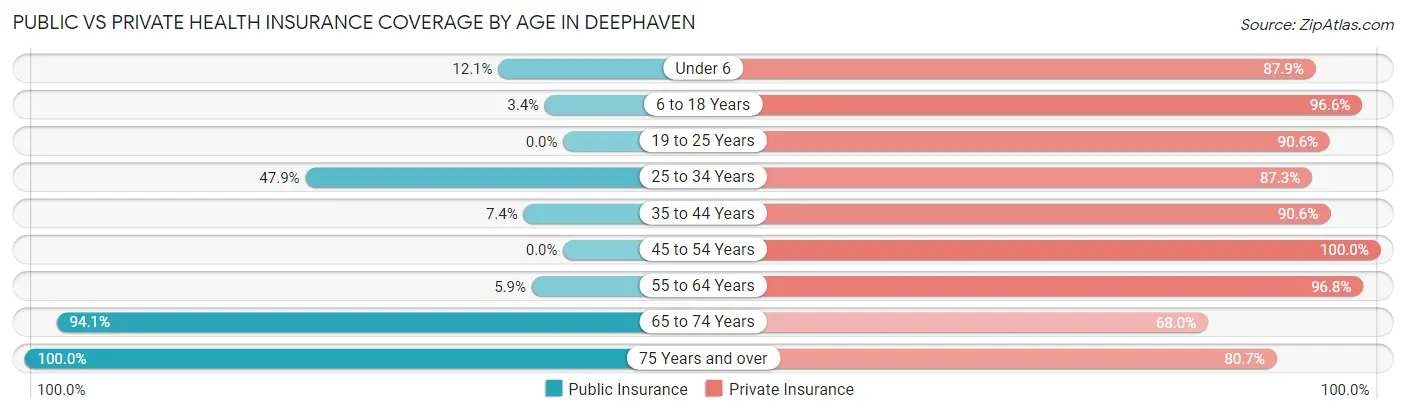
| Age Bracket | Public Insurance | Private Insurance |
| Under 6 | 24 (12.1%) | 175 (87.9%) |
| 6 to 18 Years | 28 (3.4%) | 791 (96.6%) |
| 19 to 25 Years | 0 (0.0%) | 154 (90.6%) |
| 25 to 34 Years | 79 (47.9%) | 144 (87.3%) |
| 35 to 44 Years | 37 (7.4%) | 454 (90.6%) |
| 45 to 54 Years | 0 (0.0%) | 596 (100.0%) |
| 55 to 64 Years | 40 (5.9%) | 662 (96.8%) |
| 65 to 74 Years | 332 (94.1%) | 240 (68.0%) |
| 75 Years and over | 342 (100.0%) | 276 (80.7%) |
| Total | 882 (23.0%) | 3,492 (91.2%) |
Disability Status by Sex by Age in Deephaven
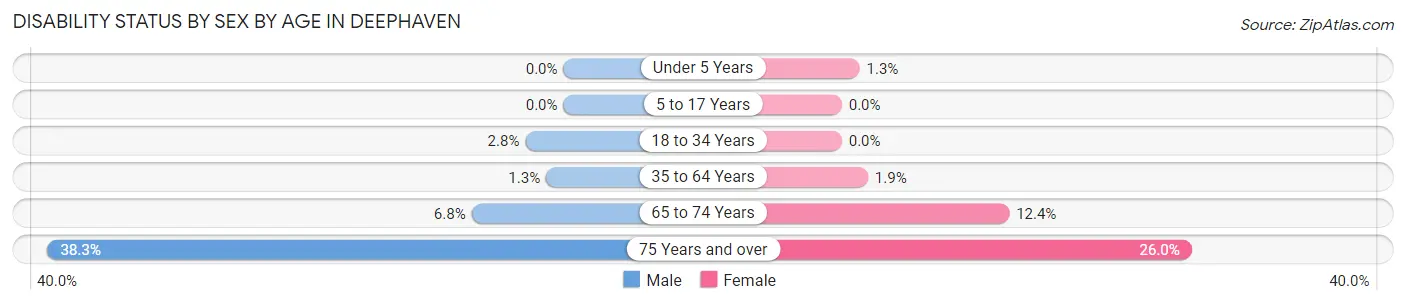
| Age Bracket | Male | Female |
| Under 5 Years | 0 (0.0%) | 1 (1.3%) |
| 5 to 17 Years | 0 (0.0%) | 0 (0.0%) |
| 18 to 34 Years | 6 (2.8%) | 0 (0.0%) |
| 35 to 64 Years | 11 (1.3%) | 18 (1.9%) |
| 65 to 74 Years | 12 (6.8%) | 22 (12.4%) |
| 75 Years and over | 72 (38.3%) | 40 (26.0%) |
Disability Class by Sex by Age in Deephaven
Disability Class: Hearing Difficulty
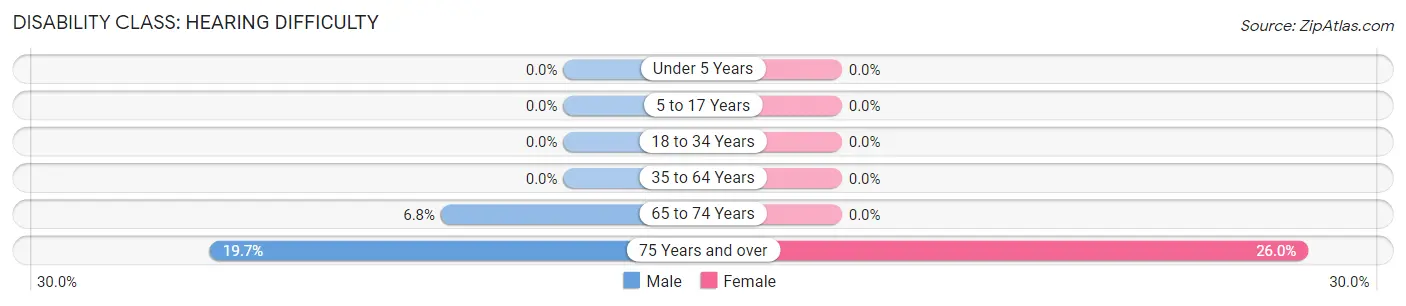
| Age Bracket | Male | Female |
| Under 5 Years | 0 (0.0%) | 0 (0.0%) |
| 5 to 17 Years | 0 (0.0%) | 0 (0.0%) |
| 18 to 34 Years | 0 (0.0%) | 0 (0.0%) |
| 35 to 64 Years | 0 (0.0%) | 0 (0.0%) |
| 65 to 74 Years | 12 (6.8%) | 0 (0.0%) |
| 75 Years and over | 37 (19.7%) | 40 (26.0%) |
Disability Class: Vision Difficulty
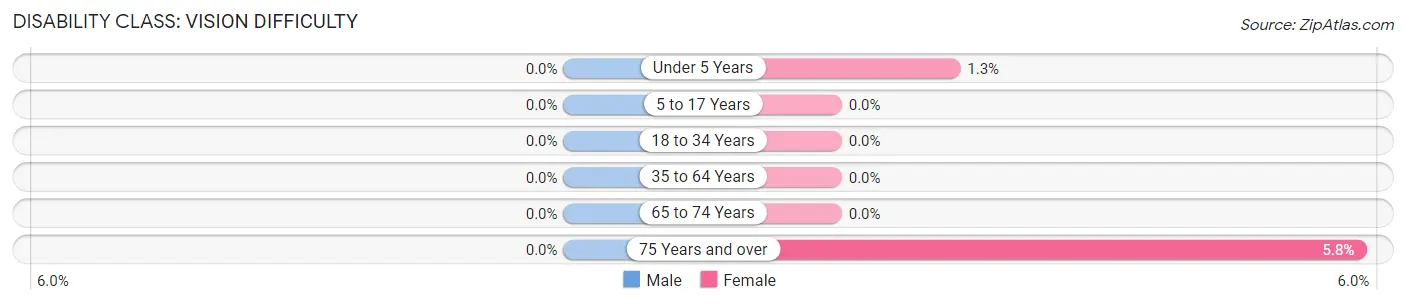
| Age Bracket | Male | Female |
| Under 5 Years | 0 (0.0%) | 1 (1.3%) |
| 5 to 17 Years | 0 (0.0%) | 0 (0.0%) |
| 18 to 34 Years | 0 (0.0%) | 0 (0.0%) |
| 35 to 64 Years | 0 (0.0%) | 0 (0.0%) |
| 65 to 74 Years | 0 (0.0%) | 0 (0.0%) |
| 75 Years and over | 0 (0.0%) | 9 (5.8%) |
Disability Class: Cognitive Difficulty
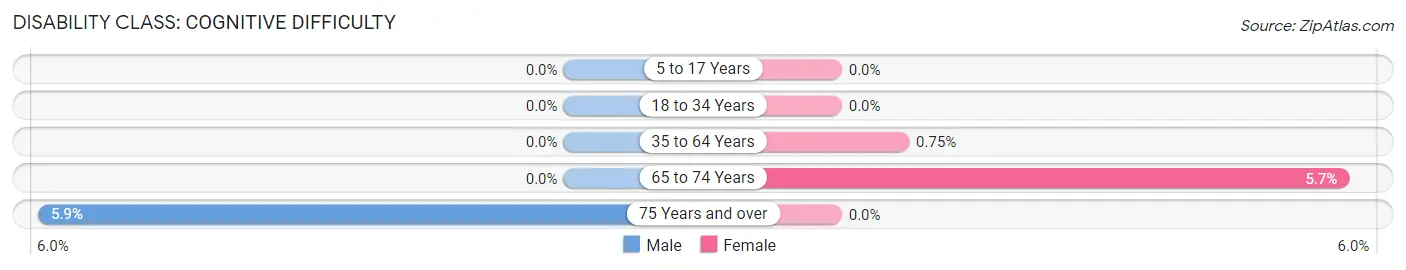
| Age Bracket | Male | Female |
| 5 to 17 Years | 0 (0.0%) | 0 (0.0%) |
| 18 to 34 Years | 0 (0.0%) | 0 (0.0%) |
| 35 to 64 Years | 0 (0.0%) | 7 (0.7%) |
| 65 to 74 Years | 0 (0.0%) | 10 (5.7%) |
| 75 Years and over | 11 (5.9%) | 0 (0.0%) |
Disability Class: Ambulatory Difficulty
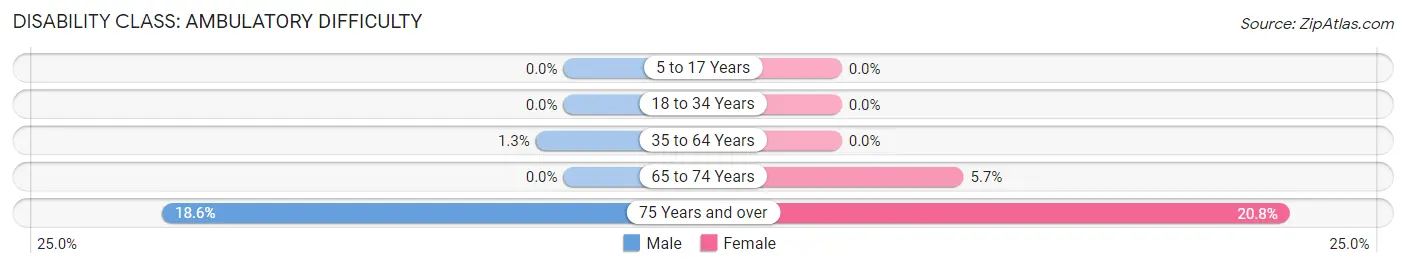
| Age Bracket | Male | Female |
| 5 to 17 Years | 0 (0.0%) | 0 (0.0%) |
| 18 to 34 Years | 0 (0.0%) | 0 (0.0%) |
| 35 to 64 Years | 11 (1.3%) | 0 (0.0%) |
| 65 to 74 Years | 0 (0.0%) | 10 (5.7%) |
| 75 Years and over | 35 (18.6%) | 32 (20.8%) |
Disability Class: Self-Care Difficulty
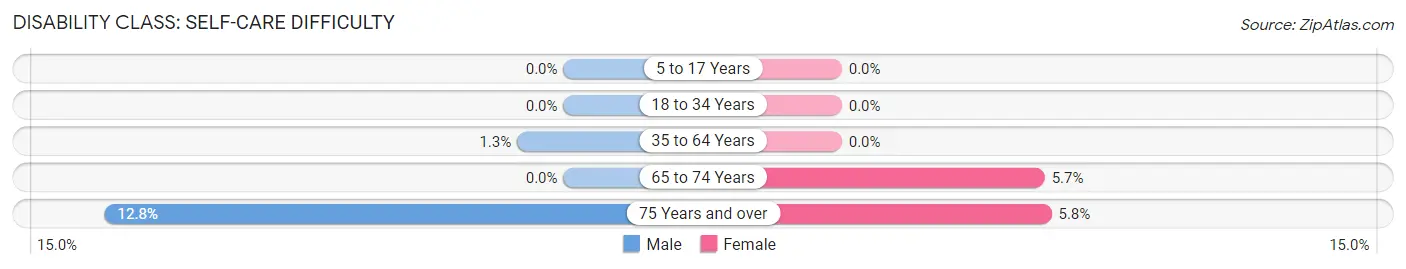
| Age Bracket | Male | Female |
| 5 to 17 Years | 0 (0.0%) | 0 (0.0%) |
| 18 to 34 Years | 0 (0.0%) | 0 (0.0%) |
| 35 to 64 Years | 11 (1.3%) | 0 (0.0%) |
| 65 to 74 Years | 0 (0.0%) | 10 (5.7%) |
| 75 Years and over | 24 (12.8%) | 9 (5.8%) |
Technology Access in Deephaven
Computing Device Access in Deephaven
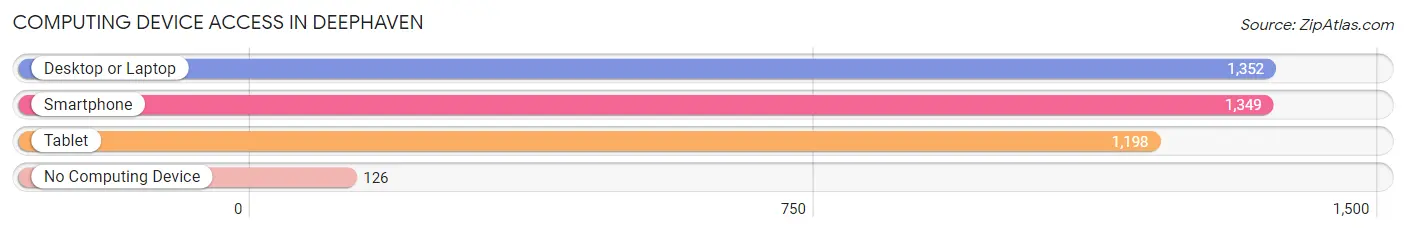
| Device Type | # Households | % Households |
| Desktop or Laptop | 1,352 | 88.8% |
| Smartphone | 1,349 | 88.6% |
| Tablet | 1,198 | 78.7% |
| No Computing Device | 126 | 8.3% |
| Total | 1,523 | 100.0% |
Internet Access in Deephaven
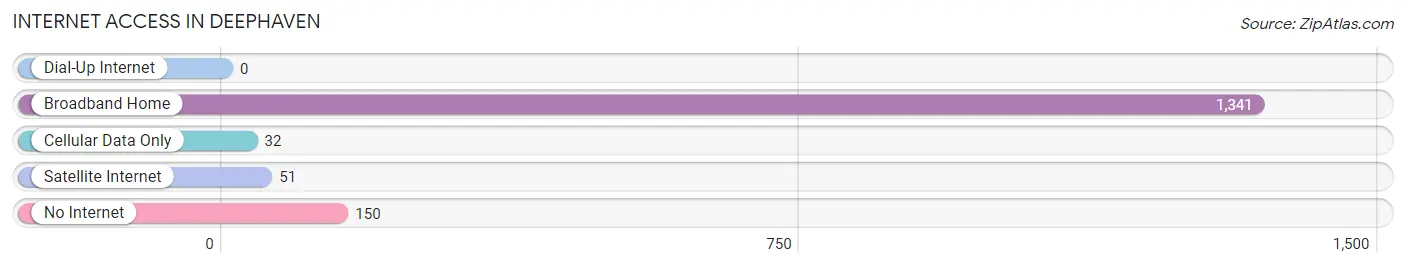
| Internet Type | # Households | % Households |
| Dial-Up Internet | 0 | 0.0% |
| Broadband Home | 1,341 | 88.0% |
| Cellular Data Only | 32 | 2.1% |
| Satellite Internet | 51 | 3.4% |
| No Internet | 150 | 9.9% |
| Total | 1,523 | 100.0% |
Deephaven Summary
Deephaven is a small city located in Hennepin County, Minnesota, United States. It is a suburb of Minneapolis and is located on the shores of Lake Minnetonka. The population was 4,521 at the 2010 census.
History
Deephaven was first settled in 1854 by a group of settlers from New England. The settlers were attracted to the area by the abundance of natural resources, including timber and fish. The town was originally named "Deephaven" after the deep harbor of Lake Minnetonka. The town was incorporated in 1887 and was the first city in Hennepin County to be incorporated.
Geography
Deephaven is located in Hennepin County, Minnesota, United States. It is located on the shores of Lake Minnetonka, about 15 miles west of Minneapolis. The city has a total area of 2.2 square miles, all of which is land.
Economy
Deephaven is a small city with a population of just over 4,500 people. The city is primarily a residential community, but there are some businesses located in the city. The largest employers in the city are the local school district, the city government, and the local hospital.
Demographics
As of the 2010 census, there were 4,521 people, 1,845 households, and 1,323 families residing in the city. The population density was 2,068.2 people per square mile. The racial makeup of the city was 94.2% White, 1.2% African American, 0.2% Native American, 1.7% Asian, 0.1% Pacific Islander, 0.9% from other races, and 1.7% from two or more races. Hispanic or Latino of any race were 2.7% of the population.
The median income for a household in the city was $90,945, and the median income for a family was $106,945. Males had a median income of $76,945 versus $50,945 for females. The per capita income for the city was $45,945. About 2.2% of families and 3.2% of the population were below the poverty line, including 4.2% of those under age 18 and 1.2% of those age 65 or over.
Conclusion
Deephaven is a small city located in Hennepin County, Minnesota, United States. It is a suburb of Minneapolis and is located on the shores of Lake Minnetonka. The city was first settled in 1854 and was incorporated in 1887. The city has a total area of 2.2 square miles, all of which is land. The population of the city was 4,521 at the 2010 census. The economy of the city is primarily residential, but there are some businesses located in the city. The median income for a household in the city was $90,945, and the median income for a family was $106,945. Deephaven is a small city with a rich history and a diverse population.
Common Questions
What is Per Capita Income in Deephaven?
Per Capita income in Deephaven is $134,031.
What is the Median Family Income in Deephaven?
Median Family Income in Deephaven is $208,958.
What is the Median Household income in Deephaven?
Median Household Income in Deephaven is $164,149.
What is Income or Wage Gap in Deephaven?
Income or Wage Gap in Deephaven is 7.1%.
Women in Deephaven earn 92.9 cents for every dollar earned by a man.
What is Inequality or Gini Index in Deephaven?
Inequality or Gini Index in Deephaven is 0.59.
What is the Total Population of Deephaven?
Total Population of Deephaven is 3,852.
What is the Total Male Population of Deephaven?
Total Male Population of Deephaven is 1,938.
What is the Total Female Population of Deephaven?
Total Female Population of Deephaven is 1,914.
What is the Ratio of Males per 100 Females in Deephaven?
There are 101.25 Males per 100 Females in Deephaven.
What is the Ratio of Females per 100 Males in Deephaven?
There are 98.76 Females per 100 Males in Deephaven.
What is the Median Population Age in Deephaven?
Median Population Age in Deephaven is 45.9 Years.
What is the Average Family Size in Deephaven
Average Family Size in Deephaven is 3.1 People.
What is the Average Household Size in Deephaven
Average Household Size in Deephaven is 2.5 People.
How Large is the Labor Force in Deephaven?
There are 1,828 People in the Labor Forcein in Deephaven.
What is the Percentage of People in the Labor Force in Deephaven?
59.8% of People are in the Labor Force in Deephaven.
What is the Unemployment Rate in Deephaven?
Unemployment Rate in Deephaven is 1.4%.