Hammond, MN Map & Demographics
Hammond Map
Hammond Overview
$47,380
PER CAPITA INCOME
$86,250
AVG FAMILY INCOME
$67,813
AVG HOUSEHOLD INCOME
47.2%
WAGE / INCOME GAP [ % ]
52.8¢/ $1
WAGE / INCOME GAP [ $ ]
0.55
INEQUALITY / GINI INDEX
137
TOTAL POPULATION
50
MALE POPULATION
87
FEMALE POPULATION
57.47
MALES / 100 FEMALES
174.00
FEMALES / 100 MALES
39.6
MEDIAN AGE
3.0
AVG FAMILY SIZE
2.4
AVG HOUSEHOLD SIZE
88
LABOR FORCE [ PEOPLE ]
78.6%
PERCENT IN LABOR FORCE
Hammond Area Codes
Income in Hammond
Income Overview in Hammond
Per Capita Income in Hammond is $47,380, while median incomes of families and households are $86,250 and $67,813 respectively.
| Characteristic | Number | Measure |
| Per Capita Income | 137 | $47,380 |
| Median Family Income | 37 | $86,250 |
| Mean Family Income | 37 | $149,268 |
| Median Household Income | 57 | $67,813 |
| Mean Household Income | 57 | $112,530 |
| Income Deficit | 37 | $0 |
| Wage / Income Gap (%) | 137 | 47.19% |
| Wage / Income Gap ($) | 137 | 52.81¢ per $1 |
| Gini / Inequality Index | 137 | 0.55 |
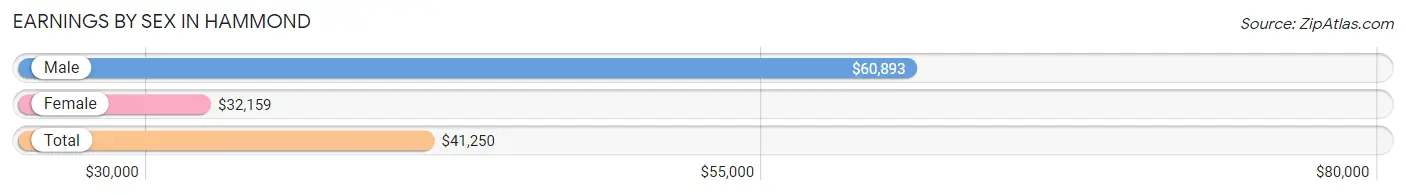
Earnings by Sex in Hammond
Average Earnings in Hammond are $41,250, $60,893 for men and $32,159 for women, a difference of 47.2%.
| Sex | Number | Average Earnings |
| Male | 37 (41.1%) | $60,893 |
| Female | 53 (58.9%) | $32,159 |
| Total | 90 (100.0%) | $41,250 |
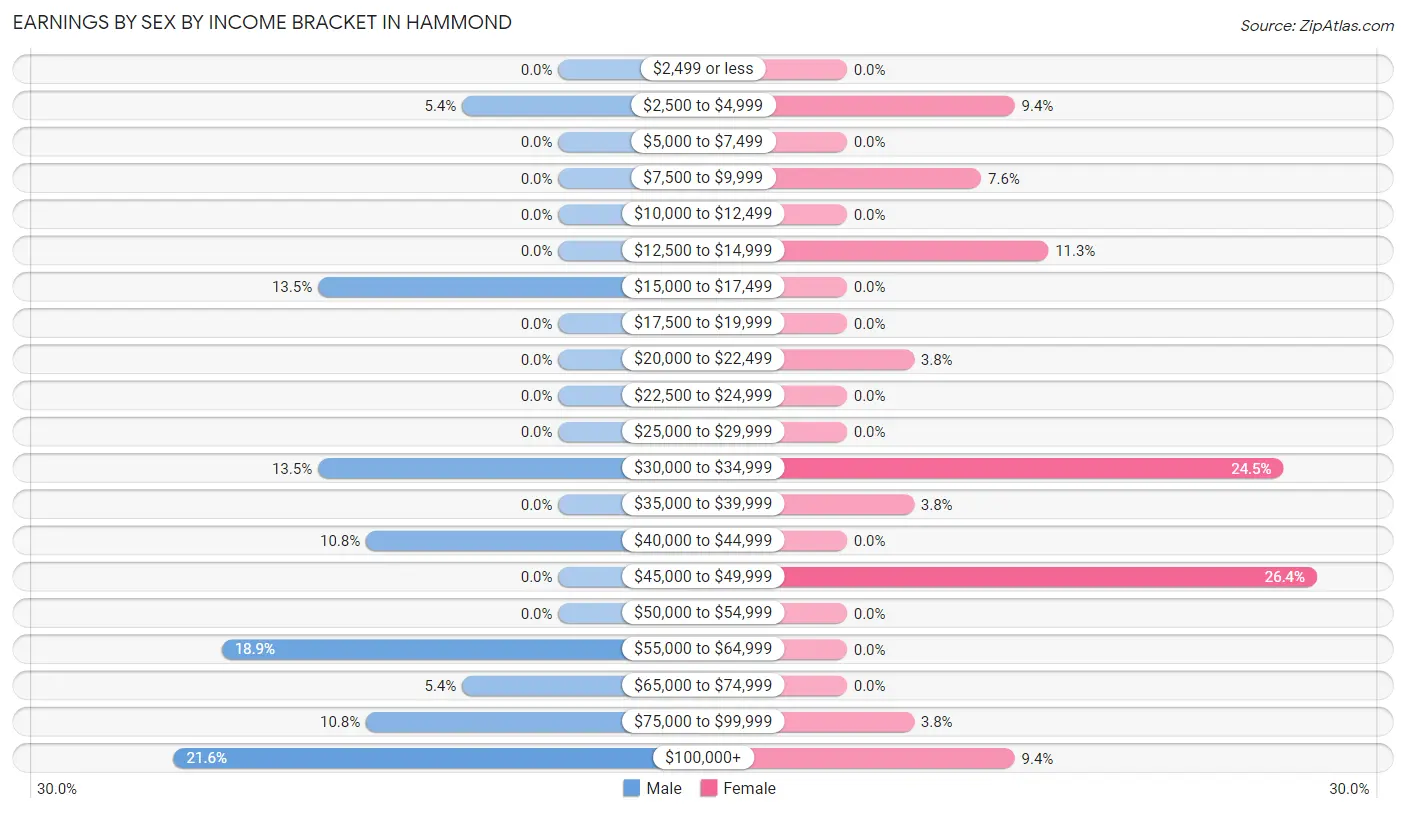
Earnings by Sex by Income Bracket in Hammond
The most common earnings brackets in Hammond are $100,000+ for men (8 | 21.6%) and $45,000 to $49,999 for women (14 | 26.4%).
| Income | Male | Female |
| $2,499 or less | 0 (0.0%) | 0 (0.0%) |
| $2,500 to $4,999 | 2 (5.4%) | 5 (9.4%) |
| $5,000 to $7,499 | 0 (0.0%) | 0 (0.0%) |
| $7,500 to $9,999 | 0 (0.0%) | 4 (7.5%) |
| $10,000 to $12,499 | 0 (0.0%) | 0 (0.0%) |
| $12,500 to $14,999 | 0 (0.0%) | 6 (11.3%) |
| $15,000 to $17,499 | 5 (13.5%) | 0 (0.0%) |
| $17,500 to $19,999 | 0 (0.0%) | 0 (0.0%) |
| $20,000 to $22,499 | 0 (0.0%) | 2 (3.8%) |
| $22,500 to $24,999 | 0 (0.0%) | 0 (0.0%) |
| $25,000 to $29,999 | 0 (0.0%) | 0 (0.0%) |
| $30,000 to $34,999 | 5 (13.5%) | 13 (24.5%) |
| $35,000 to $39,999 | 0 (0.0%) | 2 (3.8%) |
| $40,000 to $44,999 | 4 (10.8%) | 0 (0.0%) |
| $45,000 to $49,999 | 0 (0.0%) | 14 (26.4%) |
| $50,000 to $54,999 | 0 (0.0%) | 0 (0.0%) |
| $55,000 to $64,999 | 7 (18.9%) | 0 (0.0%) |
| $65,000 to $74,999 | 2 (5.4%) | 0 (0.0%) |
| $75,000 to $99,999 | 4 (10.8%) | 2 (3.8%) |
| $100,000+ | 8 (21.6%) | 5 (9.4%) |
| Total | 37 (100.0%) | 53 (100.0%) |
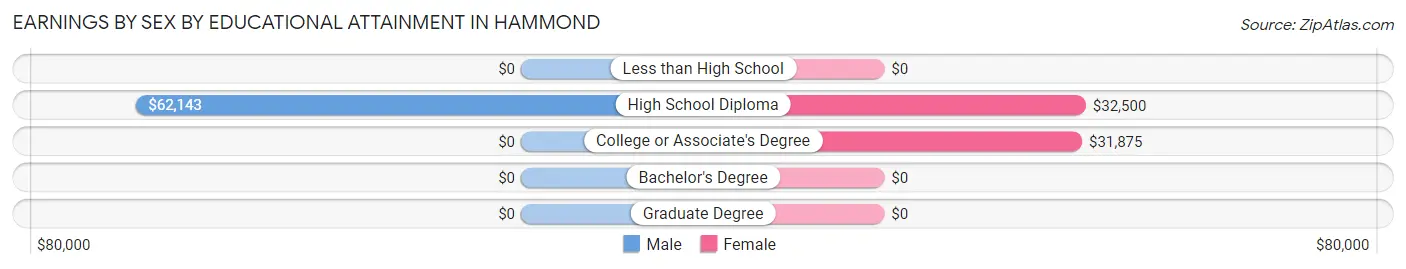
Earnings by Sex by Educational Attainment in Hammond
Average earnings in Hammond are $60,893 for men and $36,250 for women, a difference of 40.5%. Men with an educational attainment of high school diploma enjoy the highest average annual earnings of $62,143, while those with high school diploma education earn the least with $62,143. Women with an educational attainment of high school diploma earn the most with the average annual earnings of $32,500, while those with college or associate's degree education have the smallest earnings of $31,875.
| Educational Attainment | Male Income | Female Income |
| Less than High School | - | - |
| High School Diploma | $62,143 | $32,500 |
| College or Associate's Degree | - | - |
| Bachelor's Degree | - | - |
| Graduate Degree | - | - |
| Total | $60,893 | $36,250 |
Family Income in Hammond
Family Income Brackets in Hammond
According to the Hammond family income data, there are 12 families falling into the $50,000 to $74,999 income range, which is the most common income bracket and makes up 32.4% of all families.
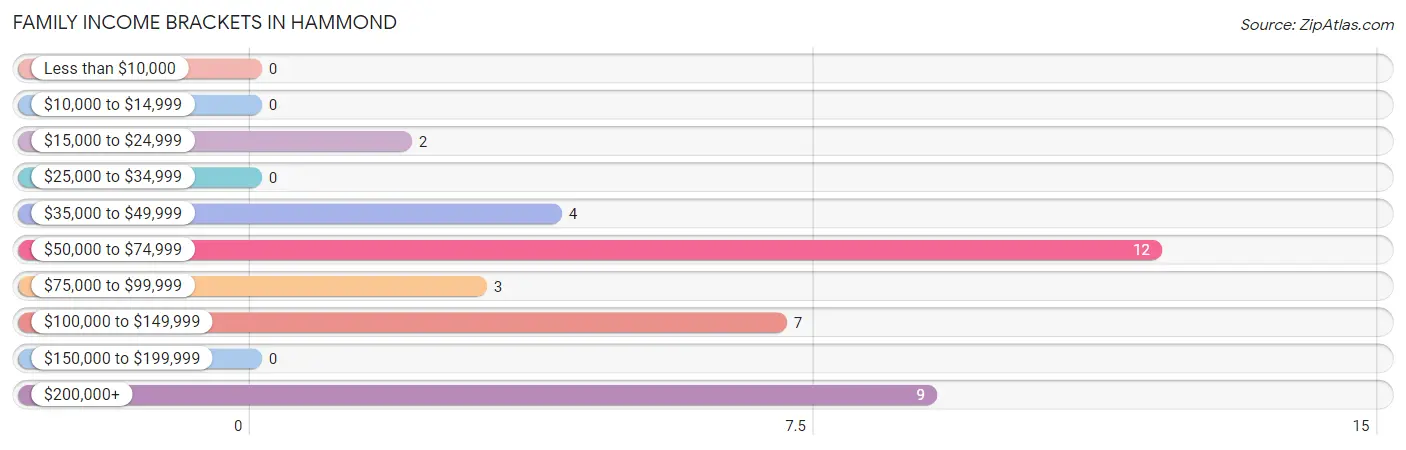
| Income Bracket | # Families | % Families |
| Less than $10,000 | 0 | 0.0% |
| $10,000 to $14,999 | 0 | 0.0% |
| $15,000 to $24,999 | 2 | 5.4% |
| $25,000 to $34,999 | 0 | 0.0% |
| $35,000 to $49,999 | 4 | 10.8% |
| $50,000 to $74,999 | 12 | 32.4% |
| $75,000 to $99,999 | 3 | 8.1% |
| $100,000 to $149,999 | 7 | 18.9% |
| $150,000 to $199,999 | 0 | 0.0% |
| $200,000+ | 9 | 24.3% |
Family Income by Famaliy Size in Hammond
3-person families (9 | 24.3%) account for the highest median family income in Hammond with $121,563 per family, while 3-person families (9 | 24.3%) have the highest median income of $40,521 per family member.
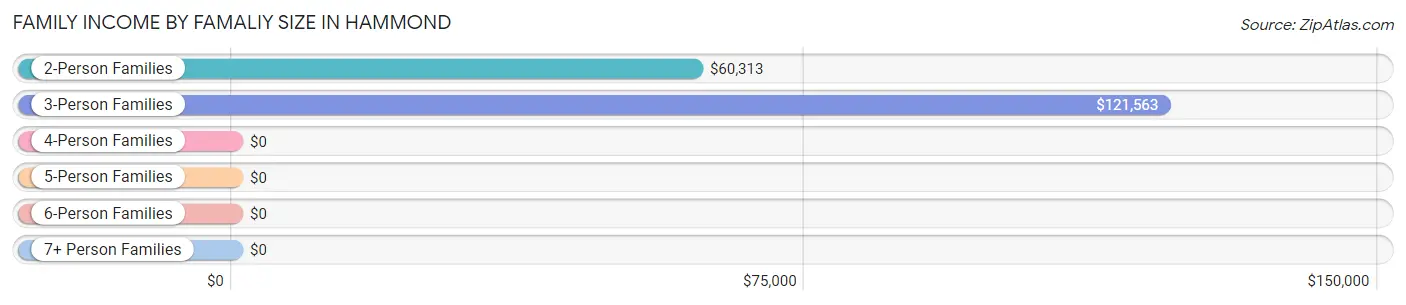
| Income Bracket | # Families | Median Income |
| 2-Person Families | 15 (40.5%) | $60,313 |
| 3-Person Families | 9 (24.3%) | $121,563 |
| 4-Person Families | 13 (35.1%) | $0 |
| 5-Person Families | 0 (0.0%) | $0 |
| 6-Person Families | 0 (0.0%) | $0 |
| 7+ Person Families | 0 (0.0%) | $0 |
| Total | 37 (100.0%) | $86,250 |
Family Income by Number of Earners in Hammond
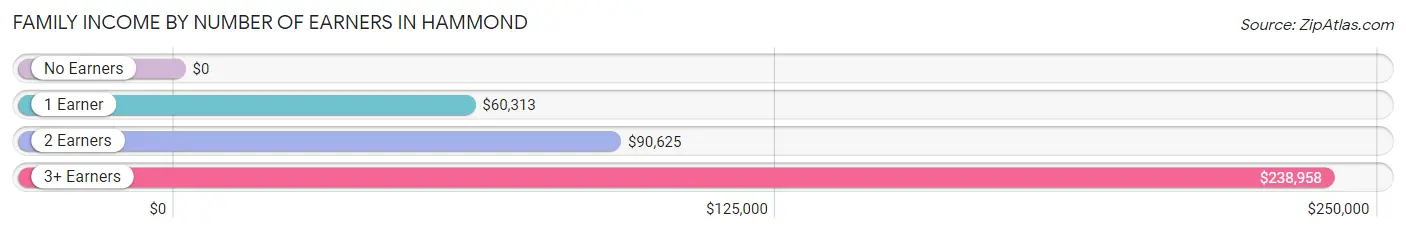
| Number of Earners | # Families | Median Income |
| No Earners | 2 (5.4%) | $0 |
| 1 Earner | 13 (35.1%) | $60,313 |
| 2 Earners | 11 (29.7%) | $90,625 |
| 3+ Earners | 11 (29.7%) | $238,958 |
| Total | 37 (100.0%) | $86,250 |
Household Income in Hammond
Household Income Brackets in Hammond
With 12 households falling in the category, the $50,000 to $74,999 income range is the most frequent in Hammond, accounting for 21.0% of all households.
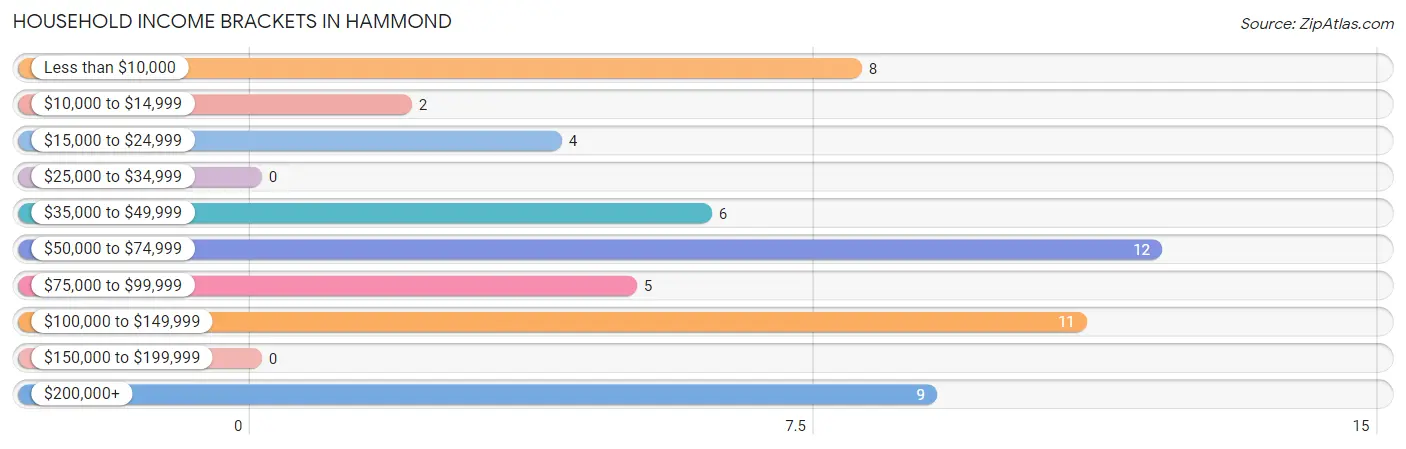
| Income Bracket | # Households | % Households |
| Less than $10,000 | 8 | 14.0% |
| $10,000 to $14,999 | 2 | 3.5% |
| $15,000 to $24,999 | 4 | 7.0% |
| $25,000 to $34,999 | 0 | 0.0% |
| $35,000 to $49,999 | 6 | 10.5% |
| $50,000 to $74,999 | 12 | 21.1% |
| $75,000 to $99,999 | 5 | 8.8% |
| $100,000 to $149,999 | 11 | 19.3% |
| $150,000 to $199,999 | 0 | 0.0% |
| $200,000+ | 9 | 15.8% |
Household Income by Householder Age in Hammond
The median household income in Hammond is $67,813, with the highest median household income of $69,063 found in the 25 to 44 years age bracket for the primary householder. A total of 19 households (33.3%) fall into this category.
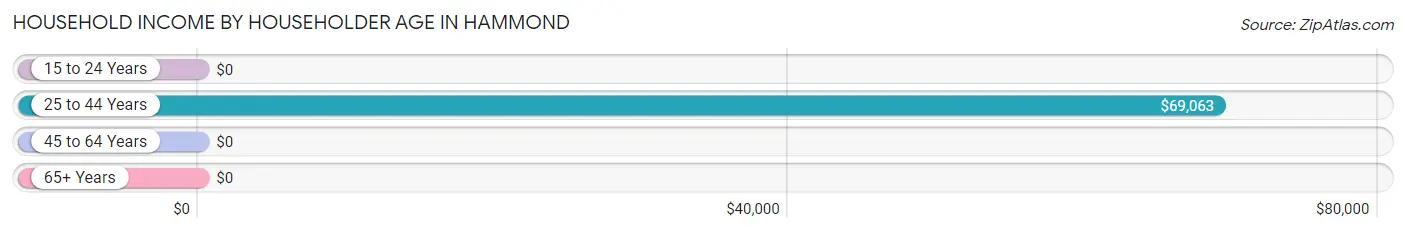
| Income Bracket | # Households | Median Income |
| 15 to 24 Years | 0 (0.0%) | $0 |
| 25 to 44 Years | 19 (33.3%) | $69,063 |
| 45 to 64 Years | 23 (40.4%) | $0 |
| 65+ Years | 15 (26.3%) | $0 |
| Total | 57 (100.0%) | $67,813 |
Poverty in Hammond
Income Below Poverty by Sex and Age in Hammond
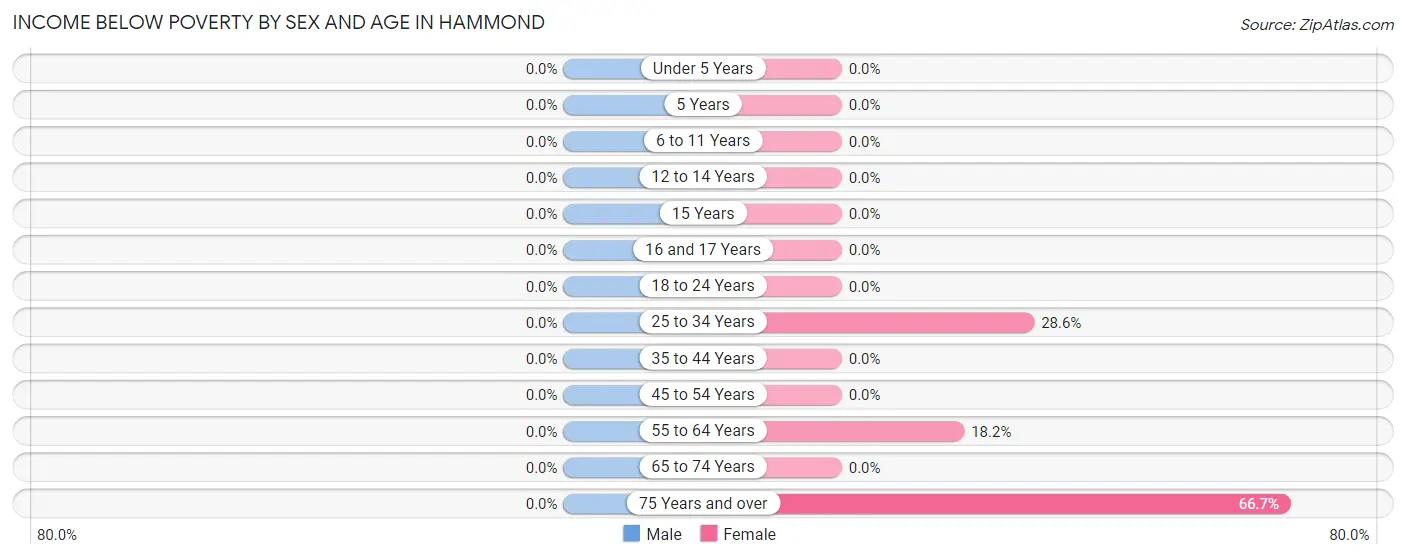
| Age Bracket | Male | Female |
| Under 5 Years | 0 (0.0%) | 0 (0.0%) |
| 5 Years | 0 (0.0%) | 0 (0.0%) |
| 6 to 11 Years | 0 (0.0%) | 0 (0.0%) |
| 12 to 14 Years | 0 (0.0%) | 0 (0.0%) |
| 15 Years | 0 (0.0%) | 0 (0.0%) |
| 16 and 17 Years | 0 (0.0%) | 0 (0.0%) |
| 18 to 24 Years | 0 (0.0%) | 0 (0.0%) |
| 25 to 34 Years | 0 (0.0%) | 4 (28.6%) |
| 35 to 44 Years | 0 (0.0%) | 0 (0.0%) |
| 45 to 54 Years | 0 (0.0%) | 0 (0.0%) |
| 55 to 64 Years | 0 (0.0%) | 2 (18.2%) |
| 65 to 74 Years | 0 (0.0%) | 0 (0.0%) |
| 75 Years and over | 0 (0.0%) | 8 (66.7%) |
| Total | 0 (0.0%) | 14 (16.1%) |
Income Above Poverty by Sex and Age in Hammond
According to the poverty statistics in Hammond, males aged under 5 years and females aged under 5 years are the age groups that are most secure financially, with 100.0% of males and 100.0% of females in these age groups living above the poverty line.
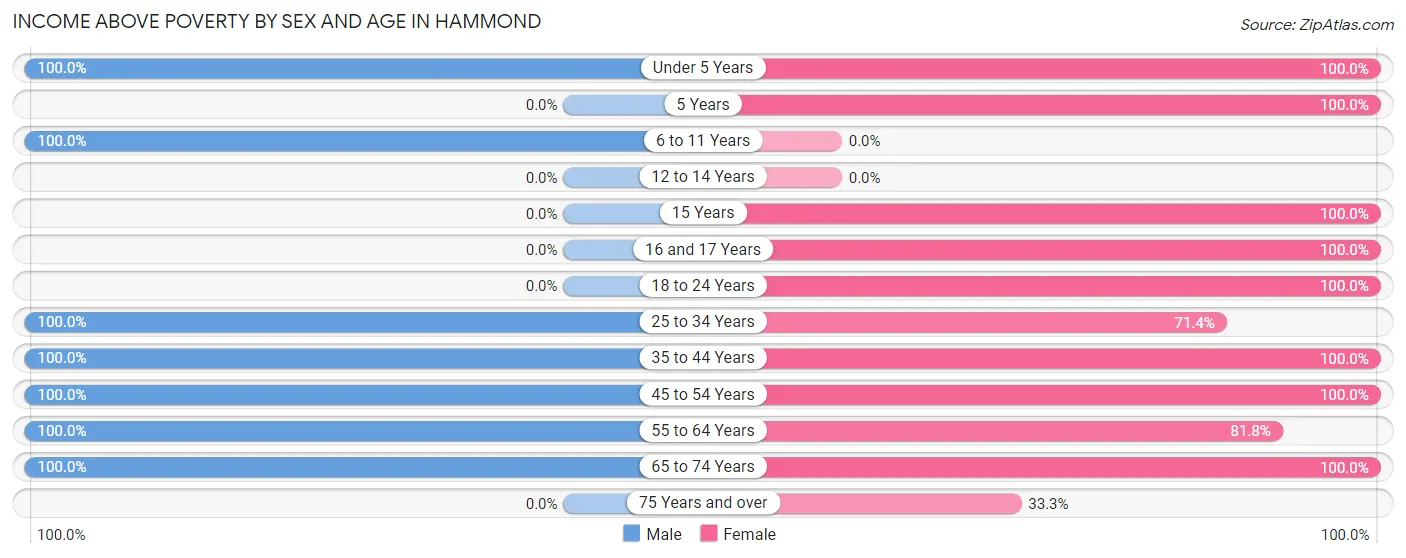
| Age Bracket | Male | Female |
| Under 5 Years | 9 (100.0%) | 8 (100.0%) |
| 5 Years | 0 (0.0%) | 2 (100.0%) |
| 6 to 11 Years | 1 (100.0%) | 0 (0.0%) |
| 12 to 14 Years | 0 (0.0%) | 0 (0.0%) |
| 15 Years | 0 (0.0%) | 5 (100.0%) |
| 16 and 17 Years | 0 (0.0%) | 3 (100.0%) |
| 18 to 24 Years | 0 (0.0%) | 6 (100.0%) |
| 25 to 34 Years | 7 (100.0%) | 10 (71.4%) |
| 35 to 44 Years | 12 (100.0%) | 13 (100.0%) |
| 45 to 54 Years | 6 (100.0%) | 6 (100.0%) |
| 55 to 64 Years | 12 (100.0%) | 9 (81.8%) |
| 65 to 74 Years | 3 (100.0%) | 7 (100.0%) |
| 75 Years and over | 0 (0.0%) | 4 (33.3%) |
| Total | 50 (100.0%) | 73 (83.9%) |
Income Below Poverty Among Married-Couple Families in Hammond
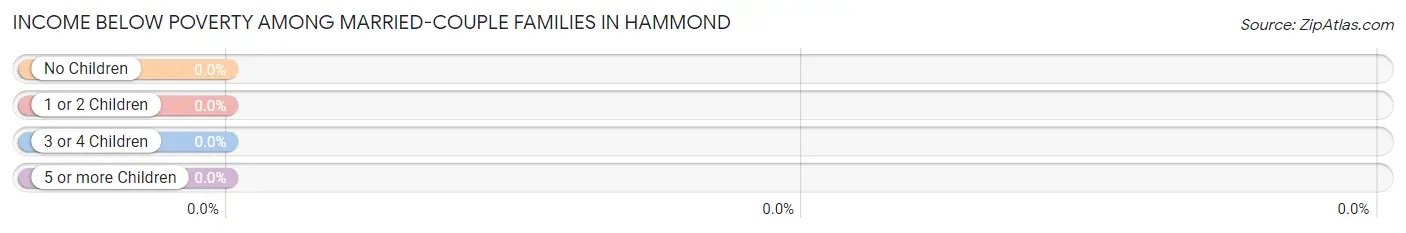
| Children | Above Poverty | Below Poverty |
| No Children | 15 (100.0%) | 0 (0.0%) |
| 1 or 2 Children | 14 (100.0%) | 0 (0.0%) |
| 3 or 4 Children | 0 (0.0%) | 0 (0.0%) |
| 5 or more Children | 0 (0.0%) | 0 (0.0%) |
| Total | 29 (100.0%) | 0 (0.0%) |
Income Below Poverty Among Single-Parent Households in Hammond
| Children | Single Father | Single Mother |
| No Children | 0 (0.0%) | 0 (0.0%) |
| 1 or 2 Children | 0 (0.0%) | 0 (0.0%) |
| 3 or 4 Children | 0 (0.0%) | 0 (0.0%) |
| 5 or more Children | 0 (0.0%) | 0 (0.0%) |
| Total | 0 (0.0%) | 0 (0.0%) |
Income Below Poverty Among Married-Couple vs Single-Parent Households in Hammond
| Children | Married-Couple Families | Single-Parent Households |
| No Children | 0 (0.0%) | 0 (0.0%) |
| 1 or 2 Children | 0 (0.0%) | 0 (0.0%) |
| 3 or 4 Children | 0 (0.0%) | 0 (0.0%) |
| 5 or more Children | 0 (0.0%) | 0 (0.0%) |
| Total | 0 (0.0%) | 0 (0.0%) |
Race in Hammond
The most populous races in Hammond are , and White / Caucasian (137 | 100.0%).
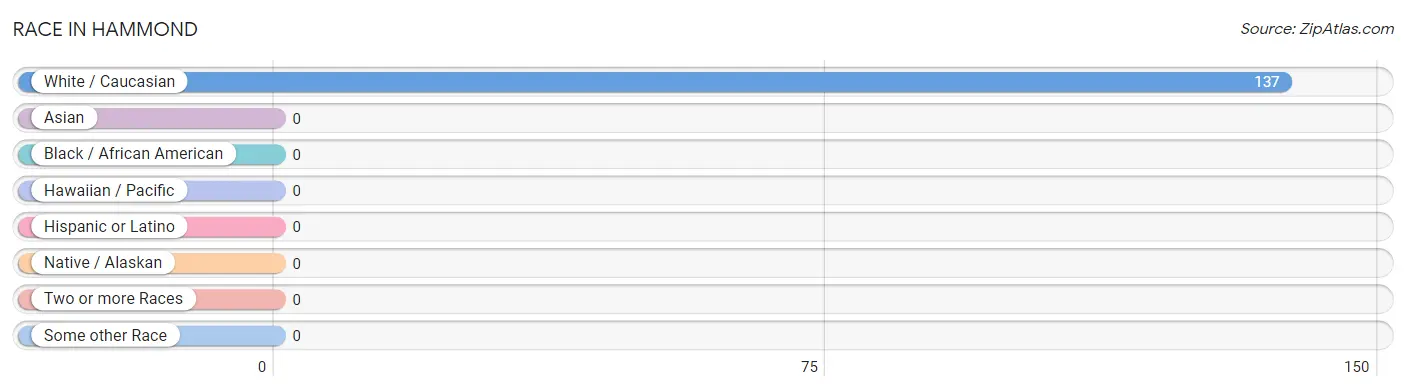
| Race | # Population | % Population |
| Asian | 0 | 0.0% |
| Black / African American | 0 | 0.0% |
| Hawaiian / Pacific | 0 | 0.0% |
| Hispanic or Latino | 0 | 0.0% |
| Native / Alaskan | 0 | 0.0% |
| White / Caucasian | 137 | 100.0% |
| Two or more Races | 0 | 0.0% |
| Some other Race | 0 | 0.0% |
| Total | 137 | 100.0% |
Ancestry in Hammond
The most populous ancestries reported in Hammond are German (66 | 48.2%), Norwegian (13 | 9.5%), English (12 | 8.8%), Irish (12 | 8.8%), and French (7 | 5.1%), together accounting for 80.3% of all Hammond residents.
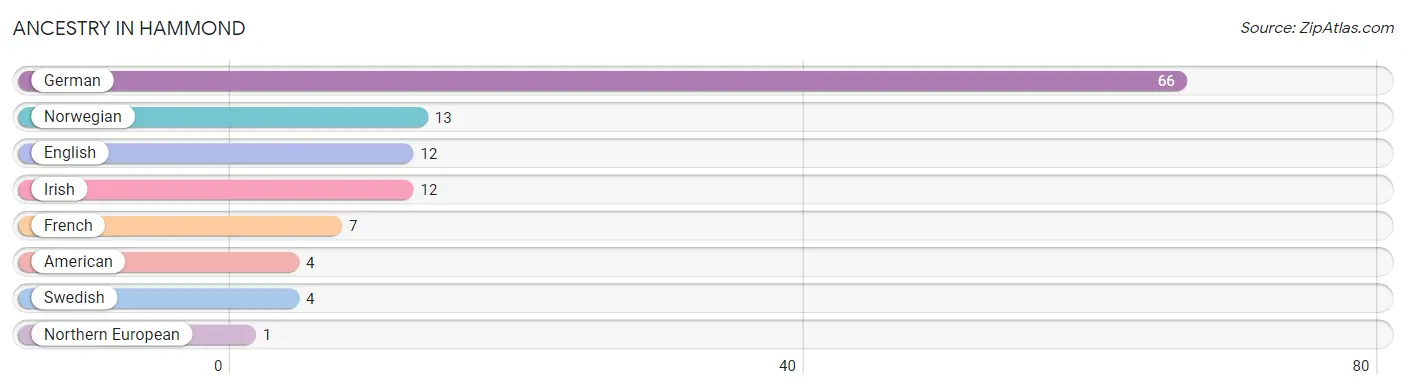
| Ancestry | # Population | % Population |
| American | 4 | 2.9% |
| English | 12 | 8.8% |
| French | 7 | 5.1% |
| German | 66 | 48.2% |
| Irish | 12 | 8.8% |
| Northern European | 1 | 0.7% |
| Norwegian | 13 | 9.5% |
| Swedish | 4 | 2.9% | View All 8 Rows |
Immigrants in Hammond

| Immigration Origin | # Population | % Population | View All 0 Rows |
Sex and Age in Hammond
Sex and Age in Hammond
The most populous age groups in Hammond are 55 to 59 Years (10 | 20.0%) for men and 15 to 19 Years (14 | 16.1%) for women.
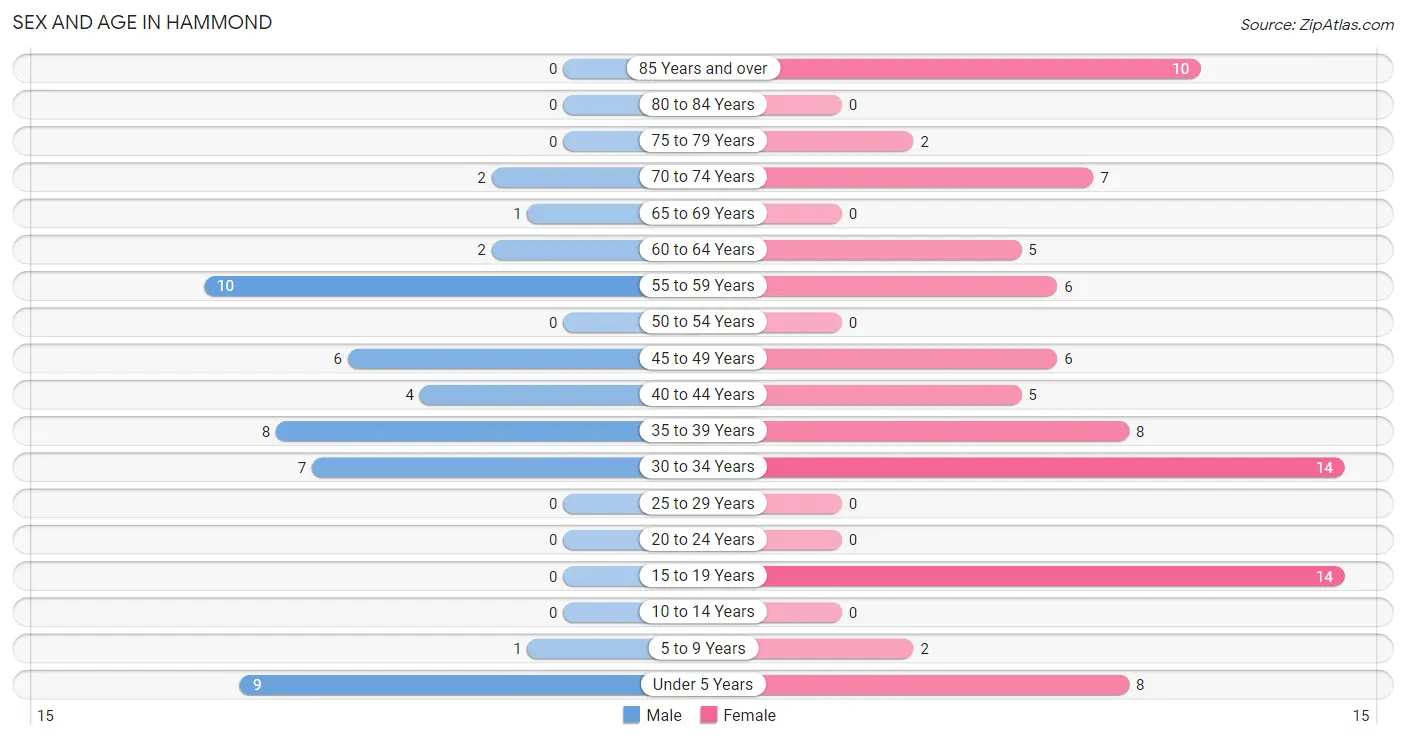
| Age Bracket | Male | Female |
| Under 5 Years | 9 (18.0%) | 8 (9.2%) |
| 5 to 9 Years | 1 (2.0%) | 2 (2.3%) |
| 10 to 14 Years | 0 (0.0%) | 0 (0.0%) |
| 15 to 19 Years | 0 (0.0%) | 14 (16.1%) |
| 20 to 24 Years | 0 (0.0%) | 0 (0.0%) |
| 25 to 29 Years | 0 (0.0%) | 0 (0.0%) |
| 30 to 34 Years | 7 (14.0%) | 14 (16.1%) |
| 35 to 39 Years | 8 (16.0%) | 8 (9.2%) |
| 40 to 44 Years | 4 (8.0%) | 5 (5.8%) |
| 45 to 49 Years | 6 (12.0%) | 6 (6.9%) |
| 50 to 54 Years | 0 (0.0%) | 0 (0.0%) |
| 55 to 59 Years | 10 (20.0%) | 6 (6.9%) |
| 60 to 64 Years | 2 (4.0%) | 5 (5.8%) |
| 65 to 69 Years | 1 (2.0%) | 0 (0.0%) |
| 70 to 74 Years | 2 (4.0%) | 7 (8.1%) |
| 75 to 79 Years | 0 (0.0%) | 2 (2.3%) |
| 80 to 84 Years | 0 (0.0%) | 0 (0.0%) |
| 85 Years and over | 0 (0.0%) | 10 (11.5%) |
| Total | 50 (100.0%) | 87 (100.0%) |
Families and Households in Hammond
Median Family Size in Hammond
The median family size in Hammond is 3.00 persons per family, with married-couple families (29 | 78.4%) accounting for the largest median family size of 3.24 persons per family. On the other hand, single male/father families (4 | 10.8%) represent the smallest median family size with 1.75 persons per family.
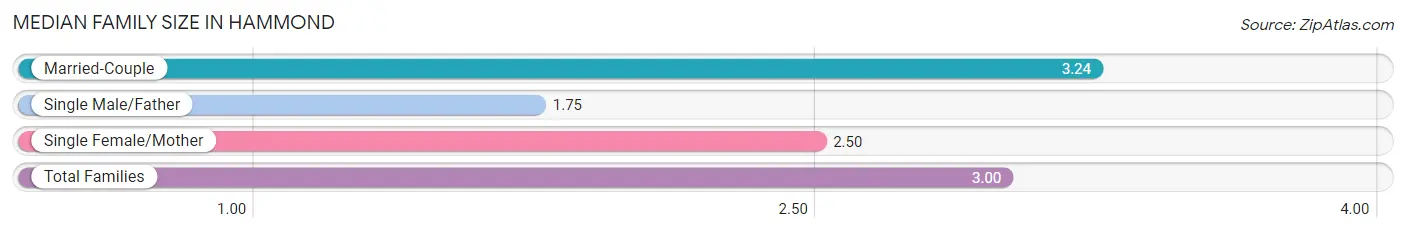
| Family Type | # Families | Family Size |
| Married-Couple | 29 (78.4%) | 3.24 |
| Single Male/Father | 4 (10.8%) | 1.75 |
| Single Female/Mother | 4 (10.8%) | 2.50 |
| Total Families | 37 (100.0%) | 3.00 |
Median Household Size in Hammond
The median household size in Hammond is 2.40 persons per household, with married-couple households (29 | 50.9%) accounting for the largest median household size of 3.24 persons per household. non-family households (20 | 35.1%) represent the smallest median household size with 1.10 persons per household.
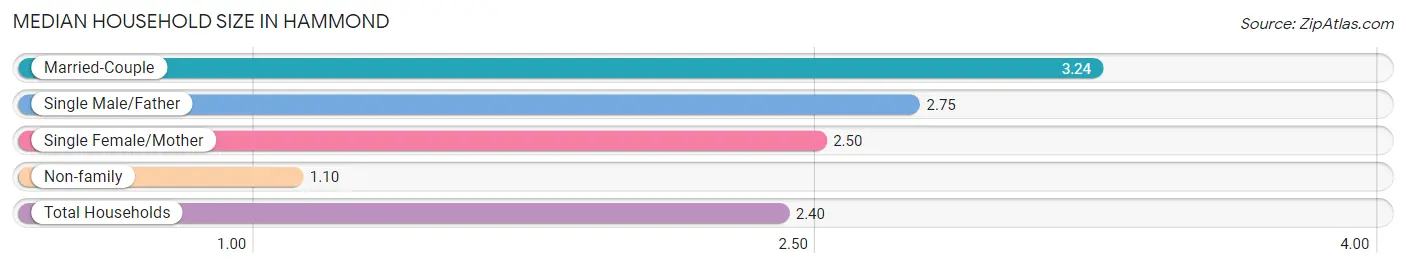
| Household Type | # Households | Household Size |
| Married-Couple | 29 (50.9%) | 3.24 |
| Single Male/Father | 4 (7.0%) | 2.75 |
| Single Female/Mother | 4 (7.0%) | 2.50 |
| Non-family | 20 (35.1%) | 1.10 |
| Total Households | 57 (100.0%) | 2.40 |
Household Size by Marriage Status in Hammond
Out of a total of 57 households in Hammond, 37 (64.9%) are family households, while 20 (35.1%) are nonfamily households. The most numerous type of family households are 3-person households, comprising 13, and the most common type of nonfamily households are 1-person households, comprising 18.
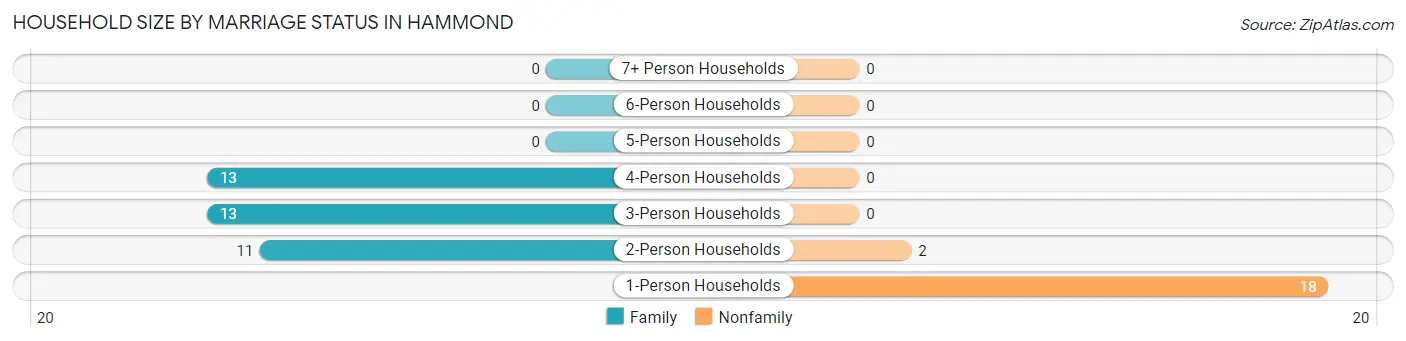
| Household Size | Family Households | Nonfamily Households |
| 1-Person Households | - | 18 (31.6%) |
| 2-Person Households | 11 (19.3%) | 2 (3.5%) |
| 3-Person Households | 13 (22.8%) | 0 (0.0%) |
| 4-Person Households | 13 (22.8%) | 0 (0.0%) |
| 5-Person Households | 0 (0.0%) | 0 (0.0%) |
| 6-Person Households | 0 (0.0%) | 0 (0.0%) |
| 7+ Person Households | 0 (0.0%) | 0 (0.0%) |
| Total | 37 (64.9%) | 20 (35.1%) |
Female Fertility in Hammond
Fertility by Age in Hammond
| Age Bracket | Women with Births | Births / 1,000 Women |
| 15 to 19 years | 0 (0.0%) | 0.0 |
| 20 to 34 years | 0 (0.0%) | 0.0 |
| 35 to 50 years | 0 (0.0%) | 0.0 |
| Total | 0 (0.0%) | 0.0 |
Fertility by Age by Marriage Status in Hammond
| Age Bracket | Married | Unmarried |
| 15 to 19 years | 0 (0.0%) | 0 (0.0%) |
| 20 to 34 years | 0 (0.0%) | 0 (0.0%) |
| 35 to 50 years | 0 (0.0%) | 0 (0.0%) |
| Total | 0 (0.0%) | 0 (0.0%) |
Fertility by Education in Hammond
| Educational Attainment | Women with Births | Births / 1,000 Women |
| Less than High School | 0 (0.0%) | 0.0 |
| High School Diploma | 0 (0.0%) | 0.0 |
| College or Associate's Degree | 0 (0.0%) | 0.0 |
| Bachelor's Degree | 0 (0.0%) | 0.0 |
| Graduate Degree | 0 (0.0%) | 0.0 |
| Total | 0 (0.0%) | 0.0 |
Fertility by Education by Marriage Status in Hammond
| Educational Attainment | Married | Unmarried |
| Less than High School | 0 (0.0%) | 0 (0.0%) |
| High School Diploma | 0 (0.0%) | 0 (0.0%) |
| College or Associate's Degree | 0 (0.0%) | 0 (0.0%) |
| Bachelor's Degree | 0 (0.0%) | 0 (0.0%) |
| Graduate Degree | 0 (0.0%) | 0 (0.0%) |
| Total | 0 (0.0%) | 0 (0.0%) |
Employment Characteristics in Hammond
Employment by Class of Employer in Hammond
Among the 86 employed individuals in Hammond, private company employees (60 | 69.8%), not-for-profit organizations (13 | 15.1%), and local government employees (11 | 12.8%) make up the most common classes of employment.
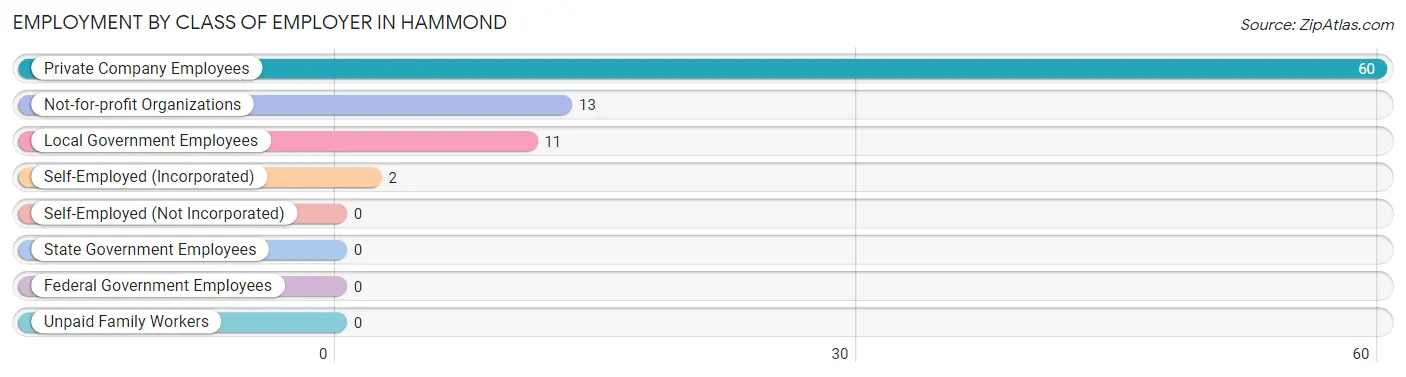
| Employer Class | # Employees | % Employees |
| Private Company Employees | 60 | 69.8% |
| Self-Employed (Incorporated) | 2 | 2.3% |
| Self-Employed (Not Incorporated) | 0 | 0.0% |
| Not-for-profit Organizations | 13 | 15.1% |
| Local Government Employees | 11 | 12.8% |
| State Government Employees | 0 | 0.0% |
| Federal Government Employees | 0 | 0.0% |
| Unpaid Family Workers | 0 | 0.0% |
| Total | 86 | 100.0% |
Employment Status by Age in Hammond
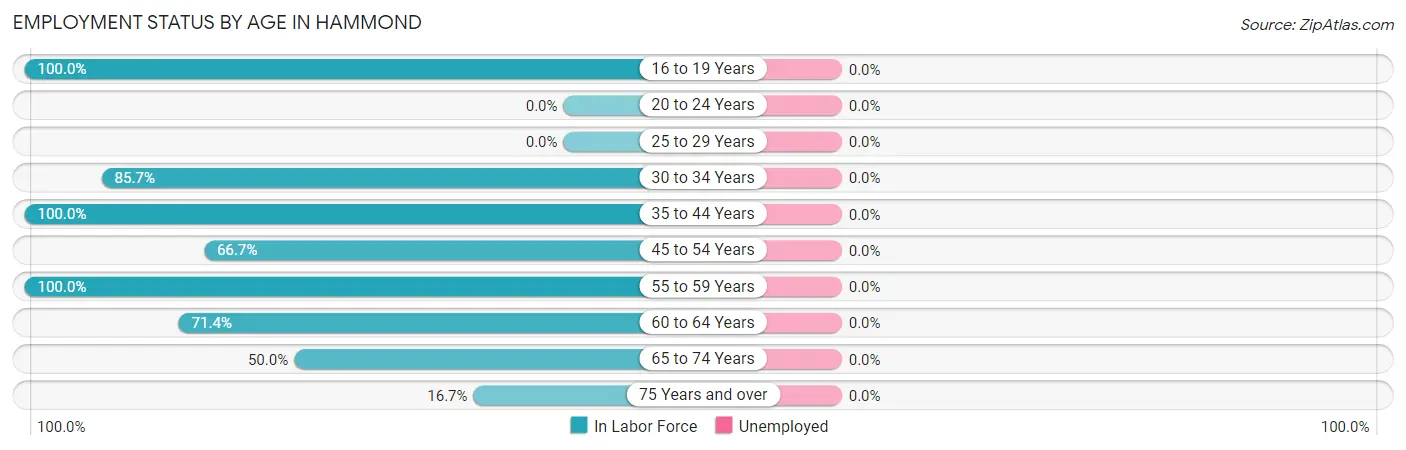
| Age Bracket | In Labor Force | Unemployed |
| 16 to 19 Years | 9 (100.0%) | 0 (0.0%) |
| 20 to 24 Years | 0 (0.0%) | 0 (0.0%) |
| 25 to 29 Years | 0 (0.0%) | 0 (0.0%) |
| 30 to 34 Years | 18 (85.7%) | 0 (0.0%) |
| 35 to 44 Years | 25 (100.0%) | 0 (0.0%) |
| 45 to 54 Years | 8 (66.7%) | 0 (0.0%) |
| 55 to 59 Years | 16 (100.0%) | 0 (0.0%) |
| 60 to 64 Years | 5 (71.4%) | 0 (0.0%) |
| 65 to 74 Years | 5 (50.0%) | 0 (0.0%) |
| 75 Years and over | 2 (16.7%) | 0 (0.0%) |
| Total | 88 (78.6%) | 0 (0.0%) |
Employment Status by Educational Attainment in Hammond
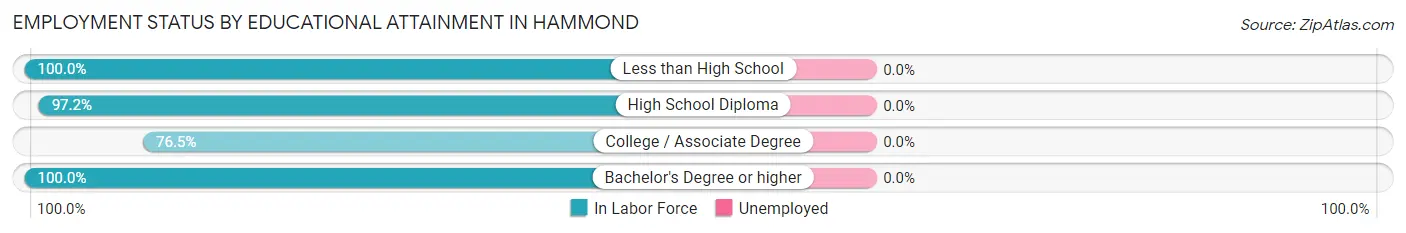
| Educational Attainment | In Labor Force | Unemployed |
| Less than High School | 2 (100.0%) | 0 (0.0%) |
| High School Diploma | 35 (97.2%) | 0 (0.0%) |
| College / Associate Degree | 26 (76.5%) | 0 (0.0%) |
| Bachelor's Degree or higher | 9 (100.0%) | 0 (0.0%) |
| Total | 72 (88.9%) | 0 (0.0%) |
Employment Occupations by Sex in Hammond
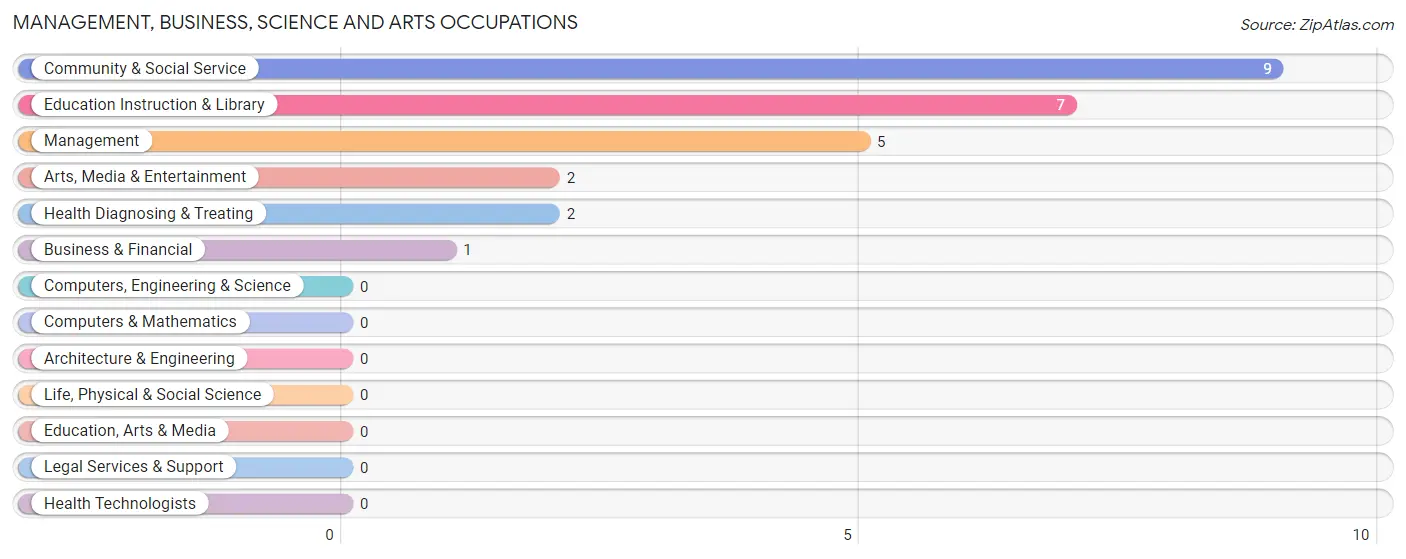
Management, Business, Science and Arts Occupations
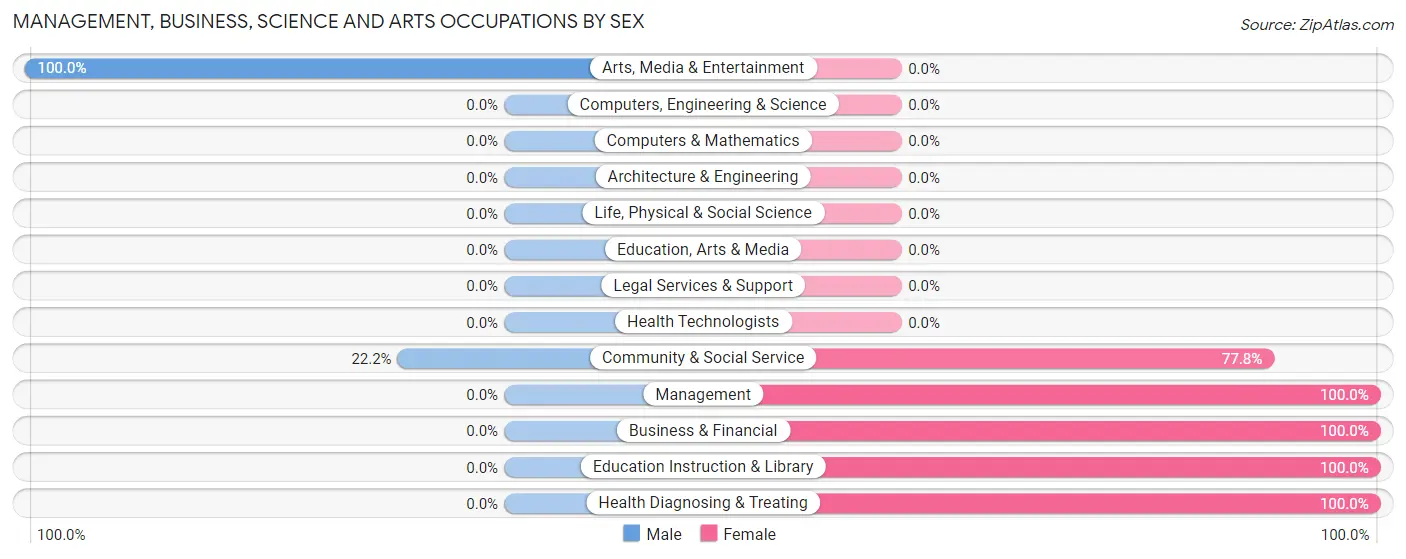
The most common Management, Business, Science and Arts occupations in Hammond are Community & Social Service (9 | 10.2%), Education Instruction & Library (7 | 8.0%), Management (5 | 5.7%), Arts, Media & Entertainment (2 | 2.3%), and Health Diagnosing & Treating (2 | 2.3%).
Management, Business, Science and Arts Occupations by Sex
Within the Management, Business, Science and Arts occupations in Hammond, the most male-oriented occupations are Arts, Media & Entertainment (100.0%), and Community & Social Service (22.2%), while the most female-oriented occupations are Management (100.0%), Business & Financial (100.0%), and Education Instruction & Library (100.0%).
| Occupation | Male | Female |
| Management | 0 (0.0%) | 5 (100.0%) |
| Business & Financial | 0 (0.0%) | 1 (100.0%) |
| Computers, Engineering & Science | 0 (0.0%) | 0 (0.0%) |
| Computers & Mathematics | 0 (0.0%) | 0 (0.0%) |
| Architecture & Engineering | 0 (0.0%) | 0 (0.0%) |
| Life, Physical & Social Science | 0 (0.0%) | 0 (0.0%) |
| Community & Social Service | 2 (22.2%) | 7 (77.8%) |
| Education, Arts & Media | 0 (0.0%) | 0 (0.0%) |
| Legal Services & Support | 0 (0.0%) | 0 (0.0%) |
| Education Instruction & Library | 0 (0.0%) | 7 (100.0%) |
| Arts, Media & Entertainment | 2 (100.0%) | 0 (0.0%) |
| Health Diagnosing & Treating | 0 (0.0%) | 2 (100.0%) |
| Health Technologists | 0 (0.0%) | 0 (0.0%) |
| Total (Category) | 2 (11.8%) | 15 (88.2%) |
| Total (Overall) | 37 (42.0%) | 51 (58.0%) |
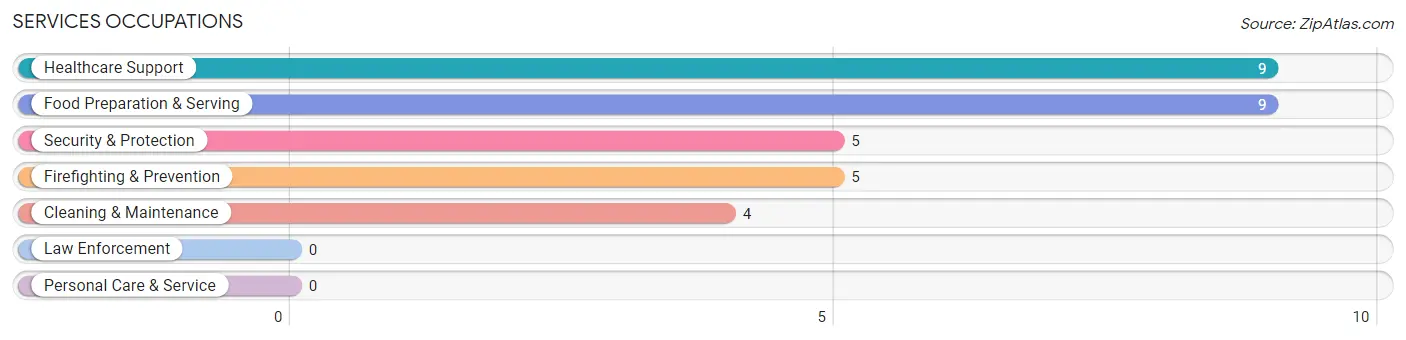
Services Occupations
The most common Services occupations in Hammond are Healthcare Support (9 | 10.2%), Food Preparation & Serving (9 | 10.2%), Security & Protection (5 | 5.7%), Firefighting & Prevention (5 | 5.7%), and Cleaning & Maintenance (4 | 4.5%).
Services Occupations by Sex
Within the Services occupations in Hammond, the most male-oriented occupations are Security & Protection (100.0%), Firefighting & Prevention (100.0%), and Cleaning & Maintenance (100.0%), while the most female-oriented occupations are Healthcare Support (100.0%), and Food Preparation & Serving (100.0%).
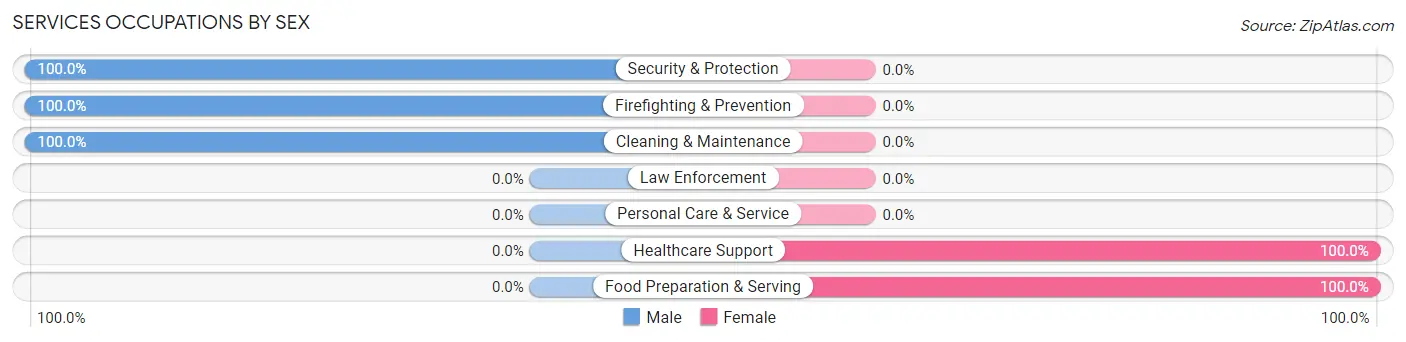
| Occupation | Male | Female |
| Healthcare Support | 0 (0.0%) | 9 (100.0%) |
| Security & Protection | 5 (100.0%) | 0 (0.0%) |
| Firefighting & Prevention | 5 (100.0%) | 0 (0.0%) |
| Law Enforcement | 0 (0.0%) | 0 (0.0%) |
| Food Preparation & Serving | 0 (0.0%) | 9 (100.0%) |
| Cleaning & Maintenance | 4 (100.0%) | 0 (0.0%) |
| Personal Care & Service | 0 (0.0%) | 0 (0.0%) |
| Total (Category) | 9 (33.3%) | 18 (66.7%) |
| Total (Overall) | 37 (42.0%) | 51 (58.0%) |
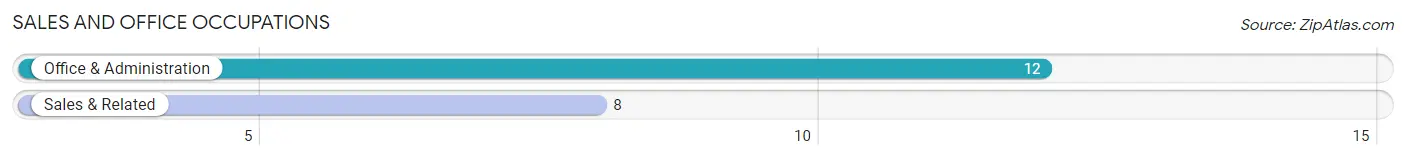
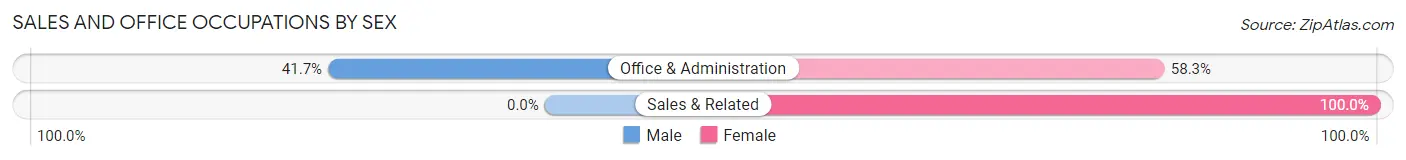
Sales and Office Occupations
The most common Sales and Office occupations in Hammond are Office & Administration (12 | 13.6%), and Sales & Related (8 | 9.1%).
Sales and Office Occupations by Sex
| Occupation | Male | Female |
| Sales & Related | 0 (0.0%) | 8 (100.0%) |
| Office & Administration | 5 (41.7%) | 7 (58.3%) |
| Total (Category) | 5 (25.0%) | 15 (75.0%) |
| Total (Overall) | 37 (42.0%) | 51 (58.0%) |
Natural Resources, Construction and Maintenance Occupations
The most common Natural Resources, Construction and Maintenance occupations in Hammond are , and Construction & Extraction (6 | 6.8%).
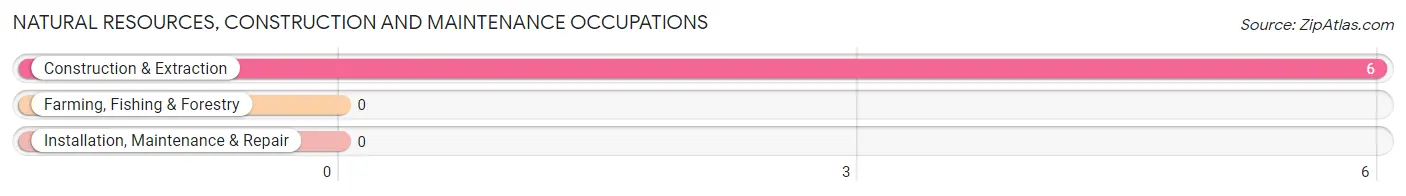
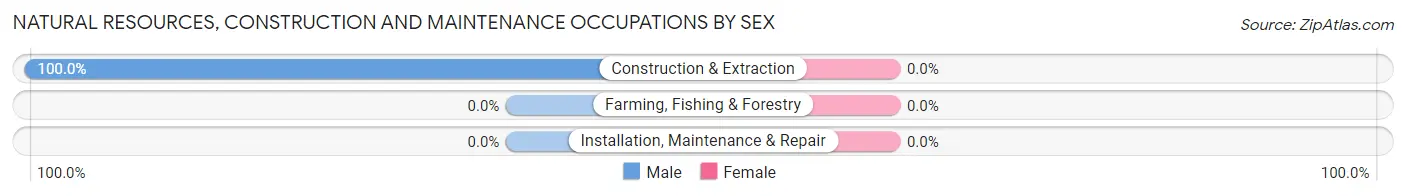
Natural Resources, Construction and Maintenance Occupations by Sex
| Occupation | Male | Female |
| Farming, Fishing & Forestry | 0 (0.0%) | 0 (0.0%) |
| Construction & Extraction | 6 (100.0%) | 0 (0.0%) |
| Installation, Maintenance & Repair | 0 (0.0%) | 0 (0.0%) |
| Total (Category) | 6 (100.0%) | 0 (0.0%) |
| Total (Overall) | 37 (42.0%) | 51 (58.0%) |
Production, Transportation and Moving Occupations
The most common Production, Transportation and Moving occupations in Hammond are Production (9 | 10.2%), Material Moving (6 | 6.8%), and Transportation (3 | 3.4%).
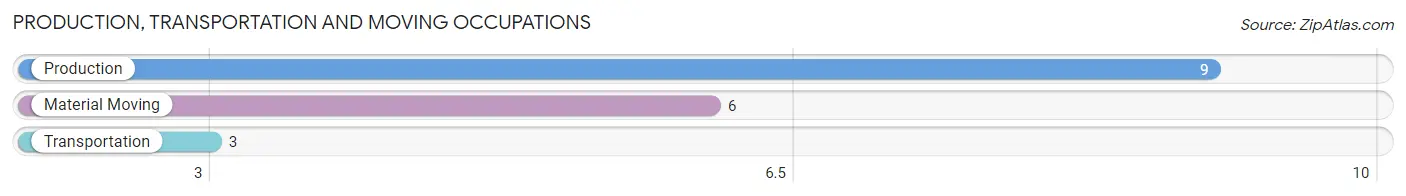
Production, Transportation and Moving Occupations by Sex
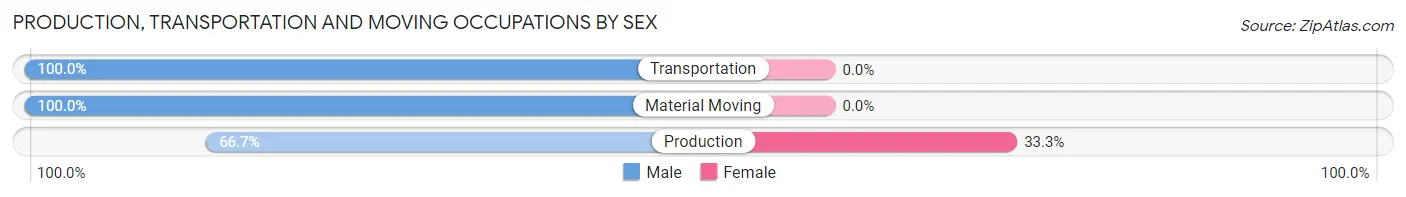
| Occupation | Male | Female |
| Production | 6 (66.7%) | 3 (33.3%) |
| Transportation | 3 (100.0%) | 0 (0.0%) |
| Material Moving | 6 (100.0%) | 0 (0.0%) |
| Total (Category) | 15 (83.3%) | 3 (16.7%) |
| Total (Overall) | 37 (42.0%) | 51 (58.0%) |
Employment Industries by Sex in Hammond
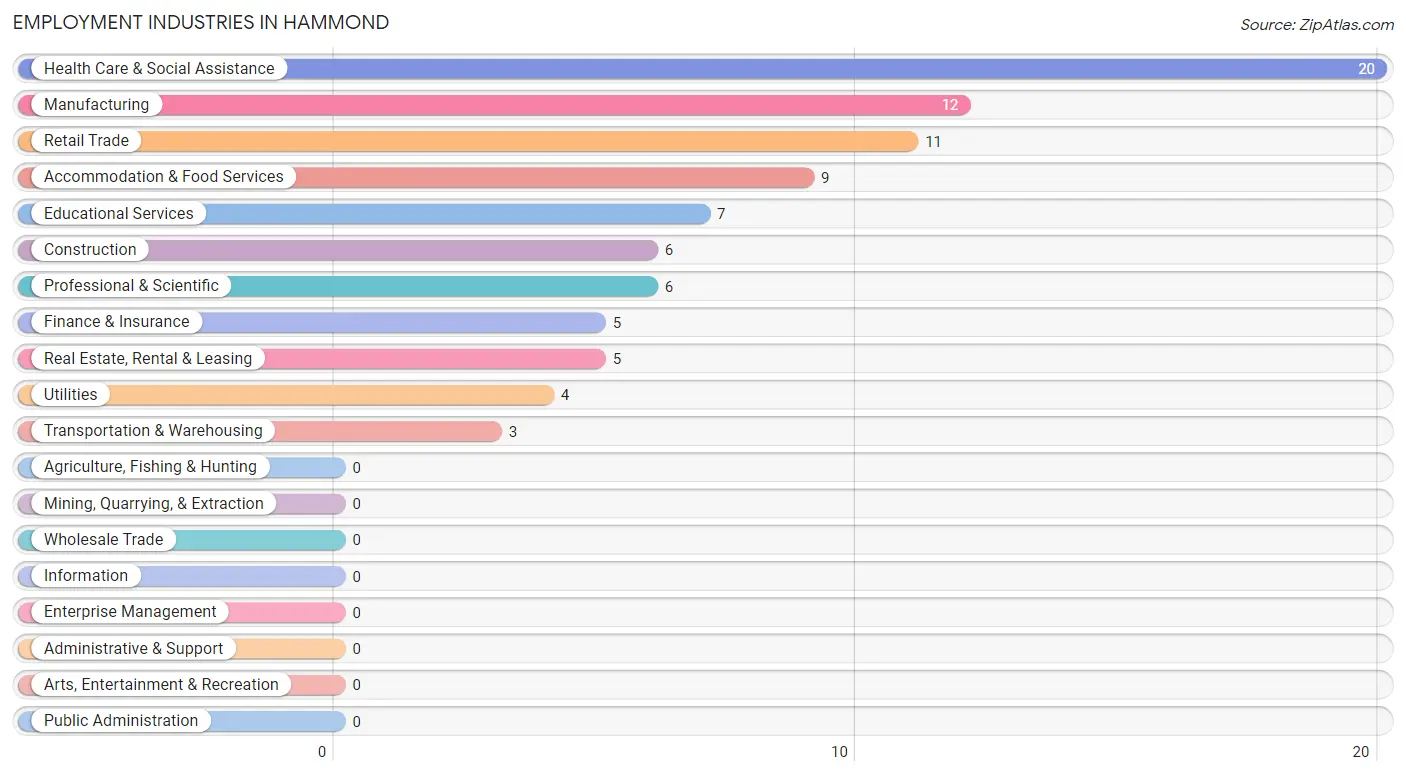
Employment Industries in Hammond
The major employment industries in Hammond include Health Care & Social Assistance (20 | 22.7%), Manufacturing (12 | 13.6%), Retail Trade (11 | 12.5%), Accommodation & Food Services (9 | 10.2%), and Educational Services (7 | 8.0%).
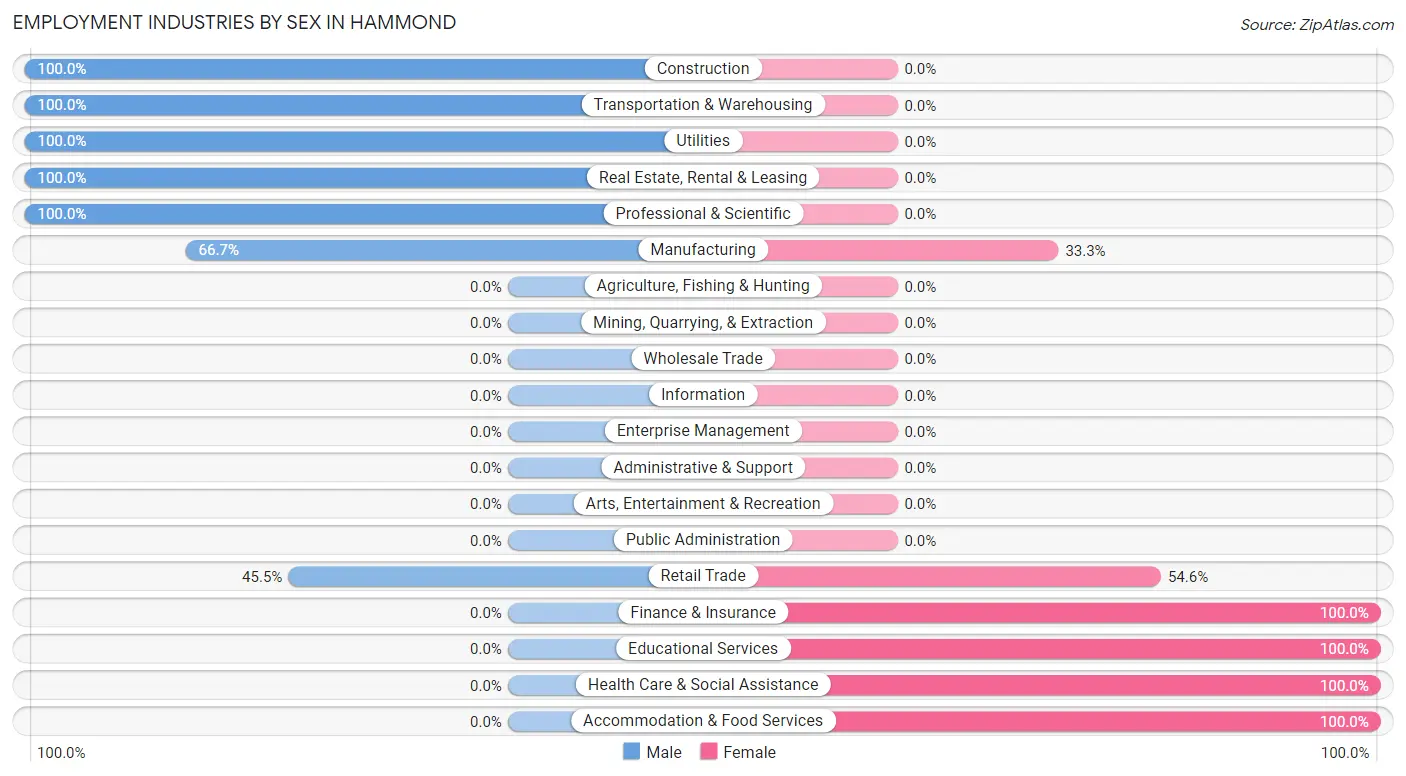
Employment Industries by Sex in Hammond
The Hammond industries that see more men than women are Construction (100.0%), Transportation & Warehousing (100.0%), and Utilities (100.0%), whereas the industries that tend to have a higher number of women are Finance & Insurance (100.0%), Educational Services (100.0%), and Health Care & Social Assistance (100.0%).
| Industry | Male | Female |
| Agriculture, Fishing & Hunting | 0 (0.0%) | 0 (0.0%) |
| Mining, Quarrying, & Extraction | 0 (0.0%) | 0 (0.0%) |
| Construction | 6 (100.0%) | 0 (0.0%) |
| Manufacturing | 8 (66.7%) | 4 (33.3%) |
| Wholesale Trade | 0 (0.0%) | 0 (0.0%) |
| Retail Trade | 5 (45.5%) | 6 (54.5%) |
| Transportation & Warehousing | 3 (100.0%) | 0 (0.0%) |
| Utilities | 4 (100.0%) | 0 (0.0%) |
| Information | 0 (0.0%) | 0 (0.0%) |
| Finance & Insurance | 0 (0.0%) | 5 (100.0%) |
| Real Estate, Rental & Leasing | 5 (100.0%) | 0 (0.0%) |
| Professional & Scientific | 6 (100.0%) | 0 (0.0%) |
| Enterprise Management | 0 (0.0%) | 0 (0.0%) |
| Administrative & Support | 0 (0.0%) | 0 (0.0%) |
| Educational Services | 0 (0.0%) | 7 (100.0%) |
| Health Care & Social Assistance | 0 (0.0%) | 20 (100.0%) |
| Arts, Entertainment & Recreation | 0 (0.0%) | 0 (0.0%) |
| Accommodation & Food Services | 0 (0.0%) | 9 (100.0%) |
| Public Administration | 0 (0.0%) | 0 (0.0%) |
| Total | 37 (42.0%) | 51 (58.0%) |
Education in Hammond
School Enrollment in Hammond
The most common levels of schooling among the 19 students in Hammond are high school (8 | 42.1%), nursery / preschool (6 | 31.6%), and college / undergraduate (4 | 21.0%).
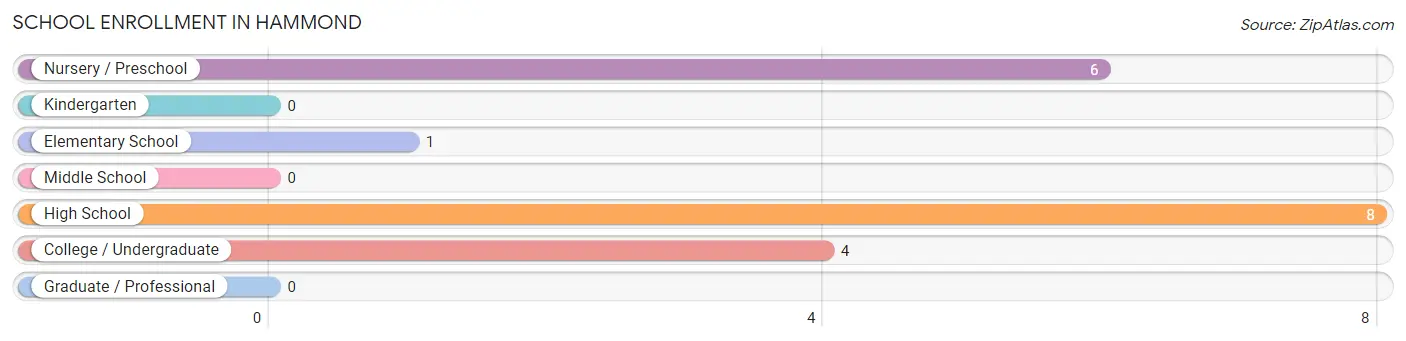
| School Level | # Students | % Students |
| Nursery / Preschool | 6 | 31.6% |
| Kindergarten | 0 | 0.0% |
| Elementary School | 1 | 5.3% |
| Middle School | 0 | 0.0% |
| High School | 8 | 42.1% |
| College / Undergraduate | 4 | 21.0% |
| Graduate / Professional | 0 | 0.0% |
| Total | 19 | 100.0% |
School Enrollment by Age by Funding Source in Hammond
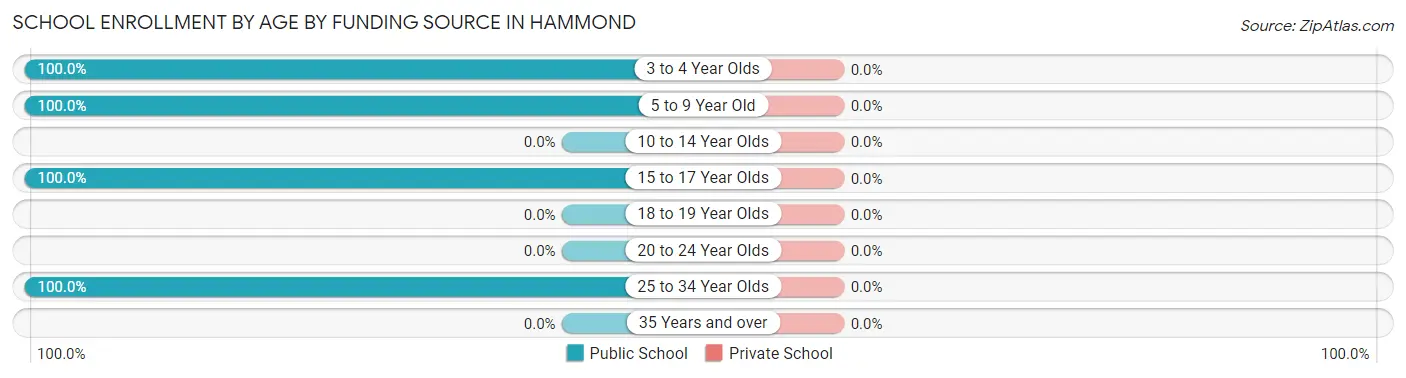
| Age Bracket | Public School | Private School |
| 3 to 4 Year Olds | 6 (100.0%) | 0 (0.0%) |
| 5 to 9 Year Old | 1 (100.0%) | 0 (0.0%) |
| 10 to 14 Year Olds | 0 (0.0%) | 0 (0.0%) |
| 15 to 17 Year Olds | 8 (100.0%) | 0 (0.0%) |
| 18 to 19 Year Olds | 0 (0.0%) | 0 (0.0%) |
| 20 to 24 Year Olds | 0 (0.0%) | 0 (0.0%) |
| 25 to 34 Year Olds | 4 (100.0%) | 0 (0.0%) |
| 35 Years and over | 0 (0.0%) | 0 (0.0%) |
| Total | 19 (100.0%) | 0 (0.0%) |
Educational Attainment by Field of Study in Hammond
Education (7 | 53.8%), literature & languages (2 | 15.4%), liberal arts & history (2 | 15.4%), psychology (1 | 7.7%), and business (1 | 7.7%) are the most common fields of study among 13 individuals in Hammond who have obtained a bachelor's degree or higher.
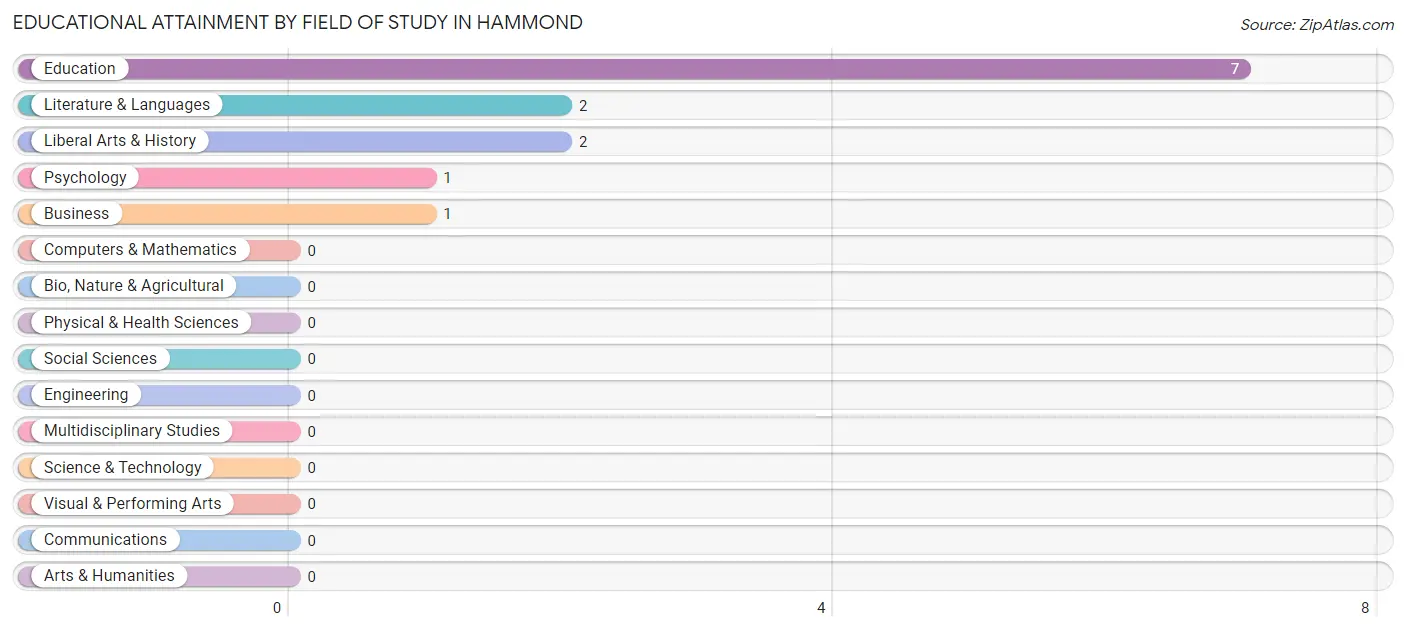
| Field of Study | # Graduates | % Graduates |
| Computers & Mathematics | 0 | 0.0% |
| Bio, Nature & Agricultural | 0 | 0.0% |
| Physical & Health Sciences | 0 | 0.0% |
| Psychology | 1 | 7.7% |
| Social Sciences | 0 | 0.0% |
| Engineering | 0 | 0.0% |
| Multidisciplinary Studies | 0 | 0.0% |
| Science & Technology | 0 | 0.0% |
| Business | 1 | 7.7% |
| Education | 7 | 53.8% |
| Literature & Languages | 2 | 15.4% |
| Liberal Arts & History | 2 | 15.4% |
| Visual & Performing Arts | 0 | 0.0% |
| Communications | 0 | 0.0% |
| Arts & Humanities | 0 | 0.0% |
| Total | 13 | 100.0% |
Transportation & Commute in Hammond
Vehicle Availability by Sex in Hammond
The most prevalent vehicle ownership categories in Hammond are males with 3 vehicles (20, accounting for 57.1%) and females with 3 vehicles (29, making up 39.2%).
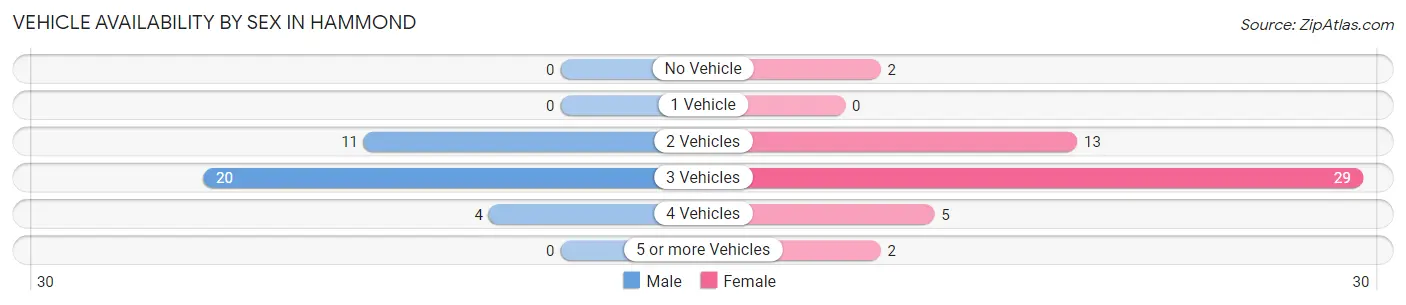
| Vehicles Available | Male | Female |
| No Vehicle | 0 (0.0%) | 2 (3.9%) |
| 1 Vehicle | 0 (0.0%) | 0 (0.0%) |
| 2 Vehicles | 11 (31.4%) | 13 (25.5%) |
| 3 Vehicles | 20 (57.1%) | 29 (56.9%) |
| 4 Vehicles | 4 (11.4%) | 5 (9.8%) |
| 5 or more Vehicles | 0 (0.0%) | 2 (3.9%) |
| Total | 35 (100.0%) | 51 (100.0%) |
Commute Time in Hammond
The most frequently occuring commute durations in Hammond are 30 to 34 minutes (37 commuters, 52.9%), 20 to 24 minutes (14 commuters, 20.0%), and 60 to 89 minutes (8 commuters, 11.4%).
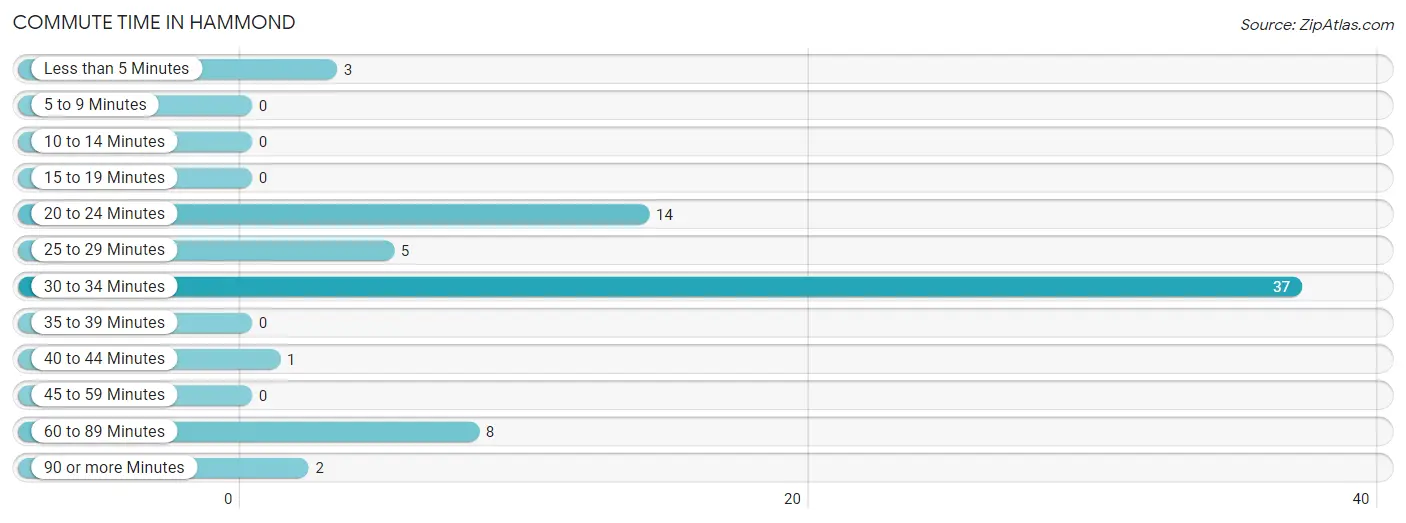
| Commute Time | # Commuters | % Commuters |
| Less than 5 Minutes | 3 | 4.3% |
| 5 to 9 Minutes | 0 | 0.0% |
| 10 to 14 Minutes | 0 | 0.0% |
| 15 to 19 Minutes | 0 | 0.0% |
| 20 to 24 Minutes | 14 | 20.0% |
| 25 to 29 Minutes | 5 | 7.1% |
| 30 to 34 Minutes | 37 | 52.9% |
| 35 to 39 Minutes | 0 | 0.0% |
| 40 to 44 Minutes | 1 | 1.4% |
| 45 to 59 Minutes | 0 | 0.0% |
| 60 to 89 Minutes | 8 | 11.4% |
| 90 or more Minutes | 2 | 2.9% |
Commute Time by Sex in Hammond
The most common commute times in Hammond are 30 to 34 minutes (14 commuters, 46.7%) for males and 30 to 34 minutes (23 commuters, 57.5%) for females.
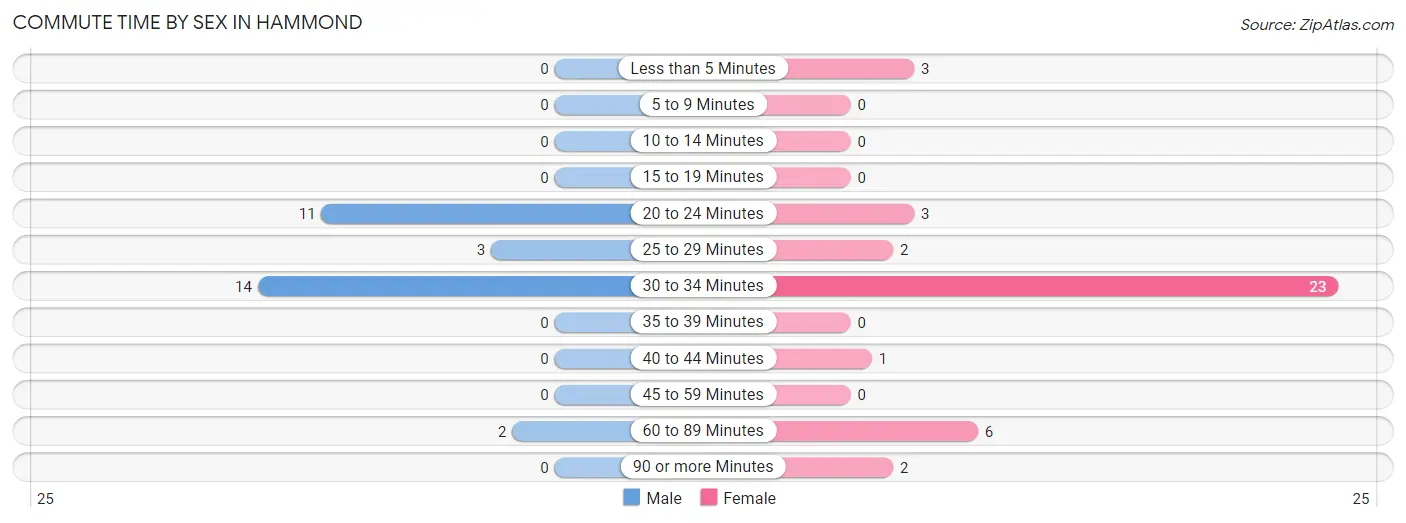
| Commute Time | Male | Female |
| Less than 5 Minutes | 0 (0.0%) | 3 (7.5%) |
| 5 to 9 Minutes | 0 (0.0%) | 0 (0.0%) |
| 10 to 14 Minutes | 0 (0.0%) | 0 (0.0%) |
| 15 to 19 Minutes | 0 (0.0%) | 0 (0.0%) |
| 20 to 24 Minutes | 11 (36.7%) | 3 (7.5%) |
| 25 to 29 Minutes | 3 (10.0%) | 2 (5.0%) |
| 30 to 34 Minutes | 14 (46.7%) | 23 (57.5%) |
| 35 to 39 Minutes | 0 (0.0%) | 0 (0.0%) |
| 40 to 44 Minutes | 0 (0.0%) | 1 (2.5%) |
| 45 to 59 Minutes | 0 (0.0%) | 0 (0.0%) |
| 60 to 89 Minutes | 2 (6.7%) | 6 (15.0%) |
| 90 or more Minutes | 0 (0.0%) | 2 (5.0%) |
Time of Departure to Work by Sex in Hammond
The most frequent times of departure to work in Hammond are 5:30 AM to 5:59 AM (7, 23.3%) for males and 6:00 AM to 6:29 AM (11, 27.5%) for females.
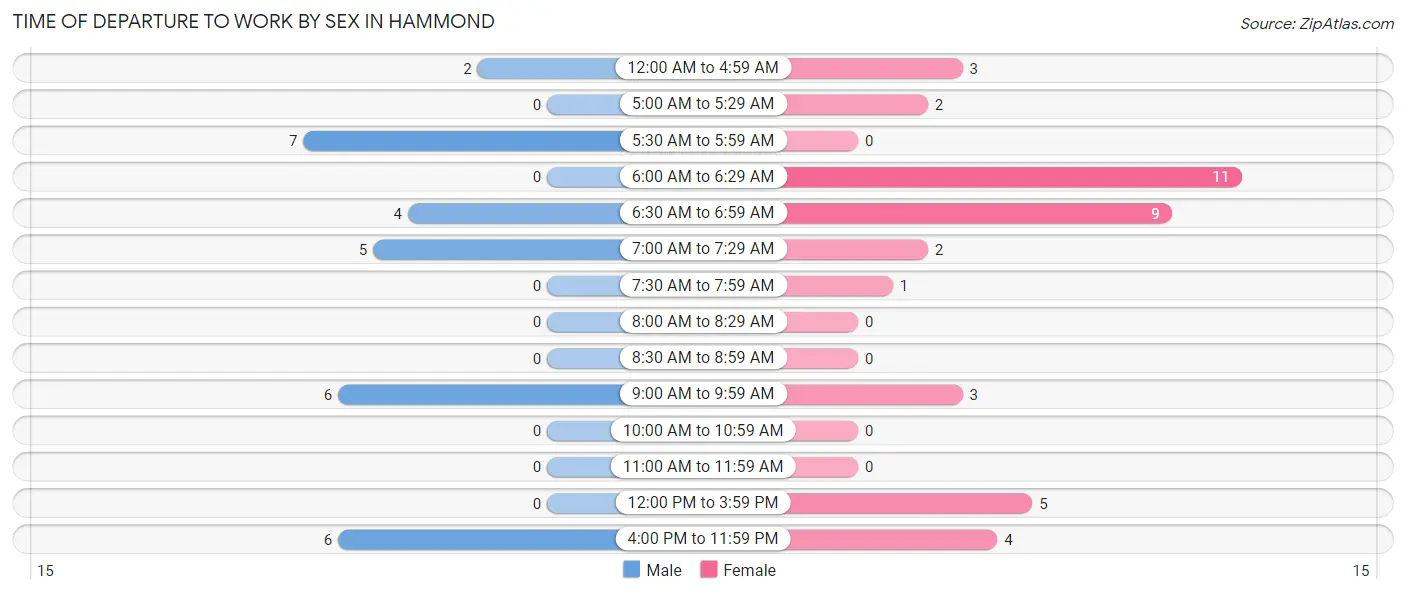
| Time of Departure | Male | Female |
| 12:00 AM to 4:59 AM | 2 (6.7%) | 3 (7.5%) |
| 5:00 AM to 5:29 AM | 0 (0.0%) | 2 (5.0%) |
| 5:30 AM to 5:59 AM | 7 (23.3%) | 0 (0.0%) |
| 6:00 AM to 6:29 AM | 0 (0.0%) | 11 (27.5%) |
| 6:30 AM to 6:59 AM | 4 (13.3%) | 9 (22.5%) |
| 7:00 AM to 7:29 AM | 5 (16.7%) | 2 (5.0%) |
| 7:30 AM to 7:59 AM | 0 (0.0%) | 1 (2.5%) |
| 8:00 AM to 8:29 AM | 0 (0.0%) | 0 (0.0%) |
| 8:30 AM to 8:59 AM | 0 (0.0%) | 0 (0.0%) |
| 9:00 AM to 9:59 AM | 6 (20.0%) | 3 (7.5%) |
| 10:00 AM to 10:59 AM | 0 (0.0%) | 0 (0.0%) |
| 11:00 AM to 11:59 AM | 0 (0.0%) | 0 (0.0%) |
| 12:00 PM to 3:59 PM | 0 (0.0%) | 5 (12.5%) |
| 4:00 PM to 11:59 PM | 6 (20.0%) | 4 (10.0%) |
| Total | 30 (100.0%) | 40 (100.0%) |
Housing Occupancy in Hammond
Occupancy by Ownership in Hammond
Of the total 57 dwellings in Hammond, owner-occupied units account for 52 (91.2%), while renter-occupied units make up 5 (8.8%).
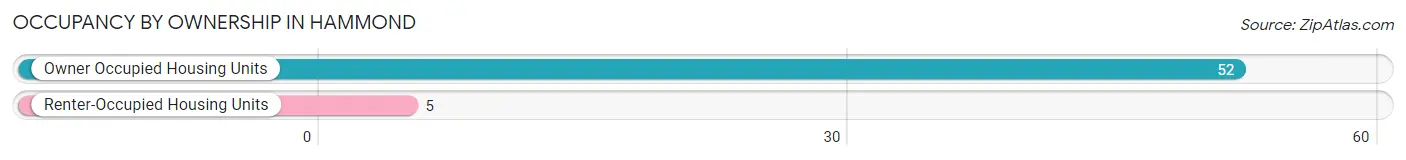
| Occupancy | # Housing Units | % Housing Units |
| Owner Occupied Housing Units | 52 | 91.2% |
| Renter-Occupied Housing Units | 5 | 8.8% |
| Total Occupied Housing Units | 57 | 100.0% |
Occupancy by Household Size in Hammond
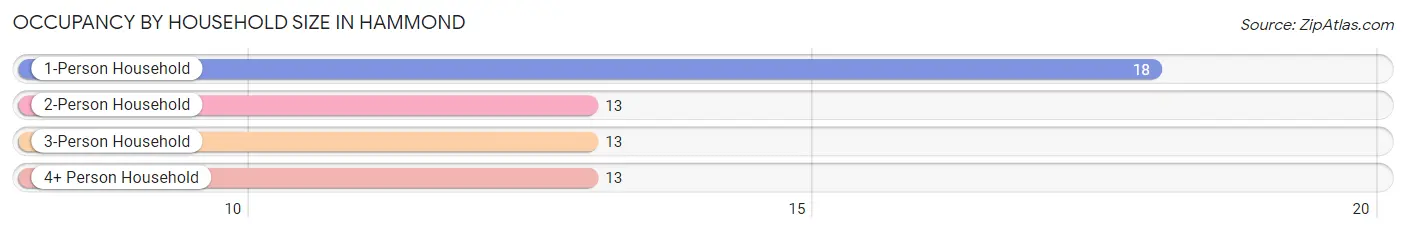
| Household Size | # Housing Units | % Housing Units |
| 1-Person Household | 18 | 31.6% |
| 2-Person Household | 13 | 22.8% |
| 3-Person Household | 13 | 22.8% |
| 4+ Person Household | 13 | 22.8% |
| Total Housing Units | 57 | 100.0% |
Occupancy by Ownership by Household Size in Hammond
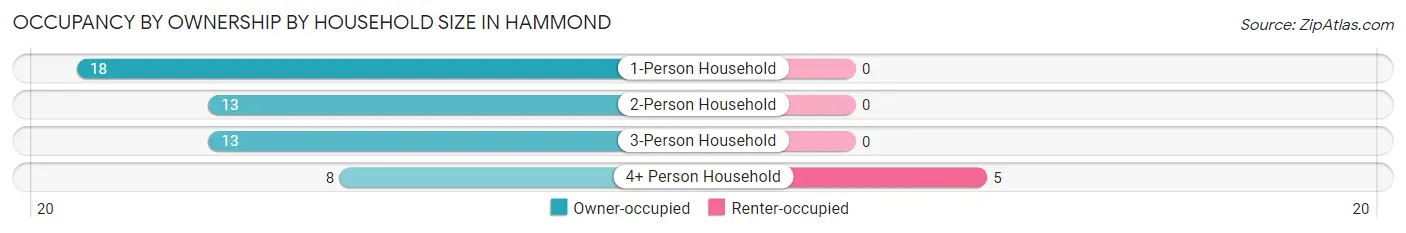
| Household Size | Owner-occupied | Renter-occupied |
| 1-Person Household | 18 (100.0%) | 0 (0.0%) |
| 2-Person Household | 13 (100.0%) | 0 (0.0%) |
| 3-Person Household | 13 (100.0%) | 0 (0.0%) |
| 4+ Person Household | 8 (61.5%) | 5 (38.5%) |
| Total Housing Units | 52 (91.2%) | 5 (8.8%) |
Occupancy by Educational Attainment in Hammond
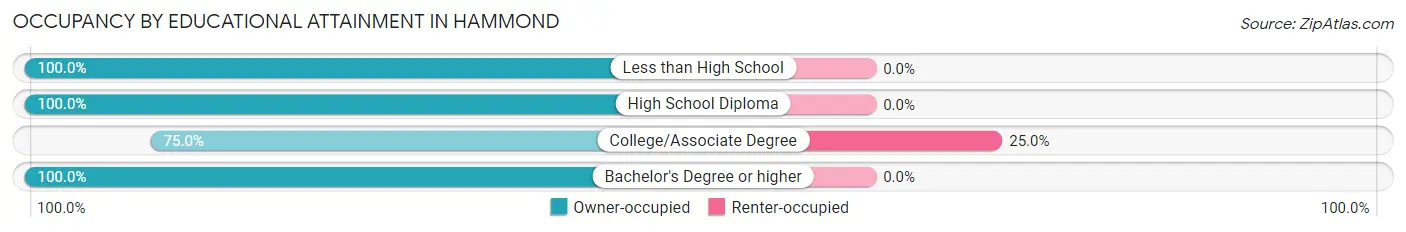
| Household Size | Owner-occupied | Renter-occupied |
| Less than High School | 8 (100.0%) | 0 (0.0%) |
| High School Diploma | 26 (100.0%) | 0 (0.0%) |
| College/Associate Degree | 15 (75.0%) | 5 (25.0%) |
| Bachelor's Degree or higher | 3 (100.0%) | 0 (0.0%) |
Occupancy by Age of Householder in Hammond
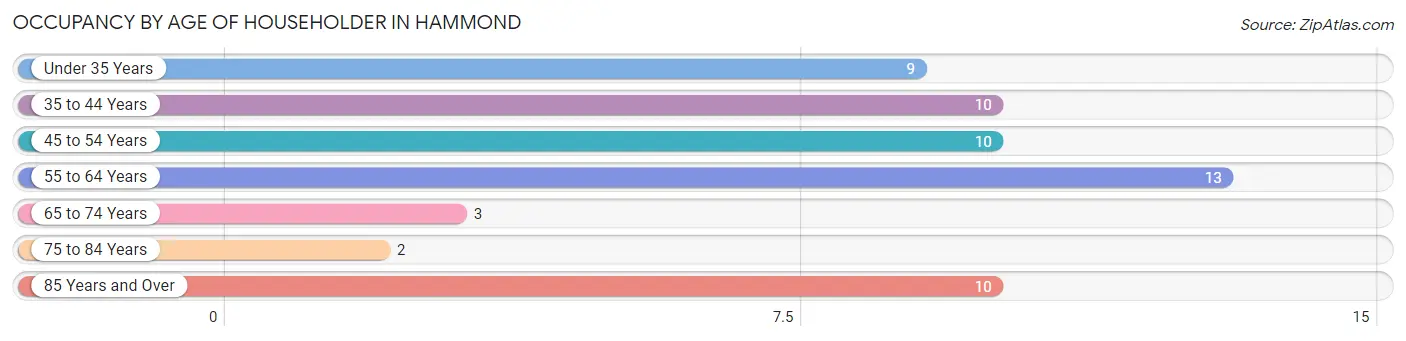
| Age Bracket | # Households | % Households |
| Under 35 Years | 9 | 15.8% |
| 35 to 44 Years | 10 | 17.5% |
| 45 to 54 Years | 10 | 17.5% |
| 55 to 64 Years | 13 | 22.8% |
| 65 to 74 Years | 3 | 5.3% |
| 75 to 84 Years | 2 | 3.5% |
| 85 Years and Over | 10 | 17.5% |
| Total | 57 | 100.0% |
Housing Finances in Hammond
Median Income by Occupancy in Hammond
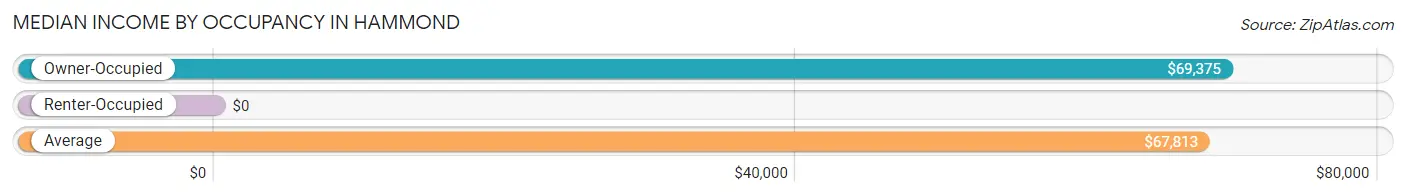
| Occupancy Type | # Households | Median Income |
| Owner-Occupied | 52 (91.2%) | $69,375 |
| Renter-Occupied | 5 (8.8%) | $0 |
| Average | 57 (100.0%) | $67,813 |
Occupancy by Householder Income Bracket in Hammond
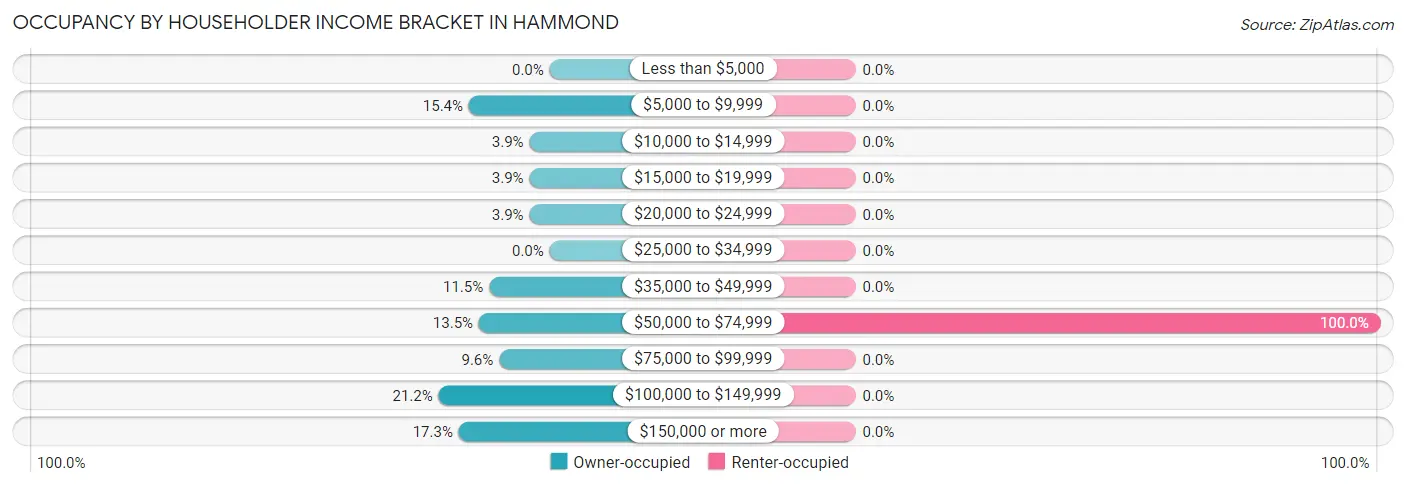
| Income Bracket | Owner-occupied | Renter-occupied |
| Less than $5,000 | 0 (0.0%) | 0 (0.0%) |
| $5,000 to $9,999 | 8 (15.4%) | 0 (0.0%) |
| $10,000 to $14,999 | 2 (3.8%) | 0 (0.0%) |
| $15,000 to $19,999 | 2 (3.8%) | 0 (0.0%) |
| $20,000 to $24,999 | 2 (3.8%) | 0 (0.0%) |
| $25,000 to $34,999 | 0 (0.0%) | 0 (0.0%) |
| $35,000 to $49,999 | 6 (11.5%) | 0 (0.0%) |
| $50,000 to $74,999 | 7 (13.5%) | 5 (100.0%) |
| $75,000 to $99,999 | 5 (9.6%) | 0 (0.0%) |
| $100,000 to $149,999 | 11 (21.1%) | 0 (0.0%) |
| $150,000 or more | 9 (17.3%) | 0 (0.0%) |
| Total | 52 (100.0%) | 5 (100.0%) |
Monthly Housing Cost Tiers in Hammond
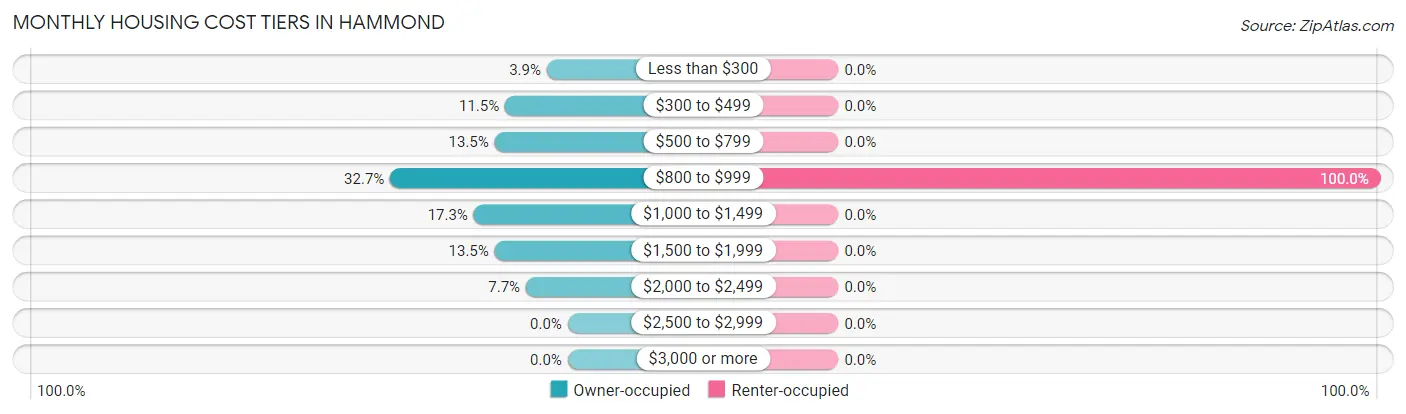
| Monthly Cost | Owner-occupied | Renter-occupied |
| Less than $300 | 2 (3.8%) | 0 (0.0%) |
| $300 to $499 | 6 (11.5%) | 0 (0.0%) |
| $500 to $799 | 7 (13.5%) | 0 (0.0%) |
| $800 to $999 | 17 (32.7%) | 5 (100.0%) |
| $1,000 to $1,499 | 9 (17.3%) | 0 (0.0%) |
| $1,500 to $1,999 | 7 (13.5%) | 0 (0.0%) |
| $2,000 to $2,499 | 4 (7.7%) | 0 (0.0%) |
| $2,500 to $2,999 | 0 (0.0%) | 0 (0.0%) |
| $3,000 or more | 0 (0.0%) | 0 (0.0%) |
| Total | 52 (100.0%) | 5 (100.0%) |
Physical Housing Characteristics in Hammond
Housing Structures in Hammond
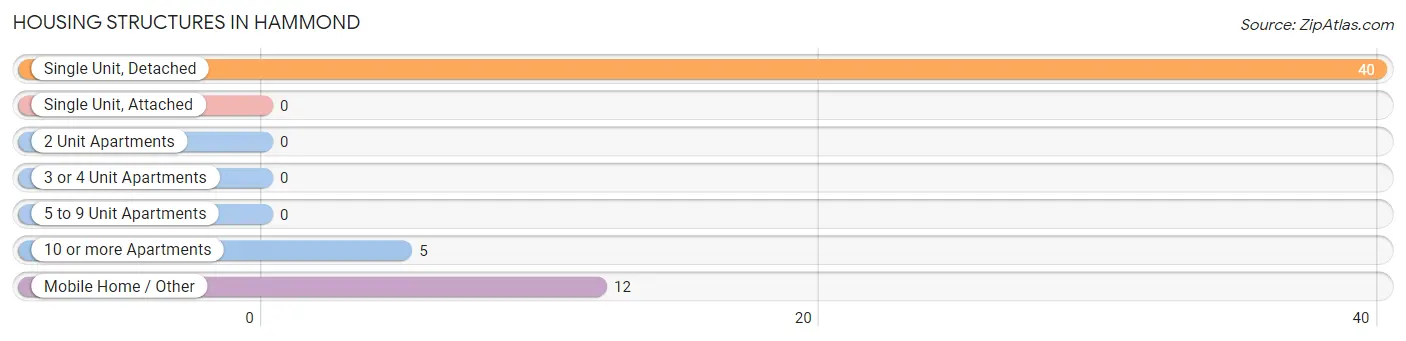
| Structure Type | # Housing Units | % Housing Units |
| Single Unit, Detached | 40 | 70.2% |
| Single Unit, Attached | 0 | 0.0% |
| 2 Unit Apartments | 0 | 0.0% |
| 3 or 4 Unit Apartments | 0 | 0.0% |
| 5 to 9 Unit Apartments | 0 | 0.0% |
| 10 or more Apartments | 5 | 8.8% |
| Mobile Home / Other | 12 | 21.0% |
| Total | 57 | 100.0% |
Housing Structures by Occupancy in Hammond
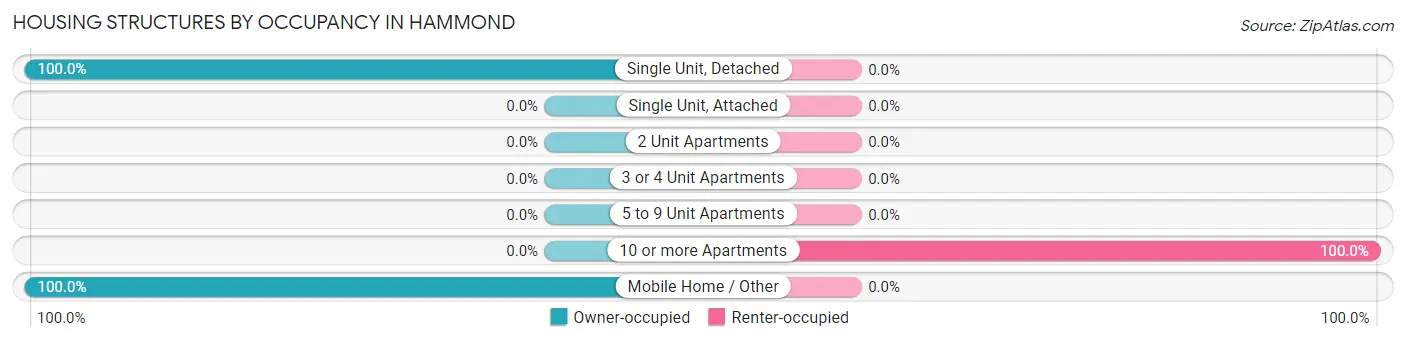
| Structure Type | Owner-occupied | Renter-occupied |
| Single Unit, Detached | 40 (100.0%) | 0 (0.0%) |
| Single Unit, Attached | 0 (0.0%) | 0 (0.0%) |
| 2 Unit Apartments | 0 (0.0%) | 0 (0.0%) |
| 3 or 4 Unit Apartments | 0 (0.0%) | 0 (0.0%) |
| 5 to 9 Unit Apartments | 0 (0.0%) | 0 (0.0%) |
| 10 or more Apartments | 0 (0.0%) | 5 (100.0%) |
| Mobile Home / Other | 12 (100.0%) | 0 (0.0%) |
| Total | 52 (91.2%) | 5 (8.8%) |
Housing Structures by Number of Rooms in Hammond
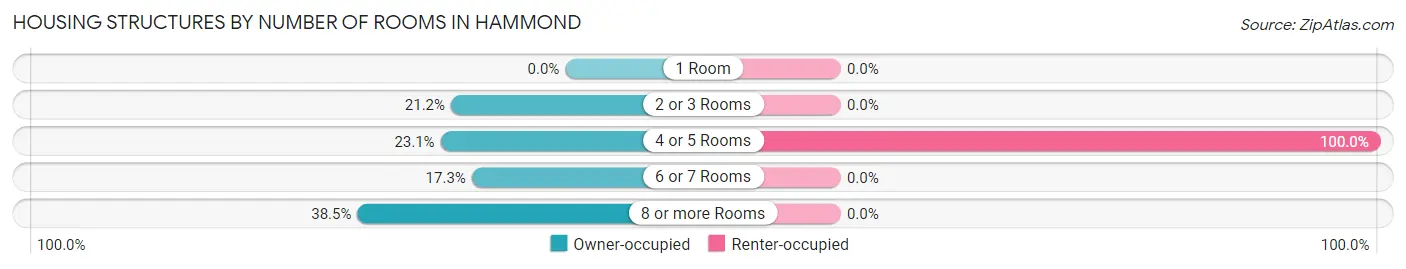
| Number of Rooms | Owner-occupied | Renter-occupied |
| 1 Room | 0 (0.0%) | 0 (0.0%) |
| 2 or 3 Rooms | 11 (21.1%) | 0 (0.0%) |
| 4 or 5 Rooms | 12 (23.1%) | 5 (100.0%) |
| 6 or 7 Rooms | 9 (17.3%) | 0 (0.0%) |
| 8 or more Rooms | 20 (38.5%) | 0 (0.0%) |
| Total | 52 (100.0%) | 5 (100.0%) |
Housing Structure by Heating Type in Hammond
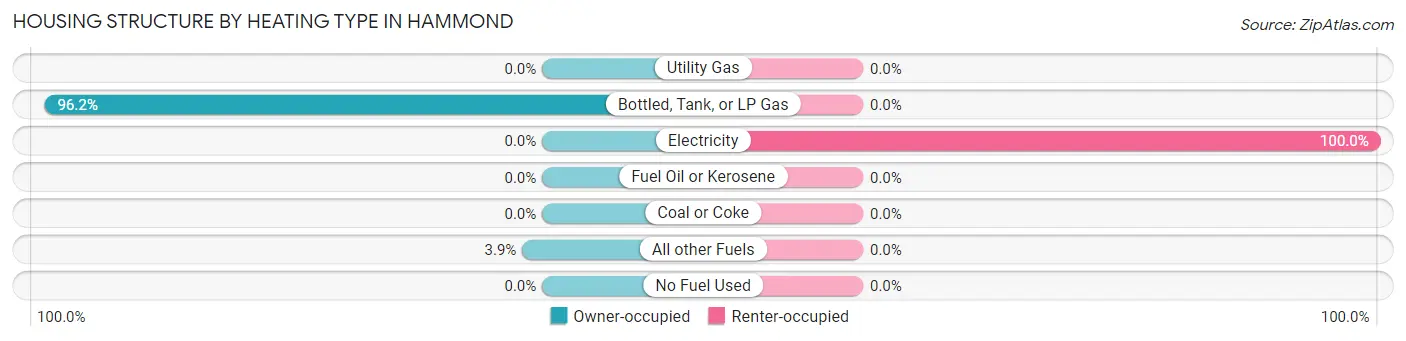
| Heating Type | Owner-occupied | Renter-occupied |
| Utility Gas | 0 (0.0%) | 0 (0.0%) |
| Bottled, Tank, or LP Gas | 50 (96.2%) | 0 (0.0%) |
| Electricity | 0 (0.0%) | 5 (100.0%) |
| Fuel Oil or Kerosene | 0 (0.0%) | 0 (0.0%) |
| Coal or Coke | 0 (0.0%) | 0 (0.0%) |
| All other Fuels | 2 (3.8%) | 0 (0.0%) |
| No Fuel Used | 0 (0.0%) | 0 (0.0%) |
| Total | 52 (100.0%) | 5 (100.0%) |
Household Vehicle Usage in Hammond

| Vehicles per Household | Owner-occupied | Renter-occupied |
| No Vehicle | 2 (3.8%) | 0 (0.0%) |
| 1 Vehicle | 12 (23.1%) | 0 (0.0%) |
| 2 Vehicles | 13 (25.0%) | 5 (100.0%) |
| 3 or more Vehicles | 25 (48.1%) | 0 (0.0%) |
| Total | 52 (100.0%) | 5 (100.0%) |
Real Estate & Mortgages in Hammond
Real Estate and Mortgage Overview in Hammond
| Characteristic | Without Mortgage | With Mortgage |
| Housing Units | 13 | 39 |
| Median Property Value | $143,800 | $0 |
| Median Household Income | - | - |
| Monthly Housing Costs | $388 | $0 |
| Real Estate Taxes | $1,563 | $0 |
Property Value by Mortgage Status in Hammond
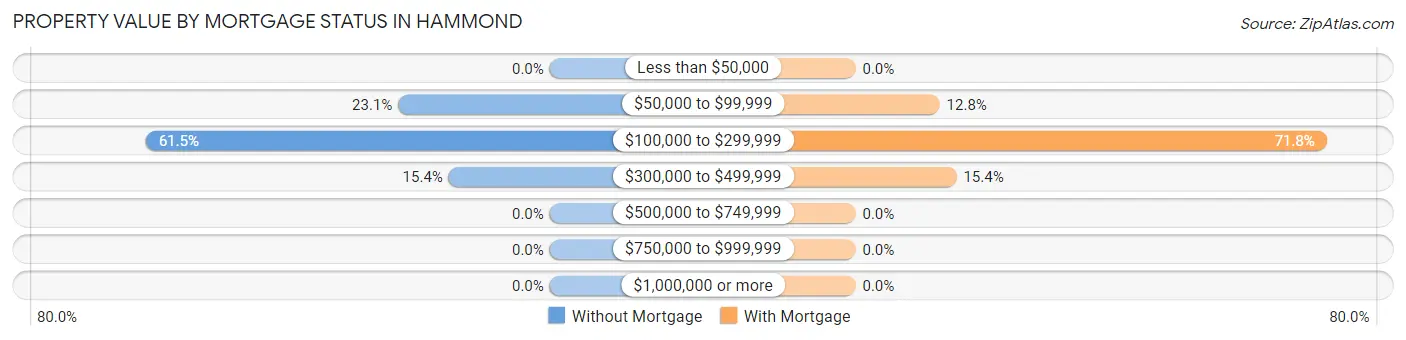
| Property Value | Without Mortgage | With Mortgage |
| Less than $50,000 | 0 (0.0%) | 0 (0.0%) |
| $50,000 to $99,999 | 3 (23.1%) | 5 (12.8%) |
| $100,000 to $299,999 | 8 (61.5%) | 28 (71.8%) |
| $300,000 to $499,999 | 2 (15.4%) | 6 (15.4%) |
| $500,000 to $749,999 | 0 (0.0%) | 0 (0.0%) |
| $750,000 to $999,999 | 0 (0.0%) | 0 (0.0%) |
| $1,000,000 or more | 0 (0.0%) | 0 (0.0%) |
| Total | 13 (100.0%) | 39 (100.0%) |
Household Income by Mortgage Status in Hammond
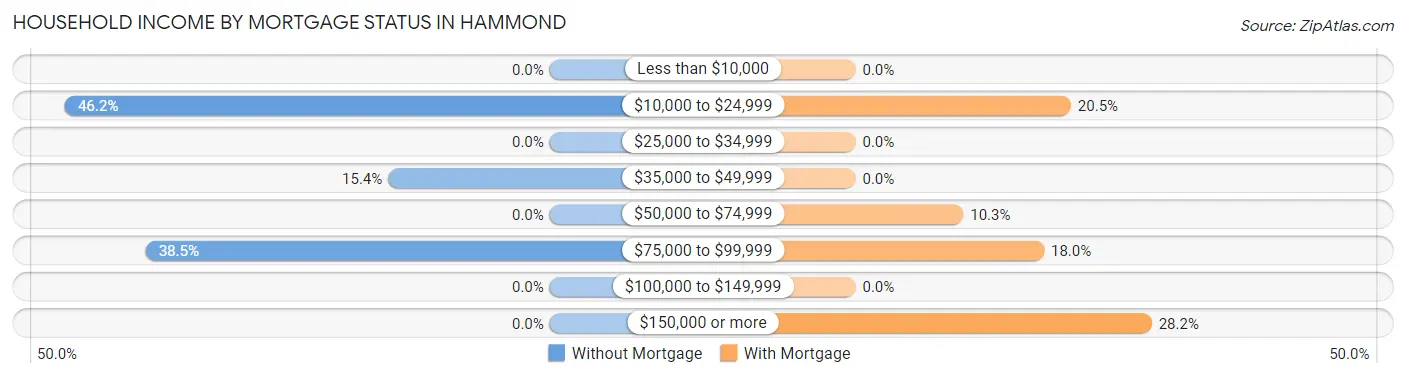
| Household Income | Without Mortgage | With Mortgage |
| Less than $10,000 | 0 (0.0%) | 0 (0.0%) |
| $10,000 to $24,999 | 6 (46.2%) | 8 (20.5%) |
| $25,000 to $34,999 | 0 (0.0%) | 0 (0.0%) |
| $35,000 to $49,999 | 2 (15.4%) | 0 (0.0%) |
| $50,000 to $74,999 | 0 (0.0%) | 4 (10.3%) |
| $75,000 to $99,999 | 5 (38.5%) | 7 (17.9%) |
| $100,000 to $149,999 | 0 (0.0%) | 0 (0.0%) |
| $150,000 or more | 0 (0.0%) | 11 (28.2%) |
| Total | 13 (100.0%) | 39 (100.0%) |
Property Value to Household Income Ratio in Hammond
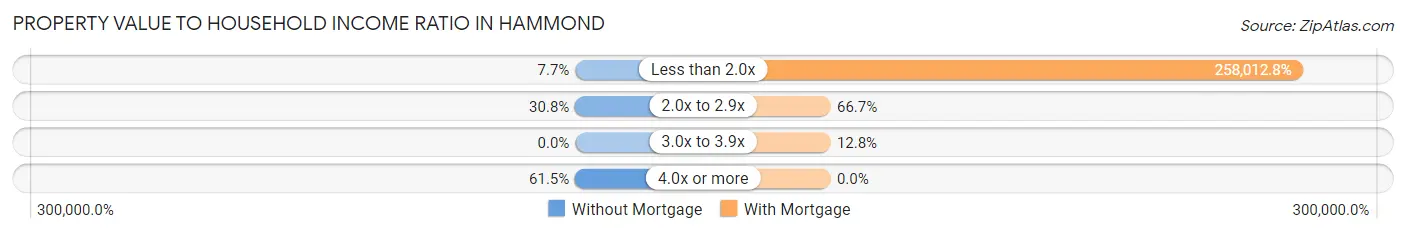
| Value-to-Income Ratio | Without Mortgage | With Mortgage |
| Less than 2.0x | 1 (7.7%) | 100,625 (258,012.8%) |
| 2.0x to 2.9x | 4 (30.8%) | 26 (66.7%) |
| 3.0x to 3.9x | 0 (0.0%) | 5 (12.8%) |
| 4.0x or more | 8 (61.5%) | 0 (0.0%) |
| Total | 13 (100.0%) | 39 (100.0%) |
Real Estate Taxes by Mortgage Status in Hammond
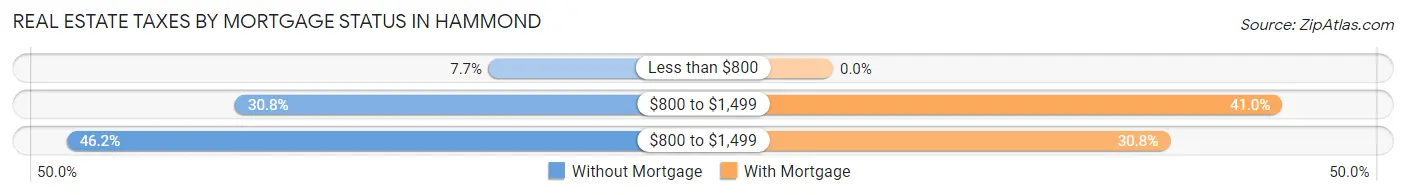
| Property Taxes | Without Mortgage | With Mortgage |
| Less than $800 | 1 (7.7%) | 0 (0.0%) |
| $800 to $1,499 | 4 (30.8%) | 16 (41.0%) |
| $800 to $1,499 | 6 (46.2%) | 12 (30.8%) |
| Total | 13 (100.0%) | 39 (100.0%) |
Health & Disability in Hammond
Health Insurance Coverage by Age in Hammond
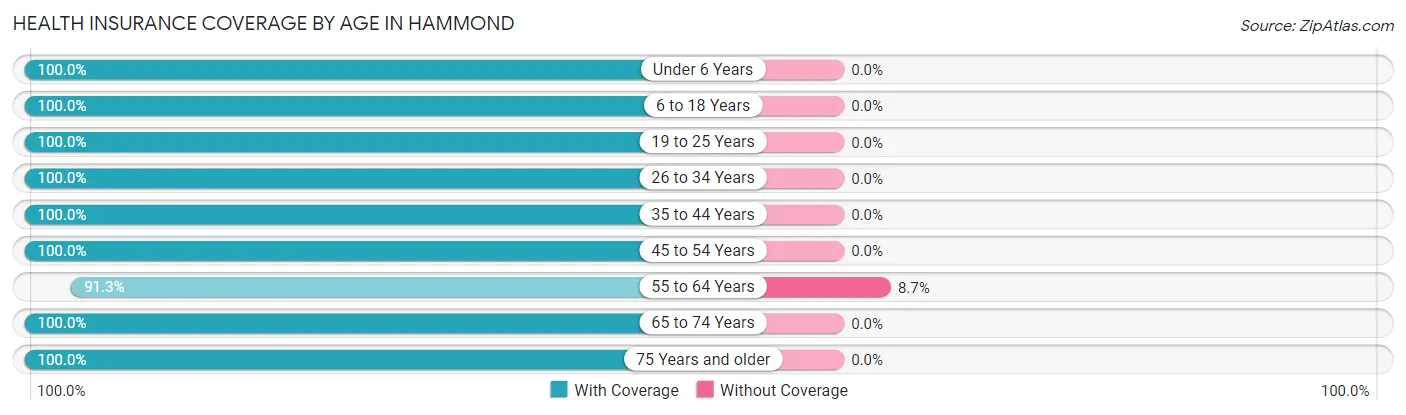
| Age Bracket | With Coverage | Without Coverage |
| Under 6 Years | 19 (100.0%) | 0 (0.0%) |
| 6 to 18 Years | 9 (100.0%) | 0 (0.0%) |
| 19 to 25 Years | 6 (100.0%) | 0 (0.0%) |
| 26 to 34 Years | 21 (100.0%) | 0 (0.0%) |
| 35 to 44 Years | 25 (100.0%) | 0 (0.0%) |
| 45 to 54 Years | 12 (100.0%) | 0 (0.0%) |
| 55 to 64 Years | 21 (91.3%) | 2 (8.7%) |
| 65 to 74 Years | 10 (100.0%) | 0 (0.0%) |
| 75 Years and older | 12 (100.0%) | 0 (0.0%) |
| Total | 135 (98.5%) | 2 (1.5%) |
Health Insurance Coverage by Citizenship Status in Hammond
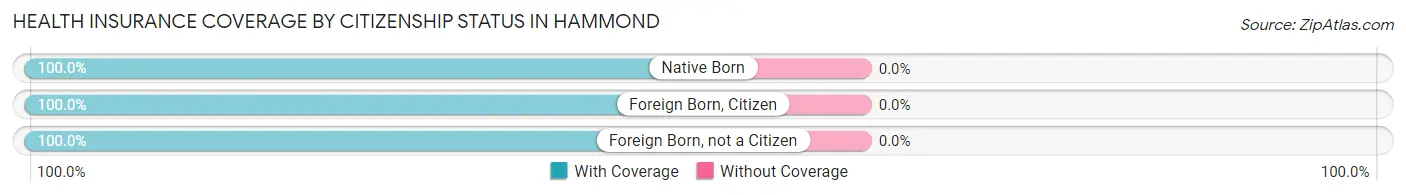
| Citizenship Status | With Coverage | Without Coverage |
| Native Born | 19 (100.0%) | 0 (0.0%) |
| Foreign Born, Citizen | 9 (100.0%) | 0 (0.0%) |
| Foreign Born, not a Citizen | 6 (100.0%) | 0 (0.0%) |
Health Insurance Coverage by Household Income in Hammond
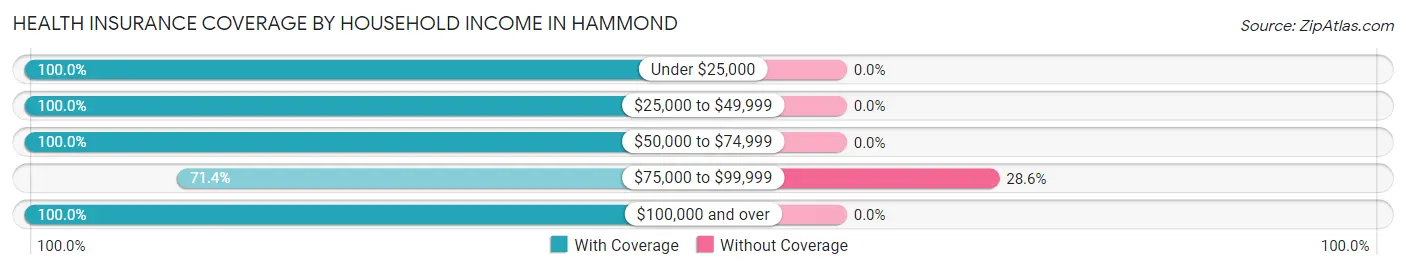
| Household Income | With Coverage | Without Coverage |
| Under $25,000 | 16 (100.0%) | 0 (0.0%) |
| $25,000 to $49,999 | 11 (100.0%) | 0 (0.0%) |
| $50,000 to $74,999 | 44 (100.0%) | 0 (0.0%) |
| $75,000 to $99,999 | 5 (71.4%) | 2 (28.6%) |
| $100,000 and over | 59 (100.0%) | 0 (0.0%) |
Public vs Private Health Insurance Coverage by Age in Hammond
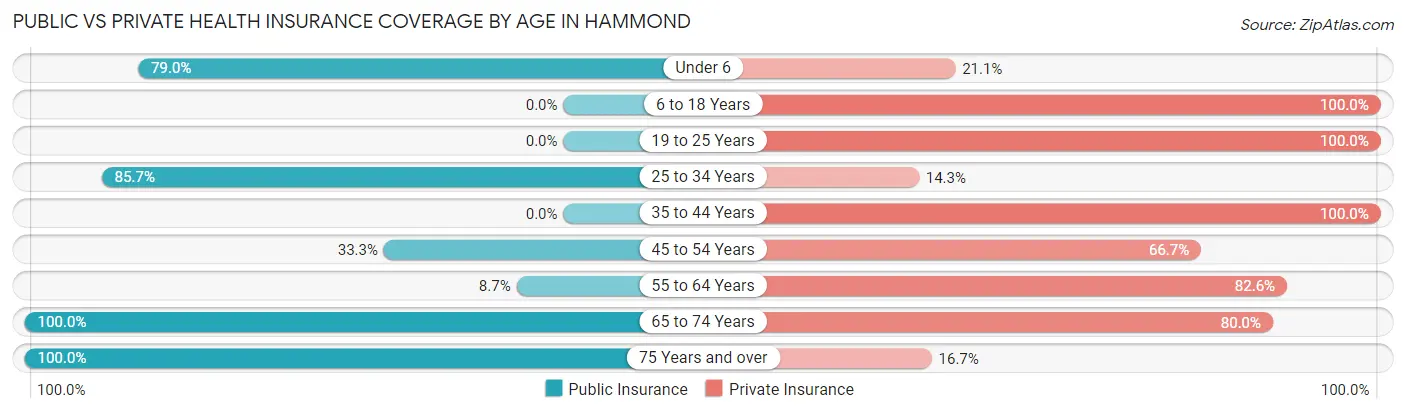
| Age Bracket | Public Insurance | Private Insurance |
| Under 6 | 15 (78.9%) | 4 (21.0%) |
| 6 to 18 Years | 0 (0.0%) | 9 (100.0%) |
| 19 to 25 Years | 0 (0.0%) | 6 (100.0%) |
| 25 to 34 Years | 18 (85.7%) | 3 (14.3%) |
| 35 to 44 Years | 0 (0.0%) | 25 (100.0%) |
| 45 to 54 Years | 4 (33.3%) | 8 (66.7%) |
| 55 to 64 Years | 2 (8.7%) | 19 (82.6%) |
| 65 to 74 Years | 10 (100.0%) | 8 (80.0%) |
| 75 Years and over | 12 (100.0%) | 2 (16.7%) |
| Total | 61 (44.5%) | 84 (61.3%) |
Disability Status by Sex by Age in Hammond
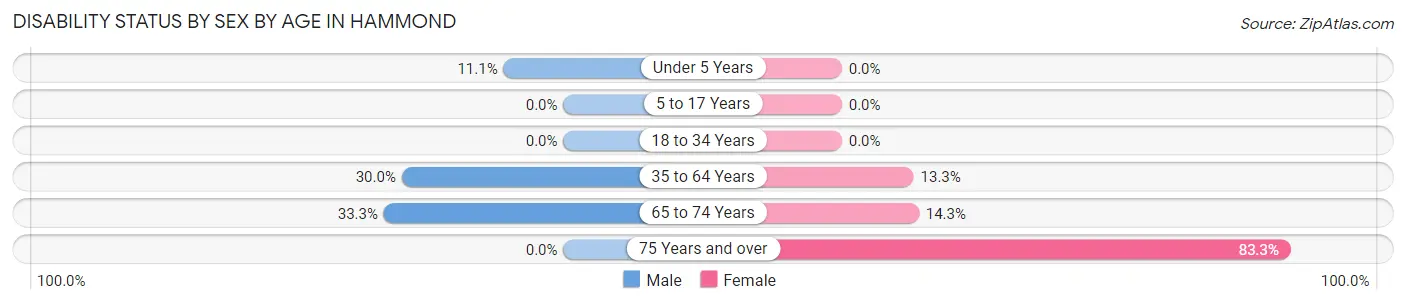
| Age Bracket | Male | Female |
| Under 5 Years | 1 (11.1%) | 0 (0.0%) |
| 5 to 17 Years | 0 (0.0%) | 0 (0.0%) |
| 18 to 34 Years | 0 (0.0%) | 0 (0.0%) |
| 35 to 64 Years | 9 (30.0%) | 4 (13.3%) |
| 65 to 74 Years | 1 (33.3%) | 1 (14.3%) |
| 75 Years and over | 0 (0.0%) | 10 (83.3%) |
Disability Class by Sex by Age in Hammond
Disability Class: Hearing Difficulty
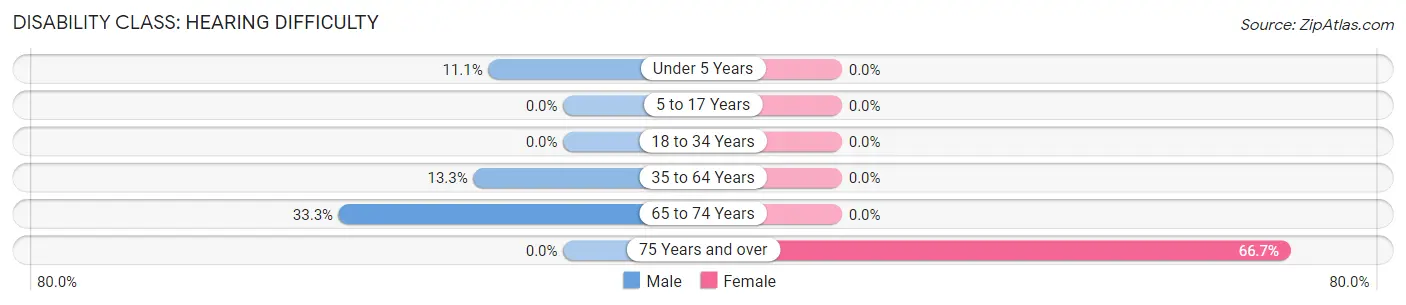
| Age Bracket | Male | Female |
| Under 5 Years | 1 (11.1%) | 0 (0.0%) |
| 5 to 17 Years | 0 (0.0%) | 0 (0.0%) |
| 18 to 34 Years | 0 (0.0%) | 0 (0.0%) |
| 35 to 64 Years | 4 (13.3%) | 0 (0.0%) |
| 65 to 74 Years | 1 (33.3%) | 0 (0.0%) |
| 75 Years and over | 0 (0.0%) | 8 (66.7%) |
Disability Class: Vision Difficulty
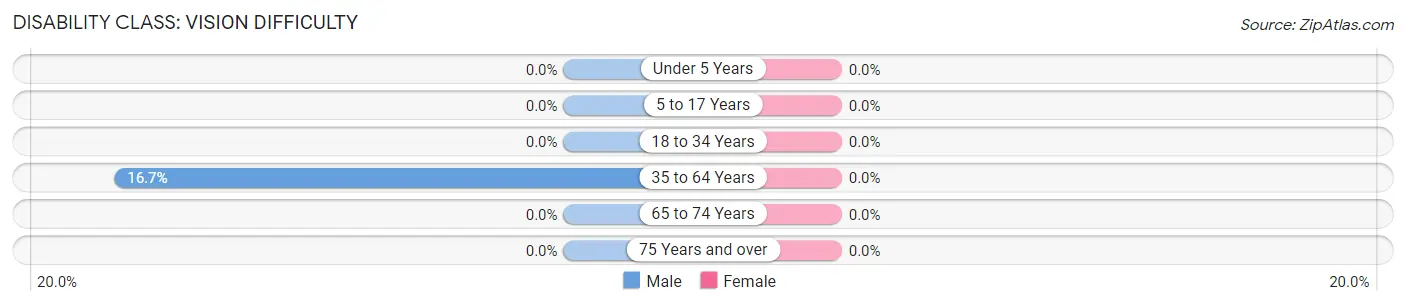
| Age Bracket | Male | Female |
| Under 5 Years | 0 (0.0%) | 0 (0.0%) |
| 5 to 17 Years | 0 (0.0%) | 0 (0.0%) |
| 18 to 34 Years | 0 (0.0%) | 0 (0.0%) |
| 35 to 64 Years | 5 (16.7%) | 0 (0.0%) |
| 65 to 74 Years | 0 (0.0%) | 0 (0.0%) |
| 75 Years and over | 0 (0.0%) | 0 (0.0%) |
Disability Class: Cognitive Difficulty
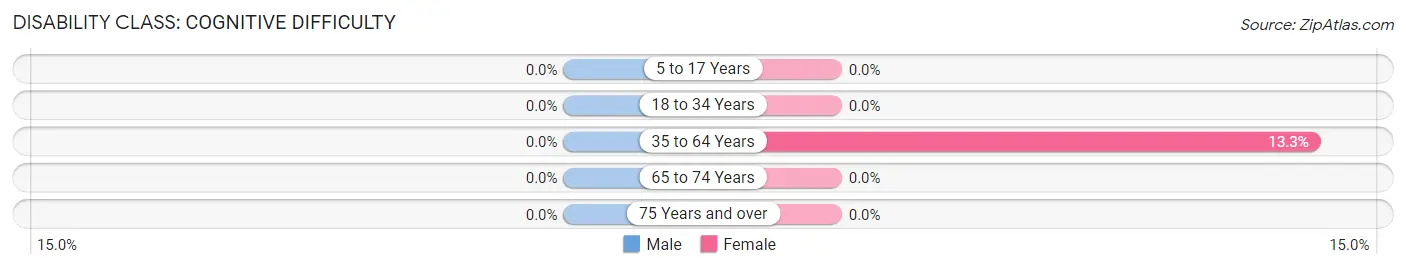
| Age Bracket | Male | Female |
| 5 to 17 Years | 0 (0.0%) | 0 (0.0%) |
| 18 to 34 Years | 0 (0.0%) | 0 (0.0%) |
| 35 to 64 Years | 0 (0.0%) | 4 (13.3%) |
| 65 to 74 Years | 0 (0.0%) | 0 (0.0%) |
| 75 Years and over | 0 (0.0%) | 0 (0.0%) |
Disability Class: Ambulatory Difficulty
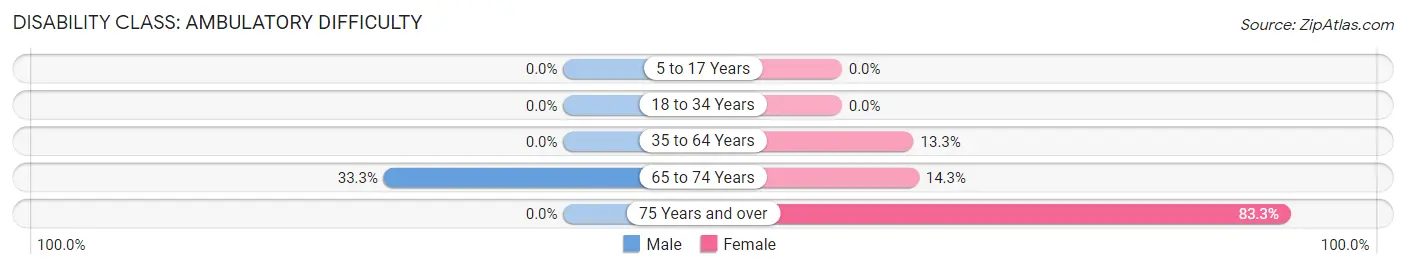
| Age Bracket | Male | Female |
| 5 to 17 Years | 0 (0.0%) | 0 (0.0%) |
| 18 to 34 Years | 0 (0.0%) | 0 (0.0%) |
| 35 to 64 Years | 0 (0.0%) | 4 (13.3%) |
| 65 to 74 Years | 1 (33.3%) | 1 (14.3%) |
| 75 Years and over | 0 (0.0%) | 10 (83.3%) |
Disability Class: Self-Care Difficulty
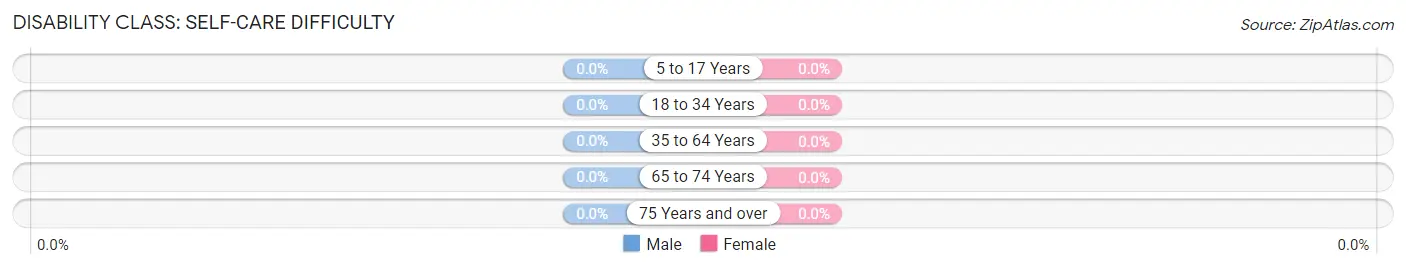
| Age Bracket | Male | Female |
| 5 to 17 Years | 0 (0.0%) | 0 (0.0%) |
| 18 to 34 Years | 0 (0.0%) | 0 (0.0%) |
| 35 to 64 Years | 0 (0.0%) | 0 (0.0%) |
| 65 to 74 Years | 0 (0.0%) | 0 (0.0%) |
| 75 Years and over | 0 (0.0%) | 0 (0.0%) |
Technology Access in Hammond
Computing Device Access in Hammond
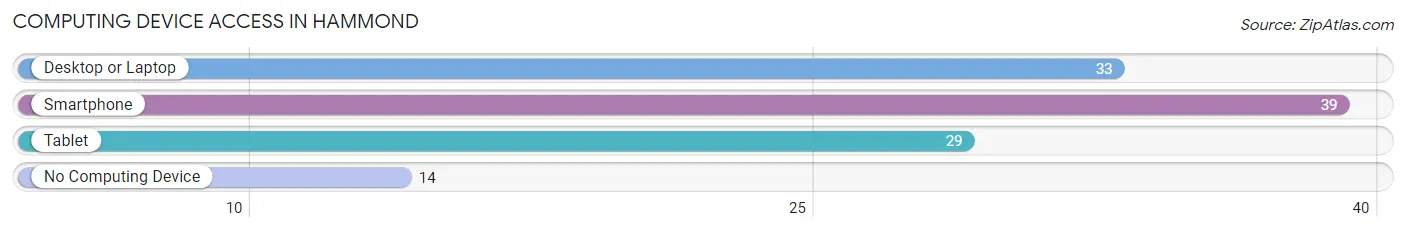
| Device Type | # Households | % Households |
| Desktop or Laptop | 33 | 57.9% |
| Smartphone | 39 | 68.4% |
| Tablet | 29 | 50.9% |
| No Computing Device | 14 | 24.6% |
| Total | 57 | 100.0% |
Internet Access in Hammond
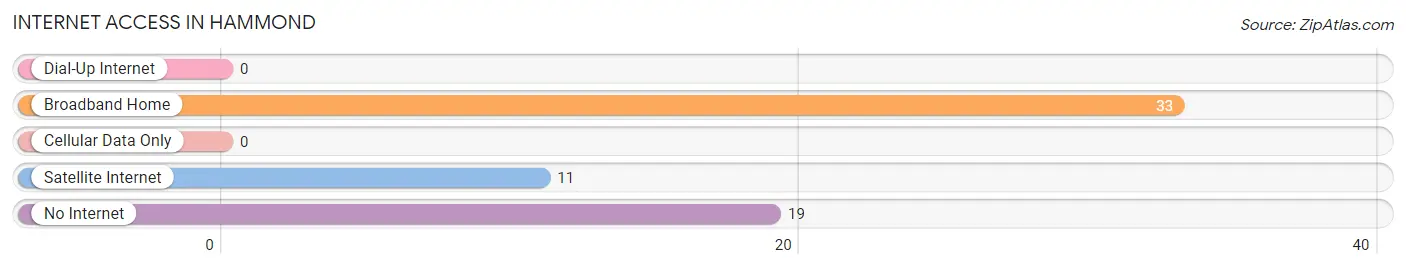
| Internet Type | # Households | % Households |
| Dial-Up Internet | 0 | 0.0% |
| Broadband Home | 33 | 57.9% |
| Cellular Data Only | 0 | 0.0% |
| Satellite Internet | 11 | 19.3% |
| No Internet | 19 | 33.3% |
| Total | 57 | 100.0% |
Hammond Summary
Hammond, Minnesota is a small city located in St. Croix County, in the western part of the state. It is situated on the banks of the St. Croix River, and is part of the Twin Cities metropolitan area. The city has a population of approximately 1,400 people, and is known for its rural charm and small-town atmosphere.
History
Hammond was first settled in 1854 by a group of settlers from New York. The town was named after the Hammond family, who were among the first settlers. The town was officially incorporated in 1872, and the first post office was established in 1873.
In the late 19th century, Hammond was a thriving agricultural community, with a variety of crops being grown in the area. The town was also home to a number of small businesses, including a sawmill, a grist mill, and a creamery.
In the early 20th century, Hammond began to experience a period of growth and development. The town was connected to the Twin Cities by a rail line, and the population began to increase. The town also saw the construction of a number of new buildings, including a school, a library, and a hospital.
Geography
Hammond is located in western Minnesota, in St. Croix County. The city is situated on the banks of the St. Croix River, and is part of the Twin Cities metropolitan area. The city is located approximately 25 miles east of Minneapolis, and is bordered by the cities of Stillwater and Hudson.
The city has a total area of 1.2 square miles, all of which is land. The terrain is mostly flat, with some rolling hills in the area. The climate is humid continental, with cold winters and warm summers.
Economy
The economy of Hammond is largely based on agriculture and tourism. The city is home to a number of small businesses, including restaurants, retail stores, and service providers. The city is also home to a number of manufacturing companies, including a paper mill and a plastics factory.
The city is also home to a number of recreational activities, including fishing, boating, and camping. The city is also home to a number of parks and trails, including the St. Croix National Scenic Riverway.
Demographics
As of the 2010 census, the population of Hammond was 1,400. The racial makeup of the city was 97.3% White, 0.6% African American, 0.3% Native American, 0.3% Asian, 0.1% Pacific Islander, 0.3% from other races, and 1.3% from two or more races. Hispanic or Latino of any race were 1.3% of the population.
The median household income in Hammond was $45,000, and the median family income was $50,000. The per capita income was $20,000. About 8.3% of families and 10.3% of the population were below the poverty line, including 14.3% of those under age 18 and 6.3% of those age 65 or over.
Common Questions
What is Per Capita Income in Hammond?
Per Capita income in Hammond is $47,380.
What is the Median Family Income in Hammond?
Median Family Income in Hammond is $86,250.
What is the Median Household income in Hammond?
Median Household Income in Hammond is $67,813.
What is Income or Wage Gap in Hammond?
Income or Wage Gap in Hammond is 47.2%.
Women in Hammond earn 52.8 cents for every dollar earned by a man.
What is Inequality or Gini Index in Hammond?
Inequality or Gini Index in Hammond is 0.55.
What is the Total Population of Hammond?
Total Population of Hammond is 137.
What is the Total Male Population of Hammond?
Total Male Population of Hammond is 50.
What is the Total Female Population of Hammond?
Total Female Population of Hammond is 87.
What is the Ratio of Males per 100 Females in Hammond?
There are 57.47 Males per 100 Females in Hammond.
What is the Ratio of Females per 100 Males in Hammond?
There are 174.00 Females per 100 Males in Hammond.
What is the Median Population Age in Hammond?
Median Population Age in Hammond is 39.6 Years.
What is the Average Family Size in Hammond
Average Family Size in Hammond is 3.0 People.
What is the Average Household Size in Hammond
Average Household Size in Hammond is 2.4 People.
How Large is the Labor Force in Hammond?
There are 88 People in the Labor Forcein in Hammond.
What is the Percentage of People in the Labor Force in Hammond?
78.6% of People are in the Labor Force in Hammond.