Minnetrista, MN Map & Demographics
Minnetrista Map
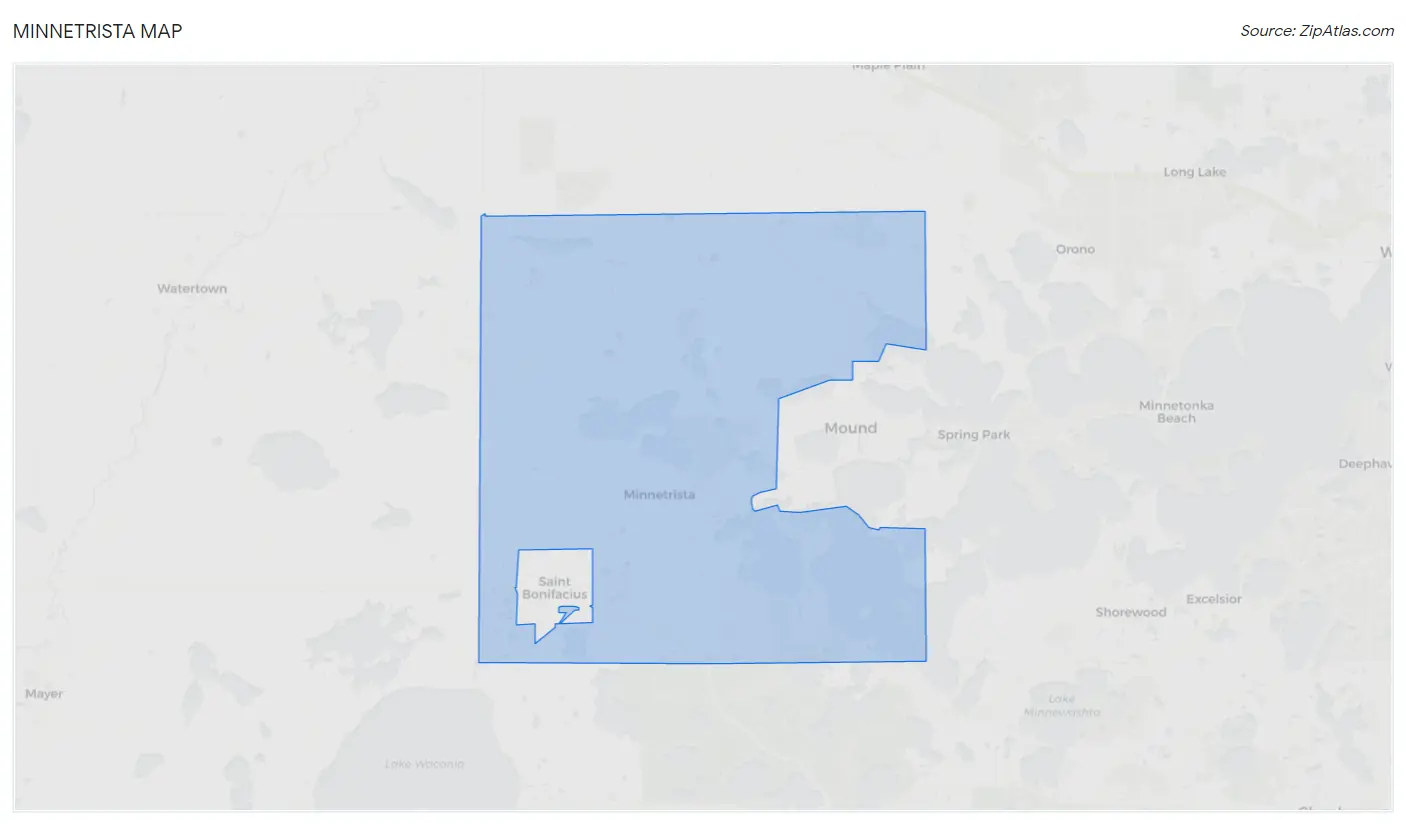
Minnetrista Overview
$69,671
PER CAPITA INCOME
$173,542
AVG FAMILY INCOME
$162,474
AVG HOUSEHOLD INCOME
51.8%
WAGE / INCOME GAP [ % ]
48.2¢/ $1
WAGE / INCOME GAP [ $ ]
0.41
INEQUALITY / GINI INDEX
8,347
TOTAL POPULATION
4,091
MALE POPULATION
4,256
FEMALE POPULATION
96.12
MALES / 100 FEMALES
104.03
FEMALES / 100 MALES
42.5
MEDIAN AGE
3.2
AVG FAMILY SIZE
3.0
AVG HOUSEHOLD SIZE
4,283
LABOR FORCE [ PEOPLE ]
70.1%
PERCENT IN LABOR FORCE
2.3%
UNEMPLOYMENT RATE
Income in Minnetrista
Income Overview in Minnetrista
Per Capita Income in Minnetrista is $69,671, while median incomes of families and households are $173,542 and $162,474 respectively.
| Characteristic | Number | Measure |
| Per Capita Income | 8,347 | $69,671 |
| Median Family Income | 2,488 | $173,542 |
| Mean Family Income | 2,488 | $220,955 |
| Median Household Income | 2,753 | $162,474 |
| Mean Household Income | 2,753 | $208,427 |
| Income Deficit | 2,488 | $0 |
| Wage / Income Gap (%) | 8,347 | 51.81% |
| Wage / Income Gap ($) | 8,347 | 48.19¢ per $1 |
| Gini / Inequality Index | 8,347 | 0.41 |
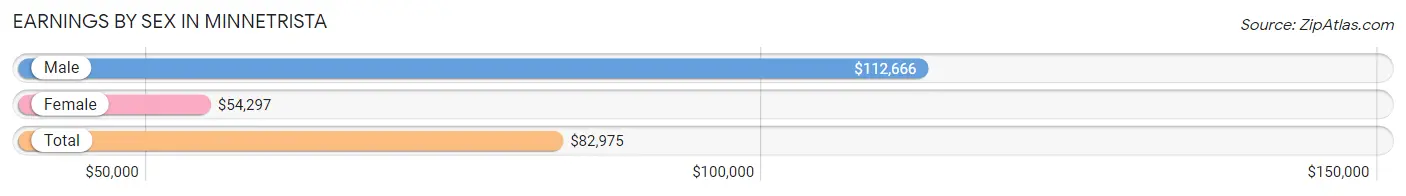
Earnings by Sex in Minnetrista
Average Earnings in Minnetrista are $82,975, $112,666 for men and $54,297 for women, a difference of 51.8%.
| Sex | Number | Average Earnings |
| Male | 2,565 (55.8%) | $112,666 |
| Female | 2,032 (44.2%) | $54,297 |
| Total | 4,597 (100.0%) | $82,975 |
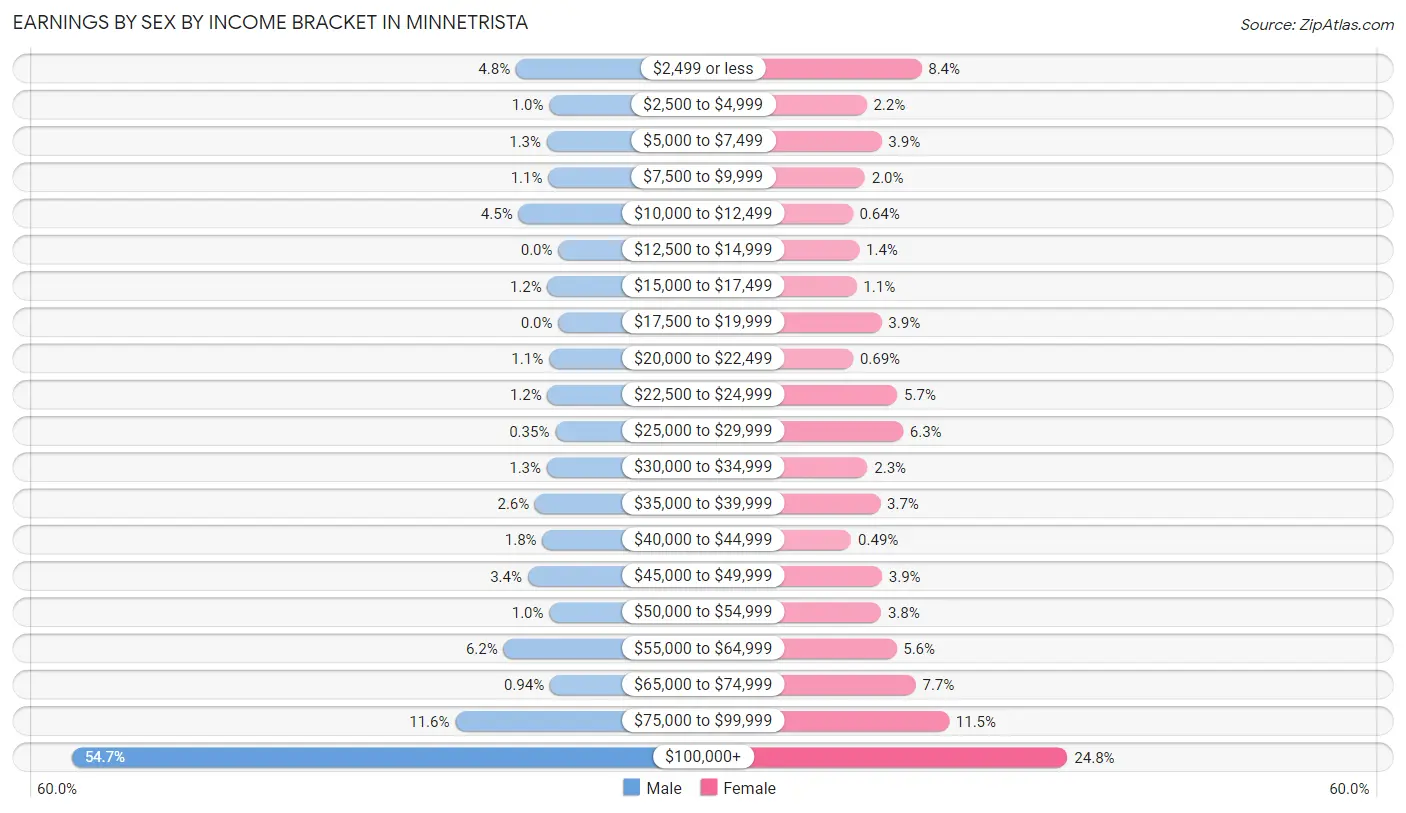
Earnings by Sex by Income Bracket in Minnetrista
The most common earnings brackets in Minnetrista are $100,000+ for men (1,403 | 54.7%) and $100,000+ for women (504 | 24.8%).
| Income | Male | Female |
| $2,499 or less | 122 (4.8%) | 170 (8.4%) |
| $2,500 to $4,999 | 26 (1.0%) | 45 (2.2%) |
| $5,000 to $7,499 | 33 (1.3%) | 79 (3.9%) |
| $7,500 to $9,999 | 29 (1.1%) | 41 (2.0%) |
| $10,000 to $12,499 | 115 (4.5%) | 13 (0.6%) |
| $12,500 to $14,999 | 0 (0.0%) | 28 (1.4%) |
| $15,000 to $17,499 | 31 (1.2%) | 22 (1.1%) |
| $17,500 to $19,999 | 0 (0.0%) | 79 (3.9%) |
| $20,000 to $22,499 | 27 (1.1%) | 14 (0.7%) |
| $22,500 to $24,999 | 31 (1.2%) | 115 (5.7%) |
| $25,000 to $29,999 | 9 (0.4%) | 128 (6.3%) |
| $30,000 to $34,999 | 33 (1.3%) | 47 (2.3%) |
| $35,000 to $39,999 | 67 (2.6%) | 76 (3.7%) |
| $40,000 to $44,999 | 46 (1.8%) | 10 (0.5%) |
| $45,000 to $49,999 | 88 (3.4%) | 80 (3.9%) |
| $50,000 to $54,999 | 26 (1.0%) | 78 (3.8%) |
| $55,000 to $64,999 | 158 (6.2%) | 113 (5.6%) |
| $65,000 to $74,999 | 24 (0.9%) | 157 (7.7%) |
| $75,000 to $99,999 | 297 (11.6%) | 233 (11.5%) |
| $100,000+ | 1,403 (54.7%) | 504 (24.8%) |
| Total | 2,565 (100.0%) | 2,032 (100.0%) |
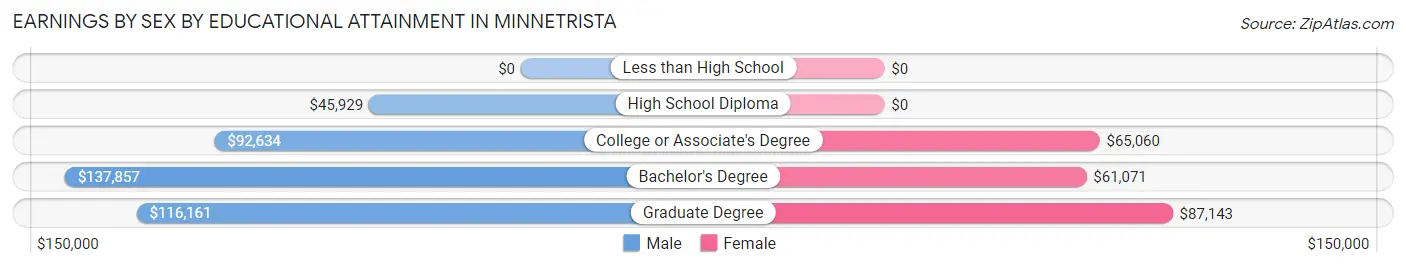
Earnings by Sex by Educational Attainment in Minnetrista
Average earnings in Minnetrista are $113,922 for men and $65,592 for women, a difference of 42.4%. Men with an educational attainment of bachelor's degree enjoy the highest average annual earnings of $137,857, while those with high school diploma education earn the least with $45,929. Women with an educational attainment of graduate degree earn the most with the average annual earnings of $87,143, while those with bachelor's degree education have the smallest earnings of $61,071.
| Educational Attainment | Male Income | Female Income |
| Less than High School | - | - |
| High School Diploma | $45,929 | $0 |
| College or Associate's Degree | $92,634 | $65,060 |
| Bachelor's Degree | $137,857 | $61,071 |
| Graduate Degree | $116,161 | $87,143 |
| Total | $113,922 | $65,592 |
Family Income in Minnetrista
Family Income Brackets in Minnetrista
According to the Minnetrista family income data, there are 1,010 families falling into the $200,000+ income range, which is the most common income bracket and makes up 40.6% of all families.
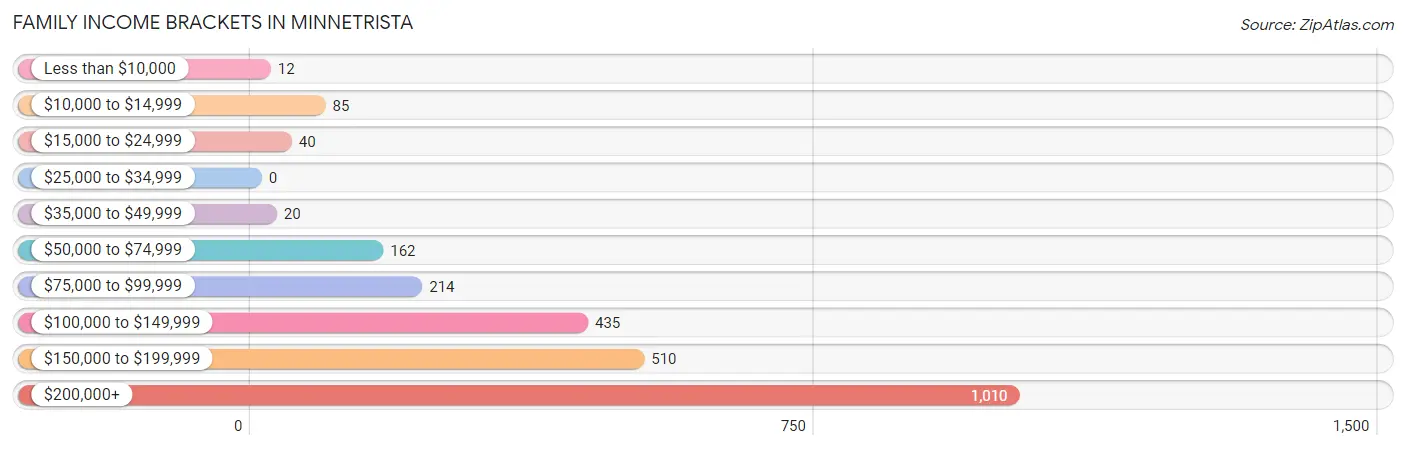
| Income Bracket | # Families | % Families |
| Less than $10,000 | 12 | 0.5% |
| $10,000 to $14,999 | 85 | 3.4% |
| $15,000 to $24,999 | 40 | 1.6% |
| $25,000 to $34,999 | 0 | 0.0% |
| $35,000 to $49,999 | 20 | 0.8% |
| $50,000 to $74,999 | 162 | 6.5% |
| $75,000 to $99,999 | 214 | 8.6% |
| $100,000 to $149,999 | 435 | 17.5% |
| $150,000 to $199,999 | 510 | 20.5% |
| $200,000+ | 1,010 | 40.6% |
Family Income by Famaliy Size in Minnetrista
5-person families (225 | 9.0%) account for the highest median family income in Minnetrista with $250,001 per family, while 3-person families (330 | 13.3%) have the highest median income of $66,623 per family member.
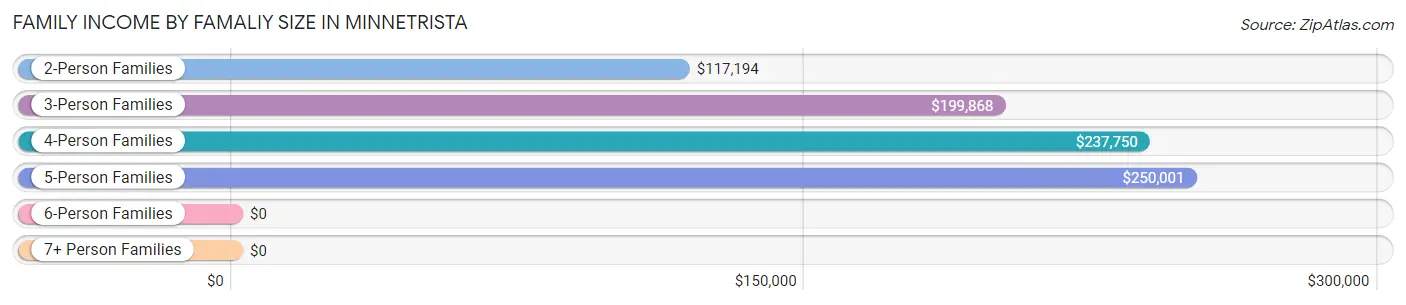
| Income Bracket | # Families | Median Income |
| 2-Person Families | 1,112 (44.7%) | $117,194 |
| 3-Person Families | 330 (13.3%) | $199,868 |
| 4-Person Families | 625 (25.1%) | $237,750 |
| 5-Person Families | 225 (9.0%) | $250,001 |
| 6-Person Families | 194 (7.8%) | $0 |
| 7+ Person Families | 2 (0.1%) | $0 |
| Total | 2,488 (100.0%) | $173,542 |
Family Income by Number of Earners in Minnetrista
The median family income in Minnetrista is $173,542, with families comprising 3+ earners (415) having the highest median family income of $250,001, while families with no earners (204) have the lowest median family income of $78,333, accounting for 16.7% and 8.2% of families, respectively.
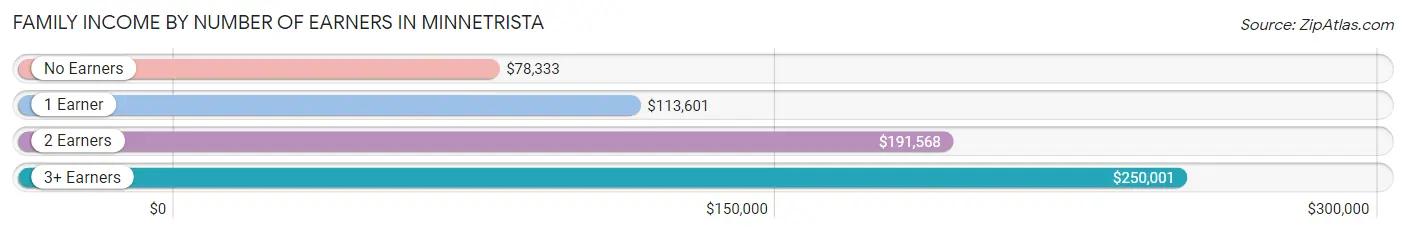
| Number of Earners | # Families | Median Income |
| No Earners | 204 (8.2%) | $78,333 |
| 1 Earner | 699 (28.1%) | $113,601 |
| 2 Earners | 1,170 (47.0%) | $191,568 |
| 3+ Earners | 415 (16.7%) | $250,001 |
| Total | 2,488 (100.0%) | $173,542 |
Household Income in Minnetrista
Household Income Brackets in Minnetrista
With 1,024 households falling in the category, the $200,000+ income range is the most frequent in Minnetrista, accounting for 37.2% of all households. In contrast, only 14 households (0.5%) fall into the $35,000 to $49,999 income bracket, making it the least populous group.
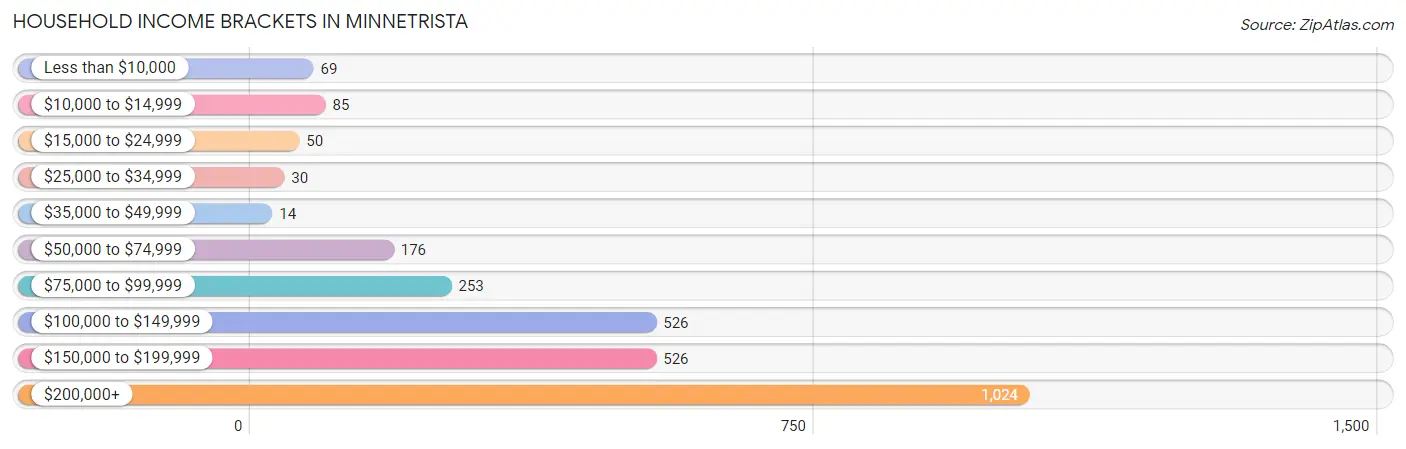
| Income Bracket | # Households | % Households |
| Less than $10,000 | 69 | 2.5% |
| $10,000 to $14,999 | 85 | 3.1% |
| $15,000 to $24,999 | 50 | 1.8% |
| $25,000 to $34,999 | 30 | 1.1% |
| $35,000 to $49,999 | 14 | 0.5% |
| $50,000 to $74,999 | 176 | 6.4% |
| $75,000 to $99,999 | 253 | 9.2% |
| $100,000 to $149,999 | 526 | 19.1% |
| $150,000 to $199,999 | 526 | 19.1% |
| $200,000+ | 1,024 | 37.2% |
Household Income by Householder Age in Minnetrista
The median household income in Minnetrista is $162,474, with the highest median household income of $187,734 found in the 25 to 44 years age bracket for the primary householder. A total of 657 households (23.9%) fall into this category.
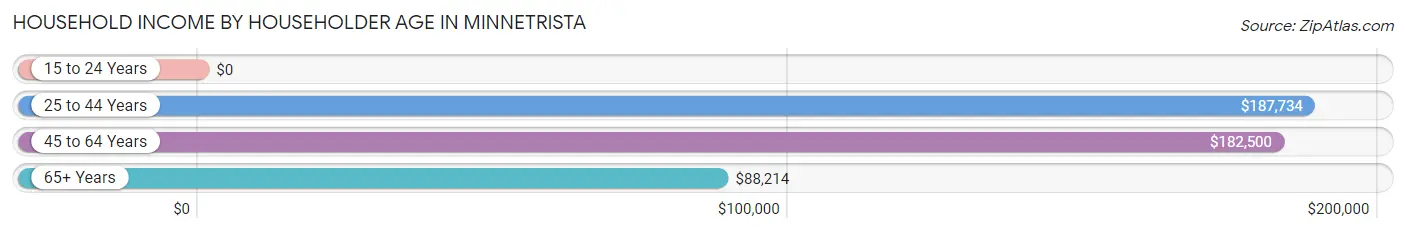
| Income Bracket | # Households | Median Income |
| 15 to 24 Years | 0 (0.0%) | $0 |
| 25 to 44 Years | 657 (23.9%) | $187,734 |
| 45 to 64 Years | 1,608 (58.4%) | $182,500 |
| 65+ Years | 488 (17.7%) | $88,214 |
| Total | 2,753 (100.0%) | $162,474 |
Poverty in Minnetrista
Income Below Poverty by Sex and Age in Minnetrista
With 9.4% poverty level for males and 6.0% for females among the residents of Minnetrista, 6 to 11 year old males and 5 year old females are the most vulnerable to poverty, with 190 males (41.8%) and 52 females (28.0%) in their respective age groups living below the poverty level.
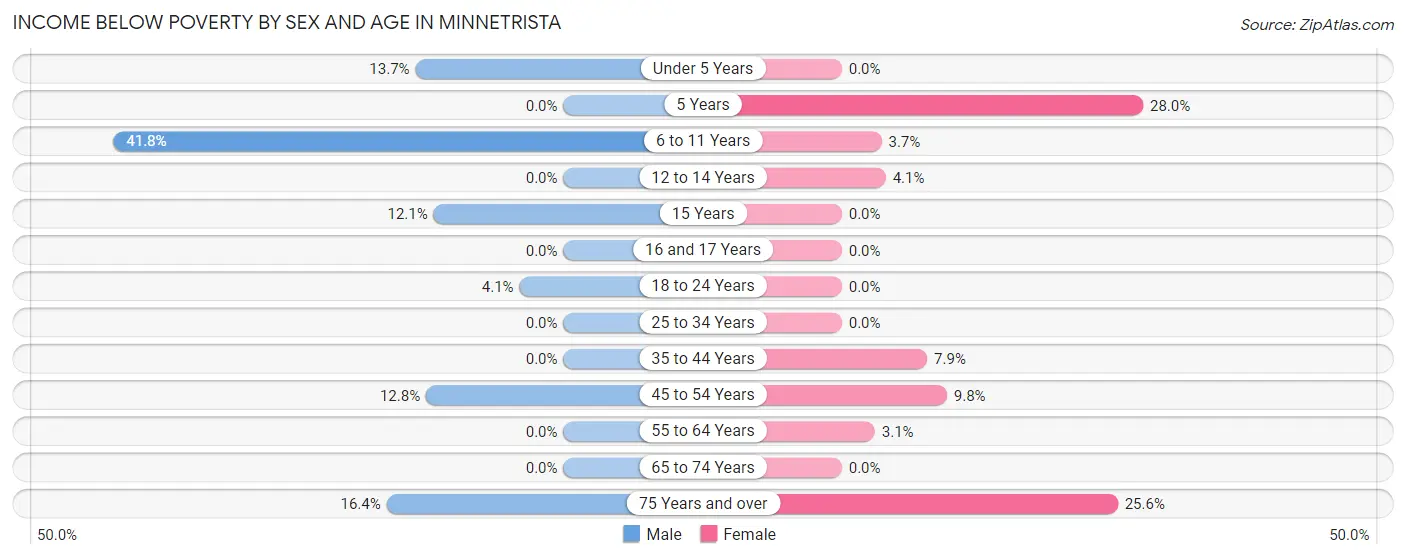
| Age Bracket | Male | Female |
| Under 5 Years | 42 (13.7%) | 0 (0.0%) |
| 5 Years | 0 (0.0%) | 52 (28.0%) |
| 6 to 11 Years | 190 (41.8%) | 14 (3.7%) |
| 12 to 14 Years | 0 (0.0%) | 13 (4.1%) |
| 15 Years | 10 (12.0%) | 0 (0.0%) |
| 16 and 17 Years | 0 (0.0%) | 0 (0.0%) |
| 18 to 24 Years | 6 (4.1%) | 0 (0.0%) |
| 25 to 34 Years | 0 (0.0%) | 0 (0.0%) |
| 35 to 44 Years | 0 (0.0%) | 37 (7.9%) |
| 45 to 54 Years | 117 (12.8%) | 104 (9.8%) |
| 55 to 64 Years | 0 (0.0%) | 16 (3.1%) |
| 65 to 74 Years | 0 (0.0%) | 0 (0.0%) |
| 75 Years and over | 21 (16.4%) | 21 (25.6%) |
| Total | 386 (9.4%) | 257 (6.0%) |
Income Above Poverty by Sex and Age in Minnetrista
According to the poverty statistics in Minnetrista, males aged 5 years and females aged under 5 years are the age groups that are most secure financially, with 100.0% of males and 100.0% of females in these age groups living above the poverty line.
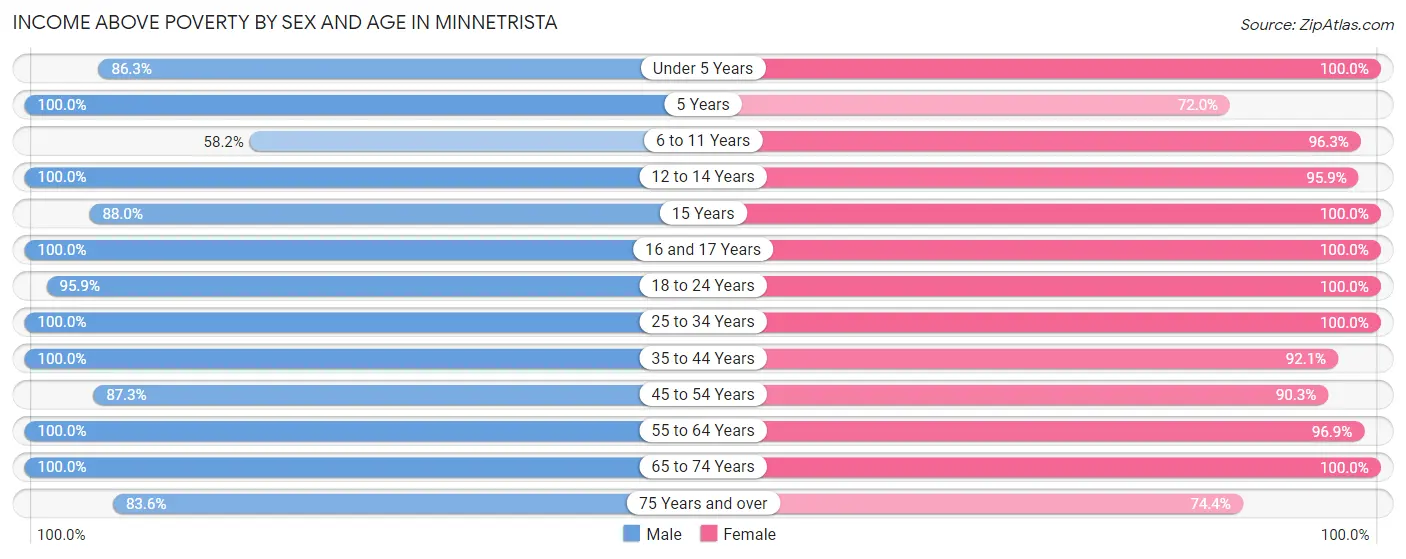
| Age Bracket | Male | Female |
| Under 5 Years | 264 (86.3%) | 227 (100.0%) |
| 5 Years | 80 (100.0%) | 134 (72.0%) |
| 6 to 11 Years | 265 (58.2%) | 365 (96.3%) |
| 12 to 14 Years | 136 (100.0%) | 306 (95.9%) |
| 15 Years | 73 (87.9%) | 66 (100.0%) |
| 16 and 17 Years | 132 (100.0%) | 202 (100.0%) |
| 18 to 24 Years | 141 (95.9%) | 193 (100.0%) |
| 25 to 34 Years | 179 (100.0%) | 249 (100.0%) |
| 35 to 44 Years | 557 (100.0%) | 430 (92.1%) |
| 45 to 54 Years | 801 (87.3%) | 963 (90.2%) |
| 55 to 64 Years | 654 (100.0%) | 505 (96.9%) |
| 65 to 74 Years | 316 (100.0%) | 298 (100.0%) |
| 75 Years and over | 107 (83.6%) | 61 (74.4%) |
| Total | 3,705 (90.6%) | 3,999 (94.0%) |
Income Below Poverty Among Married-Couple Families in Minnetrista
The poverty statistics for married-couple families in Minnetrista show that 4.1% or 97 of the total 2,364 families live below the poverty line. Families with 3 or 4 children have the highest poverty rate of 22.1%, comprising of 85 families. On the other hand, families with no children have the lowest poverty rate of 0.0%, which includes 0 families.
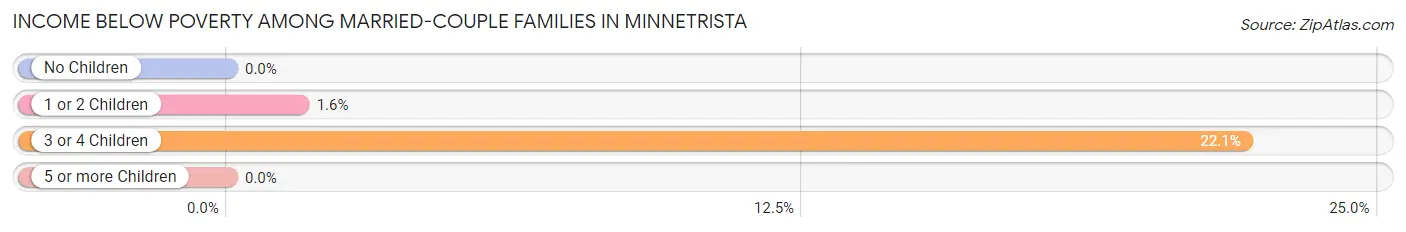
| Children | Above Poverty | Below Poverty |
| No Children | 1,212 (100.0%) | 0 (0.0%) |
| 1 or 2 Children | 755 (98.4%) | 12 (1.6%) |
| 3 or 4 Children | 300 (77.9%) | 85 (22.1%) |
| 5 or more Children | 0 (0.0%) | 0 (0.0%) |
| Total | 2,267 (95.9%) | 97 (4.1%) |
Income Below Poverty Among Single-Parent Households in Minnetrista
According to the poverty data in Minnetrista, 58.8% or 20 single-father households and 10.0% or 9 single-mother households are living below the poverty line. Among single-father households, those with 1 or 2 children have the highest poverty rate, with 20 households (58.8%) experiencing poverty. Likewise, among single-mother households, those with 1 or 2 children have the highest poverty rate, with 9 households (29.0%) falling below the poverty line.
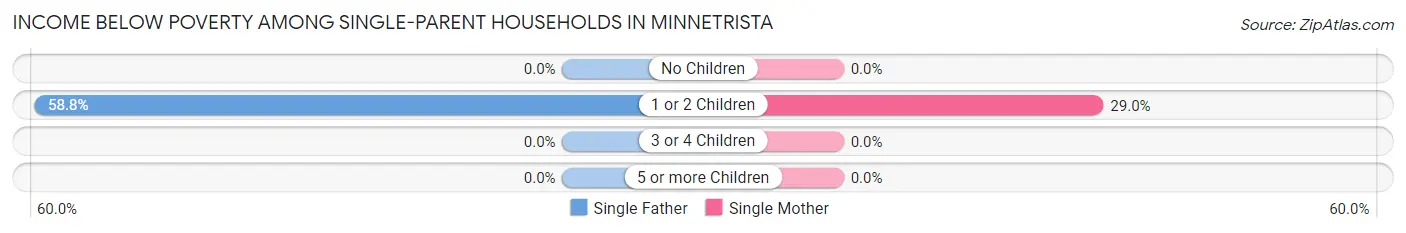
| Children | Single Father | Single Mother |
| No Children | 0 (0.0%) | 0 (0.0%) |
| 1 or 2 Children | 20 (58.8%) | 9 (29.0%) |
| 3 or 4 Children | 0 (0.0%) | 0 (0.0%) |
| 5 or more Children | 0 (0.0%) | 0 (0.0%) |
| Total | 20 (58.8%) | 9 (10.0%) |
Income Below Poverty Among Married-Couple vs Single-Parent Households in Minnetrista
The poverty data for Minnetrista shows that 97 of the married-couple family households (4.1%) and 29 of the single-parent households (23.4%) are living below the poverty level. Within the married-couple family households, those with 3 or 4 children have the highest poverty rate, with 85 households (22.1%) falling below the poverty line. Among the single-parent households, those with 1 or 2 children have the highest poverty rate, with 29 household (44.6%) living below poverty.
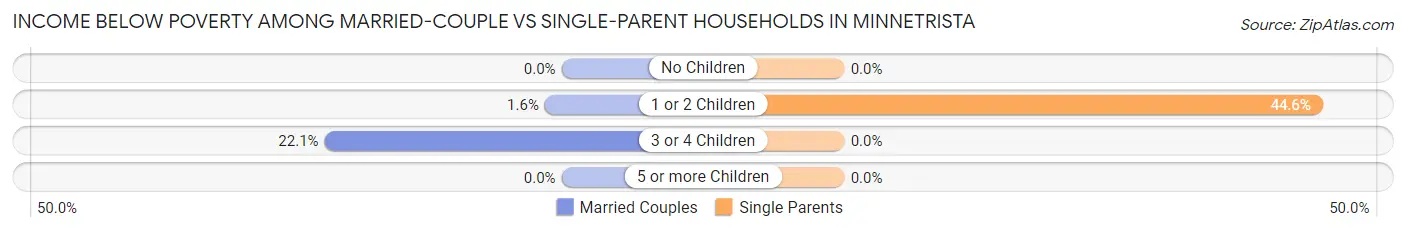
| Children | Married-Couple Families | Single-Parent Households |
| No Children | 0 (0.0%) | 0 (0.0%) |
| 1 or 2 Children | 12 (1.6%) | 29 (44.6%) |
| 3 or 4 Children | 85 (22.1%) | 0 (0.0%) |
| 5 or more Children | 0 (0.0%) | 0 (0.0%) |
| Total | 97 (4.1%) | 29 (23.4%) |
Race in Minnetrista
The most populous races in Minnetrista are White / Caucasian (7,959 | 95.4%), Two or more Races (173 | 2.1%), and Asian (88 | 1.1%).
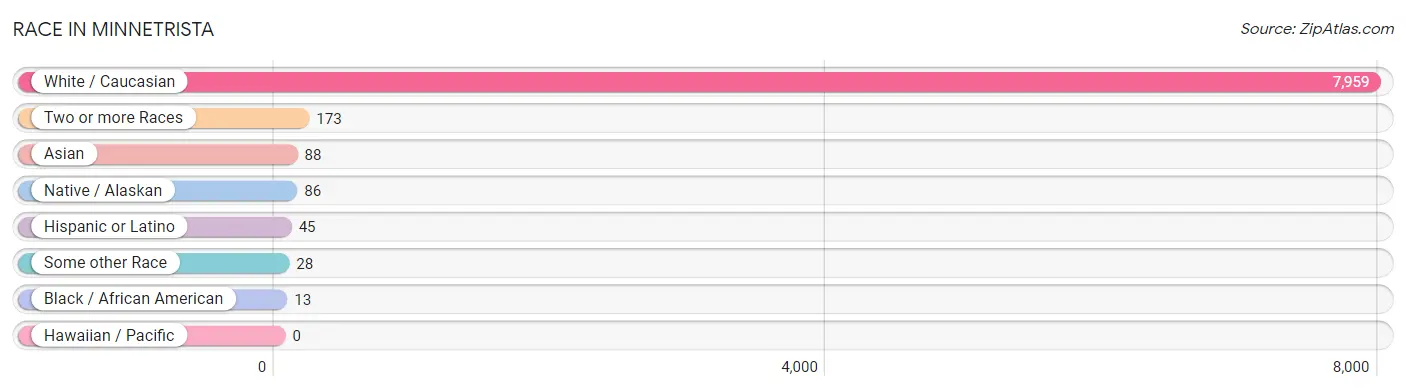
| Race | # Population | % Population |
| Asian | 88 | 1.1% |
| Black / African American | 13 | 0.2% |
| Hawaiian / Pacific | 0 | 0.0% |
| Hispanic or Latino | 45 | 0.5% |
| Native / Alaskan | 86 | 1.0% |
| White / Caucasian | 7,959 | 95.4% |
| Two or more Races | 173 | 2.1% |
| Some other Race | 28 | 0.3% |
| Total | 8,347 | 100.0% |
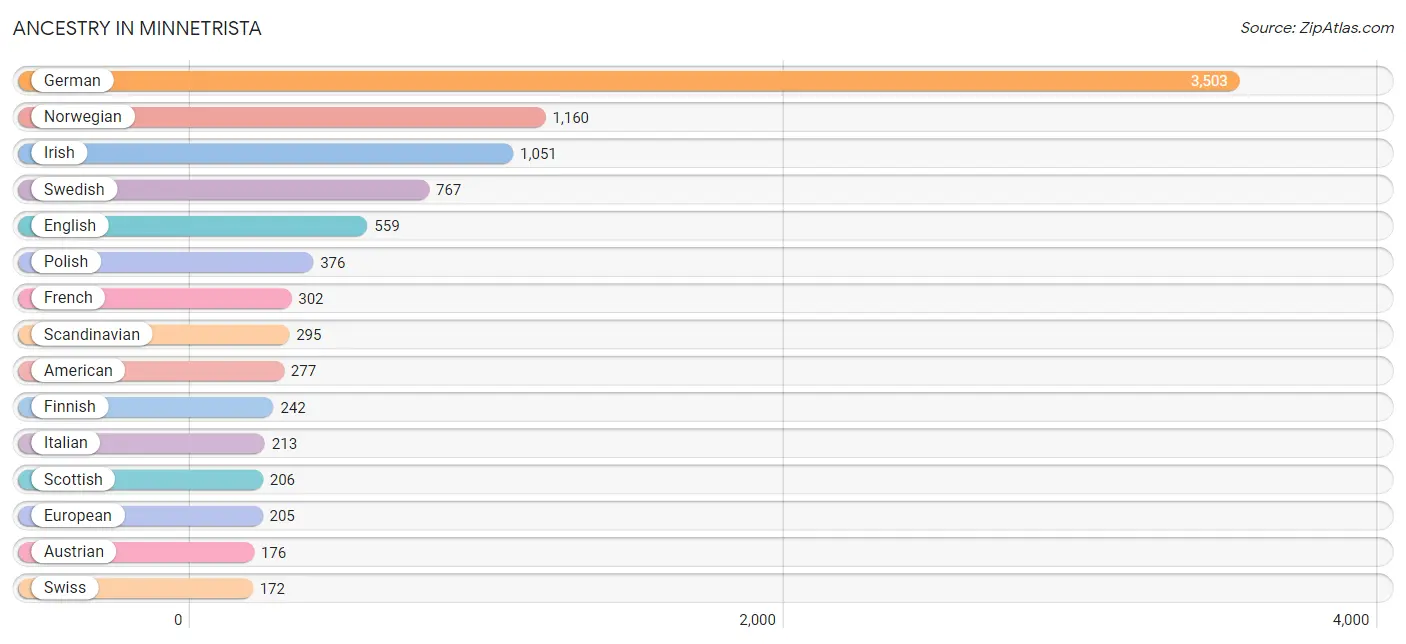
Ancestry in Minnetrista
The most populous ancestries reported in Minnetrista are German (3,503 | 42.0%), Norwegian (1,160 | 13.9%), Irish (1,051 | 12.6%), Swedish (767 | 9.2%), and English (559 | 6.7%), together accounting for 84.3% of all Minnetrista residents.
| Ancestry | # Population | % Population |
| American | 277 | 3.3% |
| Arab | 58 | 0.7% |
| Austrian | 176 | 2.1% |
| Belgian | 6 | 0.1% |
| Bhutanese | 11 | 0.1% |
| Central American | 28 | 0.3% |
| Chickasaw | 4 | 0.1% |
| Chippewa | 119 | 1.4% |
| Croatian | 10 | 0.1% |
| Czech | 117 | 1.4% |
| Czechoslovakian | 15 | 0.2% |
| Danish | 93 | 1.1% |
| Dutch | 140 | 1.7% |
| English | 559 | 6.7% |
| European | 205 | 2.5% |
| Finnish | 242 | 2.9% |
| French | 302 | 3.6% |
| French Canadian | 63 | 0.7% |
| German | 3,503 | 42.0% |
| Hungarian | 59 | 0.7% |
| Indian (Asian) | 53 | 0.6% |
| Irish | 1,051 | 12.6% |
| Italian | 213 | 2.5% |
| Korean | 43 | 0.5% |
| Latvian | 17 | 0.2% |
| Lebanese | 30 | 0.4% |
| Luxembourger | 36 | 0.4% |
| Malaysian | 28 | 0.3% |
| Mexican | 17 | 0.2% |
| Nicaraguan | 28 | 0.3% |
| Northern European | 1 | 0.0% |
| Norwegian | 1,160 | 13.9% |
| Polish | 376 | 4.5% |
| Scandinavian | 295 | 3.5% |
| Scottish | 206 | 2.5% |
| Slovak | 26 | 0.3% |
| Swedish | 767 | 9.2% |
| Swiss | 172 | 2.1% |
| Syrian | 18 | 0.2% |
| Thai | 23 | 0.3% |
| Tlingit-Haida | 16 | 0.2% |
| Ukrainian | 61 | 0.7% | View All 42 Rows |
Immigrants in Minnetrista
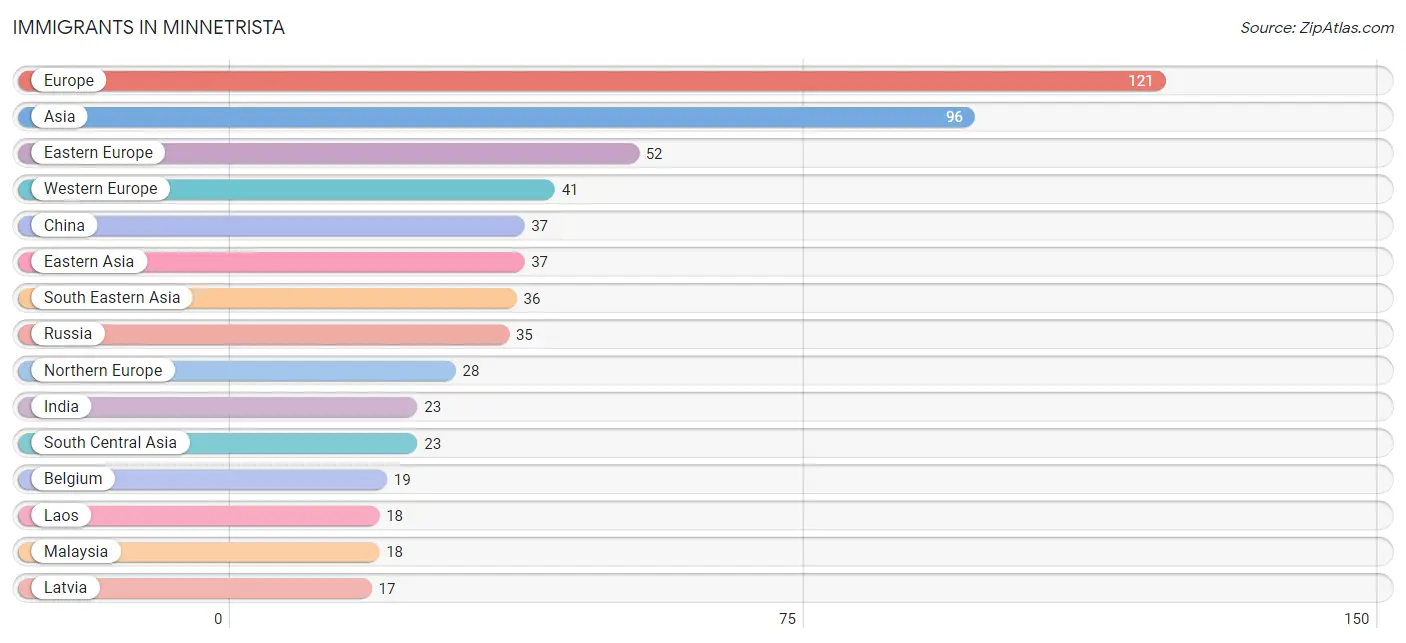
The most numerous immigrant groups reported in Minnetrista came from Europe (121 | 1.5%), Asia (96 | 1.1%), Eastern Europe (52 | 0.6%), Western Europe (41 | 0.5%), and China (37 | 0.4%), together accounting for 4.2% of all Minnetrista residents.
| Immigration Origin | # Population | % Population |
| Africa | 10 | 0.1% |
| Asia | 96 | 1.1% |
| Belgium | 19 | 0.2% |
| China | 37 | 0.4% |
| Eastern Asia | 37 | 0.4% |
| Eastern Europe | 52 | 0.6% |
| Europe | 121 | 1.5% |
| France | 9 | 0.1% |
| Germany | 13 | 0.2% |
| India | 23 | 0.3% |
| Laos | 18 | 0.2% |
| Latvia | 17 | 0.2% |
| Malaysia | 18 | 0.2% |
| Northern Africa | 10 | 0.1% |
| Northern Europe | 28 | 0.3% |
| Russia | 35 | 0.4% |
| South Central Asia | 23 | 0.3% |
| South Eastern Asia | 36 | 0.4% |
| Western Europe | 41 | 0.5% | View All 19 Rows |
Sex and Age in Minnetrista
Sex and Age in Minnetrista
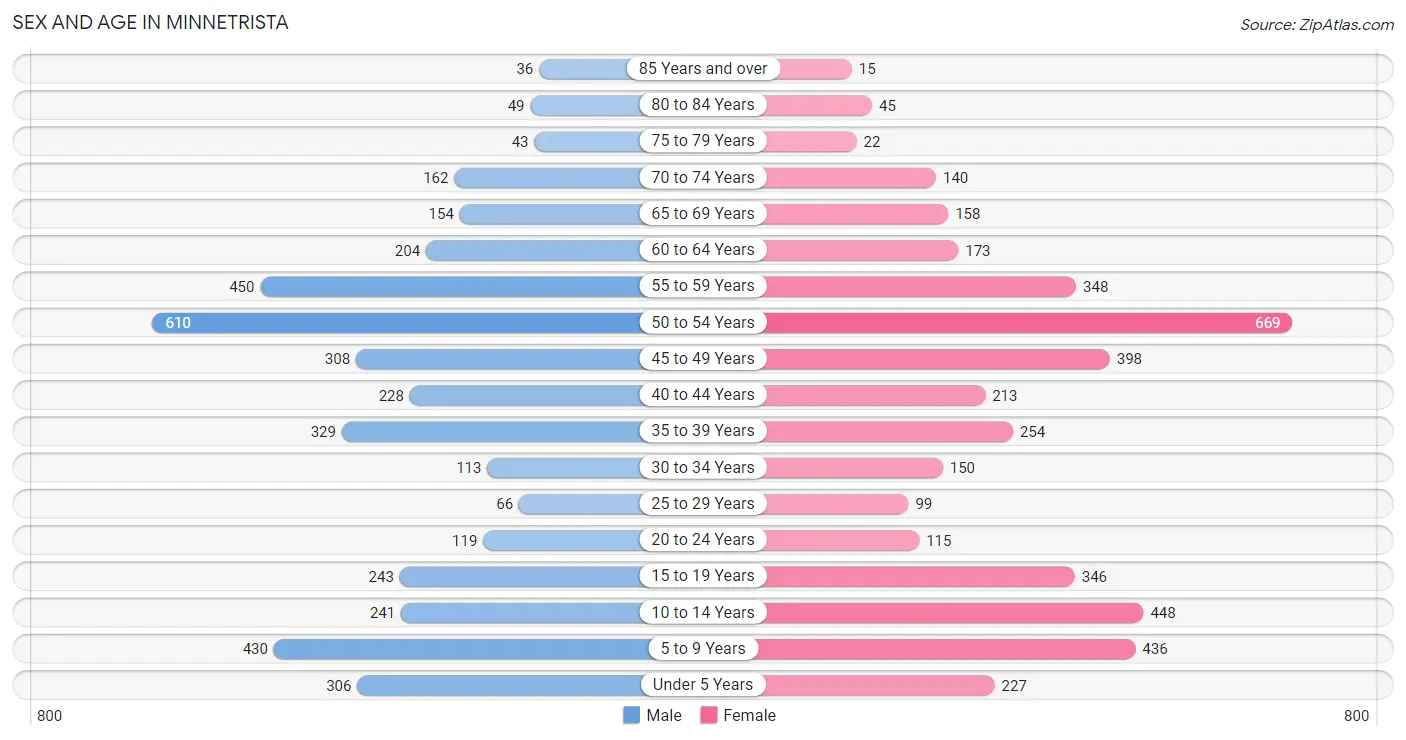
The most populous age groups in Minnetrista are 50 to 54 Years (610 | 14.9%) for men and 50 to 54 Years (669 | 15.7%) for women.
| Age Bracket | Male | Female |
| Under 5 Years | 306 (7.5%) | 227 (5.3%) |
| 5 to 9 Years | 430 (10.5%) | 436 (10.2%) |
| 10 to 14 Years | 241 (5.9%) | 448 (10.5%) |
| 15 to 19 Years | 243 (5.9%) | 346 (8.1%) |
| 20 to 24 Years | 119 (2.9%) | 115 (2.7%) |
| 25 to 29 Years | 66 (1.6%) | 99 (2.3%) |
| 30 to 34 Years | 113 (2.8%) | 150 (3.5%) |
| 35 to 39 Years | 329 (8.0%) | 254 (6.0%) |
| 40 to 44 Years | 228 (5.6%) | 213 (5.0%) |
| 45 to 49 Years | 308 (7.5%) | 398 (9.3%) |
| 50 to 54 Years | 610 (14.9%) | 669 (15.7%) |
| 55 to 59 Years | 450 (11.0%) | 348 (8.2%) |
| 60 to 64 Years | 204 (5.0%) | 173 (4.1%) |
| 65 to 69 Years | 154 (3.8%) | 158 (3.7%) |
| 70 to 74 Years | 162 (4.0%) | 140 (3.3%) |
| 75 to 79 Years | 43 (1.1%) | 22 (0.5%) |
| 80 to 84 Years | 49 (1.2%) | 45 (1.1%) |
| 85 Years and over | 36 (0.9%) | 15 (0.4%) |
| Total | 4,091 (100.0%) | 4,256 (100.0%) |
Families and Households in Minnetrista
Median Family Size in Minnetrista
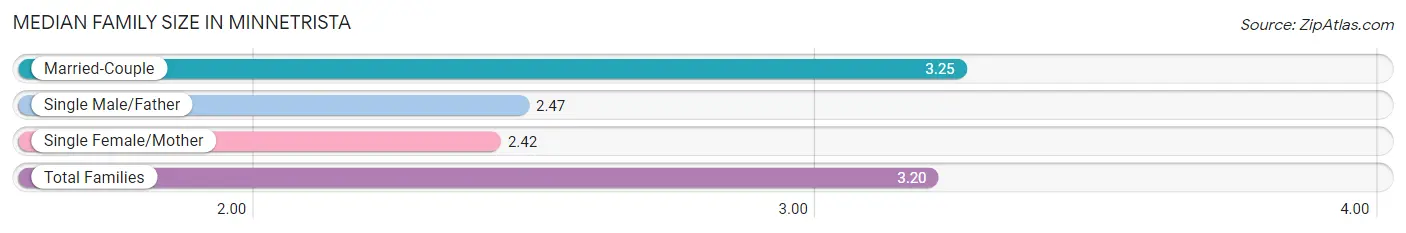
The median family size in Minnetrista is 3.20 persons per family, with married-couple families (2,364 | 95.0%) accounting for the largest median family size of 3.25 persons per family. On the other hand, single female/mother families (90 | 3.6%) represent the smallest median family size with 2.42 persons per family.
| Family Type | # Families | Family Size |
| Married-Couple | 2,364 (95.0%) | 3.25 |
| Single Male/Father | 34 (1.4%) | 2.47 |
| Single Female/Mother | 90 (3.6%) | 2.42 |
| Total Families | 2,488 (100.0%) | 3.20 |
Median Household Size in Minnetrista
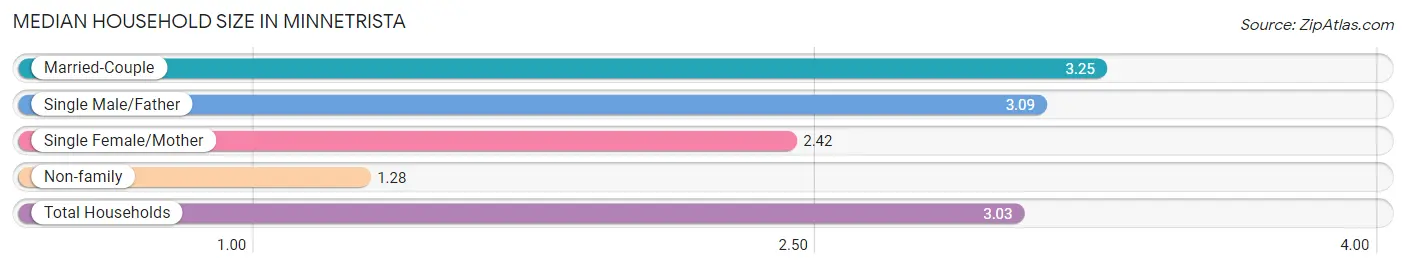
The median household size in Minnetrista is 3.03 persons per household, with married-couple households (2,364 | 85.9%) accounting for the largest median household size of 3.25 persons per household. non-family households (265 | 9.6%) represent the smallest median household size with 1.28 persons per household.
| Household Type | # Households | Household Size |
| Married-Couple | 2,364 (85.9%) | 3.25 |
| Single Male/Father | 34 (1.2%) | 3.09 |
| Single Female/Mother | 90 (3.3%) | 2.42 |
| Non-family | 265 (9.6%) | 1.28 |
| Total Households | 2,753 (100.0%) | 3.03 |
Household Size by Marriage Status in Minnetrista
Out of a total of 2,753 households in Minnetrista, 2,488 (90.4%) are family households, while 265 (9.6%) are nonfamily households. The most numerous type of family households are 2-person households, comprising 1,107, and the most common type of nonfamily households are 1-person households, comprising 189.
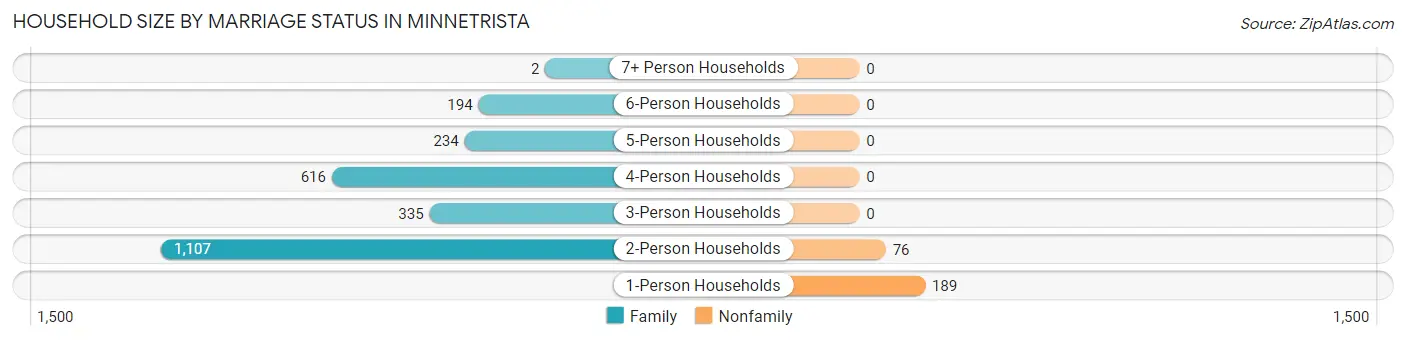
| Household Size | Family Households | Nonfamily Households |
| 1-Person Households | - | 189 (6.9%) |
| 2-Person Households | 1,107 (40.2%) | 76 (2.8%) |
| 3-Person Households | 335 (12.2%) | 0 (0.0%) |
| 4-Person Households | 616 (22.4%) | 0 (0.0%) |
| 5-Person Households | 234 (8.5%) | 0 (0.0%) |
| 6-Person Households | 194 (7.0%) | 0 (0.0%) |
| 7+ Person Households | 2 (0.1%) | 0 (0.0%) |
| Total | 2,488 (90.4%) | 265 (9.6%) |
Female Fertility in Minnetrista
Fertility by Age in Minnetrista
Average fertility rate in Minnetrista is 50.0 births per 1,000 women. Women in the age bracket of 20 to 34 years have the highest fertility rate with 66.0 births per 1,000 women. Women in the age bracket of 35 to 50 years acount for 70.4% of all women with births.
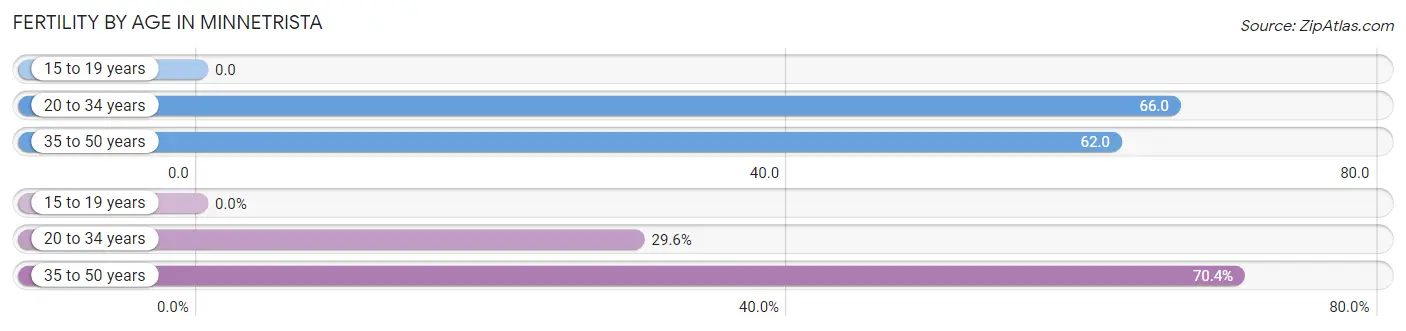
| Age Bracket | Women with Births | Births / 1,000 Women |
| 15 to 19 years | 0 (0.0%) | 0.0 |
| 20 to 34 years | 24 (29.6%) | 66.0 |
| 35 to 50 years | 57 (70.4%) | 62.0 |
| Total | 81 (100.0%) | 50.0 |
Fertility by Age by Marriage Status in Minnetrista
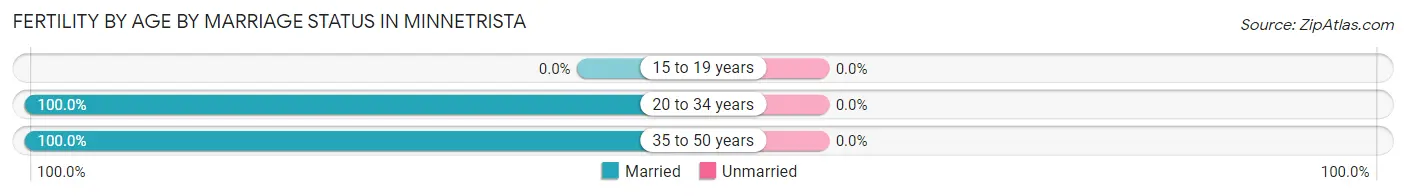
| Age Bracket | Married | Unmarried |
| 15 to 19 years | 0 (0.0%) | 0 (0.0%) |
| 20 to 34 years | 24 (100.0%) | 0 (0.0%) |
| 35 to 50 years | 57 (100.0%) | 0 (0.0%) |
| Total | 81 (100.0%) | 0 (0.0%) |
Fertility by Education in Minnetrista
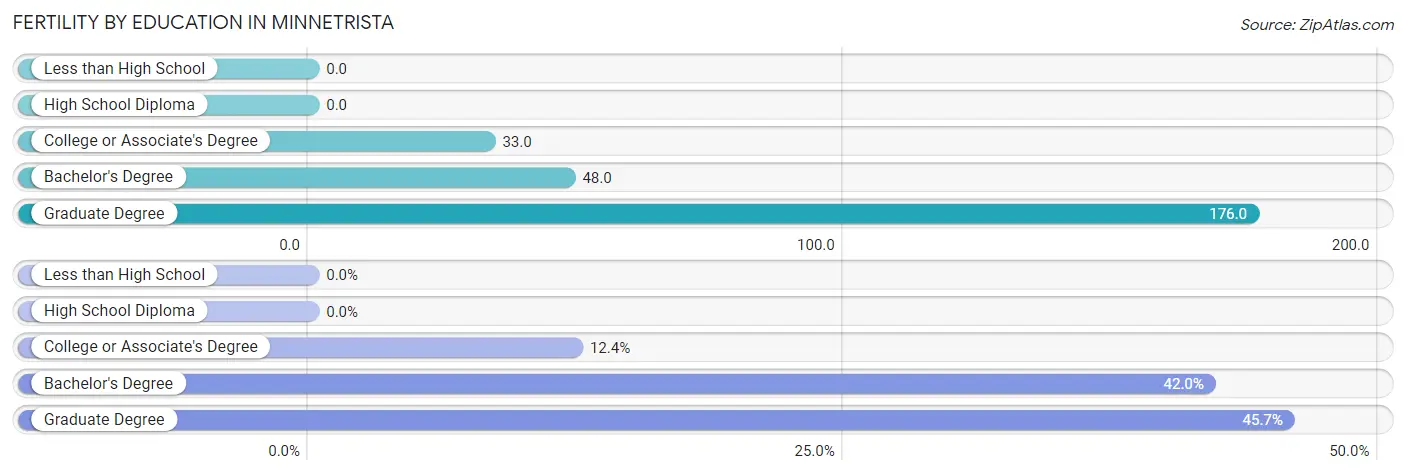
| Educational Attainment | Women with Births | Births / 1,000 Women |
| Less than High School | 0 (0.0%) | 0.0 |
| High School Diploma | 0 (0.0%) | 0.0 |
| College or Associate's Degree | 10 (12.3%) | 33.0 |
| Bachelor's Degree | 34 (42.0%) | 48.0 |
| Graduate Degree | 37 (45.7%) | 176.0 |
| Total | 81 (100.0%) | 50.0 |
Fertility by Education by Marriage Status in Minnetrista
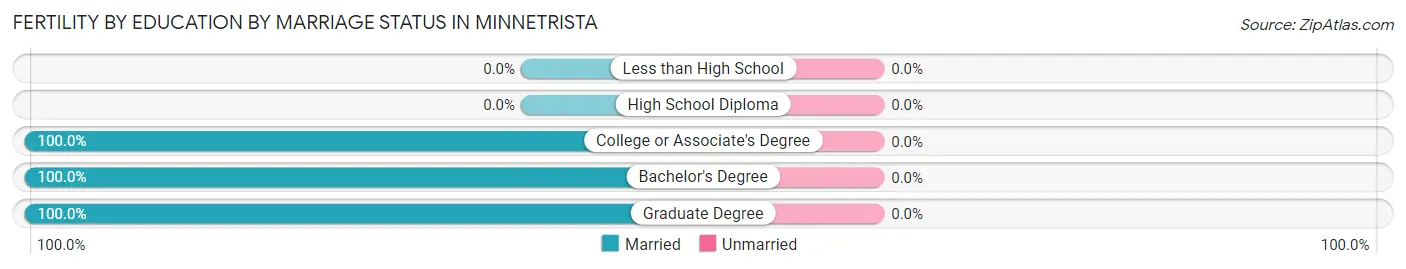
| Educational Attainment | Married | Unmarried |
| Less than High School | 0 (0.0%) | 0 (0.0%) |
| High School Diploma | 0 (0.0%) | 0 (0.0%) |
| College or Associate's Degree | 10 (100.0%) | 0 (0.0%) |
| Bachelor's Degree | 34 (100.0%) | 0 (0.0%) |
| Graduate Degree | 37 (100.0%) | 0 (0.0%) |
| Total | 81 (100.0%) | 0 (0.0%) |
Employment Characteristics in Minnetrista
Employment by Class of Employer in Minnetrista
Among the 4,120 employed individuals in Minnetrista, private company employees (2,924 | 71.0%), not-for-profit organizations (315 | 7.6%), and self-employed (incorporated) (283 | 6.9%) make up the most common classes of employment.
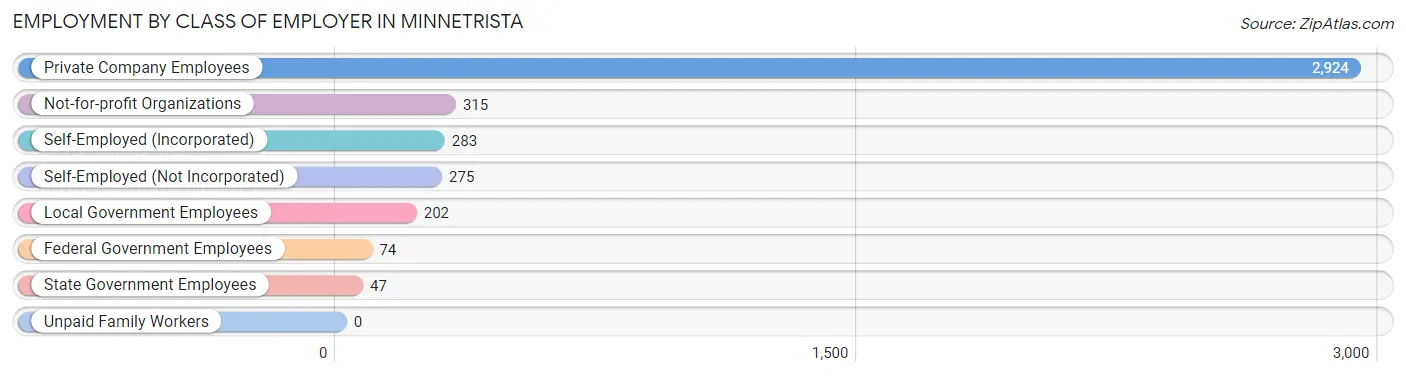
| Employer Class | # Employees | % Employees |
| Private Company Employees | 2,924 | 71.0% |
| Self-Employed (Incorporated) | 283 | 6.9% |
| Self-Employed (Not Incorporated) | 275 | 6.7% |
| Not-for-profit Organizations | 315 | 7.6% |
| Local Government Employees | 202 | 4.9% |
| State Government Employees | 47 | 1.1% |
| Federal Government Employees | 74 | 1.8% |
| Unpaid Family Workers | 0 | 0.0% |
| Total | 4,120 | 100.0% |
Employment Status by Age in Minnetrista
According to the labor force statistics for Minnetrista, out of the total population over 16 years of age (6,110), 70.1% or 4,283 individuals are in the labor force, with 2.3% or 99 of them unemployed. The age group with the highest labor force participation rate is 25 to 29 years, with 90.9% or 150 individuals in the labor force. Within the labor force, the 20 to 24 years age range has the highest percentage of unemployed individuals, with 10.5% or 16 of them being unemployed.
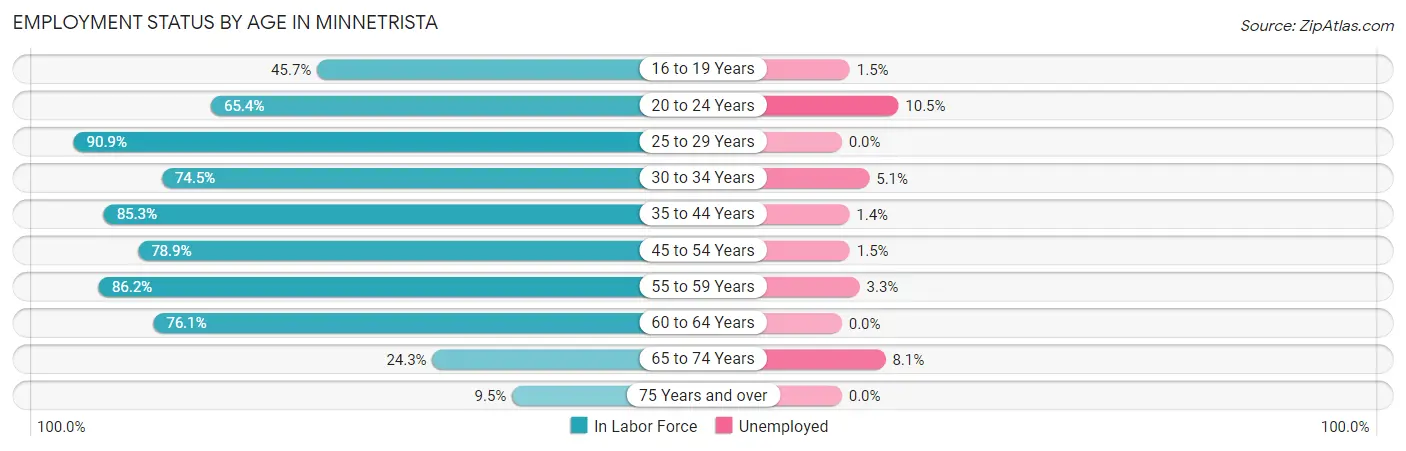
| Age Bracket | In Labor Force | Unemployed |
| 16 to 19 Years | 201 (45.7%) | 3 (1.5%) |
| 20 to 24 Years | 153 (65.4%) | 16 (10.5%) |
| 25 to 29 Years | 150 (90.9%) | 0 (0.0%) |
| 30 to 34 Years | 196 (74.5%) | 10 (5.1%) |
| 35 to 44 Years | 873 (85.3%) | 12 (1.4%) |
| 45 to 54 Years | 1,566 (78.9%) | 23 (1.5%) |
| 55 to 59 Years | 688 (86.2%) | 23 (3.3%) |
| 60 to 64 Years | 287 (76.1%) | 0 (0.0%) |
| 65 to 74 Years | 149 (24.3%) | 12 (8.1%) |
| 75 Years and over | 20 (9.5%) | 0 (0.0%) |
| Total | 4,283 (70.1%) | 99 (2.3%) |
Employment Status by Educational Attainment in Minnetrista
According to labor force statistics for Minnetrista, 81.5% of individuals (3,759) out of the total population between 25 and 64 years of age (4,612) are in the labor force, with 1.8% or 68 of them being unemployed. The group with the highest labor force participation rate are those with the educational attainment of high school diploma, with 89.1% or 318 individuals in the labor force. Within the labor force, individuals with college / associate degree education have the highest percentage of unemployment, with 5.8% or 32 of them being unemployed.
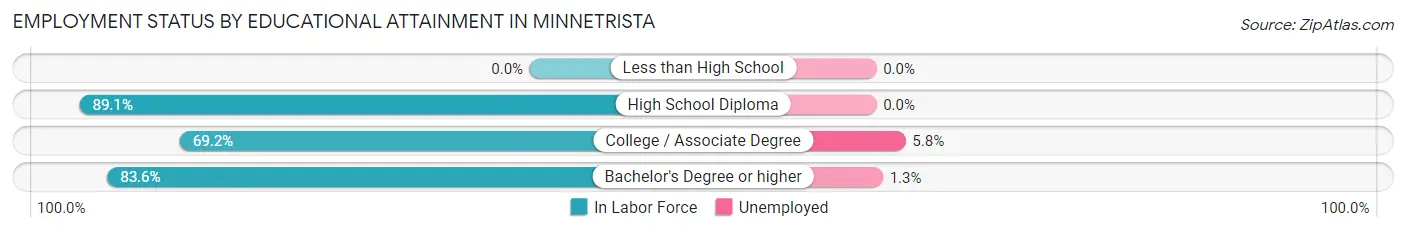
| Educational Attainment | In Labor Force | Unemployed |
| Less than High School | 0 (0.0%) | 0 (0.0%) |
| High School Diploma | 318 (89.1%) | 0 (0.0%) |
| College / Associate Degree | 555 (69.2%) | 47 (5.8%) |
| Bachelor's Degree or higher | 2,887 (83.6%) | 45 (1.3%) |
| Total | 3,759 (81.5%) | 83 (1.8%) |
Employment Occupations by Sex in Minnetrista
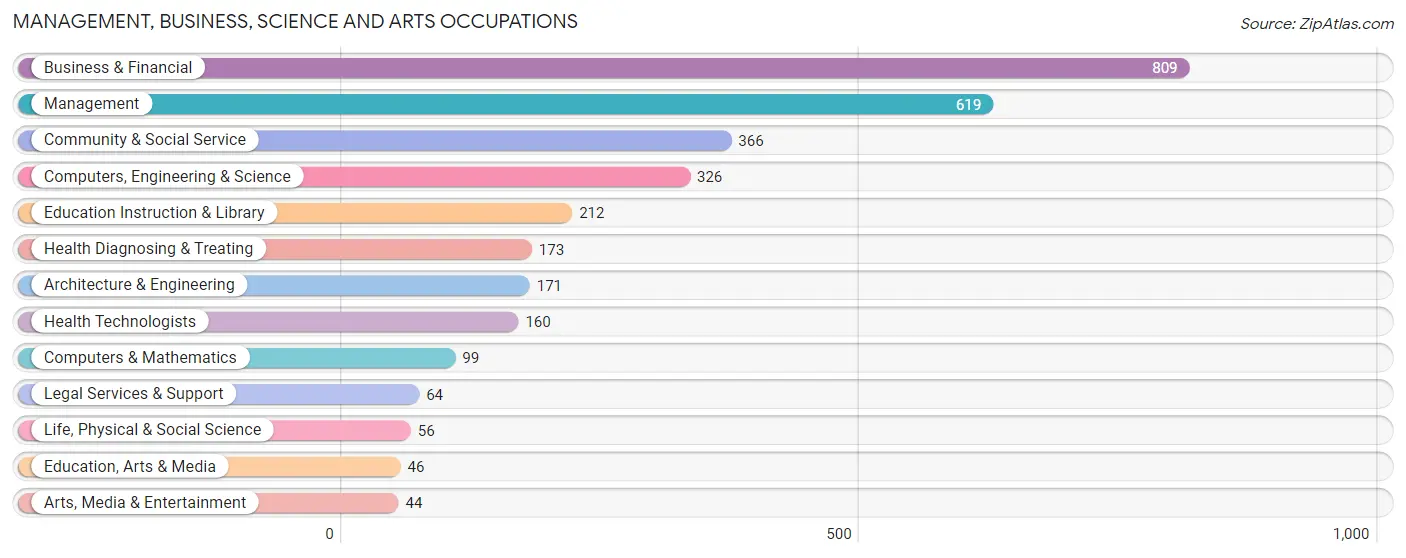
Management, Business, Science and Arts Occupations
The most common Management, Business, Science and Arts occupations in Minnetrista are Business & Financial (809 | 19.3%), Management (619 | 14.8%), Community & Social Service (366 | 8.7%), Computers, Engineering & Science (326 | 7.8%), and Education Instruction & Library (212 | 5.1%).
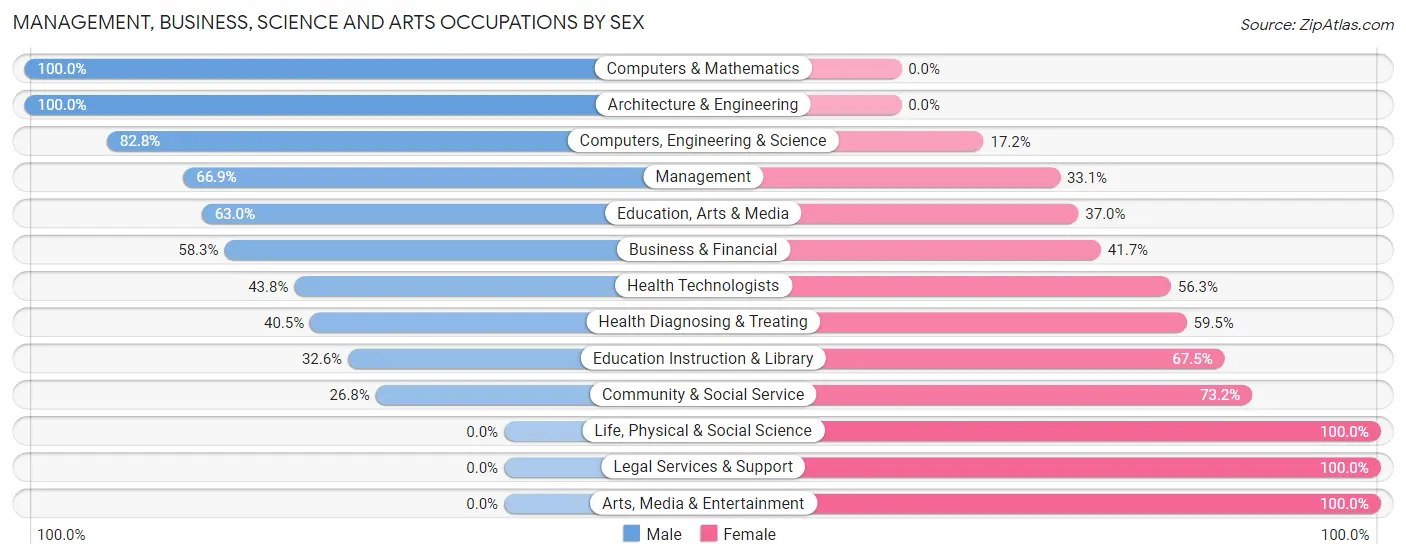
Management, Business, Science and Arts Occupations by Sex
Within the Management, Business, Science and Arts occupations in Minnetrista, the most male-oriented occupations are Computers & Mathematics (100.0%), Architecture & Engineering (100.0%), and Computers, Engineering & Science (82.8%), while the most female-oriented occupations are Life, Physical & Social Science (100.0%), Legal Services & Support (100.0%), and Arts, Media & Entertainment (100.0%).
| Occupation | Male | Female |
| Management | 414 (66.9%) | 205 (33.1%) |
| Business & Financial | 472 (58.3%) | 337 (41.7%) |
| Computers, Engineering & Science | 270 (82.8%) | 56 (17.2%) |
| Computers & Mathematics | 99 (100.0%) | 0 (0.0%) |
| Architecture & Engineering | 171 (100.0%) | 0 (0.0%) |
| Life, Physical & Social Science | 0 (0.0%) | 56 (100.0%) |
| Community & Social Service | 98 (26.8%) | 268 (73.2%) |
| Education, Arts & Media | 29 (63.0%) | 17 (37.0%) |
| Legal Services & Support | 0 (0.0%) | 64 (100.0%) |
| Education Instruction & Library | 69 (32.6%) | 143 (67.4%) |
| Arts, Media & Entertainment | 0 (0.0%) | 44 (100.0%) |
| Health Diagnosing & Treating | 70 (40.5%) | 103 (59.5%) |
| Health Technologists | 70 (43.8%) | 90 (56.2%) |
| Total (Category) | 1,324 (57.7%) | 969 (42.3%) |
| Total (Overall) | 2,429 (58.1%) | 1,754 (41.9%) |
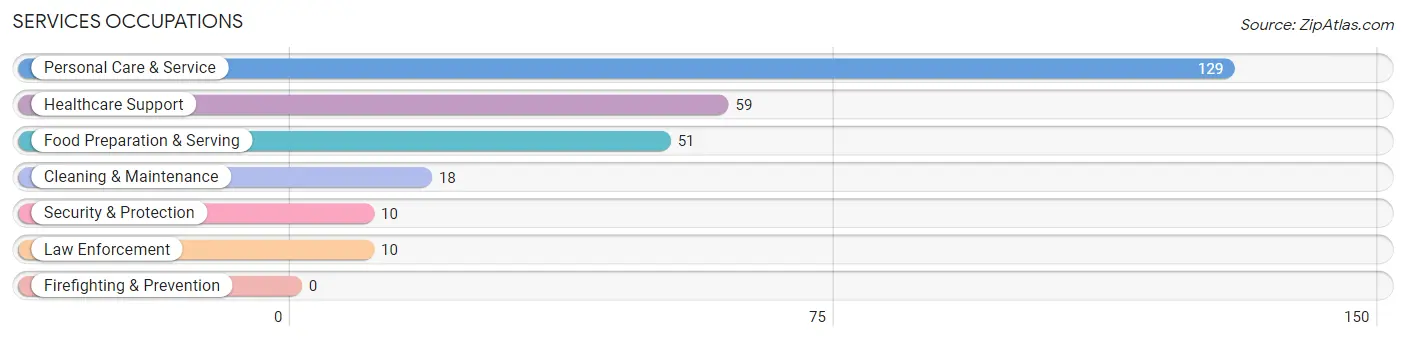
Services Occupations
The most common Services occupations in Minnetrista are Personal Care & Service (129 | 3.1%), Healthcare Support (59 | 1.4%), Food Preparation & Serving (51 | 1.2%), Cleaning & Maintenance (18 | 0.4%), and Security & Protection (10 | 0.2%).
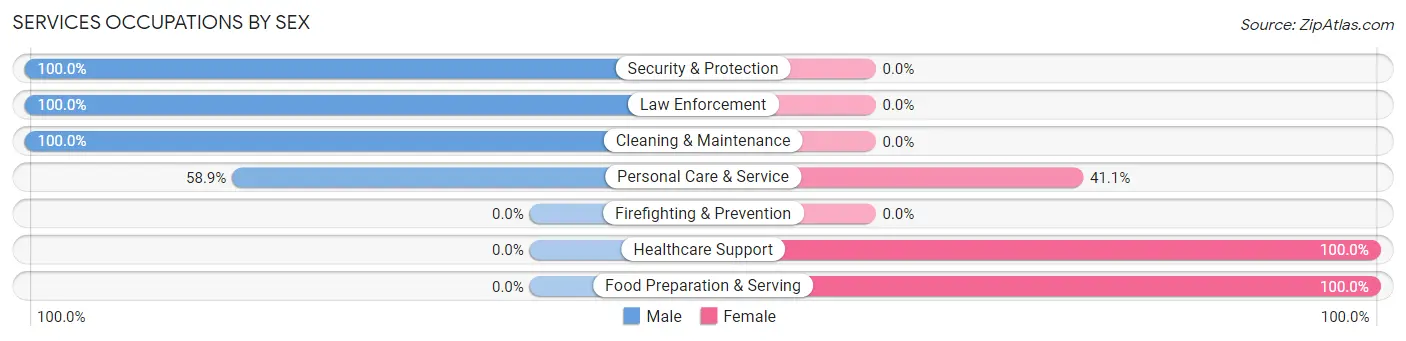
Services Occupations by Sex
Within the Services occupations in Minnetrista, the most male-oriented occupations are Security & Protection (100.0%), Law Enforcement (100.0%), and Cleaning & Maintenance (100.0%), while the most female-oriented occupations are Healthcare Support (100.0%), Food Preparation & Serving (100.0%), and Personal Care & Service (41.1%).
| Occupation | Male | Female |
| Healthcare Support | 0 (0.0%) | 59 (100.0%) |
| Security & Protection | 10 (100.0%) | 0 (0.0%) |
| Firefighting & Prevention | 0 (0.0%) | 0 (0.0%) |
| Law Enforcement | 10 (100.0%) | 0 (0.0%) |
| Food Preparation & Serving | 0 (0.0%) | 51 (100.0%) |
| Cleaning & Maintenance | 18 (100.0%) | 0 (0.0%) |
| Personal Care & Service | 76 (58.9%) | 53 (41.1%) |
| Total (Category) | 104 (39.0%) | 163 (61.1%) |
| Total (Overall) | 2,429 (58.1%) | 1,754 (41.9%) |
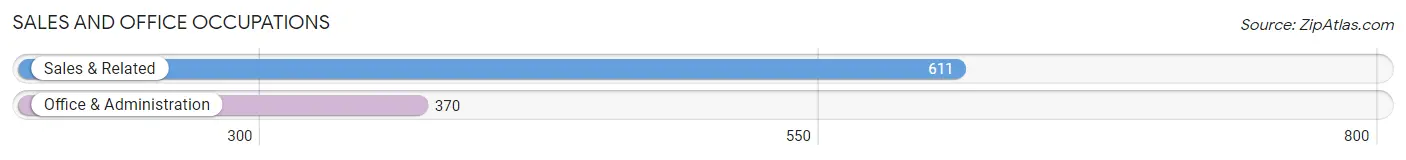
Sales and Office Occupations
The most common Sales and Office occupations in Minnetrista are Sales & Related (611 | 14.6%), and Office & Administration (370 | 8.8%).
Sales and Office Occupations by Sex
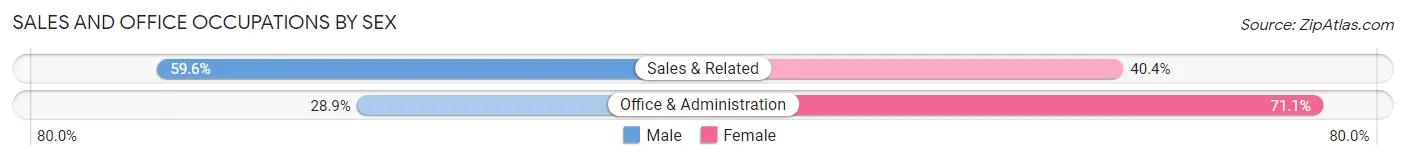
| Occupation | Male | Female |
| Sales & Related | 364 (59.6%) | 247 (40.4%) |
| Office & Administration | 107 (28.9%) | 263 (71.1%) |
| Total (Category) | 471 (48.0%) | 510 (52.0%) |
| Total (Overall) | 2,429 (58.1%) | 1,754 (41.9%) |
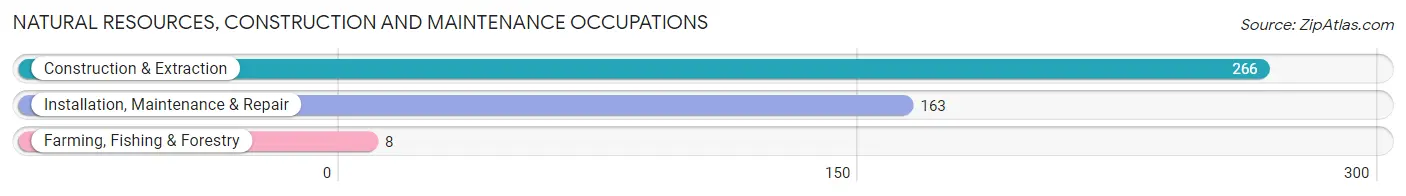
Natural Resources, Construction and Maintenance Occupations
The most common Natural Resources, Construction and Maintenance occupations in Minnetrista are Construction & Extraction (266 | 6.4%), Installation, Maintenance & Repair (163 | 3.9%), and Farming, Fishing & Forestry (8 | 0.2%).
Natural Resources, Construction and Maintenance Occupations by Sex
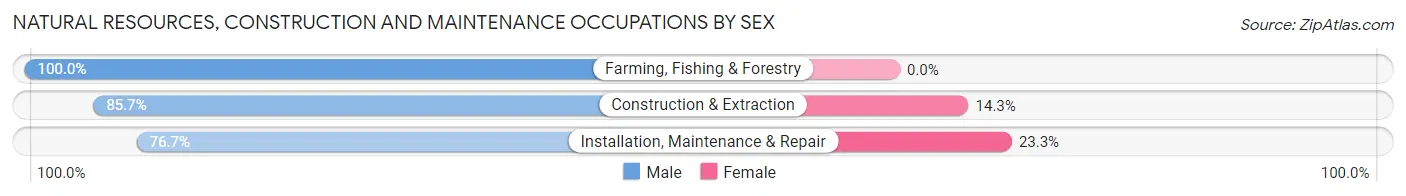
| Occupation | Male | Female |
| Farming, Fishing & Forestry | 8 (100.0%) | 0 (0.0%) |
| Construction & Extraction | 228 (85.7%) | 38 (14.3%) |
| Installation, Maintenance & Repair | 125 (76.7%) | 38 (23.3%) |
| Total (Category) | 361 (82.6%) | 76 (17.4%) |
| Total (Overall) | 2,429 (58.1%) | 1,754 (41.9%) |
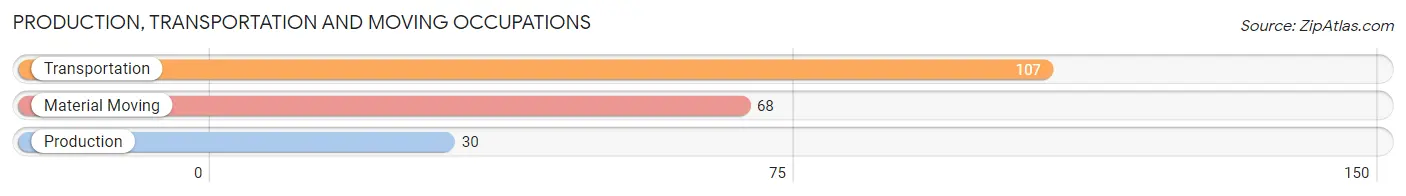
Production, Transportation and Moving Occupations
The most common Production, Transportation and Moving occupations in Minnetrista are Transportation (107 | 2.6%), Material Moving (68 | 1.6%), and Production (30 | 0.7%).
Production, Transportation and Moving Occupations by Sex
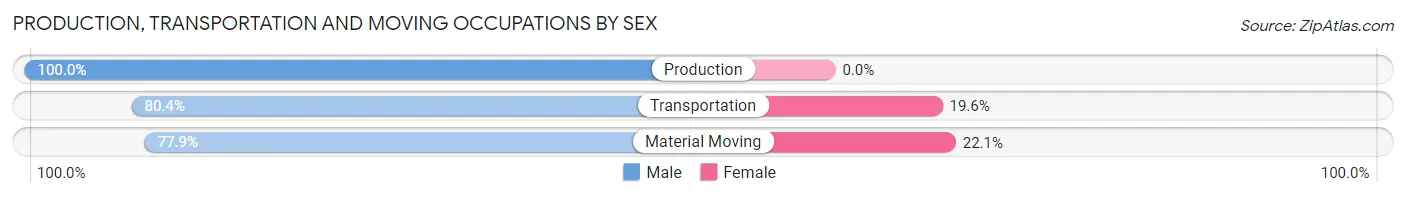
| Occupation | Male | Female |
| Production | 30 (100.0%) | 0 (0.0%) |
| Transportation | 86 (80.4%) | 21 (19.6%) |
| Material Moving | 53 (77.9%) | 15 (22.1%) |
| Total (Category) | 169 (82.4%) | 36 (17.6%) |
| Total (Overall) | 2,429 (58.1%) | 1,754 (41.9%) |
Employment Industries by Sex in Minnetrista
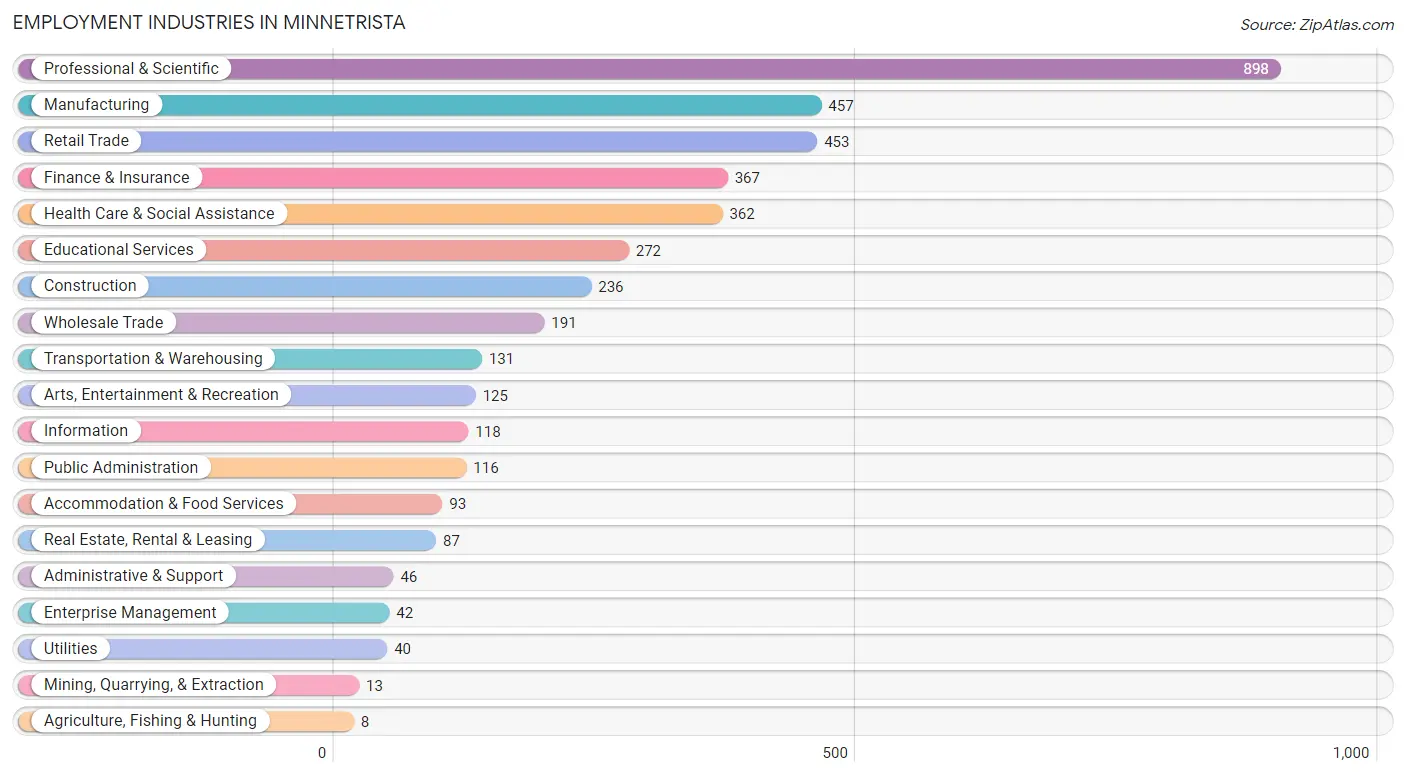
Employment Industries in Minnetrista
The major employment industries in Minnetrista include Professional & Scientific (898 | 21.5%), Manufacturing (457 | 10.9%), Retail Trade (453 | 10.8%), Finance & Insurance (367 | 8.8%), and Health Care & Social Assistance (362 | 8.6%).
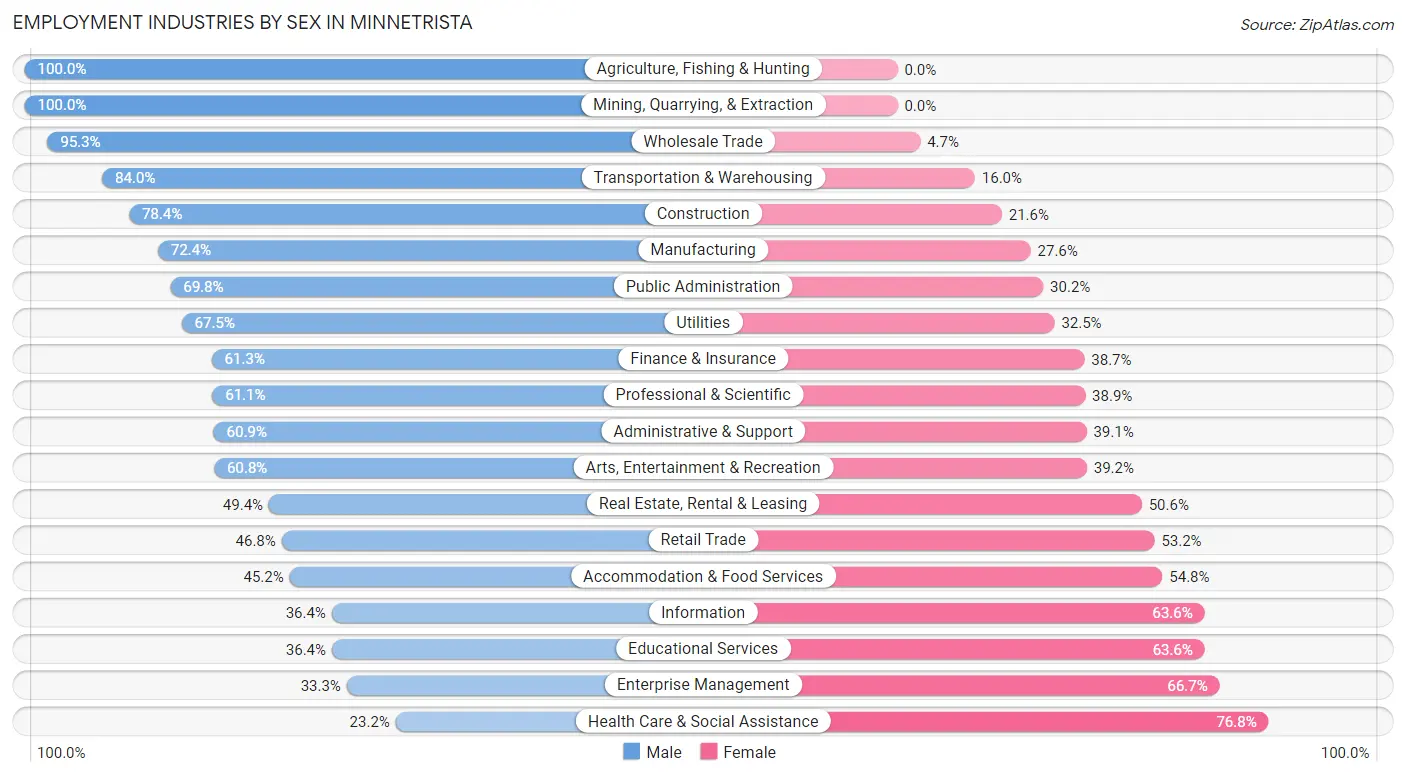
Employment Industries by Sex in Minnetrista
The Minnetrista industries that see more men than women are Agriculture, Fishing & Hunting (100.0%), Mining, Quarrying, & Extraction (100.0%), and Wholesale Trade (95.3%), whereas the industries that tend to have a higher number of women are Health Care & Social Assistance (76.8%), Enterprise Management (66.7%), and Educational Services (63.6%).
| Industry | Male | Female |
| Agriculture, Fishing & Hunting | 8 (100.0%) | 0 (0.0%) |
| Mining, Quarrying, & Extraction | 13 (100.0%) | 0 (0.0%) |
| Construction | 185 (78.4%) | 51 (21.6%) |
| Manufacturing | 331 (72.4%) | 126 (27.6%) |
| Wholesale Trade | 182 (95.3%) | 9 (4.7%) |
| Retail Trade | 212 (46.8%) | 241 (53.2%) |
| Transportation & Warehousing | 110 (84.0%) | 21 (16.0%) |
| Utilities | 27 (67.5%) | 13 (32.5%) |
| Information | 43 (36.4%) | 75 (63.6%) |
| Finance & Insurance | 225 (61.3%) | 142 (38.7%) |
| Real Estate, Rental & Leasing | 43 (49.4%) | 44 (50.6%) |
| Professional & Scientific | 549 (61.1%) | 349 (38.9%) |
| Enterprise Management | 14 (33.3%) | 28 (66.7%) |
| Administrative & Support | 28 (60.9%) | 18 (39.1%) |
| Educational Services | 99 (36.4%) | 173 (63.6%) |
| Health Care & Social Assistance | 84 (23.2%) | 278 (76.8%) |
| Arts, Entertainment & Recreation | 76 (60.8%) | 49 (39.2%) |
| Accommodation & Food Services | 42 (45.2%) | 51 (54.8%) |
| Public Administration | 81 (69.8%) | 35 (30.2%) |
| Total | 2,429 (58.1%) | 1,754 (41.9%) |
Education in Minnetrista
School Enrollment in Minnetrista
The most common levels of schooling among the 2,410 students in Minnetrista are high school (597 | 24.8%), elementary school (594 | 24.6%), and middle school (557 | 23.1%).
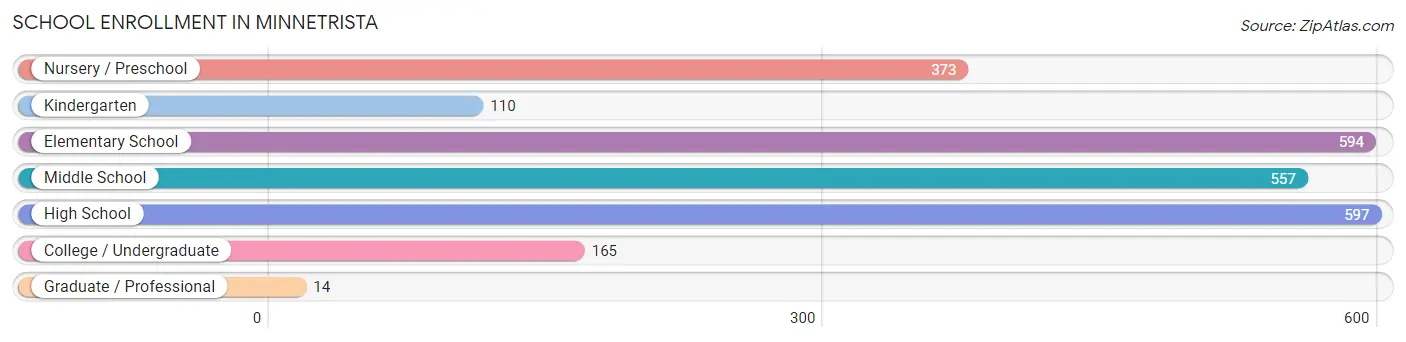
| School Level | # Students | % Students |
| Nursery / Preschool | 373 | 15.5% |
| Kindergarten | 110 | 4.6% |
| Elementary School | 594 | 24.6% |
| Middle School | 557 | 23.1% |
| High School | 597 | 24.8% |
| College / Undergraduate | 165 | 6.9% |
| Graduate / Professional | 14 | 0.6% |
| Total | 2,410 | 100.0% |
School Enrollment by Age by Funding Source in Minnetrista
Out of a total of 2,410 students who are enrolled in schools in Minnetrista, 465 (19.3%) attend a private institution, while the remaining 1,945 (80.7%) are enrolled in public schools. The age group of 35 years and over has the highest likelihood of being enrolled in private schools, with 19 (52.8% in the age bracket) enrolled. Conversely, the age group of 18 to 19 year olds has the lowest likelihood of being enrolled in a private school, with 78 (90.7% in the age bracket) attending a public institution.
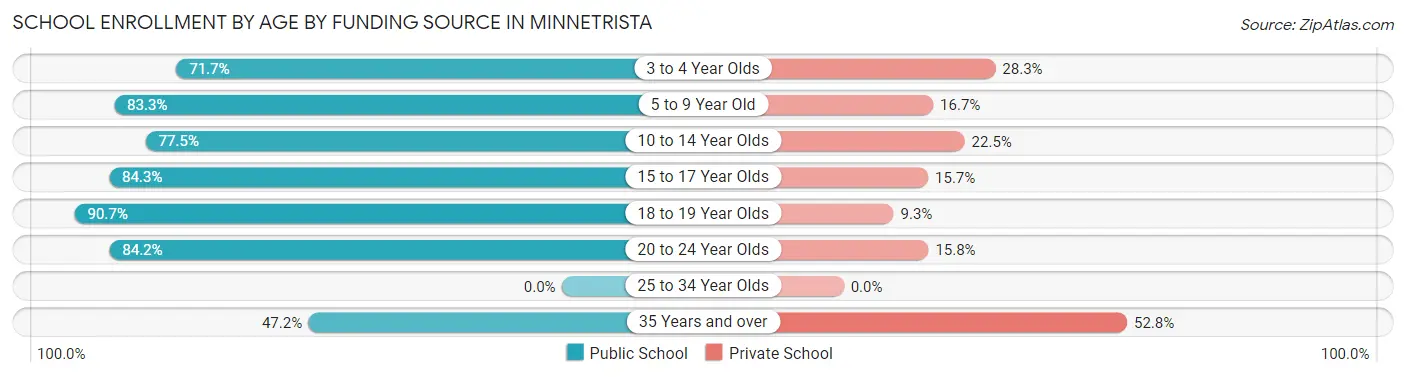
| Age Bracket | Public School | Private School |
| 3 to 4 Year Olds | 132 (71.7%) | 52 (28.3%) |
| 5 to 9 Year Old | 690 (83.3%) | 138 (16.7%) |
| 10 to 14 Year Olds | 526 (77.5%) | 153 (22.5%) |
| 15 to 17 Year Olds | 407 (84.3%) | 76 (15.7%) |
| 18 to 19 Year Olds | 78 (90.7%) | 8 (9.3%) |
| 20 to 24 Year Olds | 96 (84.2%) | 18 (15.8%) |
| 25 to 34 Year Olds | 0 (0.0%) | 0 (0.0%) |
| 35 Years and over | 17 (47.2%) | 19 (52.8%) |
| Total | 1,945 (80.7%) | 465 (19.3%) |
Educational Attainment by Field of Study in Minnetrista
Business (1,001 | 24.1%), social sciences (462 | 11.1%), education (443 | 10.7%), communications (435 | 10.5%), and bio, nature & agricultural (420 | 10.1%) are the most common fields of study among 4,157 individuals in Minnetrista who have obtained a bachelor's degree or higher.
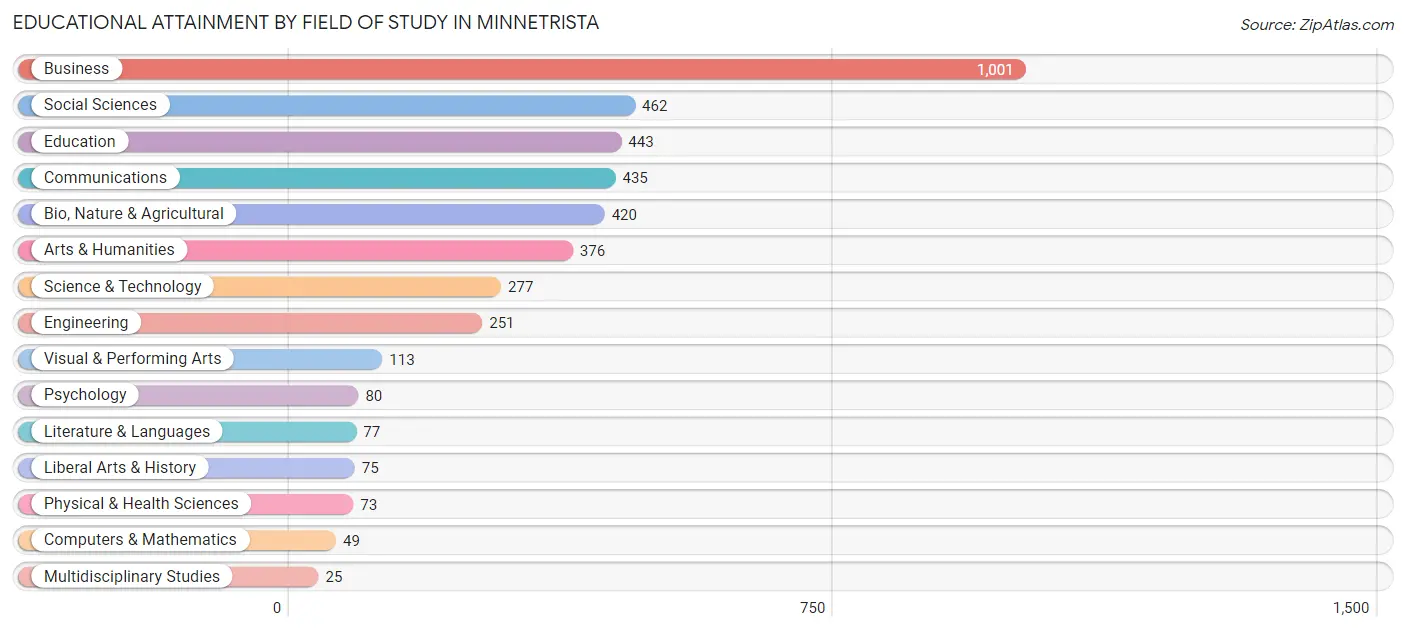
| Field of Study | # Graduates | % Graduates |
| Computers & Mathematics | 49 | 1.2% |
| Bio, Nature & Agricultural | 420 | 10.1% |
| Physical & Health Sciences | 73 | 1.8% |
| Psychology | 80 | 1.9% |
| Social Sciences | 462 | 11.1% |
| Engineering | 251 | 6.0% |
| Multidisciplinary Studies | 25 | 0.6% |
| Science & Technology | 277 | 6.7% |
| Business | 1,001 | 24.1% |
| Education | 443 | 10.7% |
| Literature & Languages | 77 | 1.8% |
| Liberal Arts & History | 75 | 1.8% |
| Visual & Performing Arts | 113 | 2.7% |
| Communications | 435 | 10.5% |
| Arts & Humanities | 376 | 9.0% |
| Total | 4,157 | 100.0% |
Transportation & Commute in Minnetrista
Vehicle Availability by Sex in Minnetrista
The most prevalent vehicle ownership categories in Minnetrista are males with 2 vehicles (987, accounting for 40.7%) and females with 2 vehicles (822, making up 58.3%).
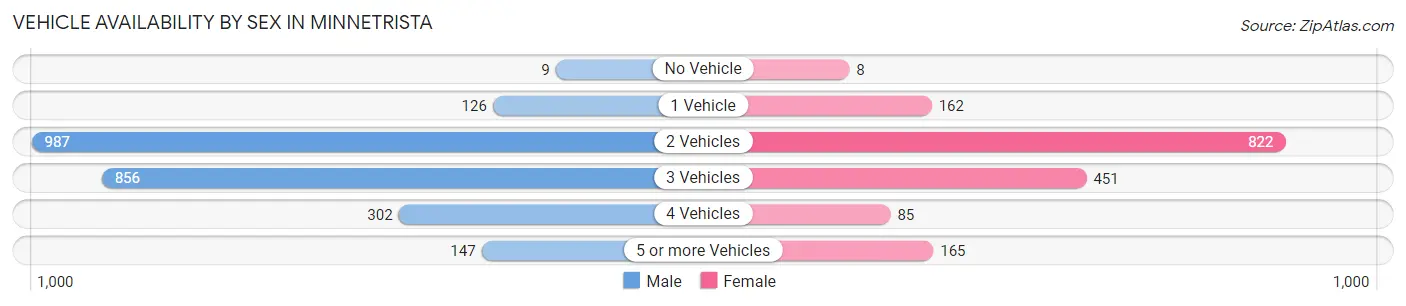
| Vehicles Available | Male | Female |
| No Vehicle | 9 (0.4%) | 8 (0.5%) |
| 1 Vehicle | 126 (5.2%) | 162 (9.6%) |
| 2 Vehicles | 987 (40.7%) | 822 (48.5%) |
| 3 Vehicles | 856 (35.3%) | 451 (26.6%) |
| 4 Vehicles | 302 (12.4%) | 85 (5.0%) |
| 5 or more Vehicles | 147 (6.1%) | 165 (9.8%) |
| Total | 2,427 (100.0%) | 1,693 (100.0%) |
Commute Time in Minnetrista
The most frequently occuring commute durations in Minnetrista are 30 to 34 minutes (504 commuters, 18.0%), 45 to 59 minutes (367 commuters, 13.1%), and 25 to 29 minutes (356 commuters, 12.7%).
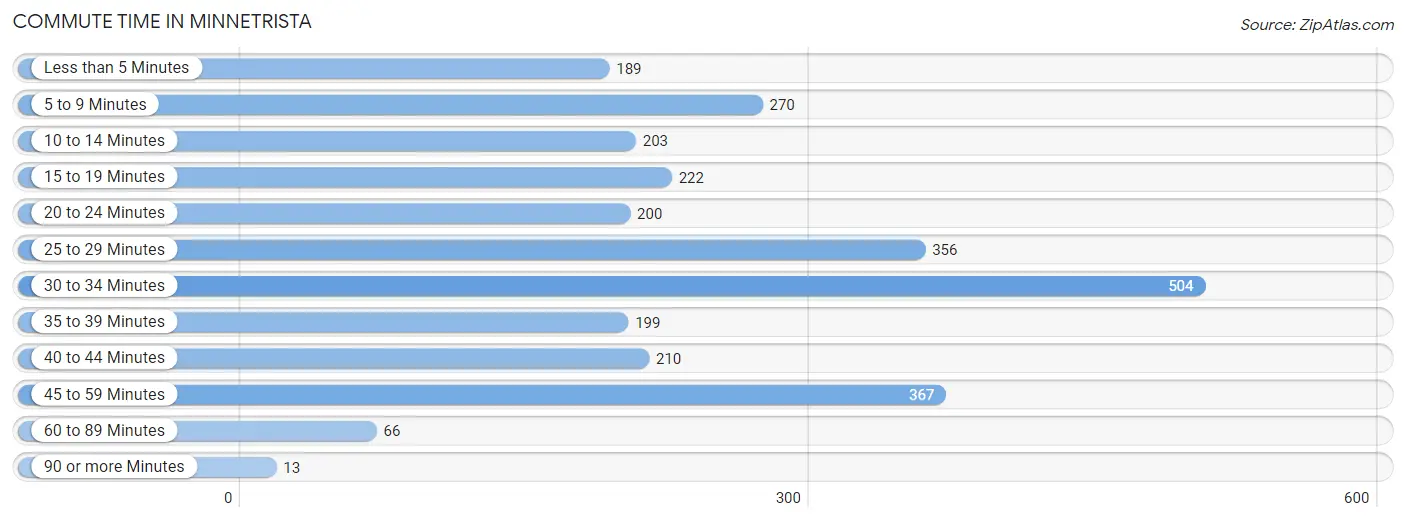
| Commute Time | # Commuters | % Commuters |
| Less than 5 Minutes | 189 | 6.8% |
| 5 to 9 Minutes | 270 | 9.7% |
| 10 to 14 Minutes | 203 | 7.2% |
| 15 to 19 Minutes | 222 | 7.9% |
| 20 to 24 Minutes | 200 | 7.1% |
| 25 to 29 Minutes | 356 | 12.7% |
| 30 to 34 Minutes | 504 | 18.0% |
| 35 to 39 Minutes | 199 | 7.1% |
| 40 to 44 Minutes | 210 | 7.5% |
| 45 to 59 Minutes | 367 | 13.1% |
| 60 to 89 Minutes | 66 | 2.4% |
| 90 or more Minutes | 13 | 0.5% |
Commute Time by Sex in Minnetrista
The most common commute times in Minnetrista are 30 to 34 minutes (299 commuters, 17.4%) for males and 30 to 34 minutes (205 commuters, 18.9%) for females.
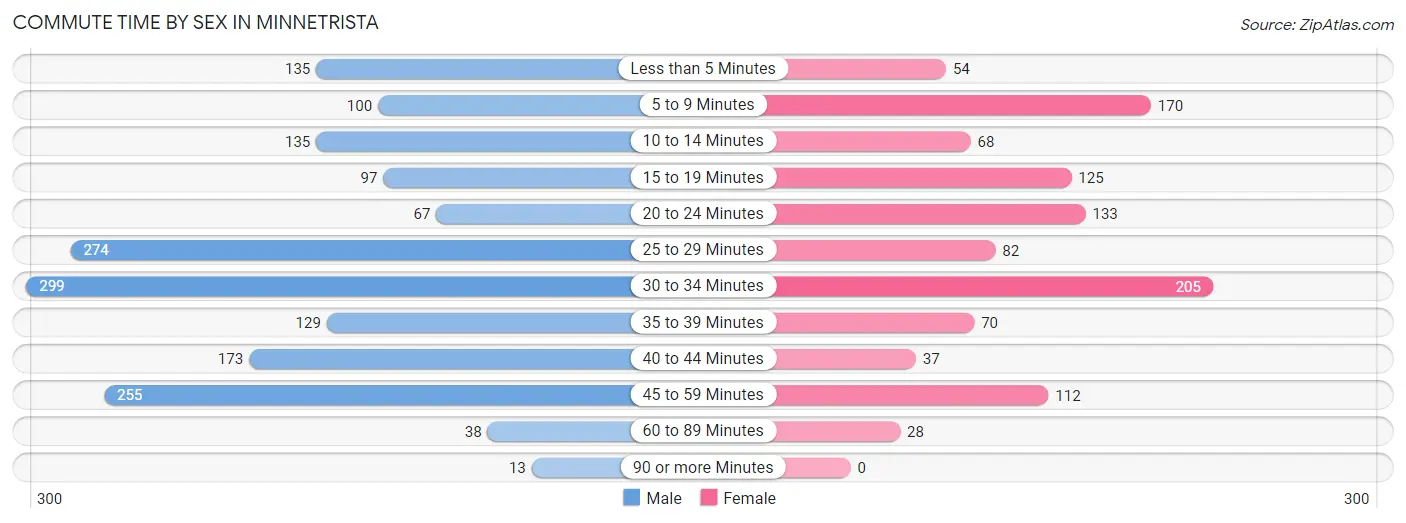
| Commute Time | Male | Female |
| Less than 5 Minutes | 135 (7.9%) | 54 (5.0%) |
| 5 to 9 Minutes | 100 (5.8%) | 170 (15.7%) |
| 10 to 14 Minutes | 135 (7.9%) | 68 (6.3%) |
| 15 to 19 Minutes | 97 (5.7%) | 125 (11.5%) |
| 20 to 24 Minutes | 67 (3.9%) | 133 (12.3%) |
| 25 to 29 Minutes | 274 (16.0%) | 82 (7.6%) |
| 30 to 34 Minutes | 299 (17.4%) | 205 (18.9%) |
| 35 to 39 Minutes | 129 (7.5%) | 70 (6.5%) |
| 40 to 44 Minutes | 173 (10.1%) | 37 (3.4%) |
| 45 to 59 Minutes | 255 (14.9%) | 112 (10.3%) |
| 60 to 89 Minutes | 38 (2.2%) | 28 (2.6%) |
| 90 or more Minutes | 13 (0.8%) | 0 (0.0%) |
Time of Departure to Work by Sex in Minnetrista
The most frequent times of departure to work in Minnetrista are 7:00 AM to 7:29 AM (424, 24.7%) for males and 7:00 AM to 7:29 AM (291, 26.9%) for females.
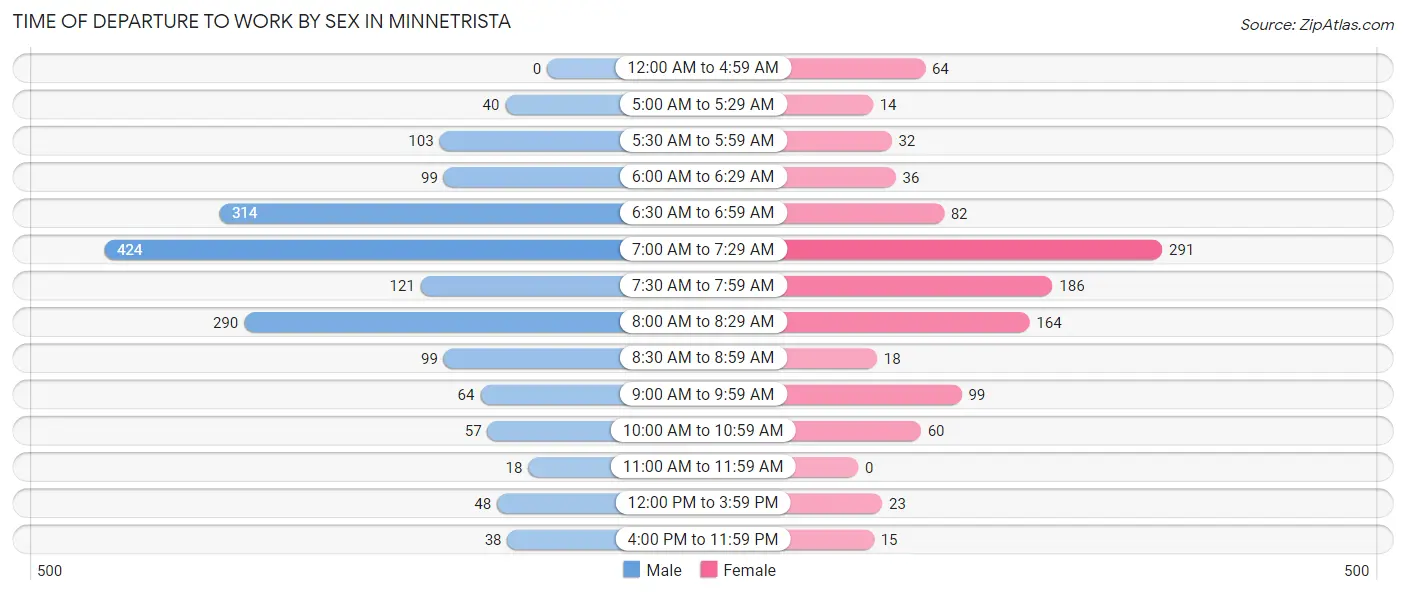
| Time of Departure | Male | Female |
| 12:00 AM to 4:59 AM | 0 (0.0%) | 64 (5.9%) |
| 5:00 AM to 5:29 AM | 40 (2.3%) | 14 (1.3%) |
| 5:30 AM to 5:59 AM | 103 (6.0%) | 32 (2.9%) |
| 6:00 AM to 6:29 AM | 99 (5.8%) | 36 (3.3%) |
| 6:30 AM to 6:59 AM | 314 (18.3%) | 82 (7.6%) |
| 7:00 AM to 7:29 AM | 424 (24.7%) | 291 (26.9%) |
| 7:30 AM to 7:59 AM | 121 (7.1%) | 186 (17.2%) |
| 8:00 AM to 8:29 AM | 290 (16.9%) | 164 (15.1%) |
| 8:30 AM to 8:59 AM | 99 (5.8%) | 18 (1.7%) |
| 9:00 AM to 9:59 AM | 64 (3.7%) | 99 (9.1%) |
| 10:00 AM to 10:59 AM | 57 (3.3%) | 60 (5.5%) |
| 11:00 AM to 11:59 AM | 18 (1.1%) | 0 (0.0%) |
| 12:00 PM to 3:59 PM | 48 (2.8%) | 23 (2.1%) |
| 4:00 PM to 11:59 PM | 38 (2.2%) | 15 (1.4%) |
| Total | 1,715 (100.0%) | 1,084 (100.0%) |
Housing Occupancy in Minnetrista
Occupancy by Ownership in Minnetrista
Of the total 2,753 dwellings in Minnetrista, owner-occupied units account for 2,633 (95.6%), while renter-occupied units make up 120 (4.4%).
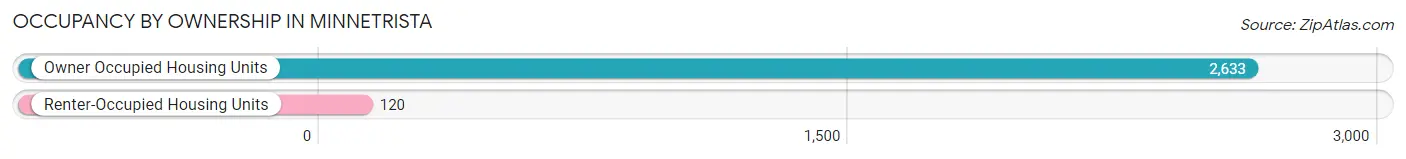
| Occupancy | # Housing Units | % Housing Units |
| Owner Occupied Housing Units | 2,633 | 95.6% |
| Renter-Occupied Housing Units | 120 | 4.4% |
| Total Occupied Housing Units | 2,753 | 100.0% |
Occupancy by Household Size in Minnetrista
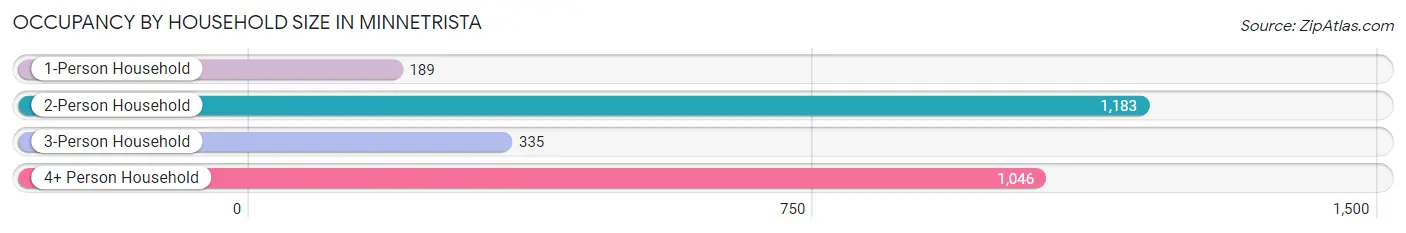
| Household Size | # Housing Units | % Housing Units |
| 1-Person Household | 189 | 6.9% |
| 2-Person Household | 1,183 | 43.0% |
| 3-Person Household | 335 | 12.2% |
| 4+ Person Household | 1,046 | 38.0% |
| Total Housing Units | 2,753 | 100.0% |
Occupancy by Ownership by Household Size in Minnetrista
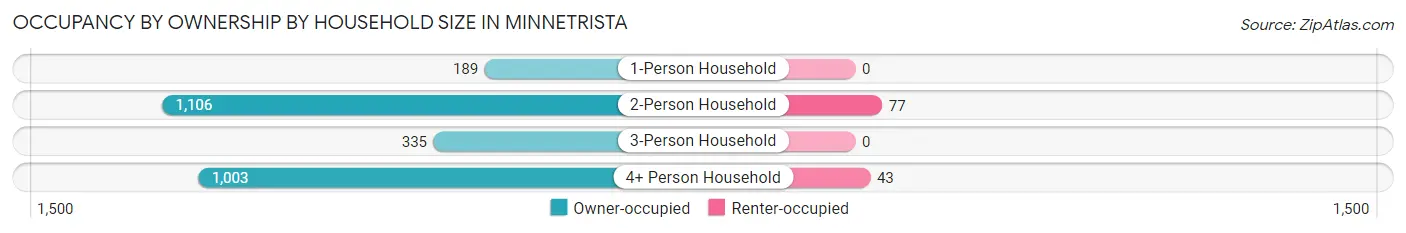
| Household Size | Owner-occupied | Renter-occupied |
| 1-Person Household | 189 (100.0%) | 0 (0.0%) |
| 2-Person Household | 1,106 (93.5%) | 77 (6.5%) |
| 3-Person Household | 335 (100.0%) | 0 (0.0%) |
| 4+ Person Household | 1,003 (95.9%) | 43 (4.1%) |
| Total Housing Units | 2,633 (95.6%) | 120 (4.4%) |
Occupancy by Educational Attainment in Minnetrista
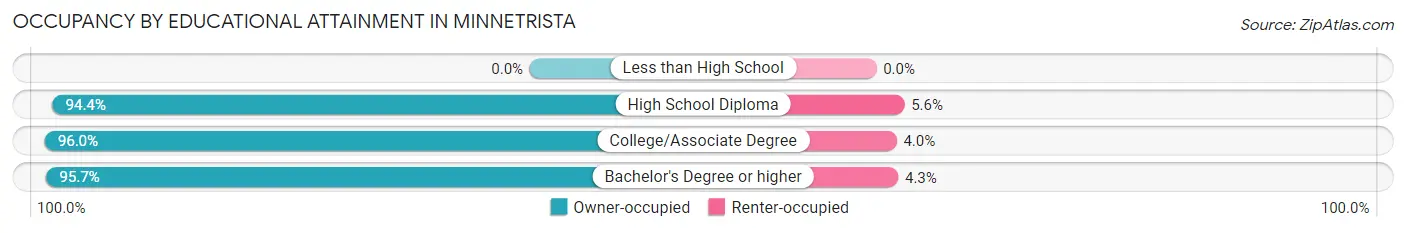
| Household Size | Owner-occupied | Renter-occupied |
| Less than High School | 0 (0.0%) | 0 (0.0%) |
| High School Diploma | 187 (94.4%) | 11 (5.6%) |
| College/Associate Degree | 525 (96.0%) | 22 (4.0%) |
| Bachelor's Degree or higher | 1,921 (95.7%) | 87 (4.3%) |
Occupancy by Age of Householder in Minnetrista
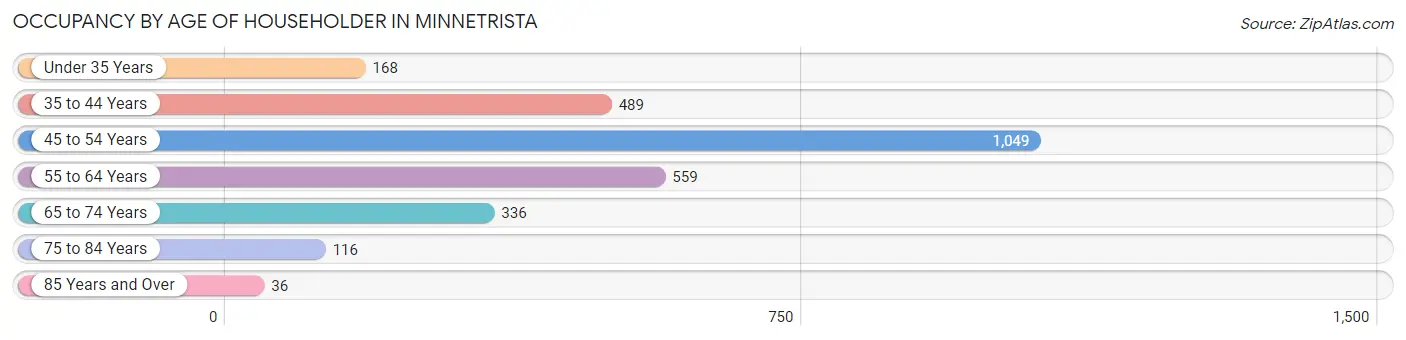
| Age Bracket | # Households | % Households |
| Under 35 Years | 168 | 6.1% |
| 35 to 44 Years | 489 | 17.8% |
| 45 to 54 Years | 1,049 | 38.1% |
| 55 to 64 Years | 559 | 20.3% |
| 65 to 74 Years | 336 | 12.2% |
| 75 to 84 Years | 116 | 4.2% |
| 85 Years and Over | 36 | 1.3% |
| Total | 2,753 | 100.0% |
Housing Finances in Minnetrista
Median Income by Occupancy in Minnetrista
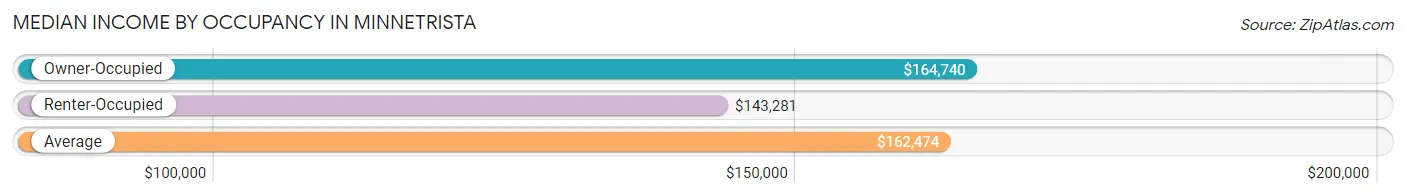
| Occupancy Type | # Households | Median Income |
| Owner-Occupied | 2,633 (95.6%) | $164,740 |
| Renter-Occupied | 120 (4.4%) | $143,281 |
| Average | 2,753 (100.0%) | $162,474 |
Occupancy by Householder Income Bracket in Minnetrista
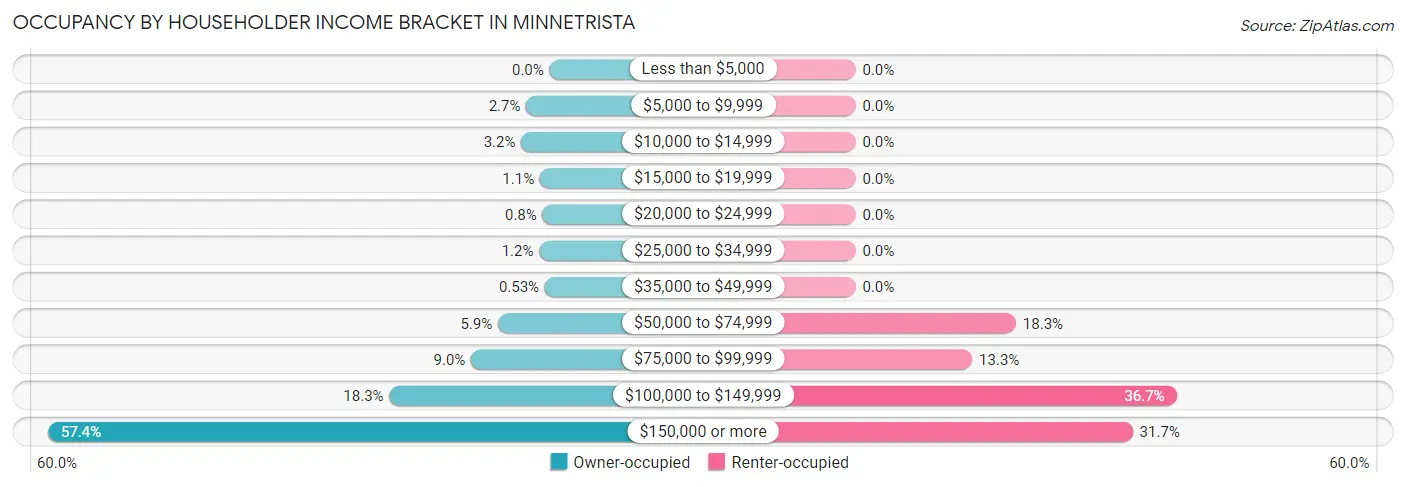
| Income Bracket | Owner-occupied | Renter-occupied |
| Less than $5,000 | 0 (0.0%) | 0 (0.0%) |
| $5,000 to $9,999 | 70 (2.7%) | 0 (0.0%) |
| $10,000 to $14,999 | 85 (3.2%) | 0 (0.0%) |
| $15,000 to $19,999 | 29 (1.1%) | 0 (0.0%) |
| $20,000 to $24,999 | 21 (0.8%) | 0 (0.0%) |
| $25,000 to $34,999 | 31 (1.2%) | 0 (0.0%) |
| $35,000 to $49,999 | 14 (0.5%) | 0 (0.0%) |
| $50,000 to $74,999 | 155 (5.9%) | 22 (18.3%) |
| $75,000 to $99,999 | 236 (9.0%) | 16 (13.3%) |
| $100,000 to $149,999 | 482 (18.3%) | 44 (36.7%) |
| $150,000 or more | 1,510 (57.4%) | 38 (31.7%) |
| Total | 2,633 (100.0%) | 120 (100.0%) |
Monthly Housing Cost Tiers in Minnetrista
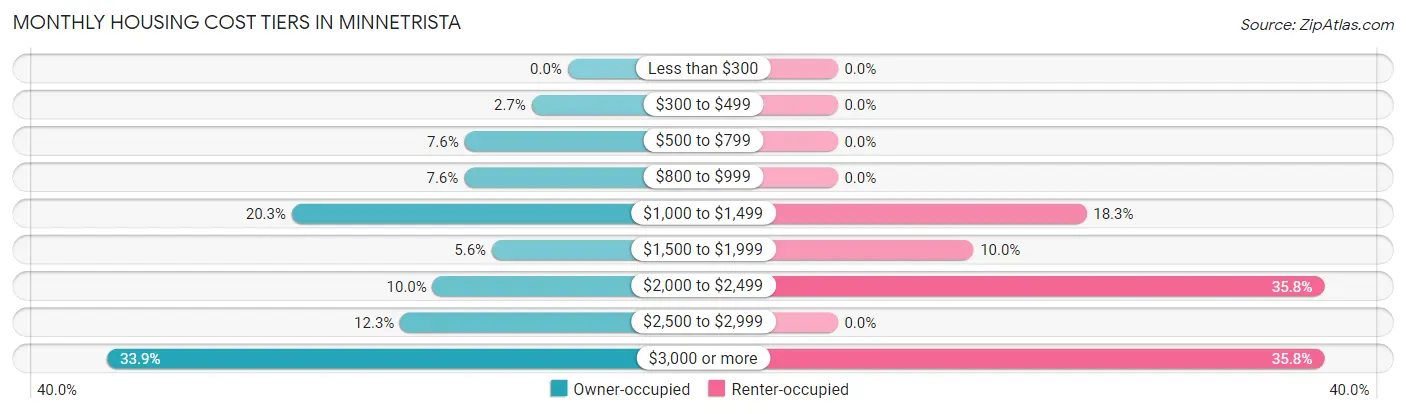
| Monthly Cost | Owner-occupied | Renter-occupied |
| Less than $300 | 0 (0.0%) | 0 (0.0%) |
| $300 to $499 | 70 (2.7%) | 0 (0.0%) |
| $500 to $799 | 200 (7.6%) | 0 (0.0%) |
| $800 to $999 | 201 (7.6%) | 0 (0.0%) |
| $1,000 to $1,499 | 535 (20.3%) | 22 (18.3%) |
| $1,500 to $1,999 | 147 (5.6%) | 12 (10.0%) |
| $2,000 to $2,499 | 262 (10.0%) | 43 (35.8%) |
| $2,500 to $2,999 | 325 (12.3%) | 0 (0.0%) |
| $3,000 or more | 893 (33.9%) | 43 (35.8%) |
| Total | 2,633 (100.0%) | 120 (100.0%) |
Physical Housing Characteristics in Minnetrista
Housing Structures in Minnetrista
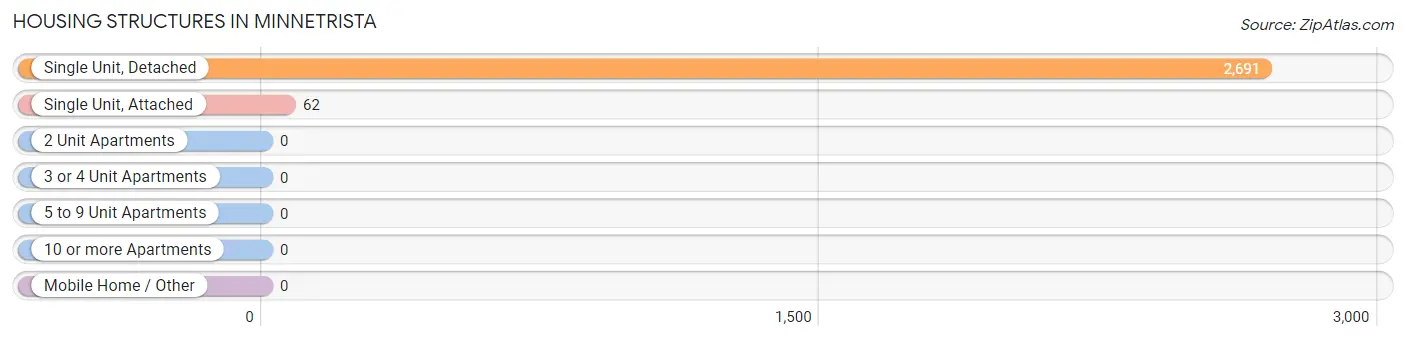
| Structure Type | # Housing Units | % Housing Units |
| Single Unit, Detached | 2,691 | 97.8% |
| Single Unit, Attached | 62 | 2.2% |
| 2 Unit Apartments | 0 | 0.0% |
| 3 or 4 Unit Apartments | 0 | 0.0% |
| 5 to 9 Unit Apartments | 0 | 0.0% |
| 10 or more Apartments | 0 | 0.0% |
| Mobile Home / Other | 0 | 0.0% |
| Total | 2,753 | 100.0% |
Housing Structures by Occupancy in Minnetrista
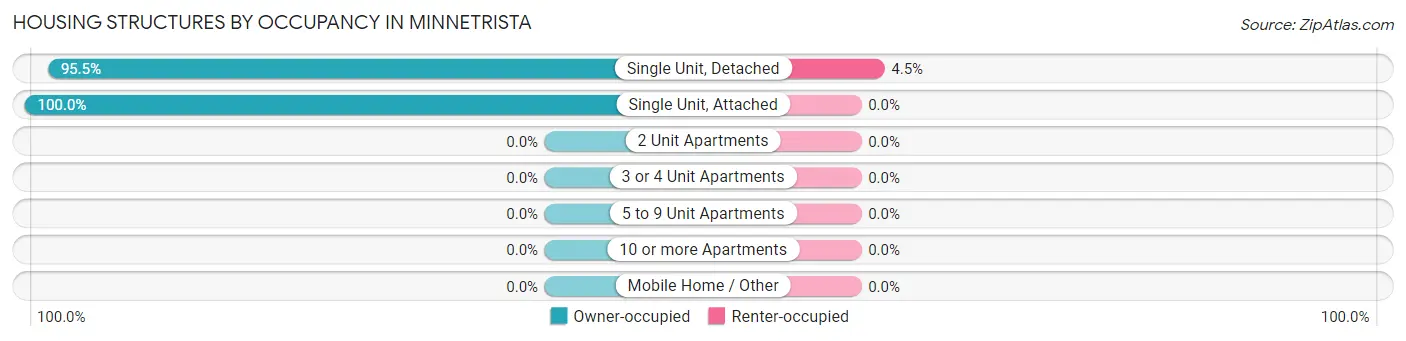
| Structure Type | Owner-occupied | Renter-occupied |
| Single Unit, Detached | 2,571 (95.5%) | 120 (4.5%) |
| Single Unit, Attached | 62 (100.0%) | 0 (0.0%) |
| 2 Unit Apartments | 0 (0.0%) | 0 (0.0%) |
| 3 or 4 Unit Apartments | 0 (0.0%) | 0 (0.0%) |
| 5 to 9 Unit Apartments | 0 (0.0%) | 0 (0.0%) |
| 10 or more Apartments | 0 (0.0%) | 0 (0.0%) |
| Mobile Home / Other | 0 (0.0%) | 0 (0.0%) |
| Total | 2,633 (95.6%) | 120 (4.4%) |
Housing Structures by Number of Rooms in Minnetrista
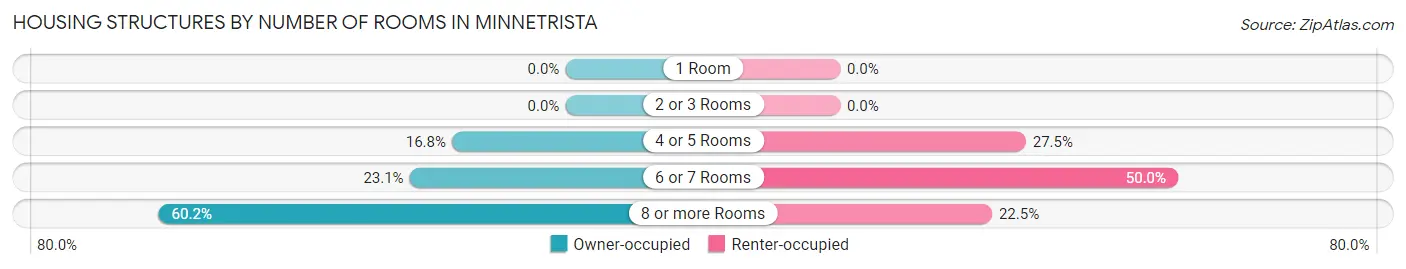
| Number of Rooms | Owner-occupied | Renter-occupied |
| 1 Room | 0 (0.0%) | 0 (0.0%) |
| 2 or 3 Rooms | 0 (0.0%) | 0 (0.0%) |
| 4 or 5 Rooms | 442 (16.8%) | 33 (27.5%) |
| 6 or 7 Rooms | 607 (23.1%) | 60 (50.0%) |
| 8 or more Rooms | 1,584 (60.2%) | 27 (22.5%) |
| Total | 2,633 (100.0%) | 120 (100.0%) |
Housing Structure by Heating Type in Minnetrista
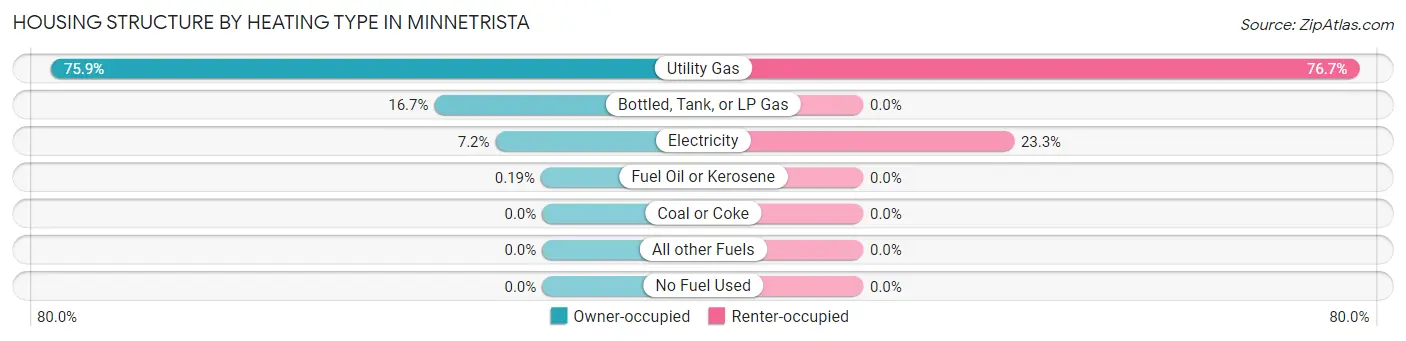
| Heating Type | Owner-occupied | Renter-occupied |
| Utility Gas | 1,999 (75.9%) | 92 (76.7%) |
| Bottled, Tank, or LP Gas | 439 (16.7%) | 0 (0.0%) |
| Electricity | 190 (7.2%) | 28 (23.3%) |
| Fuel Oil or Kerosene | 5 (0.2%) | 0 (0.0%) |
| Coal or Coke | 0 (0.0%) | 0 (0.0%) |
| All other Fuels | 0 (0.0%) | 0 (0.0%) |
| No Fuel Used | 0 (0.0%) | 0 (0.0%) |
| Total | 2,633 (100.0%) | 120 (100.0%) |
Household Vehicle Usage in Minnetrista
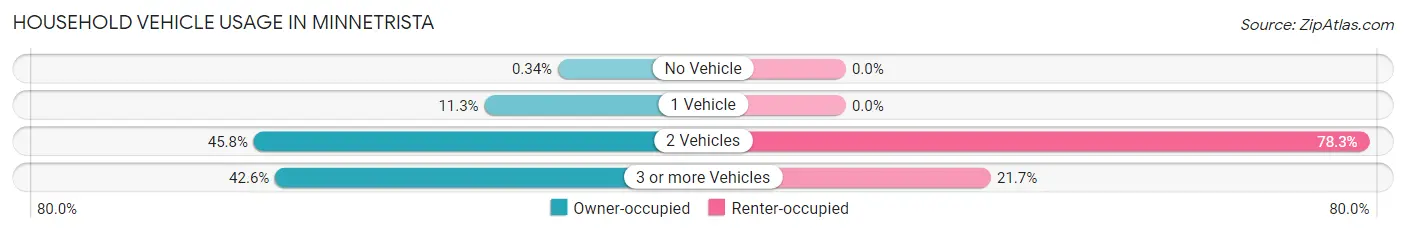
| Vehicles per Household | Owner-occupied | Renter-occupied |
| No Vehicle | 9 (0.3%) | 0 (0.0%) |
| 1 Vehicle | 298 (11.3%) | 0 (0.0%) |
| 2 Vehicles | 1,205 (45.8%) | 94 (78.3%) |
| 3 or more Vehicles | 1,121 (42.6%) | 26 (21.7%) |
| Total | 2,633 (100.0%) | 120 (100.0%) |
Real Estate & Mortgages in Minnetrista
Real Estate and Mortgage Overview in Minnetrista
| Characteristic | Without Mortgage | With Mortgage |
| Housing Units | 751 | 1,882 |
| Median Property Value | $554,800 | $591,900 |
| Median Household Income | $133,780 | $1,183 |
| Monthly Housing Costs | $917 | $893 |
| Real Estate Taxes | $5,211 | $15 |
Property Value by Mortgage Status in Minnetrista
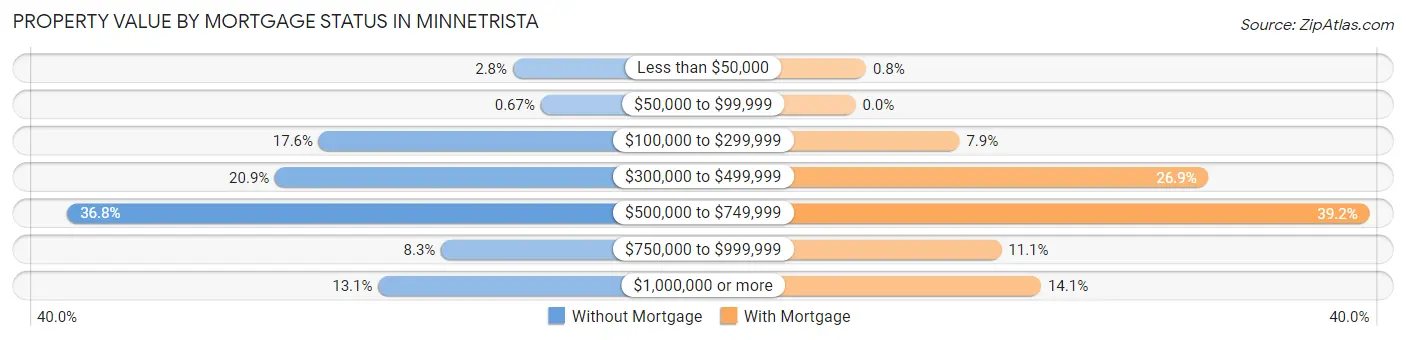
| Property Value | Without Mortgage | With Mortgage |
| Less than $50,000 | 21 (2.8%) | 15 (0.8%) |
| $50,000 to $99,999 | 5 (0.7%) | 0 (0.0%) |
| $100,000 to $299,999 | 132 (17.6%) | 149 (7.9%) |
| $300,000 to $499,999 | 157 (20.9%) | 506 (26.9%) |
| $500,000 to $749,999 | 276 (36.7%) | 737 (39.2%) |
| $750,000 to $999,999 | 62 (8.3%) | 209 (11.1%) |
| $1,000,000 or more | 98 (13.1%) | 266 (14.1%) |
| Total | 751 (100.0%) | 1,882 (100.0%) |
Household Income by Mortgage Status in Minnetrista
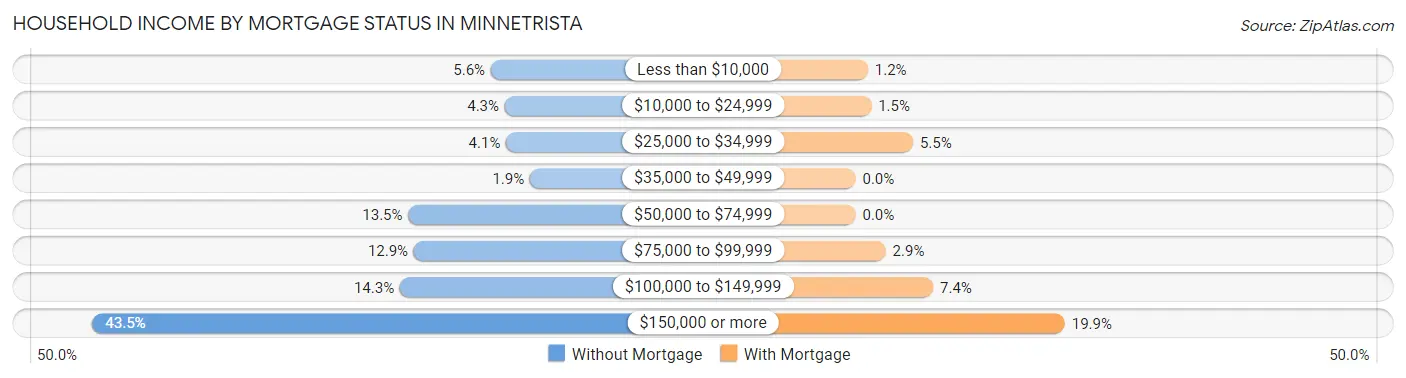
| Household Income | Without Mortgage | With Mortgage |
| Less than $10,000 | 42 (5.6%) | 22 (1.2%) |
| $10,000 to $24,999 | 32 (4.3%) | 28 (1.5%) |
| $25,000 to $34,999 | 31 (4.1%) | 103 (5.5%) |
| $35,000 to $49,999 | 14 (1.9%) | 0 (0.0%) |
| $50,000 to $74,999 | 101 (13.5%) | 0 (0.0%) |
| $75,000 to $99,999 | 97 (12.9%) | 54 (2.9%) |
| $100,000 to $149,999 | 107 (14.2%) | 139 (7.4%) |
| $150,000 or more | 327 (43.5%) | 375 (19.9%) |
| Total | 751 (100.0%) | 1,882 (100.0%) |
Property Value to Household Income Ratio in Minnetrista
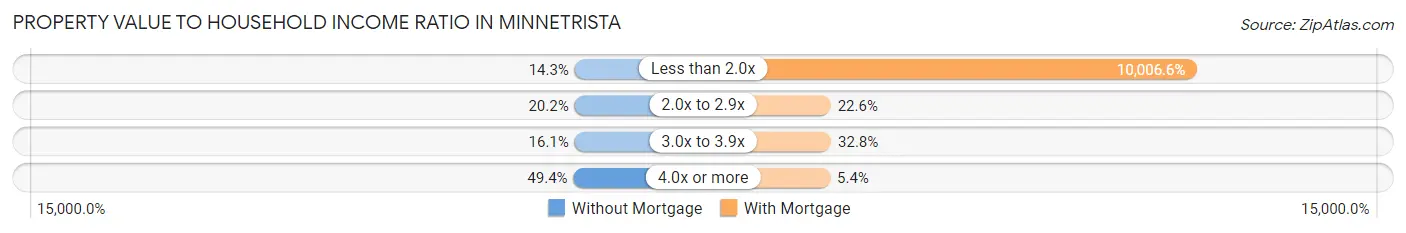
| Value-to-Income Ratio | Without Mortgage | With Mortgage |
| Less than 2.0x | 107 (14.2%) | 188,324 (10,006.6%) |
| 2.0x to 2.9x | 152 (20.2%) | 426 (22.6%) |
| 3.0x to 3.9x | 121 (16.1%) | 617 (32.8%) |
| 4.0x or more | 371 (49.4%) | 102 (5.4%) |
| Total | 751 (100.0%) | 1,882 (100.0%) |
Real Estate Taxes by Mortgage Status in Minnetrista
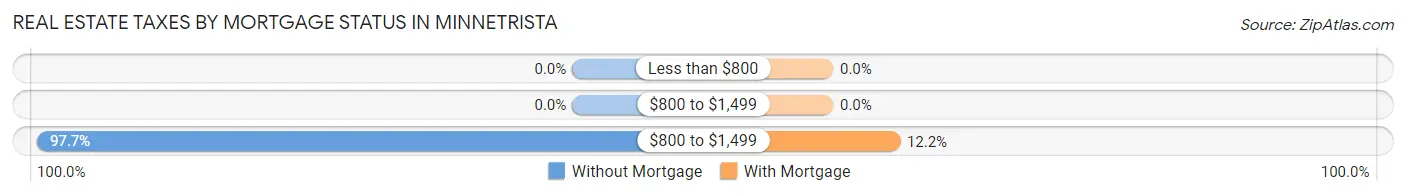
| Property Taxes | Without Mortgage | With Mortgage |
| Less than $800 | 0 (0.0%) | 0 (0.0%) |
| $800 to $1,499 | 0 (0.0%) | 0 (0.0%) |
| $800 to $1,499 | 734 (97.7%) | 230 (12.2%) |
| Total | 751 (100.0%) | 1,882 (100.0%) |
Health & Disability in Minnetrista
Health Insurance Coverage by Age in Minnetrista
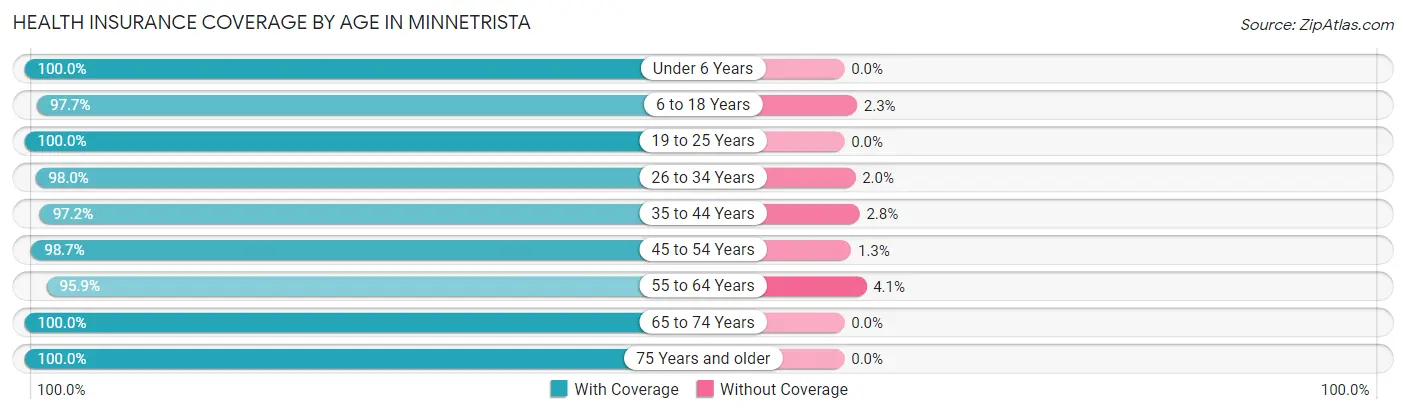
| Age Bracket | With Coverage | Without Coverage |
| Under 6 Years | 799 (100.0%) | 0 (0.0%) |
| 6 to 18 Years | 1,792 (97.7%) | 43 (2.3%) |
| 19 to 25 Years | 310 (100.0%) | 0 (0.0%) |
| 26 to 34 Years | 387 (98.0%) | 8 (2.0%) |
| 35 to 44 Years | 995 (97.2%) | 29 (2.8%) |
| 45 to 54 Years | 1,960 (98.7%) | 25 (1.3%) |
| 55 to 64 Years | 1,127 (95.9%) | 48 (4.1%) |
| 65 to 74 Years | 614 (100.0%) | 0 (0.0%) |
| 75 Years and older | 210 (100.0%) | 0 (0.0%) |
| Total | 8,194 (98.2%) | 153 (1.8%) |
Health Insurance Coverage by Citizenship Status in Minnetrista
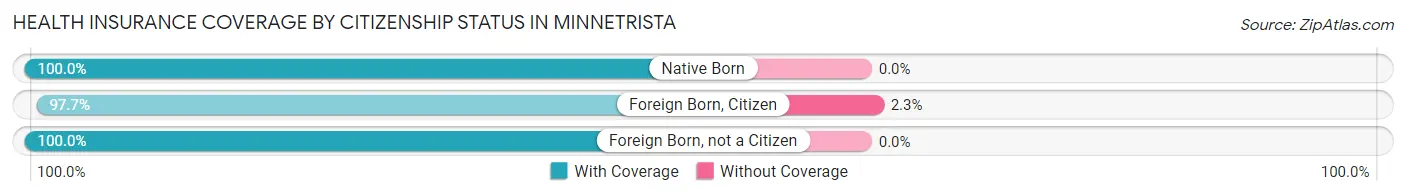
| Citizenship Status | With Coverage | Without Coverage |
| Native Born | 799 (100.0%) | 0 (0.0%) |
| Foreign Born, Citizen | 1,792 (97.7%) | 43 (2.3%) |
| Foreign Born, not a Citizen | 310 (100.0%) | 0 (0.0%) |
Health Insurance Coverage by Household Income in Minnetrista
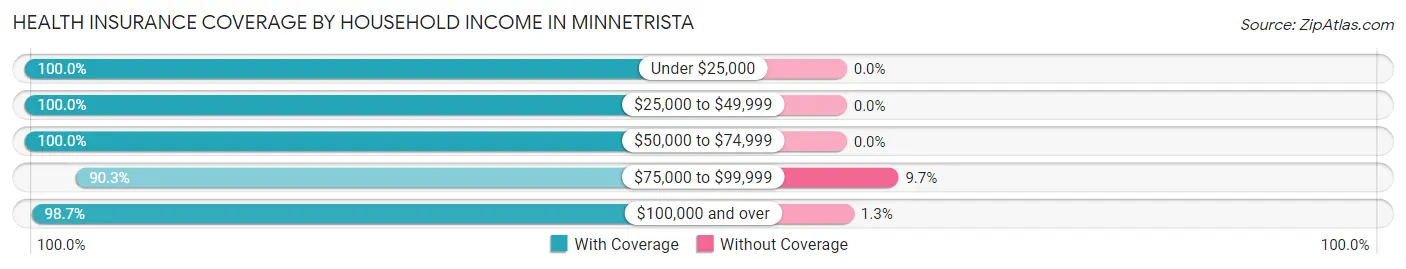
| Household Income | With Coverage | Without Coverage |
| Under $25,000 | 673 (100.0%) | 0 (0.0%) |
| $25,000 to $49,999 | 58 (100.0%) | 0 (0.0%) |
| $50,000 to $74,999 | 569 (100.0%) | 0 (0.0%) |
| $75,000 to $99,999 | 644 (90.3%) | 69 (9.7%) |
| $100,000 and over | 6,250 (98.7%) | 84 (1.3%) |
Public vs Private Health Insurance Coverage by Age in Minnetrista
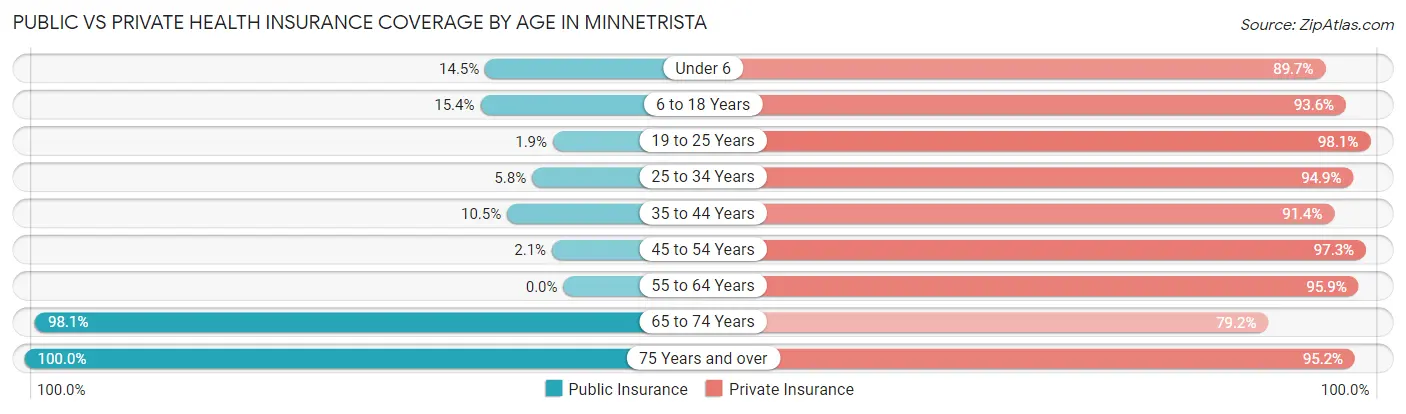
| Age Bracket | Public Insurance | Private Insurance |
| Under 6 | 116 (14.5%) | 717 (89.7%) |
| 6 to 18 Years | 283 (15.4%) | 1,717 (93.6%) |
| 19 to 25 Years | 6 (1.9%) | 304 (98.1%) |
| 25 to 34 Years | 23 (5.8%) | 375 (94.9%) |
| 35 to 44 Years | 107 (10.4%) | 936 (91.4%) |
| 45 to 54 Years | 42 (2.1%) | 1,931 (97.3%) |
| 55 to 64 Years | 0 (0.0%) | 1,127 (95.9%) |
| 65 to 74 Years | 602 (98.1%) | 486 (79.1%) |
| 75 Years and over | 210 (100.0%) | 200 (95.2%) |
| Total | 1,389 (16.6%) | 7,793 (93.4%) |
Disability Status by Sex by Age in Minnetrista
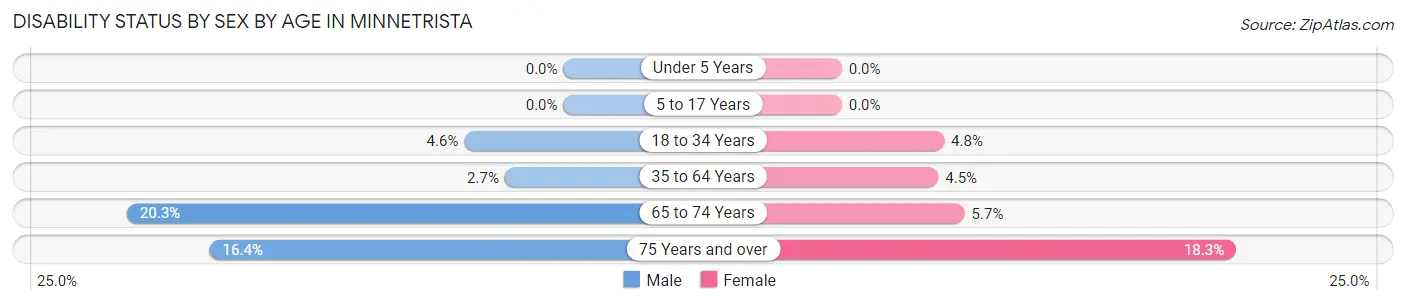
| Age Bracket | Male | Female |
| Under 5 Years | 0 (0.0%) | 0 (0.0%) |
| 5 to 17 Years | 0 (0.0%) | 0 (0.0%) |
| 18 to 34 Years | 15 (4.6%) | 21 (4.8%) |
| 35 to 64 Years | 58 (2.7%) | 92 (4.5%) |
| 65 to 74 Years | 64 (20.3%) | 17 (5.7%) |
| 75 Years and over | 21 (16.4%) | 15 (18.3%) |
Disability Class by Sex by Age in Minnetrista
Disability Class: Hearing Difficulty
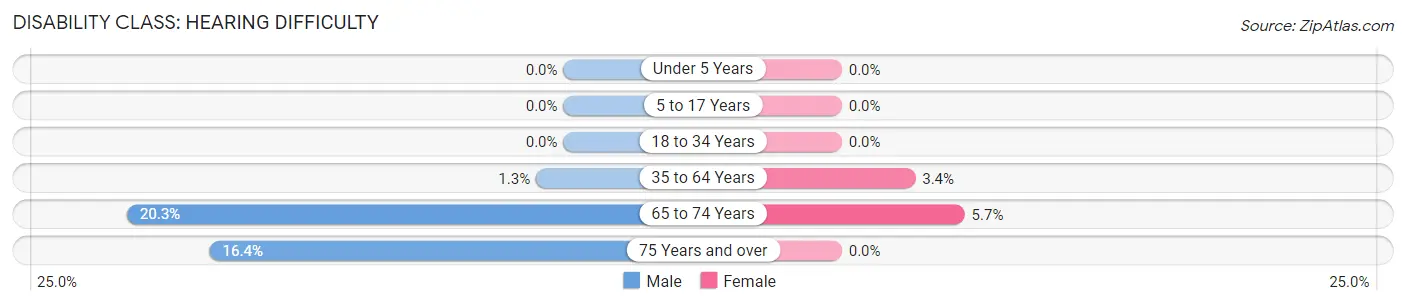
| Age Bracket | Male | Female |
| Under 5 Years | 0 (0.0%) | 0 (0.0%) |
| 5 to 17 Years | 0 (0.0%) | 0 (0.0%) |
| 18 to 34 Years | 0 (0.0%) | 0 (0.0%) |
| 35 to 64 Years | 27 (1.3%) | 70 (3.4%) |
| 65 to 74 Years | 64 (20.3%) | 17 (5.7%) |
| 75 Years and over | 21 (16.4%) | 0 (0.0%) |
Disability Class: Vision Difficulty
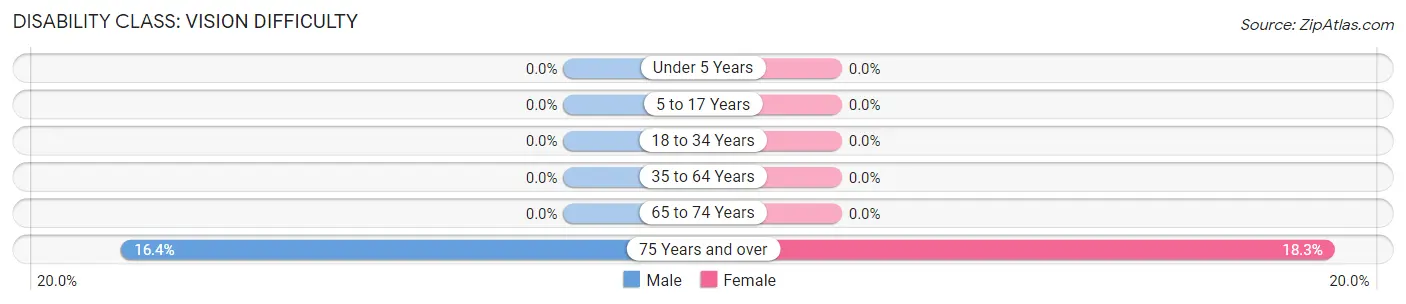
| Age Bracket | Male | Female |
| Under 5 Years | 0 (0.0%) | 0 (0.0%) |
| 5 to 17 Years | 0 (0.0%) | 0 (0.0%) |
| 18 to 34 Years | 0 (0.0%) | 0 (0.0%) |
| 35 to 64 Years | 0 (0.0%) | 0 (0.0%) |
| 65 to 74 Years | 0 (0.0%) | 0 (0.0%) |
| 75 Years and over | 21 (16.4%) | 15 (18.3%) |
Disability Class: Cognitive Difficulty
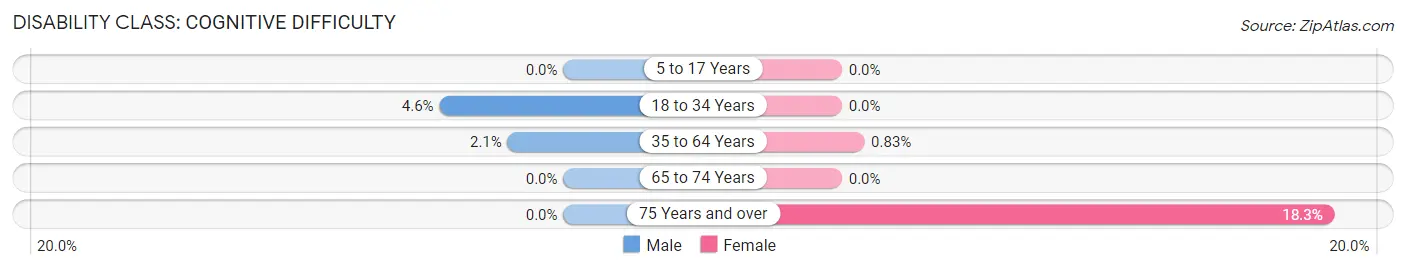
| Age Bracket | Male | Female |
| 5 to 17 Years | 0 (0.0%) | 0 (0.0%) |
| 18 to 34 Years | 15 (4.6%) | 0 (0.0%) |
| 35 to 64 Years | 44 (2.1%) | 17 (0.8%) |
| 65 to 74 Years | 0 (0.0%) | 0 (0.0%) |
| 75 Years and over | 0 (0.0%) | 15 (18.3%) |
Disability Class: Ambulatory Difficulty
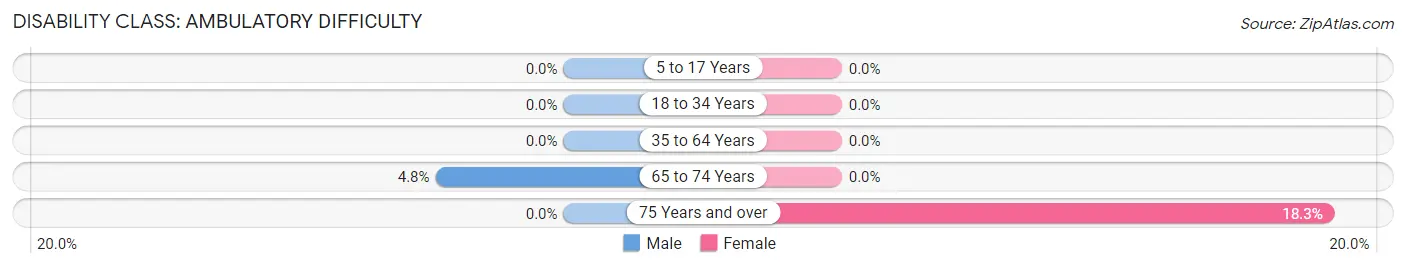
| Age Bracket | Male | Female |
| 5 to 17 Years | 0 (0.0%) | 0 (0.0%) |
| 18 to 34 Years | 0 (0.0%) | 0 (0.0%) |
| 35 to 64 Years | 0 (0.0%) | 0 (0.0%) |
| 65 to 74 Years | 15 (4.8%) | 0 (0.0%) |
| 75 Years and over | 0 (0.0%) | 15 (18.3%) |
Disability Class: Self-Care Difficulty
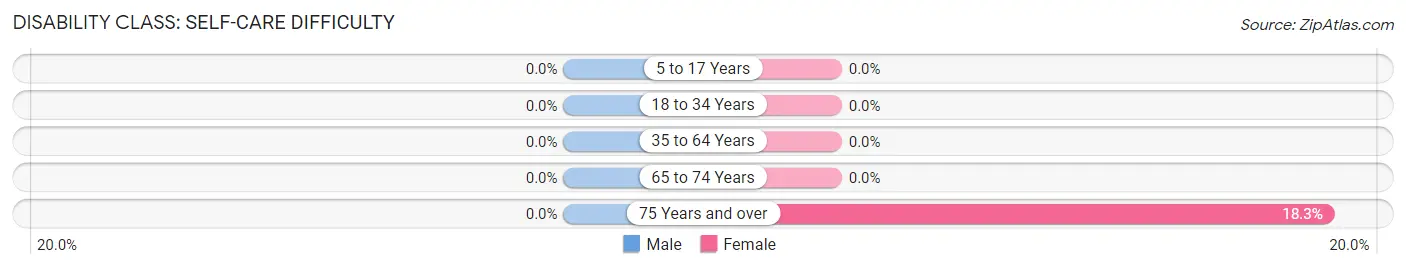
| Age Bracket | Male | Female |
| 5 to 17 Years | 0 (0.0%) | 0 (0.0%) |
| 18 to 34 Years | 0 (0.0%) | 0 (0.0%) |
| 35 to 64 Years | 0 (0.0%) | 0 (0.0%) |
| 65 to 74 Years | 0 (0.0%) | 0 (0.0%) |
| 75 Years and over | 0 (0.0%) | 15 (18.3%) |
Technology Access in Minnetrista
Computing Device Access in Minnetrista
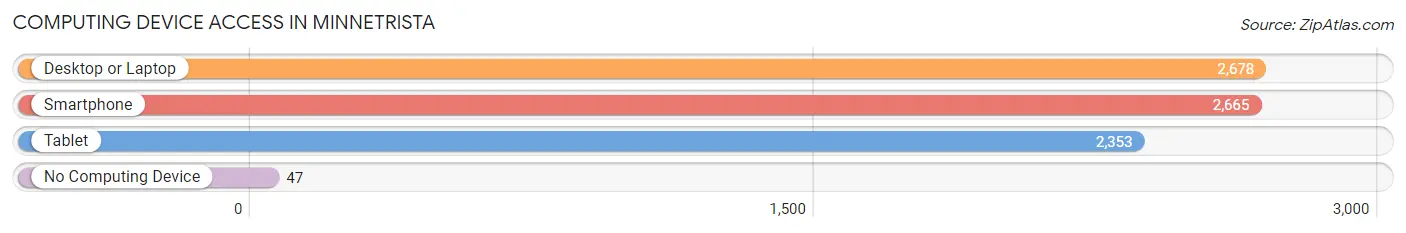
| Device Type | # Households | % Households |
| Desktop or Laptop | 2,678 | 97.3% |
| Smartphone | 2,665 | 96.8% |
| Tablet | 2,353 | 85.5% |
| No Computing Device | 47 | 1.7% |
| Total | 2,753 | 100.0% |
Internet Access in Minnetrista
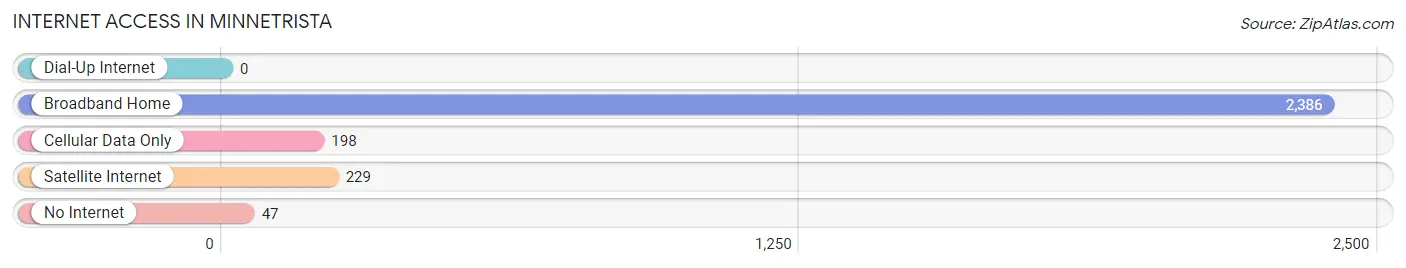
| Internet Type | # Households | % Households |
| Dial-Up Internet | 0 | 0.0% |
| Broadband Home | 2,386 | 86.7% |
| Cellular Data Only | 198 | 7.2% |
| Satellite Internet | 229 | 8.3% |
| No Internet | 47 | 1.7% |
| Total | 2,753 | 100.0% |
Minnetrista Summary
Minnetrista is a small city located in Hennepin County, Minnesota. It is situated on the west bank of Lake Minnetonka, approximately 20 miles west of Minneapolis. The city was incorporated in 1974 and has a population of approximately 8,000 people.
Geography
Minnetrista is located in the western part of Hennepin County, Minnesota. It is situated on the west bank of Lake Minnetonka, approximately 20 miles west of Minneapolis. The city is bordered by the cities of Mound, Spring Park, Orono, and Minnetonka. The city has a total area of 8.2 square miles, of which 7.9 square miles is land and 0.3 square miles is water. The terrain is mostly flat, with some rolling hills.
Climate
Minnetrista has a humid continental climate, with cold winters and hot summers. The average annual temperature is 40.2°F, with an average high of 48.7°F in July and an average low of 31.7°F in January. The average annual precipitation is 30.3 inches, with an average of 4.3 inches of snowfall per year.
Demographics
As of the 2010 census, there were 8,270 people, 3,093 households, and 2,521 families residing in the city. The population density was 1,039.2 people per square mile. The racial makeup of the city was 94.2% White, 1.2% African American, 0.2% Native American, 2.3% Asian, 0.7% from other races, and 1.5% from two or more races. Hispanic or Latino of any race were 2.2% of the population.
Economy
Minnetrista is a small city with a diverse economy. The city is home to several large employers, including the Minnetonka Corporation, a manufacturer of medical supplies and equipment, and the Minnetonka Country Club, a private golf and country club. Other major employers include the Minnetonka Public Schools, the Minnetonka Chamber of Commerce, and the Minnetonka Historical Society.
The city also has a thriving retail sector, with several shopping centers and malls located in the city. The city is also home to several restaurants, bars, and other entertainment venues.
History
Minnetrista was first settled in the late 1800s by settlers from Sweden and Norway. The city was originally known as Minnetonka Mills, and was incorporated in 1974. The city was named after the nearby Lake Minnetonka, which was named after the Dakota Sioux word for “big water.”
In the early 1900s, the city was a popular tourist destination, with several resorts located on the lake. The city was also home to several large manufacturing companies, including the Minnetonka Corporation, which was founded in 1915.
In the late 20th century, the city began to experience rapid growth, as more people moved to the area to take advantage of the city’s proximity to Minneapolis. The city has continued to grow in recent years, and is now home to several large employers and a thriving retail sector.
Common Questions
What is Per Capita Income in Minnetrista?
Per Capita income in Minnetrista is $69,671.
What is the Median Family Income in Minnetrista?
Median Family Income in Minnetrista is $173,542.
What is the Median Household income in Minnetrista?
Median Household Income in Minnetrista is $162,474.
What is Income or Wage Gap in Minnetrista?
Income or Wage Gap in Minnetrista is 51.8%.
Women in Minnetrista earn 48.2 cents for every dollar earned by a man.
What is Inequality or Gini Index in Minnetrista?
Inequality or Gini Index in Minnetrista is 0.41.
What is the Total Population of Minnetrista?
Total Population of Minnetrista is 8,347.
What is the Total Male Population of Minnetrista?
Total Male Population of Minnetrista is 4,091.
What is the Total Female Population of Minnetrista?
Total Female Population of Minnetrista is 4,256.
What is the Ratio of Males per 100 Females in Minnetrista?
There are 96.12 Males per 100 Females in Minnetrista.
What is the Ratio of Females per 100 Males in Minnetrista?
There are 104.03 Females per 100 Males in Minnetrista.
What is the Median Population Age in Minnetrista?
Median Population Age in Minnetrista is 42.5 Years.
What is the Average Family Size in Minnetrista
Average Family Size in Minnetrista is 3.2 People.
What is the Average Household Size in Minnetrista
Average Household Size in Minnetrista is 3.0 People.
How Large is the Labor Force in Minnetrista?
There are 4,283 People in the Labor Forcein in Minnetrista.
What is the Percentage of People in the Labor Force in Minnetrista?
70.1% of People are in the Labor Force in Minnetrista.
What is the Unemployment Rate in Minnetrista?
Unemployment Rate in Minnetrista is 2.3%.