Shipshewana, IN Map & Demographics
Shipshewana Map
Shipshewana Overview
$37,423
PER CAPITA INCOME
$74,861
AVG FAMILY INCOME
$53,500
AVG HOUSEHOLD INCOME
31.8%
WAGE / INCOME GAP [ % ]
68.2¢/ $1
WAGE / INCOME GAP [ $ ]
0.56
INEQUALITY / GINI INDEX
873
TOTAL POPULATION
424
MALE POPULATION
449
FEMALE POPULATION
94.43
MALES / 100 FEMALES
105.90
FEMALES / 100 MALES
37.7
MEDIAN AGE
2.7
AVG FAMILY SIZE
2.3
AVG HOUSEHOLD SIZE
471
LABOR FORCE [ PEOPLE ]
68.9%
PERCENT IN LABOR FORCE
7.2%
UNEMPLOYMENT RATE
Shipshewana Zip Codes
Shipshewana Area Codes
Income in Shipshewana
Income Overview in Shipshewana
Per Capita Income in Shipshewana is $37,423, while median incomes of families and households are $74,861 and $53,500 respectively.
| Characteristic | Number | Measure |
| Per Capita Income | 873 | $37,423 |
| Median Family Income | 257 | $74,861 |
| Mean Family Income | 257 | $101,423 |
| Median Household Income | 378 | $53,500 |
| Mean Household Income | 378 | $83,739 |
| Income Deficit | 257 | $0 |
| Wage / Income Gap (%) | 873 | 31.83% |
| Wage / Income Gap ($) | 873 | 68.17¢ per $1 |
| Gini / Inequality Index | 873 | 0.56 |
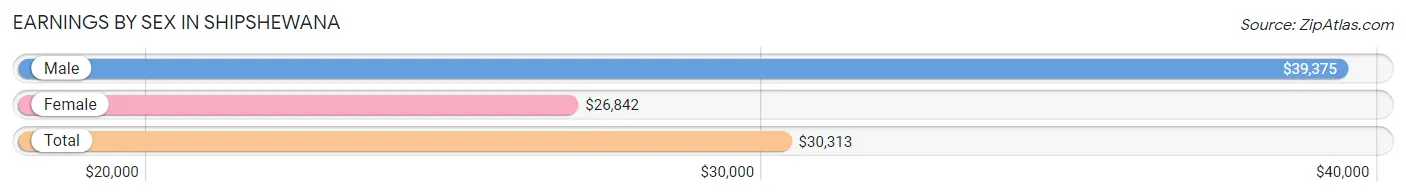
Earnings by Sex in Shipshewana
Average Earnings in Shipshewana are $30,313, $39,375 for men and $26,842 for women, a difference of 31.8%.
| Sex | Number | Average Earnings |
| Male | 285 (55.8%) | $39,375 |
| Female | 226 (44.2%) | $26,842 |
| Total | 511 (100.0%) | $30,313 |
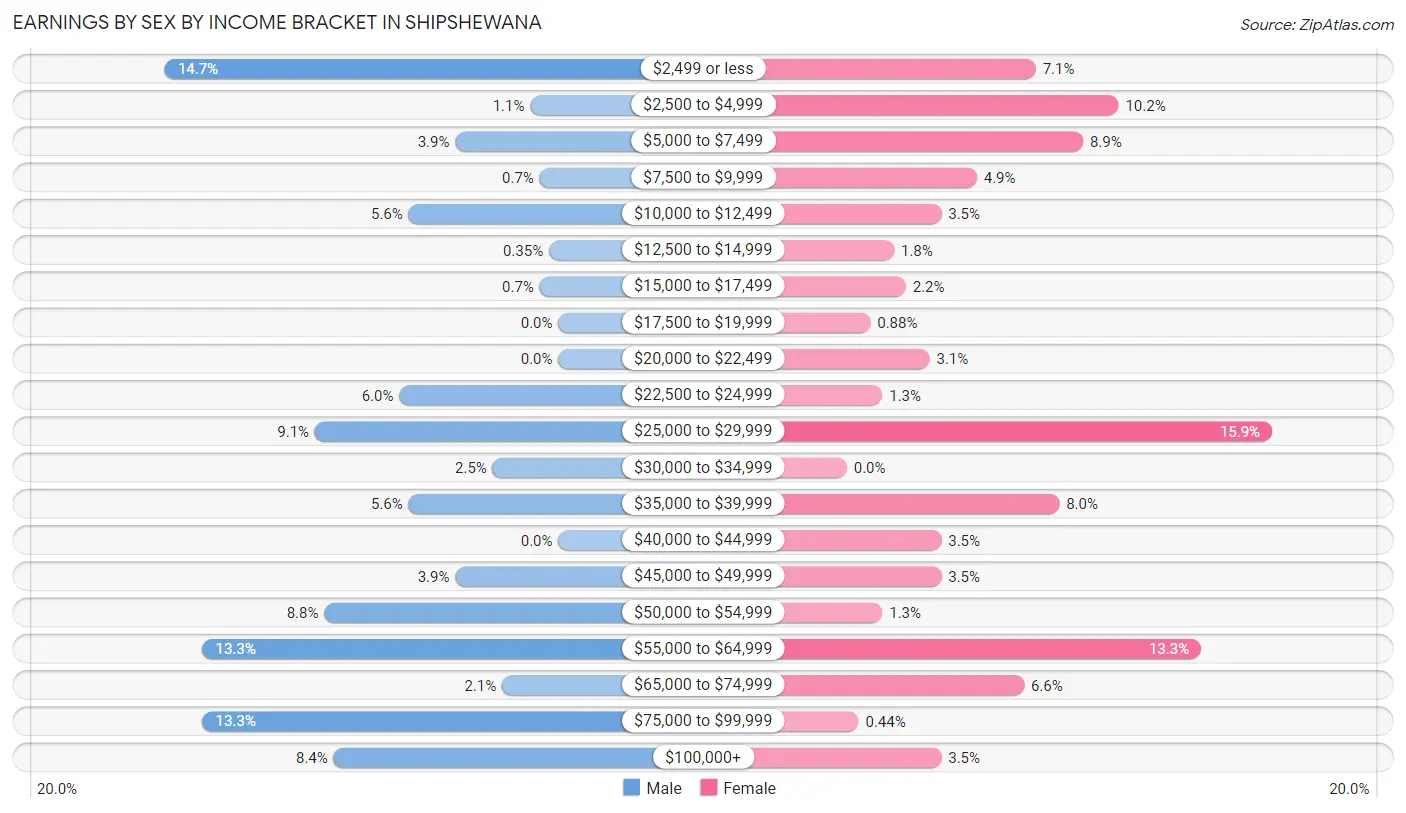
Earnings by Sex by Income Bracket in Shipshewana
The most common earnings brackets in Shipshewana are $2,499 or less for men (42 | 14.7%) and $25,000 to $29,999 for women (36 | 15.9%).
| Income | Male | Female |
| $2,499 or less | 42 (14.7%) | 16 (7.1%) |
| $2,500 to $4,999 | 3 (1.1%) | 23 (10.2%) |
| $5,000 to $7,499 | 11 (3.9%) | 20 (8.8%) |
| $7,500 to $9,999 | 2 (0.7%) | 11 (4.9%) |
| $10,000 to $12,499 | 16 (5.6%) | 8 (3.5%) |
| $12,500 to $14,999 | 1 (0.4%) | 4 (1.8%) |
| $15,000 to $17,499 | 2 (0.7%) | 5 (2.2%) |
| $17,500 to $19,999 | 0 (0.0%) | 2 (0.9%) |
| $20,000 to $22,499 | 0 (0.0%) | 7 (3.1%) |
| $22,500 to $24,999 | 17 (6.0%) | 3 (1.3%) |
| $25,000 to $29,999 | 26 (9.1%) | 36 (15.9%) |
| $30,000 to $34,999 | 7 (2.5%) | 0 (0.0%) |
| $35,000 to $39,999 | 16 (5.6%) | 18 (8.0%) |
| $40,000 to $44,999 | 0 (0.0%) | 8 (3.5%) |
| $45,000 to $49,999 | 11 (3.9%) | 8 (3.5%) |
| $50,000 to $54,999 | 25 (8.8%) | 3 (1.3%) |
| $55,000 to $64,999 | 38 (13.3%) | 30 (13.3%) |
| $65,000 to $74,999 | 6 (2.1%) | 15 (6.6%) |
| $75,000 to $99,999 | 38 (13.3%) | 1 (0.4%) |
| $100,000+ | 24 (8.4%) | 8 (3.5%) |
| Total | 285 (100.0%) | 226 (100.0%) |
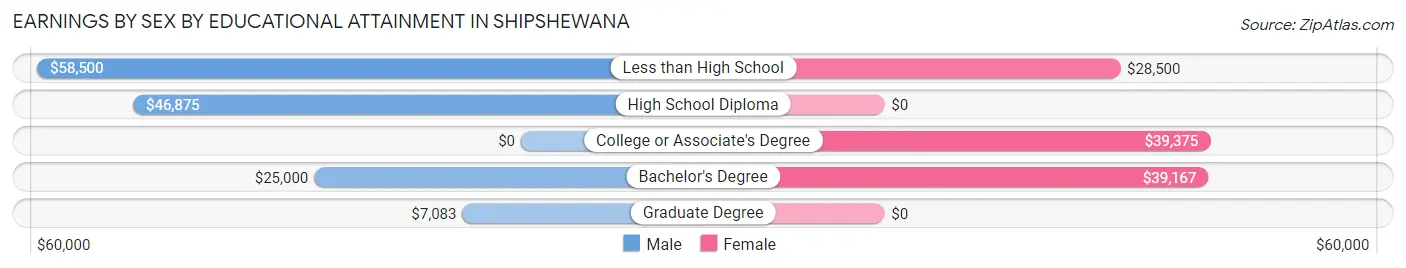
Earnings by Sex by Educational Attainment in Shipshewana
Average earnings in Shipshewana are $46,071 for men and $27,083 for women, a difference of 41.2%. Men with an educational attainment of less than high school enjoy the highest average annual earnings of $58,500, while those with graduate degree education earn the least with $7,083. Women with an educational attainment of college or associate's degree earn the most with the average annual earnings of $39,375, while those with less than high school education have the smallest earnings of $28,500.
| Educational Attainment | Male Income | Female Income |
| Less than High School | $58,500 | $28,500 |
| High School Diploma | $46,875 | $0 |
| College or Associate's Degree | - | - |
| Bachelor's Degree | $25,000 | $39,167 |
| Graduate Degree | $7,083 | $0 |
| Total | $46,071 | $27,083 |
Family Income in Shipshewana
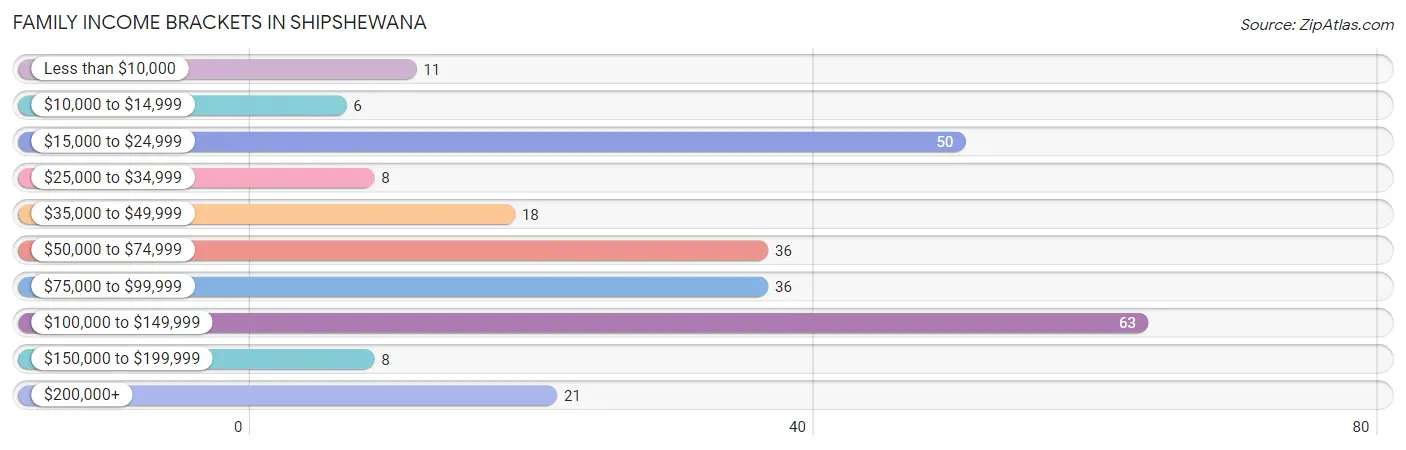
Family Income Brackets in Shipshewana
According to the Shipshewana family income data, there are 63 families falling into the $100,000 to $149,999 income range, which is the most common income bracket and makes up 24.5% of all families. Conversely, the $10,000 to $14,999 income bracket is the least frequent group with only 6 families (2.3%) belonging to this category.
| Income Bracket | # Families | % Families |
| Less than $10,000 | 11 | 4.3% |
| $10,000 to $14,999 | 6 | 2.3% |
| $15,000 to $24,999 | 50 | 19.5% |
| $25,000 to $34,999 | 8 | 3.1% |
| $35,000 to $49,999 | 18 | 7.0% |
| $50,000 to $74,999 | 36 | 14.0% |
| $75,000 to $99,999 | 36 | 14.0% |
| $100,000 to $149,999 | 63 | 24.5% |
| $150,000 to $199,999 | 8 | 3.1% |
| $200,000+ | 21 | 8.2% |
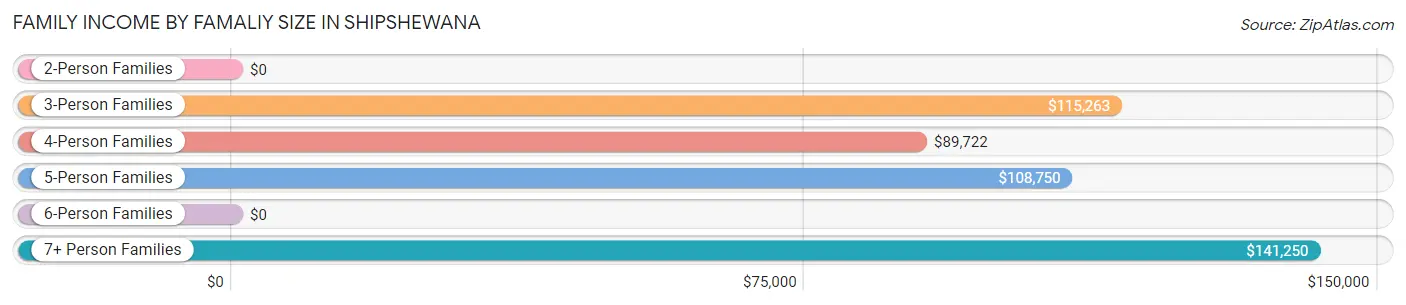
Family Income by Famaliy Size in Shipshewana
7+ person families (8 | 3.1%) account for the highest median family income in Shipshewana with $141,250 per family, while 3-person families (48 | 18.7%) have the highest median income of $38,421 per family member.
| Income Bracket | # Families | Median Income |
| 2-Person Families | 133 (51.7%) | $0 |
| 3-Person Families | 48 (18.7%) | $115,263 |
| 4-Person Families | 40 (15.6%) | $89,722 |
| 5-Person Families | 19 (7.4%) | $108,750 |
| 6-Person Families | 9 (3.5%) | $0 |
| 7+ Person Families | 8 (3.1%) | $141,250 |
| Total | 257 (100.0%) | $74,861 |
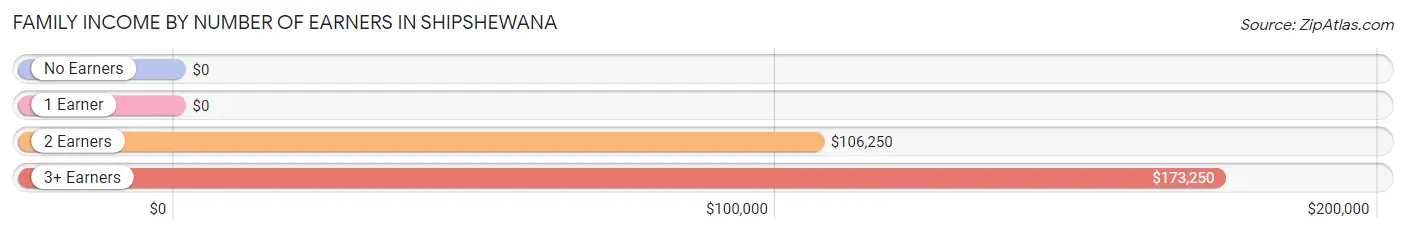
Family Income by Number of Earners in Shipshewana
| Number of Earners | # Families | Median Income |
| No Earners | 27 (10.5%) | $0 |
| 1 Earner | 101 (39.3%) | $0 |
| 2 Earners | 102 (39.7%) | $106,250 |
| 3+ Earners | 27 (10.5%) | $173,250 |
| Total | 257 (100.0%) | $74,861 |
Household Income in Shipshewana
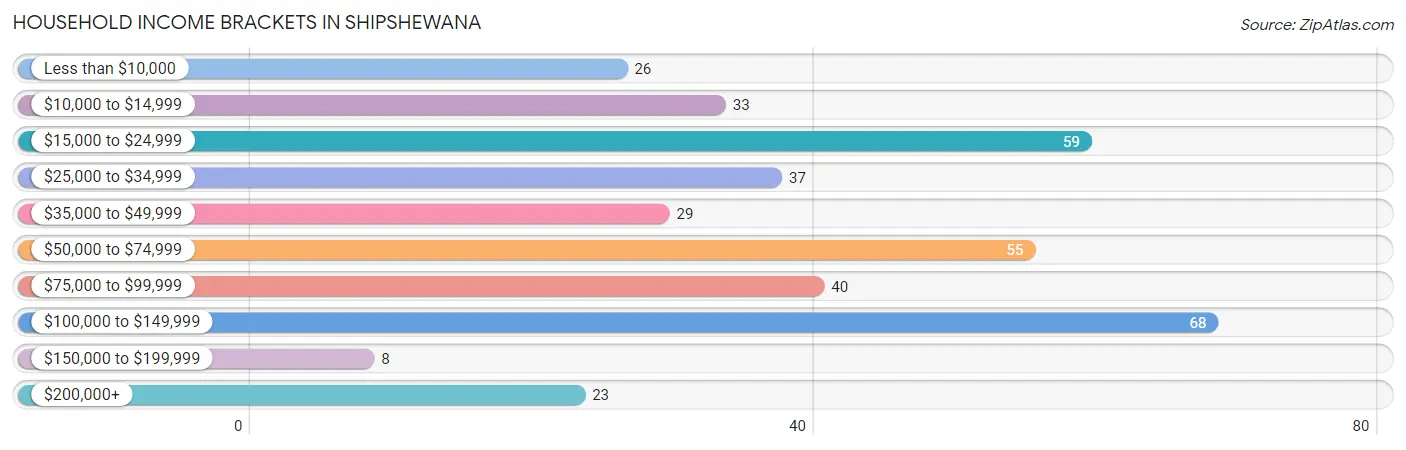
Household Income Brackets in Shipshewana
With 68 households falling in the category, the $100,000 to $149,999 income range is the most frequent in Shipshewana, accounting for 18.0% of all households. In contrast, only 8 households (2.1%) fall into the $150,000 to $199,999 income bracket, making it the least populous group.
| Income Bracket | # Households | % Households |
| Less than $10,000 | 26 | 6.9% |
| $10,000 to $14,999 | 33 | 8.7% |
| $15,000 to $24,999 | 59 | 15.6% |
| $25,000 to $34,999 | 37 | 9.8% |
| $35,000 to $49,999 | 29 | 7.7% |
| $50,000 to $74,999 | 55 | 14.6% |
| $75,000 to $99,999 | 40 | 10.6% |
| $100,000 to $149,999 | 68 | 18.0% |
| $150,000 to $199,999 | 8 | 2.1% |
| $200,000+ | 23 | 6.1% |
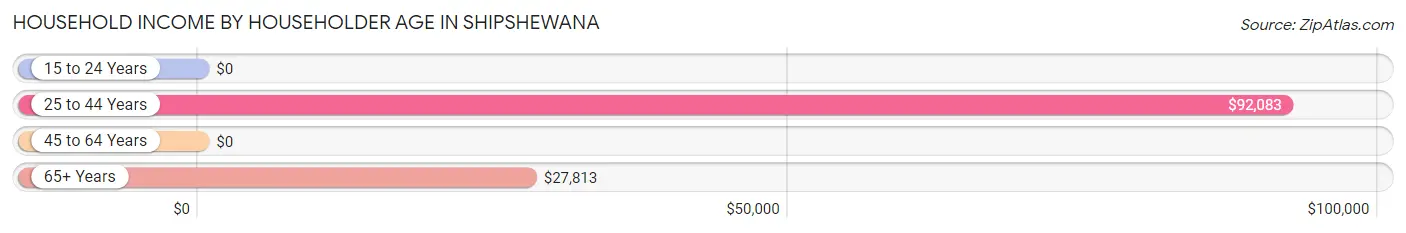
Household Income by Householder Age in Shipshewana
The median household income in Shipshewana is $53,500, with the highest median household income of $92,083 found in the 25 to 44 years age bracket for the primary householder. A total of 133 households (35.2%) fall into this category. Meanwhile, the 15 to 24 years age bracket for the primary householder has the lowest median household income of $0, with 17 households (4.5%) in this group.
| Income Bracket | # Households | Median Income |
| 15 to 24 Years | 17 (4.5%) | $0 |
| 25 to 44 Years | 133 (35.2%) | $92,083 |
| 45 to 64 Years | 85 (22.5%) | $0 |
| 65+ Years | 143 (37.8%) | $27,813 |
| Total | 378 (100.0%) | $53,500 |
Poverty in Shipshewana
Income Below Poverty by Sex and Age in Shipshewana
With 9.9% poverty level for males and 14.7% for females among the residents of Shipshewana, 16 and 17 year old males and 45 to 54 year old females are the most vulnerable to poverty, with 4 males (44.4%) and 13 females (30.2%) in their respective age groups living below the poverty level.
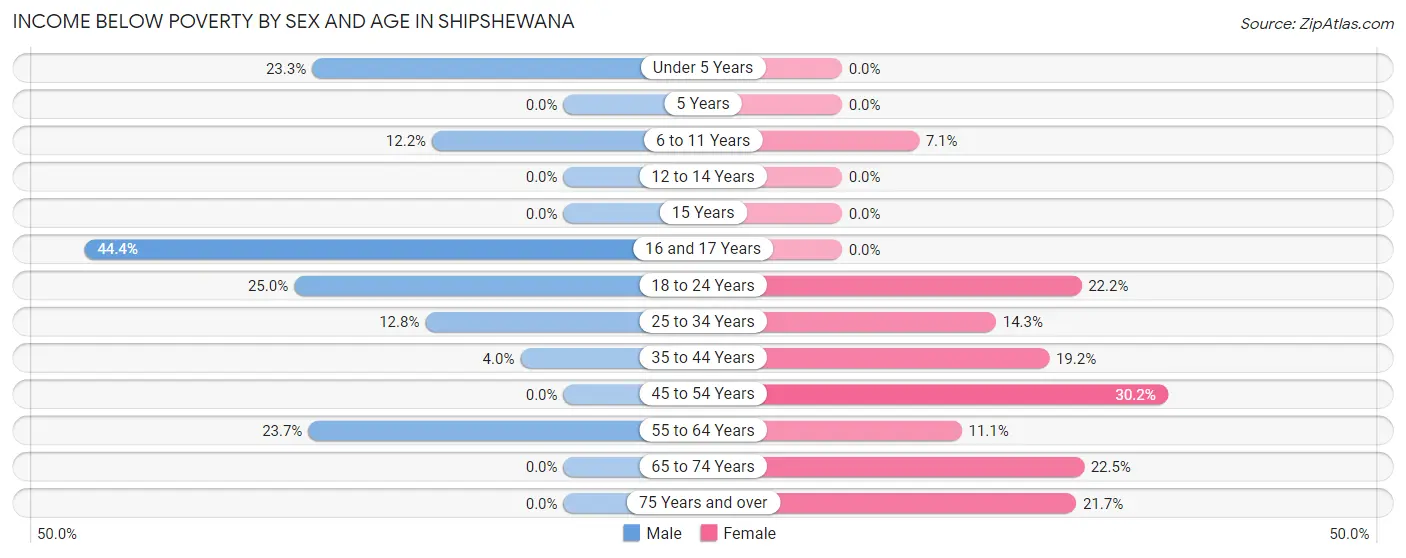
| Age Bracket | Male | Female |
| Under 5 Years | 7 (23.3%) | 0 (0.0%) |
| 5 Years | 0 (0.0%) | 0 (0.0%) |
| 6 to 11 Years | 5 (12.2%) | 2 (7.1%) |
| 12 to 14 Years | 0 (0.0%) | 0 (0.0%) |
| 15 Years | 0 (0.0%) | 0 (0.0%) |
| 16 and 17 Years | 4 (44.4%) | 0 (0.0%) |
| 18 to 24 Years | 4 (25.0%) | 6 (22.2%) |
| 25 to 34 Years | 10 (12.8%) | 8 (14.3%) |
| 35 to 44 Years | 3 (4.0%) | 10 (19.2%) |
| 45 to 54 Years | 0 (0.0%) | 13 (30.2%) |
| 55 to 64 Years | 9 (23.7%) | 6 (11.1%) |
| 65 to 74 Years | 0 (0.0%) | 11 (22.5%) |
| 75 Years and over | 0 (0.0%) | 10 (21.7%) |
| Total | 42 (9.9%) | 66 (14.7%) |
Income Above Poverty by Sex and Age in Shipshewana
According to the poverty statistics in Shipshewana, males aged 5 years and females aged under 5 years are the age groups that are most secure financially, with 100.0% of males and 100.0% of females in these age groups living above the poverty line.
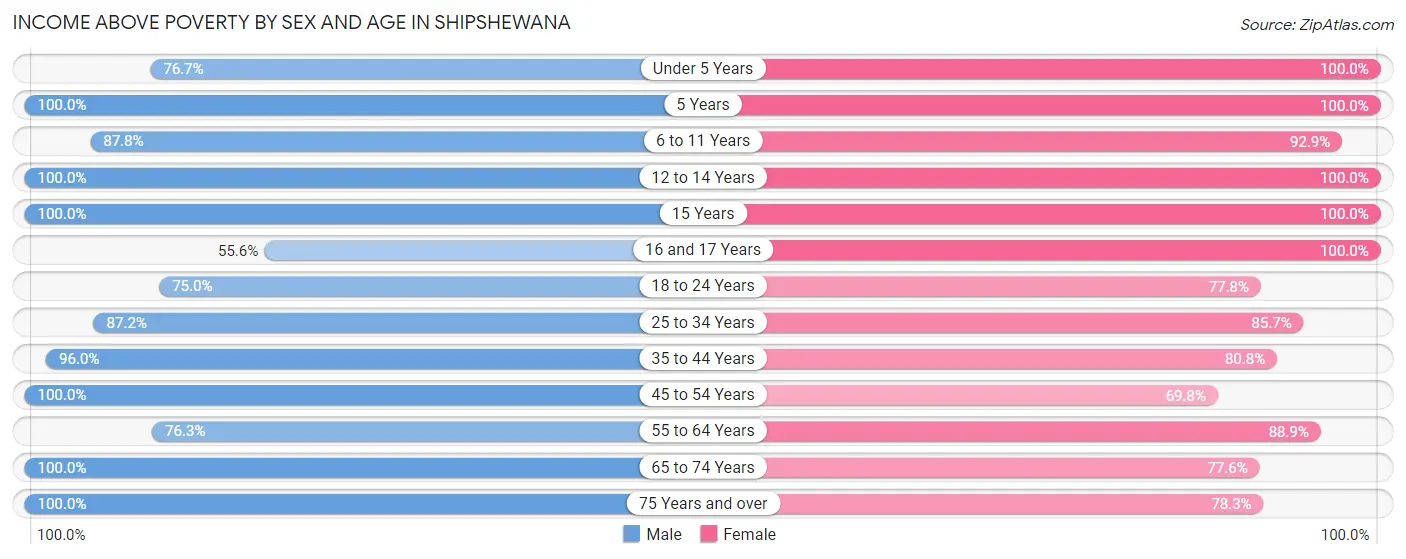
| Age Bracket | Male | Female |
| Under 5 Years | 23 (76.7%) | 35 (100.0%) |
| 5 Years | 4 (100.0%) | 17 (100.0%) |
| 6 to 11 Years | 36 (87.8%) | 26 (92.9%) |
| 12 to 14 Years | 8 (100.0%) | 11 (100.0%) |
| 15 Years | 4 (100.0%) | 11 (100.0%) |
| 16 and 17 Years | 5 (55.6%) | 20 (100.0%) |
| 18 to 24 Years | 12 (75.0%) | 21 (77.8%) |
| 25 to 34 Years | 68 (87.2%) | 48 (85.7%) |
| 35 to 44 Years | 72 (96.0%) | 42 (80.8%) |
| 45 to 54 Years | 16 (100.0%) | 30 (69.8%) |
| 55 to 64 Years | 29 (76.3%) | 48 (88.9%) |
| 65 to 74 Years | 28 (100.0%) | 38 (77.5%) |
| 75 Years and over | 77 (100.0%) | 36 (78.3%) |
| Total | 382 (90.1%) | 383 (85.3%) |
Income Below Poverty Among Married-Couple Families in Shipshewana
The poverty statistics for married-couple families in Shipshewana show that 0.4% or 1 of the total 220 families live below the poverty line. Families with 1 or 2 children have the highest poverty rate of 1.7%, comprising of 1 families. On the other hand, families with no children have the lowest poverty rate of 0.0%, which includes 0 families.
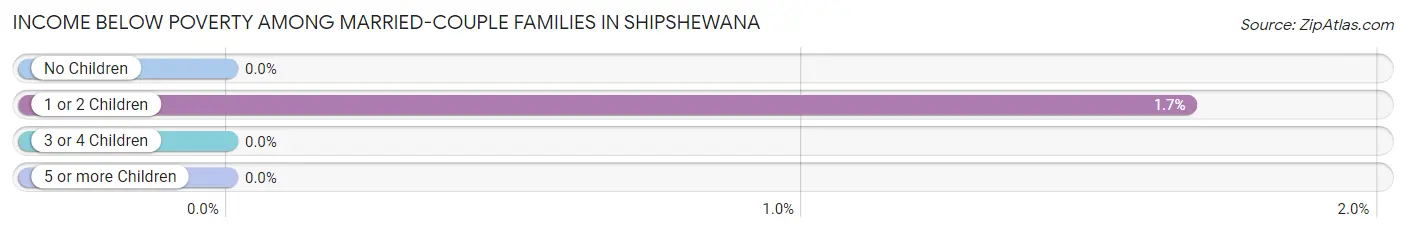
| Children | Above Poverty | Below Poverty |
| No Children | 127 (100.0%) | 0 (0.0%) |
| 1 or 2 Children | 59 (98.3%) | 1 (1.7%) |
| 3 or 4 Children | 31 (100.0%) | 0 (0.0%) |
| 5 or more Children | 2 (100.0%) | 0 (0.0%) |
| Total | 219 (99.6%) | 1 (0.4%) |
Income Below Poverty Among Single-Parent Households in Shipshewana
According to the poverty data in Shipshewana, 50.0% or 2 single-father households and 48.5% or 16 single-mother households are living below the poverty line. Among single-father households, those with 1 or 2 children have the highest poverty rate, with 2 households (50.0%) experiencing poverty. Likewise, among single-mother households, those with no children have the highest poverty rate, with 6 households (66.7%) falling below the poverty line.
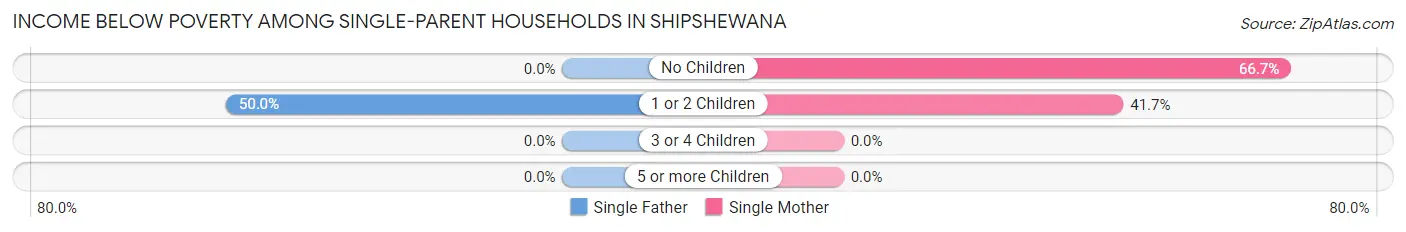
| Children | Single Father | Single Mother |
| No Children | 0 (0.0%) | 6 (66.7%) |
| 1 or 2 Children | 2 (50.0%) | 10 (41.7%) |
| 3 or 4 Children | 0 (0.0%) | 0 (0.0%) |
| 5 or more Children | 0 (0.0%) | 0 (0.0%) |
| Total | 2 (50.0%) | 16 (48.5%) |
Income Below Poverty Among Married-Couple vs Single-Parent Households in Shipshewana
The poverty data for Shipshewana shows that 1 of the married-couple family households (0.4%) and 18 of the single-parent households (48.6%) are living below the poverty level. Within the married-couple family households, those with 1 or 2 children have the highest poverty rate, with 1 households (1.7%) falling below the poverty line. Among the single-parent households, those with no children have the highest poverty rate, with 6 household (66.7%) living below poverty.
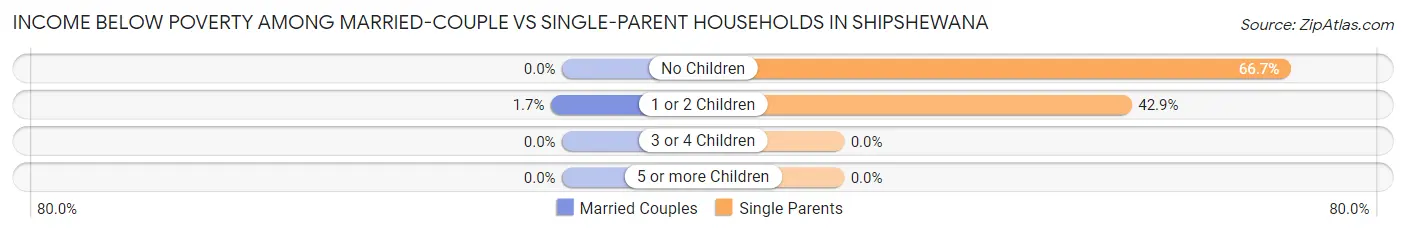
| Children | Married-Couple Families | Single-Parent Households |
| No Children | 0 (0.0%) | 6 (66.7%) |
| 1 or 2 Children | 1 (1.7%) | 12 (42.9%) |
| 3 or 4 Children | 0 (0.0%) | 0 (0.0%) |
| 5 or more Children | 0 (0.0%) | 0 (0.0%) |
| Total | 1 (0.4%) | 18 (48.6%) |
Race in Shipshewana
The most populous races in Shipshewana are White / Caucasian (796 | 91.2%), Two or more Races (69 | 7.9%), and Hispanic or Latino (33 | 3.8%).
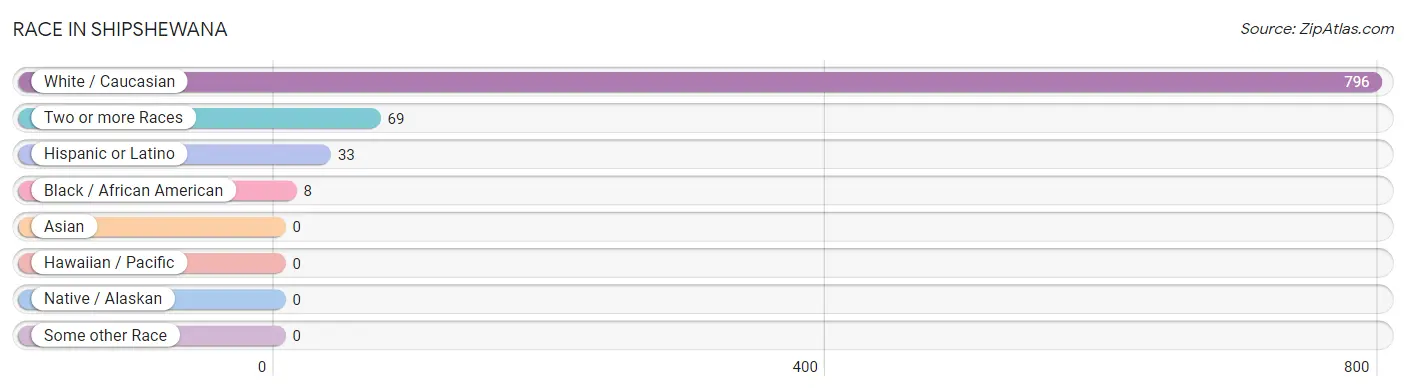
| Race | # Population | % Population |
| Asian | 0 | 0.0% |
| Black / African American | 8 | 0.9% |
| Hawaiian / Pacific | 0 | 0.0% |
| Hispanic or Latino | 33 | 3.8% |
| Native / Alaskan | 0 | 0.0% |
| White / Caucasian | 796 | 91.2% |
| Two or more Races | 69 | 7.9% |
| Some other Race | 0 | 0.0% |
| Total | 873 | 100.0% |
Ancestry in Shipshewana
The most populous ancestries reported in Shipshewana are German (262 | 30.0%), European (123 | 14.1%), English (114 | 13.1%), Irish (67 | 7.7%), and American (42 | 4.8%), together accounting for 69.6% of all Shipshewana residents.
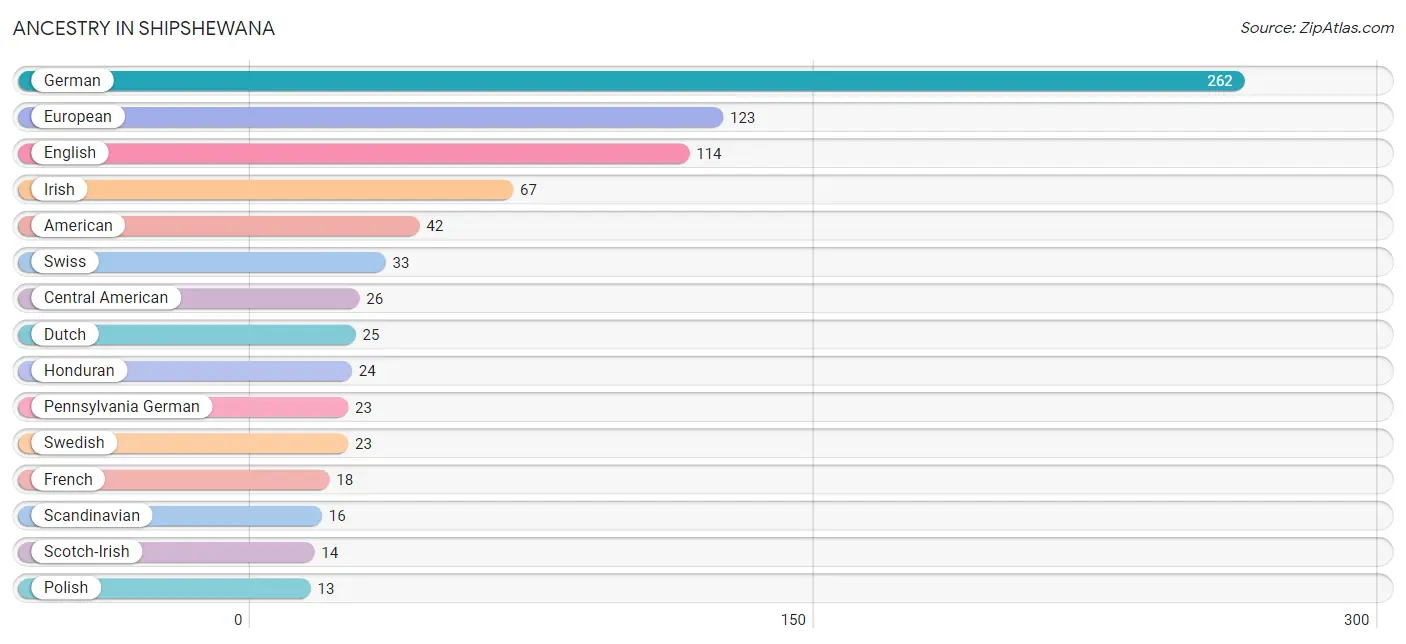
| Ancestry | # Population | % Population |
| African | 1 | 0.1% |
| American | 42 | 4.8% |
| Blackfeet | 2 | 0.2% |
| British | 4 | 0.5% |
| Central American | 26 | 3.0% |
| Cherokee | 2 | 0.2% |
| Danish | 2 | 0.2% |
| Dutch | 25 | 2.9% |
| English | 114 | 13.1% |
| European | 123 | 14.1% |
| Finnish | 2 | 0.2% |
| French | 18 | 2.1% |
| German | 262 | 30.0% |
| Greek | 6 | 0.7% |
| Honduran | 24 | 2.8% |
| Irish | 67 | 7.7% |
| Italian | 3 | 0.3% |
| Mexican | 7 | 0.8% |
| Panamanian | 2 | 0.2% |
| Pennsylvania German | 23 | 2.6% |
| Polish | 13 | 1.5% |
| Scandinavian | 16 | 1.8% |
| Scotch-Irish | 14 | 1.6% |
| Subsaharan African | 1 | 0.1% |
| Swedish | 23 | 2.6% |
| Swiss | 33 | 3.8% | View All 26 Rows |
Immigrants in Shipshewana
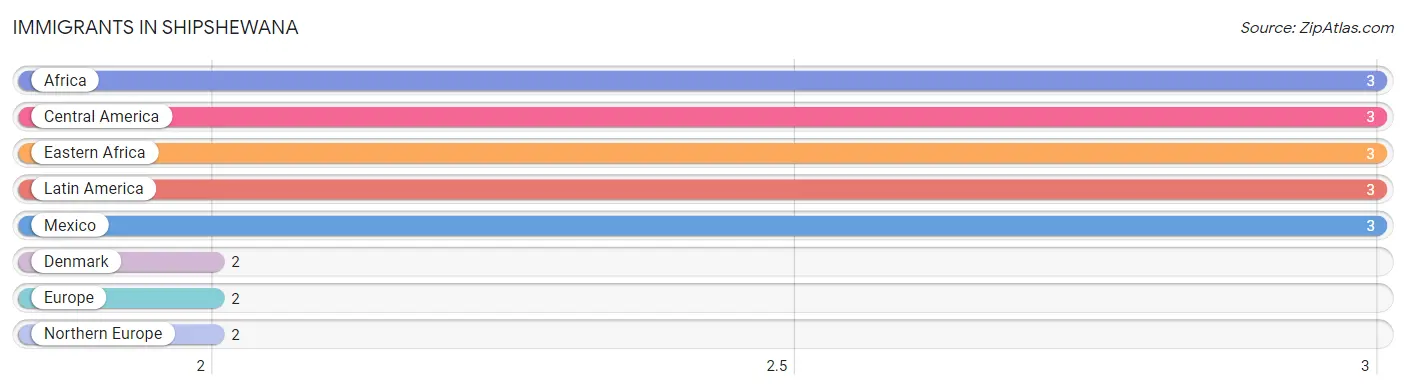
The most numerous immigrant groups reported in Shipshewana came from Africa (3 | 0.3%), Central America (3 | 0.3%), Eastern Africa (3 | 0.3%), Latin America (3 | 0.3%), and Mexico (3 | 0.3%), together accounting for 1.7% of all Shipshewana residents.
| Immigration Origin | # Population | % Population |
| Africa | 3 | 0.3% |
| Central America | 3 | 0.3% |
| Denmark | 2 | 0.2% |
| Eastern Africa | 3 | 0.3% |
| Europe | 2 | 0.2% |
| Latin America | 3 | 0.3% |
| Mexico | 3 | 0.3% |
| Northern Europe | 2 | 0.2% | View All 8 Rows |
Sex and Age in Shipshewana
Sex and Age in Shipshewana
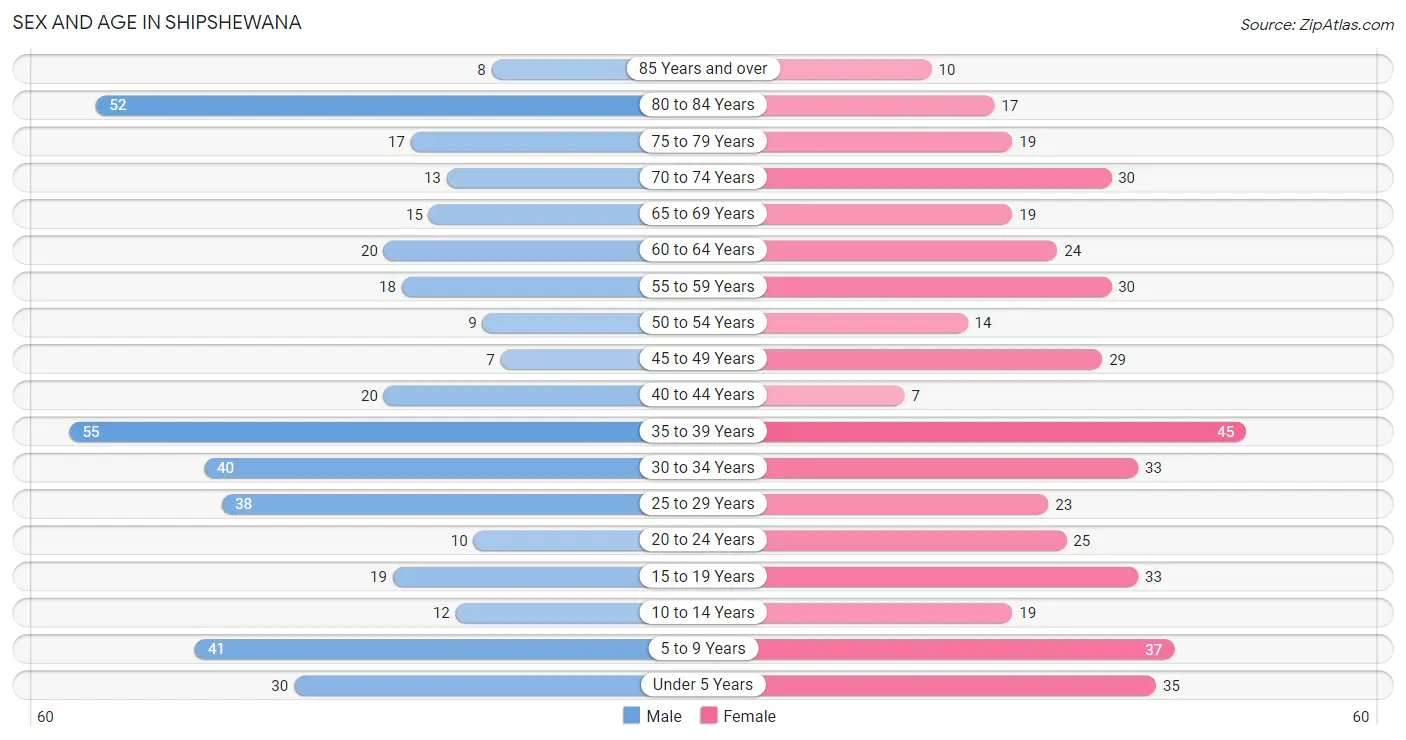
The most populous age groups in Shipshewana are 35 to 39 Years (55 | 13.0%) for men and 35 to 39 Years (45 | 10.0%) for women.
| Age Bracket | Male | Female |
| Under 5 Years | 30 (7.1%) | 35 (7.8%) |
| 5 to 9 Years | 41 (9.7%) | 37 (8.2%) |
| 10 to 14 Years | 12 (2.8%) | 19 (4.2%) |
| 15 to 19 Years | 19 (4.5%) | 33 (7.3%) |
| 20 to 24 Years | 10 (2.4%) | 25 (5.6%) |
| 25 to 29 Years | 38 (9.0%) | 23 (5.1%) |
| 30 to 34 Years | 40 (9.4%) | 33 (7.3%) |
| 35 to 39 Years | 55 (13.0%) | 45 (10.0%) |
| 40 to 44 Years | 20 (4.7%) | 7 (1.6%) |
| 45 to 49 Years | 7 (1.7%) | 29 (6.5%) |
| 50 to 54 Years | 9 (2.1%) | 14 (3.1%) |
| 55 to 59 Years | 18 (4.3%) | 30 (6.7%) |
| 60 to 64 Years | 20 (4.7%) | 24 (5.3%) |
| 65 to 69 Years | 15 (3.5%) | 19 (4.2%) |
| 70 to 74 Years | 13 (3.1%) | 30 (6.7%) |
| 75 to 79 Years | 17 (4.0%) | 19 (4.2%) |
| 80 to 84 Years | 52 (12.3%) | 17 (3.8%) |
| 85 Years and over | 8 (1.9%) | 10 (2.2%) |
| Total | 424 (100.0%) | 449 (100.0%) |
Families and Households in Shipshewana
Median Family Size in Shipshewana
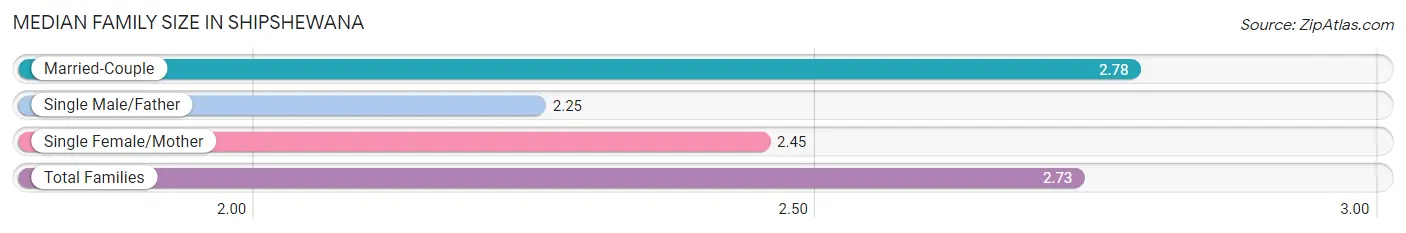
The median family size in Shipshewana is 2.73 persons per family, with married-couple families (220 | 85.6%) accounting for the largest median family size of 2.78 persons per family. On the other hand, single male/father families (4 | 1.6%) represent the smallest median family size with 2.25 persons per family.
| Family Type | # Families | Family Size |
| Married-Couple | 220 (85.6%) | 2.78 |
| Single Male/Father | 4 (1.6%) | 2.25 |
| Single Female/Mother | 33 (12.8%) | 2.45 |
| Total Families | 257 (100.0%) | 2.73 |
Median Household Size in Shipshewana
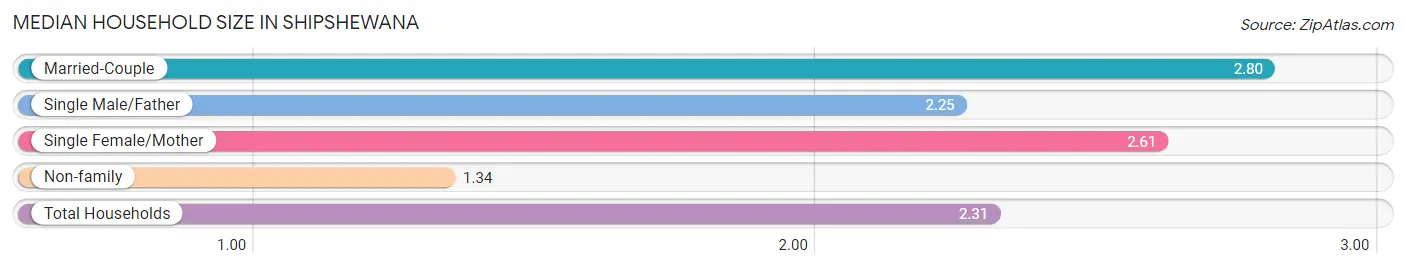
The median household size in Shipshewana is 2.31 persons per household, with married-couple households (220 | 58.2%) accounting for the largest median household size of 2.8 persons per household. non-family households (121 | 32.0%) represent the smallest median household size with 1.34 persons per household.
| Household Type | # Households | Household Size |
| Married-Couple | 220 (58.2%) | 2.80 |
| Single Male/Father | 4 (1.1%) | 2.25 |
| Single Female/Mother | 33 (8.7%) | 2.61 |
| Non-family | 121 (32.0%) | 1.34 |
| Total Households | 378 (100.0%) | 2.31 |
Household Size by Marriage Status in Shipshewana
Out of a total of 378 households in Shipshewana, 257 (68.0%) are family households, while 121 (32.0%) are nonfamily households. The most numerous type of family households are 2-person households, comprising 131, and the most common type of nonfamily households are 1-person households, comprising 99.
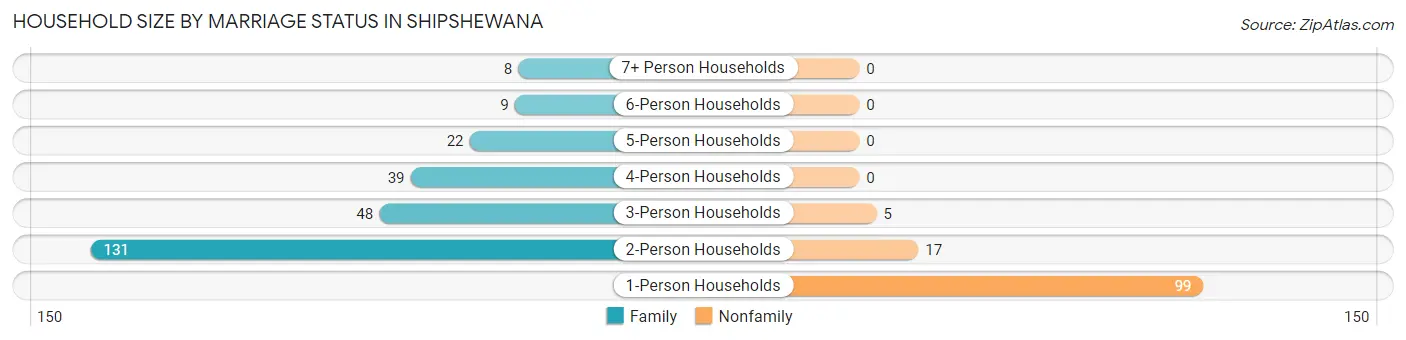
| Household Size | Family Households | Nonfamily Households |
| 1-Person Households | - | 99 (26.2%) |
| 2-Person Households | 131 (34.7%) | 17 (4.5%) |
| 3-Person Households | 48 (12.7%) | 5 (1.3%) |
| 4-Person Households | 39 (10.3%) | 0 (0.0%) |
| 5-Person Households | 22 (5.8%) | 0 (0.0%) |
| 6-Person Households | 9 (2.4%) | 0 (0.0%) |
| 7+ Person Households | 8 (2.1%) | 0 (0.0%) |
| Total | 257 (68.0%) | 121 (32.0%) |
Female Fertility in Shipshewana
Fertility by Age in Shipshewana
Average fertility rate in Shipshewana is 70.0 births per 1,000 women. Women in the age bracket of 20 to 34 years have the highest fertility rate with 173.0 births per 1,000 women. Women in the age bracket of 20 to 34 years acount for 100.0% of all women with births.
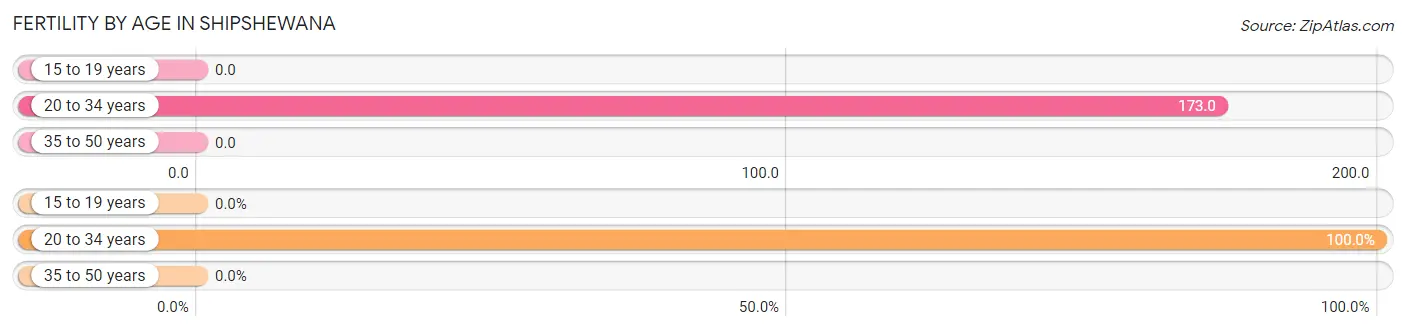
| Age Bracket | Women with Births | Births / 1,000 Women |
| 15 to 19 years | 0 (0.0%) | 0.0 |
| 20 to 34 years | 14 (100.0%) | 173.0 |
| 35 to 50 years | 0 (0.0%) | 0.0 |
| Total | 14 (100.0%) | 70.0 |
Fertility by Age by Marriage Status in Shipshewana
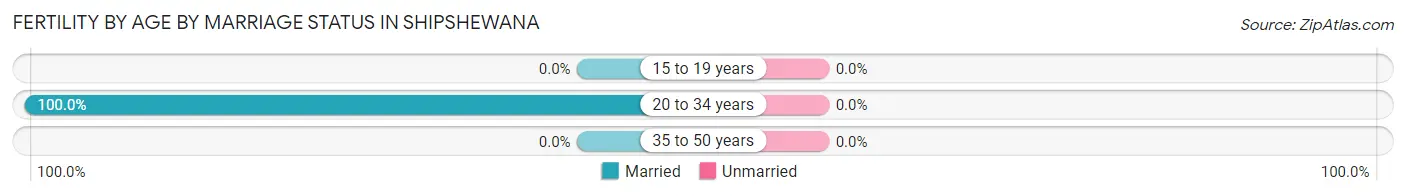
| Age Bracket | Married | Unmarried |
| 15 to 19 years | 0 (0.0%) | 0 (0.0%) |
| 20 to 34 years | 14 (100.0%) | 0 (0.0%) |
| 35 to 50 years | 0 (0.0%) | 0 (0.0%) |
| Total | 14 (100.0%) | 0 (0.0%) |
Fertility by Education in Shipshewana
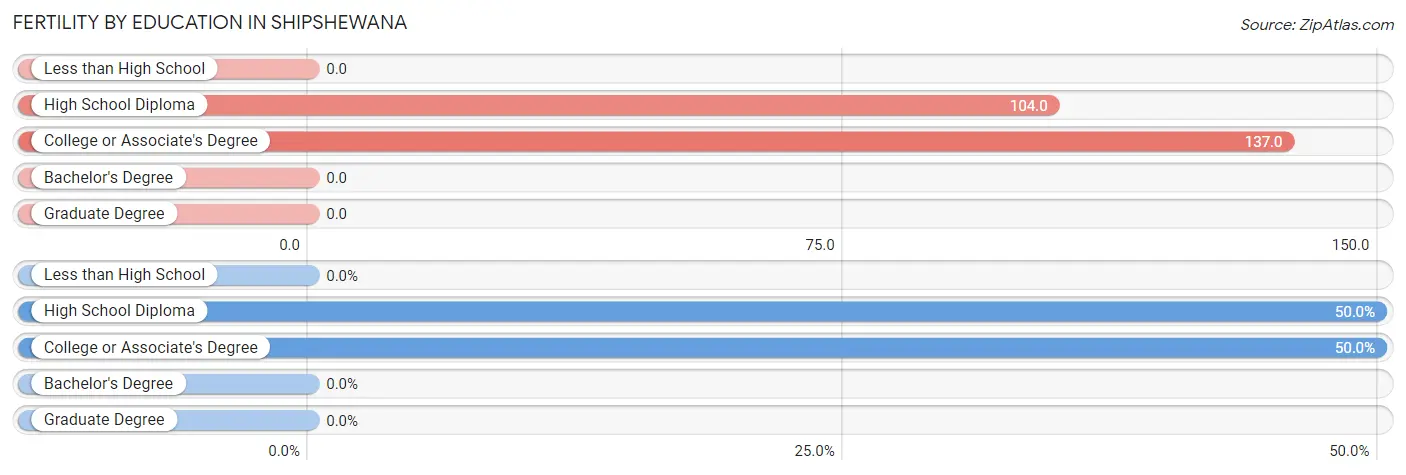
| Educational Attainment | Women with Births | Births / 1,000 Women |
| Less than High School | 0 (0.0%) | 0.0 |
| High School Diploma | 7 (50.0%) | 104.0 |
| College or Associate's Degree | 7 (50.0%) | 137.0 |
| Bachelor's Degree | 0 (0.0%) | 0.0 |
| Graduate Degree | 0 (0.0%) | 0.0 |
| Total | 14 (100.0%) | 70.0 |
Fertility by Education by Marriage Status in Shipshewana
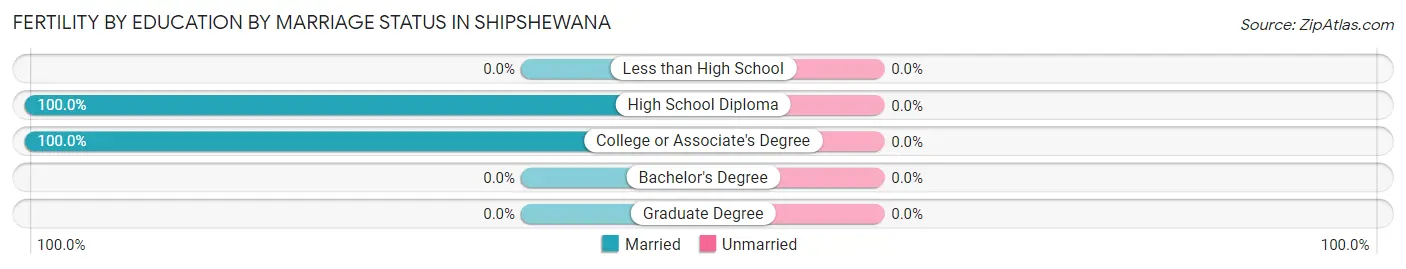
| Educational Attainment | Married | Unmarried |
| Less than High School | 0 (0.0%) | 0 (0.0%) |
| High School Diploma | 7 (100.0%) | 0 (0.0%) |
| College or Associate's Degree | 7 (100.0%) | 0 (0.0%) |
| Bachelor's Degree | 0 (0.0%) | 0 (0.0%) |
| Graduate Degree | 0 (0.0%) | 0 (0.0%) |
| Total | 14 (100.0%) | 0 (0.0%) |
Employment Characteristics in Shipshewana
Employment by Class of Employer in Shipshewana
Among the 422 employed individuals in Shipshewana, private company employees (309 | 73.2%), local government employees (39 | 9.2%), and not-for-profit organizations (28 | 6.6%) make up the most common classes of employment.
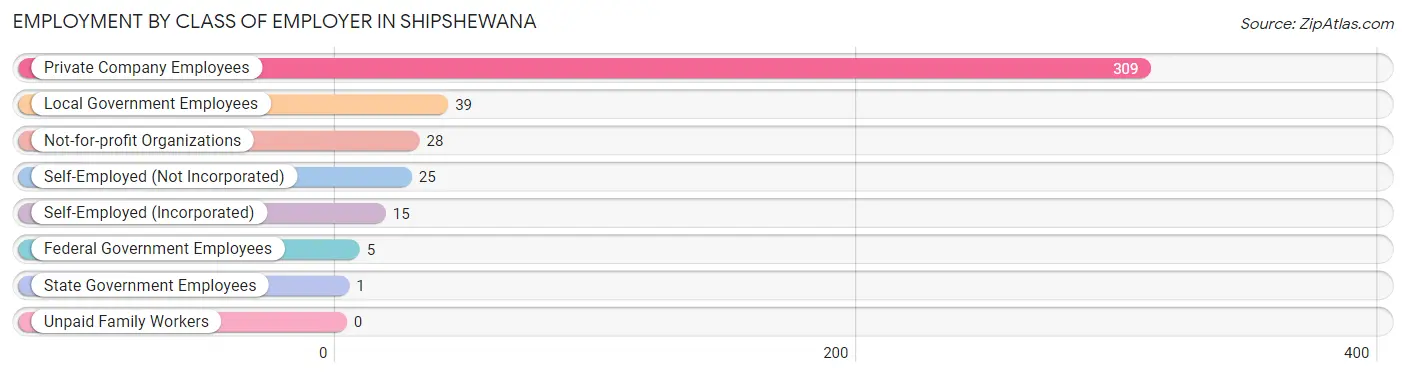
| Employer Class | # Employees | % Employees |
| Private Company Employees | 309 | 73.2% |
| Self-Employed (Incorporated) | 15 | 3.5% |
| Self-Employed (Not Incorporated) | 25 | 5.9% |
| Not-for-profit Organizations | 28 | 6.6% |
| Local Government Employees | 39 | 9.2% |
| State Government Employees | 1 | 0.2% |
| Federal Government Employees | 5 | 1.2% |
| Unpaid Family Workers | 0 | 0.0% |
| Total | 422 | 100.0% |
Employment Status by Age in Shipshewana
According to the labor force statistics for Shipshewana, out of the total population over 16 years of age (684), 68.9% or 471 individuals are in the labor force, with 7.2% or 34 of them unemployed. The age group with the highest labor force participation rate is 25 to 29 years, with 96.7% or 59 individuals in the labor force. Within the labor force, the 16 to 19 years age range has the highest percentage of unemployed individuals, with 29.4% or 10 of them being unemployed.
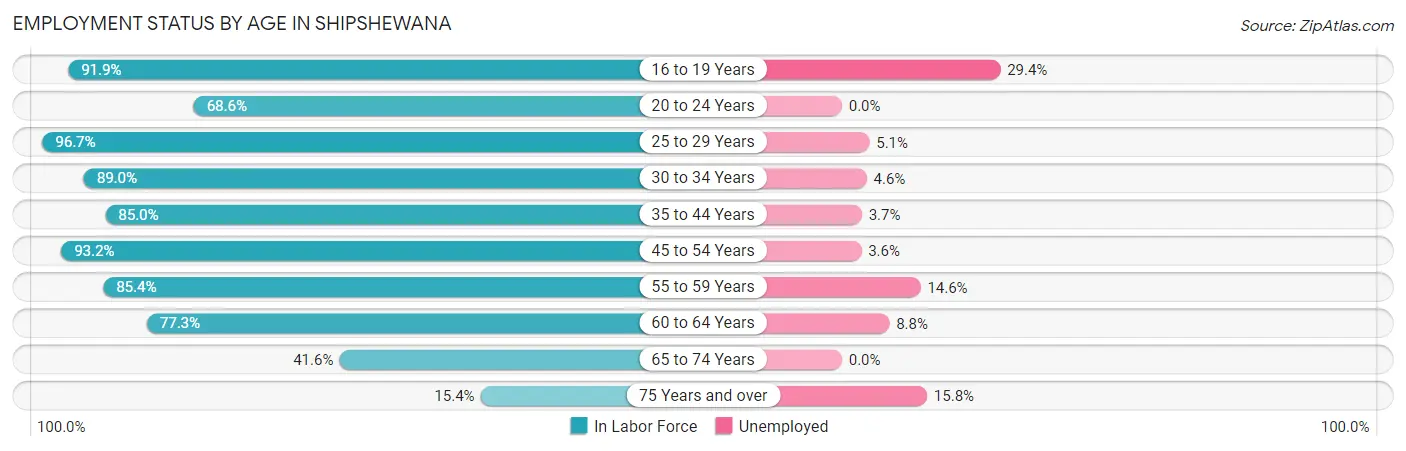
| Age Bracket | In Labor Force | Unemployed |
| 16 to 19 Years | 34 (91.9%) | 10 (29.4%) |
| 20 to 24 Years | 24 (68.6%) | 0 (0.0%) |
| 25 to 29 Years | 59 (96.7%) | 3 (5.1%) |
| 30 to 34 Years | 65 (89.0%) | 3 (4.6%) |
| 35 to 44 Years | 108 (85.0%) | 4 (3.7%) |
| 45 to 54 Years | 55 (93.2%) | 2 (3.6%) |
| 55 to 59 Years | 41 (85.4%) | 6 (14.6%) |
| 60 to 64 Years | 34 (77.3%) | 3 (8.8%) |
| 65 to 74 Years | 32 (41.6%) | 0 (0.0%) |
| 75 Years and over | 19 (15.4%) | 3 (15.8%) |
| Total | 471 (68.9%) | 34 (7.2%) |
Employment Status by Educational Attainment in Shipshewana
According to labor force statistics for Shipshewana, 87.9% of individuals (362) out of the total population between 25 and 64 years of age (412) are in the labor force, with 5.8% or 21 of them being unemployed. The group with the highest labor force participation rate are those with the educational attainment of bachelor's degree or higher, with 97.5% or 39 individuals in the labor force. Within the labor force, individuals with high school diploma education have the highest percentage of unemployment, with 11.8% or 16 of them being unemployed.
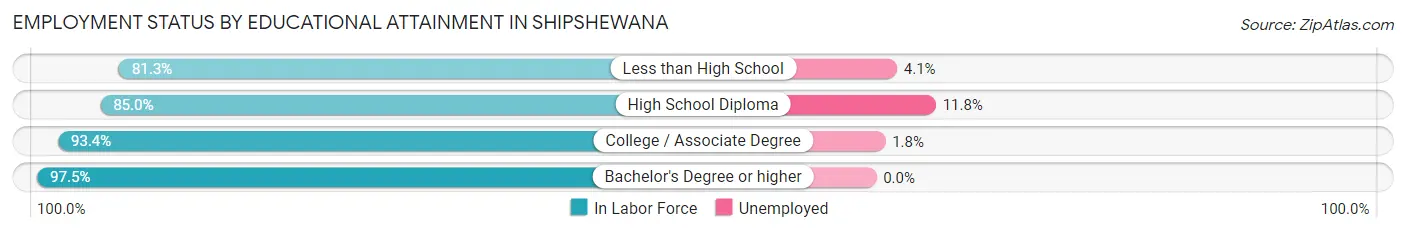
| Educational Attainment | In Labor Force | Unemployed |
| Less than High School | 74 (81.3%) | 4 (4.1%) |
| High School Diploma | 136 (85.0%) | 19 (11.8%) |
| College / Associate Degree | 113 (93.4%) | 2 (1.8%) |
| Bachelor's Degree or higher | 39 (97.5%) | 0 (0.0%) |
| Total | 362 (87.9%) | 24 (5.8%) |
Employment Occupations by Sex in Shipshewana
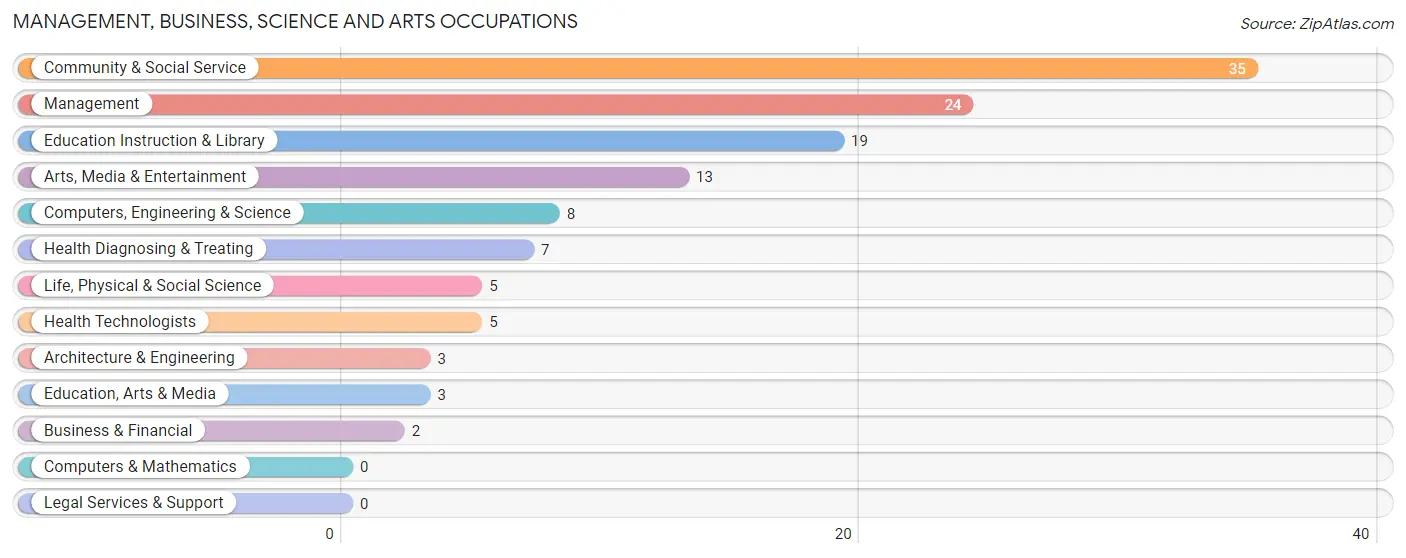
Management, Business, Science and Arts Occupations
The most common Management, Business, Science and Arts occupations in Shipshewana are Community & Social Service (35 | 8.0%), Management (24 | 5.5%), Education Instruction & Library (19 | 4.3%), Arts, Media & Entertainment (13 | 3.0%), and Computers, Engineering & Science (8 | 1.8%).
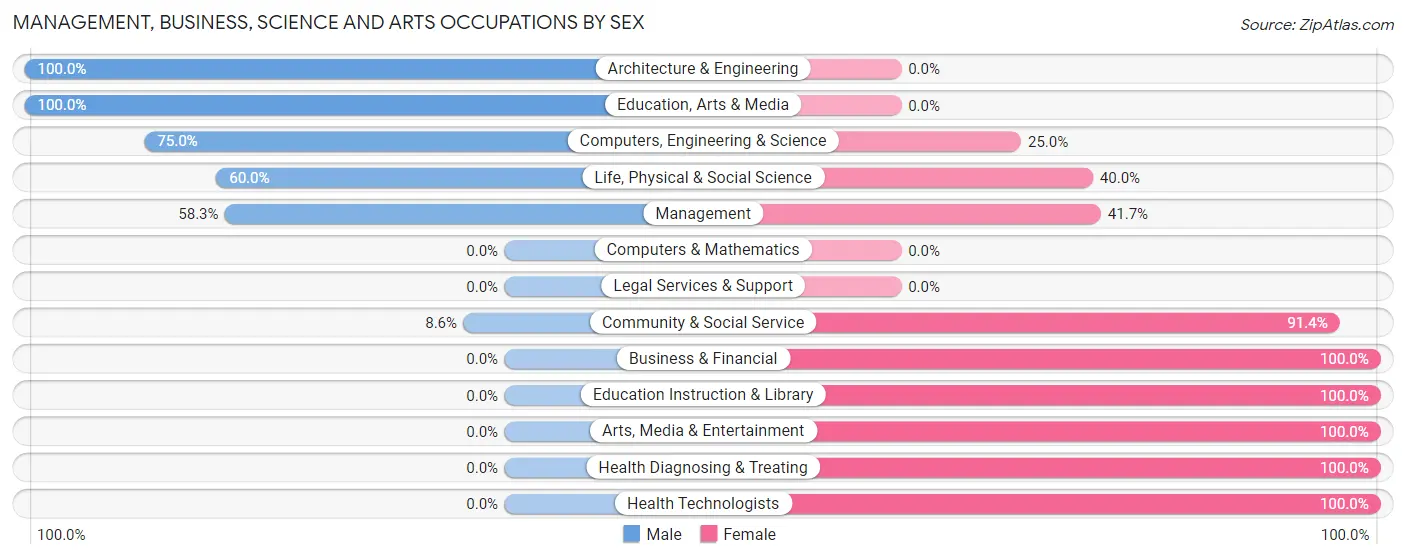
Management, Business, Science and Arts Occupations by Sex
Within the Management, Business, Science and Arts occupations in Shipshewana, the most male-oriented occupations are Architecture & Engineering (100.0%), Education, Arts & Media (100.0%), and Computers, Engineering & Science (75.0%), while the most female-oriented occupations are Business & Financial (100.0%), Education Instruction & Library (100.0%), and Arts, Media & Entertainment (100.0%).
| Occupation | Male | Female |
| Management | 14 (58.3%) | 10 (41.7%) |
| Business & Financial | 0 (0.0%) | 2 (100.0%) |
| Computers, Engineering & Science | 6 (75.0%) | 2 (25.0%) |
| Computers & Mathematics | 0 (0.0%) | 0 (0.0%) |
| Architecture & Engineering | 3 (100.0%) | 0 (0.0%) |
| Life, Physical & Social Science | 3 (60.0%) | 2 (40.0%) |
| Community & Social Service | 3 (8.6%) | 32 (91.4%) |
| Education, Arts & Media | 3 (100.0%) | 0 (0.0%) |
| Legal Services & Support | 0 (0.0%) | 0 (0.0%) |
| Education Instruction & Library | 0 (0.0%) | 19 (100.0%) |
| Arts, Media & Entertainment | 0 (0.0%) | 13 (100.0%) |
| Health Diagnosing & Treating | 0 (0.0%) | 7 (100.0%) |
| Health Technologists | 0 (0.0%) | 5 (100.0%) |
| Total (Category) | 23 (30.3%) | 53 (69.7%) |
| Total (Overall) | 231 (52.9%) | 206 (47.1%) |
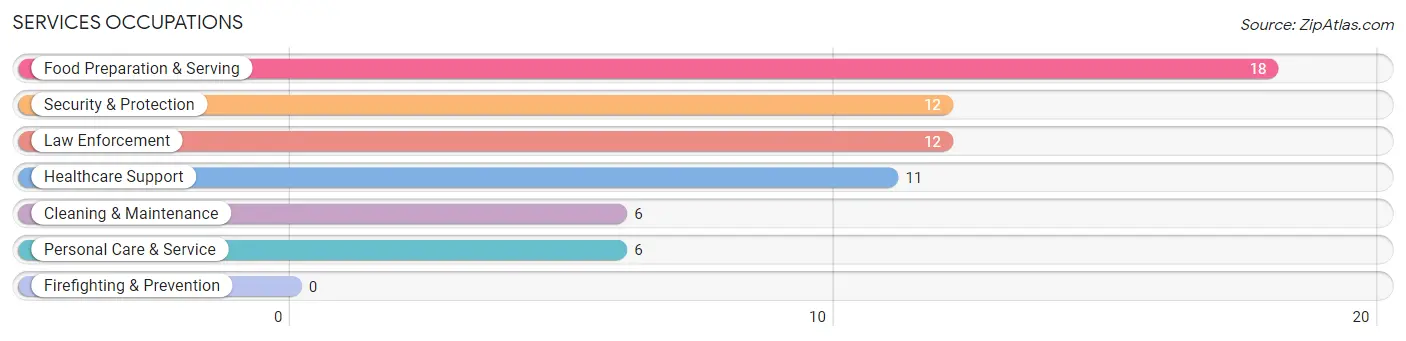
Services Occupations
The most common Services occupations in Shipshewana are Food Preparation & Serving (18 | 4.1%), Security & Protection (12 | 2.8%), Law Enforcement (12 | 2.8%), Healthcare Support (11 | 2.5%), and Cleaning & Maintenance (6 | 1.4%).
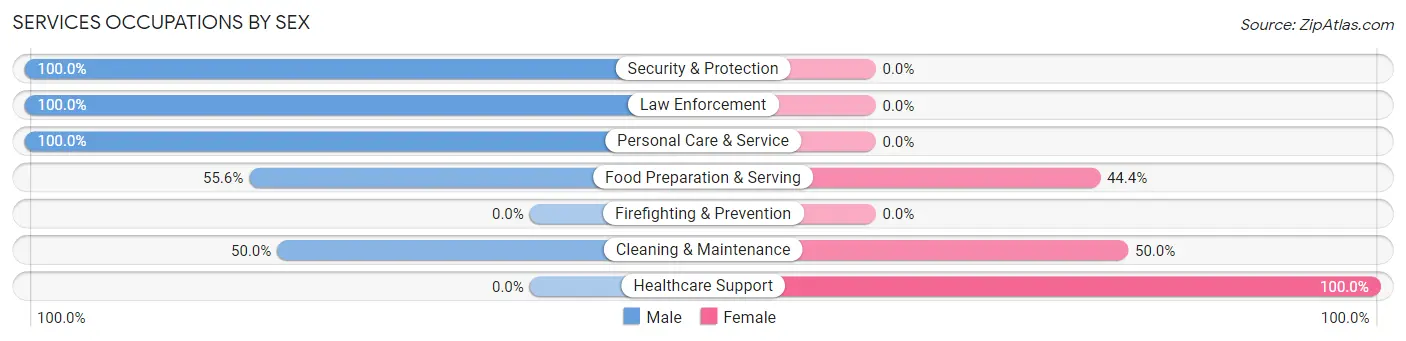
Services Occupations by Sex
Within the Services occupations in Shipshewana, the most male-oriented occupations are Security & Protection (100.0%), Law Enforcement (100.0%), and Personal Care & Service (100.0%), while the most female-oriented occupations are Healthcare Support (100.0%), Cleaning & Maintenance (50.0%), and Food Preparation & Serving (44.4%).
| Occupation | Male | Female |
| Healthcare Support | 0 (0.0%) | 11 (100.0%) |
| Security & Protection | 12 (100.0%) | 0 (0.0%) |
| Firefighting & Prevention | 0 (0.0%) | 0 (0.0%) |
| Law Enforcement | 12 (100.0%) | 0 (0.0%) |
| Food Preparation & Serving | 10 (55.6%) | 8 (44.4%) |
| Cleaning & Maintenance | 3 (50.0%) | 3 (50.0%) |
| Personal Care & Service | 6 (100.0%) | 0 (0.0%) |
| Total (Category) | 31 (58.5%) | 22 (41.5%) |
| Total (Overall) | 231 (52.9%) | 206 (47.1%) |
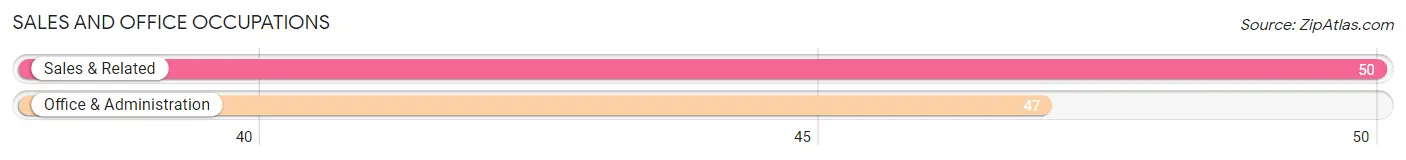
Sales and Office Occupations
The most common Sales and Office occupations in Shipshewana are Sales & Related (50 | 11.4%), and Office & Administration (47 | 10.8%).
Sales and Office Occupations by Sex
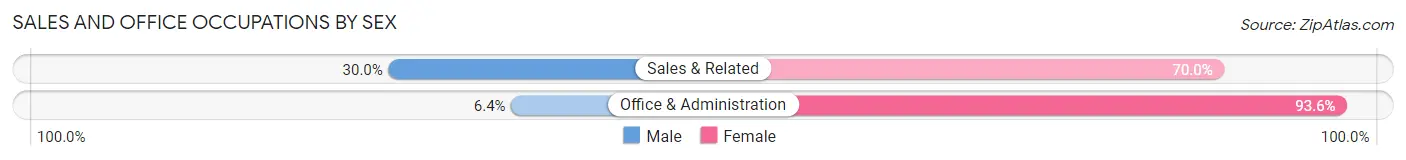
| Occupation | Male | Female |
| Sales & Related | 15 (30.0%) | 35 (70.0%) |
| Office & Administration | 3 (6.4%) | 44 (93.6%) |
| Total (Category) | 18 (18.6%) | 79 (81.4%) |
| Total (Overall) | 231 (52.9%) | 206 (47.1%) |
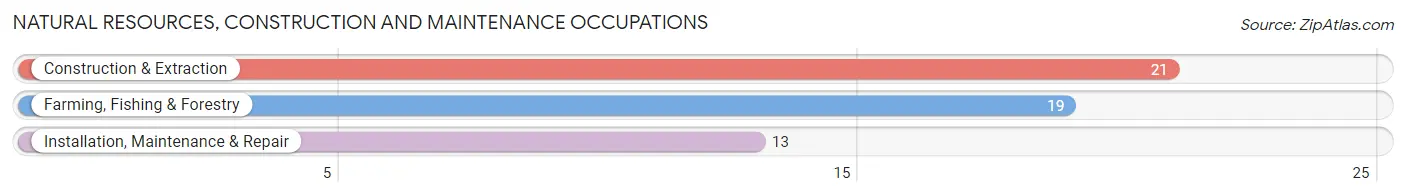
Natural Resources, Construction and Maintenance Occupations
The most common Natural Resources, Construction and Maintenance occupations in Shipshewana are Construction & Extraction (21 | 4.8%), Farming, Fishing & Forestry (19 | 4.3%), and Installation, Maintenance & Repair (13 | 3.0%).
Natural Resources, Construction and Maintenance Occupations by Sex
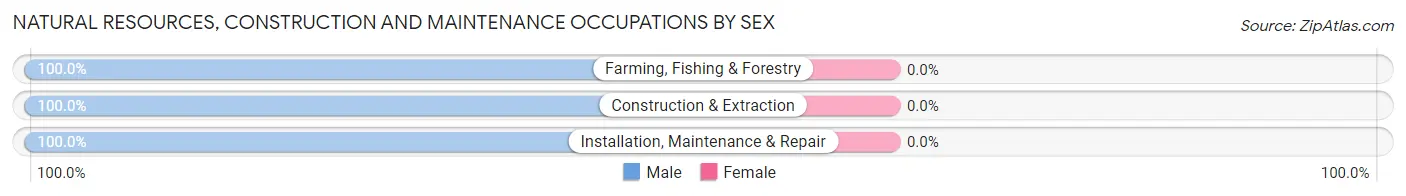
| Occupation | Male | Female |
| Farming, Fishing & Forestry | 19 (100.0%) | 0 (0.0%) |
| Construction & Extraction | 21 (100.0%) | 0 (0.0%) |
| Installation, Maintenance & Repair | 13 (100.0%) | 0 (0.0%) |
| Total (Category) | 53 (100.0%) | 0 (0.0%) |
| Total (Overall) | 231 (52.9%) | 206 (47.1%) |
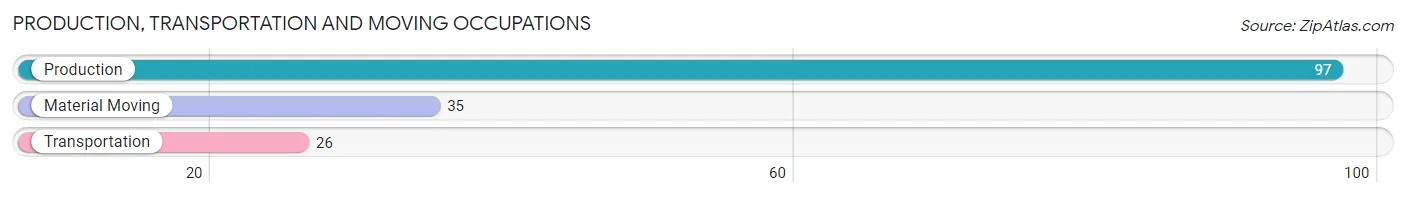
Production, Transportation and Moving Occupations
The most common Production, Transportation and Moving occupations in Shipshewana are Production (97 | 22.2%), Material Moving (35 | 8.0%), and Transportation (26 | 5.9%).
Production, Transportation and Moving Occupations by Sex
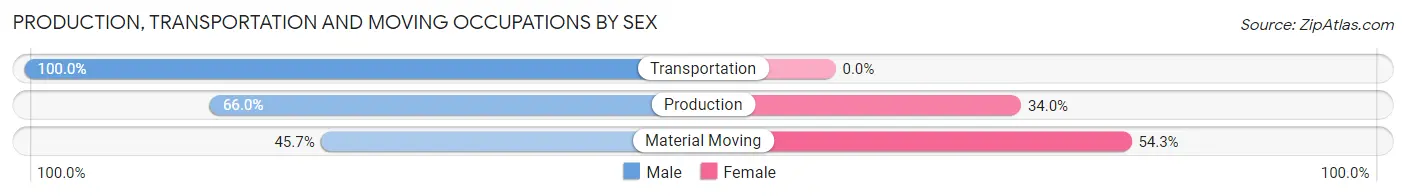
| Occupation | Male | Female |
| Production | 64 (66.0%) | 33 (34.0%) |
| Transportation | 26 (100.0%) | 0 (0.0%) |
| Material Moving | 16 (45.7%) | 19 (54.3%) |
| Total (Category) | 106 (67.1%) | 52 (32.9%) |
| Total (Overall) | 231 (52.9%) | 206 (47.1%) |
Employment Industries by Sex in Shipshewana
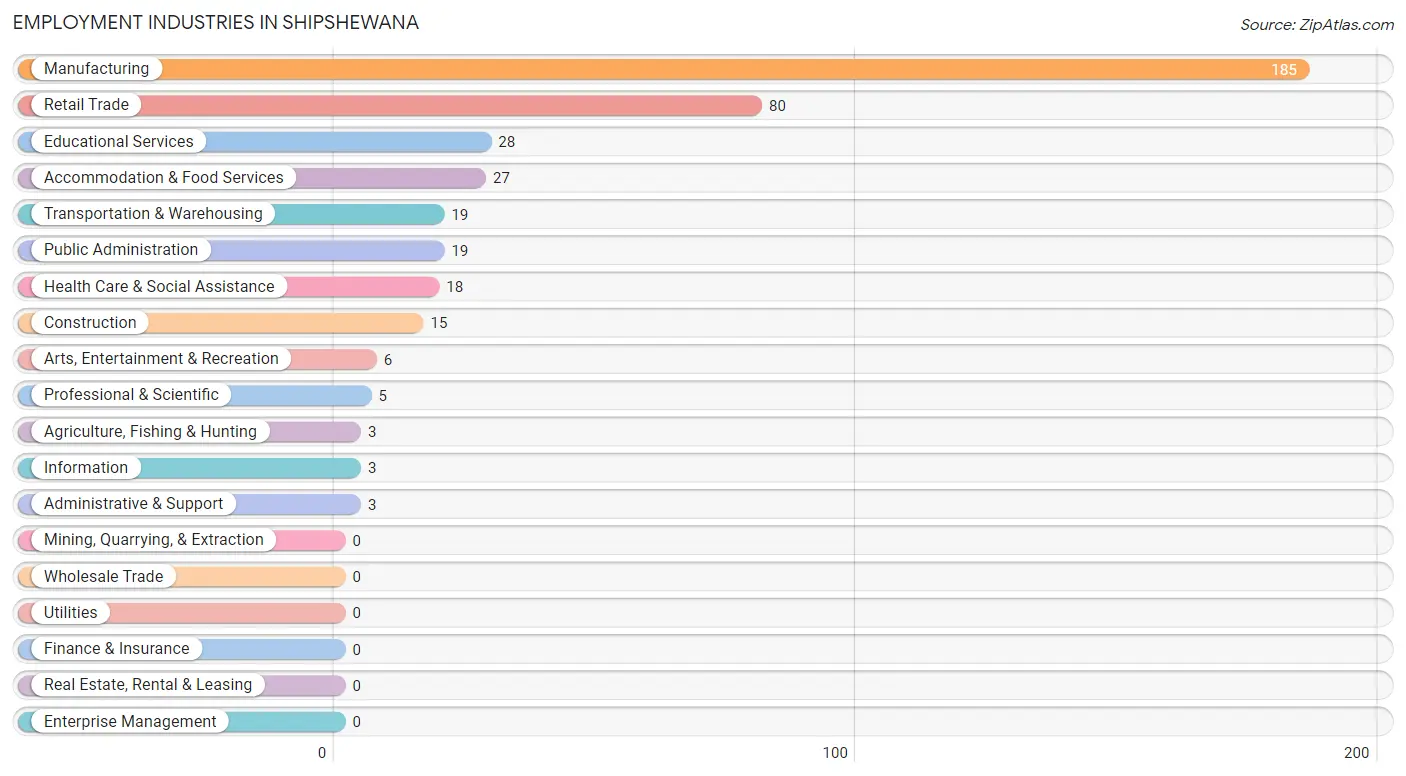
Employment Industries in Shipshewana
The major employment industries in Shipshewana include Manufacturing (185 | 42.3%), Retail Trade (80 | 18.3%), Educational Services (28 | 6.4%), Accommodation & Food Services (27 | 6.2%), and Transportation & Warehousing (19 | 4.3%).
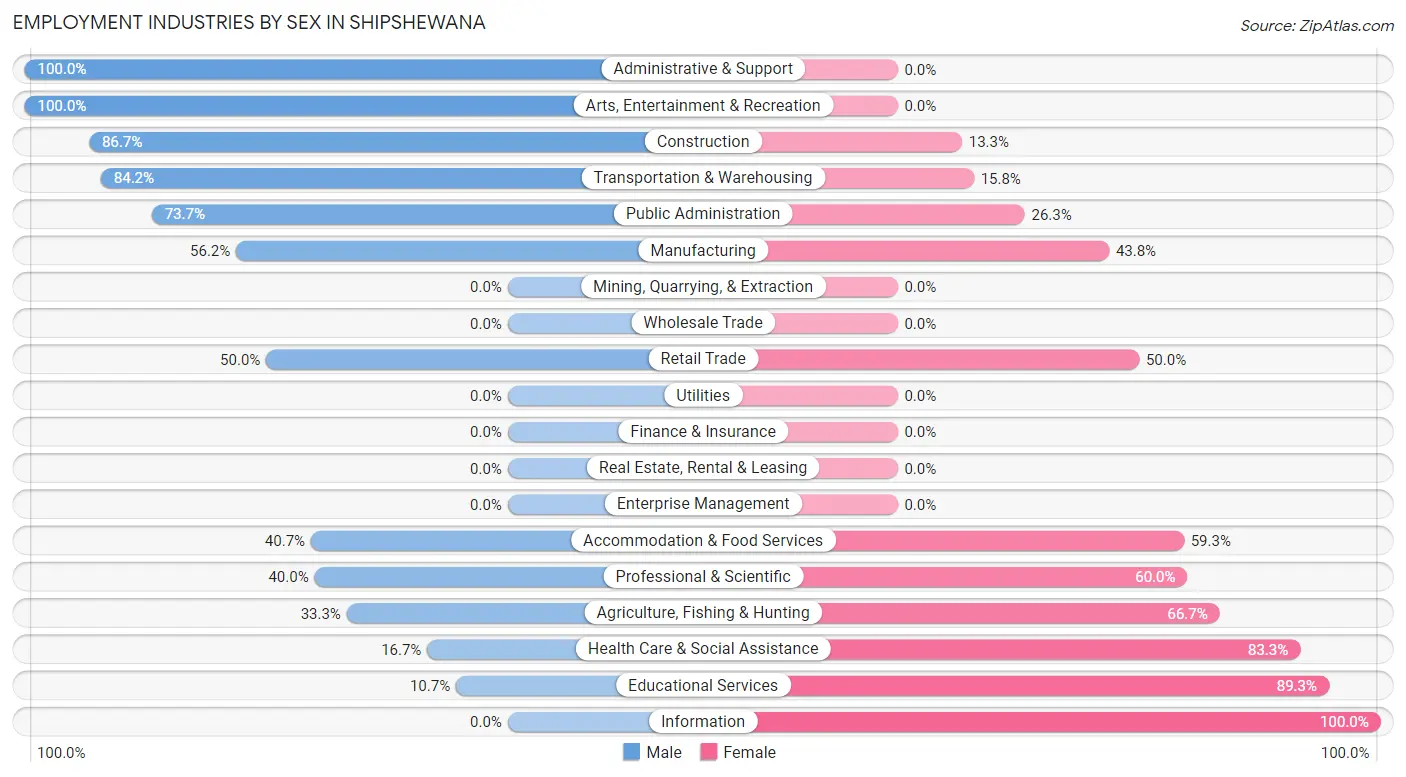
Employment Industries by Sex in Shipshewana
The Shipshewana industries that see more men than women are Administrative & Support (100.0%), Arts, Entertainment & Recreation (100.0%), and Construction (86.7%), whereas the industries that tend to have a higher number of women are Information (100.0%), Educational Services (89.3%), and Health Care & Social Assistance (83.3%).
| Industry | Male | Female |
| Agriculture, Fishing & Hunting | 1 (33.3%) | 2 (66.7%) |
| Mining, Quarrying, & Extraction | 0 (0.0%) | 0 (0.0%) |
| Construction | 13 (86.7%) | 2 (13.3%) |
| Manufacturing | 104 (56.2%) | 81 (43.8%) |
| Wholesale Trade | 0 (0.0%) | 0 (0.0%) |
| Retail Trade | 40 (50.0%) | 40 (50.0%) |
| Transportation & Warehousing | 16 (84.2%) | 3 (15.8%) |
| Utilities | 0 (0.0%) | 0 (0.0%) |
| Information | 0 (0.0%) | 3 (100.0%) |
| Finance & Insurance | 0 (0.0%) | 0 (0.0%) |
| Real Estate, Rental & Leasing | 0 (0.0%) | 0 (0.0%) |
| Professional & Scientific | 2 (40.0%) | 3 (60.0%) |
| Enterprise Management | 0 (0.0%) | 0 (0.0%) |
| Administrative & Support | 3 (100.0%) | 0 (0.0%) |
| Educational Services | 3 (10.7%) | 25 (89.3%) |
| Health Care & Social Assistance | 3 (16.7%) | 15 (83.3%) |
| Arts, Entertainment & Recreation | 6 (100.0%) | 0 (0.0%) |
| Accommodation & Food Services | 11 (40.7%) | 16 (59.3%) |
| Public Administration | 14 (73.7%) | 5 (26.3%) |
| Total | 231 (52.9%) | 206 (47.1%) |
Education in Shipshewana
School Enrollment in Shipshewana
The most common levels of schooling among the 136 students in Shipshewana are elementary school (56 | 41.2%), nursery / preschool (20 | 14.7%), and middle school (20 | 14.7%).
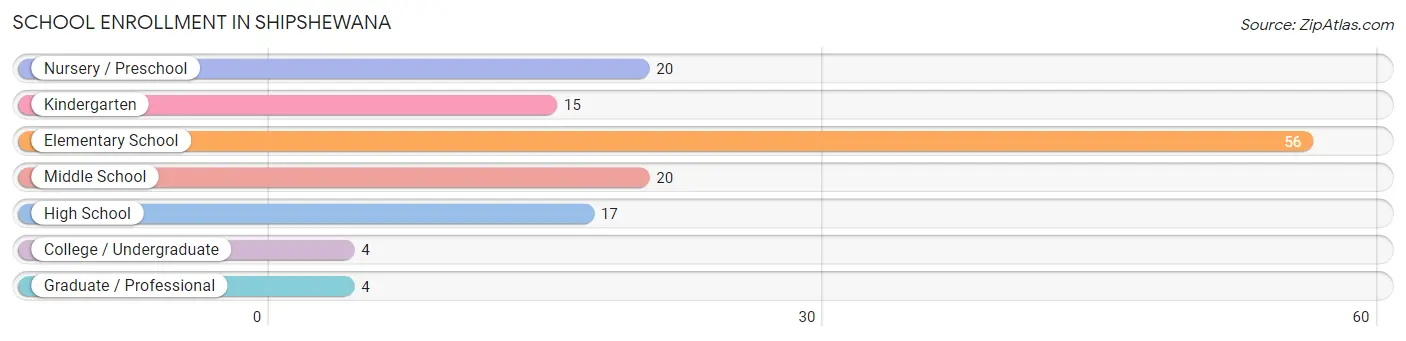
| School Level | # Students | % Students |
| Nursery / Preschool | 20 | 14.7% |
| Kindergarten | 15 | 11.0% |
| Elementary School | 56 | 41.2% |
| Middle School | 20 | 14.7% |
| High School | 17 | 12.5% |
| College / Undergraduate | 4 | 2.9% |
| Graduate / Professional | 4 | 2.9% |
| Total | 136 | 100.0% |
School Enrollment by Age by Funding Source in Shipshewana
Out of a total of 136 students who are enrolled in schools in Shipshewana, 30 (22.1%) attend a private institution, while the remaining 106 (77.9%) are enrolled in public schools. The age group of 35 years and over has the highest likelihood of being enrolled in private schools, with 4 (66.7% in the age bracket) enrolled. Conversely, the age group of 3 to 4 year olds has the lowest likelihood of being enrolled in a private school, with 7 (100.0% in the age bracket) attending a public institution.
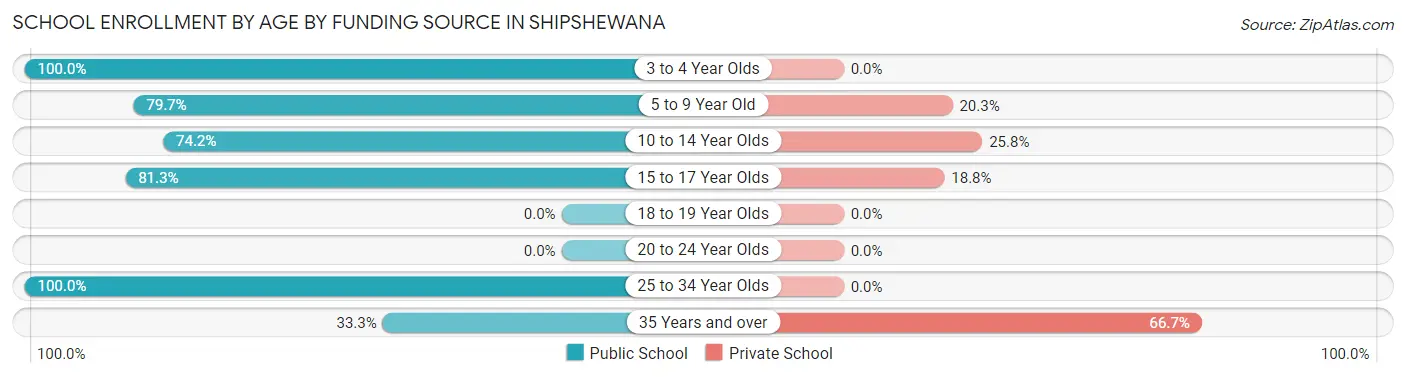
| Age Bracket | Public School | Private School |
| 3 to 4 Year Olds | 7 (100.0%) | 0 (0.0%) |
| 5 to 9 Year Old | 59 (79.7%) | 15 (20.3%) |
| 10 to 14 Year Olds | 23 (74.2%) | 8 (25.8%) |
| 15 to 17 Year Olds | 13 (81.2%) | 3 (18.8%) |
| 18 to 19 Year Olds | 0 (0.0%) | 0 (0.0%) |
| 20 to 24 Year Olds | 0 (0.0%) | 0 (0.0%) |
| 25 to 34 Year Olds | 2 (100.0%) | 0 (0.0%) |
| 35 Years and over | 2 (33.3%) | 4 (66.7%) |
| Total | 106 (77.9%) | 30 (22.1%) |
Educational Attainment by Field of Study in Shipshewana
Business (22 | 35.5%), education (10 | 16.1%), science & technology (8 | 12.9%), computers & mathematics (6 | 9.7%), and psychology (5 | 8.1%) are the most common fields of study among 62 individuals in Shipshewana who have obtained a bachelor's degree or higher.
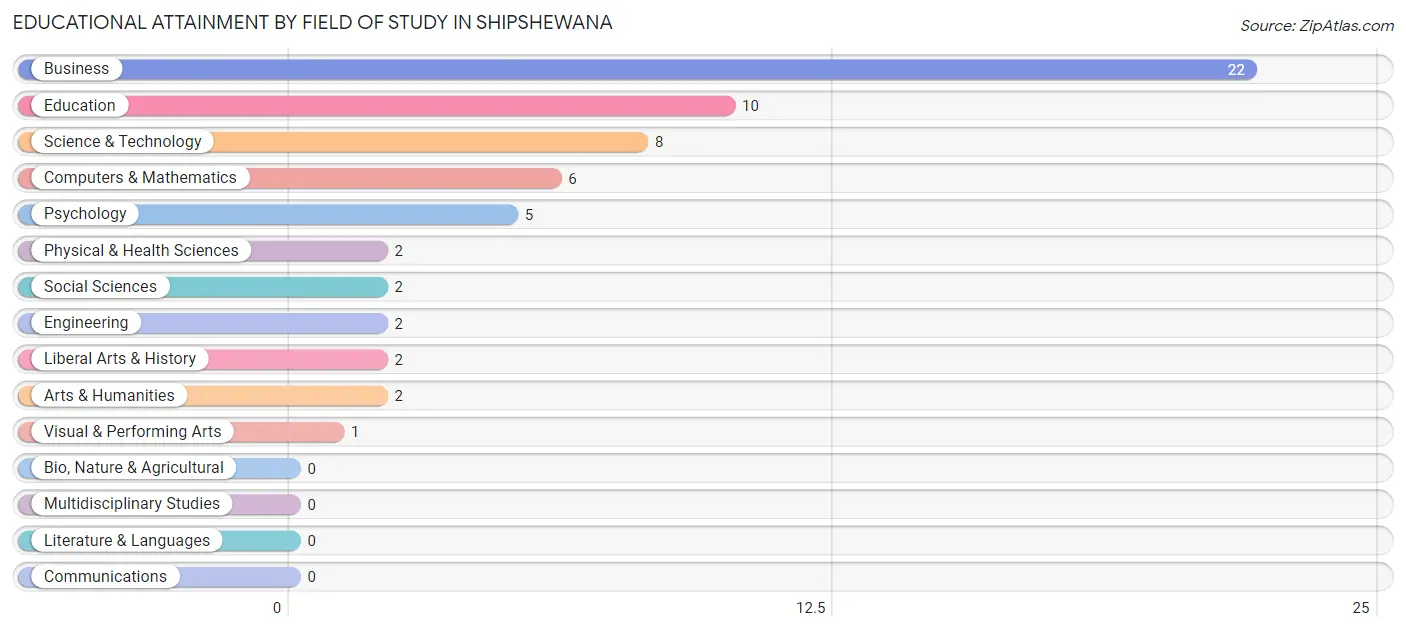
| Field of Study | # Graduates | % Graduates |
| Computers & Mathematics | 6 | 9.7% |
| Bio, Nature & Agricultural | 0 | 0.0% |
| Physical & Health Sciences | 2 | 3.2% |
| Psychology | 5 | 8.1% |
| Social Sciences | 2 | 3.2% |
| Engineering | 2 | 3.2% |
| Multidisciplinary Studies | 0 | 0.0% |
| Science & Technology | 8 | 12.9% |
| Business | 22 | 35.5% |
| Education | 10 | 16.1% |
| Literature & Languages | 0 | 0.0% |
| Liberal Arts & History | 2 | 3.2% |
| Visual & Performing Arts | 1 | 1.6% |
| Communications | 0 | 0.0% |
| Arts & Humanities | 2 | 3.2% |
| Total | 62 | 100.0% |
Transportation & Commute in Shipshewana
Vehicle Availability by Sex in Shipshewana
The most prevalent vehicle ownership categories in Shipshewana are males with 2 vehicles (104, accounting for 46.6%) and females with 2 vehicles (63, making up 52.3%).
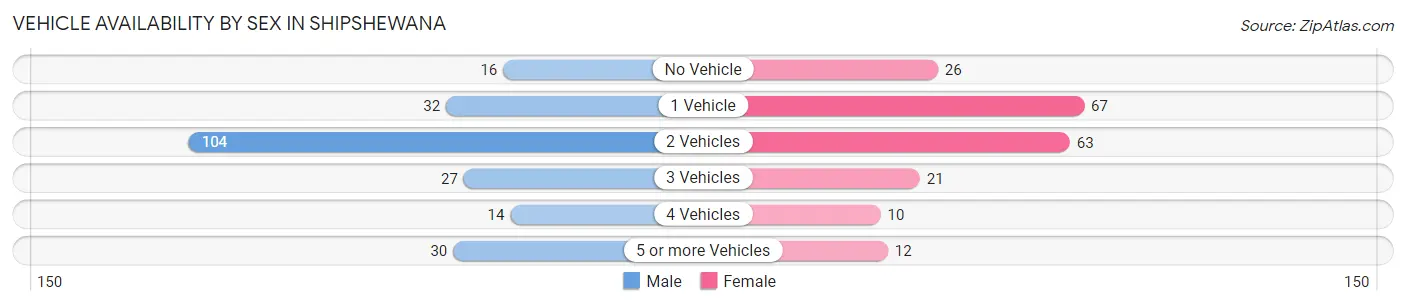
| Vehicles Available | Male | Female |
| No Vehicle | 16 (7.2%) | 26 (13.1%) |
| 1 Vehicle | 32 (14.3%) | 67 (33.7%) |
| 2 Vehicles | 104 (46.6%) | 63 (31.7%) |
| 3 Vehicles | 27 (12.1%) | 21 (10.5%) |
| 4 Vehicles | 14 (6.3%) | 10 (5.0%) |
| 5 or more Vehicles | 30 (13.5%) | 12 (6.0%) |
| Total | 223 (100.0%) | 199 (100.0%) |
Commute Time in Shipshewana
The most frequently occuring commute durations in Shipshewana are 5 to 9 minutes (88 commuters, 21.1%), 15 to 19 minutes (73 commuters, 17.5%), and 10 to 14 minutes (55 commuters, 13.2%).
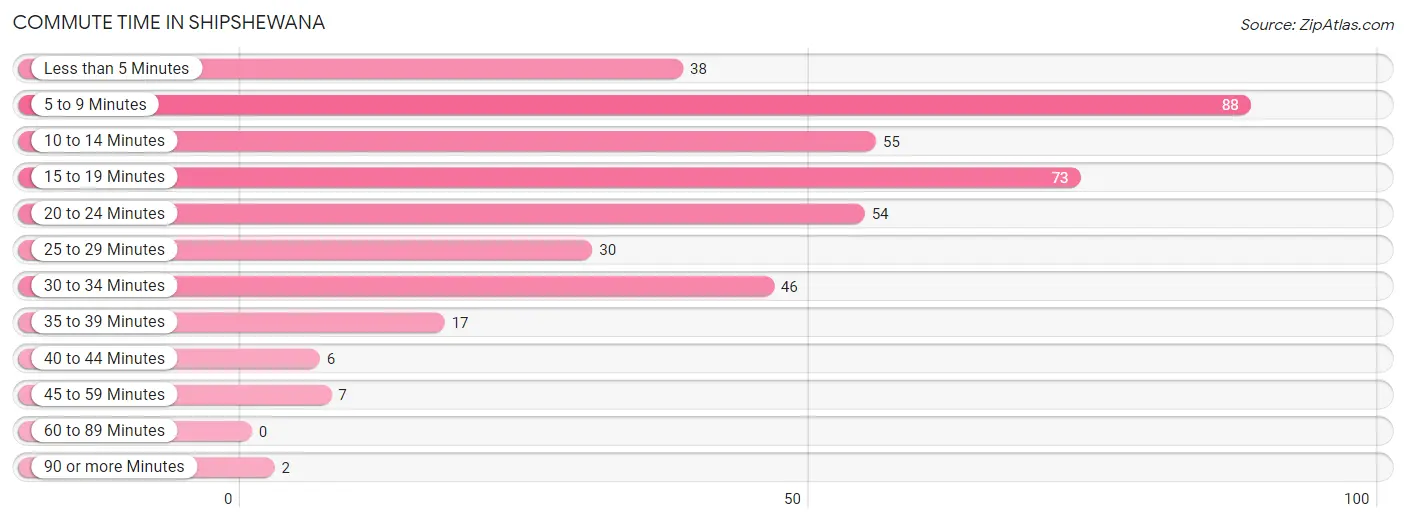
| Commute Time | # Commuters | % Commuters |
| Less than 5 Minutes | 38 | 9.1% |
| 5 to 9 Minutes | 88 | 21.1% |
| 10 to 14 Minutes | 55 | 13.2% |
| 15 to 19 Minutes | 73 | 17.5% |
| 20 to 24 Minutes | 54 | 13.0% |
| 25 to 29 Minutes | 30 | 7.2% |
| 30 to 34 Minutes | 46 | 11.1% |
| 35 to 39 Minutes | 17 | 4.1% |
| 40 to 44 Minutes | 6 | 1.4% |
| 45 to 59 Minutes | 7 | 1.7% |
| 60 to 89 Minutes | 0 | 0.0% |
| 90 or more Minutes | 2 | 0.5% |
Commute Time by Sex in Shipshewana
The most common commute times in Shipshewana are 15 to 19 minutes (42 commuters, 19.1%) for males and 5 to 9 minutes (55 commuters, 28.1%) for females.
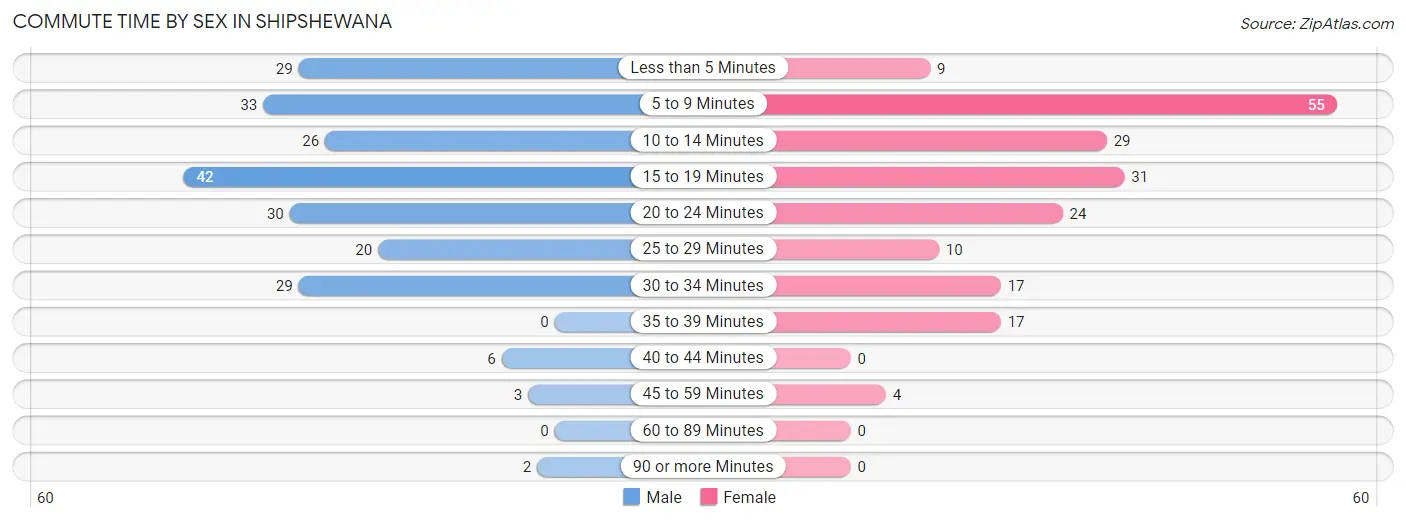
| Commute Time | Male | Female |
| Less than 5 Minutes | 29 (13.2%) | 9 (4.6%) |
| 5 to 9 Minutes | 33 (15.0%) | 55 (28.1%) |
| 10 to 14 Minutes | 26 (11.8%) | 29 (14.8%) |
| 15 to 19 Minutes | 42 (19.1%) | 31 (15.8%) |
| 20 to 24 Minutes | 30 (13.6%) | 24 (12.2%) |
| 25 to 29 Minutes | 20 (9.1%) | 10 (5.1%) |
| 30 to 34 Minutes | 29 (13.2%) | 17 (8.7%) |
| 35 to 39 Minutes | 0 (0.0%) | 17 (8.7%) |
| 40 to 44 Minutes | 6 (2.7%) | 0 (0.0%) |
| 45 to 59 Minutes | 3 (1.4%) | 4 (2.0%) |
| 60 to 89 Minutes | 0 (0.0%) | 0 (0.0%) |
| 90 or more Minutes | 2 (0.9%) | 0 (0.0%) |
Time of Departure to Work by Sex in Shipshewana
The most frequent times of departure to work in Shipshewana are 12:00 AM to 4:59 AM (73, 33.2%) for males and 6:30 AM to 6:59 AM (40, 20.4%) for females.
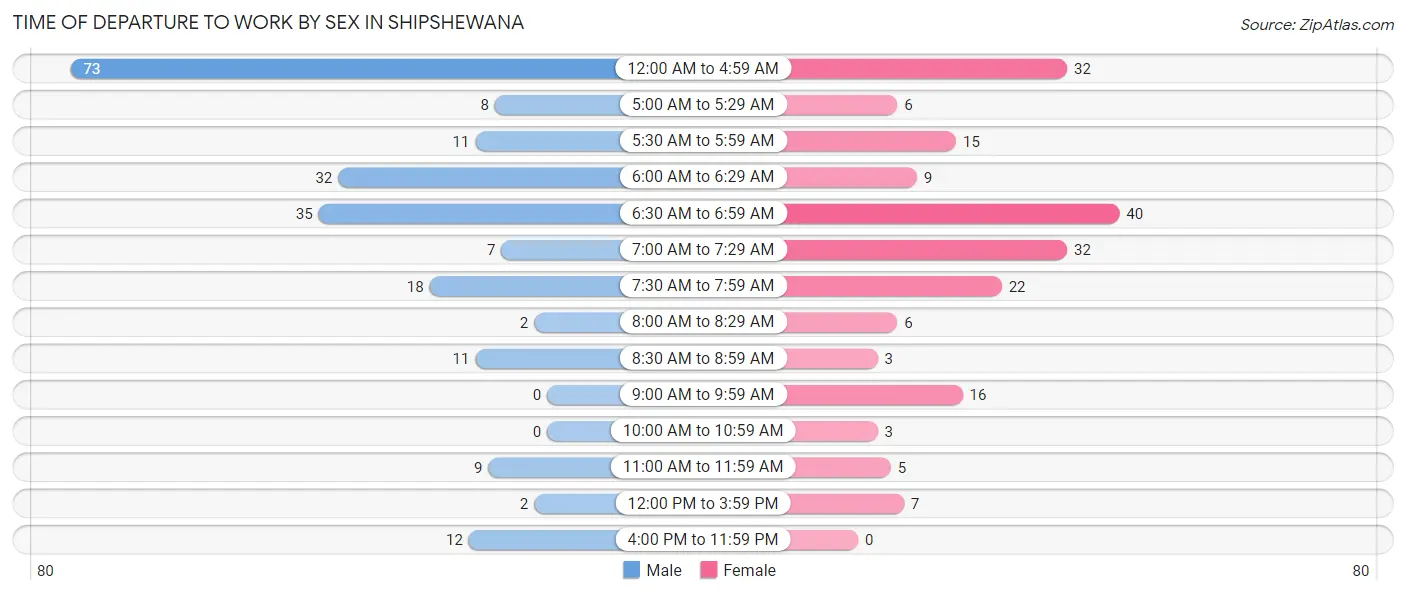
| Time of Departure | Male | Female |
| 12:00 AM to 4:59 AM | 73 (33.2%) | 32 (16.3%) |
| 5:00 AM to 5:29 AM | 8 (3.6%) | 6 (3.1%) |
| 5:30 AM to 5:59 AM | 11 (5.0%) | 15 (7.6%) |
| 6:00 AM to 6:29 AM | 32 (14.5%) | 9 (4.6%) |
| 6:30 AM to 6:59 AM | 35 (15.9%) | 40 (20.4%) |
| 7:00 AM to 7:29 AM | 7 (3.2%) | 32 (16.3%) |
| 7:30 AM to 7:59 AM | 18 (8.2%) | 22 (11.2%) |
| 8:00 AM to 8:29 AM | 2 (0.9%) | 6 (3.1%) |
| 8:30 AM to 8:59 AM | 11 (5.0%) | 3 (1.5%) |
| 9:00 AM to 9:59 AM | 0 (0.0%) | 16 (8.2%) |
| 10:00 AM to 10:59 AM | 0 (0.0%) | 3 (1.5%) |
| 11:00 AM to 11:59 AM | 9 (4.1%) | 5 (2.5%) |
| 12:00 PM to 3:59 PM | 2 (0.9%) | 7 (3.6%) |
| 4:00 PM to 11:59 PM | 12 (5.4%) | 0 (0.0%) |
| Total | 220 (100.0%) | 196 (100.0%) |
Housing Occupancy in Shipshewana
Occupancy by Ownership in Shipshewana
Of the total 378 dwellings in Shipshewana, owner-occupied units account for 228 (60.3%), while renter-occupied units make up 150 (39.7%).
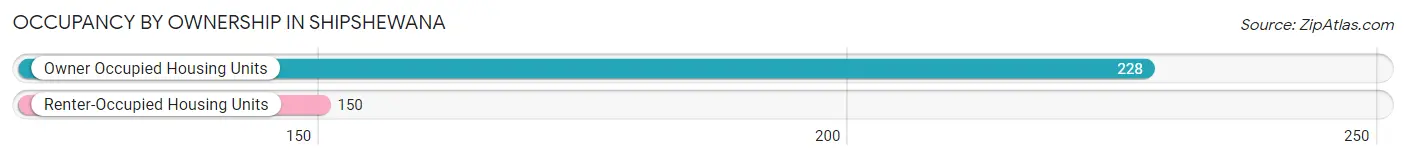
| Occupancy | # Housing Units | % Housing Units |
| Owner Occupied Housing Units | 228 | 60.3% |
| Renter-Occupied Housing Units | 150 | 39.7% |
| Total Occupied Housing Units | 378 | 100.0% |
Occupancy by Household Size in Shipshewana
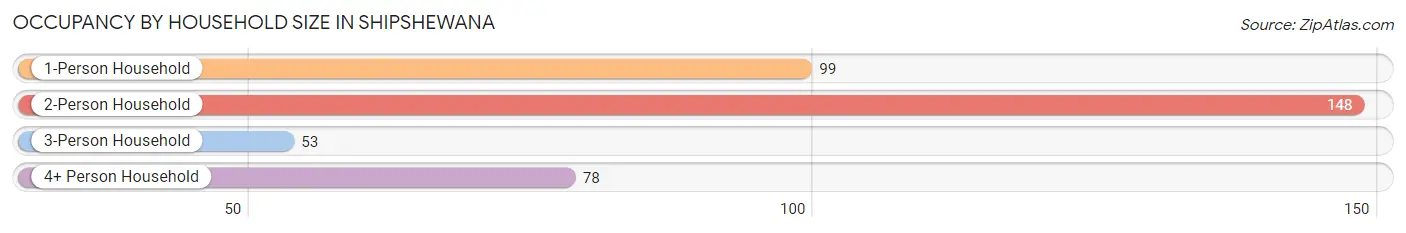
| Household Size | # Housing Units | % Housing Units |
| 1-Person Household | 99 | 26.2% |
| 2-Person Household | 148 | 39.2% |
| 3-Person Household | 53 | 14.0% |
| 4+ Person Household | 78 | 20.6% |
| Total Housing Units | 378 | 100.0% |
Occupancy by Ownership by Household Size in Shipshewana
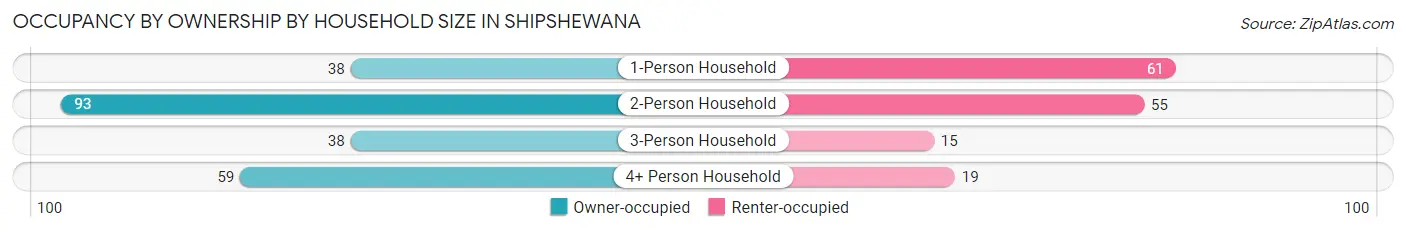
| Household Size | Owner-occupied | Renter-occupied |
| 1-Person Household | 38 (38.4%) | 61 (61.6%) |
| 2-Person Household | 93 (62.8%) | 55 (37.2%) |
| 3-Person Household | 38 (71.7%) | 15 (28.3%) |
| 4+ Person Household | 59 (75.6%) | 19 (24.4%) |
| Total Housing Units | 228 (60.3%) | 150 (39.7%) |
Occupancy by Educational Attainment in Shipshewana
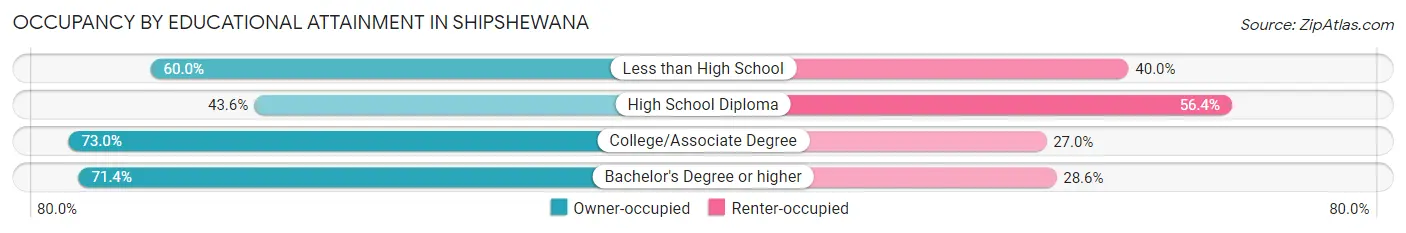
| Household Size | Owner-occupied | Renter-occupied |
| Less than High School | 39 (60.0%) | 26 (40.0%) |
| High School Diploma | 58 (43.6%) | 75 (56.4%) |
| College/Associate Degree | 111 (73.0%) | 41 (27.0%) |
| Bachelor's Degree or higher | 20 (71.4%) | 8 (28.6%) |
Occupancy by Age of Householder in Shipshewana
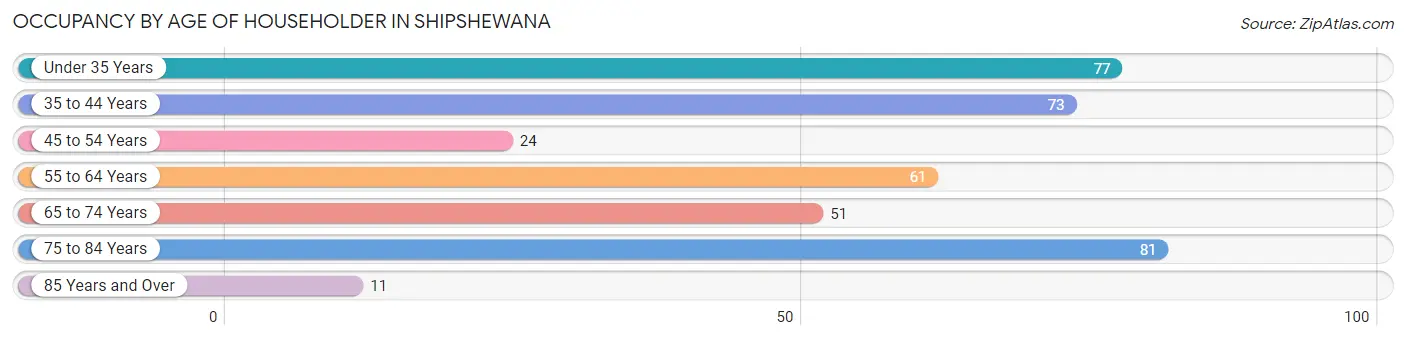
| Age Bracket | # Households | % Households |
| Under 35 Years | 77 | 20.4% |
| 35 to 44 Years | 73 | 19.3% |
| 45 to 54 Years | 24 | 6.4% |
| 55 to 64 Years | 61 | 16.1% |
| 65 to 74 Years | 51 | 13.5% |
| 75 to 84 Years | 81 | 21.4% |
| 85 Years and Over | 11 | 2.9% |
| Total | 378 | 100.0% |
Housing Finances in Shipshewana
Median Income by Occupancy in Shipshewana
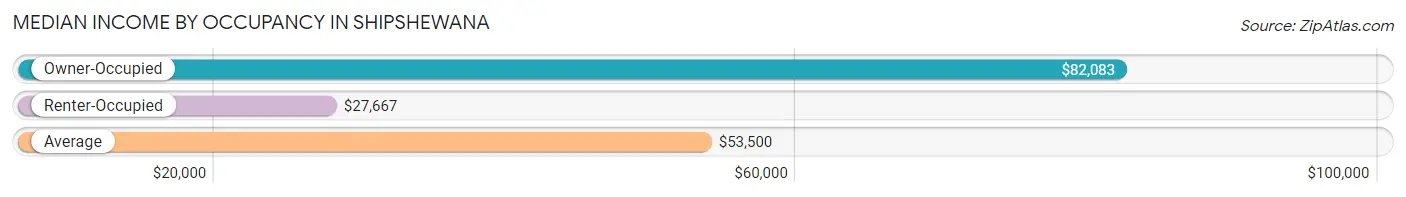
| Occupancy Type | # Households | Median Income |
| Owner-Occupied | 228 (60.3%) | $82,083 |
| Renter-Occupied | 150 (39.7%) | $27,667 |
| Average | 378 (100.0%) | $53,500 |
Occupancy by Householder Income Bracket in Shipshewana
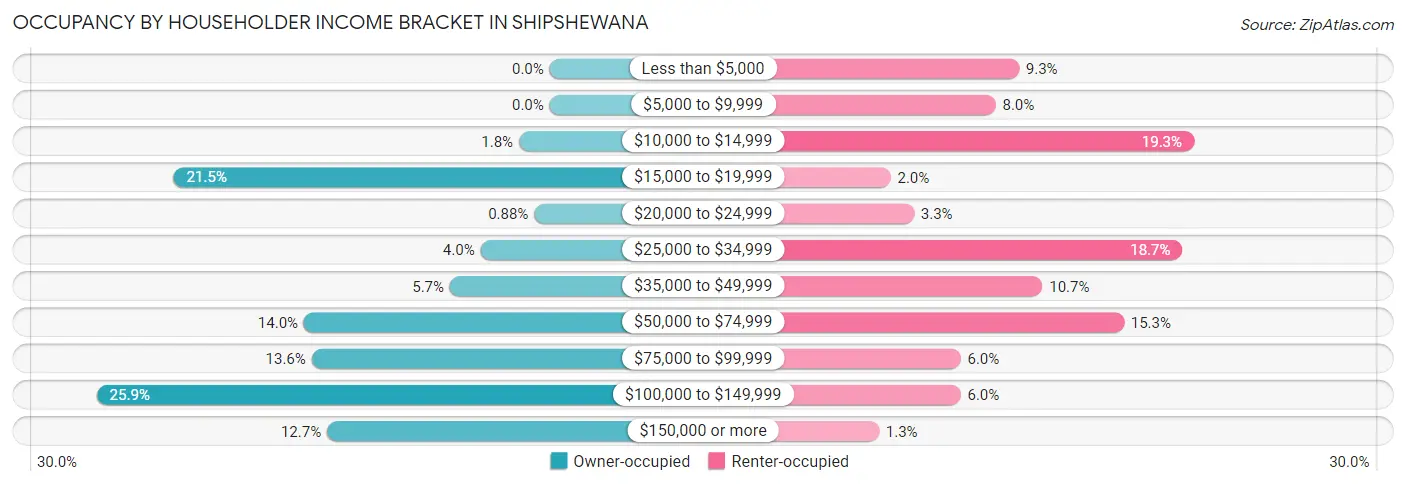
| Income Bracket | Owner-occupied | Renter-occupied |
| Less than $5,000 | 0 (0.0%) | 14 (9.3%) |
| $5,000 to $9,999 | 0 (0.0%) | 12 (8.0%) |
| $10,000 to $14,999 | 4 (1.8%) | 29 (19.3%) |
| $15,000 to $19,999 | 49 (21.5%) | 3 (2.0%) |
| $20,000 to $24,999 | 2 (0.9%) | 5 (3.3%) |
| $25,000 to $34,999 | 9 (4.0%) | 28 (18.7%) |
| $35,000 to $49,999 | 13 (5.7%) | 16 (10.7%) |
| $50,000 to $74,999 | 32 (14.0%) | 23 (15.3%) |
| $75,000 to $99,999 | 31 (13.6%) | 9 (6.0%) |
| $100,000 to $149,999 | 59 (25.9%) | 9 (6.0%) |
| $150,000 or more | 29 (12.7%) | 2 (1.3%) |
| Total | 228 (100.0%) | 150 (100.0%) |
Monthly Housing Cost Tiers in Shipshewana
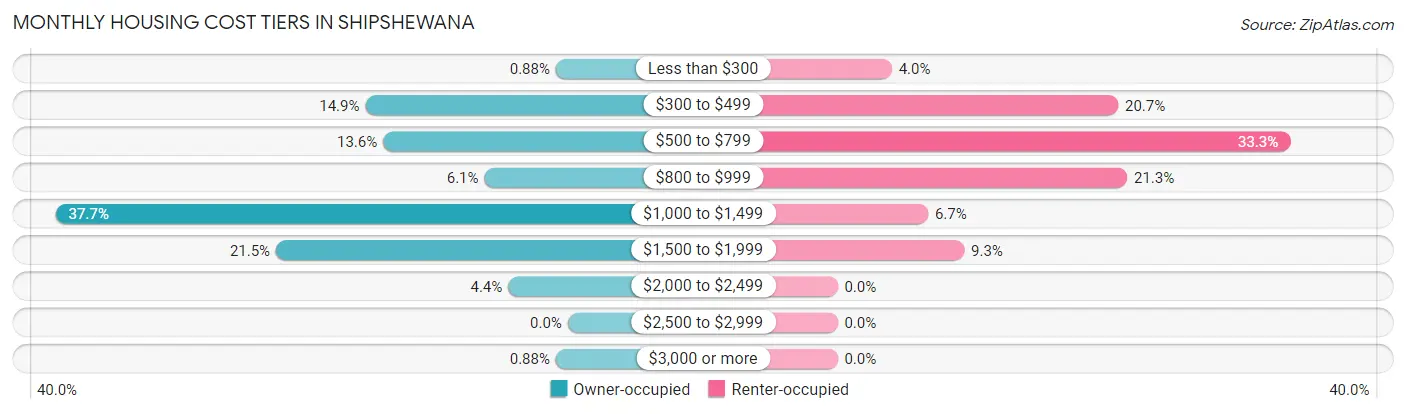
| Monthly Cost | Owner-occupied | Renter-occupied |
| Less than $300 | 2 (0.9%) | 6 (4.0%) |
| $300 to $499 | 34 (14.9%) | 31 (20.7%) |
| $500 to $799 | 31 (13.6%) | 50 (33.3%) |
| $800 to $999 | 14 (6.1%) | 32 (21.3%) |
| $1,000 to $1,499 | 86 (37.7%) | 10 (6.7%) |
| $1,500 to $1,999 | 49 (21.5%) | 14 (9.3%) |
| $2,000 to $2,499 | 10 (4.4%) | 0 (0.0%) |
| $2,500 to $2,999 | 0 (0.0%) | 0 (0.0%) |
| $3,000 or more | 2 (0.9%) | 0 (0.0%) |
| Total | 228 (100.0%) | 150 (100.0%) |
Physical Housing Characteristics in Shipshewana
Housing Structures in Shipshewana
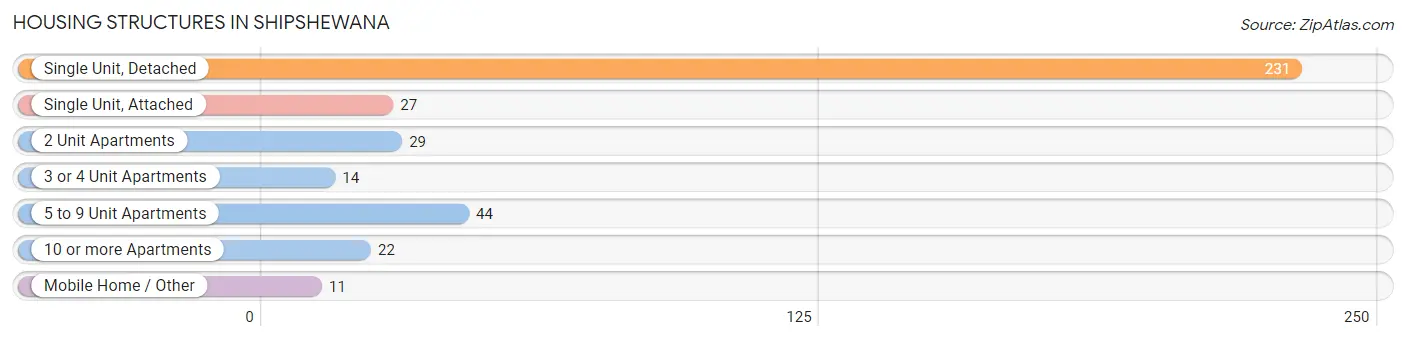
| Structure Type | # Housing Units | % Housing Units |
| Single Unit, Detached | 231 | 61.1% |
| Single Unit, Attached | 27 | 7.1% |
| 2 Unit Apartments | 29 | 7.7% |
| 3 or 4 Unit Apartments | 14 | 3.7% |
| 5 to 9 Unit Apartments | 44 | 11.6% |
| 10 or more Apartments | 22 | 5.8% |
| Mobile Home / Other | 11 | 2.9% |
| Total | 378 | 100.0% |
Housing Structures by Occupancy in Shipshewana
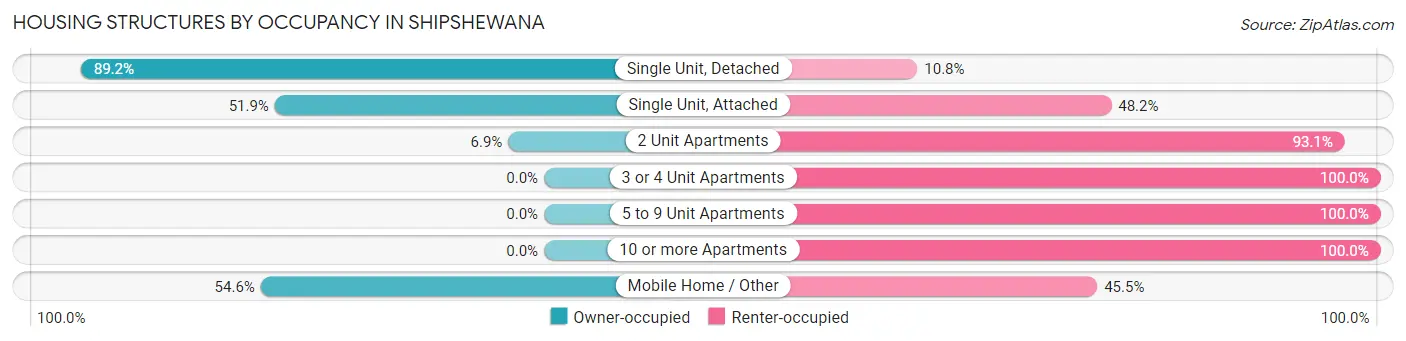
| Structure Type | Owner-occupied | Renter-occupied |
| Single Unit, Detached | 206 (89.2%) | 25 (10.8%) |
| Single Unit, Attached | 14 (51.8%) | 13 (48.1%) |
| 2 Unit Apartments | 2 (6.9%) | 27 (93.1%) |
| 3 or 4 Unit Apartments | 0 (0.0%) | 14 (100.0%) |
| 5 to 9 Unit Apartments | 0 (0.0%) | 44 (100.0%) |
| 10 or more Apartments | 0 (0.0%) | 22 (100.0%) |
| Mobile Home / Other | 6 (54.5%) | 5 (45.5%) |
| Total | 228 (60.3%) | 150 (39.7%) |
Housing Structures by Number of Rooms in Shipshewana
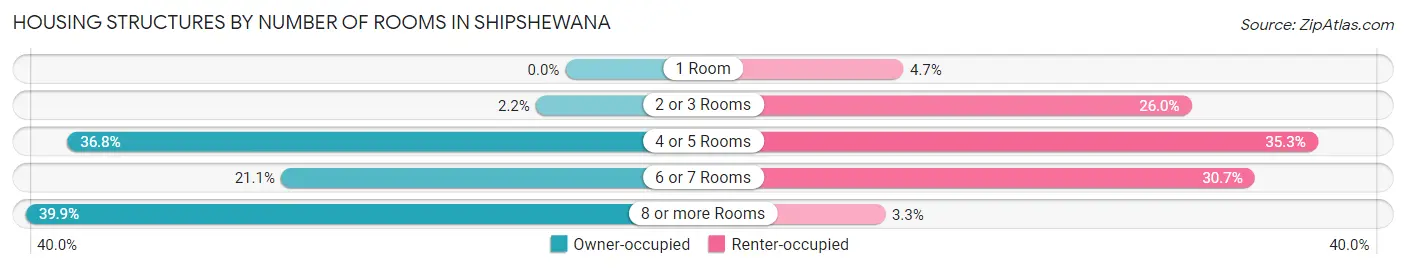
| Number of Rooms | Owner-occupied | Renter-occupied |
| 1 Room | 0 (0.0%) | 7 (4.7%) |
| 2 or 3 Rooms | 5 (2.2%) | 39 (26.0%) |
| 4 or 5 Rooms | 84 (36.8%) | 53 (35.3%) |
| 6 or 7 Rooms | 48 (21.0%) | 46 (30.7%) |
| 8 or more Rooms | 91 (39.9%) | 5 (3.3%) |
| Total | 228 (100.0%) | 150 (100.0%) |
Housing Structure by Heating Type in Shipshewana
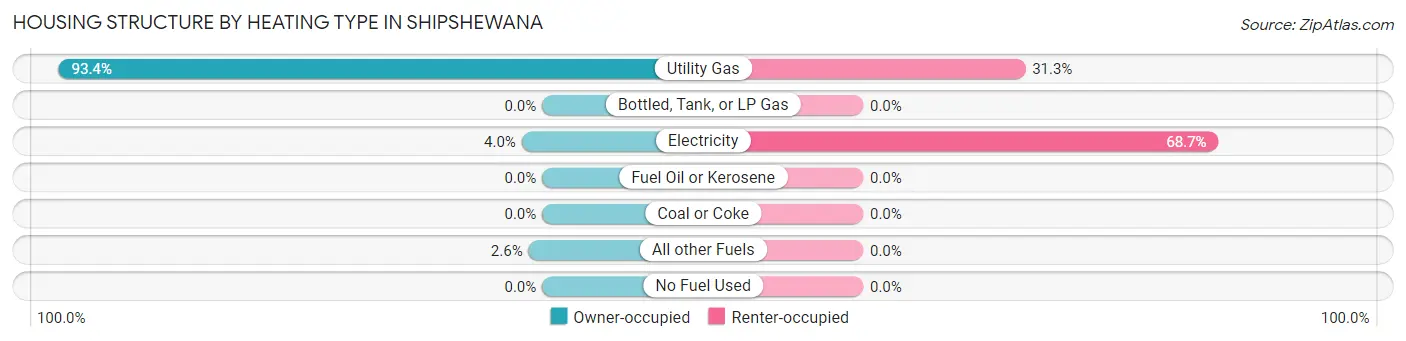
| Heating Type | Owner-occupied | Renter-occupied |
| Utility Gas | 213 (93.4%) | 47 (31.3%) |
| Bottled, Tank, or LP Gas | 0 (0.0%) | 0 (0.0%) |
| Electricity | 9 (4.0%) | 103 (68.7%) |
| Fuel Oil or Kerosene | 0 (0.0%) | 0 (0.0%) |
| Coal or Coke | 0 (0.0%) | 0 (0.0%) |
| All other Fuels | 6 (2.6%) | 0 (0.0%) |
| No Fuel Used | 0 (0.0%) | 0 (0.0%) |
| Total | 228 (100.0%) | 150 (100.0%) |
Household Vehicle Usage in Shipshewana
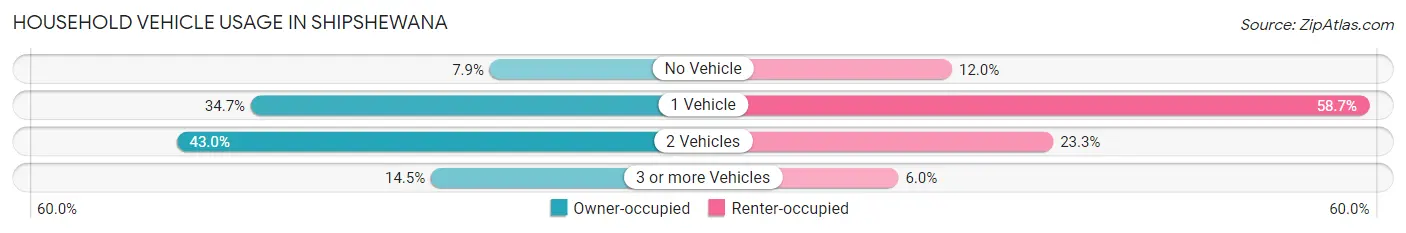
| Vehicles per Household | Owner-occupied | Renter-occupied |
| No Vehicle | 18 (7.9%) | 18 (12.0%) |
| 1 Vehicle | 79 (34.6%) | 88 (58.7%) |
| 2 Vehicles | 98 (43.0%) | 35 (23.3%) |
| 3 or more Vehicles | 33 (14.5%) | 9 (6.0%) |
| Total | 228 (100.0%) | 150 (100.0%) |
Real Estate & Mortgages in Shipshewana
Real Estate and Mortgage Overview in Shipshewana
| Characteristic | Without Mortgage | With Mortgage |
| Housing Units | 68 | 160 |
| Median Property Value | $209,100 | $223,800 |
| Median Household Income | $71,250 | $18 |
| Monthly Housing Costs | $488 | $2 |
| Real Estate Taxes | $1,667 | $0 |
Property Value by Mortgage Status in Shipshewana
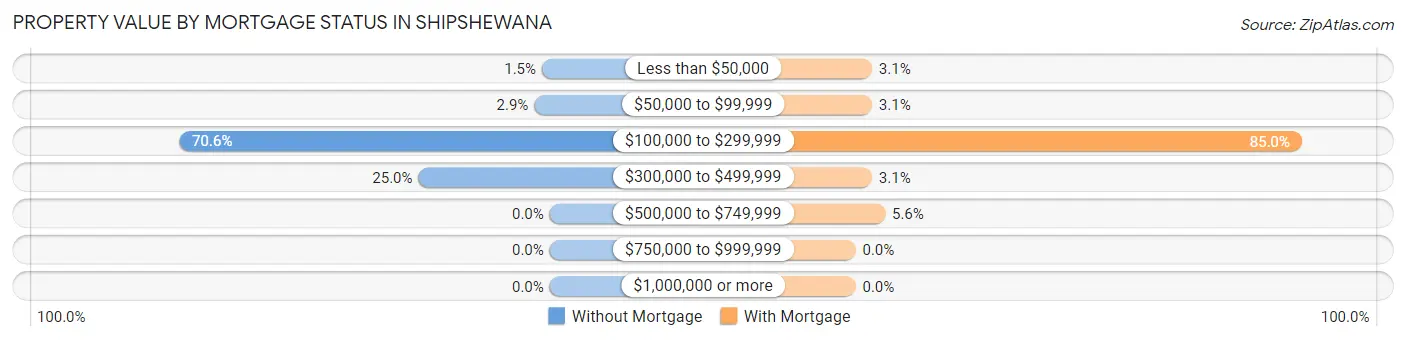
| Property Value | Without Mortgage | With Mortgage |
| Less than $50,000 | 1 (1.5%) | 5 (3.1%) |
| $50,000 to $99,999 | 2 (2.9%) | 5 (3.1%) |
| $100,000 to $299,999 | 48 (70.6%) | 136 (85.0%) |
| $300,000 to $499,999 | 17 (25.0%) | 5 (3.1%) |
| $500,000 to $749,999 | 0 (0.0%) | 9 (5.6%) |
| $750,000 to $999,999 | 0 (0.0%) | 0 (0.0%) |
| $1,000,000 or more | 0 (0.0%) | 0 (0.0%) |
| Total | 68 (100.0%) | 160 (100.0%) |
Household Income by Mortgage Status in Shipshewana
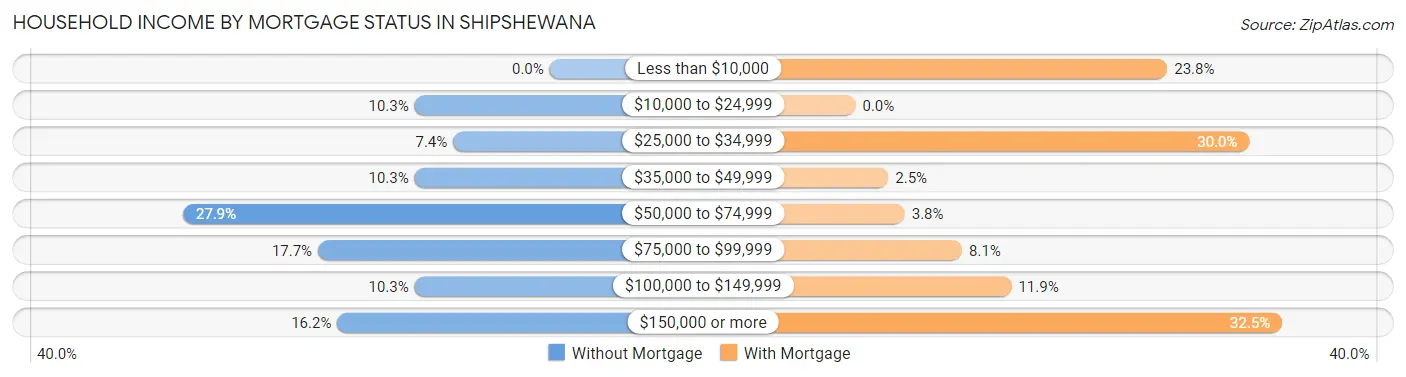
| Household Income | Without Mortgage | With Mortgage |
| Less than $10,000 | 0 (0.0%) | 38 (23.7%) |
| $10,000 to $24,999 | 7 (10.3%) | 0 (0.0%) |
| $25,000 to $34,999 | 5 (7.3%) | 48 (30.0%) |
| $35,000 to $49,999 | 7 (10.3%) | 4 (2.5%) |
| $50,000 to $74,999 | 19 (27.9%) | 6 (3.7%) |
| $75,000 to $99,999 | 12 (17.6%) | 13 (8.1%) |
| $100,000 to $149,999 | 7 (10.3%) | 19 (11.9%) |
| $150,000 or more | 11 (16.2%) | 52 (32.5%) |
| Total | 68 (100.0%) | 160 (100.0%) |
Property Value to Household Income Ratio in Shipshewana
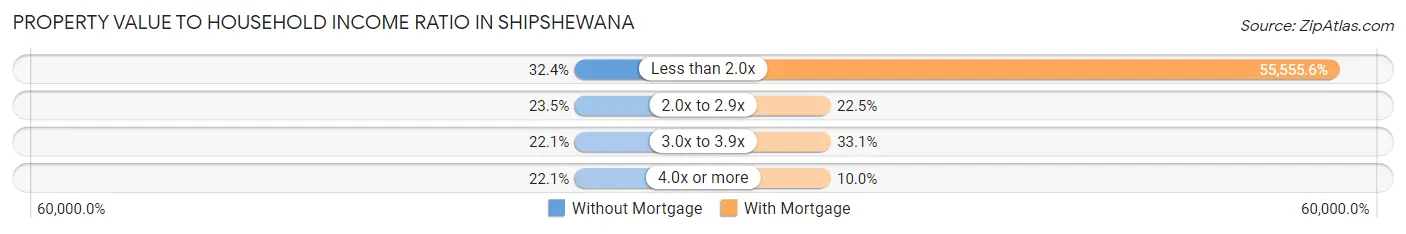
| Value-to-Income Ratio | Without Mortgage | With Mortgage |
| Less than 2.0x | 22 (32.4%) | 88,889 (55,555.6%) |
| 2.0x to 2.9x | 16 (23.5%) | 36 (22.5%) |
| 3.0x to 3.9x | 15 (22.1%) | 53 (33.1%) |
| 4.0x or more | 15 (22.1%) | 16 (10.0%) |
| Total | 68 (100.0%) | 160 (100.0%) |
Real Estate Taxes by Mortgage Status in Shipshewana
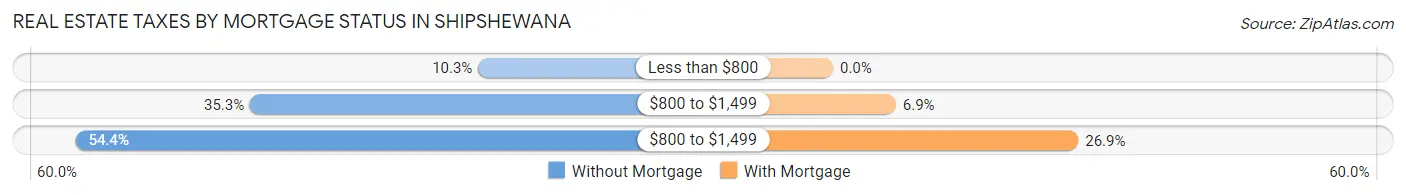
| Property Taxes | Without Mortgage | With Mortgage |
| Less than $800 | 7 (10.3%) | 0 (0.0%) |
| $800 to $1,499 | 24 (35.3%) | 11 (6.9%) |
| $800 to $1,499 | 37 (54.4%) | 43 (26.9%) |
| Total | 68 (100.0%) | 160 (100.0%) |
Health & Disability in Shipshewana
Health Insurance Coverage by Age in Shipshewana
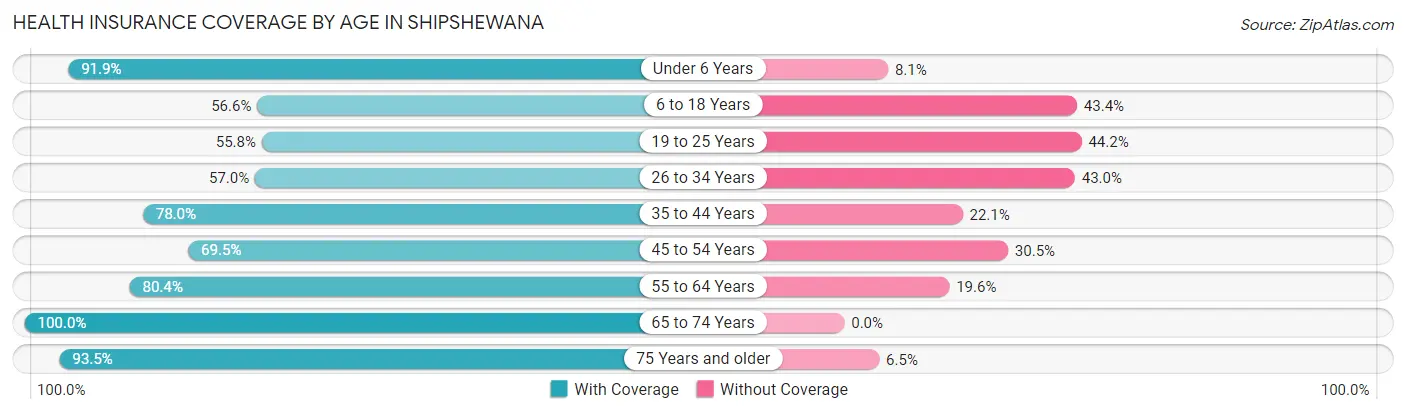
| Age Bracket | With Coverage | Without Coverage |
| Under 6 Years | 79 (91.9%) | 7 (8.1%) |
| 6 to 18 Years | 77 (56.6%) | 59 (43.4%) |
| 19 to 25 Years | 29 (55.8%) | 23 (44.2%) |
| 26 to 34 Years | 69 (57.0%) | 52 (43.0%) |
| 35 to 44 Years | 99 (77.9%) | 28 (22.1%) |
| 45 to 54 Years | 41 (69.5%) | 18 (30.5%) |
| 55 to 64 Years | 74 (80.4%) | 18 (19.6%) |
| 65 to 74 Years | 77 (100.0%) | 0 (0.0%) |
| 75 Years and older | 115 (93.5%) | 8 (6.5%) |
| Total | 660 (75.6%) | 213 (24.4%) |
Health Insurance Coverage by Citizenship Status in Shipshewana
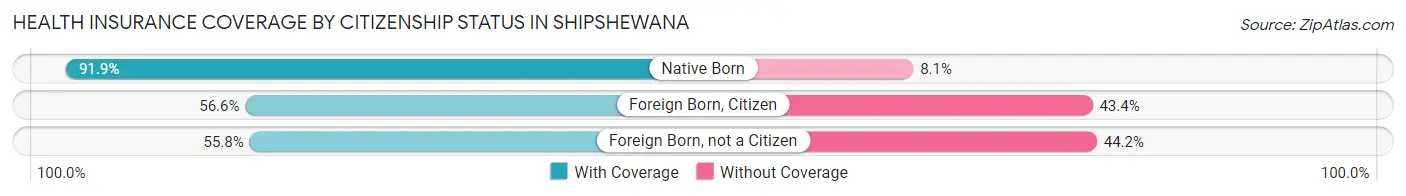
| Citizenship Status | With Coverage | Without Coverage |
| Native Born | 79 (91.9%) | 7 (8.1%) |
| Foreign Born, Citizen | 77 (56.6%) | 59 (43.4%) |
| Foreign Born, not a Citizen | 29 (55.8%) | 23 (44.2%) |
Health Insurance Coverage by Household Income in Shipshewana
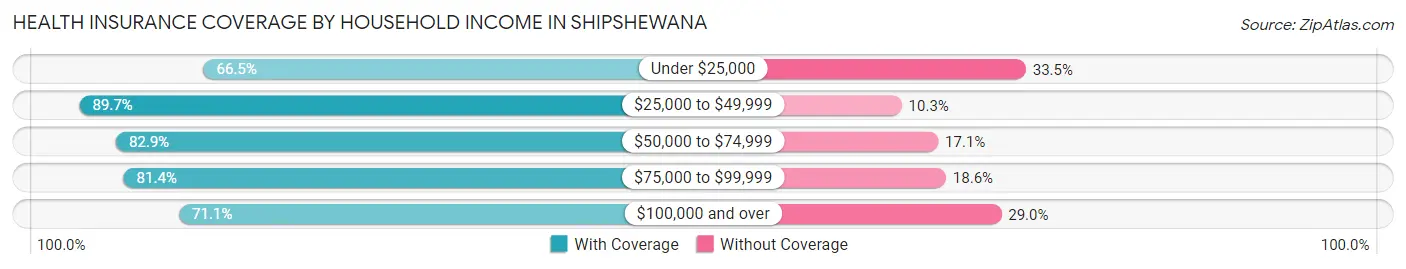
| Household Income | With Coverage | Without Coverage |
| Under $25,000 | 115 (66.5%) | 58 (33.5%) |
| $25,000 to $49,999 | 96 (89.7%) | 11 (10.3%) |
| $50,000 to $74,999 | 92 (82.9%) | 19 (17.1%) |
| $75,000 to $99,999 | 114 (81.4%) | 26 (18.6%) |
| $100,000 and over | 243 (71.1%) | 99 (28.9%) |
Public vs Private Health Insurance Coverage by Age in Shipshewana
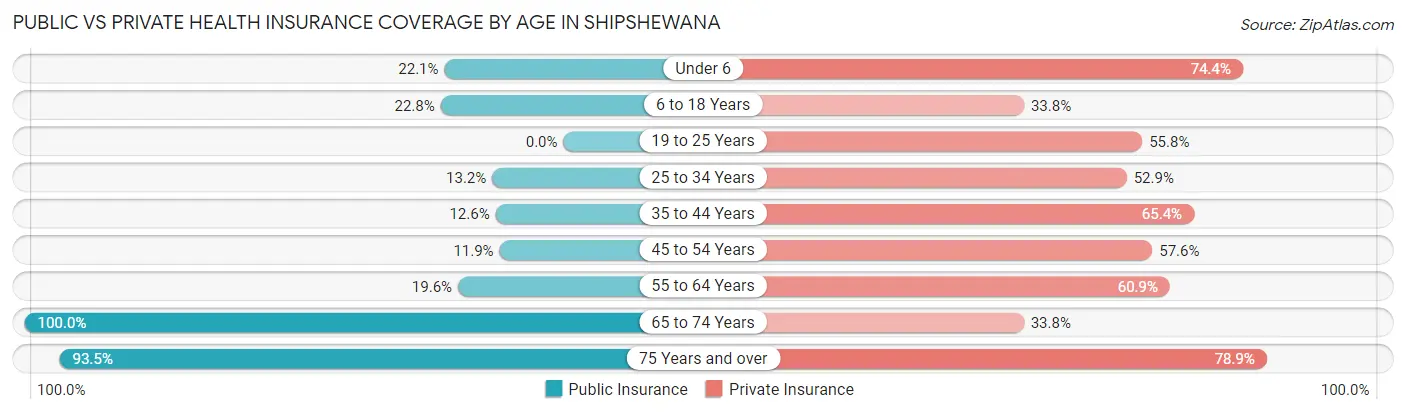
| Age Bracket | Public Insurance | Private Insurance |
| Under 6 | 19 (22.1%) | 64 (74.4%) |
| 6 to 18 Years | 31 (22.8%) | 46 (33.8%) |
| 19 to 25 Years | 0 (0.0%) | 29 (55.8%) |
| 25 to 34 Years | 16 (13.2%) | 64 (52.9%) |
| 35 to 44 Years | 16 (12.6%) | 83 (65.3%) |
| 45 to 54 Years | 7 (11.9%) | 34 (57.6%) |
| 55 to 64 Years | 18 (19.6%) | 56 (60.9%) |
| 65 to 74 Years | 77 (100.0%) | 26 (33.8%) |
| 75 Years and over | 115 (93.5%) | 97 (78.9%) |
| Total | 299 (34.3%) | 499 (57.2%) |
Disability Status by Sex by Age in Shipshewana
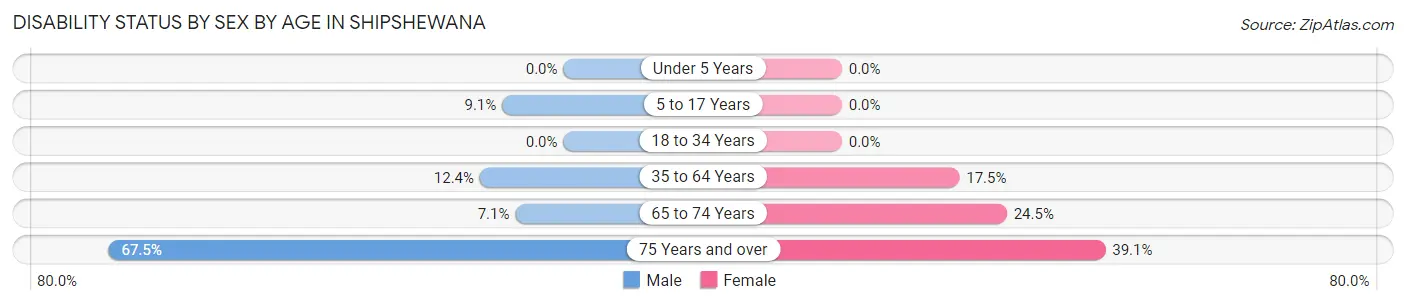
| Age Bracket | Male | Female |
| Under 5 Years | 0 (0.0%) | 0 (0.0%) |
| 5 to 17 Years | 6 (9.1%) | 0 (0.0%) |
| 18 to 34 Years | 0 (0.0%) | 0 (0.0%) |
| 35 to 64 Years | 16 (12.4%) | 26 (17.4%) |
| 65 to 74 Years | 2 (7.1%) | 12 (24.5%) |
| 75 Years and over | 52 (67.5%) | 18 (39.1%) |
Disability Class by Sex by Age in Shipshewana
Disability Class: Hearing Difficulty
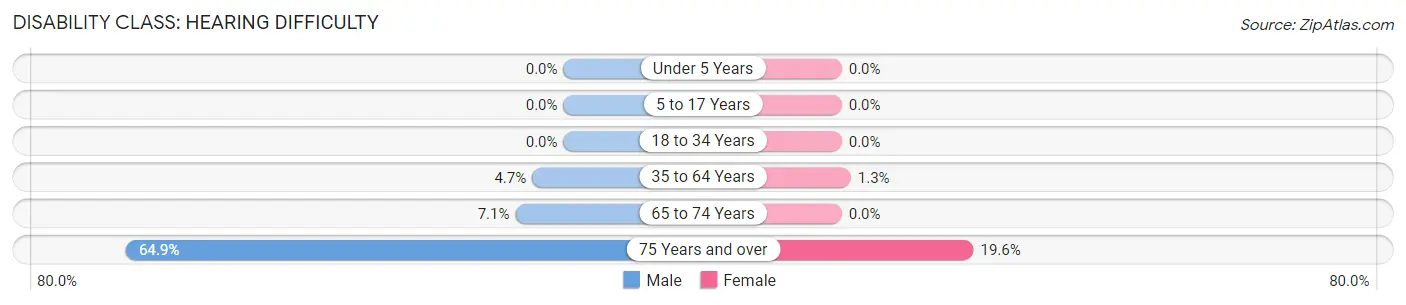
| Age Bracket | Male | Female |
| Under 5 Years | 0 (0.0%) | 0 (0.0%) |
| 5 to 17 Years | 0 (0.0%) | 0 (0.0%) |
| 18 to 34 Years | 0 (0.0%) | 0 (0.0%) |
| 35 to 64 Years | 6 (4.6%) | 2 (1.3%) |
| 65 to 74 Years | 2 (7.1%) | 0 (0.0%) |
| 75 Years and over | 50 (64.9%) | 9 (19.6%) |
Disability Class: Vision Difficulty
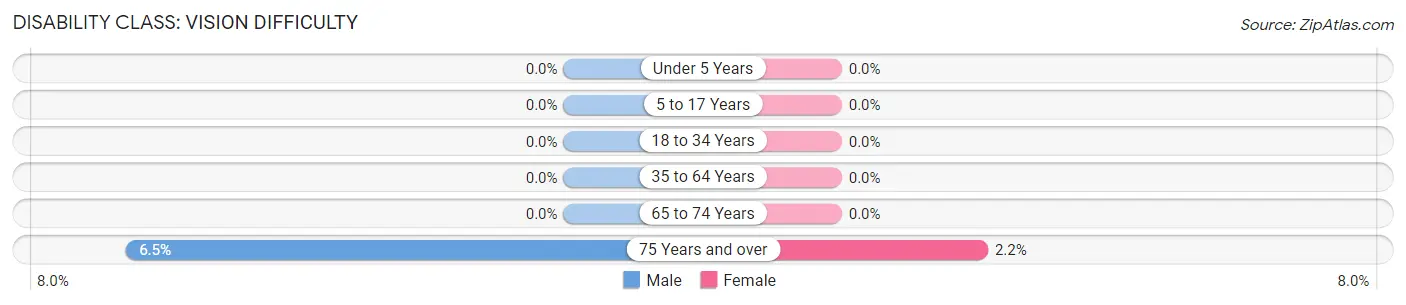
| Age Bracket | Male | Female |
| Under 5 Years | 0 (0.0%) | 0 (0.0%) |
| 5 to 17 Years | 0 (0.0%) | 0 (0.0%) |
| 18 to 34 Years | 0 (0.0%) | 0 (0.0%) |
| 35 to 64 Years | 0 (0.0%) | 0 (0.0%) |
| 65 to 74 Years | 0 (0.0%) | 0 (0.0%) |
| 75 Years and over | 5 (6.5%) | 1 (2.2%) |
Disability Class: Cognitive Difficulty
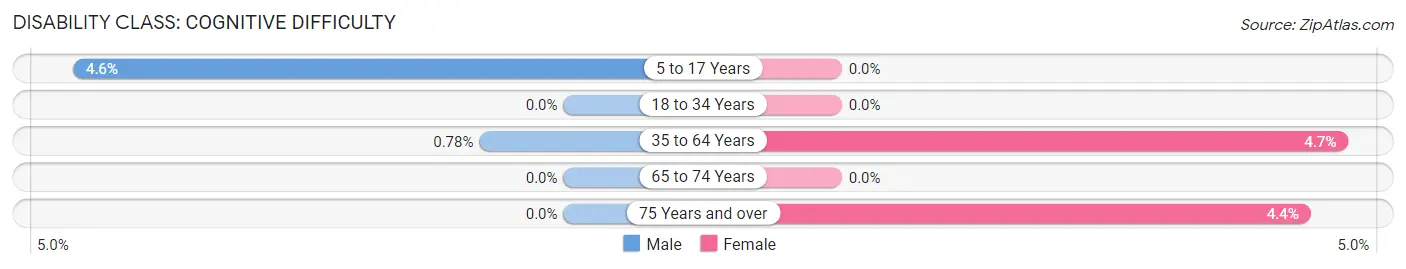
| Age Bracket | Male | Female |
| 5 to 17 Years | 3 (4.5%) | 0 (0.0%) |
| 18 to 34 Years | 0 (0.0%) | 0 (0.0%) |
| 35 to 64 Years | 1 (0.8%) | 7 (4.7%) |
| 65 to 74 Years | 0 (0.0%) | 0 (0.0%) |
| 75 Years and over | 0 (0.0%) | 2 (4.3%) |
Disability Class: Ambulatory Difficulty
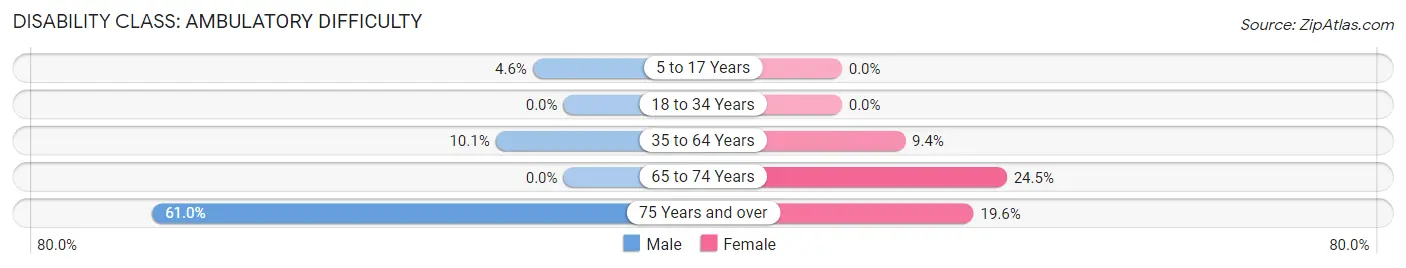
| Age Bracket | Male | Female |
| 5 to 17 Years | 3 (4.5%) | 0 (0.0%) |
| 18 to 34 Years | 0 (0.0%) | 0 (0.0%) |
| 35 to 64 Years | 13 (10.1%) | 14 (9.4%) |
| 65 to 74 Years | 0 (0.0%) | 12 (24.5%) |
| 75 Years and over | 47 (61.0%) | 9 (19.6%) |
Disability Class: Self-Care Difficulty
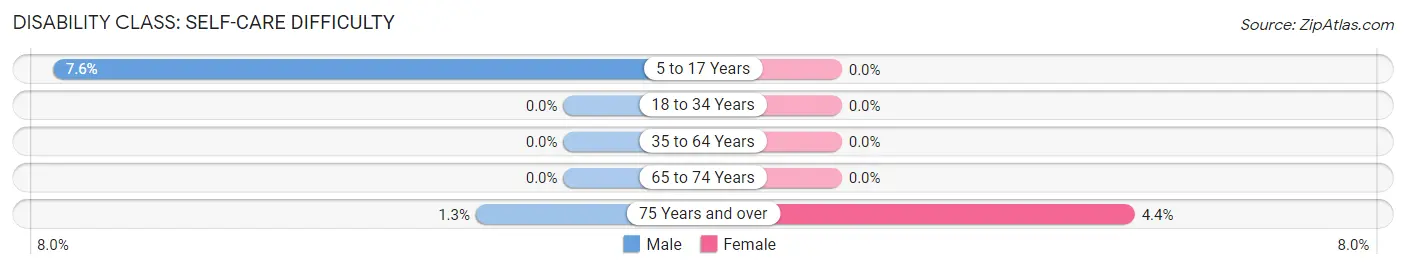
| Age Bracket | Male | Female |
| 5 to 17 Years | 5 (7.6%) | 0 (0.0%) |
| 18 to 34 Years | 0 (0.0%) | 0 (0.0%) |
| 35 to 64 Years | 0 (0.0%) | 0 (0.0%) |
| 65 to 74 Years | 0 (0.0%) | 0 (0.0%) |
| 75 Years and over | 1 (1.3%) | 2 (4.3%) |
Technology Access in Shipshewana
Computing Device Access in Shipshewana
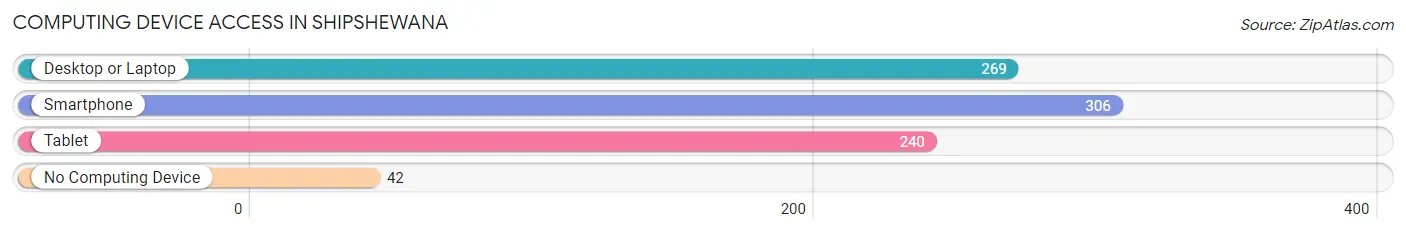
| Device Type | # Households | % Households |
| Desktop or Laptop | 269 | 71.2% |
| Smartphone | 306 | 80.9% |
| Tablet | 240 | 63.5% |
| No Computing Device | 42 | 11.1% |
| Total | 378 | 100.0% |
Internet Access in Shipshewana
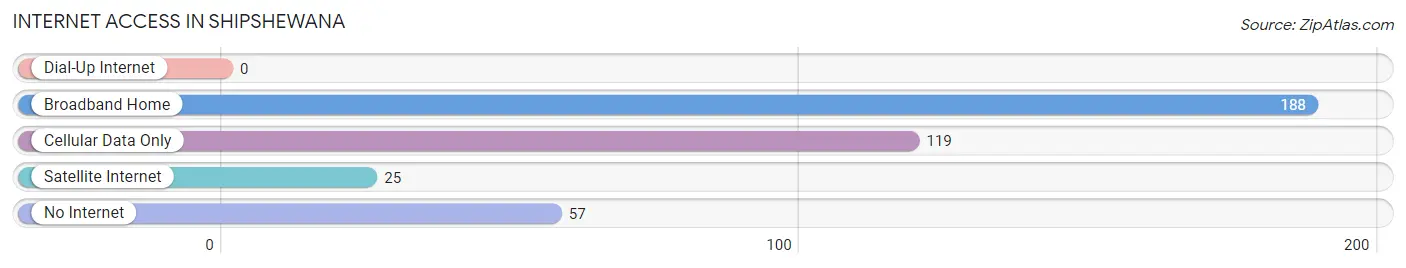
| Internet Type | # Households | % Households |
| Dial-Up Internet | 0 | 0.0% |
| Broadband Home | 188 | 49.7% |
| Cellular Data Only | 119 | 31.5% |
| Satellite Internet | 25 | 6.6% |
| No Internet | 57 | 15.1% |
| Total | 378 | 100.0% |
Shipshewana Summary
Shipshewana, Indiana is a small town located in LaGrange County in the northeastern part of the state. It is situated in the heart of Amish Country and is home to a large Amish population. The town was founded in 1837 and has a population of around 700 people.
History
Shipshewana was founded in 1837 by a group of settlers from Pennsylvania. The town was named after Chief Shipshewana of the Potawatomi tribe, who had granted the settlers permission to settle in the area. The town was originally a trading post for the local Native American tribes and settlers. In 1851, the first post office was established in the town.
In the late 1800s, the town began to attract Amish settlers from Pennsylvania. The Amish community grew steadily and by the early 1900s, Shipshewana had become a major center for Amish culture and commerce. The town is still home to a large Amish population today.
Geography
Shipshewana is located in LaGrange County in the northeastern part of Indiana. It is situated in the heart of Amish Country and is surrounded by farmland. The town is located at the intersection of State Road 5 and State Road 120. The nearest major cities are Fort Wayne, Indiana (50 miles away) and South Bend, Indiana (60 miles away).
The town has a total area of 0.7 square miles, all of which is land. The town is situated at an elevation of 845 feet above sea level. The climate is humid continental, with hot summers and cold winters.
Economy
Shipshewana is a small town with a population of around 700 people. The town is home to a large Amish population and the economy is largely based on agriculture and tourism. The town is known for its large flea market, which attracts thousands of visitors each year.
The town also has a number of small businesses, including restaurants, shops, and lodging. The town is also home to a number of manufacturing companies, including furniture makers, cabinet makers, and woodworkers.
Demographics
As of the 2010 census, the population of Shipshewana was 690 people. The racial makeup of the town was 97.4% White, 0.3% African American, 0.3% Native American, 0.3% Asian, 0.3% from other races, and 1.4% from two or more races. Hispanic or Latino of any race were 1.4% of the population.
The median income for a household in the town was $37,500, and the median income for a family was $41,250. The per capita income for the town was $17,845. About 8.3% of families and 10.3% of the population were below the poverty line, including 11.3% of those under age 18 and 8.3% of those age 65 or over.
Common Questions
What is Per Capita Income in Shipshewana?
Per Capita income in Shipshewana is $37,423.
What is the Median Family Income in Shipshewana?
Median Family Income in Shipshewana is $74,861.
What is the Median Household income in Shipshewana?
Median Household Income in Shipshewana is $53,500.
What is Income or Wage Gap in Shipshewana?
Income or Wage Gap in Shipshewana is 31.8%.
Women in Shipshewana earn 68.2 cents for every dollar earned by a man.
What is Inequality or Gini Index in Shipshewana?
Inequality or Gini Index in Shipshewana is 0.56.
What is the Total Population of Shipshewana?
Total Population of Shipshewana is 873.
What is the Total Male Population of Shipshewana?
Total Male Population of Shipshewana is 424.
What is the Total Female Population of Shipshewana?
Total Female Population of Shipshewana is 449.
What is the Ratio of Males per 100 Females in Shipshewana?
There are 94.43 Males per 100 Females in Shipshewana.
What is the Ratio of Females per 100 Males in Shipshewana?
There are 105.90 Females per 100 Males in Shipshewana.
What is the Median Population Age in Shipshewana?
Median Population Age in Shipshewana is 37.7 Years.
What is the Average Family Size in Shipshewana
Average Family Size in Shipshewana is 2.7 People.
What is the Average Household Size in Shipshewana
Average Household Size in Shipshewana is 2.3 People.
How Large is the Labor Force in Shipshewana?
There are 471 People in the Labor Forcein in Shipshewana.
What is the Percentage of People in the Labor Force in Shipshewana?
68.9% of People are in the Labor Force in Shipshewana.
What is the Unemployment Rate in Shipshewana?
Unemployment Rate in Shipshewana is 7.2%.