New Chicago, IN Map & Demographics
New Chicago Map
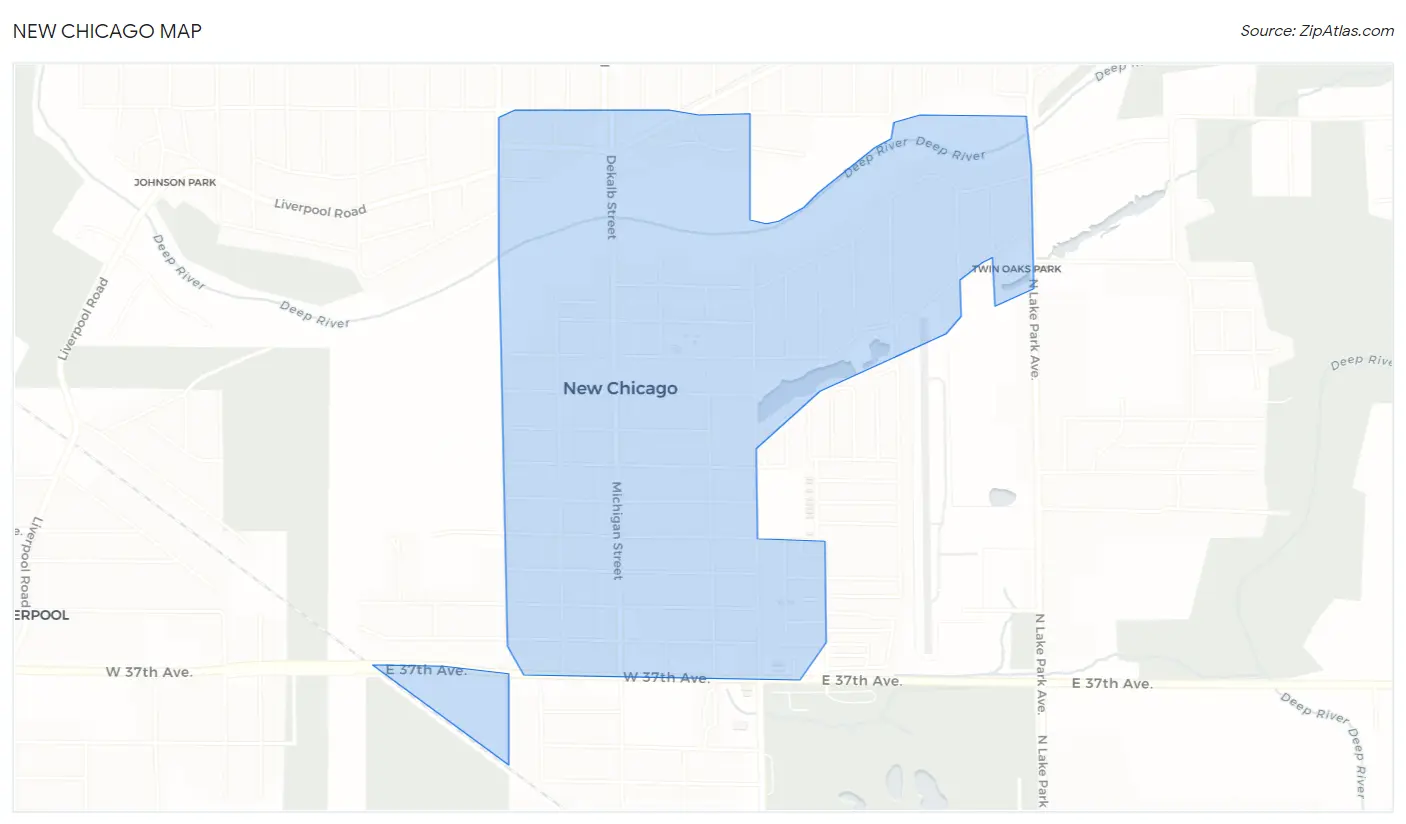
New Chicago Overview
$25,618
PER CAPITA INCOME
$73,750
AVG FAMILY INCOME
$56,761
AVG HOUSEHOLD INCOME
28.3%
WAGE / INCOME GAP [ % ]
71.7¢/ $1
WAGE / INCOME GAP [ $ ]
$8,656
FAMILY INCOME DEFICIT
0.40
INEQUALITY / GINI INDEX
2,111
TOTAL POPULATION
1,041
MALE POPULATION
1,070
FEMALE POPULATION
97.29
MALES / 100 FEMALES
102.79
FEMALES / 100 MALES
31.9
MEDIAN AGE
3.4
AVG FAMILY SIZE
2.8
AVG HOUSEHOLD SIZE
1,048
LABOR FORCE [ PEOPLE ]
65.8%
PERCENT IN LABOR FORCE
9.3%
UNEMPLOYMENT RATE
New Chicago Area Codes
Income in New Chicago
Income Overview in New Chicago
Per Capita Income in New Chicago is $25,618, while median incomes of families and households are $73,750 and $56,761 respectively.
| Characteristic | Number | Measure |
| Per Capita Income | 2,111 | $25,618 |
| Median Family Income | 538 | $73,750 |
| Mean Family Income | 538 | $81,590 |
| Median Household Income | 743 | $56,761 |
| Mean Household Income | 743 | $70,774 |
| Income Deficit | 538 | $8,656 |
| Wage / Income Gap (%) | 2,111 | 28.31% |
| Wage / Income Gap ($) | 2,111 | 71.69¢ per $1 |
| Gini / Inequality Index | 2,111 | 0.40 |
Earnings by Sex in New Chicago
Average Earnings in New Chicago are $32,527, $36,528 for men and $26,188 for women, a difference of 28.3%.
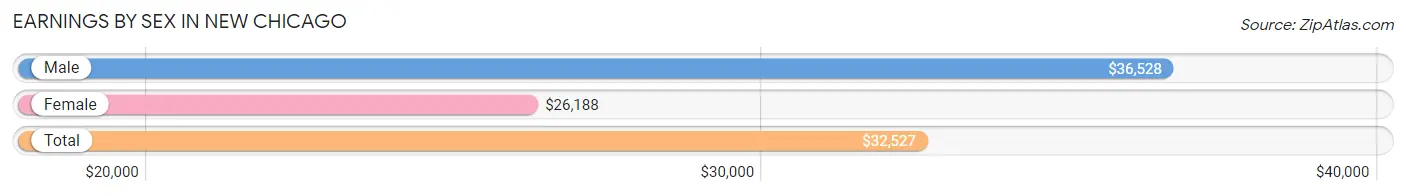
| Sex | Number | Average Earnings |
| Male | 561 (50.7%) | $36,528 |
| Female | 545 (49.3%) | $26,188 |
| Total | 1,106 (100.0%) | $32,527 |
Earnings by Sex by Income Bracket in New Chicago
The most common earnings brackets in New Chicago are $25,000 to $29,999 for men (79 | 14.1%) and $30,000 to $34,999 for women (62 | 11.4%).
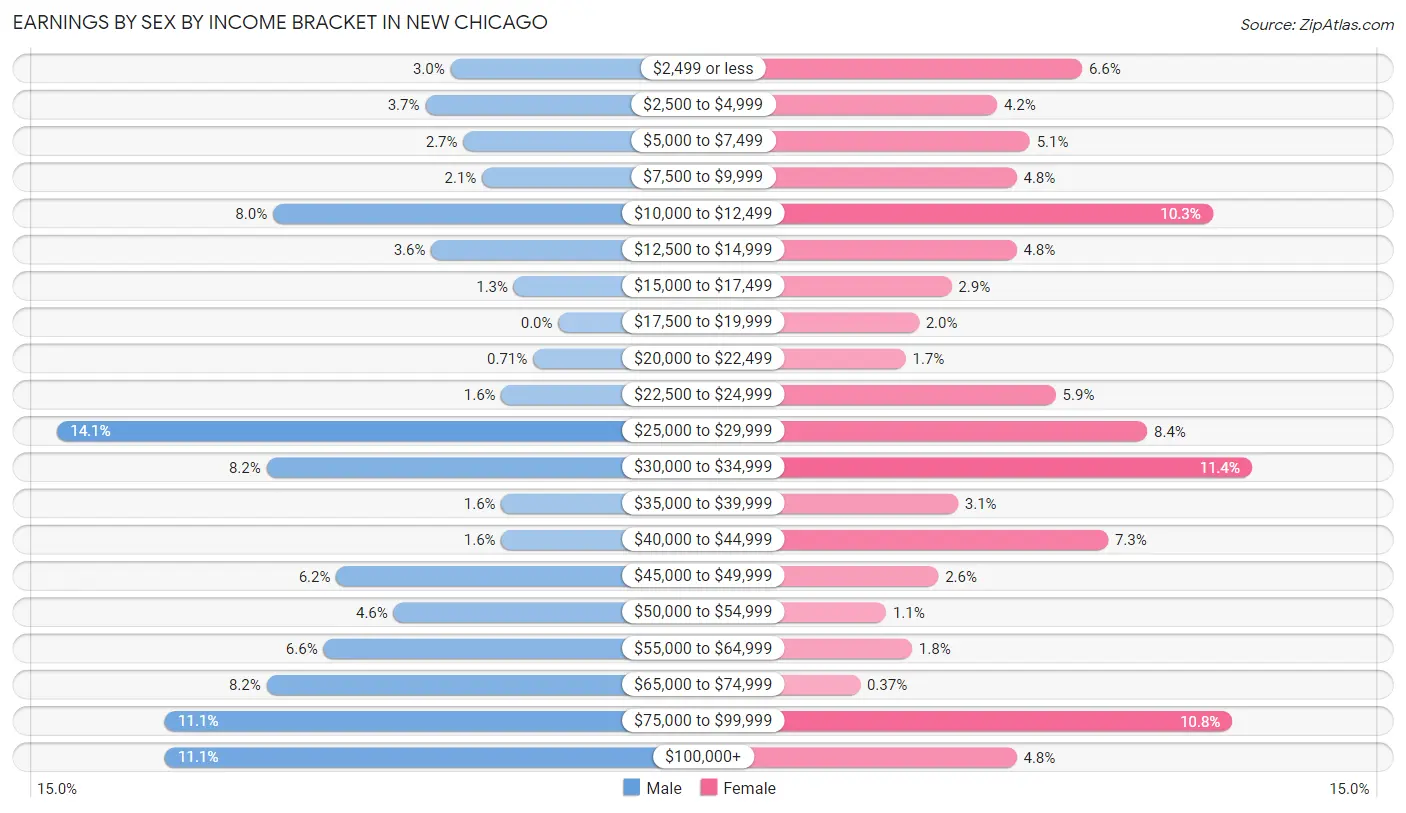
| Income | Male | Female |
| $2,499 or less | 17 (3.0%) | 36 (6.6%) |
| $2,500 to $4,999 | 21 (3.7%) | 23 (4.2%) |
| $5,000 to $7,499 | 15 (2.7%) | 28 (5.1%) |
| $7,500 to $9,999 | 12 (2.1%) | 26 (4.8%) |
| $10,000 to $12,499 | 45 (8.0%) | 56 (10.3%) |
| $12,500 to $14,999 | 20 (3.6%) | 26 (4.8%) |
| $15,000 to $17,499 | 7 (1.3%) | 16 (2.9%) |
| $17,500 to $19,999 | 0 (0.0%) | 11 (2.0%) |
| $20,000 to $22,499 | 4 (0.7%) | 9 (1.7%) |
| $22,500 to $24,999 | 9 (1.6%) | 32 (5.9%) |
| $25,000 to $29,999 | 79 (14.1%) | 46 (8.4%) |
| $30,000 to $34,999 | 46 (8.2%) | 62 (11.4%) |
| $35,000 to $39,999 | 9 (1.6%) | 17 (3.1%) |
| $40,000 to $44,999 | 9 (1.6%) | 40 (7.3%) |
| $45,000 to $49,999 | 35 (6.2%) | 14 (2.6%) |
| $50,000 to $54,999 | 26 (4.6%) | 6 (1.1%) |
| $55,000 to $64,999 | 37 (6.6%) | 10 (1.8%) |
| $65,000 to $74,999 | 46 (8.2%) | 2 (0.4%) |
| $75,000 to $99,999 | 62 (11.1%) | 59 (10.8%) |
| $100,000+ | 62 (11.1%) | 26 (4.8%) |
| Total | 561 (100.0%) | 545 (100.0%) |
Earnings by Sex by Educational Attainment in New Chicago
Average earnings in New Chicago are $34,931 for men and $33,491 for women, a difference of 4.1%. Men with an educational attainment of high school diploma enjoy the highest average annual earnings of $50,000, while those with college or associate's degree education earn the least with $34,063. Women with an educational attainment of graduate degree earn the most with the average annual earnings of $86,534, while those with less than high school education have the smallest earnings of $15,375.
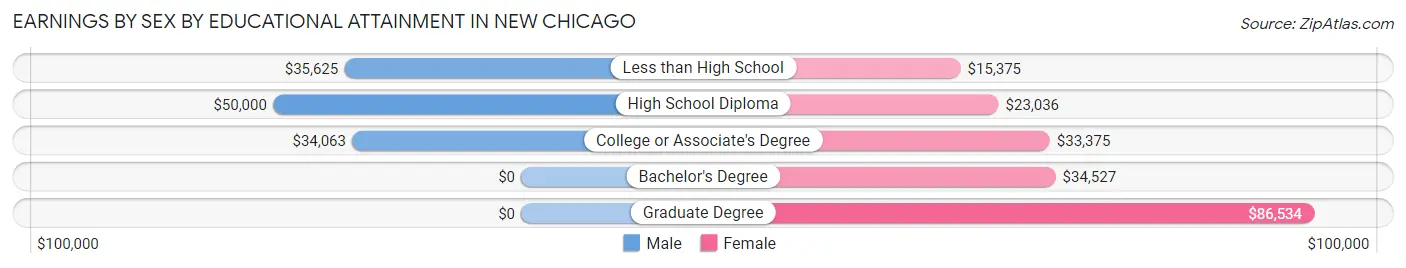
| Educational Attainment | Male Income | Female Income |
| Less than High School | $35,625 | $15,375 |
| High School Diploma | $50,000 | $23,036 |
| College or Associate's Degree | $34,063 | $33,375 |
| Bachelor's Degree | - | - |
| Graduate Degree | - | - |
| Total | $34,931 | $33,491 |
Family Income in New Chicago
Family Income Brackets in New Chicago
According to the New Chicago family income data, there are 123 families falling into the $100,000 to $149,999 income range, which is the most common income bracket and makes up 22.9% of all families. Conversely, the $200,000+ income bracket is the least frequent group with only 11 families (2.0%) belonging to this category.
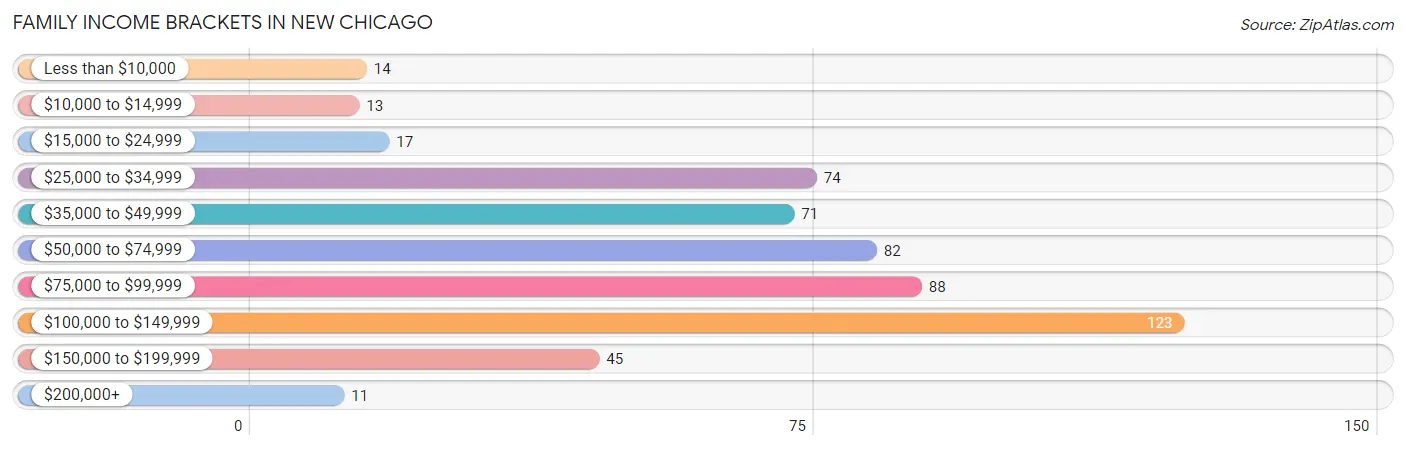
| Income Bracket | # Families | % Families |
| Less than $10,000 | 14 | 2.6% |
| $10,000 to $14,999 | 13 | 2.4% |
| $15,000 to $24,999 | 17 | 3.2% |
| $25,000 to $34,999 | 74 | 13.8% |
| $35,000 to $49,999 | 71 | 13.2% |
| $50,000 to $74,999 | 82 | 15.2% |
| $75,000 to $99,999 | 88 | 16.4% |
| $100,000 to $149,999 | 123 | 22.9% |
| $150,000 to $199,999 | 45 | 8.4% |
| $200,000+ | 11 | 2.0% |
Family Income by Famaliy Size in New Chicago
4-person families (90 | 16.7%) account for the highest median family income in New Chicago with $111,250 per family, while 4-person families (90 | 16.7%) have the highest median income of $27,812 per family member.
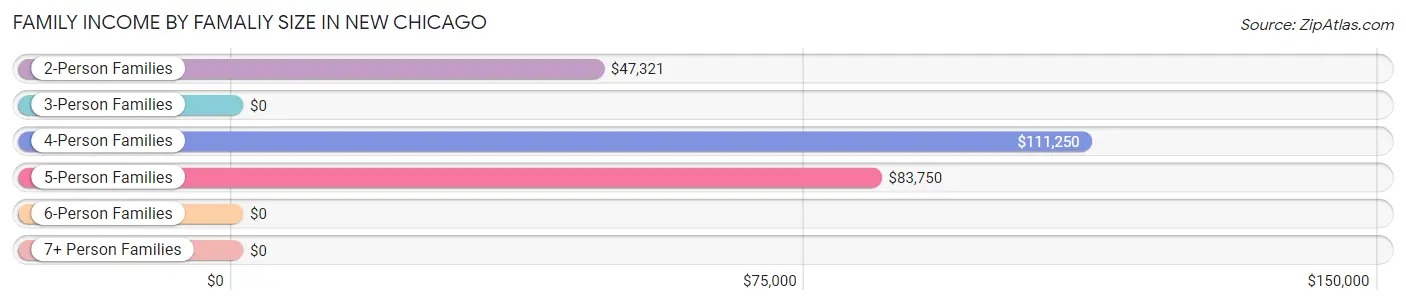
| Income Bracket | # Families | Median Income |
| 2-Person Families | 202 (37.6%) | $47,321 |
| 3-Person Families | 113 (21.0%) | $0 |
| 4-Person Families | 90 (16.7%) | $111,250 |
| 5-Person Families | 113 (21.0%) | $83,750 |
| 6-Person Families | 20 (3.7%) | $0 |
| 7+ Person Families | 0 (0.0%) | $0 |
| Total | 538 (100.0%) | $73,750 |
Family Income by Number of Earners in New Chicago
The median family income in New Chicago is $73,750, with families comprising 3+ earners (50) having the highest median family income of $160,417, while families with no earners (35) have the lowest median family income of $45,972, accounting for 9.3% and 6.5% of families, respectively.
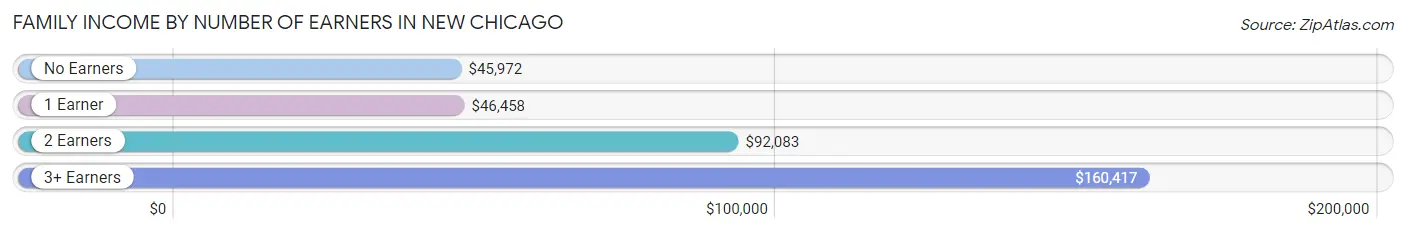
| Number of Earners | # Families | Median Income |
| No Earners | 35 (6.5%) | $45,972 |
| 1 Earner | 201 (37.4%) | $46,458 |
| 2 Earners | 252 (46.8%) | $92,083 |
| 3+ Earners | 50 (9.3%) | $160,417 |
| Total | 538 (100.0%) | $73,750 |
Household Income in New Chicago
Household Income Brackets in New Chicago
With 126 households falling in the category, the $50,000 to $74,999 income range is the most frequent in New Chicago, accounting for 17.0% of all households. In contrast, only 11 households (1.5%) fall into the $200,000+ income bracket, making it the least populous group.
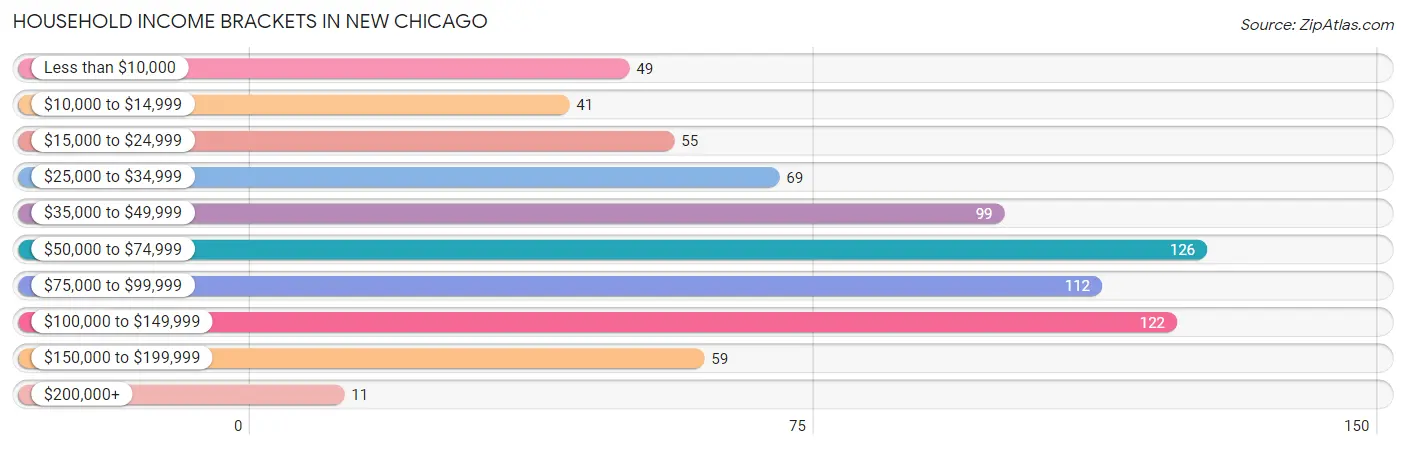
| Income Bracket | # Households | % Households |
| Less than $10,000 | 49 | 6.6% |
| $10,000 to $14,999 | 41 | 5.5% |
| $15,000 to $24,999 | 55 | 7.4% |
| $25,000 to $34,999 | 69 | 9.3% |
| $35,000 to $49,999 | 99 | 13.3% |
| $50,000 to $74,999 | 126 | 17.0% |
| $75,000 to $99,999 | 112 | 15.1% |
| $100,000 to $149,999 | 122 | 16.4% |
| $150,000 to $199,999 | 59 | 7.9% |
| $200,000+ | 11 | 1.5% |
Household Income by Householder Age in New Chicago
The median household income in New Chicago is $56,761, with the highest median household income of $84,091 found in the 25 to 44 years age bracket for the primary householder. A total of 286 households (38.5%) fall into this category. Meanwhile, the 15 to 24 years age bracket for the primary householder has the lowest median household income of $0, with 35 households (4.7%) in this group.
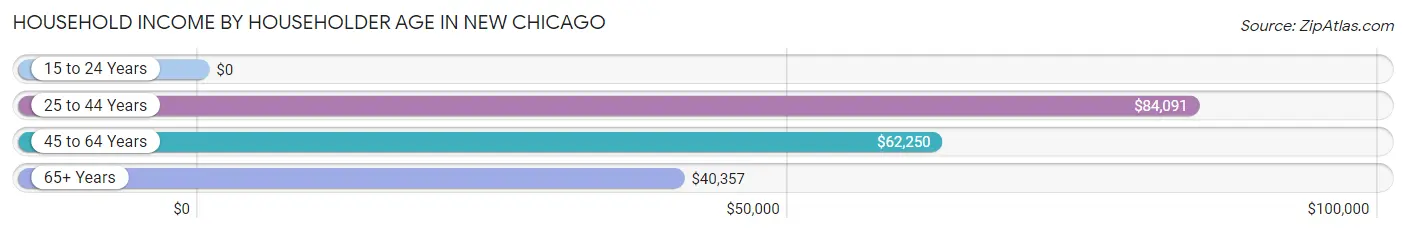
| Income Bracket | # Households | Median Income |
| 15 to 24 Years | 35 (4.7%) | $0 |
| 25 to 44 Years | 286 (38.5%) | $84,091 |
| 45 to 64 Years | 278 (37.4%) | $62,250 |
| 65+ Years | 144 (19.4%) | $40,357 |
| Total | 743 (100.0%) | $56,761 |
Poverty in New Chicago
Income Below Poverty by Sex and Age in New Chicago
With 14.3% poverty level for males and 15.3% for females among the residents of New Chicago, 16 and 17 year old males and 65 to 74 year old females are the most vulnerable to poverty, with 13 males (32.5%) and 31 females (41.3%) in their respective age groups living below the poverty level.
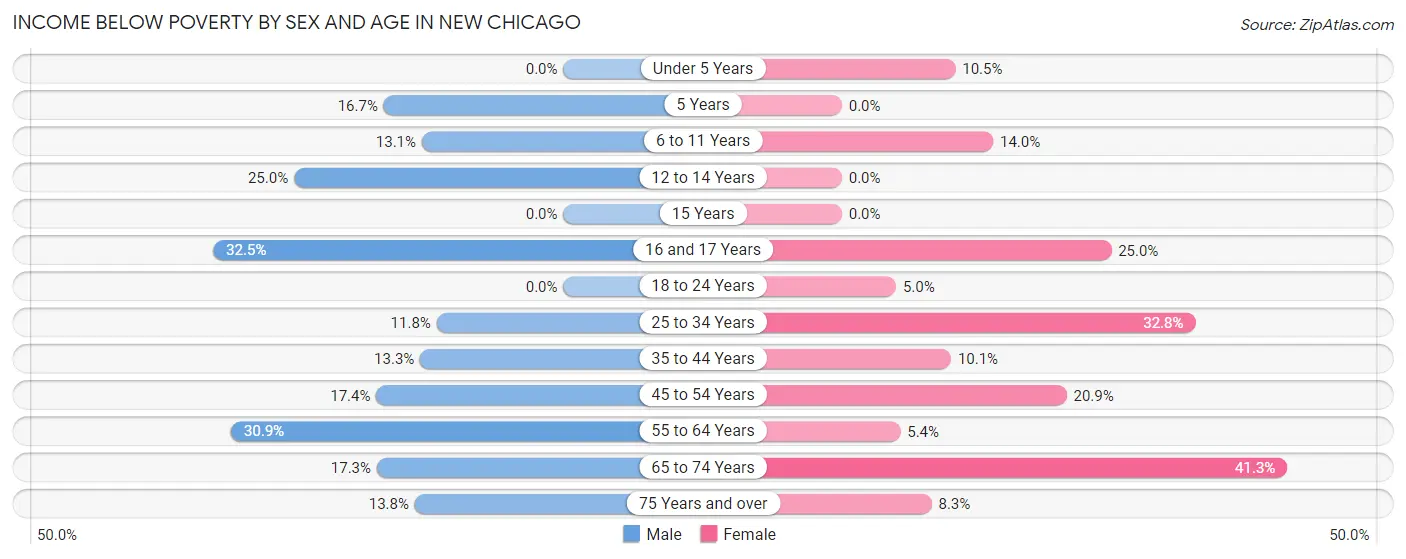
| Age Bracket | Male | Female |
| Under 5 Years | 0 (0.0%) | 6 (10.5%) |
| 5 Years | 6 (16.7%) | 0 (0.0%) |
| 6 to 11 Years | 13 (13.1%) | 16 (14.0%) |
| 12 to 14 Years | 15 (25.0%) | 0 (0.0%) |
| 15 Years | 0 (0.0%) | 0 (0.0%) |
| 16 and 17 Years | 13 (32.5%) | 6 (25.0%) |
| 18 to 24 Years | 0 (0.0%) | 8 (5.0%) |
| 25 to 34 Years | 20 (11.8%) | 41 (32.8%) |
| 35 to 44 Years | 19 (13.3%) | 16 (10.1%) |
| 45 to 54 Years | 21 (17.4%) | 29 (20.9%) |
| 55 to 64 Years | 29 (30.8%) | 7 (5.4%) |
| 65 to 74 Years | 9 (17.3%) | 31 (41.3%) |
| 75 Years and over | 4 (13.8%) | 4 (8.3%) |
| Total | 149 (14.3%) | 164 (15.3%) |
Income Above Poverty by Sex and Age in New Chicago
According to the poverty statistics in New Chicago, males aged under 5 years and females aged 5 years are the age groups that are most secure financially, with 100.0% of males and 100.0% of females in these age groups living above the poverty line.
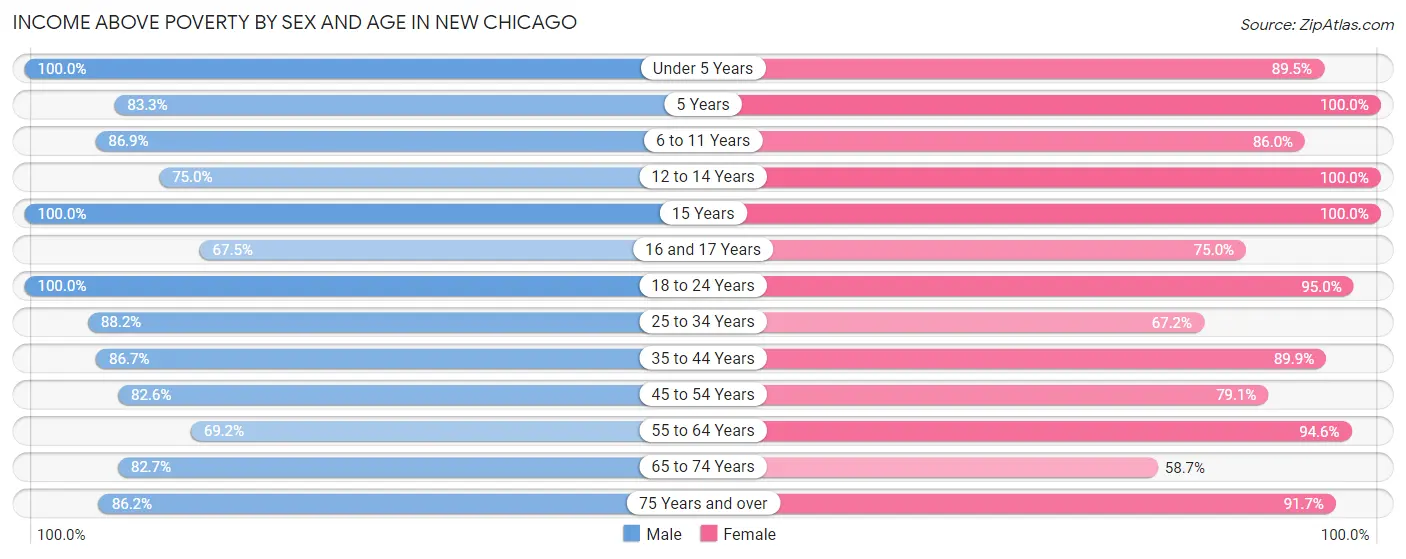
| Age Bracket | Male | Female |
| Under 5 Years | 100 (100.0%) | 51 (89.5%) |
| 5 Years | 30 (83.3%) | 22 (100.0%) |
| 6 to 11 Years | 86 (86.9%) | 98 (86.0%) |
| 12 to 14 Years | 45 (75.0%) | 18 (100.0%) |
| 15 Years | 11 (100.0%) | 2 (100.0%) |
| 16 and 17 Years | 27 (67.5%) | 18 (75.0%) |
| 18 to 24 Years | 86 (100.0%) | 151 (95.0%) |
| 25 to 34 Years | 150 (88.2%) | 84 (67.2%) |
| 35 to 44 Years | 124 (86.7%) | 142 (89.9%) |
| 45 to 54 Years | 100 (82.6%) | 110 (79.1%) |
| 55 to 64 Years | 65 (69.2%) | 122 (94.6%) |
| 65 to 74 Years | 43 (82.7%) | 44 (58.7%) |
| 75 Years and over | 25 (86.2%) | 44 (91.7%) |
| Total | 892 (85.7%) | 906 (84.7%) |
Income Below Poverty Among Married-Couple Families in New Chicago
The poverty statistics for married-couple families in New Chicago show that 9.3% or 30 of the total 321 families live below the poverty line. Families with 3 or 4 children have the highest poverty rate of 20.6%, comprising of 7 families. On the other hand, families with 1 or 2 children have the lowest poverty rate of 2.6%, which includes 4 families.
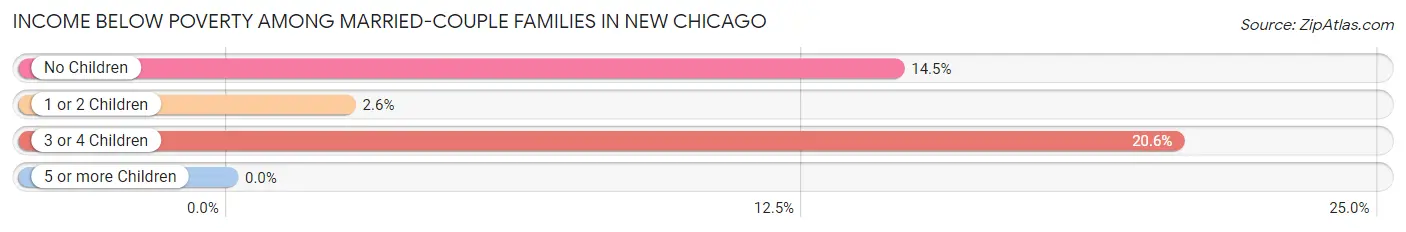
| Children | Above Poverty | Below Poverty |
| No Children | 112 (85.5%) | 19 (14.5%) |
| 1 or 2 Children | 152 (97.4%) | 4 (2.6%) |
| 3 or 4 Children | 27 (79.4%) | 7 (20.6%) |
| 5 or more Children | 0 (0.0%) | 0 (0.0%) |
| Total | 291 (90.6%) | 30 (9.3%) |
Income Below Poverty Among Single-Parent Households in New Chicago
According to the poverty data in New Chicago, 11.4% or 9 single-father households and 13.0% or 18 single-mother households are living below the poverty line. Among single-father households, those with no children have the highest poverty rate, with 5 households (18.5%) experiencing poverty. Likewise, among single-mother households, those with 3 or 4 children have the highest poverty rate, with 8 households (30.8%) falling below the poverty line.
| Children | Single Father | Single Mother |
| No Children | 5 (18.5%) | 4 (7.4%) |
| 1 or 2 Children | 4 (12.9%) | 6 (10.3%) |
| 3 or 4 Children | 0 (0.0%) | 8 (30.8%) |
| 5 or more Children | 0 (0.0%) | 0 (0.0%) |
| Total | 9 (11.4%) | 18 (13.0%) |
Income Below Poverty Among Married-Couple vs Single-Parent Households in New Chicago
The poverty data for New Chicago shows that 30 of the married-couple family households (9.3%) and 27 of the single-parent households (12.4%) are living below the poverty level. Within the married-couple family households, those with 3 or 4 children have the highest poverty rate, with 7 households (20.6%) falling below the poverty line. Among the single-parent households, those with 3 or 4 children have the highest poverty rate, with 8 household (17.0%) living below poverty.
| Children | Married-Couple Families | Single-Parent Households |
| No Children | 19 (14.5%) | 9 (11.1%) |
| 1 or 2 Children | 4 (2.6%) | 10 (11.2%) |
| 3 or 4 Children | 7 (20.6%) | 8 (17.0%) |
| 5 or more Children | 0 (0.0%) | 0 (0.0%) |
| Total | 30 (9.3%) | 27 (12.4%) |
Race in New Chicago
The most populous races in New Chicago are White / Caucasian (1,516 | 71.8%), Hispanic or Latino (817 | 38.7%), and Two or more Races (393 | 18.6%).
| Race | # Population | % Population |
| Asian | 5 | 0.2% |
| Black / African American | 37 | 1.8% |
| Hawaiian / Pacific | 14 | 0.7% |
| Hispanic or Latino | 817 | 38.7% |
| Native / Alaskan | 0 | 0.0% |
| White / Caucasian | 1,516 | 71.8% |
| Two or more Races | 393 | 18.6% |
| Some other Race | 146 | 6.9% |
| Total | 2,111 | 100.0% |
Ancestry in New Chicago
The most populous ancestries reported in New Chicago are Mexican (672 | 31.8%), German (322 | 15.2%), Irish (247 | 11.7%), English (190 | 9.0%), and Polish (129 | 6.1%), together accounting for 73.9% of all New Chicago residents.
| Ancestry | # Population | % Population |
| Albanian | 12 | 0.6% |
| American | 128 | 6.1% |
| Austrian | 7 | 0.3% |
| British | 8 | 0.4% |
| Burmese | 18 | 0.9% |
| Central American | 85 | 4.0% |
| Costa Rican | 23 | 1.1% |
| Cuban | 4 | 0.2% |
| Czech | 12 | 0.6% |
| Dutch | 33 | 1.6% |
| English | 190 | 9.0% |
| French | 37 | 1.8% |
| French Canadian | 3 | 0.1% |
| German | 322 | 15.2% |
| Greek | 3 | 0.1% |
| Guamanian / Chamorro | 14 | 0.7% |
| Honduran | 62 | 2.9% |
| Hungarian | 17 | 0.8% |
| Irish | 247 | 11.7% |
| Italian | 106 | 5.0% |
| Korean | 2 | 0.1% |
| Lithuanian | 3 | 0.1% |
| Mexican | 672 | 31.8% |
| Norwegian | 11 | 0.5% |
| Polish | 129 | 6.1% |
| Puerto Rican | 52 | 2.5% |
| Scotch-Irish | 116 | 5.5% |
| Scottish | 15 | 0.7% |
| Slovak | 12 | 0.6% |
| Spanish | 4 | 0.2% | View All 30 Rows |
Immigrants in New Chicago
The most numerous immigrant groups reported in New Chicago came from Central America (150 | 7.1%), Latin America (150 | 7.1%), Mexico (119 | 5.6%), Honduras (23 | 1.1%), and Europe (21 | 1.0%), together accounting for 21.9% of all New Chicago residents.
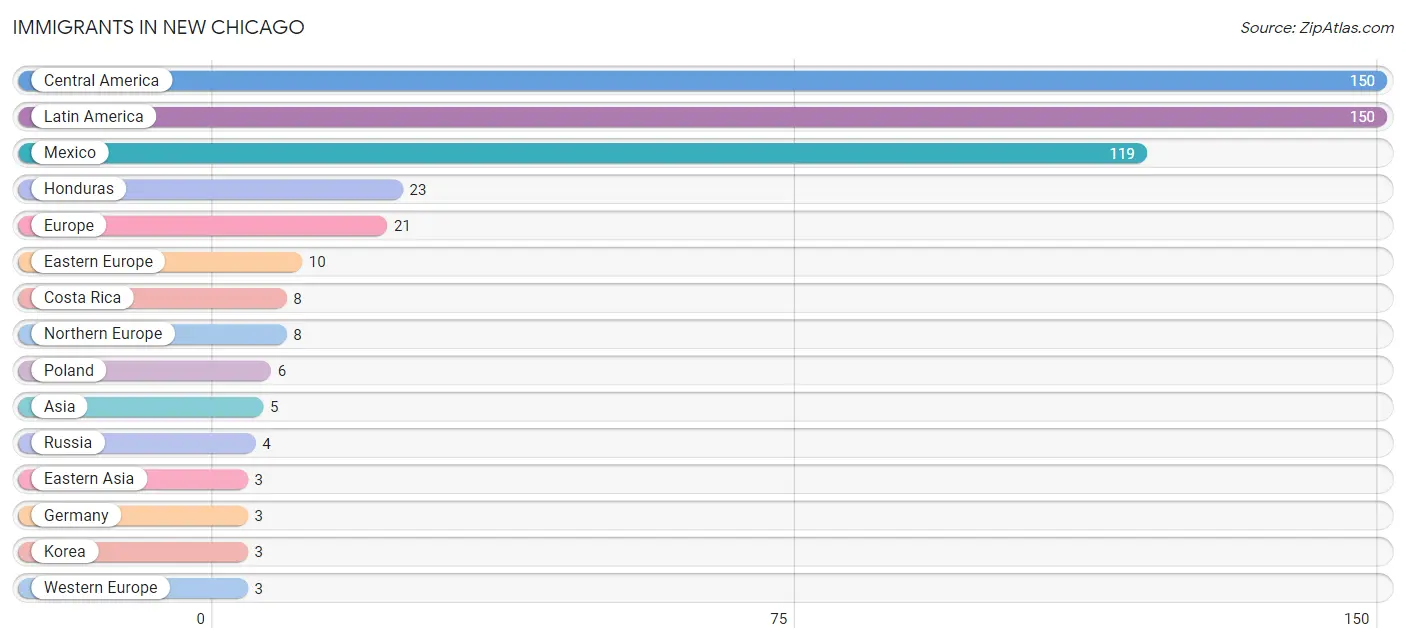
| Immigration Origin | # Population | % Population |
| Asia | 5 | 0.2% |
| Central America | 150 | 7.1% |
| Costa Rica | 8 | 0.4% |
| Eastern Asia | 3 | 0.1% |
| Eastern Europe | 10 | 0.5% |
| Europe | 21 | 1.0% |
| Germany | 3 | 0.1% |
| Honduras | 23 | 1.1% |
| Korea | 3 | 0.1% |
| Latin America | 150 | 7.1% |
| Mexico | 119 | 5.6% |
| Northern Europe | 8 | 0.4% |
| Philippines | 2 | 0.1% |
| Poland | 6 | 0.3% |
| Russia | 4 | 0.2% |
| South Eastern Asia | 2 | 0.1% |
| Western Europe | 3 | 0.1% | View All 17 Rows |
Sex and Age in New Chicago
Sex and Age in New Chicago
The most populous age groups in New Chicago are 25 to 29 Years (114 | 11.0%) for men and 15 to 19 Years (130 | 12.1%) for women.
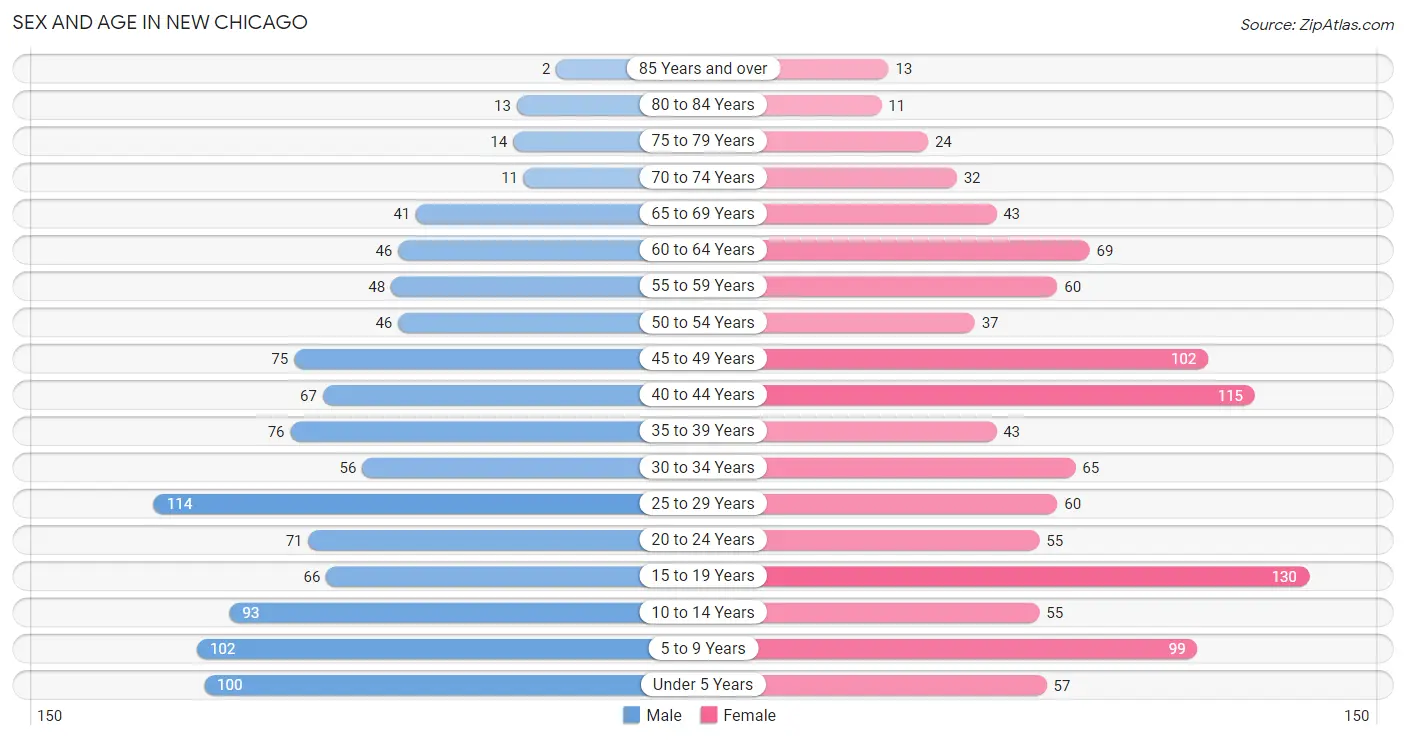
| Age Bracket | Male | Female |
| Under 5 Years | 100 (9.6%) | 57 (5.3%) |
| 5 to 9 Years | 102 (9.8%) | 99 (9.2%) |
| 10 to 14 Years | 93 (8.9%) | 55 (5.1%) |
| 15 to 19 Years | 66 (6.3%) | 130 (12.1%) |
| 20 to 24 Years | 71 (6.8%) | 55 (5.1%) |
| 25 to 29 Years | 114 (11.0%) | 60 (5.6%) |
| 30 to 34 Years | 56 (5.4%) | 65 (6.1%) |
| 35 to 39 Years | 76 (7.3%) | 43 (4.0%) |
| 40 to 44 Years | 67 (6.4%) | 115 (10.7%) |
| 45 to 49 Years | 75 (7.2%) | 102 (9.5%) |
| 50 to 54 Years | 46 (4.4%) | 37 (3.5%) |
| 55 to 59 Years | 48 (4.6%) | 60 (5.6%) |
| 60 to 64 Years | 46 (4.4%) | 69 (6.5%) |
| 65 to 69 Years | 41 (3.9%) | 43 (4.0%) |
| 70 to 74 Years | 11 (1.1%) | 32 (3.0%) |
| 75 to 79 Years | 14 (1.3%) | 24 (2.2%) |
| 80 to 84 Years | 13 (1.3%) | 11 (1.0%) |
| 85 Years and over | 2 (0.2%) | 13 (1.2%) |
| Total | 1,041 (100.0%) | 1,070 (100.0%) |
Families and Households in New Chicago
Median Family Size in New Chicago
The median family size in New Chicago is 3.35 persons per family, with married-couple families (321 | 59.7%) accounting for the largest median family size of 3.48 persons per family. On the other hand, single male/father families (79 | 14.7%) represent the smallest median family size with 2.76 persons per family.
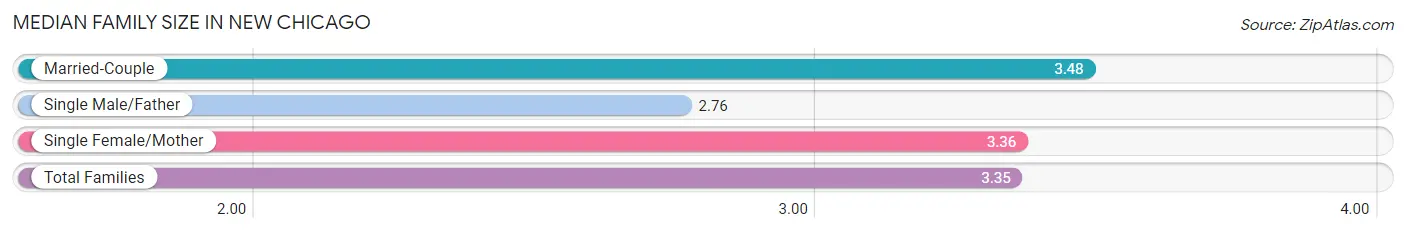
| Family Type | # Families | Family Size |
| Married-Couple | 321 (59.7%) | 3.48 |
| Single Male/Father | 79 (14.7%) | 2.76 |
| Single Female/Mother | 138 (25.7%) | 3.36 |
| Total Families | 538 (100.0%) | 3.35 |
Median Household Size in New Chicago
The median household size in New Chicago is 2.84 persons per household, with single male/father households (79 | 10.6%) accounting for the largest median household size of 3.53 persons per household. non-family households (205 | 27.6%) represent the smallest median household size with 1.12 persons per household.
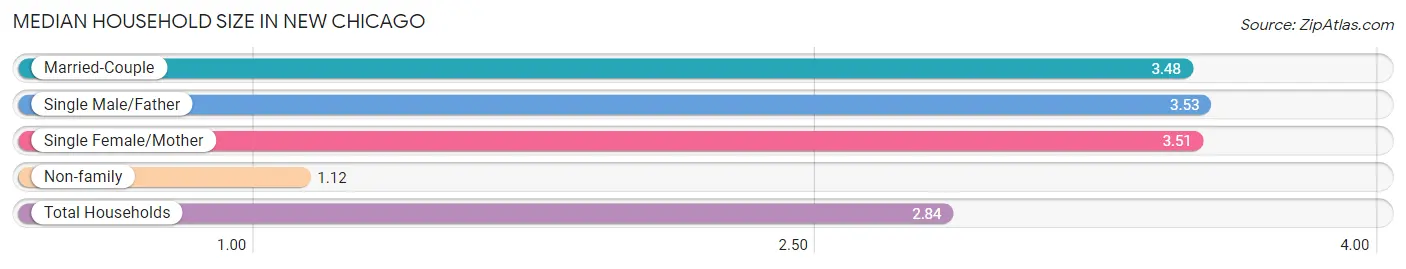
| Household Type | # Households | Household Size |
| Married-Couple | 321 (43.2%) | 3.48 |
| Single Male/Father | 79 (10.6%) | 3.53 |
| Single Female/Mother | 138 (18.6%) | 3.51 |
| Non-family | 205 (27.6%) | 1.12 |
| Total Households | 743 (100.0%) | 2.84 |
Household Size by Marriage Status in New Chicago
Out of a total of 743 households in New Chicago, 538 (72.4%) are family households, while 205 (27.6%) are nonfamily households. The most numerous type of family households are 2-person households, comprising 156, and the most common type of nonfamily households are 1-person households, comprising 181.
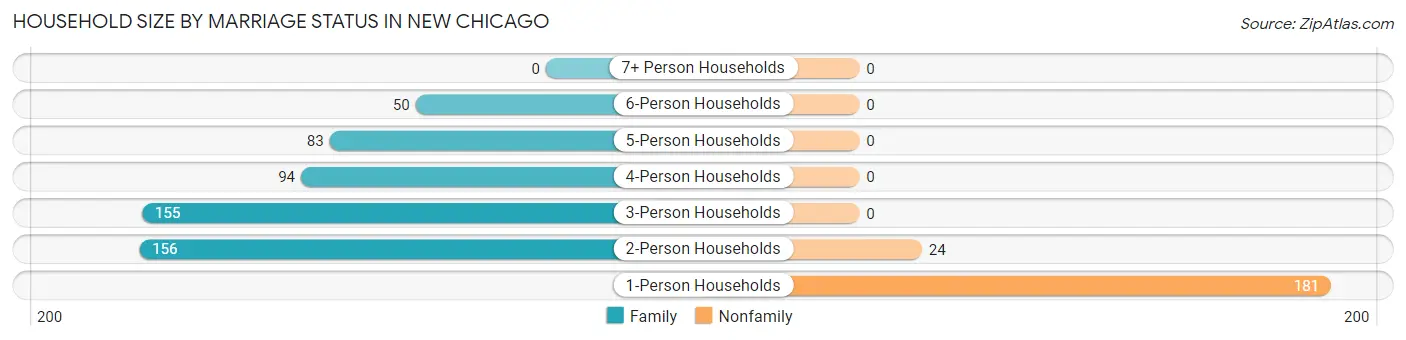
| Household Size | Family Households | Nonfamily Households |
| 1-Person Households | - | 181 (24.4%) |
| 2-Person Households | 156 (21.0%) | 24 (3.2%) |
| 3-Person Households | 155 (20.9%) | 0 (0.0%) |
| 4-Person Households | 94 (12.7%) | 0 (0.0%) |
| 5-Person Households | 83 (11.2%) | 0 (0.0%) |
| 6-Person Households | 50 (6.7%) | 0 (0.0%) |
| 7+ Person Households | 0 (0.0%) | 0 (0.0%) |
| Total | 538 (72.4%) | 205 (27.6%) |
Female Fertility in New Chicago
Fertility by Age in New Chicago
Average fertility rate in New Chicago is 44.0 births per 1,000 women. Women in the age bracket of 20 to 34 years have the highest fertility rate with 144.0 births per 1,000 women. Women in the age bracket of 20 to 34 years acount for 100.0% of all women with births.
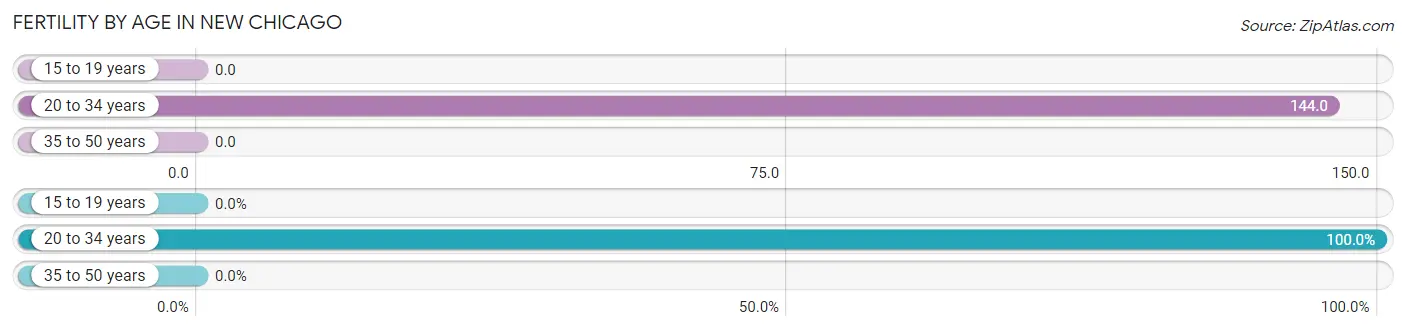
| Age Bracket | Women with Births | Births / 1,000 Women |
| 15 to 19 years | 0 (0.0%) | 0.0 |
| 20 to 34 years | 26 (100.0%) | 144.0 |
| 35 to 50 years | 0 (0.0%) | 0.0 |
| Total | 26 (100.0%) | 44.0 |
Fertility by Age by Marriage Status in New Chicago
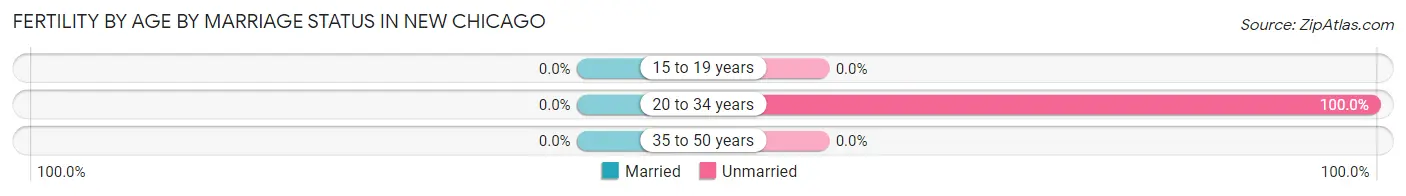
| Age Bracket | Married | Unmarried |
| 15 to 19 years | 0 (0.0%) | 0 (0.0%) |
| 20 to 34 years | 0 (0.0%) | 26 (100.0%) |
| 35 to 50 years | 0 (0.0%) | 0 (0.0%) |
| Total | 0 (0.0%) | 26 (100.0%) |
Fertility by Education in New Chicago
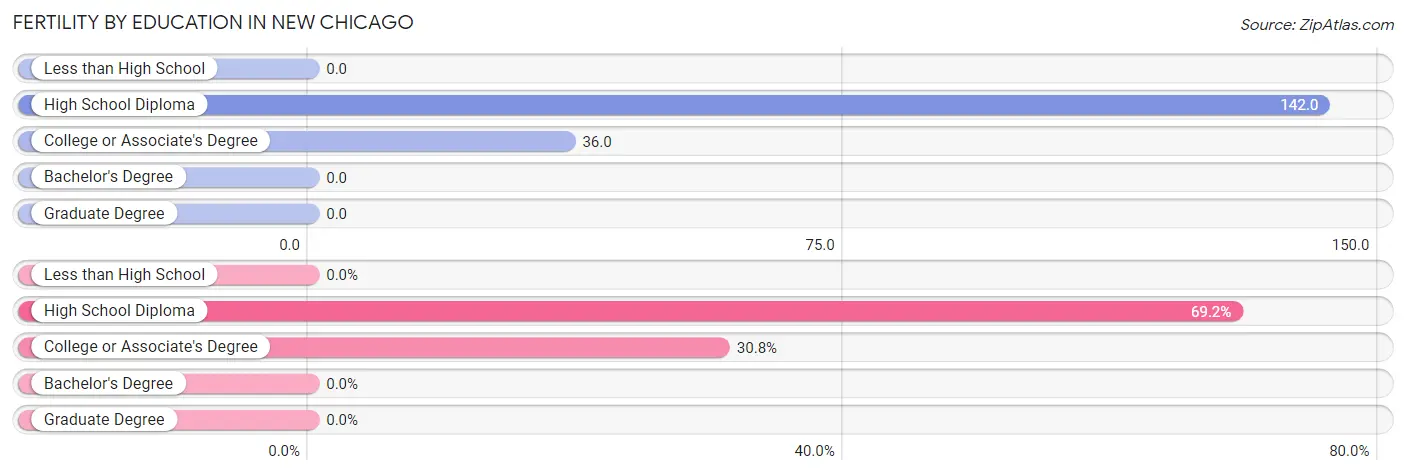
| Educational Attainment | Women with Births | Births / 1,000 Women |
| Less than High School | 0 (0.0%) | 0.0 |
| High School Diploma | 18 (69.2%) | 142.0 |
| College or Associate's Degree | 8 (30.8%) | 36.0 |
| Bachelor's Degree | 0 (0.0%) | 0.0 |
| Graduate Degree | 0 (0.0%) | 0.0 |
| Total | 26 (100.0%) | 44.0 |
Fertility by Education by Marriage Status in New Chicago
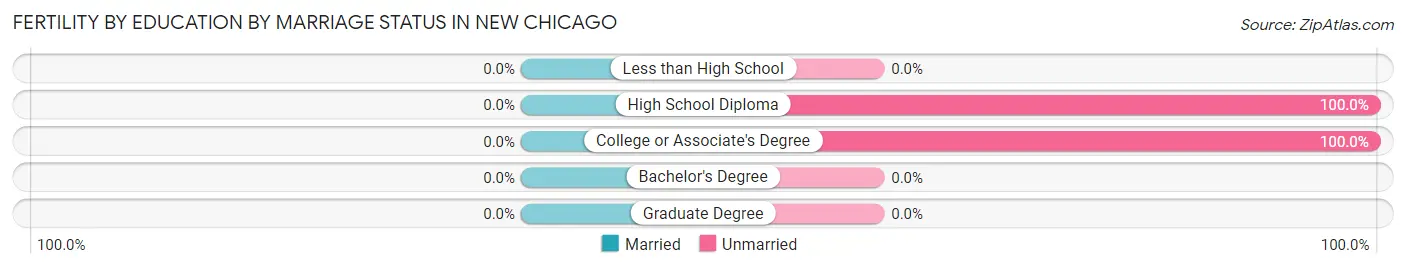
| Educational Attainment | Married | Unmarried |
| Less than High School | 0 (0.0%) | 0 (0.0%) |
| High School Diploma | 0 (0.0%) | 18 (100.0%) |
| College or Associate's Degree | 0 (0.0%) | 8 (100.0%) |
| Bachelor's Degree | 0 (0.0%) | 0 (0.0%) |
| Graduate Degree | 0 (0.0%) | 0 (0.0%) |
| Total | 0 (0.0%) | 26 (100.0%) |
Employment Characteristics in New Chicago
Employment by Class of Employer in New Chicago
Among the 945 employed individuals in New Chicago, private company employees (633 | 67.0%), not-for-profit organizations (105 | 11.1%), and local government employees (81 | 8.6%) make up the most common classes of employment.
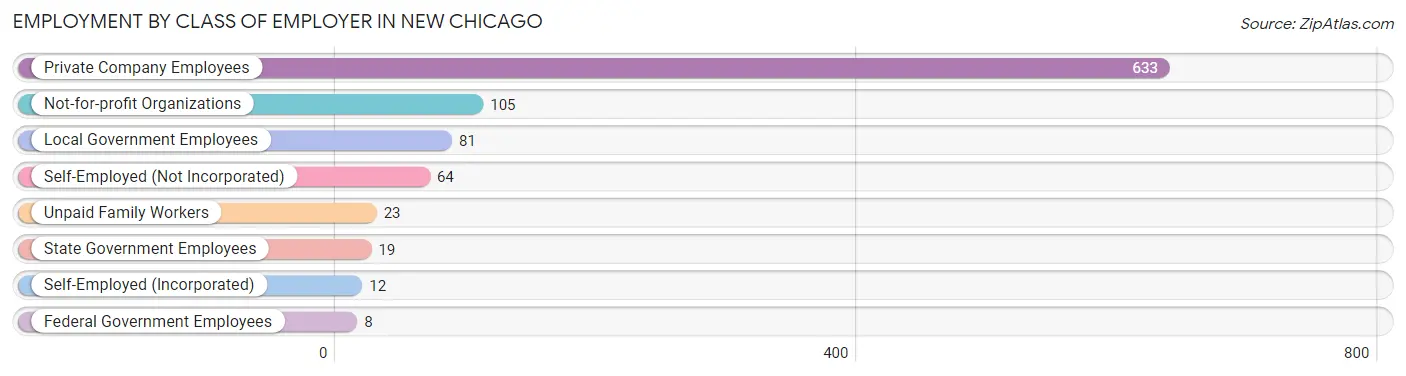
| Employer Class | # Employees | % Employees |
| Private Company Employees | 633 | 67.0% |
| Self-Employed (Incorporated) | 12 | 1.3% |
| Self-Employed (Not Incorporated) | 64 | 6.8% |
| Not-for-profit Organizations | 105 | 11.1% |
| Local Government Employees | 81 | 8.6% |
| State Government Employees | 19 | 2.0% |
| Federal Government Employees | 8 | 0.9% |
| Unpaid Family Workers | 23 | 2.4% |
| Total | 945 | 100.0% |
Employment Status by Age in New Chicago
According to the labor force statistics for New Chicago, out of the total population over 16 years of age (1,592), 65.8% or 1,048 individuals are in the labor force, with 9.3% or 97 of them unemployed. The age group with the highest labor force participation rate is 30 to 34 years, with 90.9% or 110 individuals in the labor force. Within the labor force, the 25 to 29 years age range has the highest percentage of unemployed individuals, with 20.7% or 30 of them being unemployed.
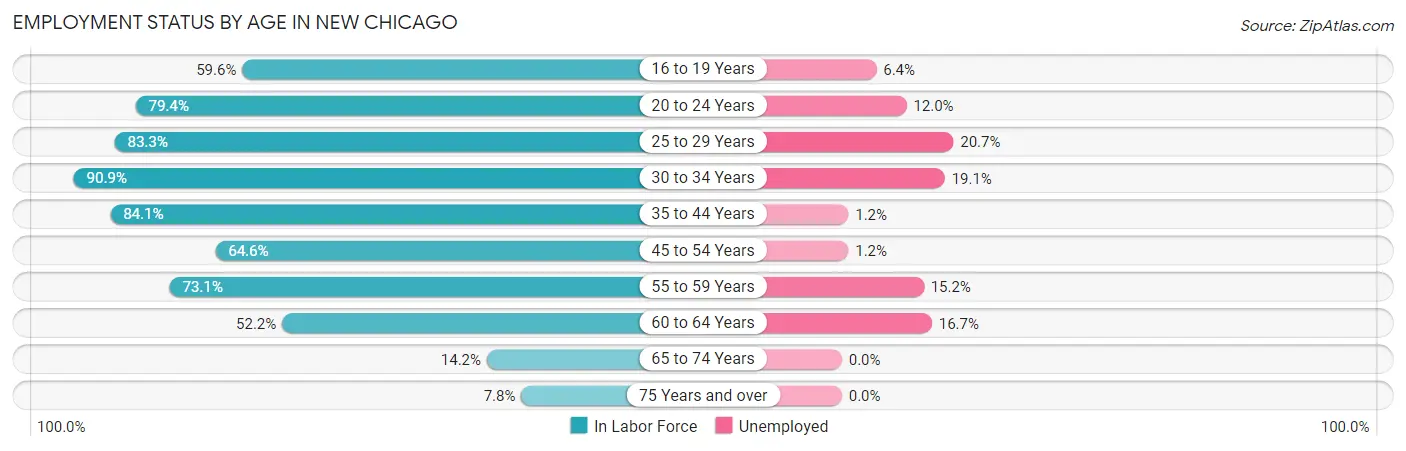
| Age Bracket | In Labor Force | Unemployed |
| 16 to 19 Years | 109 (59.6%) | 7 (6.4%) |
| 20 to 24 Years | 100 (79.4%) | 12 (12.0%) |
| 25 to 29 Years | 145 (83.3%) | 30 (20.7%) |
| 30 to 34 Years | 110 (90.9%) | 21 (19.1%) |
| 35 to 44 Years | 253 (84.1%) | 3 (1.2%) |
| 45 to 54 Years | 168 (64.6%) | 2 (1.2%) |
| 55 to 59 Years | 79 (73.1%) | 12 (15.2%) |
| 60 to 64 Years | 60 (52.2%) | 10 (16.7%) |
| 65 to 74 Years | 18 (14.2%) | 0 (0.0%) |
| 75 Years and over | 6 (7.8%) | 0 (0.0%) |
| Total | 1,048 (65.8%) | 97 (9.3%) |
Employment Status by Educational Attainment in New Chicago
According to labor force statistics for New Chicago, 75.5% of individuals (815) out of the total population between 25 and 64 years of age (1,079) are in the labor force, with 9.6% or 78 of them being unemployed. The group with the highest labor force participation rate are those with the educational attainment of bachelor's degree or higher, with 94.7% or 177 individuals in the labor force. Within the labor force, individuals with less than high school education have the highest percentage of unemployment, with 20.6% or 26 of them being unemployed.
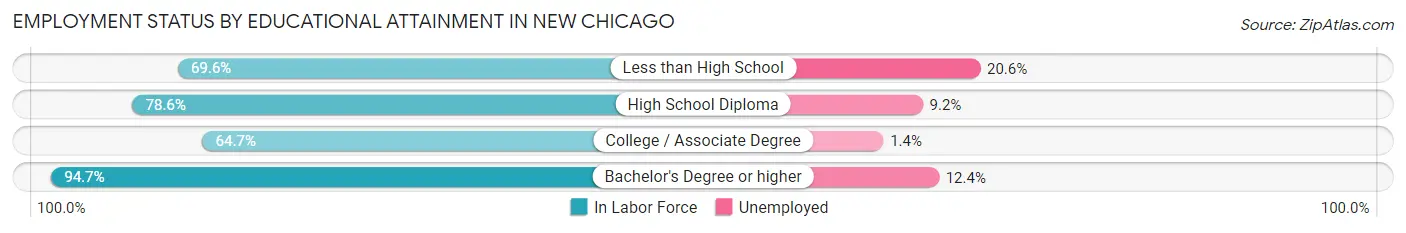
| Educational Attainment | In Labor Force | Unemployed |
| Less than High School | 126 (69.6%) | 37 (20.6%) |
| High School Diploma | 294 (78.6%) | 34 (9.2%) |
| College / Associate Degree | 218 (64.7%) | 5 (1.4%) |
| Bachelor's Degree or higher | 177 (94.7%) | 23 (12.4%) |
| Total | 815 (75.5%) | 104 (9.6%) |
Employment Occupations by Sex in New Chicago
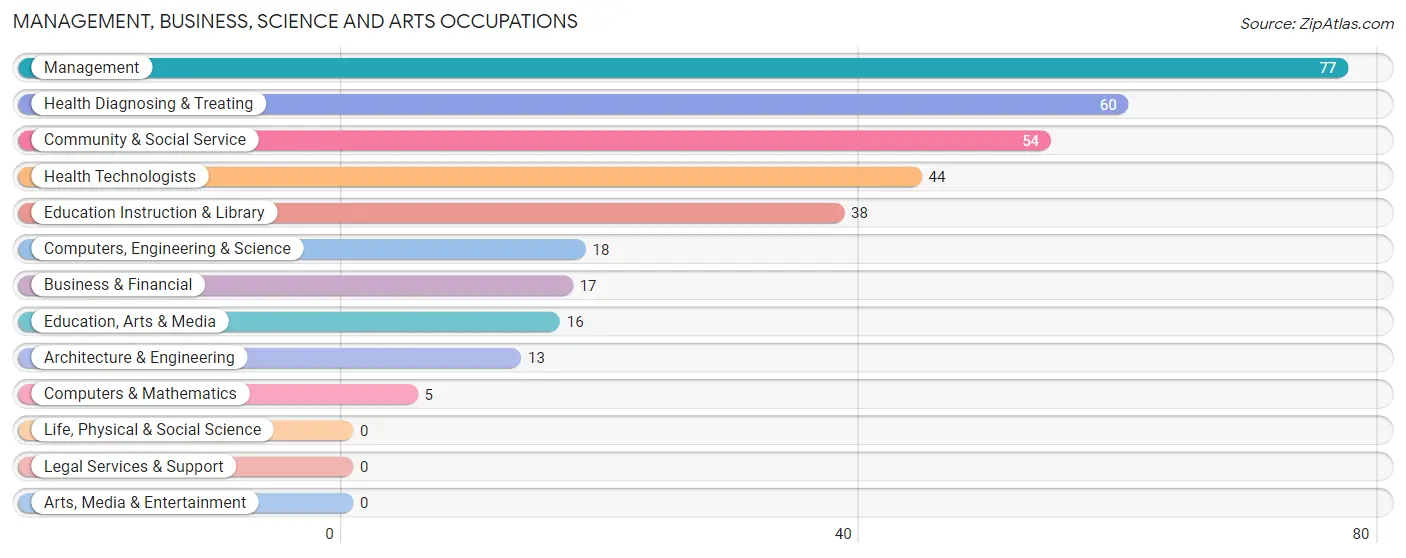
Management, Business, Science and Arts Occupations
The most common Management, Business, Science and Arts occupations in New Chicago are Management (77 | 8.1%), Health Diagnosing & Treating (60 | 6.3%), Community & Social Service (54 | 5.7%), Health Technologists (44 | 4.6%), and Education Instruction & Library (38 | 4.0%).
Management, Business, Science and Arts Occupations by Sex
Within the Management, Business, Science and Arts occupations in New Chicago, the most male-oriented occupations are Computers, Engineering & Science (100.0%), Computers & Mathematics (100.0%), and Architecture & Engineering (100.0%), while the most female-oriented occupations are Community & Social Service (100.0%), Education, Arts & Media (100.0%), and Education Instruction & Library (100.0%).
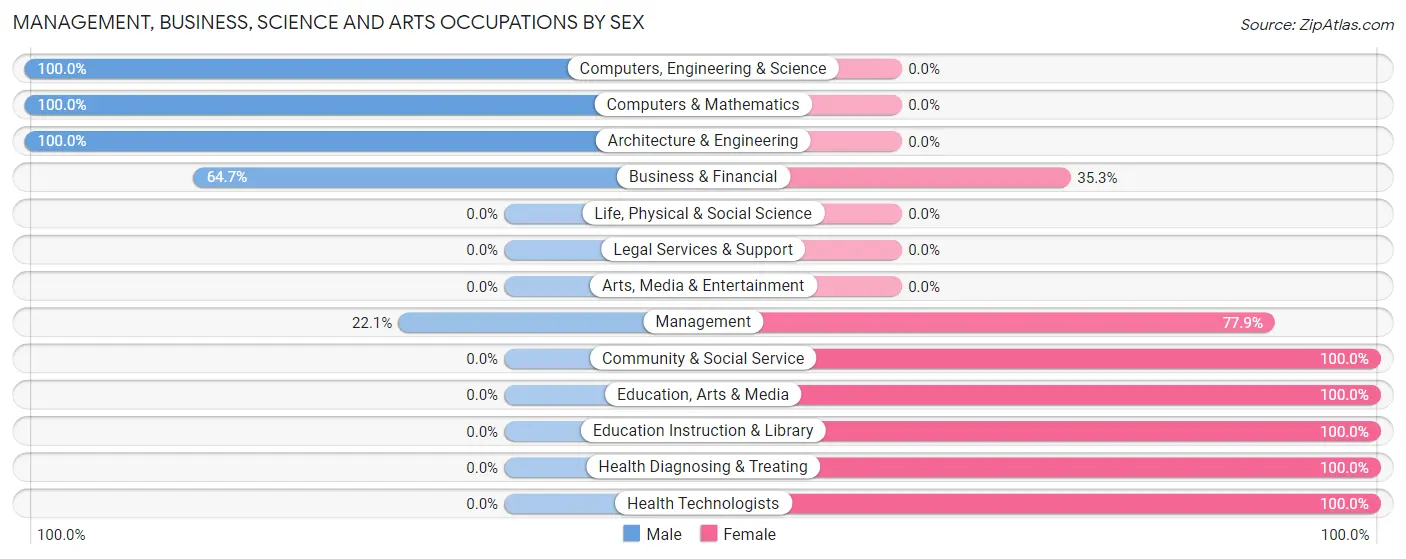
| Occupation | Male | Female |
| Management | 17 (22.1%) | 60 (77.9%) |
| Business & Financial | 11 (64.7%) | 6 (35.3%) |
| Computers, Engineering & Science | 18 (100.0%) | 0 (0.0%) |
| Computers & Mathematics | 5 (100.0%) | 0 (0.0%) |
| Architecture & Engineering | 13 (100.0%) | 0 (0.0%) |
| Life, Physical & Social Science | 0 (0.0%) | 0 (0.0%) |
| Community & Social Service | 0 (0.0%) | 54 (100.0%) |
| Education, Arts & Media | 0 (0.0%) | 16 (100.0%) |
| Legal Services & Support | 0 (0.0%) | 0 (0.0%) |
| Education Instruction & Library | 0 (0.0%) | 38 (100.0%) |
| Arts, Media & Entertainment | 0 (0.0%) | 0 (0.0%) |
| Health Diagnosing & Treating | 0 (0.0%) | 60 (100.0%) |
| Health Technologists | 0 (0.0%) | 44 (100.0%) |
| Total (Category) | 46 (20.3%) | 180 (79.6%) |
| Total (Overall) | 439 (46.2%) | 512 (53.8%) |
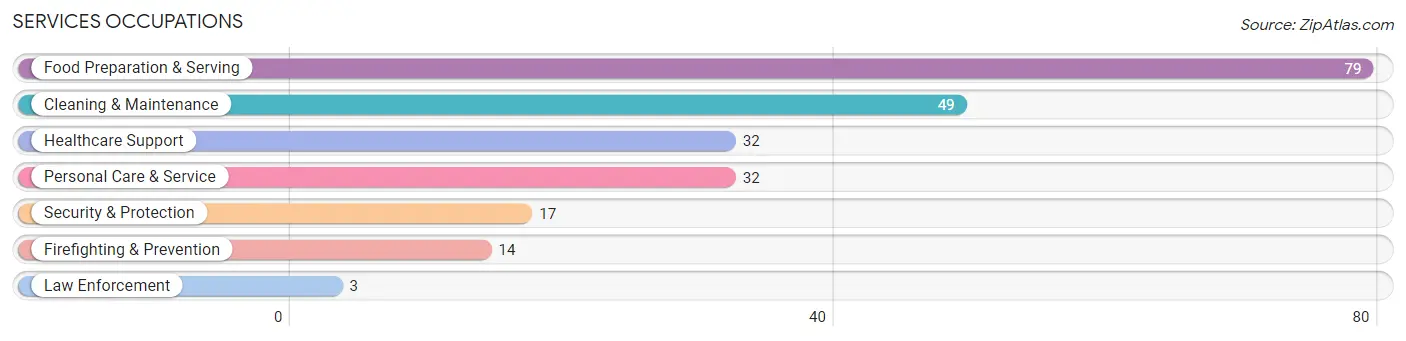
Services Occupations
The most common Services occupations in New Chicago are Food Preparation & Serving (79 | 8.3%), Cleaning & Maintenance (49 | 5.1%), Healthcare Support (32 | 3.4%), Personal Care & Service (32 | 3.4%), and Security & Protection (17 | 1.8%).
Services Occupations by Sex
Within the Services occupations in New Chicago, the most male-oriented occupations are Security & Protection (100.0%), Firefighting & Prevention (100.0%), and Law Enforcement (100.0%), while the most female-oriented occupations are Healthcare Support (100.0%), Personal Care & Service (81.2%), and Food Preparation & Serving (55.7%).
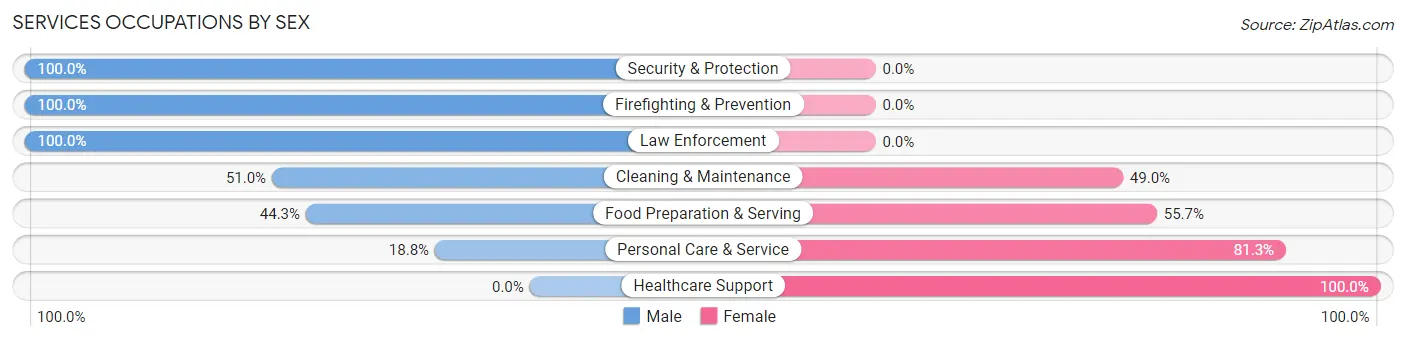
| Occupation | Male | Female |
| Healthcare Support | 0 (0.0%) | 32 (100.0%) |
| Security & Protection | 17 (100.0%) | 0 (0.0%) |
| Firefighting & Prevention | 14 (100.0%) | 0 (0.0%) |
| Law Enforcement | 3 (100.0%) | 0 (0.0%) |
| Food Preparation & Serving | 35 (44.3%) | 44 (55.7%) |
| Cleaning & Maintenance | 25 (51.0%) | 24 (49.0%) |
| Personal Care & Service | 6 (18.8%) | 26 (81.2%) |
| Total (Category) | 83 (39.7%) | 126 (60.3%) |
| Total (Overall) | 439 (46.2%) | 512 (53.8%) |
Sales and Office Occupations
The most common Sales and Office occupations in New Chicago are Office & Administration (148 | 15.6%), and Sales & Related (83 | 8.7%).

Sales and Office Occupations by Sex

| Occupation | Male | Female |
| Sales & Related | 25 (30.1%) | 58 (69.9%) |
| Office & Administration | 23 (15.5%) | 125 (84.5%) |
| Total (Category) | 48 (20.8%) | 183 (79.2%) |
| Total (Overall) | 439 (46.2%) | 512 (53.8%) |
Natural Resources, Construction and Maintenance Occupations
The most common Natural Resources, Construction and Maintenance occupations in New Chicago are Construction & Extraction (72 | 7.6%), and Installation, Maintenance & Repair (14 | 1.5%).

Natural Resources, Construction and Maintenance Occupations by Sex

| Occupation | Male | Female |
| Farming, Fishing & Forestry | 0 (0.0%) | 0 (0.0%) |
| Construction & Extraction | 72 (100.0%) | 0 (0.0%) |
| Installation, Maintenance & Repair | 14 (100.0%) | 0 (0.0%) |
| Total (Category) | 86 (100.0%) | 0 (0.0%) |
| Total (Overall) | 439 (46.2%) | 512 (53.8%) |
Production, Transportation and Moving Occupations
The most common Production, Transportation and Moving occupations in New Chicago are Production (101 | 10.6%), Material Moving (64 | 6.7%), and Transportation (34 | 3.6%).
Production, Transportation and Moving Occupations by Sex
| Occupation | Male | Female |
| Production | 88 (87.1%) | 13 (12.9%) |
| Transportation | 31 (91.2%) | 3 (8.8%) |
| Material Moving | 57 (89.1%) | 7 (10.9%) |
| Total (Category) | 176 (88.4%) | 23 (11.6%) |
| Total (Overall) | 439 (46.2%) | 512 (53.8%) |
Employment Industries by Sex in New Chicago
Employment Industries in New Chicago
The major employment industries in New Chicago include Health Care & Social Assistance (164 | 17.2%), Manufacturing (147 | 15.5%), Accommodation & Food Services (137 | 14.4%), Retail Trade (112 | 11.8%), and Construction (96 | 10.1%).
Employment Industries by Sex in New Chicago
The New Chicago industries that see more men than women are Wholesale Trade (100.0%), Real Estate, Rental & Leasing (100.0%), and Manufacturing (91.2%), whereas the industries that tend to have a higher number of women are Professional & Scientific (100.0%), Health Care & Social Assistance (94.5%), and Educational Services (90.9%).
| Industry | Male | Female |
| Agriculture, Fishing & Hunting | 0 (0.0%) | 0 (0.0%) |
| Mining, Quarrying, & Extraction | 0 (0.0%) | 0 (0.0%) |
| Construction | 85 (88.5%) | 11 (11.5%) |
| Manufacturing | 134 (91.2%) | 13 (8.8%) |
| Wholesale Trade | 8 (100.0%) | 0 (0.0%) |
| Retail Trade | 44 (39.3%) | 68 (60.7%) |
| Transportation & Warehousing | 50 (87.7%) | 7 (12.3%) |
| Utilities | 8 (57.1%) | 6 (42.9%) |
| Information | 0 (0.0%) | 0 (0.0%) |
| Finance & Insurance | 4 (20.0%) | 16 (80.0%) |
| Real Estate, Rental & Leasing | 4 (100.0%) | 0 (0.0%) |
| Professional & Scientific | 0 (0.0%) | 21 (100.0%) |
| Enterprise Management | 0 (0.0%) | 0 (0.0%) |
| Administrative & Support | 36 (73.5%) | 13 (26.5%) |
| Educational Services | 5 (9.1%) | 50 (90.9%) |
| Health Care & Social Assistance | 9 (5.5%) | 155 (94.5%) |
| Arts, Entertainment & Recreation | 11 (61.1%) | 7 (38.9%) |
| Accommodation & Food Services | 35 (25.6%) | 102 (74.5%) |
| Public Administration | 3 (15.0%) | 17 (85.0%) |
| Total | 439 (46.2%) | 512 (53.8%) |
Education in New Chicago
School Enrollment in New Chicago
The most common levels of schooling among the 677 students in New Chicago are college / undergraduate (162 | 23.9%), high school (147 | 21.7%), and middle school (134 | 19.8%).
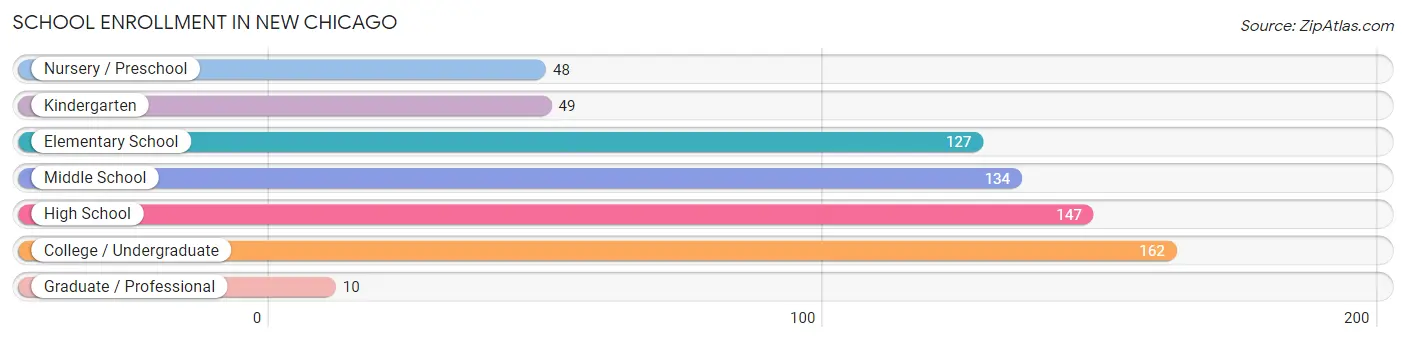
| School Level | # Students | % Students |
| Nursery / Preschool | 48 | 7.1% |
| Kindergarten | 49 | 7.2% |
| Elementary School | 127 | 18.8% |
| Middle School | 134 | 19.8% |
| High School | 147 | 21.7% |
| College / Undergraduate | 162 | 23.9% |
| Graduate / Professional | 10 | 1.5% |
| Total | 677 | 100.0% |
School Enrollment by Age by Funding Source in New Chicago
Out of a total of 677 students who are enrolled in schools in New Chicago, 128 (18.9%) attend a private institution, while the remaining 549 (81.1%) are enrolled in public schools. The age group of 10 to 14 year olds has the highest likelihood of being enrolled in private schools, with 42 (28.4% in the age bracket) enrolled. Conversely, the age group of 20 to 24 year olds has the lowest likelihood of being enrolled in a private school, with 25 (100.0% in the age bracket) attending a public institution.
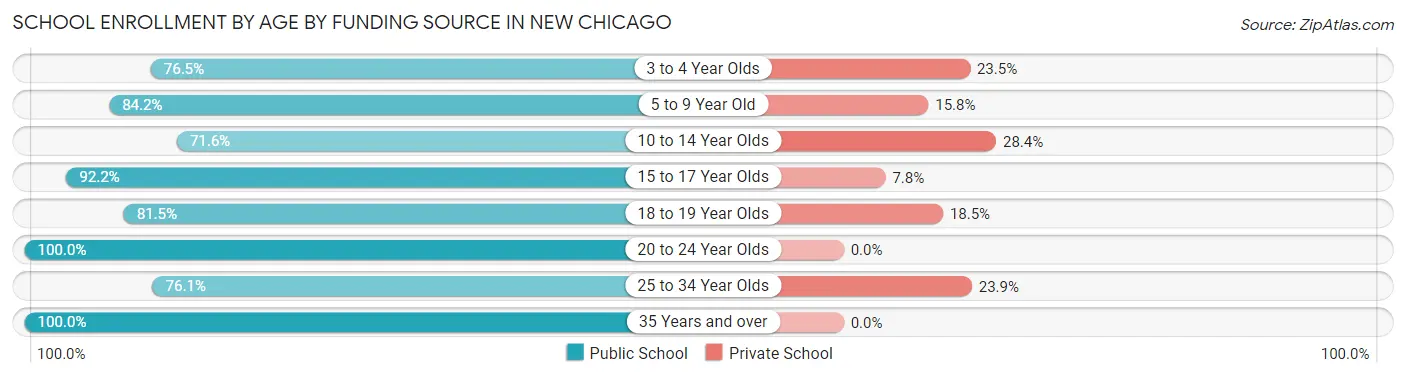
| Age Bracket | Public School | Private School |
| 3 to 4 Year Olds | 26 (76.5%) | 8 (23.5%) |
| 5 to 9 Year Old | 155 (84.2%) | 29 (15.8%) |
| 10 to 14 Year Olds | 106 (71.6%) | 42 (28.4%) |
| 15 to 17 Year Olds | 71 (92.2%) | 6 (7.8%) |
| 18 to 19 Year Olds | 97 (81.5%) | 22 (18.5%) |
| 20 to 24 Year Olds | 25 (100.0%) | 0 (0.0%) |
| 25 to 34 Year Olds | 67 (76.1%) | 21 (23.9%) |
| 35 Years and over | 2 (100.0%) | 0 (0.0%) |
| Total | 549 (81.1%) | 128 (18.9%) |
Educational Attainment by Field of Study in New Chicago
Education (66 | 31.0%), science & technology (51 | 23.9%), computers & mathematics (27 | 12.7%), business (25 | 11.7%), and communications (21 | 9.9%) are the most common fields of study among 213 individuals in New Chicago who have obtained a bachelor's degree or higher.
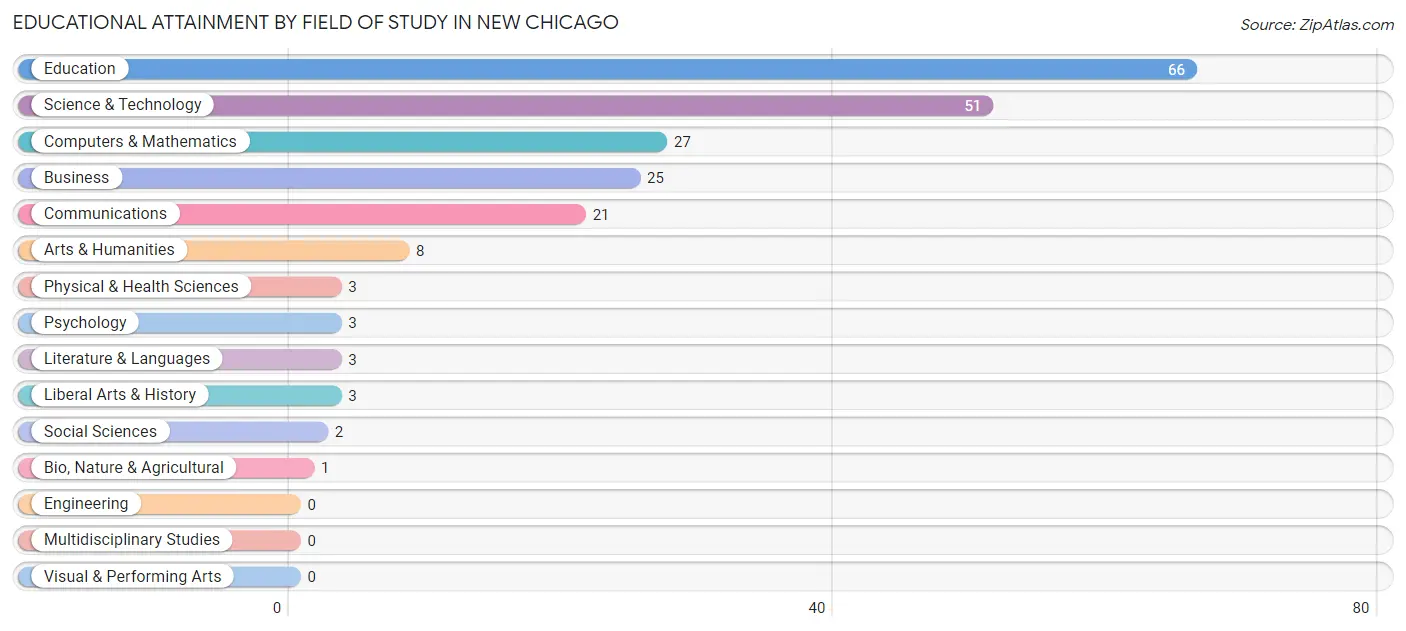
| Field of Study | # Graduates | % Graduates |
| Computers & Mathematics | 27 | 12.7% |
| Bio, Nature & Agricultural | 1 | 0.5% |
| Physical & Health Sciences | 3 | 1.4% |
| Psychology | 3 | 1.4% |
| Social Sciences | 2 | 0.9% |
| Engineering | 0 | 0.0% |
| Multidisciplinary Studies | 0 | 0.0% |
| Science & Technology | 51 | 23.9% |
| Business | 25 | 11.7% |
| Education | 66 | 31.0% |
| Literature & Languages | 3 | 1.4% |
| Liberal Arts & History | 3 | 1.4% |
| Visual & Performing Arts | 0 | 0.0% |
| Communications | 21 | 9.9% |
| Arts & Humanities | 8 | 3.8% |
| Total | 213 | 100.0% |
Transportation & Commute in New Chicago
Vehicle Availability by Sex in New Chicago
The most prevalent vehicle ownership categories in New Chicago are males with 2 vehicles (210, accounting for 47.8%) and females with 2 vehicles (211, making up 41.5%).
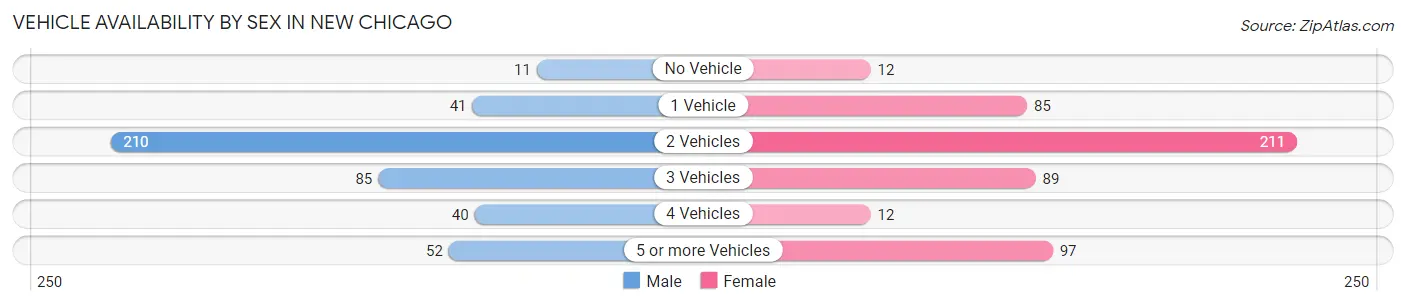
| Vehicles Available | Male | Female |
| No Vehicle | 11 (2.5%) | 12 (2.4%) |
| 1 Vehicle | 41 (9.3%) | 85 (16.8%) |
| 2 Vehicles | 210 (47.8%) | 211 (41.7%) |
| 3 Vehicles | 85 (19.4%) | 89 (17.6%) |
| 4 Vehicles | 40 (9.1%) | 12 (2.4%) |
| 5 or more Vehicles | 52 (11.8%) | 97 (19.2%) |
| Total | 439 (100.0%) | 506 (100.0%) |
Commute Time in New Chicago
The most frequently occuring commute durations in New Chicago are 15 to 19 minutes (237 commuters, 26.5%), 30 to 34 minutes (164 commuters, 18.3%), and 20 to 24 minutes (102 commuters, 11.4%).
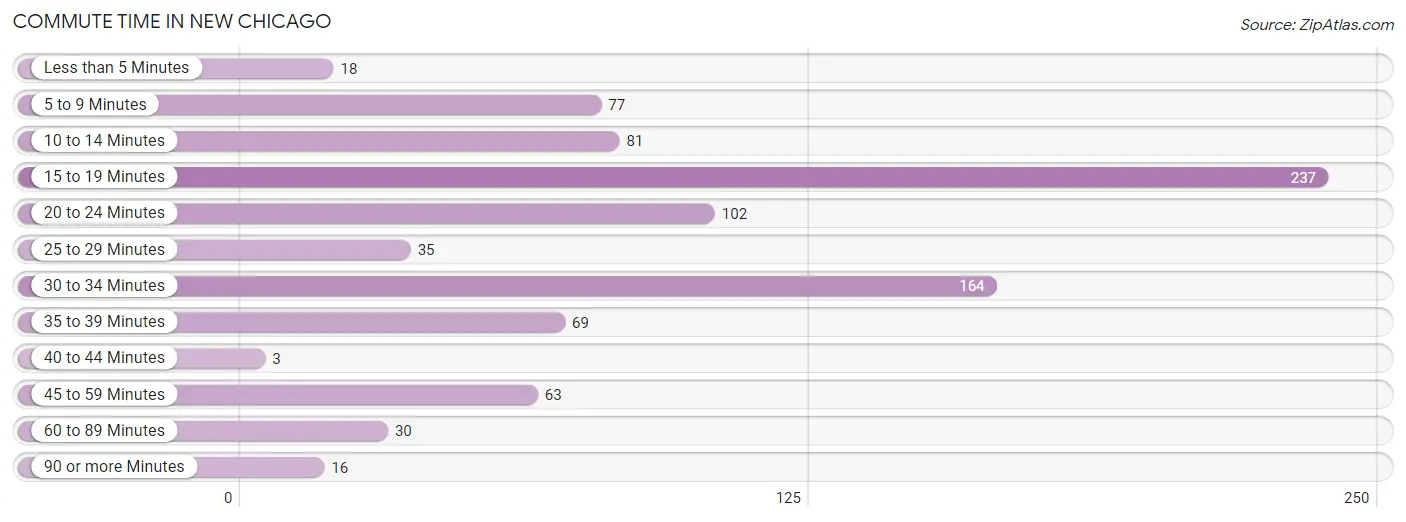
| Commute Time | # Commuters | % Commuters |
| Less than 5 Minutes | 18 | 2.0% |
| 5 to 9 Minutes | 77 | 8.6% |
| 10 to 14 Minutes | 81 | 9.0% |
| 15 to 19 Minutes | 237 | 26.5% |
| 20 to 24 Minutes | 102 | 11.4% |
| 25 to 29 Minutes | 35 | 3.9% |
| 30 to 34 Minutes | 164 | 18.3% |
| 35 to 39 Minutes | 69 | 7.7% |
| 40 to 44 Minutes | 3 | 0.3% |
| 45 to 59 Minutes | 63 | 7.0% |
| 60 to 89 Minutes | 30 | 3.4% |
| 90 or more Minutes | 16 | 1.8% |
Commute Time by Sex in New Chicago
The most common commute times in New Chicago are 30 to 34 minutes (89 commuters, 21.1%) for males and 15 to 19 minutes (153 commuters, 32.4%) for females.
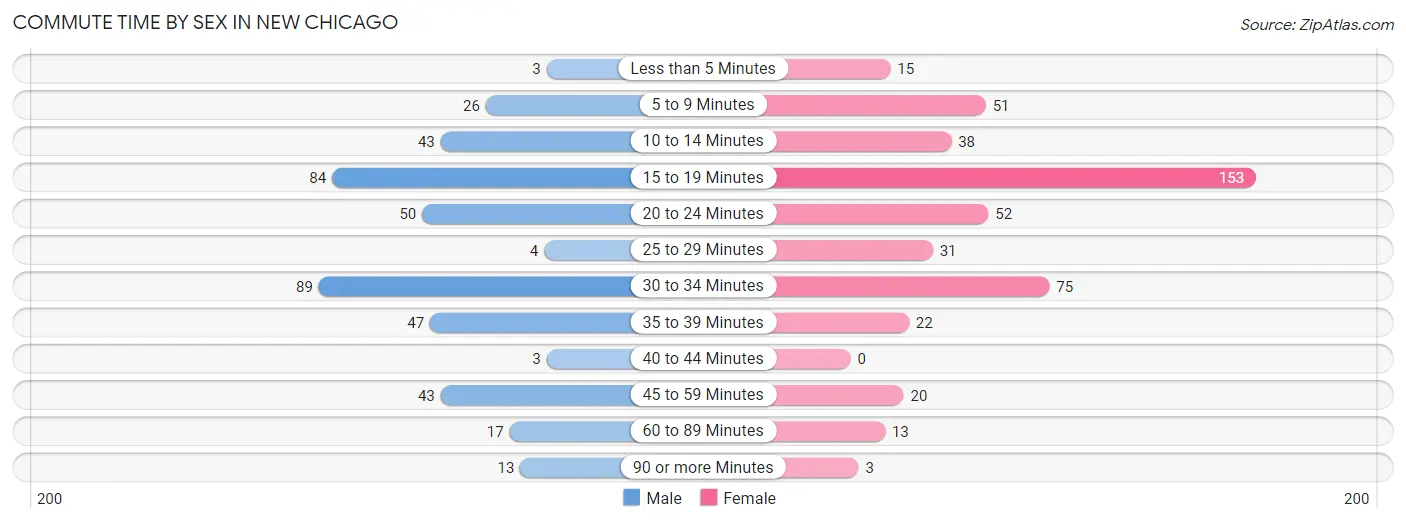
| Commute Time | Male | Female |
| Less than 5 Minutes | 3 (0.7%) | 15 (3.2%) |
| 5 to 9 Minutes | 26 (6.2%) | 51 (10.8%) |
| 10 to 14 Minutes | 43 (10.2%) | 38 (8.0%) |
| 15 to 19 Minutes | 84 (19.9%) | 153 (32.4%) |
| 20 to 24 Minutes | 50 (11.8%) | 52 (11.0%) |
| 25 to 29 Minutes | 4 (0.9%) | 31 (6.6%) |
| 30 to 34 Minutes | 89 (21.1%) | 75 (15.9%) |
| 35 to 39 Minutes | 47 (11.1%) | 22 (4.6%) |
| 40 to 44 Minutes | 3 (0.7%) | 0 (0.0%) |
| 45 to 59 Minutes | 43 (10.2%) | 20 (4.2%) |
| 60 to 89 Minutes | 17 (4.0%) | 13 (2.8%) |
| 90 or more Minutes | 13 (3.1%) | 3 (0.6%) |
Time of Departure to Work by Sex in New Chicago
The most frequent times of departure to work in New Chicago are 12:00 AM to 4:59 AM (76, 18.0%) for males and 7:30 AM to 7:59 AM (82, 17.3%) for females.
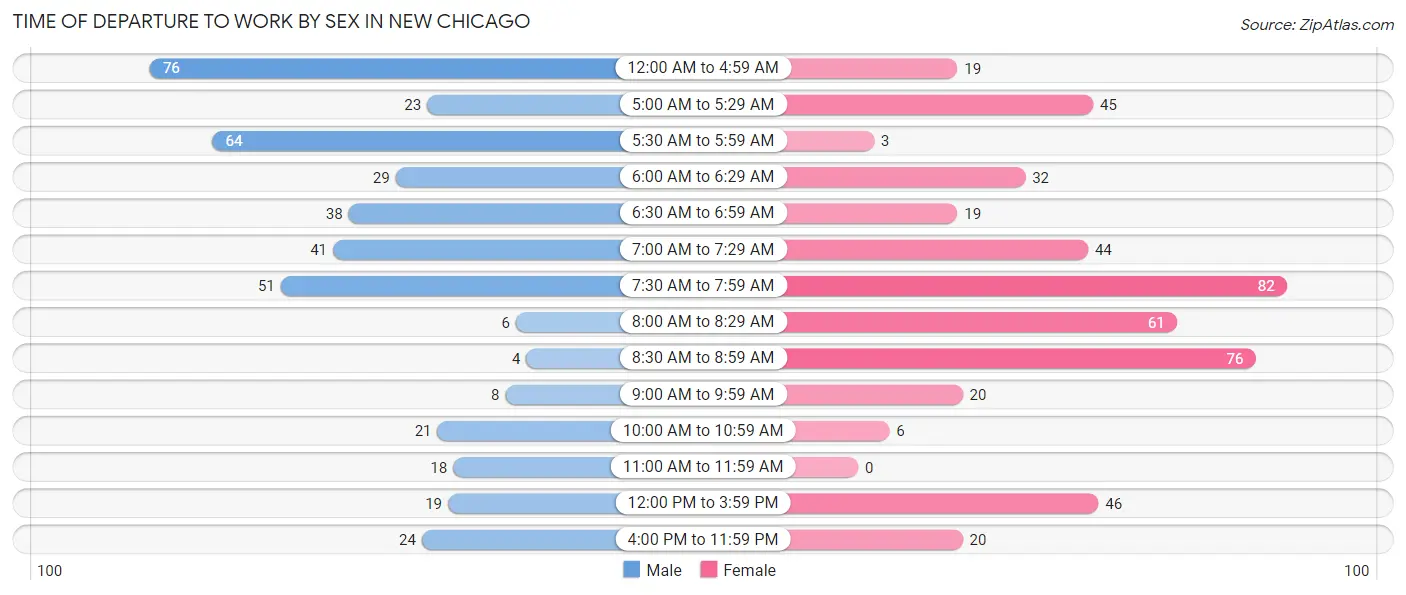
| Time of Departure | Male | Female |
| 12:00 AM to 4:59 AM | 76 (18.0%) | 19 (4.0%) |
| 5:00 AM to 5:29 AM | 23 (5.4%) | 45 (9.5%) |
| 5:30 AM to 5:59 AM | 64 (15.2%) | 3 (0.6%) |
| 6:00 AM to 6:29 AM | 29 (6.9%) | 32 (6.8%) |
| 6:30 AM to 6:59 AM | 38 (9.0%) | 19 (4.0%) |
| 7:00 AM to 7:29 AM | 41 (9.7%) | 44 (9.3%) |
| 7:30 AM to 7:59 AM | 51 (12.1%) | 82 (17.3%) |
| 8:00 AM to 8:29 AM | 6 (1.4%) | 61 (12.9%) |
| 8:30 AM to 8:59 AM | 4 (0.9%) | 76 (16.1%) |
| 9:00 AM to 9:59 AM | 8 (1.9%) | 20 (4.2%) |
| 10:00 AM to 10:59 AM | 21 (5.0%) | 6 (1.3%) |
| 11:00 AM to 11:59 AM | 18 (4.3%) | 0 (0.0%) |
| 12:00 PM to 3:59 PM | 19 (4.5%) | 46 (9.7%) |
| 4:00 PM to 11:59 PM | 24 (5.7%) | 20 (4.2%) |
| Total | 422 (100.0%) | 473 (100.0%) |
Housing Occupancy in New Chicago
Occupancy by Ownership in New Chicago
Of the total 743 dwellings in New Chicago, owner-occupied units account for 526 (70.8%), while renter-occupied units make up 217 (29.2%).
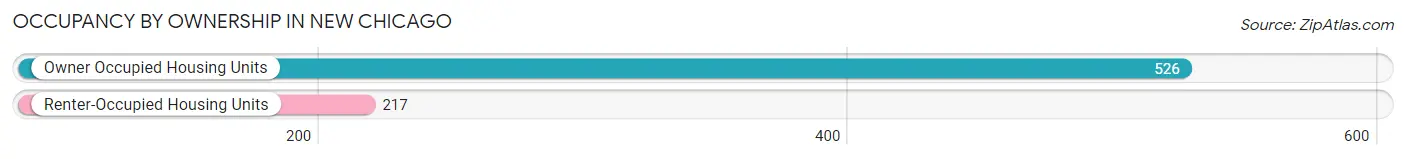
| Occupancy | # Housing Units | % Housing Units |
| Owner Occupied Housing Units | 526 | 70.8% |
| Renter-Occupied Housing Units | 217 | 29.2% |
| Total Occupied Housing Units | 743 | 100.0% |
Occupancy by Household Size in New Chicago
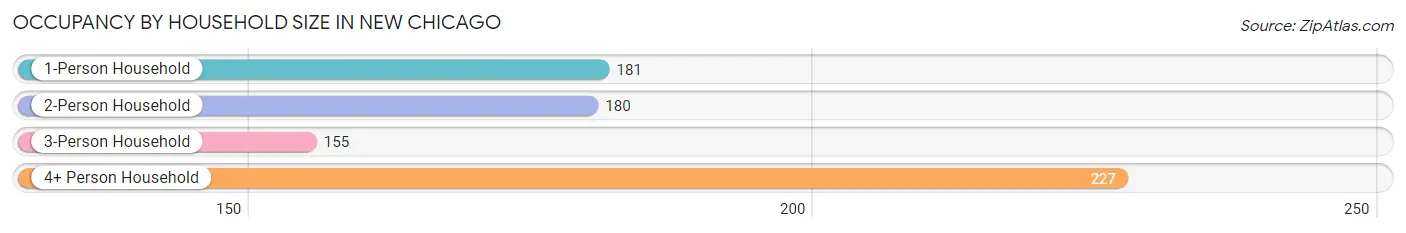
| Household Size | # Housing Units | % Housing Units |
| 1-Person Household | 181 | 24.4% |
| 2-Person Household | 180 | 24.2% |
| 3-Person Household | 155 | 20.9% |
| 4+ Person Household | 227 | 30.5% |
| Total Housing Units | 743 | 100.0% |
Occupancy by Ownership by Household Size in New Chicago
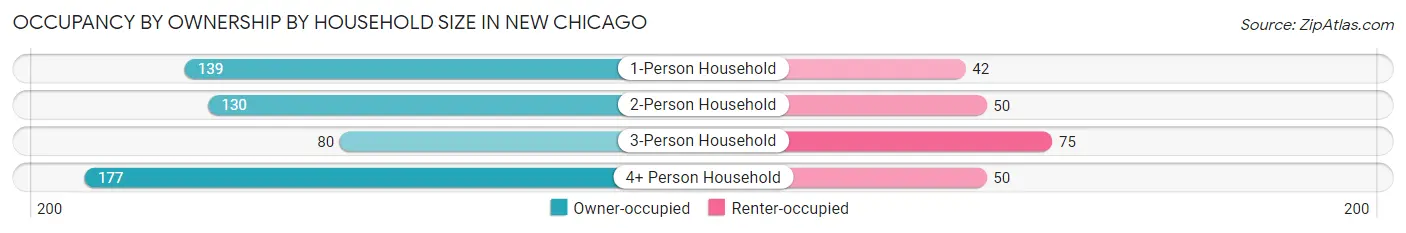
| Household Size | Owner-occupied | Renter-occupied |
| 1-Person Household | 139 (76.8%) | 42 (23.2%) |
| 2-Person Household | 130 (72.2%) | 50 (27.8%) |
| 3-Person Household | 80 (51.6%) | 75 (48.4%) |
| 4+ Person Household | 177 (78.0%) | 50 (22.0%) |
| Total Housing Units | 526 (70.8%) | 217 (29.2%) |
Occupancy by Educational Attainment in New Chicago
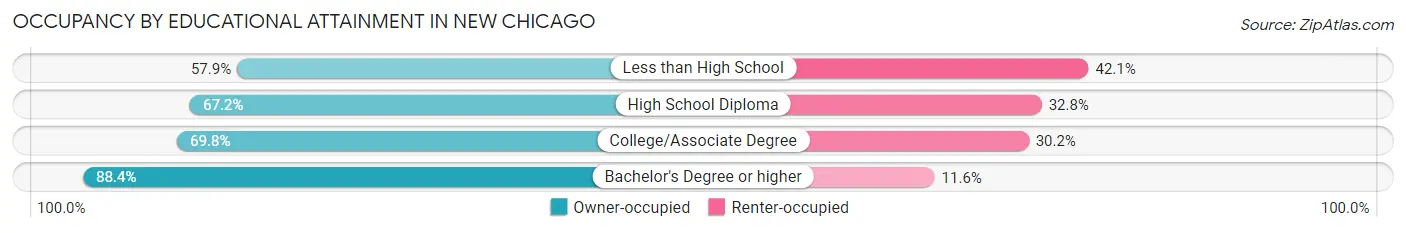
| Household Size | Owner-occupied | Renter-occupied |
| Less than High School | 55 (57.9%) | 40 (42.1%) |
| High School Diploma | 176 (67.2%) | 86 (32.8%) |
| College/Associate Degree | 173 (69.8%) | 75 (30.2%) |
| Bachelor's Degree or higher | 122 (88.4%) | 16 (11.6%) |
Occupancy by Age of Householder in New Chicago
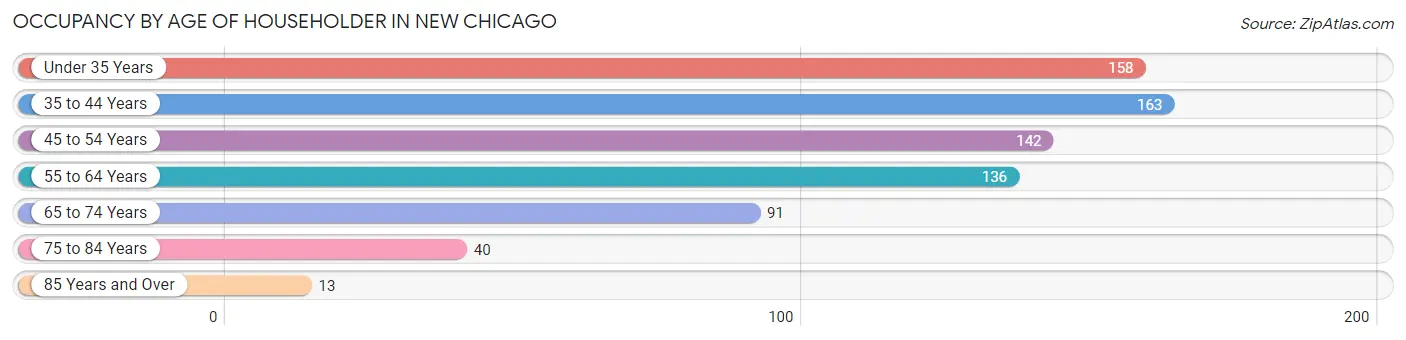
| Age Bracket | # Households | % Households |
| Under 35 Years | 158 | 21.3% |
| 35 to 44 Years | 163 | 21.9% |
| 45 to 54 Years | 142 | 19.1% |
| 55 to 64 Years | 136 | 18.3% |
| 65 to 74 Years | 91 | 12.2% |
| 75 to 84 Years | 40 | 5.4% |
| 85 Years and Over | 13 | 1.8% |
| Total | 743 | 100.0% |
Housing Finances in New Chicago
Median Income by Occupancy in New Chicago
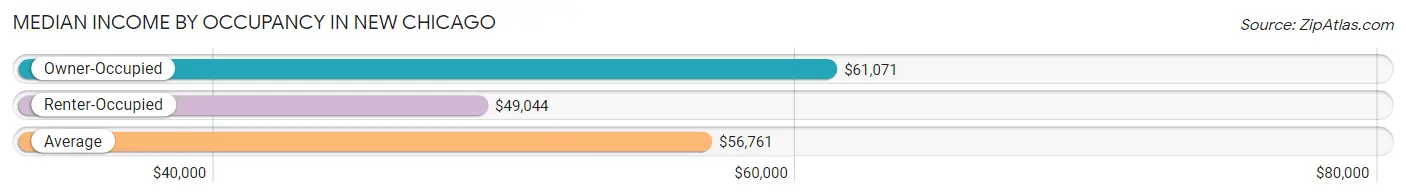
| Occupancy Type | # Households | Median Income |
| Owner-Occupied | 526 (70.8%) | $61,071 |
| Renter-Occupied | 217 (29.2%) | $49,044 |
| Average | 743 (100.0%) | $56,761 |
Occupancy by Householder Income Bracket in New Chicago

| Income Bracket | Owner-occupied | Renter-occupied |
| Less than $5,000 | 23 (4.4%) | 6 (2.8%) |
| $5,000 to $9,999 | 3 (0.6%) | 17 (7.8%) |
| $10,000 to $14,999 | 32 (6.1%) | 9 (4.2%) |
| $15,000 to $19,999 | 26 (4.9%) | 16 (7.4%) |
| $20,000 to $24,999 | 6 (1.1%) | 7 (3.2%) |
| $25,000 to $34,999 | 45 (8.6%) | 24 (11.1%) |
| $35,000 to $49,999 | 63 (12.0%) | 36 (16.6%) |
| $50,000 to $74,999 | 90 (17.1%) | 36 (16.6%) |
| $75,000 to $99,999 | 71 (13.5%) | 41 (18.9%) |
| $100,000 to $149,999 | 115 (21.9%) | 7 (3.2%) |
| $150,000 or more | 52 (9.9%) | 18 (8.3%) |
| Total | 526 (100.0%) | 217 (100.0%) |
Monthly Housing Cost Tiers in New Chicago
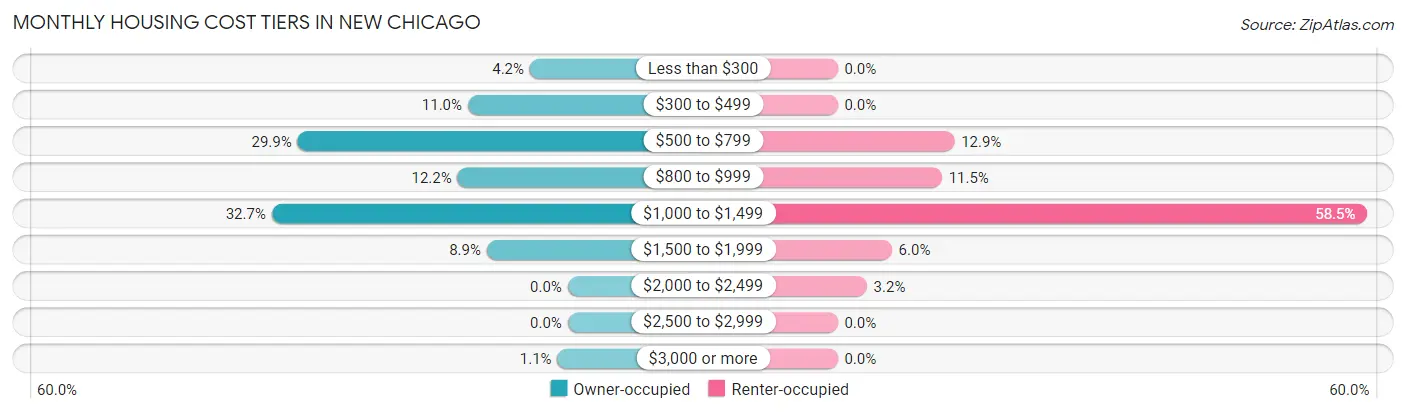
| Monthly Cost | Owner-occupied | Renter-occupied |
| Less than $300 | 22 (4.2%) | 0 (0.0%) |
| $300 to $499 | 58 (11.0%) | 0 (0.0%) |
| $500 to $799 | 157 (29.8%) | 28 (12.9%) |
| $800 to $999 | 64 (12.2%) | 25 (11.5%) |
| $1,000 to $1,499 | 172 (32.7%) | 127 (58.5%) |
| $1,500 to $1,999 | 47 (8.9%) | 13 (6.0%) |
| $2,000 to $2,499 | 0 (0.0%) | 7 (3.2%) |
| $2,500 to $2,999 | 0 (0.0%) | 0 (0.0%) |
| $3,000 or more | 6 (1.1%) | 0 (0.0%) |
| Total | 526 (100.0%) | 217 (100.0%) |
Physical Housing Characteristics in New Chicago
Housing Structures in New Chicago
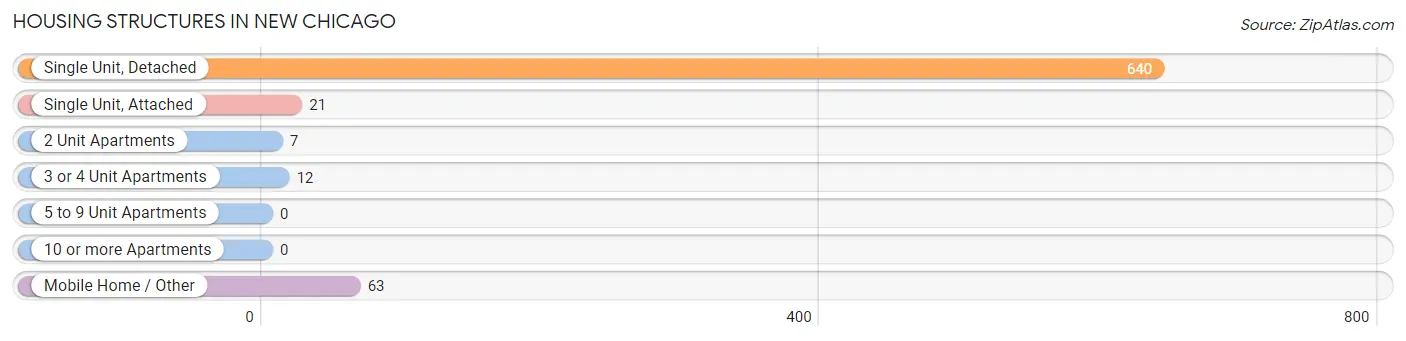
| Structure Type | # Housing Units | % Housing Units |
| Single Unit, Detached | 640 | 86.1% |
| Single Unit, Attached | 21 | 2.8% |
| 2 Unit Apartments | 7 | 0.9% |
| 3 or 4 Unit Apartments | 12 | 1.6% |
| 5 to 9 Unit Apartments | 0 | 0.0% |
| 10 or more Apartments | 0 | 0.0% |
| Mobile Home / Other | 63 | 8.5% |
| Total | 743 | 100.0% |
Housing Structures by Occupancy in New Chicago
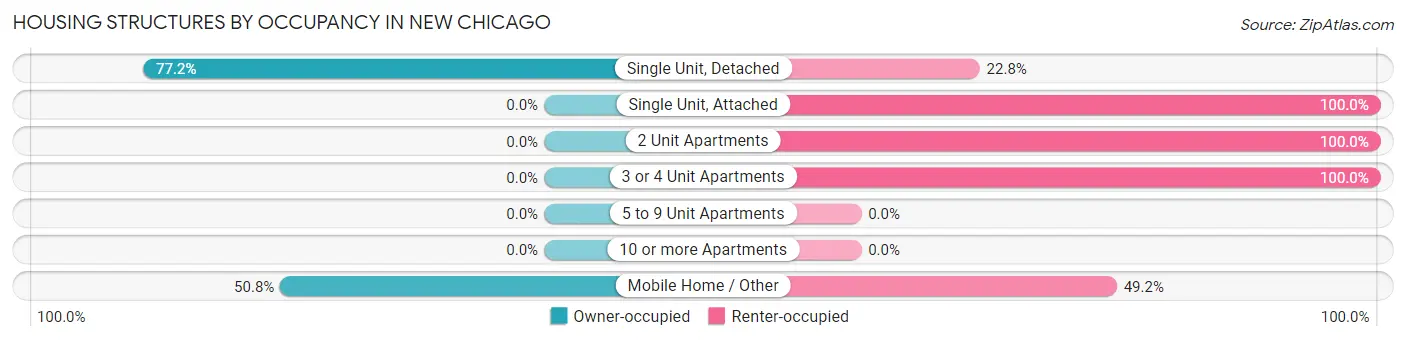
| Structure Type | Owner-occupied | Renter-occupied |
| Single Unit, Detached | 494 (77.2%) | 146 (22.8%) |
| Single Unit, Attached | 0 (0.0%) | 21 (100.0%) |
| 2 Unit Apartments | 0 (0.0%) | 7 (100.0%) |
| 3 or 4 Unit Apartments | 0 (0.0%) | 12 (100.0%) |
| 5 to 9 Unit Apartments | 0 (0.0%) | 0 (0.0%) |
| 10 or more Apartments | 0 (0.0%) | 0 (0.0%) |
| Mobile Home / Other | 32 (50.8%) | 31 (49.2%) |
| Total | 526 (70.8%) | 217 (29.2%) |
Housing Structures by Number of Rooms in New Chicago
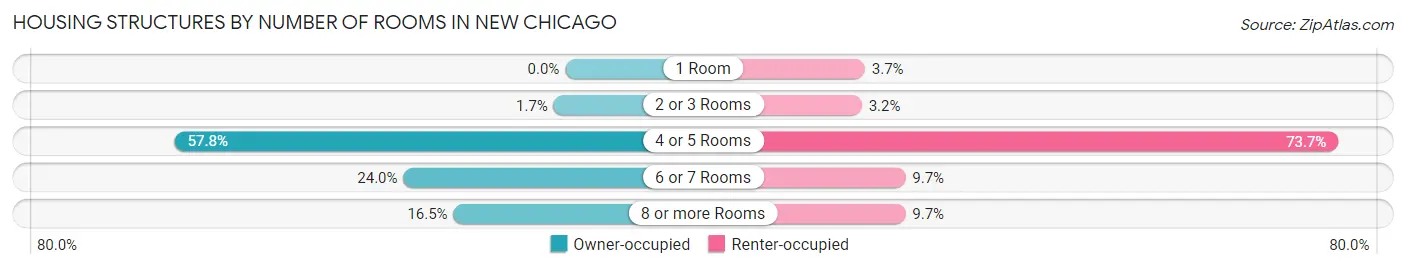
| Number of Rooms | Owner-occupied | Renter-occupied |
| 1 Room | 0 (0.0%) | 8 (3.7%) |
| 2 or 3 Rooms | 9 (1.7%) | 7 (3.2%) |
| 4 or 5 Rooms | 304 (57.8%) | 160 (73.7%) |
| 6 or 7 Rooms | 126 (23.9%) | 21 (9.7%) |
| 8 or more Rooms | 87 (16.5%) | 21 (9.7%) |
| Total | 526 (100.0%) | 217 (100.0%) |
Housing Structure by Heating Type in New Chicago
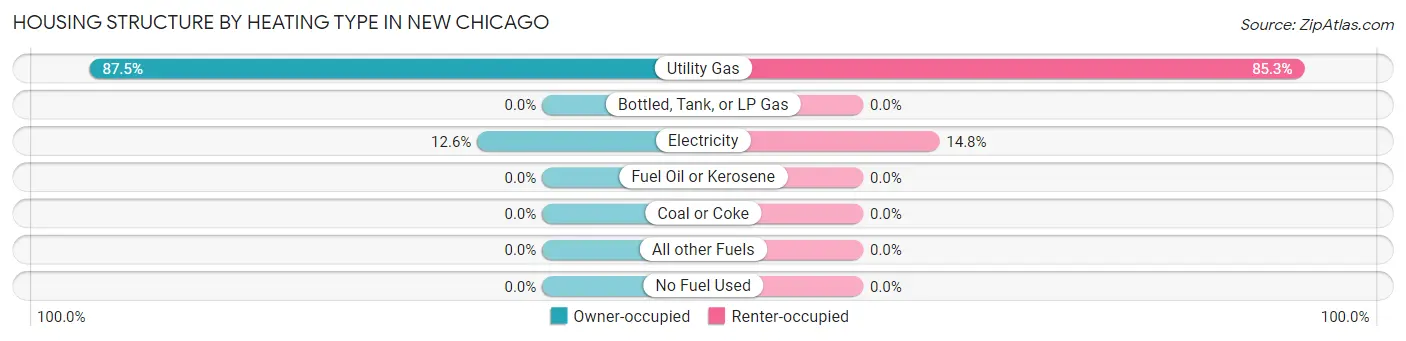
| Heating Type | Owner-occupied | Renter-occupied |
| Utility Gas | 460 (87.5%) | 185 (85.3%) |
| Bottled, Tank, or LP Gas | 0 (0.0%) | 0 (0.0%) |
| Electricity | 66 (12.6%) | 32 (14.7%) |
| Fuel Oil or Kerosene | 0 (0.0%) | 0 (0.0%) |
| Coal or Coke | 0 (0.0%) | 0 (0.0%) |
| All other Fuels | 0 (0.0%) | 0 (0.0%) |
| No Fuel Used | 0 (0.0%) | 0 (0.0%) |
| Total | 526 (100.0%) | 217 (100.0%) |
Household Vehicle Usage in New Chicago
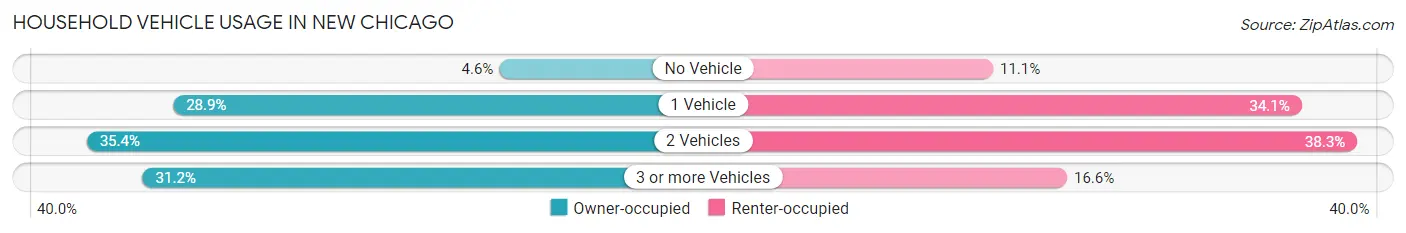
| Vehicles per Household | Owner-occupied | Renter-occupied |
| No Vehicle | 24 (4.6%) | 24 (11.1%) |
| 1 Vehicle | 152 (28.9%) | 74 (34.1%) |
| 2 Vehicles | 186 (35.4%) | 83 (38.3%) |
| 3 or more Vehicles | 164 (31.2%) | 36 (16.6%) |
| Total | 526 (100.0%) | 217 (100.0%) |
Real Estate & Mortgages in New Chicago
Real Estate and Mortgage Overview in New Chicago
| Characteristic | Without Mortgage | With Mortgage |
| Housing Units | 223 | 303 |
| Median Property Value | $125,400 | $111,200 |
| Median Household Income | $55,250 | $48 |
| Monthly Housing Costs | $570 | $6 |
| Real Estate Taxes | $1,440 | $11 |
Property Value by Mortgage Status in New Chicago
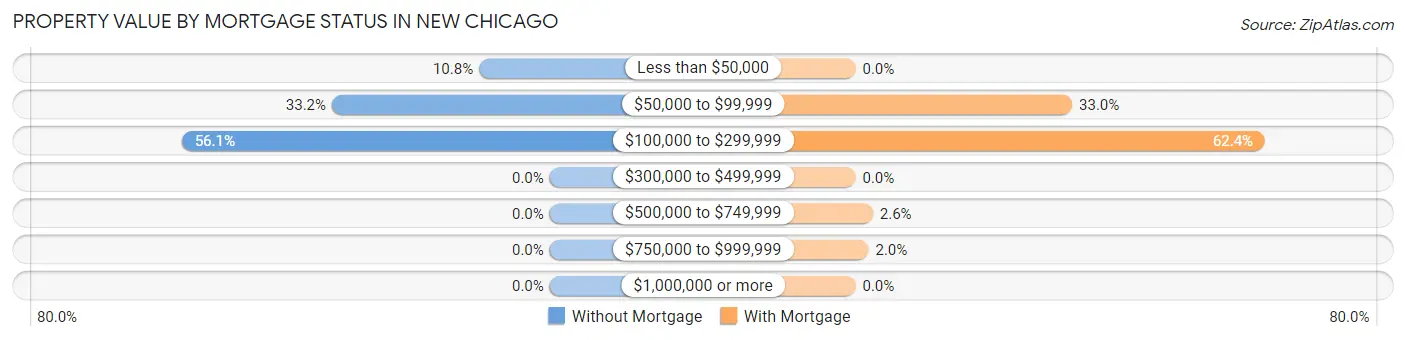
| Property Value | Without Mortgage | With Mortgage |
| Less than $50,000 | 24 (10.8%) | 0 (0.0%) |
| $50,000 to $99,999 | 74 (33.2%) | 100 (33.0%) |
| $100,000 to $299,999 | 125 (56.0%) | 189 (62.4%) |
| $300,000 to $499,999 | 0 (0.0%) | 0 (0.0%) |
| $500,000 to $749,999 | 0 (0.0%) | 8 (2.6%) |
| $750,000 to $999,999 | 0 (0.0%) | 6 (2.0%) |
| $1,000,000 or more | 0 (0.0%) | 0 (0.0%) |
| Total | 223 (100.0%) | 303 (100.0%) |
Household Income by Mortgage Status in New Chicago
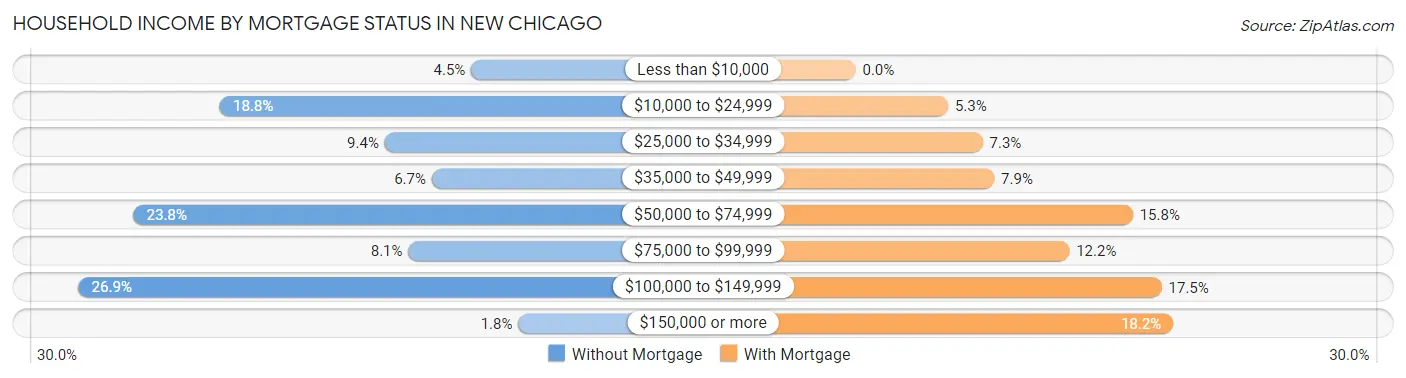
| Household Income | Without Mortgage | With Mortgage |
| Less than $10,000 | 10 (4.5%) | 0 (0.0%) |
| $10,000 to $24,999 | 42 (18.8%) | 16 (5.3%) |
| $25,000 to $34,999 | 21 (9.4%) | 22 (7.3%) |
| $35,000 to $49,999 | 15 (6.7%) | 24 (7.9%) |
| $50,000 to $74,999 | 53 (23.8%) | 48 (15.8%) |
| $75,000 to $99,999 | 18 (8.1%) | 37 (12.2%) |
| $100,000 to $149,999 | 60 (26.9%) | 53 (17.5%) |
| $150,000 or more | 4 (1.8%) | 55 (18.1%) |
| Total | 223 (100.0%) | 303 (100.0%) |
Property Value to Household Income Ratio in New Chicago
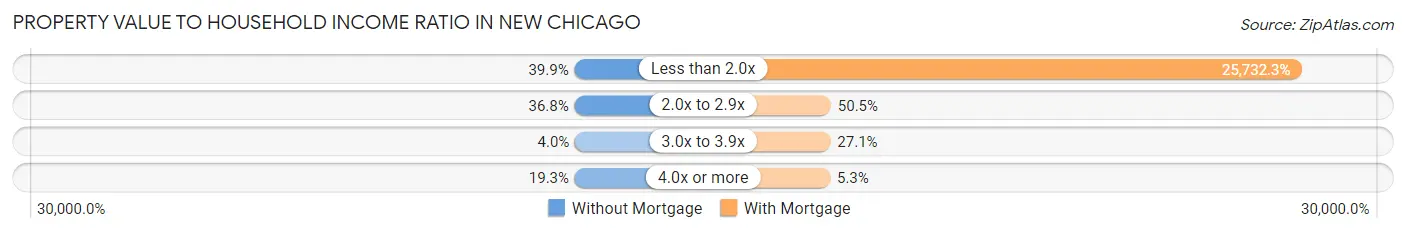
| Value-to-Income Ratio | Without Mortgage | With Mortgage |
| Less than 2.0x | 89 (39.9%) | 77,969 (25,732.3%) |
| 2.0x to 2.9x | 82 (36.8%) | 153 (50.5%) |
| 3.0x to 3.9x | 9 (4.0%) | 82 (27.1%) |
| 4.0x or more | 43 (19.3%) | 16 (5.3%) |
| Total | 223 (100.0%) | 303 (100.0%) |
Real Estate Taxes by Mortgage Status in New Chicago

| Property Taxes | Without Mortgage | With Mortgage |
| Less than $800 | 54 (24.2%) | 9 (3.0%) |
| $800 to $1,499 | 57 (25.6%) | 95 (31.4%) |
| $800 to $1,499 | 99 (44.4%) | 114 (37.6%) |
| Total | 223 (100.0%) | 303 (100.0%) |
Health & Disability in New Chicago
Health Insurance Coverage by Age in New Chicago
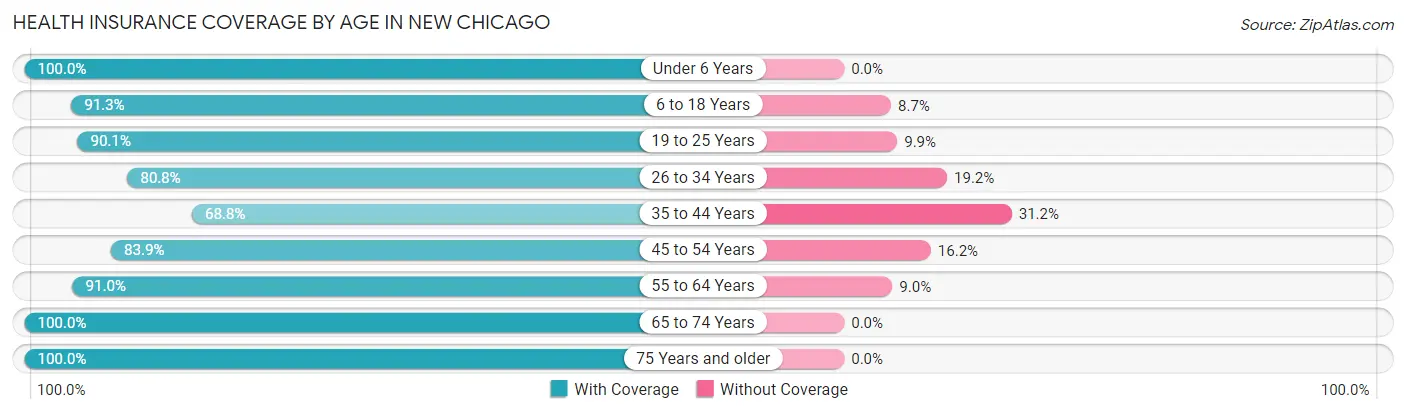
| Age Bracket | With Coverage | Without Coverage |
| Under 6 Years | 215 (100.0%) | 0 (0.0%) |
| 6 to 18 Years | 429 (91.3%) | 41 (8.7%) |
| 19 to 25 Years | 155 (90.1%) | 17 (9.9%) |
| 26 to 34 Years | 215 (80.8%) | 51 (19.2%) |
| 35 to 44 Years | 207 (68.8%) | 94 (31.2%) |
| 45 to 54 Years | 218 (83.9%) | 42 (16.2%) |
| 55 to 64 Years | 203 (91.0%) | 20 (9.0%) |
| 65 to 74 Years | 127 (100.0%) | 0 (0.0%) |
| 75 Years and older | 77 (100.0%) | 0 (0.0%) |
| Total | 1,846 (87.5%) | 265 (12.6%) |
Health Insurance Coverage by Citizenship Status in New Chicago

| Citizenship Status | With Coverage | Without Coverage |
| Native Born | 215 (100.0%) | 0 (0.0%) |
| Foreign Born, Citizen | 429 (91.3%) | 41 (8.7%) |
| Foreign Born, not a Citizen | 155 (90.1%) | 17 (9.9%) |
Health Insurance Coverage by Household Income in New Chicago
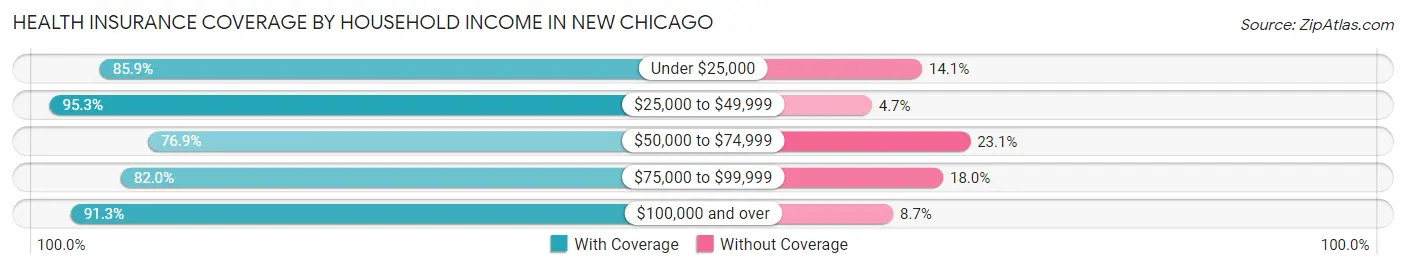
| Household Income | With Coverage | Without Coverage |
| Under $25,000 | 201 (85.9%) | 33 (14.1%) |
| $25,000 to $49,999 | 407 (95.3%) | 20 (4.7%) |
| $50,000 to $74,999 | 296 (76.9%) | 89 (23.1%) |
| $75,000 to $99,999 | 268 (82.0%) | 59 (18.0%) |
| $100,000 and over | 674 (91.3%) | 64 (8.7%) |
Public vs Private Health Insurance Coverage by Age in New Chicago
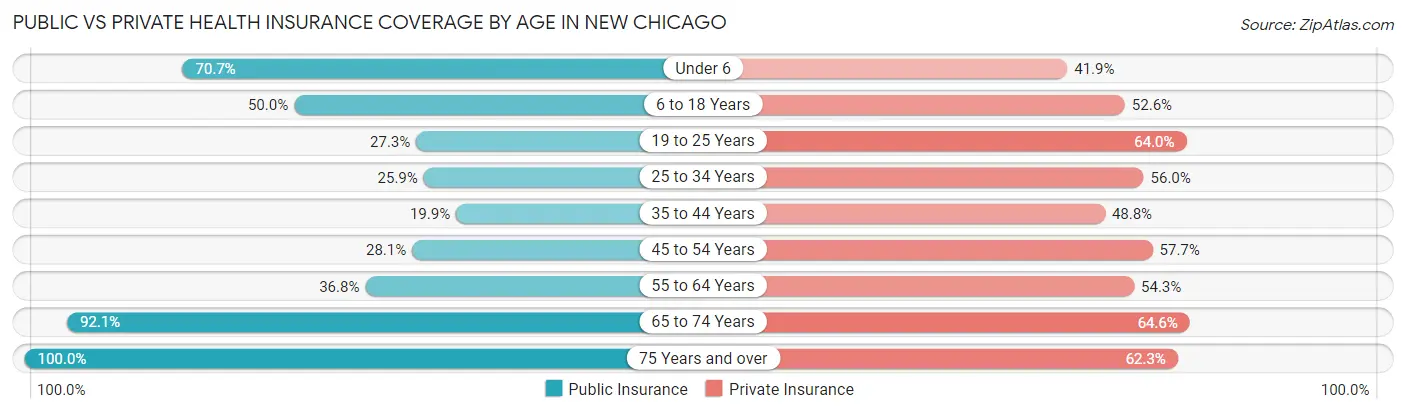
| Age Bracket | Public Insurance | Private Insurance |
| Under 6 | 152 (70.7%) | 90 (41.9%) |
| 6 to 18 Years | 235 (50.0%) | 247 (52.5%) |
| 19 to 25 Years | 47 (27.3%) | 110 (63.9%) |
| 25 to 34 Years | 69 (25.9%) | 149 (56.0%) |
| 35 to 44 Years | 60 (19.9%) | 147 (48.8%) |
| 45 to 54 Years | 73 (28.1%) | 150 (57.7%) |
| 55 to 64 Years | 82 (36.8%) | 121 (54.3%) |
| 65 to 74 Years | 117 (92.1%) | 82 (64.6%) |
| 75 Years and over | 77 (100.0%) | 48 (62.3%) |
| Total | 912 (43.2%) | 1,144 (54.2%) |
Disability Status by Sex by Age in New Chicago
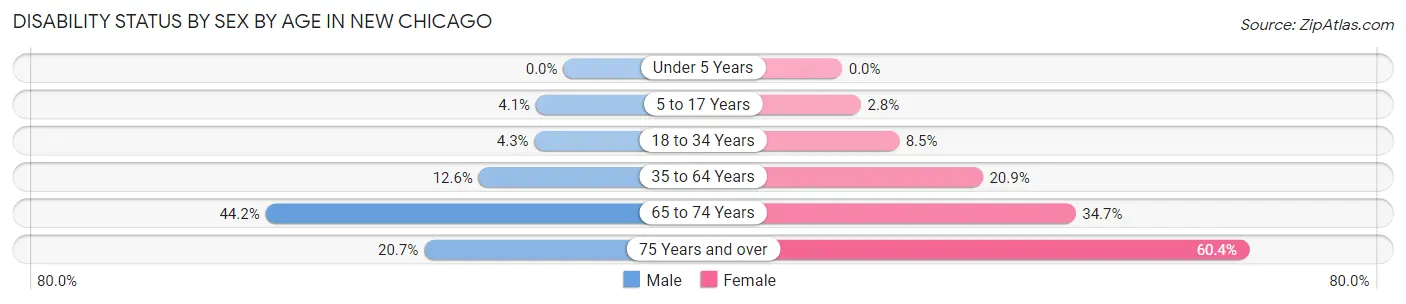
| Age Bracket | Male | Female |
| Under 5 Years | 0 (0.0%) | 0 (0.0%) |
| 5 to 17 Years | 10 (4.1%) | 5 (2.8%) |
| 18 to 34 Years | 11 (4.3%) | 24 (8.5%) |
| 35 to 64 Years | 45 (12.6%) | 89 (20.9%) |
| 65 to 74 Years | 23 (44.2%) | 26 (34.7%) |
| 75 Years and over | 6 (20.7%) | 29 (60.4%) |
Disability Class by Sex by Age in New Chicago
Disability Class: Hearing Difficulty
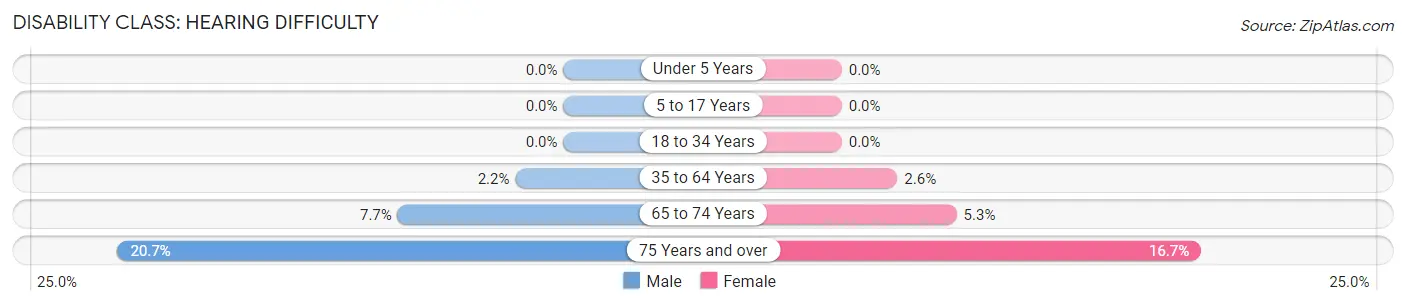
| Age Bracket | Male | Female |
| Under 5 Years | 0 (0.0%) | 0 (0.0%) |
| 5 to 17 Years | 0 (0.0%) | 0 (0.0%) |
| 18 to 34 Years | 0 (0.0%) | 0 (0.0%) |
| 35 to 64 Years | 8 (2.2%) | 11 (2.6%) |
| 65 to 74 Years | 4 (7.7%) | 4 (5.3%) |
| 75 Years and over | 6 (20.7%) | 8 (16.7%) |
Disability Class: Vision Difficulty
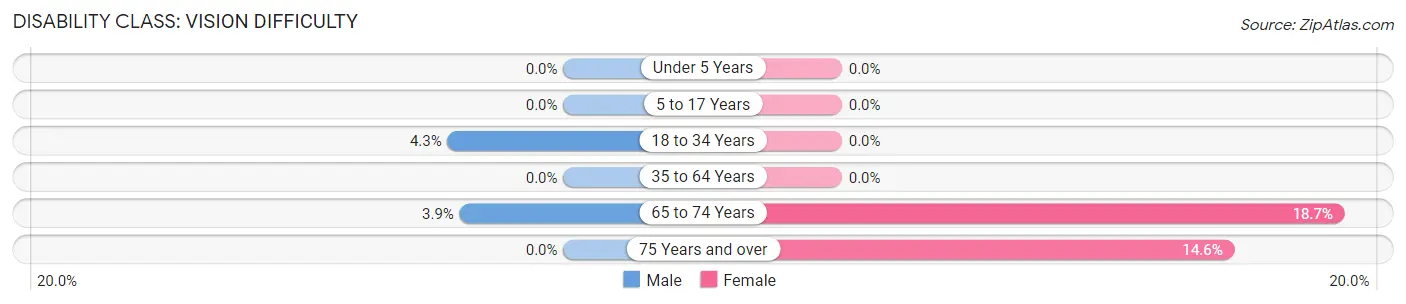
| Age Bracket | Male | Female |
| Under 5 Years | 0 (0.0%) | 0 (0.0%) |
| 5 to 17 Years | 0 (0.0%) | 0 (0.0%) |
| 18 to 34 Years | 11 (4.3%) | 0 (0.0%) |
| 35 to 64 Years | 0 (0.0%) | 0 (0.0%) |
| 65 to 74 Years | 2 (3.8%) | 14 (18.7%) |
| 75 Years and over | 0 (0.0%) | 7 (14.6%) |
Disability Class: Cognitive Difficulty
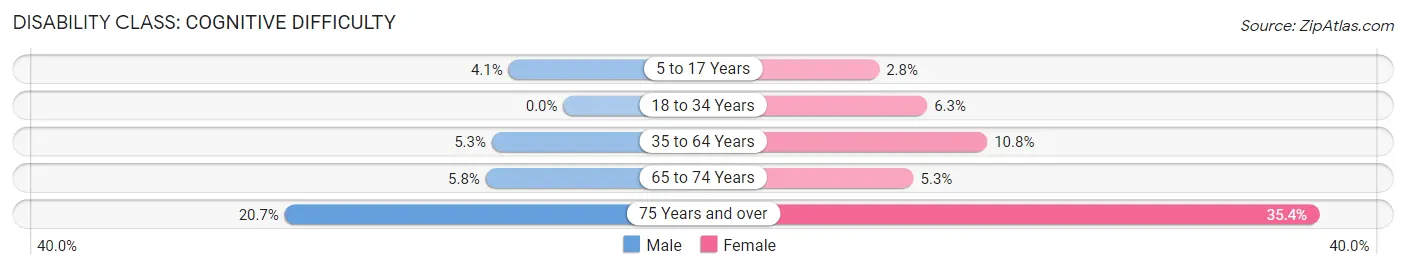
| Age Bracket | Male | Female |
| 5 to 17 Years | 10 (4.1%) | 5 (2.8%) |
| 18 to 34 Years | 0 (0.0%) | 18 (6.3%) |
| 35 to 64 Years | 19 (5.3%) | 46 (10.8%) |
| 65 to 74 Years | 3 (5.8%) | 4 (5.3%) |
| 75 Years and over | 6 (20.7%) | 17 (35.4%) |
Disability Class: Ambulatory Difficulty
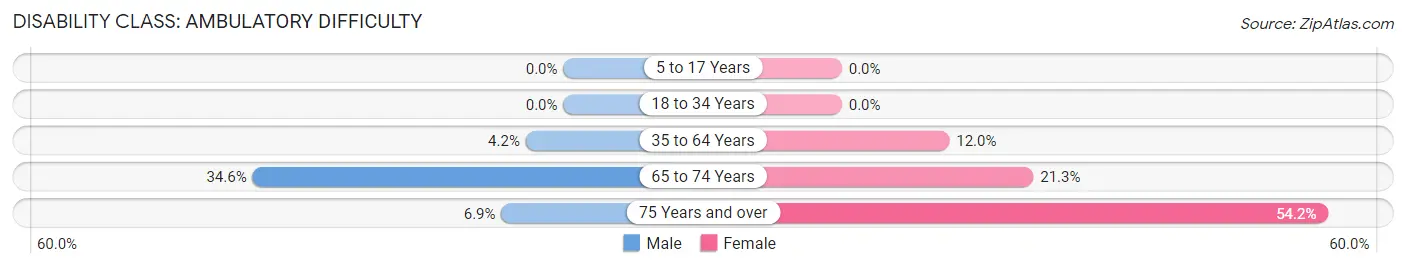
| Age Bracket | Male | Female |
| 5 to 17 Years | 0 (0.0%) | 0 (0.0%) |
| 18 to 34 Years | 0 (0.0%) | 0 (0.0%) |
| 35 to 64 Years | 15 (4.2%) | 51 (12.0%) |
| 65 to 74 Years | 18 (34.6%) | 16 (21.3%) |
| 75 Years and over | 2 (6.9%) | 26 (54.2%) |
Disability Class: Self-Care Difficulty
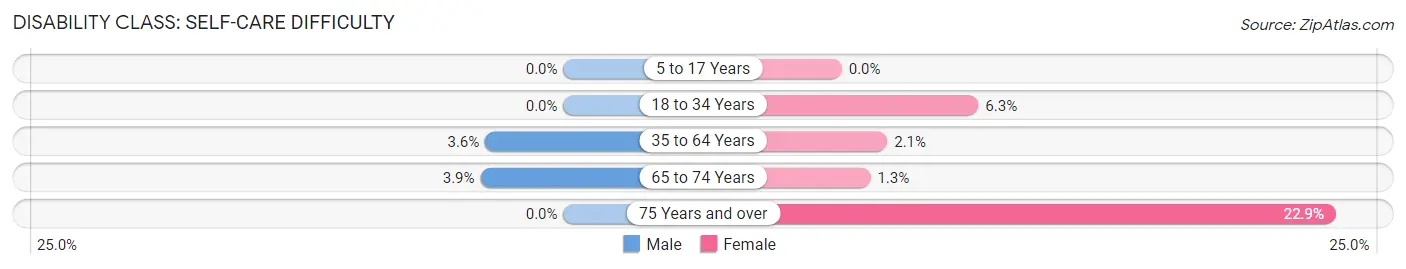
| Age Bracket | Male | Female |
| 5 to 17 Years | 0 (0.0%) | 0 (0.0%) |
| 18 to 34 Years | 0 (0.0%) | 18 (6.3%) |
| 35 to 64 Years | 13 (3.6%) | 9 (2.1%) |
| 65 to 74 Years | 2 (3.8%) | 1 (1.3%) |
| 75 Years and over | 0 (0.0%) | 11 (22.9%) |
Technology Access in New Chicago
Computing Device Access in New Chicago
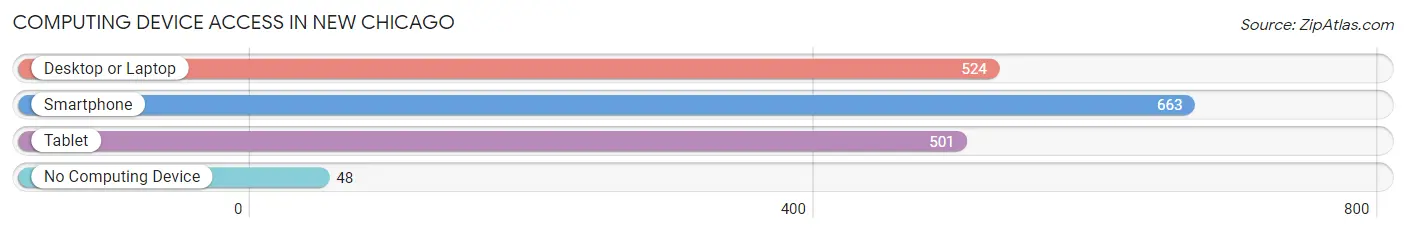
| Device Type | # Households | % Households |
| Desktop or Laptop | 524 | 70.5% |
| Smartphone | 663 | 89.2% |
| Tablet | 501 | 67.4% |
| No Computing Device | 48 | 6.5% |
| Total | 743 | 100.0% |
Internet Access in New Chicago
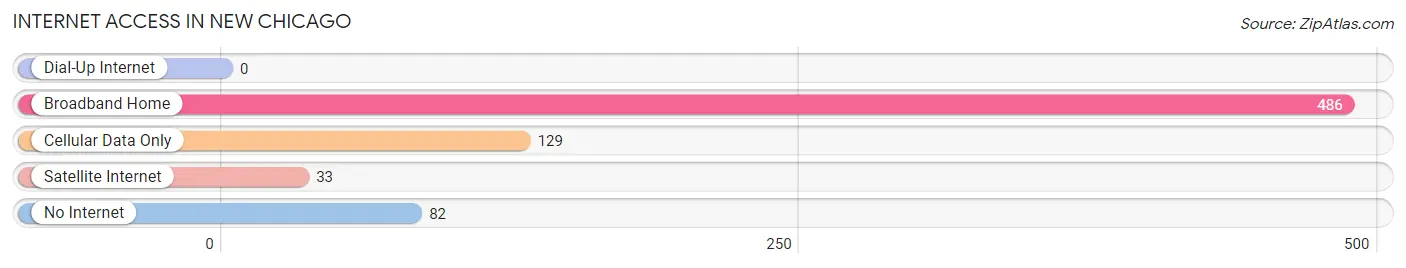
| Internet Type | # Households | % Households |
| Dial-Up Internet | 0 | 0.0% |
| Broadband Home | 486 | 65.4% |
| Cellular Data Only | 129 | 17.4% |
| Satellite Internet | 33 | 4.4% |
| No Internet | 82 | 11.0% |
| Total | 743 | 100.0% |
New Chicago Summary
Chicago, Illinois is the third-largest city in the United States and the largest city in the state of Illinois. It is located on the southwestern shore of Lake Michigan in the northeastern corner of the state. The city is known for its vibrant culture, diverse population, and iconic skyline.
History
The area that is now Chicago was first settled by Native Americans in the late 17th century. The first non-native settlers arrived in the early 1800s, and the city was officially incorporated in 1837. In the mid-1800s, Chicago experienced a period of rapid growth and development, becoming a major transportation hub and the center of the nation’s meatpacking industry. The city was also the site of the 1893 World’s Columbian Exposition, which showcased the city’s industrial and cultural achievements.
In the early 20th century, Chicago was a major center of the labor movement and a major destination for African Americans migrating from the South. The city was also the site of the infamous 1919 race riots, which were sparked by racial tensions and labor disputes. In the 1950s and 1960s, Chicago experienced a period of economic decline and population loss, but the city has since experienced a resurgence in population and economic growth.
Geography
Chicago is located on the southwestern shore of Lake Michigan in the northeastern corner of the state of Illinois. The city is situated on a flat plain, with the Chicago River running through the center of the city. The city is divided into 77 distinct neighborhoods, each with its own unique character and culture. The city is also home to several parks, including Grant Park, Lincoln Park, and Millennium Park.
Economy
Chicago is a major economic center in the Midwest, with a diverse economy that includes finance, manufacturing, transportation, and tourism. The city is home to several Fortune 500 companies, including Boeing, McDonald’s, and United Airlines. The city is also a major center for the arts, with numerous museums, theaters, and music venues.
Demographics
As of the 2010 census, the population of Chicago was 2,695,598. The city is home to a diverse population, with the largest ethnic groups being African American (32.9%), White (31.7%), Hispanic or Latino (28.9%), and Asian (5.5%). The city also has a large immigrant population, with over one million foreign-born residents.
Conclusion
Chicago is a vibrant and diverse city with a rich history and a thriving economy. The city is home to a diverse population and is a major center for the arts, finance, manufacturing, and transportation. Chicago is a major destination for tourists and is a great place to live, work, and play.
Common Questions
What is Per Capita Income in New Chicago?
Per Capita income in New Chicago is $25,618.
What is the Median Family Income in New Chicago?
Median Family Income in New Chicago is $73,750.
What is the Median Household income in New Chicago?
Median Household Income in New Chicago is $56,761.
What is Income or Wage Gap in New Chicago?
Income or Wage Gap in New Chicago is 28.3%.
Women in New Chicago earn 71.7 cents for every dollar earned by a man.
What is Family Income Deficit in New Chicago?
Family Income Deficit in New Chicago is $8,656.
Families that are below poverty line in New Chicago earn $8,656 less on average than the poverty threshold level.
What is Inequality or Gini Index in New Chicago?
Inequality or Gini Index in New Chicago is 0.40.
What is the Total Population of New Chicago?
Total Population of New Chicago is 2,111.
What is the Total Male Population of New Chicago?
Total Male Population of New Chicago is 1,041.
What is the Total Female Population of New Chicago?
Total Female Population of New Chicago is 1,070.
What is the Ratio of Males per 100 Females in New Chicago?
There are 97.29 Males per 100 Females in New Chicago.
What is the Ratio of Females per 100 Males in New Chicago?
There are 102.79 Females per 100 Males in New Chicago.
What is the Median Population Age in New Chicago?
Median Population Age in New Chicago is 31.9 Years.
What is the Average Family Size in New Chicago
Average Family Size in New Chicago is 3.4 People.
What is the Average Household Size in New Chicago
Average Household Size in New Chicago is 2.8 People.
How Large is the Labor Force in New Chicago?
There are 1,048 People in the Labor Forcein in New Chicago.
What is the Percentage of People in the Labor Force in New Chicago?
65.8% of People are in the Labor Force in New Chicago.
What is the Unemployment Rate in New Chicago?
Unemployment Rate in New Chicago is 9.3%.