North Vernon, IN Map & Demographics
North Vernon Map
North Vernon Overview
$28,440
PER CAPITA INCOME
$54,477
AVG FAMILY INCOME
$46,889
AVG HOUSEHOLD INCOME
24.5%
WAGE / INCOME GAP [ % ]
75.5¢/ $1
WAGE / INCOME GAP [ $ ]
0.46
INEQUALITY / GINI INDEX
6,935
TOTAL POPULATION
3,692
MALE POPULATION
3,243
FEMALE POPULATION
113.85
MALES / 100 FEMALES
87.84
FEMALES / 100 MALES
37.5
MEDIAN AGE
2.7
AVG FAMILY SIZE
2.3
AVG HOUSEHOLD SIZE
3,012
LABOR FORCE [ PEOPLE ]
53.2%
PERCENT IN LABOR FORCE
5.9%
UNEMPLOYMENT RATE
North Vernon Zip Codes
North Vernon Area Codes
Income in North Vernon
Income Overview in North Vernon
Per Capita Income in North Vernon is $28,440, while median incomes of families and households are $54,477 and $46,889 respectively.
| Characteristic | Number | Measure |
| Per Capita Income | 6,935 | $28,440 |
| Median Family Income | 1,725 | $54,477 |
| Mean Family Income | 1,725 | $78,973 |
| Median Household Income | 2,939 | $46,889 |
| Mean Household Income | 2,939 | $64,909 |
| Income Deficit | 1,725 | $0 |
| Wage / Income Gap (%) | 6,935 | 24.55% |
| Wage / Income Gap ($) | 6,935 | 75.45¢ per $1 |
| Gini / Inequality Index | 6,935 | 0.46 |
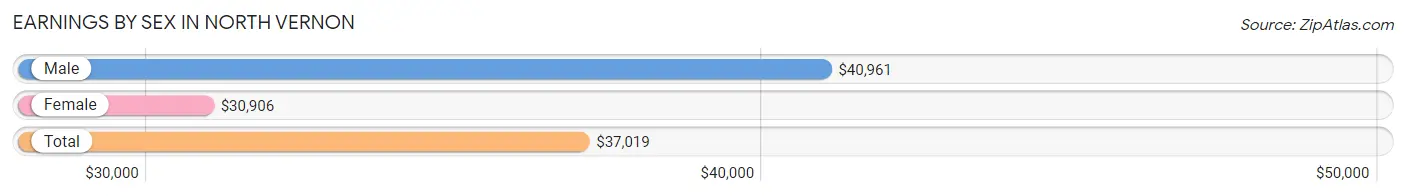
Earnings by Sex in North Vernon
Average Earnings in North Vernon are $37,019, $40,961 for men and $30,906 for women, a difference of 24.5%.
| Sex | Number | Average Earnings |
| Male | 1,955 (57.7%) | $40,961 |
| Female | 1,434 (42.3%) | $30,906 |
| Total | 3,389 (100.0%) | $37,019 |
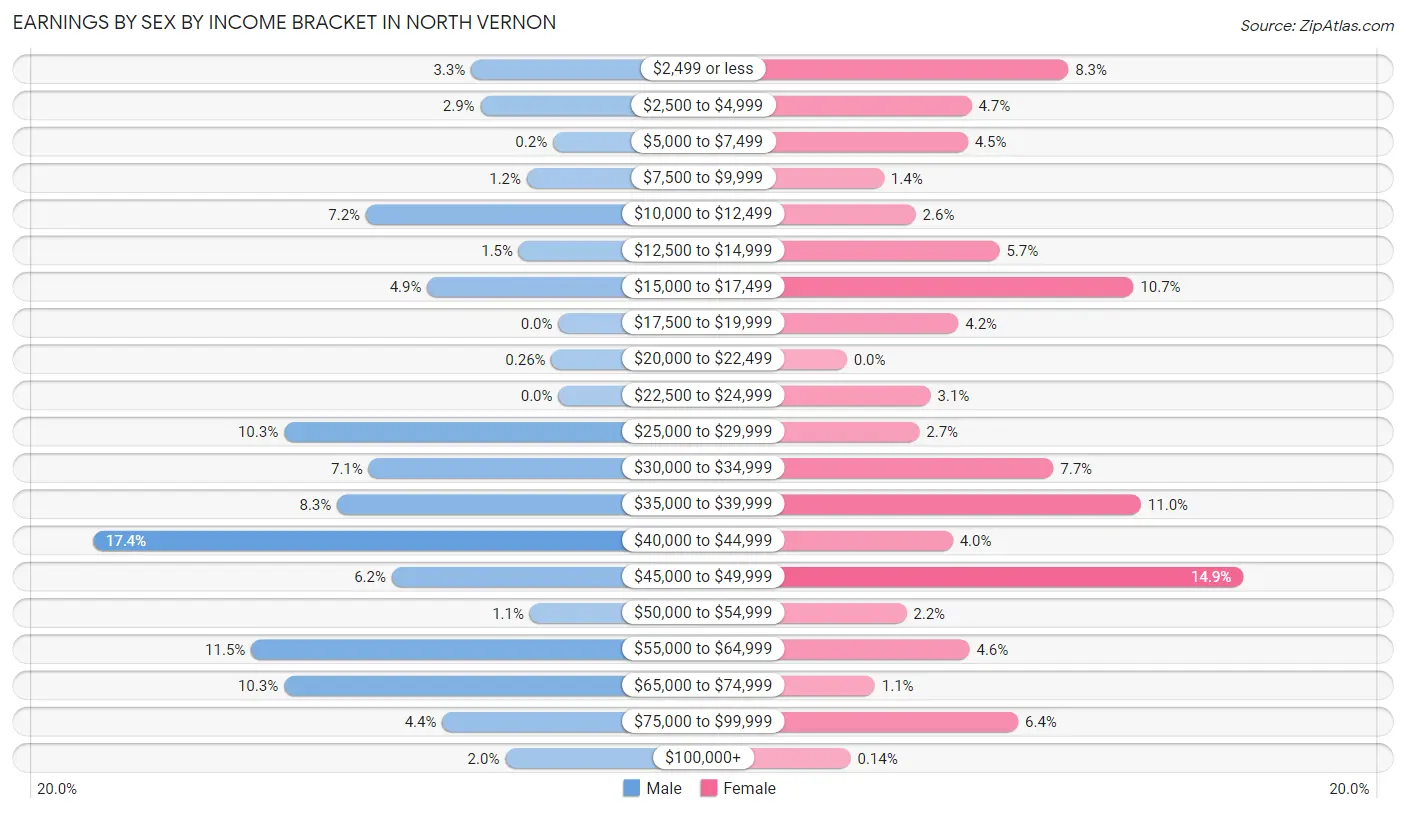
Earnings by Sex by Income Bracket in North Vernon
The most common earnings brackets in North Vernon are $40,000 to $44,999 for men (341 | 17.4%) and $45,000 to $49,999 for women (213 | 14.8%).
| Income | Male | Female |
| $2,499 or less | 64 (3.3%) | 119 (8.3%) |
| $2,500 to $4,999 | 57 (2.9%) | 67 (4.7%) |
| $5,000 to $7,499 | 4 (0.2%) | 65 (4.5%) |
| $7,500 to $9,999 | 23 (1.2%) | 20 (1.4%) |
| $10,000 to $12,499 | 141 (7.2%) | 37 (2.6%) |
| $12,500 to $14,999 | 29 (1.5%) | 82 (5.7%) |
| $15,000 to $17,499 | 96 (4.9%) | 154 (10.7%) |
| $17,500 to $19,999 | 0 (0.0%) | 60 (4.2%) |
| $20,000 to $22,499 | 5 (0.3%) | 0 (0.0%) |
| $22,500 to $24,999 | 0 (0.0%) | 45 (3.1%) |
| $25,000 to $29,999 | 201 (10.3%) | 39 (2.7%) |
| $30,000 to $34,999 | 139 (7.1%) | 111 (7.7%) |
| $35,000 to $39,999 | 162 (8.3%) | 158 (11.0%) |
| $40,000 to $44,999 | 341 (17.4%) | 57 (4.0%) |
| $45,000 to $49,999 | 122 (6.2%) | 213 (14.8%) |
| $50,000 to $54,999 | 21 (1.1%) | 32 (2.2%) |
| $55,000 to $64,999 | 225 (11.5%) | 66 (4.6%) |
| $65,000 to $74,999 | 201 (10.3%) | 15 (1.1%) |
| $75,000 to $99,999 | 85 (4.3%) | 92 (6.4%) |
| $100,000+ | 39 (2.0%) | 2 (0.1%) |
| Total | 1,955 (100.0%) | 1,434 (100.0%) |
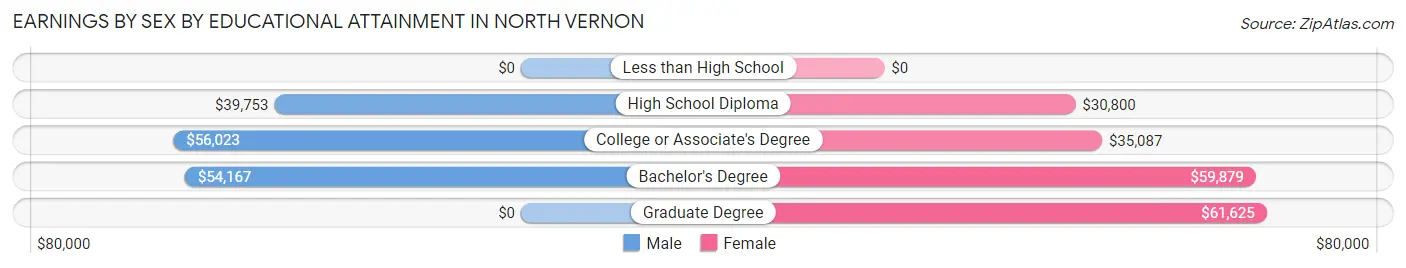
Earnings by Sex by Educational Attainment in North Vernon
Average earnings in North Vernon are $42,607 for men and $34,605 for women, a difference of 18.8%. Men with an educational attainment of college or associate's degree enjoy the highest average annual earnings of $56,023, while those with high school diploma education earn the least with $39,753. Women with an educational attainment of graduate degree earn the most with the average annual earnings of $61,625, while those with high school diploma education have the smallest earnings of $30,800.
| Educational Attainment | Male Income | Female Income |
| Less than High School | - | - |
| High School Diploma | $39,753 | $30,800 |
| College or Associate's Degree | $56,023 | $35,087 |
| Bachelor's Degree | $54,167 | $59,879 |
| Graduate Degree | - | - |
| Total | $42,607 | $34,605 |
Family Income in North Vernon
Family Income Brackets in North Vernon
According to the North Vernon family income data, there are 336 families falling into the $35,000 to $49,999 income range, which is the most common income bracket and makes up 19.5% of all families. Conversely, the $200,000+ income bracket is the least frequent group with only 21 families (1.2%) belonging to this category.
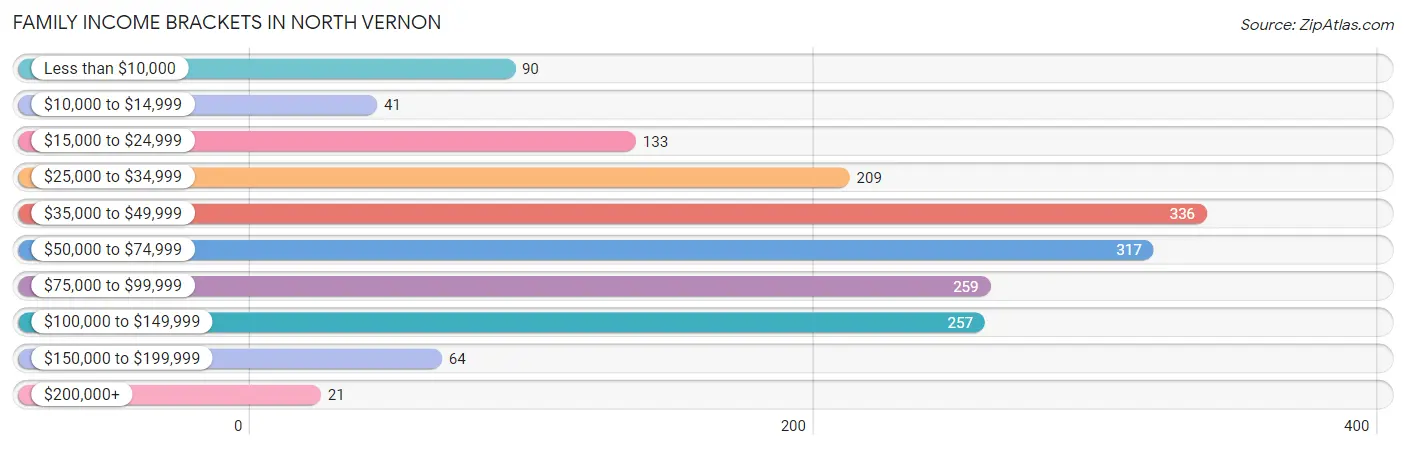
| Income Bracket | # Families | % Families |
| Less than $10,000 | 90 | 5.2% |
| $10,000 to $14,999 | 41 | 2.4% |
| $15,000 to $24,999 | 133 | 7.7% |
| $25,000 to $34,999 | 209 | 12.1% |
| $35,000 to $49,999 | 336 | 19.5% |
| $50,000 to $74,999 | 317 | 18.4% |
| $75,000 to $99,999 | 259 | 15.0% |
| $100,000 to $149,999 | 257 | 14.9% |
| $150,000 to $199,999 | 64 | 3.7% |
| $200,000+ | 21 | 1.2% |
Family Income by Famaliy Size in North Vernon
5-person families (175 | 10.1%) account for the highest median family income in North Vernon with $98,155 per family, while 3-person families (293 | 17.0%) have the highest median income of $25,139 per family member.
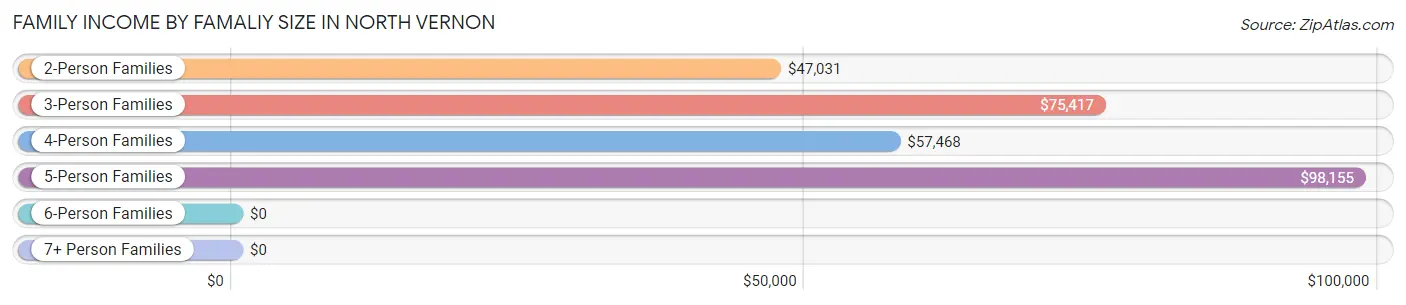
| Income Bracket | # Families | Median Income |
| 2-Person Families | 930 (53.9%) | $47,031 |
| 3-Person Families | 293 (17.0%) | $75,417 |
| 4-Person Families | 297 (17.2%) | $57,468 |
| 5-Person Families | 175 (10.1%) | $98,155 |
| 6-Person Families | 8 (0.5%) | $0 |
| 7+ Person Families | 22 (1.3%) | $0 |
| Total | 1,725 (100.0%) | $54,477 |
Family Income by Number of Earners in North Vernon
The median family income in North Vernon is $54,477, with families comprising 2 earners (480) having the highest median family income of $99,487, while families with no earners (268) have the lowest median family income of $35,000, accounting for 27.8% and 15.5% of families, respectively.
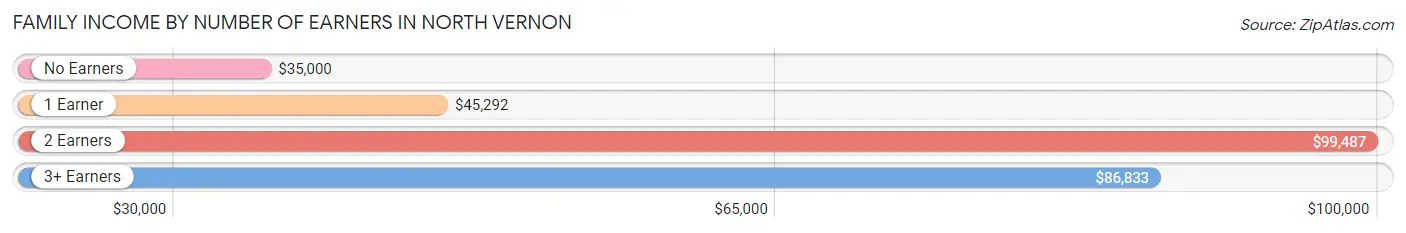
| Number of Earners | # Families | Median Income |
| No Earners | 268 (15.5%) | $35,000 |
| 1 Earner | 781 (45.3%) | $45,292 |
| 2 Earners | 480 (27.8%) | $99,487 |
| 3+ Earners | 196 (11.4%) | $86,833 |
| Total | 1,725 (100.0%) | $54,477 |
Household Income in North Vernon
Household Income Brackets in North Vernon
With 579 households falling in the category, the $50,000 to $74,999 income range is the most frequent in North Vernon, accounting for 19.7% of all households. In contrast, only 21 households (0.7%) fall into the $200,000+ income bracket, making it the least populous group.
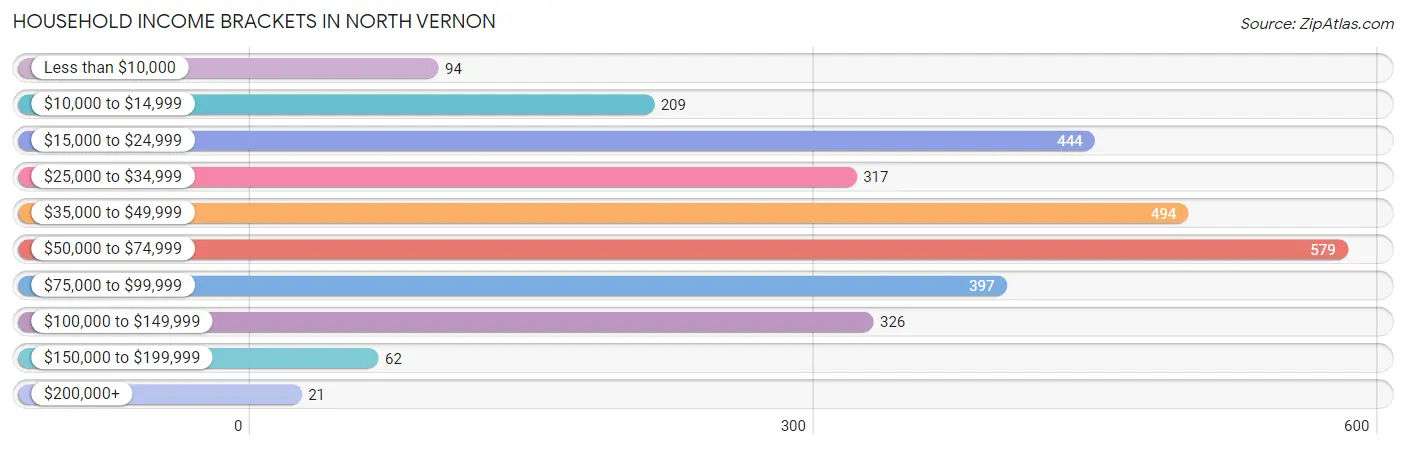
| Income Bracket | # Households | % Households |
| Less than $10,000 | 94 | 3.2% |
| $10,000 to $14,999 | 209 | 7.1% |
| $15,000 to $24,999 | 444 | 15.1% |
| $25,000 to $34,999 | 317 | 10.8% |
| $35,000 to $49,999 | 494 | 16.8% |
| $50,000 to $74,999 | 579 | 19.7% |
| $75,000 to $99,999 | 397 | 13.5% |
| $100,000 to $149,999 | 326 | 11.1% |
| $150,000 to $199,999 | 62 | 2.1% |
| $200,000+ | 21 | 0.7% |
Household Income by Householder Age in North Vernon
The median household income in North Vernon is $46,889, with the highest median household income of $56,801 found in the 45 to 64 years age bracket for the primary householder. A total of 1,004 households (34.2%) fall into this category. Meanwhile, the 15 to 24 years age bracket for the primary householder has the lowest median household income of $0, with 264 households (9.0%) in this group.
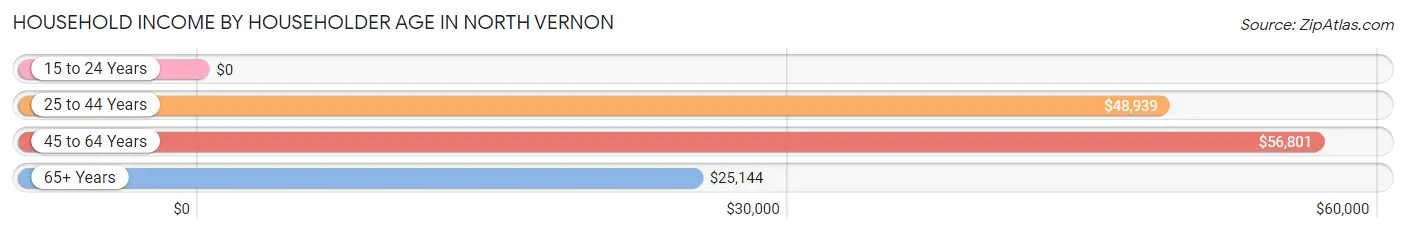
| Income Bracket | # Households | Median Income |
| 15 to 24 Years | 264 (9.0%) | $0 |
| 25 to 44 Years | 820 (27.9%) | $48,939 |
| 45 to 64 Years | 1,004 (34.2%) | $56,801 |
| 65+ Years | 851 (29.0%) | $25,144 |
| Total | 2,939 (100.0%) | $46,889 |
Poverty in North Vernon
Income Below Poverty by Sex and Age in North Vernon
With 18.4% poverty level for males and 21.7% for females among the residents of North Vernon, 12 to 14 year old males and under 5 year old females are the most vulnerable to poverty, with 65 males (31.1%) and 121 females (79.1%) in their respective age groups living below the poverty level.
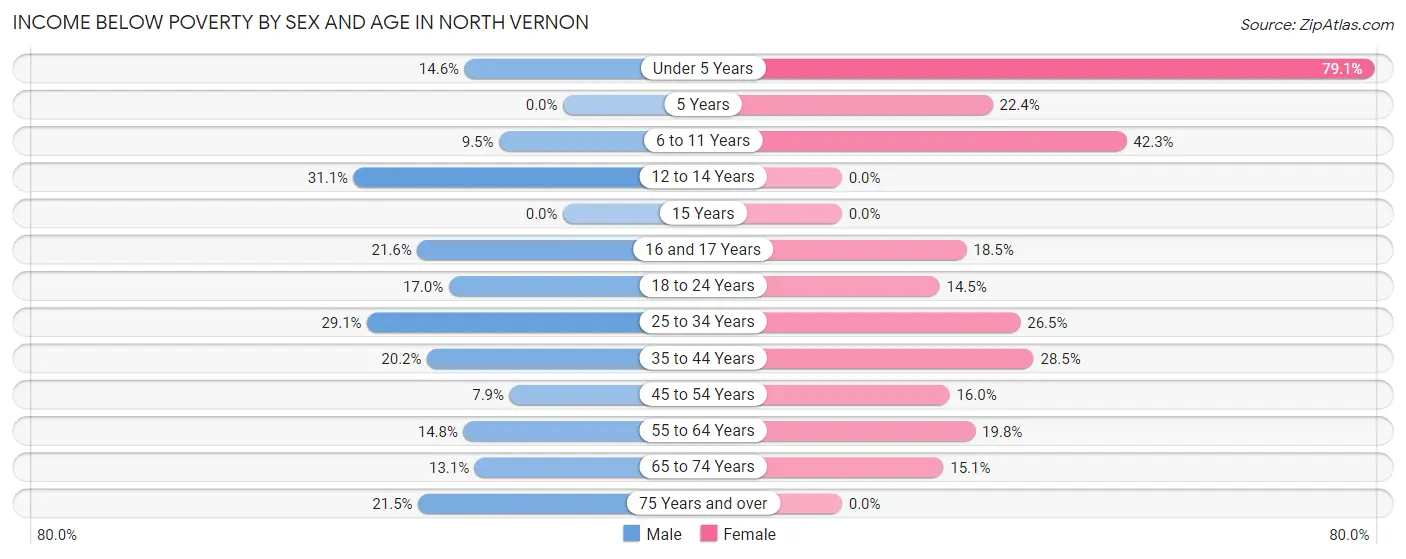
| Age Bracket | Male | Female |
| Under 5 Years | 37 (14.6%) | 121 (79.1%) |
| 5 Years | 0 (0.0%) | 32 (22.4%) |
| 6 to 11 Years | 21 (9.5%) | 71 (42.3%) |
| 12 to 14 Years | 65 (31.1%) | 0 (0.0%) |
| 15 Years | 0 (0.0%) | 0 (0.0%) |
| 16 and 17 Years | 37 (21.6%) | 25 (18.5%) |
| 18 to 24 Years | 46 (17.0%) | 45 (14.5%) |
| 25 to 34 Years | 192 (29.1%) | 110 (26.5%) |
| 35 to 44 Years | 83 (20.2%) | 78 (28.5%) |
| 45 to 54 Years | 44 (7.9%) | 79 (16.0%) |
| 55 to 64 Years | 47 (14.8%) | 58 (19.8%) |
| 65 to 74 Years | 24 (13.1%) | 66 (15.1%) |
| 75 Years and over | 51 (21.5%) | 0 (0.0%) |
| Total | 647 (18.4%) | 685 (21.7%) |
Income Above Poverty by Sex and Age in North Vernon
According to the poverty statistics in North Vernon, males aged 5 years and females aged 12 to 14 years are the age groups that are most secure financially, with 100.0% of males and 100.0% of females in these age groups living above the poverty line.
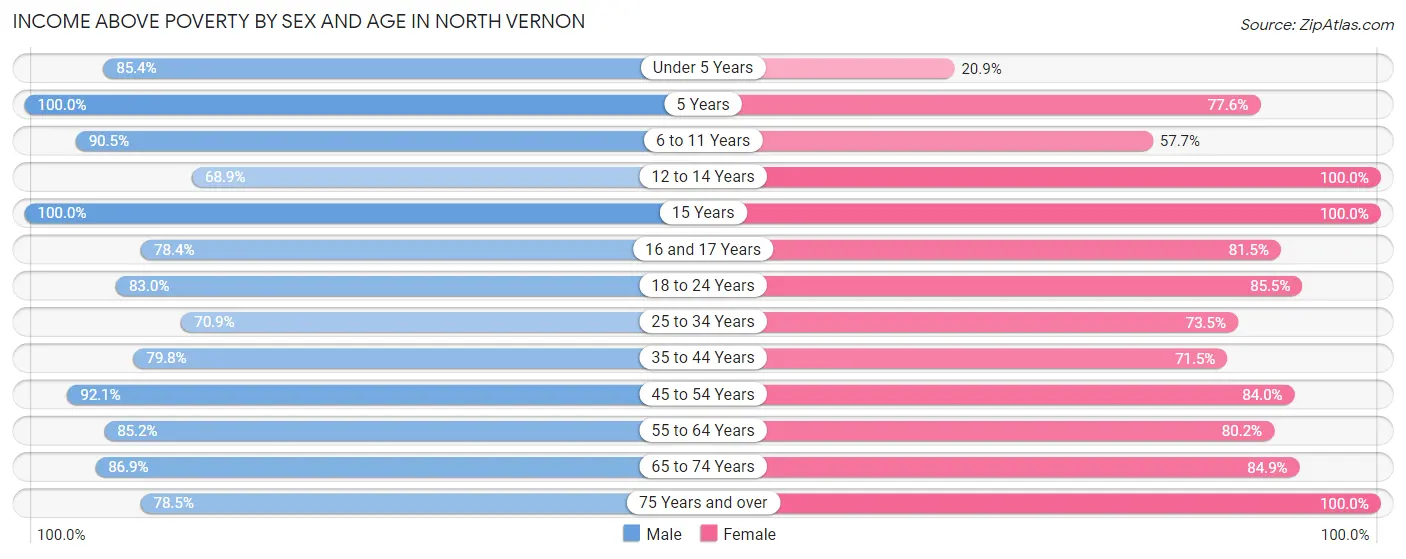
| Age Bracket | Male | Female |
| Under 5 Years | 216 (85.4%) | 32 (20.9%) |
| 5 Years | 8 (100.0%) | 111 (77.6%) |
| 6 to 11 Years | 200 (90.5%) | 97 (57.7%) |
| 12 to 14 Years | 144 (68.9%) | 44 (100.0%) |
| 15 Years | 18 (100.0%) | 25 (100.0%) |
| 16 and 17 Years | 134 (78.4%) | 110 (81.5%) |
| 18 to 24 Years | 225 (83.0%) | 265 (85.5%) |
| 25 to 34 Years | 468 (70.9%) | 305 (73.5%) |
| 35 to 44 Years | 328 (79.8%) | 196 (71.5%) |
| 45 to 54 Years | 510 (92.1%) | 415 (84.0%) |
| 55 to 64 Years | 271 (85.2%) | 235 (80.2%) |
| 65 to 74 Years | 159 (86.9%) | 372 (84.9%) |
| 75 Years and over | 186 (78.5%) | 257 (100.0%) |
| Total | 2,867 (81.6%) | 2,464 (78.2%) |
Income Below Poverty Among Married-Couple Families in North Vernon
The poverty statistics for married-couple families in North Vernon show that 12.5% or 117 of the total 934 families live below the poverty line. Families with 3 or 4 children have the highest poverty rate of 44.2%, comprising of 57 families. On the other hand, families with no children have the lowest poverty rate of 6.1%, which includes 39 families.
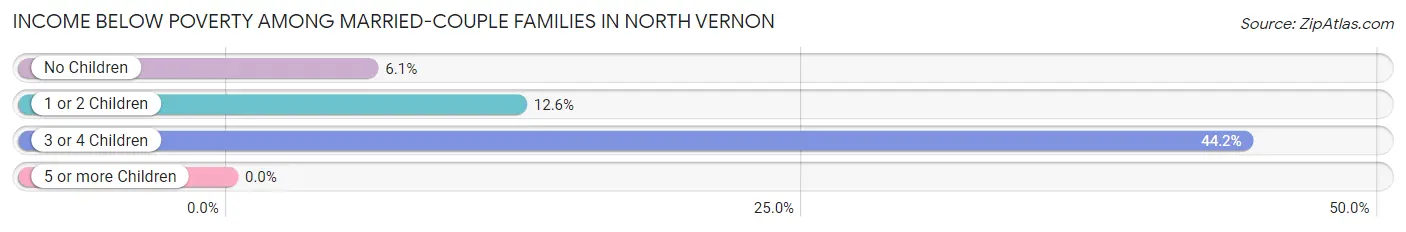
| Children | Above Poverty | Below Poverty |
| No Children | 599 (93.9%) | 39 (6.1%) |
| 1 or 2 Children | 146 (87.4%) | 21 (12.6%) |
| 3 or 4 Children | 72 (55.8%) | 57 (44.2%) |
| 5 or more Children | 0 (0.0%) | 0 (0.0%) |
| Total | 817 (87.5%) | 117 (12.5%) |
Income Below Poverty Among Single-Parent Households in North Vernon
According to the poverty data in North Vernon, 13.2% or 39 single-father households and 27.6% or 137 single-mother households are living below the poverty line. Among single-father households, those with 1 or 2 children have the highest poverty rate, with 39 households (45.9%) experiencing poverty. Likewise, among single-mother households, those with 1 or 2 children have the highest poverty rate, with 107 households (31.8%) falling below the poverty line.
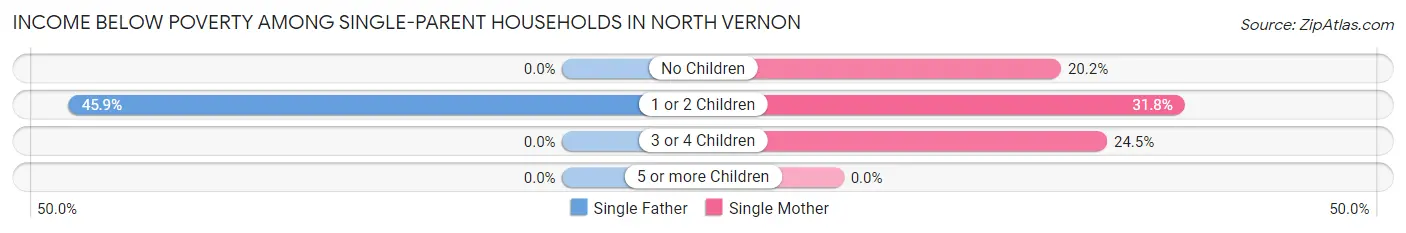
| Children | Single Father | Single Mother |
| No Children | 0 (0.0%) | 17 (20.2%) |
| 1 or 2 Children | 39 (45.9%) | 107 (31.8%) |
| 3 or 4 Children | 0 (0.0%) | 13 (24.5%) |
| 5 or more Children | 0 (0.0%) | 0 (0.0%) |
| Total | 39 (13.2%) | 137 (27.6%) |
Income Below Poverty Among Married-Couple vs Single-Parent Households in North Vernon
The poverty data for North Vernon shows that 117 of the married-couple family households (12.5%) and 176 of the single-parent households (22.3%) are living below the poverty level. Within the married-couple family households, those with 3 or 4 children have the highest poverty rate, with 57 households (44.2%) falling below the poverty line. Among the single-parent households, those with 1 or 2 children have the highest poverty rate, with 146 household (34.6%) living below poverty.
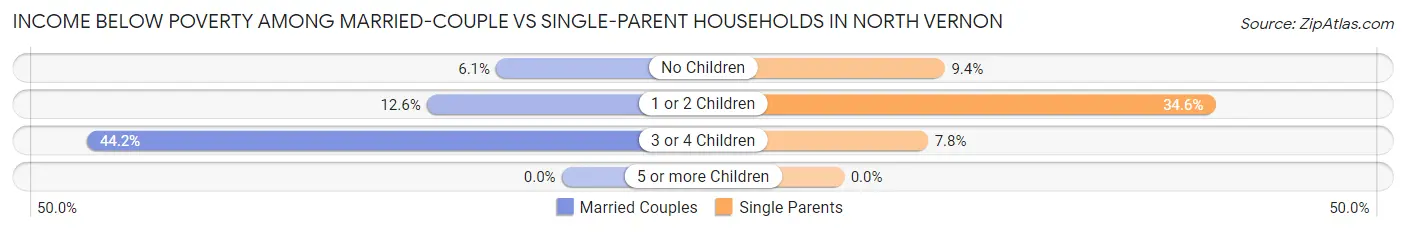
| Children | Married-Couple Families | Single-Parent Households |
| No Children | 39 (6.1%) | 17 (9.4%) |
| 1 or 2 Children | 21 (12.6%) | 146 (34.6%) |
| 3 or 4 Children | 57 (44.2%) | 13 (7.8%) |
| 5 or more Children | 0 (0.0%) | 0 (0.0%) |
| Total | 117 (12.5%) | 176 (22.3%) |
Race in North Vernon
The most populous races in North Vernon are White / Caucasian (6,305 | 90.9%), Hispanic or Latino (540 | 7.8%), and Two or more Races (295 | 4.3%).
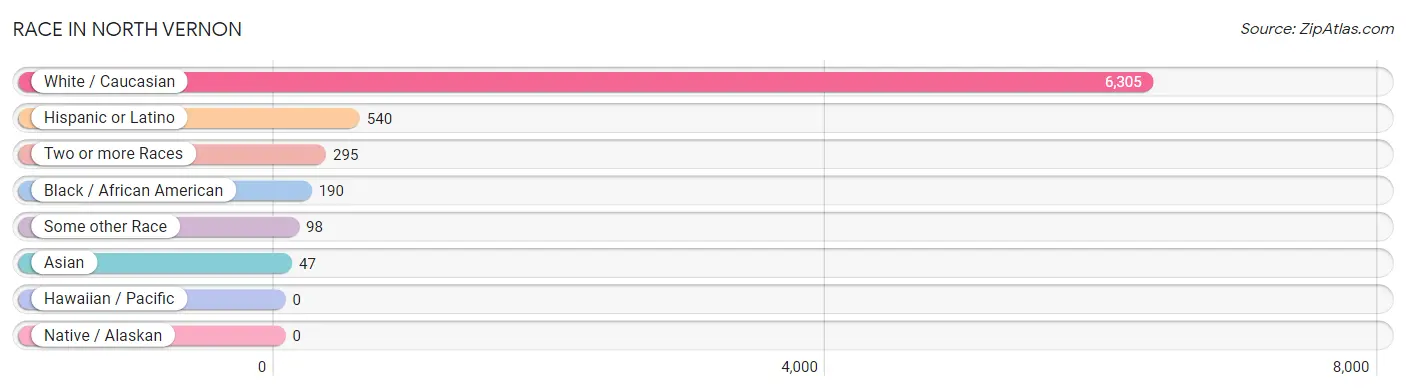
| Race | # Population | % Population |
| Asian | 47 | 0.7% |
| Black / African American | 190 | 2.7% |
| Hawaiian / Pacific | 0 | 0.0% |
| Hispanic or Latino | 540 | 7.8% |
| Native / Alaskan | 0 | 0.0% |
| White / Caucasian | 6,305 | 90.9% |
| Two or more Races | 295 | 4.3% |
| Some other Race | 98 | 1.4% |
| Total | 6,935 | 100.0% |
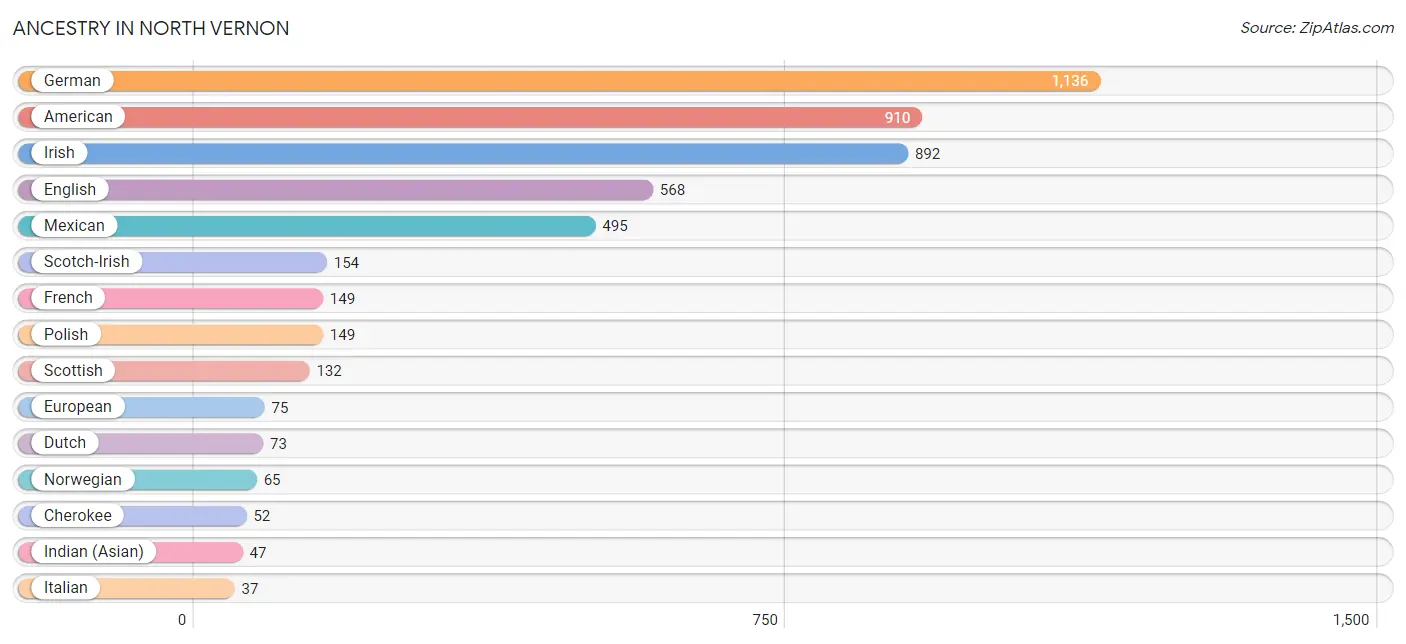
Ancestry in North Vernon
The most populous ancestries reported in North Vernon are German (1,136 | 16.4%), American (910 | 13.1%), Irish (892 | 12.9%), English (568 | 8.2%), and Mexican (495 | 7.1%), together accounting for 57.7% of all North Vernon residents.
| Ancestry | # Population | % Population |
| African | 11 | 0.2% |
| American | 910 | 13.1% |
| Arab | 6 | 0.1% |
| British | 24 | 0.4% |
| Cherokee | 52 | 0.7% |
| Dutch | 73 | 1.1% |
| Eastern European | 26 | 0.4% |
| English | 568 | 8.2% |
| European | 75 | 1.1% |
| French | 149 | 2.1% |
| German | 1,136 | 16.4% |
| Indian (Asian) | 47 | 0.7% |
| Irish | 892 | 12.9% |
| Italian | 37 | 0.5% |
| Mexican | 495 | 7.1% |
| Northern European | 6 | 0.1% |
| Norwegian | 65 | 0.9% |
| Polish | 149 | 2.1% |
| Puerto Rican | 10 | 0.1% |
| Scandinavian | 11 | 0.2% |
| Scotch-Irish | 154 | 2.2% |
| Scottish | 132 | 1.9% |
| Spanish | 35 | 0.5% |
| Subsaharan African | 16 | 0.2% |
| Swedish | 20 | 0.3% |
| Swiss | 12 | 0.2% |
| Welsh | 2 | 0.0% | View All 27 Rows |
Immigrants in North Vernon
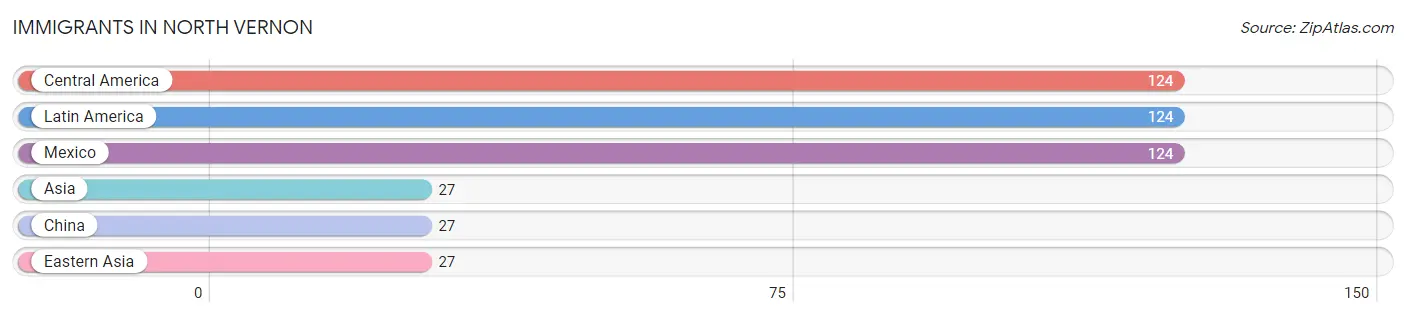
The most numerous immigrant groups reported in North Vernon came from Central America (124 | 1.8%), Latin America (124 | 1.8%), Mexico (124 | 1.8%), Asia (27 | 0.4%), and China (27 | 0.4%), together accounting for 6.1% of all North Vernon residents.
| Immigration Origin | # Population | % Population |
| Asia | 27 | 0.4% |
| Central America | 124 | 1.8% |
| China | 27 | 0.4% |
| Eastern Asia | 27 | 0.4% |
| Latin America | 124 | 1.8% |
| Mexico | 124 | 1.8% | View All 6 Rows |
Sex and Age in North Vernon
Sex and Age in North Vernon
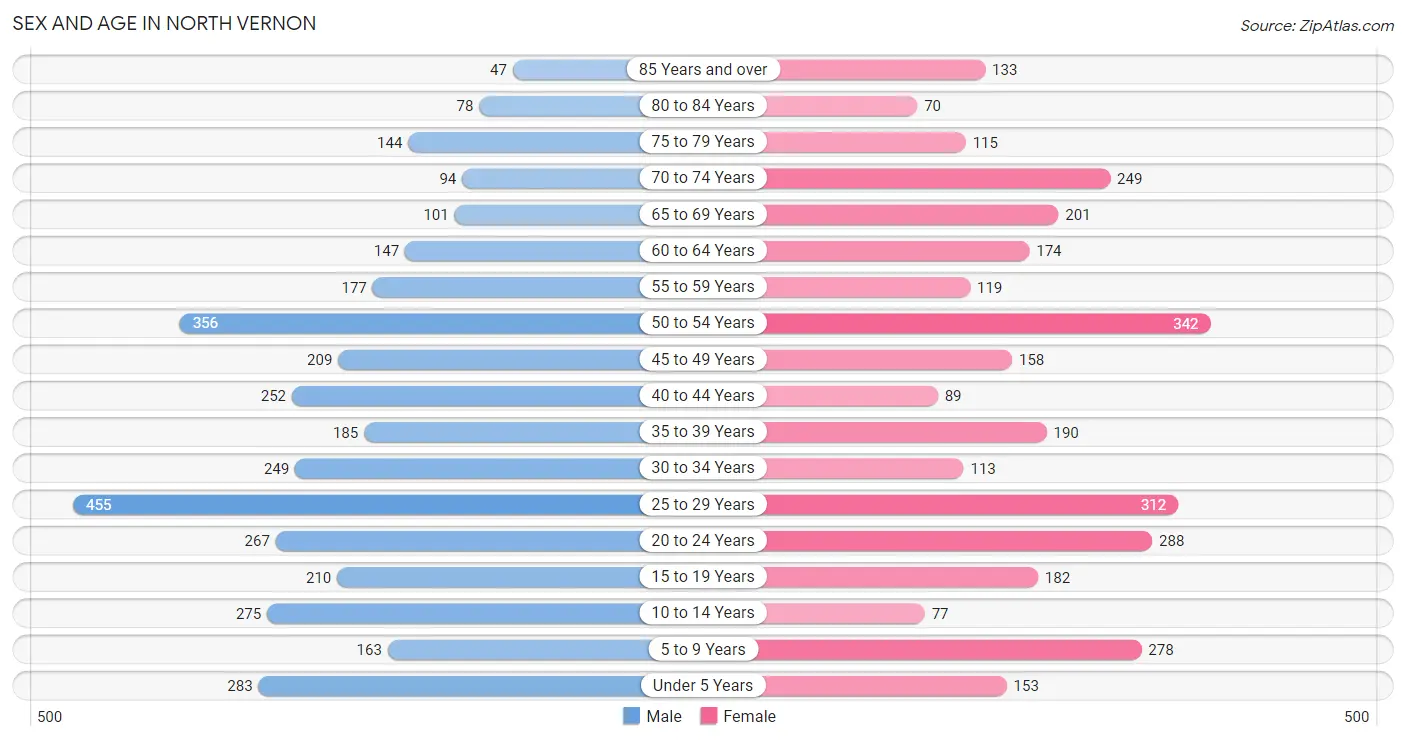
The most populous age groups in North Vernon are 25 to 29 Years (455 | 12.3%) for men and 50 to 54 Years (342 | 10.5%) for women.
| Age Bracket | Male | Female |
| Under 5 Years | 283 (7.7%) | 153 (4.7%) |
| 5 to 9 Years | 163 (4.4%) | 278 (8.6%) |
| 10 to 14 Years | 275 (7.4%) | 77 (2.4%) |
| 15 to 19 Years | 210 (5.7%) | 182 (5.6%) |
| 20 to 24 Years | 267 (7.2%) | 288 (8.9%) |
| 25 to 29 Years | 455 (12.3%) | 312 (9.6%) |
| 30 to 34 Years | 249 (6.7%) | 113 (3.5%) |
| 35 to 39 Years | 185 (5.0%) | 190 (5.9%) |
| 40 to 44 Years | 252 (6.8%) | 89 (2.7%) |
| 45 to 49 Years | 209 (5.7%) | 158 (4.9%) |
| 50 to 54 Years | 356 (9.6%) | 342 (10.5%) |
| 55 to 59 Years | 177 (4.8%) | 119 (3.7%) |
| 60 to 64 Years | 147 (4.0%) | 174 (5.4%) |
| 65 to 69 Years | 101 (2.7%) | 201 (6.2%) |
| 70 to 74 Years | 94 (2.5%) | 249 (7.7%) |
| 75 to 79 Years | 144 (3.9%) | 115 (3.5%) |
| 80 to 84 Years | 78 (2.1%) | 70 (2.2%) |
| 85 Years and over | 47 (1.3%) | 133 (4.1%) |
| Total | 3,692 (100.0%) | 3,243 (100.0%) |
Families and Households in North Vernon
Median Family Size in North Vernon
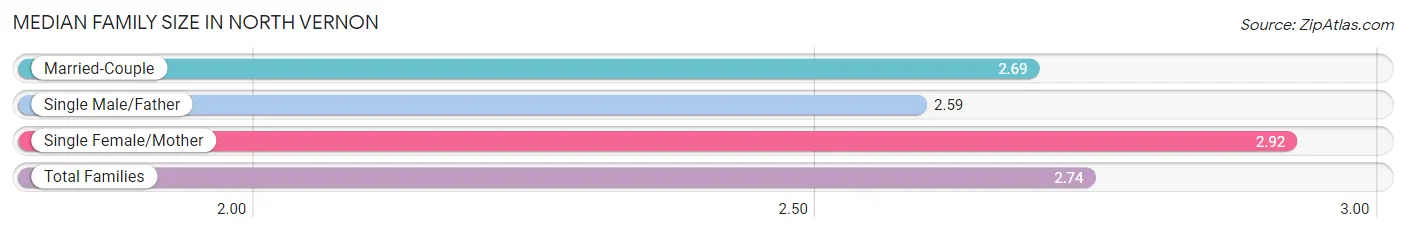
The median family size in North Vernon is 2.74 persons per family, with single female/mother families (496 | 28.7%) accounting for the largest median family size of 2.92 persons per family. On the other hand, single male/father families (295 | 17.1%) represent the smallest median family size with 2.59 persons per family.
| Family Type | # Families | Family Size |
| Married-Couple | 934 (54.1%) | 2.69 |
| Single Male/Father | 295 (17.1%) | 2.59 |
| Single Female/Mother | 496 (28.7%) | 2.92 |
| Total Families | 1,725 (100.0%) | 2.74 |
Median Household Size in North Vernon
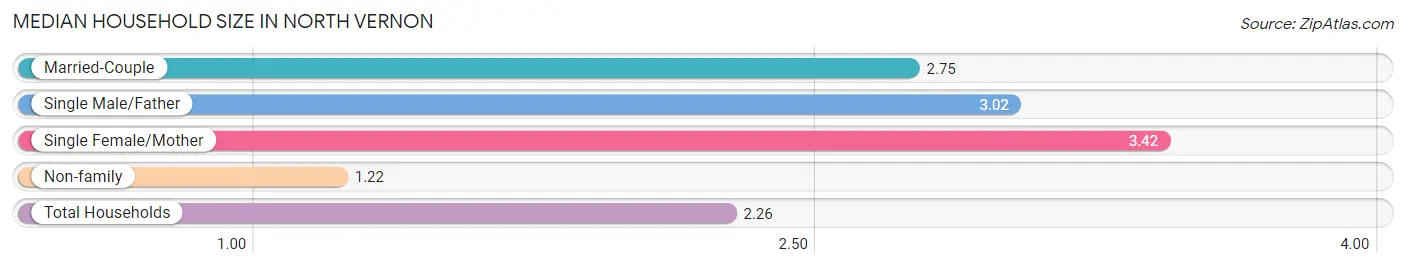
The median household size in North Vernon is 2.26 persons per household, with single female/mother households (496 | 16.9%) accounting for the largest median household size of 3.42 persons per household. non-family households (1,214 | 41.3%) represent the smallest median household size with 1.22 persons per household.
| Household Type | # Households | Household Size |
| Married-Couple | 934 (31.8%) | 2.75 |
| Single Male/Father | 295 (10.0%) | 3.02 |
| Single Female/Mother | 496 (16.9%) | 3.42 |
| Non-family | 1,214 (41.3%) | 1.22 |
| Total Households | 2,939 (100.0%) | 2.26 |
Household Size by Marriage Status in North Vernon
Out of a total of 2,939 households in North Vernon, 1,725 (58.7%) are family households, while 1,214 (41.3%) are nonfamily households. The most numerous type of family households are 2-person households, comprising 829, and the most common type of nonfamily households are 1-person households, comprising 968.
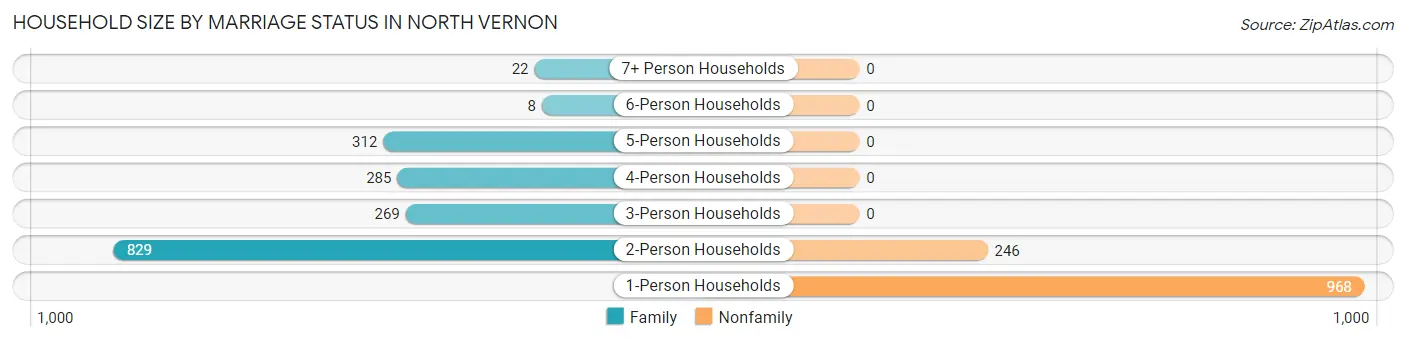
| Household Size | Family Households | Nonfamily Households |
| 1-Person Households | - | 968 (32.9%) |
| 2-Person Households | 829 (28.2%) | 246 (8.4%) |
| 3-Person Households | 269 (9.1%) | 0 (0.0%) |
| 4-Person Households | 285 (9.7%) | 0 (0.0%) |
| 5-Person Households | 312 (10.6%) | 0 (0.0%) |
| 6-Person Households | 8 (0.3%) | 0 (0.0%) |
| 7+ Person Households | 22 (0.7%) | 0 (0.0%) |
| Total | 1,725 (58.7%) | 1,214 (41.3%) |
Female Fertility in North Vernon
Fertility by Age in North Vernon
Average fertility rate in North Vernon is 70.0 births per 1,000 women. Women in the age bracket of 35 to 50 years have the highest fertility rate with 99.0 births per 1,000 women. Women in the age bracket of 20 to 34 years acount for 51.6% of all women with births.
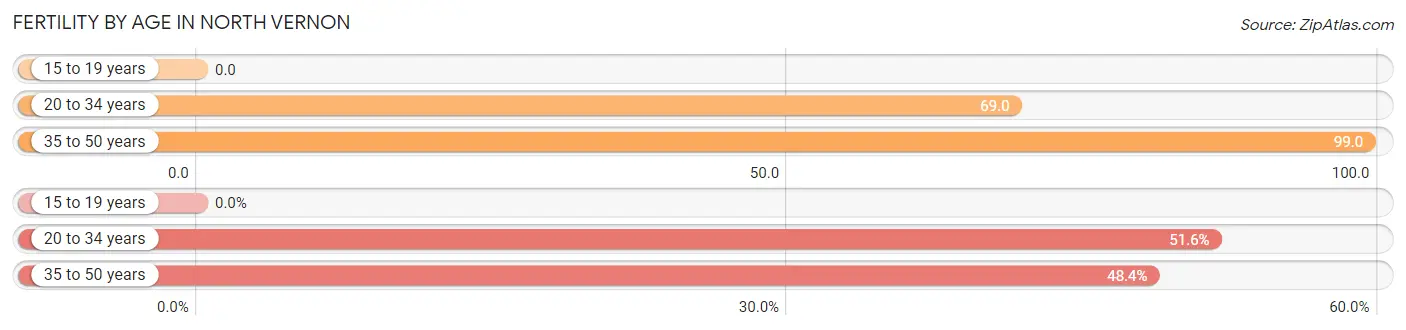
| Age Bracket | Women with Births | Births / 1,000 Women |
| 15 to 19 years | 0 (0.0%) | 0.0 |
| 20 to 34 years | 49 (51.6%) | 69.0 |
| 35 to 50 years | 46 (48.4%) | 99.0 |
| Total | 95 (100.0%) | 70.0 |
Fertility by Age by Marriage Status in North Vernon
72.6% of women with births (95) in North Vernon are married. The highest percentage of unmarried women with births falls into 20 to 34 years age bracket with 53.1% of them unmarried at the time of birth, while the lowest percentage of unmarried women with births belong to 35 to 50 years age bracket with 0.0% of them unmarried.
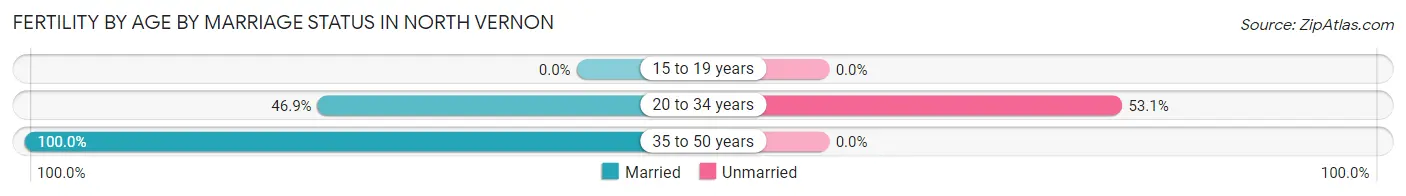
| Age Bracket | Married | Unmarried |
| 15 to 19 years | 0 (0.0%) | 0 (0.0%) |
| 20 to 34 years | 23 (46.9%) | 26 (53.1%) |
| 35 to 50 years | 46 (100.0%) | 0 (0.0%) |
| Total | 69 (72.6%) | 26 (27.4%) |
Fertility by Education in North Vernon
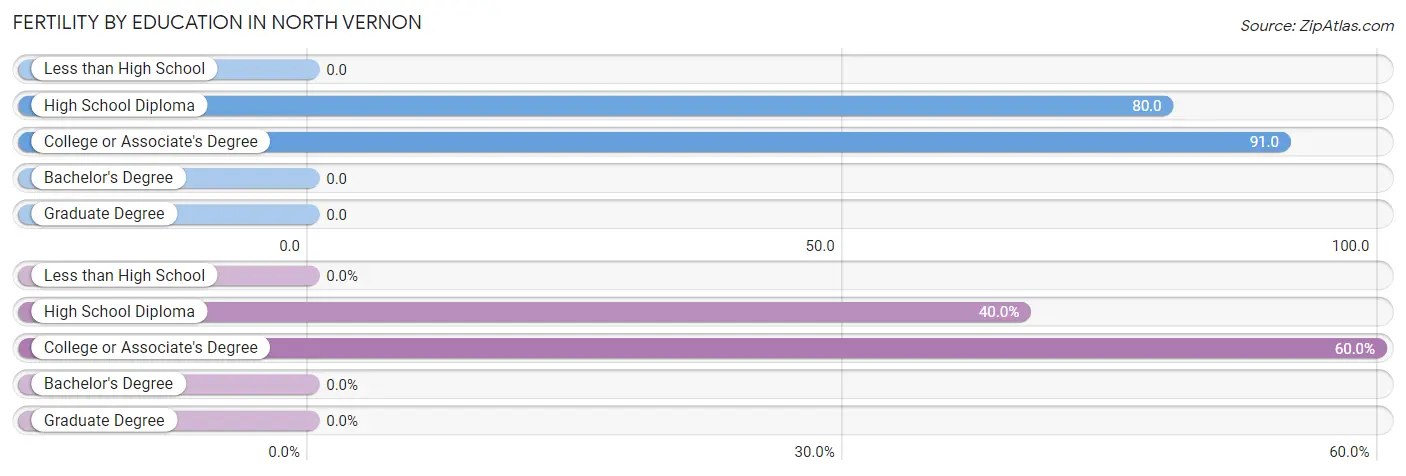
| Educational Attainment | Women with Births | Births / 1,000 Women |
| Less than High School | 0 (0.0%) | 0.0 |
| High School Diploma | 38 (40.0%) | 80.0 |
| College or Associate's Degree | 57 (60.0%) | 91.0 |
| Bachelor's Degree | 0 (0.0%) | 0.0 |
| Graduate Degree | 0 (0.0%) | 0.0 |
| Total | 95 (100.0%) | 70.0 |
Fertility by Education by Marriage Status in North Vernon
27.4% of women with births in North Vernon are unmarried. Women with the educational attainment of college or associate's degree are most likely to be married with 80.7% of them married at childbirth, while women with the educational attainment of high school diploma are least likely to be married with 39.5% of them unmarried at childbirth.
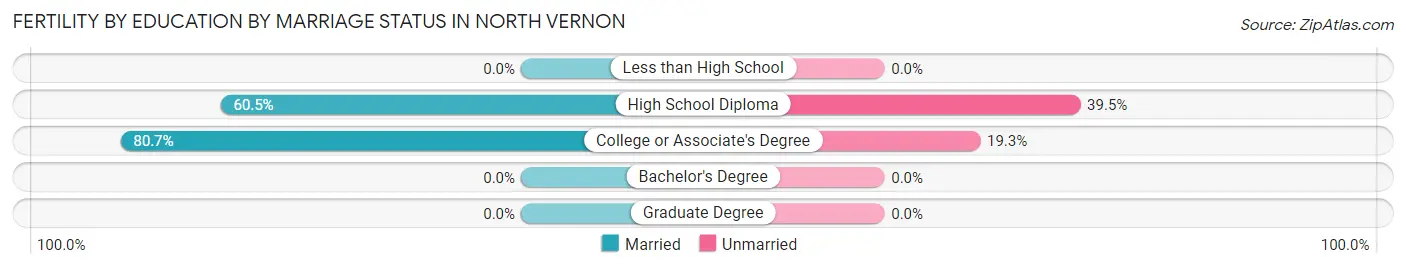
| Educational Attainment | Married | Unmarried |
| Less than High School | 0 (0.0%) | 0 (0.0%) |
| High School Diploma | 23 (60.5%) | 15 (39.5%) |
| College or Associate's Degree | 46 (80.7%) | 11 (19.3%) |
| Bachelor's Degree | 0 (0.0%) | 0 (0.0%) |
| Graduate Degree | 0 (0.0%) | 0 (0.0%) |
| Total | 69 (72.6%) | 26 (27.4%) |
Employment Characteristics in North Vernon
Employment by Class of Employer in North Vernon
Among the 2,718 employed individuals in North Vernon, private company employees (2,174 | 80.0%), local government employees (279 | 10.3%), and self-employed (not incorporated) (86 | 3.2%) make up the most common classes of employment.
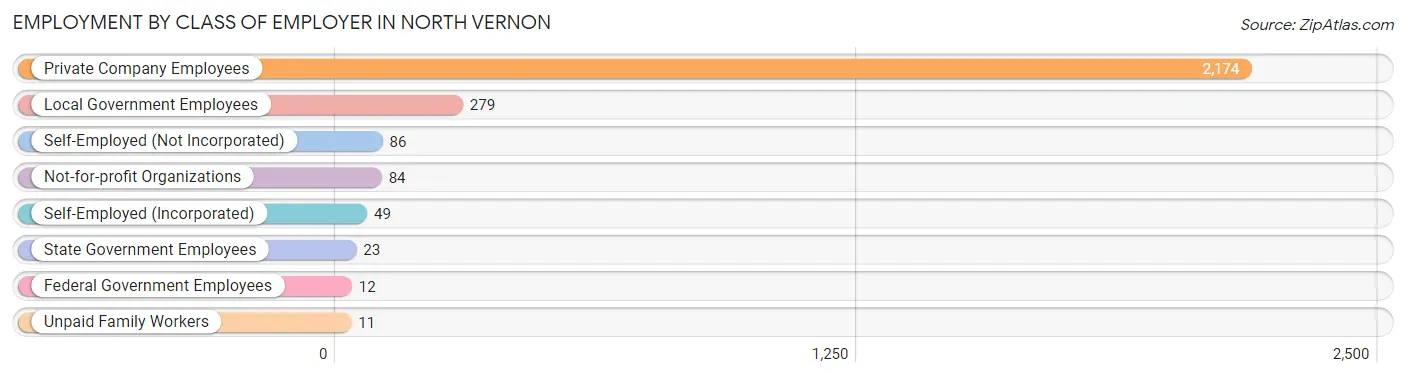
| Employer Class | # Employees | % Employees |
| Private Company Employees | 2,174 | 80.0% |
| Self-Employed (Incorporated) | 49 | 1.8% |
| Self-Employed (Not Incorporated) | 86 | 3.2% |
| Not-for-profit Organizations | 84 | 3.1% |
| Local Government Employees | 279 | 10.3% |
| State Government Employees | 23 | 0.9% |
| Federal Government Employees | 12 | 0.4% |
| Unpaid Family Workers | 11 | 0.4% |
| Total | 2,718 | 100.0% |
Employment Status by Age in North Vernon
According to the labor force statistics for North Vernon, out of the total population over 16 years of age (5,662), 53.2% or 3,012 individuals are in the labor force, with 5.9% or 178 of them unemployed. The age group with the highest labor force participation rate is 35 to 44 years, with 84.2% or 603 individuals in the labor force. Within the labor force, the 25 to 29 years age range has the highest percentage of unemployed individuals, with 26.6% or 122 of them being unemployed.
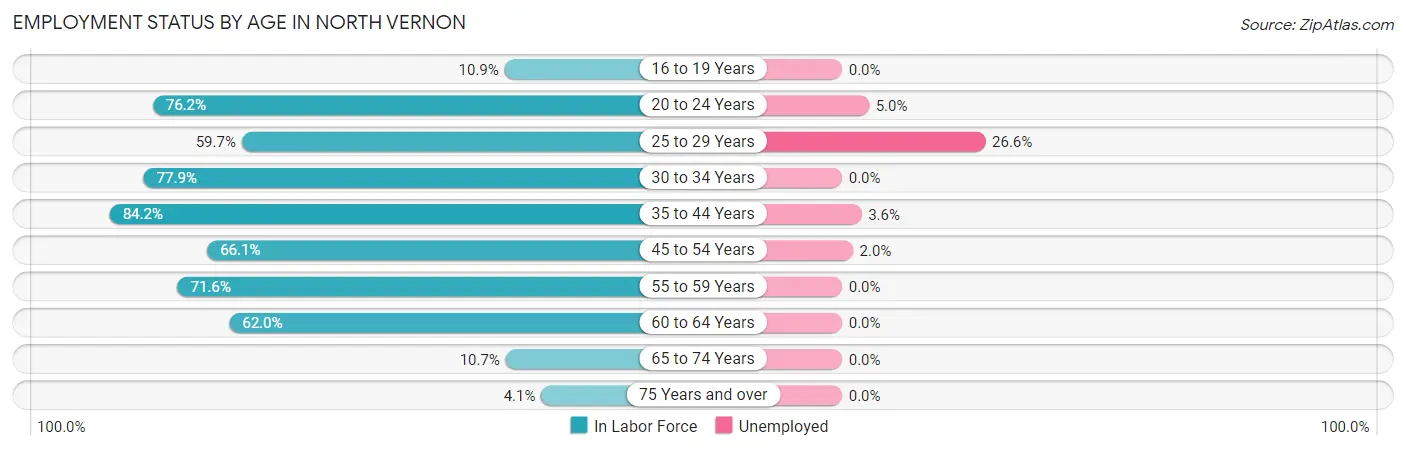
| Age Bracket | In Labor Force | Unemployed |
| 16 to 19 Years | 38 (10.9%) | 0 (0.0%) |
| 20 to 24 Years | 423 (76.2%) | 21 (5.0%) |
| 25 to 29 Years | 458 (59.7%) | 122 (26.6%) |
| 30 to 34 Years | 282 (77.9%) | 0 (0.0%) |
| 35 to 44 Years | 603 (84.2%) | 22 (3.6%) |
| 45 to 54 Years | 704 (66.1%) | 14 (2.0%) |
| 55 to 59 Years | 212 (71.6%) | 0 (0.0%) |
| 60 to 64 Years | 199 (62.0%) | 0 (0.0%) |
| 65 to 74 Years | 69 (10.7%) | 0 (0.0%) |
| 75 Years and over | 24 (4.1%) | 0 (0.0%) |
| Total | 3,012 (53.2%) | 178 (5.9%) |
Employment Status by Educational Attainment in North Vernon
According to labor force statistics for North Vernon, 69.7% of individuals (2,458) out of the total population between 25 and 64 years of age (3,527) are in the labor force, with 6.4% or 157 of them being unemployed. The group with the highest labor force participation rate are those with the educational attainment of bachelor's degree or higher, with 92.2% or 247 individuals in the labor force. Within the labor force, individuals with college / associate degree education have the highest percentage of unemployment, with 9.8% or 105 of them being unemployed.
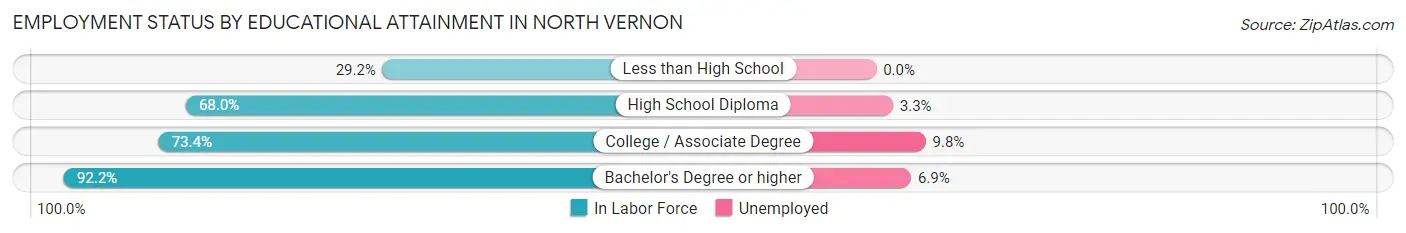
| Educational Attainment | In Labor Force | Unemployed |
| Less than High School | 63 (29.2%) | 0 (0.0%) |
| High School Diploma | 1,075 (68.0%) | 52 (3.3%) |
| College / Associate Degree | 1,073 (73.4%) | 143 (9.8%) |
| Bachelor's Degree or higher | 247 (92.2%) | 18 (6.9%) |
| Total | 2,458 (69.7%) | 226 (6.4%) |
Employment Occupations by Sex in North Vernon
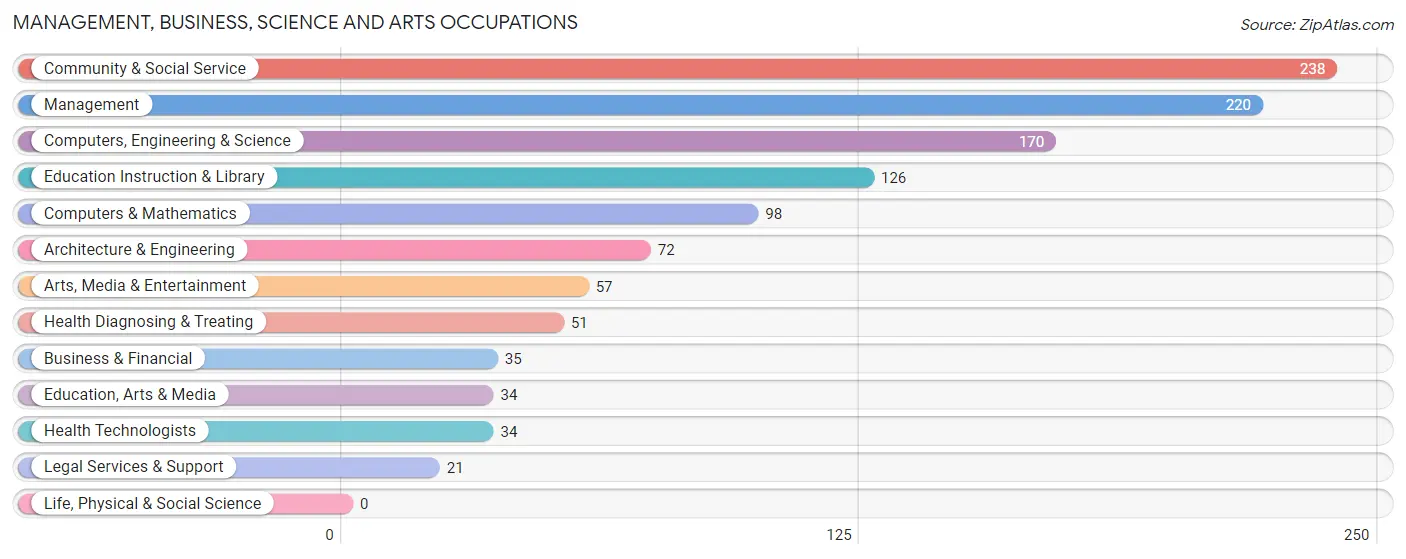
Management, Business, Science and Arts Occupations
The most common Management, Business, Science and Arts occupations in North Vernon are Community & Social Service (238 | 8.4%), Management (220 | 7.8%), Computers, Engineering & Science (170 | 6.0%), Education Instruction & Library (126 | 4.4%), and Computers & Mathematics (98 | 3.5%).
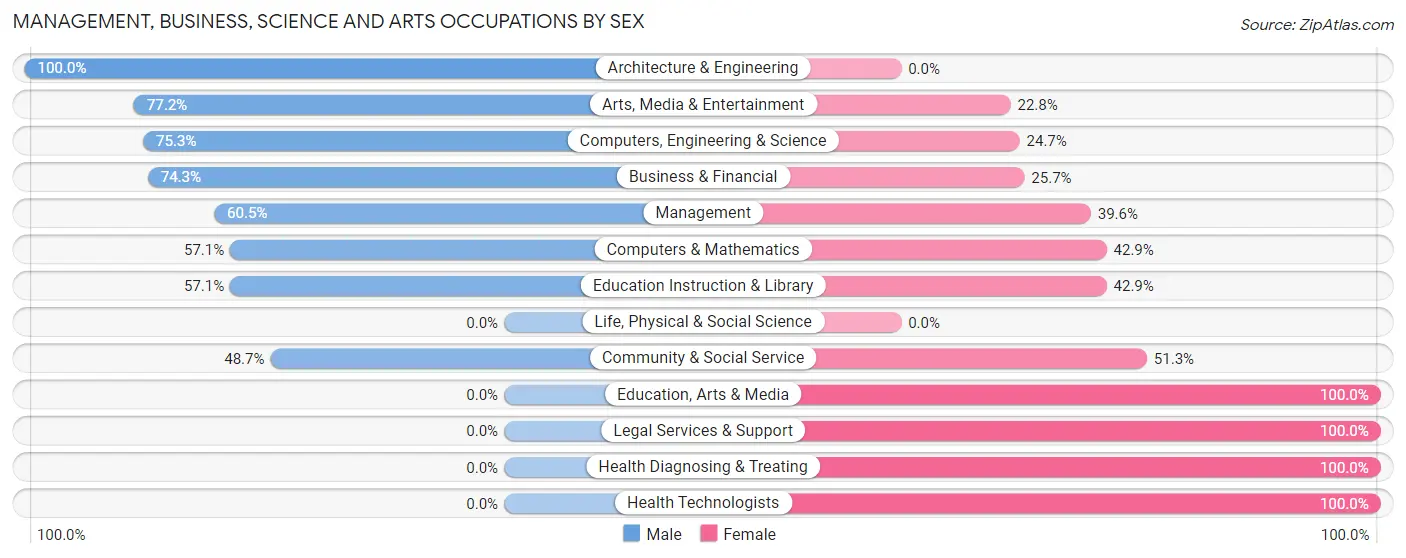
Management, Business, Science and Arts Occupations by Sex
Within the Management, Business, Science and Arts occupations in North Vernon, the most male-oriented occupations are Architecture & Engineering (100.0%), Arts, Media & Entertainment (77.2%), and Computers, Engineering & Science (75.3%), while the most female-oriented occupations are Education, Arts & Media (100.0%), Legal Services & Support (100.0%), and Health Diagnosing & Treating (100.0%).
| Occupation | Male | Female |
| Management | 133 (60.5%) | 87 (39.6%) |
| Business & Financial | 26 (74.3%) | 9 (25.7%) |
| Computers, Engineering & Science | 128 (75.3%) | 42 (24.7%) |
| Computers & Mathematics | 56 (57.1%) | 42 (42.9%) |
| Architecture & Engineering | 72 (100.0%) | 0 (0.0%) |
| Life, Physical & Social Science | 0 (0.0%) | 0 (0.0%) |
| Community & Social Service | 116 (48.7%) | 122 (51.3%) |
| Education, Arts & Media | 0 (0.0%) | 34 (100.0%) |
| Legal Services & Support | 0 (0.0%) | 21 (100.0%) |
| Education Instruction & Library | 72 (57.1%) | 54 (42.9%) |
| Arts, Media & Entertainment | 44 (77.2%) | 13 (22.8%) |
| Health Diagnosing & Treating | 0 (0.0%) | 51 (100.0%) |
| Health Technologists | 0 (0.0%) | 34 (100.0%) |
| Total (Category) | 403 (56.4%) | 311 (43.6%) |
| Total (Overall) | 1,593 (56.2%) | 1,240 (43.8%) |
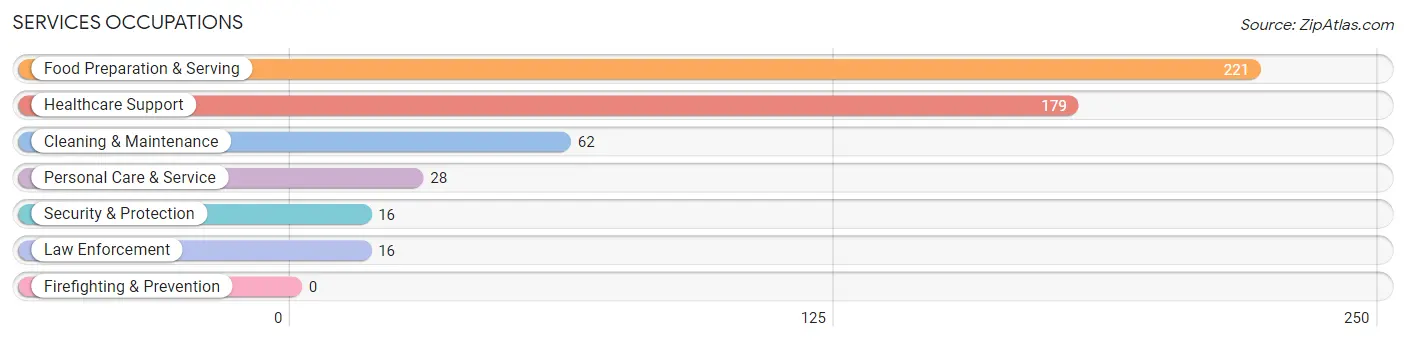
Services Occupations
The most common Services occupations in North Vernon are Food Preparation & Serving (221 | 7.8%), Healthcare Support (179 | 6.3%), Cleaning & Maintenance (62 | 2.2%), Personal Care & Service (28 | 1.0%), and Security & Protection (16 | 0.6%).
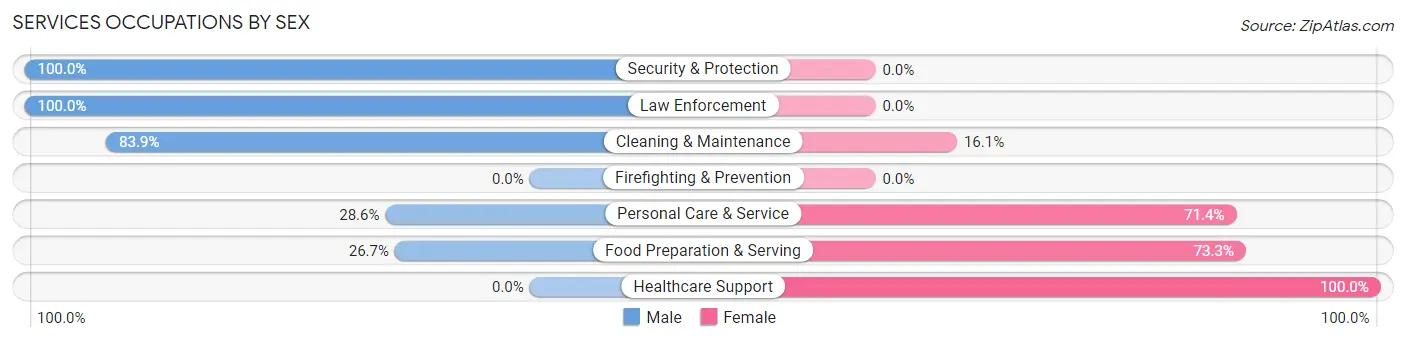
Services Occupations by Sex
Within the Services occupations in North Vernon, the most male-oriented occupations are Security & Protection (100.0%), Law Enforcement (100.0%), and Cleaning & Maintenance (83.9%), while the most female-oriented occupations are Healthcare Support (100.0%), Food Preparation & Serving (73.3%), and Personal Care & Service (71.4%).
| Occupation | Male | Female |
| Healthcare Support | 0 (0.0%) | 179 (100.0%) |
| Security & Protection | 16 (100.0%) | 0 (0.0%) |
| Firefighting & Prevention | 0 (0.0%) | 0 (0.0%) |
| Law Enforcement | 16 (100.0%) | 0 (0.0%) |
| Food Preparation & Serving | 59 (26.7%) | 162 (73.3%) |
| Cleaning & Maintenance | 52 (83.9%) | 10 (16.1%) |
| Personal Care & Service | 8 (28.6%) | 20 (71.4%) |
| Total (Category) | 135 (26.7%) | 371 (73.3%) |
| Total (Overall) | 1,593 (56.2%) | 1,240 (43.8%) |
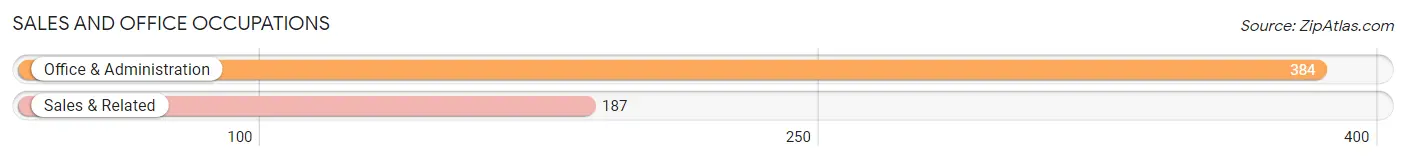
Sales and Office Occupations
The most common Sales and Office occupations in North Vernon are Office & Administration (384 | 13.6%), and Sales & Related (187 | 6.6%).
Sales and Office Occupations by Sex
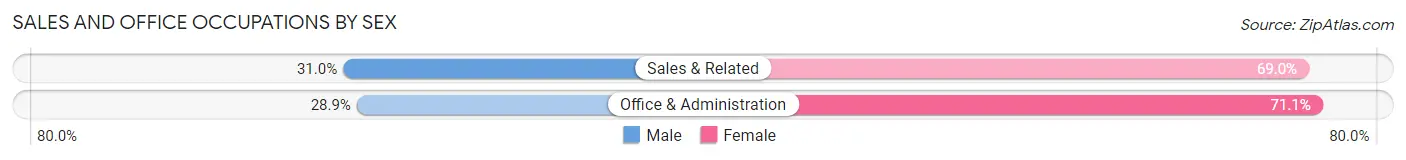
| Occupation | Male | Female |
| Sales & Related | 58 (31.0%) | 129 (69.0%) |
| Office & Administration | 111 (28.9%) | 273 (71.1%) |
| Total (Category) | 169 (29.6%) | 402 (70.4%) |
| Total (Overall) | 1,593 (56.2%) | 1,240 (43.8%) |
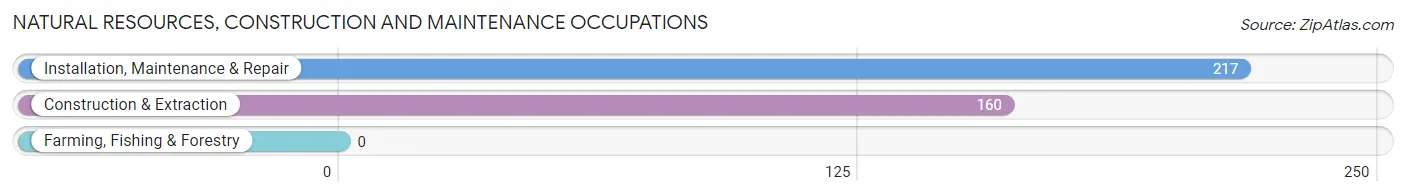
Natural Resources, Construction and Maintenance Occupations
The most common Natural Resources, Construction and Maintenance occupations in North Vernon are Installation, Maintenance & Repair (217 | 7.7%), and Construction & Extraction (160 | 5.7%).
Natural Resources, Construction and Maintenance Occupations by Sex
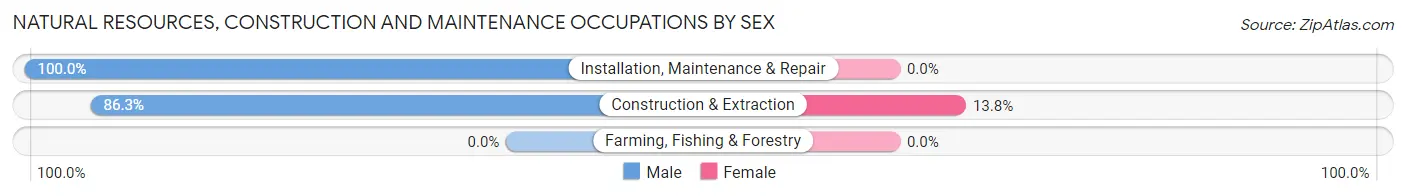
| Occupation | Male | Female |
| Farming, Fishing & Forestry | 0 (0.0%) | 0 (0.0%) |
| Construction & Extraction | 138 (86.3%) | 22 (13.8%) |
| Installation, Maintenance & Repair | 217 (100.0%) | 0 (0.0%) |
| Total (Category) | 355 (94.2%) | 22 (5.8%) |
| Total (Overall) | 1,593 (56.2%) | 1,240 (43.8%) |
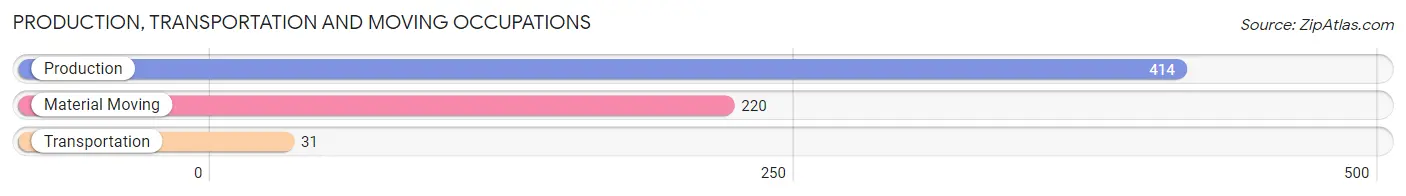
Production, Transportation and Moving Occupations
The most common Production, Transportation and Moving occupations in North Vernon are Production (414 | 14.6%), Material Moving (220 | 7.8%), and Transportation (31 | 1.1%).
Production, Transportation and Moving Occupations by Sex
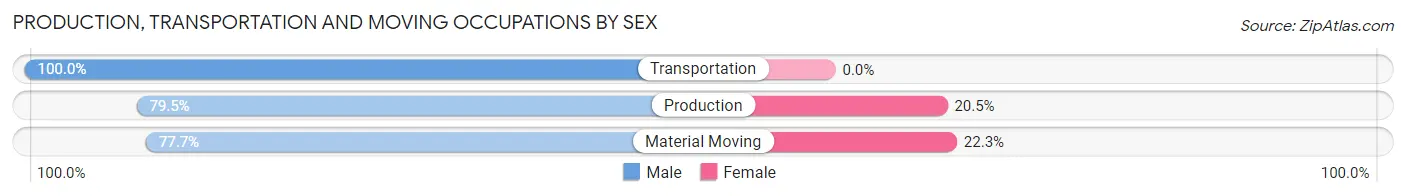
| Occupation | Male | Female |
| Production | 329 (79.5%) | 85 (20.5%) |
| Transportation | 31 (100.0%) | 0 (0.0%) |
| Material Moving | 171 (77.7%) | 49 (22.3%) |
| Total (Category) | 531 (79.8%) | 134 (20.2%) |
| Total (Overall) | 1,593 (56.2%) | 1,240 (43.8%) |
Employment Industries by Sex in North Vernon
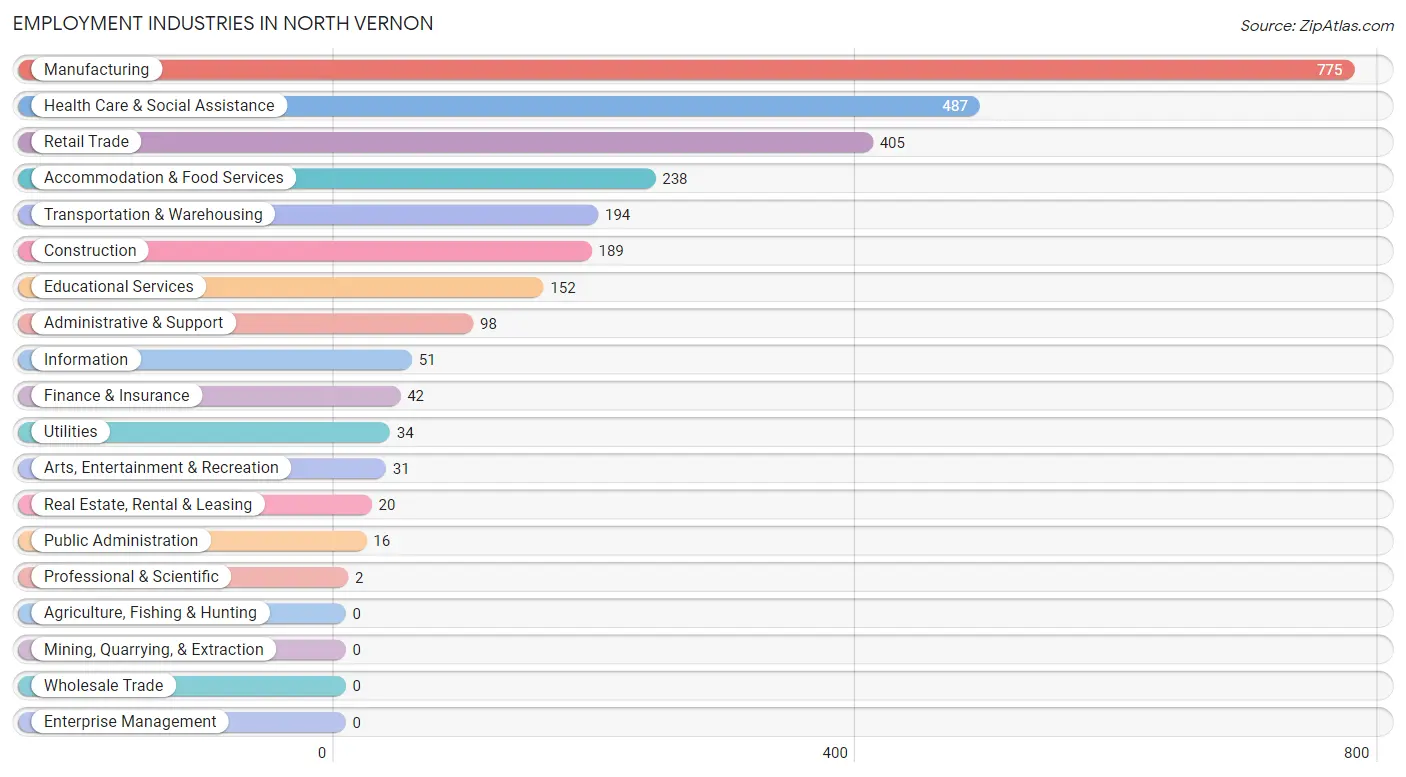
Employment Industries in North Vernon
The major employment industries in North Vernon include Manufacturing (775 | 27.4%), Health Care & Social Assistance (487 | 17.2%), Retail Trade (405 | 14.3%), Accommodation & Food Services (238 | 8.4%), and Transportation & Warehousing (194 | 6.9%).
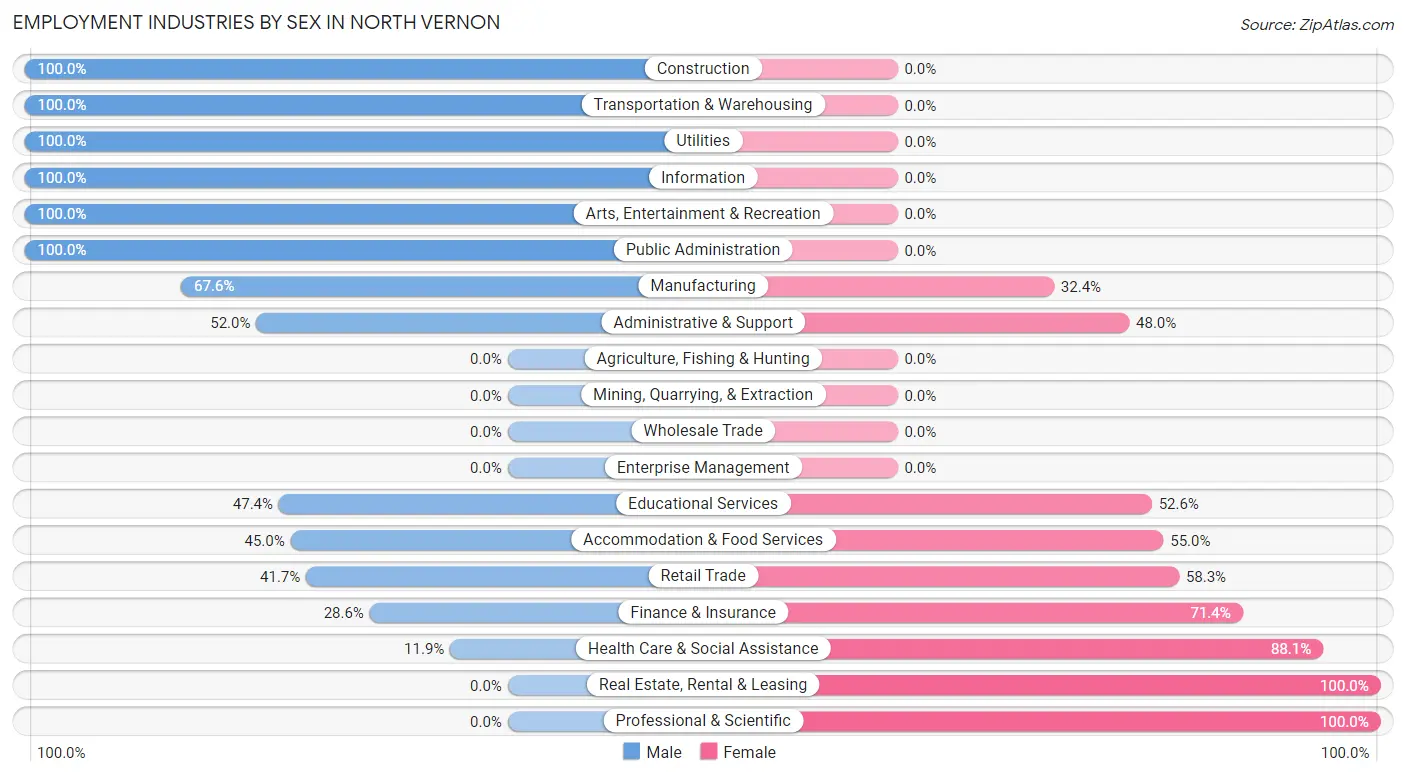
Employment Industries by Sex in North Vernon
The North Vernon industries that see more men than women are Construction (100.0%), Transportation & Warehousing (100.0%), and Utilities (100.0%), whereas the industries that tend to have a higher number of women are Real Estate, Rental & Leasing (100.0%), Professional & Scientific (100.0%), and Health Care & Social Assistance (88.1%).
| Industry | Male | Female |
| Agriculture, Fishing & Hunting | 0 (0.0%) | 0 (0.0%) |
| Mining, Quarrying, & Extraction | 0 (0.0%) | 0 (0.0%) |
| Construction | 189 (100.0%) | 0 (0.0%) |
| Manufacturing | 524 (67.6%) | 251 (32.4%) |
| Wholesale Trade | 0 (0.0%) | 0 (0.0%) |
| Retail Trade | 169 (41.7%) | 236 (58.3%) |
| Transportation & Warehousing | 194 (100.0%) | 0 (0.0%) |
| Utilities | 34 (100.0%) | 0 (0.0%) |
| Information | 51 (100.0%) | 0 (0.0%) |
| Finance & Insurance | 12 (28.6%) | 30 (71.4%) |
| Real Estate, Rental & Leasing | 0 (0.0%) | 20 (100.0%) |
| Professional & Scientific | 0 (0.0%) | 2 (100.0%) |
| Enterprise Management | 0 (0.0%) | 0 (0.0%) |
| Administrative & Support | 51 (52.0%) | 47 (48.0%) |
| Educational Services | 72 (47.4%) | 80 (52.6%) |
| Health Care & Social Assistance | 58 (11.9%) | 429 (88.1%) |
| Arts, Entertainment & Recreation | 31 (100.0%) | 0 (0.0%) |
| Accommodation & Food Services | 107 (45.0%) | 131 (55.0%) |
| Public Administration | 16 (100.0%) | 0 (0.0%) |
| Total | 1,593 (56.2%) | 1,240 (43.8%) |
Education in North Vernon
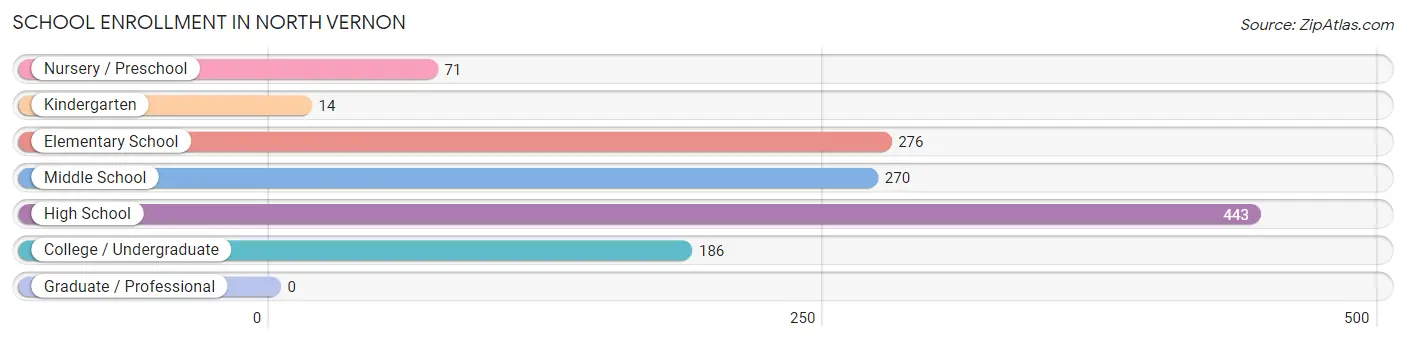
School Enrollment in North Vernon
The most common levels of schooling among the 1,260 students in North Vernon are high school (443 | 35.2%), elementary school (276 | 21.9%), and middle school (270 | 21.4%).
| School Level | # Students | % Students |
| Nursery / Preschool | 71 | 5.6% |
| Kindergarten | 14 | 1.1% |
| Elementary School | 276 | 21.9% |
| Middle School | 270 | 21.4% |
| High School | 443 | 35.2% |
| College / Undergraduate | 186 | 14.8% |
| Graduate / Professional | 0 | 0.0% |
| Total | 1,260 | 100.0% |
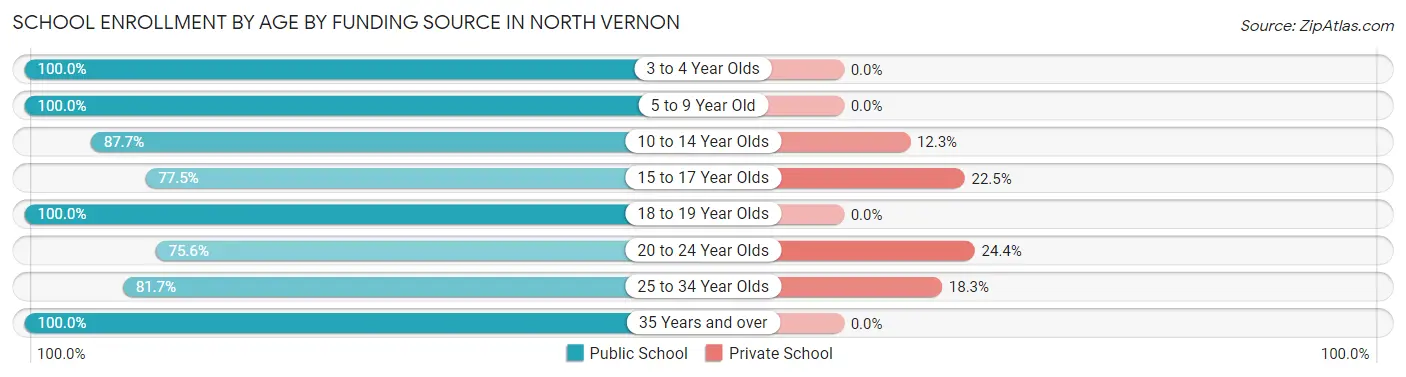
School Enrollment by Age by Funding Source in North Vernon
Out of a total of 1,260 students who are enrolled in schools in North Vernon, 152 (12.1%) attend a private institution, while the remaining 1,108 (87.9%) are enrolled in public schools. The age group of 20 to 24 year olds has the highest likelihood of being enrolled in private schools, with 20 (24.4% in the age bracket) enrolled. Conversely, the age group of 3 to 4 year olds has the lowest likelihood of being enrolled in a private school, with 39 (100.0% in the age bracket) attending a public institution.
| Age Bracket | Public School | Private School |
| 3 to 4 Year Olds | 39 (100.0%) | 0 (0.0%) |
| 5 to 9 Year Old | 322 (100.0%) | 0 (0.0%) |
| 10 to 14 Year Olds | 277 (87.7%) | 39 (12.3%) |
| 15 to 17 Year Olds | 272 (77.5%) | 79 (22.5%) |
| 18 to 19 Year Olds | 22 (100.0%) | 0 (0.0%) |
| 20 to 24 Year Olds | 62 (75.6%) | 20 (24.4%) |
| 25 to 34 Year Olds | 67 (81.7%) | 15 (18.3%) |
| 35 Years and over | 46 (100.0%) | 0 (0.0%) |
| Total | 1,108 (87.9%) | 152 (12.1%) |
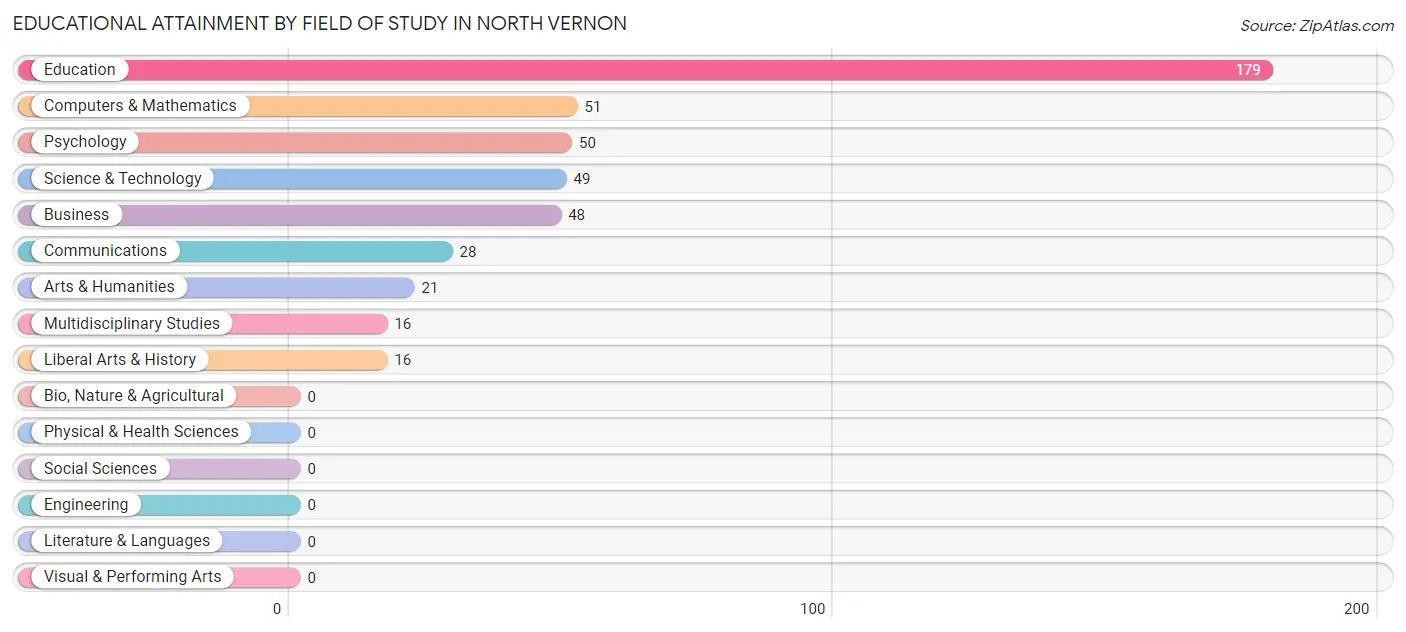
Educational Attainment by Field of Study in North Vernon
Education (179 | 39.1%), computers & mathematics (51 | 11.1%), psychology (50 | 10.9%), science & technology (49 | 10.7%), and business (48 | 10.5%) are the most common fields of study among 458 individuals in North Vernon who have obtained a bachelor's degree or higher.
| Field of Study | # Graduates | % Graduates |
| Computers & Mathematics | 51 | 11.1% |
| Bio, Nature & Agricultural | 0 | 0.0% |
| Physical & Health Sciences | 0 | 0.0% |
| Psychology | 50 | 10.9% |
| Social Sciences | 0 | 0.0% |
| Engineering | 0 | 0.0% |
| Multidisciplinary Studies | 16 | 3.5% |
| Science & Technology | 49 | 10.7% |
| Business | 48 | 10.5% |
| Education | 179 | 39.1% |
| Literature & Languages | 0 | 0.0% |
| Liberal Arts & History | 16 | 3.5% |
| Visual & Performing Arts | 0 | 0.0% |
| Communications | 28 | 6.1% |
| Arts & Humanities | 21 | 4.6% |
| Total | 458 | 100.0% |
Transportation & Commute in North Vernon
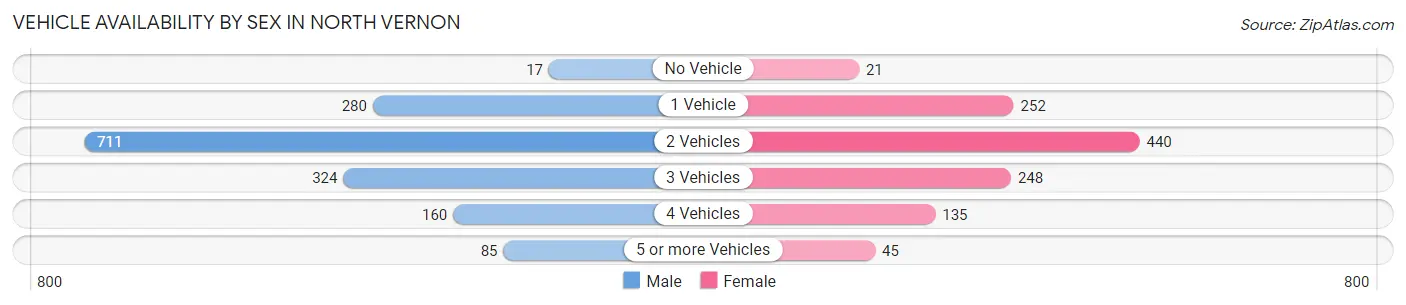
Vehicle Availability by Sex in North Vernon
The most prevalent vehicle ownership categories in North Vernon are males with 2 vehicles (711, accounting for 45.1%) and females with 2 vehicles (440, making up 62.3%).
| Vehicles Available | Male | Female |
| No Vehicle | 17 (1.1%) | 21 (1.8%) |
| 1 Vehicle | 280 (17.8%) | 252 (22.1%) |
| 2 Vehicles | 711 (45.1%) | 440 (38.6%) |
| 3 Vehicles | 324 (20.5%) | 248 (21.7%) |
| 4 Vehicles | 160 (10.2%) | 135 (11.8%) |
| 5 or more Vehicles | 85 (5.4%) | 45 (3.9%) |
| Total | 1,577 (100.0%) | 1,141 (100.0%) |
Commute Time in North Vernon
The most frequently occuring commute durations in North Vernon are 5 to 9 minutes (581 commuters, 22.4%), 10 to 14 minutes (549 commuters, 21.2%), and 30 to 34 minutes (426 commuters, 16.4%).
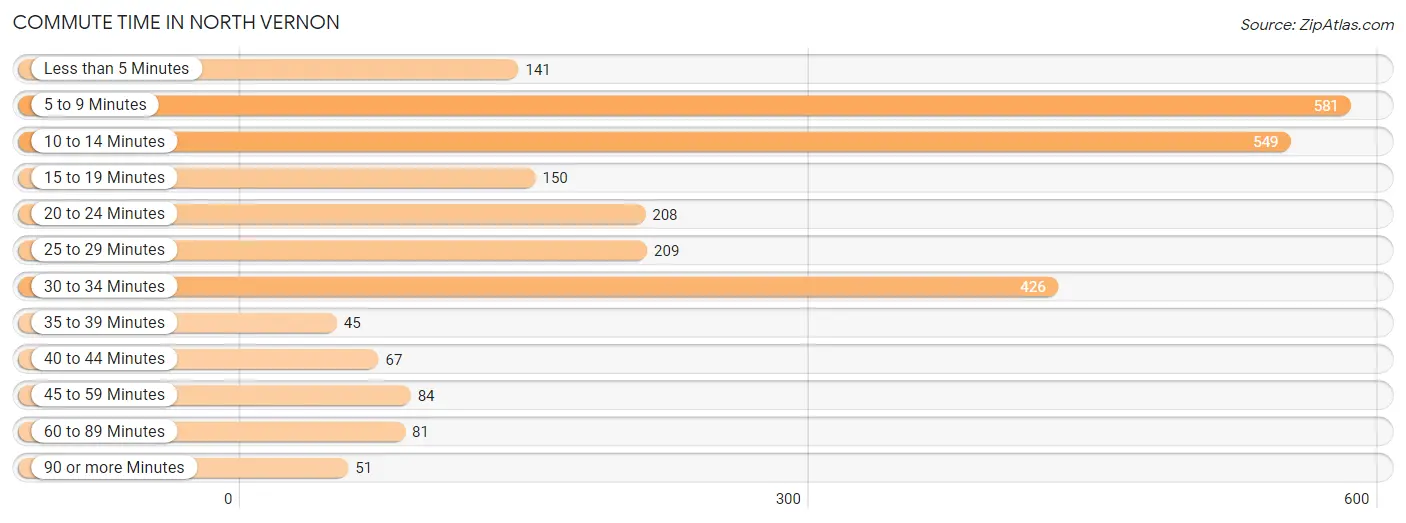
| Commute Time | # Commuters | % Commuters |
| Less than 5 Minutes | 141 | 5.4% |
| 5 to 9 Minutes | 581 | 22.4% |
| 10 to 14 Minutes | 549 | 21.2% |
| 15 to 19 Minutes | 150 | 5.8% |
| 20 to 24 Minutes | 208 | 8.0% |
| 25 to 29 Minutes | 209 | 8.1% |
| 30 to 34 Minutes | 426 | 16.4% |
| 35 to 39 Minutes | 45 | 1.7% |
| 40 to 44 Minutes | 67 | 2.6% |
| 45 to 59 Minutes | 84 | 3.2% |
| 60 to 89 Minutes | 81 | 3.1% |
| 90 or more Minutes | 51 | 2.0% |
Commute Time by Sex in North Vernon
The most common commute times in North Vernon are 5 to 9 minutes (327 commuters, 20.9%) for males and 10 to 14 minutes (338 commuters, 33.0%) for females.
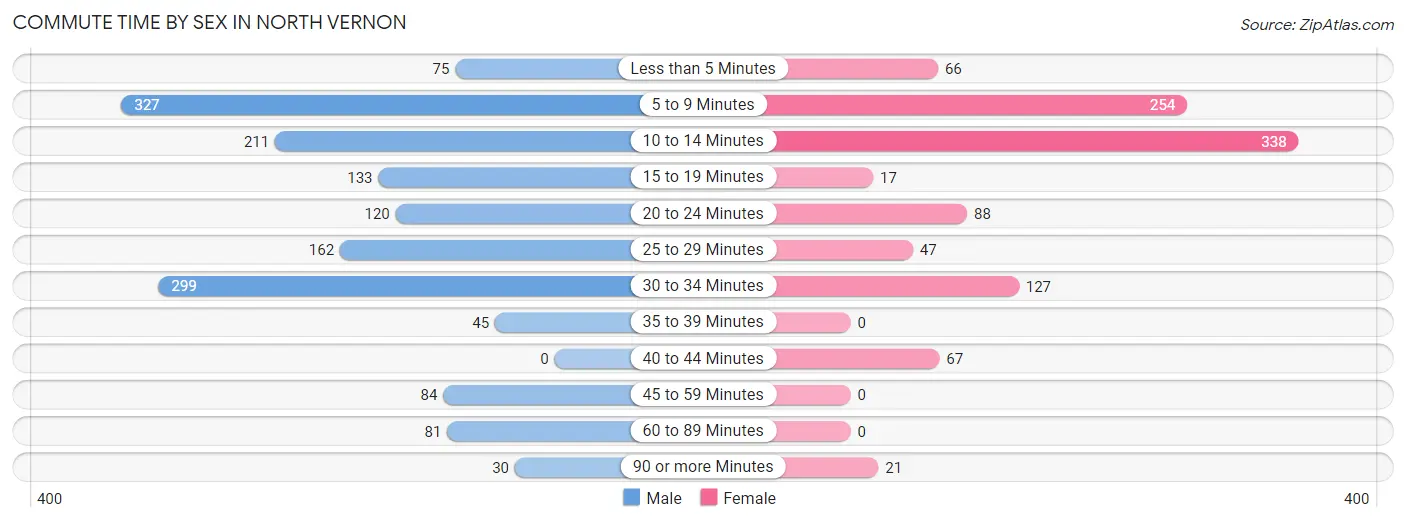
| Commute Time | Male | Female |
| Less than 5 Minutes | 75 (4.8%) | 66 (6.4%) |
| 5 to 9 Minutes | 327 (20.9%) | 254 (24.8%) |
| 10 to 14 Minutes | 211 (13.5%) | 338 (33.0%) |
| 15 to 19 Minutes | 133 (8.5%) | 17 (1.7%) |
| 20 to 24 Minutes | 120 (7.7%) | 88 (8.6%) |
| 25 to 29 Minutes | 162 (10.3%) | 47 (4.6%) |
| 30 to 34 Minutes | 299 (19.1%) | 127 (12.4%) |
| 35 to 39 Minutes | 45 (2.9%) | 0 (0.0%) |
| 40 to 44 Minutes | 0 (0.0%) | 67 (6.5%) |
| 45 to 59 Minutes | 84 (5.4%) | 0 (0.0%) |
| 60 to 89 Minutes | 81 (5.2%) | 0 (0.0%) |
| 90 or more Minutes | 30 (1.9%) | 21 (2.1%) |
Time of Departure to Work by Sex in North Vernon
The most frequent times of departure to work in North Vernon are 7:30 AM to 7:59 AM (288, 18.4%) for males and 7:30 AM to 7:59 AM (227, 22.2%) for females.
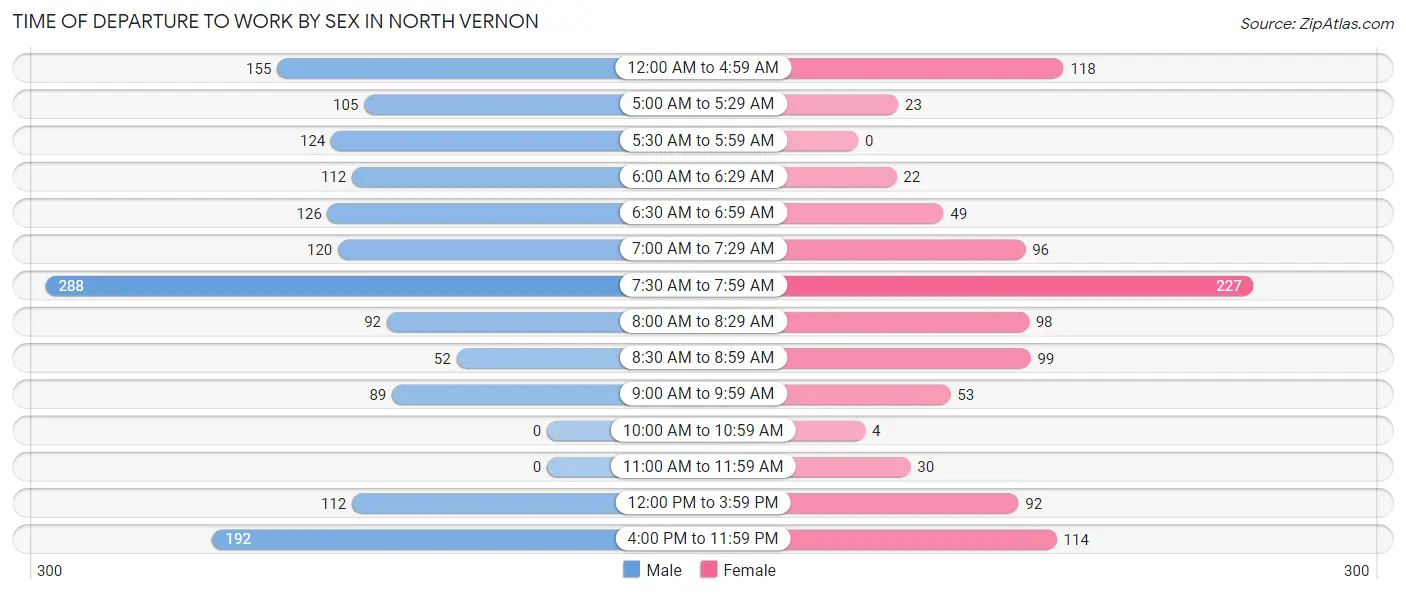
| Time of Departure | Male | Female |
| 12:00 AM to 4:59 AM | 155 (9.9%) | 118 (11.5%) |
| 5:00 AM to 5:29 AM | 105 (6.7%) | 23 (2.2%) |
| 5:30 AM to 5:59 AM | 124 (7.9%) | 0 (0.0%) |
| 6:00 AM to 6:29 AM | 112 (7.1%) | 22 (2.1%) |
| 6:30 AM to 6:59 AM | 126 (8.0%) | 49 (4.8%) |
| 7:00 AM to 7:29 AM | 120 (7.7%) | 96 (9.4%) |
| 7:30 AM to 7:59 AM | 288 (18.4%) | 227 (22.2%) |
| 8:00 AM to 8:29 AM | 92 (5.9%) | 98 (9.6%) |
| 8:30 AM to 8:59 AM | 52 (3.3%) | 99 (9.7%) |
| 9:00 AM to 9:59 AM | 89 (5.7%) | 53 (5.2%) |
| 10:00 AM to 10:59 AM | 0 (0.0%) | 4 (0.4%) |
| 11:00 AM to 11:59 AM | 0 (0.0%) | 30 (2.9%) |
| 12:00 PM to 3:59 PM | 112 (7.1%) | 92 (9.0%) |
| 4:00 PM to 11:59 PM | 192 (12.2%) | 114 (11.1%) |
| Total | 1,567 (100.0%) | 1,025 (100.0%) |
Housing Occupancy in North Vernon
Occupancy by Ownership in North Vernon
Of the total 2,939 dwellings in North Vernon, owner-occupied units account for 1,708 (58.1%), while renter-occupied units make up 1,231 (41.9%).
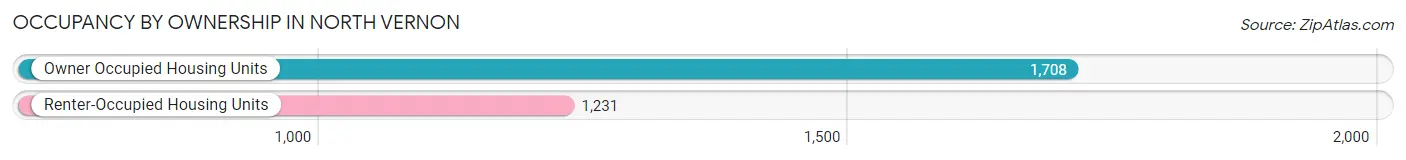
| Occupancy | # Housing Units | % Housing Units |
| Owner Occupied Housing Units | 1,708 | 58.1% |
| Renter-Occupied Housing Units | 1,231 | 41.9% |
| Total Occupied Housing Units | 2,939 | 100.0% |
Occupancy by Household Size in North Vernon
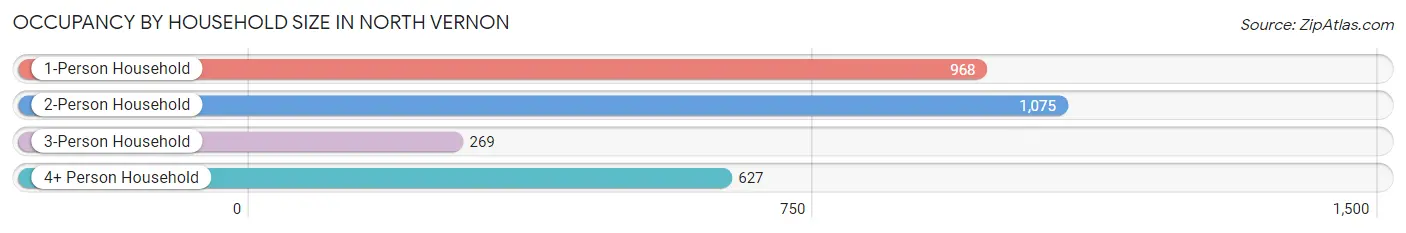
| Household Size | # Housing Units | % Housing Units |
| 1-Person Household | 968 | 32.9% |
| 2-Person Household | 1,075 | 36.6% |
| 3-Person Household | 269 | 9.1% |
| 4+ Person Household | 627 | 21.3% |
| Total Housing Units | 2,939 | 100.0% |
Occupancy by Ownership by Household Size in North Vernon
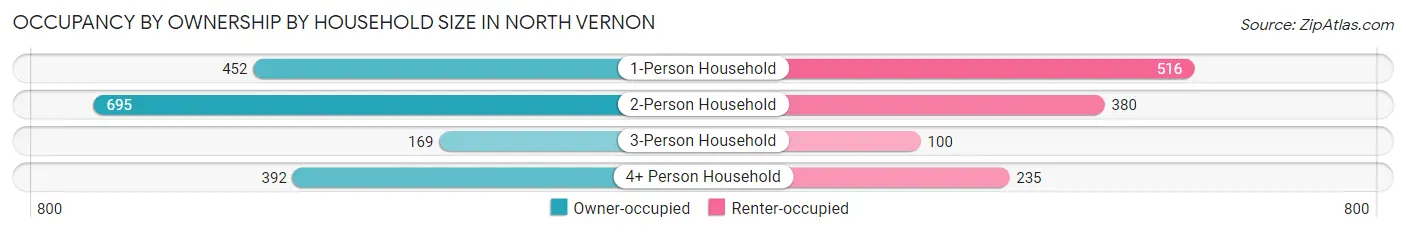
| Household Size | Owner-occupied | Renter-occupied |
| 1-Person Household | 452 (46.7%) | 516 (53.3%) |
| 2-Person Household | 695 (64.6%) | 380 (35.3%) |
| 3-Person Household | 169 (62.8%) | 100 (37.2%) |
| 4+ Person Household | 392 (62.5%) | 235 (37.5%) |
| Total Housing Units | 1,708 (58.1%) | 1,231 (41.9%) |
Occupancy by Educational Attainment in North Vernon
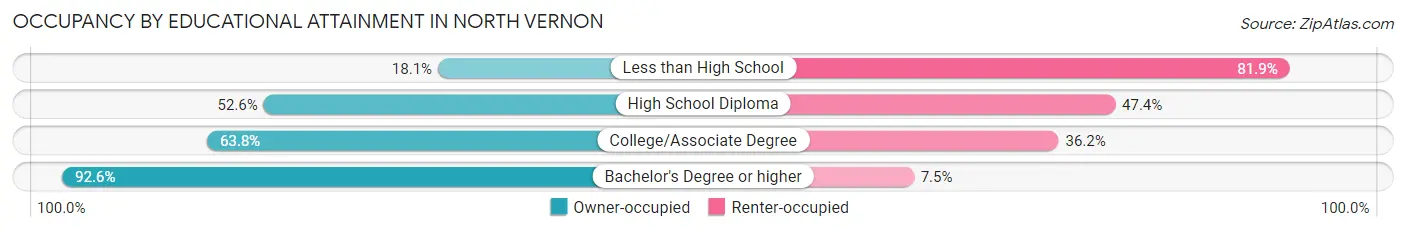
| Household Size | Owner-occupied | Renter-occupied |
| Less than High School | 54 (18.1%) | 245 (81.9%) |
| High School Diploma | 581 (52.6%) | 523 (47.4%) |
| College/Associate Degree | 775 (63.8%) | 439 (36.2%) |
| Bachelor's Degree or higher | 298 (92.5%) | 24 (7.4%) |
Occupancy by Age of Householder in North Vernon
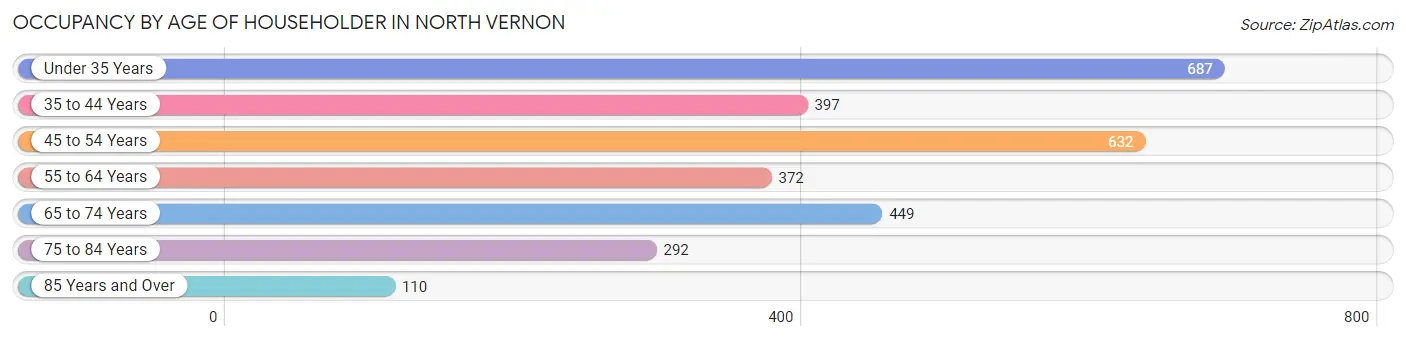
| Age Bracket | # Households | % Households |
| Under 35 Years | 687 | 23.4% |
| 35 to 44 Years | 397 | 13.5% |
| 45 to 54 Years | 632 | 21.5% |
| 55 to 64 Years | 372 | 12.7% |
| 65 to 74 Years | 449 | 15.3% |
| 75 to 84 Years | 292 | 9.9% |
| 85 Years and Over | 110 | 3.7% |
| Total | 2,939 | 100.0% |
Housing Finances in North Vernon
Median Income by Occupancy in North Vernon
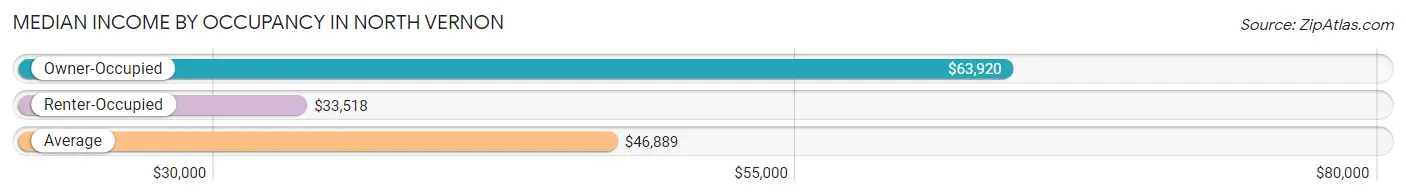
| Occupancy Type | # Households | Median Income |
| Owner-Occupied | 1,708 (58.1%) | $63,920 |
| Renter-Occupied | 1,231 (41.9%) | $33,518 |
| Average | 2,939 (100.0%) | $46,889 |
Occupancy by Householder Income Bracket in North Vernon
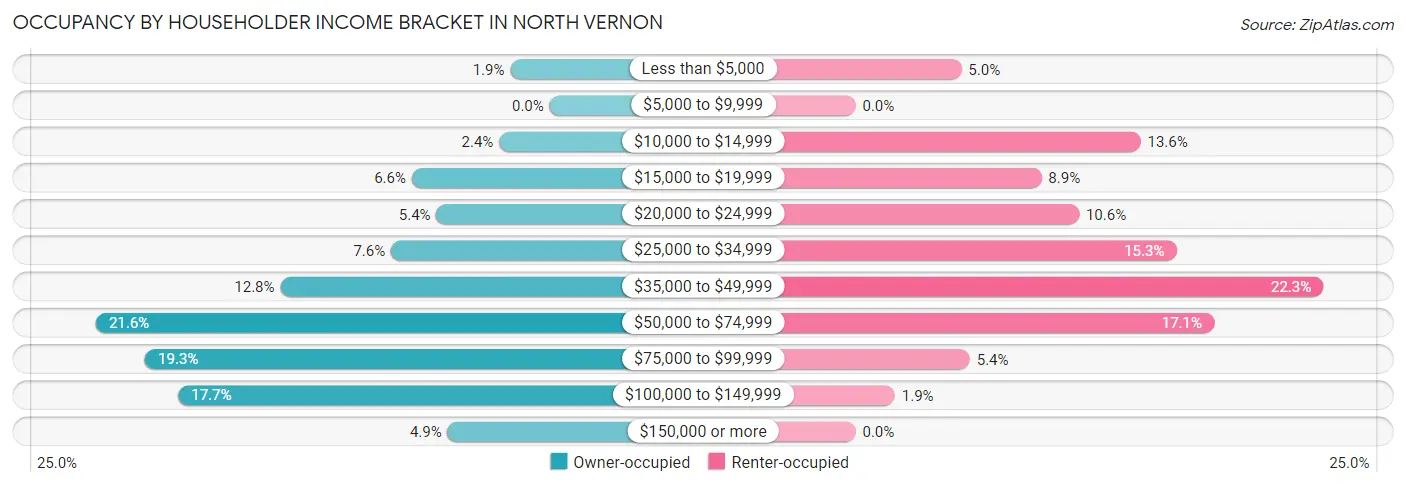
| Income Bracket | Owner-occupied | Renter-occupied |
| Less than $5,000 | 32 (1.9%) | 62 (5.0%) |
| $5,000 to $9,999 | 0 (0.0%) | 0 (0.0%) |
| $10,000 to $14,999 | 41 (2.4%) | 167 (13.6%) |
| $15,000 to $19,999 | 112 (6.6%) | 109 (8.8%) |
| $20,000 to $24,999 | 92 (5.4%) | 131 (10.6%) |
| $25,000 to $34,999 | 129 (7.5%) | 188 (15.3%) |
| $35,000 to $49,999 | 219 (12.8%) | 274 (22.3%) |
| $50,000 to $74,999 | 369 (21.6%) | 210 (17.1%) |
| $75,000 to $99,999 | 329 (19.3%) | 67 (5.4%) |
| $100,000 to $149,999 | 302 (17.7%) | 23 (1.9%) |
| $150,000 or more | 83 (4.9%) | 0 (0.0%) |
| Total | 1,708 (100.0%) | 1,231 (100.0%) |
Monthly Housing Cost Tiers in North Vernon
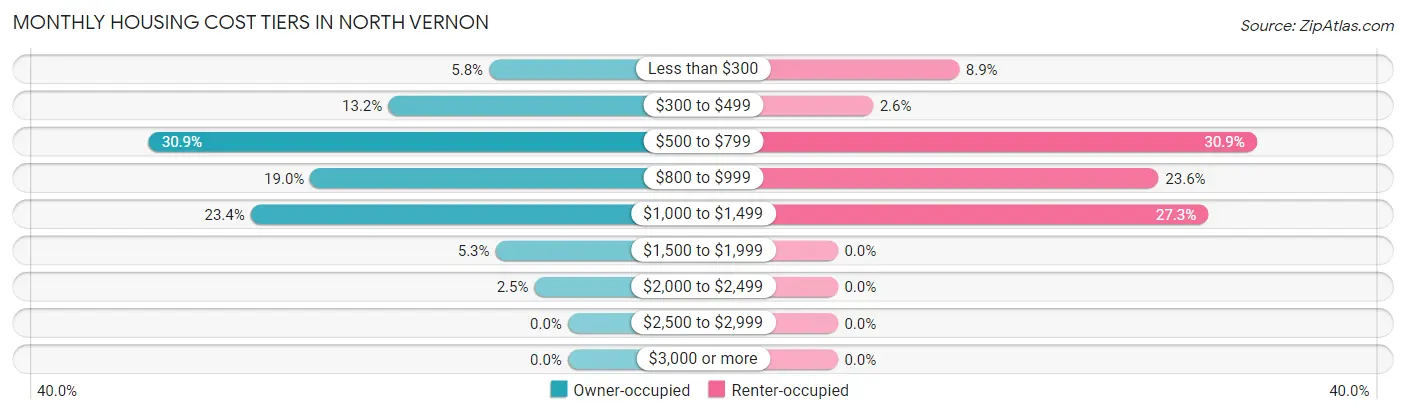
| Monthly Cost | Owner-occupied | Renter-occupied |
| Less than $300 | 99 (5.8%) | 110 (8.9%) |
| $300 to $499 | 226 (13.2%) | 32 (2.6%) |
| $500 to $799 | 527 (30.8%) | 380 (30.9%) |
| $800 to $999 | 324 (19.0%) | 291 (23.6%) |
| $1,000 to $1,499 | 399 (23.4%) | 336 (27.3%) |
| $1,500 to $1,999 | 91 (5.3%) | 0 (0.0%) |
| $2,000 to $2,499 | 42 (2.5%) | 0 (0.0%) |
| $2,500 to $2,999 | 0 (0.0%) | 0 (0.0%) |
| $3,000 or more | 0 (0.0%) | 0 (0.0%) |
| Total | 1,708 (100.0%) | 1,231 (100.0%) |
Physical Housing Characteristics in North Vernon
Housing Structures in North Vernon
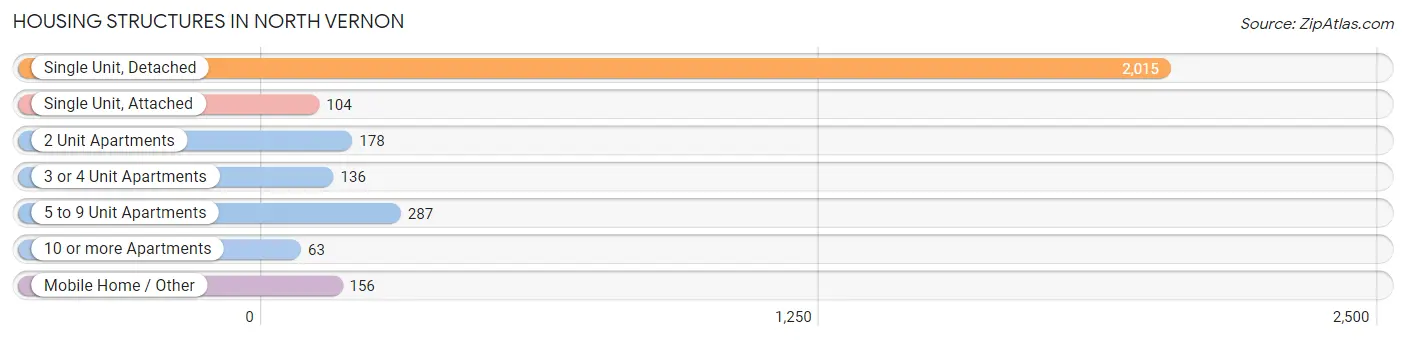
| Structure Type | # Housing Units | % Housing Units |
| Single Unit, Detached | 2,015 | 68.6% |
| Single Unit, Attached | 104 | 3.5% |
| 2 Unit Apartments | 178 | 6.1% |
| 3 or 4 Unit Apartments | 136 | 4.6% |
| 5 to 9 Unit Apartments | 287 | 9.8% |
| 10 or more Apartments | 63 | 2.1% |
| Mobile Home / Other | 156 | 5.3% |
| Total | 2,939 | 100.0% |
Housing Structures by Occupancy in North Vernon
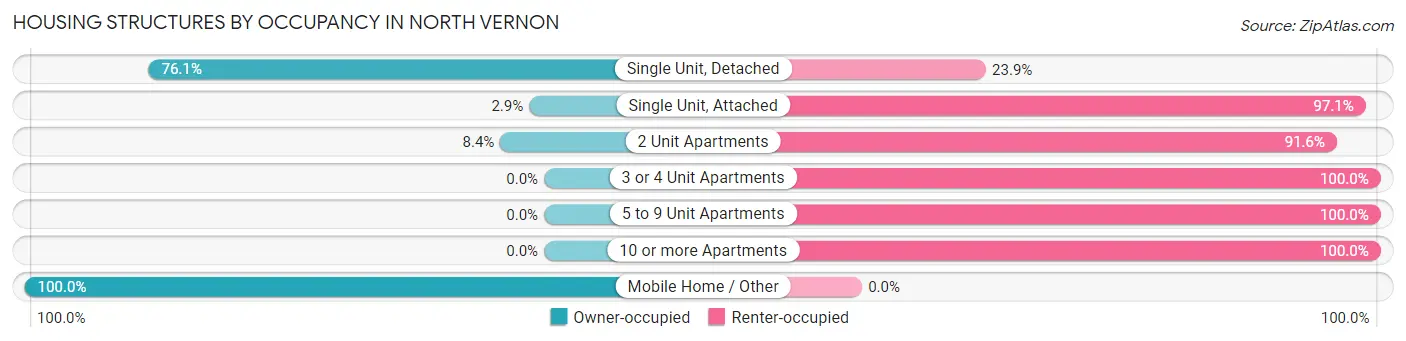
| Structure Type | Owner-occupied | Renter-occupied |
| Single Unit, Detached | 1,534 (76.1%) | 481 (23.9%) |
| Single Unit, Attached | 3 (2.9%) | 101 (97.1%) |
| 2 Unit Apartments | 15 (8.4%) | 163 (91.6%) |
| 3 or 4 Unit Apartments | 0 (0.0%) | 136 (100.0%) |
| 5 to 9 Unit Apartments | 0 (0.0%) | 287 (100.0%) |
| 10 or more Apartments | 0 (0.0%) | 63 (100.0%) |
| Mobile Home / Other | 156 (100.0%) | 0 (0.0%) |
| Total | 1,708 (58.1%) | 1,231 (41.9%) |
Housing Structures by Number of Rooms in North Vernon
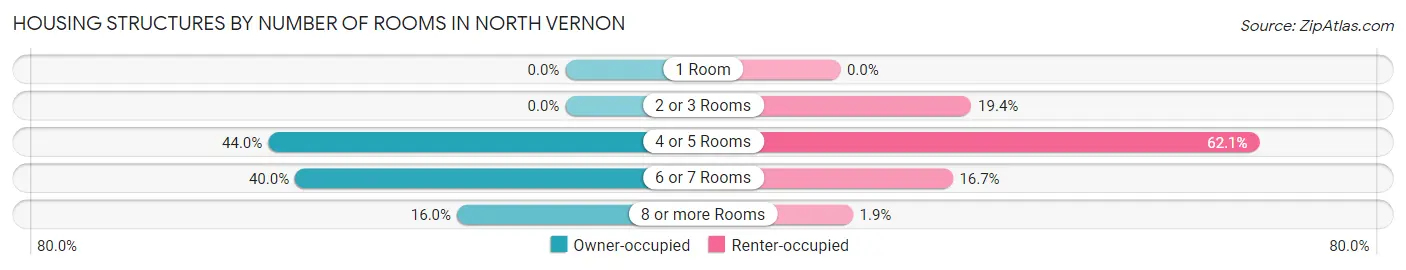
| Number of Rooms | Owner-occupied | Renter-occupied |
| 1 Room | 0 (0.0%) | 0 (0.0%) |
| 2 or 3 Rooms | 0 (0.0%) | 239 (19.4%) |
| 4 or 5 Rooms | 751 (44.0%) | 764 (62.1%) |
| 6 or 7 Rooms | 683 (40.0%) | 205 (16.7%) |
| 8 or more Rooms | 274 (16.0%) | 23 (1.9%) |
| Total | 1,708 (100.0%) | 1,231 (100.0%) |
Housing Structure by Heating Type in North Vernon
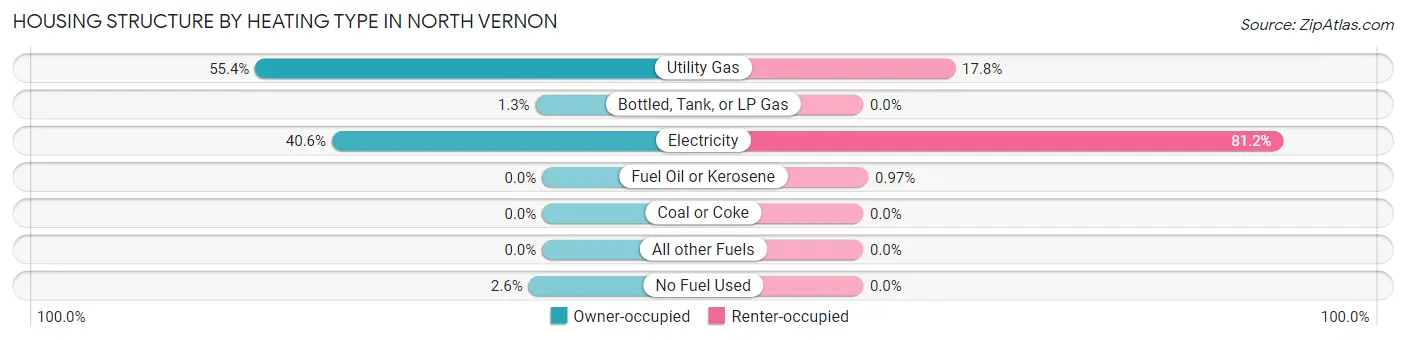
| Heating Type | Owner-occupied | Renter-occupied |
| Utility Gas | 947 (55.4%) | 219 (17.8%) |
| Bottled, Tank, or LP Gas | 22 (1.3%) | 0 (0.0%) |
| Electricity | 694 (40.6%) | 1,000 (81.2%) |
| Fuel Oil or Kerosene | 0 (0.0%) | 12 (1.0%) |
| Coal or Coke | 0 (0.0%) | 0 (0.0%) |
| All other Fuels | 0 (0.0%) | 0 (0.0%) |
| No Fuel Used | 45 (2.6%) | 0 (0.0%) |
| Total | 1,708 (100.0%) | 1,231 (100.0%) |
Household Vehicle Usage in North Vernon
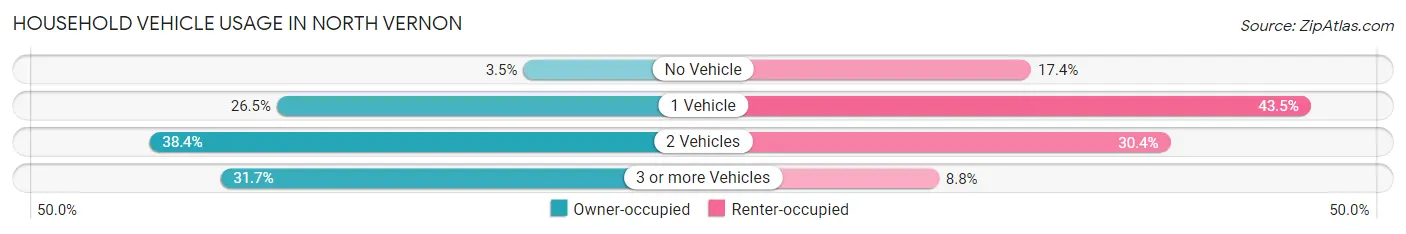
| Vehicles per Household | Owner-occupied | Renter-occupied |
| No Vehicle | 59 (3.5%) | 214 (17.4%) |
| 1 Vehicle | 452 (26.5%) | 535 (43.5%) |
| 2 Vehicles | 655 (38.4%) | 374 (30.4%) |
| 3 or more Vehicles | 542 (31.7%) | 108 (8.8%) |
| Total | 1,708 (100.0%) | 1,231 (100.0%) |
Real Estate & Mortgages in North Vernon
Real Estate and Mortgage Overview in North Vernon
| Characteristic | Without Mortgage | With Mortgage |
| Housing Units | 536 | 1,172 |
| Median Property Value | $122,600 | $99,800 |
| Median Household Income | $77,500 | $50 |
| Monthly Housing Costs | $485 | $0 |
| Real Estate Taxes | $675 | $42 |
Property Value by Mortgage Status in North Vernon
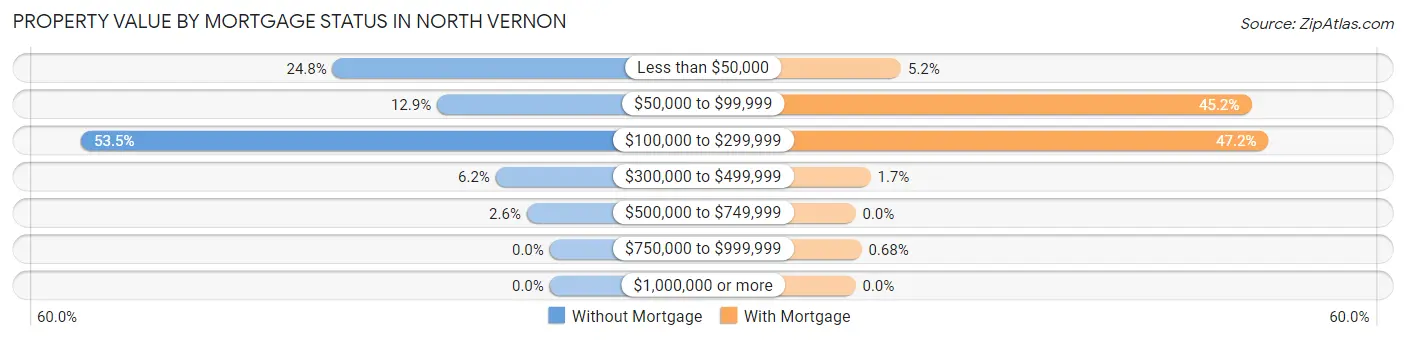
| Property Value | Without Mortgage | With Mortgage |
| Less than $50,000 | 133 (24.8%) | 61 (5.2%) |
| $50,000 to $99,999 | 69 (12.9%) | 530 (45.2%) |
| $100,000 to $299,999 | 287 (53.5%) | 553 (47.2%) |
| $300,000 to $499,999 | 33 (6.2%) | 20 (1.7%) |
| $500,000 to $749,999 | 14 (2.6%) | 0 (0.0%) |
| $750,000 to $999,999 | 0 (0.0%) | 8 (0.7%) |
| $1,000,000 or more | 0 (0.0%) | 0 (0.0%) |
| Total | 536 (100.0%) | 1,172 (100.0%) |
Household Income by Mortgage Status in North Vernon
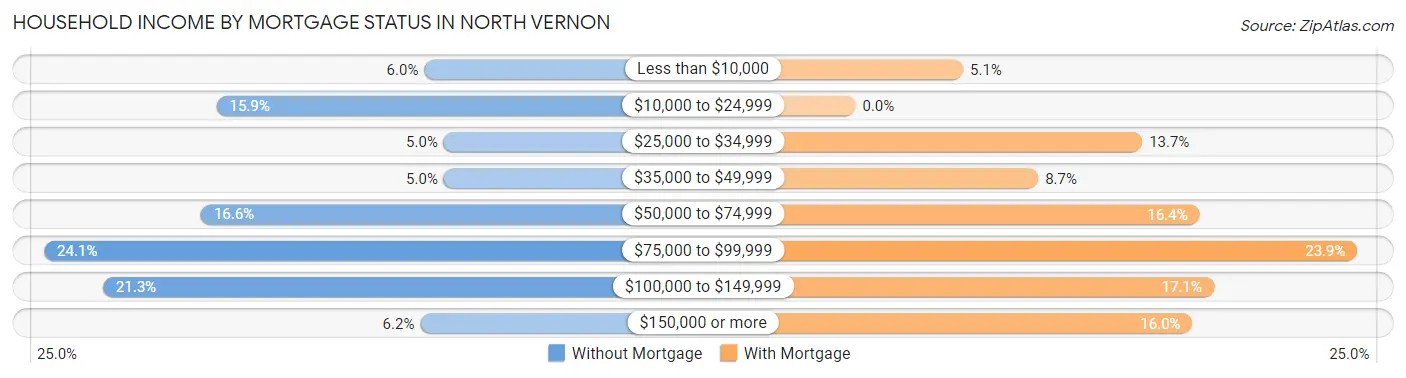
| Household Income | Without Mortgage | With Mortgage |
| Less than $10,000 | 32 (6.0%) | 60 (5.1%) |
| $10,000 to $24,999 | 85 (15.9%) | 0 (0.0%) |
| $25,000 to $34,999 | 27 (5.0%) | 160 (13.7%) |
| $35,000 to $49,999 | 27 (5.0%) | 102 (8.7%) |
| $50,000 to $74,999 | 89 (16.6%) | 192 (16.4%) |
| $75,000 to $99,999 | 129 (24.1%) | 280 (23.9%) |
| $100,000 to $149,999 | 114 (21.3%) | 200 (17.1%) |
| $150,000 or more | 33 (6.2%) | 188 (16.0%) |
| Total | 536 (100.0%) | 1,172 (100.0%) |
Property Value to Household Income Ratio in North Vernon
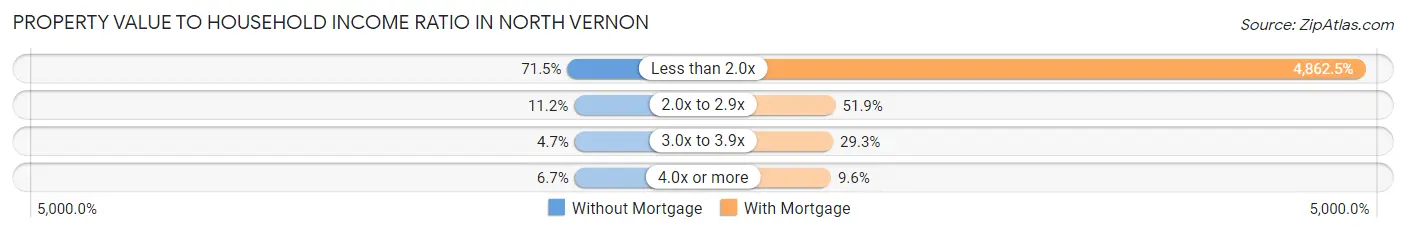
| Value-to-Income Ratio | Without Mortgage | With Mortgage |
| Less than 2.0x | 383 (71.5%) | 56,989 (4,862.5%) |
| 2.0x to 2.9x | 60 (11.2%) | 608 (51.9%) |
| 3.0x to 3.9x | 25 (4.7%) | 343 (29.3%) |
| 4.0x or more | 36 (6.7%) | 113 (9.6%) |
| Total | 536 (100.0%) | 1,172 (100.0%) |
Real Estate Taxes by Mortgage Status in North Vernon
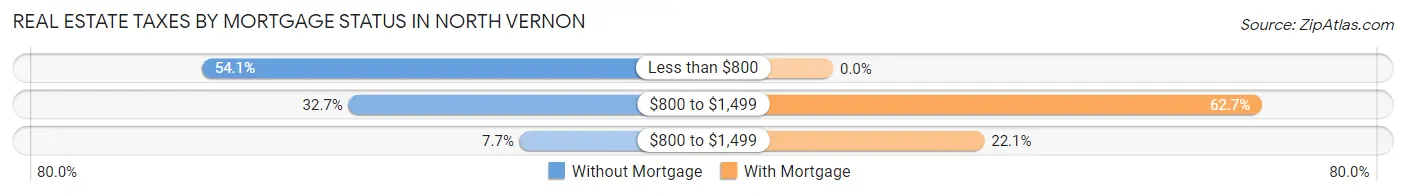
| Property Taxes | Without Mortgage | With Mortgage |
| Less than $800 | 290 (54.1%) | 0 (0.0%) |
| $800 to $1,499 | 175 (32.7%) | 735 (62.7%) |
| $800 to $1,499 | 41 (7.6%) | 259 (22.1%) |
| Total | 536 (100.0%) | 1,172 (100.0%) |
Health & Disability in North Vernon
Health Insurance Coverage by Age in North Vernon
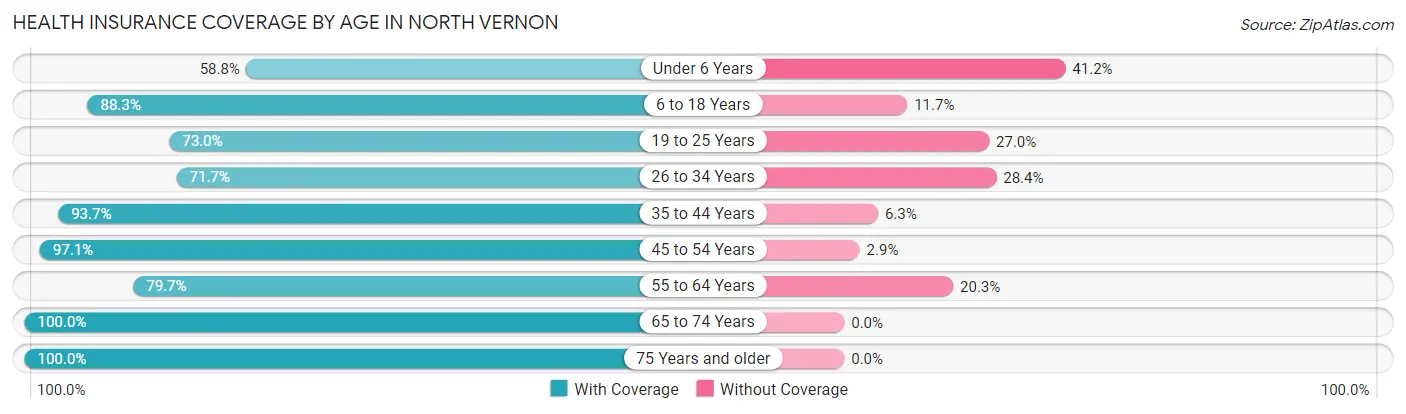
| Age Bracket | With Coverage | Without Coverage |
| Under 6 Years | 345 (58.8%) | 242 (41.2%) |
| 6 to 18 Years | 910 (88.3%) | 121 (11.7%) |
| 19 to 25 Years | 603 (73.0%) | 223 (27.0%) |
| 26 to 34 Years | 566 (71.7%) | 224 (28.3%) |
| 35 to 44 Years | 642 (93.7%) | 43 (6.3%) |
| 45 to 54 Years | 1,018 (97.1%) | 30 (2.9%) |
| 55 to 64 Years | 487 (79.7%) | 124 (20.3%) |
| 65 to 74 Years | 621 (100.0%) | 0 (0.0%) |
| 75 Years and older | 494 (100.0%) | 0 (0.0%) |
| Total | 5,686 (85.0%) | 1,007 (15.0%) |
Health Insurance Coverage by Citizenship Status in North Vernon
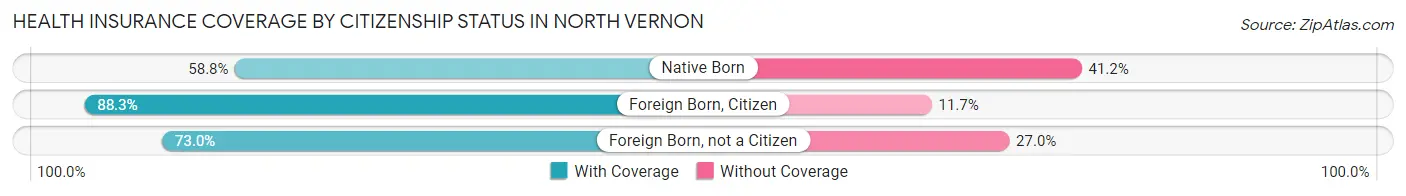
| Citizenship Status | With Coverage | Without Coverage |
| Native Born | 345 (58.8%) | 242 (41.2%) |
| Foreign Born, Citizen | 910 (88.3%) | 121 (11.7%) |
| Foreign Born, not a Citizen | 603 (73.0%) | 223 (27.0%) |
Health Insurance Coverage by Household Income in North Vernon
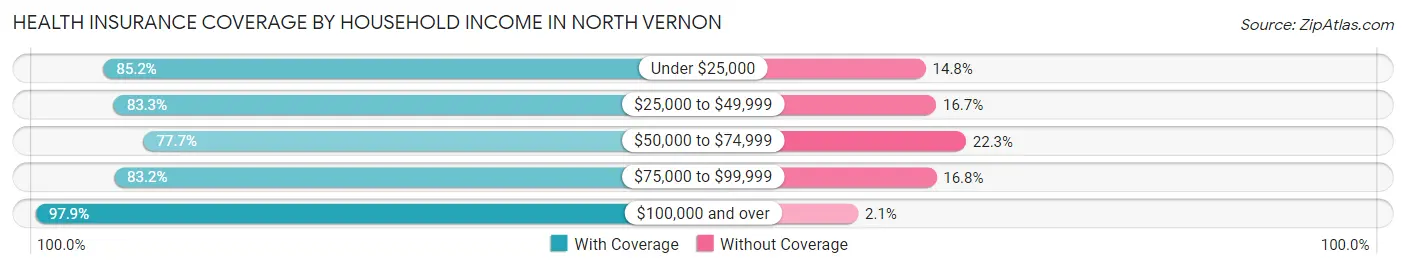
| Household Income | With Coverage | Without Coverage |
| Under $25,000 | 981 (85.2%) | 170 (14.8%) |
| $25,000 to $49,999 | 1,420 (83.3%) | 285 (16.7%) |
| $50,000 to $74,999 | 1,198 (77.7%) | 344 (22.3%) |
| $75,000 to $99,999 | 913 (83.2%) | 184 (16.8%) |
| $100,000 and over | 1,109 (97.9%) | 24 (2.1%) |
Public vs Private Health Insurance Coverage by Age in North Vernon
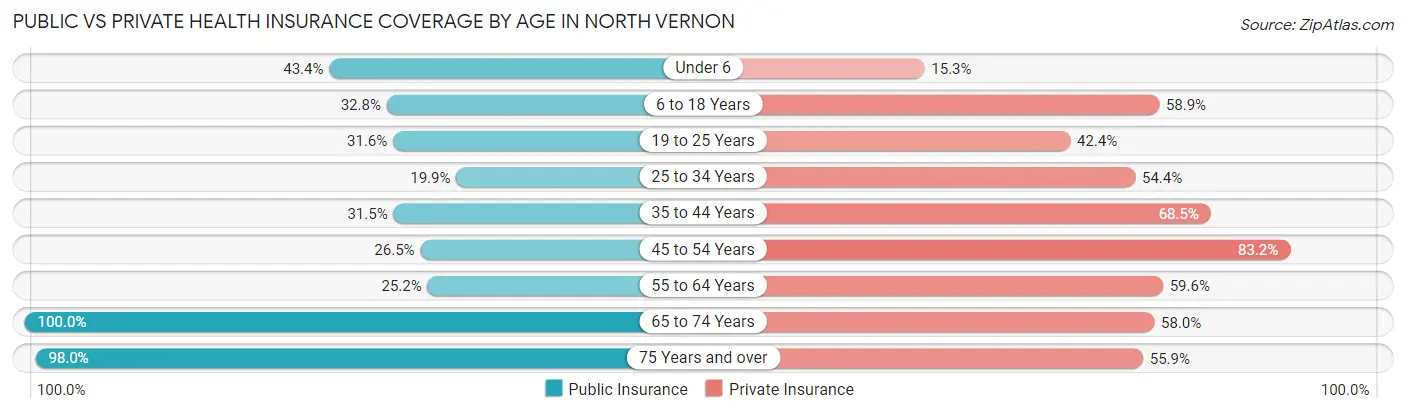
| Age Bracket | Public Insurance | Private Insurance |
| Under 6 | 255 (43.4%) | 90 (15.3%) |
| 6 to 18 Years | 338 (32.8%) | 607 (58.9%) |
| 19 to 25 Years | 261 (31.6%) | 350 (42.4%) |
| 25 to 34 Years | 157 (19.9%) | 430 (54.4%) |
| 35 to 44 Years | 216 (31.5%) | 469 (68.5%) |
| 45 to 54 Years | 278 (26.5%) | 872 (83.2%) |
| 55 to 64 Years | 154 (25.2%) | 364 (59.6%) |
| 65 to 74 Years | 621 (100.0%) | 360 (58.0%) |
| 75 Years and over | 484 (98.0%) | 276 (55.9%) |
| Total | 2,764 (41.3%) | 3,818 (57.0%) |
Disability Status by Sex by Age in North Vernon
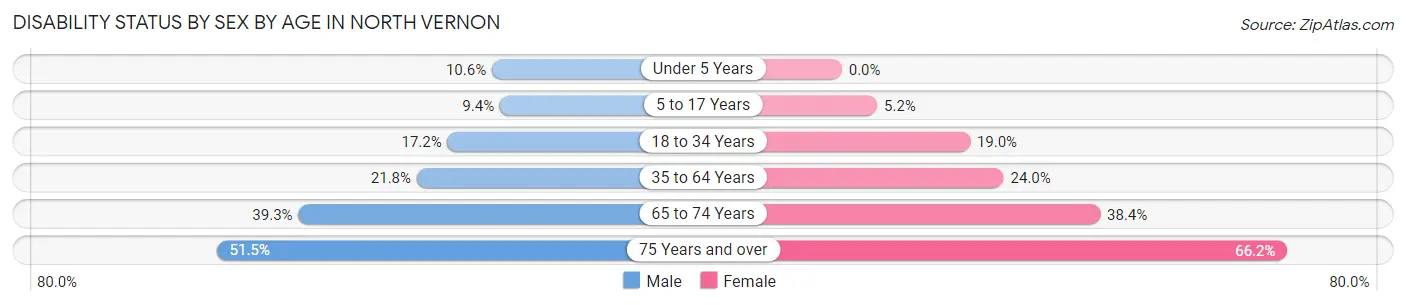
| Age Bracket | Male | Female |
| Under 5 Years | 30 (10.6%) | 0 (0.0%) |
| 5 to 17 Years | 59 (9.4%) | 27 (5.2%) |
| 18 to 34 Years | 160 (17.2%) | 138 (19.0%) |
| 35 to 64 Years | 279 (21.7%) | 255 (24.0%) |
| 65 to 74 Years | 72 (39.3%) | 168 (38.4%) |
| 75 Years and over | 122 (51.5%) | 170 (66.1%) |
Disability Class by Sex by Age in North Vernon
Disability Class: Hearing Difficulty
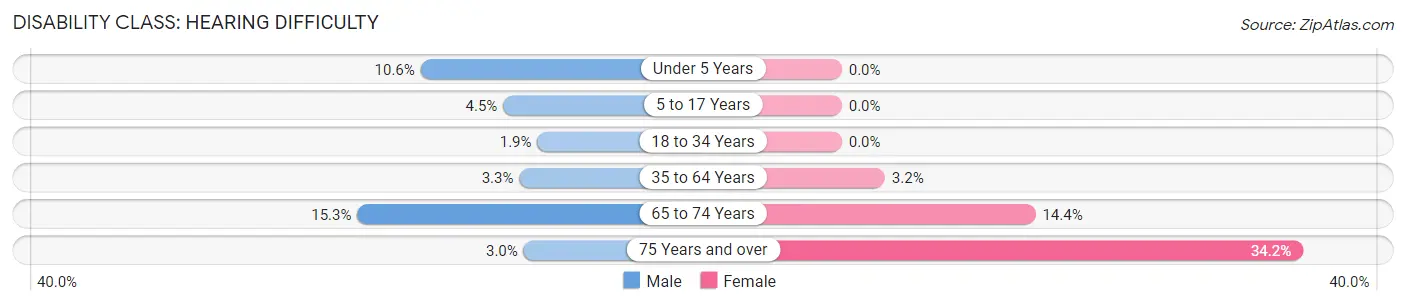
| Age Bracket | Male | Female |
| Under 5 Years | 30 (10.6%) | 0 (0.0%) |
| 5 to 17 Years | 28 (4.5%) | 0 (0.0%) |
| 18 to 34 Years | 18 (1.9%) | 0 (0.0%) |
| 35 to 64 Years | 42 (3.3%) | 34 (3.2%) |
| 65 to 74 Years | 28 (15.3%) | 63 (14.4%) |
| 75 Years and over | 7 (2.9%) | 88 (34.2%) |
Disability Class: Vision Difficulty
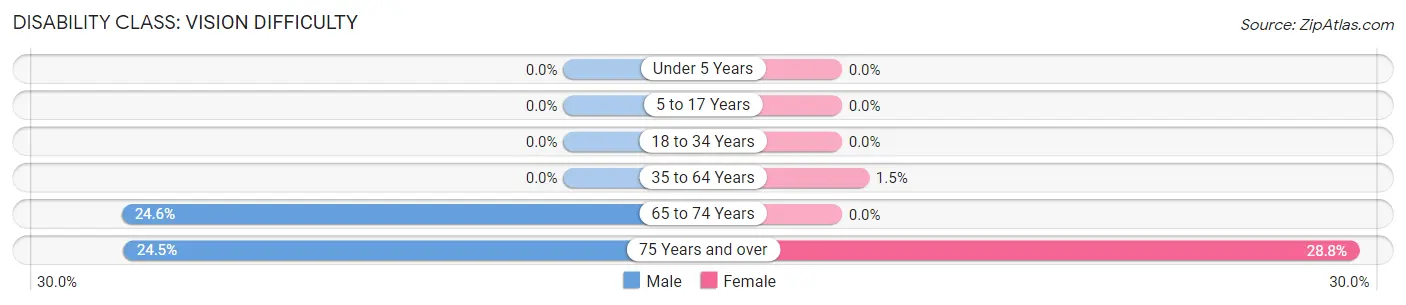
| Age Bracket | Male | Female |
| Under 5 Years | 0 (0.0%) | 0 (0.0%) |
| 5 to 17 Years | 0 (0.0%) | 0 (0.0%) |
| 18 to 34 Years | 0 (0.0%) | 0 (0.0%) |
| 35 to 64 Years | 0 (0.0%) | 16 (1.5%) |
| 65 to 74 Years | 45 (24.6%) | 0 (0.0%) |
| 75 Years and over | 58 (24.5%) | 74 (28.8%) |
Disability Class: Cognitive Difficulty
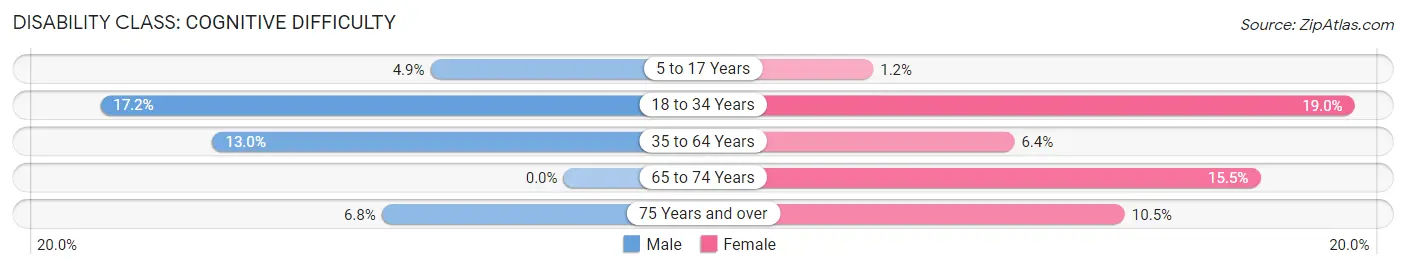
| Age Bracket | Male | Female |
| 5 to 17 Years | 31 (4.9%) | 6 (1.2%) |
| 18 to 34 Years | 160 (17.2%) | 138 (19.0%) |
| 35 to 64 Years | 167 (13.0%) | 68 (6.4%) |
| 65 to 74 Years | 0 (0.0%) | 68 (15.5%) |
| 75 Years and over | 16 (6.8%) | 27 (10.5%) |
Disability Class: Ambulatory Difficulty
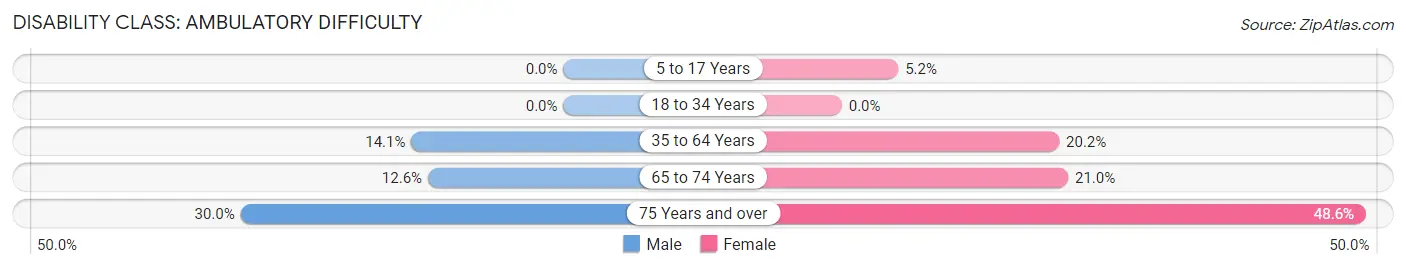
| Age Bracket | Male | Female |
| 5 to 17 Years | 0 (0.0%) | 27 (5.2%) |
| 18 to 34 Years | 0 (0.0%) | 0 (0.0%) |
| 35 to 64 Years | 181 (14.1%) | 214 (20.2%) |
| 65 to 74 Years | 23 (12.6%) | 92 (21.0%) |
| 75 Years and over | 71 (30.0%) | 125 (48.6%) |
Disability Class: Self-Care Difficulty
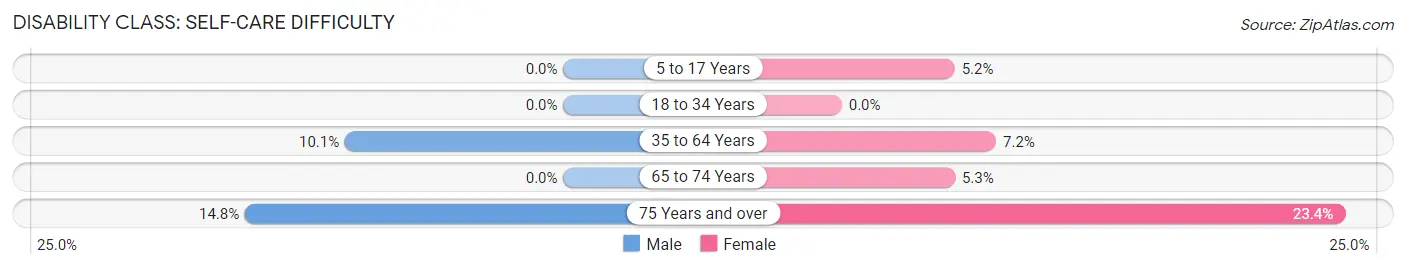
| Age Bracket | Male | Female |
| 5 to 17 Years | 0 (0.0%) | 27 (5.2%) |
| 18 to 34 Years | 0 (0.0%) | 0 (0.0%) |
| 35 to 64 Years | 130 (10.1%) | 76 (7.2%) |
| 65 to 74 Years | 0 (0.0%) | 23 (5.2%) |
| 75 Years and over | 35 (14.8%) | 60 (23.4%) |
Technology Access in North Vernon
Computing Device Access in North Vernon
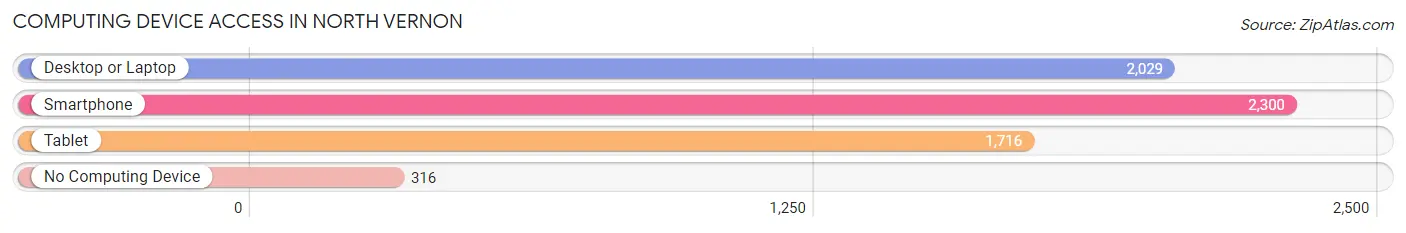
| Device Type | # Households | % Households |
| Desktop or Laptop | 2,029 | 69.0% |
| Smartphone | 2,300 | 78.3% |
| Tablet | 1,716 | 58.4% |
| No Computing Device | 316 | 10.7% |
| Total | 2,939 | 100.0% |
Internet Access in North Vernon
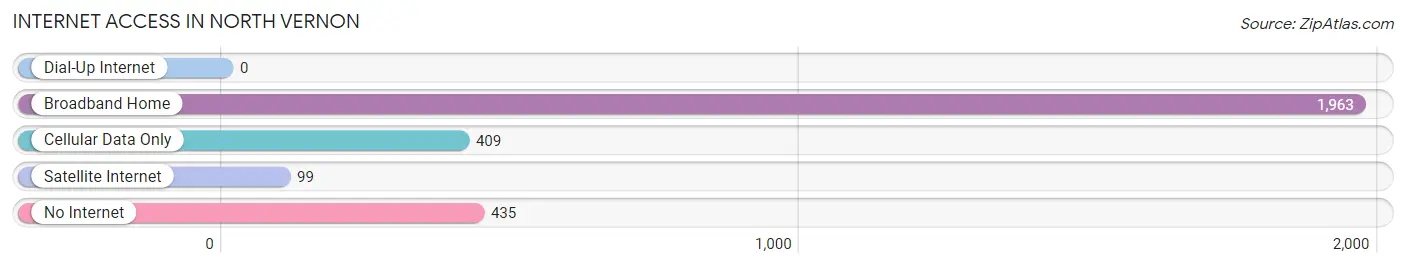
| Internet Type | # Households | % Households |
| Dial-Up Internet | 0 | 0.0% |
| Broadband Home | 1,963 | 66.8% |
| Cellular Data Only | 409 | 13.9% |
| Satellite Internet | 99 | 3.4% |
| No Internet | 435 | 14.8% |
| Total | 2,939 | 100.0% |
North Vernon Summary
History
North Vernon, Indiana is a small city located in Jennings County, Indiana. It is situated along the Muscatatuck River, approximately 50 miles south of Indianapolis. The city was founded in 1837 and was originally known as Vernon. The name was changed to North Vernon in 1853 to distinguish it from another town in the state with the same name.
The city was an important stop on the Ohio and Mississippi Railroad, which was built in 1853. This railroad connected North Vernon to Cincinnati, Ohio and St. Louis, Missouri. The railroad was a major factor in the growth of the city, as it allowed for the transportation of goods and people.
The city was also an important stop on the Underground Railroad, which was used by African Americans escaping slavery in the South. North Vernon was a safe haven for many of these individuals, and the city was home to several prominent abolitionists.
Geography
North Vernon is located in the southeastern part of Jennings County, Indiana. It is situated along the Muscatatuck River, approximately 50 miles south of Indianapolis. The city has a total area of 4.2 square miles, all of which is land.
The city has a humid continental climate, with hot summers and cold winters. The average temperature in the summer is around 75 degrees Fahrenheit, and the average temperature in the winter is around 30 degrees Fahrenheit.
Economy
North Vernon’s economy is largely based on manufacturing and agriculture. The city is home to several manufacturing companies, including a plastics plant, a metal fabrication plant, and a food processing plant.
Agriculture is also an important part of the city’s economy. The city is home to several farms, which produce corn, soybeans, wheat, and other crops.
Demographics
As of the 2010 census, the population of North Vernon was 6,902. The city has a population density of 1,664 people per square mile. The median age of the population is 38.7 years, and the median household income is $37,945.
The racial makeup of the city is 87.3% White, 8.2% African American, 0.7% Native American, 0.4% Asian, 0.1% Pacific Islander, 1.2% from other races, and 2.1% from two or more races.
Conclusion
North Vernon, Indiana is a small city located in Jennings County, Indiana. It was founded in 1837 and was an important stop on the Ohio and Mississippi Railroad and the Underground Railroad. The city has a humid continental climate, and its economy is largely based on manufacturing and agriculture. As of the 2010 census, the population of North Vernon was 6,902. The city has a population density of 1,664 people per square mile, and the median age of the population is 38.7 years. The racial makeup of the city is 87.3% White, 8.2% African American, 0.7% Native American, 0.4% Asian, 0.1% Pacific Islander, 1.2% from other races, and 2.1% from two or more races.
Common Questions
What is Per Capita Income in North Vernon?
Per Capita income in North Vernon is $28,440.
What is the Median Family Income in North Vernon?
Median Family Income in North Vernon is $54,477.
What is the Median Household income in North Vernon?
Median Household Income in North Vernon is $46,889.
What is Income or Wage Gap in North Vernon?
Income or Wage Gap in North Vernon is 24.5%.
Women in North Vernon earn 75.5 cents for every dollar earned by a man.
What is Inequality or Gini Index in North Vernon?
Inequality or Gini Index in North Vernon is 0.46.
What is the Total Population of North Vernon?
Total Population of North Vernon is 6,935.
What is the Total Male Population of North Vernon?
Total Male Population of North Vernon is 3,692.
What is the Total Female Population of North Vernon?
Total Female Population of North Vernon is 3,243.
What is the Ratio of Males per 100 Females in North Vernon?
There are 113.85 Males per 100 Females in North Vernon.
What is the Ratio of Females per 100 Males in North Vernon?
There are 87.84 Females per 100 Males in North Vernon.
What is the Median Population Age in North Vernon?
Median Population Age in North Vernon is 37.5 Years.
What is the Average Family Size in North Vernon
Average Family Size in North Vernon is 2.7 People.
What is the Average Household Size in North Vernon
Average Household Size in North Vernon is 2.3 People.
How Large is the Labor Force in North Vernon?
There are 3,012 People in the Labor Forcein in North Vernon.
What is the Percentage of People in the Labor Force in North Vernon?
53.2% of People are in the Labor Force in North Vernon.
What is the Unemployment Rate in North Vernon?
Unemployment Rate in North Vernon is 5.9%.