St Bernice, IN Map & Demographics
St Bernice Map
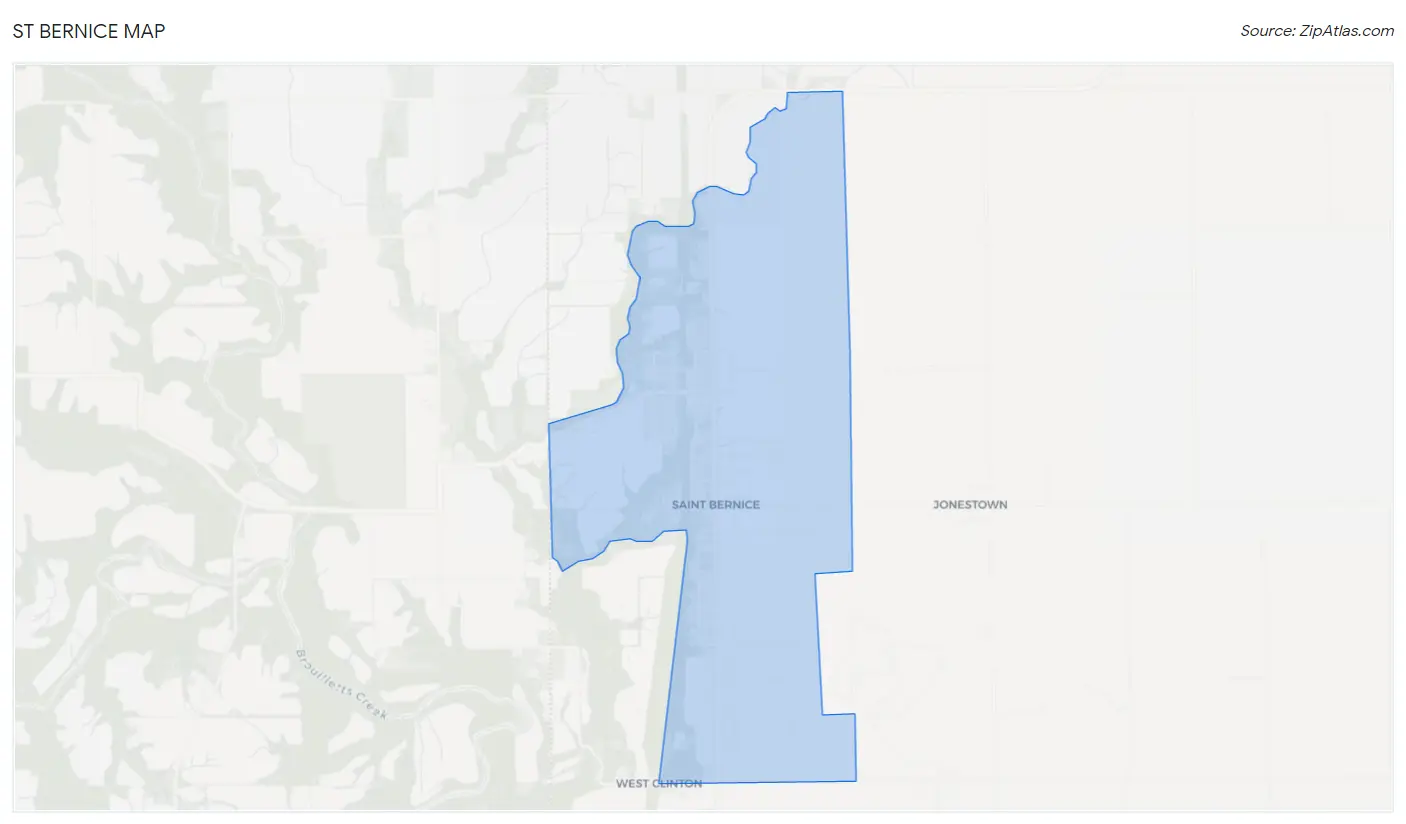
St Bernice Overview
$23,062
PER CAPITA INCOME
$70,521
AVG FAMILY INCOME
$70,208
AVG HOUSEHOLD INCOME
23.2%
WAGE / INCOME GAP [ % ]
76.8¢/ $1
WAGE / INCOME GAP [ $ ]
0.30
INEQUALITY / GINI INDEX
601
TOTAL POPULATION
379
MALE POPULATION
222
FEMALE POPULATION
170.72
MALES / 100 FEMALES
58.58
FEMALES / 100 MALES
43.3
MEDIAN AGE
3.0
AVG FAMILY SIZE
2.7
AVG HOUSEHOLD SIZE
187
LABOR FORCE [ PEOPLE ]
45.0%
PERCENT IN LABOR FORCE
Income in St Bernice
Income Overview in St Bernice
Per Capita Income in St Bernice is $23,062, while median incomes of families and households are $70,521 and $70,208 respectively.
| Characteristic | Number | Measure |
| Per Capita Income | 601 | $23,062 |
| Median Family Income | 187 | $70,521 |
| Mean Family Income | 187 | $70,457 |
| Median Household Income | 222 | $70,208 |
| Mean Household Income | 222 | $66,498 |
| Income Deficit | 187 | $0 |
| Wage / Income Gap (%) | 601 | 23.22% |
| Wage / Income Gap ($) | 601 | 76.78¢ per $1 |
| Gini / Inequality Index | 601 | 0.30 |
Earnings by Sex in St Bernice
Average Earnings in St Bernice are $41,321, $42,429 for men and $32,578 for women, a difference of 23.2%.
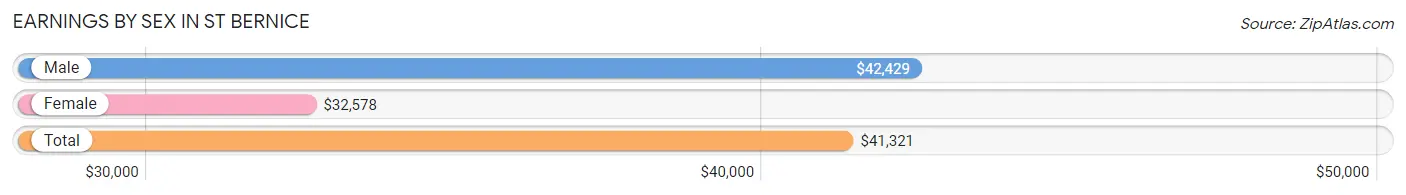
| Sex | Number | Average Earnings |
| Male | 150 (73.9%) | $42,429 |
| Female | 53 (26.1%) | $32,578 |
| Total | 203 (100.0%) | $41,321 |
Earnings by Sex by Income Bracket in St Bernice
The most common earnings brackets in St Bernice are $75,000 to $99,999 for men (38 | 25.3%) and $30,000 to $34,999 for women (16 | 30.2%).
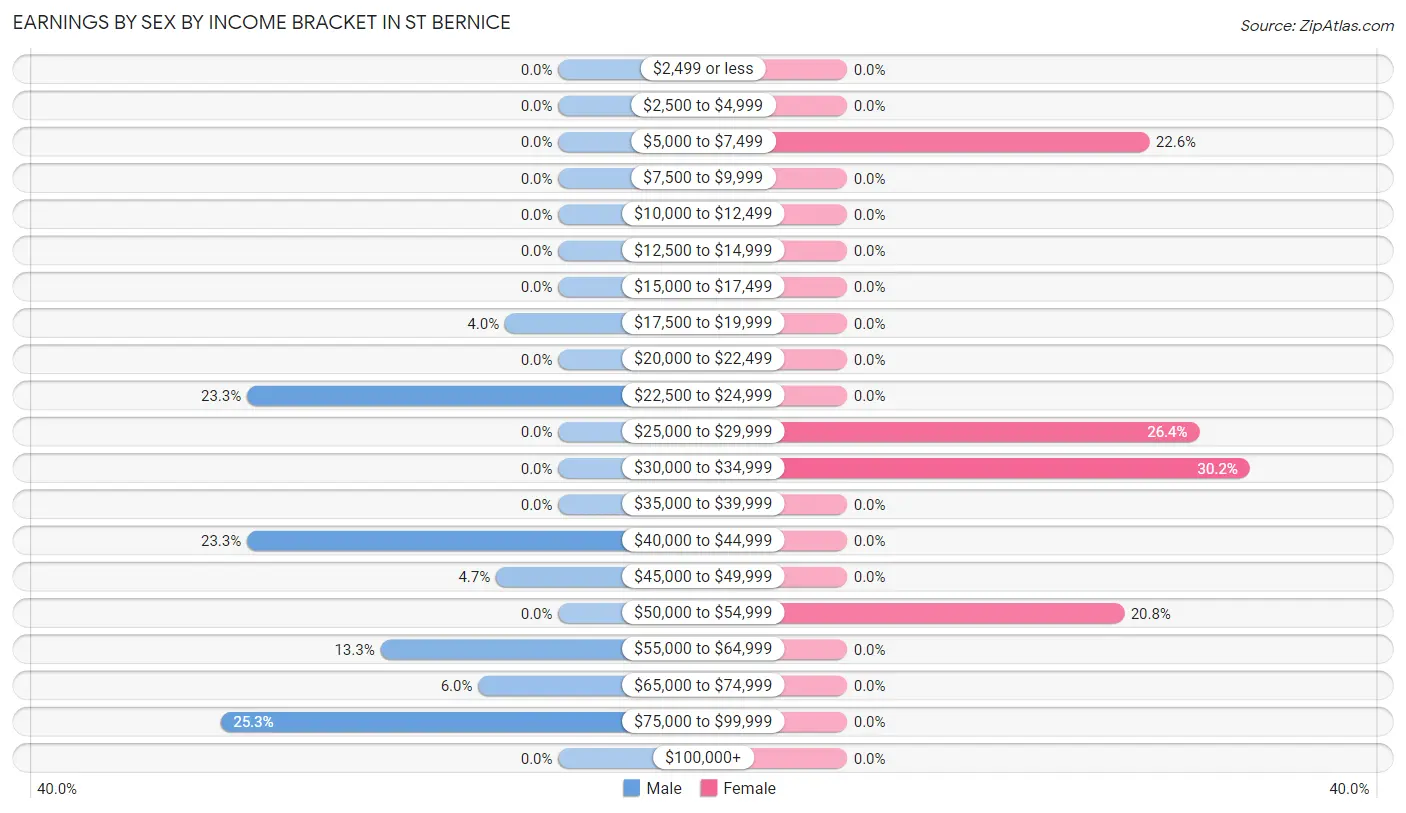
| Income | Male | Female |
| $2,499 or less | 0 (0.0%) | 0 (0.0%) |
| $2,500 to $4,999 | 0 (0.0%) | 0 (0.0%) |
| $5,000 to $7,499 | 0 (0.0%) | 12 (22.6%) |
| $7,500 to $9,999 | 0 (0.0%) | 0 (0.0%) |
| $10,000 to $12,499 | 0 (0.0%) | 0 (0.0%) |
| $12,500 to $14,999 | 0 (0.0%) | 0 (0.0%) |
| $15,000 to $17,499 | 0 (0.0%) | 0 (0.0%) |
| $17,500 to $19,999 | 6 (4.0%) | 0 (0.0%) |
| $20,000 to $22,499 | 0 (0.0%) | 0 (0.0%) |
| $22,500 to $24,999 | 35 (23.3%) | 0 (0.0%) |
| $25,000 to $29,999 | 0 (0.0%) | 14 (26.4%) |
| $30,000 to $34,999 | 0 (0.0%) | 16 (30.2%) |
| $35,000 to $39,999 | 0 (0.0%) | 0 (0.0%) |
| $40,000 to $44,999 | 35 (23.3%) | 0 (0.0%) |
| $45,000 to $49,999 | 7 (4.7%) | 0 (0.0%) |
| $50,000 to $54,999 | 0 (0.0%) | 11 (20.7%) |
| $55,000 to $64,999 | 20 (13.3%) | 0 (0.0%) |
| $65,000 to $74,999 | 9 (6.0%) | 0 (0.0%) |
| $75,000 to $99,999 | 38 (25.3%) | 0 (0.0%) |
| $100,000+ | 0 (0.0%) | 0 (0.0%) |
| Total | 150 (100.0%) | 53 (100.0%) |
Earnings by Sex by Educational Attainment in St Bernice
Average earnings in St Bernice are $42,429 for men and $33,203 for women, a difference of 21.7%. Men with an educational attainment of high school diploma enjoy the highest average annual earnings of $60,938, while those with college or associate's degree education earn the least with $46,786. Women with an educational attainment of high school diploma earn the most with the average annual earnings of $27,321, while those with high school diploma education have the smallest earnings of $27,321.
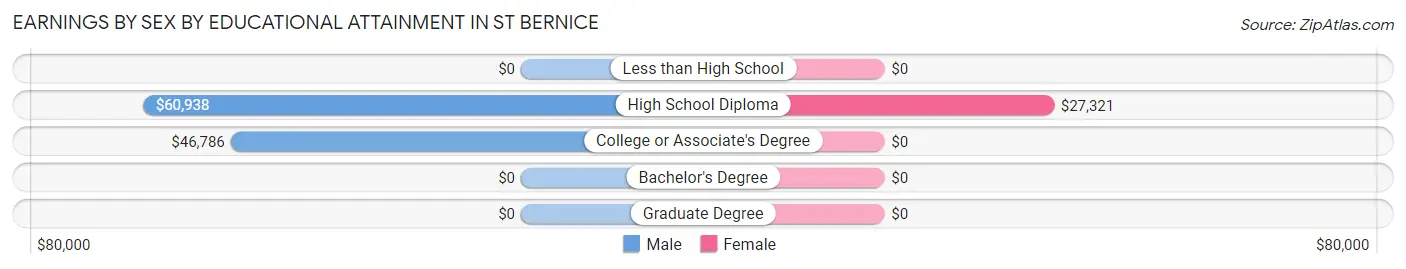
| Educational Attainment | Male Income | Female Income |
| Less than High School | - | - |
| High School Diploma | $60,938 | $27,321 |
| College or Associate's Degree | $46,786 | $0 |
| Bachelor's Degree | - | - |
| Graduate Degree | - | - |
| Total | $42,429 | $33,203 |
Family Income in St Bernice
Family Income Brackets in St Bernice
According to the St Bernice family income data, there are 80 families falling into the $100,000 to $149,999 income range, which is the most common income bracket and makes up 42.8% of all families.
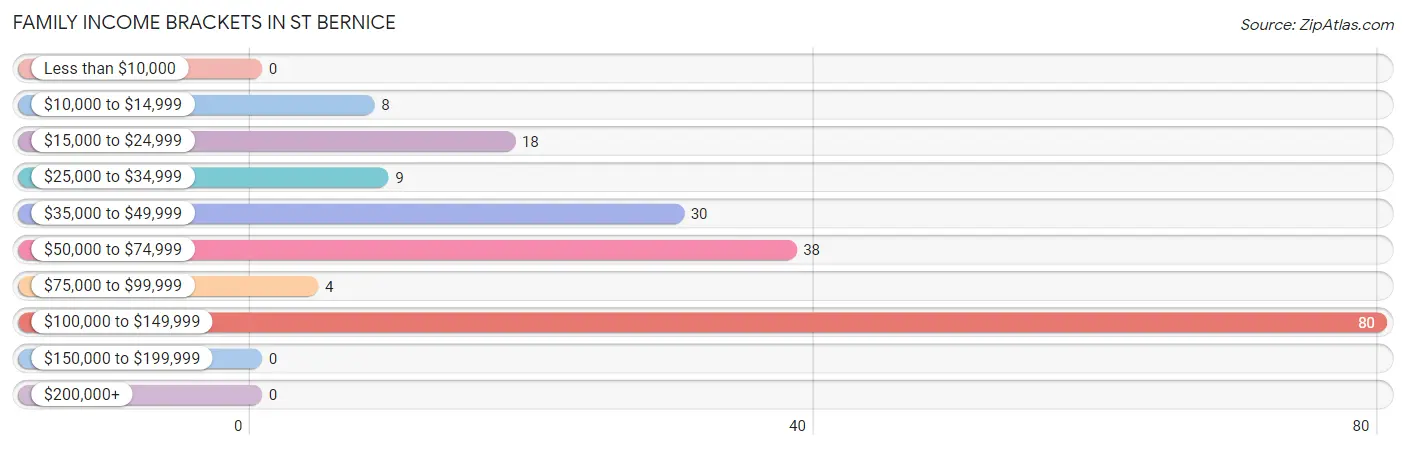
| Income Bracket | # Families | % Families |
| Less than $10,000 | 0 | 0.0% |
| $10,000 to $14,999 | 8 | 4.3% |
| $15,000 to $24,999 | 18 | 9.6% |
| $25,000 to $34,999 | 9 | 4.8% |
| $35,000 to $49,999 | 30 | 16.0% |
| $50,000 to $74,999 | 38 | 20.3% |
| $75,000 to $99,999 | 4 | 2.1% |
| $100,000 to $149,999 | 80 | 42.8% |
| $150,000 to $199,999 | 0 | 0.0% |
| $200,000+ | 0 | 0.0% |
Family Income by Famaliy Size in St Bernice
| Income Bracket | # Families | Median Income |
| 2-Person Families | 116 (62.0%) | $0 |
| 3-Person Families | 37 (19.8%) | $0 |
| 4-Person Families | 0 (0.0%) | $0 |
| 5-Person Families | 0 (0.0%) | $0 |
| 6-Person Families | 34 (18.2%) | $0 |
| 7+ Person Families | 0 (0.0%) | $0 |
| Total | 187 (100.0%) | $70,521 |
Family Income by Number of Earners in St Bernice
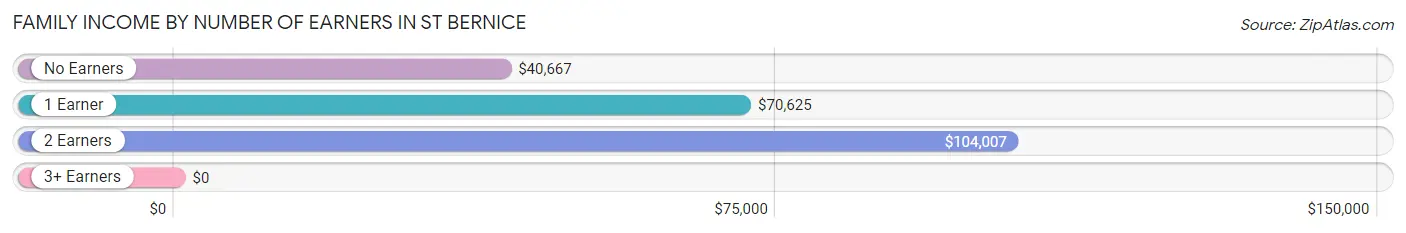
| Number of Earners | # Families | Median Income |
| No Earners | 50 (26.7%) | $40,667 |
| 1 Earner | 88 (47.1%) | $70,625 |
| 2 Earners | 49 (26.2%) | $104,007 |
| 3+ Earners | 0 (0.0%) | $0 |
| Total | 187 (100.0%) | $70,521 |
Household Income in St Bernice
Household Income Brackets in St Bernice
With 80 households falling in the category, the $100,000 to $149,999 income range is the most frequent in St Bernice, accounting for 36.0% of all households.
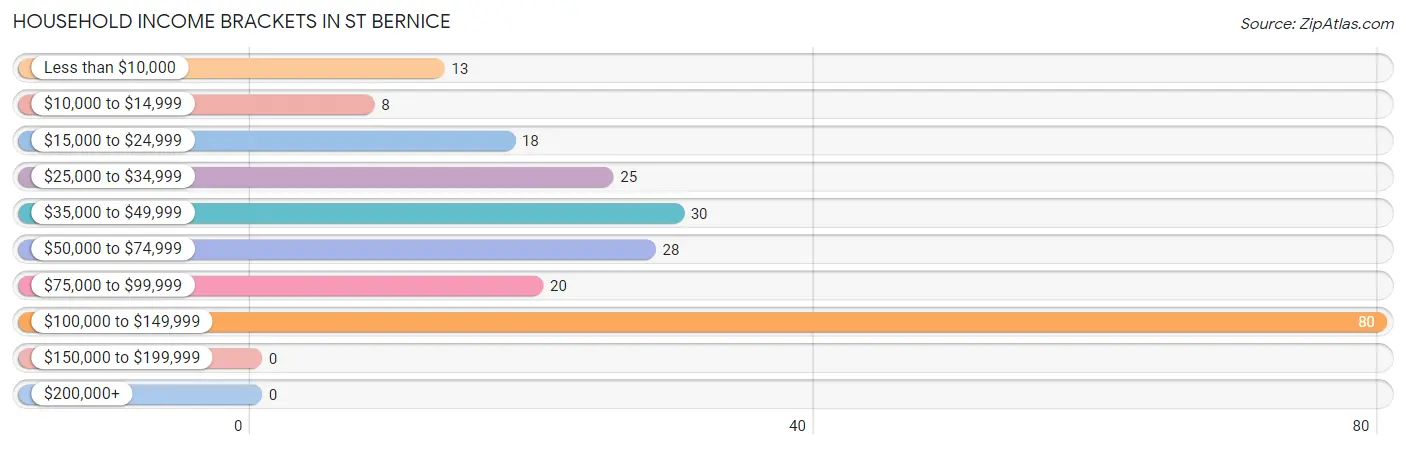
| Income Bracket | # Households | % Households |
| Less than $10,000 | 13 | 5.9% |
| $10,000 to $14,999 | 8 | 3.6% |
| $15,000 to $24,999 | 18 | 8.1% |
| $25,000 to $34,999 | 25 | 11.3% |
| $35,000 to $49,999 | 30 | 13.5% |
| $50,000 to $74,999 | 28 | 12.6% |
| $75,000 to $99,999 | 20 | 9.0% |
| $100,000 to $149,999 | 80 | 36.0% |
| $150,000 to $199,999 | 0 | 0.0% |
| $200,000+ | 0 | 0.0% |
Household Income by Householder Age in St Bernice
The median household income in St Bernice is $70,208, with the highest median household income of $103,125 found in the 25 to 44 years age bracket for the primary householder. A total of 73 households (32.9%) fall into this category.
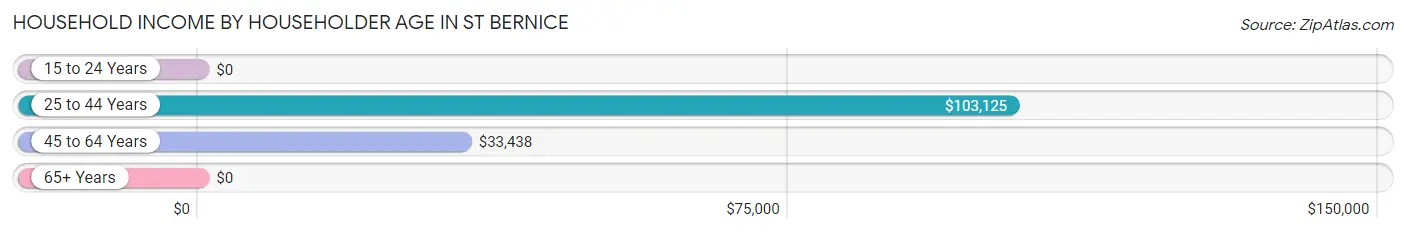
| Income Bracket | # Households | Median Income |
| 15 to 24 Years | 0 (0.0%) | $0 |
| 25 to 44 Years | 73 (32.9%) | $103,125 |
| 45 to 64 Years | 42 (18.9%) | $33,438 |
| 65+ Years | 107 (48.2%) | $0 |
| Total | 222 (100.0%) | $70,208 |
Poverty in St Bernice
Income Below Poverty by Sex and Age in St Bernice
With 2.1% poverty level for males and 9.0% for females among the residents of St Bernice, 65 to 74 year old males and 75 year old and over females are the most vulnerable to poverty, with 8 males (9.8%) and 13 females (22.0%) in their respective age groups living below the poverty level.
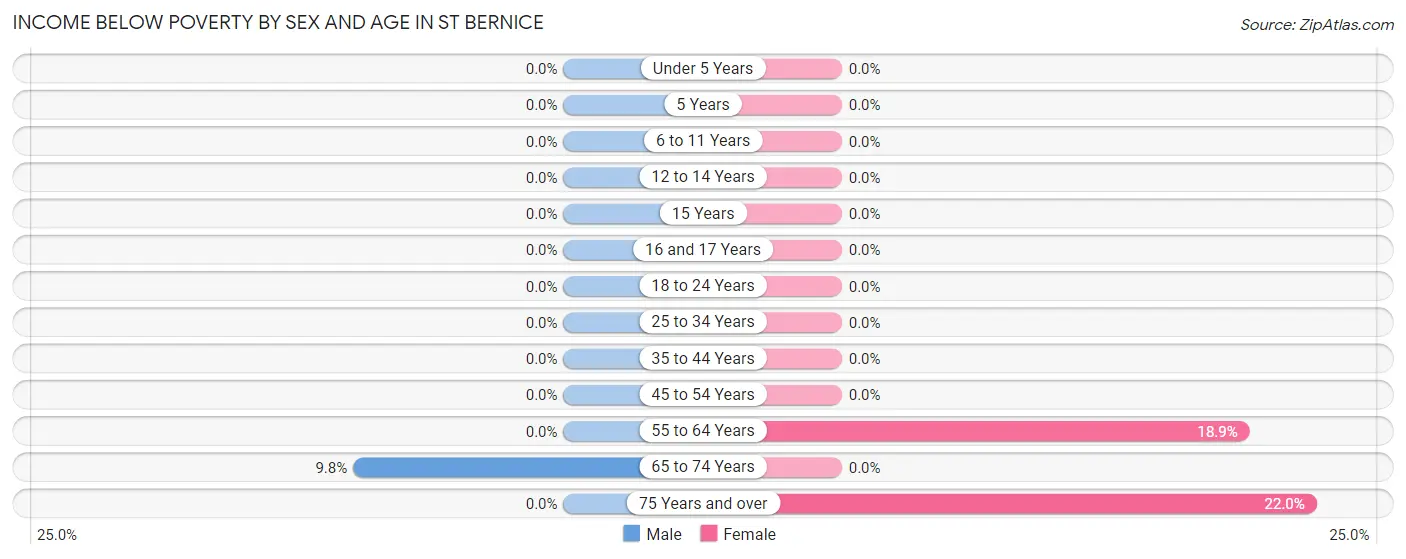
| Age Bracket | Male | Female |
| Under 5 Years | 0 (0.0%) | 0 (0.0%) |
| 5 Years | 0 (0.0%) | 0 (0.0%) |
| 6 to 11 Years | 0 (0.0%) | 0 (0.0%) |
| 12 to 14 Years | 0 (0.0%) | 0 (0.0%) |
| 15 Years | 0 (0.0%) | 0 (0.0%) |
| 16 and 17 Years | 0 (0.0%) | 0 (0.0%) |
| 18 to 24 Years | 0 (0.0%) | 0 (0.0%) |
| 25 to 34 Years | 0 (0.0%) | 0 (0.0%) |
| 35 to 44 Years | 0 (0.0%) | 0 (0.0%) |
| 45 to 54 Years | 0 (0.0%) | 0 (0.0%) |
| 55 to 64 Years | 0 (0.0%) | 7 (18.9%) |
| 65 to 74 Years | 8 (9.8%) | 0 (0.0%) |
| 75 Years and over | 0 (0.0%) | 13 (22.0%) |
| Total | 8 (2.1%) | 20 (9.0%) |
Income Above Poverty by Sex and Age in St Bernice
According to the poverty statistics in St Bernice, males aged 12 to 14 years and females aged under 5 years are the age groups that are most secure financially, with 100.0% of males and 100.0% of females in these age groups living above the poverty line.
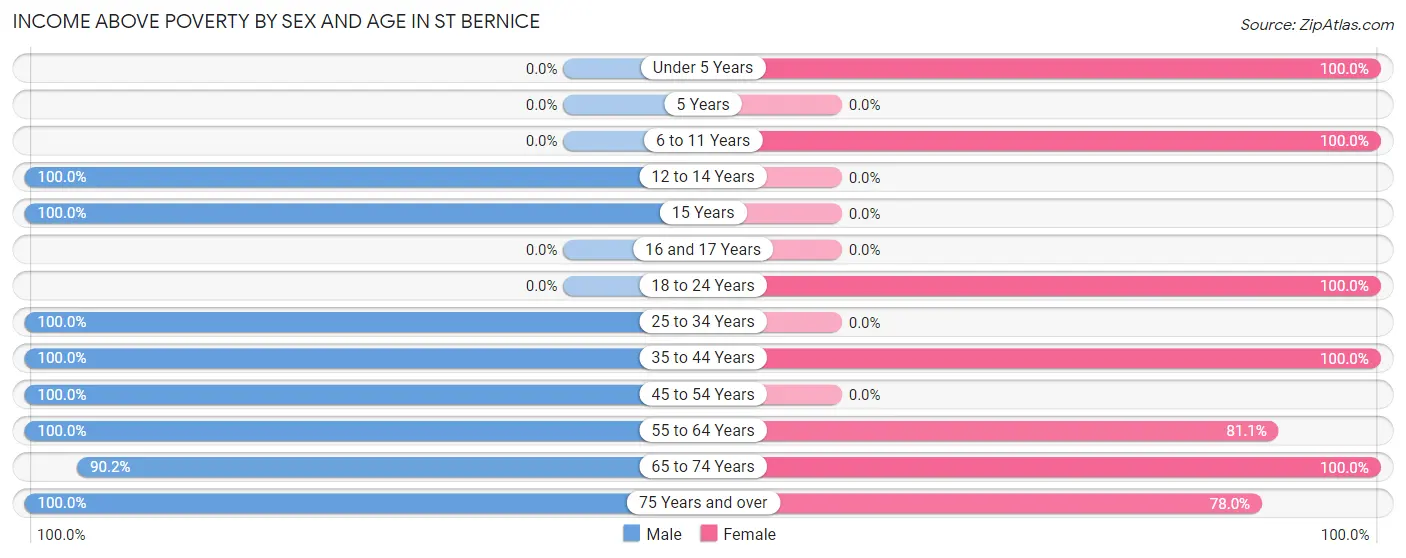
| Age Bracket | Male | Female |
| Under 5 Years | 0 (0.0%) | 11 (100.0%) |
| 5 Years | 0 (0.0%) | 0 (0.0%) |
| 6 to 11 Years | 0 (0.0%) | 41 (100.0%) |
| 12 to 14 Years | 93 (100.0%) | 0 (0.0%) |
| 15 Years | 40 (100.0%) | 0 (0.0%) |
| 16 and 17 Years | 0 (0.0%) | 0 (0.0%) |
| 18 to 24 Years | 0 (0.0%) | 8 (100.0%) |
| 25 to 34 Years | 35 (100.0%) | 0 (0.0%) |
| 35 to 44 Years | 66 (100.0%) | 59 (100.0%) |
| 45 to 54 Years | 32 (100.0%) | 0 (0.0%) |
| 55 to 64 Years | 26 (100.0%) | 30 (81.1%) |
| 65 to 74 Years | 74 (90.2%) | 7 (100.0%) |
| 75 Years and over | 5 (100.0%) | 46 (78.0%) |
| Total | 371 (97.9%) | 202 (91.0%) |
Income Below Poverty Among Married-Couple Families in St Bernice
The poverty statistics for married-couple families in St Bernice show that 8.3% or 8 of the total 97 families live below the poverty line. Families with no children have the highest poverty rate of 15.4%, comprising of 8 families. On the other hand, families with 1 or 2 children have the lowest poverty rate of 0.0%, which includes 0 families.
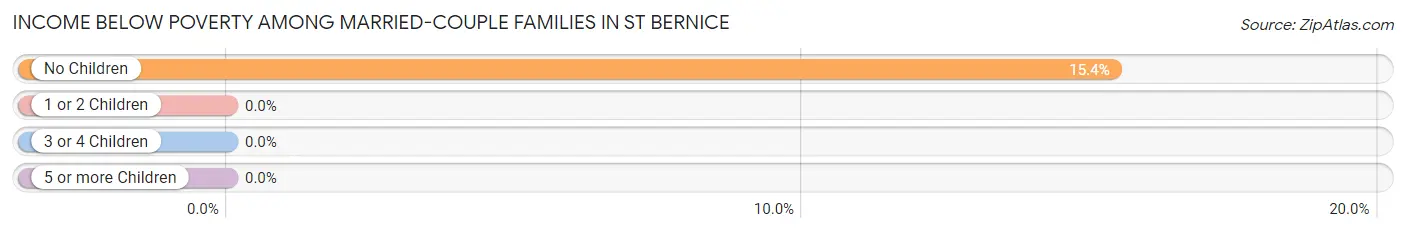
| Children | Above Poverty | Below Poverty |
| No Children | 44 (84.6%) | 8 (15.4%) |
| 1 or 2 Children | 11 (100.0%) | 0 (0.0%) |
| 3 or 4 Children | 34 (100.0%) | 0 (0.0%) |
| 5 or more Children | 0 (0.0%) | 0 (0.0%) |
| Total | 89 (91.7%) | 8 (8.3%) |
Income Below Poverty Among Single-Parent Households in St Bernice
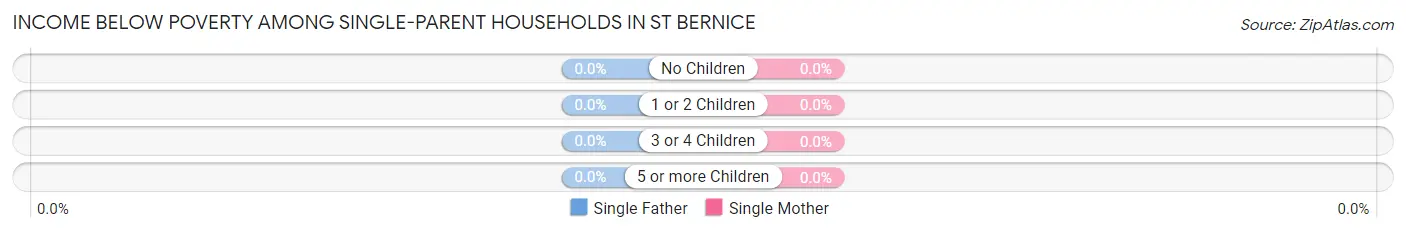
| Children | Single Father | Single Mother |
| No Children | 0 (0.0%) | 0 (0.0%) |
| 1 or 2 Children | 0 (0.0%) | 0 (0.0%) |
| 3 or 4 Children | 0 (0.0%) | 0 (0.0%) |
| 5 or more Children | 0 (0.0%) | 0 (0.0%) |
| Total | 0 (0.0%) | 0 (0.0%) |
Income Below Poverty Among Married-Couple vs Single-Parent Households in St Bernice
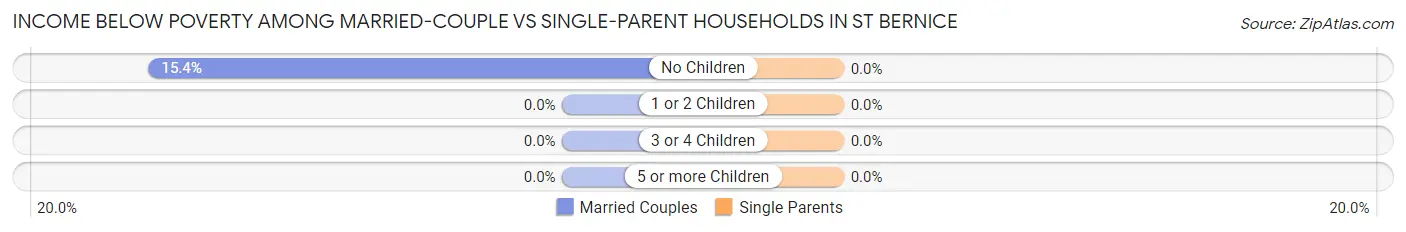
| Children | Married-Couple Families | Single-Parent Households |
| No Children | 8 (15.4%) | 0 (0.0%) |
| 1 or 2 Children | 0 (0.0%) | 0 (0.0%) |
| 3 or 4 Children | 0 (0.0%) | 0 (0.0%) |
| 5 or more Children | 0 (0.0%) | 0 (0.0%) |
| Total | 8 (8.3%) | 0 (0.0%) |
Race in St Bernice
The most populous races in St Bernice are White / Caucasian (590 | 98.2%), and Two or more Races (11 | 1.8%).
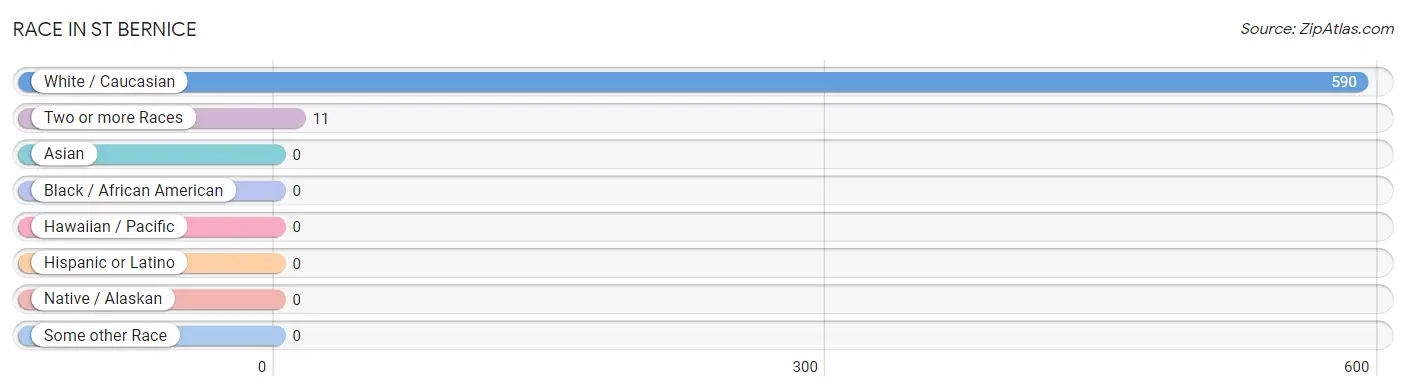
| Race | # Population | % Population |
| Asian | 0 | 0.0% |
| Black / African American | 0 | 0.0% |
| Hawaiian / Pacific | 0 | 0.0% |
| Hispanic or Latino | 0 | 0.0% |
| Native / Alaskan | 0 | 0.0% |
| White / Caucasian | 590 | 98.2% |
| Two or more Races | 11 | 1.8% |
| Some other Race | 0 | 0.0% |
| Total | 601 | 100.0% |
Ancestry in St Bernice
The most populous ancestries reported in St Bernice are American (44 | 7.3%), British (34 | 5.7%), European (30 | 5.0%), English (25 | 4.2%), and Scottish (14 | 2.3%), together accounting for 24.5% of all St Bernice residents.
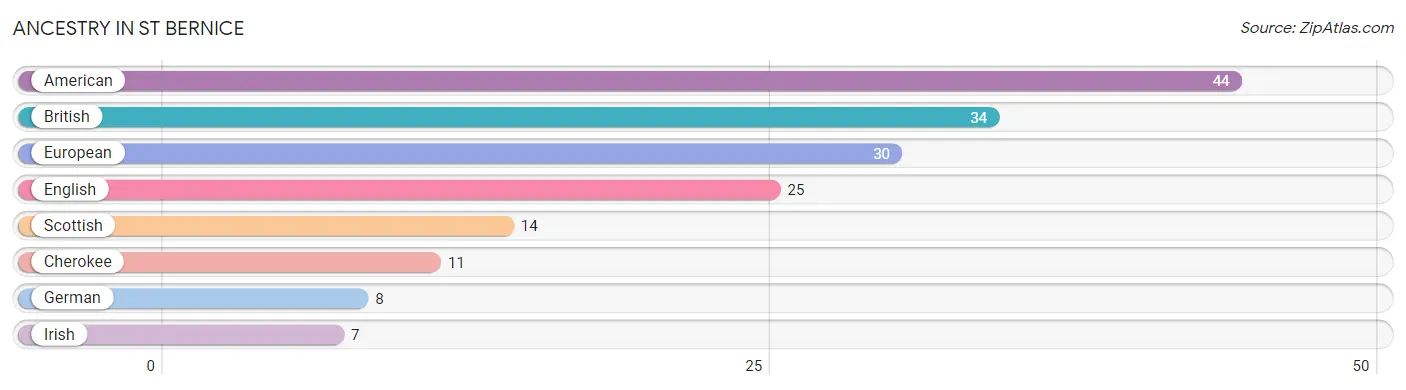
| Ancestry | # Population | % Population |
| American | 44 | 7.3% |
| British | 34 | 5.7% |
| Cherokee | 11 | 1.8% |
| English | 25 | 4.2% |
| European | 30 | 5.0% |
| German | 8 | 1.3% |
| Irish | 7 | 1.2% |
| Scottish | 14 | 2.3% | View All 8 Rows |
Immigrants in St Bernice

| Immigration Origin | # Population | % Population | View All 0 Rows |
Sex and Age in St Bernice
Sex and Age in St Bernice
The most populous age groups in St Bernice are 10 to 14 Years (93 | 24.5%) for men and 40 to 44 Years (45 | 20.3%) for women.
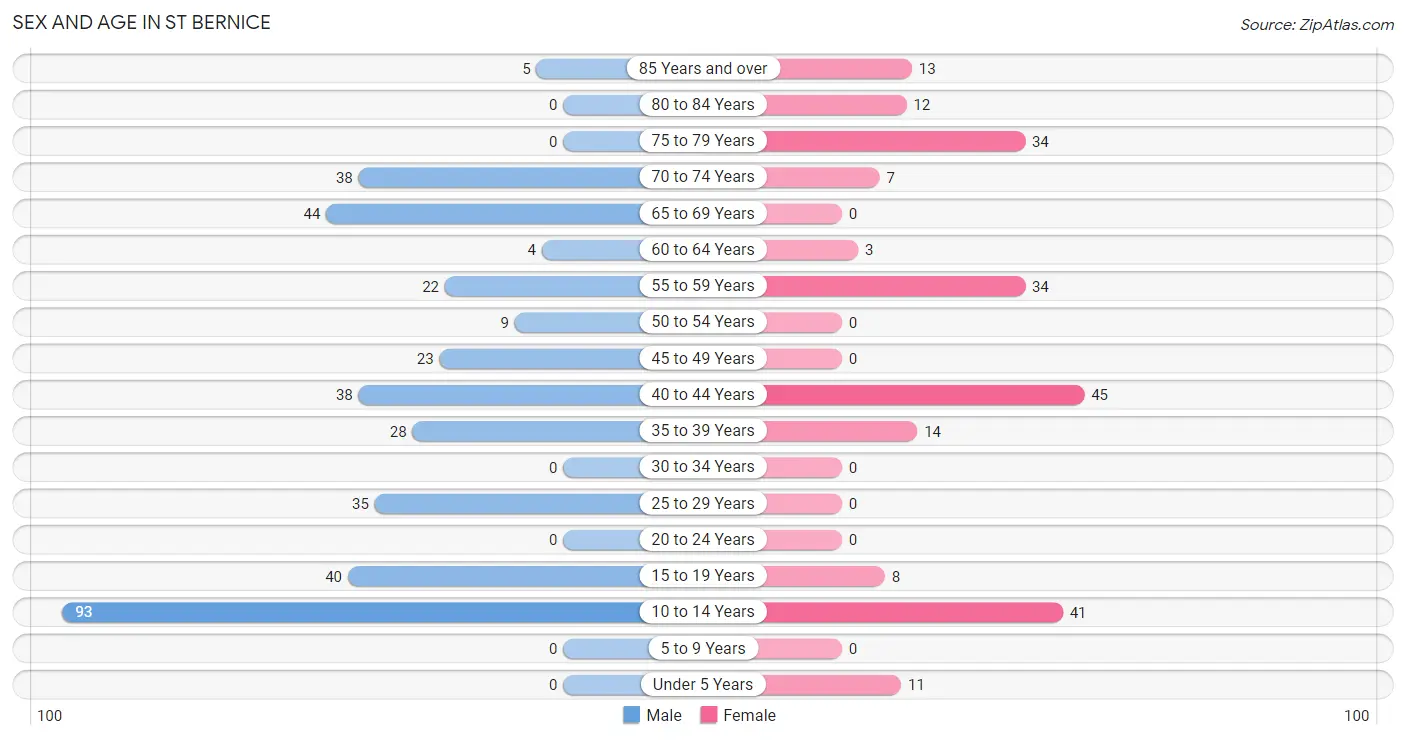
| Age Bracket | Male | Female |
| Under 5 Years | 0 (0.0%) | 11 (5.0%) |
| 5 to 9 Years | 0 (0.0%) | 0 (0.0%) |
| 10 to 14 Years | 93 (24.5%) | 41 (18.5%) |
| 15 to 19 Years | 40 (10.5%) | 8 (3.6%) |
| 20 to 24 Years | 0 (0.0%) | 0 (0.0%) |
| 25 to 29 Years | 35 (9.2%) | 0 (0.0%) |
| 30 to 34 Years | 0 (0.0%) | 0 (0.0%) |
| 35 to 39 Years | 28 (7.4%) | 14 (6.3%) |
| 40 to 44 Years | 38 (10.0%) | 45 (20.3%) |
| 45 to 49 Years | 23 (6.1%) | 0 (0.0%) |
| 50 to 54 Years | 9 (2.4%) | 0 (0.0%) |
| 55 to 59 Years | 22 (5.8%) | 34 (15.3%) |
| 60 to 64 Years | 4 (1.1%) | 3 (1.3%) |
| 65 to 69 Years | 44 (11.6%) | 0 (0.0%) |
| 70 to 74 Years | 38 (10.0%) | 7 (3.2%) |
| 75 to 79 Years | 0 (0.0%) | 34 (15.3%) |
| 80 to 84 Years | 0 (0.0%) | 12 (5.4%) |
| 85 Years and over | 5 (1.3%) | 13 (5.9%) |
| Total | 379 (100.0%) | 222 (100.0%) |
Families and Households in St Bernice
Median Family Size in St Bernice
The median family size in St Bernice is 2.97 persons per family, with married-couple families (97 | 51.9%) accounting for the largest median family size of 3.99 persons per family. On the other hand, single female/mother families (12 | 6.4%) represent the smallest median family size with 1.33 persons per family.
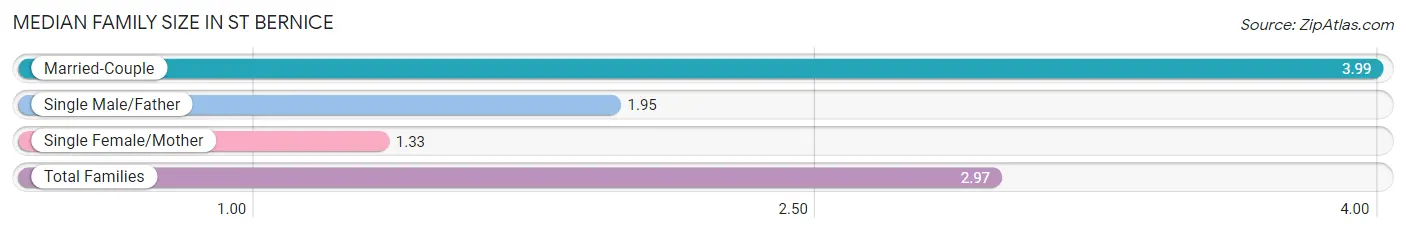
| Family Type | # Families | Family Size |
| Married-Couple | 97 (51.9%) | 3.99 |
| Single Male/Father | 78 (41.7%) | 1.95 |
| Single Female/Mother | 12 (6.4%) | 1.33 |
| Total Families | 187 (100.0%) | 2.97 |
Median Household Size in St Bernice
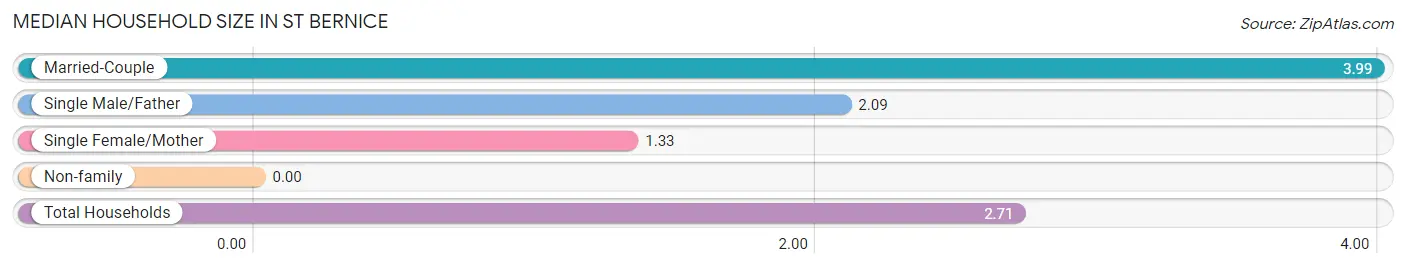
| Household Type | # Households | Household Size |
| Married-Couple | 97 (43.7%) | 3.99 |
| Single Male/Father | 78 (35.1%) | 2.09 |
| Single Female/Mother | 12 (5.4%) | 1.33 |
| Non-family | 35 (15.8%) | - |
| Total Households | 222 (100.0%) | 2.71 |
Household Size by Marriage Status in St Bernice
Out of a total of 222 households in St Bernice, 187 (84.2%) are family households, while 35 (15.8%) are nonfamily households. The most numerous type of family households are 2-person households, comprising 116, and the most common type of nonfamily households are 1-person households, comprising 35.
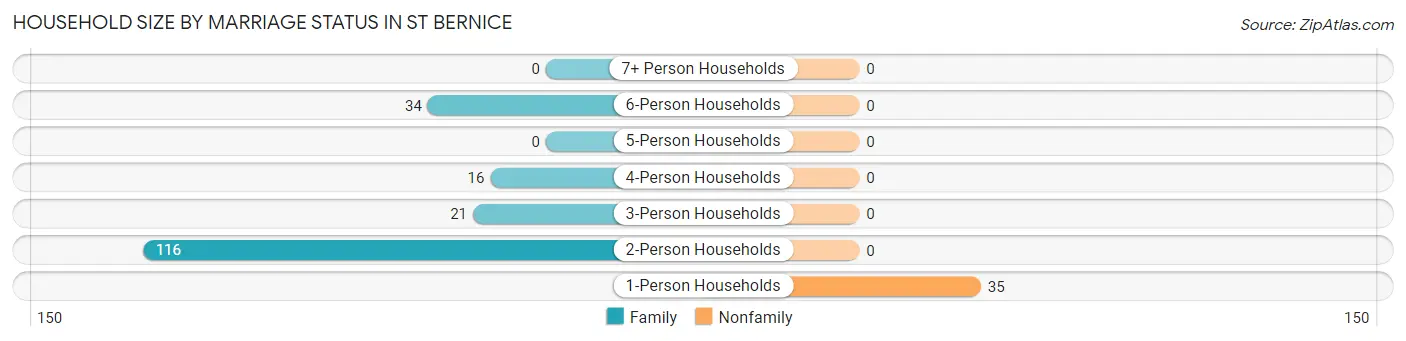
| Household Size | Family Households | Nonfamily Households |
| 1-Person Households | - | 35 (15.8%) |
| 2-Person Households | 116 (52.2%) | 0 (0.0%) |
| 3-Person Households | 21 (9.5%) | 0 (0.0%) |
| 4-Person Households | 16 (7.2%) | 0 (0.0%) |
| 5-Person Households | 0 (0.0%) | 0 (0.0%) |
| 6-Person Households | 34 (15.3%) | 0 (0.0%) |
| 7+ Person Households | 0 (0.0%) | 0 (0.0%) |
| Total | 187 (84.2%) | 35 (15.8%) |
Female Fertility in St Bernice
Fertility by Age in St Bernice
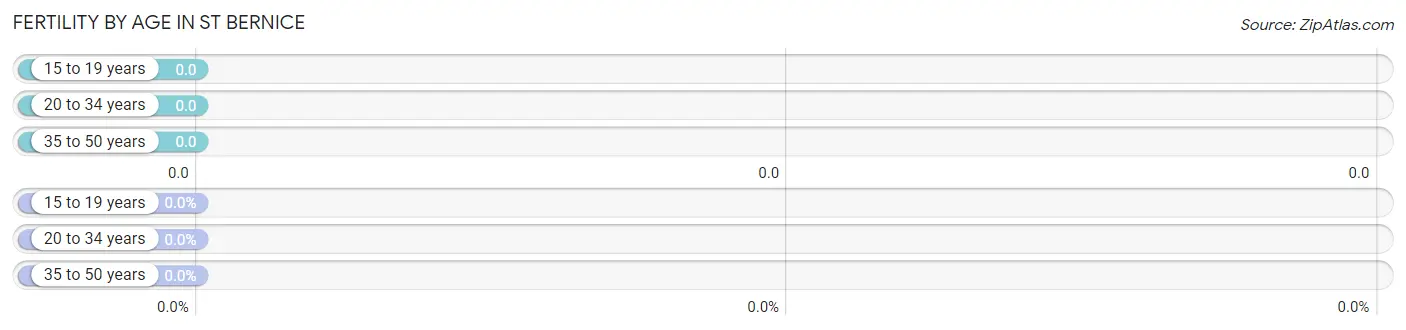
| Age Bracket | Women with Births | Births / 1,000 Women |
| 15 to 19 years | 0 (0.0%) | 0.0 |
| 20 to 34 years | 0 (0.0%) | 0.0 |
| 35 to 50 years | 0 (0.0%) | 0.0 |
| Total | 0 (0.0%) | 0.0 |
Fertility by Age by Marriage Status in St Bernice
| Age Bracket | Married | Unmarried |
| 15 to 19 years | 0 (0.0%) | 0 (0.0%) |
| 20 to 34 years | 0 (0.0%) | 0 (0.0%) |
| 35 to 50 years | 0 (0.0%) | 0 (0.0%) |
| Total | 0 (0.0%) | 0 (0.0%) |
Fertility by Education in St Bernice
| Educational Attainment | Women with Births | Births / 1,000 Women |
| Less than High School | 0 (0.0%) | 0.0 |
| High School Diploma | 0 (0.0%) | 0.0 |
| College or Associate's Degree | 0 (0.0%) | 0.0 |
| Bachelor's Degree | 0 (0.0%) | 0.0 |
| Graduate Degree | 0 (0.0%) | 0.0 |
| Total | 0 (0.0%) | 0.0 |
Fertility by Education by Marriage Status in St Bernice
| Educational Attainment | Married | Unmarried |
| Less than High School | 0 (0.0%) | 0 (0.0%) |
| High School Diploma | 0 (0.0%) | 0 (0.0%) |
| College or Associate's Degree | 0 (0.0%) | 0 (0.0%) |
| Bachelor's Degree | 0 (0.0%) | 0 (0.0%) |
| Graduate Degree | 0 (0.0%) | 0 (0.0%) |
| Total | 0 (0.0%) | 0 (0.0%) |
Employment Characteristics in St Bernice
Employment by Class of Employer in St Bernice
Among the 152 employed individuals in St Bernice, private company employees (136 | 89.5%), and self-employed (not incorporated) (16 | 10.5%) make up the most common classes of employment.
| Employer Class | # Employees | % Employees |
| Private Company Employees | 136 | 89.5% |
| Self-Employed (Incorporated) | 0 | 0.0% |
| Self-Employed (Not Incorporated) | 16 | 10.5% |
| Not-for-profit Organizations | 0 | 0.0% |
| Local Government Employees | 0 | 0.0% |
| State Government Employees | 0 | 0.0% |
| Federal Government Employees | 0 | 0.0% |
| Unpaid Family Workers | 0 | 0.0% |
| Total | 152 | 100.0% |
Employment Status by Age in St Bernice
| Age Bracket | In Labor Force | Unemployed |
| 16 to 19 Years | 0 (0.0%) | 0 (0.0%) |
| 20 to 24 Years | 0 (0.0%) | 0 (0.0%) |
| 25 to 29 Years | 35 (100.0%) | 0 (0.0%) |
| 30 to 34 Years | 0 (0.0%) | 0 (0.0%) |
| 35 to 44 Years | 88 (70.4%) | 0 (0.0%) |
| 45 to 54 Years | 32 (100.0%) | 0 (0.0%) |
| 55 to 59 Years | 23 (41.1%) | 0 (0.0%) |
| 60 to 64 Years | 3 (42.9%) | 0 (0.0%) |
| 65 to 74 Years | 6 (6.7%) | 0 (0.0%) |
| 75 Years and over | 0 (0.0%) | 0 (0.0%) |
| Total | 187 (45.0%) | 0 (0.0%) |
Employment Status by Educational Attainment in St Bernice
| Educational Attainment | In Labor Force | Unemployed |
| Less than High School | 35 (42.7%) | 0 (0.0%) |
| High School Diploma | 107 (85.6%) | 0 (0.0%) |
| College / Associate Degree | 27 (100.0%) | 0 (0.0%) |
| Bachelor's Degree or higher | 12 (57.1%) | 0 (0.0%) |
| Total | 181 (71.0%) | 0 (0.0%) |
Employment Occupations by Sex in St Bernice
Management, Business, Science and Arts Occupations
The most common Management, Business, Science and Arts occupations in St Bernice are , and Health Diagnosing & Treating (11 | 5.9%).
Management, Business, Science and Arts Occupations by Sex
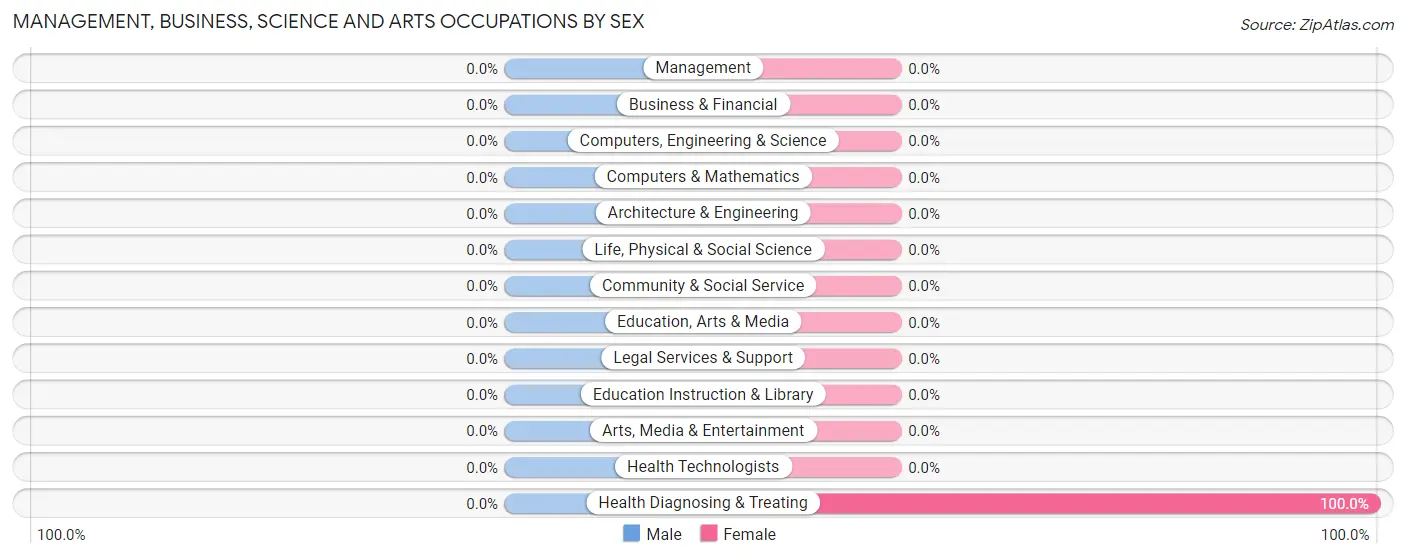
| Occupation | Male | Female |
| Management | 0 (0.0%) | 0 (0.0%) |
| Business & Financial | 0 (0.0%) | 0 (0.0%) |
| Computers, Engineering & Science | 0 (0.0%) | 0 (0.0%) |
| Computers & Mathematics | 0 (0.0%) | 0 (0.0%) |
| Architecture & Engineering | 0 (0.0%) | 0 (0.0%) |
| Life, Physical & Social Science | 0 (0.0%) | 0 (0.0%) |
| Community & Social Service | 0 (0.0%) | 0 (0.0%) |
| Education, Arts & Media | 0 (0.0%) | 0 (0.0%) |
| Legal Services & Support | 0 (0.0%) | 0 (0.0%) |
| Education Instruction & Library | 0 (0.0%) | 0 (0.0%) |
| Arts, Media & Entertainment | 0 (0.0%) | 0 (0.0%) |
| Health Diagnosing & Treating | 0 (0.0%) | 11 (100.0%) |
| Health Technologists | 0 (0.0%) | 0 (0.0%) |
| Total (Category) | 0 (0.0%) | 11 (100.0%) |
| Total (Overall) | 146 (78.1%) | 41 (21.9%) |
Services Occupations
The most common Services occupations in St Bernice are Cleaning & Maintenance (22 | 11.8%), and Healthcare Support (11 | 5.9%).
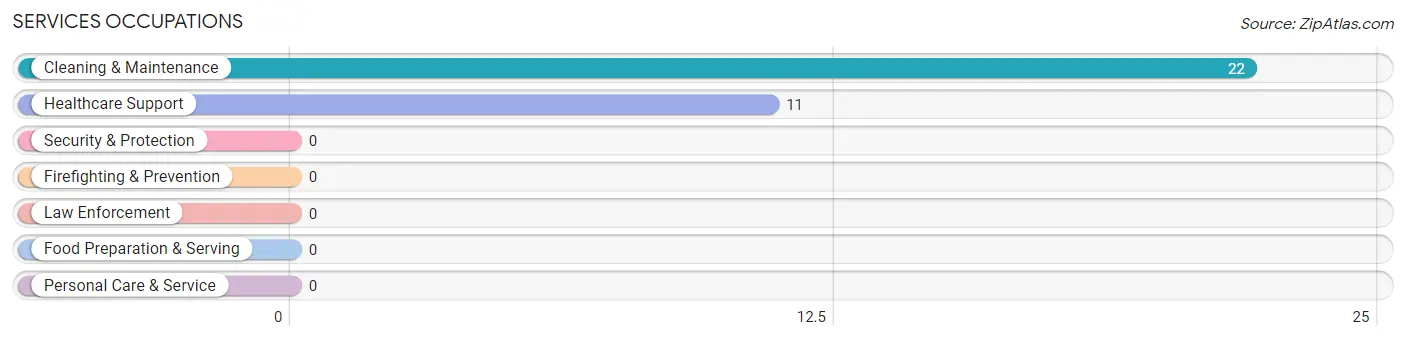
Services Occupations by Sex
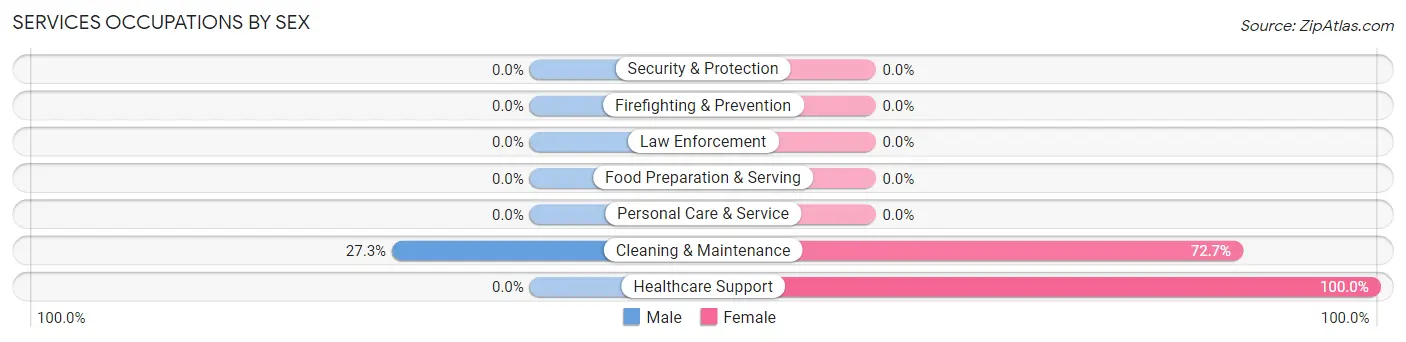
| Occupation | Male | Female |
| Healthcare Support | 0 (0.0%) | 11 (100.0%) |
| Security & Protection | 0 (0.0%) | 0 (0.0%) |
| Firefighting & Prevention | 0 (0.0%) | 0 (0.0%) |
| Law Enforcement | 0 (0.0%) | 0 (0.0%) |
| Food Preparation & Serving | 0 (0.0%) | 0 (0.0%) |
| Cleaning & Maintenance | 6 (27.3%) | 16 (72.7%) |
| Personal Care & Service | 0 (0.0%) | 0 (0.0%) |
| Total (Category) | 6 (18.2%) | 27 (81.8%) |
| Total (Overall) | 146 (78.1%) | 41 (21.9%) |
Sales and Office Occupations
The most common Sales and Office occupations in St Bernice are , and Sales & Related (19 | 10.2%).
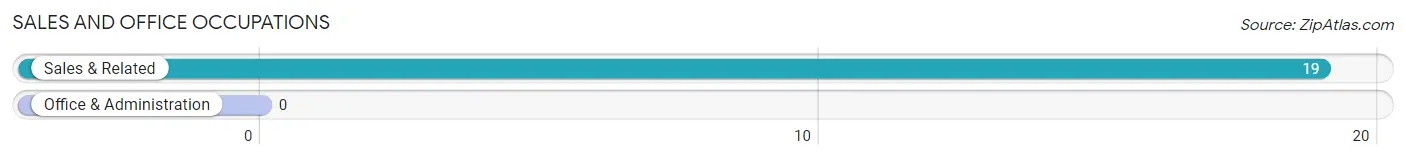
Sales and Office Occupations by Sex

| Occupation | Male | Female |
| Sales & Related | 16 (84.2%) | 3 (15.8%) |
| Office & Administration | 0 (0.0%) | 0 (0.0%) |
| Total (Category) | 16 (84.2%) | 3 (15.8%) |
| Total (Overall) | 146 (78.1%) | 41 (21.9%) |
Natural Resources, Construction and Maintenance Occupations
The most common Natural Resources, Construction and Maintenance occupations in St Bernice are , and Installation, Maintenance & Repair (7 | 3.7%).
Natural Resources, Construction and Maintenance Occupations by Sex
| Occupation | Male | Female |
| Farming, Fishing & Forestry | 0 (0.0%) | 0 (0.0%) |
| Construction & Extraction | 0 (0.0%) | 0 (0.0%) |
| Installation, Maintenance & Repair | 7 (100.0%) | 0 (0.0%) |
| Total (Category) | 7 (100.0%) | 0 (0.0%) |
| Total (Overall) | 146 (78.1%) | 41 (21.9%) |
Production, Transportation and Moving Occupations
The most common Production, Transportation and Moving occupations in St Bernice are Production (79 | 42.2%), and Transportation (38 | 20.3%).
Production, Transportation and Moving Occupations by Sex
| Occupation | Male | Female |
| Production | 79 (100.0%) | 0 (0.0%) |
| Transportation | 38 (100.0%) | 0 (0.0%) |
| Material Moving | 0 (0.0%) | 0 (0.0%) |
| Total (Category) | 117 (100.0%) | 0 (0.0%) |
| Total (Overall) | 146 (78.1%) | 41 (21.9%) |
Employment Industries by Sex in St Bernice
Employment Industries in St Bernice
The major employment industries in St Bernice include Manufacturing (86 | 46.0%), Transportation & Warehousing (38 | 20.3%), Health Care & Social Assistance (38 | 20.3%), and Retail Trade (3 | 1.6%).
Employment Industries by Sex in St Bernice
The St Bernice industries that see more men than women are Manufacturing (100.0%), and Transportation & Warehousing (100.0%), whereas the industries that tend to have a higher number of women are Retail Trade (100.0%), and Health Care & Social Assistance (100.0%).
| Industry | Male | Female |
| Agriculture, Fishing & Hunting | 0 (0.0%) | 0 (0.0%) |
| Mining, Quarrying, & Extraction | 0 (0.0%) | 0 (0.0%) |
| Construction | 0 (0.0%) | 0 (0.0%) |
| Manufacturing | 86 (100.0%) | 0 (0.0%) |
| Wholesale Trade | 0 (0.0%) | 0 (0.0%) |
| Retail Trade | 0 (0.0%) | 3 (100.0%) |
| Transportation & Warehousing | 38 (100.0%) | 0 (0.0%) |
| Utilities | 0 (0.0%) | 0 (0.0%) |
| Information | 0 (0.0%) | 0 (0.0%) |
| Finance & Insurance | 0 (0.0%) | 0 (0.0%) |
| Real Estate, Rental & Leasing | 0 (0.0%) | 0 (0.0%) |
| Professional & Scientific | 0 (0.0%) | 0 (0.0%) |
| Enterprise Management | 0 (0.0%) | 0 (0.0%) |
| Administrative & Support | 0 (0.0%) | 0 (0.0%) |
| Educational Services | 0 (0.0%) | 0 (0.0%) |
| Health Care & Social Assistance | 0 (0.0%) | 38 (100.0%) |
| Arts, Entertainment & Recreation | 0 (0.0%) | 0 (0.0%) |
| Accommodation & Food Services | 0 (0.0%) | 0 (0.0%) |
| Public Administration | 0 (0.0%) | 0 (0.0%) |
| Total | 146 (78.1%) | 41 (21.9%) |
Education in St Bernice
School Enrollment in St Bernice
The most common levels of schooling among the 152 students in St Bernice are high school (122 | 80.3%), college / undergraduate (19 | 12.5%), and middle school (11 | 7.2%).
| School Level | # Students | % Students |
| Nursery / Preschool | 0 | 0.0% |
| Kindergarten | 0 | 0.0% |
| Elementary School | 0 | 0.0% |
| Middle School | 11 | 7.2% |
| High School | 122 | 80.3% |
| College / Undergraduate | 19 | 12.5% |
| Graduate / Professional | 0 | 0.0% |
| Total | 152 | 100.0% |
School Enrollment by Age by Funding Source in St Bernice
| Age Bracket | Public School | Private School |
| 3 to 4 Year Olds | 0 (0.0%) | 0 (0.0%) |
| 5 to 9 Year Old | 0 (0.0%) | 0 (0.0%) |
| 10 to 14 Year Olds | 93 (100.0%) | 0 (0.0%) |
| 15 to 17 Year Olds | 40 (100.0%) | 0 (0.0%) |
| 18 to 19 Year Olds | 8 (100.0%) | 0 (0.0%) |
| 20 to 24 Year Olds | 0 (0.0%) | 0 (0.0%) |
| 25 to 34 Year Olds | 0 (0.0%) | 0 (0.0%) |
| 35 Years and over | 11 (100.0%) | 0 (0.0%) |
| Total | 152 (100.0%) | 0 (0.0%) |
Educational Attainment by Field of Study in St Bernice
Computers & mathematics (12 | 40.0%), social sciences (9 | 30.0%), and liberal arts & history (9 | 30.0%) are the most common fields of study among 30 individuals in St Bernice who have obtained a bachelor's degree or higher.
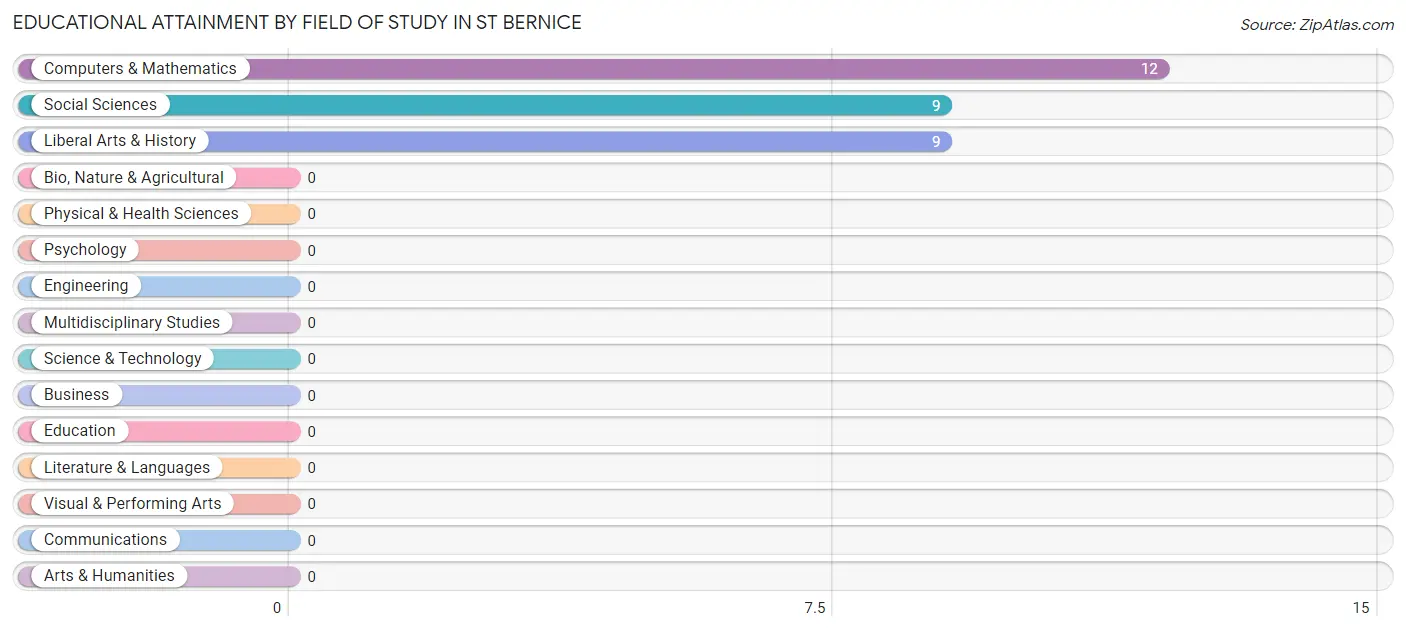
| Field of Study | # Graduates | % Graduates |
| Computers & Mathematics | 12 | 40.0% |
| Bio, Nature & Agricultural | 0 | 0.0% |
| Physical & Health Sciences | 0 | 0.0% |
| Psychology | 0 | 0.0% |
| Social Sciences | 9 | 30.0% |
| Engineering | 0 | 0.0% |
| Multidisciplinary Studies | 0 | 0.0% |
| Science & Technology | 0 | 0.0% |
| Business | 0 | 0.0% |
| Education | 0 | 0.0% |
| Literature & Languages | 0 | 0.0% |
| Liberal Arts & History | 9 | 30.0% |
| Visual & Performing Arts | 0 | 0.0% |
| Communications | 0 | 0.0% |
| Arts & Humanities | 0 | 0.0% |
| Total | 30 | 100.0% |
Transportation & Commute in St Bernice
Vehicle Availability by Sex in St Bernice
The most prevalent vehicle ownership categories in St Bernice are males with 4 vehicles (61, accounting for 54.9%) and females with 4 vehicles (11, making up 148.8%).
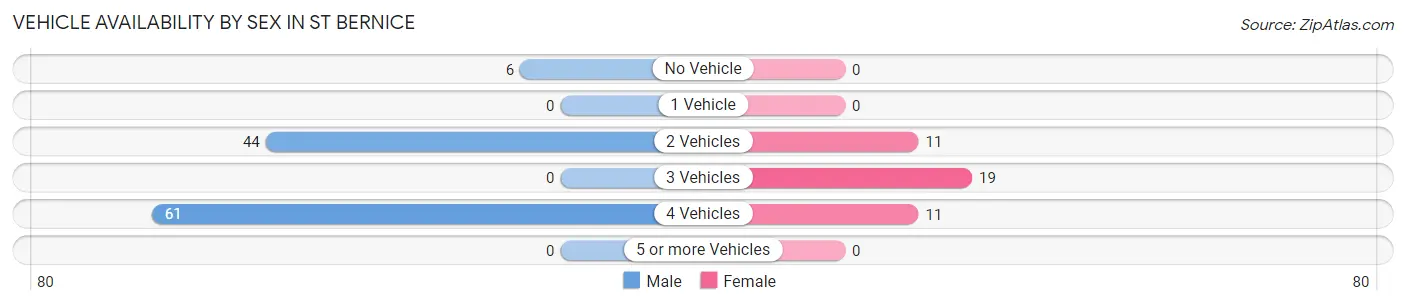
| Vehicles Available | Male | Female |
| No Vehicle | 6 (5.4%) | 0 (0.0%) |
| 1 Vehicle | 0 (0.0%) | 0 (0.0%) |
| 2 Vehicles | 44 (39.6%) | 11 (26.8%) |
| 3 Vehicles | 0 (0.0%) | 19 (46.3%) |
| 4 Vehicles | 61 (54.9%) | 11 (26.8%) |
| 5 or more Vehicles | 0 (0.0%) | 0 (0.0%) |
| Total | 111 (100.0%) | 41 (100.0%) |
Commute Time in St Bernice
The most frequently occuring commute durations in St Bernice are 45 to 59 minutes (41 commuters, 27.0%), 90 or more minutes (38 commuters, 25.0%), and 30 to 34 minutes (27 commuters, 17.8%).
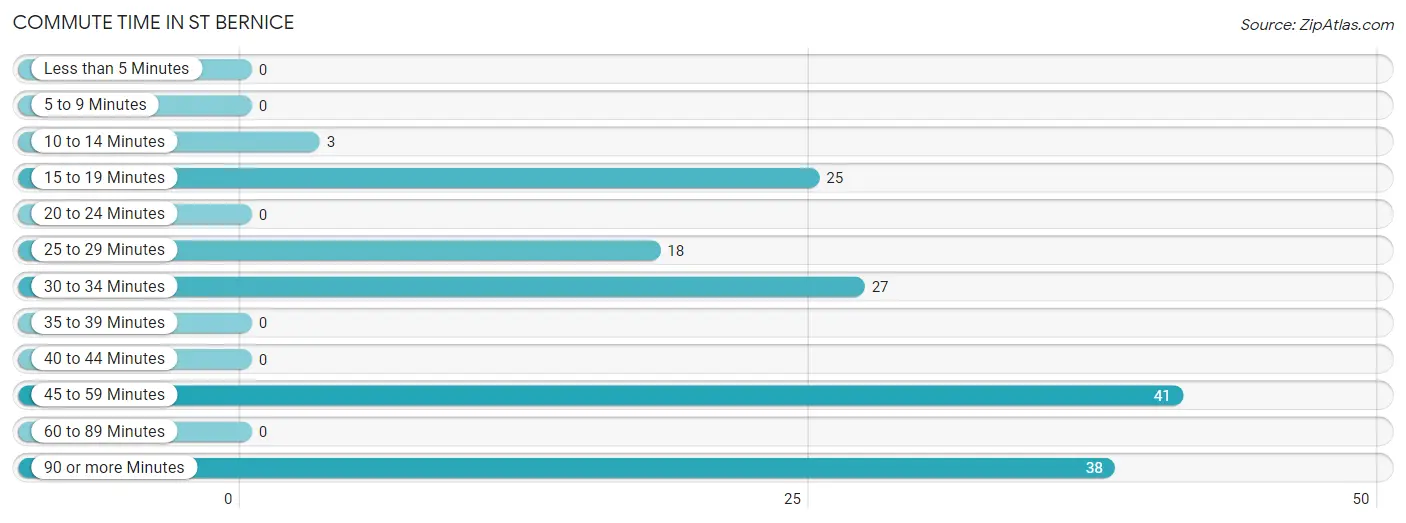
| Commute Time | # Commuters | % Commuters |
| Less than 5 Minutes | 0 | 0.0% |
| 5 to 9 Minutes | 0 | 0.0% |
| 10 to 14 Minutes | 3 | 2.0% |
| 15 to 19 Minutes | 25 | 16.5% |
| 20 to 24 Minutes | 0 | 0.0% |
| 25 to 29 Minutes | 18 | 11.8% |
| 30 to 34 Minutes | 27 | 17.8% |
| 35 to 39 Minutes | 0 | 0.0% |
| 40 to 44 Minutes | 0 | 0.0% |
| 45 to 59 Minutes | 41 | 27.0% |
| 60 to 89 Minutes | 0 | 0.0% |
| 90 or more Minutes | 38 | 25.0% |
Commute Time by Sex in St Bernice
The most common commute times in St Bernice are 90 or more minutes (38 commuters, 34.2%) for males and 30 to 34 minutes (27 commuters, 65.8%) for females.
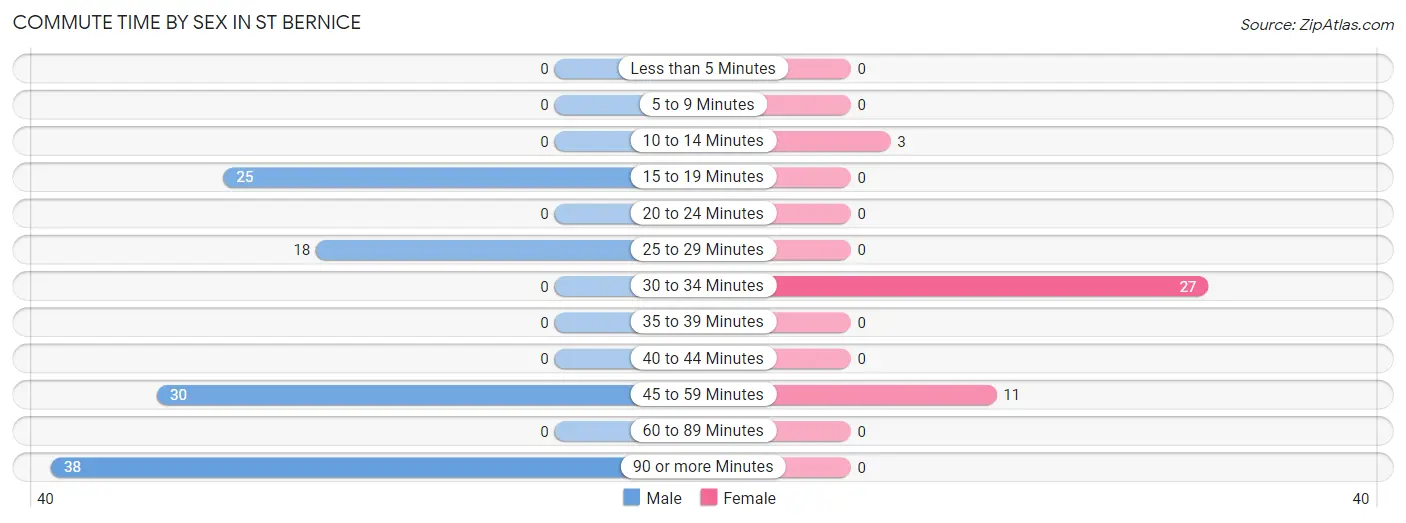
| Commute Time | Male | Female |
| Less than 5 Minutes | 0 (0.0%) | 0 (0.0%) |
| 5 to 9 Minutes | 0 (0.0%) | 0 (0.0%) |
| 10 to 14 Minutes | 0 (0.0%) | 3 (7.3%) |
| 15 to 19 Minutes | 25 (22.5%) | 0 (0.0%) |
| 20 to 24 Minutes | 0 (0.0%) | 0 (0.0%) |
| 25 to 29 Minutes | 18 (16.2%) | 0 (0.0%) |
| 30 to 34 Minutes | 0 (0.0%) | 27 (65.8%) |
| 35 to 39 Minutes | 0 (0.0%) | 0 (0.0%) |
| 40 to 44 Minutes | 0 (0.0%) | 0 (0.0%) |
| 45 to 59 Minutes | 30 (27.0%) | 11 (26.8%) |
| 60 to 89 Minutes | 0 (0.0%) | 0 (0.0%) |
| 90 or more Minutes | 38 (34.2%) | 0 (0.0%) |
Time of Departure to Work by Sex in St Bernice
The most frequent times of departure to work in St Bernice are 6:00 AM to 6:29 AM (47, 42.3%) for males and 6:00 AM to 6:29 AM (16, 39.0%) for females.
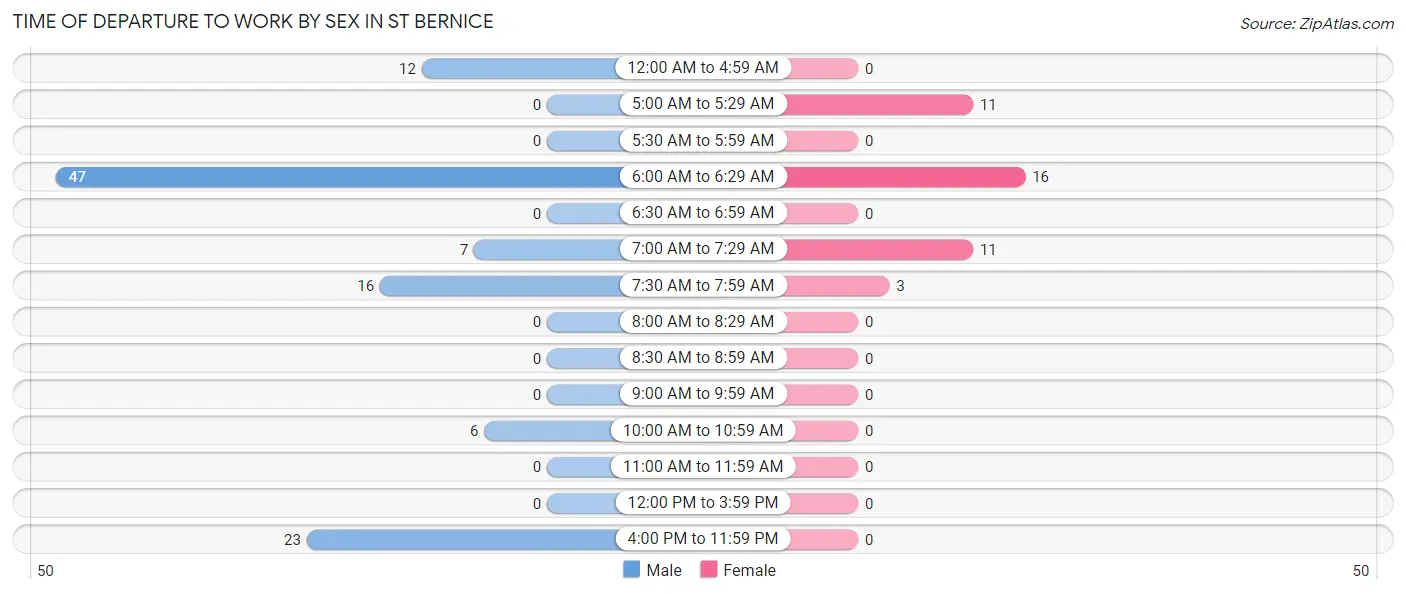
| Time of Departure | Male | Female |
| 12:00 AM to 4:59 AM | 12 (10.8%) | 0 (0.0%) |
| 5:00 AM to 5:29 AM | 0 (0.0%) | 11 (26.8%) |
| 5:30 AM to 5:59 AM | 0 (0.0%) | 0 (0.0%) |
| 6:00 AM to 6:29 AM | 47 (42.3%) | 16 (39.0%) |
| 6:30 AM to 6:59 AM | 0 (0.0%) | 0 (0.0%) |
| 7:00 AM to 7:29 AM | 7 (6.3%) | 11 (26.8%) |
| 7:30 AM to 7:59 AM | 16 (14.4%) | 3 (7.3%) |
| 8:00 AM to 8:29 AM | 0 (0.0%) | 0 (0.0%) |
| 8:30 AM to 8:59 AM | 0 (0.0%) | 0 (0.0%) |
| 9:00 AM to 9:59 AM | 0 (0.0%) | 0 (0.0%) |
| 10:00 AM to 10:59 AM | 6 (5.4%) | 0 (0.0%) |
| 11:00 AM to 11:59 AM | 0 (0.0%) | 0 (0.0%) |
| 12:00 PM to 3:59 PM | 0 (0.0%) | 0 (0.0%) |
| 4:00 PM to 11:59 PM | 23 (20.7%) | 0 (0.0%) |
| Total | 111 (100.0%) | 41 (100.0%) |
Housing Occupancy in St Bernice
Occupancy by Ownership in St Bernice
Of the total 222 dwellings in St Bernice, owner-occupied units account for 210 (94.6%), while renter-occupied units make up 12 (5.4%).
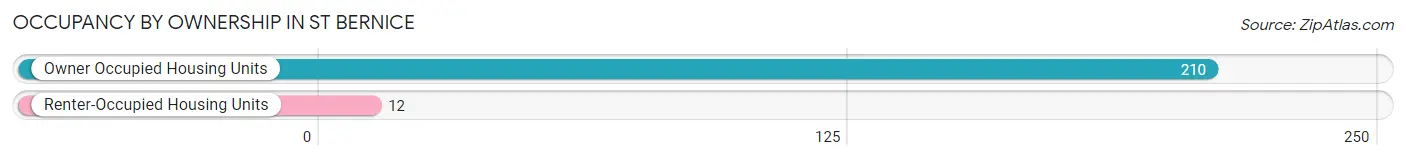
| Occupancy | # Housing Units | % Housing Units |
| Owner Occupied Housing Units | 210 | 94.6% |
| Renter-Occupied Housing Units | 12 | 5.4% |
| Total Occupied Housing Units | 222 | 100.0% |
Occupancy by Household Size in St Bernice
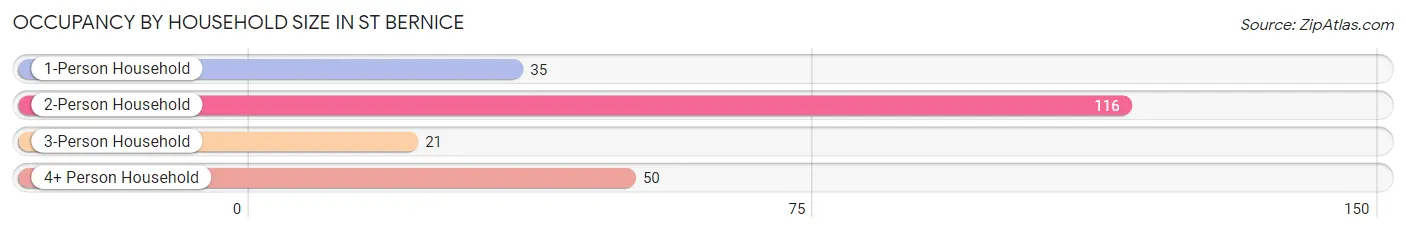
| Household Size | # Housing Units | % Housing Units |
| 1-Person Household | 35 | 15.8% |
| 2-Person Household | 116 | 52.2% |
| 3-Person Household | 21 | 9.5% |
| 4+ Person Household | 50 | 22.5% |
| Total Housing Units | 222 | 100.0% |
Occupancy by Ownership by Household Size in St Bernice
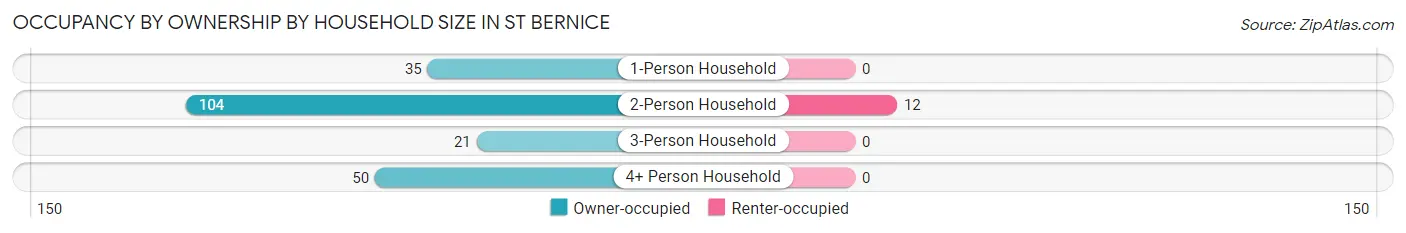
| Household Size | Owner-occupied | Renter-occupied |
| 1-Person Household | 35 (100.0%) | 0 (0.0%) |
| 2-Person Household | 104 (89.7%) | 12 (10.3%) |
| 3-Person Household | 21 (100.0%) | 0 (0.0%) |
| 4+ Person Household | 50 (100.0%) | 0 (0.0%) |
| Total Housing Units | 210 (94.6%) | 12 (5.4%) |
Occupancy by Educational Attainment in St Bernice
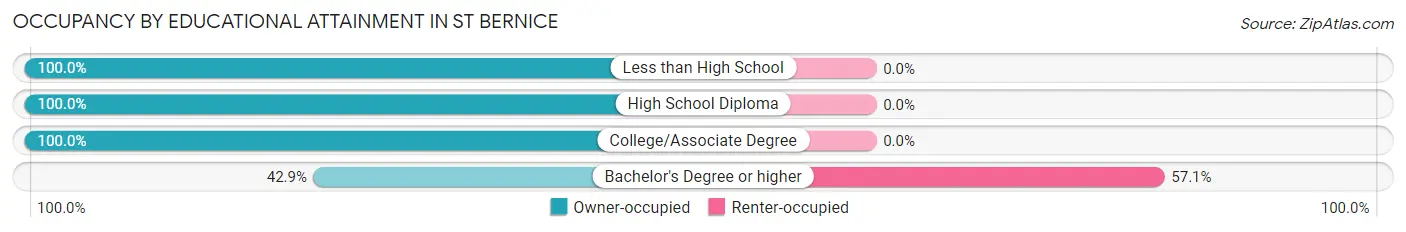
| Household Size | Owner-occupied | Renter-occupied |
| Less than High School | 82 (100.0%) | 0 (0.0%) |
| High School Diploma | 69 (100.0%) | 0 (0.0%) |
| College/Associate Degree | 50 (100.0%) | 0 (0.0%) |
| Bachelor's Degree or higher | 9 (42.9%) | 12 (57.1%) |
Occupancy by Age of Householder in St Bernice
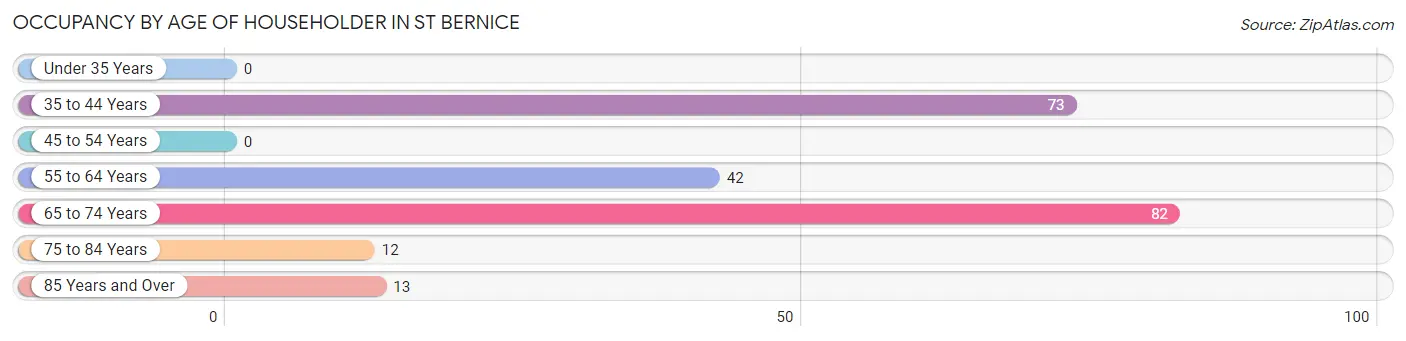
| Age Bracket | # Households | % Households |
| Under 35 Years | 0 | 0.0% |
| 35 to 44 Years | 73 | 32.9% |
| 45 to 54 Years | 0 | 0.0% |
| 55 to 64 Years | 42 | 18.9% |
| 65 to 74 Years | 82 | 36.9% |
| 75 to 84 Years | 12 | 5.4% |
| 85 Years and Over | 13 | 5.9% |
| Total | 222 | 100.0% |
Housing Finances in St Bernice
Median Income by Occupancy in St Bernice
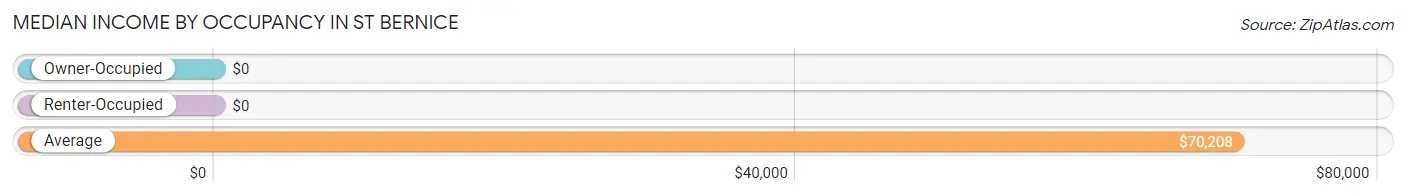
| Occupancy Type | # Households | Median Income |
| Owner-Occupied | 210 (94.6%) | $0 |
| Renter-Occupied | 12 (5.4%) | $0 |
| Average | 222 (100.0%) | $70,208 |
Occupancy by Householder Income Bracket in St Bernice
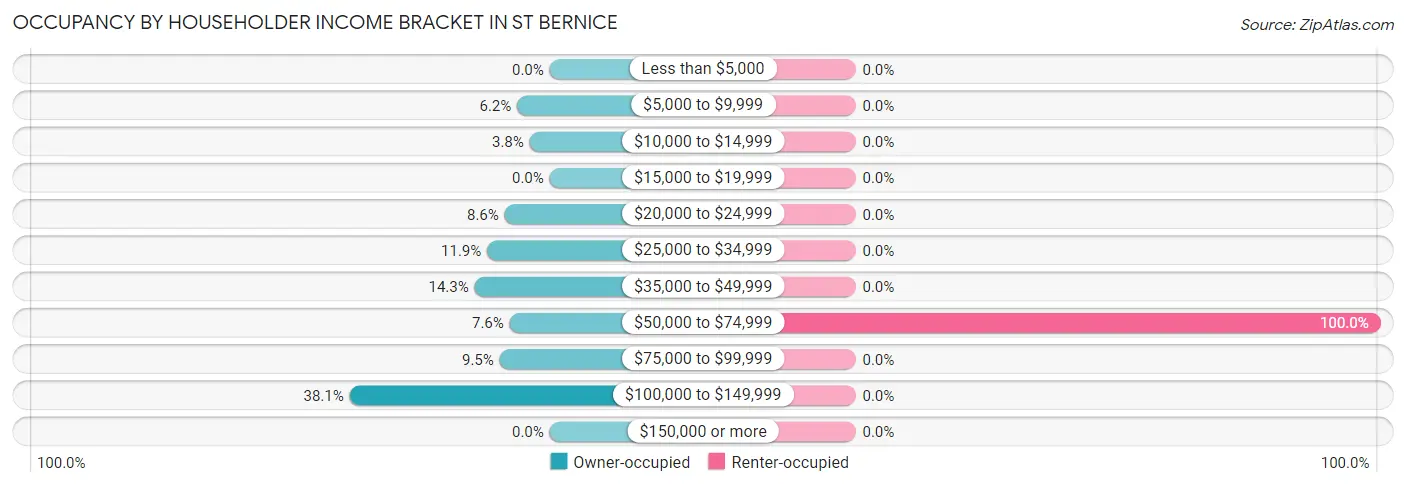
| Income Bracket | Owner-occupied | Renter-occupied |
| Less than $5,000 | 0 (0.0%) | 0 (0.0%) |
| $5,000 to $9,999 | 13 (6.2%) | 0 (0.0%) |
| $10,000 to $14,999 | 8 (3.8%) | 0 (0.0%) |
| $15,000 to $19,999 | 0 (0.0%) | 0 (0.0%) |
| $20,000 to $24,999 | 18 (8.6%) | 0 (0.0%) |
| $25,000 to $34,999 | 25 (11.9%) | 0 (0.0%) |
| $35,000 to $49,999 | 30 (14.3%) | 0 (0.0%) |
| $50,000 to $74,999 | 16 (7.6%) | 12 (100.0%) |
| $75,000 to $99,999 | 20 (9.5%) | 0 (0.0%) |
| $100,000 to $149,999 | 80 (38.1%) | 0 (0.0%) |
| $150,000 or more | 0 (0.0%) | 0 (0.0%) |
| Total | 210 (100.0%) | 12 (100.0%) |
Monthly Housing Cost Tiers in St Bernice
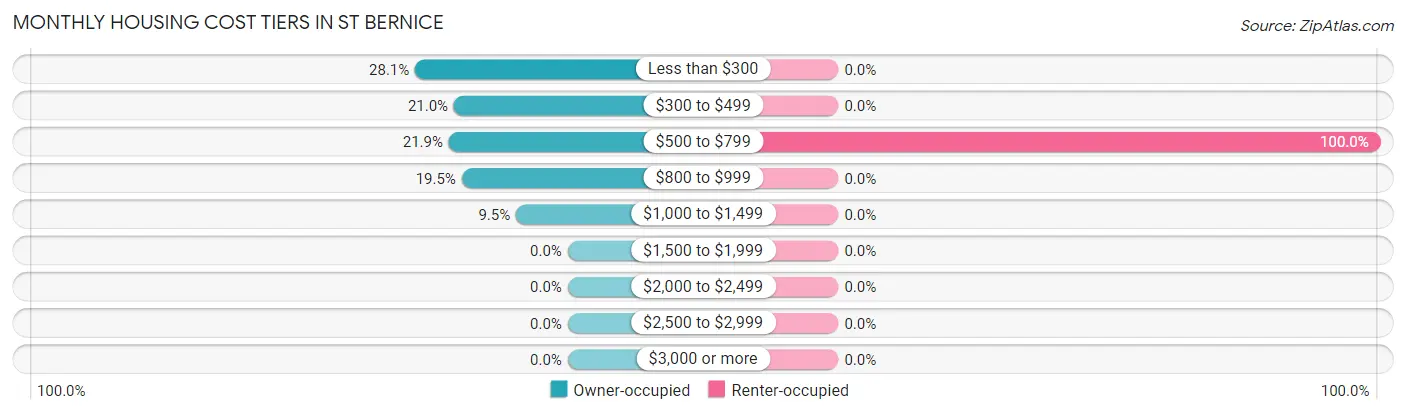
| Monthly Cost | Owner-occupied | Renter-occupied |
| Less than $300 | 59 (28.1%) | 0 (0.0%) |
| $300 to $499 | 44 (20.9%) | 0 (0.0%) |
| $500 to $799 | 46 (21.9%) | 12 (100.0%) |
| $800 to $999 | 41 (19.5%) | 0 (0.0%) |
| $1,000 to $1,499 | 20 (9.5%) | 0 (0.0%) |
| $1,500 to $1,999 | 0 (0.0%) | 0 (0.0%) |
| $2,000 to $2,499 | 0 (0.0%) | 0 (0.0%) |
| $2,500 to $2,999 | 0 (0.0%) | 0 (0.0%) |
| $3,000 or more | 0 (0.0%) | 0 (0.0%) |
| Total | 210 (100.0%) | 12 (100.0%) |
Physical Housing Characteristics in St Bernice
Housing Structures in St Bernice
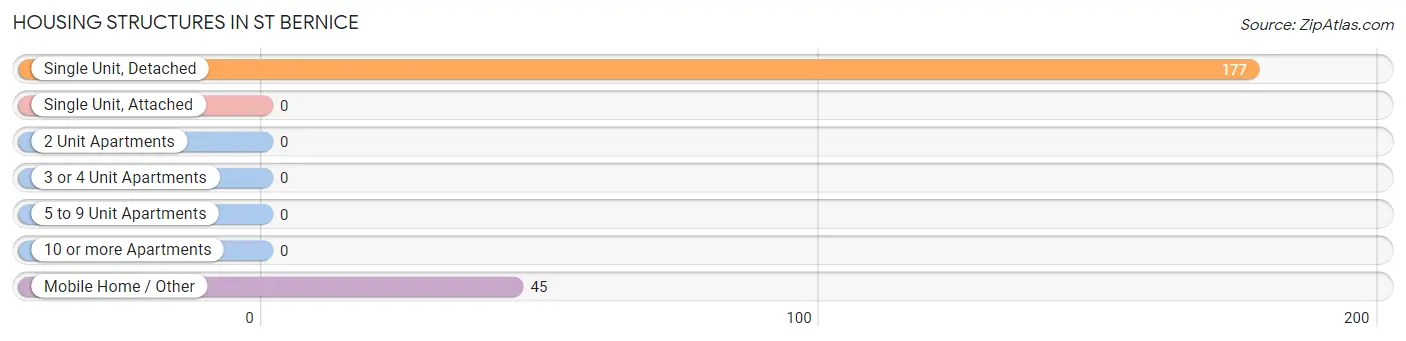
| Structure Type | # Housing Units | % Housing Units |
| Single Unit, Detached | 177 | 79.7% |
| Single Unit, Attached | 0 | 0.0% |
| 2 Unit Apartments | 0 | 0.0% |
| 3 or 4 Unit Apartments | 0 | 0.0% |
| 5 to 9 Unit Apartments | 0 | 0.0% |
| 10 or more Apartments | 0 | 0.0% |
| Mobile Home / Other | 45 | 20.3% |
| Total | 222 | 100.0% |
Housing Structures by Occupancy in St Bernice
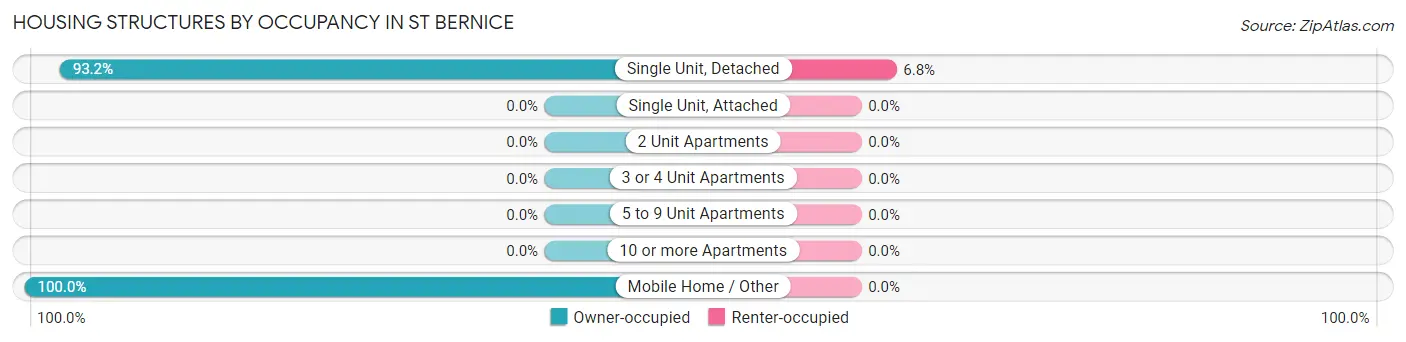
| Structure Type | Owner-occupied | Renter-occupied |
| Single Unit, Detached | 165 (93.2%) | 12 (6.8%) |
| Single Unit, Attached | 0 (0.0%) | 0 (0.0%) |
| 2 Unit Apartments | 0 (0.0%) | 0 (0.0%) |
| 3 or 4 Unit Apartments | 0 (0.0%) | 0 (0.0%) |
| 5 to 9 Unit Apartments | 0 (0.0%) | 0 (0.0%) |
| 10 or more Apartments | 0 (0.0%) | 0 (0.0%) |
| Mobile Home / Other | 45 (100.0%) | 0 (0.0%) |
| Total | 210 (94.6%) | 12 (5.4%) |
Housing Structures by Number of Rooms in St Bernice
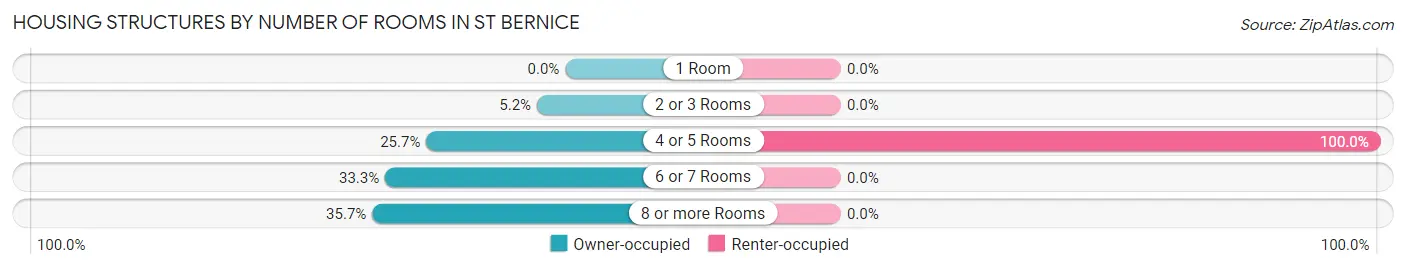
| Number of Rooms | Owner-occupied | Renter-occupied |
| 1 Room | 0 (0.0%) | 0 (0.0%) |
| 2 or 3 Rooms | 11 (5.2%) | 0 (0.0%) |
| 4 or 5 Rooms | 54 (25.7%) | 12 (100.0%) |
| 6 or 7 Rooms | 70 (33.3%) | 0 (0.0%) |
| 8 or more Rooms | 75 (35.7%) | 0 (0.0%) |
| Total | 210 (100.0%) | 12 (100.0%) |
Housing Structure by Heating Type in St Bernice
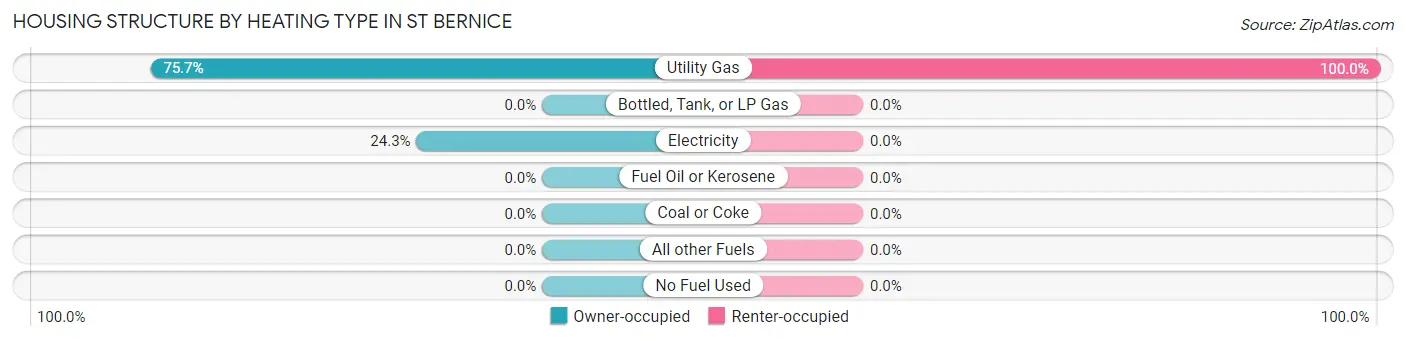
| Heating Type | Owner-occupied | Renter-occupied |
| Utility Gas | 159 (75.7%) | 12 (100.0%) |
| Bottled, Tank, or LP Gas | 0 (0.0%) | 0 (0.0%) |
| Electricity | 51 (24.3%) | 0 (0.0%) |
| Fuel Oil or Kerosene | 0 (0.0%) | 0 (0.0%) |
| Coal or Coke | 0 (0.0%) | 0 (0.0%) |
| All other Fuels | 0 (0.0%) | 0 (0.0%) |
| No Fuel Used | 0 (0.0%) | 0 (0.0%) |
| Total | 210 (100.0%) | 12 (100.0%) |
Household Vehicle Usage in St Bernice
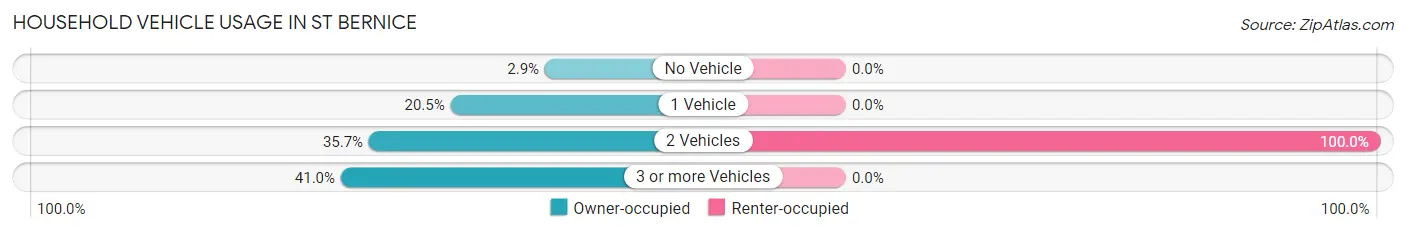
| Vehicles per Household | Owner-occupied | Renter-occupied |
| No Vehicle | 6 (2.9%) | 0 (0.0%) |
| 1 Vehicle | 43 (20.5%) | 0 (0.0%) |
| 2 Vehicles | 75 (35.7%) | 12 (100.0%) |
| 3 or more Vehicles | 86 (40.9%) | 0 (0.0%) |
| Total | 210 (100.0%) | 12 (100.0%) |
Real Estate & Mortgages in St Bernice
Real Estate and Mortgage Overview in St Bernice
| Characteristic | Without Mortgage | With Mortgage |
| Housing Units | 106 | 104 |
| Median Property Value | - | - |
| Median Household Income | - | - |
| Monthly Housing Costs | $290 | $0 |
| Real Estate Taxes | - | - |
Property Value by Mortgage Status in St Bernice
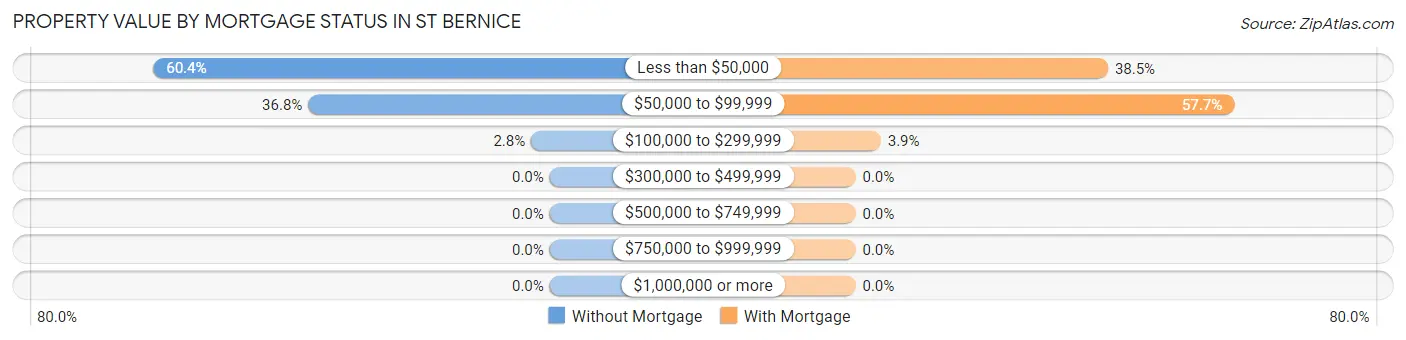
| Property Value | Without Mortgage | With Mortgage |
| Less than $50,000 | 64 (60.4%) | 40 (38.5%) |
| $50,000 to $99,999 | 39 (36.8%) | 60 (57.7%) |
| $100,000 to $299,999 | 3 (2.8%) | 4 (3.8%) |
| $300,000 to $499,999 | 0 (0.0%) | 0 (0.0%) |
| $500,000 to $749,999 | 0 (0.0%) | 0 (0.0%) |
| $750,000 to $999,999 | 0 (0.0%) | 0 (0.0%) |
| $1,000,000 or more | 0 (0.0%) | 0 (0.0%) |
| Total | 106 (100.0%) | 104 (100.0%) |
Household Income by Mortgage Status in St Bernice
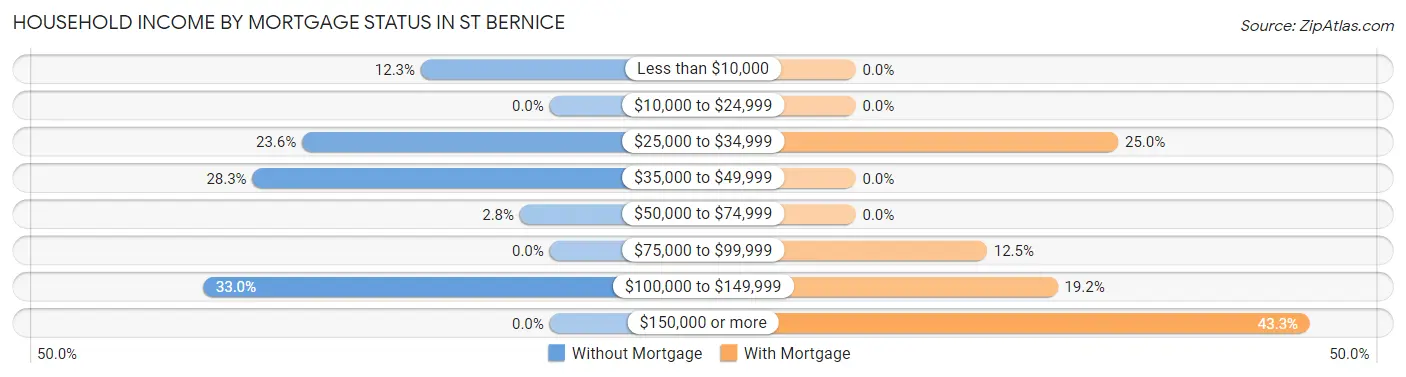
| Household Income | Without Mortgage | With Mortgage |
| Less than $10,000 | 13 (12.3%) | 0 (0.0%) |
| $10,000 to $24,999 | 0 (0.0%) | 0 (0.0%) |
| $25,000 to $34,999 | 25 (23.6%) | 26 (25.0%) |
| $35,000 to $49,999 | 30 (28.3%) | 0 (0.0%) |
| $50,000 to $74,999 | 3 (2.8%) | 0 (0.0%) |
| $75,000 to $99,999 | 0 (0.0%) | 13 (12.5%) |
| $100,000 to $149,999 | 35 (33.0%) | 20 (19.2%) |
| $150,000 or more | 0 (0.0%) | 45 (43.3%) |
| Total | 106 (100.0%) | 104 (100.0%) |
Property Value to Household Income Ratio in St Bernice
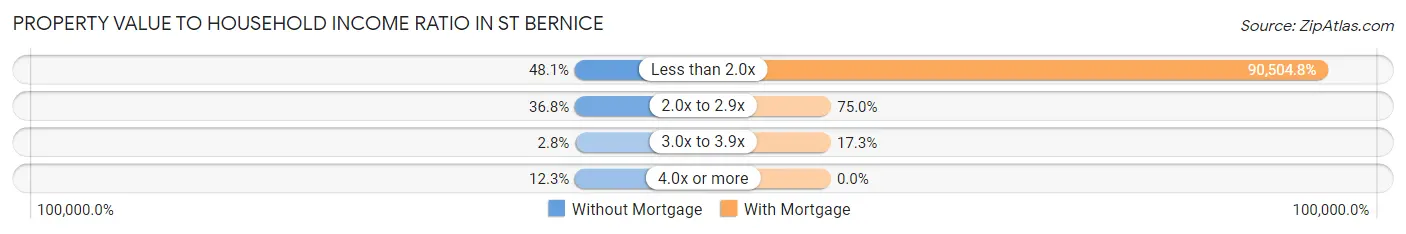
| Value-to-Income Ratio | Without Mortgage | With Mortgage |
| Less than 2.0x | 51 (48.1%) | 94,125 (90,504.8%) |
| 2.0x to 2.9x | 39 (36.8%) | 78 (75.0%) |
| 3.0x to 3.9x | 3 (2.8%) | 18 (17.3%) |
| 4.0x or more | 13 (12.3%) | 0 (0.0%) |
| Total | 106 (100.0%) | 104 (100.0%) |
Real Estate Taxes by Mortgage Status in St Bernice
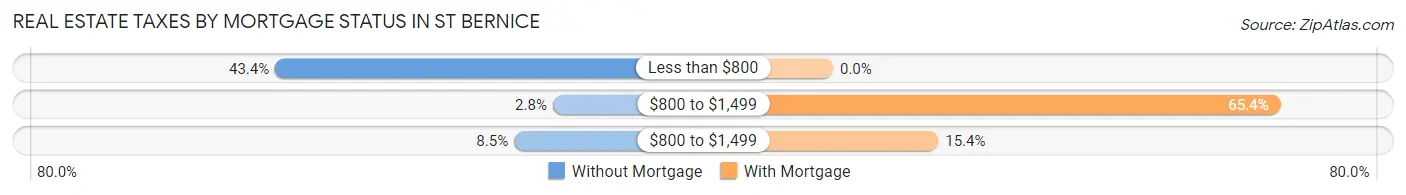
| Property Taxes | Without Mortgage | With Mortgage |
| Less than $800 | 46 (43.4%) | 0 (0.0%) |
| $800 to $1,499 | 3 (2.8%) | 68 (65.4%) |
| $800 to $1,499 | 9 (8.5%) | 16 (15.4%) |
| Total | 106 (100.0%) | 104 (100.0%) |
Health & Disability in St Bernice
Health Insurance Coverage by Age in St Bernice
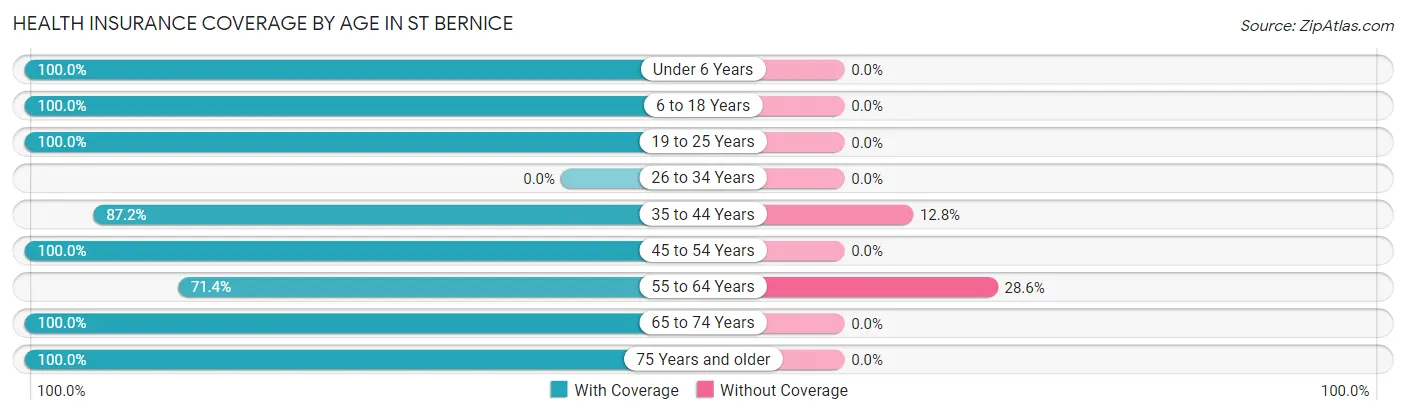
| Age Bracket | With Coverage | Without Coverage |
| Under 6 Years | 11 (100.0%) | 0 (0.0%) |
| 6 to 18 Years | 182 (100.0%) | 0 (0.0%) |
| 19 to 25 Years | 35 (100.0%) | 0 (0.0%) |
| 26 to 34 Years | 0 (0.0%) | 0 (0.0%) |
| 35 to 44 Years | 109 (87.2%) | 16 (12.8%) |
| 45 to 54 Years | 32 (100.0%) | 0 (0.0%) |
| 55 to 64 Years | 45 (71.4%) | 18 (28.6%) |
| 65 to 74 Years | 89 (100.0%) | 0 (0.0%) |
| 75 Years and older | 64 (100.0%) | 0 (0.0%) |
| Total | 567 (94.3%) | 34 (5.7%) |
Health Insurance Coverage by Citizenship Status in St Bernice
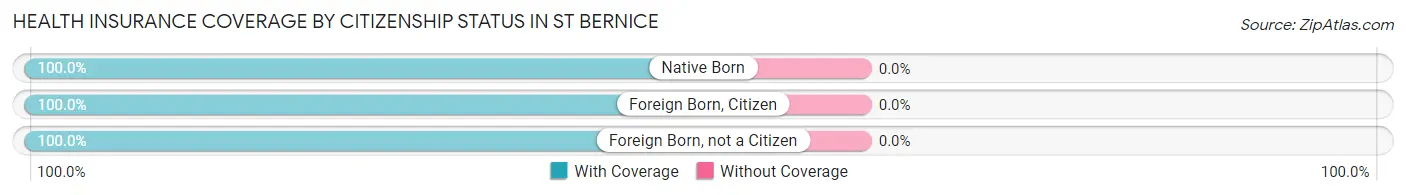
| Citizenship Status | With Coverage | Without Coverage |
| Native Born | 11 (100.0%) | 0 (0.0%) |
| Foreign Born, Citizen | 182 (100.0%) | 0 (0.0%) |
| Foreign Born, not a Citizen | 35 (100.0%) | 0 (0.0%) |
Health Insurance Coverage by Household Income in St Bernice
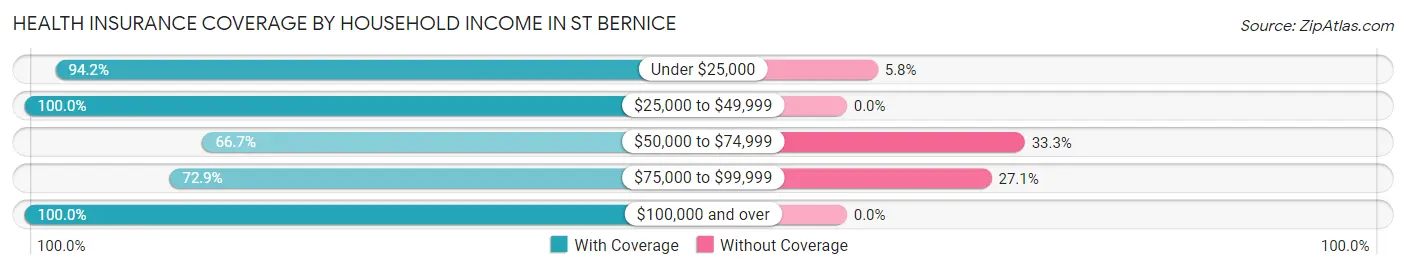
| Household Income | With Coverage | Without Coverage |
| Under $25,000 | 65 (94.2%) | 4 (5.8%) |
| $25,000 to $49,999 | 94 (100.0%) | 0 (0.0%) |
| $50,000 to $74,999 | 28 (66.7%) | 14 (33.3%) |
| $75,000 to $99,999 | 43 (72.9%) | 16 (27.1%) |
| $100,000 and over | 337 (100.0%) | 0 (0.0%) |
Public vs Private Health Insurance Coverage by Age in St Bernice
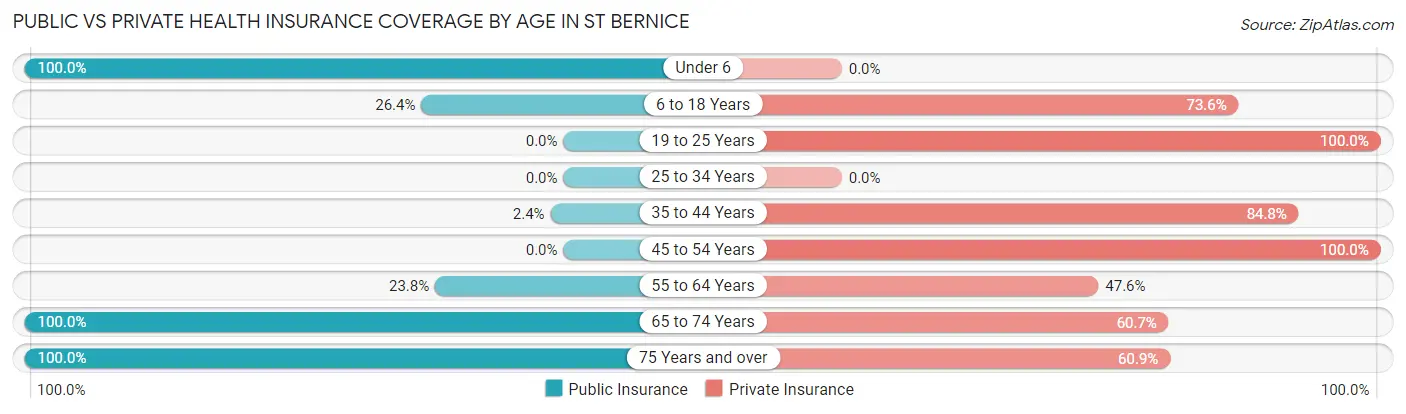
| Age Bracket | Public Insurance | Private Insurance |
| Under 6 | 11 (100.0%) | 0 (0.0%) |
| 6 to 18 Years | 48 (26.4%) | 134 (73.6%) |
| 19 to 25 Years | 0 (0.0%) | 35 (100.0%) |
| 25 to 34 Years | 0 (0.0%) | 0 (0.0%) |
| 35 to 44 Years | 3 (2.4%) | 106 (84.8%) |
| 45 to 54 Years | 0 (0.0%) | 32 (100.0%) |
| 55 to 64 Years | 15 (23.8%) | 30 (47.6%) |
| 65 to 74 Years | 89 (100.0%) | 54 (60.7%) |
| 75 Years and over | 64 (100.0%) | 39 (60.9%) |
| Total | 230 (38.3%) | 430 (71.6%) |
Disability Status by Sex by Age in St Bernice
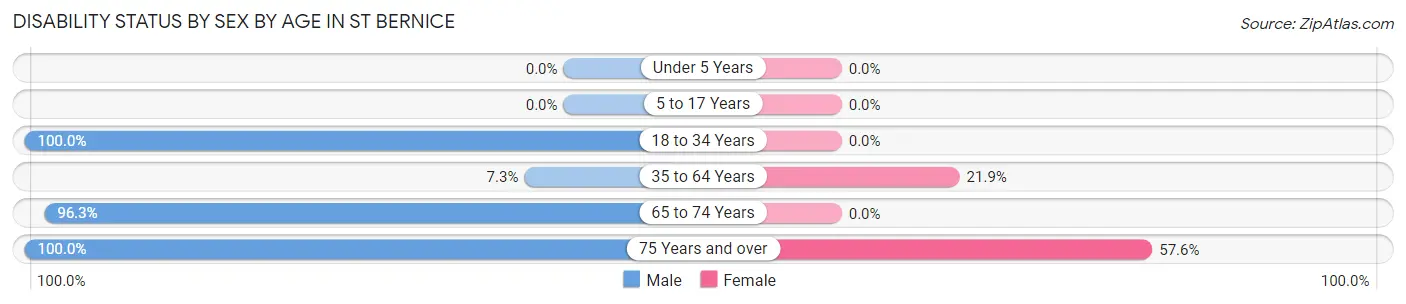
| Age Bracket | Male | Female |
| Under 5 Years | 0 (0.0%) | 0 (0.0%) |
| 5 to 17 Years | 0 (0.0%) | 0 (0.0%) |
| 18 to 34 Years | 35 (100.0%) | 0 (0.0%) |
| 35 to 64 Years | 9 (7.3%) | 21 (21.9%) |
| 65 to 74 Years | 79 (96.3%) | 0 (0.0%) |
| 75 Years and over | 5 (100.0%) | 34 (57.6%) |
Disability Class by Sex by Age in St Bernice
Disability Class: Hearing Difficulty
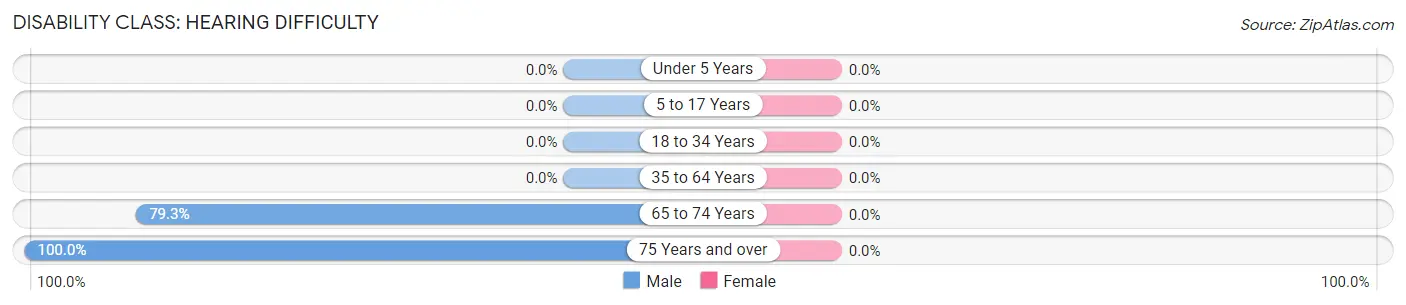
| Age Bracket | Male | Female |
| Under 5 Years | 0 (0.0%) | 0 (0.0%) |
| 5 to 17 Years | 0 (0.0%) | 0 (0.0%) |
| 18 to 34 Years | 0 (0.0%) | 0 (0.0%) |
| 35 to 64 Years | 0 (0.0%) | 0 (0.0%) |
| 65 to 74 Years | 65 (79.3%) | 0 (0.0%) |
| 75 Years and over | 5 (100.0%) | 0 (0.0%) |
Disability Class: Vision Difficulty
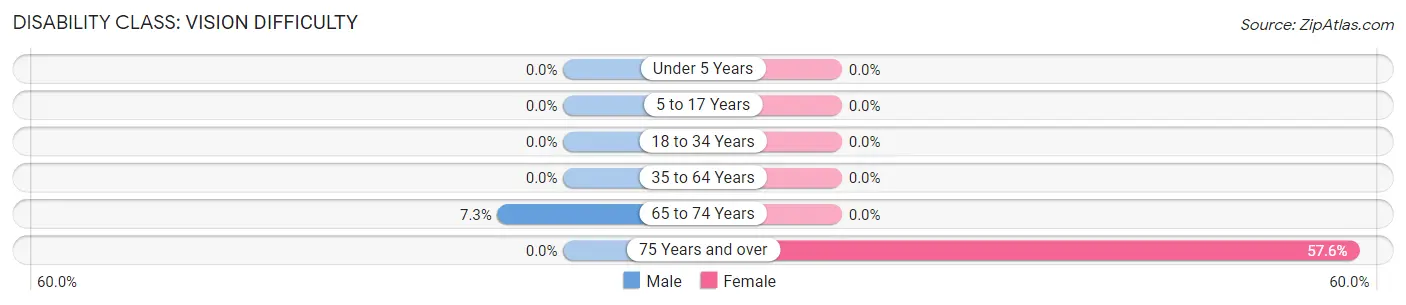
| Age Bracket | Male | Female |
| Under 5 Years | 0 (0.0%) | 0 (0.0%) |
| 5 to 17 Years | 0 (0.0%) | 0 (0.0%) |
| 18 to 34 Years | 0 (0.0%) | 0 (0.0%) |
| 35 to 64 Years | 0 (0.0%) | 0 (0.0%) |
| 65 to 74 Years | 6 (7.3%) | 0 (0.0%) |
| 75 Years and over | 0 (0.0%) | 34 (57.6%) |
Disability Class: Cognitive Difficulty
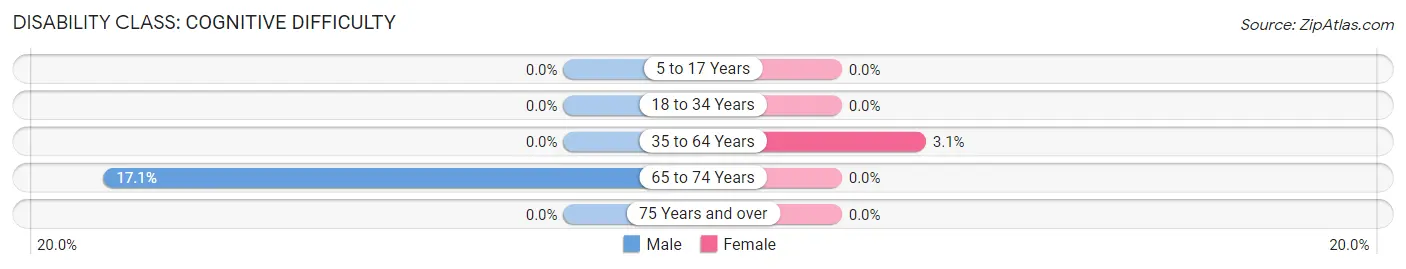
| Age Bracket | Male | Female |
| 5 to 17 Years | 0 (0.0%) | 0 (0.0%) |
| 18 to 34 Years | 0 (0.0%) | 0 (0.0%) |
| 35 to 64 Years | 0 (0.0%) | 3 (3.1%) |
| 65 to 74 Years | 14 (17.1%) | 0 (0.0%) |
| 75 Years and over | 0 (0.0%) | 0 (0.0%) |
Disability Class: Ambulatory Difficulty
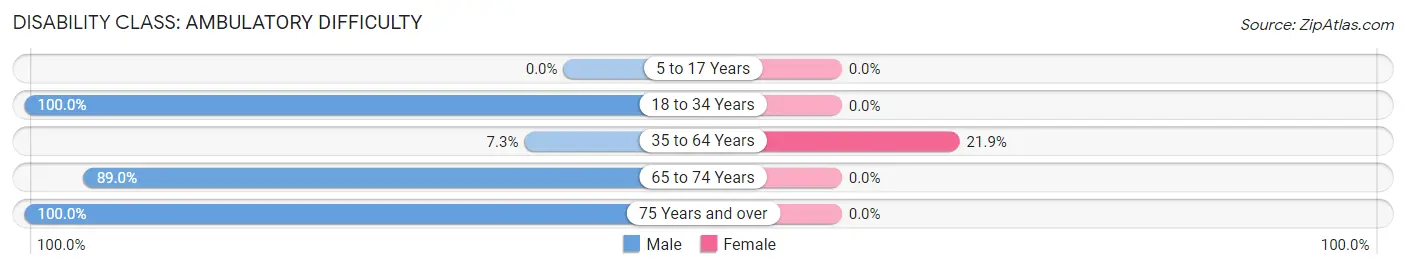
| Age Bracket | Male | Female |
| 5 to 17 Years | 0 (0.0%) | 0 (0.0%) |
| 18 to 34 Years | 35 (100.0%) | 0 (0.0%) |
| 35 to 64 Years | 9 (7.3%) | 21 (21.9%) |
| 65 to 74 Years | 73 (89.0%) | 0 (0.0%) |
| 75 Years and over | 5 (100.0%) | 0 (0.0%) |
Disability Class: Self-Care Difficulty
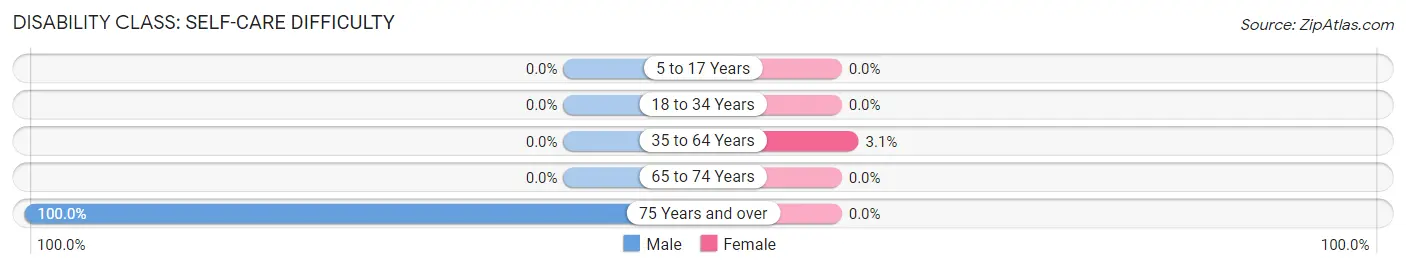
| Age Bracket | Male | Female |
| 5 to 17 Years | 0 (0.0%) | 0 (0.0%) |
| 18 to 34 Years | 0 (0.0%) | 0 (0.0%) |
| 35 to 64 Years | 0 (0.0%) | 3 (3.1%) |
| 65 to 74 Years | 0 (0.0%) | 0 (0.0%) |
| 75 Years and over | 5 (100.0%) | 0 (0.0%) |
Technology Access in St Bernice
Computing Device Access in St Bernice
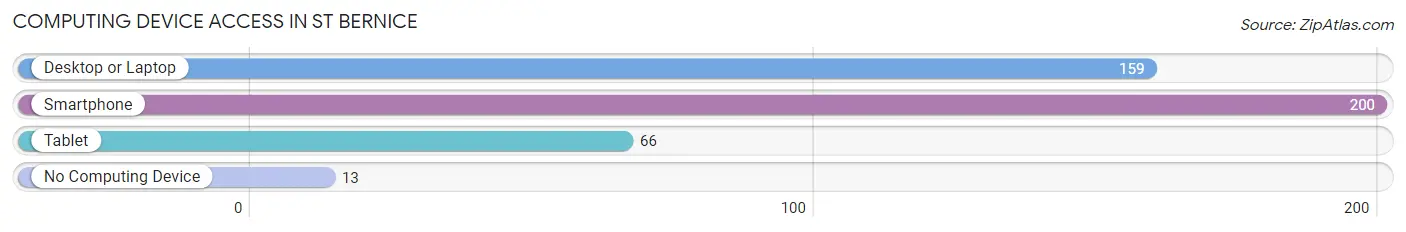
| Device Type | # Households | % Households |
| Desktop or Laptop | 159 | 71.6% |
| Smartphone | 200 | 90.1% |
| Tablet | 66 | 29.7% |
| No Computing Device | 13 | 5.9% |
| Total | 222 | 100.0% |
Internet Access in St Bernice
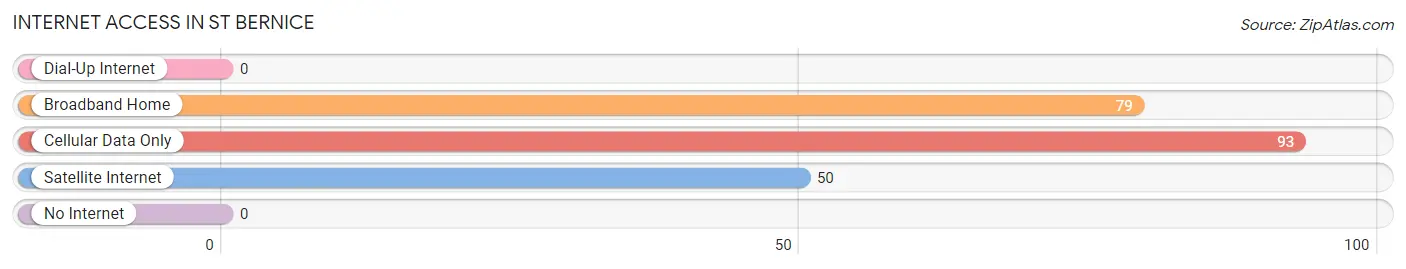
| Internet Type | # Households | % Households |
| Dial-Up Internet | 0 | 0.0% |
| Broadband Home | 79 | 35.6% |
| Cellular Data Only | 93 | 41.9% |
| Satellite Internet | 50 | 22.5% |
| No Internet | 0 | 0.0% |
| Total | 222 | 100.0% |
St Bernice Summary
Introduction
St Bernice is a small town located in the state of Indiana, United States. It is situated in Vermillion County and is part of the Terre Haute Metropolitan Statistical Area. The town has a population of 1,845 people as of the 2010 census. St Bernice is a rural community with a rich history and a vibrant economy. This paper will explore the history, geography, economy and demographics of St Bernice in 2000 words.
History
St Bernice was founded in 1837 by a group of settlers from Ohio. The town was named after Bernice, the daughter of one of the settlers. The town was originally a farming community and the main crops grown were corn, wheat, and oats. The town also had a sawmill and a gristmill.
In 1851, the first post office was established in St Bernice. The town was incorporated in 1867 and the first mayor was elected in 1868.
In the late 19th century, St Bernice was a thriving community with a population of over 1,000 people. The town had several stores, a bank, a hotel, a newspaper, and a school.
In the early 20th century, the population of St Bernice began to decline as people moved away to larger cities. The town’s economy also suffered as the railroad bypassed St Bernice.
Geography
St Bernice is located in the western part of Vermillion County, Indiana. The town is situated on the banks of the Wabash River and is surrounded by rolling hills and farmland. The town is located approximately 30 miles south of Terre Haute and 40 miles north of Indianapolis.
The climate in St Bernice is humid continental, with hot summers and cold winters. The average temperature in the summer is around 75 degrees Fahrenheit and the average temperature in the winter is around 30 degrees Fahrenheit.
Economy
The economy of St Bernice is largely based on agriculture. The town is home to several farms that produce corn, wheat, soybeans, and other crops. The town also has several businesses that provide services to the local community, such as auto repair shops, restaurants, and grocery stores.
The town is also home to several manufacturing companies, such as a furniture factory and a plastics factory. The town also has a small airport that serves the local area.
Demographics
As of the 2010 census, the population of St Bernice was 1,845 people. The racial makeup of the town was 97.3% White, 0.7% African American, 0.3% Native American, 0.2% Asian, and 1.5% from other races.
The median household income in St Bernice was $37,917 and the median family income was $45,625. The per capita income was $19,845. The town had a poverty rate of 16.3%.
Conclusion
St Bernice is a small town located in the state of Indiana, United States. It is situated in Vermillion County and is part of the Terre Haute Metropolitan Statistical Area. The town has a population of 1,845 people as of the 2010 census. St Bernice is a rural community with a rich history and a vibrant economy. The town’s economy is largely based on agriculture and manufacturing. The town also has several businesses that provide services to the local community. The racial makeup of the town is predominantly White, with a small percentage of African American, Native American, and Asian residents. The median household income in St Bernice was $37,917 and the median family income was $45,625. The per capita income was $19,845. The town had a poverty rate of 16.3%.
Common Questions
What is Per Capita Income in St Bernice?
Per Capita income in St Bernice is $23,062.
What is the Median Family Income in St Bernice?
Median Family Income in St Bernice is $70,521.
What is the Median Household income in St Bernice?
Median Household Income in St Bernice is $70,208.
What is Income or Wage Gap in St Bernice?
Income or Wage Gap in St Bernice is 23.2%.
Women in St Bernice earn 76.8 cents for every dollar earned by a man.
What is Inequality or Gini Index in St Bernice?
Inequality or Gini Index in St Bernice is 0.30.
What is the Total Population of St Bernice?
Total Population of St Bernice is 601.
What is the Total Male Population of St Bernice?
Total Male Population of St Bernice is 379.
What is the Total Female Population of St Bernice?
Total Female Population of St Bernice is 222.
What is the Ratio of Males per 100 Females in St Bernice?
There are 170.72 Males per 100 Females in St Bernice.
What is the Ratio of Females per 100 Males in St Bernice?
There are 58.58 Females per 100 Males in St Bernice.
What is the Median Population Age in St Bernice?
Median Population Age in St Bernice is 43.3 Years.
What is the Average Family Size in St Bernice
Average Family Size in St Bernice is 3.0 People.
What is the Average Household Size in St Bernice
Average Household Size in St Bernice is 2.7 People.
How Large is the Labor Force in St Bernice?
There are 187 People in the Labor Forcein in St Bernice.
What is the Percentage of People in the Labor Force in St Bernice?
45.0% of People are in the Labor Force in St Bernice.