Topeka, IN Map & Demographics
Topeka Map
Topeka Overview
$27,742
PER CAPITA INCOME
$70,833
AVG FAMILY INCOME
$59,559
AVG HOUSEHOLD INCOME
37.2%
WAGE / INCOME GAP [ % ]
62.8¢/ $1
WAGE / INCOME GAP [ $ ]
$9,715
FAMILY INCOME DEFICIT
0.41
INEQUALITY / GINI INDEX
1,132
TOTAL POPULATION
549
MALE POPULATION
583
FEMALE POPULATION
94.17
MALES / 100 FEMALES
106.19
FEMALES / 100 MALES
33.7
MEDIAN AGE
3.7
AVG FAMILY SIZE
3.0
AVG HOUSEHOLD SIZE
488
LABOR FORCE [ PEOPLE ]
60.8%
PERCENT IN LABOR FORCE
6.4%
UNEMPLOYMENT RATE
Topeka Zip Codes
Topeka Area Codes
Income in Topeka
Income Overview in Topeka
Per Capita Income in Topeka is $27,742, while median incomes of families and households are $70,833 and $59,559 respectively.
| Characteristic | Number | Measure |
| Per Capita Income | 1,132 | $27,742 |
| Median Family Income | 258 | $70,833 |
| Mean Family Income | 258 | $86,000 |
| Median Household Income | 382 | $59,559 |
| Mean Household Income | 382 | $75,563 |
| Income Deficit | 258 | $9,715 |
| Wage / Income Gap (%) | 1,132 | 37.18% |
| Wage / Income Gap ($) | 1,132 | 62.82¢ per $1 |
| Gini / Inequality Index | 1,132 | 0.41 |
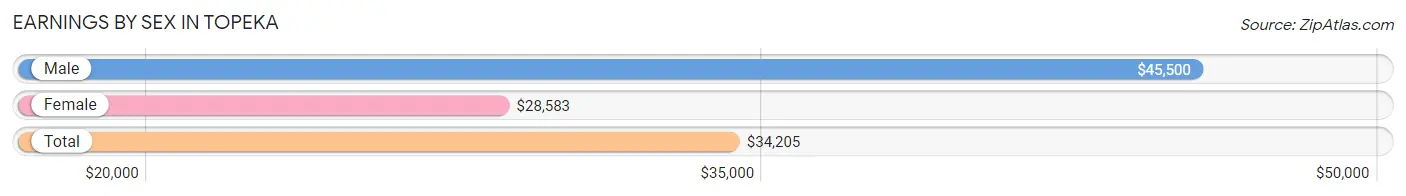
Earnings by Sex in Topeka
Average Earnings in Topeka are $34,205, $45,500 for men and $28,583 for women, a difference of 37.2%.
| Sex | Number | Average Earnings |
| Male | 306 (57.8%) | $45,500 |
| Female | 223 (42.2%) | $28,583 |
| Total | 529 (100.0%) | $34,205 |
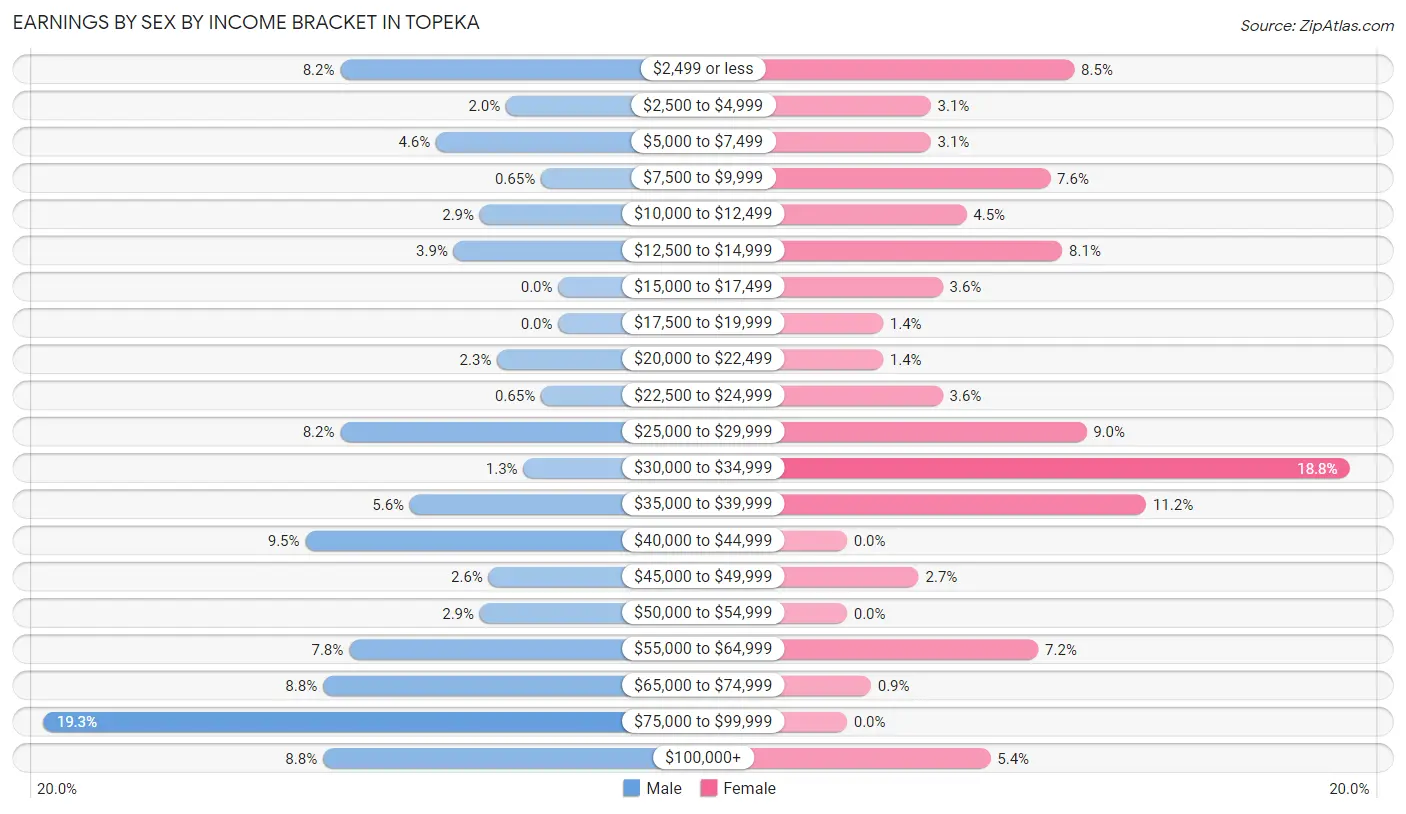
Earnings by Sex by Income Bracket in Topeka
The most common earnings brackets in Topeka are $75,000 to $99,999 for men (59 | 19.3%) and $30,000 to $34,999 for women (42 | 18.8%).
| Income | Male | Female |
| $2,499 or less | 25 (8.2%) | 19 (8.5%) |
| $2,500 to $4,999 | 6 (2.0%) | 7 (3.1%) |
| $5,000 to $7,499 | 14 (4.6%) | 7 (3.1%) |
| $7,500 to $9,999 | 2 (0.6%) | 17 (7.6%) |
| $10,000 to $12,499 | 9 (2.9%) | 10 (4.5%) |
| $12,500 to $14,999 | 12 (3.9%) | 18 (8.1%) |
| $15,000 to $17,499 | 0 (0.0%) | 8 (3.6%) |
| $17,500 to $19,999 | 0 (0.0%) | 3 (1.3%) |
| $20,000 to $22,499 | 7 (2.3%) | 3 (1.3%) |
| $22,500 to $24,999 | 2 (0.6%) | 8 (3.6%) |
| $25,000 to $29,999 | 25 (8.2%) | 20 (9.0%) |
| $30,000 to $34,999 | 4 (1.3%) | 42 (18.8%) |
| $35,000 to $39,999 | 17 (5.6%) | 25 (11.2%) |
| $40,000 to $44,999 | 29 (9.5%) | 0 (0.0%) |
| $45,000 to $49,999 | 8 (2.6%) | 6 (2.7%) |
| $50,000 to $54,999 | 9 (2.9%) | 0 (0.0%) |
| $55,000 to $64,999 | 24 (7.8%) | 16 (7.2%) |
| $65,000 to $74,999 | 27 (8.8%) | 2 (0.9%) |
| $75,000 to $99,999 | 59 (19.3%) | 0 (0.0%) |
| $100,000+ | 27 (8.8%) | 12 (5.4%) |
| Total | 306 (100.0%) | 223 (100.0%) |
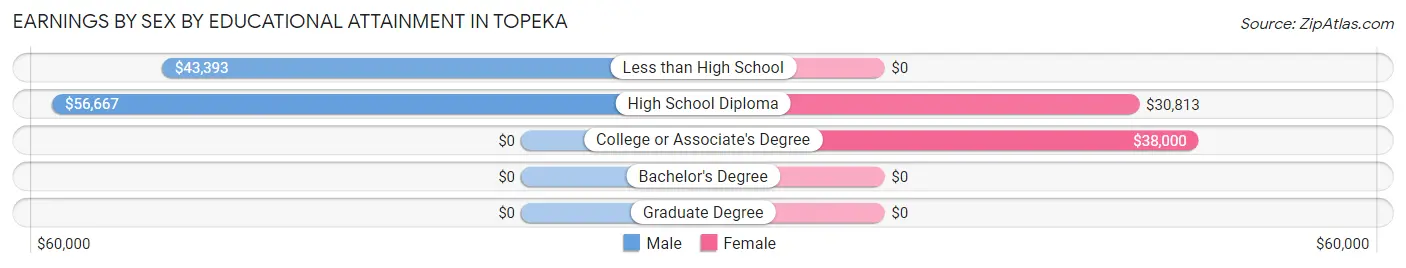
Earnings by Sex by Educational Attainment in Topeka
Average earnings in Topeka are $51,806 for men and $30,586 for women, a difference of 41.0%. Men with an educational attainment of high school diploma enjoy the highest average annual earnings of $56,667, while those with less than high school education earn the least with $43,393. Women with an educational attainment of college or associate's degree earn the most with the average annual earnings of $38,000, while those with high school diploma education have the smallest earnings of $30,813.
| Educational Attainment | Male Income | Female Income |
| Less than High School | $43,393 | $0 |
| High School Diploma | $56,667 | $30,813 |
| College or Associate's Degree | - | - |
| Bachelor's Degree | - | - |
| Graduate Degree | - | - |
| Total | $51,806 | $30,586 |
Family Income in Topeka
Family Income Brackets in Topeka
According to the Topeka family income data, there are 70 families falling into the $75,000 to $99,999 income range, which is the most common income bracket and makes up 27.1% of all families.
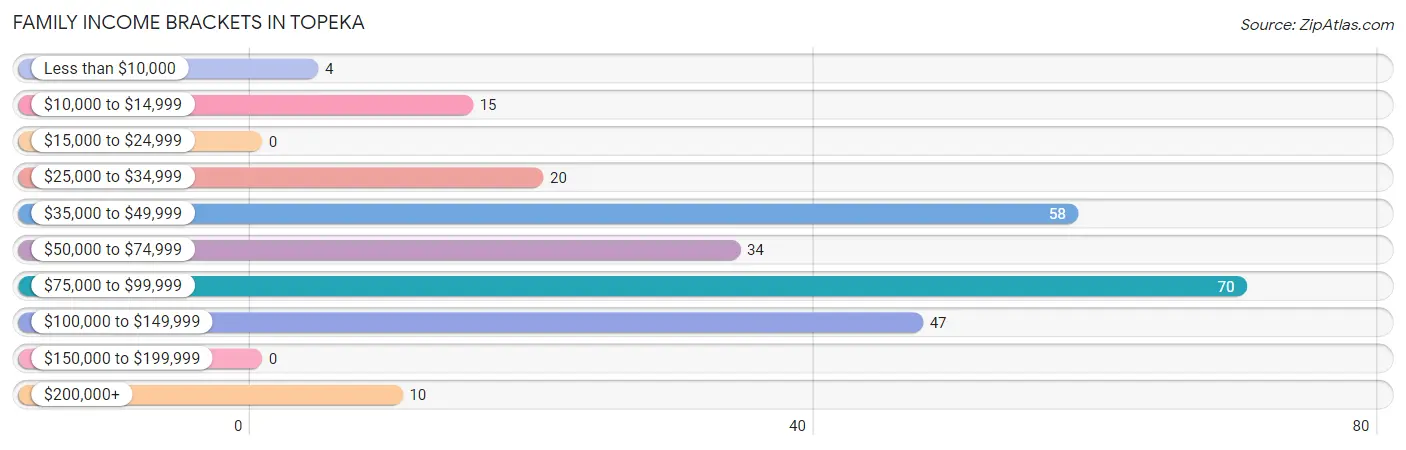
| Income Bracket | # Families | % Families |
| Less than $10,000 | 4 | 1.6% |
| $10,000 to $14,999 | 15 | 5.8% |
| $15,000 to $24,999 | 0 | 0.0% |
| $25,000 to $34,999 | 20 | 7.8% |
| $35,000 to $49,999 | 58 | 22.5% |
| $50,000 to $74,999 | 34 | 13.2% |
| $75,000 to $99,999 | 70 | 27.1% |
| $100,000 to $149,999 | 47 | 18.2% |
| $150,000 to $199,999 | 0 | 0.0% |
| $200,000+ | 10 | 3.9% |
Family Income by Famaliy Size in Topeka
5-person families (27 | 10.5%) account for the highest median family income in Topeka with $103,750 per family, while 5-person families (27 | 10.5%) have the highest median income of $20,750 per family member.
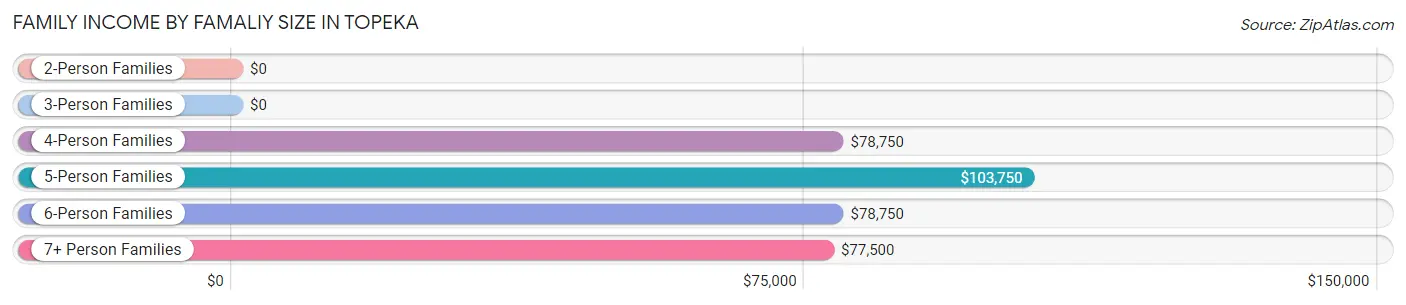
| Income Bracket | # Families | Median Income |
| 2-Person Families | 109 (42.2%) | $0 |
| 3-Person Families | 32 (12.4%) | $0 |
| 4-Person Families | 42 (16.3%) | $78,750 |
| 5-Person Families | 27 (10.5%) | $103,750 |
| 6-Person Families | 32 (12.4%) | $78,750 |
| 7+ Person Families | 16 (6.2%) | $77,500 |
| Total | 258 (100.0%) | $70,833 |
Family Income by Number of Earners in Topeka
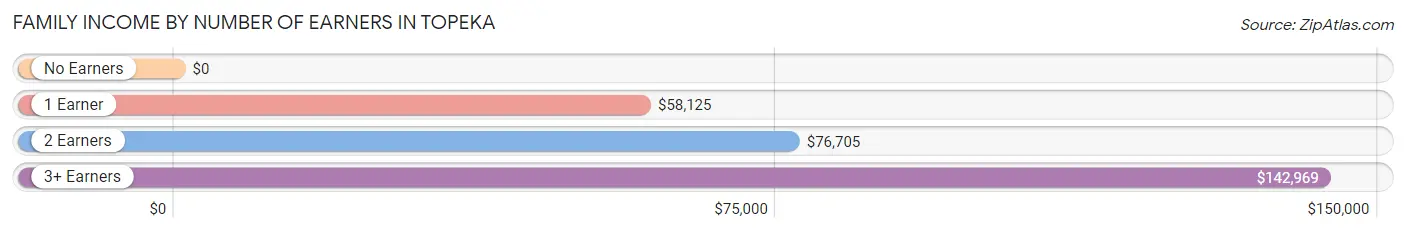
| Number of Earners | # Families | Median Income |
| No Earners | 26 (10.1%) | $0 |
| 1 Earner | 100 (38.8%) | $58,125 |
| 2 Earners | 107 (41.5%) | $76,705 |
| 3+ Earners | 25 (9.7%) | $142,969 |
| Total | 258 (100.0%) | $70,833 |
Household Income in Topeka
Household Income Brackets in Topeka
With 83 households falling in the category, the $75,000 to $99,999 income range is the most frequent in Topeka, accounting for 21.7% of all households.
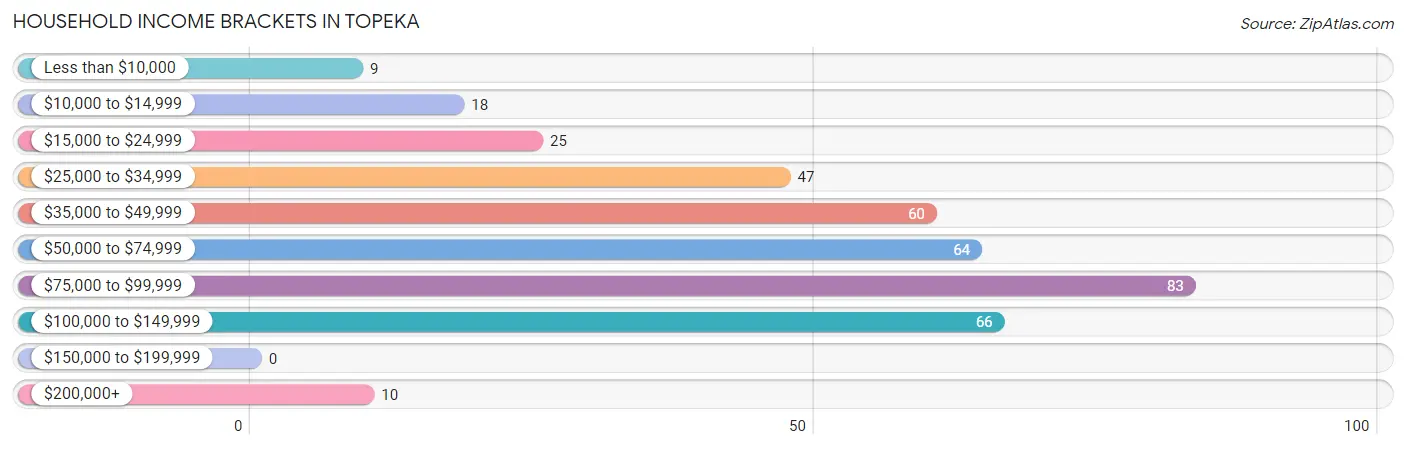
| Income Bracket | # Households | % Households |
| Less than $10,000 | 9 | 2.4% |
| $10,000 to $14,999 | 18 | 4.7% |
| $15,000 to $24,999 | 25 | 6.5% |
| $25,000 to $34,999 | 47 | 12.3% |
| $35,000 to $49,999 | 60 | 15.7% |
| $50,000 to $74,999 | 64 | 16.8% |
| $75,000 to $99,999 | 83 | 21.7% |
| $100,000 to $149,999 | 66 | 17.3% |
| $150,000 to $199,999 | 0 | 0.0% |
| $200,000+ | 10 | 2.6% |
Household Income by Householder Age in Topeka
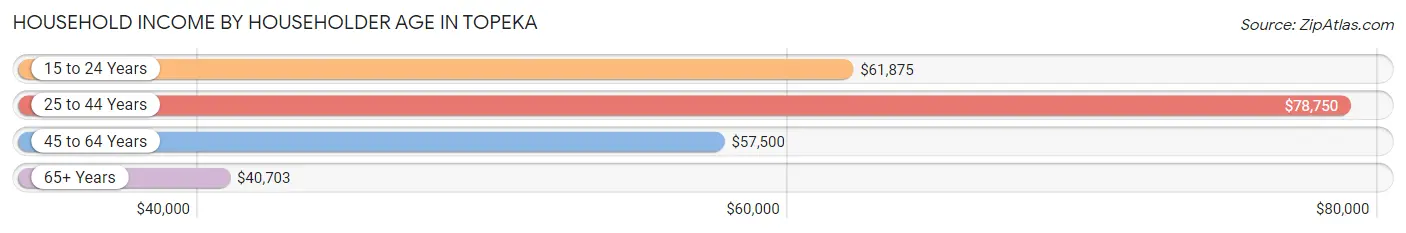
The median household income in Topeka is $59,559, with the highest median household income of $78,750 found in the 25 to 44 years age bracket for the primary householder. A total of 148 households (38.7%) fall into this category. Meanwhile, the 65+ years age bracket for the primary householder has the lowest median household income of $40,703, with 95 households (24.9%) in this group.
| Income Bracket | # Households | Median Income |
| 15 to 24 Years | 23 (6.0%) | $61,875 |
| 25 to 44 Years | 148 (38.7%) | $78,750 |
| 45 to 64 Years | 116 (30.4%) | $57,500 |
| 65+ Years | 95 (24.9%) | $40,703 |
| Total | 382 (100.0%) | $59,559 |
Poverty in Topeka
Income Below Poverty by Sex and Age in Topeka
With 3.8% poverty level for males and 11.3% for females among the residents of Topeka, 16 and 17 year old males and 55 to 64 year old females are the most vulnerable to poverty, with 3 males (25.0%) and 25 females (23.6%) in their respective age groups living below the poverty level.
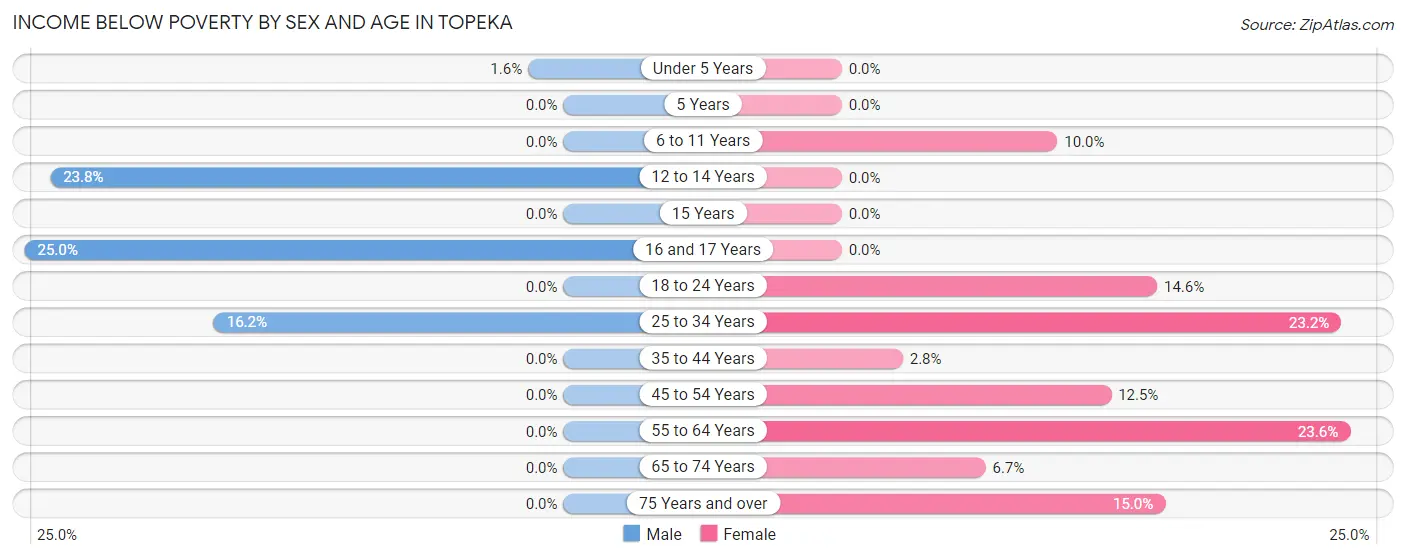
| Age Bracket | Male | Female |
| Under 5 Years | 1 (1.6%) | 0 (0.0%) |
| 5 Years | 0 (0.0%) | 0 (0.0%) |
| 6 to 11 Years | 0 (0.0%) | 6 (10.0%) |
| 12 to 14 Years | 5 (23.8%) | 0 (0.0%) |
| 15 Years | 0 (0.0%) | 0 (0.0%) |
| 16 and 17 Years | 3 (25.0%) | 0 (0.0%) |
| 18 to 24 Years | 0 (0.0%) | 6 (14.6%) |
| 25 to 34 Years | 12 (16.2%) | 19 (23.2%) |
| 35 to 44 Years | 0 (0.0%) | 3 (2.8%) |
| 45 to 54 Years | 0 (0.0%) | 1 (12.5%) |
| 55 to 64 Years | 0 (0.0%) | 25 (23.6%) |
| 65 to 74 Years | 0 (0.0%) | 3 (6.7%) |
| 75 Years and over | 0 (0.0%) | 3 (15.0%) |
| Total | 21 (3.8%) | 66 (11.3%) |
Income Above Poverty by Sex and Age in Topeka
According to the poverty statistics in Topeka, males aged 5 years and females aged under 5 years are the age groups that are most secure financially, with 100.0% of males and 100.0% of females in these age groups living above the poverty line.
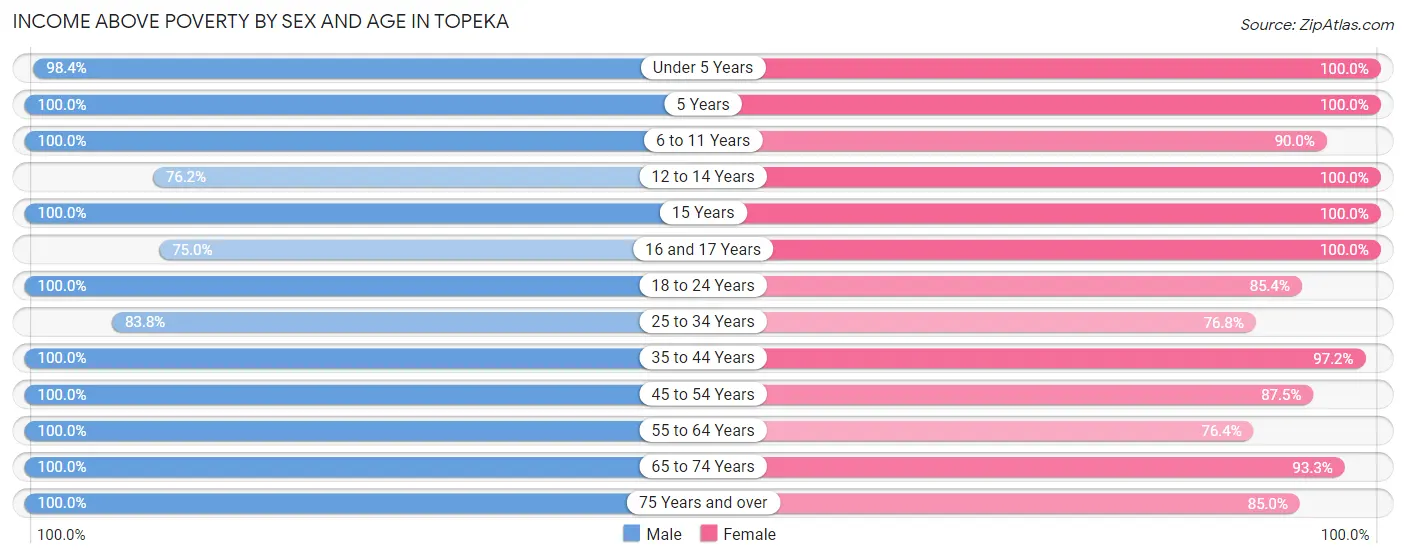
| Age Bracket | Male | Female |
| Under 5 Years | 60 (98.4%) | 45 (100.0%) |
| 5 Years | 5 (100.0%) | 10 (100.0%) |
| 6 to 11 Years | 69 (100.0%) | 54 (90.0%) |
| 12 to 14 Years | 16 (76.2%) | 27 (100.0%) |
| 15 Years | 19 (100.0%) | 12 (100.0%) |
| 16 and 17 Years | 9 (75.0%) | 21 (100.0%) |
| 18 to 24 Years | 41 (100.0%) | 35 (85.4%) |
| 25 to 34 Years | 62 (83.8%) | 63 (76.8%) |
| 35 to 44 Years | 93 (100.0%) | 103 (97.2%) |
| 45 to 54 Years | 25 (100.0%) | 7 (87.5%) |
| 55 to 64 Years | 75 (100.0%) | 81 (76.4%) |
| 65 to 74 Years | 49 (100.0%) | 42 (93.3%) |
| 75 Years and over | 5 (100.0%) | 17 (85.0%) |
| Total | 528 (96.2%) | 517 (88.7%) |
Income Below Poverty Among Married-Couple Families in Topeka
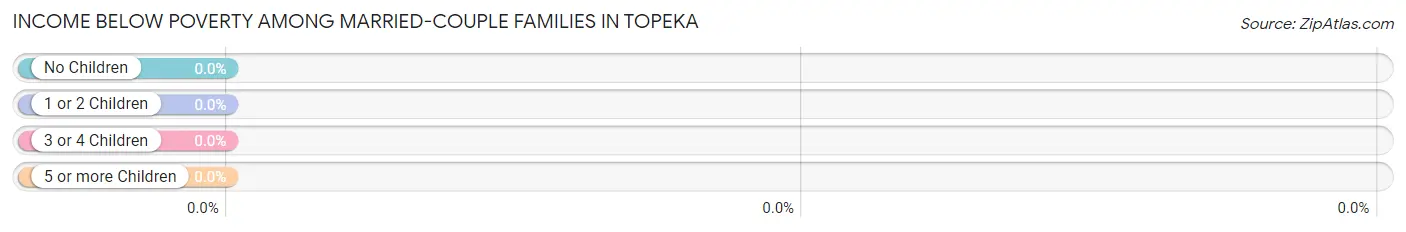
| Children | Above Poverty | Below Poverty |
| No Children | 71 (100.0%) | 0 (0.0%) |
| 1 or 2 Children | 28 (100.0%) | 0 (0.0%) |
| 3 or 4 Children | 44 (100.0%) | 0 (0.0%) |
| 5 or more Children | 16 (100.0%) | 0 (0.0%) |
| Total | 159 (100.0%) | 0 (0.0%) |
Income Below Poverty Among Single-Parent Households in Topeka
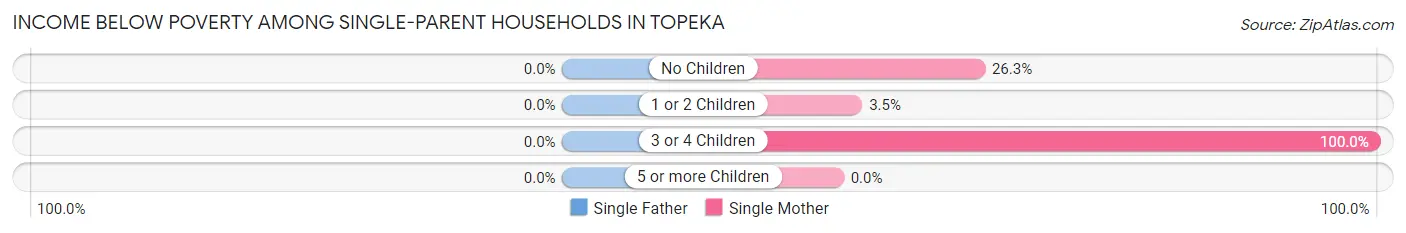
| Children | Single Father | Single Mother |
| No Children | 0 (0.0%) | 15 (26.3%) |
| 1 or 2 Children | 0 (0.0%) | 1 (3.5%) |
| 3 or 4 Children | 0 (0.0%) | 4 (100.0%) |
| 5 or more Children | 0 (0.0%) | 0 (0.0%) |
| Total | 0 (0.0%) | 20 (22.2%) |
Income Below Poverty Among Married-Couple vs Single-Parent Households in Topeka
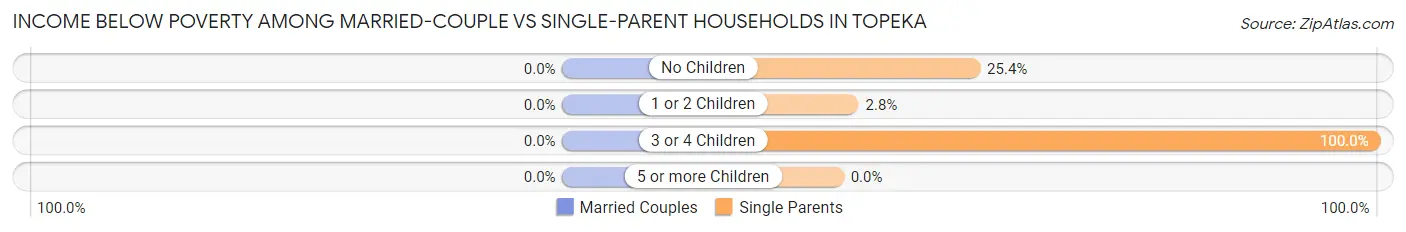
| Children | Married-Couple Families | Single-Parent Households |
| No Children | 0 (0.0%) | 15 (25.4%) |
| 1 or 2 Children | 0 (0.0%) | 1 (2.8%) |
| 3 or 4 Children | 0 (0.0%) | 4 (100.0%) |
| 5 or more Children | 0 (0.0%) | 0 (0.0%) |
| Total | 0 (0.0%) | 20 (20.2%) |
Race in Topeka
The most populous races in Topeka are White / Caucasian (972 | 85.9%), Two or more Races (151 | 13.3%), and Hispanic or Latino (11 | 1.0%).
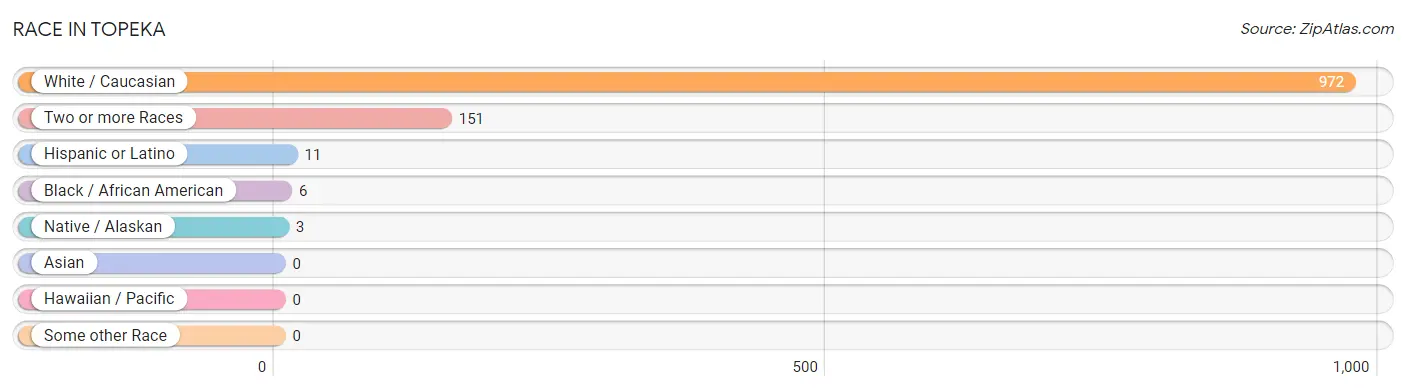
| Race | # Population | % Population |
| Asian | 0 | 0.0% |
| Black / African American | 6 | 0.5% |
| Hawaiian / Pacific | 0 | 0.0% |
| Hispanic or Latino | 11 | 1.0% |
| Native / Alaskan | 3 | 0.3% |
| White / Caucasian | 972 | 85.9% |
| Two or more Races | 151 | 13.3% |
| Some other Race | 0 | 0.0% |
| Total | 1,132 | 100.0% |
Ancestry in Topeka
The most populous ancestries reported in Topeka are German (368 | 32.5%), Arab (187 | 16.5%), European (137 | 12.1%), English (122 | 10.8%), and Irish (119 | 10.5%), together accounting for 82.4% of all Topeka residents.
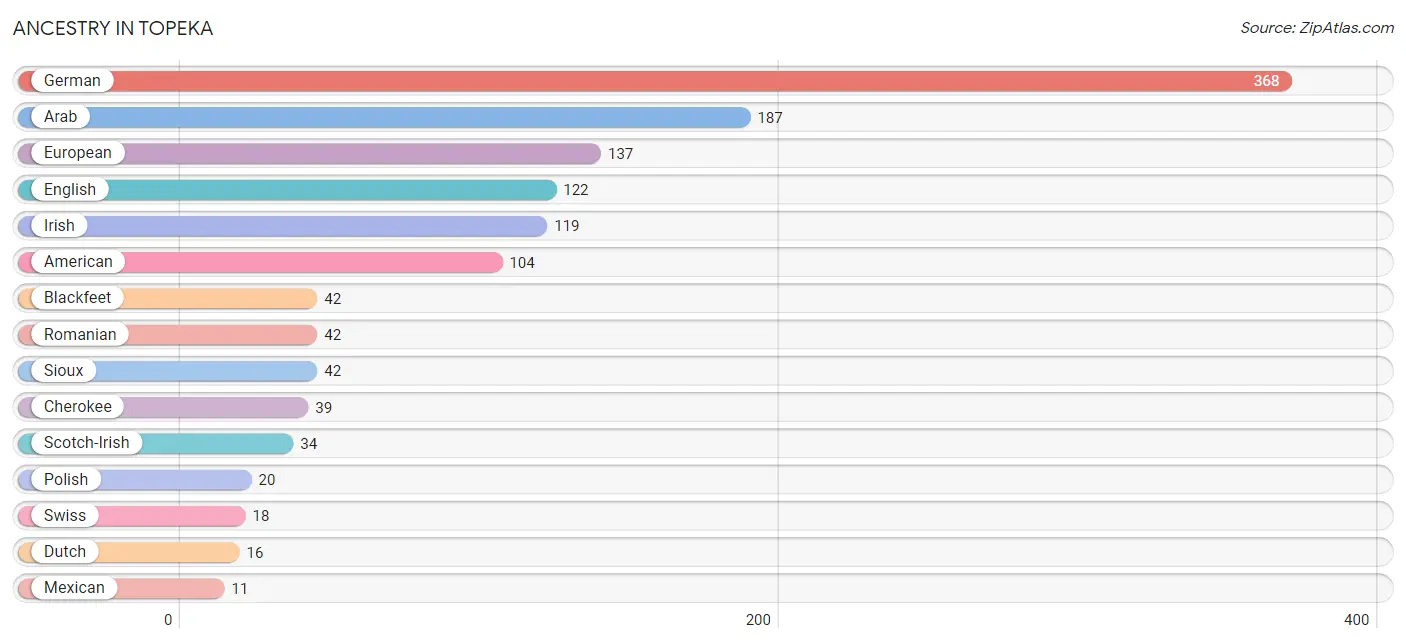
| Ancestry | # Population | % Population |
| American | 104 | 9.2% |
| Arab | 187 | 16.5% |
| Blackfeet | 42 | 3.7% |
| Cherokee | 39 | 3.5% |
| Chippewa | 1 | 0.1% |
| Dutch | 16 | 1.4% |
| English | 122 | 10.8% |
| European | 137 | 12.1% |
| Finnish | 10 | 0.9% |
| French | 3 | 0.3% |
| German | 368 | 32.5% |
| Irish | 119 | 10.5% |
| Mexican | 11 | 1.0% |
| Navajo | 2 | 0.2% |
| Pennsylvania German | 6 | 0.5% |
| Polish | 20 | 1.8% |
| Romanian | 42 | 3.7% |
| Scotch-Irish | 34 | 3.0% |
| Sioux | 42 | 3.7% |
| Swedish | 11 | 1.0% |
| Swiss | 18 | 1.6% | View All 21 Rows |
Immigrants in Topeka
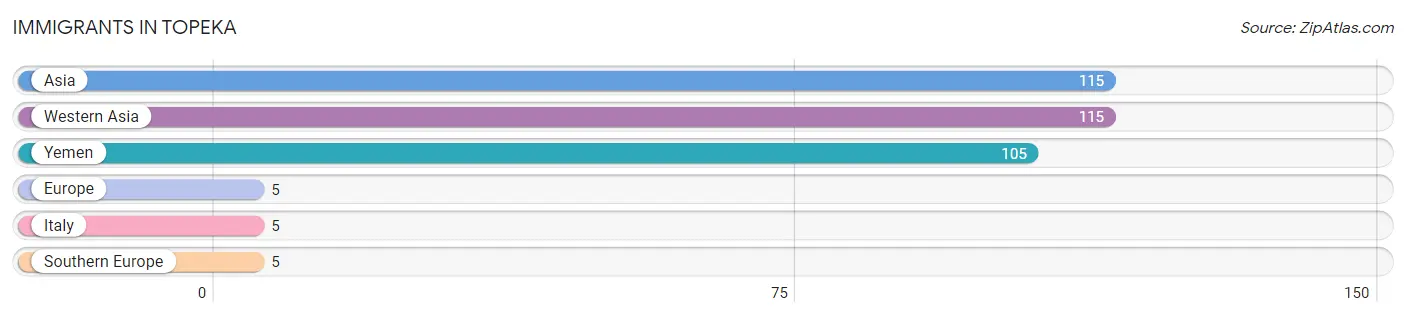
The most numerous immigrant groups reported in Topeka came from Asia (115 | 10.2%), Western Asia (115 | 10.2%), Yemen (105 | 9.3%), Europe (5 | 0.4%), and Italy (5 | 0.4%), together accounting for 30.5% of all Topeka residents.
| Immigration Origin | # Population | % Population |
| Asia | 115 | 10.2% |
| Europe | 5 | 0.4% |
| Italy | 5 | 0.4% |
| Southern Europe | 5 | 0.4% |
| Western Asia | 115 | 10.2% |
| Yemen | 105 | 9.3% | View All 6 Rows |
Sex and Age in Topeka
Sex and Age in Topeka
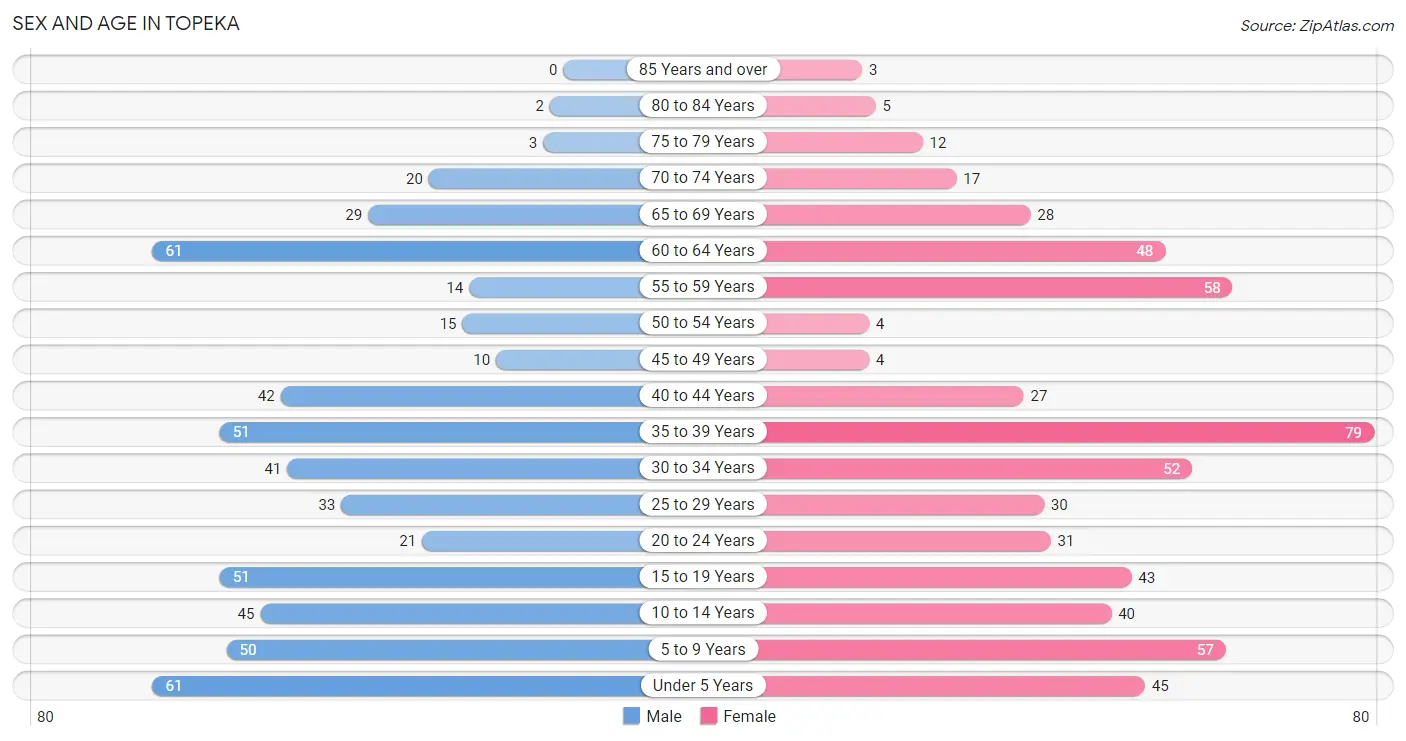
The most populous age groups in Topeka are Under 5 Years (61 | 11.1%) for men and 35 to 39 Years (79 | 13.6%) for women.
| Age Bracket | Male | Female |
| Under 5 Years | 61 (11.1%) | 45 (7.7%) |
| 5 to 9 Years | 50 (9.1%) | 57 (9.8%) |
| 10 to 14 Years | 45 (8.2%) | 40 (6.9%) |
| 15 to 19 Years | 51 (9.3%) | 43 (7.4%) |
| 20 to 24 Years | 21 (3.8%) | 31 (5.3%) |
| 25 to 29 Years | 33 (6.0%) | 30 (5.1%) |
| 30 to 34 Years | 41 (7.5%) | 52 (8.9%) |
| 35 to 39 Years | 51 (9.3%) | 79 (13.6%) |
| 40 to 44 Years | 42 (7.6%) | 27 (4.6%) |
| 45 to 49 Years | 10 (1.8%) | 4 (0.7%) |
| 50 to 54 Years | 15 (2.7%) | 4 (0.7%) |
| 55 to 59 Years | 14 (2.5%) | 58 (10.0%) |
| 60 to 64 Years | 61 (11.1%) | 48 (8.2%) |
| 65 to 69 Years | 29 (5.3%) | 28 (4.8%) |
| 70 to 74 Years | 20 (3.6%) | 17 (2.9%) |
| 75 to 79 Years | 3 (0.5%) | 12 (2.1%) |
| 80 to 84 Years | 2 (0.4%) | 5 (0.9%) |
| 85 Years and over | 0 (0.0%) | 3 (0.5%) |
| Total | 549 (100.0%) | 583 (100.0%) |
Families and Households in Topeka
Median Family Size in Topeka
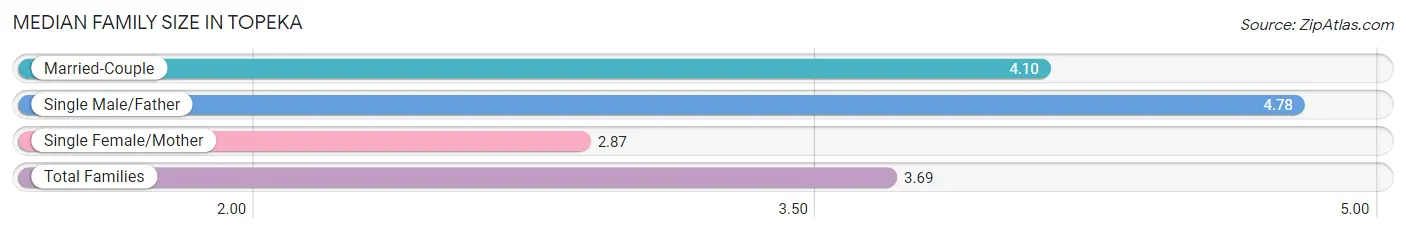
The median family size in Topeka is 3.69 persons per family, with single male/father families (9 | 3.5%) accounting for the largest median family size of 4.78 persons per family. On the other hand, single female/mother families (90 | 34.9%) represent the smallest median family size with 2.87 persons per family.
| Family Type | # Families | Family Size |
| Married-Couple | 159 (61.6%) | 4.10 |
| Single Male/Father | 9 (3.5%) | 4.78 |
| Single Female/Mother | 90 (34.9%) | 2.87 |
| Total Families | 258 (100.0%) | 3.69 |
Median Household Size in Topeka
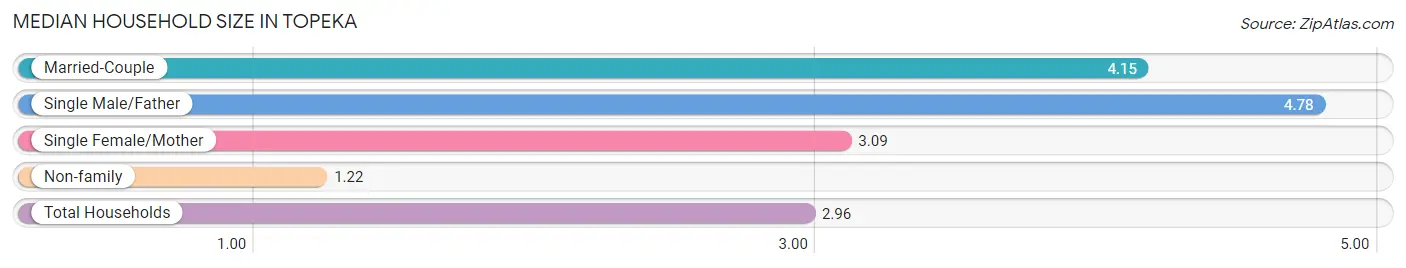
The median household size in Topeka is 2.96 persons per household, with single male/father households (9 | 2.4%) accounting for the largest median household size of 4.78 persons per household. non-family households (124 | 32.5%) represent the smallest median household size with 1.22 persons per household.
| Household Type | # Households | Household Size |
| Married-Couple | 159 (41.6%) | 4.15 |
| Single Male/Father | 9 (2.4%) | 4.78 |
| Single Female/Mother | 90 (23.6%) | 3.09 |
| Non-family | 124 (32.5%) | 1.22 |
| Total Households | 382 (100.0%) | 2.96 |
Household Size by Marriage Status in Topeka
Out of a total of 382 households in Topeka, 258 (67.5%) are family households, while 124 (32.5%) are nonfamily households. The most numerous type of family households are 2-person households, comprising 89, and the most common type of nonfamily households are 1-person households, comprising 103.
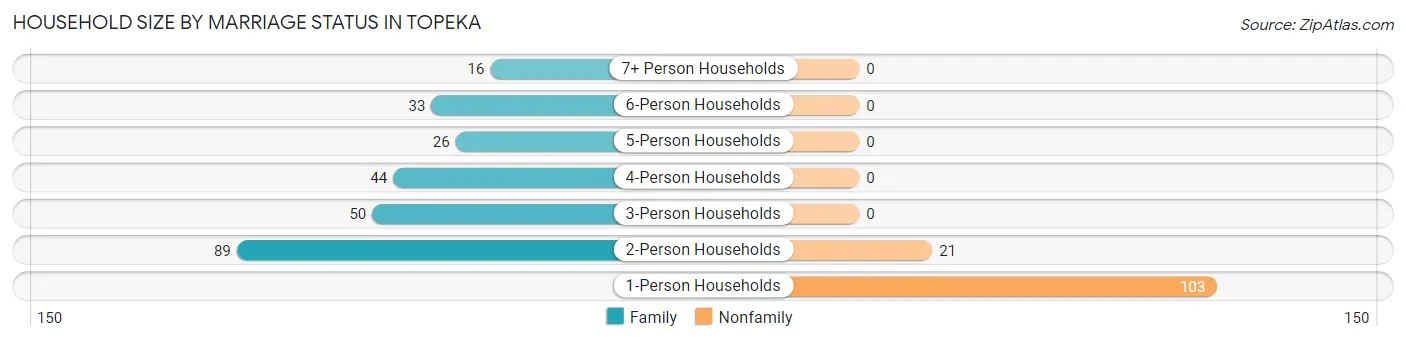
| Household Size | Family Households | Nonfamily Households |
| 1-Person Households | - | 103 (27.0%) |
| 2-Person Households | 89 (23.3%) | 21 (5.5%) |
| 3-Person Households | 50 (13.1%) | 0 (0.0%) |
| 4-Person Households | 44 (11.5%) | 0 (0.0%) |
| 5-Person Households | 26 (6.8%) | 0 (0.0%) |
| 6-Person Households | 33 (8.6%) | 0 (0.0%) |
| 7+ Person Households | 16 (4.2%) | 0 (0.0%) |
| Total | 258 (67.5%) | 124 (32.5%) |
Female Fertility in Topeka
Fertility by Age in Topeka
Average fertility rate in Topeka is 83.0 births per 1,000 women. Women in the age bracket of 20 to 34 years have the highest fertility rate with 195.0 births per 1,000 women. Women in the age bracket of 20 to 34 years acount for 100.0% of all women with births.
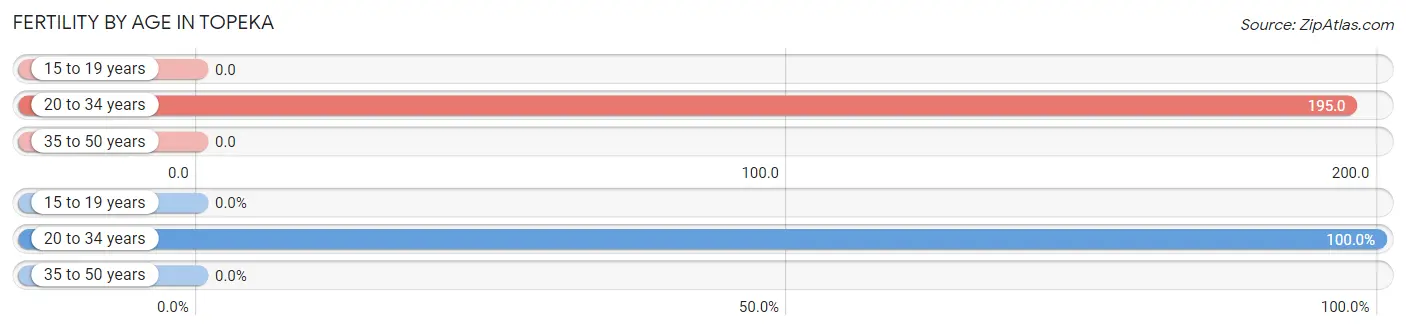
| Age Bracket | Women with Births | Births / 1,000 Women |
| 15 to 19 years | 0 (0.0%) | 0.0 |
| 20 to 34 years | 22 (100.0%) | 195.0 |
| 35 to 50 years | 0 (0.0%) | 0.0 |
| Total | 22 (100.0%) | 83.0 |
Fertility by Age by Marriage Status in Topeka
77.3% of women with births (22) in Topeka are married. The highest percentage of unmarried women with births falls into 20 to 34 years age bracket with 22.7% of them unmarried at the time of birth, while the lowest percentage of unmarried women with births belong to 20 to 34 years age bracket with 22.7% of them unmarried.
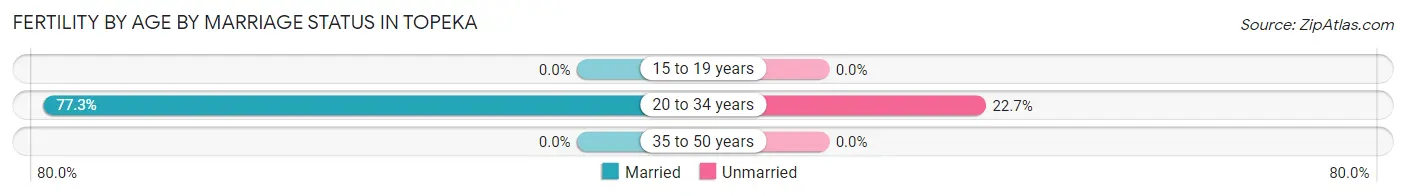
| Age Bracket | Married | Unmarried |
| 15 to 19 years | 0 (0.0%) | 0 (0.0%) |
| 20 to 34 years | 17 (77.3%) | 5 (22.7%) |
| 35 to 50 years | 0 (0.0%) | 0 (0.0%) |
| Total | 17 (77.3%) | 5 (22.7%) |
Fertility by Education in Topeka
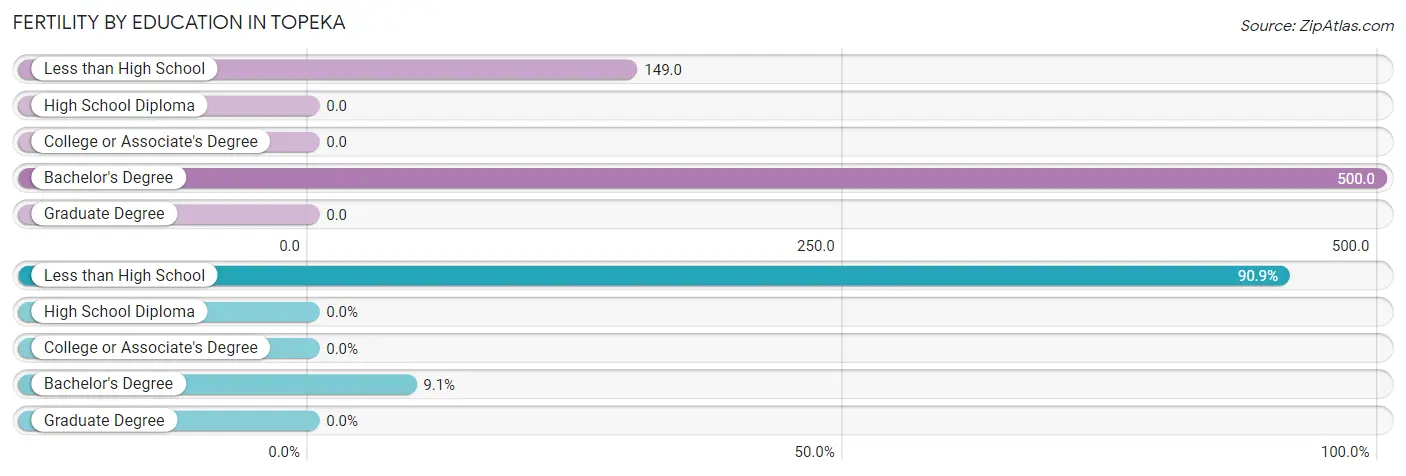
| Educational Attainment | Women with Births | Births / 1,000 Women |
| Less than High School | 20 (90.9%) | 149.0 |
| High School Diploma | 0 (0.0%) | 0.0 |
| College or Associate's Degree | 0 (0.0%) | 0.0 |
| Bachelor's Degree | 2 (9.1%) | 500.0 |
| Graduate Degree | 0 (0.0%) | 0.0 |
| Total | 22 (100.0%) | 83.0 |
Fertility by Education by Marriage Status in Topeka
22.7% of women with births in Topeka are unmarried. Women with the educational attainment of bachelor's degree are most likely to be married with 100.0% of them married at childbirth, while women with the educational attainment of less than high school are least likely to be married with 25.0% of them unmarried at childbirth.
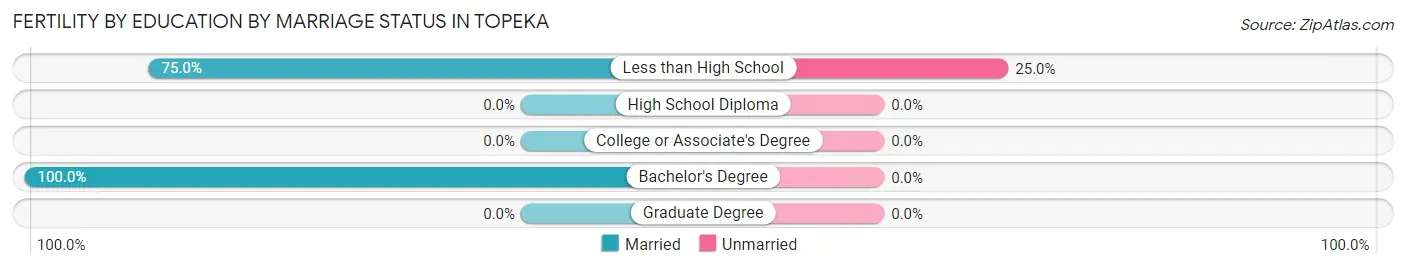
| Educational Attainment | Married | Unmarried |
| Less than High School | 15 (75.0%) | 5 (25.0%) |
| High School Diploma | 0 (0.0%) | 0 (0.0%) |
| College or Associate's Degree | 0 (0.0%) | 0 (0.0%) |
| Bachelor's Degree | 2 (100.0%) | 0 (0.0%) |
| Graduate Degree | 0 (0.0%) | 0 (0.0%) |
| Total | 17 (77.3%) | 5 (22.7%) |
Employment Characteristics in Topeka
Employment by Class of Employer in Topeka
Among the 457 employed individuals in Topeka, private company employees (397 | 86.9%), local government employees (18 | 3.9%), and not-for-profit organizations (16 | 3.5%) make up the most common classes of employment.
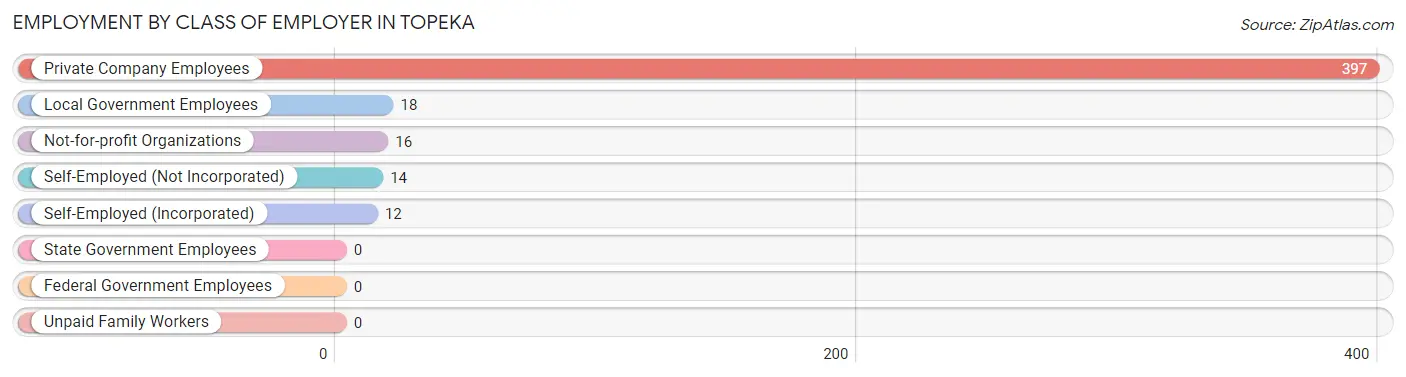
| Employer Class | # Employees | % Employees |
| Private Company Employees | 397 | 86.9% |
| Self-Employed (Incorporated) | 12 | 2.6% |
| Self-Employed (Not Incorporated) | 14 | 3.1% |
| Not-for-profit Organizations | 16 | 3.5% |
| Local Government Employees | 18 | 3.9% |
| State Government Employees | 0 | 0.0% |
| Federal Government Employees | 0 | 0.0% |
| Unpaid Family Workers | 0 | 0.0% |
| Total | 457 | 100.0% |
Employment Status by Age in Topeka
According to the labor force statistics for Topeka, out of the total population over 16 years of age (803), 60.8% or 488 individuals are in the labor force, with 6.4% or 31 of them unemployed. The age group with the highest labor force participation rate is 25 to 29 years, with 84.1% or 53 individuals in the labor force. Within the labor force, the 16 to 19 years age range has the highest percentage of unemployed individuals, with 28.6% or 14 of them being unemployed.
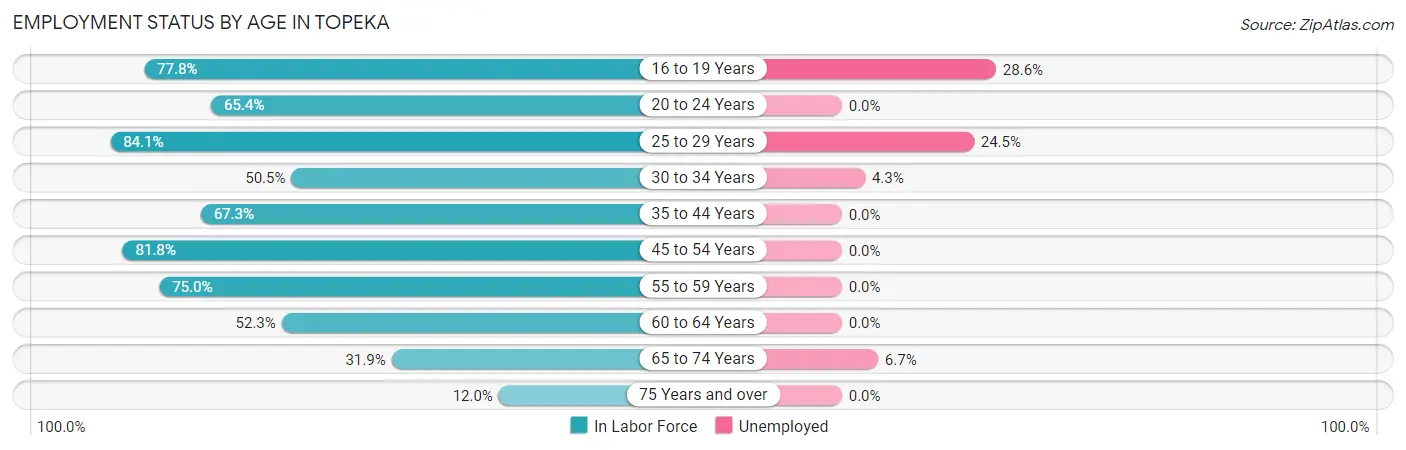
| Age Bracket | In Labor Force | Unemployed |
| 16 to 19 Years | 49 (77.8%) | 14 (28.6%) |
| 20 to 24 Years | 34 (65.4%) | 0 (0.0%) |
| 25 to 29 Years | 53 (84.1%) | 13 (24.5%) |
| 30 to 34 Years | 47 (50.5%) | 2 (4.3%) |
| 35 to 44 Years | 134 (67.3%) | 0 (0.0%) |
| 45 to 54 Years | 27 (81.8%) | 0 (0.0%) |
| 55 to 59 Years | 54 (75.0%) | 0 (0.0%) |
| 60 to 64 Years | 57 (52.3%) | 0 (0.0%) |
| 65 to 74 Years | 30 (31.9%) | 2 (6.7%) |
| 75 Years and over | 3 (12.0%) | 0 (0.0%) |
| Total | 488 (60.8%) | 31 (6.4%) |
Employment Status by Educational Attainment in Topeka
According to labor force statistics for Topeka, 65.4% of individuals (372) out of the total population between 25 and 64 years of age (569) are in the labor force, with 4.0% or 15 of them being unemployed. The group with the highest labor force participation rate are those with the educational attainment of bachelor's degree or higher, with 78.3% or 18 individuals in the labor force. Within the labor force, individuals with less than high school education have the highest percentage of unemployment, with 10.2% or 13 of them being unemployed.
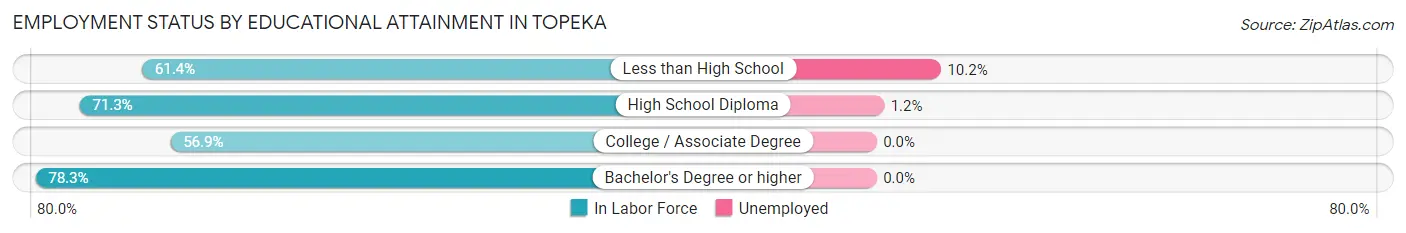
| Educational Attainment | In Labor Force | Unemployed |
| Less than High School | 127 (61.4%) | 21 (10.2%) |
| High School Diploma | 169 (71.3%) | 3 (1.2%) |
| College / Associate Degree | 58 (56.9%) | 0 (0.0%) |
| Bachelor's Degree or higher | 18 (78.3%) | 0 (0.0%) |
| Total | 372 (65.4%) | 23 (4.0%) |
Employment Occupations by Sex in Topeka
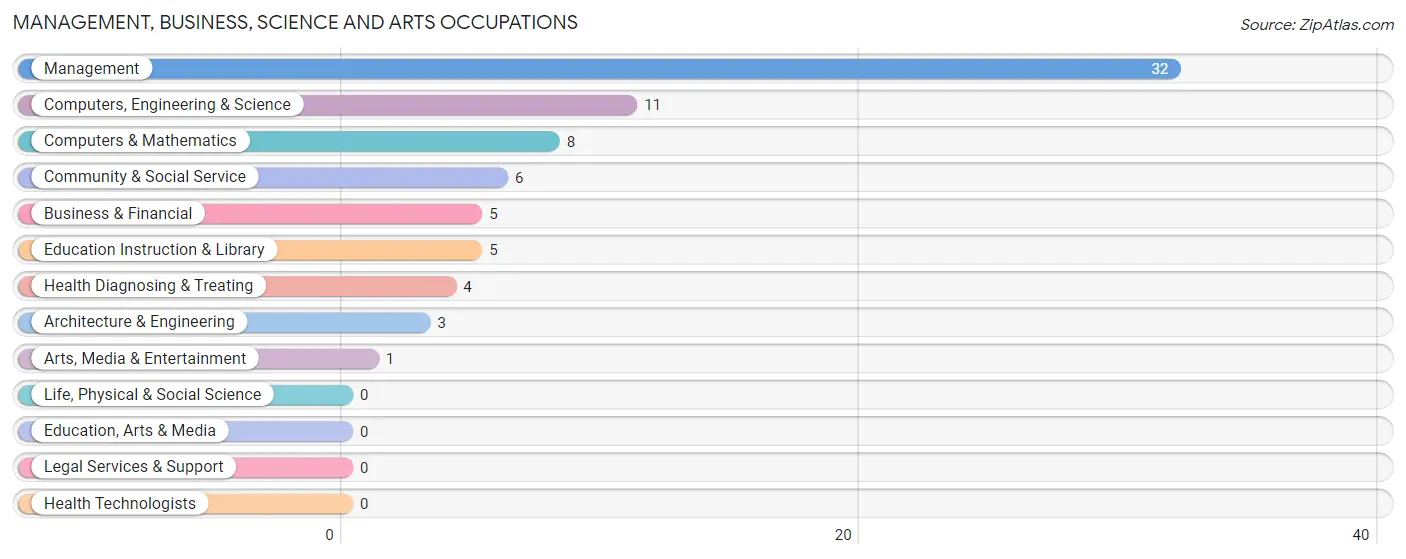
Management, Business, Science and Arts Occupations
The most common Management, Business, Science and Arts occupations in Topeka are Management (32 | 7.0%), Computers, Engineering & Science (11 | 2.4%), Computers & Mathematics (8 | 1.8%), Community & Social Service (6 | 1.3%), and Business & Financial (5 | 1.1%).
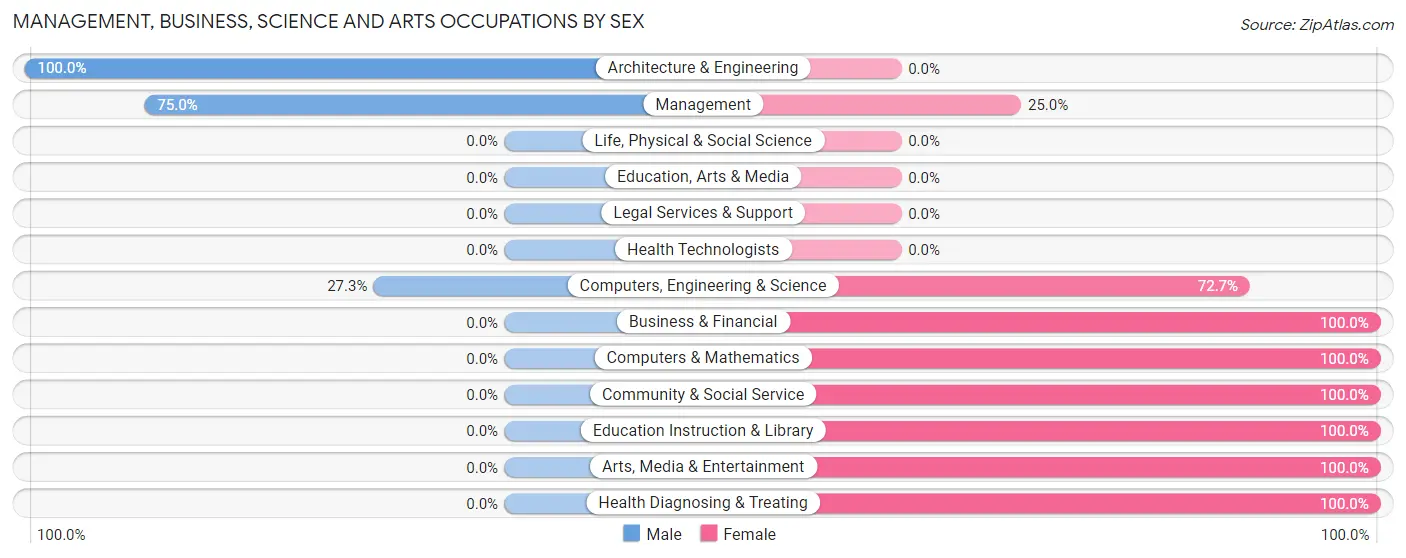
Management, Business, Science and Arts Occupations by Sex
Within the Management, Business, Science and Arts occupations in Topeka, the most male-oriented occupations are Architecture & Engineering (100.0%), Management (75.0%), and Computers, Engineering & Science (27.3%), while the most female-oriented occupations are Business & Financial (100.0%), Computers & Mathematics (100.0%), and Community & Social Service (100.0%).
| Occupation | Male | Female |
| Management | 24 (75.0%) | 8 (25.0%) |
| Business & Financial | 0 (0.0%) | 5 (100.0%) |
| Computers, Engineering & Science | 3 (27.3%) | 8 (72.7%) |
| Computers & Mathematics | 0 (0.0%) | 8 (100.0%) |
| Architecture & Engineering | 3 (100.0%) | 0 (0.0%) |
| Life, Physical & Social Science | 0 (0.0%) | 0 (0.0%) |
| Community & Social Service | 0 (0.0%) | 6 (100.0%) |
| Education, Arts & Media | 0 (0.0%) | 0 (0.0%) |
| Legal Services & Support | 0 (0.0%) | 0 (0.0%) |
| Education Instruction & Library | 0 (0.0%) | 5 (100.0%) |
| Arts, Media & Entertainment | 0 (0.0%) | 1 (100.0%) |
| Health Diagnosing & Treating | 0 (0.0%) | 4 (100.0%) |
| Health Technologists | 0 (0.0%) | 0 (0.0%) |
| Total (Category) | 27 (46.6%) | 31 (53.4%) |
| Total (Overall) | 265 (58.0%) | 192 (42.0%) |
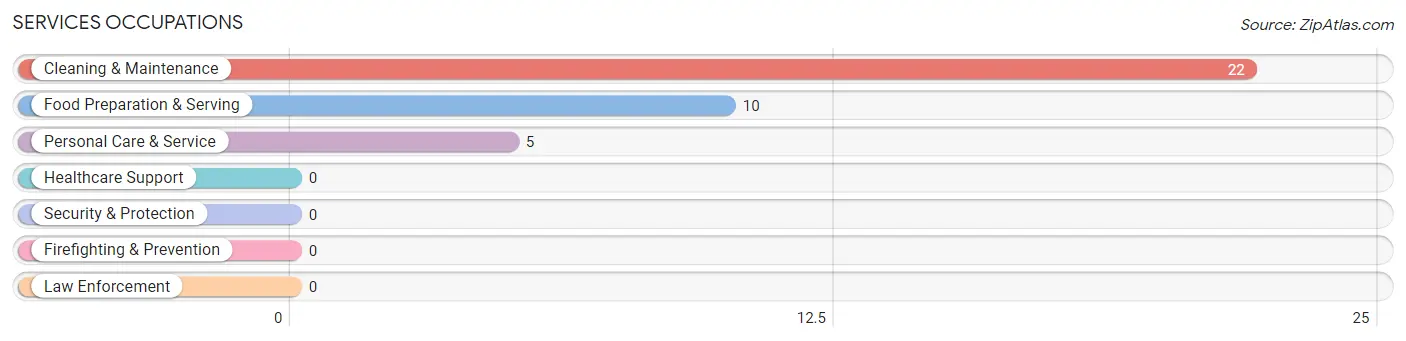
Services Occupations
The most common Services occupations in Topeka are Cleaning & Maintenance (22 | 4.8%), Food Preparation & Serving (10 | 2.2%), and Personal Care & Service (5 | 1.1%).
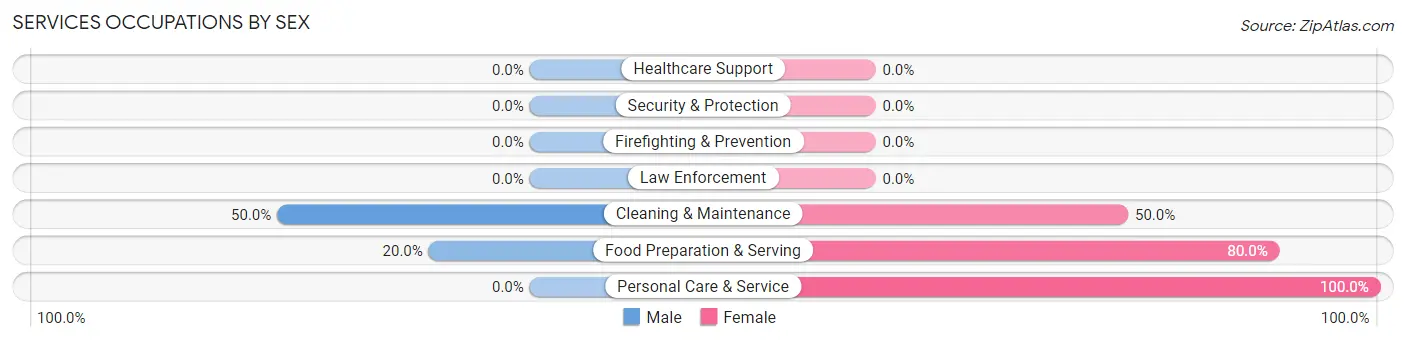
Services Occupations by Sex
Within the Services occupations in Topeka, the most male-oriented occupations are Cleaning & Maintenance (50.0%), and Food Preparation & Serving (20.0%), while the most female-oriented occupations are Personal Care & Service (100.0%), Food Preparation & Serving (80.0%), and Cleaning & Maintenance (50.0%).
| Occupation | Male | Female |
| Healthcare Support | 0 (0.0%) | 0 (0.0%) |
| Security & Protection | 0 (0.0%) | 0 (0.0%) |
| Firefighting & Prevention | 0 (0.0%) | 0 (0.0%) |
| Law Enforcement | 0 (0.0%) | 0 (0.0%) |
| Food Preparation & Serving | 2 (20.0%) | 8 (80.0%) |
| Cleaning & Maintenance | 11 (50.0%) | 11 (50.0%) |
| Personal Care & Service | 0 (0.0%) | 5 (100.0%) |
| Total (Category) | 13 (35.1%) | 24 (64.9%) |
| Total (Overall) | 265 (58.0%) | 192 (42.0%) |
Sales and Office Occupations
The most common Sales and Office occupations in Topeka are Sales & Related (61 | 13.4%), and Office & Administration (25 | 5.5%).
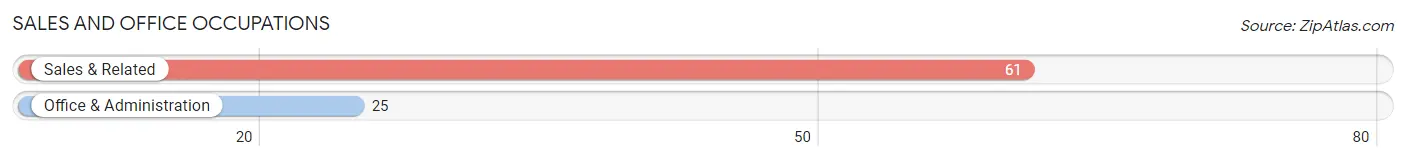
Sales and Office Occupations by Sex
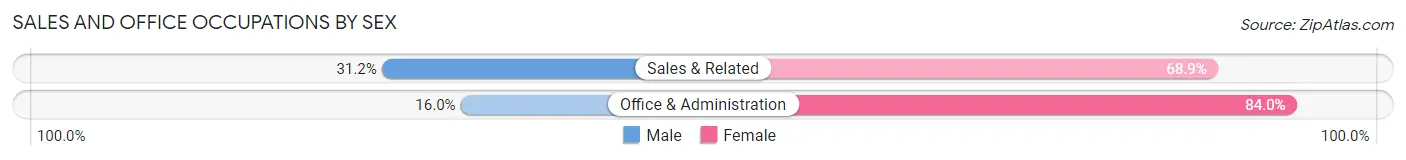
| Occupation | Male | Female |
| Sales & Related | 19 (31.1%) | 42 (68.9%) |
| Office & Administration | 4 (16.0%) | 21 (84.0%) |
| Total (Category) | 23 (26.7%) | 63 (73.3%) |
| Total (Overall) | 265 (58.0%) | 192 (42.0%) |
Natural Resources, Construction and Maintenance Occupations
The most common Natural Resources, Construction and Maintenance occupations in Topeka are Construction & Extraction (9 | 2.0%), Installation, Maintenance & Repair (9 | 2.0%), and Farming, Fishing & Forestry (3 | 0.7%).
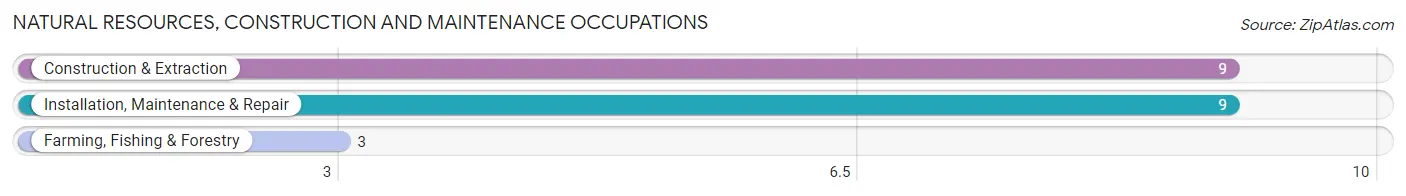
Natural Resources, Construction and Maintenance Occupations by Sex
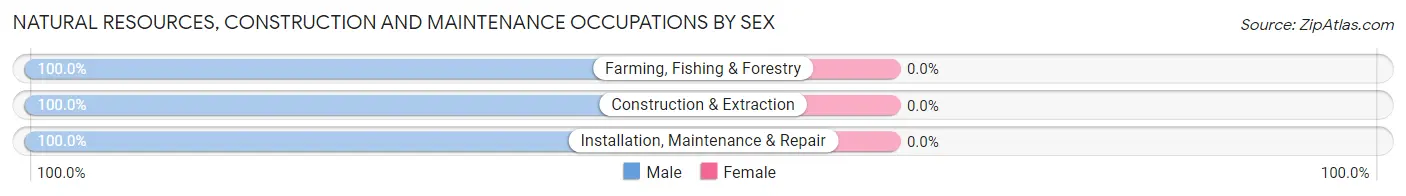
| Occupation | Male | Female |
| Farming, Fishing & Forestry | 3 (100.0%) | 0 (0.0%) |
| Construction & Extraction | 9 (100.0%) | 0 (0.0%) |
| Installation, Maintenance & Repair | 9 (100.0%) | 0 (0.0%) |
| Total (Category) | 21 (100.0%) | 0 (0.0%) |
| Total (Overall) | 265 (58.0%) | 192 (42.0%) |
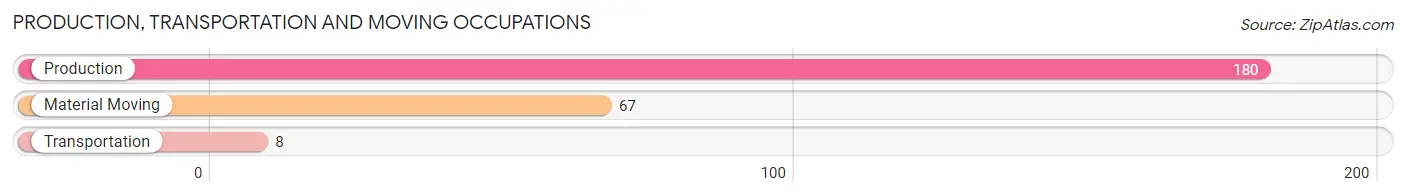
Production, Transportation and Moving Occupations
The most common Production, Transportation and Moving occupations in Topeka are Production (180 | 39.4%), Material Moving (67 | 14.7%), and Transportation (8 | 1.8%).
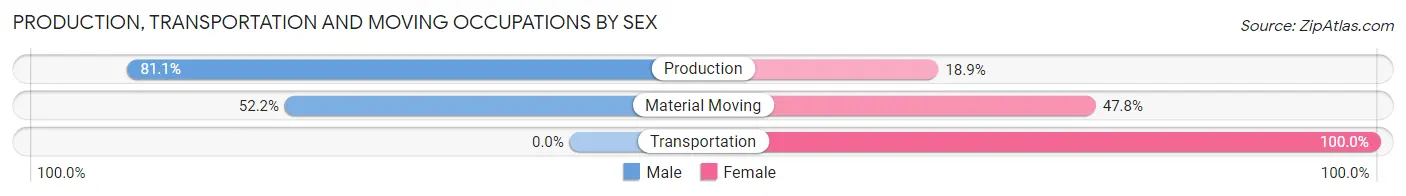
Production, Transportation and Moving Occupations by Sex
| Occupation | Male | Female |
| Production | 146 (81.1%) | 34 (18.9%) |
| Transportation | 0 (0.0%) | 8 (100.0%) |
| Material Moving | 35 (52.2%) | 32 (47.8%) |
| Total (Category) | 181 (71.0%) | 74 (29.0%) |
| Total (Overall) | 265 (58.0%) | 192 (42.0%) |
Employment Industries by Sex in Topeka
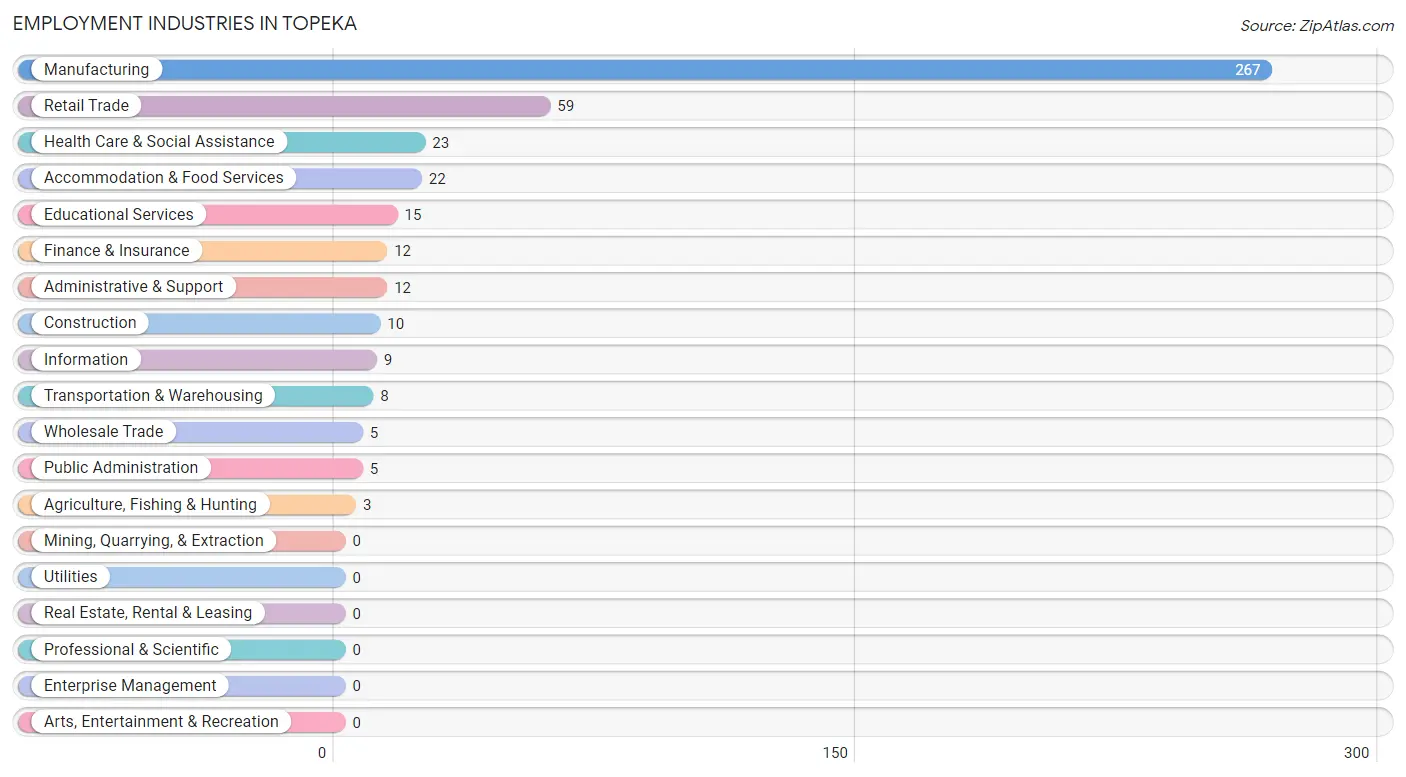
Employment Industries in Topeka
The major employment industries in Topeka include Manufacturing (267 | 58.4%), Retail Trade (59 | 12.9%), Health Care & Social Assistance (23 | 5.0%), Accommodation & Food Services (22 | 4.8%), and Educational Services (15 | 3.3%).
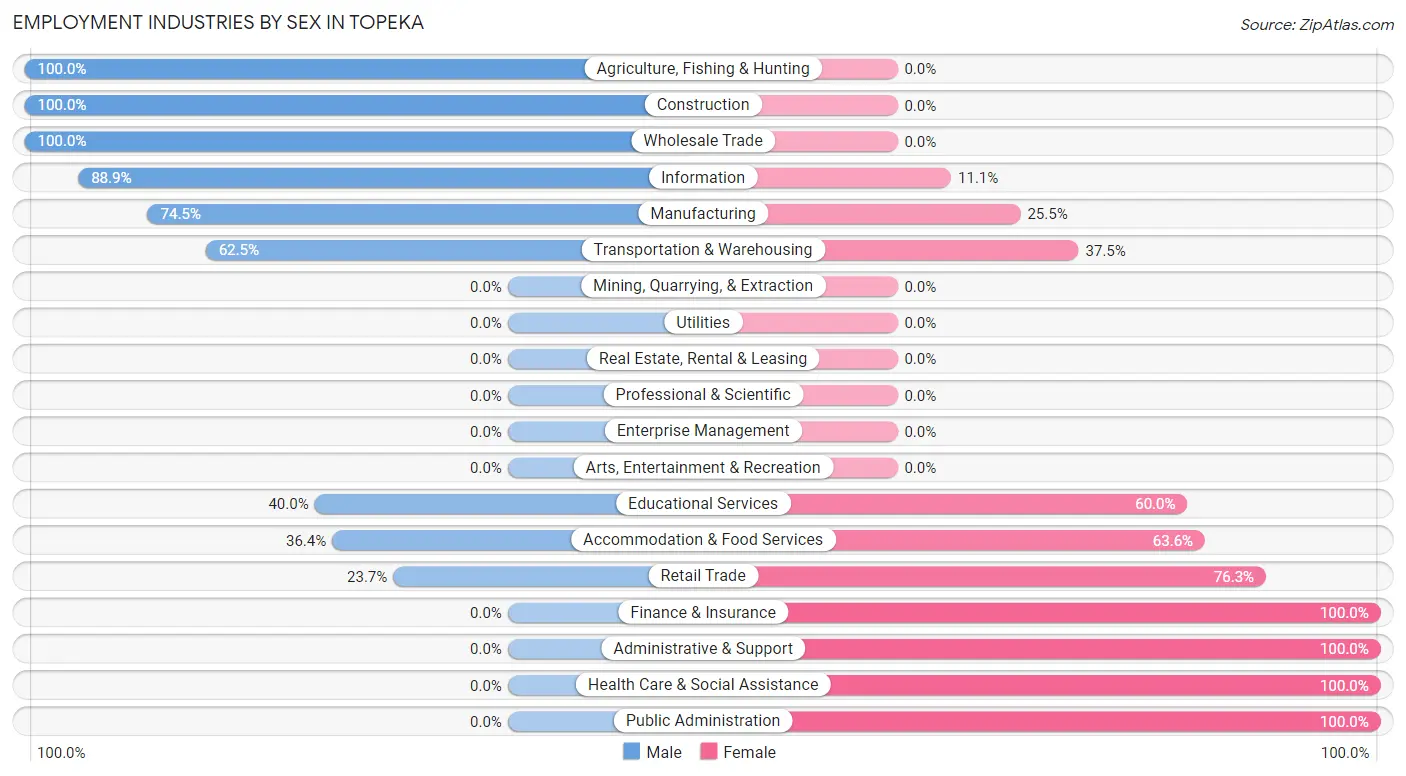
Employment Industries by Sex in Topeka
The Topeka industries that see more men than women are Agriculture, Fishing & Hunting (100.0%), Construction (100.0%), and Wholesale Trade (100.0%), whereas the industries that tend to have a higher number of women are Finance & Insurance (100.0%), Administrative & Support (100.0%), and Health Care & Social Assistance (100.0%).
| Industry | Male | Female |
| Agriculture, Fishing & Hunting | 3 (100.0%) | 0 (0.0%) |
| Mining, Quarrying, & Extraction | 0 (0.0%) | 0 (0.0%) |
| Construction | 10 (100.0%) | 0 (0.0%) |
| Manufacturing | 199 (74.5%) | 68 (25.5%) |
| Wholesale Trade | 5 (100.0%) | 0 (0.0%) |
| Retail Trade | 14 (23.7%) | 45 (76.3%) |
| Transportation & Warehousing | 5 (62.5%) | 3 (37.5%) |
| Utilities | 0 (0.0%) | 0 (0.0%) |
| Information | 8 (88.9%) | 1 (11.1%) |
| Finance & Insurance | 0 (0.0%) | 12 (100.0%) |
| Real Estate, Rental & Leasing | 0 (0.0%) | 0 (0.0%) |
| Professional & Scientific | 0 (0.0%) | 0 (0.0%) |
| Enterprise Management | 0 (0.0%) | 0 (0.0%) |
| Administrative & Support | 0 (0.0%) | 12 (100.0%) |
| Educational Services | 6 (40.0%) | 9 (60.0%) |
| Health Care & Social Assistance | 0 (0.0%) | 23 (100.0%) |
| Arts, Entertainment & Recreation | 0 (0.0%) | 0 (0.0%) |
| Accommodation & Food Services | 8 (36.4%) | 14 (63.6%) |
| Public Administration | 0 (0.0%) | 5 (100.0%) |
| Total | 265 (58.0%) | 192 (42.0%) |
Education in Topeka
School Enrollment in Topeka
The most common levels of schooling among the 272 students in Topeka are elementary school (90 | 33.1%), high school (69 | 25.4%), and middle school (58 | 21.3%).
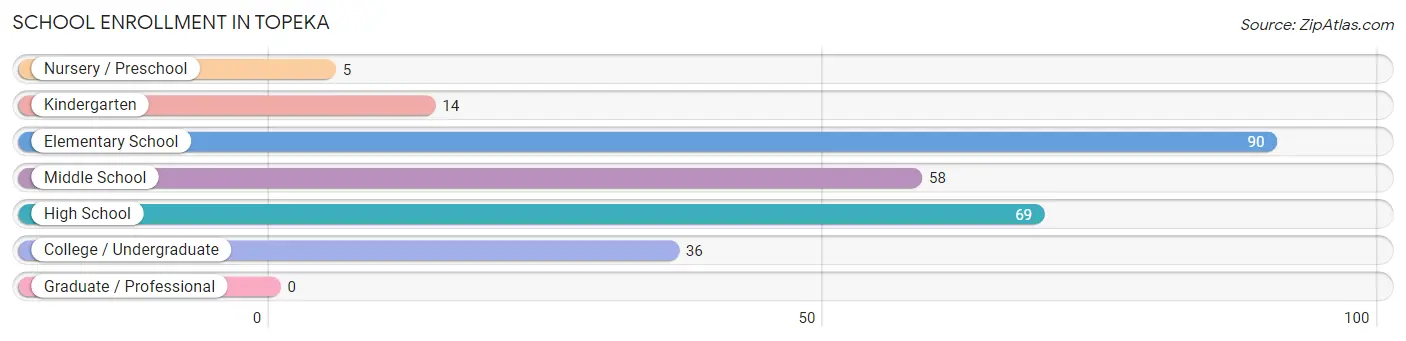
| School Level | # Students | % Students |
| Nursery / Preschool | 5 | 1.8% |
| Kindergarten | 14 | 5.1% |
| Elementary School | 90 | 33.1% |
| Middle School | 58 | 21.3% |
| High School | 69 | 25.4% |
| College / Undergraduate | 36 | 13.2% |
| Graduate / Professional | 0 | 0.0% |
| Total | 272 | 100.0% |
School Enrollment by Age by Funding Source in Topeka
Out of a total of 272 students who are enrolled in schools in Topeka, 75 (27.6%) attend a private institution, while the remaining 197 (72.4%) are enrolled in public schools. The age group of 15 to 17 year olds has the highest likelihood of being enrolled in private schools, with 23 (43.4% in the age bracket) enrolled. Conversely, the age group of 18 to 19 year olds has the lowest likelihood of being enrolled in a private school, with 9 (100.0% in the age bracket) attending a public institution.
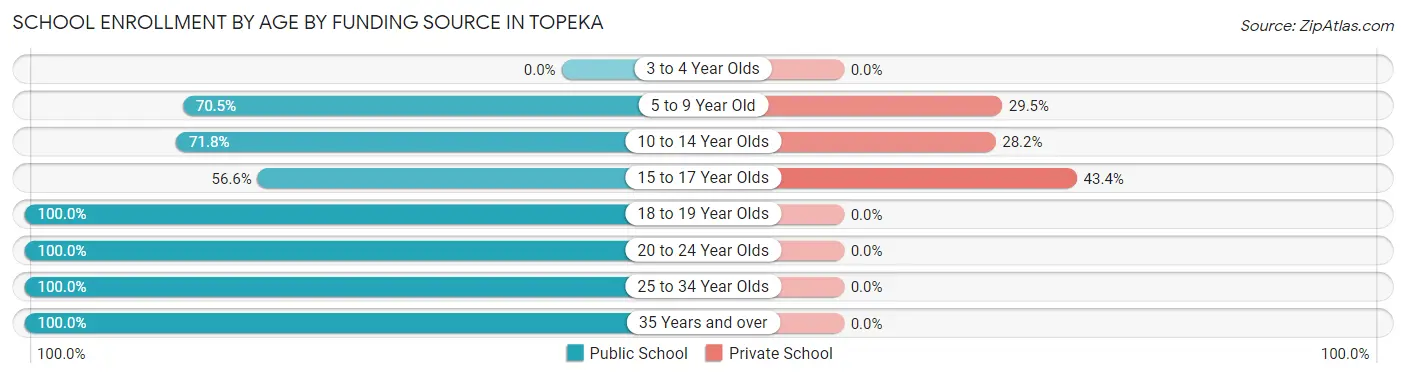
| Age Bracket | Public School | Private School |
| 3 to 4 Year Olds | 0 (0.0%) | 0 (0.0%) |
| 5 to 9 Year Old | 67 (70.5%) | 28 (29.5%) |
| 10 to 14 Year Olds | 61 (71.8%) | 24 (28.2%) |
| 15 to 17 Year Olds | 30 (56.6%) | 23 (43.4%) |
| 18 to 19 Year Olds | 9 (100.0%) | 0 (0.0%) |
| 20 to 24 Year Olds | 2 (100.0%) | 0 (0.0%) |
| 25 to 34 Year Olds | 8 (100.0%) | 0 (0.0%) |
| 35 Years and over | 20 (100.0%) | 0 (0.0%) |
| Total | 197 (72.4%) | 75 (27.6%) |
Educational Attainment by Field of Study in Topeka
Science & technology (14 | 32.6%), computers & mathematics (10 | 23.3%), engineering (5 | 11.6%), business (4 | 9.3%), and education (4 | 9.3%) are the most common fields of study among 43 individuals in Topeka who have obtained a bachelor's degree or higher.
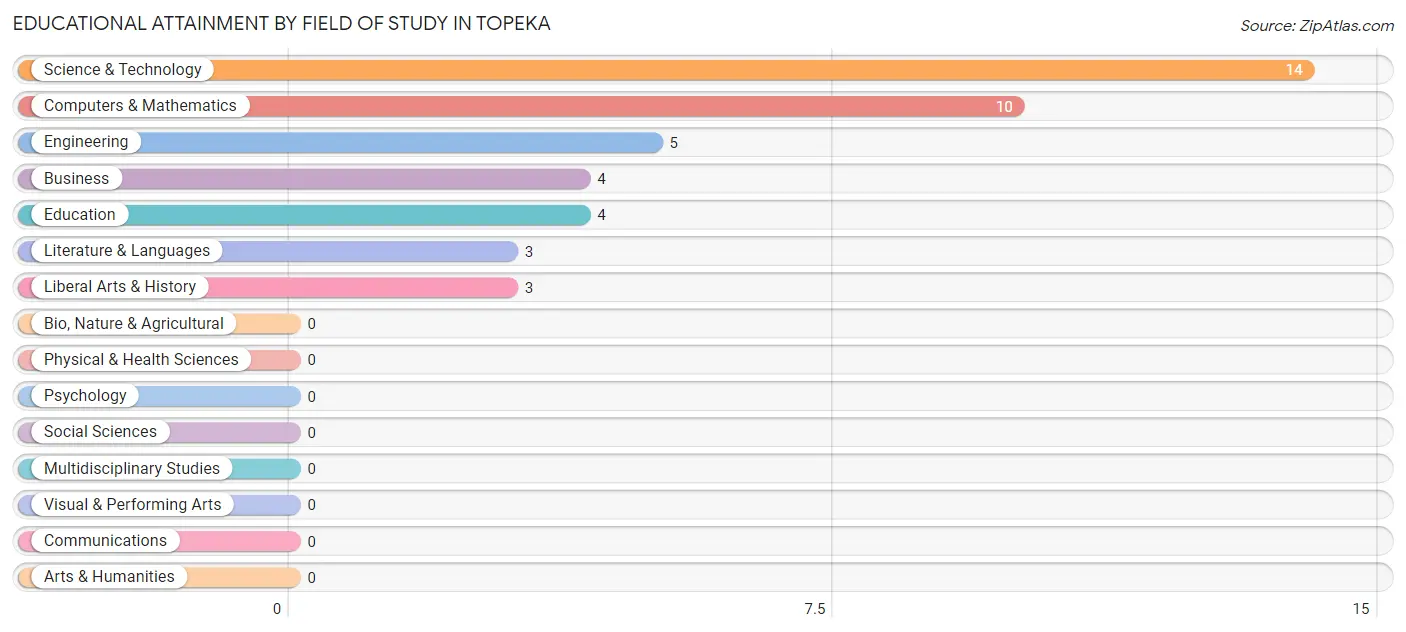
| Field of Study | # Graduates | % Graduates |
| Computers & Mathematics | 10 | 23.3% |
| Bio, Nature & Agricultural | 0 | 0.0% |
| Physical & Health Sciences | 0 | 0.0% |
| Psychology | 0 | 0.0% |
| Social Sciences | 0 | 0.0% |
| Engineering | 5 | 11.6% |
| Multidisciplinary Studies | 0 | 0.0% |
| Science & Technology | 14 | 32.6% |
| Business | 4 | 9.3% |
| Education | 4 | 9.3% |
| Literature & Languages | 3 | 7.0% |
| Liberal Arts & History | 3 | 7.0% |
| Visual & Performing Arts | 0 | 0.0% |
| Communications | 0 | 0.0% |
| Arts & Humanities | 0 | 0.0% |
| Total | 43 | 100.0% |
Transportation & Commute in Topeka
Vehicle Availability by Sex in Topeka
The most prevalent vehicle ownership categories in Topeka are males with 2 vehicles (100, accounting for 37.7%) and females with 2 vehicles (104, making up 52.1%).
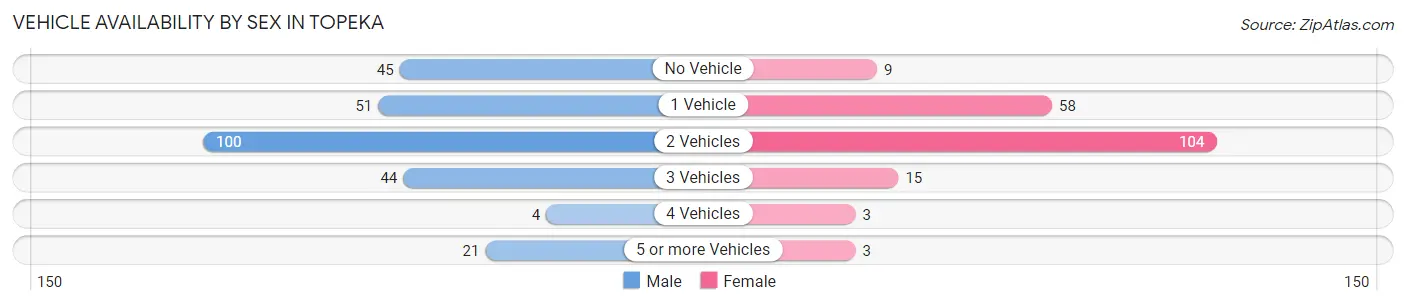
| Vehicles Available | Male | Female |
| No Vehicle | 45 (17.0%) | 9 (4.7%) |
| 1 Vehicle | 51 (19.3%) | 58 (30.2%) |
| 2 Vehicles | 100 (37.7%) | 104 (54.2%) |
| 3 Vehicles | 44 (16.6%) | 15 (7.8%) |
| 4 Vehicles | 4 (1.5%) | 3 (1.6%) |
| 5 or more Vehicles | 21 (7.9%) | 3 (1.6%) |
| Total | 265 (100.0%) | 192 (100.0%) |
Commute Time in Topeka
The most frequently occuring commute durations in Topeka are 5 to 9 minutes (110 commuters, 24.2%), less than 5 minutes (93 commuters, 20.4%), and 20 to 24 minutes (52 commuters, 11.4%).
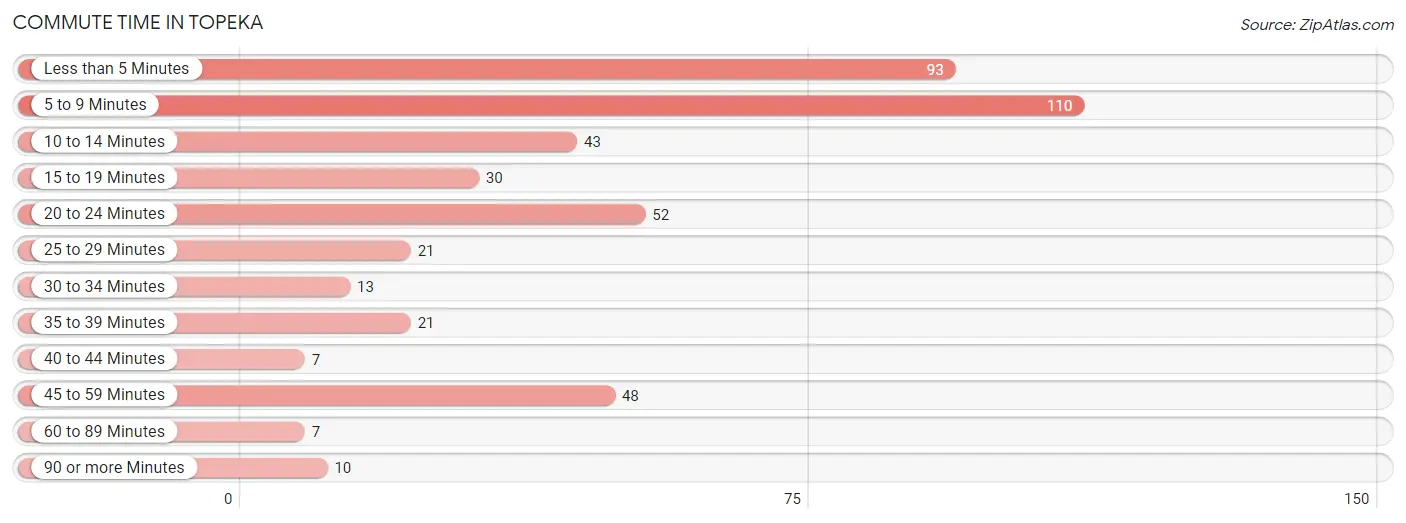
| Commute Time | # Commuters | % Commuters |
| Less than 5 Minutes | 93 | 20.4% |
| 5 to 9 Minutes | 110 | 24.2% |
| 10 to 14 Minutes | 43 | 9.5% |
| 15 to 19 Minutes | 30 | 6.6% |
| 20 to 24 Minutes | 52 | 11.4% |
| 25 to 29 Minutes | 21 | 4.6% |
| 30 to 34 Minutes | 13 | 2.9% |
| 35 to 39 Minutes | 21 | 4.6% |
| 40 to 44 Minutes | 7 | 1.5% |
| 45 to 59 Minutes | 48 | 10.5% |
| 60 to 89 Minutes | 7 | 1.5% |
| 90 or more Minutes | 10 | 2.2% |
Commute Time by Sex in Topeka
The most common commute times in Topeka are 5 to 9 minutes (71 commuters, 26.8%) for males and less than 5 minutes (61 commuters, 32.1%) for females.
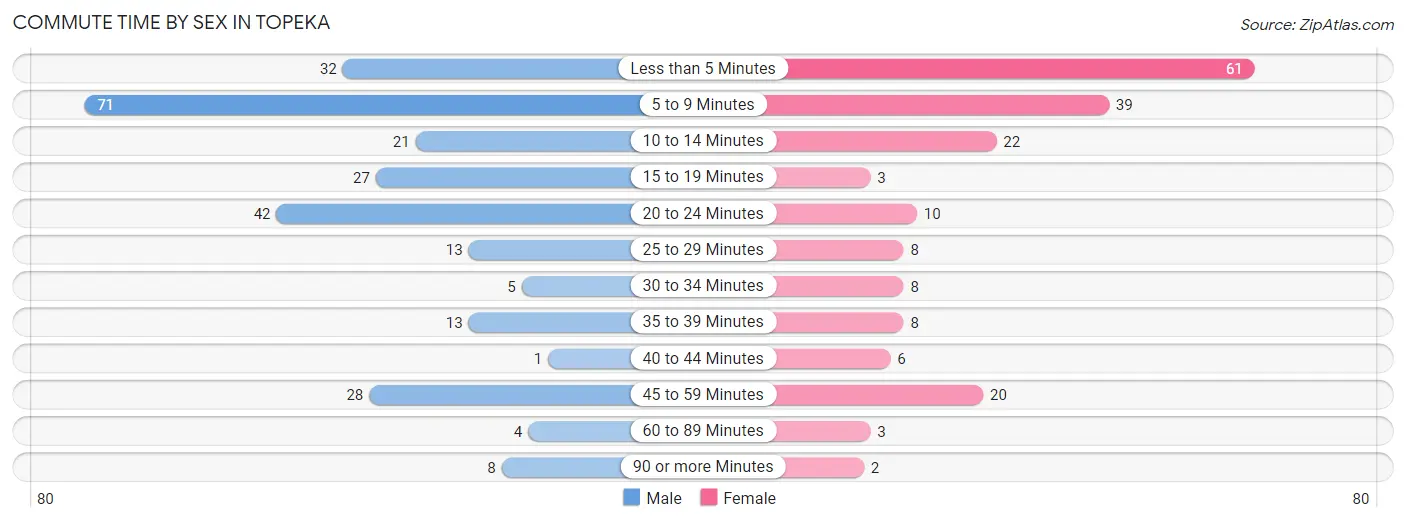
| Commute Time | Male | Female |
| Less than 5 Minutes | 32 (12.1%) | 61 (32.1%) |
| 5 to 9 Minutes | 71 (26.8%) | 39 (20.5%) |
| 10 to 14 Minutes | 21 (7.9%) | 22 (11.6%) |
| 15 to 19 Minutes | 27 (10.2%) | 3 (1.6%) |
| 20 to 24 Minutes | 42 (15.9%) | 10 (5.3%) |
| 25 to 29 Minutes | 13 (4.9%) | 8 (4.2%) |
| 30 to 34 Minutes | 5 (1.9%) | 8 (4.2%) |
| 35 to 39 Minutes | 13 (4.9%) | 8 (4.2%) |
| 40 to 44 Minutes | 1 (0.4%) | 6 (3.2%) |
| 45 to 59 Minutes | 28 (10.6%) | 20 (10.5%) |
| 60 to 89 Minutes | 4 (1.5%) | 3 (1.6%) |
| 90 or more Minutes | 8 (3.0%) | 2 (1.1%) |
Time of Departure to Work by Sex in Topeka
The most frequent times of departure to work in Topeka are 12:00 AM to 4:59 AM (141, 53.2%) for males and 12:00 AM to 4:59 AM (69, 36.3%) for females.
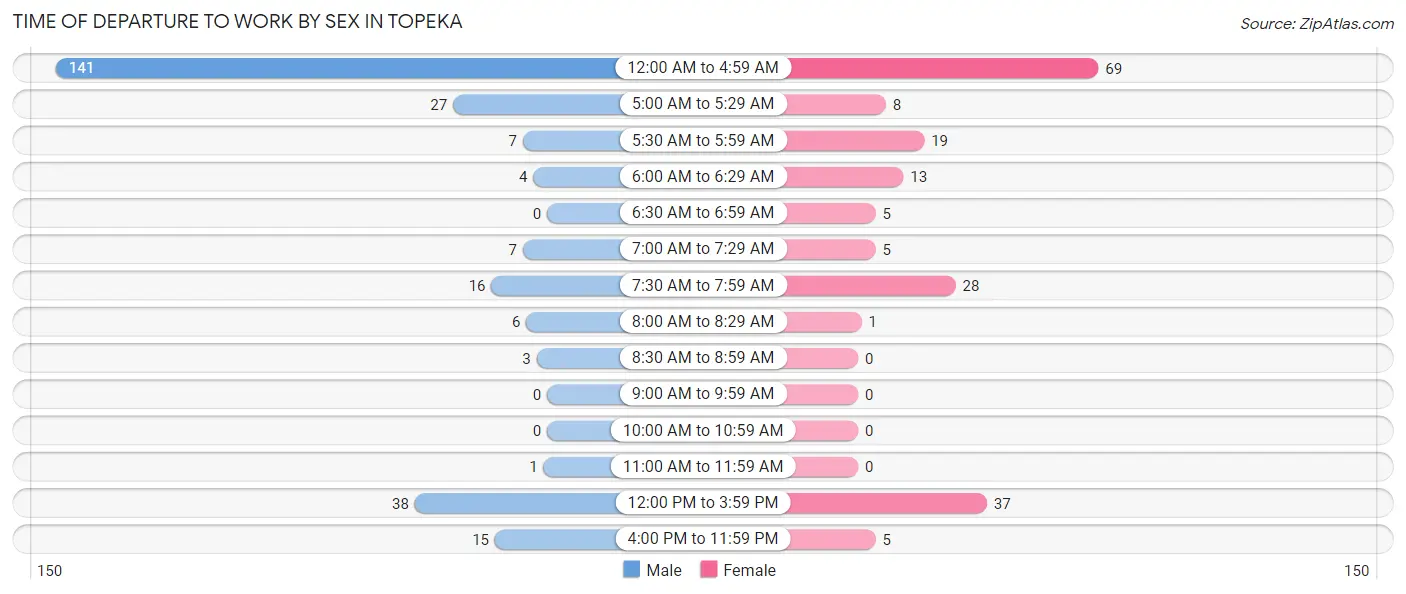
| Time of Departure | Male | Female |
| 12:00 AM to 4:59 AM | 141 (53.2%) | 69 (36.3%) |
| 5:00 AM to 5:29 AM | 27 (10.2%) | 8 (4.2%) |
| 5:30 AM to 5:59 AM | 7 (2.6%) | 19 (10.0%) |
| 6:00 AM to 6:29 AM | 4 (1.5%) | 13 (6.8%) |
| 6:30 AM to 6:59 AM | 0 (0.0%) | 5 (2.6%) |
| 7:00 AM to 7:29 AM | 7 (2.6%) | 5 (2.6%) |
| 7:30 AM to 7:59 AM | 16 (6.0%) | 28 (14.7%) |
| 8:00 AM to 8:29 AM | 6 (2.3%) | 1 (0.5%) |
| 8:30 AM to 8:59 AM | 3 (1.1%) | 0 (0.0%) |
| 9:00 AM to 9:59 AM | 0 (0.0%) | 0 (0.0%) |
| 10:00 AM to 10:59 AM | 0 (0.0%) | 0 (0.0%) |
| 11:00 AM to 11:59 AM | 1 (0.4%) | 0 (0.0%) |
| 12:00 PM to 3:59 PM | 38 (14.3%) | 37 (19.5%) |
| 4:00 PM to 11:59 PM | 15 (5.7%) | 5 (2.6%) |
| Total | 265 (100.0%) | 190 (100.0%) |
Housing Occupancy in Topeka
Occupancy by Ownership in Topeka
Of the total 382 dwellings in Topeka, owner-occupied units account for 243 (63.6%), while renter-occupied units make up 139 (36.4%).
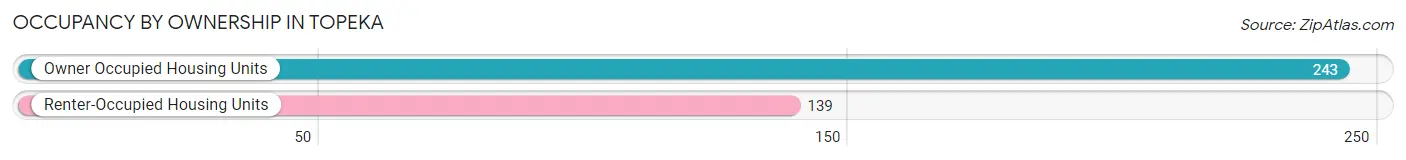
| Occupancy | # Housing Units | % Housing Units |
| Owner Occupied Housing Units | 243 | 63.6% |
| Renter-Occupied Housing Units | 139 | 36.4% |
| Total Occupied Housing Units | 382 | 100.0% |
Occupancy by Household Size in Topeka
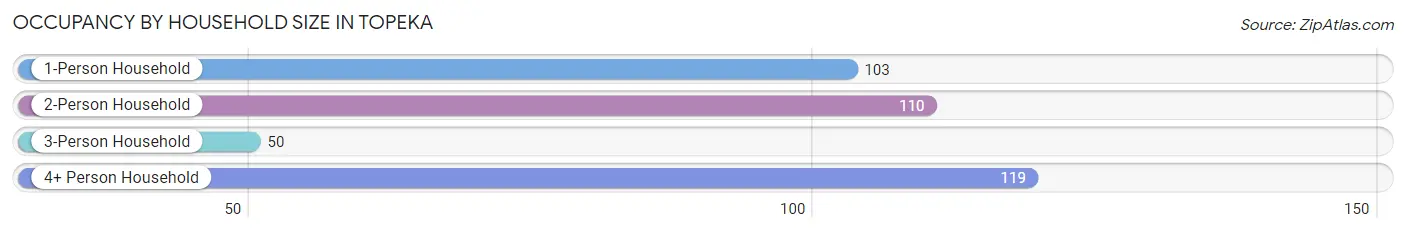
| Household Size | # Housing Units | % Housing Units |
| 1-Person Household | 103 | 27.0% |
| 2-Person Household | 110 | 28.8% |
| 3-Person Household | 50 | 13.1% |
| 4+ Person Household | 119 | 31.1% |
| Total Housing Units | 382 | 100.0% |
Occupancy by Ownership by Household Size in Topeka
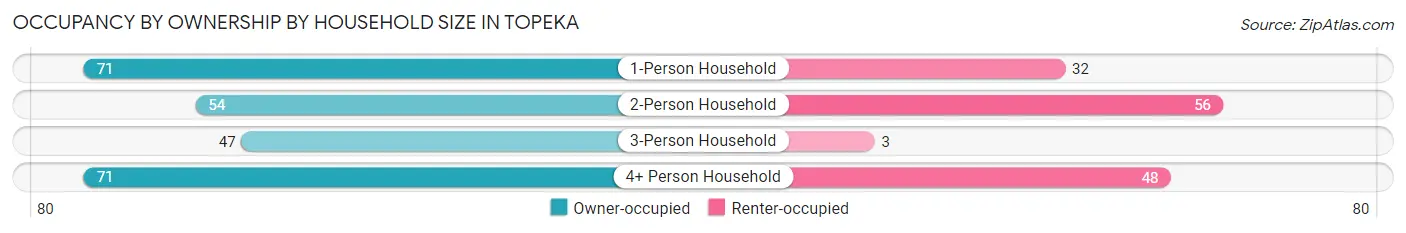
| Household Size | Owner-occupied | Renter-occupied |
| 1-Person Household | 71 (68.9%) | 32 (31.1%) |
| 2-Person Household | 54 (49.1%) | 56 (50.9%) |
| 3-Person Household | 47 (94.0%) | 3 (6.0%) |
| 4+ Person Household | 71 (59.7%) | 48 (40.3%) |
| Total Housing Units | 243 (63.6%) | 139 (36.4%) |
Occupancy by Educational Attainment in Topeka
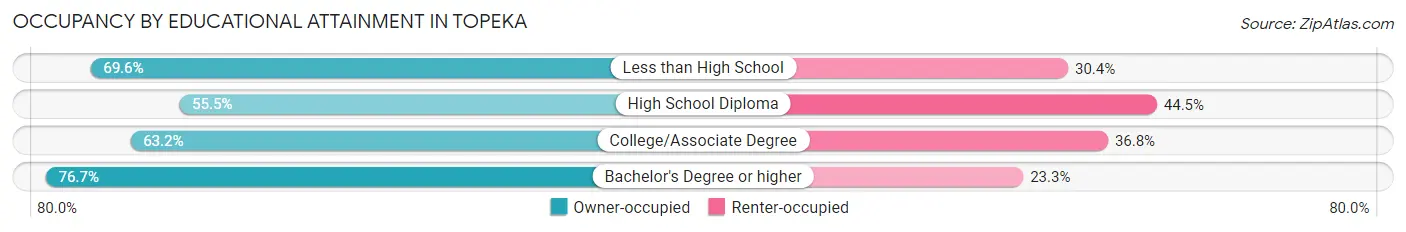
| Household Size | Owner-occupied | Renter-occupied |
| Less than High School | 96 (69.6%) | 42 (30.4%) |
| High School Diploma | 81 (55.5%) | 65 (44.5%) |
| College/Associate Degree | 43 (63.2%) | 25 (36.8%) |
| Bachelor's Degree or higher | 23 (76.7%) | 7 (23.3%) |
Occupancy by Age of Householder in Topeka
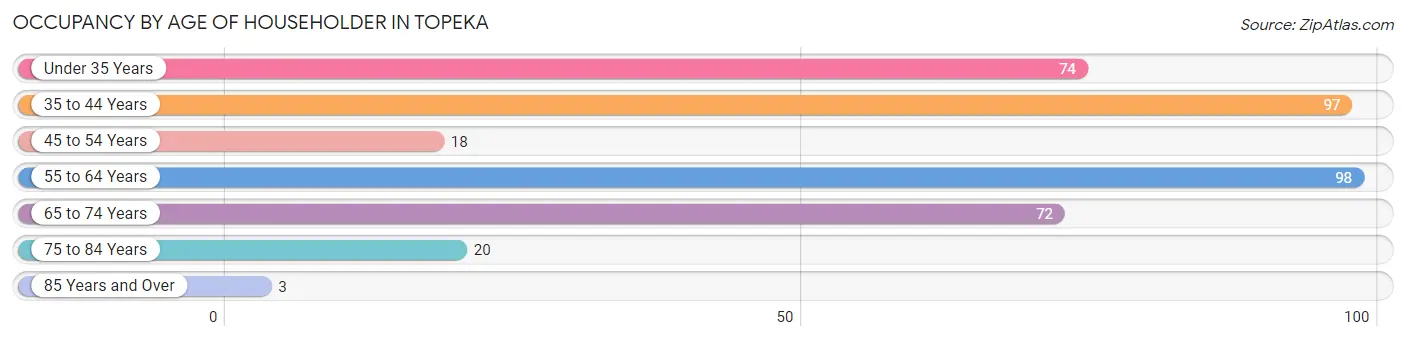
| Age Bracket | # Households | % Households |
| Under 35 Years | 74 | 19.4% |
| 35 to 44 Years | 97 | 25.4% |
| 45 to 54 Years | 18 | 4.7% |
| 55 to 64 Years | 98 | 25.7% |
| 65 to 74 Years | 72 | 18.9% |
| 75 to 84 Years | 20 | 5.2% |
| 85 Years and Over | 3 | 0.8% |
| Total | 382 | 100.0% |
Housing Finances in Topeka
Median Income by Occupancy in Topeka
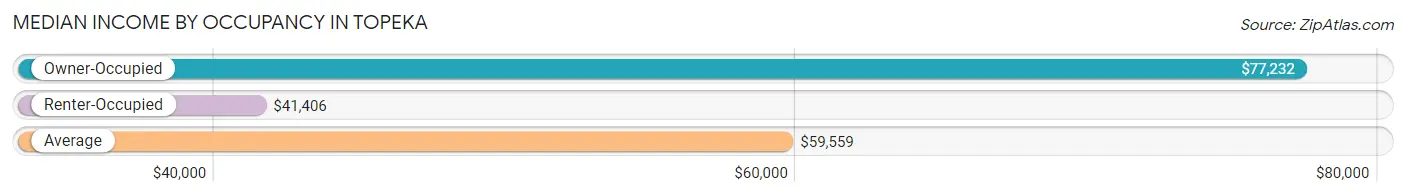
| Occupancy Type | # Households | Median Income |
| Owner-Occupied | 243 (63.6%) | $77,232 |
| Renter-Occupied | 139 (36.4%) | $41,406 |
| Average | 382 (100.0%) | $59,559 |
Occupancy by Householder Income Bracket in Topeka
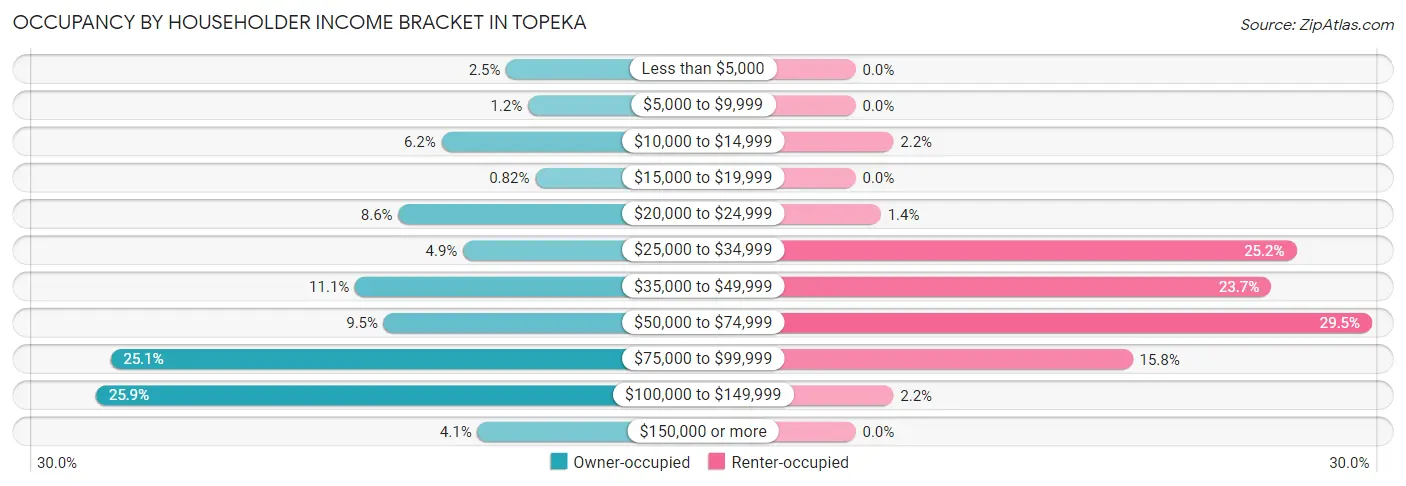
| Income Bracket | Owner-occupied | Renter-occupied |
| Less than $5,000 | 6 (2.5%) | 0 (0.0%) |
| $5,000 to $9,999 | 3 (1.2%) | 0 (0.0%) |
| $10,000 to $14,999 | 15 (6.2%) | 3 (2.2%) |
| $15,000 to $19,999 | 2 (0.8%) | 0 (0.0%) |
| $20,000 to $24,999 | 21 (8.6%) | 2 (1.4%) |
| $25,000 to $34,999 | 12 (4.9%) | 35 (25.2%) |
| $35,000 to $49,999 | 27 (11.1%) | 33 (23.7%) |
| $50,000 to $74,999 | 23 (9.5%) | 41 (29.5%) |
| $75,000 to $99,999 | 61 (25.1%) | 22 (15.8%) |
| $100,000 to $149,999 | 63 (25.9%) | 3 (2.2%) |
| $150,000 or more | 10 (4.1%) | 0 (0.0%) |
| Total | 243 (100.0%) | 139 (100.0%) |
Monthly Housing Cost Tiers in Topeka
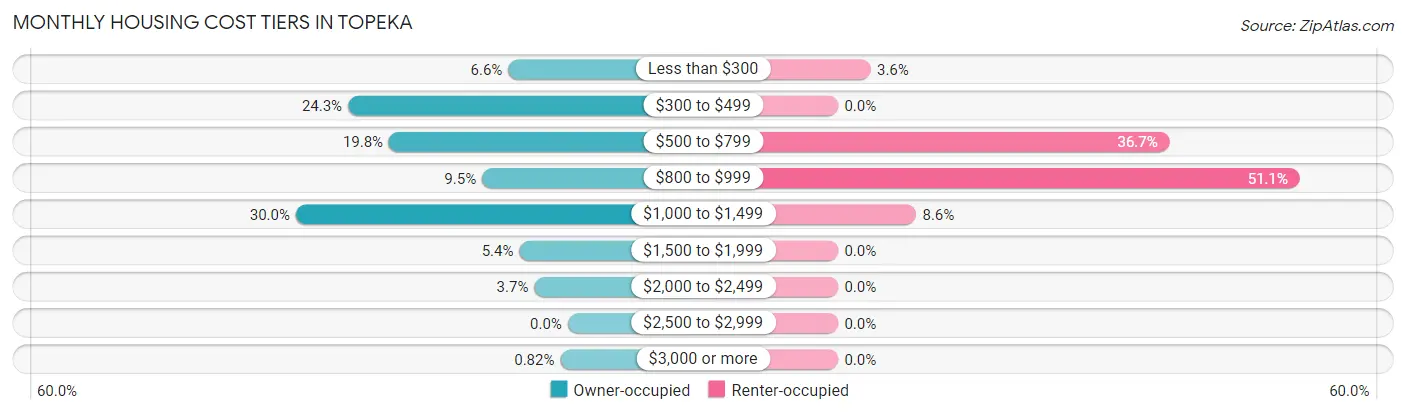
| Monthly Cost | Owner-occupied | Renter-occupied |
| Less than $300 | 16 (6.6%) | 5 (3.6%) |
| $300 to $499 | 59 (24.3%) | 0 (0.0%) |
| $500 to $799 | 48 (19.8%) | 51 (36.7%) |
| $800 to $999 | 23 (9.5%) | 71 (51.1%) |
| $1,000 to $1,499 | 73 (30.0%) | 12 (8.6%) |
| $1,500 to $1,999 | 13 (5.3%) | 0 (0.0%) |
| $2,000 to $2,499 | 9 (3.7%) | 0 (0.0%) |
| $2,500 to $2,999 | 0 (0.0%) | 0 (0.0%) |
| $3,000 or more | 2 (0.8%) | 0 (0.0%) |
| Total | 243 (100.0%) | 139 (100.0%) |
Physical Housing Characteristics in Topeka
Housing Structures in Topeka
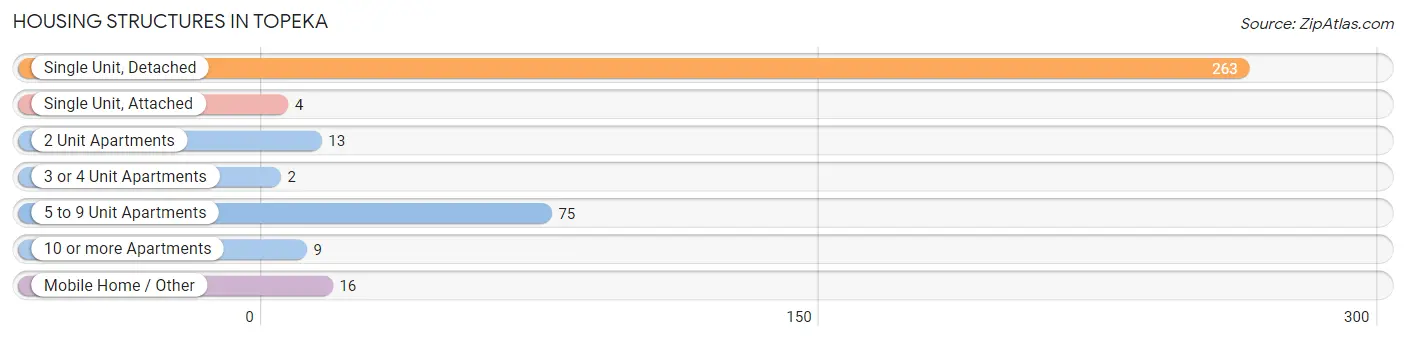
| Structure Type | # Housing Units | % Housing Units |
| Single Unit, Detached | 263 | 68.9% |
| Single Unit, Attached | 4 | 1.1% |
| 2 Unit Apartments | 13 | 3.4% |
| 3 or 4 Unit Apartments | 2 | 0.5% |
| 5 to 9 Unit Apartments | 75 | 19.6% |
| 10 or more Apartments | 9 | 2.4% |
| Mobile Home / Other | 16 | 4.2% |
| Total | 382 | 100.0% |
Housing Structures by Occupancy in Topeka
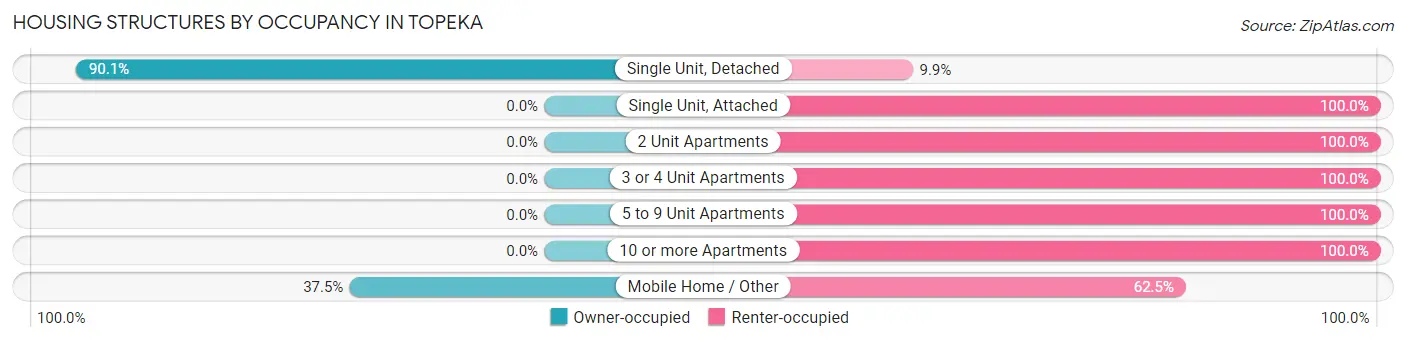
| Structure Type | Owner-occupied | Renter-occupied |
| Single Unit, Detached | 237 (90.1%) | 26 (9.9%) |
| Single Unit, Attached | 0 (0.0%) | 4 (100.0%) |
| 2 Unit Apartments | 0 (0.0%) | 13 (100.0%) |
| 3 or 4 Unit Apartments | 0 (0.0%) | 2 (100.0%) |
| 5 to 9 Unit Apartments | 0 (0.0%) | 75 (100.0%) |
| 10 or more Apartments | 0 (0.0%) | 9 (100.0%) |
| Mobile Home / Other | 6 (37.5%) | 10 (62.5%) |
| Total | 243 (63.6%) | 139 (36.4%) |
Housing Structures by Number of Rooms in Topeka
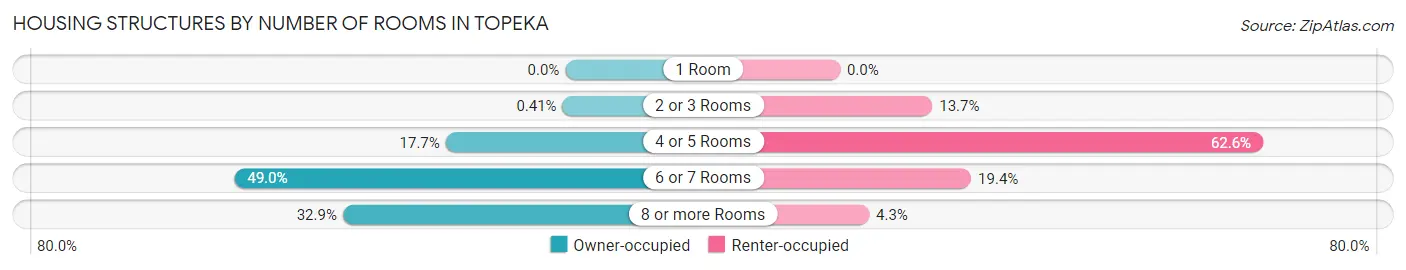
| Number of Rooms | Owner-occupied | Renter-occupied |
| 1 Room | 0 (0.0%) | 0 (0.0%) |
| 2 or 3 Rooms | 1 (0.4%) | 19 (13.7%) |
| 4 or 5 Rooms | 43 (17.7%) | 87 (62.6%) |
| 6 or 7 Rooms | 119 (49.0%) | 27 (19.4%) |
| 8 or more Rooms | 80 (32.9%) | 6 (4.3%) |
| Total | 243 (100.0%) | 139 (100.0%) |
Housing Structure by Heating Type in Topeka
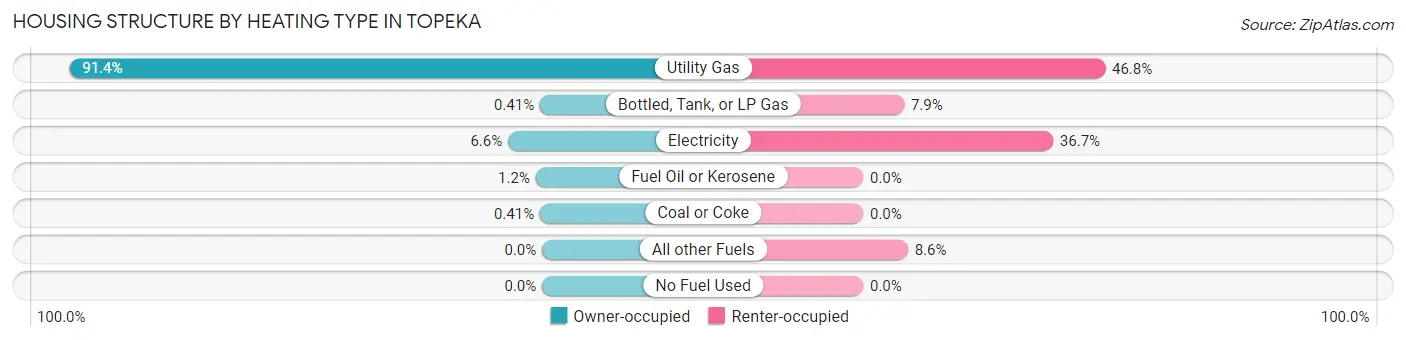
| Heating Type | Owner-occupied | Renter-occupied |
| Utility Gas | 222 (91.4%) | 65 (46.8%) |
| Bottled, Tank, or LP Gas | 1 (0.4%) | 11 (7.9%) |
| Electricity | 16 (6.6%) | 51 (36.7%) |
| Fuel Oil or Kerosene | 3 (1.2%) | 0 (0.0%) |
| Coal or Coke | 1 (0.4%) | 0 (0.0%) |
| All other Fuels | 0 (0.0%) | 12 (8.6%) |
| No Fuel Used | 0 (0.0%) | 0 (0.0%) |
| Total | 243 (100.0%) | 139 (100.0%) |
Household Vehicle Usage in Topeka
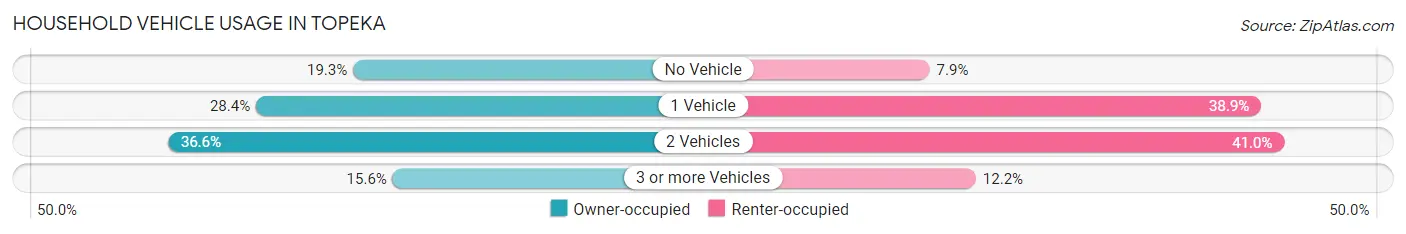
| Vehicles per Household | Owner-occupied | Renter-occupied |
| No Vehicle | 47 (19.3%) | 11 (7.9%) |
| 1 Vehicle | 69 (28.4%) | 54 (38.9%) |
| 2 Vehicles | 89 (36.6%) | 57 (41.0%) |
| 3 or more Vehicles | 38 (15.6%) | 17 (12.2%) |
| Total | 243 (100.0%) | 139 (100.0%) |
Real Estate & Mortgages in Topeka
Real Estate and Mortgage Overview in Topeka
| Characteristic | Without Mortgage | With Mortgage |
| Housing Units | 106 | 137 |
| Median Property Value | $107,500 | $140,300 |
| Median Household Income | $48,750 | $8 |
| Monthly Housing Costs | $438 | $2 |
| Real Estate Taxes | $758 | $4 |
Property Value by Mortgage Status in Topeka
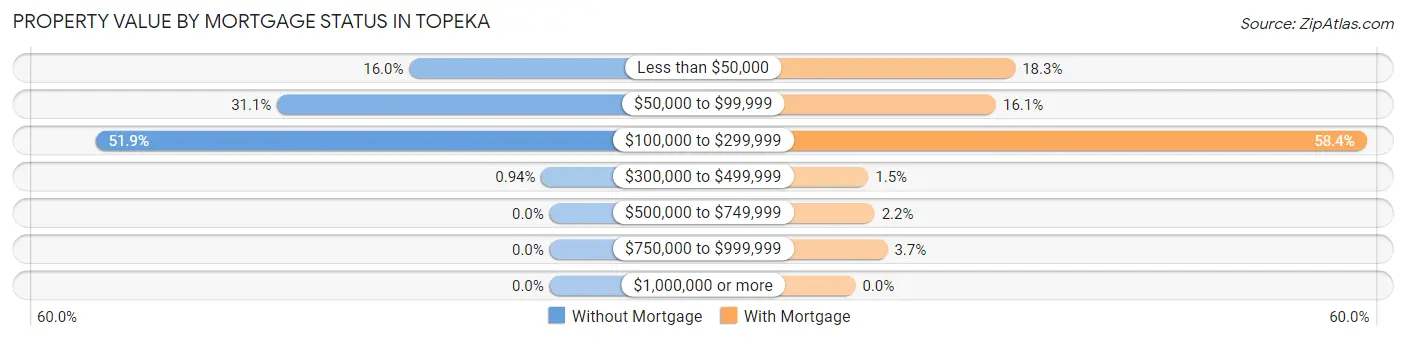
| Property Value | Without Mortgage | With Mortgage |
| Less than $50,000 | 17 (16.0%) | 25 (18.2%) |
| $50,000 to $99,999 | 33 (31.1%) | 22 (16.1%) |
| $100,000 to $299,999 | 55 (51.9%) | 80 (58.4%) |
| $300,000 to $499,999 | 1 (0.9%) | 2 (1.5%) |
| $500,000 to $749,999 | 0 (0.0%) | 3 (2.2%) |
| $750,000 to $999,999 | 0 (0.0%) | 5 (3.6%) |
| $1,000,000 or more | 0 (0.0%) | 0 (0.0%) |
| Total | 106 (100.0%) | 137 (100.0%) |
Household Income by Mortgage Status in Topeka
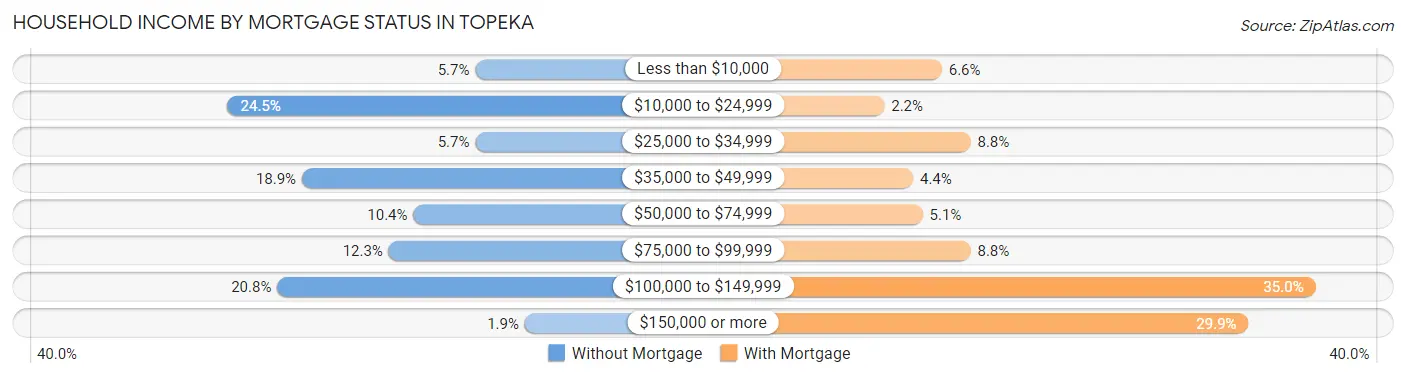
| Household Income | Without Mortgage | With Mortgage |
| Less than $10,000 | 6 (5.7%) | 9 (6.6%) |
| $10,000 to $24,999 | 26 (24.5%) | 3 (2.2%) |
| $25,000 to $34,999 | 6 (5.7%) | 12 (8.8%) |
| $35,000 to $49,999 | 20 (18.9%) | 6 (4.4%) |
| $50,000 to $74,999 | 11 (10.4%) | 7 (5.1%) |
| $75,000 to $99,999 | 13 (12.3%) | 12 (8.8%) |
| $100,000 to $149,999 | 22 (20.7%) | 48 (35.0%) |
| $150,000 or more | 2 (1.9%) | 41 (29.9%) |
| Total | 106 (100.0%) | 137 (100.0%) |
Property Value to Household Income Ratio in Topeka
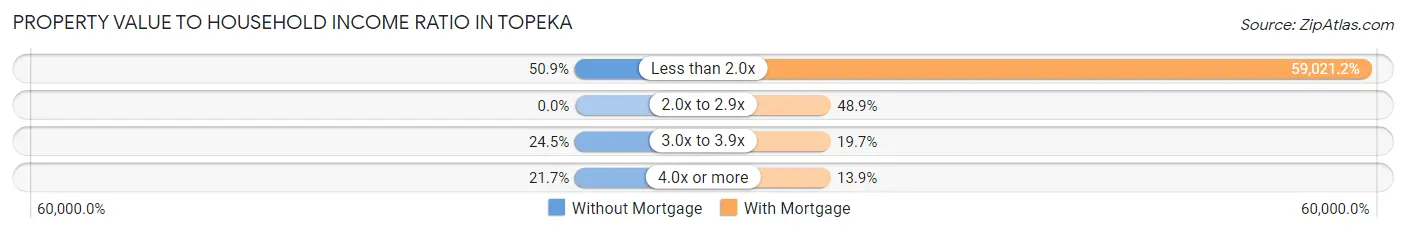
| Value-to-Income Ratio | Without Mortgage | With Mortgage |
| Less than 2.0x | 54 (50.9%) | 80,859 (59,021.2%) |
| 2.0x to 2.9x | 0 (0.0%) | 67 (48.9%) |
| 3.0x to 3.9x | 26 (24.5%) | 27 (19.7%) |
| 4.0x or more | 23 (21.7%) | 19 (13.9%) |
| Total | 106 (100.0%) | 137 (100.0%) |
Real Estate Taxes by Mortgage Status in Topeka
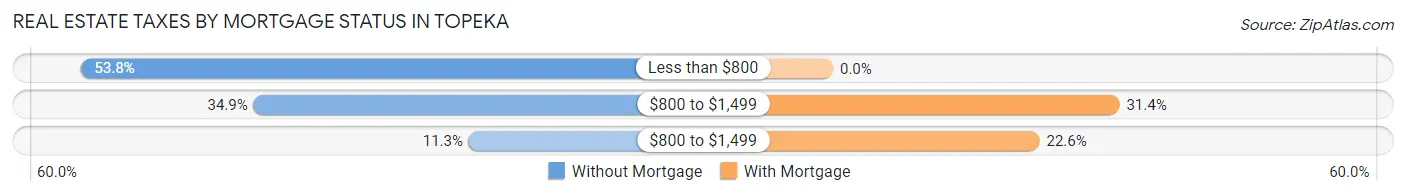
| Property Taxes | Without Mortgage | With Mortgage |
| Less than $800 | 57 (53.8%) | 0 (0.0%) |
| $800 to $1,499 | 37 (34.9%) | 43 (31.4%) |
| $800 to $1,499 | 12 (11.3%) | 31 (22.6%) |
| Total | 106 (100.0%) | 137 (100.0%) |
Health & Disability in Topeka
Health Insurance Coverage by Age in Topeka
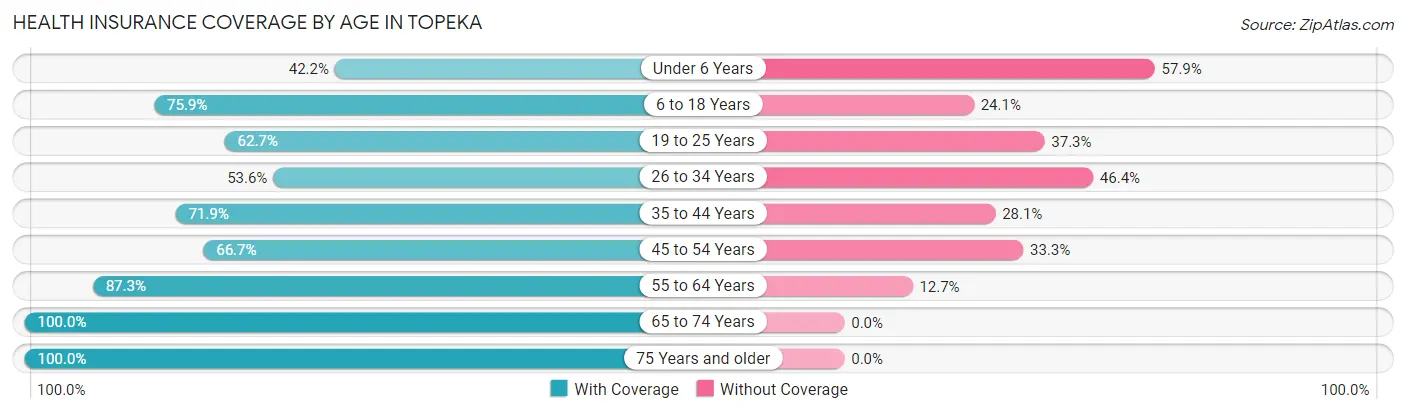
| Age Bracket | With Coverage | Without Coverage |
| Under 6 Years | 51 (42.1%) | 70 (57.9%) |
| 6 to 18 Years | 198 (75.9%) | 63 (24.1%) |
| 19 to 25 Years | 42 (62.7%) | 25 (37.3%) |
| 26 to 34 Years | 81 (53.6%) | 70 (46.4%) |
| 35 to 44 Years | 143 (71.9%) | 56 (28.1%) |
| 45 to 54 Years | 22 (66.7%) | 11 (33.3%) |
| 55 to 64 Years | 158 (87.3%) | 23 (12.7%) |
| 65 to 74 Years | 94 (100.0%) | 0 (0.0%) |
| 75 Years and older | 25 (100.0%) | 0 (0.0%) |
| Total | 814 (71.9%) | 318 (28.1%) |
Health Insurance Coverage by Citizenship Status in Topeka
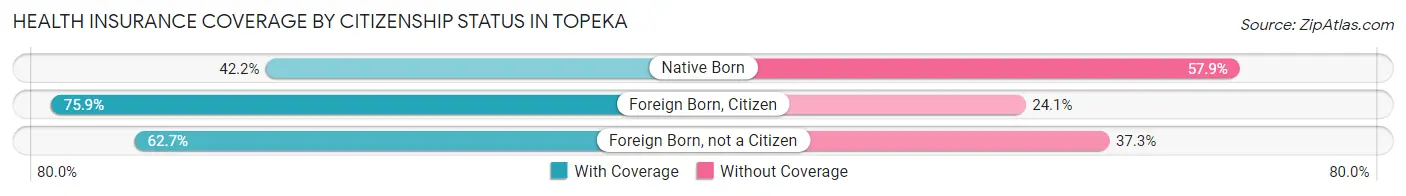
| Citizenship Status | With Coverage | Without Coverage |
| Native Born | 51 (42.1%) | 70 (57.9%) |
| Foreign Born, Citizen | 198 (75.9%) | 63 (24.1%) |
| Foreign Born, not a Citizen | 42 (62.7%) | 25 (37.3%) |
Health Insurance Coverage by Household Income in Topeka
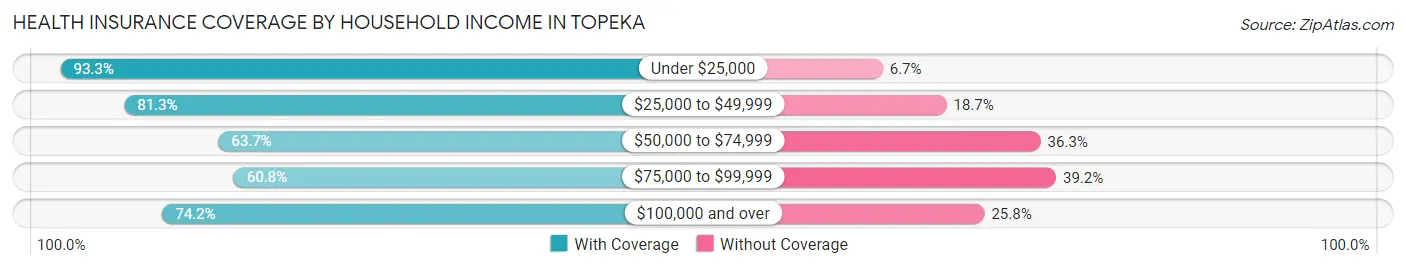
| Household Income | With Coverage | Without Coverage |
| Under $25,000 | 83 (93.3%) | 6 (6.7%) |
| $25,000 to $49,999 | 174 (81.3%) | 40 (18.7%) |
| $50,000 to $74,999 | 149 (63.7%) | 85 (36.3%) |
| $75,000 to $99,999 | 152 (60.8%) | 98 (39.2%) |
| $100,000 and over | 256 (74.2%) | 89 (25.8%) |
Public vs Private Health Insurance Coverage by Age in Topeka
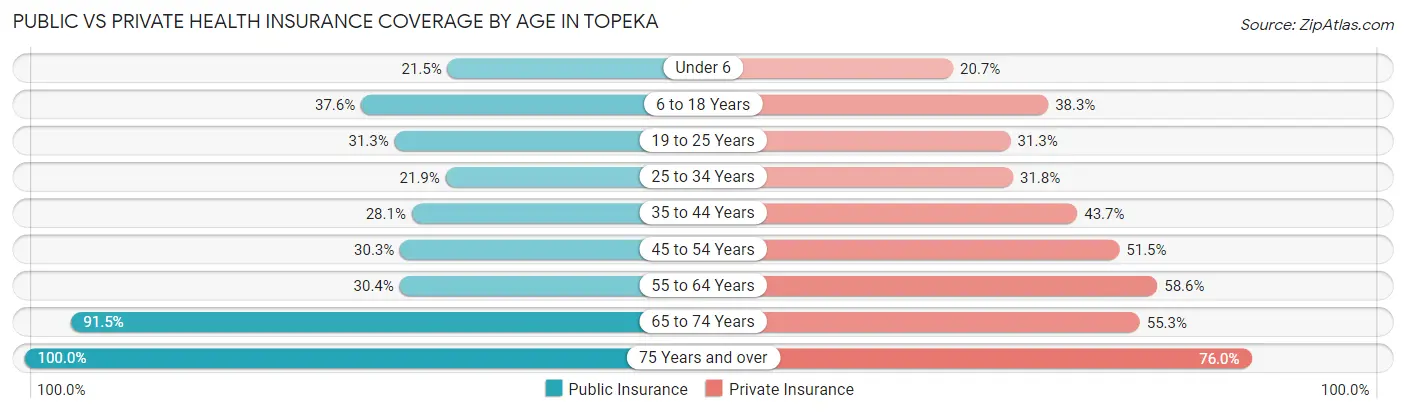
| Age Bracket | Public Insurance | Private Insurance |
| Under 6 | 26 (21.5%) | 25 (20.7%) |
| 6 to 18 Years | 98 (37.6%) | 100 (38.3%) |
| 19 to 25 Years | 21 (31.3%) | 21 (31.3%) |
| 25 to 34 Years | 33 (21.8%) | 48 (31.8%) |
| 35 to 44 Years | 56 (28.1%) | 87 (43.7%) |
| 45 to 54 Years | 10 (30.3%) | 17 (51.5%) |
| 55 to 64 Years | 55 (30.4%) | 106 (58.6%) |
| 65 to 74 Years | 86 (91.5%) | 52 (55.3%) |
| 75 Years and over | 25 (100.0%) | 19 (76.0%) |
| Total | 410 (36.2%) | 475 (42.0%) |
Disability Status by Sex by Age in Topeka
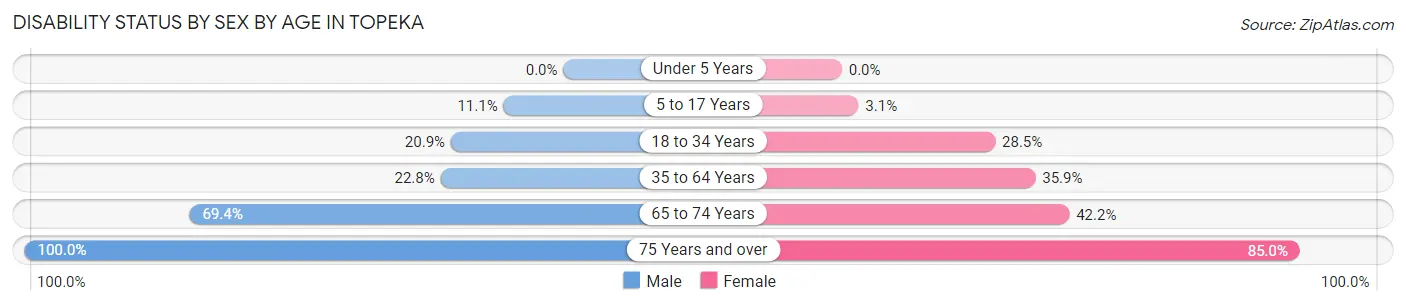
| Age Bracket | Male | Female |
| Under 5 Years | 0 (0.0%) | 0 (0.0%) |
| 5 to 17 Years | 14 (11.1%) | 4 (3.1%) |
| 18 to 34 Years | 24 (20.9%) | 35 (28.5%) |
| 35 to 64 Years | 44 (22.8%) | 79 (35.9%) |
| 65 to 74 Years | 34 (69.4%) | 19 (42.2%) |
| 75 Years and over | 5 (100.0%) | 17 (85.0%) |
Disability Class by Sex by Age in Topeka
Disability Class: Hearing Difficulty
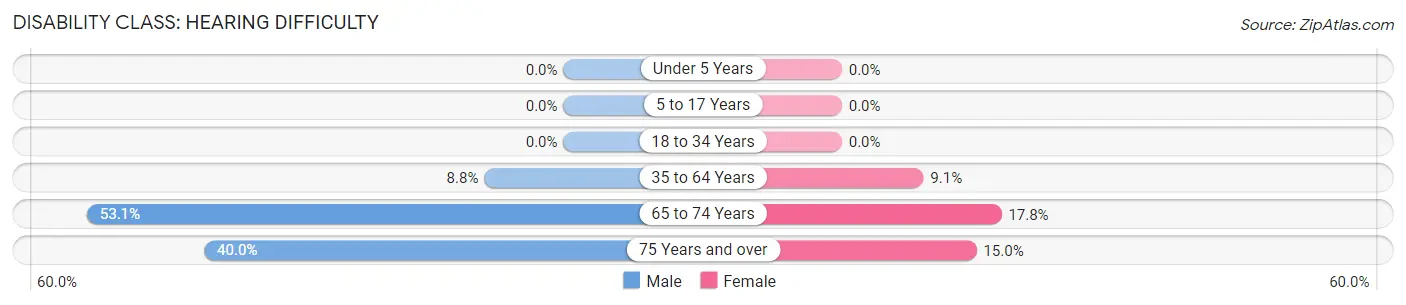
| Age Bracket | Male | Female |
| Under 5 Years | 0 (0.0%) | 0 (0.0%) |
| 5 to 17 Years | 0 (0.0%) | 0 (0.0%) |
| 18 to 34 Years | 0 (0.0%) | 0 (0.0%) |
| 35 to 64 Years | 17 (8.8%) | 20 (9.1%) |
| 65 to 74 Years | 26 (53.1%) | 8 (17.8%) |
| 75 Years and over | 2 (40.0%) | 3 (15.0%) |
Disability Class: Vision Difficulty
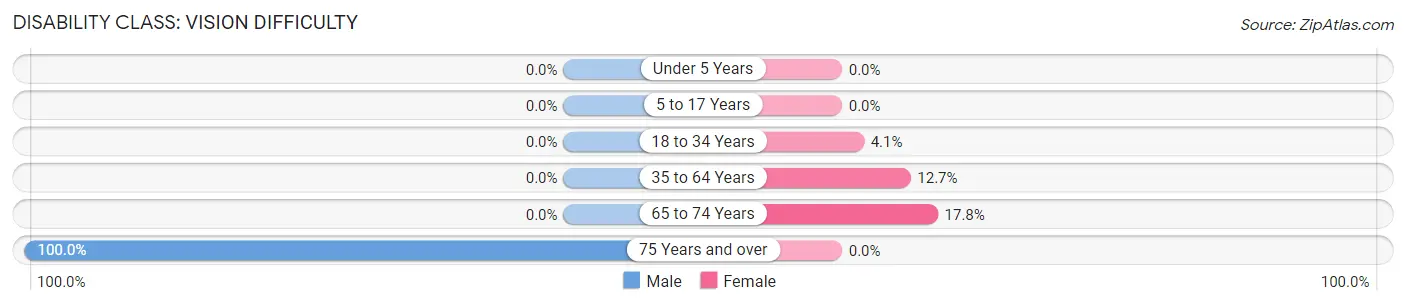
| Age Bracket | Male | Female |
| Under 5 Years | 0 (0.0%) | 0 (0.0%) |
| 5 to 17 Years | 0 (0.0%) | 0 (0.0%) |
| 18 to 34 Years | 0 (0.0%) | 5 (4.1%) |
| 35 to 64 Years | 0 (0.0%) | 28 (12.7%) |
| 65 to 74 Years | 0 (0.0%) | 8 (17.8%) |
| 75 Years and over | 5 (100.0%) | 0 (0.0%) |
Disability Class: Cognitive Difficulty
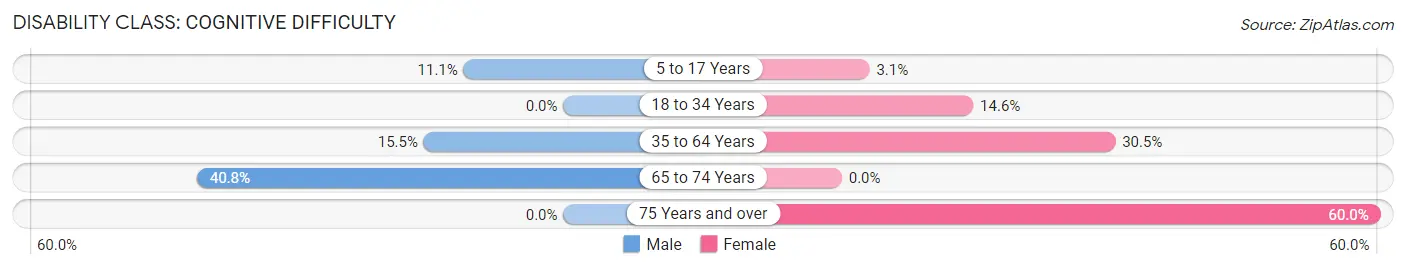
| Age Bracket | Male | Female |
| 5 to 17 Years | 14 (11.1%) | 4 (3.1%) |
| 18 to 34 Years | 0 (0.0%) | 18 (14.6%) |
| 35 to 64 Years | 30 (15.5%) | 67 (30.4%) |
| 65 to 74 Years | 20 (40.8%) | 0 (0.0%) |
| 75 Years and over | 0 (0.0%) | 12 (60.0%) |
Disability Class: Ambulatory Difficulty
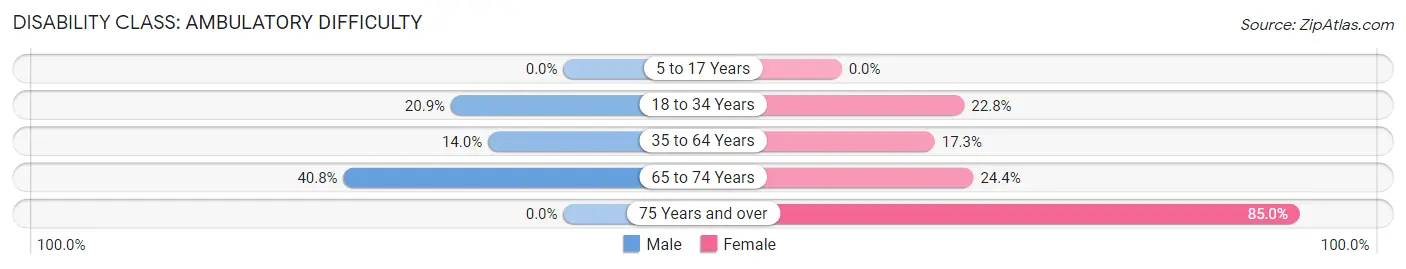
| Age Bracket | Male | Female |
| 5 to 17 Years | 0 (0.0%) | 0 (0.0%) |
| 18 to 34 Years | 24 (20.9%) | 28 (22.8%) |
| 35 to 64 Years | 27 (14.0%) | 38 (17.3%) |
| 65 to 74 Years | 20 (40.8%) | 11 (24.4%) |
| 75 Years and over | 0 (0.0%) | 17 (85.0%) |
Disability Class: Self-Care Difficulty
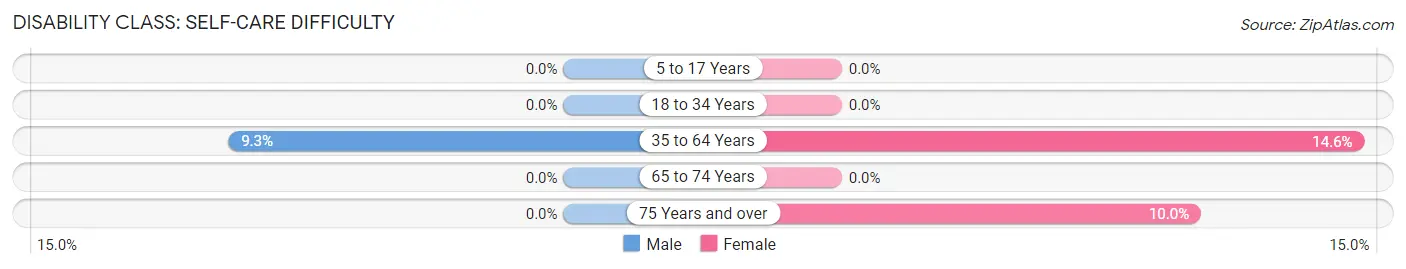
| Age Bracket | Male | Female |
| 5 to 17 Years | 0 (0.0%) | 0 (0.0%) |
| 18 to 34 Years | 0 (0.0%) | 0 (0.0%) |
| 35 to 64 Years | 18 (9.3%) | 32 (14.5%) |
| 65 to 74 Years | 0 (0.0%) | 0 (0.0%) |
| 75 Years and over | 0 (0.0%) | 2 (10.0%) |
Technology Access in Topeka
Computing Device Access in Topeka
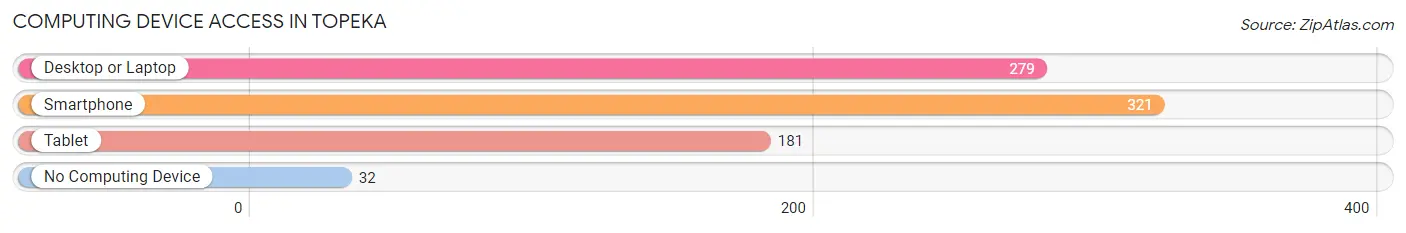
| Device Type | # Households | % Households |
| Desktop or Laptop | 279 | 73.0% |
| Smartphone | 321 | 84.0% |
| Tablet | 181 | 47.4% |
| No Computing Device | 32 | 8.4% |
| Total | 382 | 100.0% |
Internet Access in Topeka
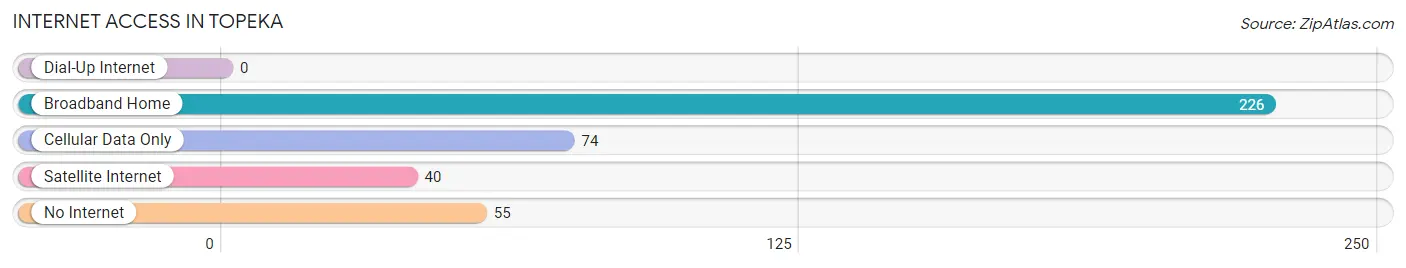
| Internet Type | # Households | % Households |
| Dial-Up Internet | 0 | 0.0% |
| Broadband Home | 226 | 59.2% |
| Cellular Data Only | 74 | 19.4% |
| Satellite Internet | 40 | 10.5% |
| No Internet | 55 | 14.4% |
| Total | 382 | 100.0% |
Topeka Summary
Topeka is a small town located in the state of Indiana, in the United States. It is situated in the northern part of the state, in the county of LaGrange. The town has a population of approximately 1,500 people, and is located in the heart of Amish Country.
History
Topeka was founded in 1837 by a group of settlers from Pennsylvania. The town was named after the Shawnee Indian Chief, Topeka. The settlers were attracted to the area due to its fertile soil and abundant natural resources. The town quickly grew and became a thriving agricultural center.
In the late 19th century, Topeka was a major stop on the Wabash and Erie Canal. The canal was used to transport goods and people between the Great Lakes and the Ohio River. The town also had a thriving lumber industry, which provided jobs for many of the town’s residents.
In the early 20th century, Topeka experienced a period of growth and prosperity. The town was home to several factories, including a flour mill, a furniture factory, and a canning factory. The town also had a thriving retail sector, with several stores and shops.
Geography
Topeka is located in the northern part of Indiana, in the county of LaGrange. The town is situated on the banks of the Elkhart River, which flows through the town. The town is surrounded by rolling hills and farmland. The town is located approximately 40 miles from Fort Wayne, Indiana, and approximately 60 miles from Chicago, Illinois.
Economy
The economy of Topeka is largely based on agriculture. The town is home to several farms, which produce a variety of crops, including corn, soybeans, and wheat. The town also has a thriving retail sector, with several stores and shops. The town is also home to several manufacturing companies, which produce a variety of products, including furniture, clothing, and food products.
Demographics
As of the 2010 census, the population of Topeka was 1,500. The town has a population that is predominantly white, with a small percentage of African Americans and Hispanics. The median household income in the town is $41,000, and the median home value is $90,000. The town has a high school graduation rate of 85%, and a poverty rate of 11%.
Topeka is a small town with a rich history and a vibrant economy. The town is home to a diverse population, and is a great place to live and work. The town has a strong agricultural base, and is home to several manufacturing companies. The town is also home to several stores and shops, and is a great place to shop and dine. Topeka is a great place to call home.
Common Questions
What is Per Capita Income in Topeka?
Per Capita income in Topeka is $27,742.
What is the Median Family Income in Topeka?
Median Family Income in Topeka is $70,833.
What is the Median Household income in Topeka?
Median Household Income in Topeka is $59,559.
What is Income or Wage Gap in Topeka?
Income or Wage Gap in Topeka is 37.2%.
Women in Topeka earn 62.8 cents for every dollar earned by a man.
What is Family Income Deficit in Topeka?
Family Income Deficit in Topeka is $9,715.
Families that are below poverty line in Topeka earn $9,715 less on average than the poverty threshold level.
What is Inequality or Gini Index in Topeka?
Inequality or Gini Index in Topeka is 0.41.
What is the Total Population of Topeka?
Total Population of Topeka is 1,132.
What is the Total Male Population of Topeka?
Total Male Population of Topeka is 549.
What is the Total Female Population of Topeka?
Total Female Population of Topeka is 583.
What is the Ratio of Males per 100 Females in Topeka?
There are 94.17 Males per 100 Females in Topeka.
What is the Ratio of Females per 100 Males in Topeka?
There are 106.19 Females per 100 Males in Topeka.
What is the Median Population Age in Topeka?
Median Population Age in Topeka is 33.7 Years.
What is the Average Family Size in Topeka
Average Family Size in Topeka is 3.7 People.
What is the Average Household Size in Topeka
Average Household Size in Topeka is 3.0 People.
How Large is the Labor Force in Topeka?
There are 488 People in the Labor Forcein in Topeka.
What is the Percentage of People in the Labor Force in Topeka?
60.8% of People are in the Labor Force in Topeka.
What is the Unemployment Rate in Topeka?
Unemployment Rate in Topeka is 6.4%.