Butler, IN Map & Demographics
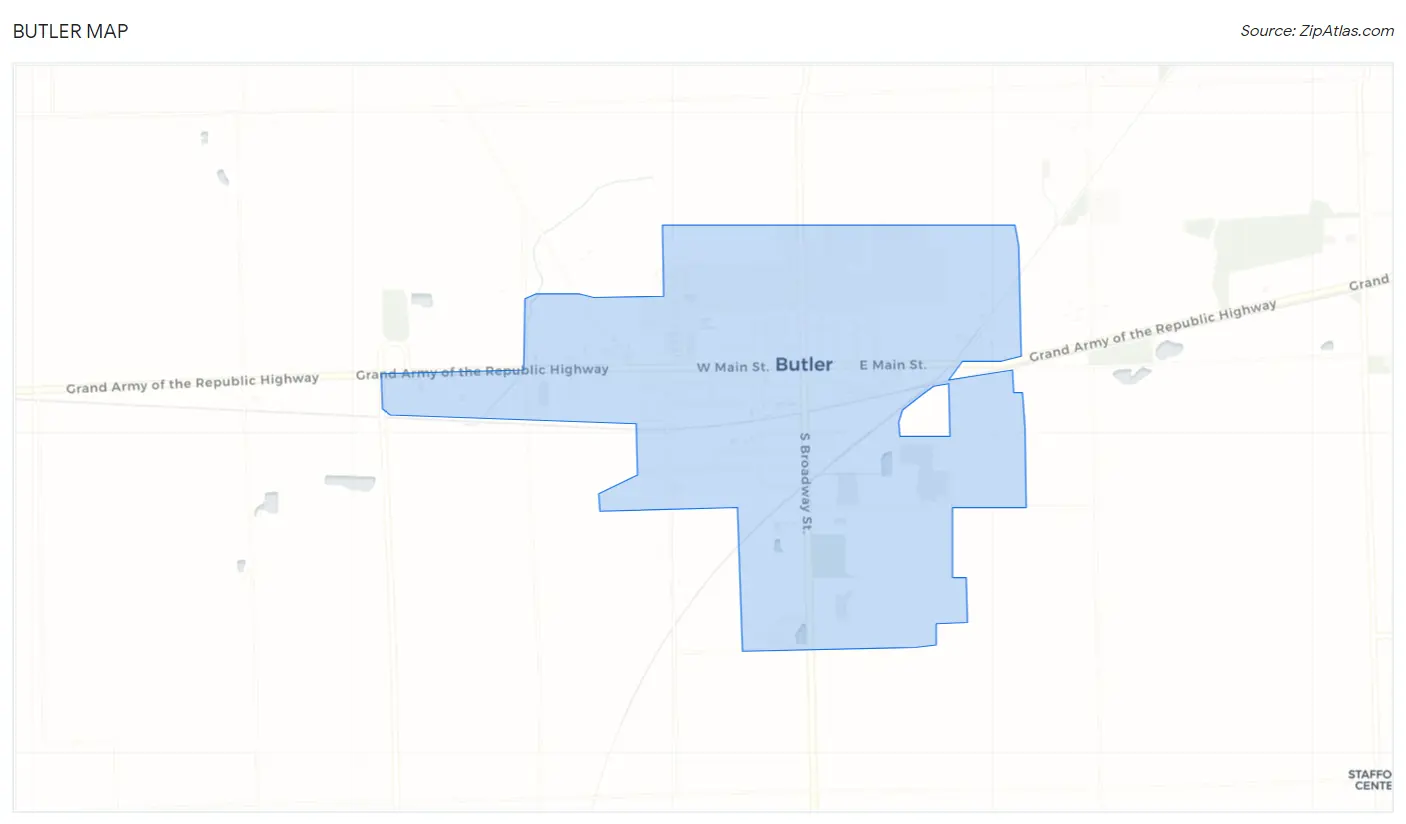
Butler Map
Butler Overview
$24,112
PER CAPITA INCOME
$70,982
AVG FAMILY INCOME
$53,233
AVG HOUSEHOLD INCOME
31.8%
WAGE / INCOME GAP [ % ]
68.2¢/ $1
WAGE / INCOME GAP [ $ ]
0.41
INEQUALITY / GINI INDEX
2,746
TOTAL POPULATION
1,306
MALE POPULATION
1,440
FEMALE POPULATION
90.69
MALES / 100 FEMALES
110.26
FEMALES / 100 MALES
36.8
MEDIAN AGE
3.2
AVG FAMILY SIZE
2.6
AVG HOUSEHOLD SIZE
1,136
LABOR FORCE [ PEOPLE ]
55.3%
PERCENT IN LABOR FORCE
4.0%
UNEMPLOYMENT RATE
Butler Zip Codes
Butler Area Codes
Income in Butler
Income Overview in Butler
Per Capita Income in Butler is $24,112, while median incomes of families and households are $70,982 and $53,233 respectively.
| Characteristic | Number | Measure |
| Per Capita Income | 2,746 | $24,112 |
| Median Family Income | 675 | $70,982 |
| Mean Family Income | 675 | $73,022 |
| Median Household Income | 1,009 | $53,233 |
| Mean Household Income | 1,009 | $62,456 |
| Income Deficit | 675 | $0 |
| Wage / Income Gap (%) | 2,746 | 31.78% |
| Wage / Income Gap ($) | 2,746 | 68.22¢ per $1 |
| Gini / Inequality Index | 2,746 | 0.41 |
Earnings by Sex in Butler
Average Earnings in Butler are $38,633, $45,978 for men and $31,366 for women, a difference of 31.8%.
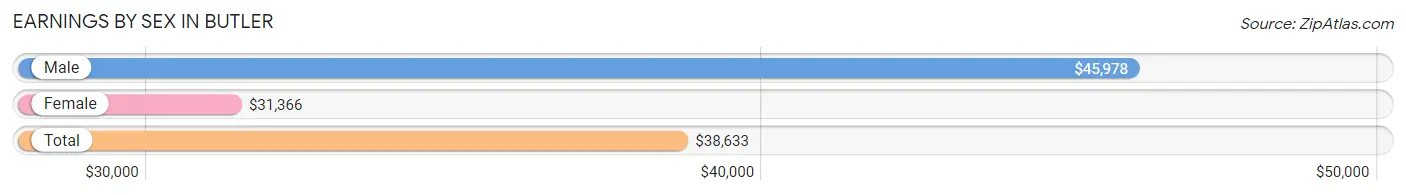
| Sex | Number | Average Earnings |
| Male | 630 (51.3%) | $45,978 |
| Female | 597 (48.7%) | $31,366 |
| Total | 1,227 (100.0%) | $38,633 |
Earnings by Sex by Income Bracket in Butler
The most common earnings brackets in Butler are $75,000 to $99,999 for men (85 | 13.5%) and $30,000 to $34,999 for women (85 | 14.2%).
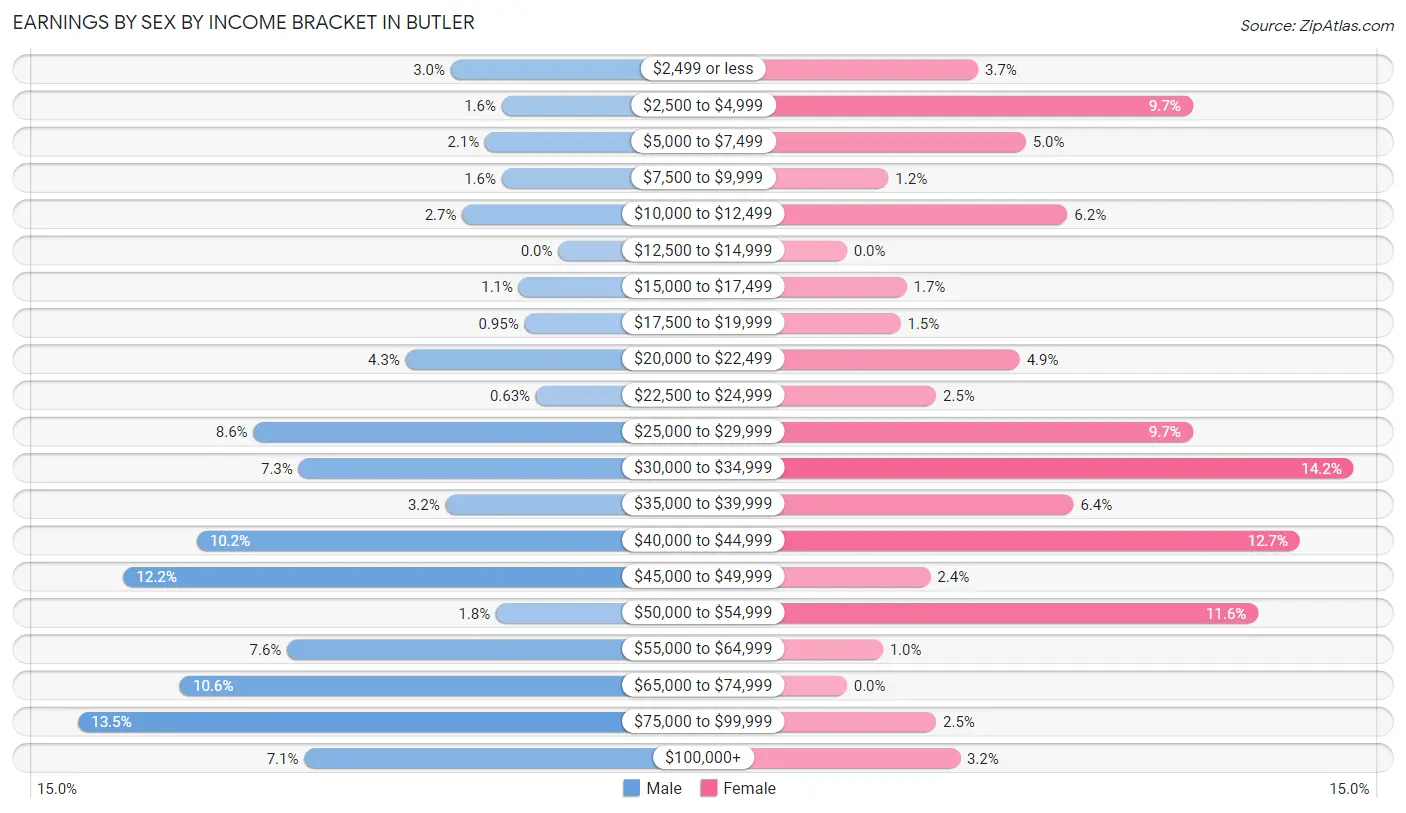
| Income | Male | Female |
| $2,499 or less | 19 (3.0%) | 22 (3.7%) |
| $2,500 to $4,999 | 10 (1.6%) | 58 (9.7%) |
| $5,000 to $7,499 | 13 (2.1%) | 30 (5.0%) |
| $7,500 to $9,999 | 10 (1.6%) | 7 (1.2%) |
| $10,000 to $12,499 | 17 (2.7%) | 37 (6.2%) |
| $12,500 to $14,999 | 0 (0.0%) | 0 (0.0%) |
| $15,000 to $17,499 | 7 (1.1%) | 10 (1.7%) |
| $17,500 to $19,999 | 6 (0.9%) | 9 (1.5%) |
| $20,000 to $22,499 | 27 (4.3%) | 29 (4.9%) |
| $22,500 to $24,999 | 4 (0.6%) | 15 (2.5%) |
| $25,000 to $29,999 | 54 (8.6%) | 58 (9.7%) |
| $30,000 to $34,999 | 46 (7.3%) | 85 (14.2%) |
| $35,000 to $39,999 | 20 (3.2%) | 38 (6.4%) |
| $40,000 to $44,999 | 64 (10.2%) | 76 (12.7%) |
| $45,000 to $49,999 | 77 (12.2%) | 14 (2.4%) |
| $50,000 to $54,999 | 11 (1.8%) | 69 (11.6%) |
| $55,000 to $64,999 | 48 (7.6%) | 6 (1.0%) |
| $65,000 to $74,999 | 67 (10.6%) | 0 (0.0%) |
| $75,000 to $99,999 | 85 (13.5%) | 15 (2.5%) |
| $100,000+ | 45 (7.1%) | 19 (3.2%) |
| Total | 630 (100.0%) | 597 (100.0%) |
Earnings by Sex by Educational Attainment in Butler
Average earnings in Butler are $47,540 for men and $34,201 for women, a difference of 28.1%. Men with an educational attainment of less than high school enjoy the highest average annual earnings of $70,391, while those with high school diploma education earn the least with $42,066. Women with an educational attainment of bachelor's degree earn the most with the average annual earnings of $53,274, while those with less than high school education have the smallest earnings of $25,952.
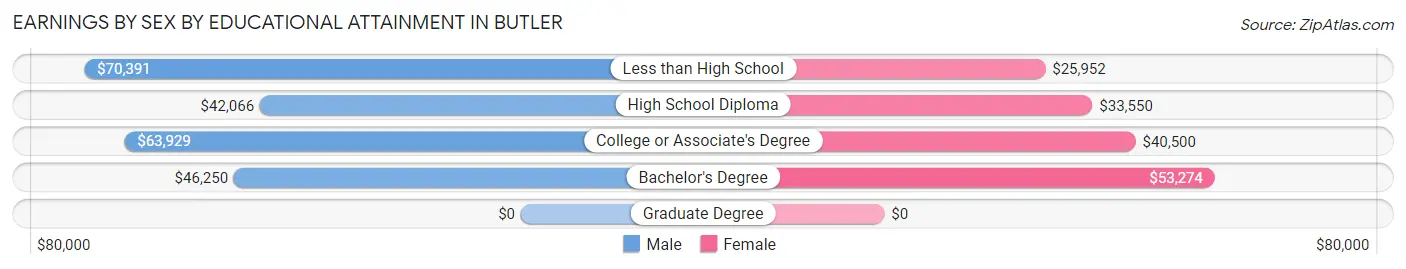
| Educational Attainment | Male Income | Female Income |
| Less than High School | $70,391 | $25,952 |
| High School Diploma | $42,066 | $33,550 |
| College or Associate's Degree | $63,929 | $40,500 |
| Bachelor's Degree | $46,250 | $53,274 |
| Graduate Degree | - | - |
| Total | $47,540 | $34,201 |
Family Income in Butler
Family Income Brackets in Butler
According to the Butler family income data, there are 152 families falling into the $75,000 to $99,999 income range, which is the most common income bracket and makes up 22.5% of all families.
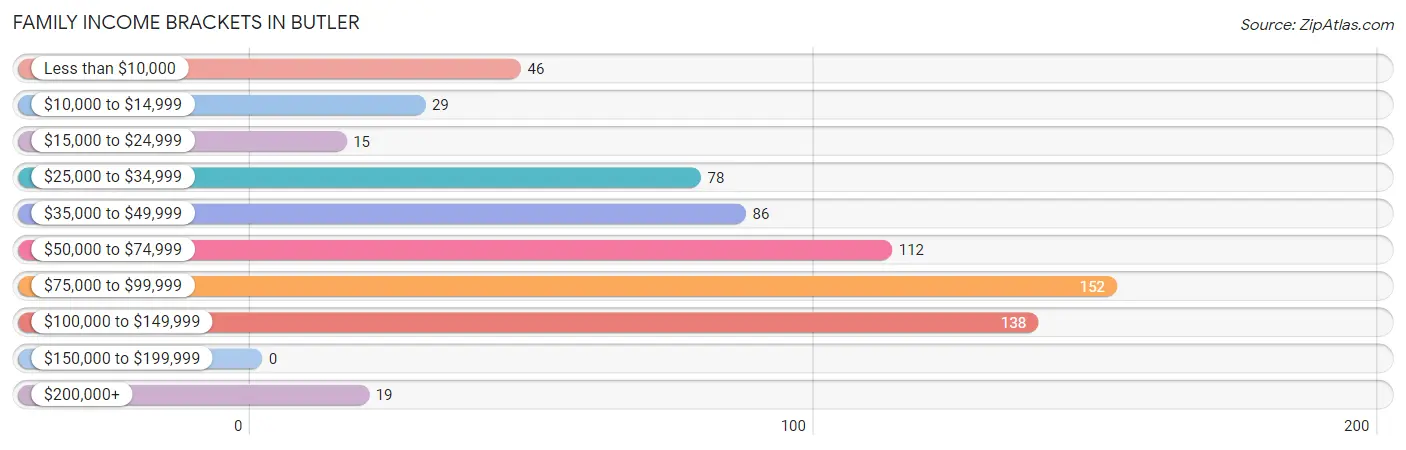
| Income Bracket | # Families | % Families |
| Less than $10,000 | 46 | 6.8% |
| $10,000 to $14,999 | 29 | 4.3% |
| $15,000 to $24,999 | 15 | 2.2% |
| $25,000 to $34,999 | 78 | 11.6% |
| $35,000 to $49,999 | 86 | 12.7% |
| $50,000 to $74,999 | 112 | 16.6% |
| $75,000 to $99,999 | 152 | 22.5% |
| $100,000 to $149,999 | 138 | 20.4% |
| $150,000 to $199,999 | 0 | 0.0% |
| $200,000+ | 19 | 2.8% |
Family Income by Famaliy Size in Butler
4-person families (133 | 19.7%) account for the highest median family income in Butler with $92,951 per family, while 2-person families (248 | 36.7%) have the highest median income of $26,072 per family member.
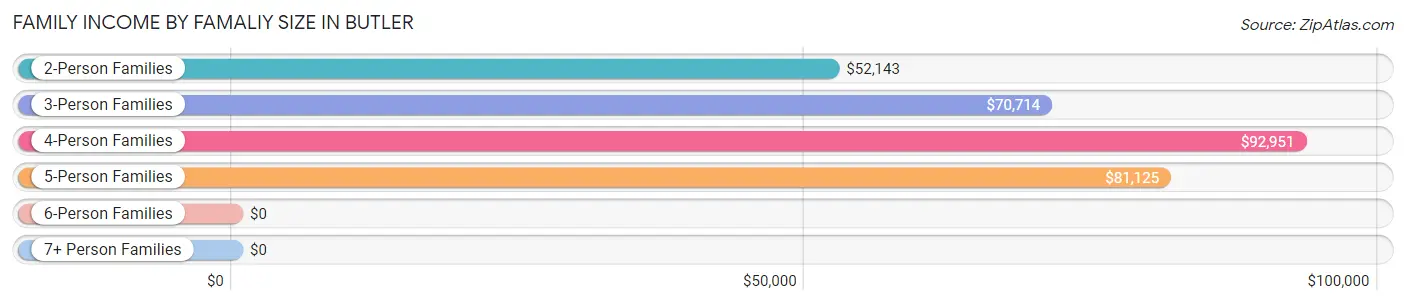
| Income Bracket | # Families | Median Income |
| 2-Person Families | 248 (36.7%) | $52,143 |
| 3-Person Families | 198 (29.3%) | $70,714 |
| 4-Person Families | 133 (19.7%) | $92,951 |
| 5-Person Families | 50 (7.4%) | $81,125 |
| 6-Person Families | 23 (3.4%) | $0 |
| 7+ Person Families | 23 (3.4%) | $0 |
| Total | 675 (100.0%) | $70,982 |
Family Income by Number of Earners in Butler
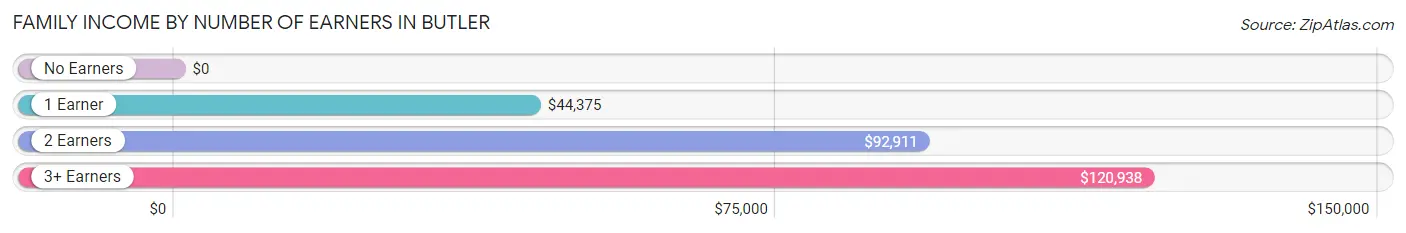
| Number of Earners | # Families | Median Income |
| No Earners | 109 (16.2%) | $0 |
| 1 Earner | 232 (34.4%) | $44,375 |
| 2 Earners | 250 (37.0%) | $92,911 |
| 3+ Earners | 84 (12.4%) | $120,938 |
| Total | 675 (100.0%) | $70,982 |
Household Income in Butler
Household Income Brackets in Butler
With 173 households falling in the category, the $100,000 to $149,999 income range is the most frequent in Butler, accounting for 17.2% of all households.
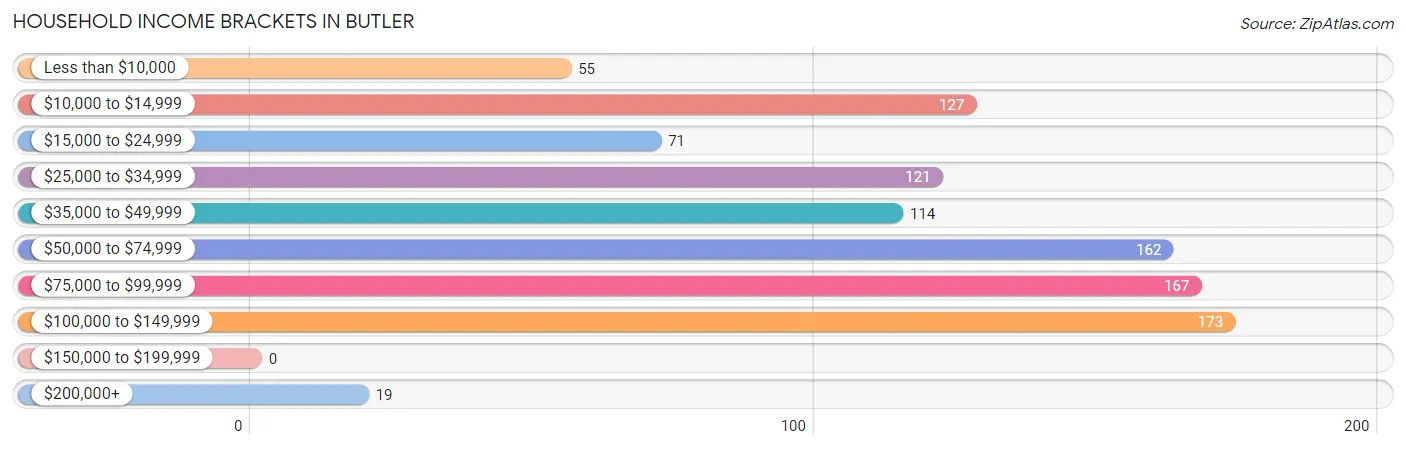
| Income Bracket | # Households | % Households |
| Less than $10,000 | 55 | 5.5% |
| $10,000 to $14,999 | 127 | 12.6% |
| $15,000 to $24,999 | 71 | 7.0% |
| $25,000 to $34,999 | 121 | 12.0% |
| $35,000 to $49,999 | 114 | 11.3% |
| $50,000 to $74,999 | 162 | 16.1% |
| $75,000 to $99,999 | 167 | 16.6% |
| $100,000 to $149,999 | 173 | 17.1% |
| $150,000 to $199,999 | 0 | 0.0% |
| $200,000+ | 19 | 1.9% |
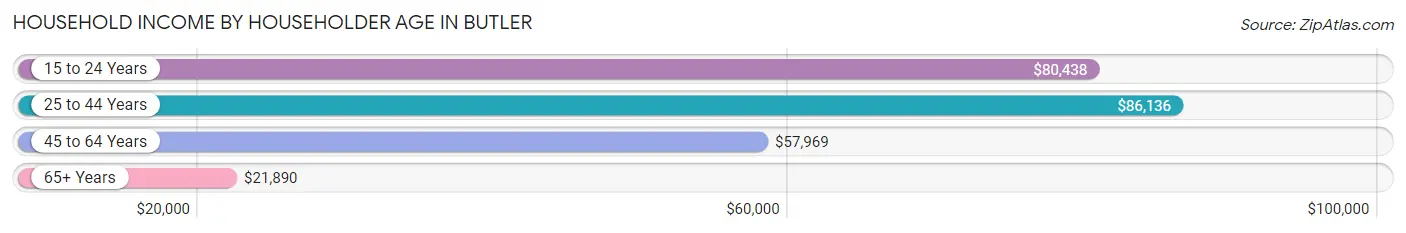
Household Income by Householder Age in Butler
The median household income in Butler is $53,233, with the highest median household income of $86,136 found in the 25 to 44 years age bracket for the primary householder. A total of 360 households (35.7%) fall into this category. Meanwhile, the 65+ years age bracket for the primary householder has the lowest median household income of $21,890, with 259 households (25.7%) in this group.
| Income Bracket | # Households | Median Income |
| 15 to 24 Years | 49 (4.9%) | $80,438 |
| 25 to 44 Years | 360 (35.7%) | $86,136 |
| 45 to 64 Years | 341 (33.8%) | $57,969 |
| 65+ Years | 259 (25.7%) | $21,890 |
| Total | 1,009 (100.0%) | $53,233 |
Poverty in Butler
Income Below Poverty by Sex and Age in Butler
With 13.0% poverty level for males and 28.4% for females among the residents of Butler, 16 and 17 year old males and 6 to 11 year old females are the most vulnerable to poverty, with 14 males (28.6%) and 101 females (66.0%) in their respective age groups living below the poverty level.
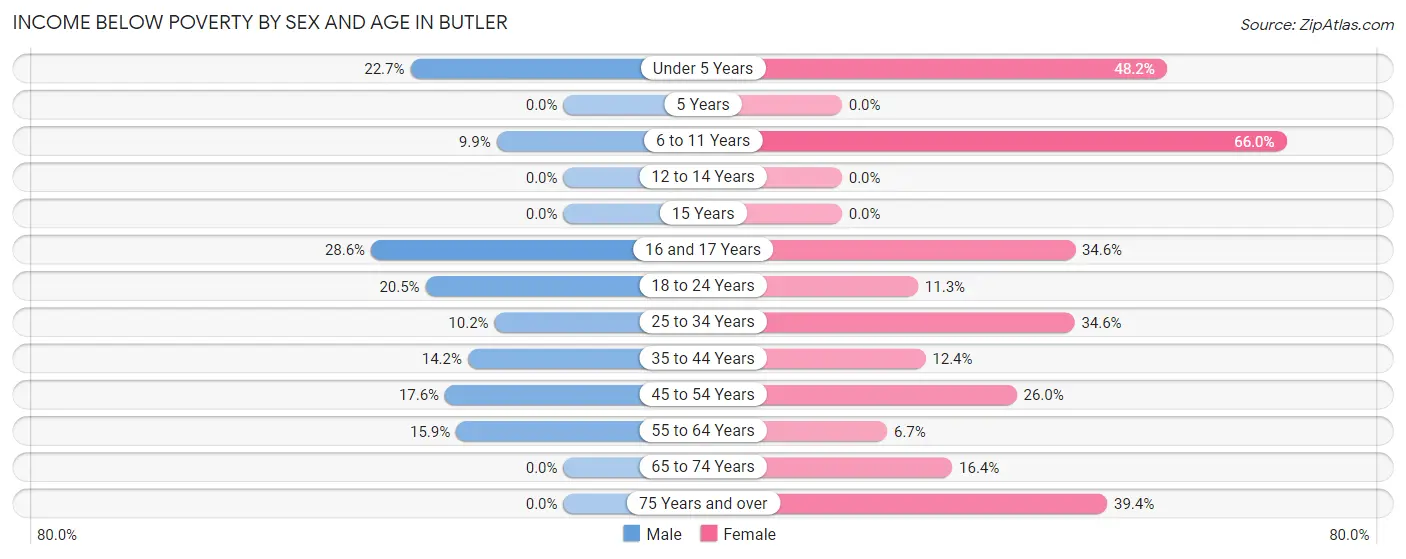
| Age Bracket | Male | Female |
| Under 5 Years | 20 (22.7%) | 68 (48.2%) |
| 5 Years | 0 (0.0%) | 0 (0.0%) |
| 6 to 11 Years | 15 (9.9%) | 101 (66.0%) |
| 12 to 14 Years | 0 (0.0%) | 0 (0.0%) |
| 15 Years | 0 (0.0%) | 0 (0.0%) |
| 16 and 17 Years | 14 (28.6%) | 18 (34.6%) |
| 18 to 24 Years | 17 (20.5%) | 13 (11.3%) |
| 25 to 34 Years | 17 (10.2%) | 66 (34.5%) |
| 35 to 44 Years | 21 (14.2%) | 18 (12.4%) |
| 45 to 54 Years | 32 (17.6%) | 41 (26.0%) |
| 55 to 64 Years | 29 (15.9%) | 9 (6.7%) |
| 65 to 74 Years | 0 (0.0%) | 19 (16.4%) |
| 75 Years and over | 0 (0.0%) | 39 (39.4%) |
| Total | 165 (13.0%) | 392 (28.4%) |
Income Above Poverty by Sex and Age in Butler
According to the poverty statistics in Butler, males aged 5 years and females aged 5 years are the age groups that are most secure financially, with 100.0% of males and 100.0% of females in these age groups living above the poverty line.
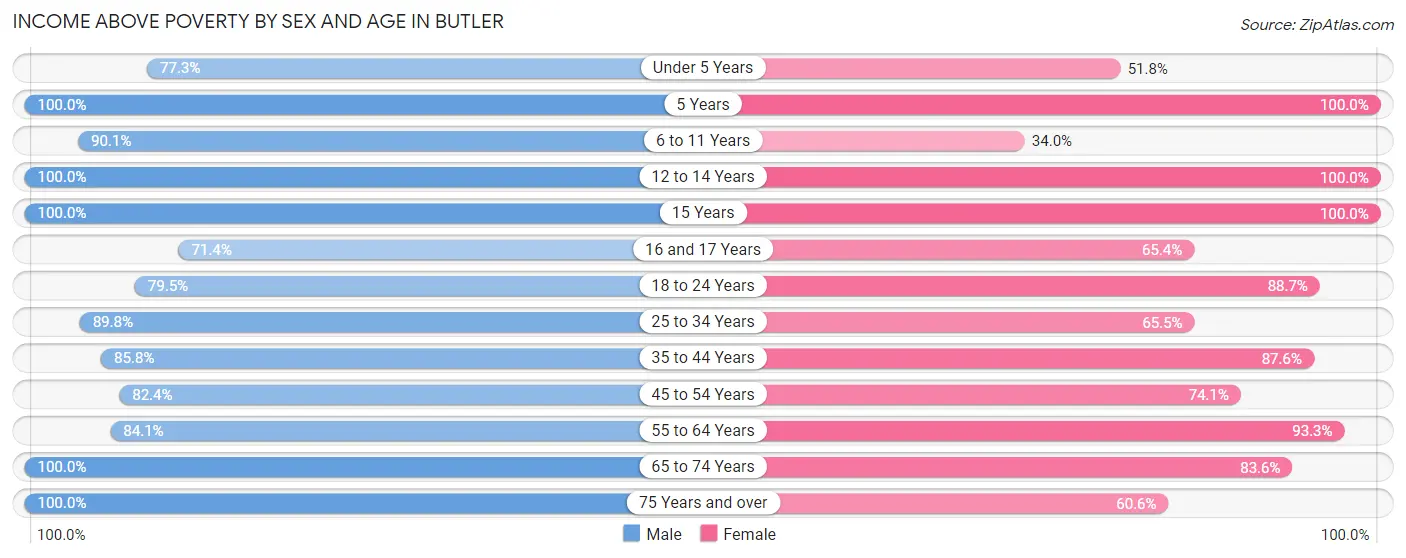
| Age Bracket | Male | Female |
| Under 5 Years | 68 (77.3%) | 73 (51.8%) |
| 5 Years | 13 (100.0%) | 12 (100.0%) |
| 6 to 11 Years | 136 (90.1%) | 52 (34.0%) |
| 12 to 14 Years | 32 (100.0%) | 18 (100.0%) |
| 15 Years | 39 (100.0%) | 44 (100.0%) |
| 16 and 17 Years | 35 (71.4%) | 34 (65.4%) |
| 18 to 24 Years | 66 (79.5%) | 102 (88.7%) |
| 25 to 34 Years | 149 (89.8%) | 125 (65.4%) |
| 35 to 44 Years | 127 (85.8%) | 127 (87.6%) |
| 45 to 54 Years | 150 (82.4%) | 117 (74.1%) |
| 55 to 64 Years | 153 (84.1%) | 125 (93.3%) |
| 65 to 74 Years | 66 (100.0%) | 97 (83.6%) |
| 75 Years and over | 66 (100.0%) | 60 (60.6%) |
| Total | 1,100 (87.0%) | 986 (71.6%) |
Income Below Poverty Among Married-Couple Families in Butler
The poverty statistics for married-couple families in Butler show that 3.0% or 12 of the total 405 families live below the poverty line. Families with 1 or 2 children have the highest poverty rate of 7.3%, comprising of 12 families. On the other hand, families with no children have the lowest poverty rate of 0.0%, which includes 0 families.
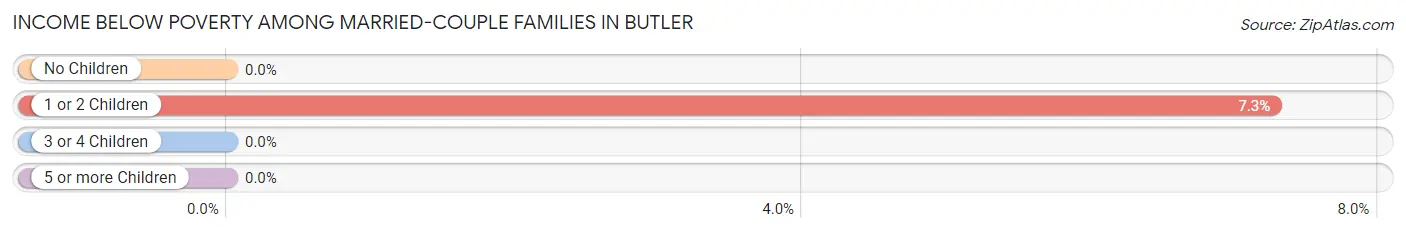
| Children | Above Poverty | Below Poverty |
| No Children | 190 (100.0%) | 0 (0.0%) |
| 1 or 2 Children | 153 (92.7%) | 12 (7.3%) |
| 3 or 4 Children | 41 (100.0%) | 0 (0.0%) |
| 5 or more Children | 9 (100.0%) | 0 (0.0%) |
| Total | 393 (97.0%) | 12 (3.0%) |
Income Below Poverty Among Single-Parent Households in Butler
According to the poverty data in Butler, 32.8% or 43 single-father households and 30.9% or 43 single-mother households are living below the poverty line. Among single-father households, those with 3 or 4 children have the highest poverty rate, with 14 households (100.0%) experiencing poverty. Likewise, among single-mother households, those with 3 or 4 children have the highest poverty rate, with 11 households (100.0%) falling below the poverty line.
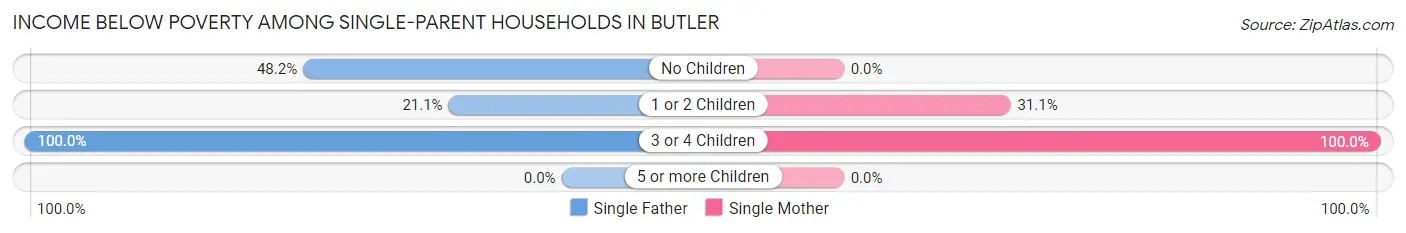
| Children | Single Father | Single Mother |
| No Children | 13 (48.1%) | 0 (0.0%) |
| 1 or 2 Children | 16 (21.0%) | 32 (31.1%) |
| 3 or 4 Children | 14 (100.0%) | 11 (100.0%) |
| 5 or more Children | 0 (0.0%) | 0 (0.0%) |
| Total | 43 (32.8%) | 43 (30.9%) |
Income Below Poverty Among Married-Couple vs Single-Parent Households in Butler
The poverty data for Butler shows that 12 of the married-couple family households (3.0%) and 86 of the single-parent households (31.9%) are living below the poverty level. Within the married-couple family households, those with 1 or 2 children have the highest poverty rate, with 12 households (7.3%) falling below the poverty line. Among the single-parent households, those with 3 or 4 children have the highest poverty rate, with 25 household (100.0%) living below poverty.
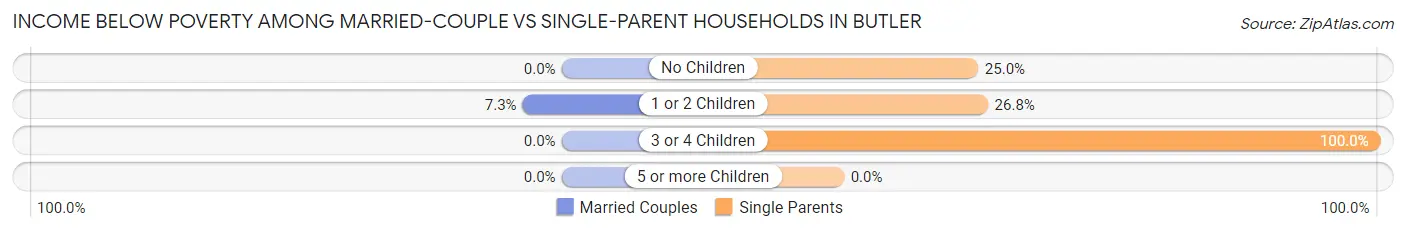
| Children | Married-Couple Families | Single-Parent Households |
| No Children | 0 (0.0%) | 13 (25.0%) |
| 1 or 2 Children | 12 (7.3%) | 48 (26.8%) |
| 3 or 4 Children | 0 (0.0%) | 25 (100.0%) |
| 5 or more Children | 0 (0.0%) | 0 (0.0%) |
| Total | 12 (3.0%) | 86 (31.9%) |
Race in Butler
The most populous races in Butler are White / Caucasian (2,656 | 96.7%), Two or more Races (74 | 2.7%), and Hispanic or Latino (71 | 2.6%).
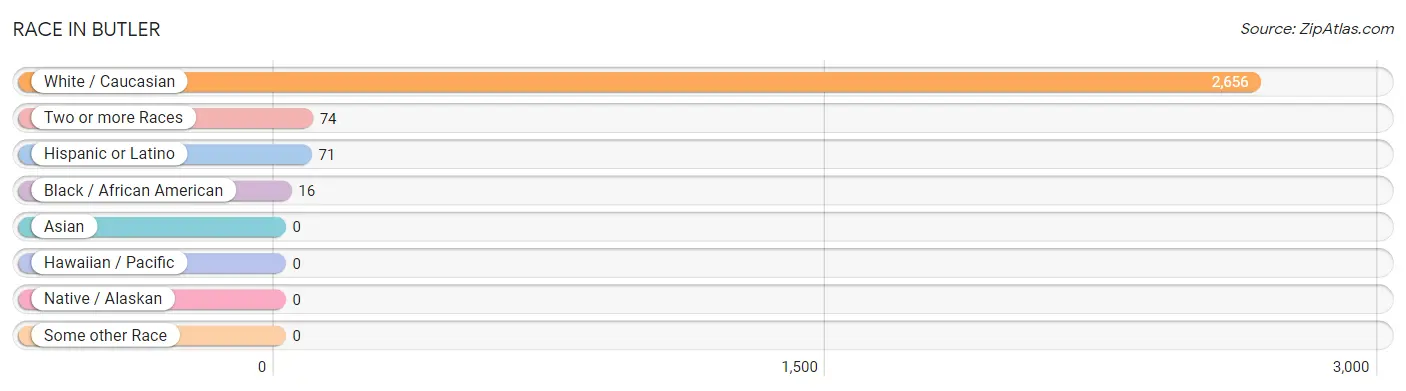
| Race | # Population | % Population |
| Asian | 0 | 0.0% |
| Black / African American | 16 | 0.6% |
| Hawaiian / Pacific | 0 | 0.0% |
| Hispanic or Latino | 71 | 2.6% |
| Native / Alaskan | 0 | 0.0% |
| White / Caucasian | 2,656 | 96.7% |
| Two or more Races | 74 | 2.7% |
| Some other Race | 0 | 0.0% |
| Total | 2,746 | 100.0% |
Ancestry in Butler
The most populous ancestries reported in Butler are German (815 | 29.7%), Irish (427 | 15.5%), English (365 | 13.3%), American (258 | 9.4%), and European (80 | 2.9%), together accounting for 70.8% of all Butler residents.
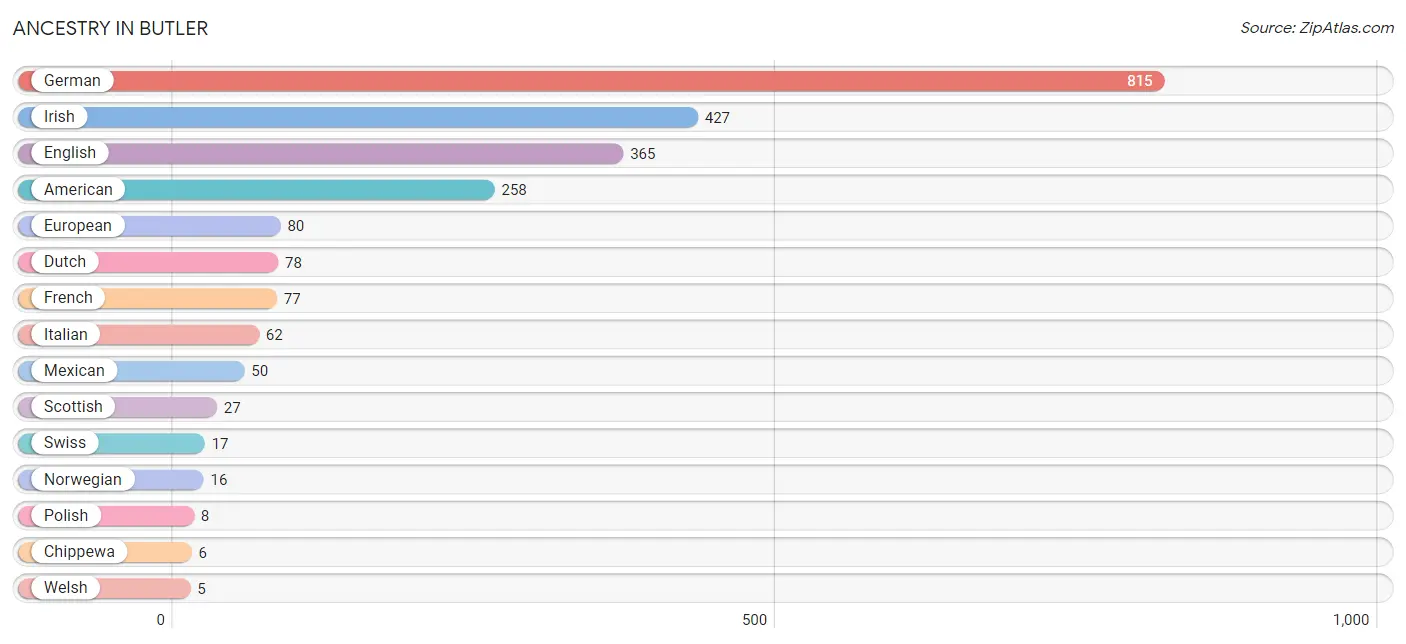
| Ancestry | # Population | % Population |
| American | 258 | 9.4% |
| Chippewa | 6 | 0.2% |
| Crow | 4 | 0.2% |
| Dutch | 78 | 2.8% |
| English | 365 | 13.3% |
| European | 80 | 2.9% |
| French | 77 | 2.8% |
| French Canadian | 4 | 0.2% |
| German | 815 | 29.7% |
| Irish | 427 | 15.5% |
| Italian | 62 | 2.3% |
| Mexican | 50 | 1.8% |
| Norwegian | 16 | 0.6% |
| Polish | 8 | 0.3% |
| Scottish | 27 | 1.0% |
| Swiss | 17 | 0.6% |
| Welsh | 5 | 0.2% | View All 17 Rows |
Immigrants in Butler
The most numerous immigrant groups reported in Butler came from Europe (17 | 0.6%), and Northern Europe (17 | 0.6%), together accounting for 1.2% of all Butler residents.
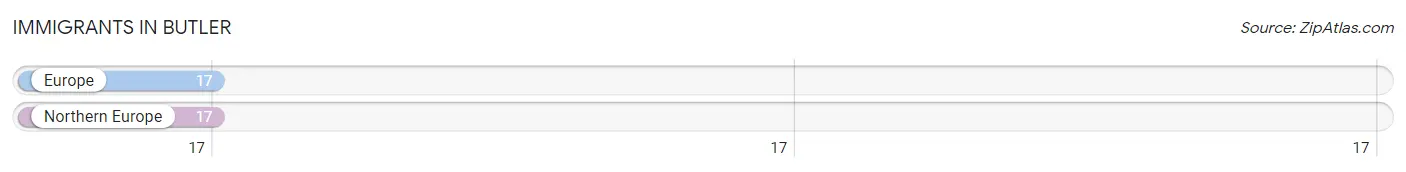
| Immigration Origin | # Population | % Population |
| Europe | 17 | 0.6% |
| Northern Europe | 17 | 0.6% | View All 2 Rows |
Sex and Age in Butler
Sex and Age in Butler
The most populous age groups in Butler are 5 to 9 Years (128 | 9.8%) for men and Under 5 Years (141 | 9.8%) for women.
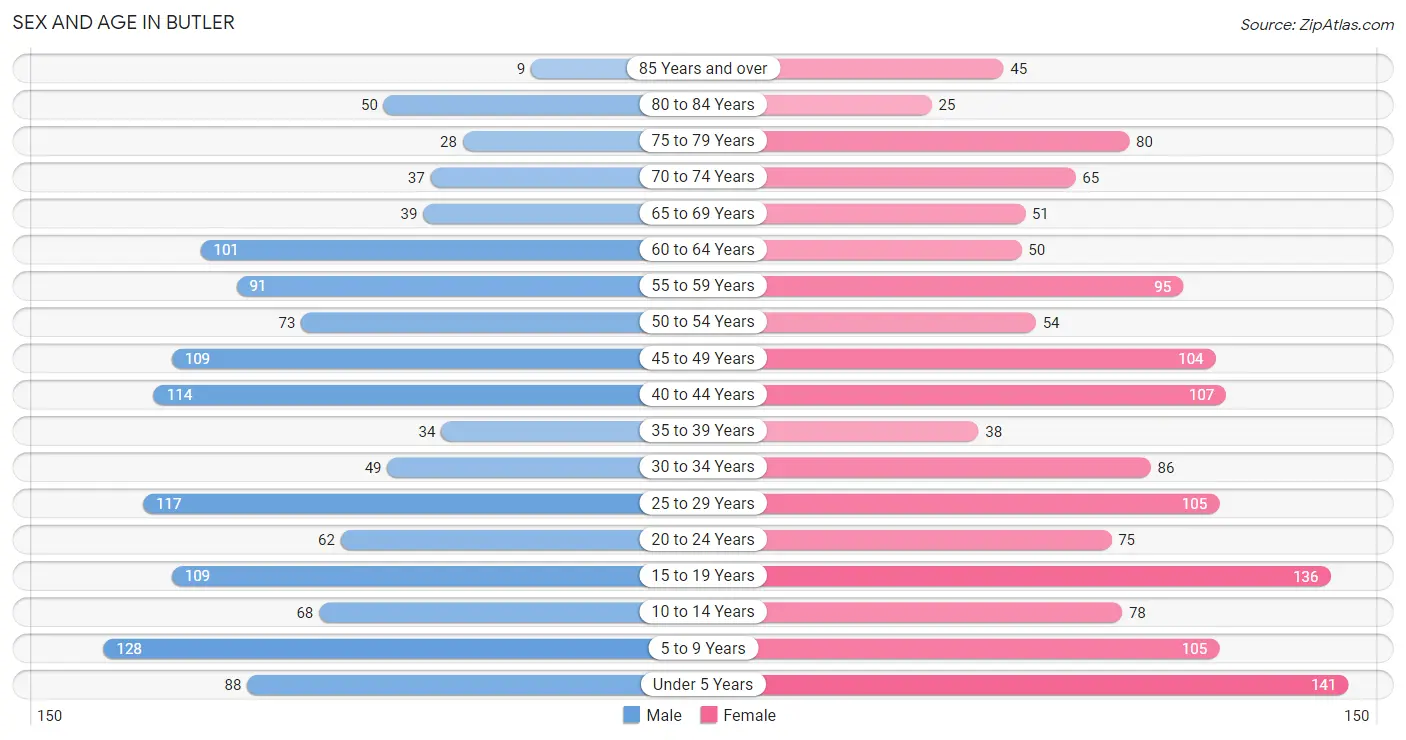
| Age Bracket | Male | Female |
| Under 5 Years | 88 (6.7%) | 141 (9.8%) |
| 5 to 9 Years | 128 (9.8%) | 105 (7.3%) |
| 10 to 14 Years | 68 (5.2%) | 78 (5.4%) |
| 15 to 19 Years | 109 (8.4%) | 136 (9.4%) |
| 20 to 24 Years | 62 (4.8%) | 75 (5.2%) |
| 25 to 29 Years | 117 (9.0%) | 105 (7.3%) |
| 30 to 34 Years | 49 (3.7%) | 86 (6.0%) |
| 35 to 39 Years | 34 (2.6%) | 38 (2.6%) |
| 40 to 44 Years | 114 (8.7%) | 107 (7.4%) |
| 45 to 49 Years | 109 (8.4%) | 104 (7.2%) |
| 50 to 54 Years | 73 (5.6%) | 54 (3.7%) |
| 55 to 59 Years | 91 (7.0%) | 95 (6.6%) |
| 60 to 64 Years | 101 (7.7%) | 50 (3.5%) |
| 65 to 69 Years | 39 (3.0%) | 51 (3.5%) |
| 70 to 74 Years | 37 (2.8%) | 65 (4.5%) |
| 75 to 79 Years | 28 (2.1%) | 80 (5.6%) |
| 80 to 84 Years | 50 (3.8%) | 25 (1.7%) |
| 85 Years and over | 9 (0.7%) | 45 (3.1%) |
| Total | 1,306 (100.0%) | 1,440 (100.0%) |
Families and Households in Butler
Median Family Size in Butler
The median family size in Butler is 3.17 persons per family, with single female/mother families (139 | 20.6%) accounting for the largest median family size of 3.5 persons per family. On the other hand, married-couple families (405 | 60.0%) represent the smallest median family size with 3.04 persons per family.
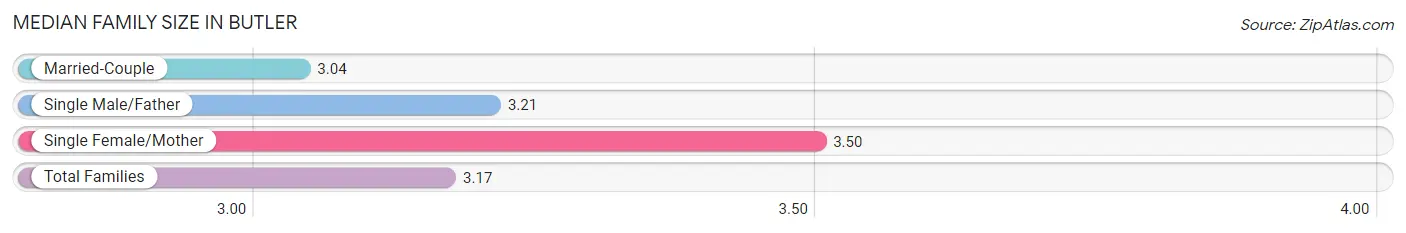
| Family Type | # Families | Family Size |
| Married-Couple | 405 (60.0%) | 3.04 |
| Single Male/Father | 131 (19.4%) | 3.21 |
| Single Female/Mother | 139 (20.6%) | 3.50 |
| Total Families | 675 (100.0%) | 3.17 |
Median Household Size in Butler
The median household size in Butler is 2.61 persons per household, with single female/mother households (139 | 13.8%) accounting for the largest median household size of 3.68 persons per household. non-family households (334 | 33.1%) represent the smallest median household size with 1.25 persons per household.
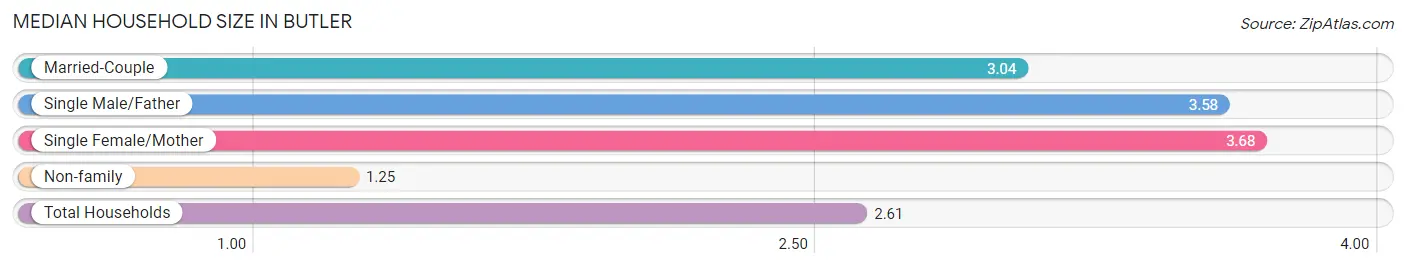
| Household Type | # Households | Household Size |
| Married-Couple | 405 (40.1%) | 3.04 |
| Single Male/Father | 131 (13.0%) | 3.58 |
| Single Female/Mother | 139 (13.8%) | 3.68 |
| Non-family | 334 (33.1%) | 1.25 |
| Total Households | 1,009 (100.0%) | 2.61 |
Household Size by Marriage Status in Butler
Out of a total of 1,009 households in Butler, 675 (66.9%) are family households, while 334 (33.1%) are nonfamily households. The most numerous type of family households are 2-person households, comprising 220, and the most common type of nonfamily households are 1-person households, comprising 277.
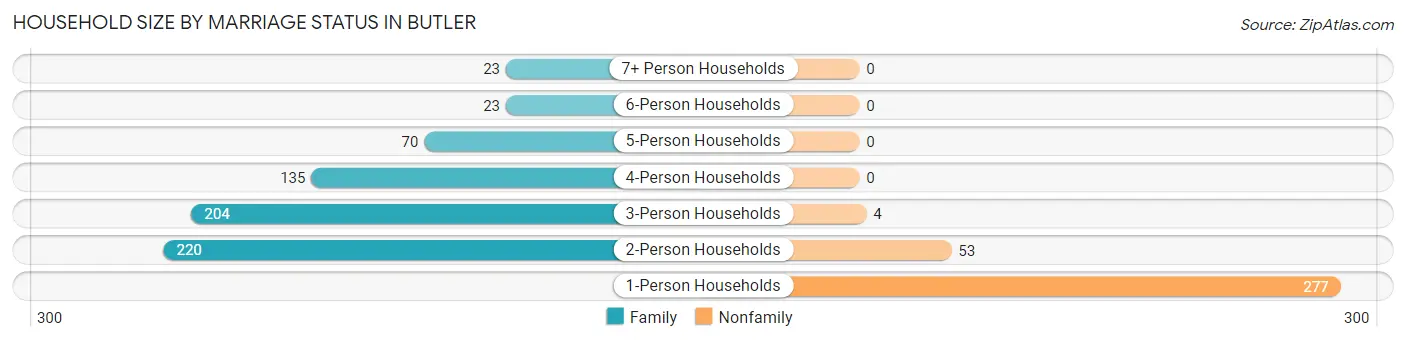
| Household Size | Family Households | Nonfamily Households |
| 1-Person Households | - | 277 (27.5%) |
| 2-Person Households | 220 (21.8%) | 53 (5.2%) |
| 3-Person Households | 204 (20.2%) | 4 (0.4%) |
| 4-Person Households | 135 (13.4%) | 0 (0.0%) |
| 5-Person Households | 70 (6.9%) | 0 (0.0%) |
| 6-Person Households | 23 (2.3%) | 0 (0.0%) |
| 7+ Person Households | 23 (2.3%) | 0 (0.0%) |
| Total | 675 (66.9%) | 334 (33.1%) |
Female Fertility in Butler
Fertility by Age in Butler
Average fertility rate in Butler is 40.0 births per 1,000 women. Women in the age bracket of 20 to 34 years have the highest fertility rate with 102.0 births per 1,000 women. Women in the age bracket of 20 to 34 years acount for 100.0% of all women with births.
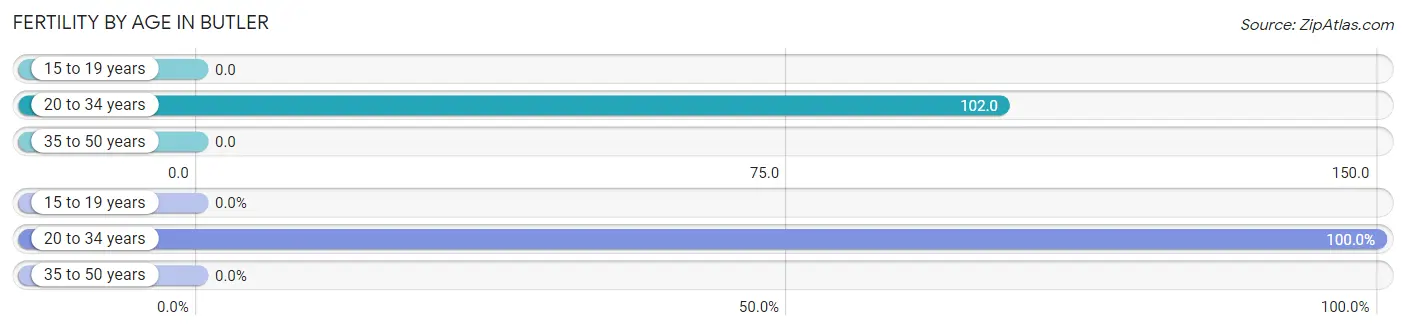
| Age Bracket | Women with Births | Births / 1,000 Women |
| 15 to 19 years | 0 (0.0%) | 0.0 |
| 20 to 34 years | 27 (100.0%) | 102.0 |
| 35 to 50 years | 0 (0.0%) | 0.0 |
| Total | 27 (100.0%) | 40.0 |
Fertility by Age by Marriage Status in Butler
44.4% of women with births (27) in Butler are married. The highest percentage of unmarried women with births falls into 20 to 34 years age bracket with 55.6% of them unmarried at the time of birth, while the lowest percentage of unmarried women with births belong to 20 to 34 years age bracket with 55.6% of them unmarried.
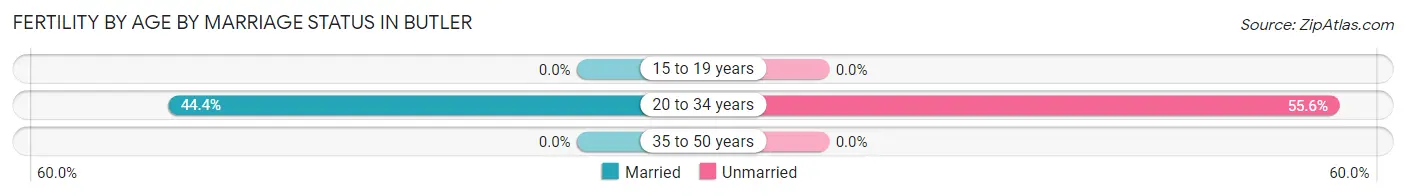
| Age Bracket | Married | Unmarried |
| 15 to 19 years | 0 (0.0%) | 0 (0.0%) |
| 20 to 34 years | 12 (44.4%) | 15 (55.6%) |
| 35 to 50 years | 0 (0.0%) | 0 (0.0%) |
| Total | 12 (44.4%) | 15 (55.6%) |
Fertility by Education in Butler
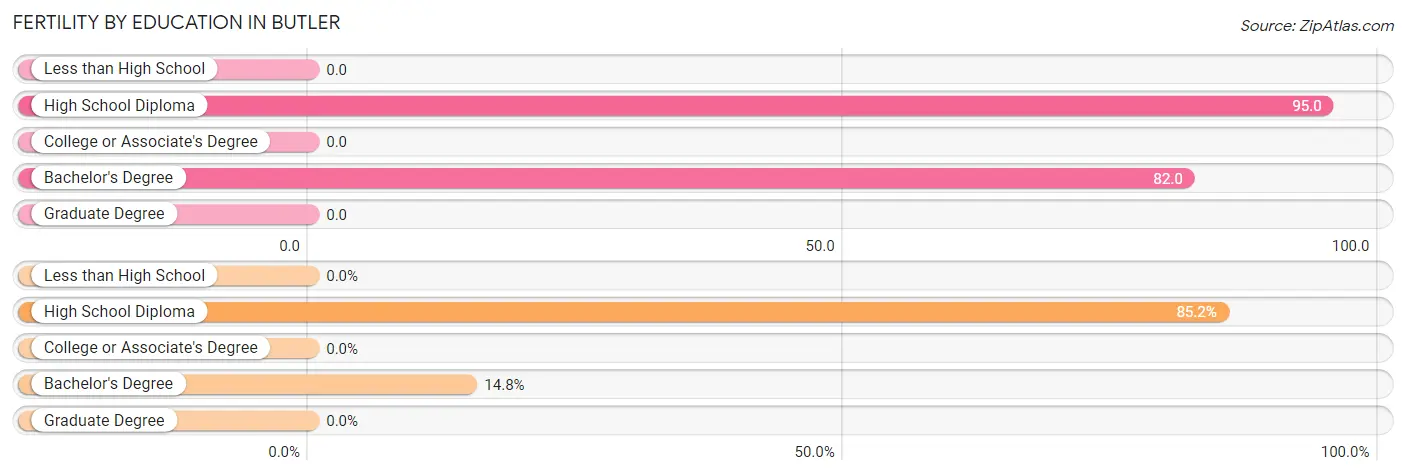
| Educational Attainment | Women with Births | Births / 1,000 Women |
| Less than High School | 0 (0.0%) | 0.0 |
| High School Diploma | 23 (85.2%) | 95.0 |
| College or Associate's Degree | 0 (0.0%) | 0.0 |
| Bachelor's Degree | 4 (14.8%) | 82.0 |
| Graduate Degree | 0 (0.0%) | 0.0 |
| Total | 27 (100.0%) | 40.0 |
Fertility by Education by Marriage Status in Butler
55.6% of women with births in Butler are unmarried. Women with the educational attainment of bachelor's degree are most likely to be married with 100.0% of them married at childbirth, while women with the educational attainment of high school diploma are least likely to be married with 65.2% of them unmarried at childbirth.
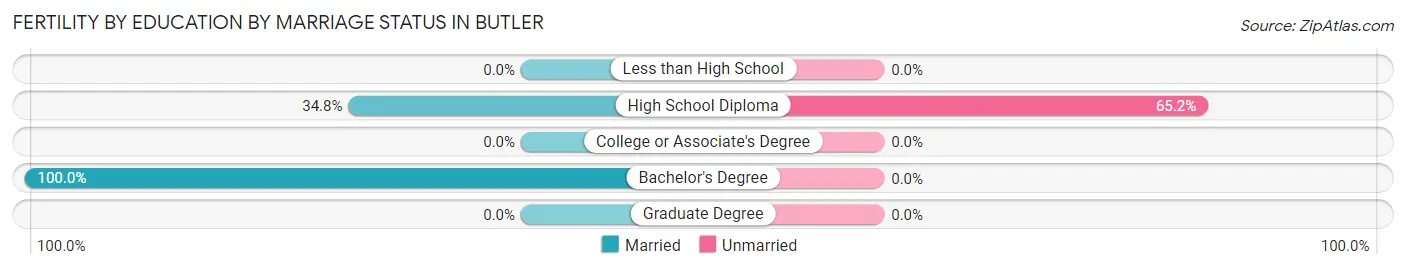
| Educational Attainment | Married | Unmarried |
| Less than High School | 0 (0.0%) | 0 (0.0%) |
| High School Diploma | 8 (34.8%) | 15 (65.2%) |
| College or Associate's Degree | 0 (0.0%) | 0 (0.0%) |
| Bachelor's Degree | 4 (100.0%) | 0 (0.0%) |
| Graduate Degree | 0 (0.0%) | 0 (0.0%) |
| Total | 12 (44.4%) | 15 (55.6%) |
Employment Characteristics in Butler
Employment by Class of Employer in Butler
Among the 1,083 employed individuals in Butler, private company employees (868 | 80.1%), local government employees (79 | 7.3%), and not-for-profit organizations (67 | 6.2%) make up the most common classes of employment.
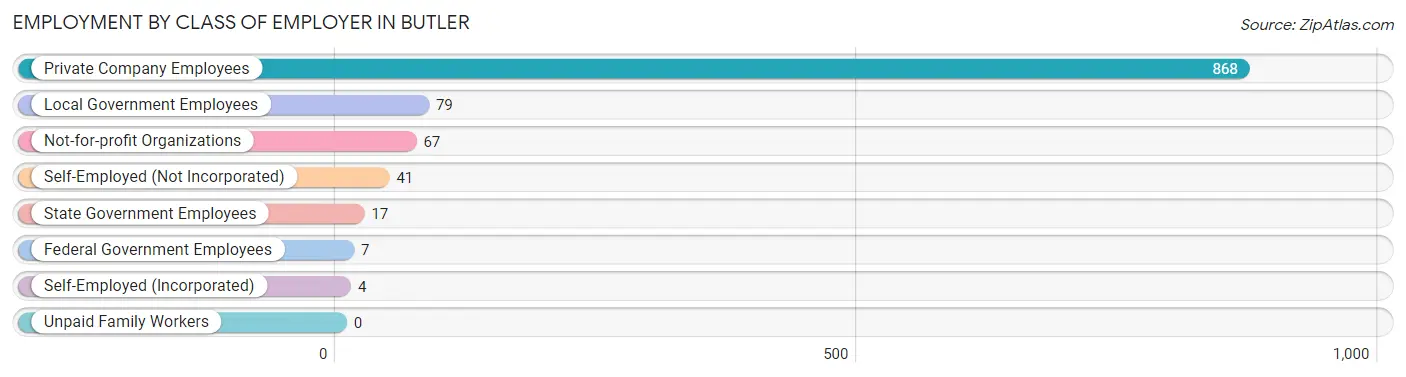
| Employer Class | # Employees | % Employees |
| Private Company Employees | 868 | 80.1% |
| Self-Employed (Incorporated) | 4 | 0.4% |
| Self-Employed (Not Incorporated) | 41 | 3.8% |
| Not-for-profit Organizations | 67 | 6.2% |
| Local Government Employees | 79 | 7.3% |
| State Government Employees | 17 | 1.6% |
| Federal Government Employees | 7 | 0.6% |
| Unpaid Family Workers | 0 | 0.0% |
| Total | 1,083 | 100.0% |
Employment Status by Age in Butler
According to the labor force statistics for Butler, out of the total population over 16 years of age (2,055), 55.3% or 1,136 individuals are in the labor force, with 4.0% or 45 of them unemployed. The age group with the highest labor force participation rate is 30 to 34 years, with 91.1% or 123 individuals in the labor force. Within the labor force, the 20 to 24 years age range has the highest percentage of unemployed individuals, with 14.3% or 13 of them being unemployed.
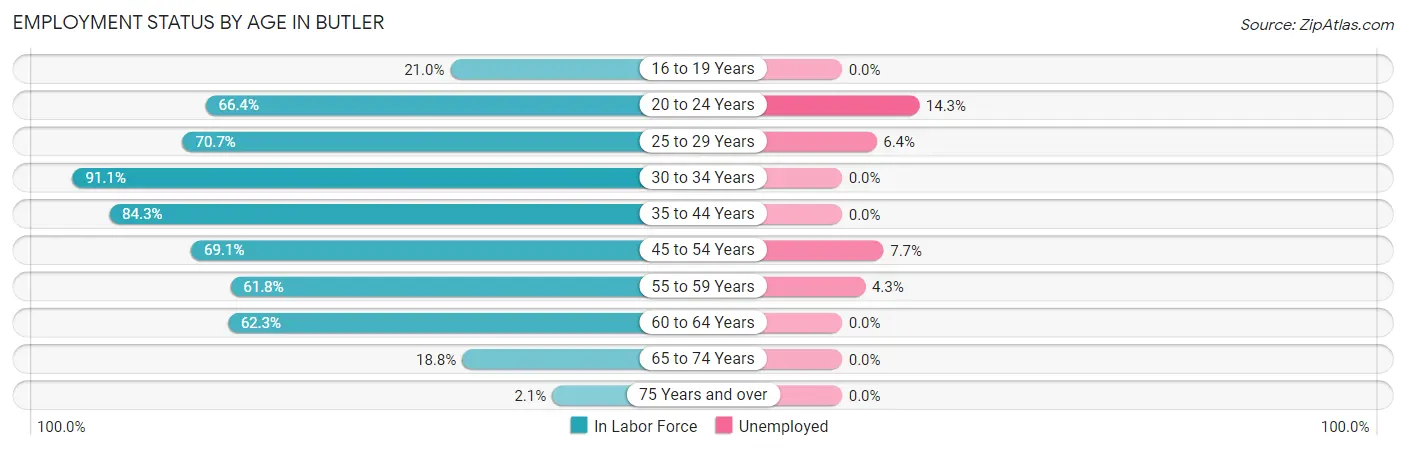
| Age Bracket | In Labor Force | Unemployed |
| 16 to 19 Years | 34 (21.0%) | 0 (0.0%) |
| 20 to 24 Years | 91 (66.4%) | 13 (14.3%) |
| 25 to 29 Years | 157 (70.7%) | 10 (6.4%) |
| 30 to 34 Years | 123 (91.1%) | 0 (0.0%) |
| 35 to 44 Years | 247 (84.3%) | 0 (0.0%) |
| 45 to 54 Years | 235 (69.1%) | 18 (7.7%) |
| 55 to 59 Years | 115 (61.8%) | 5 (4.3%) |
| 60 to 64 Years | 94 (62.3%) | 0 (0.0%) |
| 65 to 74 Years | 36 (18.8%) | 0 (0.0%) |
| 75 Years and over | 5 (2.1%) | 0 (0.0%) |
| Total | 1,136 (55.3%) | 45 (4.0%) |
Employment Status by Educational Attainment in Butler
According to labor force statistics for Butler, 73.2% of individuals (971) out of the total population between 25 and 64 years of age (1,327) are in the labor force, with 3.4% or 33 of them being unemployed. The group with the highest labor force participation rate are those with the educational attainment of bachelor's degree or higher, with 99.2% or 120 individuals in the labor force. Within the labor force, individuals with bachelor's degree or higher education have the highest percentage of unemployment, with 5.0% or 6 of them being unemployed.
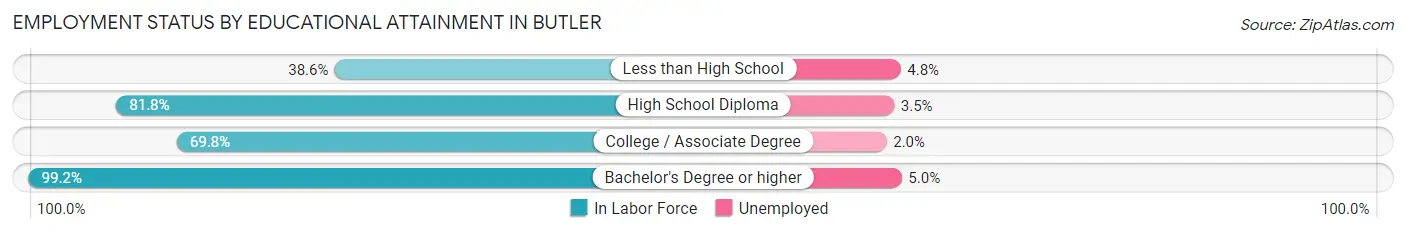
| Educational Attainment | In Labor Force | Unemployed |
| Less than High School | 83 (38.6%) | 10 (4.8%) |
| High School Diploma | 518 (81.8%) | 22 (3.5%) |
| College / Associate Degree | 250 (69.8%) | 7 (2.0%) |
| Bachelor's Degree or higher | 120 (99.2%) | 6 (5.0%) |
| Total | 971 (73.2%) | 45 (3.4%) |
Employment Occupations by Sex in Butler
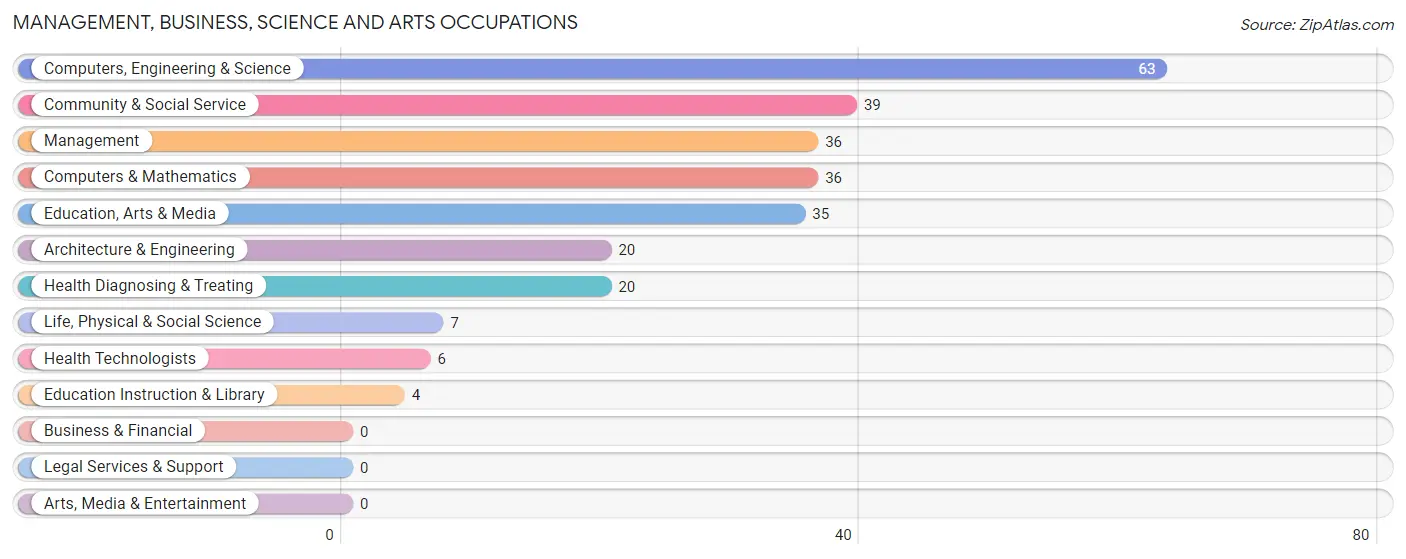
Management, Business, Science and Arts Occupations
The most common Management, Business, Science and Arts occupations in Butler are Computers, Engineering & Science (63 | 5.8%), Community & Social Service (39 | 3.6%), Management (36 | 3.3%), Computers & Mathematics (36 | 3.3%), and Education, Arts & Media (35 | 3.2%).
Management, Business, Science and Arts Occupations by Sex
Within the Management, Business, Science and Arts occupations in Butler, the most male-oriented occupations are Computers & Mathematics (100.0%), Life, Physical & Social Science (100.0%), and Education Instruction & Library (100.0%), while the most female-oriented occupations are Health Diagnosing & Treating (100.0%), Health Technologists (100.0%), and Education, Arts & Media (57.1%).
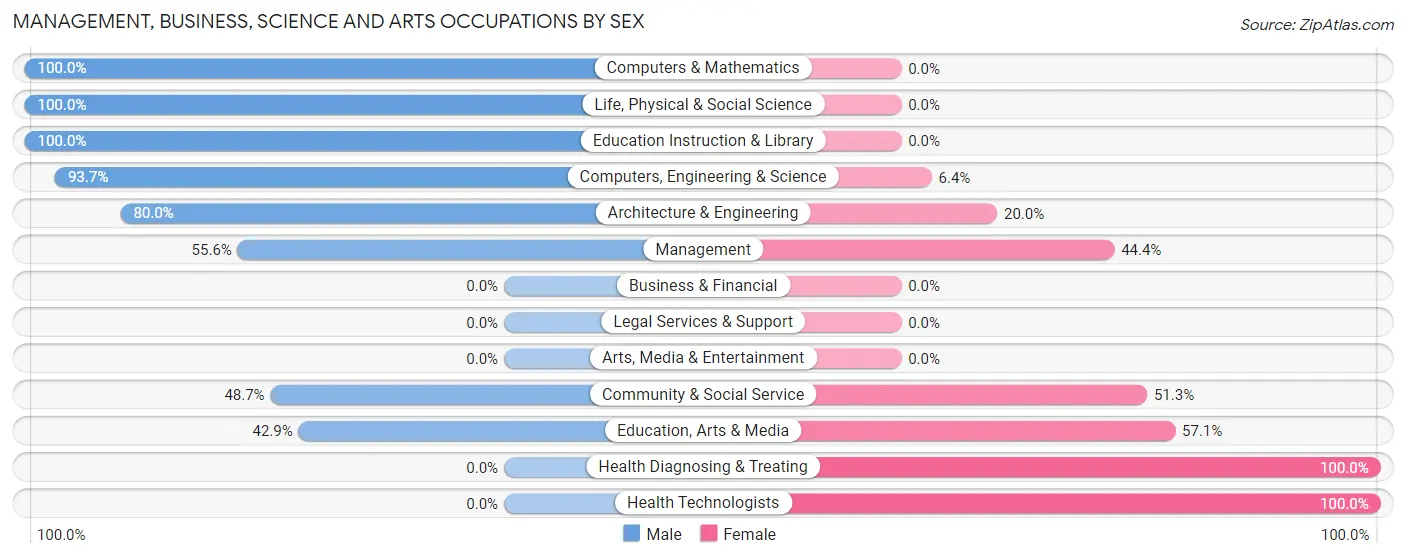
| Occupation | Male | Female |
| Management | 20 (55.6%) | 16 (44.4%) |
| Business & Financial | 0 (0.0%) | 0 (0.0%) |
| Computers, Engineering & Science | 59 (93.6%) | 4 (6.4%) |
| Computers & Mathematics | 36 (100.0%) | 0 (0.0%) |
| Architecture & Engineering | 16 (80.0%) | 4 (20.0%) |
| Life, Physical & Social Science | 7 (100.0%) | 0 (0.0%) |
| Community & Social Service | 19 (48.7%) | 20 (51.3%) |
| Education, Arts & Media | 15 (42.9%) | 20 (57.1%) |
| Legal Services & Support | 0 (0.0%) | 0 (0.0%) |
| Education Instruction & Library | 4 (100.0%) | 0 (0.0%) |
| Arts, Media & Entertainment | 0 (0.0%) | 0 (0.0%) |
| Health Diagnosing & Treating | 0 (0.0%) | 20 (100.0%) |
| Health Technologists | 0 (0.0%) | 6 (100.0%) |
| Total (Category) | 98 (62.0%) | 60 (38.0%) |
| Total (Overall) | 591 (54.2%) | 500 (45.8%) |
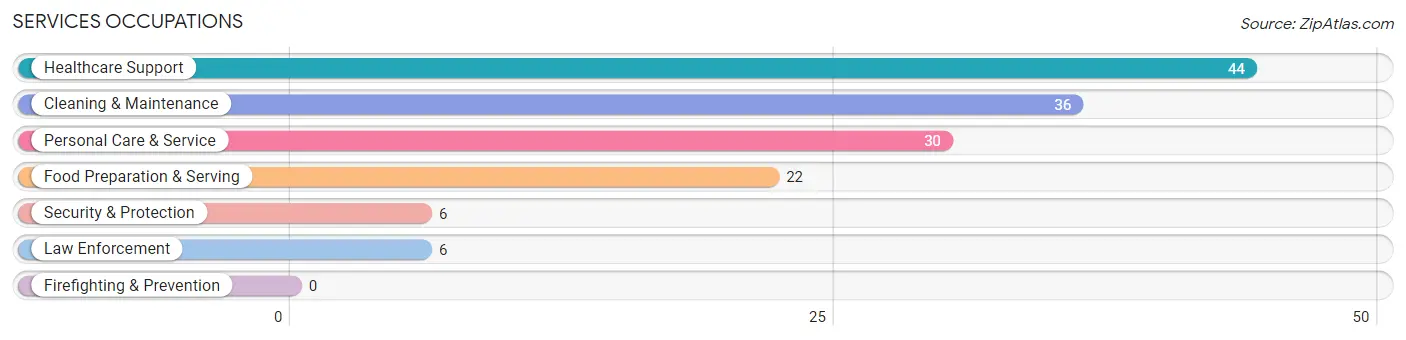
Services Occupations
The most common Services occupations in Butler are Healthcare Support (44 | 4.0%), Cleaning & Maintenance (36 | 3.3%), Personal Care & Service (30 | 2.8%), Food Preparation & Serving (22 | 2.0%), and Security & Protection (6 | 0.5%).
Services Occupations by Sex
Within the Services occupations in Butler, the most male-oriented occupations are Security & Protection (100.0%), Law Enforcement (100.0%), and Cleaning & Maintenance (69.4%), while the most female-oriented occupations are Healthcare Support (100.0%), Personal Care & Service (100.0%), and Food Preparation & Serving (77.3%).
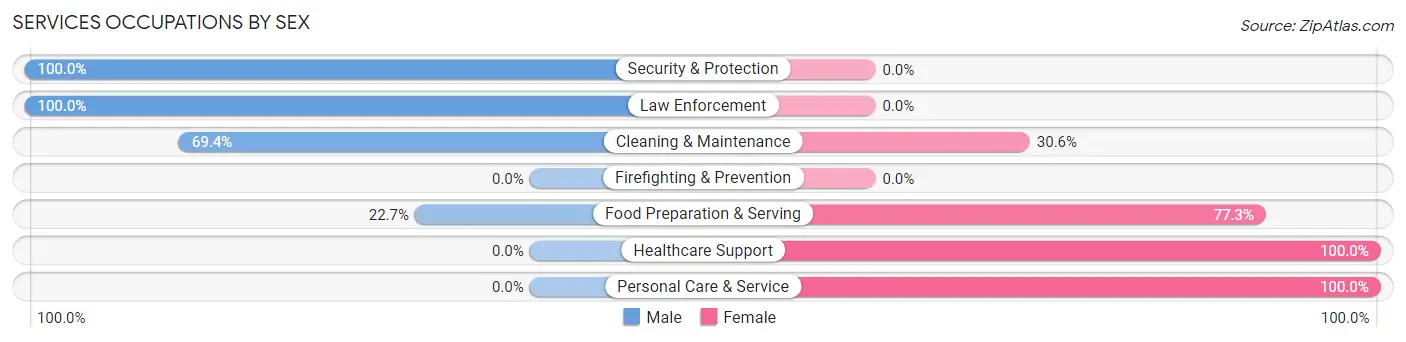
| Occupation | Male | Female |
| Healthcare Support | 0 (0.0%) | 44 (100.0%) |
| Security & Protection | 6 (100.0%) | 0 (0.0%) |
| Firefighting & Prevention | 0 (0.0%) | 0 (0.0%) |
| Law Enforcement | 6 (100.0%) | 0 (0.0%) |
| Food Preparation & Serving | 5 (22.7%) | 17 (77.3%) |
| Cleaning & Maintenance | 25 (69.4%) | 11 (30.6%) |
| Personal Care & Service | 0 (0.0%) | 30 (100.0%) |
| Total (Category) | 36 (26.1%) | 102 (73.9%) |
| Total (Overall) | 591 (54.2%) | 500 (45.8%) |
Sales and Office Occupations
The most common Sales and Office occupations in Butler are Office & Administration (136 | 12.5%), and Sales & Related (60 | 5.5%).
Sales and Office Occupations by Sex
| Occupation | Male | Female |
| Sales & Related | 28 (46.7%) | 32 (53.3%) |
| Office & Administration | 24 (17.6%) | 112 (82.4%) |
| Total (Category) | 52 (26.5%) | 144 (73.5%) |
| Total (Overall) | 591 (54.2%) | 500 (45.8%) |
Natural Resources, Construction and Maintenance Occupations
The most common Natural Resources, Construction and Maintenance occupations in Butler are Installation, Maintenance & Repair (40 | 3.7%), and Construction & Extraction (19 | 1.7%).
Natural Resources, Construction and Maintenance Occupations by Sex
| Occupation | Male | Female |
| Farming, Fishing & Forestry | 0 (0.0%) | 0 (0.0%) |
| Construction & Extraction | 19 (100.0%) | 0 (0.0%) |
| Installation, Maintenance & Repair | 40 (100.0%) | 0 (0.0%) |
| Total (Category) | 59 (100.0%) | 0 (0.0%) |
| Total (Overall) | 591 (54.2%) | 500 (45.8%) |
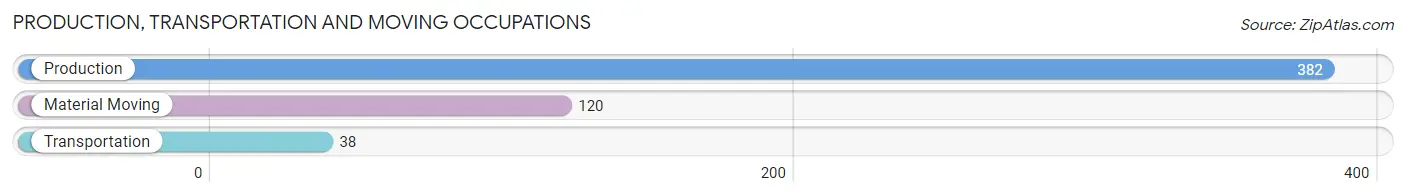
Production, Transportation and Moving Occupations
The most common Production, Transportation and Moving occupations in Butler are Production (382 | 35.0%), Material Moving (120 | 11.0%), and Transportation (38 | 3.5%).
Production, Transportation and Moving Occupations by Sex
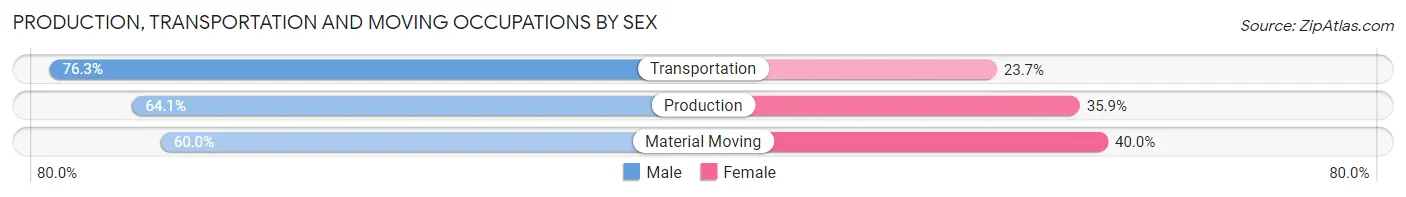
| Occupation | Male | Female |
| Production | 245 (64.1%) | 137 (35.9%) |
| Transportation | 29 (76.3%) | 9 (23.7%) |
| Material Moving | 72 (60.0%) | 48 (40.0%) |
| Total (Category) | 346 (64.1%) | 194 (35.9%) |
| Total (Overall) | 591 (54.2%) | 500 (45.8%) |
Employment Industries by Sex in Butler
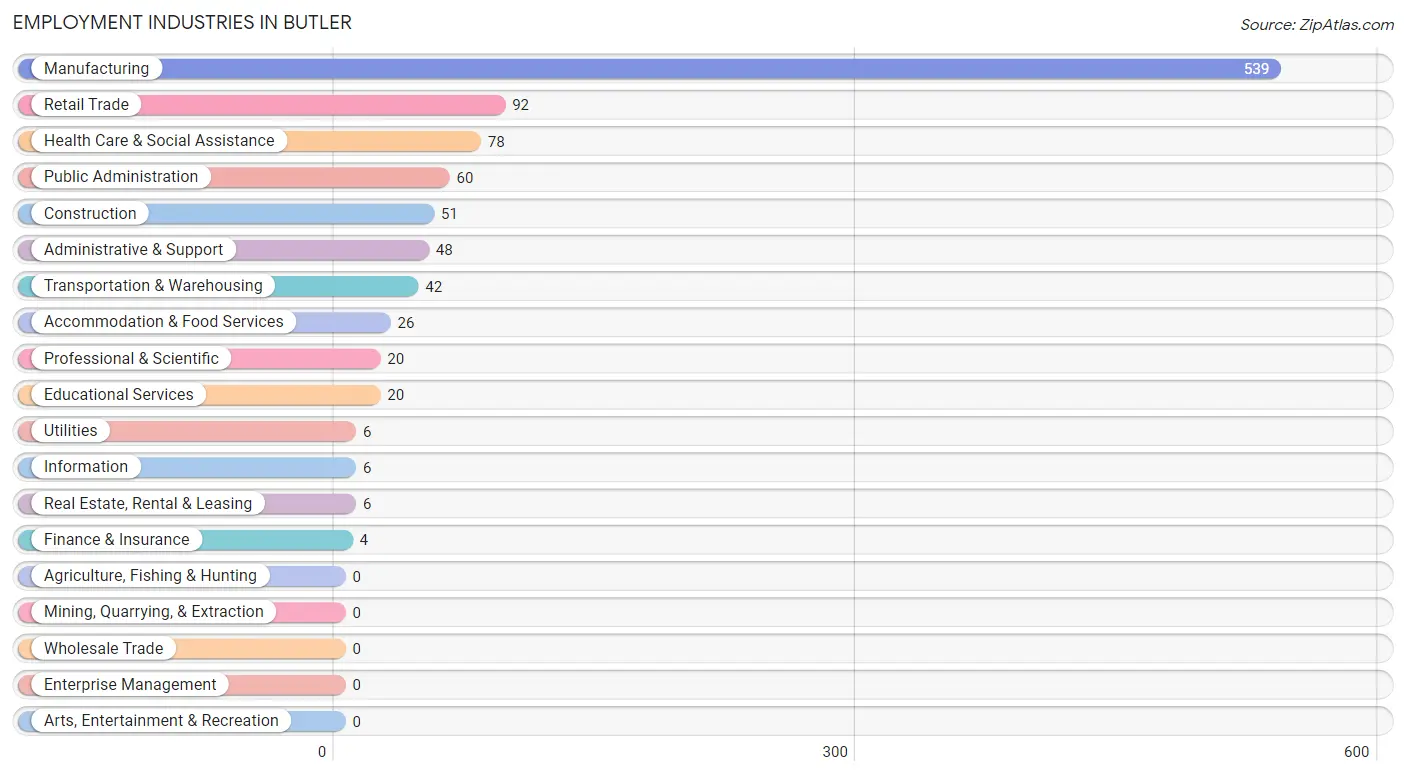
Employment Industries in Butler
The major employment industries in Butler include Manufacturing (539 | 49.4%), Retail Trade (92 | 8.4%), Health Care & Social Assistance (78 | 7.1%), Public Administration (60 | 5.5%), and Construction (51 | 4.7%).
Employment Industries by Sex in Butler
The Butler industries that see more men than women are Construction (100.0%), Information (100.0%), and Real Estate, Rental & Leasing (100.0%), whereas the industries that tend to have a higher number of women are Utilities (100.0%), Finance & Insurance (100.0%), and Health Care & Social Assistance (94.9%).
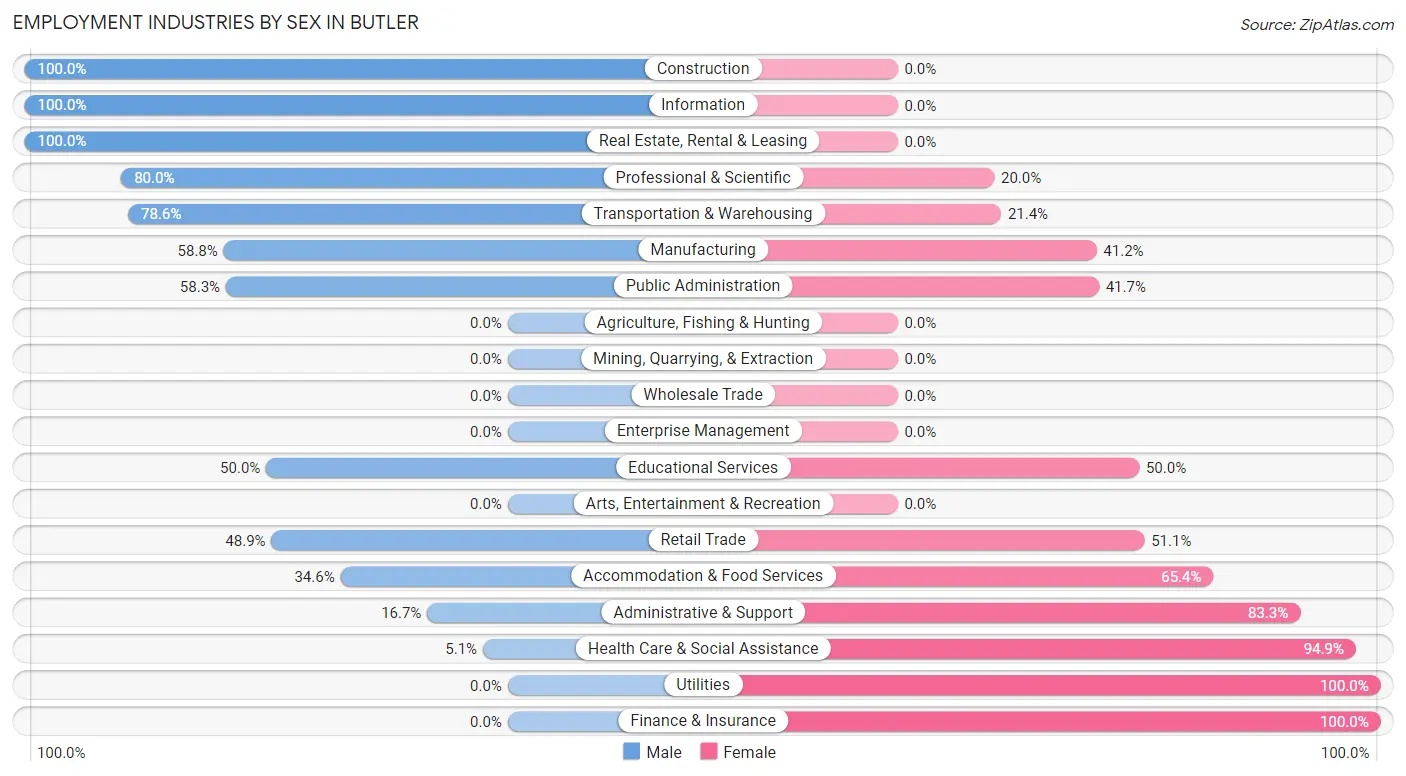
| Industry | Male | Female |
| Agriculture, Fishing & Hunting | 0 (0.0%) | 0 (0.0%) |
| Mining, Quarrying, & Extraction | 0 (0.0%) | 0 (0.0%) |
| Construction | 51 (100.0%) | 0 (0.0%) |
| Manufacturing | 317 (58.8%) | 222 (41.2%) |
| Wholesale Trade | 0 (0.0%) | 0 (0.0%) |
| Retail Trade | 45 (48.9%) | 47 (51.1%) |
| Transportation & Warehousing | 33 (78.6%) | 9 (21.4%) |
| Utilities | 0 (0.0%) | 6 (100.0%) |
| Information | 6 (100.0%) | 0 (0.0%) |
| Finance & Insurance | 0 (0.0%) | 4 (100.0%) |
| Real Estate, Rental & Leasing | 6 (100.0%) | 0 (0.0%) |
| Professional & Scientific | 16 (80.0%) | 4 (20.0%) |
| Enterprise Management | 0 (0.0%) | 0 (0.0%) |
| Administrative & Support | 8 (16.7%) | 40 (83.3%) |
| Educational Services | 10 (50.0%) | 10 (50.0%) |
| Health Care & Social Assistance | 4 (5.1%) | 74 (94.9%) |
| Arts, Entertainment & Recreation | 0 (0.0%) | 0 (0.0%) |
| Accommodation & Food Services | 9 (34.6%) | 17 (65.4%) |
| Public Administration | 35 (58.3%) | 25 (41.7%) |
| Total | 591 (54.2%) | 500 (45.8%) |
Education in Butler
School Enrollment in Butler
The most common levels of schooling among the 645 students in Butler are elementary school (220 | 34.1%), high school (217 | 33.6%), and middle school (70 | 10.8%).
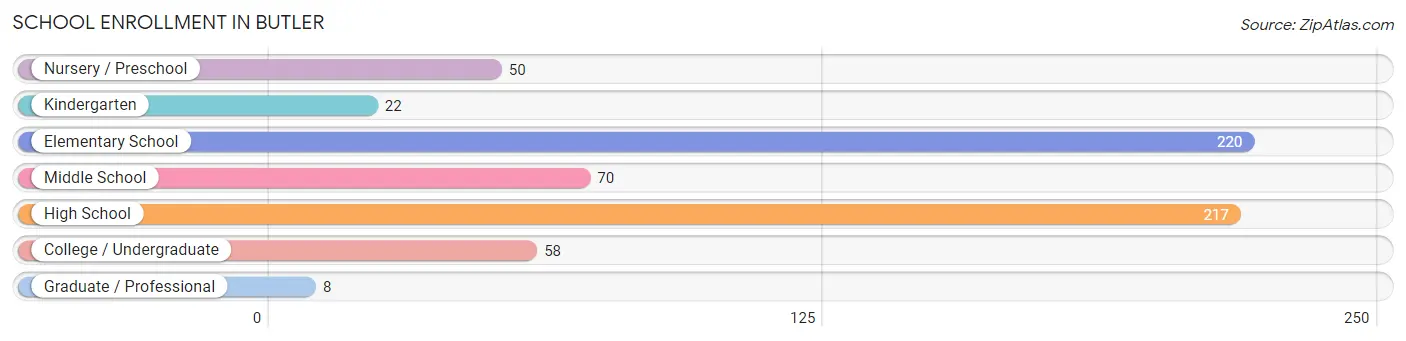
| School Level | # Students | % Students |
| Nursery / Preschool | 50 | 7.7% |
| Kindergarten | 22 | 3.4% |
| Elementary School | 220 | 34.1% |
| Middle School | 70 | 10.8% |
| High School | 217 | 33.6% |
| College / Undergraduate | 58 | 9.0% |
| Graduate / Professional | 8 | 1.2% |
| Total | 645 | 100.0% |
School Enrollment by Age by Funding Source in Butler
Out of a total of 645 students who are enrolled in schools in Butler, 90 (14.0%) attend a private institution, while the remaining 555 (86.0%) are enrolled in public schools. The age group of 20 to 24 year olds has the highest likelihood of being enrolled in private schools, with 16 (55.2% in the age bracket) enrolled. Conversely, the age group of 3 to 4 year olds has the lowest likelihood of being enrolled in a private school, with 21 (100.0% in the age bracket) attending a public institution.
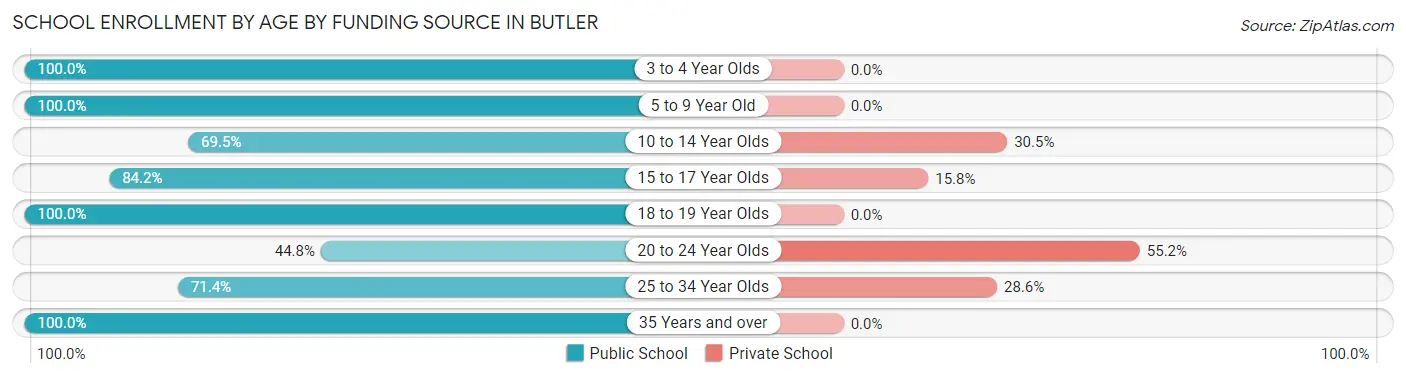
| Age Bracket | Public School | Private School |
| 3 to 4 Year Olds | 21 (100.0%) | 0 (0.0%) |
| 5 to 9 Year Old | 216 (100.0%) | 0 (0.0%) |
| 10 to 14 Year Olds | 89 (69.5%) | 39 (30.5%) |
| 15 to 17 Year Olds | 155 (84.2%) | 29 (15.8%) |
| 18 to 19 Year Olds | 42 (100.0%) | 0 (0.0%) |
| 20 to 24 Year Olds | 13 (44.8%) | 16 (55.2%) |
| 25 to 34 Year Olds | 15 (71.4%) | 6 (28.6%) |
| 35 Years and over | 4 (100.0%) | 0 (0.0%) |
| Total | 555 (86.0%) | 90 (14.0%) |
Educational Attainment by Field of Study in Butler
Computers & mathematics (29 | 16.8%), arts & humanities (27 | 15.6%), science & technology (25 | 14.4%), social sciences (22 | 12.7%), and business (21 | 12.1%) are the most common fields of study among 173 individuals in Butler who have obtained a bachelor's degree or higher.
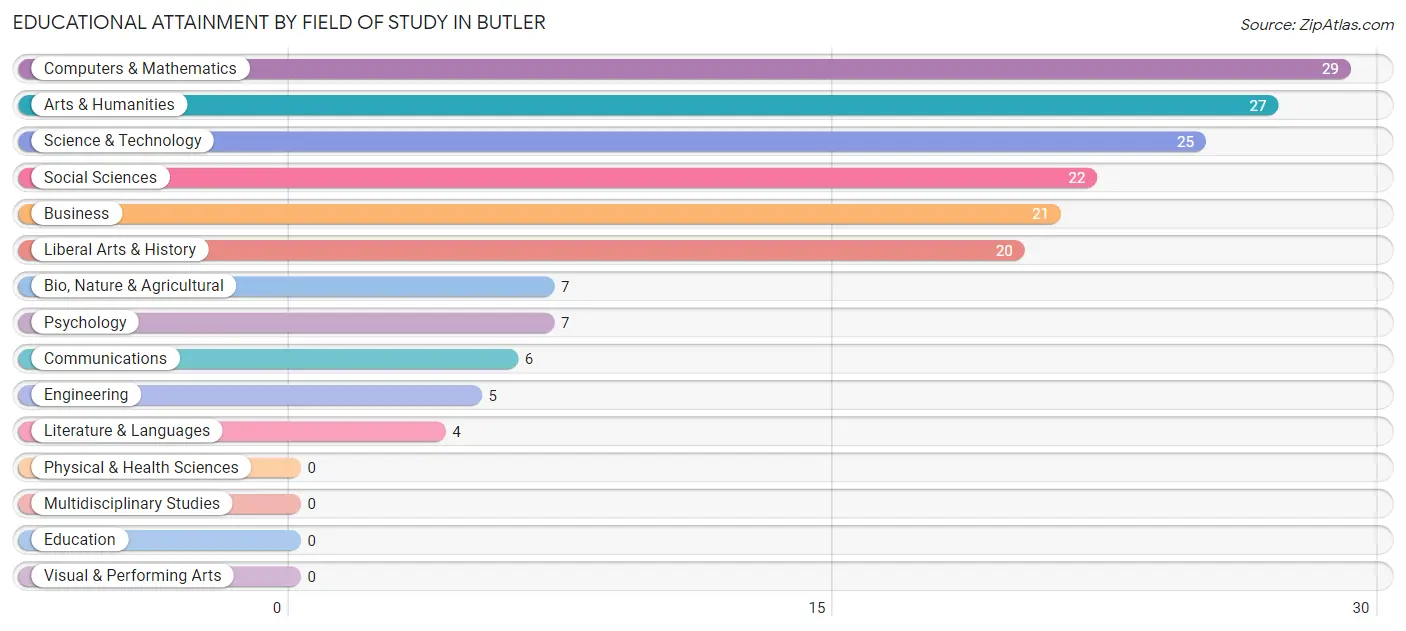
| Field of Study | # Graduates | % Graduates |
| Computers & Mathematics | 29 | 16.8% |
| Bio, Nature & Agricultural | 7 | 4.1% |
| Physical & Health Sciences | 0 | 0.0% |
| Psychology | 7 | 4.1% |
| Social Sciences | 22 | 12.7% |
| Engineering | 5 | 2.9% |
| Multidisciplinary Studies | 0 | 0.0% |
| Science & Technology | 25 | 14.4% |
| Business | 21 | 12.1% |
| Education | 0 | 0.0% |
| Literature & Languages | 4 | 2.3% |
| Liberal Arts & History | 20 | 11.6% |
| Visual & Performing Arts | 0 | 0.0% |
| Communications | 6 | 3.5% |
| Arts & Humanities | 27 | 15.6% |
| Total | 173 | 100.0% |
Transportation & Commute in Butler
Vehicle Availability by Sex in Butler
The most prevalent vehicle ownership categories in Butler are males with 2 vehicles (246, accounting for 42.2%) and females with 2 vehicles (223, making up 49.2%).
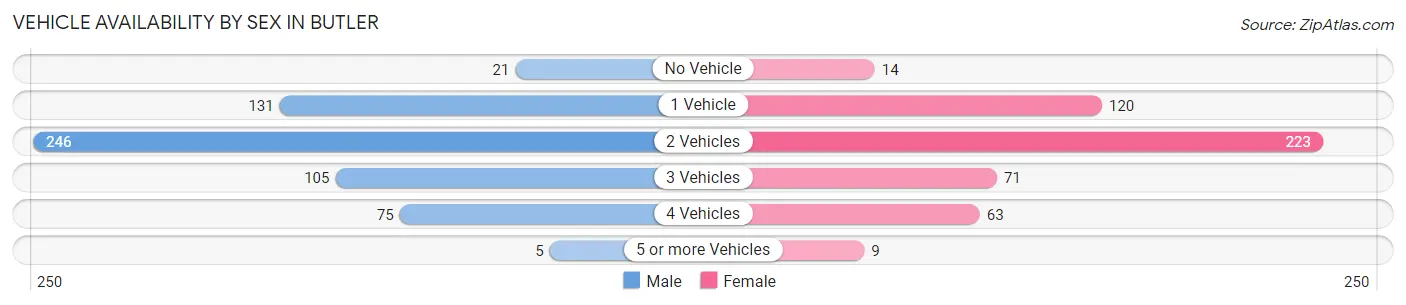
| Vehicles Available | Male | Female |
| No Vehicle | 21 (3.6%) | 14 (2.8%) |
| 1 Vehicle | 131 (22.5%) | 120 (24.0%) |
| 2 Vehicles | 246 (42.2%) | 223 (44.6%) |
| 3 Vehicles | 105 (18.0%) | 71 (14.2%) |
| 4 Vehicles | 75 (12.9%) | 63 (12.6%) |
| 5 or more Vehicles | 5 (0.9%) | 9 (1.8%) |
| Total | 583 (100.0%) | 500 (100.0%) |
Commute Time in Butler
The most frequently occuring commute durations in Butler are 5 to 9 minutes (233 commuters, 22.3%), 10 to 14 minutes (176 commuters, 16.9%), and 30 to 34 minutes (133 commuters, 12.8%).
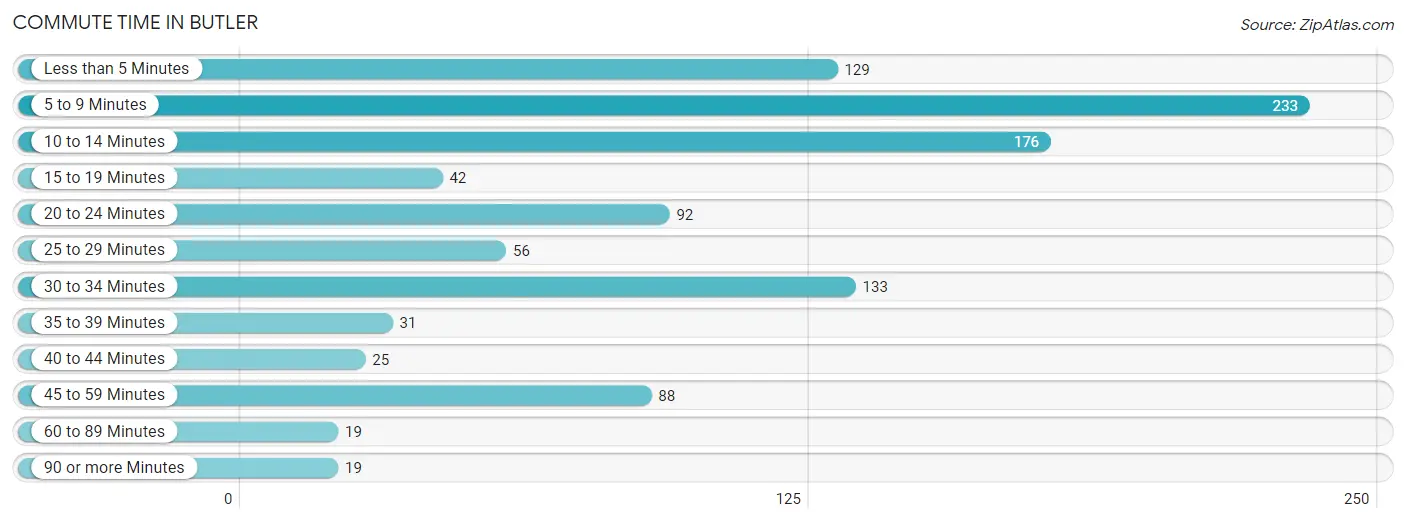
| Commute Time | # Commuters | % Commuters |
| Less than 5 Minutes | 129 | 12.4% |
| 5 to 9 Minutes | 233 | 22.3% |
| 10 to 14 Minutes | 176 | 16.9% |
| 15 to 19 Minutes | 42 | 4.0% |
| 20 to 24 Minutes | 92 | 8.8% |
| 25 to 29 Minutes | 56 | 5.4% |
| 30 to 34 Minutes | 133 | 12.8% |
| 35 to 39 Minutes | 31 | 3.0% |
| 40 to 44 Minutes | 25 | 2.4% |
| 45 to 59 Minutes | 88 | 8.4% |
| 60 to 89 Minutes | 19 | 1.8% |
| 90 or more Minutes | 19 | 1.8% |
Commute Time by Sex in Butler
The most common commute times in Butler are 5 to 9 minutes (100 commuters, 18.3%) for males and 5 to 9 minutes (133 commuters, 26.8%) for females.
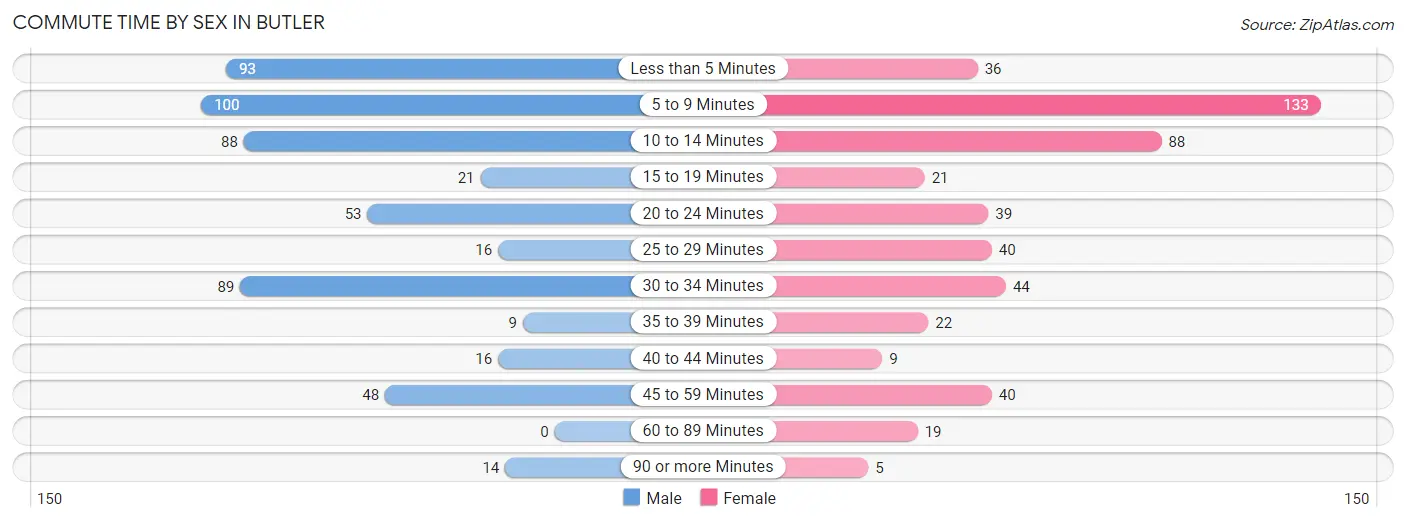
| Commute Time | Male | Female |
| Less than 5 Minutes | 93 (17.0%) | 36 (7.3%) |
| 5 to 9 Minutes | 100 (18.3%) | 133 (26.8%) |
| 10 to 14 Minutes | 88 (16.1%) | 88 (17.7%) |
| 15 to 19 Minutes | 21 (3.8%) | 21 (4.2%) |
| 20 to 24 Minutes | 53 (9.7%) | 39 (7.9%) |
| 25 to 29 Minutes | 16 (2.9%) | 40 (8.1%) |
| 30 to 34 Minutes | 89 (16.3%) | 44 (8.9%) |
| 35 to 39 Minutes | 9 (1.7%) | 22 (4.4%) |
| 40 to 44 Minutes | 16 (2.9%) | 9 (1.8%) |
| 45 to 59 Minutes | 48 (8.8%) | 40 (8.1%) |
| 60 to 89 Minutes | 0 (0.0%) | 19 (3.8%) |
| 90 or more Minutes | 14 (2.6%) | 5 (1.0%) |
Time of Departure to Work by Sex in Butler
The most frequent times of departure to work in Butler are 4:00 PM to 11:59 PM (118, 21.6%) for males and 7:30 AM to 7:59 AM (82, 16.5%) for females.
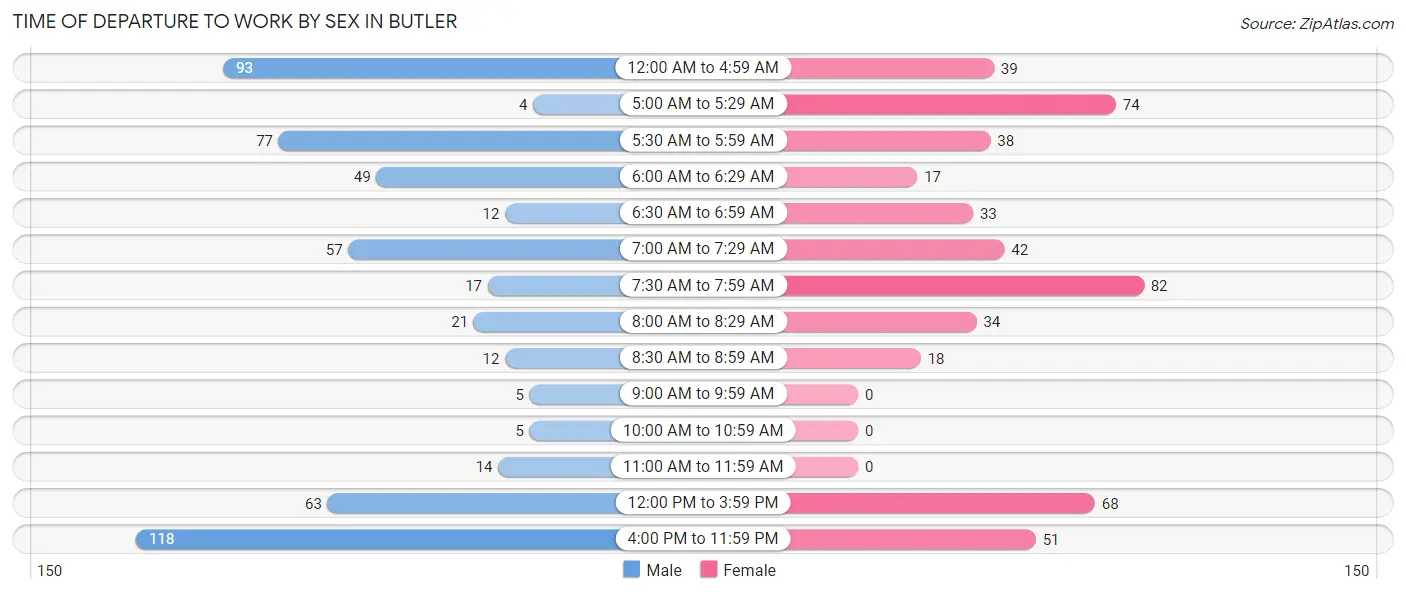
| Time of Departure | Male | Female |
| 12:00 AM to 4:59 AM | 93 (17.0%) | 39 (7.9%) |
| 5:00 AM to 5:29 AM | 4 (0.7%) | 74 (14.9%) |
| 5:30 AM to 5:59 AM | 77 (14.1%) | 38 (7.7%) |
| 6:00 AM to 6:29 AM | 49 (9.0%) | 17 (3.4%) |
| 6:30 AM to 6:59 AM | 12 (2.2%) | 33 (6.7%) |
| 7:00 AM to 7:29 AM | 57 (10.4%) | 42 (8.5%) |
| 7:30 AM to 7:59 AM | 17 (3.1%) | 82 (16.5%) |
| 8:00 AM to 8:29 AM | 21 (3.8%) | 34 (6.9%) |
| 8:30 AM to 8:59 AM | 12 (2.2%) | 18 (3.6%) |
| 9:00 AM to 9:59 AM | 5 (0.9%) | 0 (0.0%) |
| 10:00 AM to 10:59 AM | 5 (0.9%) | 0 (0.0%) |
| 11:00 AM to 11:59 AM | 14 (2.6%) | 0 (0.0%) |
| 12:00 PM to 3:59 PM | 63 (11.5%) | 68 (13.7%) |
| 4:00 PM to 11:59 PM | 118 (21.6%) | 51 (10.3%) |
| Total | 547 (100.0%) | 496 (100.0%) |
Housing Occupancy in Butler
Occupancy by Ownership in Butler
Of the total 1,009 dwellings in Butler, owner-occupied units account for 700 (69.4%), while renter-occupied units make up 309 (30.6%).
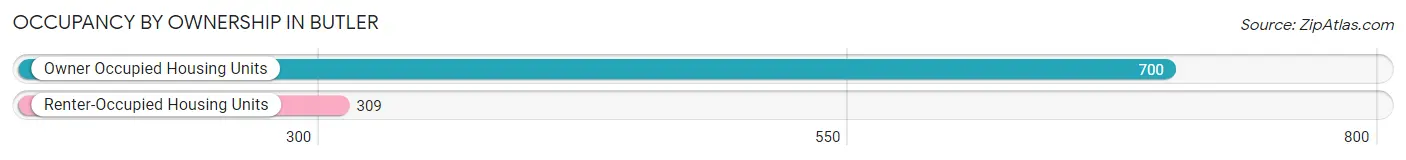
| Occupancy | # Housing Units | % Housing Units |
| Owner Occupied Housing Units | 700 | 69.4% |
| Renter-Occupied Housing Units | 309 | 30.6% |
| Total Occupied Housing Units | 1,009 | 100.0% |
Occupancy by Household Size in Butler
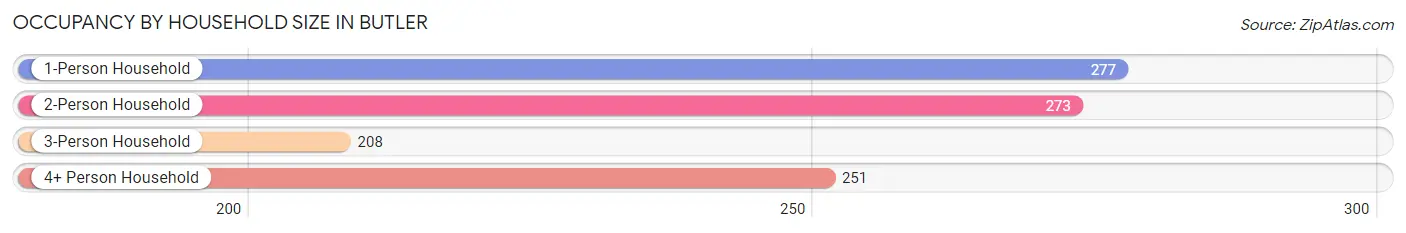
| Household Size | # Housing Units | % Housing Units |
| 1-Person Household | 277 | 27.5% |
| 2-Person Household | 273 | 27.1% |
| 3-Person Household | 208 | 20.6% |
| 4+ Person Household | 251 | 24.9% |
| Total Housing Units | 1,009 | 100.0% |
Occupancy by Ownership by Household Size in Butler
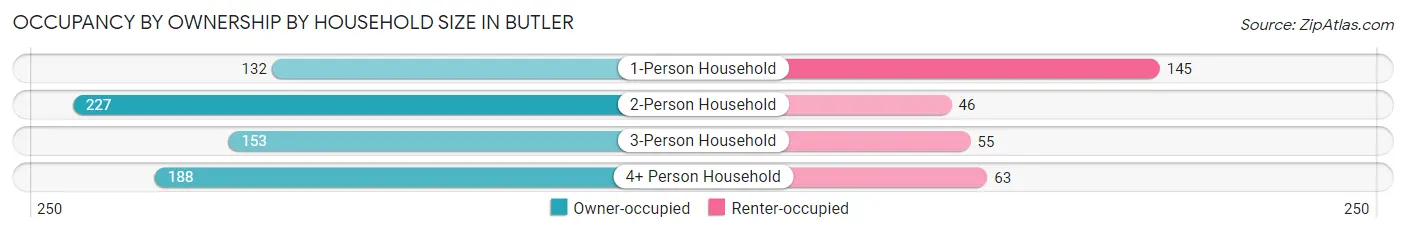
| Household Size | Owner-occupied | Renter-occupied |
| 1-Person Household | 132 (47.6%) | 145 (52.3%) |
| 2-Person Household | 227 (83.2%) | 46 (16.9%) |
| 3-Person Household | 153 (73.6%) | 55 (26.4%) |
| 4+ Person Household | 188 (74.9%) | 63 (25.1%) |
| Total Housing Units | 700 (69.4%) | 309 (30.6%) |
Occupancy by Educational Attainment in Butler
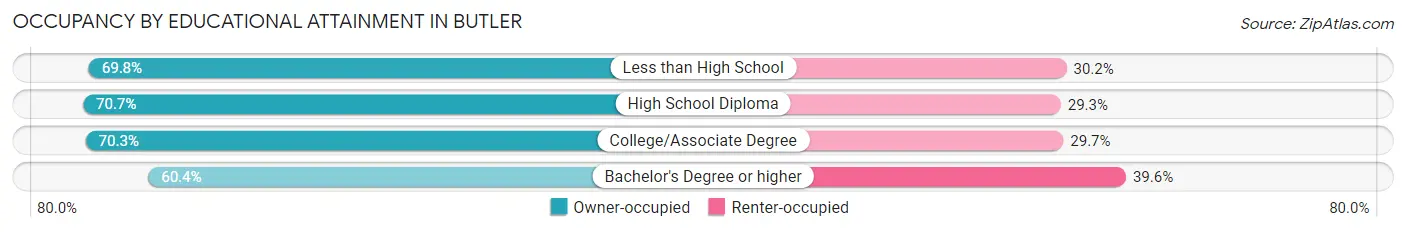
| Household Size | Owner-occupied | Renter-occupied |
| Less than High School | 104 (69.8%) | 45 (30.2%) |
| High School Diploma | 326 (70.7%) | 135 (29.3%) |
| College/Associate Degree | 206 (70.3%) | 87 (29.7%) |
| Bachelor's Degree or higher | 64 (60.4%) | 42 (39.6%) |
Occupancy by Age of Householder in Butler
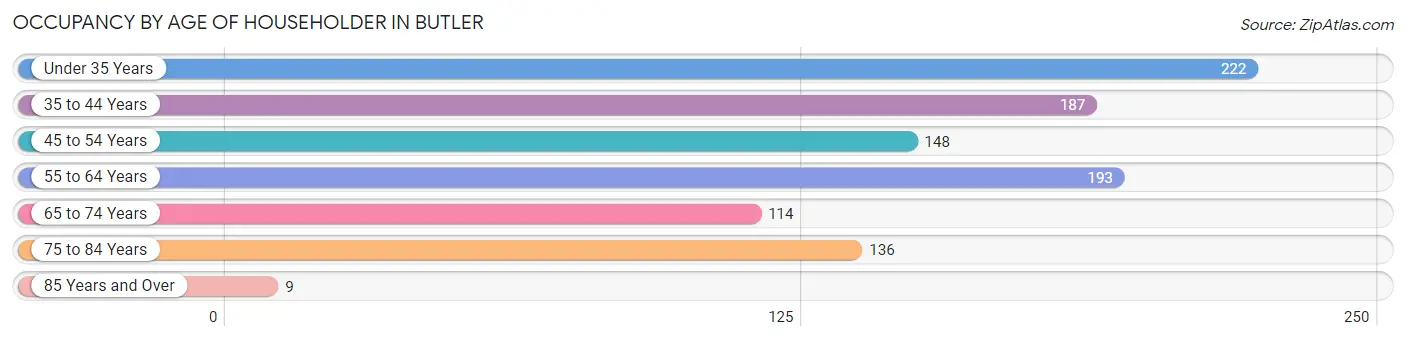
| Age Bracket | # Households | % Households |
| Under 35 Years | 222 | 22.0% |
| 35 to 44 Years | 187 | 18.5% |
| 45 to 54 Years | 148 | 14.7% |
| 55 to 64 Years | 193 | 19.1% |
| 65 to 74 Years | 114 | 11.3% |
| 75 to 84 Years | 136 | 13.5% |
| 85 Years and Over | 9 | 0.9% |
| Total | 1,009 | 100.0% |
Housing Finances in Butler
Median Income by Occupancy in Butler
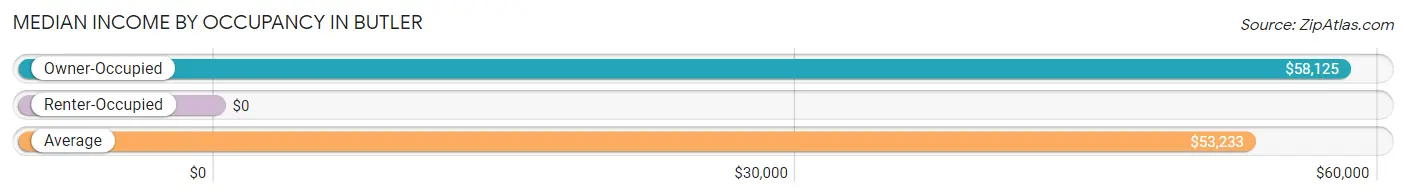
| Occupancy Type | # Households | Median Income |
| Owner-Occupied | 700 (69.4%) | $58,125 |
| Renter-Occupied | 309 (30.6%) | $0 |
| Average | 1,009 (100.0%) | $53,233 |
Occupancy by Householder Income Bracket in Butler
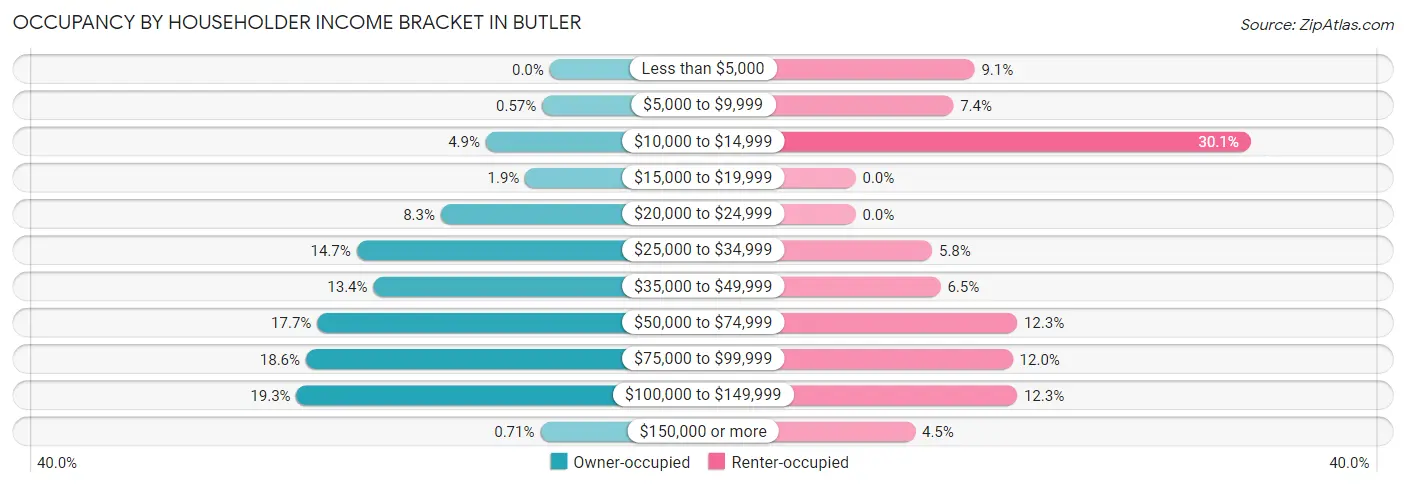
| Income Bracket | Owner-occupied | Renter-occupied |
| Less than $5,000 | 0 (0.0%) | 28 (9.1%) |
| $5,000 to $9,999 | 4 (0.6%) | 23 (7.4%) |
| $10,000 to $14,999 | 34 (4.9%) | 93 (30.1%) |
| $15,000 to $19,999 | 13 (1.9%) | 0 (0.0%) |
| $20,000 to $24,999 | 58 (8.3%) | 0 (0.0%) |
| $25,000 to $34,999 | 103 (14.7%) | 18 (5.8%) |
| $35,000 to $49,999 | 94 (13.4%) | 20 (6.5%) |
| $50,000 to $74,999 | 124 (17.7%) | 38 (12.3%) |
| $75,000 to $99,999 | 130 (18.6%) | 37 (12.0%) |
| $100,000 to $149,999 | 135 (19.3%) | 38 (12.3%) |
| $150,000 or more | 5 (0.7%) | 14 (4.5%) |
| Total | 700 (100.0%) | 309 (100.0%) |
Monthly Housing Cost Tiers in Butler
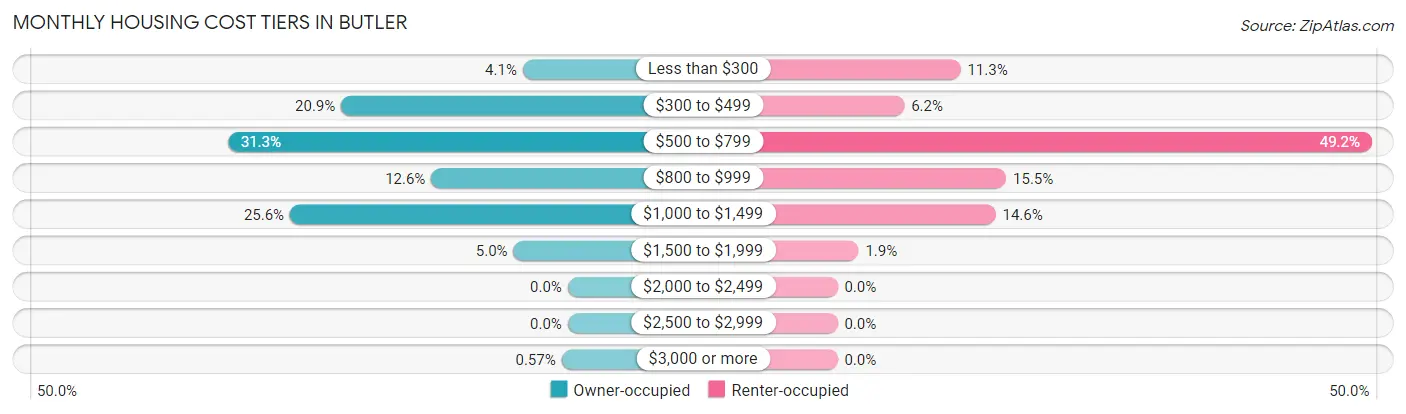
| Monthly Cost | Owner-occupied | Renter-occupied |
| Less than $300 | 29 (4.1%) | 35 (11.3%) |
| $300 to $499 | 146 (20.9%) | 19 (6.1%) |
| $500 to $799 | 219 (31.3%) | 152 (49.2%) |
| $800 to $999 | 88 (12.6%) | 48 (15.5%) |
| $1,000 to $1,499 | 179 (25.6%) | 45 (14.6%) |
| $1,500 to $1,999 | 35 (5.0%) | 6 (1.9%) |
| $2,000 to $2,499 | 0 (0.0%) | 0 (0.0%) |
| $2,500 to $2,999 | 0 (0.0%) | 0 (0.0%) |
| $3,000 or more | 4 (0.6%) | 0 (0.0%) |
| Total | 700 (100.0%) | 309 (100.0%) |
Physical Housing Characteristics in Butler
Housing Structures in Butler
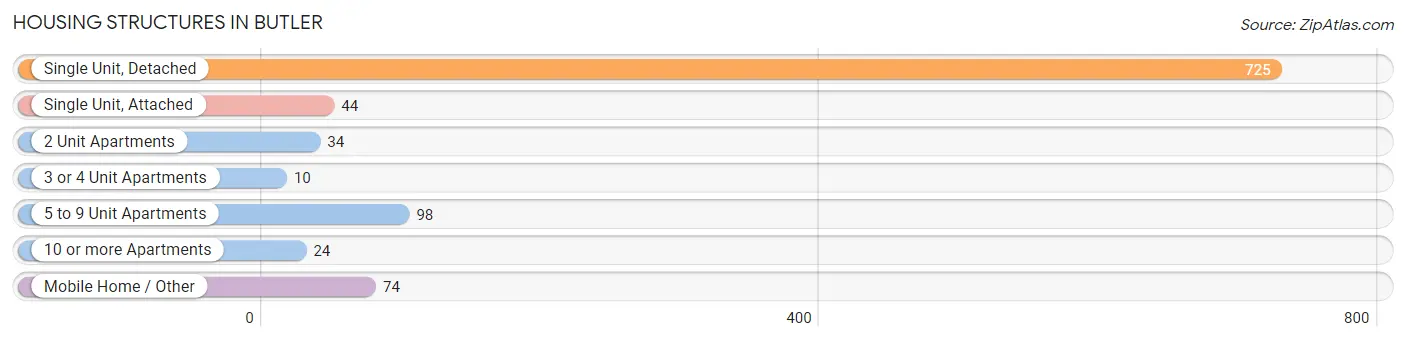
| Structure Type | # Housing Units | % Housing Units |
| Single Unit, Detached | 725 | 71.9% |
| Single Unit, Attached | 44 | 4.4% |
| 2 Unit Apartments | 34 | 3.4% |
| 3 or 4 Unit Apartments | 10 | 1.0% |
| 5 to 9 Unit Apartments | 98 | 9.7% |
| 10 or more Apartments | 24 | 2.4% |
| Mobile Home / Other | 74 | 7.3% |
| Total | 1,009 | 100.0% |
Housing Structures by Occupancy in Butler
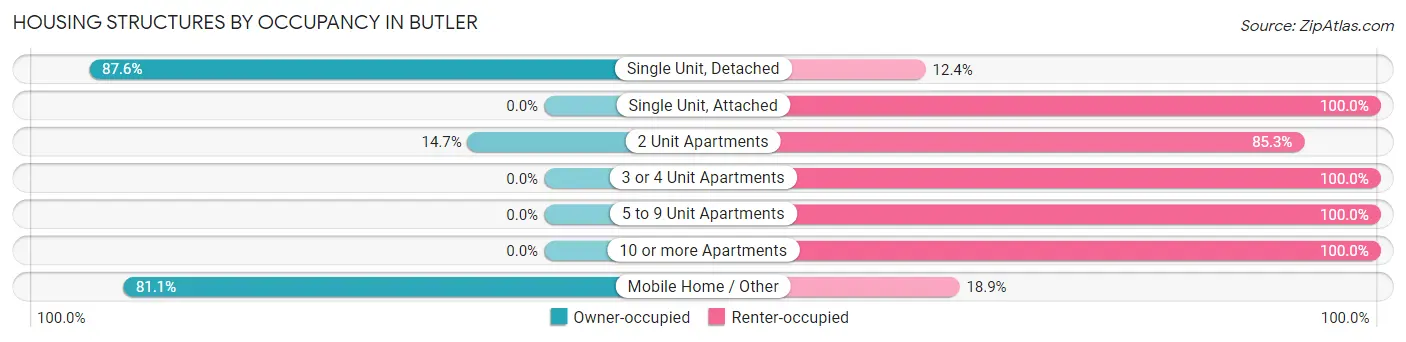
| Structure Type | Owner-occupied | Renter-occupied |
| Single Unit, Detached | 635 (87.6%) | 90 (12.4%) |
| Single Unit, Attached | 0 (0.0%) | 44 (100.0%) |
| 2 Unit Apartments | 5 (14.7%) | 29 (85.3%) |
| 3 or 4 Unit Apartments | 0 (0.0%) | 10 (100.0%) |
| 5 to 9 Unit Apartments | 0 (0.0%) | 98 (100.0%) |
| 10 or more Apartments | 0 (0.0%) | 24 (100.0%) |
| Mobile Home / Other | 60 (81.1%) | 14 (18.9%) |
| Total | 700 (69.4%) | 309 (30.6%) |
Housing Structures by Number of Rooms in Butler
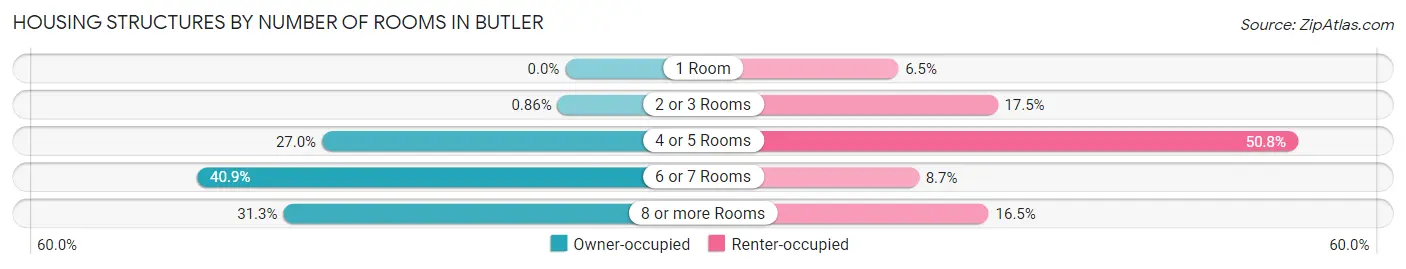
| Number of Rooms | Owner-occupied | Renter-occupied |
| 1 Room | 0 (0.0%) | 20 (6.5%) |
| 2 or 3 Rooms | 6 (0.9%) | 54 (17.5%) |
| 4 or 5 Rooms | 189 (27.0%) | 157 (50.8%) |
| 6 or 7 Rooms | 286 (40.9%) | 27 (8.7%) |
| 8 or more Rooms | 219 (31.3%) | 51 (16.5%) |
| Total | 700 (100.0%) | 309 (100.0%) |
Housing Structure by Heating Type in Butler
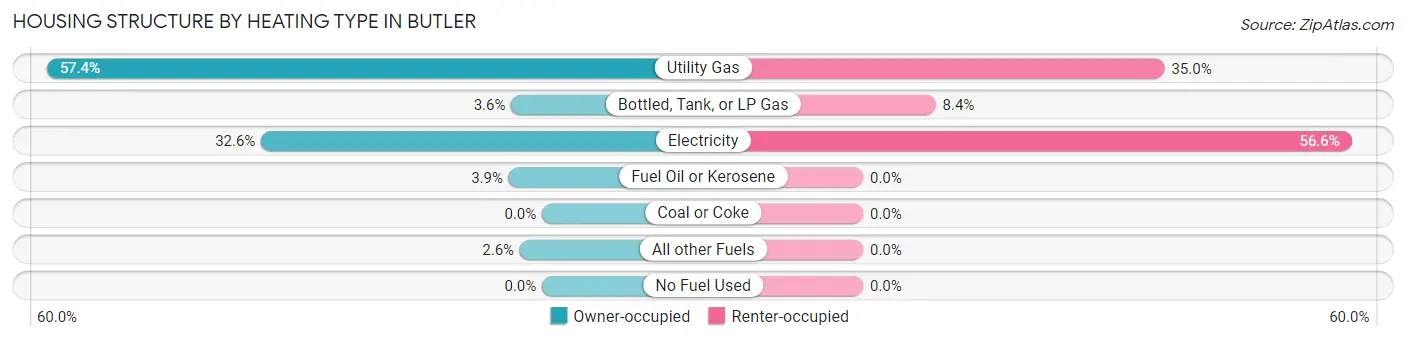
| Heating Type | Owner-occupied | Renter-occupied |
| Utility Gas | 402 (57.4%) | 108 (34.9%) |
| Bottled, Tank, or LP Gas | 25 (3.6%) | 26 (8.4%) |
| Electricity | 228 (32.6%) | 175 (56.6%) |
| Fuel Oil or Kerosene | 27 (3.9%) | 0 (0.0%) |
| Coal or Coke | 0 (0.0%) | 0 (0.0%) |
| All other Fuels | 18 (2.6%) | 0 (0.0%) |
| No Fuel Used | 0 (0.0%) | 0 (0.0%) |
| Total | 700 (100.0%) | 309 (100.0%) |
Household Vehicle Usage in Butler
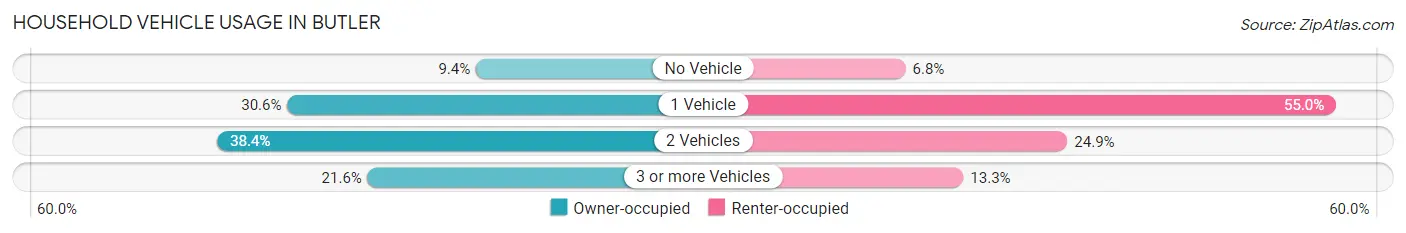
| Vehicles per Household | Owner-occupied | Renter-occupied |
| No Vehicle | 66 (9.4%) | 21 (6.8%) |
| 1 Vehicle | 214 (30.6%) | 170 (55.0%) |
| 2 Vehicles | 269 (38.4%) | 77 (24.9%) |
| 3 or more Vehicles | 151 (21.6%) | 41 (13.3%) |
| Total | 700 (100.0%) | 309 (100.0%) |
Real Estate & Mortgages in Butler
Real Estate and Mortgage Overview in Butler
| Characteristic | Without Mortgage | With Mortgage |
| Housing Units | 204 | 496 |
| Median Property Value | $86,800 | $95,200 |
| Median Household Income | $64,583 | $5 |
| Monthly Housing Costs | $470 | $4 |
| Real Estate Taxes | $543 | $33 |
Property Value by Mortgage Status in Butler
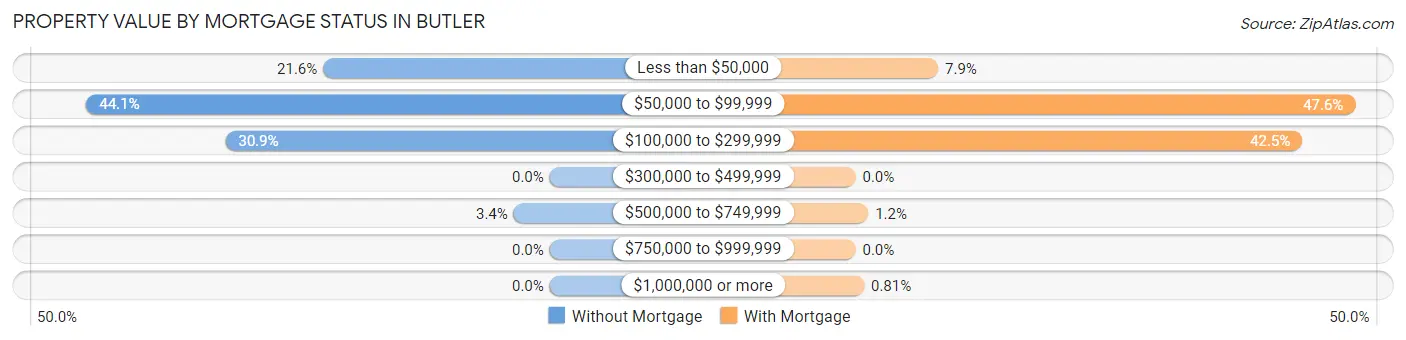
| Property Value | Without Mortgage | With Mortgage |
| Less than $50,000 | 44 (21.6%) | 39 (7.9%) |
| $50,000 to $99,999 | 90 (44.1%) | 236 (47.6%) |
| $100,000 to $299,999 | 63 (30.9%) | 211 (42.5%) |
| $300,000 to $499,999 | 0 (0.0%) | 0 (0.0%) |
| $500,000 to $749,999 | 7 (3.4%) | 6 (1.2%) |
| $750,000 to $999,999 | 0 (0.0%) | 0 (0.0%) |
| $1,000,000 or more | 0 (0.0%) | 4 (0.8%) |
| Total | 204 (100.0%) | 496 (100.0%) |
Household Income by Mortgage Status in Butler
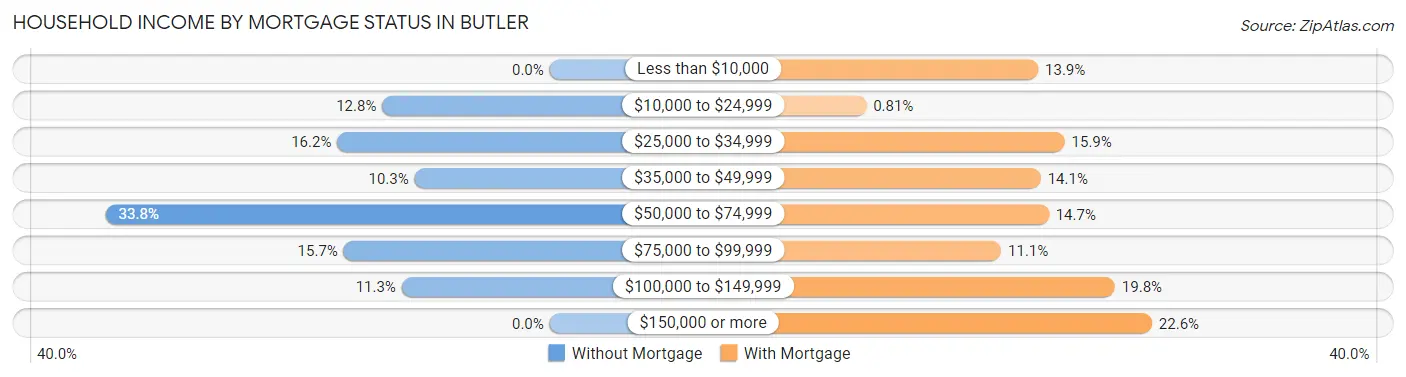
| Household Income | Without Mortgage | With Mortgage |
| Less than $10,000 | 0 (0.0%) | 69 (13.9%) |
| $10,000 to $24,999 | 26 (12.8%) | 4 (0.8%) |
| $25,000 to $34,999 | 33 (16.2%) | 79 (15.9%) |
| $35,000 to $49,999 | 21 (10.3%) | 70 (14.1%) |
| $50,000 to $74,999 | 69 (33.8%) | 73 (14.7%) |
| $75,000 to $99,999 | 32 (15.7%) | 55 (11.1%) |
| $100,000 to $149,999 | 23 (11.3%) | 98 (19.8%) |
| $150,000 or more | 0 (0.0%) | 112 (22.6%) |
| Total | 204 (100.0%) | 496 (100.0%) |
Property Value to Household Income Ratio in Butler
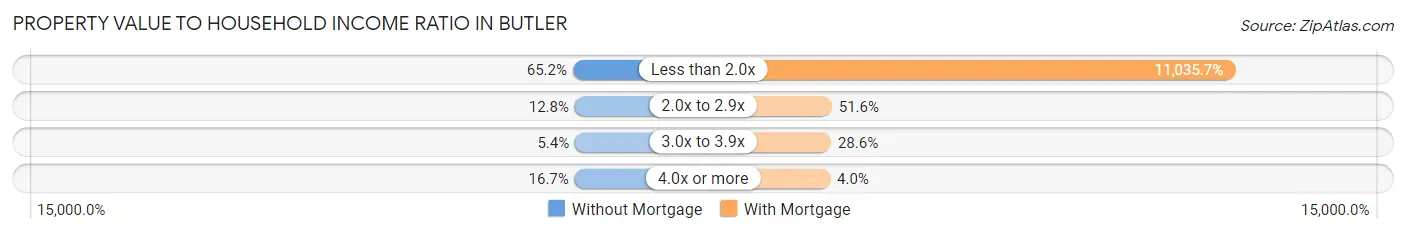
| Value-to-Income Ratio | Without Mortgage | With Mortgage |
| Less than 2.0x | 133 (65.2%) | 54,737 (11,035.7%) |
| 2.0x to 2.9x | 26 (12.8%) | 256 (51.6%) |
| 3.0x to 3.9x | 11 (5.4%) | 142 (28.6%) |
| 4.0x or more | 34 (16.7%) | 20 (4.0%) |
| Total | 204 (100.0%) | 496 (100.0%) |
Real Estate Taxes by Mortgage Status in Butler
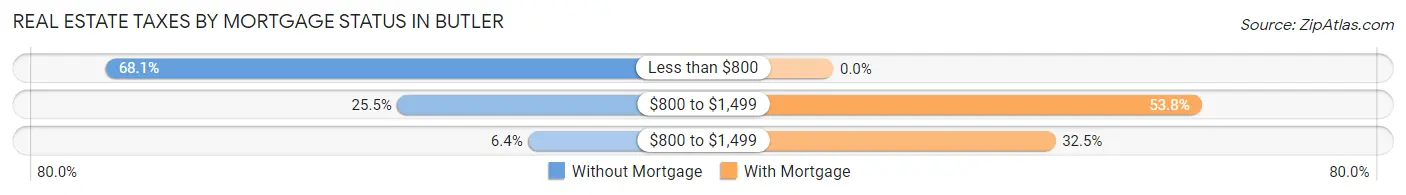
| Property Taxes | Without Mortgage | With Mortgage |
| Less than $800 | 139 (68.1%) | 0 (0.0%) |
| $800 to $1,499 | 52 (25.5%) | 267 (53.8%) |
| $800 to $1,499 | 13 (6.4%) | 161 (32.5%) |
| Total | 204 (100.0%) | 496 (100.0%) |
Health & Disability in Butler
Health Insurance Coverage by Age in Butler
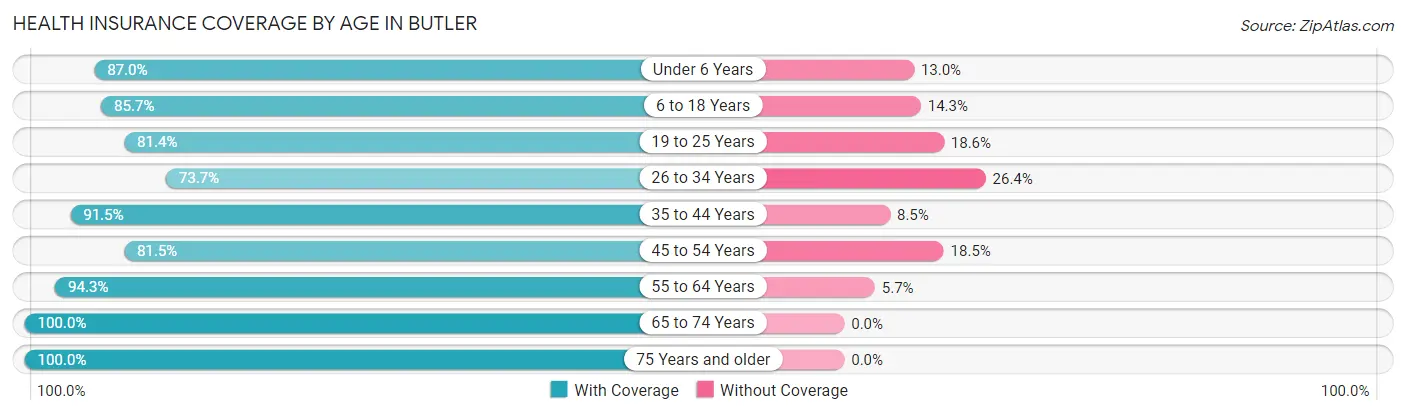
| Age Bracket | With Coverage | Without Coverage |
| Under 6 Years | 221 (87.0%) | 33 (13.0%) |
| 6 to 18 Years | 487 (85.7%) | 81 (14.3%) |
| 19 to 25 Years | 171 (81.4%) | 39 (18.6%) |
| 26 to 34 Years | 232 (73.7%) | 83 (26.4%) |
| 35 to 44 Years | 268 (91.5%) | 25 (8.5%) |
| 45 to 54 Years | 277 (81.5%) | 63 (18.5%) |
| 55 to 64 Years | 298 (94.3%) | 18 (5.7%) |
| 65 to 74 Years | 182 (100.0%) | 0 (0.0%) |
| 75 Years and older | 165 (100.0%) | 0 (0.0%) |
| Total | 2,301 (87.1%) | 342 (12.9%) |
Health Insurance Coverage by Citizenship Status in Butler
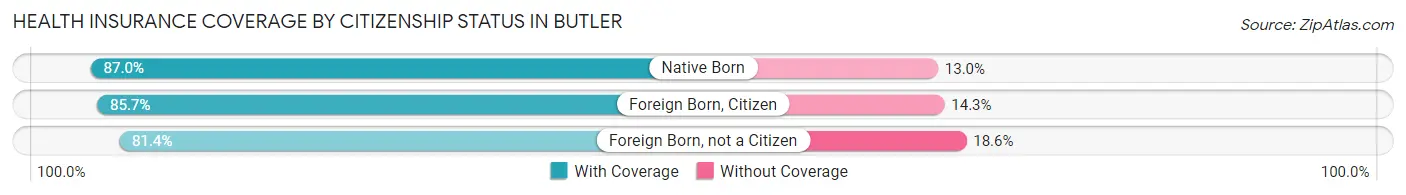
| Citizenship Status | With Coverage | Without Coverage |
| Native Born | 221 (87.0%) | 33 (13.0%) |
| Foreign Born, Citizen | 487 (85.7%) | 81 (14.3%) |
| Foreign Born, not a Citizen | 171 (81.4%) | 39 (18.6%) |
Health Insurance Coverage by Household Income in Butler
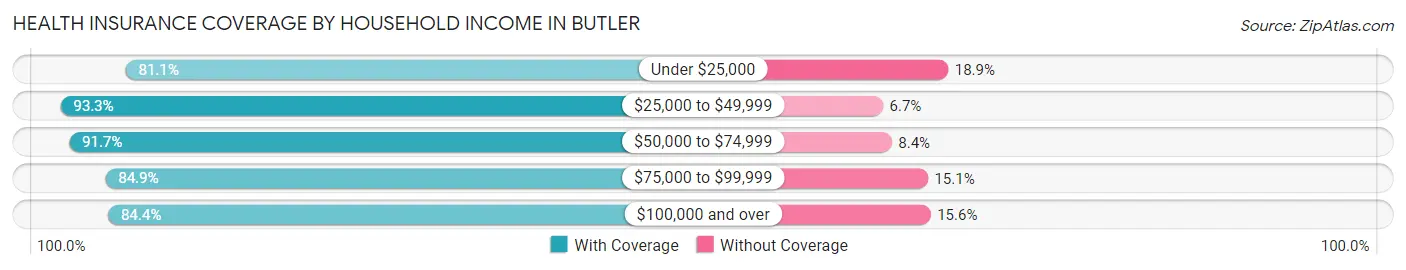
| Household Income | With Coverage | Without Coverage |
| Under $25,000 | 390 (81.1%) | 91 (18.9%) |
| $25,000 to $49,999 | 528 (93.3%) | 38 (6.7%) |
| $50,000 to $74,999 | 406 (91.6%) | 37 (8.4%) |
| $75,000 to $99,999 | 393 (84.9%) | 70 (15.1%) |
| $100,000 and over | 572 (84.4%) | 106 (15.6%) |
Public vs Private Health Insurance Coverage by Age in Butler
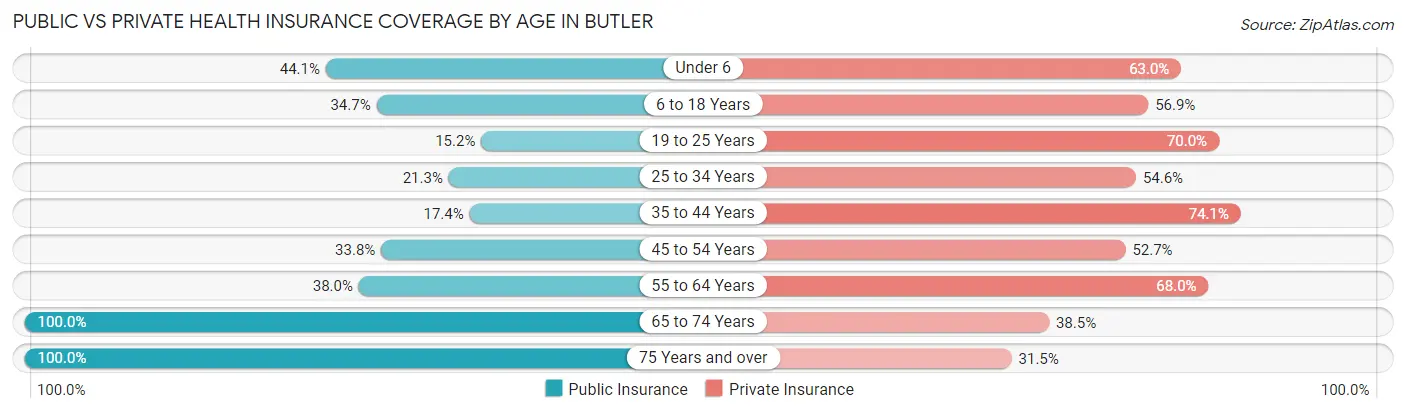
| Age Bracket | Public Insurance | Private Insurance |
| Under 6 | 112 (44.1%) | 160 (63.0%) |
| 6 to 18 Years | 197 (34.7%) | 323 (56.9%) |
| 19 to 25 Years | 32 (15.2%) | 147 (70.0%) |
| 25 to 34 Years | 67 (21.3%) | 172 (54.6%) |
| 35 to 44 Years | 51 (17.4%) | 217 (74.1%) |
| 45 to 54 Years | 115 (33.8%) | 179 (52.6%) |
| 55 to 64 Years | 120 (38.0%) | 215 (68.0%) |
| 65 to 74 Years | 182 (100.0%) | 70 (38.5%) |
| 75 Years and over | 165 (100.0%) | 52 (31.5%) |
| Total | 1,041 (39.4%) | 1,535 (58.1%) |
Disability Status by Sex by Age in Butler
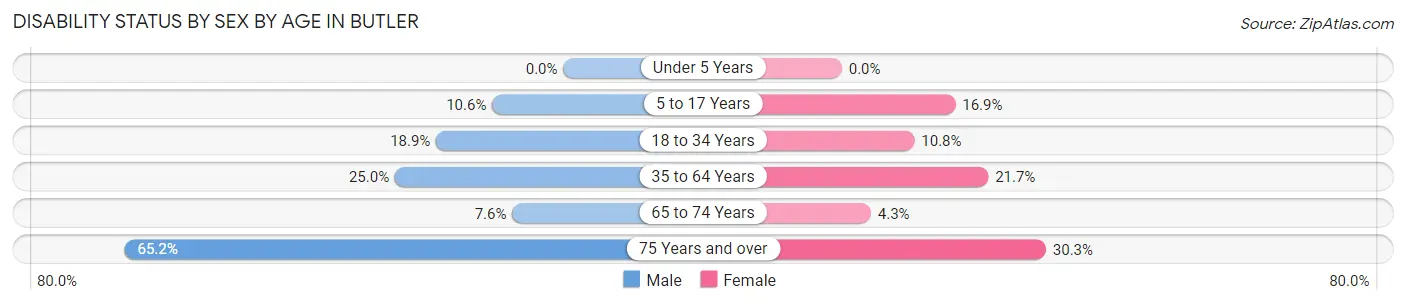
| Age Bracket | Male | Female |
| Under 5 Years | 0 (0.0%) | 0 (0.0%) |
| 5 to 17 Years | 30 (10.6%) | 47 (16.9%) |
| 18 to 34 Years | 47 (18.9%) | 33 (10.8%) |
| 35 to 64 Years | 128 (25.0%) | 95 (21.7%) |
| 65 to 74 Years | 5 (7.6%) | 5 (4.3%) |
| 75 Years and over | 43 (65.1%) | 30 (30.3%) |
Disability Class by Sex by Age in Butler
Disability Class: Hearing Difficulty
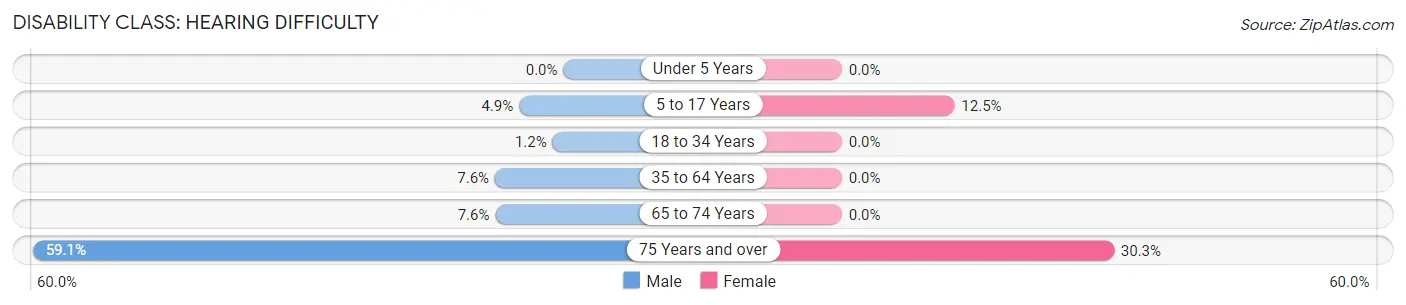
| Age Bracket | Male | Female |
| Under 5 Years | 0 (0.0%) | 0 (0.0%) |
| 5 to 17 Years | 14 (4.9%) | 35 (12.5%) |
| 18 to 34 Years | 3 (1.2%) | 0 (0.0%) |
| 35 to 64 Years | 39 (7.6%) | 0 (0.0%) |
| 65 to 74 Years | 5 (7.6%) | 0 (0.0%) |
| 75 Years and over | 39 (59.1%) | 30 (30.3%) |
Disability Class: Vision Difficulty
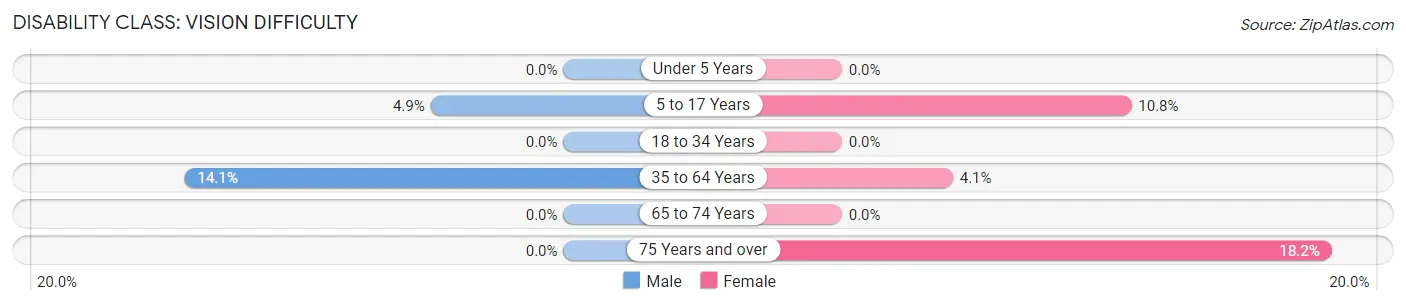
| Age Bracket | Male | Female |
| Under 5 Years | 0 (0.0%) | 0 (0.0%) |
| 5 to 17 Years | 14 (4.9%) | 30 (10.7%) |
| 18 to 34 Years | 0 (0.0%) | 0 (0.0%) |
| 35 to 64 Years | 72 (14.1%) | 18 (4.1%) |
| 65 to 74 Years | 0 (0.0%) | 0 (0.0%) |
| 75 Years and over | 0 (0.0%) | 18 (18.2%) |
Disability Class: Cognitive Difficulty
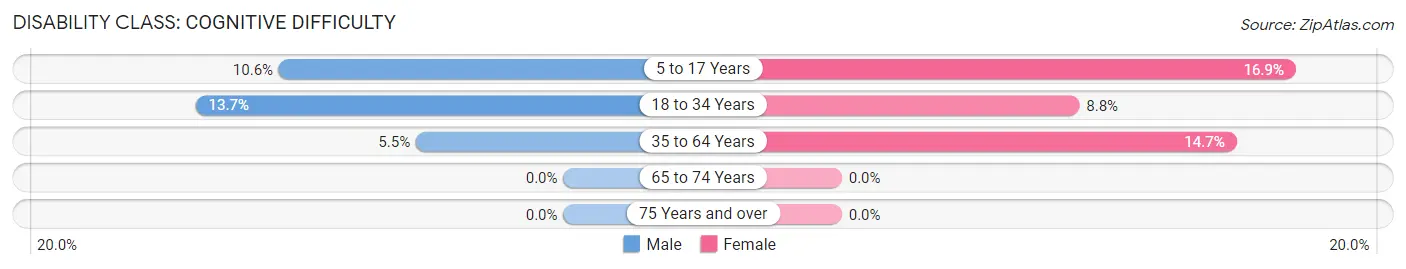
| Age Bracket | Male | Female |
| 5 to 17 Years | 30 (10.6%) | 47 (16.9%) |
| 18 to 34 Years | 34 (13.7%) | 27 (8.8%) |
| 35 to 64 Years | 28 (5.5%) | 64 (14.6%) |
| 65 to 74 Years | 0 (0.0%) | 0 (0.0%) |
| 75 Years and over | 0 (0.0%) | 0 (0.0%) |
Disability Class: Ambulatory Difficulty
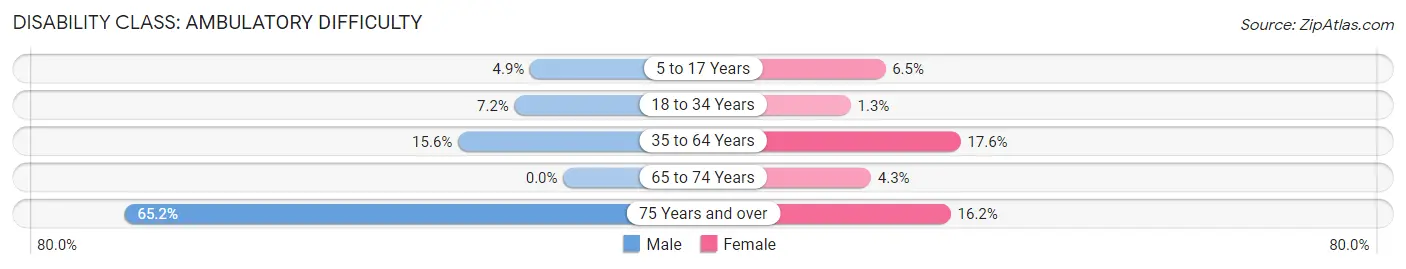
| Age Bracket | Male | Female |
| 5 to 17 Years | 14 (4.9%) | 18 (6.5%) |
| 18 to 34 Years | 18 (7.2%) | 4 (1.3%) |
| 35 to 64 Years | 80 (15.6%) | 77 (17.6%) |
| 65 to 74 Years | 0 (0.0%) | 5 (4.3%) |
| 75 Years and over | 43 (65.1%) | 16 (16.2%) |
Disability Class: Self-Care Difficulty
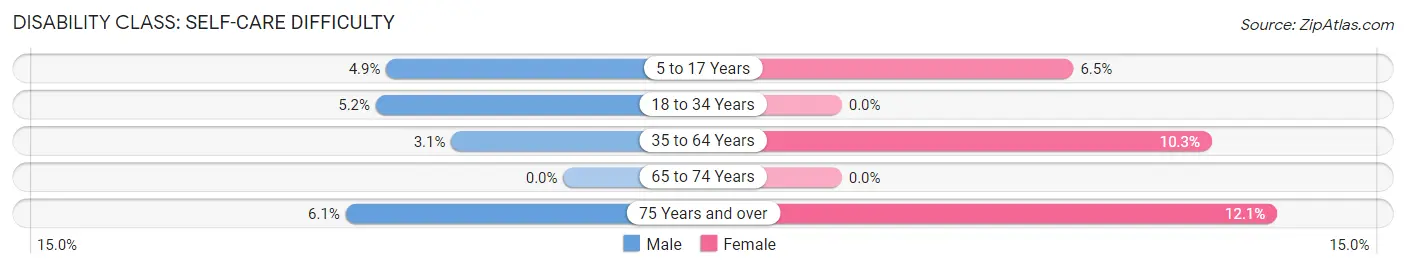
| Age Bracket | Male | Female |
| 5 to 17 Years | 14 (4.9%) | 18 (6.5%) |
| 18 to 34 Years | 13 (5.2%) | 0 (0.0%) |
| 35 to 64 Years | 16 (3.1%) | 45 (10.3%) |
| 65 to 74 Years | 0 (0.0%) | 0 (0.0%) |
| 75 Years and over | 4 (6.1%) | 12 (12.1%) |
Technology Access in Butler
Computing Device Access in Butler
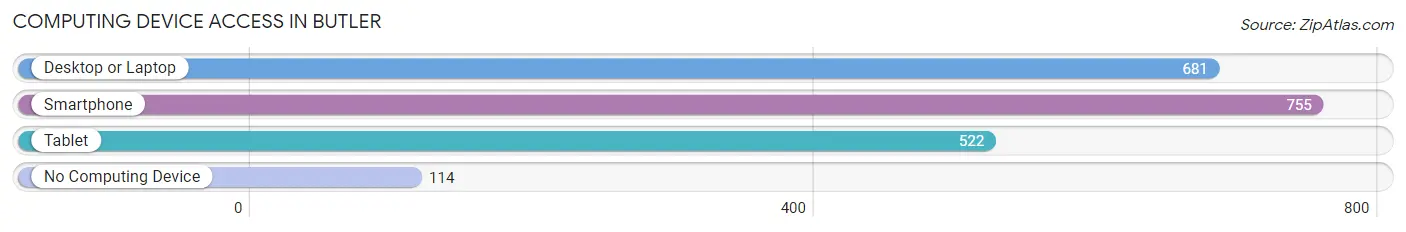
| Device Type | # Households | % Households |
| Desktop or Laptop | 681 | 67.5% |
| Smartphone | 755 | 74.8% |
| Tablet | 522 | 51.7% |
| No Computing Device | 114 | 11.3% |
| Total | 1,009 | 100.0% |
Internet Access in Butler
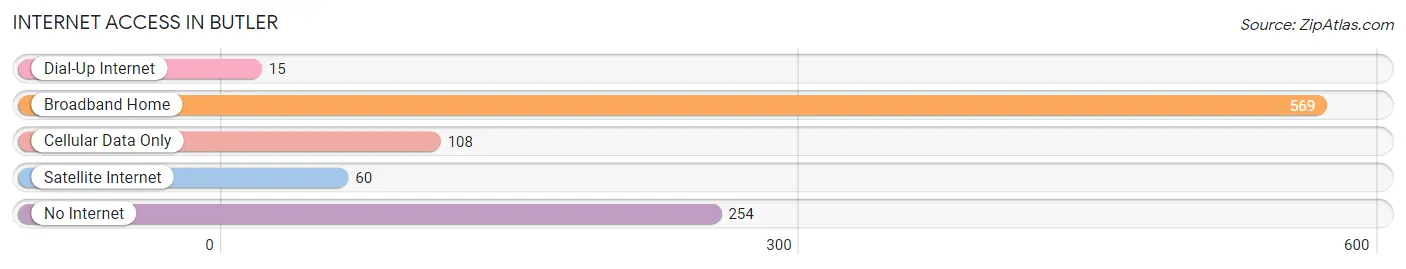
| Internet Type | # Households | % Households |
| Dial-Up Internet | 15 | 1.5% |
| Broadband Home | 569 | 56.4% |
| Cellular Data Only | 108 | 10.7% |
| Satellite Internet | 60 | 5.9% |
| No Internet | 254 | 25.2% |
| Total | 1,009 | 100.0% |
Butler Summary
Butler, Indiana is a small town located in DeKalb County, Indiana. It is situated in the northeastern part of the state, approximately 40 miles northeast of Fort Wayne. The town was founded in 1837 and has a population of approximately 1,500 people.
History
Butler was founded in 1837 by a group of settlers from Ohio. The town was named after General Richard Butler, a Revolutionary War hero. The town was originally a farming community, but it soon developed into a manufacturing center. The first industry in Butler was a sawmill, which was built in 1845. This was followed by a gristmill, a woolen mill, and a furniture factory.
In the late 19th century, Butler became a major center for the production of agricultural implements. The town was also home to several other industries, including a brickyard, a canning factory, and a flour mill.
Geography
Butler is located in the northeastern part of Indiana, approximately 40 miles northeast of Fort Wayne. The town is situated in a rural area, surrounded by farmland. The nearest major city is Auburn, which is located about 20 miles to the south.
The town is situated on the banks of the St. Joseph River, which flows through the town. The river is a popular spot for fishing and boating.
Economy
Butler’s economy is largely based on agriculture and manufacturing. The town is home to several factories, including a furniture factory, a canning factory, and a flour mill. The town also has several small businesses, including restaurants, shops, and a hardware store.
The town is also home to several farms, which produce a variety of crops, including corn, soybeans, and wheat.
Demographics
As of the 2010 census, the population of Butler was 1,500. The town is predominantly white, with approximately 95% of the population being Caucasian. The median household income is $41,000, and the median home value is $90,000.
The town has a low crime rate, and the unemployment rate is below the national average. The town is served by the DeKalb County School District, which includes two elementary schools, one middle school, and one high school.
Conclusion
Butler, Indiana is a small town located in DeKalb County, Indiana. It was founded in 1837 and has a population of approximately 1,500 people. The town is situated in a rural area, surrounded by farmland, and is home to several factories and small businesses. The town’s economy is largely based on agriculture and manufacturing, and the median household income is $41,000. Butler has a low crime rate and the unemployment rate is below the national average. The town is served by the DeKalb County School District, which includes two elementary schools, one middle school, and one high school.
Common Questions
What is Per Capita Income in Butler?
Per Capita income in Butler is $24,112.
What is the Median Family Income in Butler?
Median Family Income in Butler is $70,982.
What is the Median Household income in Butler?
Median Household Income in Butler is $53,233.
What is Income or Wage Gap in Butler?
Income or Wage Gap in Butler is 31.8%.
Women in Butler earn 68.2 cents for every dollar earned by a man.
What is Inequality or Gini Index in Butler?
Inequality or Gini Index in Butler is 0.41.
What is the Total Population of Butler?
Total Population of Butler is 2,746.
What is the Total Male Population of Butler?
Total Male Population of Butler is 1,306.
What is the Total Female Population of Butler?
Total Female Population of Butler is 1,440.
What is the Ratio of Males per 100 Females in Butler?
There are 90.69 Males per 100 Females in Butler.
What is the Ratio of Females per 100 Males in Butler?
There are 110.26 Females per 100 Males in Butler.
What is the Median Population Age in Butler?
Median Population Age in Butler is 36.8 Years.
What is the Average Family Size in Butler
Average Family Size in Butler is 3.2 People.
What is the Average Household Size in Butler
Average Household Size in Butler is 2.6 People.
How Large is the Labor Force in Butler?
There are 1,136 People in the Labor Forcein in Butler.
What is the Percentage of People in the Labor Force in Butler?
55.3% of People are in the Labor Force in Butler.
What is the Unemployment Rate in Butler?
Unemployment Rate in Butler is 4.0%.