Zip Codes with the Highest Percentage of Population with a Degree in Computers and Mathematics in Indiana
RELATED REPORTS & OPTIONS
Computers and Mathematics
Indiana
Compare Zip Codes
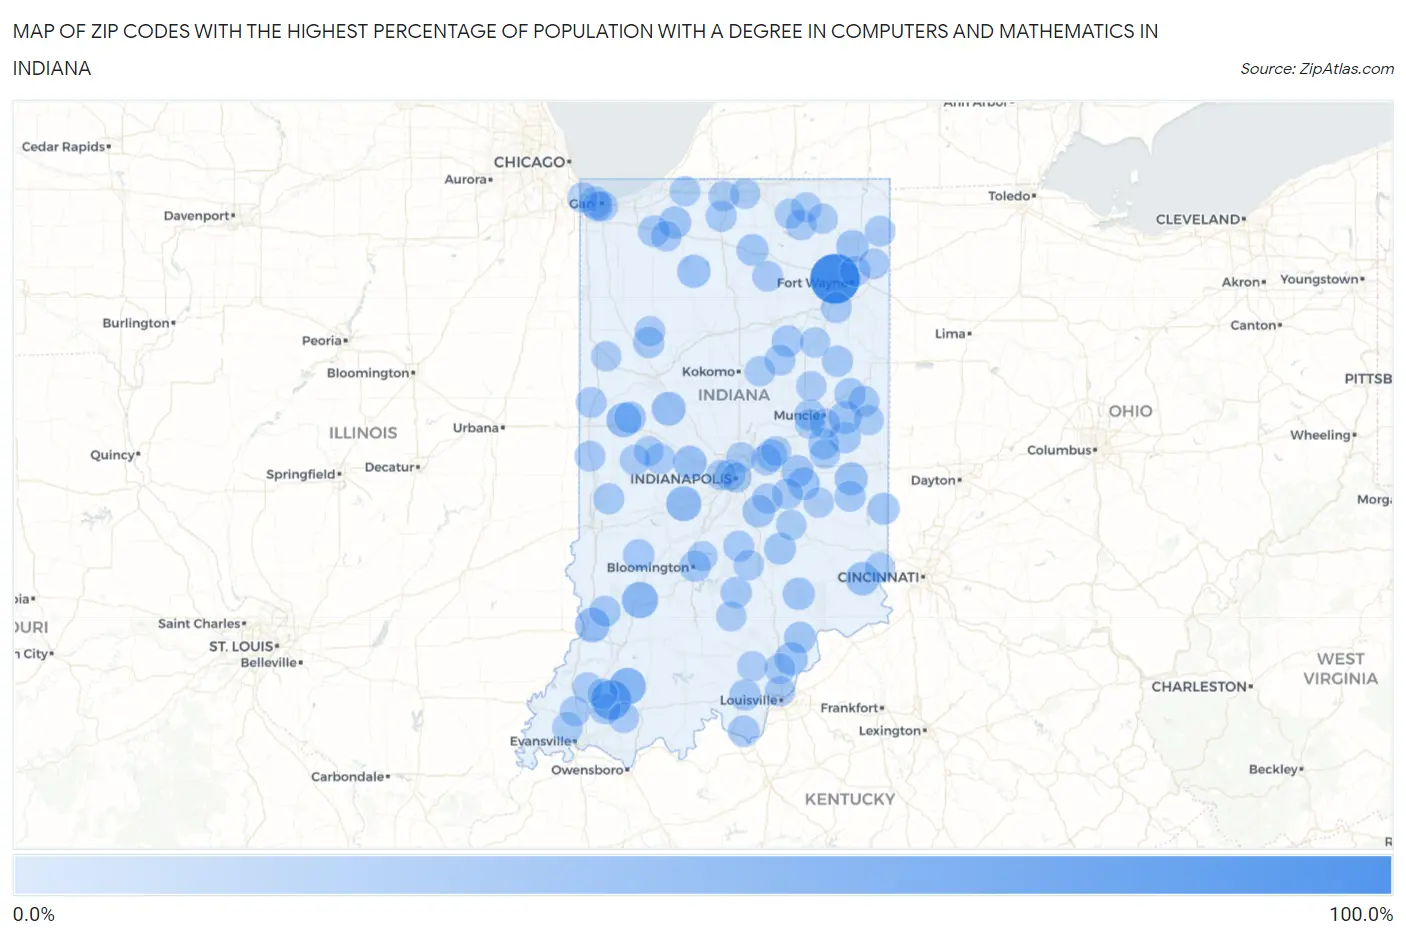
Map of Zip Codes with the Highest Percentage of Population with a Degree in Computers and Mathematics in Indiana
0.0%
100.0%
Zip Codes with the Highest Percentage of Population with a Degree in Computers and Mathematics in Indiana
| Zip Code | % Graduates | vs State | vs National | |
| 1. | 46704 | 100.0% | 4.2%(+95.8)#1 | 4.9%(+95.1)#20 |
| 2. | 47584 | 50.0% | 4.2%(+45.8)#2 | 4.9%(+45.1)#84 |
| 3. | 47590 | 37.1% | 4.2%(+32.9)#3 | 4.9%(+32.2)#149 |
| 4. | 47449 | 34.5% | 4.2%(+30.2)#4 | 4.9%(+29.6)#172 |
| 5. | 46180 | 28.8% | 4.2%(+24.6)#5 | 4.9%(+23.9)#240 |
| 6. | 47516 | 27.3% | 4.2%(+23.0)#6 | 4.9%(+22.4)#257 |
| 7. | 47958 | 26.3% | 4.2%(+22.1)#7 | 4.9%(+21.4)#280 |
| 8. | 47930 | 23.6% | 4.2%(+19.4)#8 | 4.9%(+18.7)#347 |
| 9. | 46149 | 22.0% | 4.2%(+17.7)#9 | 4.9%(+17.1)#393 |
| 10. | 47032 | 21.8% | 4.2%(+17.5)#10 | 4.9%(+16.9)#398 |
| 11. | 46960 | 20.2% | 4.2%(+15.9)#11 | 4.9%(+15.3)#457 |
| 12. | 47163 | 20.0% | 4.2%(+15.8)#12 | 4.9%(+15.1)#462 |
| 13. | 47357 | 19.1% | 4.2%(+14.9)#13 | 4.9%(+14.3)#497 |
| 14. | 47368 | 18.4% | 4.2%(+14.2)#14 | 4.9%(+13.5)#539 |
| 15. | 46738 | 17.2% | 4.2%(+12.9)#15 | 4.9%(+12.3)#620 |
| 16. | 46346 | 16.7% | 4.2%(+12.4)#16 | 4.9%(+11.8)#641 |
| 17. | 46162 | 16.5% | 4.2%(+12.2)#17 | 4.9%(+11.6)#660 |
| 18. | 46115 | 16.4% | 4.2%(+12.1)#18 | 4.9%(+11.5)#666 |
| 19. | 46117 | 15.9% | 4.2%(+11.6)#19 | 4.9%(+11.0)#710 |
| 20. | 47282 | 15.8% | 4.2%(+11.5)#20 | 4.9%(+10.9)#722 |
| 21. | 46524 | 14.5% | 4.2%(+10.2)#21 | 4.9%(+9.58)#848 |
| 22. | 47246 | 14.4% | 4.2%(+10.1)#22 | 4.9%(+9.50)#854 |
| 23. | 47994 | 14.1% | 4.2%(+9.82)#23 | 4.9%(+9.17)#902 |
| 24. | 46406 | 13.9% | 4.2%(+9.62)#24 | 4.9%(+8.97)#926 |
| 25. | 47003 | 13.2% | 4.2%(+8.93)#25 | 4.9%(+8.28)#1,026 |
| 26. | 47138 | 13.1% | 4.2%(+8.81)#26 | 4.9%(+8.16)#1,045 |
| 27. | 46940 | 12.8% | 4.2%(+8.57)#27 | 4.9%(+7.93)#1,076 |
| 28. | 47135 | 12.7% | 4.2%(+8.41)#28 | 4.9%(+7.76)#1,101 |
| 29. | 47427 | 12.3% | 4.2%(+8.06)#29 | 4.9%(+7.41)#1,166 |
| 30. | 46390 | 12.2% | 4.2%(+7.93)#30 | 4.9%(+7.28)#1,186 |
| 31. | 47354 | 11.9% | 4.2%(+7.66)#31 | 4.9%(+7.01)#1,233 |
| 32. | 47114 | 11.8% | 4.2%(+7.60)#32 | 4.9%(+6.95)#1,247 |
| 33. | 47373 | 11.6% | 4.2%(+7.32)#33 | 4.9%(+6.68)#1,316 |
| 34. | 47235 | 11.5% | 4.2%(+7.29)#34 | 4.9%(+6.64)#1,321 |
| 35. | 47406 | 11.5% | 4.2%(+7.21)#35 | 4.9%(+6.56)#1,336 |
| 36. | 47396 | 11.3% | 4.2%(+7.04)#36 | 4.9%(+6.39)#1,386 |
| 37. | 46040 | 11.3% | 4.2%(+7.03)#37 | 4.9%(+6.38)#1,388 |
| 38. | 47929 | 11.0% | 4.2%(+6.75)#38 | 4.9%(+6.11)#1,459 |
| 39. | 47359 | 11.0% | 4.2%(+6.71)#39 | 4.9%(+6.06)#1,466 |
| 40. | 46799 | 10.6% | 4.2%(+6.36)#40 | 4.9%(+5.71)#1,554 |
| 41. | 47874 | 10.6% | 4.2%(+6.31)#41 | 4.9%(+5.67)#1,565 |
| 42. | 47619 | 10.5% | 4.2%(+6.28)#42 | 4.9%(+5.63)#1,575 |
| 43. | 47380 | 10.4% | 4.2%(+6.13)#43 | 4.9%(+5.48)#1,620 |
| 44. | 47361 | 10.3% | 4.2%(+6.10)#44 | 4.9%(+5.45)#1,634 |
| 45. | 46536 | 10.0% | 4.2%(+5.78)#45 | 4.9%(+5.13)#1,745 |
| 46. | 46161 | 9.9% | 4.2%(+5.62)#46 | 4.9%(+4.97)#1,807 |
| 47. | 47535 | 9.8% | 4.2%(+5.54)#47 | 4.9%(+4.89)#1,843 |
| 48. | 46987 | 9.7% | 4.2%(+5.44)#48 | 4.9%(+4.80)#1,889 |
| 49. | 47331 | 9.4% | 4.2%(+5.14)#49 | 4.9%(+4.49)#2,025 |
| 50. | 46164 | 9.3% | 4.2%(+5.03)#50 | 4.9%(+4.39)#2,076 |
| 51. | 46510 | 9.2% | 4.2%(+4.92)#51 | 4.9%(+4.28)#2,135 |
| 52. | 46825 | 9.2% | 4.2%(+4.91)#52 | 4.9%(+4.27)#2,142 |
| 53. | 47954 | 9.1% | 4.2%(+4.86)#53 | 4.9%(+4.21)#2,168 |
| 54. | 46126 | 9.1% | 4.2%(+4.84)#54 | 4.9%(+4.20)#2,178 |
| 55. | 46340 | 9.0% | 4.2%(+4.73)#55 | 4.9%(+4.09)#2,269 |
| 56. | 47637 | 8.9% | 4.2%(+4.67)#56 | 4.9%(+4.02)#2,304 |
| 57. | 47991 | 8.9% | 4.2%(+4.61)#57 | 4.9%(+3.97)#2,328 |
| 58. | 47143 | 8.6% | 4.2%(+4.39)#58 | 4.9%(+3.75)#2,453 |
| 59. | 47928 | 8.5% | 4.2%(+4.29)#59 | 4.9%(+3.64)#2,516 |
| 60. | 46222 | 8.3% | 4.2%(+4.06)#60 | 4.9%(+3.41)#2,666 |
| 61. | 47720 | 8.3% | 4.2%(+4.06)#61 | 4.9%(+3.41)#2,667 |
| 62. | 46767 | 8.3% | 4.2%(+4.02)#62 | 4.9%(+3.37)#2,696 |
| 63. | 46721 | 8.2% | 4.2%(+3.99)#63 | 4.9%(+3.34)#2,717 |
| 64. | 46407 | 8.1% | 4.2%(+3.81)#64 | 4.9%(+3.16)#2,857 |
| 65. | 46055 | 8.0% | 4.2%(+3.74)#65 | 4.9%(+3.09)#2,917 |
| 66. | 46741 | 7.7% | 4.2%(+3.46)#66 | 4.9%(+2.81)#3,132 |
| 67. | 47649 | 7.7% | 4.2%(+3.45)#67 | 4.9%(+2.80)#3,148 |
| 68. | 47129 | 7.6% | 4.2%(+3.37)#68 | 4.9%(+2.72)#3,228 |
| 69. | 46404 | 7.6% | 4.2%(+3.36)#69 | 4.9%(+2.71)#3,234 |
| 70. | 47660 | 7.6% | 4.2%(+3.35)#70 | 4.9%(+2.70)#3,242 |
| 71. | 47302 | 7.6% | 4.2%(+3.33)#71 | 4.9%(+2.68)#3,266 |
| 72. | 46613 | 7.5% | 4.2%(+3.30)#72 | 4.9%(+2.66)#3,294 |
| 73. | 47989 | 7.5% | 4.2%(+3.26)#73 | 4.9%(+2.62)#3,329 |
| 74. | 46571 | 7.4% | 4.2%(+3.16)#74 | 4.9%(+2.51)#3,419 |
| 75. | 47394 | 7.3% | 4.2%(+3.01)#75 | 4.9%(+2.37)#3,561 |
| 76. | 47201 | 7.2% | 4.2%(+3.00)#76 | 4.9%(+2.35)#3,578 |
| 77. | 46561 | 7.2% | 4.2%(+2.99)#77 | 4.9%(+2.35)#3,582 |
| 78. | 46792 | 7.1% | 4.2%(+2.87)#78 | 4.9%(+2.22)#3,715 |
| 79. | 46936 | 7.1% | 4.2%(+2.82)#79 | 4.9%(+2.17)#3,754 |
| 80. | 47980 | 7.1% | 4.2%(+2.81)#80 | 4.9%(+2.16)#3,763 |
| 81. | 46182 | 7.0% | 4.2%(+2.79)#81 | 4.9%(+2.14)#3,786 |
| 82. | 47165 | 7.0% | 4.2%(+2.77)#82 | 4.9%(+2.12)#3,806 |
| 83. | 46327 | 6.9% | 4.2%(+2.65)#83 | 4.9%(+2.01)#3,941 |
| 84. | 47639 | 6.9% | 4.2%(+2.65)#84 | 4.9%(+2.01)#3,942 |
| 85. | 46240 | 6.8% | 4.2%(+2.59)#85 | 4.9%(+1.94)#4,016 |
| 86. | 46173 | 6.8% | 4.2%(+2.57)#86 | 4.9%(+1.92)#4,051 |
| 87. | 47408 | 6.8% | 4.2%(+2.57)#87 | 4.9%(+1.92)#4,054 |
| 88. | 47025 | 6.8% | 4.2%(+2.55)#88 | 4.9%(+1.91)#4,066 |
| 89. | 47260 | 6.8% | 4.2%(+2.55)#89 | 4.9%(+1.90)#4,069 |
| 90. | 46371 | 6.8% | 4.2%(+2.53)#90 | 4.9%(+1.89)#4,098 |
| 91. | 47944 | 6.7% | 4.2%(+2.44)#91 | 4.9%(+1.79)#4,215 |
| 92. | 47362 | 6.7% | 4.2%(+2.43)#92 | 4.9%(+1.79)#4,225 |
| 93. | 47965 | 6.7% | 4.2%(+2.42)#93 | 4.9%(+1.77)#4,245 |
| 94. | 46214 | 6.7% | 4.2%(+2.41)#94 | 4.9%(+1.76)#4,268 |
| 95. | 46048 | 6.6% | 4.2%(+2.39)#95 | 4.9%(+1.74)#4,289 |
| 96. | 46204 | 6.5% | 4.2%(+2.28)#96 | 4.9%(+1.63)#4,415 |
| 97. | 47334 | 6.5% | 4.2%(+2.26)#97 | 4.9%(+1.61)#4,456 |
| 98. | 46957 | 6.5% | 4.2%(+2.20)#98 | 4.9%(+1.56)#4,529 |
| 99. | 46784 | 6.4% | 4.2%(+2.18)#99 | 4.9%(+1.54)#4,554 |
| 100. | 46543 | 6.4% | 4.2%(+2.17)#100 | 4.9%(+1.52)#4,583 |
Common Questions
What are the Top 10 Zip Codes with the Highest Percentage of Population with a Degree in Computers and Mathematics in Indiana?
Top 10 Zip Codes with the Highest Percentage of Population with a Degree in Computers and Mathematics in Indiana are:
What zip code has the Highest Percentage of Population with a Degree in Computers and Mathematics in Indiana?
46704 has the Highest Percentage of Population with a Degree in Computers and Mathematics in Indiana with 100.0%.
What is the Percentage of Population with a Degree in Computers and Mathematics in the State of Indiana?
Percentage of Population with a Degree in Computers and Mathematics in Indiana is 4.2%.
What is the Percentage of Population with a Degree in Computers and Mathematics in the United States?
Percentage of Population with a Degree in Computers and Mathematics in the United States is 4.9%.