Saratoga, IN Map & Demographics
Saratoga Map
Saratoga Overview
$19,700
PER CAPITA INCOME
$59,531
AVG FAMILY INCOME
$48,750
AVG HOUSEHOLD INCOME
0.39
INEQUALITY / GINI INDEX
312
TOTAL POPULATION
161
MALE POPULATION
151
FEMALE POPULATION
106.62
MALES / 100 FEMALES
93.79
FEMALES / 100 MALES
31.3
MEDIAN AGE
3.8
AVG FAMILY SIZE
2.9
AVG HOUSEHOLD SIZE
122
LABOR FORCE [ PEOPLE ]
54.0%
PERCENT IN LABOR FORCE
5.7%
UNEMPLOYMENT RATE
Saratoga Zip Codes
Saratoga Area Codes
Income in Saratoga
Income Overview in Saratoga
Per Capita Income in Saratoga is $19,700, while median incomes of families and households are $59,531 and $48,750 respectively.
| Characteristic | Number | Measure |
| Per Capita Income | 312 | $19,700 |
| Median Family Income | 55 | $59,531 |
| Mean Family Income | 55 | $63,500 |
| Median Household Income | 107 | $48,750 |
| Mean Household Income | 107 | $54,250 |
| Income Deficit | 55 | $0 |
| Wage / Income Gap (%) | 312 | 0.00% |
| Wage / Income Gap ($) | 312 | 100.00¢ per $1 |
| Gini / Inequality Index | 312 | 0.39 |
Earnings by Sex in Saratoga
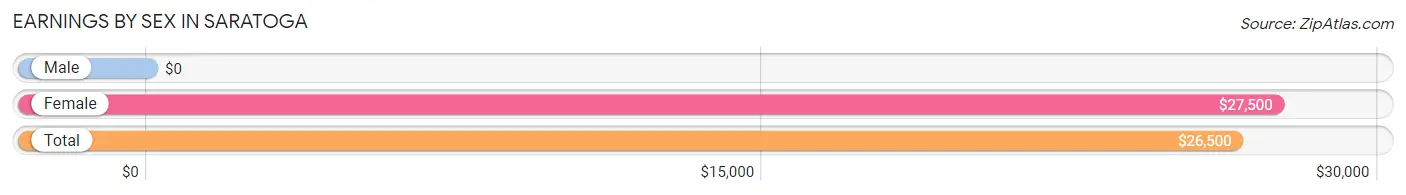
| Sex | Number | Average Earnings |
| Male | 88 (61.1%) | $0 |
| Female | 56 (38.9%) | $27,500 |
| Total | 144 (100.0%) | $26,500 |
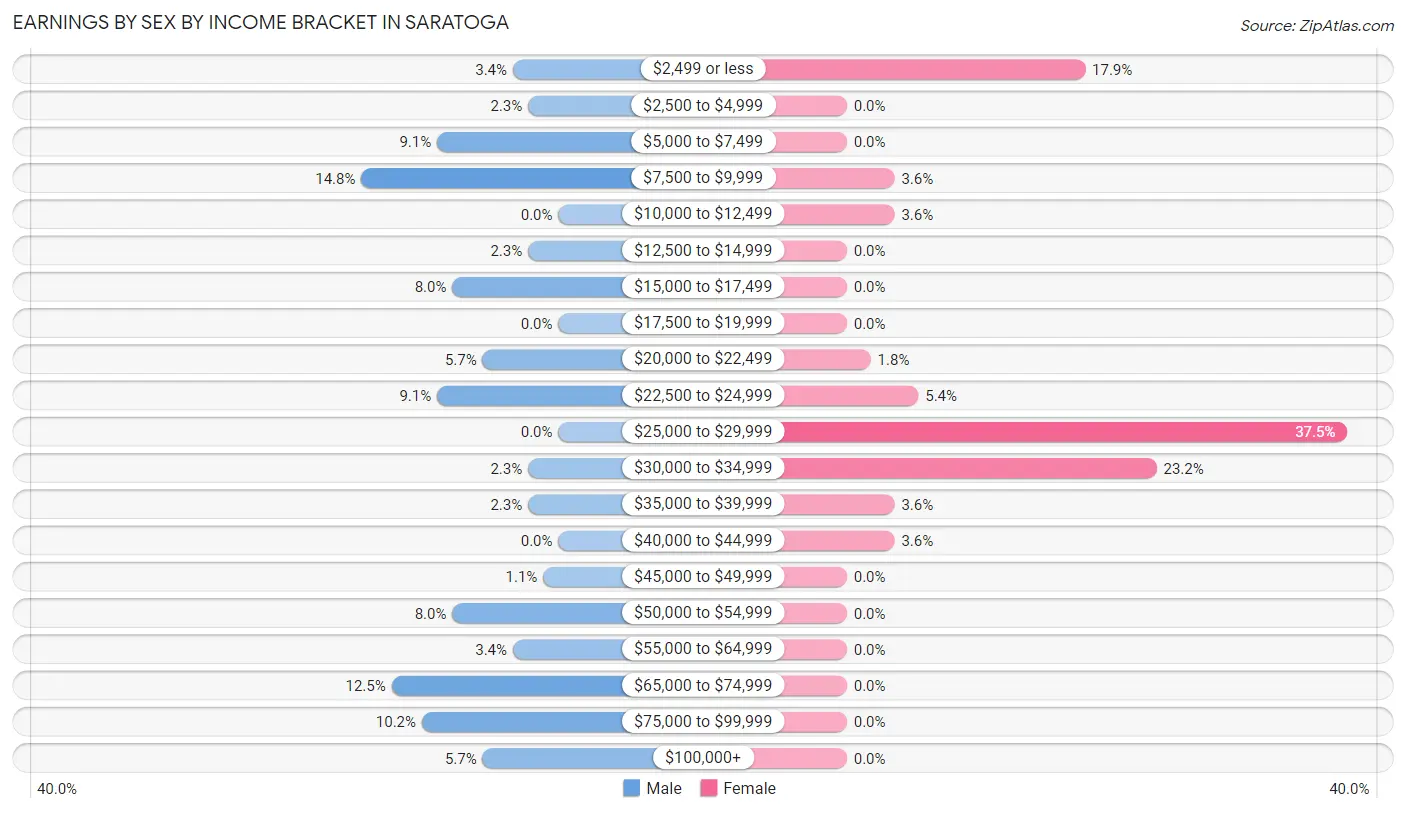
Earnings by Sex by Income Bracket in Saratoga
The most common earnings brackets in Saratoga are $7,500 to $9,999 for men (13 | 14.8%) and $25,000 to $29,999 for women (21 | 37.5%).
| Income | Male | Female |
| $2,499 or less | 3 (3.4%) | 10 (17.9%) |
| $2,500 to $4,999 | 2 (2.3%) | 0 (0.0%) |
| $5,000 to $7,499 | 8 (9.1%) | 0 (0.0%) |
| $7,500 to $9,999 | 13 (14.8%) | 2 (3.6%) |
| $10,000 to $12,499 | 0 (0.0%) | 2 (3.6%) |
| $12,500 to $14,999 | 2 (2.3%) | 0 (0.0%) |
| $15,000 to $17,499 | 7 (8.0%) | 0 (0.0%) |
| $17,500 to $19,999 | 0 (0.0%) | 0 (0.0%) |
| $20,000 to $22,499 | 5 (5.7%) | 1 (1.8%) |
| $22,500 to $24,999 | 8 (9.1%) | 3 (5.4%) |
| $25,000 to $29,999 | 0 (0.0%) | 21 (37.5%) |
| $30,000 to $34,999 | 2 (2.3%) | 13 (23.2%) |
| $35,000 to $39,999 | 2 (2.3%) | 2 (3.6%) |
| $40,000 to $44,999 | 0 (0.0%) | 2 (3.6%) |
| $45,000 to $49,999 | 1 (1.1%) | 0 (0.0%) |
| $50,000 to $54,999 | 7 (8.0%) | 0 (0.0%) |
| $55,000 to $64,999 | 3 (3.4%) | 0 (0.0%) |
| $65,000 to $74,999 | 11 (12.5%) | 0 (0.0%) |
| $75,000 to $99,999 | 9 (10.2%) | 0 (0.0%) |
| $100,000+ | 5 (5.7%) | 0 (0.0%) |
| Total | 88 (100.0%) | 56 (100.0%) |
Earnings by Sex by Educational Attainment in Saratoga
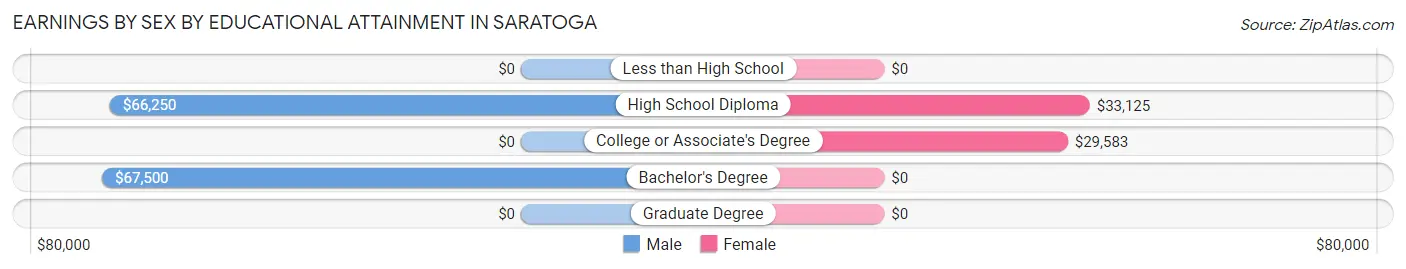
| Educational Attainment | Male Income | Female Income |
| Less than High School | - | - |
| High School Diploma | $66,250 | $33,125 |
| College or Associate's Degree | - | - |
| Bachelor's Degree | $67,500 | $0 |
| Graduate Degree | - | - |
| Total | - | - |
Family Income in Saratoga
Family Income Brackets in Saratoga
According to the Saratoga family income data, there are 19 families falling into the $50,000 to $74,999 income range, which is the most common income bracket and makes up 34.5% of all families.
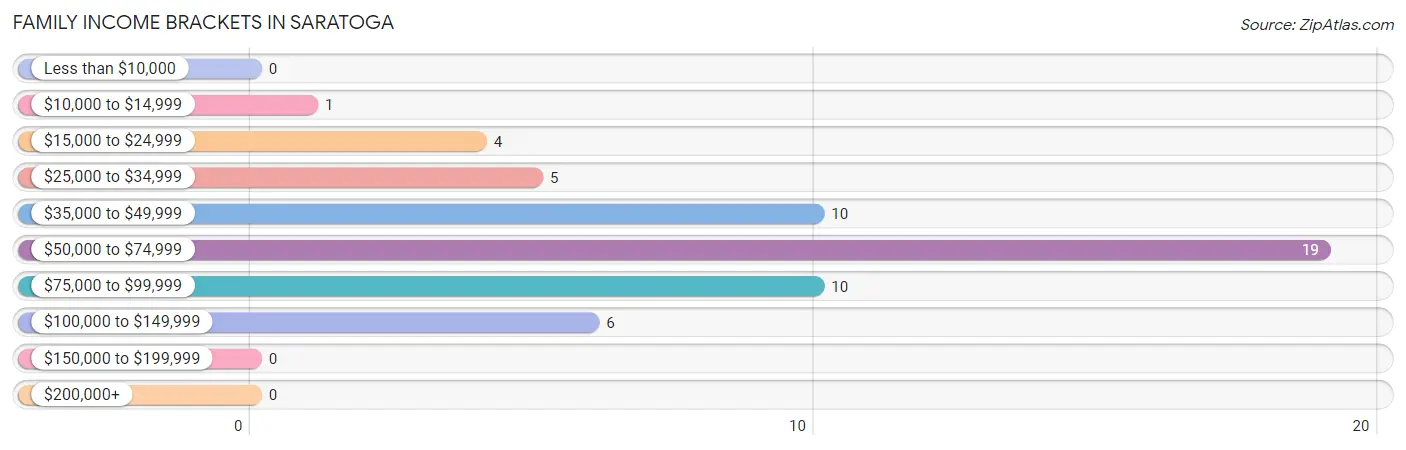
| Income Bracket | # Families | % Families |
| Less than $10,000 | 0 | 0.0% |
| $10,000 to $14,999 | 1 | 1.8% |
| $15,000 to $24,999 | 4 | 7.3% |
| $25,000 to $34,999 | 5 | 9.1% |
| $35,000 to $49,999 | 10 | 18.2% |
| $50,000 to $74,999 | 19 | 34.5% |
| $75,000 to $99,999 | 10 | 18.2% |
| $100,000 to $149,999 | 6 | 10.9% |
| $150,000 to $199,999 | 0 | 0.0% |
| $200,000+ | 0 | 0.0% |
Family Income by Famaliy Size in Saratoga
3-person families (16 | 29.1%) account for the highest median family income in Saratoga with $77,500 per family, while 3-person families (16 | 29.1%) have the highest median income of $25,833 per family member.
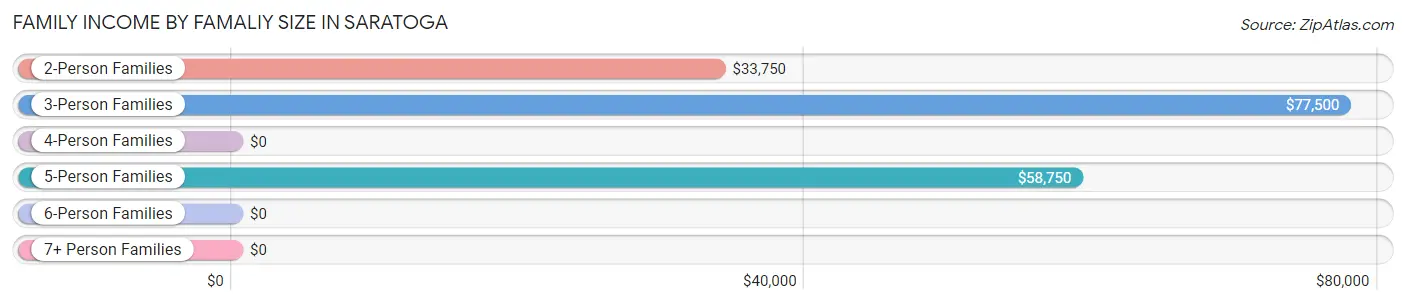
| Income Bracket | # Families | Median Income |
| 2-Person Families | 11 (20.0%) | $33,750 |
| 3-Person Families | 16 (29.1%) | $77,500 |
| 4-Person Families | 16 (29.1%) | $0 |
| 5-Person Families | 12 (21.8%) | $58,750 |
| 6-Person Families | 0 (0.0%) | $0 |
| 7+ Person Families | 0 (0.0%) | $0 |
| Total | 55 (100.0%) | $59,531 |
Family Income by Number of Earners in Saratoga
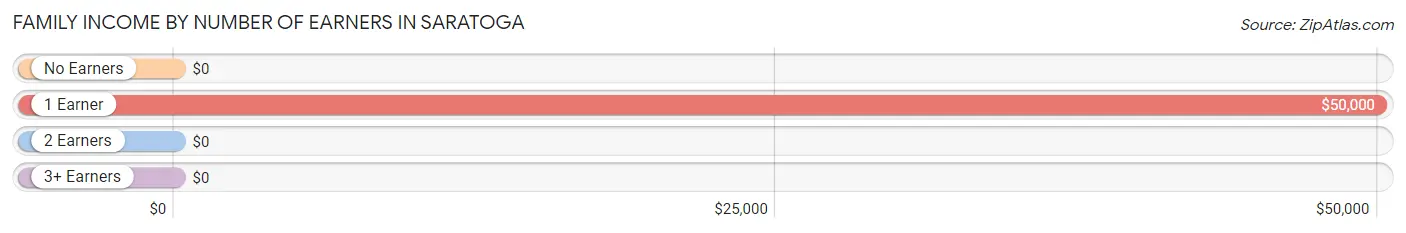
| Number of Earners | # Families | Median Income |
| No Earners | 10 (18.2%) | $0 |
| 1 Earner | 26 (47.3%) | $50,000 |
| 2 Earners | 16 (29.1%) | $0 |
| 3+ Earners | 3 (5.4%) | $0 |
| Total | 55 (100.0%) | $59,531 |
Household Income in Saratoga
Household Income Brackets in Saratoga
With 25 households falling in the category, the $50,000 to $74,999 income range is the most frequent in Saratoga, accounting for 23.4% of all households.
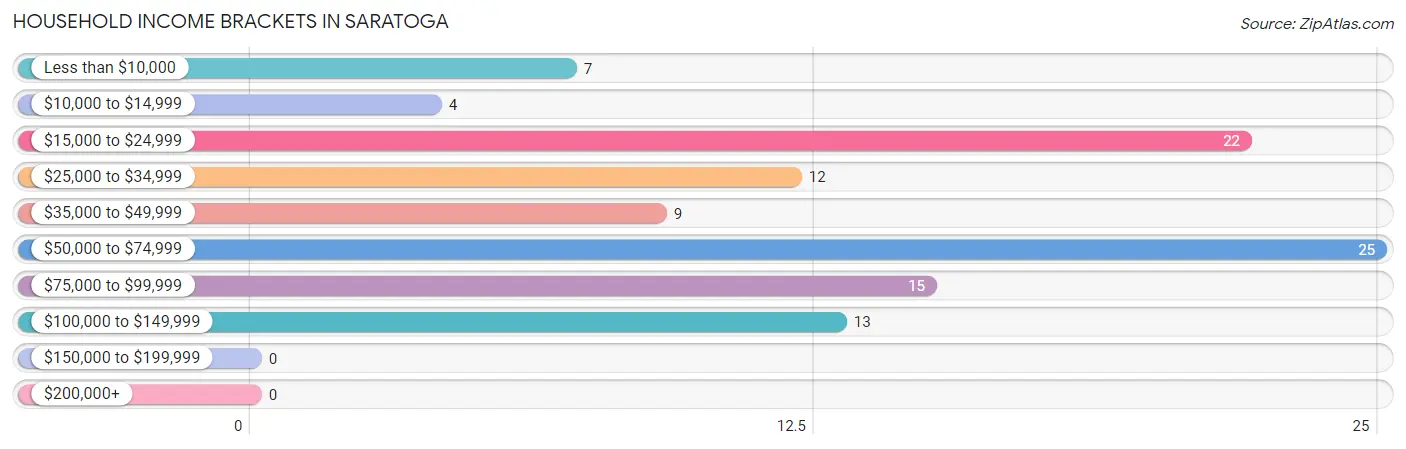
| Income Bracket | # Households | % Households |
| Less than $10,000 | 7 | 6.5% |
| $10,000 to $14,999 | 4 | 3.7% |
| $15,000 to $24,999 | 22 | 20.6% |
| $25,000 to $34,999 | 12 | 11.2% |
| $35,000 to $49,999 | 9 | 8.4% |
| $50,000 to $74,999 | 25 | 23.4% |
| $75,000 to $99,999 | 15 | 14.0% |
| $100,000 to $149,999 | 13 | 12.1% |
| $150,000 to $199,999 | 0 | 0.0% |
| $200,000+ | 0 | 0.0% |
Household Income by Householder Age in Saratoga
The median household income in Saratoga is $48,750, with the highest median household income of $58,906 found in the 25 to 44 years age bracket for the primary householder. A total of 39 households (36.4%) fall into this category. Meanwhile, the 15 to 24 years age bracket for the primary householder has the lowest median household income of $0, with 5 households (4.7%) in this group.
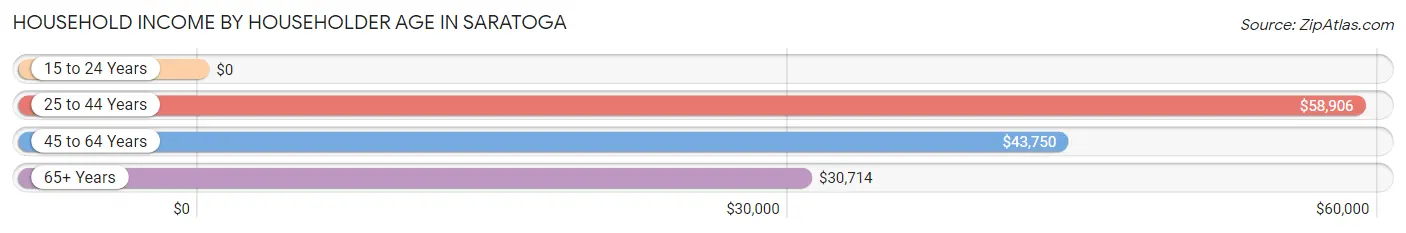
| Income Bracket | # Households | Median Income |
| 15 to 24 Years | 5 (4.7%) | $0 |
| 25 to 44 Years | 39 (36.4%) | $58,906 |
| 45 to 64 Years | 39 (36.4%) | $43,750 |
| 65+ Years | 24 (22.4%) | $30,714 |
| Total | 107 (100.0%) | $48,750 |
Poverty in Saratoga
Income Below Poverty by Sex and Age in Saratoga
With 18.6% poverty level for males and 17.9% for females among the residents of Saratoga, 55 to 64 year old males and 16 and 17 year old females are the most vulnerable to poverty, with 11 males (52.4%) and 2 females (100.0%) in their respective age groups living below the poverty level.
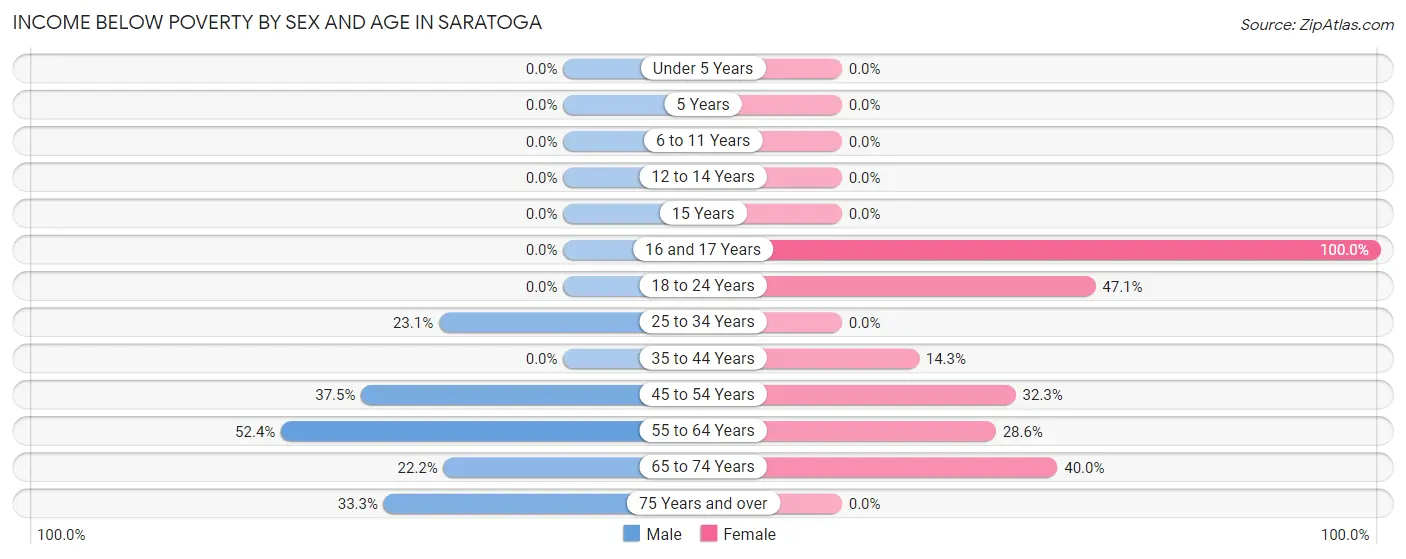
| Age Bracket | Male | Female |
| Under 5 Years | 0 (0.0%) | 0 (0.0%) |
| 5 Years | 0 (0.0%) | 0 (0.0%) |
| 6 to 11 Years | 0 (0.0%) | 0 (0.0%) |
| 12 to 14 Years | 0 (0.0%) | 0 (0.0%) |
| 15 Years | 0 (0.0%) | 0 (0.0%) |
| 16 and 17 Years | 0 (0.0%) | 2 (100.0%) |
| 18 to 24 Years | 0 (0.0%) | 8 (47.1%) |
| 25 to 34 Years | 6 (23.1%) | 0 (0.0%) |
| 35 to 44 Years | 0 (0.0%) | 1 (14.3%) |
| 45 to 54 Years | 9 (37.5%) | 10 (32.3%) |
| 55 to 64 Years | 11 (52.4%) | 2 (28.6%) |
| 65 to 74 Years | 2 (22.2%) | 4 (40.0%) |
| 75 Years and over | 2 (33.3%) | 0 (0.0%) |
| Total | 30 (18.6%) | 27 (17.9%) |
Income Above Poverty by Sex and Age in Saratoga
According to the poverty statistics in Saratoga, males aged under 5 years and females aged under 5 years are the age groups that are most secure financially, with 100.0% of males and 100.0% of females in these age groups living above the poverty line.
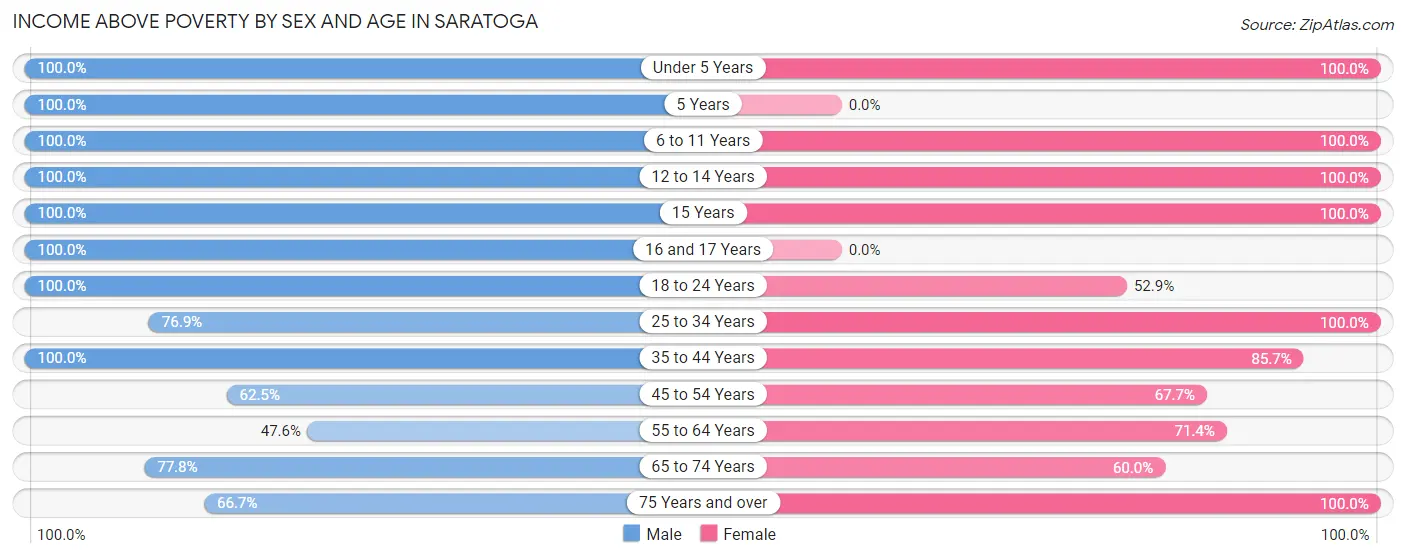
| Age Bracket | Male | Female |
| Under 5 Years | 10 (100.0%) | 32 (100.0%) |
| 5 Years | 3 (100.0%) | 0 (0.0%) |
| 6 to 11 Years | 20 (100.0%) | 3 (100.0%) |
| 12 to 14 Years | 4 (100.0%) | 6 (100.0%) |
| 15 Years | 2 (100.0%) | 6 (100.0%) |
| 16 and 17 Years | 5 (100.0%) | 0 (0.0%) |
| 18 to 24 Years | 19 (100.0%) | 9 (52.9%) |
| 25 to 34 Years | 20 (76.9%) | 17 (100.0%) |
| 35 to 44 Years | 12 (100.0%) | 6 (85.7%) |
| 45 to 54 Years | 15 (62.5%) | 21 (67.7%) |
| 55 to 64 Years | 10 (47.6%) | 5 (71.4%) |
| 65 to 74 Years | 7 (77.8%) | 6 (60.0%) |
| 75 Years and over | 4 (66.7%) | 13 (100.0%) |
| Total | 131 (81.4%) | 124 (82.1%) |
Income Below Poverty Among Married-Couple Families in Saratoga
The poverty statistics for married-couple families in Saratoga show that 7.9% or 3 of the total 38 families live below the poverty line. Families with no children have the highest poverty rate of 16.7%, comprising of 2 families. On the other hand, families with 3 or 4 children have the lowest poverty rate of 0.0%, which includes 0 families.
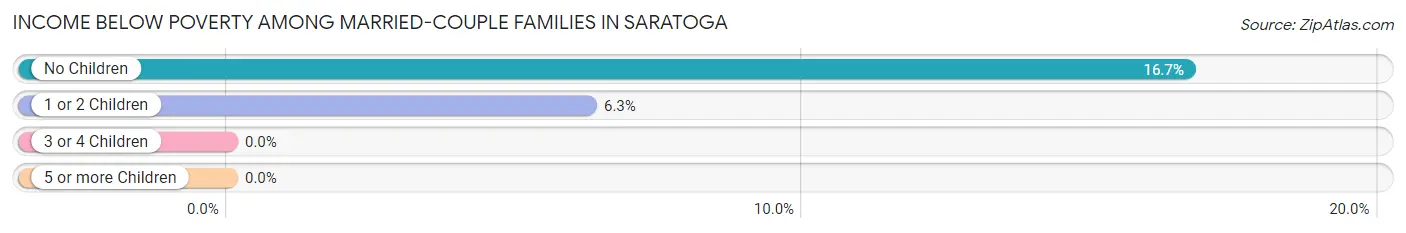
| Children | Above Poverty | Below Poverty |
| No Children | 10 (83.3%) | 2 (16.7%) |
| 1 or 2 Children | 15 (93.8%) | 1 (6.2%) |
| 3 or 4 Children | 10 (100.0%) | 0 (0.0%) |
| 5 or more Children | 0 (0.0%) | 0 (0.0%) |
| Total | 35 (92.1%) | 3 (7.9%) |
Income Below Poverty Among Single-Parent Households in Saratoga
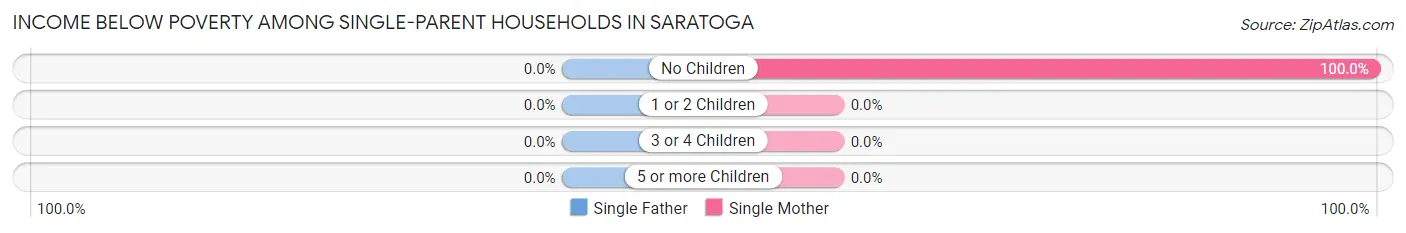
| Children | Single Father | Single Mother |
| No Children | 0 (0.0%) | 1 (100.0%) |
| 1 or 2 Children | 0 (0.0%) | 0 (0.0%) |
| 3 or 4 Children | 0 (0.0%) | 0 (0.0%) |
| 5 or more Children | 0 (0.0%) | 0 (0.0%) |
| Total | 0 (0.0%) | 1 (14.3%) |
Income Below Poverty Among Married-Couple vs Single-Parent Households in Saratoga
The poverty data for Saratoga shows that 3 of the married-couple family households (7.9%) and 1 of the single-parent households (5.9%) are living below the poverty level. Within the married-couple family households, those with no children have the highest poverty rate, with 2 households (16.7%) falling below the poverty line. Among the single-parent households, those with no children have the highest poverty rate, with 1 household (25.0%) living below poverty.
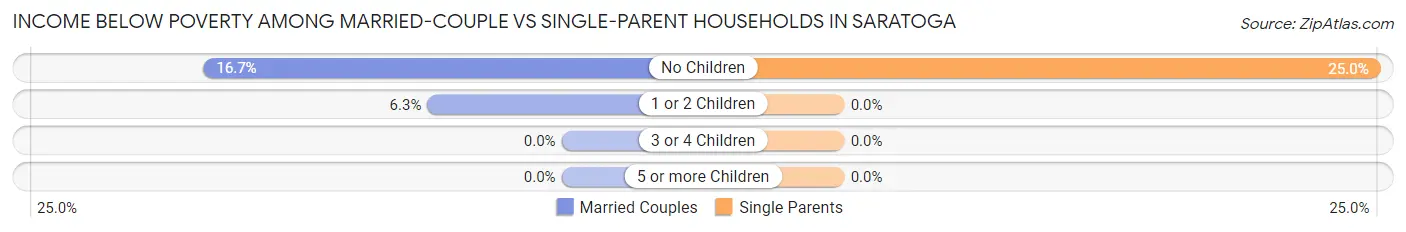
| Children | Married-Couple Families | Single-Parent Households |
| No Children | 2 (16.7%) | 1 (25.0%) |
| 1 or 2 Children | 1 (6.2%) | 0 (0.0%) |
| 3 or 4 Children | 0 (0.0%) | 0 (0.0%) |
| 5 or more Children | 0 (0.0%) | 0 (0.0%) |
| Total | 3 (7.9%) | 1 (5.9%) |
Race in Saratoga
The most populous races in Saratoga are White / Caucasian (310 | 99.4%), and Two or more Races (2 | 0.6%).
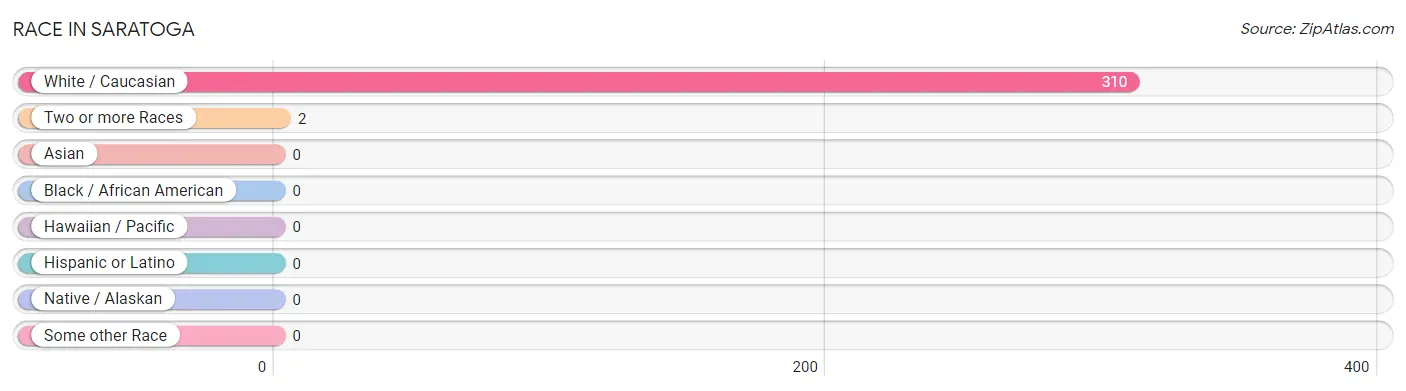
| Race | # Population | % Population |
| Asian | 0 | 0.0% |
| Black / African American | 0 | 0.0% |
| Hawaiian / Pacific | 0 | 0.0% |
| Hispanic or Latino | 0 | 0.0% |
| Native / Alaskan | 0 | 0.0% |
| White / Caucasian | 310 | 99.4% |
| Two or more Races | 2 | 0.6% |
| Some other Race | 0 | 0.0% |
| Total | 312 | 100.0% |
Ancestry in Saratoga
The most populous ancestries reported in Saratoga are German (51 | 16.4%), American (50 | 16.0%), English (29 | 9.3%), Irish (8 | 2.6%), and Italian (5 | 1.6%), together accounting for 45.8% of all Saratoga residents.
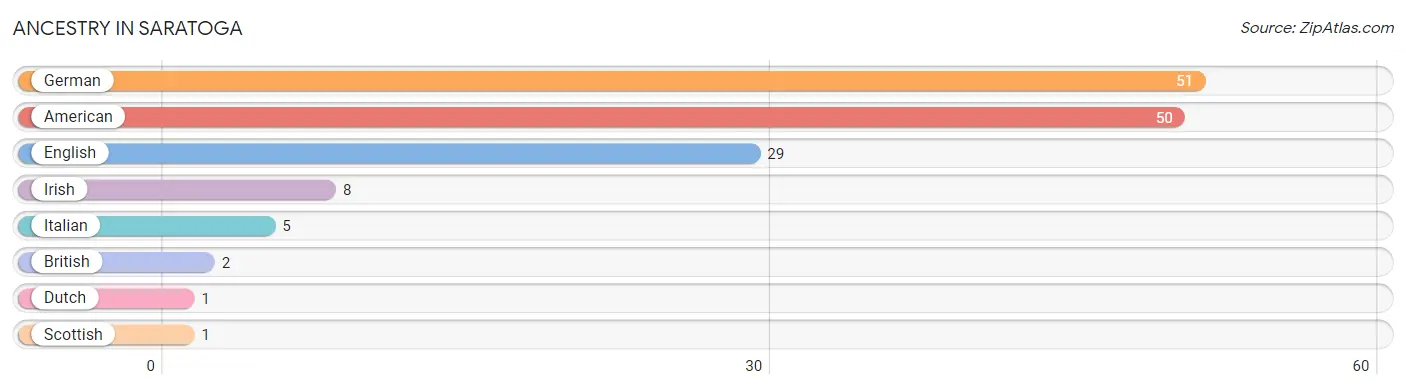
| Ancestry | # Population | % Population |
| American | 50 | 16.0% |
| British | 2 | 0.6% |
| Dutch | 1 | 0.3% |
| English | 29 | 9.3% |
| German | 51 | 16.4% |
| Irish | 8 | 2.6% |
| Italian | 5 | 1.6% |
| Scottish | 1 | 0.3% | View All 8 Rows |
Immigrants in Saratoga

| Immigration Origin | # Population | % Population | View All 0 Rows |
Sex and Age in Saratoga
Sex and Age in Saratoga
The most populous age groups in Saratoga are 20 to 24 Years (19 | 11.8%) for men and Under 5 Years (32 | 21.2%) for women.
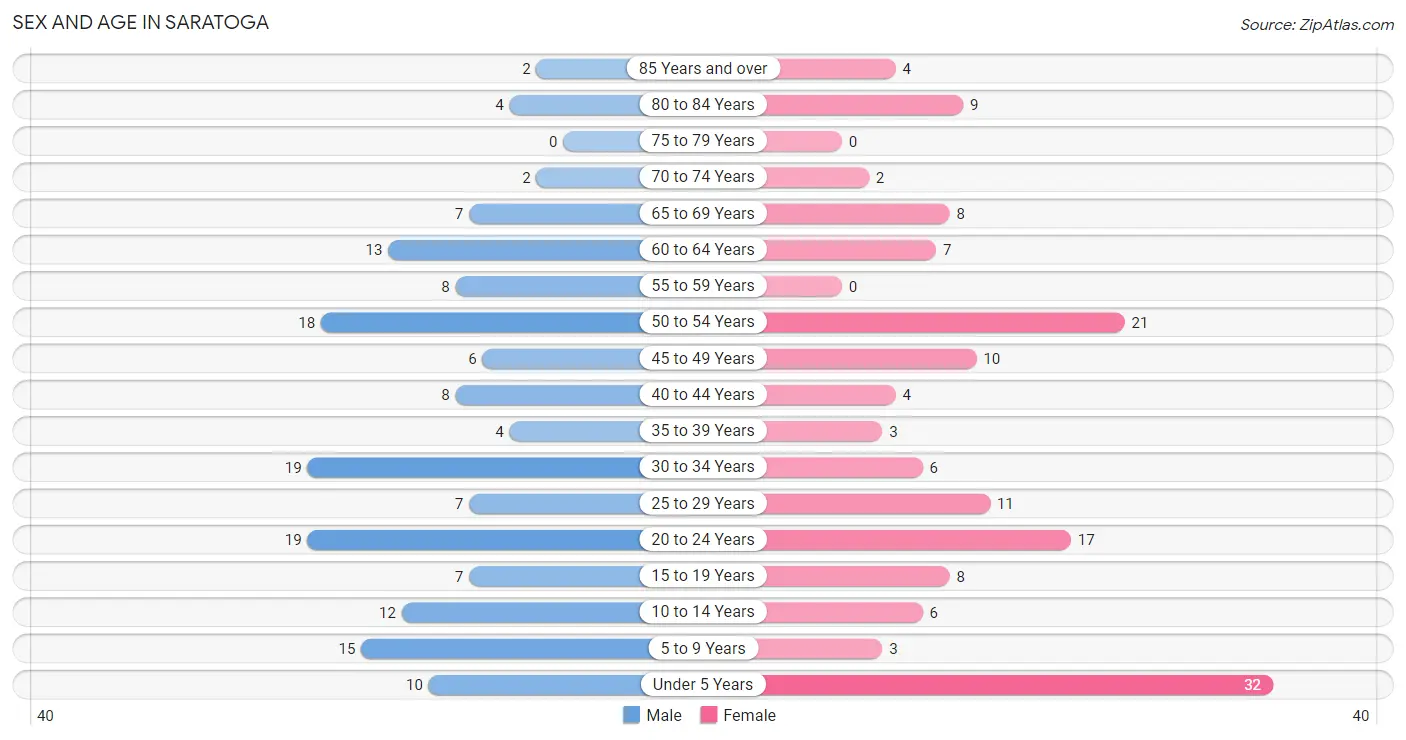
| Age Bracket | Male | Female |
| Under 5 Years | 10 (6.2%) | 32 (21.2%) |
| 5 to 9 Years | 15 (9.3%) | 3 (2.0%) |
| 10 to 14 Years | 12 (7.4%) | 6 (4.0%) |
| 15 to 19 Years | 7 (4.3%) | 8 (5.3%) |
| 20 to 24 Years | 19 (11.8%) | 17 (11.3%) |
| 25 to 29 Years | 7 (4.3%) | 11 (7.3%) |
| 30 to 34 Years | 19 (11.8%) | 6 (4.0%) |
| 35 to 39 Years | 4 (2.5%) | 3 (2.0%) |
| 40 to 44 Years | 8 (5.0%) | 4 (2.6%) |
| 45 to 49 Years | 6 (3.7%) | 10 (6.6%) |
| 50 to 54 Years | 18 (11.2%) | 21 (13.9%) |
| 55 to 59 Years | 8 (5.0%) | 0 (0.0%) |
| 60 to 64 Years | 13 (8.1%) | 7 (4.6%) |
| 65 to 69 Years | 7 (4.3%) | 8 (5.3%) |
| 70 to 74 Years | 2 (1.2%) | 2 (1.3%) |
| 75 to 79 Years | 0 (0.0%) | 0 (0.0%) |
| 80 to 84 Years | 4 (2.5%) | 9 (6.0%) |
| 85 Years and over | 2 (1.2%) | 4 (2.6%) |
| Total | 161 (100.0%) | 151 (100.0%) |
Families and Households in Saratoga
Median Family Size in Saratoga
The median family size in Saratoga is 3.76 persons per family, with single female/mother families (7 | 12.7%) accounting for the largest median family size of 4.57 persons per family. On the other hand, single male/father families (10 | 18.2%) represent the smallest median family size with 3.60 persons per family.
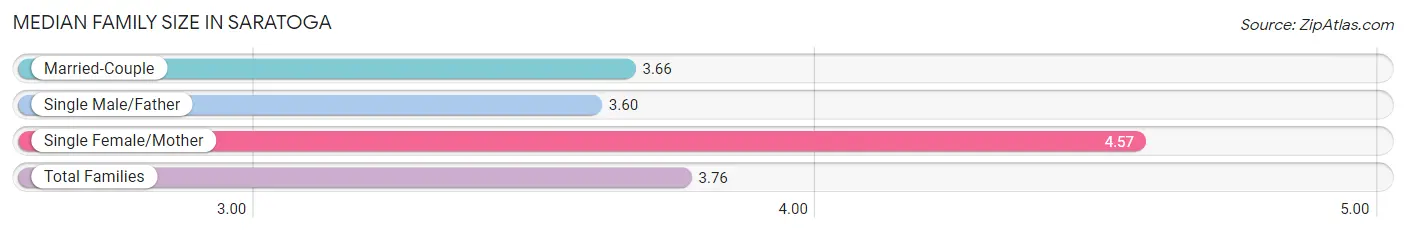
| Family Type | # Families | Family Size |
| Married-Couple | 38 (69.1%) | 3.66 |
| Single Male/Father | 10 (18.2%) | 3.60 |
| Single Female/Mother | 7 (12.7%) | 4.57 |
| Total Families | 55 (100.0%) | 3.76 |
Median Household Size in Saratoga
The median household size in Saratoga is 2.92 persons per household, with single female/mother households (7 | 6.5%) accounting for the largest median household size of 5 persons per household. non-family households (52 | 48.6%) represent the smallest median household size with 1.81 persons per household.
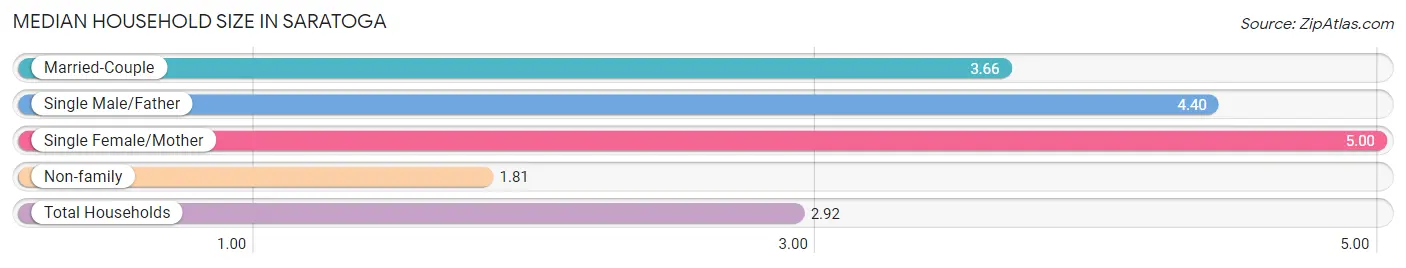
| Household Type | # Households | Household Size |
| Married-Couple | 38 (35.5%) | 3.66 |
| Single Male/Father | 10 (9.3%) | 4.40 |
| Single Female/Mother | 7 (6.5%) | 5.00 |
| Non-family | 52 (48.6%) | 1.81 |
| Total Households | 107 (100.0%) | 2.92 |
Household Size by Marriage Status in Saratoga
Out of a total of 107 households in Saratoga, 55 (51.4%) are family households, while 52 (48.6%) are nonfamily households. The most numerous type of family households are 4-person households, comprising 23, and the most common type of nonfamily households are 1-person households, comprising 25.
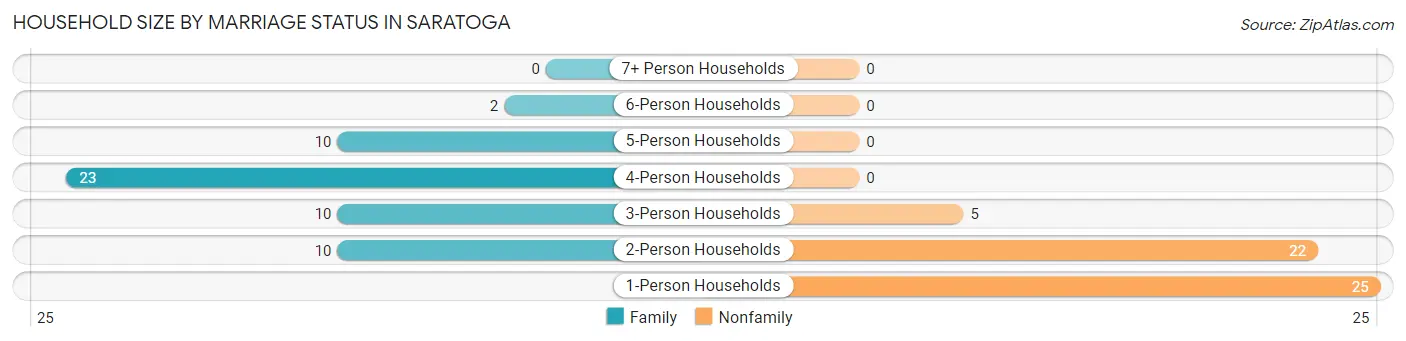
| Household Size | Family Households | Nonfamily Households |
| 1-Person Households | - | 25 (23.4%) |
| 2-Person Households | 10 (9.3%) | 22 (20.6%) |
| 3-Person Households | 10 (9.3%) | 5 (4.7%) |
| 4-Person Households | 23 (21.5%) | 0 (0.0%) |
| 5-Person Households | 10 (9.3%) | 0 (0.0%) |
| 6-Person Households | 2 (1.9%) | 0 (0.0%) |
| 7+ Person Households | 0 (0.0%) | 0 (0.0%) |
| Total | 55 (51.4%) | 52 (48.6%) |
Female Fertility in Saratoga
Fertility by Age in Saratoga
Average fertility rate in Saratoga is 153.0 births per 1,000 women. Women in the age bracket of 20 to 34 years have the highest fertility rate with 235.0 births per 1,000 women. Women in the age bracket of 20 to 34 years acount for 88.9% of all women with births.
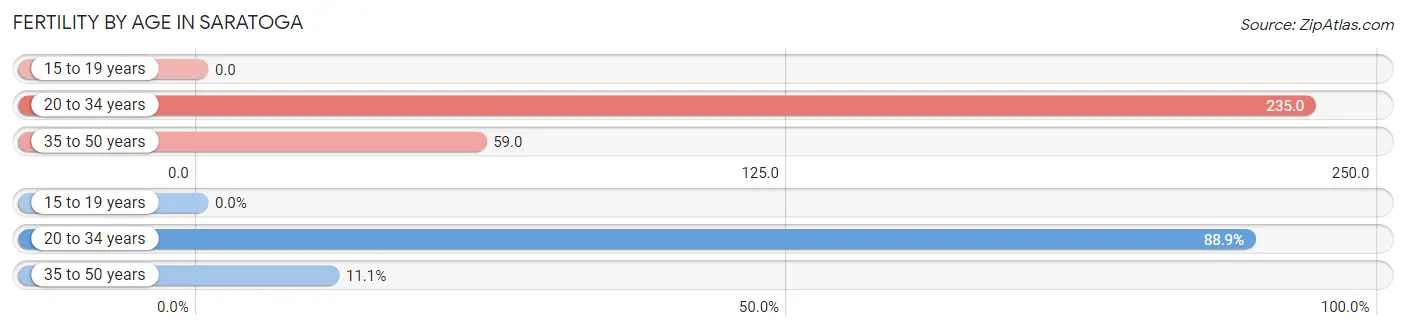
| Age Bracket | Women with Births | Births / 1,000 Women |
| 15 to 19 years | 0 (0.0%) | 0.0 |
| 20 to 34 years | 8 (88.9%) | 235.0 |
| 35 to 50 years | 1 (11.1%) | 59.0 |
| Total | 9 (100.0%) | 153.0 |
Fertility by Age by Marriage Status in Saratoga
11.1% of women with births (9) in Saratoga are married. The highest percentage of unmarried women with births falls into 20 to 34 years age bracket with 100.0% of them unmarried at the time of birth, while the lowest percentage of unmarried women with births belong to 35 to 50 years age bracket with 0.0% of them unmarried.
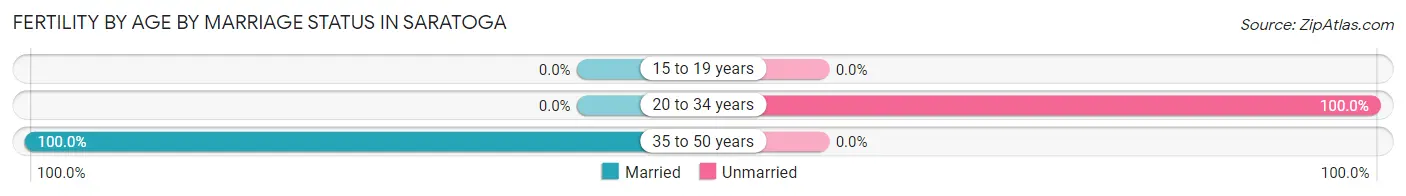
| Age Bracket | Married | Unmarried |
| 15 to 19 years | 0 (0.0%) | 0 (0.0%) |
| 20 to 34 years | 0 (0.0%) | 8 (100.0%) |
| 35 to 50 years | 1 (100.0%) | 0 (0.0%) |
| Total | 1 (11.1%) | 8 (88.9%) |
Fertility by Education in Saratoga
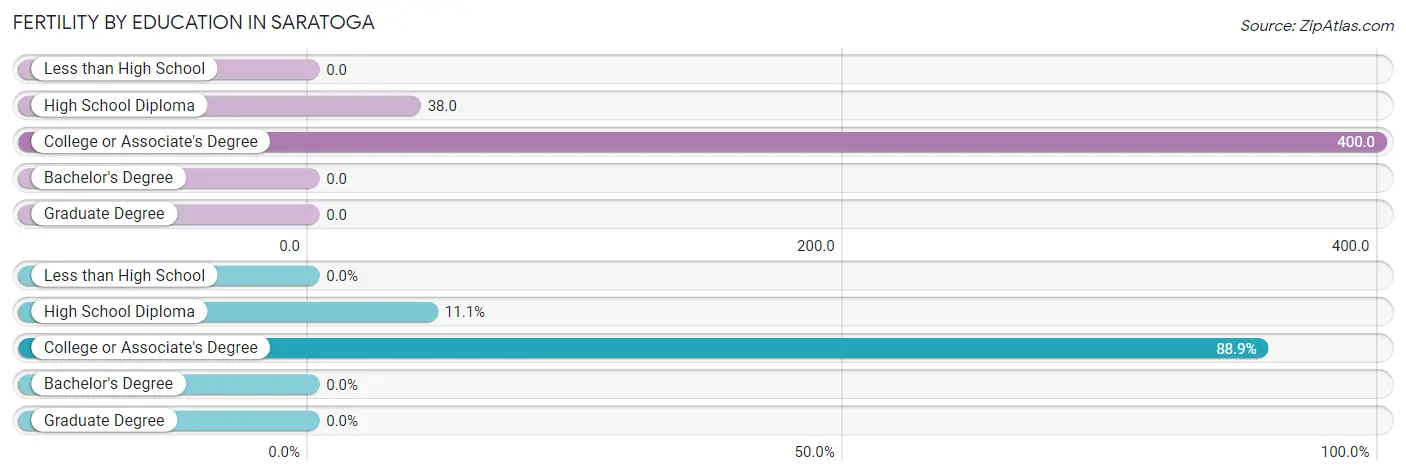
| Educational Attainment | Women with Births | Births / 1,000 Women |
| Less than High School | 0 (0.0%) | 0.0 |
| High School Diploma | 1 (11.1%) | 38.0 |
| College or Associate's Degree | 8 (88.9%) | 400.0 |
| Bachelor's Degree | 0 (0.0%) | 0.0 |
| Graduate Degree | 0 (0.0%) | 0.0 |
| Total | 9 (100.0%) | 153.0 |
Fertility by Education by Marriage Status in Saratoga
88.9% of women with births in Saratoga are unmarried. Women with the educational attainment of high school diploma are most likely to be married with 100.0% of them married at childbirth, while women with the educational attainment of college or associate's degree are least likely to be married with 100.0% of them unmarried at childbirth.
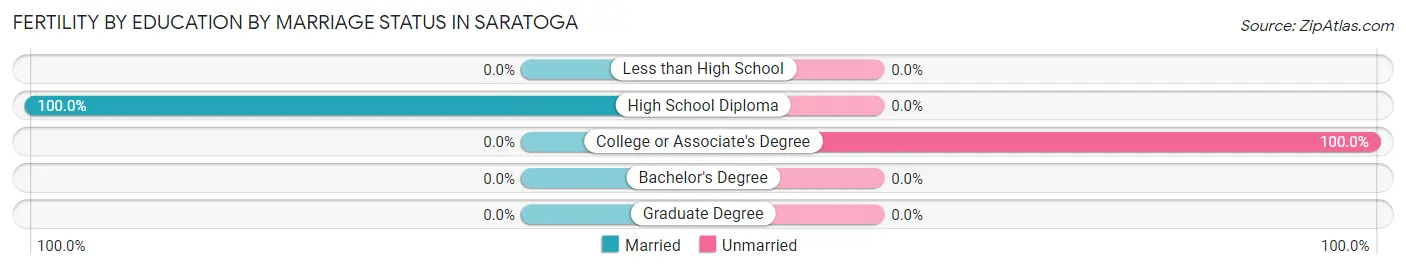
| Educational Attainment | Married | Unmarried |
| Less than High School | 0 (0.0%) | 0 (0.0%) |
| High School Diploma | 1 (100.0%) | 0 (0.0%) |
| College or Associate's Degree | 0 (0.0%) | 8 (100.0%) |
| Bachelor's Degree | 0 (0.0%) | 0 (0.0%) |
| Graduate Degree | 0 (0.0%) | 0 (0.0%) |
| Total | 1 (11.1%) | 8 (88.9%) |
Employment Characteristics in Saratoga
Employment by Class of Employer in Saratoga
Among the 112 employed individuals in Saratoga, private company employees (90 | 80.4%), self-employed (incorporated) (9 | 8.0%), and not-for-profit organizations (8 | 7.1%) make up the most common classes of employment.
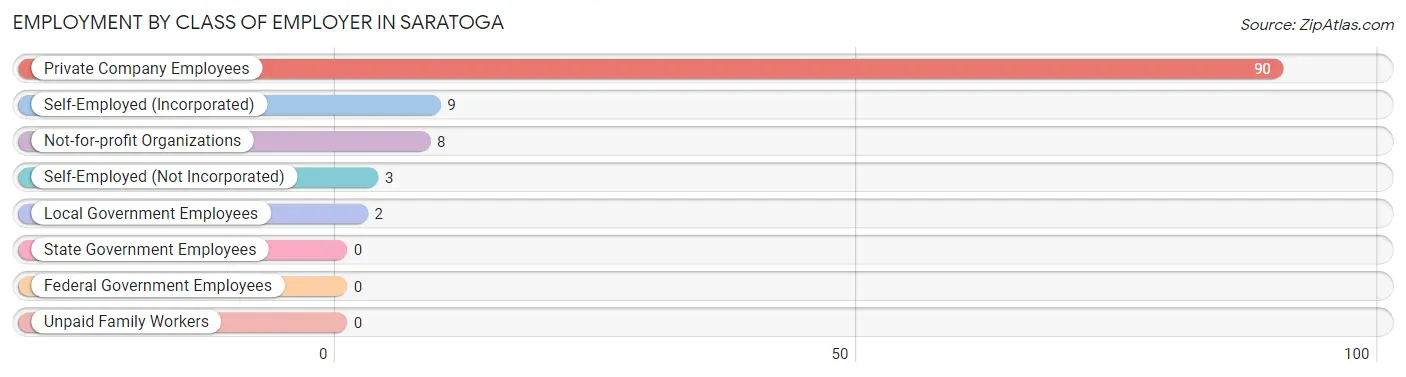
| Employer Class | # Employees | % Employees |
| Private Company Employees | 90 | 80.4% |
| Self-Employed (Incorporated) | 9 | 8.0% |
| Self-Employed (Not Incorporated) | 3 | 2.7% |
| Not-for-profit Organizations | 8 | 7.1% |
| Local Government Employees | 2 | 1.8% |
| State Government Employees | 0 | 0.0% |
| Federal Government Employees | 0 | 0.0% |
| Unpaid Family Workers | 0 | 0.0% |
| Total | 112 | 100.0% |
Employment Status by Age in Saratoga
According to the labor force statistics for Saratoga, out of the total population over 16 years of age (226), 54.0% or 122 individuals are in the labor force, with 5.7% or 7 of them unemployed. The age group with the highest labor force participation rate is 25 to 29 years, with 100.0% or 18 individuals in the labor force. Within the labor force, the 20 to 24 years age range has the highest percentage of unemployed individuals, with 30.0% or 6 of them being unemployed.
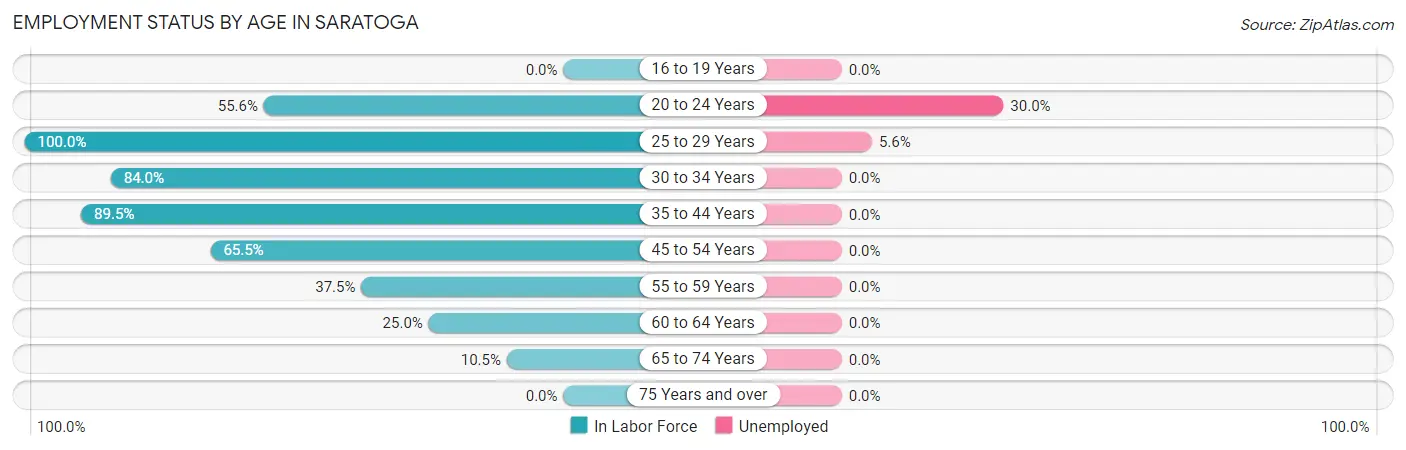
| Age Bracket | In Labor Force | Unemployed |
| 16 to 19 Years | 0 (0.0%) | 0 (0.0%) |
| 20 to 24 Years | 20 (55.6%) | 6 (30.0%) |
| 25 to 29 Years | 18 (100.0%) | 1 (5.6%) |
| 30 to 34 Years | 21 (84.0%) | 0 (0.0%) |
| 35 to 44 Years | 17 (89.5%) | 0 (0.0%) |
| 45 to 54 Years | 36 (65.5%) | 0 (0.0%) |
| 55 to 59 Years | 3 (37.5%) | 0 (0.0%) |
| 60 to 64 Years | 5 (25.0%) | 0 (0.0%) |
| 65 to 74 Years | 2 (10.5%) | 0 (0.0%) |
| 75 Years and over | 0 (0.0%) | 0 (0.0%) |
| Total | 122 (54.0%) | 7 (5.7%) |
Employment Status by Educational Attainment in Saratoga
According to labor force statistics for Saratoga, 69.0% of individuals (100) out of the total population between 25 and 64 years of age (145) are in the labor force, with 1.0% or 1 of them being unemployed. The group with the highest labor force participation rate are those with the educational attainment of high school diploma, with 87.0% or 40 individuals in the labor force. Within the labor force, individuals with high school diploma education have the highest percentage of unemployment, with 2.5% or 1 of them being unemployed.
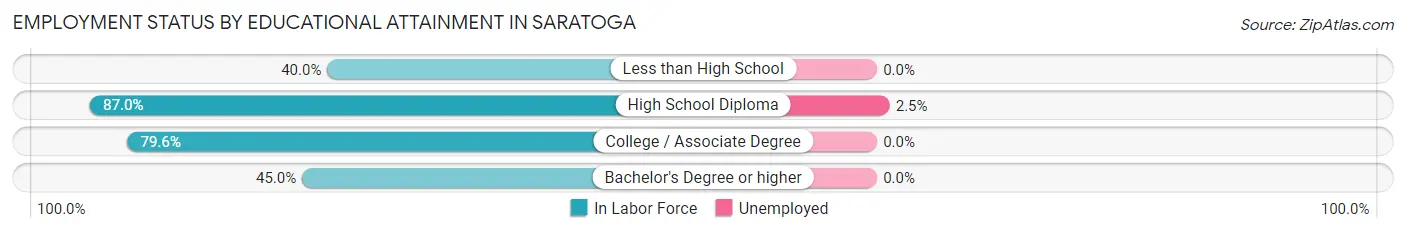
| Educational Attainment | In Labor Force | Unemployed |
| Less than High School | 12 (40.0%) | 0 (0.0%) |
| High School Diploma | 40 (87.0%) | 1 (2.5%) |
| College / Associate Degree | 39 (79.6%) | 0 (0.0%) |
| Bachelor's Degree or higher | 9 (45.0%) | 0 (0.0%) |
| Total | 100 (69.0%) | 1 (1.0%) |
Employment Occupations by Sex in Saratoga
Management, Business, Science and Arts Occupations
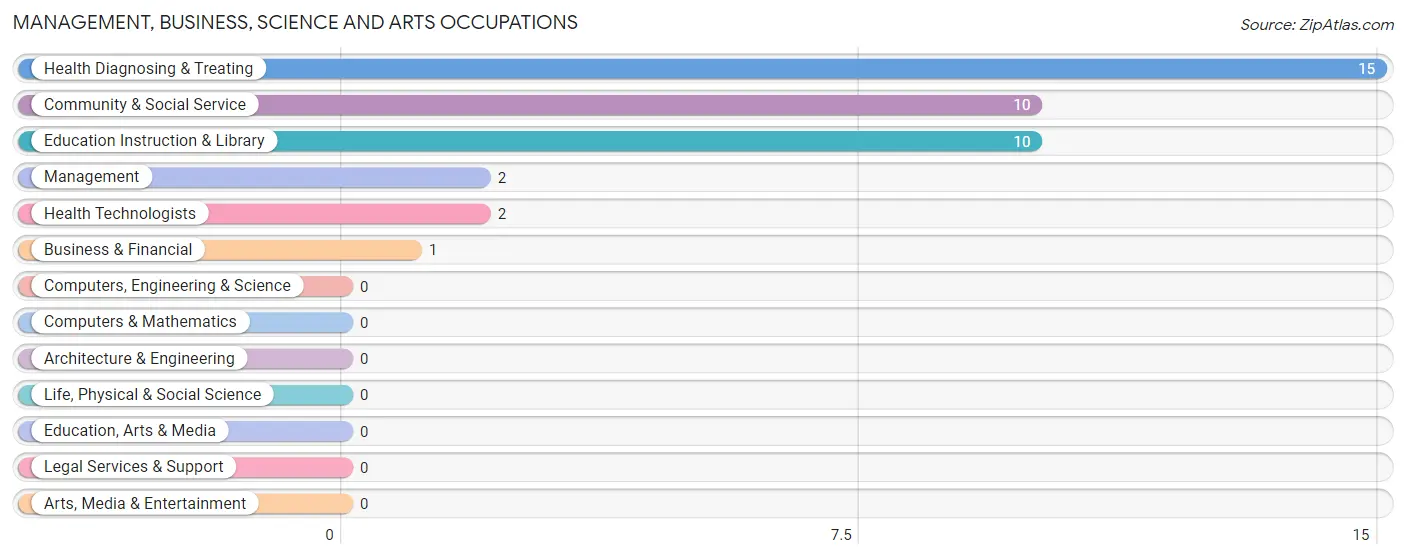
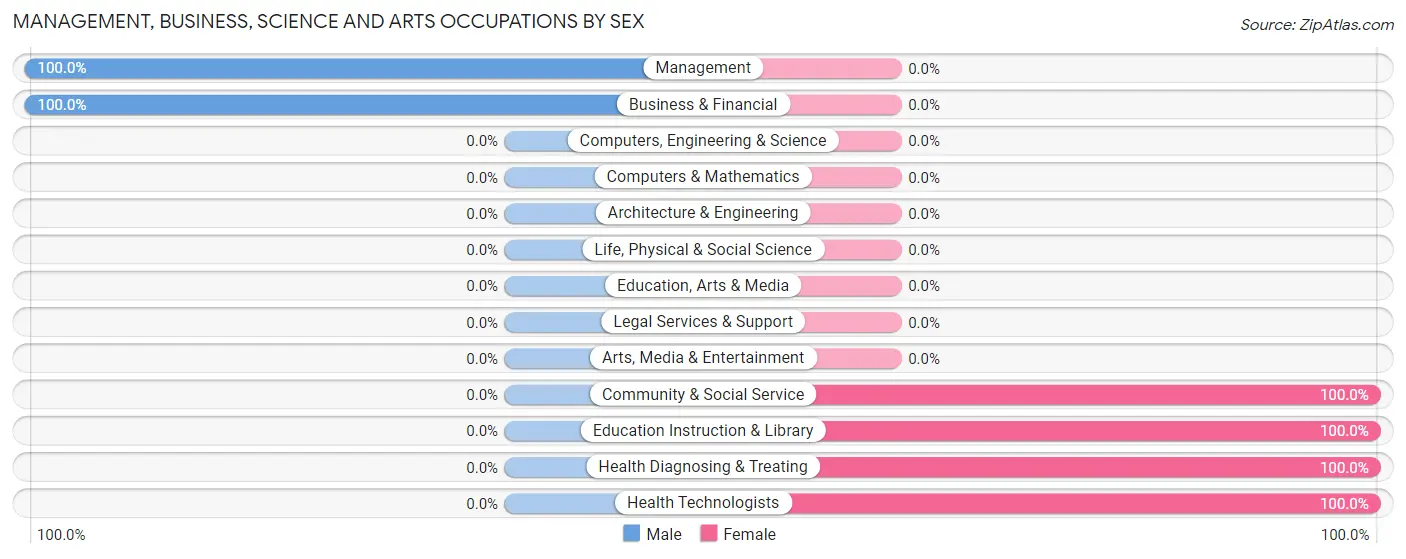
The most common Management, Business, Science and Arts occupations in Saratoga are Health Diagnosing & Treating (15 | 13.0%), Community & Social Service (10 | 8.7%), Education Instruction & Library (10 | 8.7%), Management (2 | 1.7%), and Health Technologists (2 | 1.7%).
Management, Business, Science and Arts Occupations by Sex
Within the Management, Business, Science and Arts occupations in Saratoga, the most male-oriented occupations are Management (100.0%), and Business & Financial (100.0%), while the most female-oriented occupations are Community & Social Service (100.0%), Education Instruction & Library (100.0%), and Health Diagnosing & Treating (100.0%).
| Occupation | Male | Female |
| Management | 2 (100.0%) | 0 (0.0%) |
| Business & Financial | 1 (100.0%) | 0 (0.0%) |
| Computers, Engineering & Science | 0 (0.0%) | 0 (0.0%) |
| Computers & Mathematics | 0 (0.0%) | 0 (0.0%) |
| Architecture & Engineering | 0 (0.0%) | 0 (0.0%) |
| Life, Physical & Social Science | 0 (0.0%) | 0 (0.0%) |
| Community & Social Service | 0 (0.0%) | 10 (100.0%) |
| Education, Arts & Media | 0 (0.0%) | 0 (0.0%) |
| Legal Services & Support | 0 (0.0%) | 0 (0.0%) |
| Education Instruction & Library | 0 (0.0%) | 10 (100.0%) |
| Arts, Media & Entertainment | 0 (0.0%) | 0 (0.0%) |
| Health Diagnosing & Treating | 0 (0.0%) | 15 (100.0%) |
| Health Technologists | 0 (0.0%) | 2 (100.0%) |
| Total (Category) | 3 (10.7%) | 25 (89.3%) |
| Total (Overall) | 75 (65.2%) | 40 (34.8%) |
Services Occupations
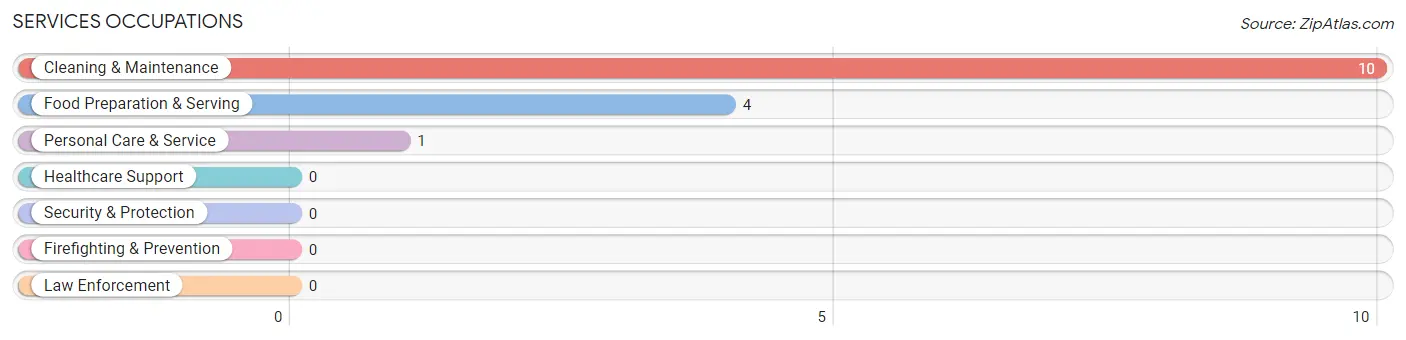
The most common Services occupations in Saratoga are Cleaning & Maintenance (10 | 8.7%), Food Preparation & Serving (4 | 3.5%), and Personal Care & Service (1 | 0.9%).
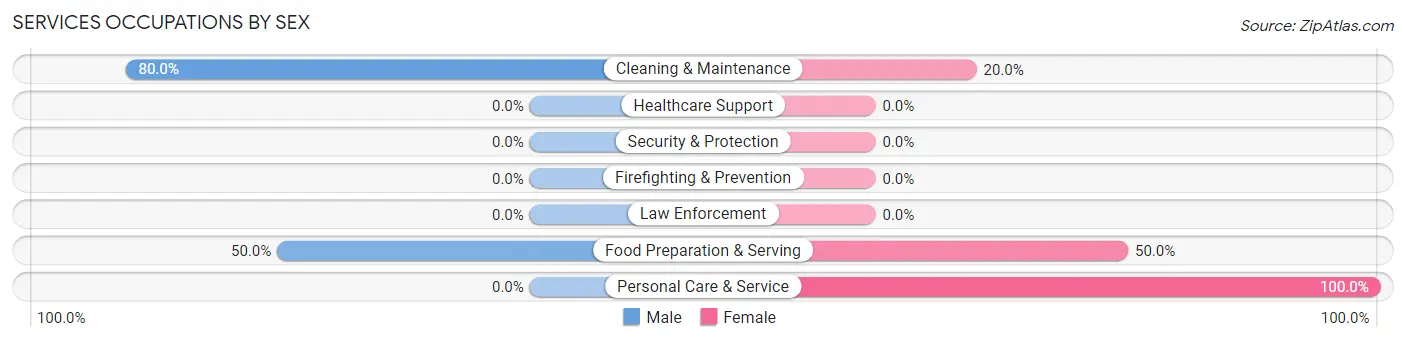
Services Occupations by Sex
Within the Services occupations in Saratoga, the most male-oriented occupations are Cleaning & Maintenance (80.0%), and Food Preparation & Serving (50.0%), while the most female-oriented occupations are Personal Care & Service (100.0%), Food Preparation & Serving (50.0%), and Cleaning & Maintenance (20.0%).
| Occupation | Male | Female |
| Healthcare Support | 0 (0.0%) | 0 (0.0%) |
| Security & Protection | 0 (0.0%) | 0 (0.0%) |
| Firefighting & Prevention | 0 (0.0%) | 0 (0.0%) |
| Law Enforcement | 0 (0.0%) | 0 (0.0%) |
| Food Preparation & Serving | 2 (50.0%) | 2 (50.0%) |
| Cleaning & Maintenance | 8 (80.0%) | 2 (20.0%) |
| Personal Care & Service | 0 (0.0%) | 1 (100.0%) |
| Total (Category) | 10 (66.7%) | 5 (33.3%) |
| Total (Overall) | 75 (65.2%) | 40 (34.8%) |
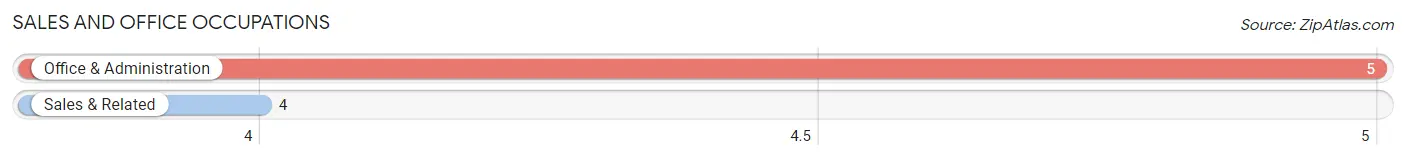
Sales and Office Occupations
The most common Sales and Office occupations in Saratoga are Office & Administration (5 | 4.3%), and Sales & Related (4 | 3.5%).
Sales and Office Occupations by Sex
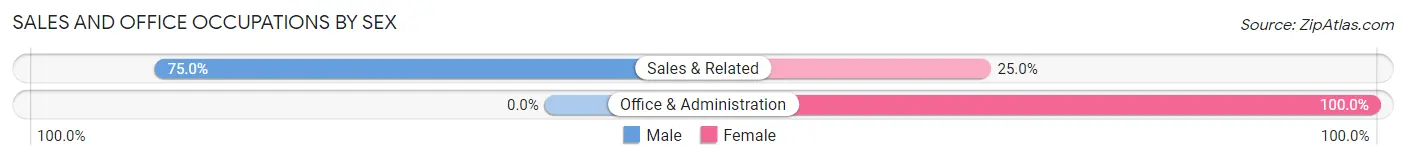
| Occupation | Male | Female |
| Sales & Related | 3 (75.0%) | 1 (25.0%) |
| Office & Administration | 0 (0.0%) | 5 (100.0%) |
| Total (Category) | 3 (33.3%) | 6 (66.7%) |
| Total (Overall) | 75 (65.2%) | 40 (34.8%) |
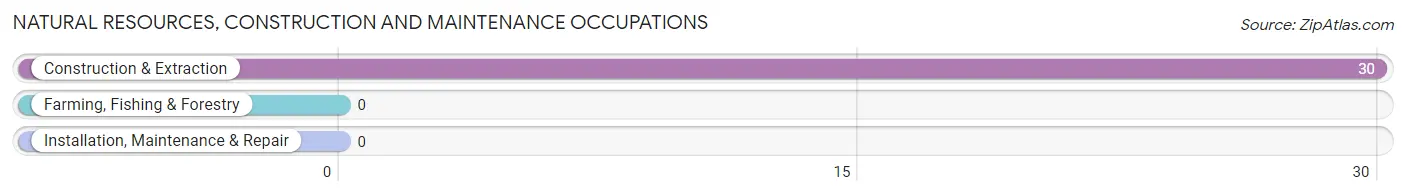
Natural Resources, Construction and Maintenance Occupations
The most common Natural Resources, Construction and Maintenance occupations in Saratoga are , and Construction & Extraction (30 | 26.1%).
Natural Resources, Construction and Maintenance Occupations by Sex
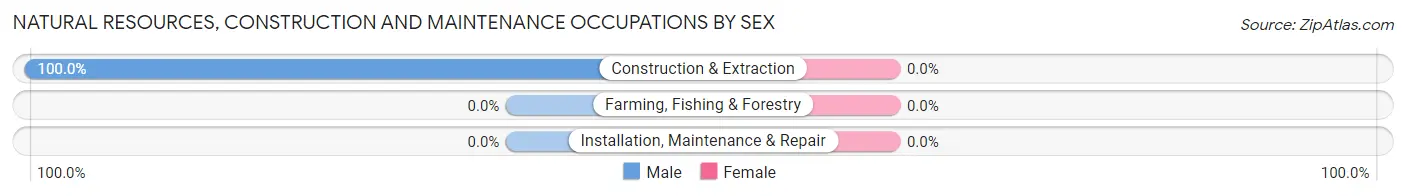
| Occupation | Male | Female |
| Farming, Fishing & Forestry | 0 (0.0%) | 0 (0.0%) |
| Construction & Extraction | 30 (100.0%) | 0 (0.0%) |
| Installation, Maintenance & Repair | 0 (0.0%) | 0 (0.0%) |
| Total (Category) | 30 (100.0%) | 0 (0.0%) |
| Total (Overall) | 75 (65.2%) | 40 (34.8%) |
Production, Transportation and Moving Occupations
The most common Production, Transportation and Moving occupations in Saratoga are Production (19 | 16.5%), Transportation (11 | 9.6%), and Material Moving (3 | 2.6%).
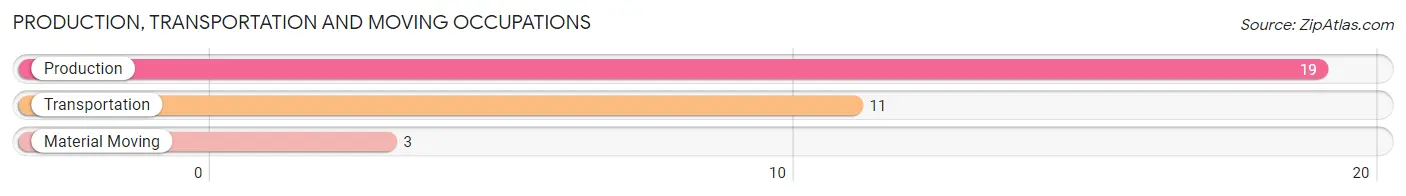
Production, Transportation and Moving Occupations by Sex
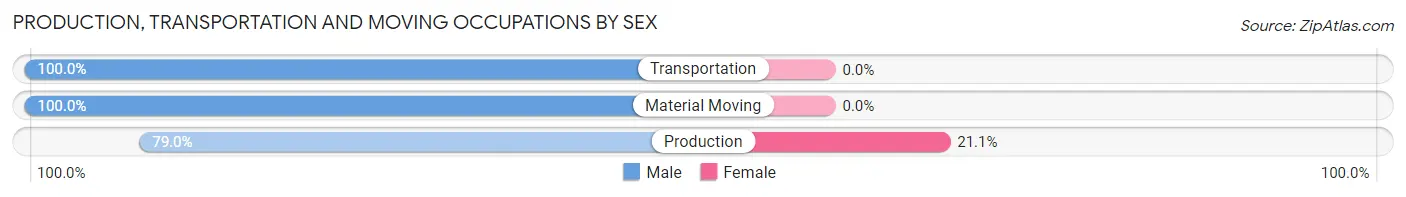
| Occupation | Male | Female |
| Production | 15 (78.9%) | 4 (21.0%) |
| Transportation | 11 (100.0%) | 0 (0.0%) |
| Material Moving | 3 (100.0%) | 0 (0.0%) |
| Total (Category) | 29 (87.9%) | 4 (12.1%) |
| Total (Overall) | 75 (65.2%) | 40 (34.8%) |
Employment Industries by Sex in Saratoga
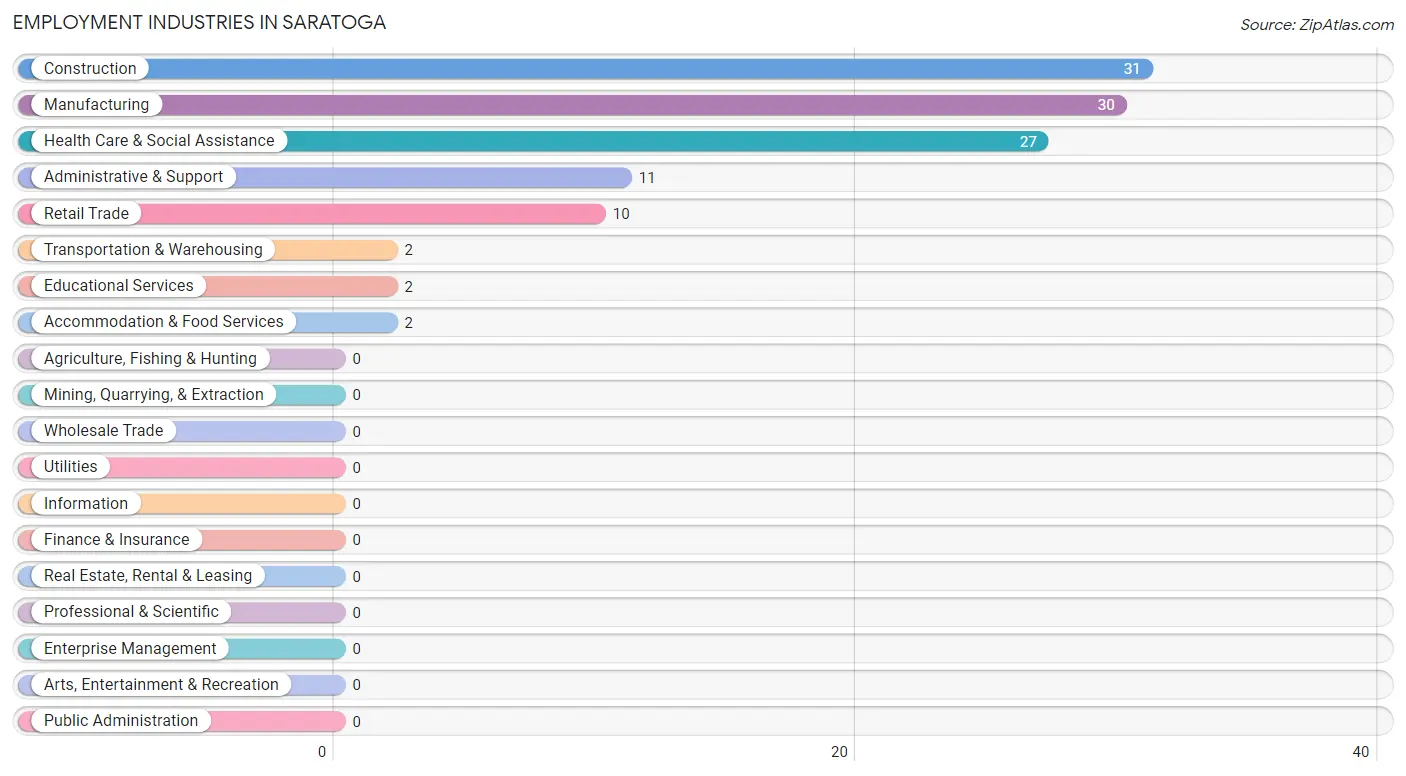
Employment Industries in Saratoga
The major employment industries in Saratoga include Construction (31 | 27.0%), Manufacturing (30 | 26.1%), Health Care & Social Assistance (27 | 23.5%), Administrative & Support (11 | 9.6%), and Retail Trade (10 | 8.7%).
Employment Industries by Sex in Saratoga
The Saratoga industries that see more men than women are Construction (100.0%), Transportation & Warehousing (100.0%), and Administrative & Support (100.0%), whereas the industries that tend to have a higher number of women are Educational Services (100.0%), Health Care & Social Assistance (100.0%), and Accommodation & Food Services (100.0%).
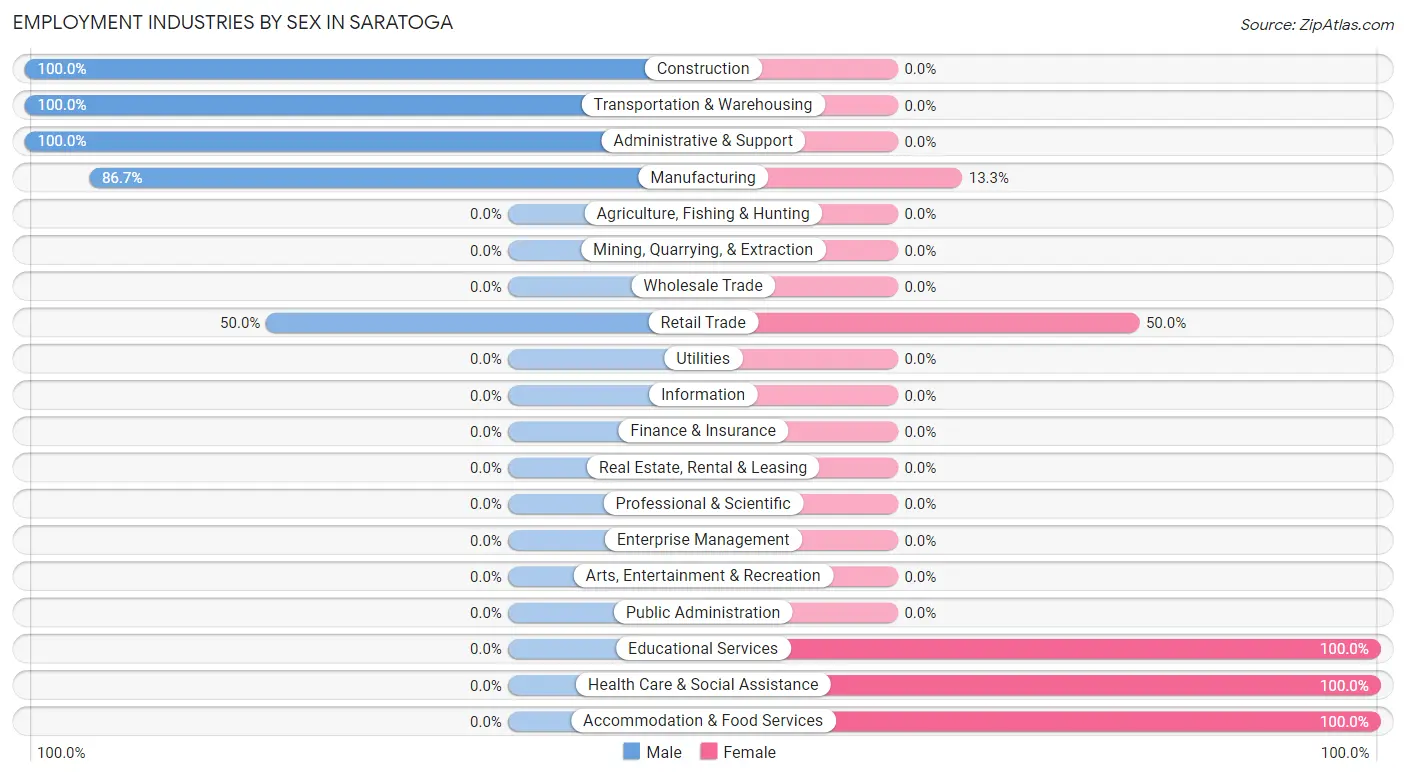
| Industry | Male | Female |
| Agriculture, Fishing & Hunting | 0 (0.0%) | 0 (0.0%) |
| Mining, Quarrying, & Extraction | 0 (0.0%) | 0 (0.0%) |
| Construction | 31 (100.0%) | 0 (0.0%) |
| Manufacturing | 26 (86.7%) | 4 (13.3%) |
| Wholesale Trade | 0 (0.0%) | 0 (0.0%) |
| Retail Trade | 5 (50.0%) | 5 (50.0%) |
| Transportation & Warehousing | 2 (100.0%) | 0 (0.0%) |
| Utilities | 0 (0.0%) | 0 (0.0%) |
| Information | 0 (0.0%) | 0 (0.0%) |
| Finance & Insurance | 0 (0.0%) | 0 (0.0%) |
| Real Estate, Rental & Leasing | 0 (0.0%) | 0 (0.0%) |
| Professional & Scientific | 0 (0.0%) | 0 (0.0%) |
| Enterprise Management | 0 (0.0%) | 0 (0.0%) |
| Administrative & Support | 11 (100.0%) | 0 (0.0%) |
| Educational Services | 0 (0.0%) | 2 (100.0%) |
| Health Care & Social Assistance | 0 (0.0%) | 27 (100.0%) |
| Arts, Entertainment & Recreation | 0 (0.0%) | 0 (0.0%) |
| Accommodation & Food Services | 0 (0.0%) | 2 (100.0%) |
| Public Administration | 0 (0.0%) | 0 (0.0%) |
| Total | 75 (65.2%) | 40 (34.8%) |
Education in Saratoga
School Enrollment in Saratoga
The most common levels of schooling among the 56 students in Saratoga are elementary school (16 | 28.6%), middle school (16 | 28.6%), and high school (15 | 26.8%).
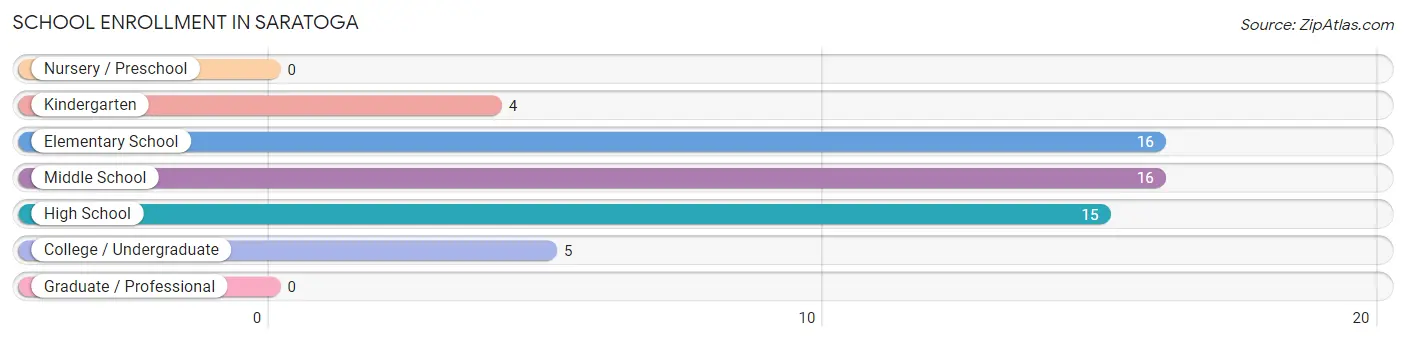
| School Level | # Students | % Students |
| Nursery / Preschool | 0 | 0.0% |
| Kindergarten | 4 | 7.1% |
| Elementary School | 16 | 28.6% |
| Middle School | 16 | 28.6% |
| High School | 15 | 26.8% |
| College / Undergraduate | 5 | 8.9% |
| Graduate / Professional | 0 | 0.0% |
| Total | 56 | 100.0% |
School Enrollment by Age by Funding Source in Saratoga
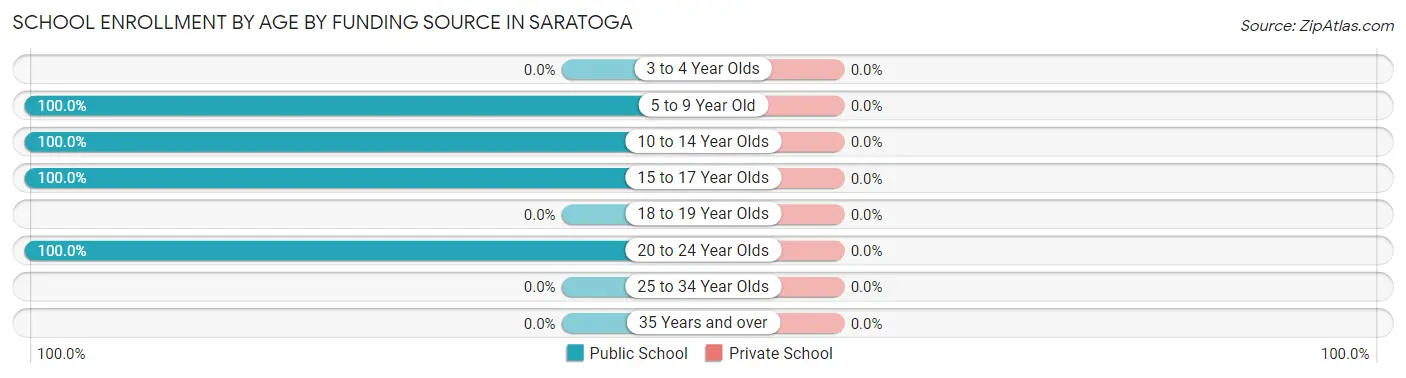
| Age Bracket | Public School | Private School |
| 3 to 4 Year Olds | 0 (0.0%) | 0 (0.0%) |
| 5 to 9 Year Old | 18 (100.0%) | 0 (0.0%) |
| 10 to 14 Year Olds | 18 (100.0%) | 0 (0.0%) |
| 15 to 17 Year Olds | 15 (100.0%) | 0 (0.0%) |
| 18 to 19 Year Olds | 0 (0.0%) | 0 (0.0%) |
| 20 to 24 Year Olds | 5 (100.0%) | 0 (0.0%) |
| 25 to 34 Year Olds | 0 (0.0%) | 0 (0.0%) |
| 35 Years and over | 0 (0.0%) | 0 (0.0%) |
| Total | 56 (100.0%) | 0 (0.0%) |
Educational Attainment by Field of Study in Saratoga
Education (8 | 26.7%), literature & languages (7 | 23.3%), arts & humanities (6 | 20.0%), science & technology (3 | 10.0%), and liberal arts & history (2 | 6.7%) are the most common fields of study among 30 individuals in Saratoga who have obtained a bachelor's degree or higher.
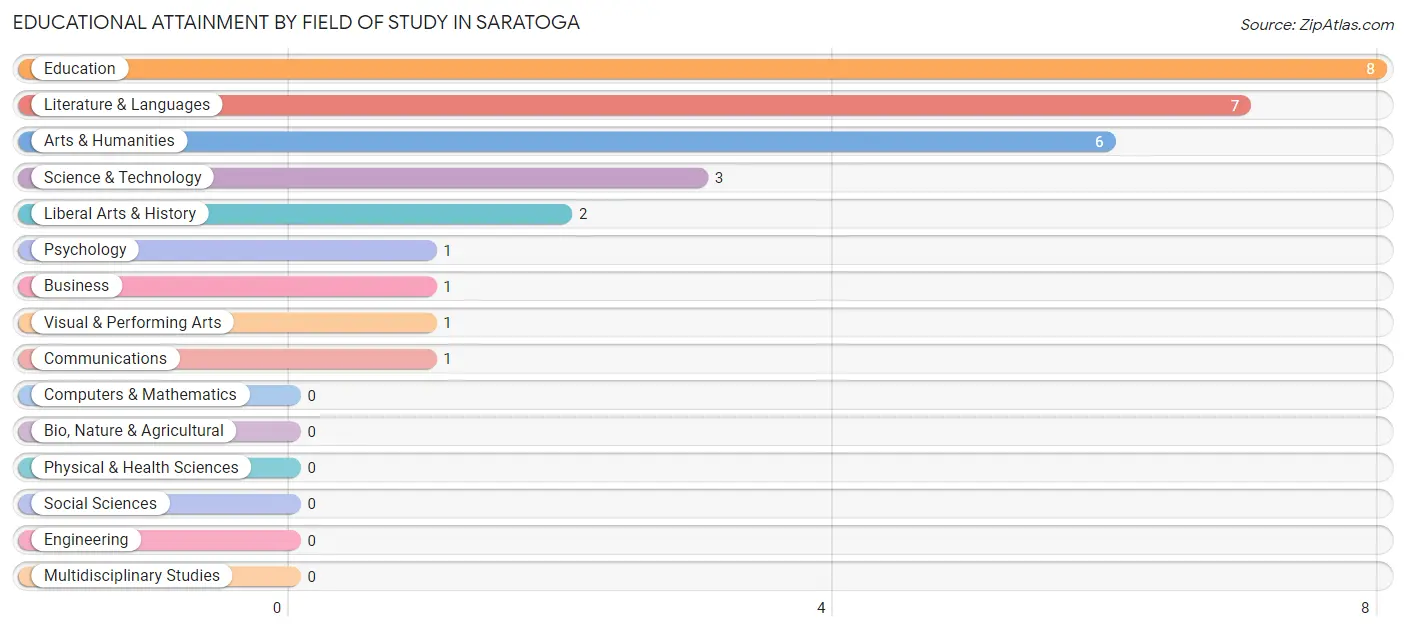
| Field of Study | # Graduates | % Graduates |
| Computers & Mathematics | 0 | 0.0% |
| Bio, Nature & Agricultural | 0 | 0.0% |
| Physical & Health Sciences | 0 | 0.0% |
| Psychology | 1 | 3.3% |
| Social Sciences | 0 | 0.0% |
| Engineering | 0 | 0.0% |
| Multidisciplinary Studies | 0 | 0.0% |
| Science & Technology | 3 | 10.0% |
| Business | 1 | 3.3% |
| Education | 8 | 26.7% |
| Literature & Languages | 7 | 23.3% |
| Liberal Arts & History | 2 | 6.7% |
| Visual & Performing Arts | 1 | 3.3% |
| Communications | 1 | 3.3% |
| Arts & Humanities | 6 | 20.0% |
| Total | 30 | 100.0% |
Transportation & Commute in Saratoga
Vehicle Availability by Sex in Saratoga
The most prevalent vehicle ownership categories in Saratoga are males with 2 vehicles (30, accounting for 41.1%) and females with 2 vehicles (19, making up 76.9%).
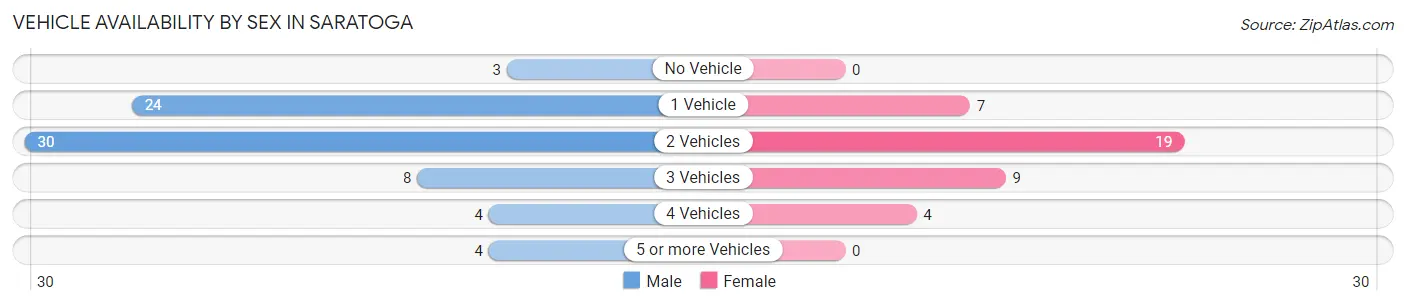
| Vehicles Available | Male | Female |
| No Vehicle | 3 (4.1%) | 0 (0.0%) |
| 1 Vehicle | 24 (32.9%) | 7 (17.9%) |
| 2 Vehicles | 30 (41.1%) | 19 (48.7%) |
| 3 Vehicles | 8 (11.0%) | 9 (23.1%) |
| 4 Vehicles | 4 (5.5%) | 4 (10.3%) |
| 5 or more Vehicles | 4 (5.5%) | 0 (0.0%) |
| Total | 73 (100.0%) | 39 (100.0%) |
Commute Time in Saratoga
The most frequently occuring commute durations in Saratoga are 10 to 14 minutes (51 commuters, 45.5%), 15 to 19 minutes (23 commuters, 20.5%), and 30 to 34 minutes (15 commuters, 13.4%).
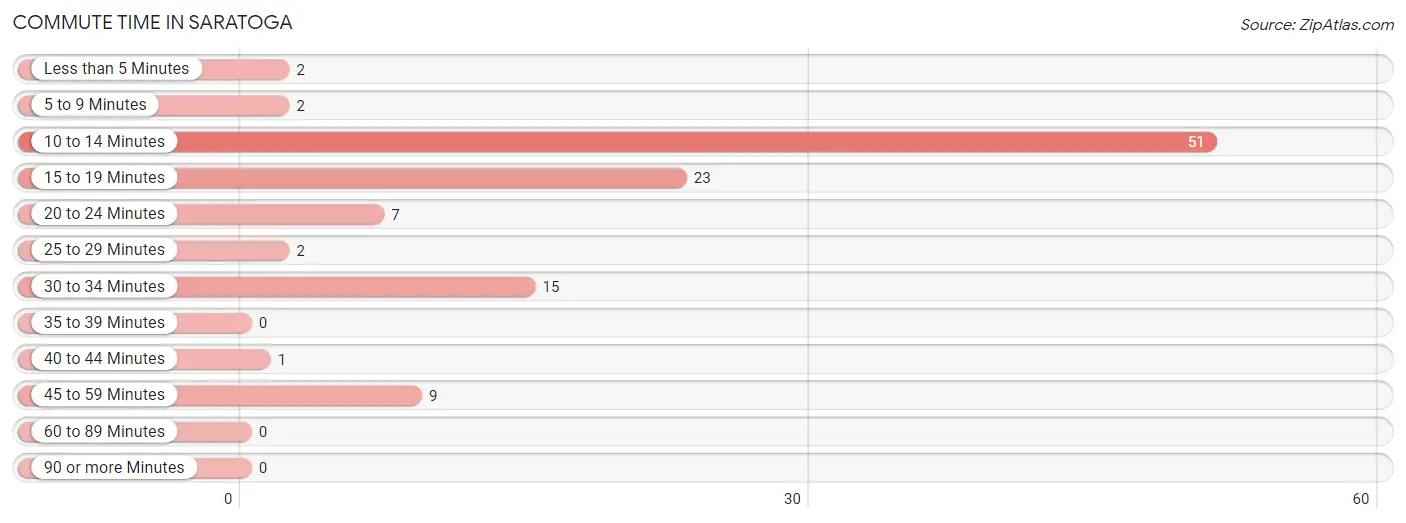
| Commute Time | # Commuters | % Commuters |
| Less than 5 Minutes | 2 | 1.8% |
| 5 to 9 Minutes | 2 | 1.8% |
| 10 to 14 Minutes | 51 | 45.5% |
| 15 to 19 Minutes | 23 | 20.5% |
| 20 to 24 Minutes | 7 | 6.2% |
| 25 to 29 Minutes | 2 | 1.8% |
| 30 to 34 Minutes | 15 | 13.4% |
| 35 to 39 Minutes | 0 | 0.0% |
| 40 to 44 Minutes | 1 | 0.9% |
| 45 to 59 Minutes | 9 | 8.0% |
| 60 to 89 Minutes | 0 | 0.0% |
| 90 or more Minutes | 0 | 0.0% |
Commute Time by Sex in Saratoga
The most common commute times in Saratoga are 10 to 14 minutes (27 commuters, 37.0%) for males and 10 to 14 minutes (24 commuters, 61.5%) for females.
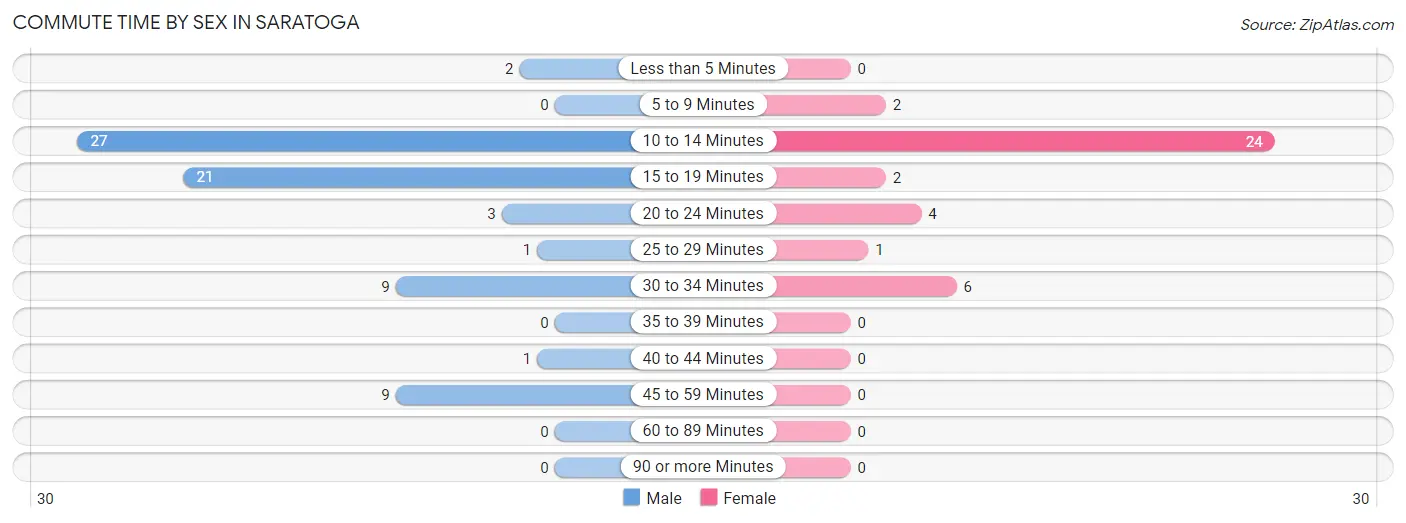
| Commute Time | Male | Female |
| Less than 5 Minutes | 2 (2.7%) | 0 (0.0%) |
| 5 to 9 Minutes | 0 (0.0%) | 2 (5.1%) |
| 10 to 14 Minutes | 27 (37.0%) | 24 (61.5%) |
| 15 to 19 Minutes | 21 (28.8%) | 2 (5.1%) |
| 20 to 24 Minutes | 3 (4.1%) | 4 (10.3%) |
| 25 to 29 Minutes | 1 (1.4%) | 1 (2.6%) |
| 30 to 34 Minutes | 9 (12.3%) | 6 (15.4%) |
| 35 to 39 Minutes | 0 (0.0%) | 0 (0.0%) |
| 40 to 44 Minutes | 1 (1.4%) | 0 (0.0%) |
| 45 to 59 Minutes | 9 (12.3%) | 0 (0.0%) |
| 60 to 89 Minutes | 0 (0.0%) | 0 (0.0%) |
| 90 or more Minutes | 0 (0.0%) | 0 (0.0%) |
Time of Departure to Work by Sex in Saratoga
The most frequent times of departure to work in Saratoga are 6:30 AM to 6:59 AM (20, 27.4%) for males and 7:30 AM to 7:59 AM (15, 38.5%) for females.
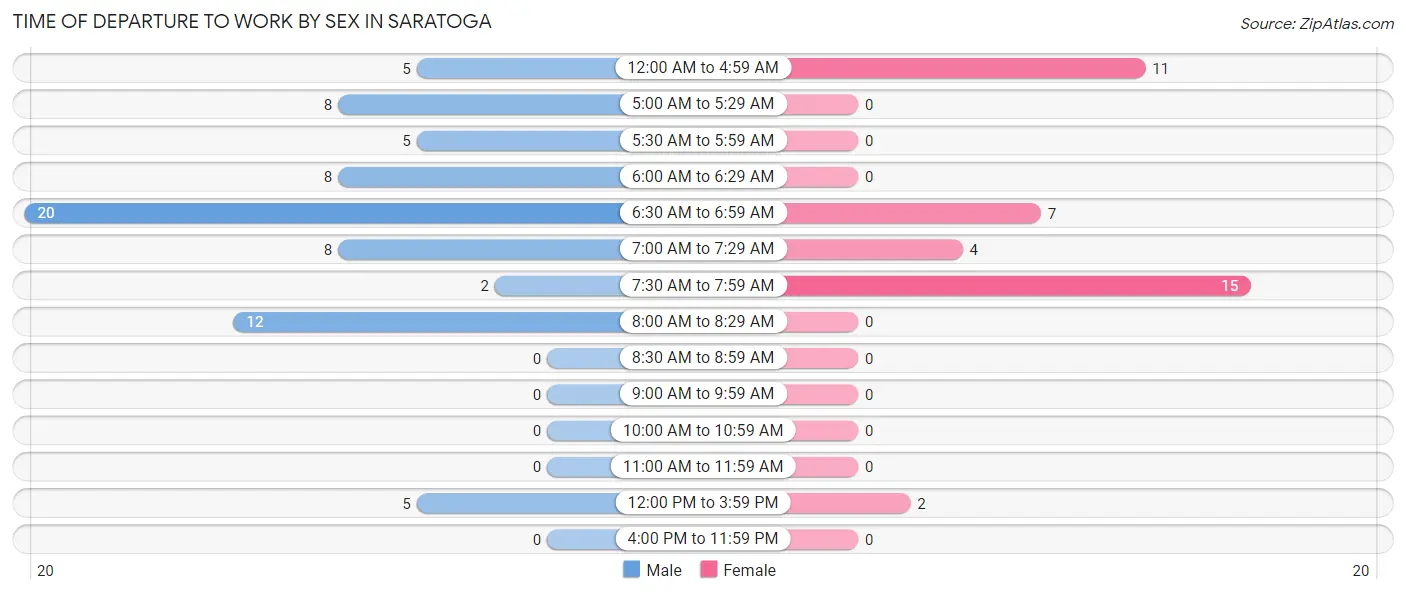
| Time of Departure | Male | Female |
| 12:00 AM to 4:59 AM | 5 (6.9%) | 11 (28.2%) |
| 5:00 AM to 5:29 AM | 8 (11.0%) | 0 (0.0%) |
| 5:30 AM to 5:59 AM | 5 (6.9%) | 0 (0.0%) |
| 6:00 AM to 6:29 AM | 8 (11.0%) | 0 (0.0%) |
| 6:30 AM to 6:59 AM | 20 (27.4%) | 7 (17.9%) |
| 7:00 AM to 7:29 AM | 8 (11.0%) | 4 (10.3%) |
| 7:30 AM to 7:59 AM | 2 (2.7%) | 15 (38.5%) |
| 8:00 AM to 8:29 AM | 12 (16.4%) | 0 (0.0%) |
| 8:30 AM to 8:59 AM | 0 (0.0%) | 0 (0.0%) |
| 9:00 AM to 9:59 AM | 0 (0.0%) | 0 (0.0%) |
| 10:00 AM to 10:59 AM | 0 (0.0%) | 0 (0.0%) |
| 11:00 AM to 11:59 AM | 0 (0.0%) | 0 (0.0%) |
| 12:00 PM to 3:59 PM | 5 (6.9%) | 2 (5.1%) |
| 4:00 PM to 11:59 PM | 0 (0.0%) | 0 (0.0%) |
| Total | 73 (100.0%) | 39 (100.0%) |
Housing Occupancy in Saratoga
Occupancy by Ownership in Saratoga
Of the total 107 dwellings in Saratoga, owner-occupied units account for 61 (57.0%), while renter-occupied units make up 46 (43.0%).
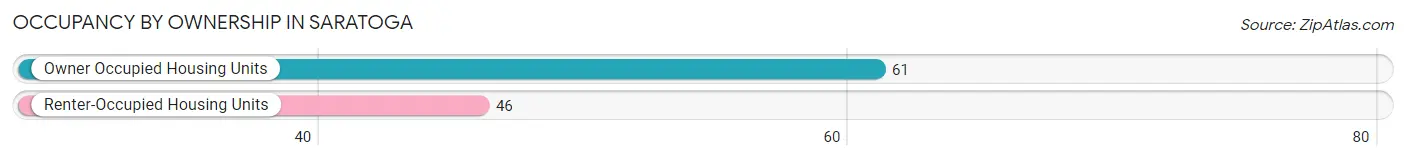
| Occupancy | # Housing Units | % Housing Units |
| Owner Occupied Housing Units | 61 | 57.0% |
| Renter-Occupied Housing Units | 46 | 43.0% |
| Total Occupied Housing Units | 107 | 100.0% |
Occupancy by Household Size in Saratoga
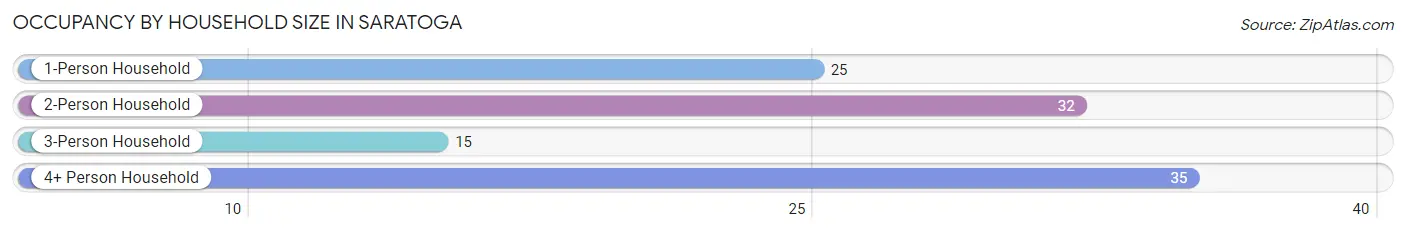
| Household Size | # Housing Units | % Housing Units |
| 1-Person Household | 25 | 23.4% |
| 2-Person Household | 32 | 29.9% |
| 3-Person Household | 15 | 14.0% |
| 4+ Person Household | 35 | 32.7% |
| Total Housing Units | 107 | 100.0% |
Occupancy by Ownership by Household Size in Saratoga
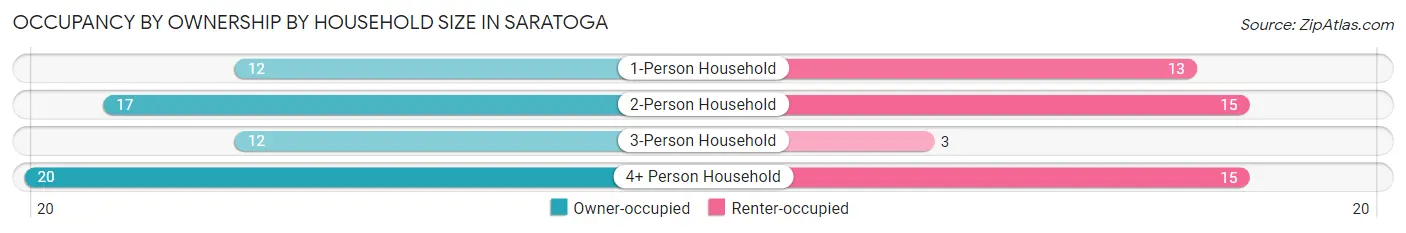
| Household Size | Owner-occupied | Renter-occupied |
| 1-Person Household | 12 (48.0%) | 13 (52.0%) |
| 2-Person Household | 17 (53.1%) | 15 (46.9%) |
| 3-Person Household | 12 (80.0%) | 3 (20.0%) |
| 4+ Person Household | 20 (57.1%) | 15 (42.9%) |
| Total Housing Units | 61 (57.0%) | 46 (43.0%) |
Occupancy by Educational Attainment in Saratoga
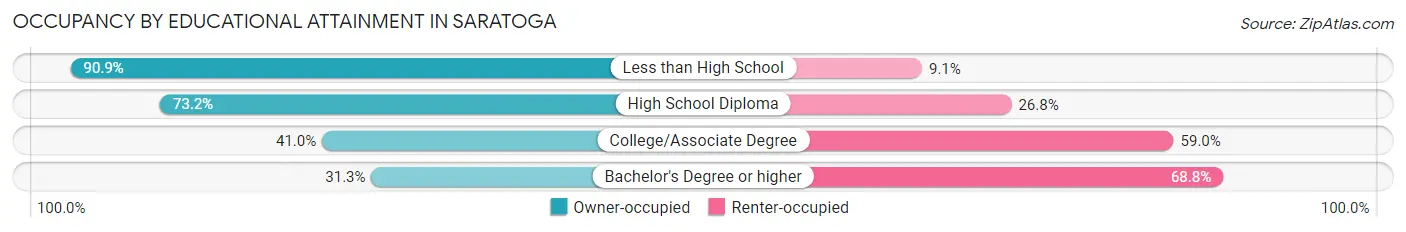
| Household Size | Owner-occupied | Renter-occupied |
| Less than High School | 10 (90.9%) | 1 (9.1%) |
| High School Diploma | 30 (73.2%) | 11 (26.8%) |
| College/Associate Degree | 16 (41.0%) | 23 (59.0%) |
| Bachelor's Degree or higher | 5 (31.2%) | 11 (68.8%) |
Occupancy by Age of Householder in Saratoga
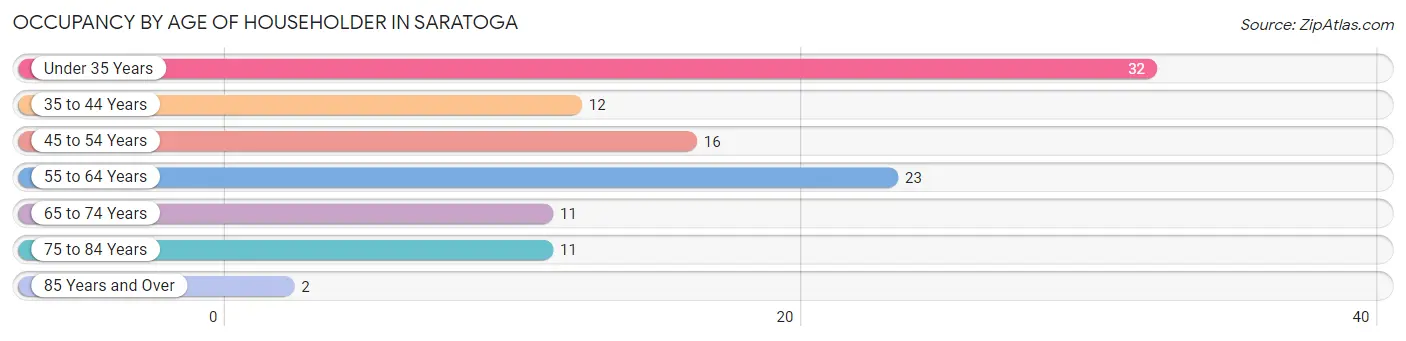
| Age Bracket | # Households | % Households |
| Under 35 Years | 32 | 29.9% |
| 35 to 44 Years | 12 | 11.2% |
| 45 to 54 Years | 16 | 14.9% |
| 55 to 64 Years | 23 | 21.5% |
| 65 to 74 Years | 11 | 10.3% |
| 75 to 84 Years | 11 | 10.3% |
| 85 Years and Over | 2 | 1.9% |
| Total | 107 | 100.0% |
Housing Finances in Saratoga
Median Income by Occupancy in Saratoga
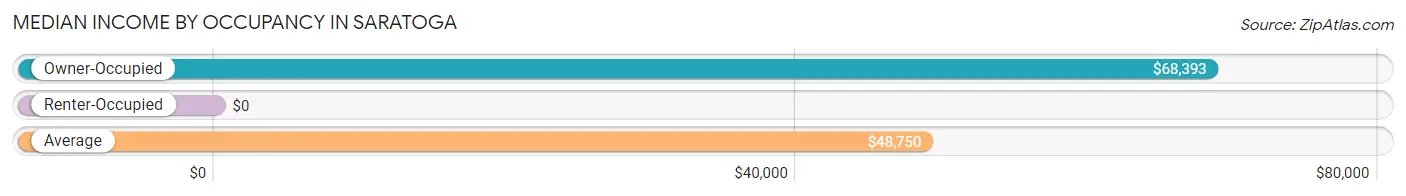
| Occupancy Type | # Households | Median Income |
| Owner-Occupied | 61 (57.0%) | $68,393 |
| Renter-Occupied | 46 (43.0%) | $0 |
| Average | 107 (100.0%) | $48,750 |
Occupancy by Householder Income Bracket in Saratoga
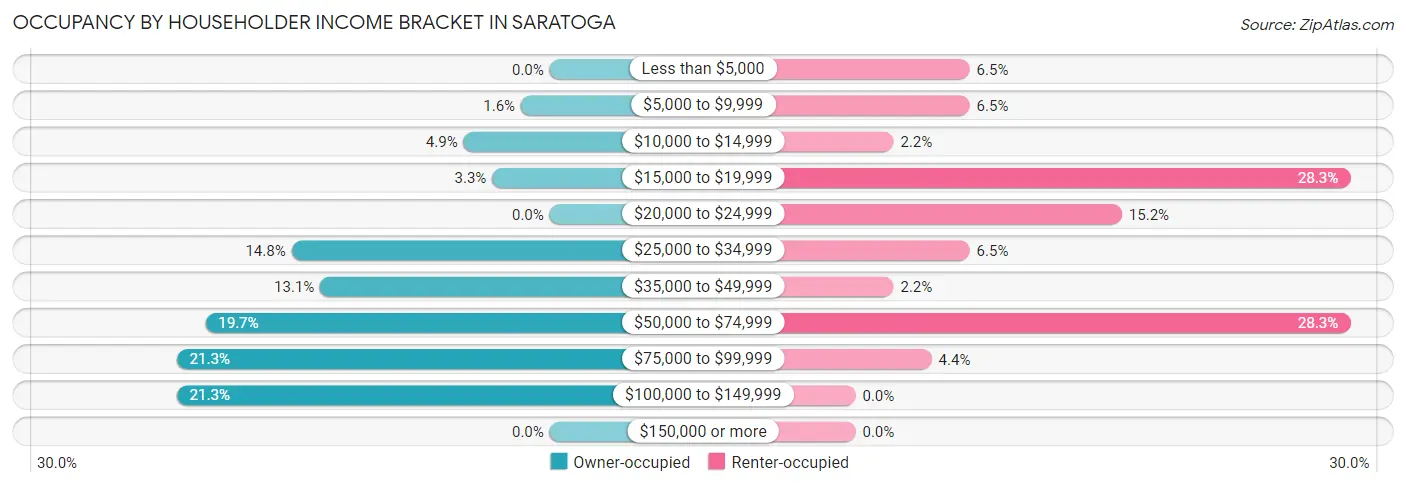
| Income Bracket | Owner-occupied | Renter-occupied |
| Less than $5,000 | 0 (0.0%) | 3 (6.5%) |
| $5,000 to $9,999 | 1 (1.6%) | 3 (6.5%) |
| $10,000 to $14,999 | 3 (4.9%) | 1 (2.2%) |
| $15,000 to $19,999 | 2 (3.3%) | 13 (28.3%) |
| $20,000 to $24,999 | 0 (0.0%) | 7 (15.2%) |
| $25,000 to $34,999 | 9 (14.7%) | 3 (6.5%) |
| $35,000 to $49,999 | 8 (13.1%) | 1 (2.2%) |
| $50,000 to $74,999 | 12 (19.7%) | 13 (28.3%) |
| $75,000 to $99,999 | 13 (21.3%) | 2 (4.3%) |
| $100,000 to $149,999 | 13 (21.3%) | 0 (0.0%) |
| $150,000 or more | 0 (0.0%) | 0 (0.0%) |
| Total | 61 (100.0%) | 46 (100.0%) |
Monthly Housing Cost Tiers in Saratoga
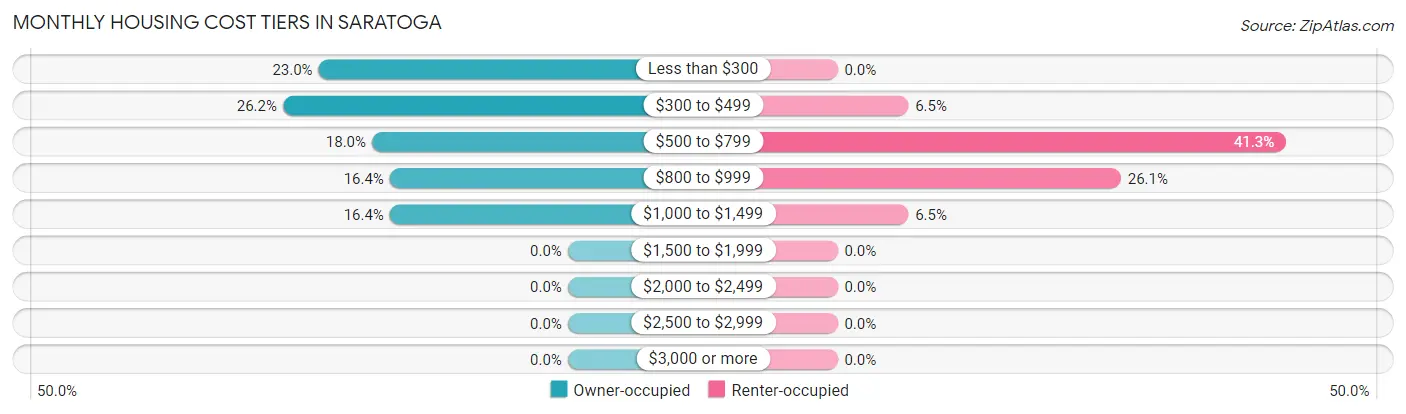
| Monthly Cost | Owner-occupied | Renter-occupied |
| Less than $300 | 14 (23.0%) | 0 (0.0%) |
| $300 to $499 | 16 (26.2%) | 3 (6.5%) |
| $500 to $799 | 11 (18.0%) | 19 (41.3%) |
| $800 to $999 | 10 (16.4%) | 12 (26.1%) |
| $1,000 to $1,499 | 10 (16.4%) | 3 (6.5%) |
| $1,500 to $1,999 | 0 (0.0%) | 0 (0.0%) |
| $2,000 to $2,499 | 0 (0.0%) | 0 (0.0%) |
| $2,500 to $2,999 | 0 (0.0%) | 0 (0.0%) |
| $3,000 or more | 0 (0.0%) | 0 (0.0%) |
| Total | 61 (100.0%) | 46 (100.0%) |
Physical Housing Characteristics in Saratoga
Housing Structures in Saratoga
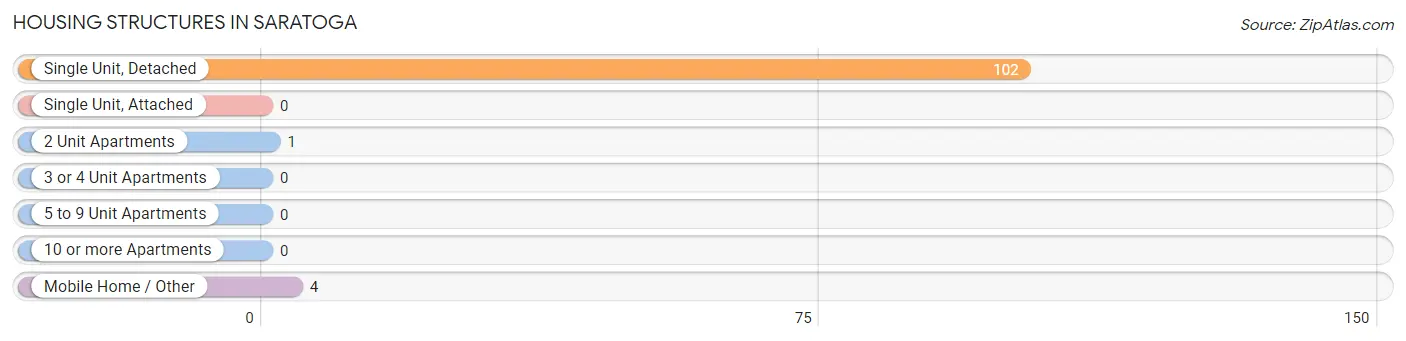
| Structure Type | # Housing Units | % Housing Units |
| Single Unit, Detached | 102 | 95.3% |
| Single Unit, Attached | 0 | 0.0% |
| 2 Unit Apartments | 1 | 0.9% |
| 3 or 4 Unit Apartments | 0 | 0.0% |
| 5 to 9 Unit Apartments | 0 | 0.0% |
| 10 or more Apartments | 0 | 0.0% |
| Mobile Home / Other | 4 | 3.7% |
| Total | 107 | 100.0% |
Housing Structures by Occupancy in Saratoga
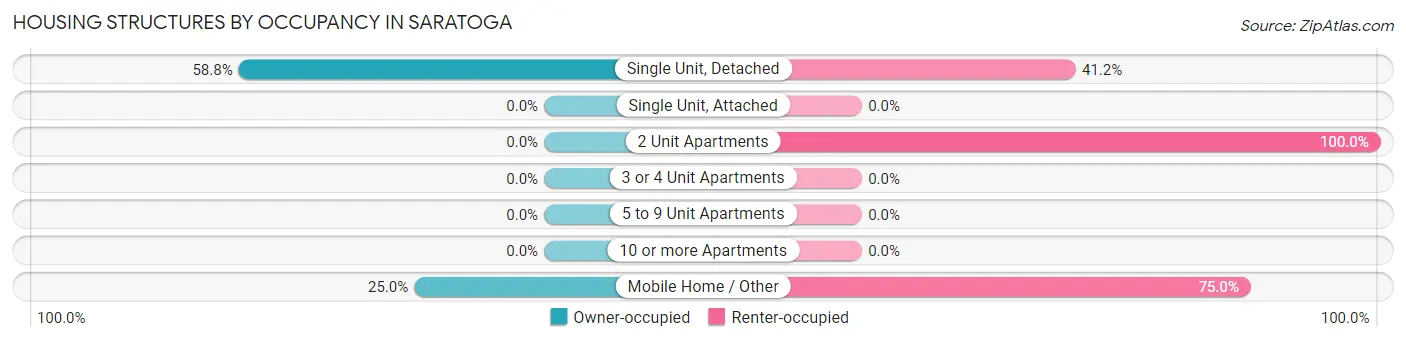
| Structure Type | Owner-occupied | Renter-occupied |
| Single Unit, Detached | 60 (58.8%) | 42 (41.2%) |
| Single Unit, Attached | 0 (0.0%) | 0 (0.0%) |
| 2 Unit Apartments | 0 (0.0%) | 1 (100.0%) |
| 3 or 4 Unit Apartments | 0 (0.0%) | 0 (0.0%) |
| 5 to 9 Unit Apartments | 0 (0.0%) | 0 (0.0%) |
| 10 or more Apartments | 0 (0.0%) | 0 (0.0%) |
| Mobile Home / Other | 1 (25.0%) | 3 (75.0%) |
| Total | 61 (57.0%) | 46 (43.0%) |
Housing Structures by Number of Rooms in Saratoga
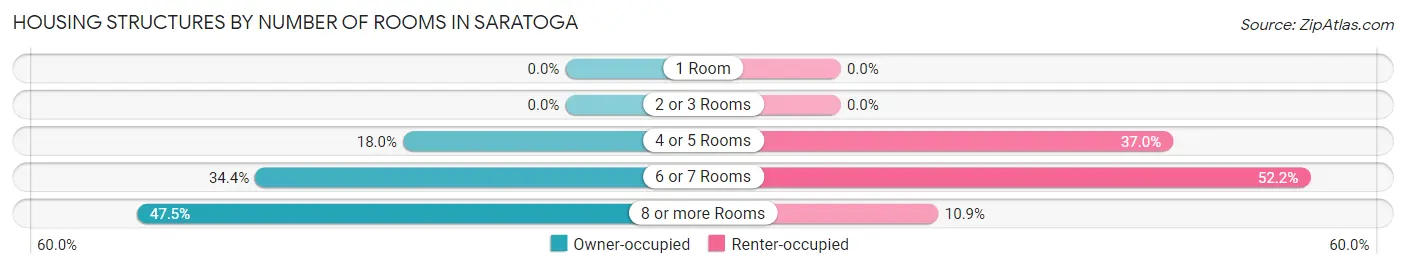
| Number of Rooms | Owner-occupied | Renter-occupied |
| 1 Room | 0 (0.0%) | 0 (0.0%) |
| 2 or 3 Rooms | 0 (0.0%) | 0 (0.0%) |
| 4 or 5 Rooms | 11 (18.0%) | 17 (37.0%) |
| 6 or 7 Rooms | 21 (34.4%) | 24 (52.2%) |
| 8 or more Rooms | 29 (47.5%) | 5 (10.9%) |
| Total | 61 (100.0%) | 46 (100.0%) |
Housing Structure by Heating Type in Saratoga
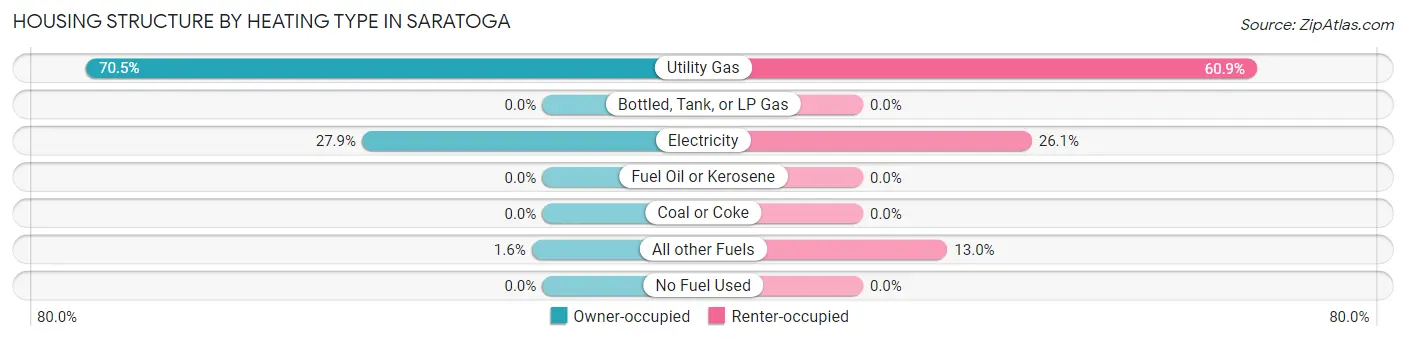
| Heating Type | Owner-occupied | Renter-occupied |
| Utility Gas | 43 (70.5%) | 28 (60.9%) |
| Bottled, Tank, or LP Gas | 0 (0.0%) | 0 (0.0%) |
| Electricity | 17 (27.9%) | 12 (26.1%) |
| Fuel Oil or Kerosene | 0 (0.0%) | 0 (0.0%) |
| Coal or Coke | 0 (0.0%) | 0 (0.0%) |
| All other Fuels | 1 (1.6%) | 6 (13.0%) |
| No Fuel Used | 0 (0.0%) | 0 (0.0%) |
| Total | 61 (100.0%) | 46 (100.0%) |
Household Vehicle Usage in Saratoga
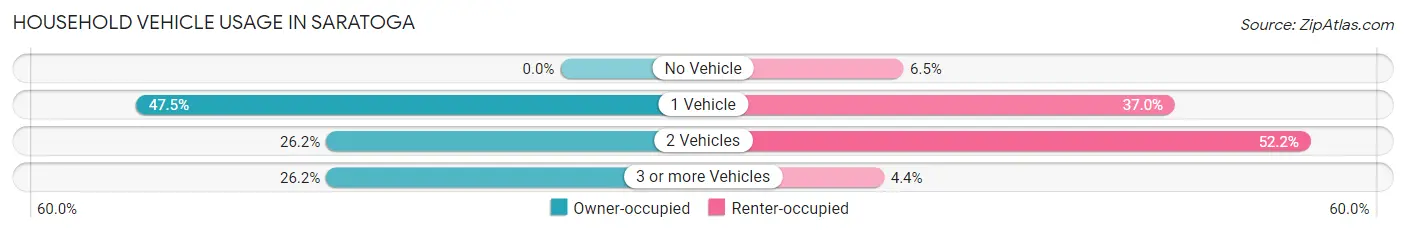
| Vehicles per Household | Owner-occupied | Renter-occupied |
| No Vehicle | 0 (0.0%) | 3 (6.5%) |
| 1 Vehicle | 29 (47.5%) | 17 (37.0%) |
| 2 Vehicles | 16 (26.2%) | 24 (52.2%) |
| 3 or more Vehicles | 16 (26.2%) | 2 (4.3%) |
| Total | 61 (100.0%) | 46 (100.0%) |
Real Estate & Mortgages in Saratoga
Real Estate and Mortgage Overview in Saratoga
| Characteristic | Without Mortgage | With Mortgage |
| Housing Units | 34 | 27 |
| Median Property Value | $53,100 | $68,100 |
| Median Household Income | $41,429 | $0 |
| Monthly Housing Costs | $313 | $0 |
| Real Estate Taxes | $308 | $0 |
Property Value by Mortgage Status in Saratoga
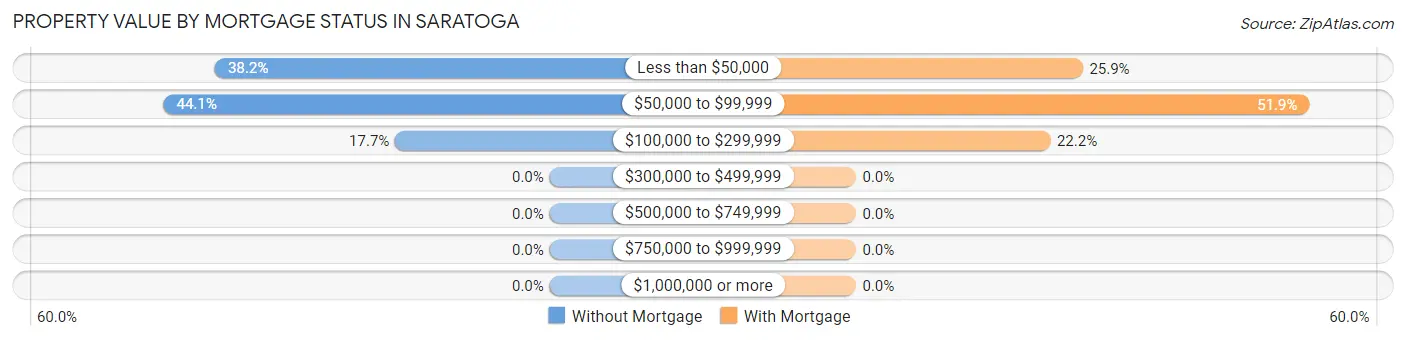
| Property Value | Without Mortgage | With Mortgage |
| Less than $50,000 | 13 (38.2%) | 7 (25.9%) |
| $50,000 to $99,999 | 15 (44.1%) | 14 (51.8%) |
| $100,000 to $299,999 | 6 (17.6%) | 6 (22.2%) |
| $300,000 to $499,999 | 0 (0.0%) | 0 (0.0%) |
| $500,000 to $749,999 | 0 (0.0%) | 0 (0.0%) |
| $750,000 to $999,999 | 0 (0.0%) | 0 (0.0%) |
| $1,000,000 or more | 0 (0.0%) | 0 (0.0%) |
| Total | 34 (100.0%) | 27 (100.0%) |
Household Income by Mortgage Status in Saratoga
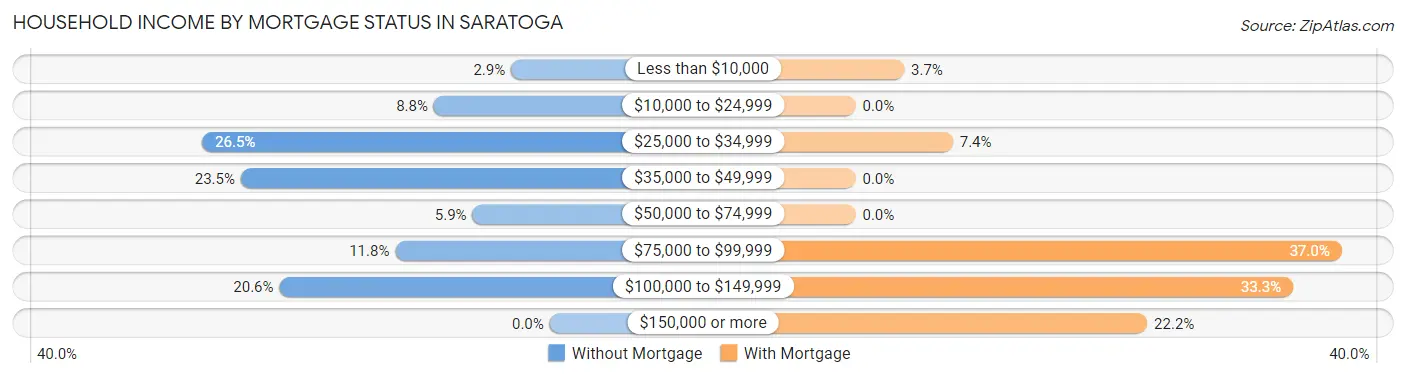
| Household Income | Without Mortgage | With Mortgage |
| Less than $10,000 | 1 (2.9%) | 1 (3.7%) |
| $10,000 to $24,999 | 3 (8.8%) | 0 (0.0%) |
| $25,000 to $34,999 | 9 (26.5%) | 2 (7.4%) |
| $35,000 to $49,999 | 8 (23.5%) | 0 (0.0%) |
| $50,000 to $74,999 | 2 (5.9%) | 0 (0.0%) |
| $75,000 to $99,999 | 4 (11.8%) | 10 (37.0%) |
| $100,000 to $149,999 | 7 (20.6%) | 9 (33.3%) |
| $150,000 or more | 0 (0.0%) | 6 (22.2%) |
| Total | 34 (100.0%) | 27 (100.0%) |
Property Value to Household Income Ratio in Saratoga
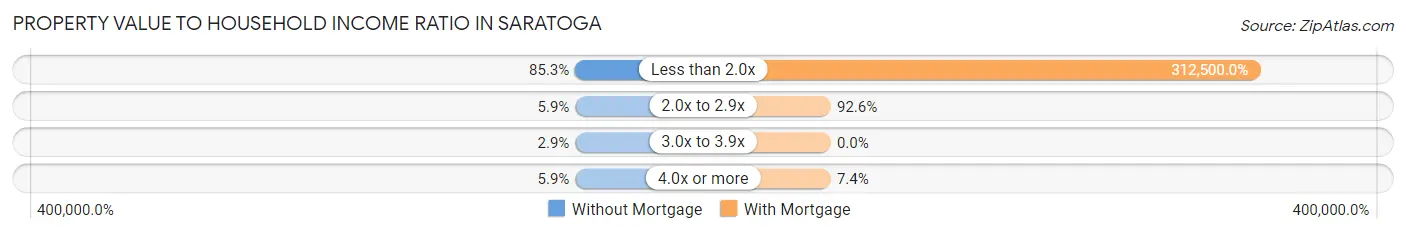
| Value-to-Income Ratio | Without Mortgage | With Mortgage |
| Less than 2.0x | 29 (85.3%) | 84,375 (312,500.0%) |
| 2.0x to 2.9x | 2 (5.9%) | 25 (92.6%) |
| 3.0x to 3.9x | 1 (2.9%) | 0 (0.0%) |
| 4.0x or more | 2 (5.9%) | 2 (7.4%) |
| Total | 34 (100.0%) | 27 (100.0%) |
Real Estate Taxes by Mortgage Status in Saratoga
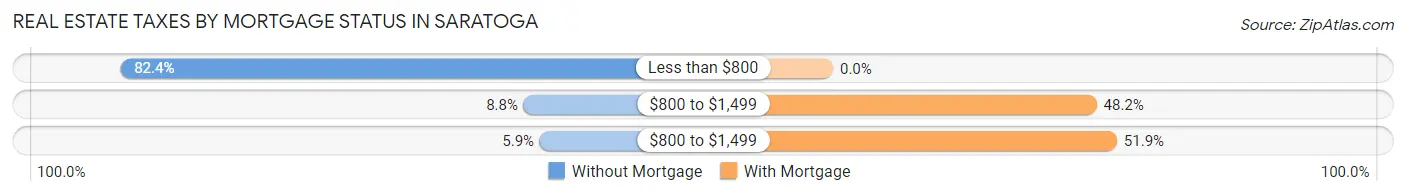
| Property Taxes | Without Mortgage | With Mortgage |
| Less than $800 | 28 (82.4%) | 0 (0.0%) |
| $800 to $1,499 | 3 (8.8%) | 13 (48.1%) |
| $800 to $1,499 | 2 (5.9%) | 14 (51.8%) |
| Total | 34 (100.0%) | 27 (100.0%) |
Health & Disability in Saratoga
Health Insurance Coverage by Age in Saratoga
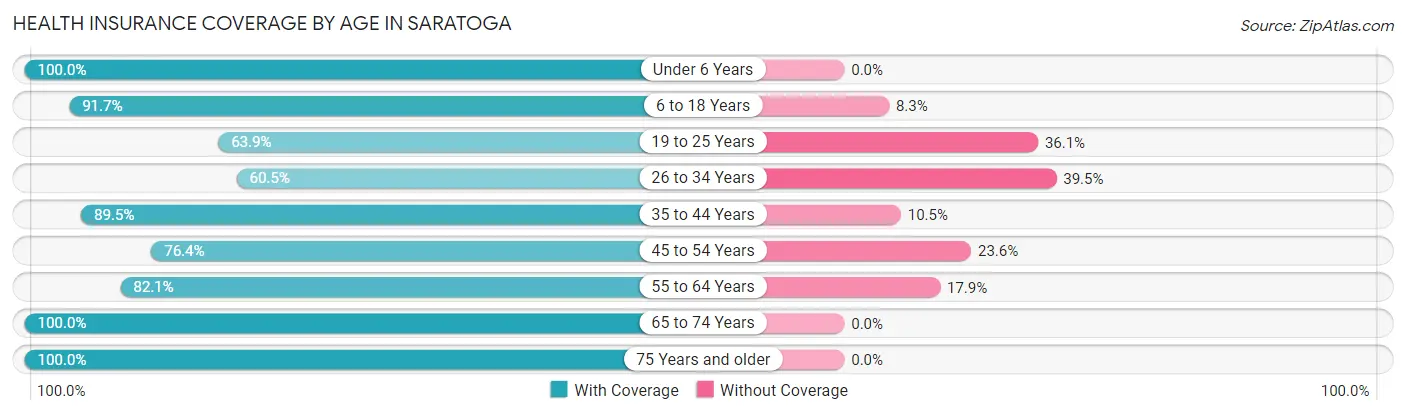
| Age Bracket | With Coverage | Without Coverage |
| Under 6 Years | 45 (100.0%) | 0 (0.0%) |
| 6 to 18 Years | 44 (91.7%) | 4 (8.3%) |
| 19 to 25 Years | 23 (63.9%) | 13 (36.1%) |
| 26 to 34 Years | 26 (60.5%) | 17 (39.5%) |
| 35 to 44 Years | 17 (89.5%) | 2 (10.5%) |
| 45 to 54 Years | 42 (76.4%) | 13 (23.6%) |
| 55 to 64 Years | 23 (82.1%) | 5 (17.9%) |
| 65 to 74 Years | 19 (100.0%) | 0 (0.0%) |
| 75 Years and older | 19 (100.0%) | 0 (0.0%) |
| Total | 258 (82.7%) | 54 (17.3%) |
Health Insurance Coverage by Citizenship Status in Saratoga
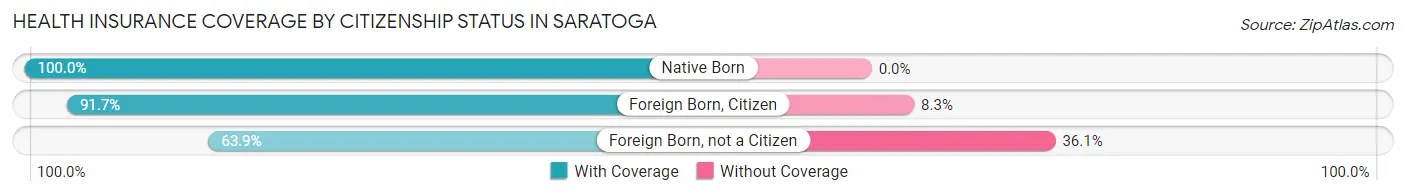
| Citizenship Status | With Coverage | Without Coverage |
| Native Born | 45 (100.0%) | 0 (0.0%) |
| Foreign Born, Citizen | 44 (91.7%) | 4 (8.3%) |
| Foreign Born, not a Citizen | 23 (63.9%) | 13 (36.1%) |
Health Insurance Coverage by Household Income in Saratoga
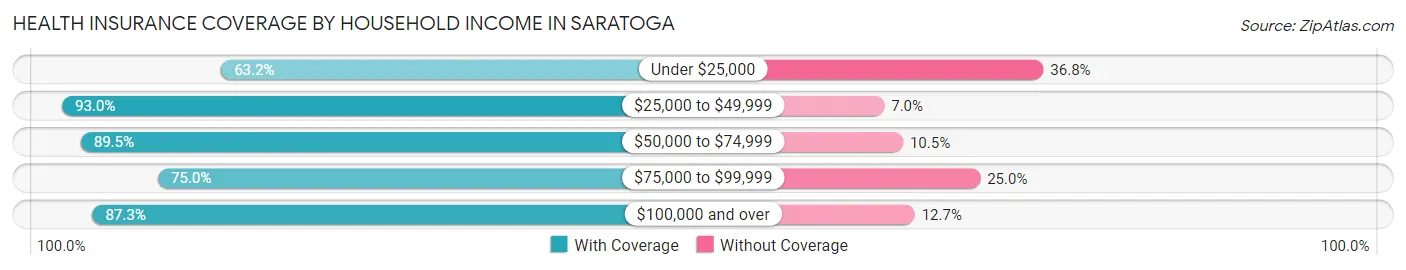
| Household Income | With Coverage | Without Coverage |
| Under $25,000 | 36 (63.2%) | 21 (36.8%) |
| $25,000 to $49,999 | 53 (93.0%) | 4 (7.0%) |
| $50,000 to $74,999 | 85 (89.5%) | 10 (10.5%) |
| $75,000 to $99,999 | 36 (75.0%) | 12 (25.0%) |
| $100,000 and over | 48 (87.3%) | 7 (12.7%) |
Public vs Private Health Insurance Coverage by Age in Saratoga
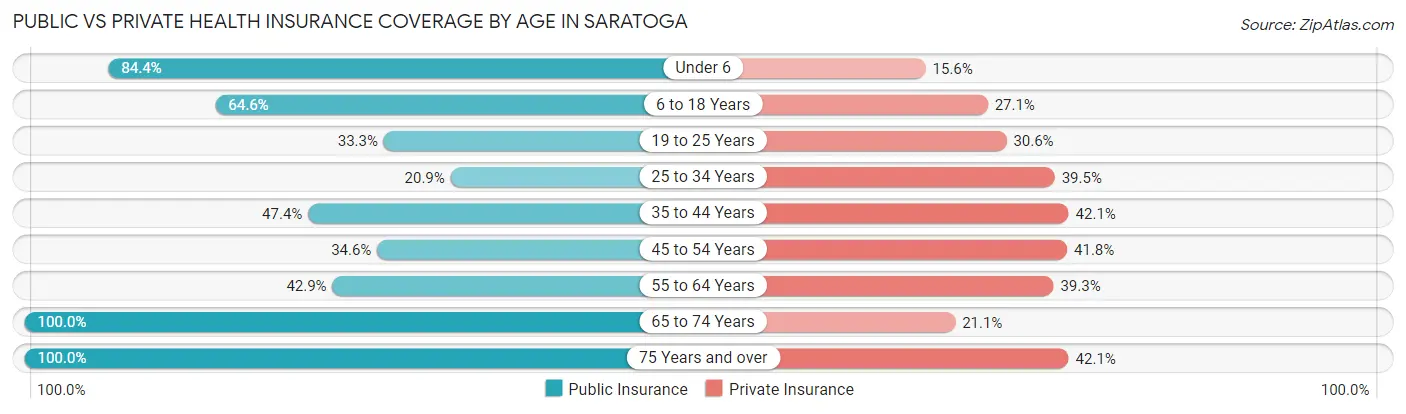
| Age Bracket | Public Insurance | Private Insurance |
| Under 6 | 38 (84.4%) | 7 (15.6%) |
| 6 to 18 Years | 31 (64.6%) | 13 (27.1%) |
| 19 to 25 Years | 12 (33.3%) | 11 (30.6%) |
| 25 to 34 Years | 9 (20.9%) | 17 (39.5%) |
| 35 to 44 Years | 9 (47.4%) | 8 (42.1%) |
| 45 to 54 Years | 19 (34.5%) | 23 (41.8%) |
| 55 to 64 Years | 12 (42.9%) | 11 (39.3%) |
| 65 to 74 Years | 19 (100.0%) | 4 (21.0%) |
| 75 Years and over | 19 (100.0%) | 8 (42.1%) |
| Total | 168 (53.8%) | 102 (32.7%) |
Disability Status by Sex by Age in Saratoga
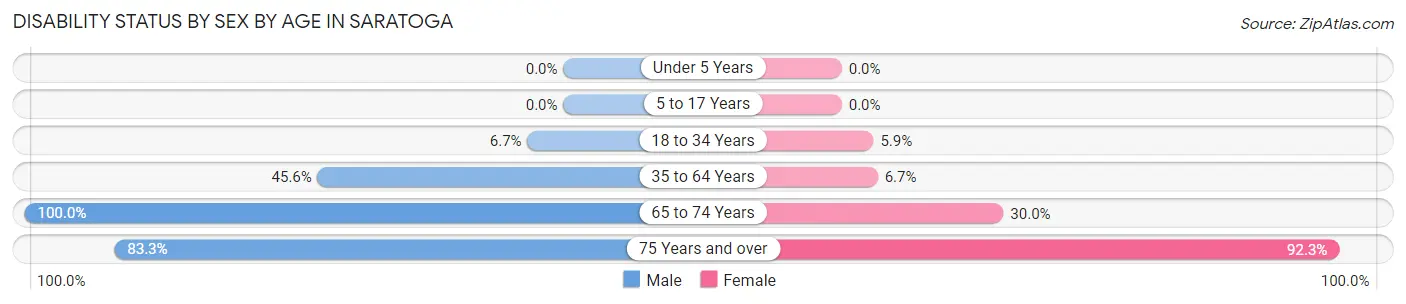
| Age Bracket | Male | Female |
| Under 5 Years | 0 (0.0%) | 0 (0.0%) |
| 5 to 17 Years | 0 (0.0%) | 0 (0.0%) |
| 18 to 34 Years | 3 (6.7%) | 2 (5.9%) |
| 35 to 64 Years | 26 (45.6%) | 3 (6.7%) |
| 65 to 74 Years | 9 (100.0%) | 3 (30.0%) |
| 75 Years and over | 5 (83.3%) | 12 (92.3%) |
Disability Class by Sex by Age in Saratoga
Disability Class: Hearing Difficulty
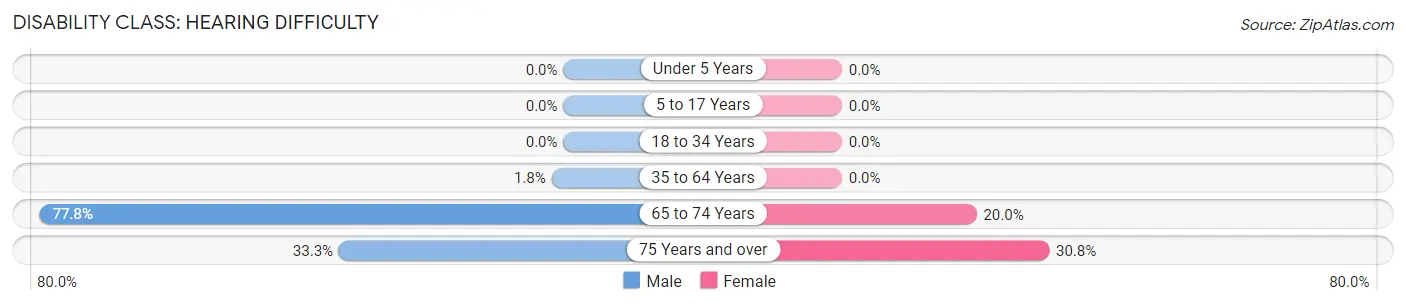
| Age Bracket | Male | Female |
| Under 5 Years | 0 (0.0%) | 0 (0.0%) |
| 5 to 17 Years | 0 (0.0%) | 0 (0.0%) |
| 18 to 34 Years | 0 (0.0%) | 0 (0.0%) |
| 35 to 64 Years | 1 (1.8%) | 0 (0.0%) |
| 65 to 74 Years | 7 (77.8%) | 2 (20.0%) |
| 75 Years and over | 2 (33.3%) | 4 (30.8%) |
Disability Class: Vision Difficulty
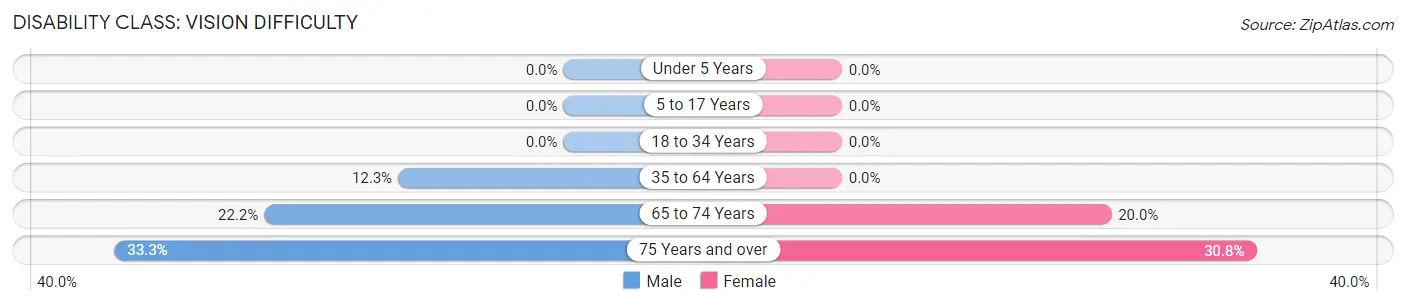
| Age Bracket | Male | Female |
| Under 5 Years | 0 (0.0%) | 0 (0.0%) |
| 5 to 17 Years | 0 (0.0%) | 0 (0.0%) |
| 18 to 34 Years | 0 (0.0%) | 0 (0.0%) |
| 35 to 64 Years | 7 (12.3%) | 0 (0.0%) |
| 65 to 74 Years | 2 (22.2%) | 2 (20.0%) |
| 75 Years and over | 2 (33.3%) | 4 (30.8%) |
Disability Class: Cognitive Difficulty
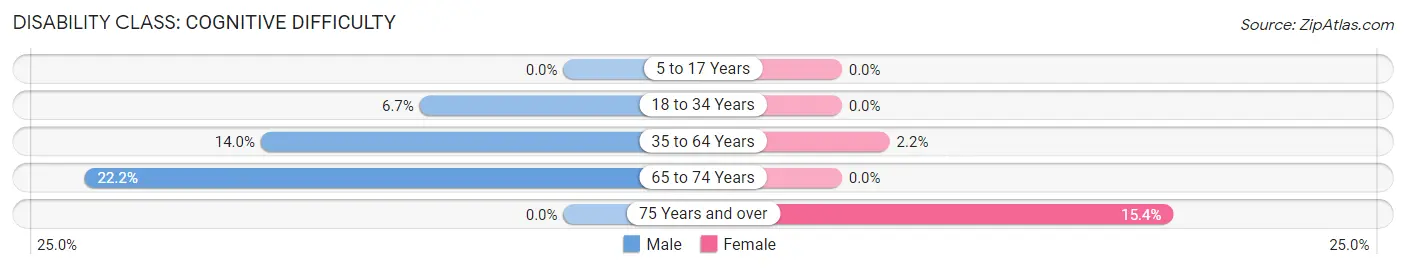
| Age Bracket | Male | Female |
| 5 to 17 Years | 0 (0.0%) | 0 (0.0%) |
| 18 to 34 Years | 3 (6.7%) | 0 (0.0%) |
| 35 to 64 Years | 8 (14.0%) | 1 (2.2%) |
| 65 to 74 Years | 2 (22.2%) | 0 (0.0%) |
| 75 Years and over | 0 (0.0%) | 2 (15.4%) |
Disability Class: Ambulatory Difficulty
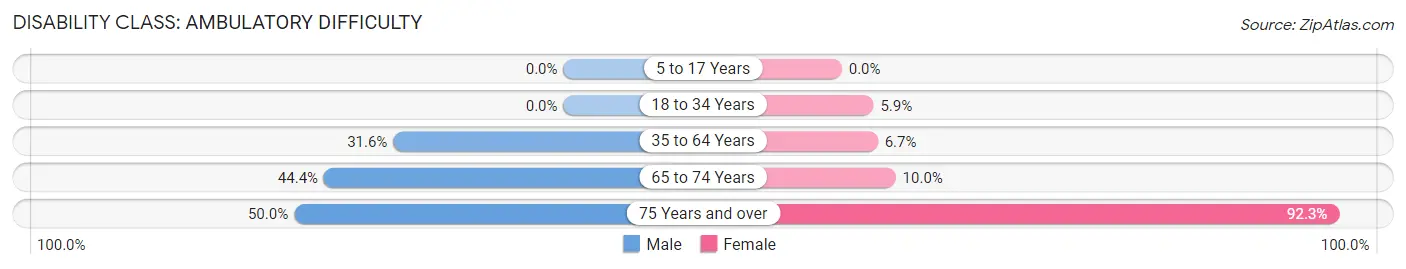
| Age Bracket | Male | Female |
| 5 to 17 Years | 0 (0.0%) | 0 (0.0%) |
| 18 to 34 Years | 0 (0.0%) | 2 (5.9%) |
| 35 to 64 Years | 18 (31.6%) | 3 (6.7%) |
| 65 to 74 Years | 4 (44.4%) | 1 (10.0%) |
| 75 Years and over | 3 (50.0%) | 12 (92.3%) |
Disability Class: Self-Care Difficulty
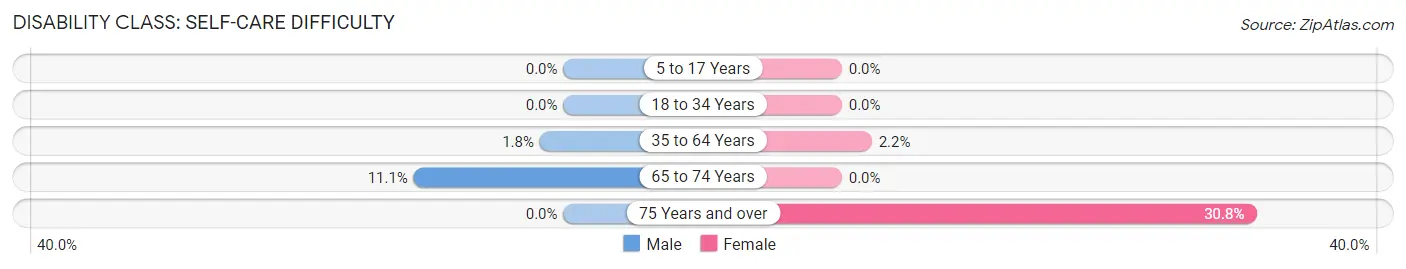
| Age Bracket | Male | Female |
| 5 to 17 Years | 0 (0.0%) | 0 (0.0%) |
| 18 to 34 Years | 0 (0.0%) | 0 (0.0%) |
| 35 to 64 Years | 1 (1.8%) | 1 (2.2%) |
| 65 to 74 Years | 1 (11.1%) | 0 (0.0%) |
| 75 Years and over | 0 (0.0%) | 4 (30.8%) |
Technology Access in Saratoga
Computing Device Access in Saratoga
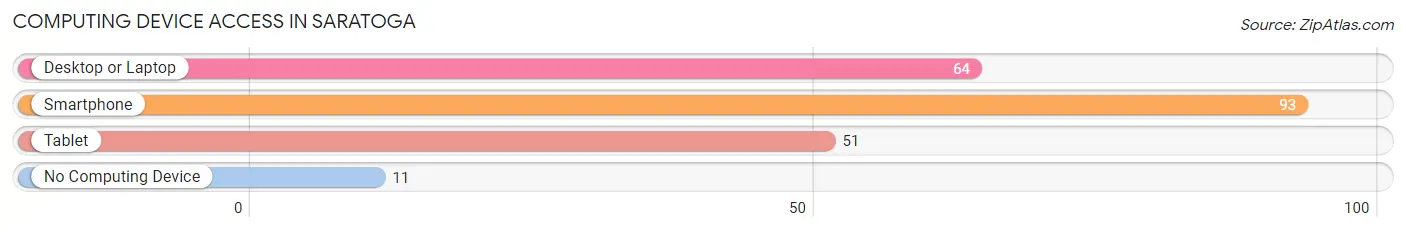
| Device Type | # Households | % Households |
| Desktop or Laptop | 64 | 59.8% |
| Smartphone | 93 | 86.9% |
| Tablet | 51 | 47.7% |
| No Computing Device | 11 | 10.3% |
| Total | 107 | 100.0% |
Internet Access in Saratoga
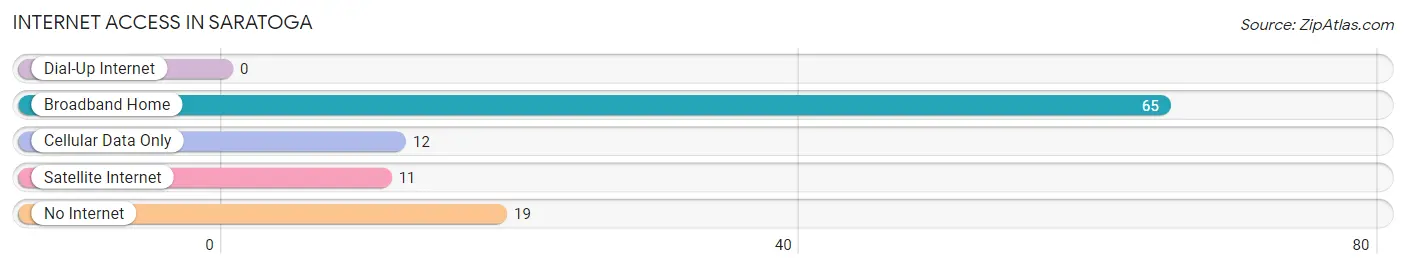
| Internet Type | # Households | % Households |
| Dial-Up Internet | 0 | 0.0% |
| Broadband Home | 65 | 60.8% |
| Cellular Data Only | 12 | 11.2% |
| Satellite Internet | 11 | 10.3% |
| No Internet | 19 | 17.8% |
| Total | 107 | 100.0% |
Saratoga Summary
Saratoga is a small town located in Pulaski County, Indiana, United States. The population was 1,072 at the 2010 census. Saratoga is located in the heart of the Hoosier National Forest and is surrounded by rolling hills and farmland.
History
Saratoga was founded in 1837 by a group of settlers from Ohio. The town was named after the Battle of Saratoga, which was fought during the American Revolutionary War. The town was originally a farming community, but in the late 19th century, it became a popular tourist destination due to its proximity to the Hoosier National Forest.
In the early 20th century, Saratoga was a popular destination for hunters and fishermen. The town was also home to a number of resorts, including the Saratoga Hotel, which was built in the late 1800s and was a popular destination for wealthy visitors.
Geography
Saratoga is located in Pulaski County, Indiana, at the intersection of State Road 14 and State Road 39. The town is situated in a rural area, surrounded by rolling hills and farmland. The Hoosier National Forest is located just to the east of the town.
The climate in Saratoga is humid continental, with hot summers and cold winters. The average annual temperature is 54°F (12°C). The average annual precipitation is 40 inches (101 cm).
Economy
The economy of Saratoga is largely based on agriculture and tourism. The town is home to a number of farms, which produce corn, soybeans, and other crops. The town is also home to a number of tourist attractions, including the Hoosier National Forest, which attracts visitors from all over the country.
Demographics
As of the 2010 census, there were 1,072 people, 431 households, and 287 families living in Saratoga. The population density was 545.3 people per square mile (210.9/km2). The racial makeup of the town was 97.2% White, 0.3% African American, 0.3% Native American, 0.3% Asian, 0.3% from other races, and 1.6% from two or more races. Hispanic or Latino of any race were 1.2% of the population.
The median income for a household in Saratoga was $37,500, and the median income for a family was $45,000. Males had a median income of $31,250 versus $21,250 for females. The per capita income for the town was $17,845. About 8.3% of families and 11.2% of the population were below the poverty line, including 16.7% of those under age 18 and 8.3% of those age 65 or over.
Common Questions
What is Per Capita Income in Saratoga?
Per Capita income in Saratoga is $19,700.
What is the Median Family Income in Saratoga?
Median Family Income in Saratoga is $59,531.
What is the Median Household income in Saratoga?
Median Household Income in Saratoga is $48,750.
What is Inequality or Gini Index in Saratoga?
Inequality or Gini Index in Saratoga is 0.39.
What is the Total Population of Saratoga?
Total Population of Saratoga is 312.
What is the Total Male Population of Saratoga?
Total Male Population of Saratoga is 161.
What is the Total Female Population of Saratoga?
Total Female Population of Saratoga is 151.
What is the Ratio of Males per 100 Females in Saratoga?
There are 106.62 Males per 100 Females in Saratoga.
What is the Ratio of Females per 100 Males in Saratoga?
There are 93.79 Females per 100 Males in Saratoga.
What is the Median Population Age in Saratoga?
Median Population Age in Saratoga is 31.3 Years.
What is the Average Family Size in Saratoga
Average Family Size in Saratoga is 3.8 People.
What is the Average Household Size in Saratoga
Average Household Size in Saratoga is 2.9 People.
How Large is the Labor Force in Saratoga?
There are 122 People in the Labor Forcein in Saratoga.
What is the Percentage of People in the Labor Force in Saratoga?
54.0% of People are in the Labor Force in Saratoga.
What is the Unemployment Rate in Saratoga?
Unemployment Rate in Saratoga is 5.7%.