Waveland, IN Map & Demographics
Waveland Map
Waveland Overview
$26,643
PER CAPITA INCOME
$81,944
AVG FAMILY INCOME
$59,141
AVG HOUSEHOLD INCOME
44.7%
WAGE / INCOME GAP [ % ]
55.3¢/ $1
WAGE / INCOME GAP [ $ ]
0.33
INEQUALITY / GINI INDEX
389
TOTAL POPULATION
192
MALE POPULATION
197
FEMALE POPULATION
97.46
MALES / 100 FEMALES
102.60
FEMALES / 100 MALES
33.9
MEDIAN AGE
3.5
AVG FAMILY SIZE
2.6
AVG HOUSEHOLD SIZE
196
LABOR FORCE [ PEOPLE ]
72.1%
PERCENT IN LABOR FORCE
6.6%
UNEMPLOYMENT RATE
Waveland Zip Codes
Waveland Area Codes
Income in Waveland
Income Overview in Waveland
Per Capita Income in Waveland is $26,643, while median incomes of families and households are $81,944 and $59,141 respectively.
| Characteristic | Number | Measure |
| Per Capita Income | 389 | $26,643 |
| Median Family Income | 92 | $81,944 |
| Mean Family Income | 92 | $89,483 |
| Median Household Income | 147 | $59,141 |
| Mean Household Income | 147 | $72,029 |
| Income Deficit | 92 | $0 |
| Wage / Income Gap (%) | 389 | 44.69% |
| Wage / Income Gap ($) | 389 | 55.31¢ per $1 |
| Gini / Inequality Index | 389 | 0.33 |
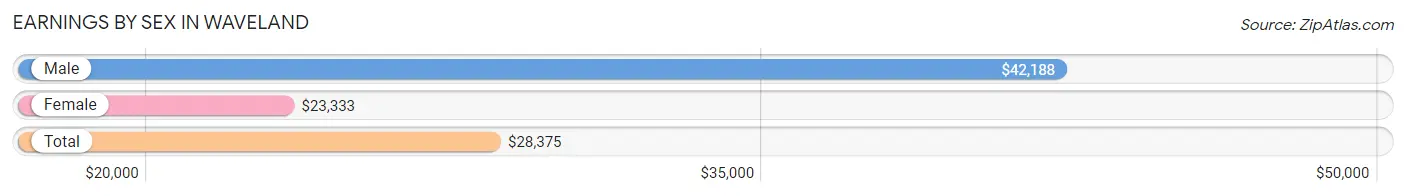
Earnings by Sex in Waveland
Average Earnings in Waveland are $28,375, $42,188 for men and $23,333 for women, a difference of 44.7%.
| Sex | Number | Average Earnings |
| Male | 117 (54.9%) | $42,188 |
| Female | 96 (45.1%) | $23,333 |
| Total | 213 (100.0%) | $28,375 |
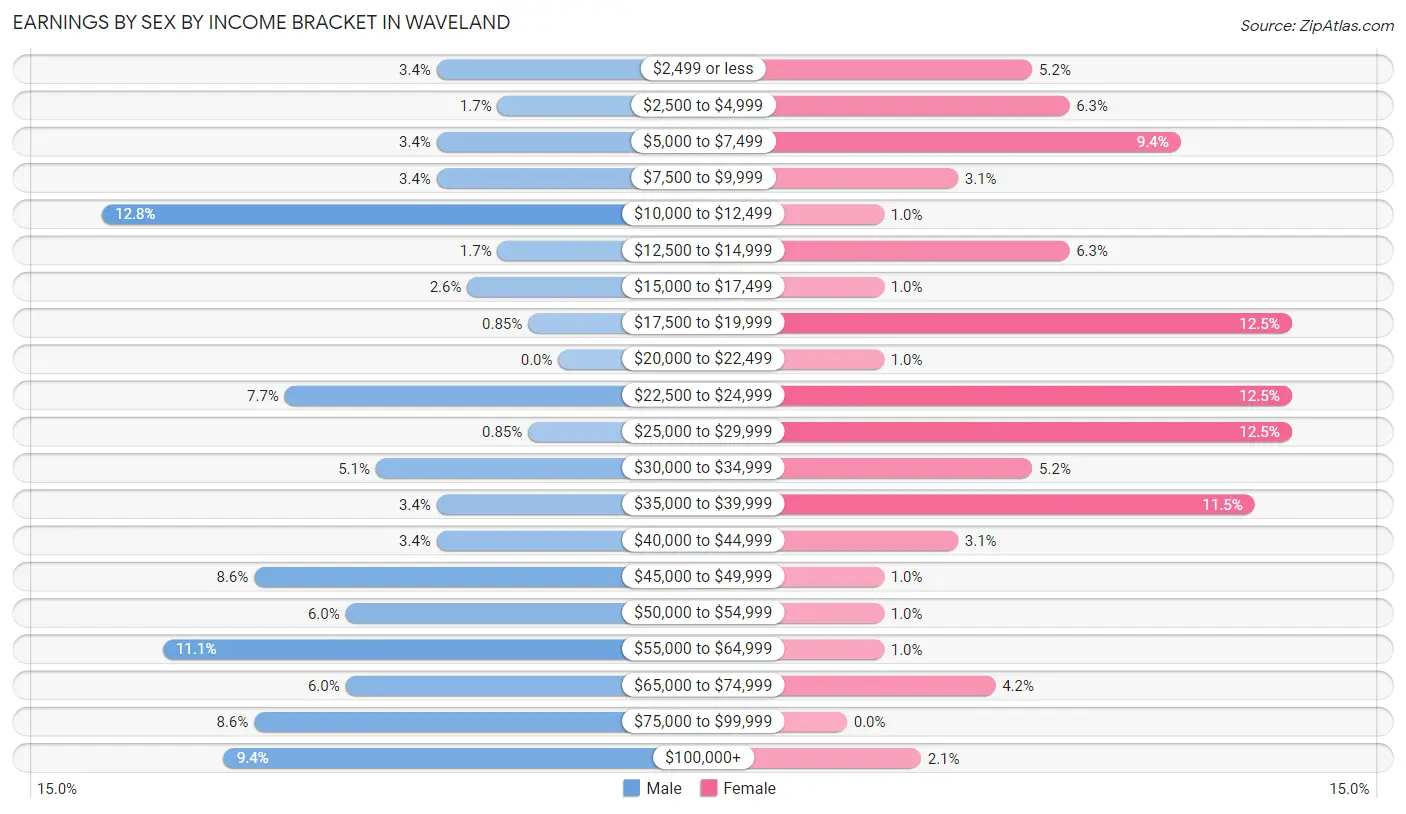
Earnings by Sex by Income Bracket in Waveland
The most common earnings brackets in Waveland are $10,000 to $12,499 for men (15 | 12.8%) and $17,500 to $19,999 for women (12 | 12.5%).
| Income | Male | Female |
| $2,499 or less | 4 (3.4%) | 5 (5.2%) |
| $2,500 to $4,999 | 2 (1.7%) | 6 (6.2%) |
| $5,000 to $7,499 | 4 (3.4%) | 9 (9.4%) |
| $7,500 to $9,999 | 4 (3.4%) | 3 (3.1%) |
| $10,000 to $12,499 | 15 (12.8%) | 1 (1.0%) |
| $12,500 to $14,999 | 2 (1.7%) | 6 (6.2%) |
| $15,000 to $17,499 | 3 (2.6%) | 1 (1.0%) |
| $17,500 to $19,999 | 1 (0.9%) | 12 (12.5%) |
| $20,000 to $22,499 | 0 (0.0%) | 1 (1.0%) |
| $22,500 to $24,999 | 9 (7.7%) | 12 (12.5%) |
| $25,000 to $29,999 | 1 (0.9%) | 12 (12.5%) |
| $30,000 to $34,999 | 6 (5.1%) | 5 (5.2%) |
| $35,000 to $39,999 | 4 (3.4%) | 11 (11.5%) |
| $40,000 to $44,999 | 4 (3.4%) | 3 (3.1%) |
| $45,000 to $49,999 | 10 (8.6%) | 1 (1.0%) |
| $50,000 to $54,999 | 7 (6.0%) | 1 (1.0%) |
| $55,000 to $64,999 | 13 (11.1%) | 1 (1.0%) |
| $65,000 to $74,999 | 7 (6.0%) | 4 (4.2%) |
| $75,000 to $99,999 | 10 (8.6%) | 0 (0.0%) |
| $100,000+ | 11 (9.4%) | 2 (2.1%) |
| Total | 117 (100.0%) | 96 (100.0%) |
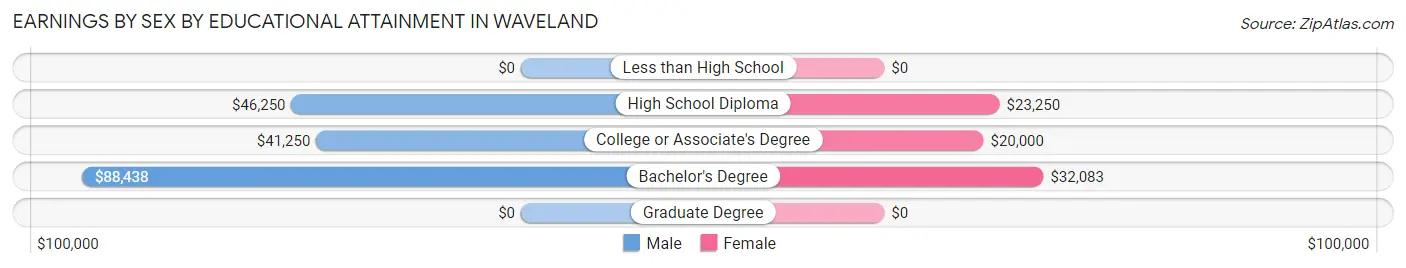
Earnings by Sex by Educational Attainment in Waveland
Average earnings in Waveland are $48,750 for men and $24,167 for women, a difference of 50.4%. Men with an educational attainment of bachelor's degree enjoy the highest average annual earnings of $88,438, while those with college or associate's degree education earn the least with $41,250. Women with an educational attainment of bachelor's degree earn the most with the average annual earnings of $32,083, while those with college or associate's degree education have the smallest earnings of $20,000.
| Educational Attainment | Male Income | Female Income |
| Less than High School | - | - |
| High School Diploma | $46,250 | $23,250 |
| College or Associate's Degree | $41,250 | $20,000 |
| Bachelor's Degree | $88,438 | $32,083 |
| Graduate Degree | - | - |
| Total | $48,750 | $24,167 |
Family Income in Waveland
Family Income Brackets in Waveland
According to the Waveland family income data, there are 24 families falling into the $100,000 to $149,999 income range, which is the most common income bracket and makes up 26.1% of all families.
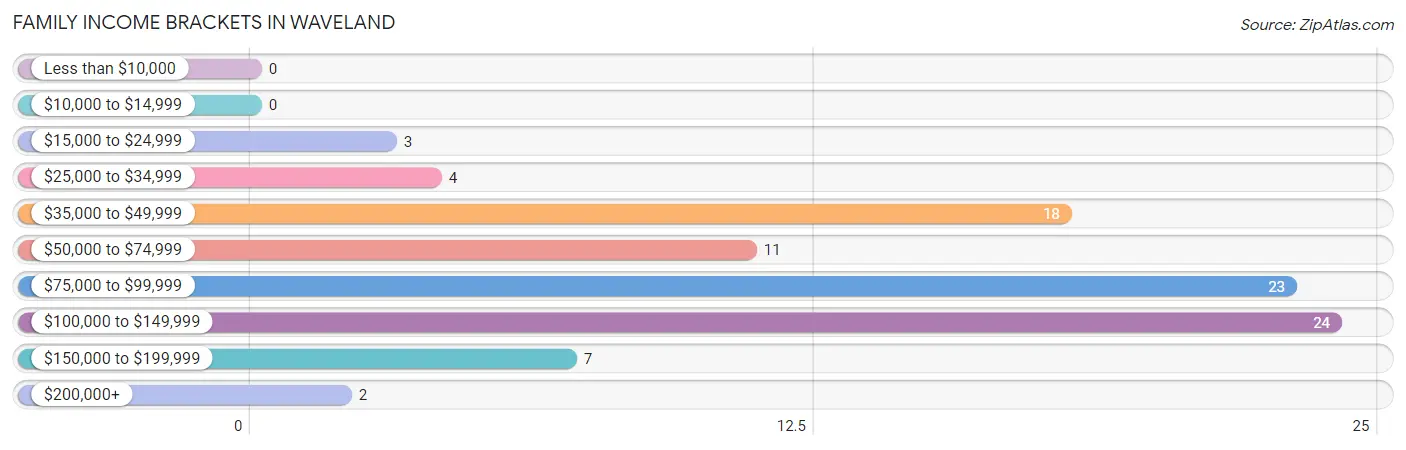
| Income Bracket | # Families | % Families |
| Less than $10,000 | 0 | 0.0% |
| $10,000 to $14,999 | 0 | 0.0% |
| $15,000 to $24,999 | 3 | 3.3% |
| $25,000 to $34,999 | 4 | 4.3% |
| $35,000 to $49,999 | 18 | 19.6% |
| $50,000 to $74,999 | 11 | 12.0% |
| $75,000 to $99,999 | 23 | 25.0% |
| $100,000 to $149,999 | 24 | 26.1% |
| $150,000 to $199,999 | 7 | 7.6% |
| $200,000+ | 2 | 2.2% |
Family Income by Famaliy Size in Waveland
4-person families (13 | 14.1%) account for the highest median family income in Waveland with $116,750 per family, while 2-person families (30 | 32.6%) have the highest median income of $38,750 per family member.
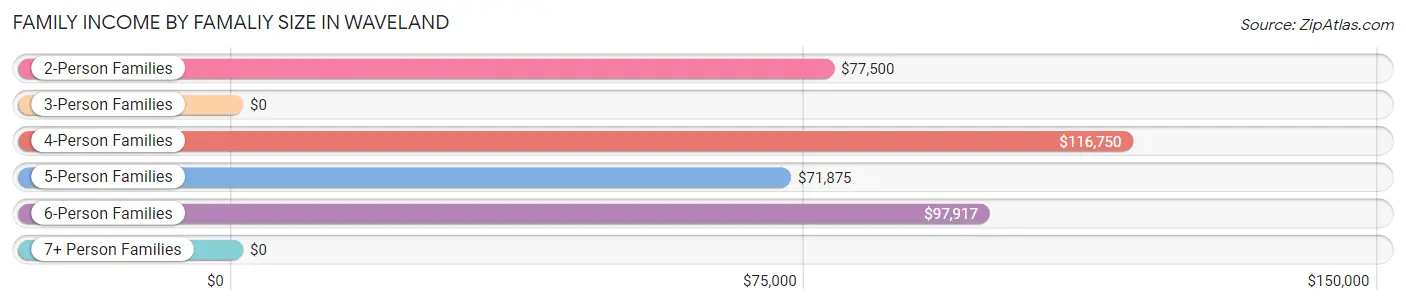
| Income Bracket | # Families | Median Income |
| 2-Person Families | 30 (32.6%) | $77,500 |
| 3-Person Families | 18 (19.6%) | $0 |
| 4-Person Families | 13 (14.1%) | $116,750 |
| 5-Person Families | 17 (18.5%) | $71,875 |
| 6-Person Families | 5 (5.4%) | $97,917 |
| 7+ Person Families | 9 (9.8%) | $0 |
| Total | 92 (100.0%) | $81,944 |
Family Income by Number of Earners in Waveland
The median family income in Waveland is $81,944, with families comprising 3+ earners (12) having the highest median family income of $126,250, while families with no earners (7) have the lowest median family income of $43,750, accounting for 13.0% and 7.6% of families, respectively.
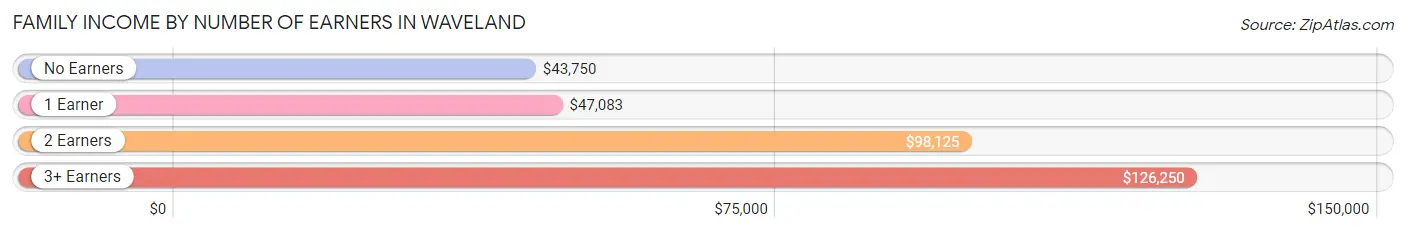
| Number of Earners | # Families | Median Income |
| No Earners | 7 (7.6%) | $43,750 |
| 1 Earner | 21 (22.8%) | $47,083 |
| 2 Earners | 52 (56.5%) | $98,125 |
| 3+ Earners | 12 (13.0%) | $126,250 |
| Total | 92 (100.0%) | $81,944 |
Household Income in Waveland
Household Income Brackets in Waveland
With 33 households falling in the category, the $50,000 to $74,999 income range is the most frequent in Waveland, accounting for 22.5% of all households. In contrast, only 1 households (0.7%) fall into the less than $10,000 income bracket, making it the least populous group.
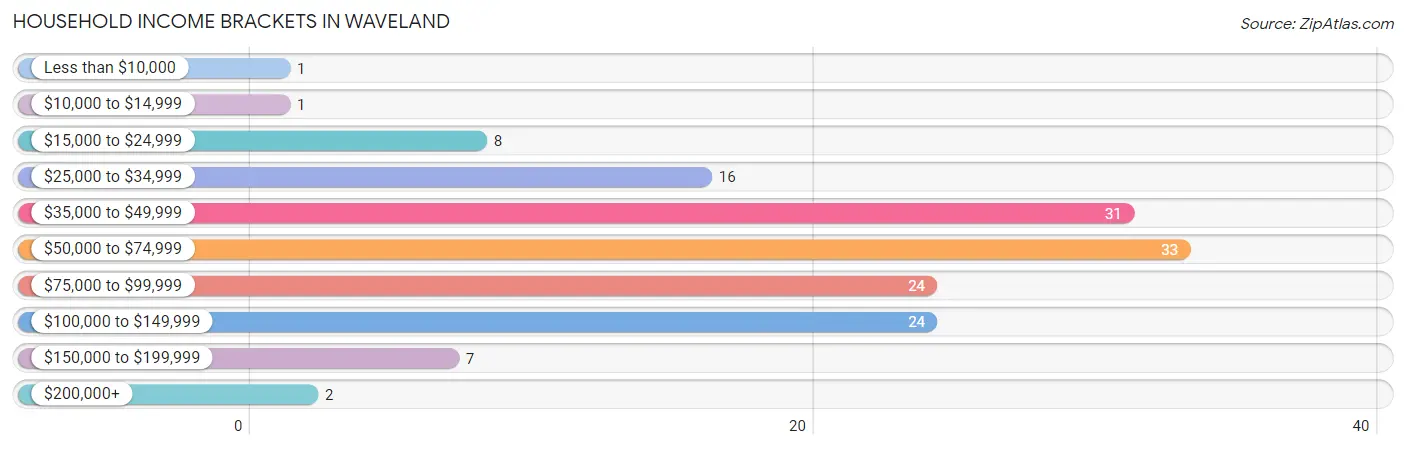
| Income Bracket | # Households | % Households |
| Less than $10,000 | 1 | 0.7% |
| $10,000 to $14,999 | 1 | 0.7% |
| $15,000 to $24,999 | 8 | 5.4% |
| $25,000 to $34,999 | 16 | 10.9% |
| $35,000 to $49,999 | 31 | 21.1% |
| $50,000 to $74,999 | 33 | 22.4% |
| $75,000 to $99,999 | 24 | 16.3% |
| $100,000 to $149,999 | 24 | 16.3% |
| $150,000 to $199,999 | 7 | 4.8% |
| $200,000+ | 2 | 1.4% |
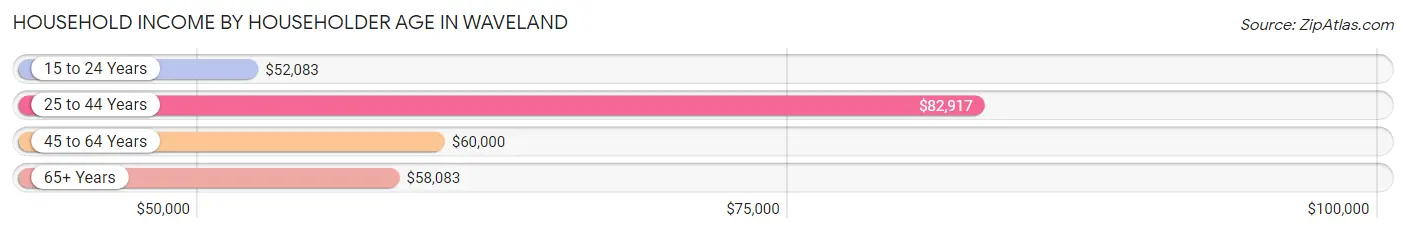
Household Income by Householder Age in Waveland
The median household income in Waveland is $59,141, with the highest median household income of $82,917 found in the 25 to 44 years age bracket for the primary householder. A total of 57 households (38.8%) fall into this category. Meanwhile, the 15 to 24 years age bracket for the primary householder has the lowest median household income of $52,083, with 9 households (6.1%) in this group.
| Income Bracket | # Households | Median Income |
| 15 to 24 Years | 9 (6.1%) | $52,083 |
| 25 to 44 Years | 57 (38.8%) | $82,917 |
| 45 to 64 Years | 34 (23.1%) | $60,000 |
| 65+ Years | 47 (32.0%) | $58,083 |
| Total | 147 (100.0%) | $59,141 |
Poverty in Waveland
Income Below Poverty by Sex and Age in Waveland
With 5.2% poverty level for males and 8.1% for females among the residents of Waveland, 12 to 14 year old males and 18 to 24 year old females are the most vulnerable to poverty, with 2 males (16.7%) and 5 females (19.2%) in their respective age groups living below the poverty level.
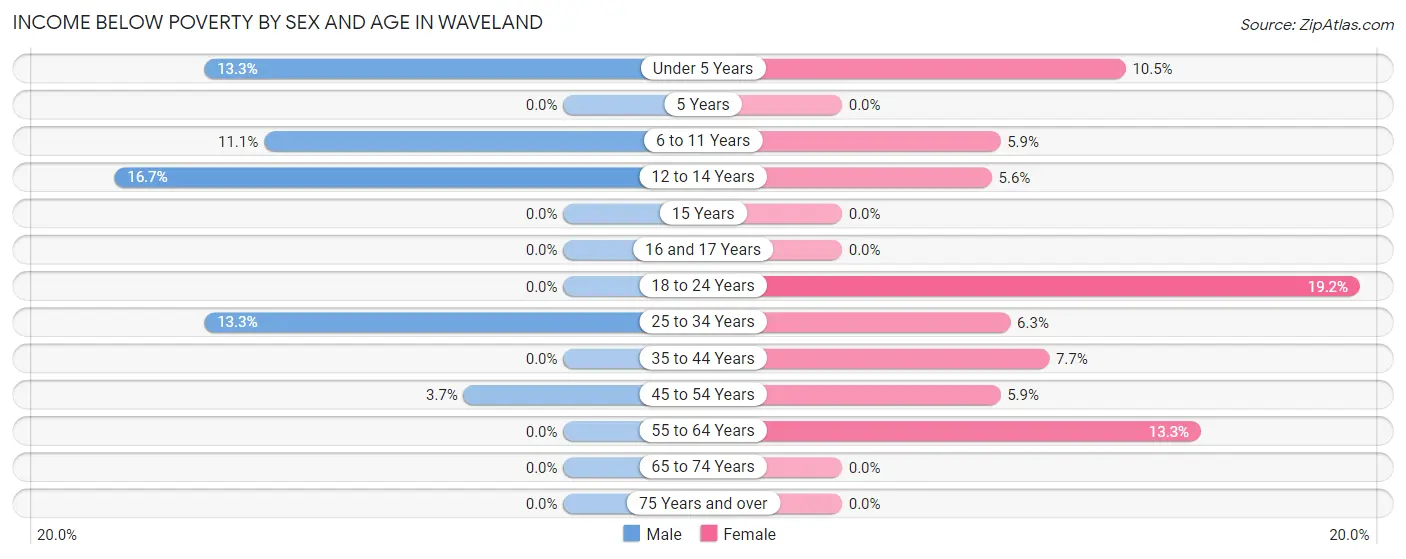
| Age Bracket | Male | Female |
| Under 5 Years | 2 (13.3%) | 2 (10.5%) |
| 5 Years | 0 (0.0%) | 0 (0.0%) |
| 6 to 11 Years | 3 (11.1%) | 1 (5.9%) |
| 12 to 14 Years | 2 (16.7%) | 1 (5.6%) |
| 15 Years | 0 (0.0%) | 0 (0.0%) |
| 16 and 17 Years | 0 (0.0%) | 0 (0.0%) |
| 18 to 24 Years | 0 (0.0%) | 5 (19.2%) |
| 25 to 34 Years | 2 (13.3%) | 1 (6.2%) |
| 35 to 44 Years | 0 (0.0%) | 3 (7.7%) |
| 45 to 54 Years | 1 (3.7%) | 1 (5.9%) |
| 55 to 64 Years | 0 (0.0%) | 2 (13.3%) |
| 65 to 74 Years | 0 (0.0%) | 0 (0.0%) |
| 75 Years and over | 0 (0.0%) | 0 (0.0%) |
| Total | 10 (5.2%) | 16 (8.1%) |
Income Above Poverty by Sex and Age in Waveland
According to the poverty statistics in Waveland, males aged 15 years and females aged 5 years are the age groups that are most secure financially, with 100.0% of males and 100.0% of females in these age groups living above the poverty line.
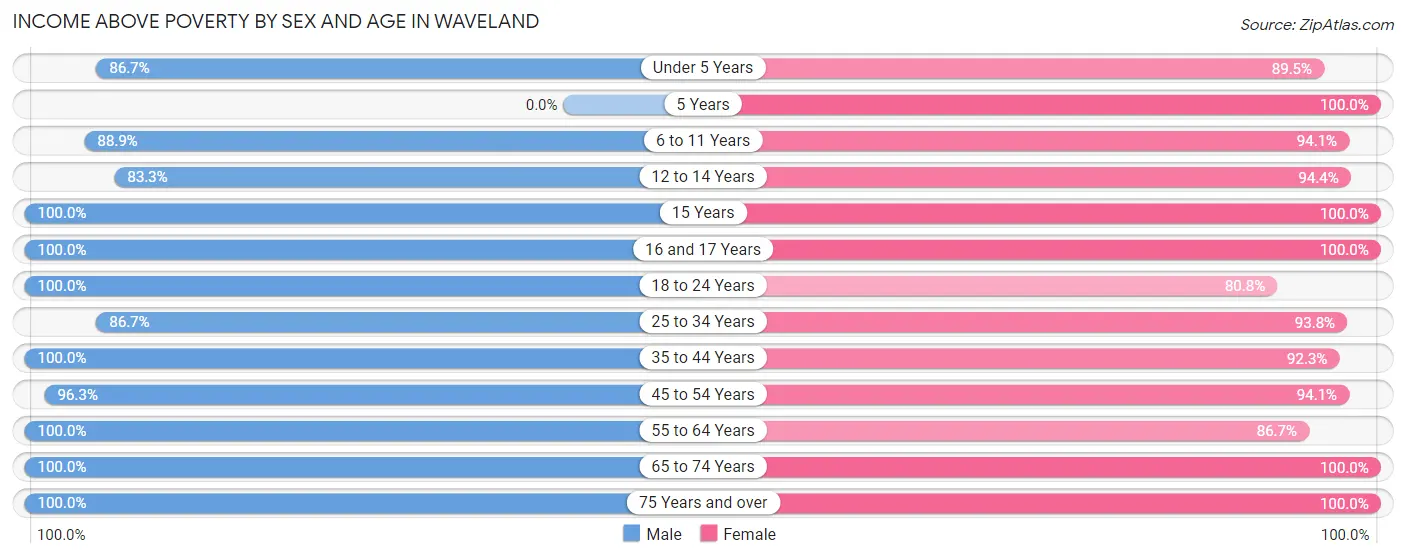
| Age Bracket | Male | Female |
| Under 5 Years | 13 (86.7%) | 17 (89.5%) |
| 5 Years | 0 (0.0%) | 1 (100.0%) |
| 6 to 11 Years | 24 (88.9%) | 16 (94.1%) |
| 12 to 14 Years | 10 (83.3%) | 17 (94.4%) |
| 15 Years | 6 (100.0%) | 2 (100.0%) |
| 16 and 17 Years | 7 (100.0%) | 3 (100.0%) |
| 18 to 24 Years | 16 (100.0%) | 21 (80.8%) |
| 25 to 34 Years | 13 (86.7%) | 15 (93.8%) |
| 35 to 44 Years | 26 (100.0%) | 36 (92.3%) |
| 45 to 54 Years | 26 (96.3%) | 16 (94.1%) |
| 55 to 64 Years | 6 (100.0%) | 13 (86.7%) |
| 65 to 74 Years | 20 (100.0%) | 8 (100.0%) |
| 75 Years and over | 15 (100.0%) | 16 (100.0%) |
| Total | 182 (94.8%) | 181 (91.9%) |
Income Below Poverty Among Married-Couple Families in Waveland
The poverty statistics for married-couple families in Waveland show that 2.7% or 2 of the total 74 families live below the poverty line. Families with 3 or 4 children have the highest poverty rate of 16.7%, comprising of 2 families. On the other hand, families with no children have the lowest poverty rate of 0.0%, which includes 0 families.

| Children | Above Poverty | Below Poverty |
| No Children | 26 (100.0%) | 0 (0.0%) |
| 1 or 2 Children | 27 (100.0%) | 0 (0.0%) |
| 3 or 4 Children | 10 (83.3%) | 2 (16.7%) |
| 5 or more Children | 9 (100.0%) | 0 (0.0%) |
| Total | 72 (97.3%) | 2 (2.7%) |
Income Below Poverty Among Single-Parent Households in Waveland
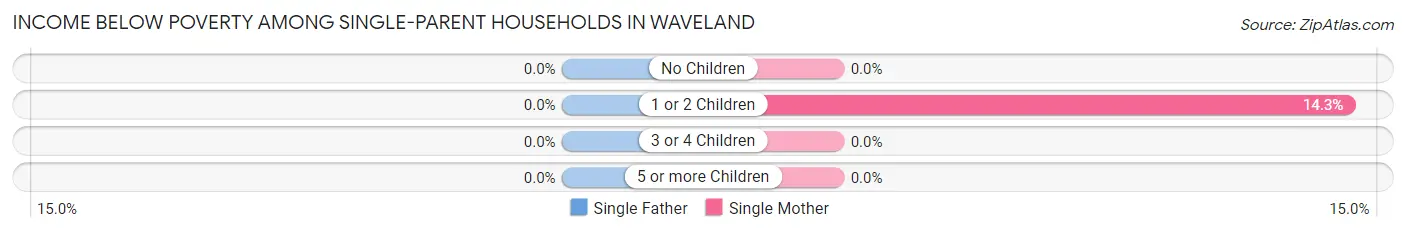
| Children | Single Father | Single Mother |
| No Children | 0 (0.0%) | 0 (0.0%) |
| 1 or 2 Children | 0 (0.0%) | 1 (14.3%) |
| 3 or 4 Children | 0 (0.0%) | 0 (0.0%) |
| 5 or more Children | 0 (0.0%) | 0 (0.0%) |
| Total | 0 (0.0%) | 1 (9.1%) |
Income Below Poverty Among Married-Couple vs Single-Parent Households in Waveland
The poverty data for Waveland shows that 2 of the married-couple family households (2.7%) and 1 of the single-parent households (5.6%) are living below the poverty level. Within the married-couple family households, those with 3 or 4 children have the highest poverty rate, with 2 households (16.7%) falling below the poverty line. Among the single-parent households, those with 1 or 2 children have the highest poverty rate, with 1 household (12.5%) living below poverty.
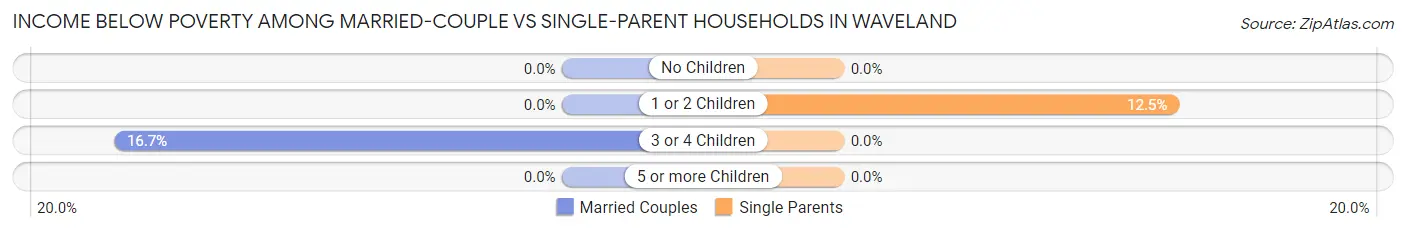
| Children | Married-Couple Families | Single-Parent Households |
| No Children | 0 (0.0%) | 0 (0.0%) |
| 1 or 2 Children | 0 (0.0%) | 1 (12.5%) |
| 3 or 4 Children | 2 (16.7%) | 0 (0.0%) |
| 5 or more Children | 0 (0.0%) | 0 (0.0%) |
| Total | 2 (2.7%) | 1 (5.6%) |
Race in Waveland
The most populous races in Waveland are White / Caucasian (355 | 91.3%), Two or more Races (32 | 8.2%), and Hispanic or Latino (3 | 0.8%).
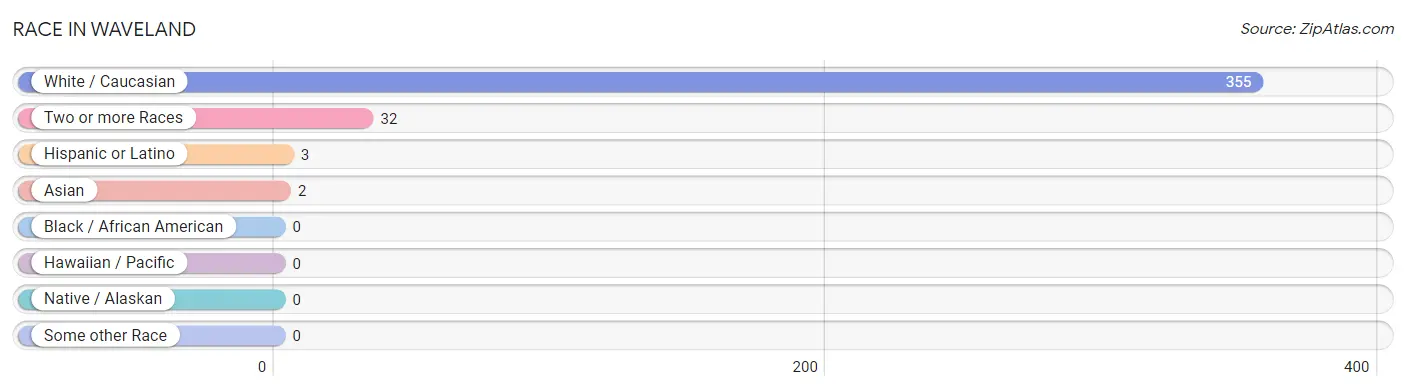
| Race | # Population | % Population |
| Asian | 2 | 0.5% |
| Black / African American | 0 | 0.0% |
| Hawaiian / Pacific | 0 | 0.0% |
| Hispanic or Latino | 3 | 0.8% |
| Native / Alaskan | 0 | 0.0% |
| White / Caucasian | 355 | 91.3% |
| Two or more Races | 32 | 8.2% |
| Some other Race | 0 | 0.0% |
| Total | 389 | 100.0% |
Ancestry in Waveland
The most populous ancestries reported in Waveland are German (82 | 21.1%), English (71 | 18.2%), American (51 | 13.1%), Irish (37 | 9.5%), and Cherokee (18 | 4.6%), together accounting for 66.6% of all Waveland residents.
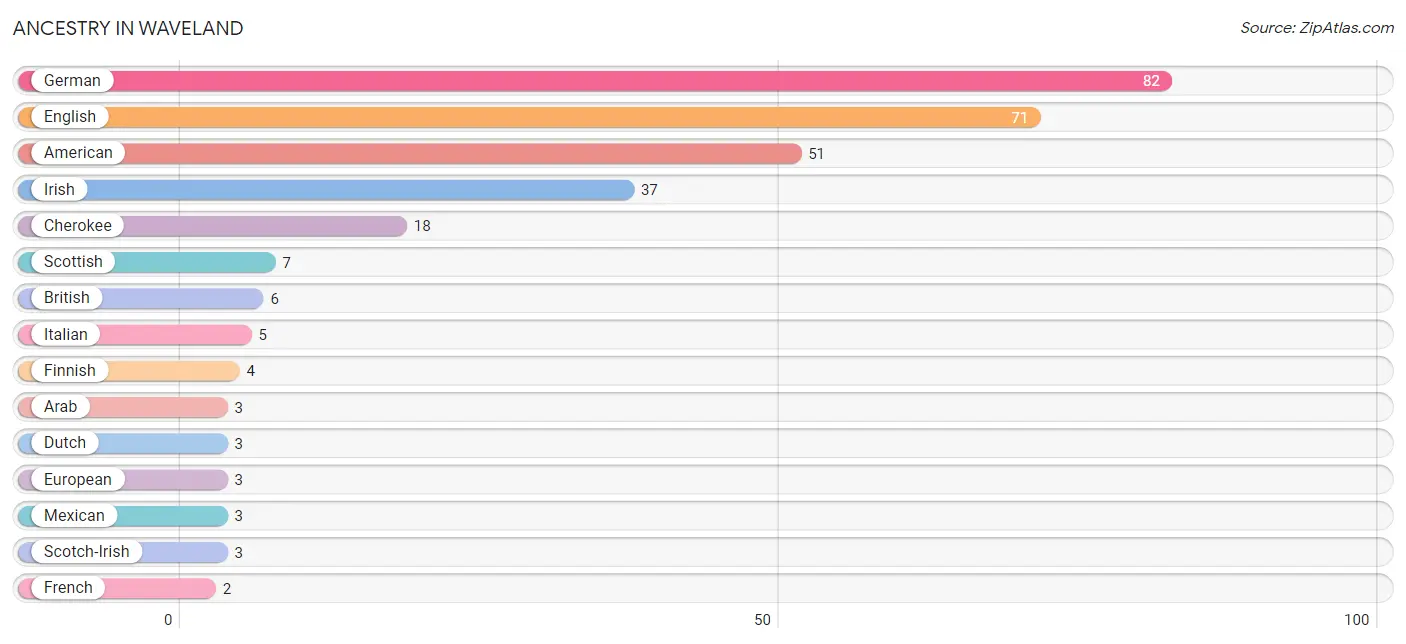
| Ancestry | # Population | % Population |
| American | 51 | 13.1% |
| Arab | 3 | 0.8% |
| British | 6 | 1.5% |
| Cherokee | 18 | 4.6% |
| Dutch | 3 | 0.8% |
| English | 71 | 18.2% |
| European | 3 | 0.8% |
| Finnish | 4 | 1.0% |
| French | 2 | 0.5% |
| German | 82 | 21.1% |
| Irish | 37 | 9.5% |
| Italian | 5 | 1.3% |
| Korean | 2 | 0.5% |
| Mexican | 3 | 0.8% |
| Scotch-Irish | 3 | 0.8% |
| Scottish | 7 | 1.8% | View All 16 Rows |
Immigrants in Waveland
The most numerous immigrant groups reported in Waveland came from Europe (4 | 1.0%), Germany (4 | 1.0%), Western Europe (4 | 1.0%), Asia (2 | 0.5%), and Philippines (2 | 0.5%), together accounting for 4.1% of all Waveland residents.
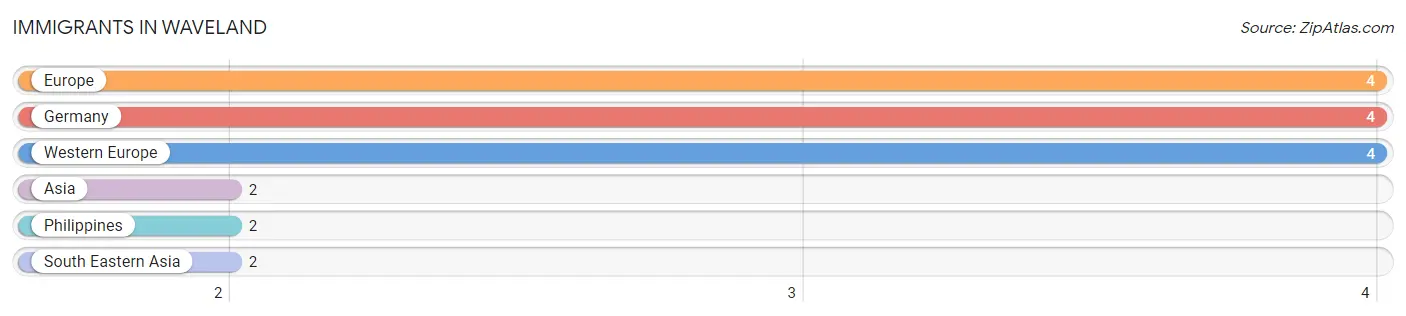
| Immigration Origin | # Population | % Population |
| Asia | 2 | 0.5% |
| Europe | 4 | 1.0% |
| Germany | 4 | 1.0% |
| Philippines | 2 | 0.5% |
| South Eastern Asia | 2 | 0.5% |
| Western Europe | 4 | 1.0% | View All 6 Rows |
Sex and Age in Waveland
Sex and Age in Waveland
The most populous age groups in Waveland are 5 to 9 Years (21 | 10.9%) for men and 40 to 44 Years (26 | 13.2%) for women.
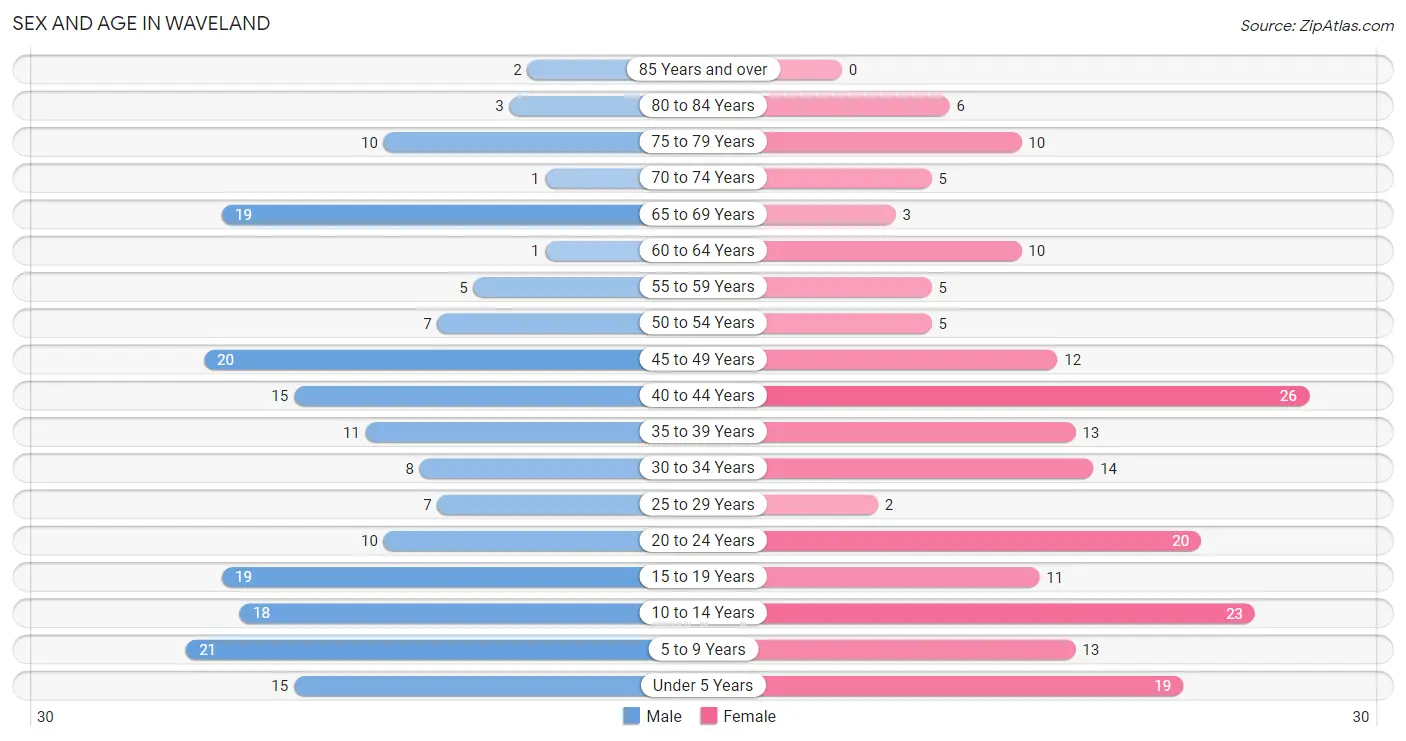
| Age Bracket | Male | Female |
| Under 5 Years | 15 (7.8%) | 19 (9.6%) |
| 5 to 9 Years | 21 (10.9%) | 13 (6.6%) |
| 10 to 14 Years | 18 (9.4%) | 23 (11.7%) |
| 15 to 19 Years | 19 (9.9%) | 11 (5.6%) |
| 20 to 24 Years | 10 (5.2%) | 20 (10.2%) |
| 25 to 29 Years | 7 (3.6%) | 2 (1.0%) |
| 30 to 34 Years | 8 (4.2%) | 14 (7.1%) |
| 35 to 39 Years | 11 (5.7%) | 13 (6.6%) |
| 40 to 44 Years | 15 (7.8%) | 26 (13.2%) |
| 45 to 49 Years | 20 (10.4%) | 12 (6.1%) |
| 50 to 54 Years | 7 (3.6%) | 5 (2.5%) |
| 55 to 59 Years | 5 (2.6%) | 5 (2.5%) |
| 60 to 64 Years | 1 (0.5%) | 10 (5.1%) |
| 65 to 69 Years | 19 (9.9%) | 3 (1.5%) |
| 70 to 74 Years | 1 (0.5%) | 5 (2.5%) |
| 75 to 79 Years | 10 (5.2%) | 10 (5.1%) |
| 80 to 84 Years | 3 (1.6%) | 6 (3.0%) |
| 85 Years and over | 2 (1.0%) | 0 (0.0%) |
| Total | 192 (100.0%) | 197 (100.0%) |
Families and Households in Waveland
Median Family Size in Waveland
The median family size in Waveland is 3.49 persons per family, with married-couple families (74 | 80.4%) accounting for the largest median family size of 3.72 persons per family. On the other hand, single female/mother families (11 | 12.0%) represent the smallest median family size with 2.36 persons per family.
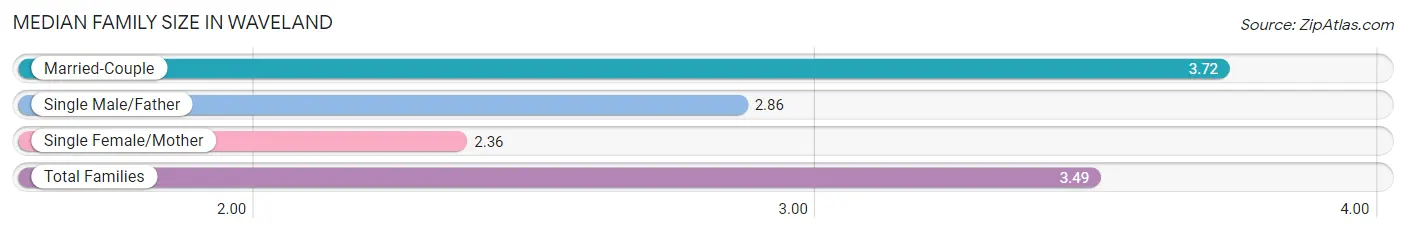
| Family Type | # Families | Family Size |
| Married-Couple | 74 (80.4%) | 3.72 |
| Single Male/Father | 7 (7.6%) | 2.86 |
| Single Female/Mother | 11 (12.0%) | 2.36 |
| Total Families | 92 (100.0%) | 3.49 |
Median Household Size in Waveland
The median household size in Waveland is 2.65 persons per household, with married-couple households (74 | 50.3%) accounting for the largest median household size of 3.73 persons per household. non-family households (55 | 37.4%) represent the smallest median household size with 1.15 persons per household.
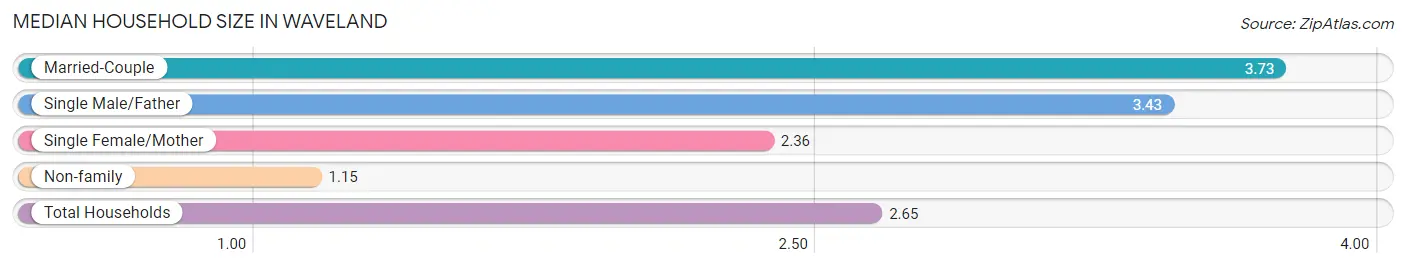
| Household Type | # Households | Household Size |
| Married-Couple | 74 (50.3%) | 3.73 |
| Single Male/Father | 7 (4.8%) | 3.43 |
| Single Female/Mother | 11 (7.5%) | 2.36 |
| Non-family | 55 (37.4%) | 1.15 |
| Total Households | 147 (100.0%) | 2.65 |
Household Size by Marriage Status in Waveland
Out of a total of 147 households in Waveland, 92 (62.6%) are family households, while 55 (37.4%) are nonfamily households. The most numerous type of family households are 2-person households, comprising 30, and the most common type of nonfamily households are 1-person households, comprising 49.
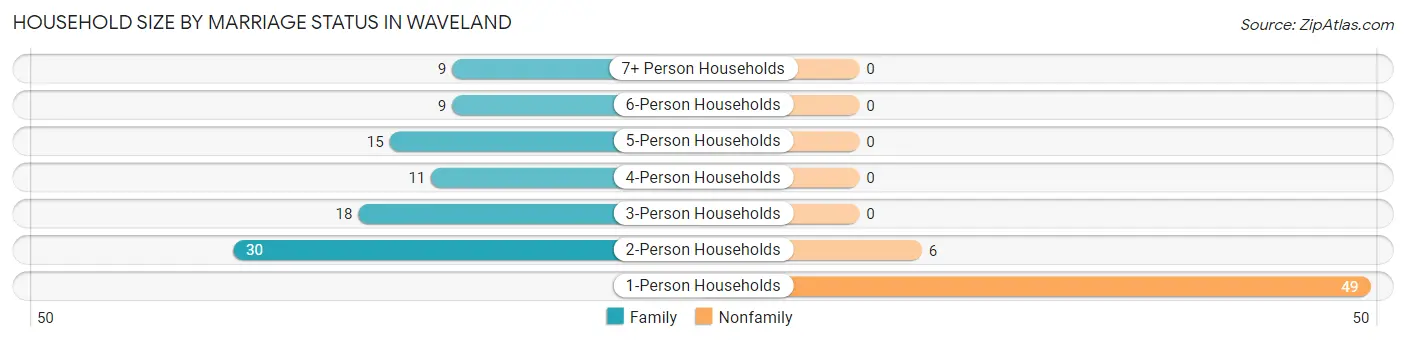
| Household Size | Family Households | Nonfamily Households |
| 1-Person Households | - | 49 (33.3%) |
| 2-Person Households | 30 (20.4%) | 6 (4.1%) |
| 3-Person Households | 18 (12.2%) | 0 (0.0%) |
| 4-Person Households | 11 (7.5%) | 0 (0.0%) |
| 5-Person Households | 15 (10.2%) | 0 (0.0%) |
| 6-Person Households | 9 (6.1%) | 0 (0.0%) |
| 7+ Person Households | 9 (6.1%) | 0 (0.0%) |
| Total | 92 (62.6%) | 55 (37.4%) |
Female Fertility in Waveland
Fertility by Age in Waveland
Average fertility rate in Waveland is 31.0 births per 1,000 women. Women in the age bracket of 15 to 19 years have the highest fertility rate with 182.0 births per 1,000 women. Women in the age bracket of 15 to 19 years acount for 66.7% of all women with births.
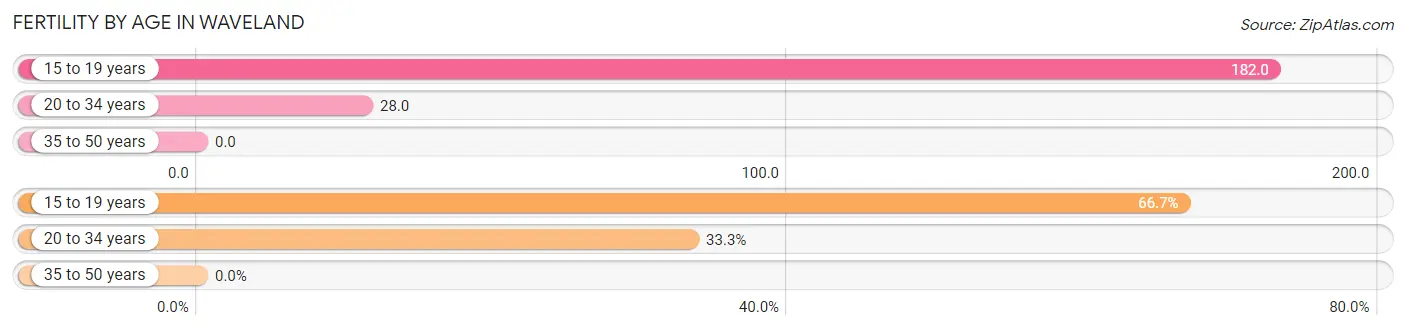
| Age Bracket | Women with Births | Births / 1,000 Women |
| 15 to 19 years | 2 (66.7%) | 182.0 |
| 20 to 34 years | 1 (33.3%) | 28.0 |
| 35 to 50 years | 0 (0.0%) | 0.0 |
| Total | 3 (100.0%) | 31.0 |
Fertility by Age by Marriage Status in Waveland
33.3% of women with births (3) in Waveland are married. The highest percentage of unmarried women with births falls into 15 to 19 years age bracket with 100.0% of them unmarried at the time of birth, while the lowest percentage of unmarried women with births belong to 20 to 34 years age bracket with 0.0% of them unmarried.
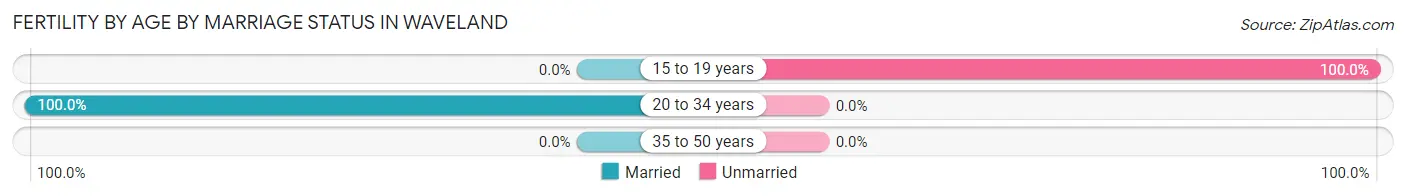
| Age Bracket | Married | Unmarried |
| 15 to 19 years | 0 (0.0%) | 2 (100.0%) |
| 20 to 34 years | 1 (100.0%) | 0 (0.0%) |
| 35 to 50 years | 0 (0.0%) | 0 (0.0%) |
| Total | 1 (33.3%) | 2 (66.7%) |
Fertility by Education in Waveland
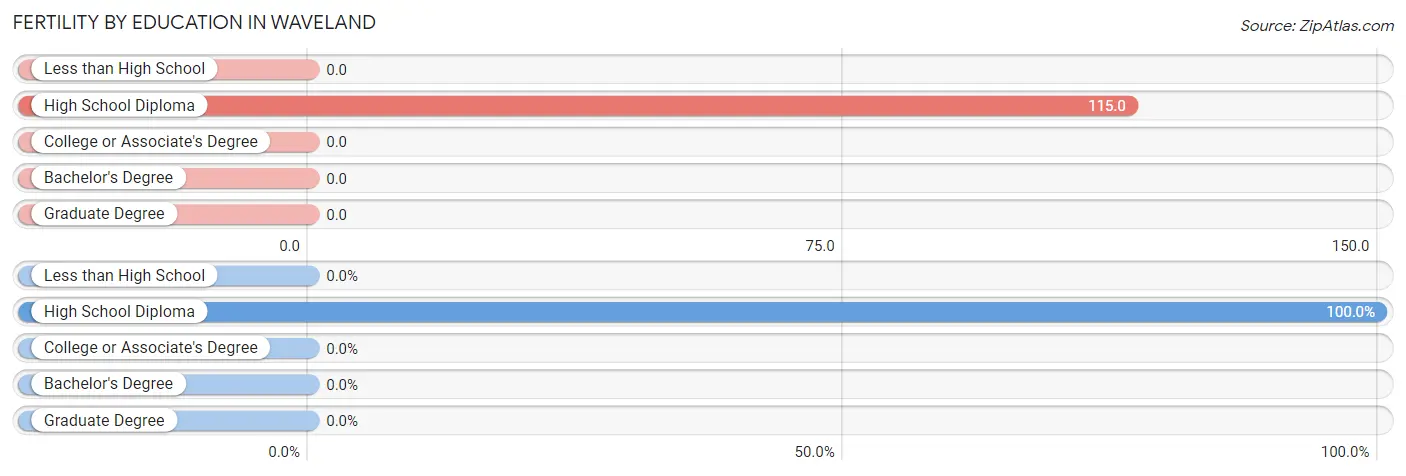
| Educational Attainment | Women with Births | Births / 1,000 Women |
| Less than High School | 0 (0.0%) | 0.0 |
| High School Diploma | 3 (100.0%) | 115.0 |
| College or Associate's Degree | 0 (0.0%) | 0.0 |
| Bachelor's Degree | 0 (0.0%) | 0.0 |
| Graduate Degree | 0 (0.0%) | 0.0 |
| Total | 3 (100.0%) | 31.0 |
Fertility by Education by Marriage Status in Waveland
66.7% of women with births in Waveland are unmarried. Women with the educational attainment of high school diploma are most likely to be married with 33.3% of them married at childbirth, while women with the educational attainment of high school diploma are least likely to be married with 66.7% of them unmarried at childbirth.
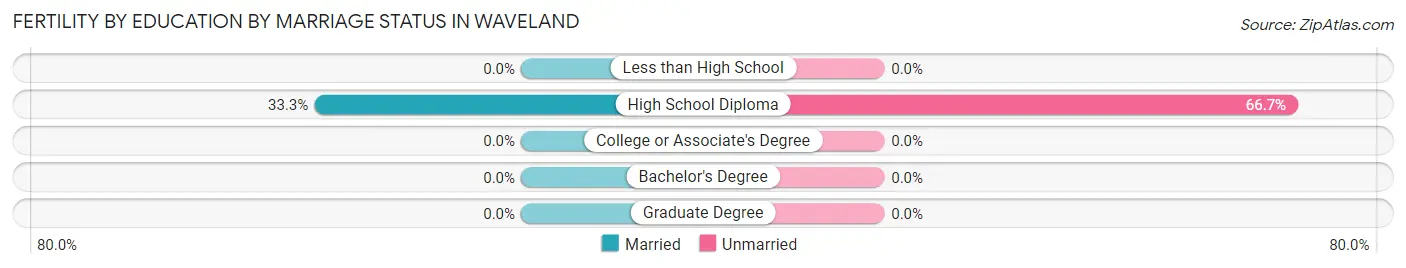
| Educational Attainment | Married | Unmarried |
| Less than High School | 0 (0.0%) | 0 (0.0%) |
| High School Diploma | 1 (33.3%) | 2 (66.7%) |
| College or Associate's Degree | 0 (0.0%) | 0 (0.0%) |
| Bachelor's Degree | 0 (0.0%) | 0 (0.0%) |
| Graduate Degree | 0 (0.0%) | 0 (0.0%) |
| Total | 1 (33.3%) | 2 (66.7%) |
Employment Characteristics in Waveland
Employment by Class of Employer in Waveland
Among the 171 employed individuals in Waveland, private company employees (138 | 80.7%), not-for-profit organizations (19 | 11.1%), and local government employees (7 | 4.1%) make up the most common classes of employment.
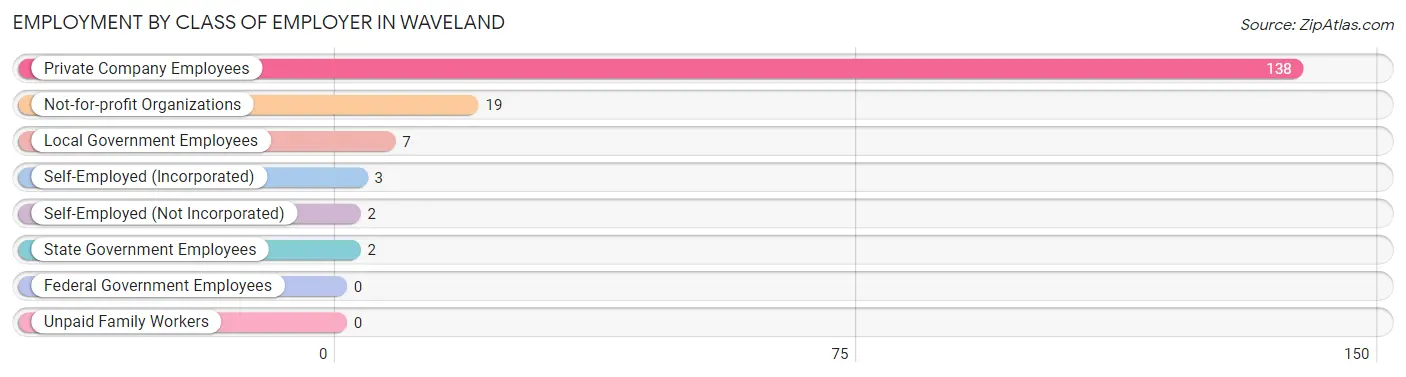
| Employer Class | # Employees | % Employees |
| Private Company Employees | 138 | 80.7% |
| Self-Employed (Incorporated) | 3 | 1.8% |
| Self-Employed (Not Incorporated) | 2 | 1.2% |
| Not-for-profit Organizations | 19 | 11.1% |
| Local Government Employees | 7 | 4.1% |
| State Government Employees | 2 | 1.2% |
| Federal Government Employees | 0 | 0.0% |
| Unpaid Family Workers | 0 | 0.0% |
| Total | 171 | 100.0% |
Employment Status by Age in Waveland
According to the labor force statistics for Waveland, out of the total population over 16 years of age (272), 72.1% or 196 individuals are in the labor force, with 6.6% or 13 of them unemployed. The age group with the highest labor force participation rate is 35 to 44 years, with 93.8% or 61 individuals in the labor force. Within the labor force, the 16 to 19 years age range has the highest percentage of unemployed individuals, with 25.0% or 3 of them being unemployed.
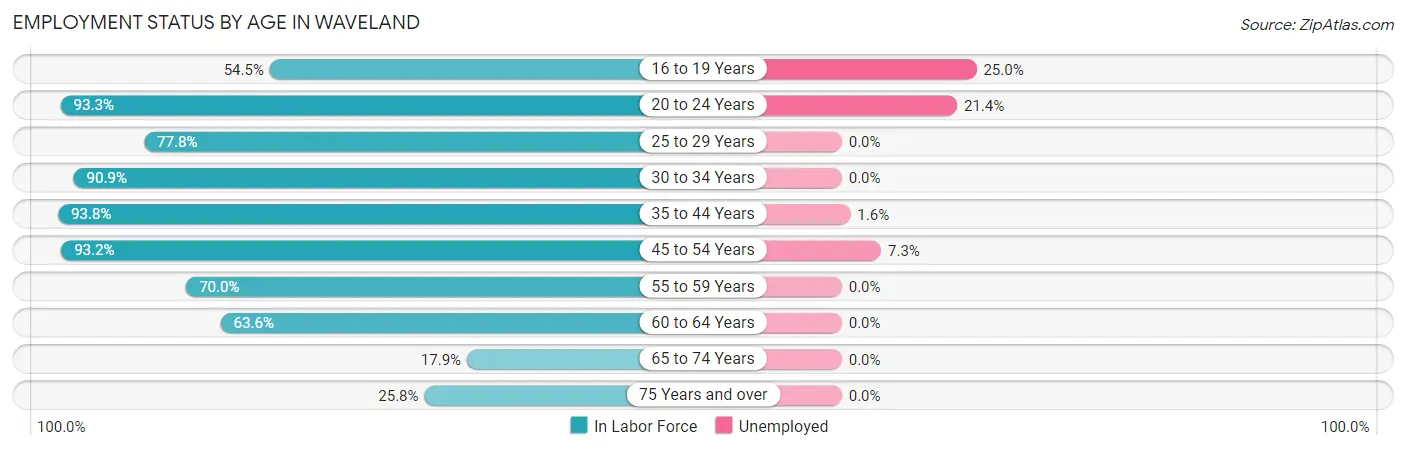
| Age Bracket | In Labor Force | Unemployed |
| 16 to 19 Years | 12 (54.5%) | 3 (25.0%) |
| 20 to 24 Years | 28 (93.3%) | 6 (21.4%) |
| 25 to 29 Years | 7 (77.8%) | 0 (0.0%) |
| 30 to 34 Years | 20 (90.9%) | 0 (0.0%) |
| 35 to 44 Years | 61 (93.8%) | 1 (1.6%) |
| 45 to 54 Years | 41 (93.2%) | 3 (7.3%) |
| 55 to 59 Years | 7 (70.0%) | 0 (0.0%) |
| 60 to 64 Years | 7 (63.6%) | 0 (0.0%) |
| 65 to 74 Years | 5 (17.9%) | 0 (0.0%) |
| 75 Years and over | 8 (25.8%) | 0 (0.0%) |
| Total | 196 (72.1%) | 13 (6.6%) |
Employment Status by Educational Attainment in Waveland
According to labor force statistics for Waveland, 88.8% of individuals (143) out of the total population between 25 and 64 years of age (161) are in the labor force, with 2.8% or 4 of them being unemployed. The group with the highest labor force participation rate are those with the educational attainment of high school diploma, with 96.7% or 58 individuals in the labor force. Within the labor force, individuals with college / associate degree education have the highest percentage of unemployment, with 7.7% or 4 of them being unemployed.
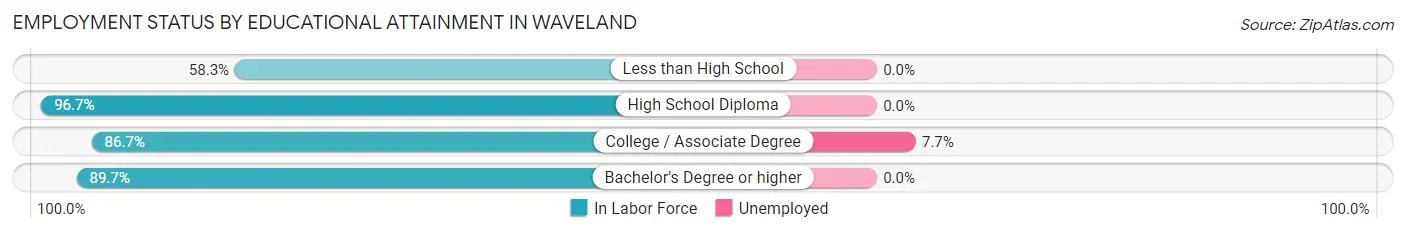
| Educational Attainment | In Labor Force | Unemployed |
| Less than High School | 7 (58.3%) | 0 (0.0%) |
| High School Diploma | 58 (96.7%) | 0 (0.0%) |
| College / Associate Degree | 52 (86.7%) | 5 (7.7%) |
| Bachelor's Degree or higher | 26 (89.7%) | 0 (0.0%) |
| Total | 143 (88.8%) | 5 (2.8%) |
Employment Occupations by Sex in Waveland
Management, Business, Science and Arts Occupations
The most common Management, Business, Science and Arts occupations in Waveland are Community & Social Service (22 | 12.0%), Education Instruction & Library (15 | 8.2%), Management (14 | 7.6%), Health Diagnosing & Treating (13 | 7.1%), and Health Technologists (8 | 4.4%).
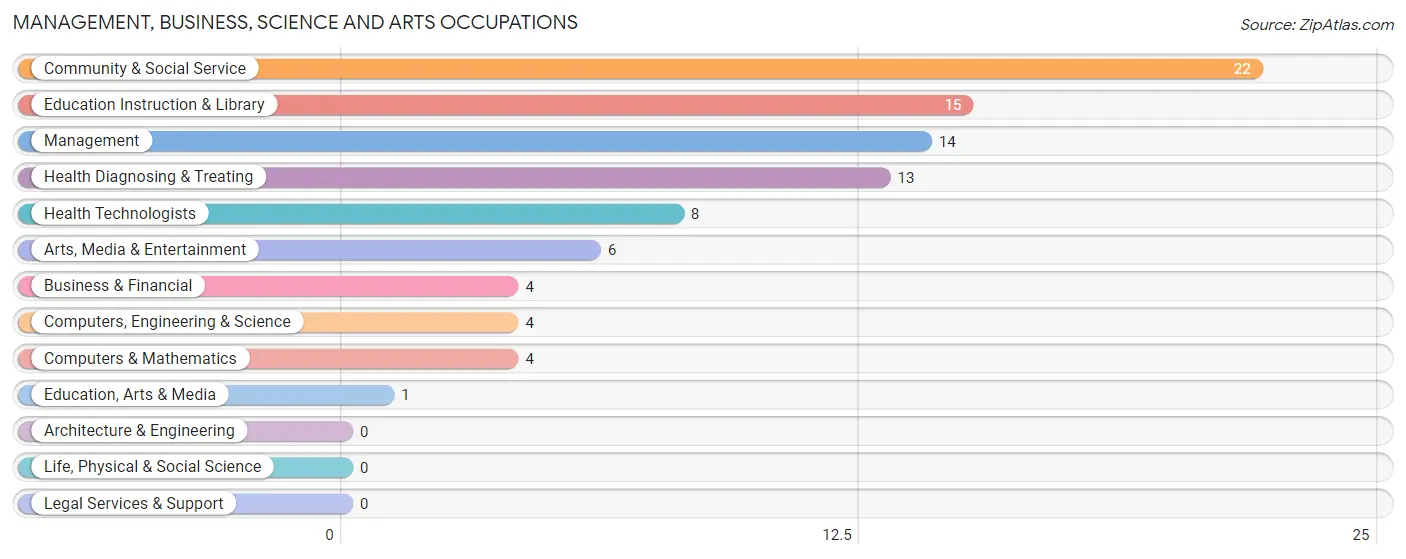
Management, Business, Science and Arts Occupations by Sex
Within the Management, Business, Science and Arts occupations in Waveland, the most male-oriented occupations are Computers, Engineering & Science (100.0%), Computers & Mathematics (100.0%), and Education, Arts & Media (100.0%), while the most female-oriented occupations are Health Diagnosing & Treating (84.6%), Health Technologists (75.0%), and Education Instruction & Library (53.3%).
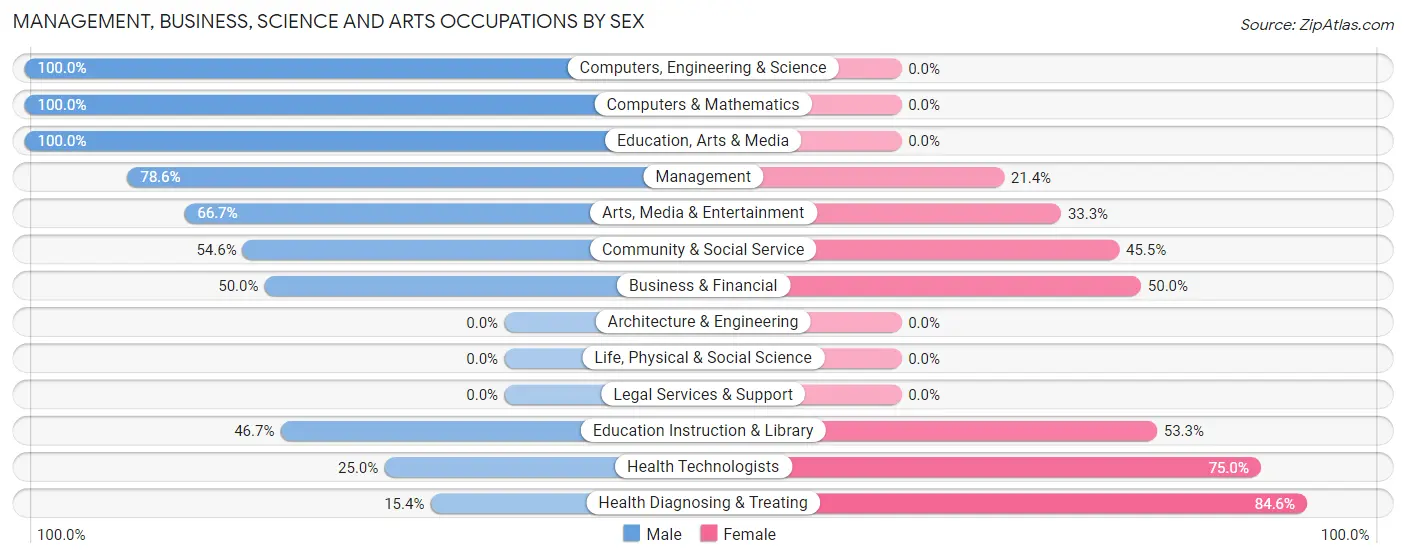
| Occupation | Male | Female |
| Management | 11 (78.6%) | 3 (21.4%) |
| Business & Financial | 2 (50.0%) | 2 (50.0%) |
| Computers, Engineering & Science | 4 (100.0%) | 0 (0.0%) |
| Computers & Mathematics | 4 (100.0%) | 0 (0.0%) |
| Architecture & Engineering | 0 (0.0%) | 0 (0.0%) |
| Life, Physical & Social Science | 0 (0.0%) | 0 (0.0%) |
| Community & Social Service | 12 (54.5%) | 10 (45.5%) |
| Education, Arts & Media | 1 (100.0%) | 0 (0.0%) |
| Legal Services & Support | 0 (0.0%) | 0 (0.0%) |
| Education Instruction & Library | 7 (46.7%) | 8 (53.3%) |
| Arts, Media & Entertainment | 4 (66.7%) | 2 (33.3%) |
| Health Diagnosing & Treating | 2 (15.4%) | 11 (84.6%) |
| Health Technologists | 2 (25.0%) | 6 (75.0%) |
| Total (Category) | 31 (54.4%) | 26 (45.6%) |
| Total (Overall) | 93 (50.8%) | 90 (49.2%) |
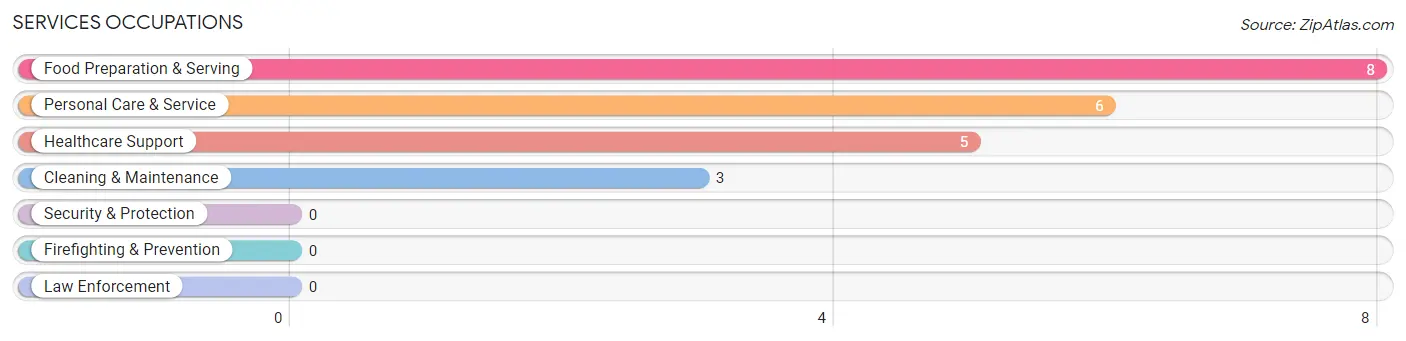
Services Occupations
The most common Services occupations in Waveland are Food Preparation & Serving (8 | 4.4%), Personal Care & Service (6 | 3.3%), Healthcare Support (5 | 2.7%), and Cleaning & Maintenance (3 | 1.6%).
Services Occupations by Sex
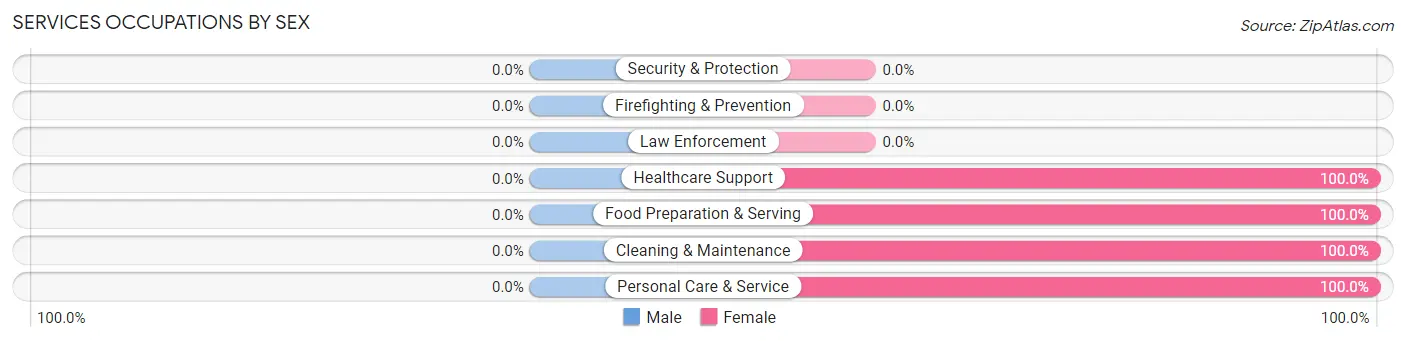
| Occupation | Male | Female |
| Healthcare Support | 0 (0.0%) | 5 (100.0%) |
| Security & Protection | 0 (0.0%) | 0 (0.0%) |
| Firefighting & Prevention | 0 (0.0%) | 0 (0.0%) |
| Law Enforcement | 0 (0.0%) | 0 (0.0%) |
| Food Preparation & Serving | 0 (0.0%) | 8 (100.0%) |
| Cleaning & Maintenance | 0 (0.0%) | 3 (100.0%) |
| Personal Care & Service | 0 (0.0%) | 6 (100.0%) |
| Total (Category) | 0 (0.0%) | 22 (100.0%) |
| Total (Overall) | 93 (50.8%) | 90 (49.2%) |
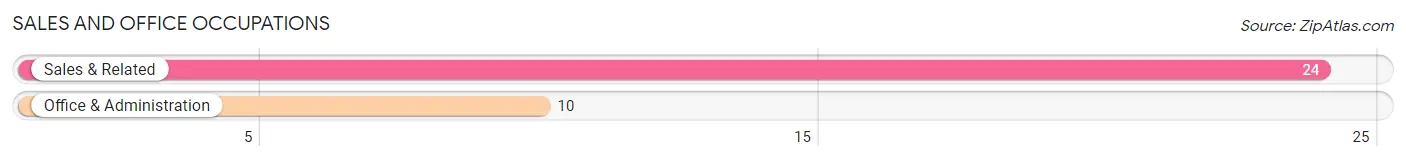
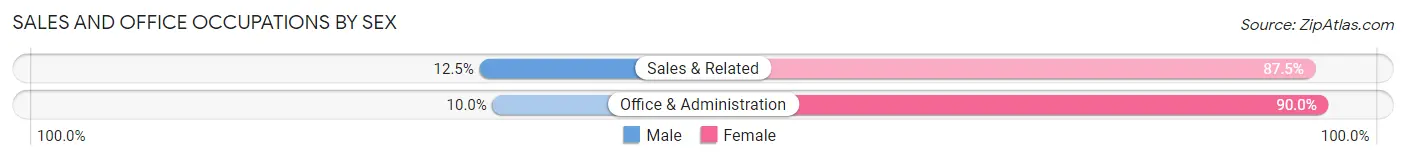
Sales and Office Occupations
The most common Sales and Office occupations in Waveland are Sales & Related (24 | 13.1%), and Office & Administration (10 | 5.5%).
Sales and Office Occupations by Sex
| Occupation | Male | Female |
| Sales & Related | 3 (12.5%) | 21 (87.5%) |
| Office & Administration | 1 (10.0%) | 9 (90.0%) |
| Total (Category) | 4 (11.8%) | 30 (88.2%) |
| Total (Overall) | 93 (50.8%) | 90 (49.2%) |
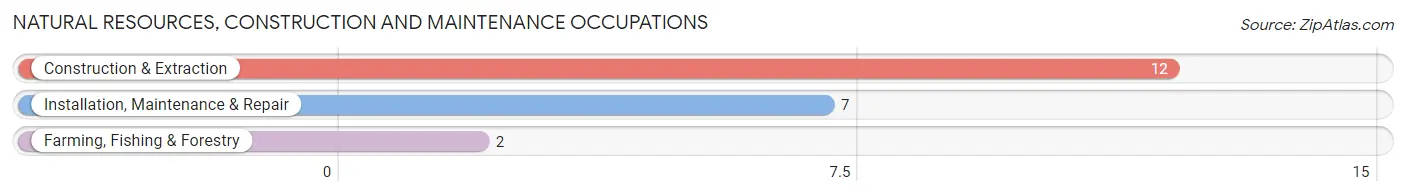
Natural Resources, Construction and Maintenance Occupations
The most common Natural Resources, Construction and Maintenance occupations in Waveland are Construction & Extraction (12 | 6.6%), Installation, Maintenance & Repair (7 | 3.8%), and Farming, Fishing & Forestry (2 | 1.1%).
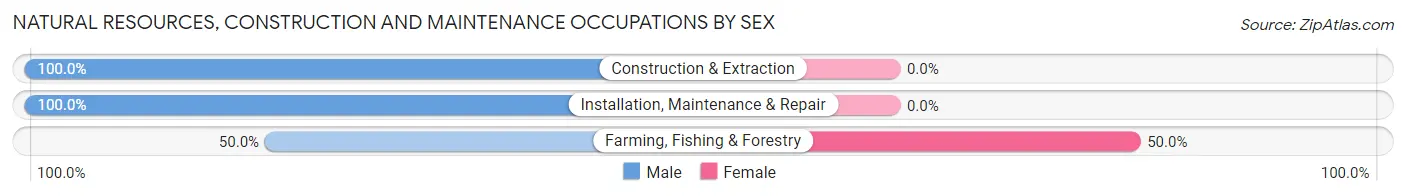
Natural Resources, Construction and Maintenance Occupations by Sex
| Occupation | Male | Female |
| Farming, Fishing & Forestry | 1 (50.0%) | 1 (50.0%) |
| Construction & Extraction | 12 (100.0%) | 0 (0.0%) |
| Installation, Maintenance & Repair | 7 (100.0%) | 0 (0.0%) |
| Total (Category) | 20 (95.2%) | 1 (4.8%) |
| Total (Overall) | 93 (50.8%) | 90 (49.2%) |
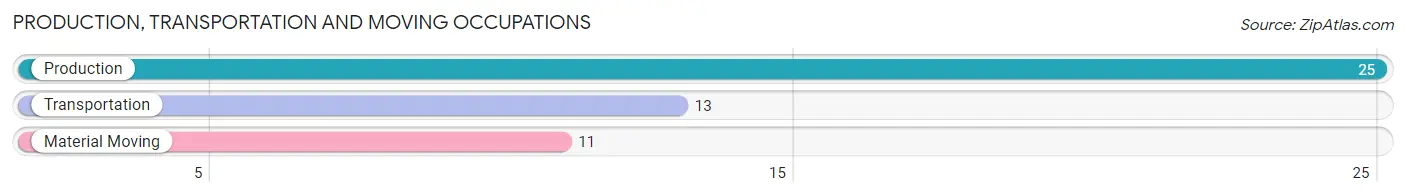
Production, Transportation and Moving Occupations
The most common Production, Transportation and Moving occupations in Waveland are Production (25 | 13.7%), Transportation (13 | 7.1%), and Material Moving (11 | 6.0%).
Production, Transportation and Moving Occupations by Sex
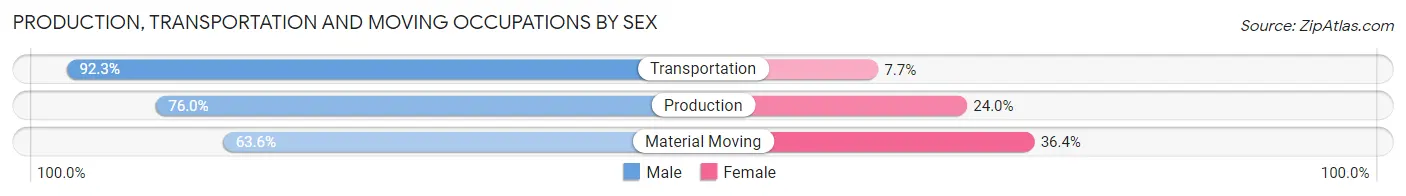
| Occupation | Male | Female |
| Production | 19 (76.0%) | 6 (24.0%) |
| Transportation | 12 (92.3%) | 1 (7.7%) |
| Material Moving | 7 (63.6%) | 4 (36.4%) |
| Total (Category) | 38 (77.5%) | 11 (22.5%) |
| Total (Overall) | 93 (50.8%) | 90 (49.2%) |
Employment Industries by Sex in Waveland
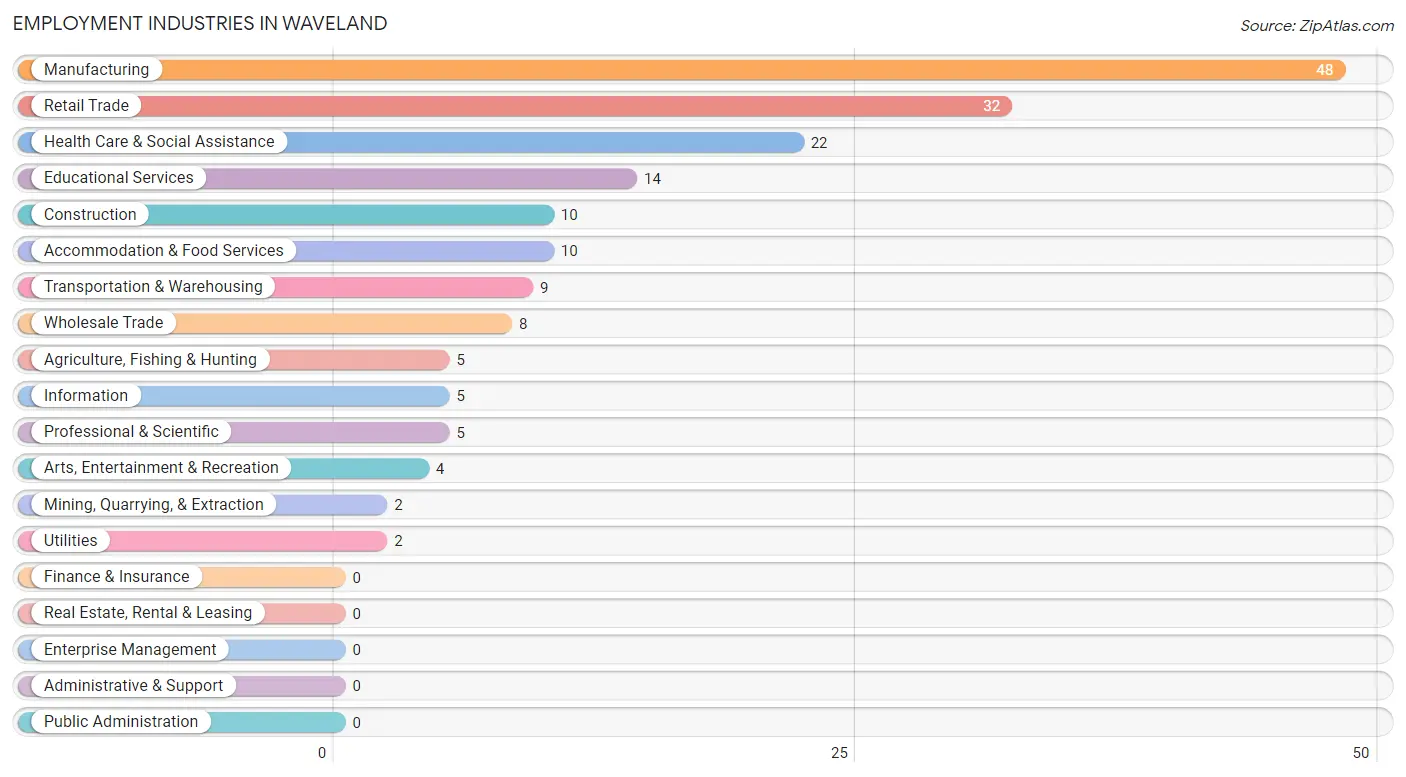
Employment Industries in Waveland
The major employment industries in Waveland include Manufacturing (48 | 26.2%), Retail Trade (32 | 17.5%), Health Care & Social Assistance (22 | 12.0%), Educational Services (14 | 7.6%), and Construction (10 | 5.5%).
Employment Industries by Sex in Waveland
The Waveland industries that see more men than women are Agriculture, Fishing & Hunting (100.0%), Mining, Quarrying, & Extraction (100.0%), and Transportation & Warehousing (88.9%), whereas the industries that tend to have a higher number of women are Utilities (100.0%), Health Care & Social Assistance (90.9%), and Accommodation & Food Services (90.0%).

| Industry | Male | Female |
| Agriculture, Fishing & Hunting | 5 (100.0%) | 0 (0.0%) |
| Mining, Quarrying, & Extraction | 2 (100.0%) | 0 (0.0%) |
| Construction | 8 (80.0%) | 2 (20.0%) |
| Manufacturing | 40 (83.3%) | 8 (16.7%) |
| Wholesale Trade | 5 (62.5%) | 3 (37.5%) |
| Retail Trade | 4 (12.5%) | 28 (87.5%) |
| Transportation & Warehousing | 8 (88.9%) | 1 (11.1%) |
| Utilities | 0 (0.0%) | 2 (100.0%) |
| Information | 4 (80.0%) | 1 (20.0%) |
| Finance & Insurance | 0 (0.0%) | 0 (0.0%) |
| Real Estate, Rental & Leasing | 0 (0.0%) | 0 (0.0%) |
| Professional & Scientific | 4 (80.0%) | 1 (20.0%) |
| Enterprise Management | 0 (0.0%) | 0 (0.0%) |
| Administrative & Support | 0 (0.0%) | 0 (0.0%) |
| Educational Services | 7 (50.0%) | 7 (50.0%) |
| Health Care & Social Assistance | 2 (9.1%) | 20 (90.9%) |
| Arts, Entertainment & Recreation | 2 (50.0%) | 2 (50.0%) |
| Accommodation & Food Services | 1 (10.0%) | 9 (90.0%) |
| Public Administration | 0 (0.0%) | 0 (0.0%) |
| Total | 93 (50.8%) | 90 (49.2%) |
Education in Waveland
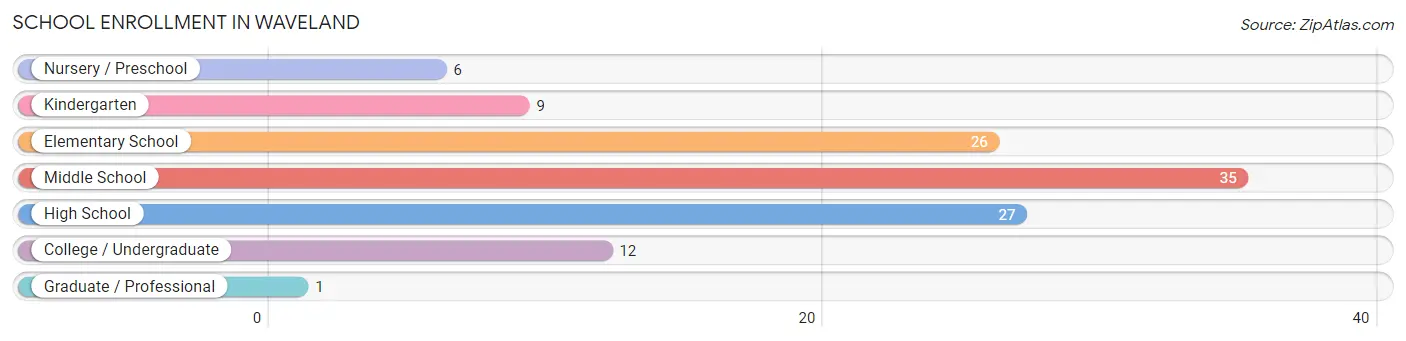
School Enrollment in Waveland
The most common levels of schooling among the 116 students in Waveland are middle school (35 | 30.2%), high school (27 | 23.3%), and elementary school (26 | 22.4%).
| School Level | # Students | % Students |
| Nursery / Preschool | 6 | 5.2% |
| Kindergarten | 9 | 7.8% |
| Elementary School | 26 | 22.4% |
| Middle School | 35 | 30.2% |
| High School | 27 | 23.3% |
| College / Undergraduate | 12 | 10.3% |
| Graduate / Professional | 1 | 0.9% |
| Total | 116 | 100.0% |
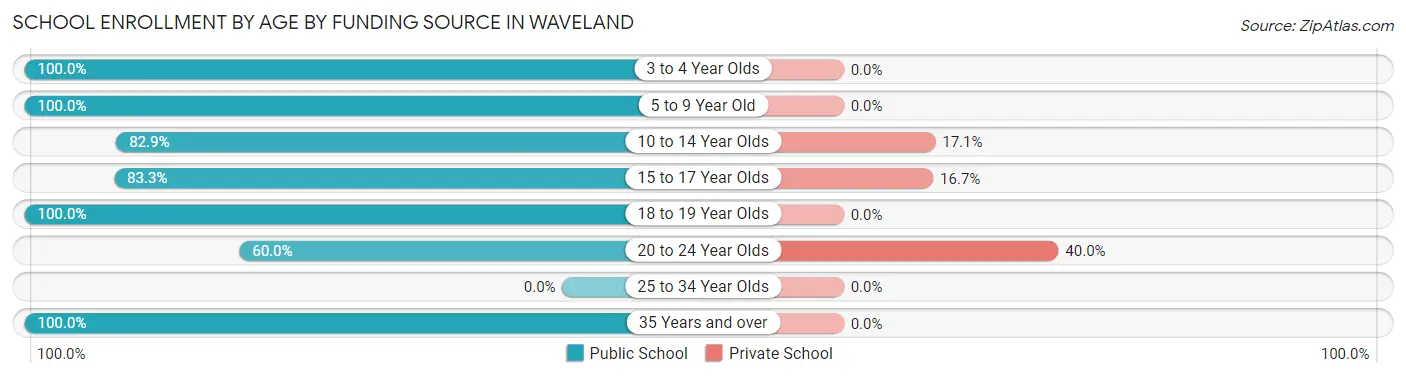
School Enrollment by Age by Funding Source in Waveland
Out of a total of 116 students who are enrolled in schools in Waveland, 12 (10.3%) attend a private institution, while the remaining 104 (89.7%) are enrolled in public schools. The age group of 20 to 24 year olds has the highest likelihood of being enrolled in private schools, with 2 (40.0% in the age bracket) enrolled. Conversely, the age group of 3 to 4 year olds has the lowest likelihood of being enrolled in a private school, with 6 (100.0% in the age bracket) attending a public institution.
| Age Bracket | Public School | Private School |
| 3 to 4 Year Olds | 6 (100.0%) | 0 (0.0%) |
| 5 to 9 Year Old | 32 (100.0%) | 0 (0.0%) |
| 10 to 14 Year Olds | 34 (82.9%) | 7 (17.1%) |
| 15 to 17 Year Olds | 15 (83.3%) | 3 (16.7%) |
| 18 to 19 Year Olds | 7 (100.0%) | 0 (0.0%) |
| 20 to 24 Year Olds | 3 (60.0%) | 2 (40.0%) |
| 25 to 34 Year Olds | 0 (0.0%) | 0 (0.0%) |
| 35 Years and over | 7 (100.0%) | 0 (0.0%) |
| Total | 104 (89.7%) | 12 (10.3%) |
Educational Attainment by Field of Study in Waveland
Education (15 | 33.3%), science & technology (8 | 17.8%), business (7 | 15.6%), bio, nature & agricultural (6 | 13.3%), and arts & humanities (3 | 6.7%) are the most common fields of study among 45 individuals in Waveland who have obtained a bachelor's degree or higher.
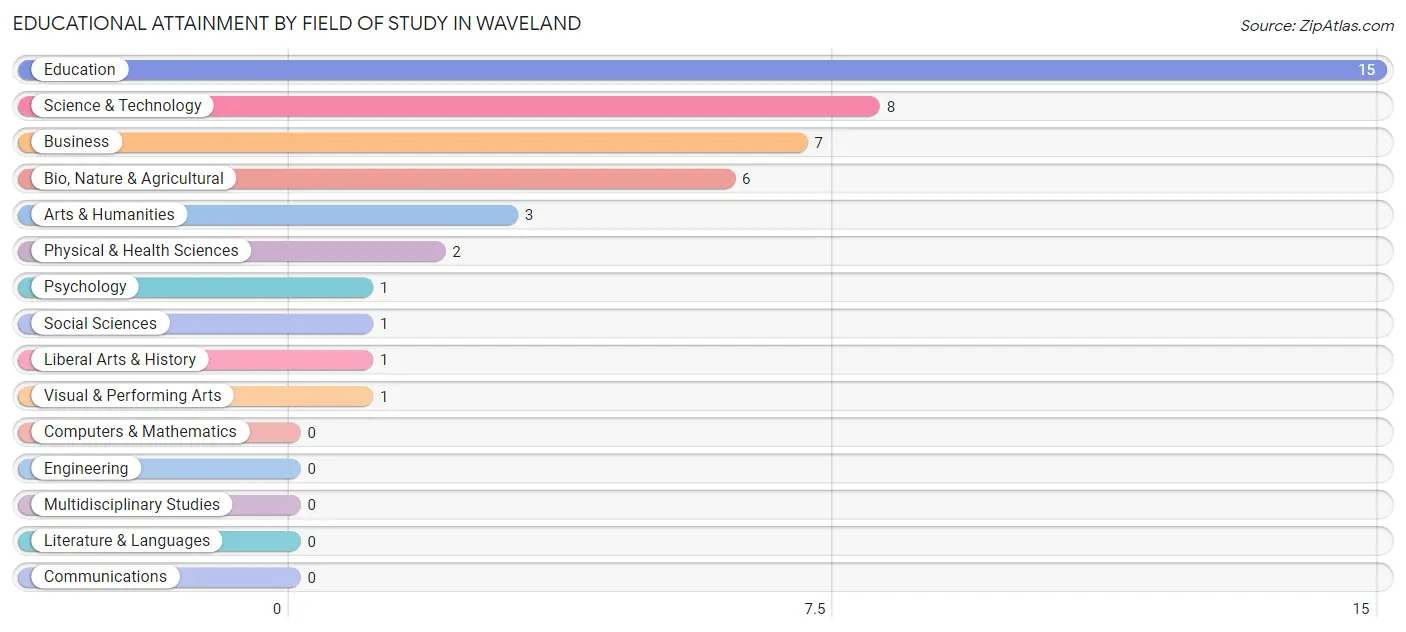
| Field of Study | # Graduates | % Graduates |
| Computers & Mathematics | 0 | 0.0% |
| Bio, Nature & Agricultural | 6 | 13.3% |
| Physical & Health Sciences | 2 | 4.4% |
| Psychology | 1 | 2.2% |
| Social Sciences | 1 | 2.2% |
| Engineering | 0 | 0.0% |
| Multidisciplinary Studies | 0 | 0.0% |
| Science & Technology | 8 | 17.8% |
| Business | 7 | 15.6% |
| Education | 15 | 33.3% |
| Literature & Languages | 0 | 0.0% |
| Liberal Arts & History | 1 | 2.2% |
| Visual & Performing Arts | 1 | 2.2% |
| Communications | 0 | 0.0% |
| Arts & Humanities | 3 | 6.7% |
| Total | 45 | 100.0% |
Transportation & Commute in Waveland
Vehicle Availability by Sex in Waveland
The most prevalent vehicle ownership categories in Waveland are males with 3 vehicles (33, accounting for 36.7%) and females with 3 vehicles (22, making up 40.7%).
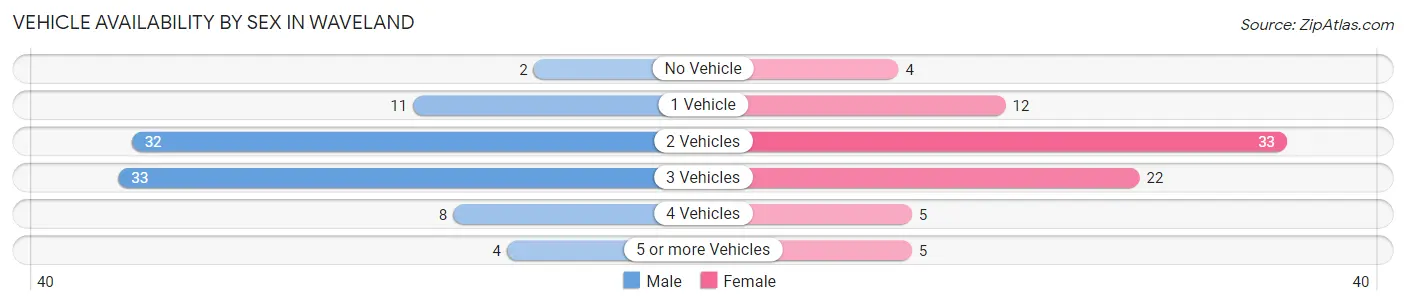
| Vehicles Available | Male | Female |
| No Vehicle | 2 (2.2%) | 4 (4.9%) |
| 1 Vehicle | 11 (12.2%) | 12 (14.8%) |
| 2 Vehicles | 32 (35.6%) | 33 (40.7%) |
| 3 Vehicles | 33 (36.7%) | 22 (27.2%) |
| 4 Vehicles | 8 (8.9%) | 5 (6.2%) |
| 5 or more Vehicles | 4 (4.4%) | 5 (6.2%) |
| Total | 90 (100.0%) | 81 (100.0%) |
Commute Time in Waveland
The most frequently occuring commute durations in Waveland are 20 to 24 minutes (50 commuters, 29.9%), 30 to 34 minutes (32 commuters, 19.2%), and 25 to 29 minutes (23 commuters, 13.8%).
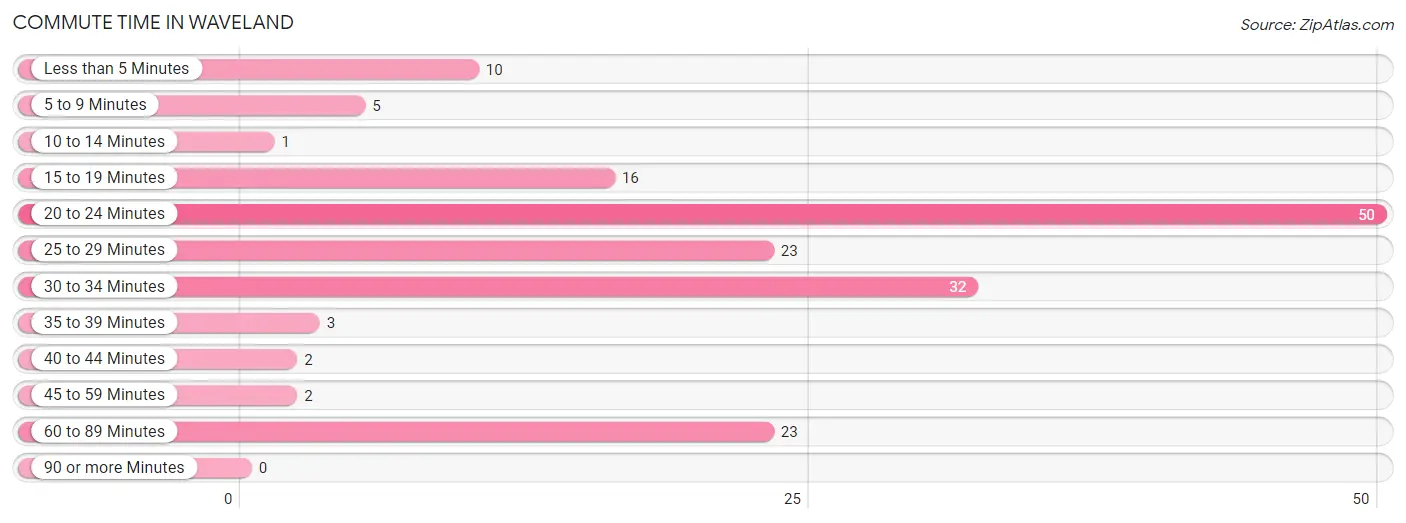
| Commute Time | # Commuters | % Commuters |
| Less than 5 Minutes | 10 | 6.0% |
| 5 to 9 Minutes | 5 | 3.0% |
| 10 to 14 Minutes | 1 | 0.6% |
| 15 to 19 Minutes | 16 | 9.6% |
| 20 to 24 Minutes | 50 | 29.9% |
| 25 to 29 Minutes | 23 | 13.8% |
| 30 to 34 Minutes | 32 | 19.2% |
| 35 to 39 Minutes | 3 | 1.8% |
| 40 to 44 Minutes | 2 | 1.2% |
| 45 to 59 Minutes | 2 | 1.2% |
| 60 to 89 Minutes | 23 | 13.8% |
| 90 or more Minutes | 0 | 0.0% |
Commute Time by Sex in Waveland
The most common commute times in Waveland are 20 to 24 minutes (30 commuters, 33.7%) for males and 20 to 24 minutes (20 commuters, 25.6%) for females.
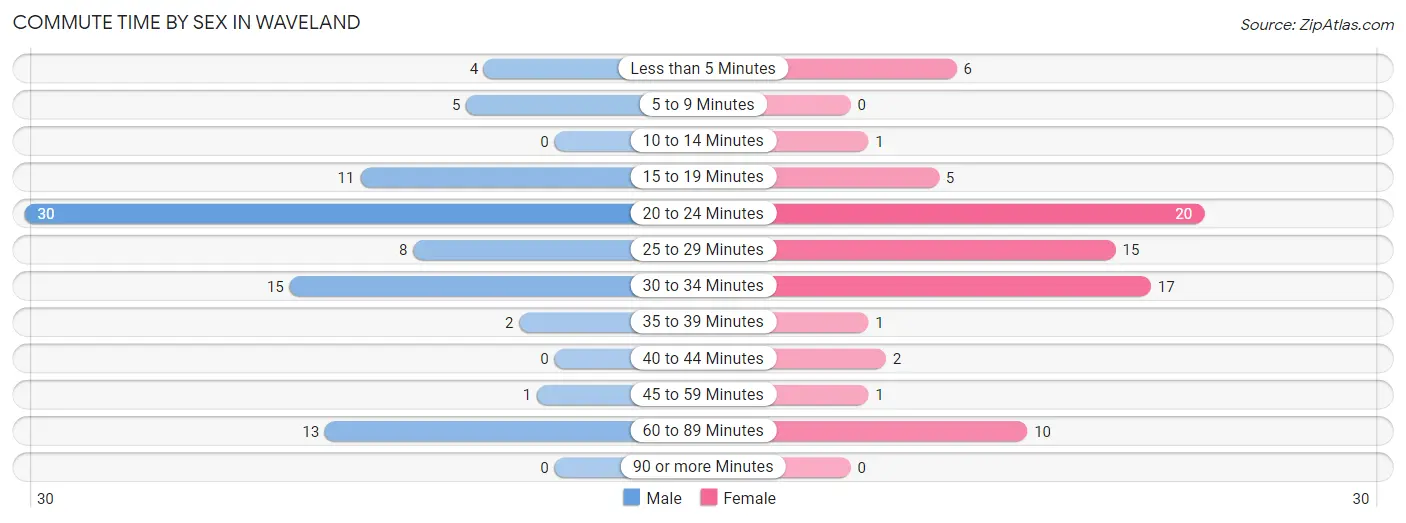
| Commute Time | Male | Female |
| Less than 5 Minutes | 4 (4.5%) | 6 (7.7%) |
| 5 to 9 Minutes | 5 (5.6%) | 0 (0.0%) |
| 10 to 14 Minutes | 0 (0.0%) | 1 (1.3%) |
| 15 to 19 Minutes | 11 (12.4%) | 5 (6.4%) |
| 20 to 24 Minutes | 30 (33.7%) | 20 (25.6%) |
| 25 to 29 Minutes | 8 (9.0%) | 15 (19.2%) |
| 30 to 34 Minutes | 15 (16.9%) | 17 (21.8%) |
| 35 to 39 Minutes | 2 (2.2%) | 1 (1.3%) |
| 40 to 44 Minutes | 0 (0.0%) | 2 (2.6%) |
| 45 to 59 Minutes | 1 (1.1%) | 1 (1.3%) |
| 60 to 89 Minutes | 13 (14.6%) | 10 (12.8%) |
| 90 or more Minutes | 0 (0.0%) | 0 (0.0%) |
Time of Departure to Work by Sex in Waveland
The most frequent times of departure to work in Waveland are 5:00 AM to 5:29 AM (15, 16.9%) for males and 7:30 AM to 7:59 AM (19, 24.4%) for females.
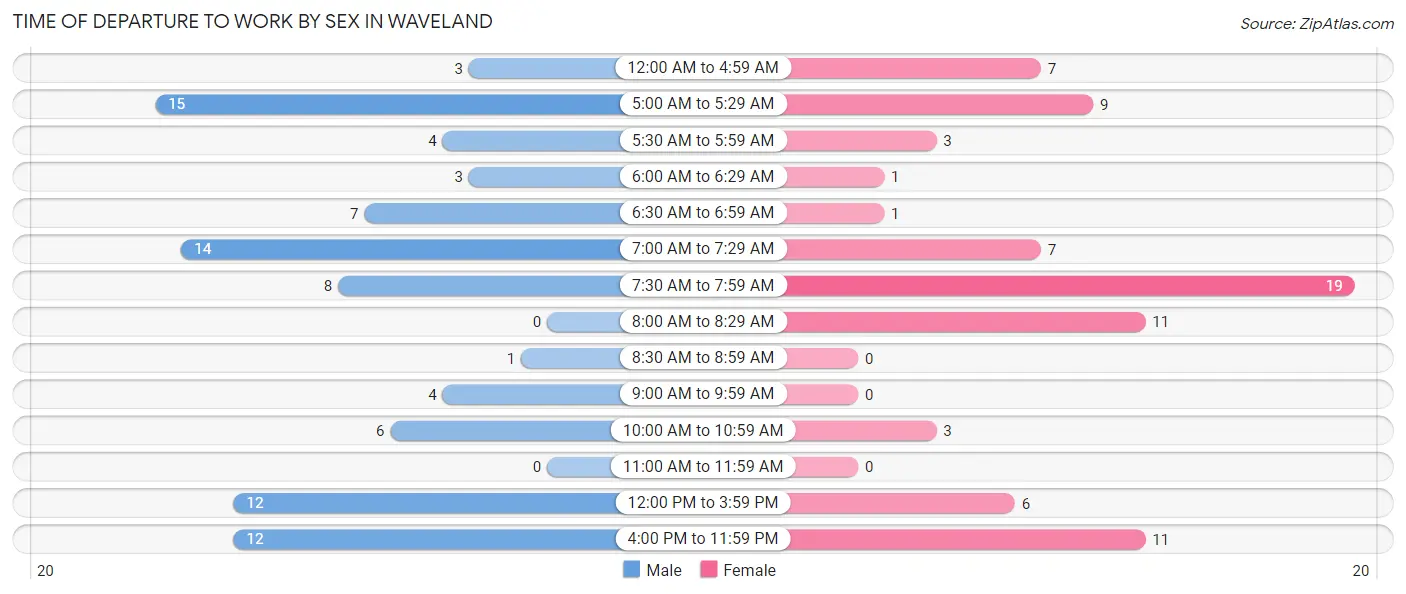
| Time of Departure | Male | Female |
| 12:00 AM to 4:59 AM | 3 (3.4%) | 7 (9.0%) |
| 5:00 AM to 5:29 AM | 15 (16.9%) | 9 (11.5%) |
| 5:30 AM to 5:59 AM | 4 (4.5%) | 3 (3.8%) |
| 6:00 AM to 6:29 AM | 3 (3.4%) | 1 (1.3%) |
| 6:30 AM to 6:59 AM | 7 (7.9%) | 1 (1.3%) |
| 7:00 AM to 7:29 AM | 14 (15.7%) | 7 (9.0%) |
| 7:30 AM to 7:59 AM | 8 (9.0%) | 19 (24.4%) |
| 8:00 AM to 8:29 AM | 0 (0.0%) | 11 (14.1%) |
| 8:30 AM to 8:59 AM | 1 (1.1%) | 0 (0.0%) |
| 9:00 AM to 9:59 AM | 4 (4.5%) | 0 (0.0%) |
| 10:00 AM to 10:59 AM | 6 (6.7%) | 3 (3.8%) |
| 11:00 AM to 11:59 AM | 0 (0.0%) | 0 (0.0%) |
| 12:00 PM to 3:59 PM | 12 (13.5%) | 6 (7.7%) |
| 4:00 PM to 11:59 PM | 12 (13.5%) | 11 (14.1%) |
| Total | 89 (100.0%) | 78 (100.0%) |
Housing Occupancy in Waveland
Occupancy by Ownership in Waveland
Of the total 147 dwellings in Waveland, owner-occupied units account for 129 (87.8%), while renter-occupied units make up 18 (12.2%).
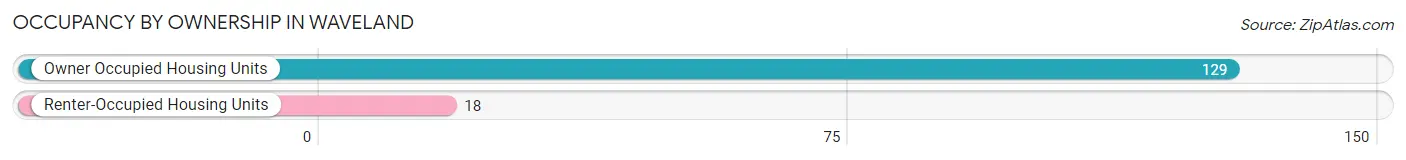
| Occupancy | # Housing Units | % Housing Units |
| Owner Occupied Housing Units | 129 | 87.8% |
| Renter-Occupied Housing Units | 18 | 12.2% |
| Total Occupied Housing Units | 147 | 100.0% |
Occupancy by Household Size in Waveland
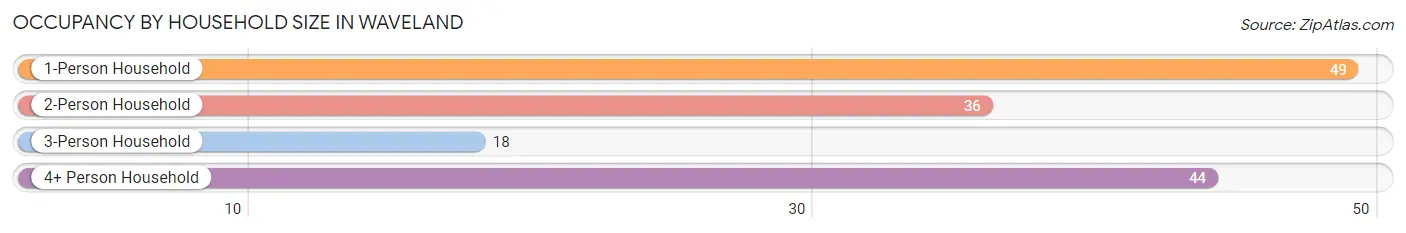
| Household Size | # Housing Units | % Housing Units |
| 1-Person Household | 49 | 33.3% |
| 2-Person Household | 36 | 24.5% |
| 3-Person Household | 18 | 12.2% |
| 4+ Person Household | 44 | 29.9% |
| Total Housing Units | 147 | 100.0% |
Occupancy by Ownership by Household Size in Waveland
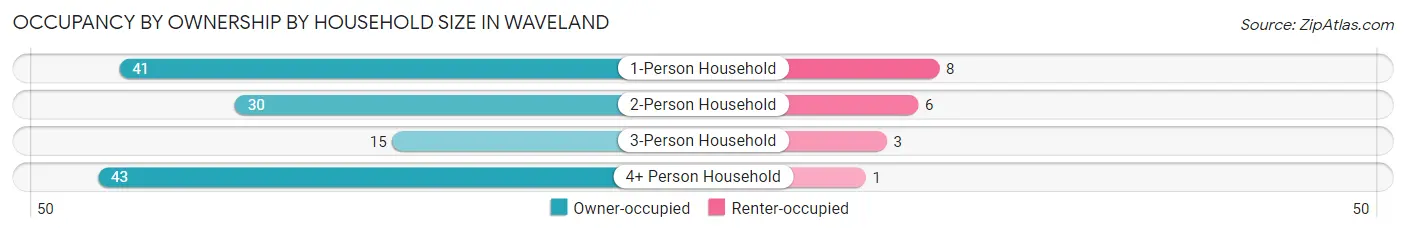
| Household Size | Owner-occupied | Renter-occupied |
| 1-Person Household | 41 (83.7%) | 8 (16.3%) |
| 2-Person Household | 30 (83.3%) | 6 (16.7%) |
| 3-Person Household | 15 (83.3%) | 3 (16.7%) |
| 4+ Person Household | 43 (97.7%) | 1 (2.3%) |
| Total Housing Units | 129 (87.8%) | 18 (12.2%) |
Occupancy by Educational Attainment in Waveland
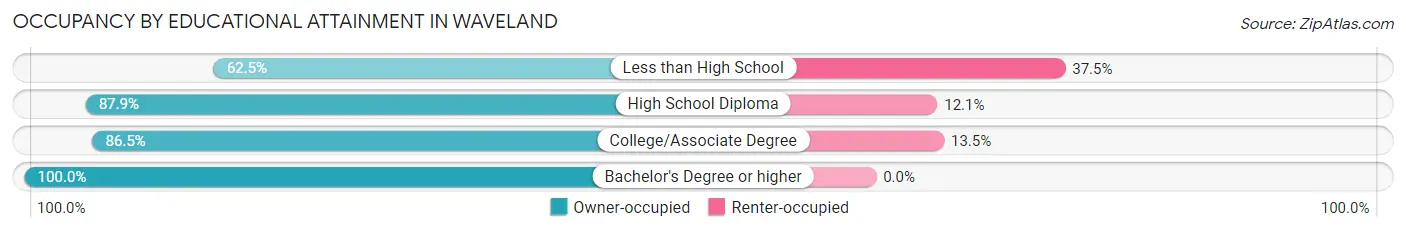
| Household Size | Owner-occupied | Renter-occupied |
| Less than High School | 5 (62.5%) | 3 (37.5%) |
| High School Diploma | 58 (87.9%) | 8 (12.1%) |
| College/Associate Degree | 45 (86.5%) | 7 (13.5%) |
| Bachelor's Degree or higher | 21 (100.0%) | 0 (0.0%) |
Occupancy by Age of Householder in Waveland
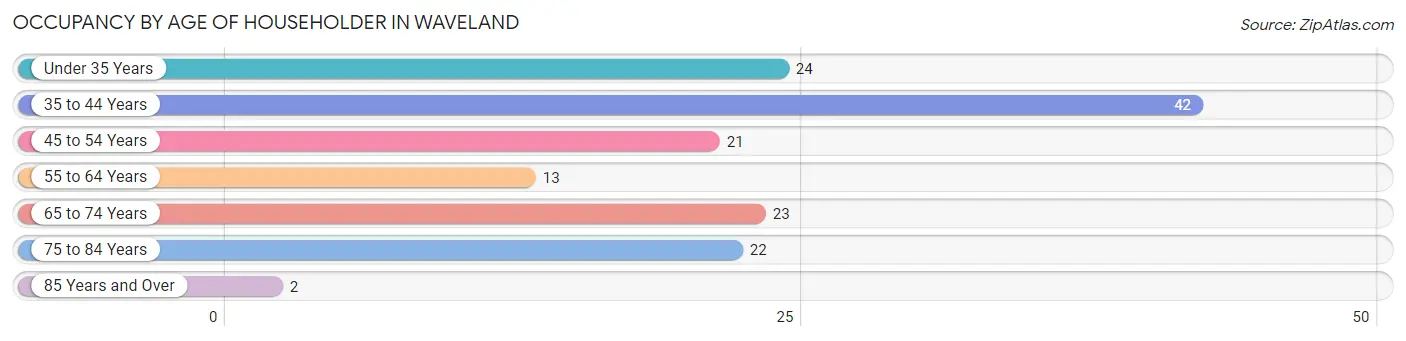
| Age Bracket | # Households | % Households |
| Under 35 Years | 24 | 16.3% |
| 35 to 44 Years | 42 | 28.6% |
| 45 to 54 Years | 21 | 14.3% |
| 55 to 64 Years | 13 | 8.8% |
| 65 to 74 Years | 23 | 15.7% |
| 75 to 84 Years | 22 | 15.0% |
| 85 Years and Over | 2 | 1.4% |
| Total | 147 | 100.0% |
Housing Finances in Waveland
Median Income by Occupancy in Waveland
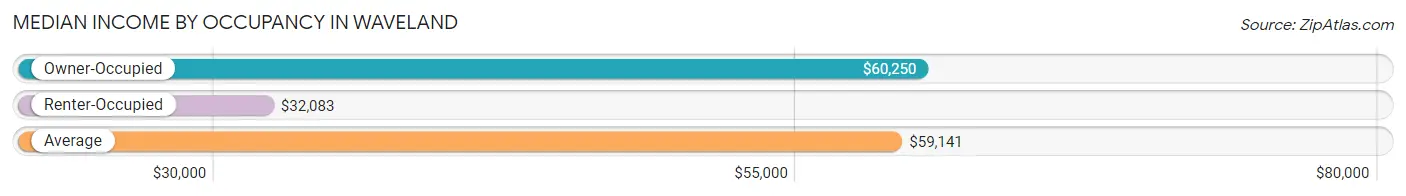
| Occupancy Type | # Households | Median Income |
| Owner-Occupied | 129 (87.8%) | $60,250 |
| Renter-Occupied | 18 (12.2%) | $32,083 |
| Average | 147 (100.0%) | $59,141 |
Occupancy by Householder Income Bracket in Waveland
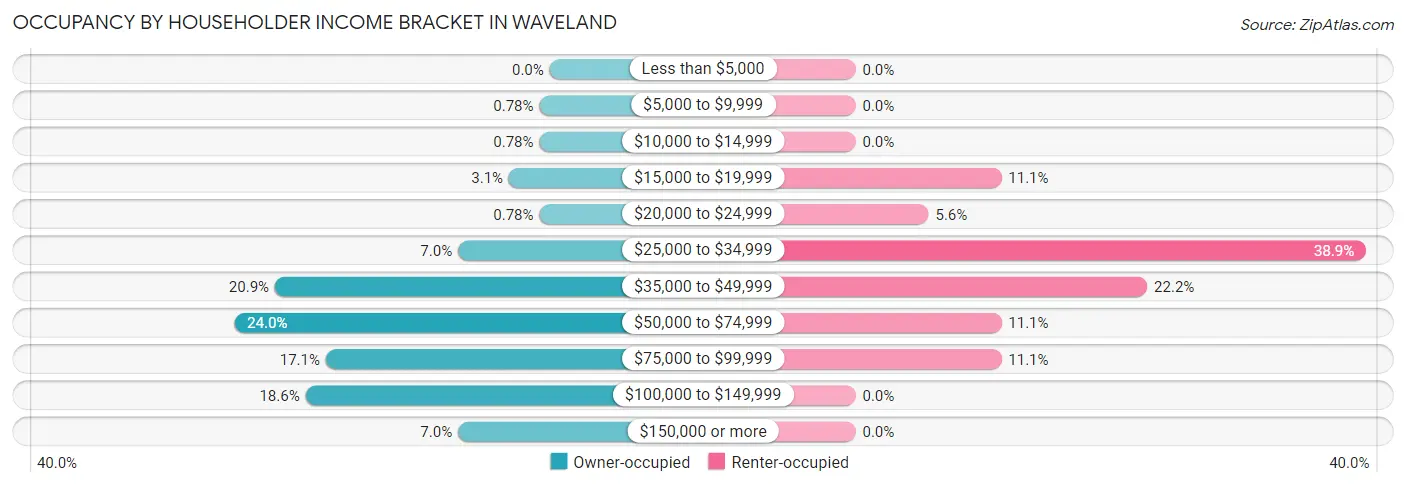
| Income Bracket | Owner-occupied | Renter-occupied |
| Less than $5,000 | 0 (0.0%) | 0 (0.0%) |
| $5,000 to $9,999 | 1 (0.8%) | 0 (0.0%) |
| $10,000 to $14,999 | 1 (0.8%) | 0 (0.0%) |
| $15,000 to $19,999 | 4 (3.1%) | 2 (11.1%) |
| $20,000 to $24,999 | 1 (0.8%) | 1 (5.6%) |
| $25,000 to $34,999 | 9 (7.0%) | 7 (38.9%) |
| $35,000 to $49,999 | 27 (20.9%) | 4 (22.2%) |
| $50,000 to $74,999 | 31 (24.0%) | 2 (11.1%) |
| $75,000 to $99,999 | 22 (17.1%) | 2 (11.1%) |
| $100,000 to $149,999 | 24 (18.6%) | 0 (0.0%) |
| $150,000 or more | 9 (7.0%) | 0 (0.0%) |
| Total | 129 (100.0%) | 18 (100.0%) |
Monthly Housing Cost Tiers in Waveland
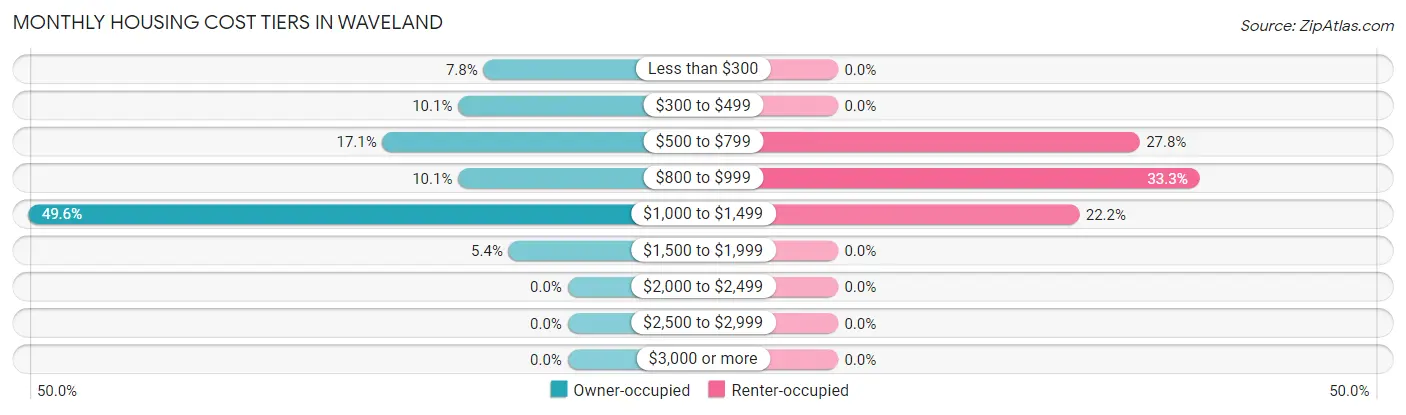
| Monthly Cost | Owner-occupied | Renter-occupied |
| Less than $300 | 10 (7.7%) | 0 (0.0%) |
| $300 to $499 | 13 (10.1%) | 0 (0.0%) |
| $500 to $799 | 22 (17.1%) | 5 (27.8%) |
| $800 to $999 | 13 (10.1%) | 6 (33.3%) |
| $1,000 to $1,499 | 64 (49.6%) | 4 (22.2%) |
| $1,500 to $1,999 | 7 (5.4%) | 0 (0.0%) |
| $2,000 to $2,499 | 0 (0.0%) | 0 (0.0%) |
| $2,500 to $2,999 | 0 (0.0%) | 0 (0.0%) |
| $3,000 or more | 0 (0.0%) | 0 (0.0%) |
| Total | 129 (100.0%) | 18 (100.0%) |
Physical Housing Characteristics in Waveland
Housing Structures in Waveland
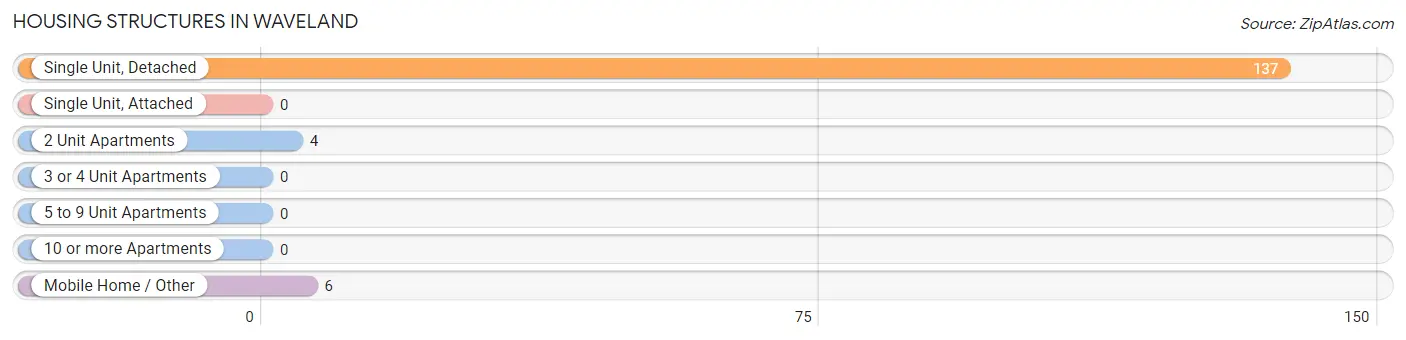
| Structure Type | # Housing Units | % Housing Units |
| Single Unit, Detached | 137 | 93.2% |
| Single Unit, Attached | 0 | 0.0% |
| 2 Unit Apartments | 4 | 2.7% |
| 3 or 4 Unit Apartments | 0 | 0.0% |
| 5 to 9 Unit Apartments | 0 | 0.0% |
| 10 or more Apartments | 0 | 0.0% |
| Mobile Home / Other | 6 | 4.1% |
| Total | 147 | 100.0% |
Housing Structures by Occupancy in Waveland
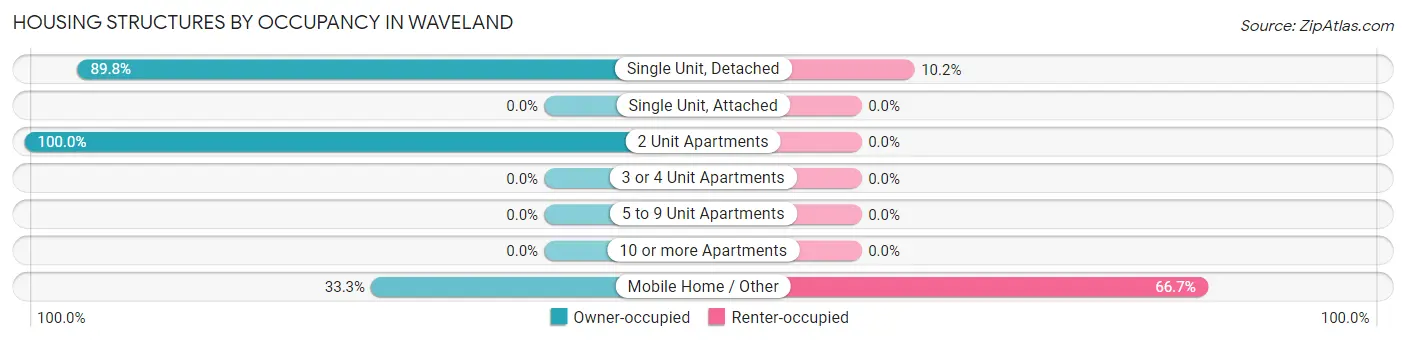
| Structure Type | Owner-occupied | Renter-occupied |
| Single Unit, Detached | 123 (89.8%) | 14 (10.2%) |
| Single Unit, Attached | 0 (0.0%) | 0 (0.0%) |
| 2 Unit Apartments | 4 (100.0%) | 0 (0.0%) |
| 3 or 4 Unit Apartments | 0 (0.0%) | 0 (0.0%) |
| 5 to 9 Unit Apartments | 0 (0.0%) | 0 (0.0%) |
| 10 or more Apartments | 0 (0.0%) | 0 (0.0%) |
| Mobile Home / Other | 2 (33.3%) | 4 (66.7%) |
| Total | 129 (87.8%) | 18 (12.2%) |
Housing Structures by Number of Rooms in Waveland
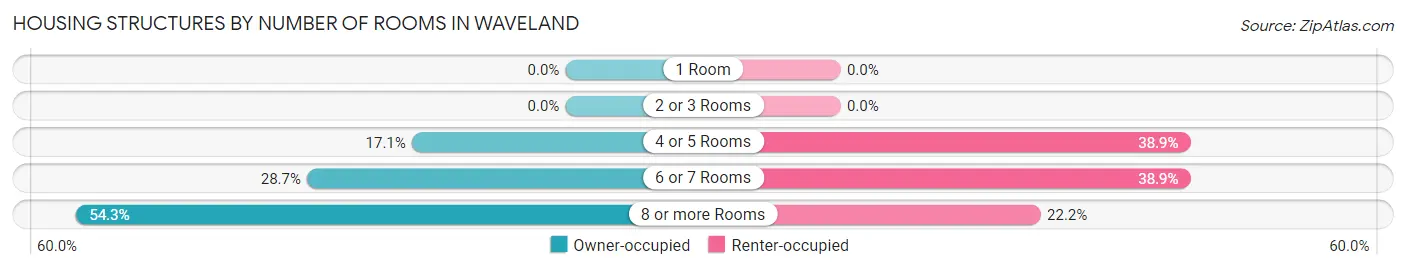
| Number of Rooms | Owner-occupied | Renter-occupied |
| 1 Room | 0 (0.0%) | 0 (0.0%) |
| 2 or 3 Rooms | 0 (0.0%) | 0 (0.0%) |
| 4 or 5 Rooms | 22 (17.1%) | 7 (38.9%) |
| 6 or 7 Rooms | 37 (28.7%) | 7 (38.9%) |
| 8 or more Rooms | 70 (54.3%) | 4 (22.2%) |
| Total | 129 (100.0%) | 18 (100.0%) |
Housing Structure by Heating Type in Waveland
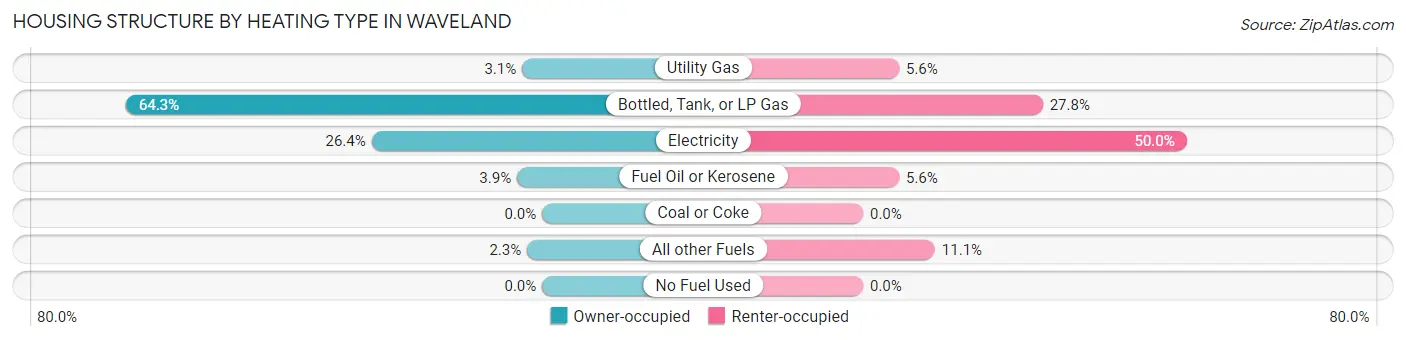
| Heating Type | Owner-occupied | Renter-occupied |
| Utility Gas | 4 (3.1%) | 1 (5.6%) |
| Bottled, Tank, or LP Gas | 83 (64.3%) | 5 (27.8%) |
| Electricity | 34 (26.4%) | 9 (50.0%) |
| Fuel Oil or Kerosene | 5 (3.9%) | 1 (5.6%) |
| Coal or Coke | 0 (0.0%) | 0 (0.0%) |
| All other Fuels | 3 (2.3%) | 2 (11.1%) |
| No Fuel Used | 0 (0.0%) | 0 (0.0%) |
| Total | 129 (100.0%) | 18 (100.0%) |
Household Vehicle Usage in Waveland
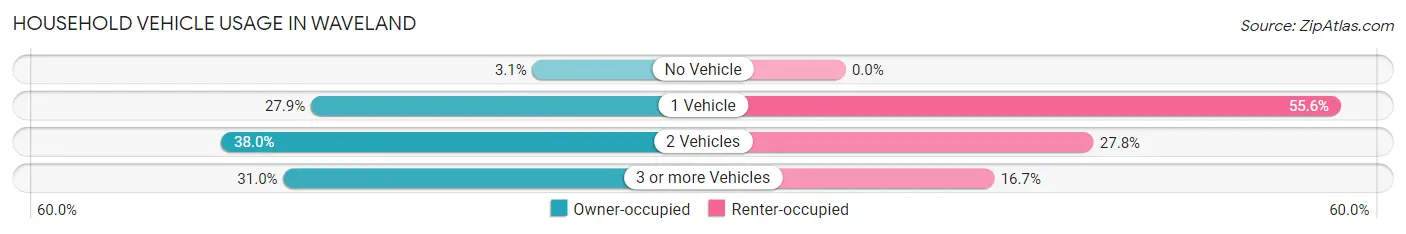
| Vehicles per Household | Owner-occupied | Renter-occupied |
| No Vehicle | 4 (3.1%) | 0 (0.0%) |
| 1 Vehicle | 36 (27.9%) | 10 (55.6%) |
| 2 Vehicles | 49 (38.0%) | 5 (27.8%) |
| 3 or more Vehicles | 40 (31.0%) | 3 (16.7%) |
| Total | 129 (100.0%) | 18 (100.0%) |
Real Estate & Mortgages in Waveland
Real Estate and Mortgage Overview in Waveland
| Characteristic | Without Mortgage | With Mortgage |
| Housing Units | 38 | 91 |
| Median Property Value | $70,000 | $107,300 |
| Median Household Income | $78,750 | $4 |
| Monthly Housing Costs | $383 | $0 |
| Real Estate Taxes | $300 | $3 |
Property Value by Mortgage Status in Waveland
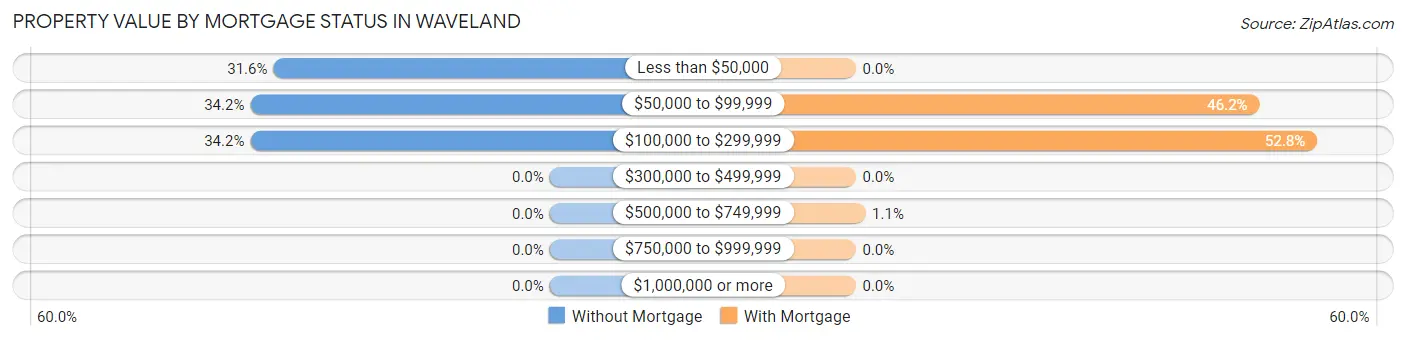
| Property Value | Without Mortgage | With Mortgage |
| Less than $50,000 | 12 (31.6%) | 0 (0.0%) |
| $50,000 to $99,999 | 13 (34.2%) | 42 (46.2%) |
| $100,000 to $299,999 | 13 (34.2%) | 48 (52.7%) |
| $300,000 to $499,999 | 0 (0.0%) | 0 (0.0%) |
| $500,000 to $749,999 | 0 (0.0%) | 1 (1.1%) |
| $750,000 to $999,999 | 0 (0.0%) | 0 (0.0%) |
| $1,000,000 or more | 0 (0.0%) | 0 (0.0%) |
| Total | 38 (100.0%) | 91 (100.0%) |
Household Income by Mortgage Status in Waveland
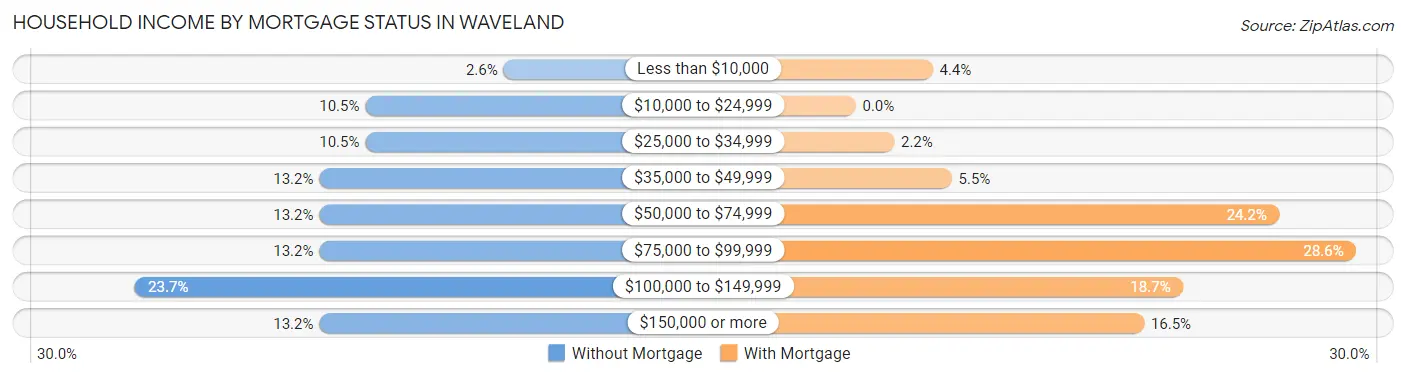
| Household Income | Without Mortgage | With Mortgage |
| Less than $10,000 | 1 (2.6%) | 4 (4.4%) |
| $10,000 to $24,999 | 4 (10.5%) | 0 (0.0%) |
| $25,000 to $34,999 | 4 (10.5%) | 2 (2.2%) |
| $35,000 to $49,999 | 5 (13.2%) | 5 (5.5%) |
| $50,000 to $74,999 | 5 (13.2%) | 22 (24.2%) |
| $75,000 to $99,999 | 5 (13.2%) | 26 (28.6%) |
| $100,000 to $149,999 | 9 (23.7%) | 17 (18.7%) |
| $150,000 or more | 5 (13.2%) | 15 (16.5%) |
| Total | 38 (100.0%) | 91 (100.0%) |
Property Value to Household Income Ratio in Waveland
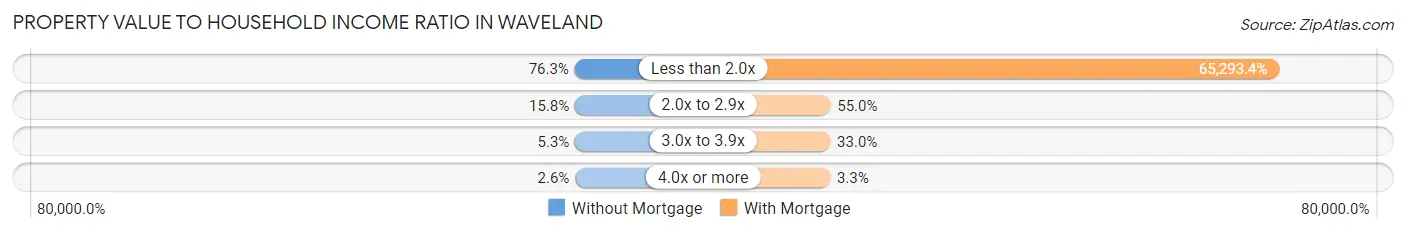
| Value-to-Income Ratio | Without Mortgage | With Mortgage |
| Less than 2.0x | 29 (76.3%) | 59,417 (65,293.4%) |
| 2.0x to 2.9x | 6 (15.8%) | 50 (54.9%) |
| 3.0x to 3.9x | 2 (5.3%) | 30 (33.0%) |
| 4.0x or more | 1 (2.6%) | 3 (3.3%) |
| Total | 38 (100.0%) | 91 (100.0%) |
Real Estate Taxes by Mortgage Status in Waveland
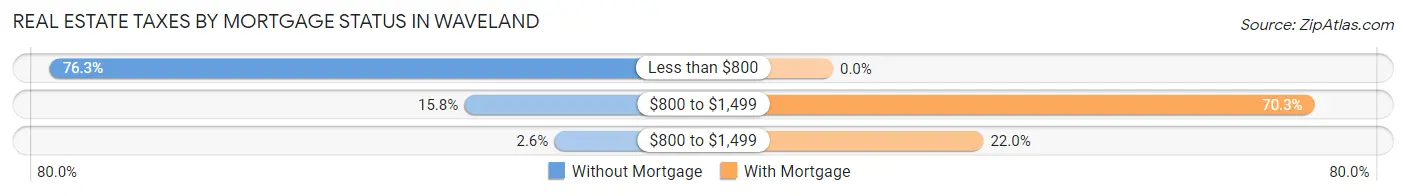
| Property Taxes | Without Mortgage | With Mortgage |
| Less than $800 | 29 (76.3%) | 0 (0.0%) |
| $800 to $1,499 | 6 (15.8%) | 64 (70.3%) |
| $800 to $1,499 | 1 (2.6%) | 20 (22.0%) |
| Total | 38 (100.0%) | 91 (100.0%) |
Health & Disability in Waveland
Health Insurance Coverage by Age in Waveland
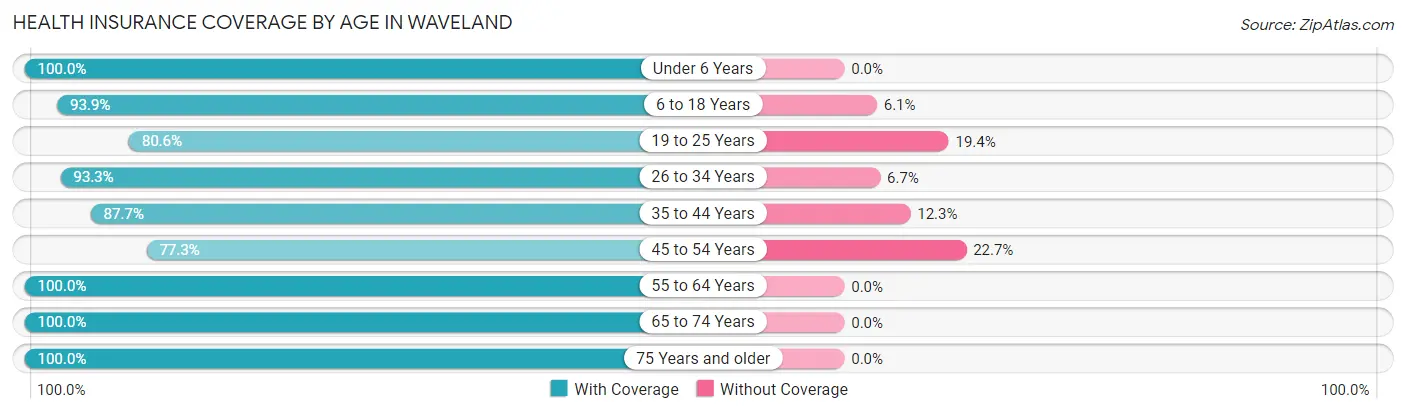
| Age Bracket | With Coverage | Without Coverage |
| Under 6 Years | 35 (100.0%) | 0 (0.0%) |
| 6 to 18 Years | 93 (93.9%) | 6 (6.1%) |
| 19 to 25 Years | 29 (80.6%) | 7 (19.4%) |
| 26 to 34 Years | 28 (93.3%) | 2 (6.7%) |
| 35 to 44 Years | 57 (87.7%) | 8 (12.3%) |
| 45 to 54 Years | 34 (77.3%) | 10 (22.7%) |
| 55 to 64 Years | 21 (100.0%) | 0 (0.0%) |
| 65 to 74 Years | 28 (100.0%) | 0 (0.0%) |
| 75 Years and older | 31 (100.0%) | 0 (0.0%) |
| Total | 356 (91.5%) | 33 (8.5%) |
Health Insurance Coverage by Citizenship Status in Waveland
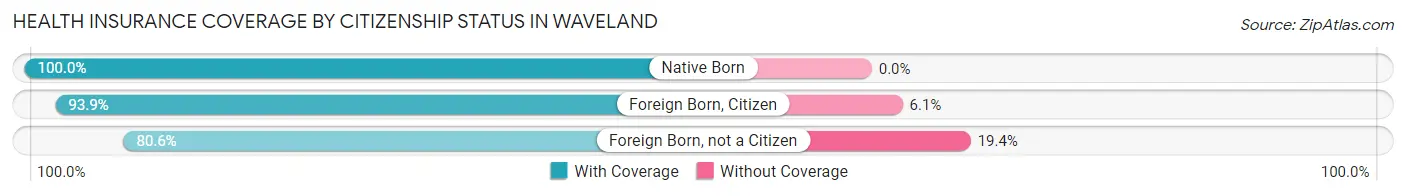
| Citizenship Status | With Coverage | Without Coverage |
| Native Born | 35 (100.0%) | 0 (0.0%) |
| Foreign Born, Citizen | 93 (93.9%) | 6 (6.1%) |
| Foreign Born, not a Citizen | 29 (80.6%) | 7 (19.4%) |
Health Insurance Coverage by Household Income in Waveland
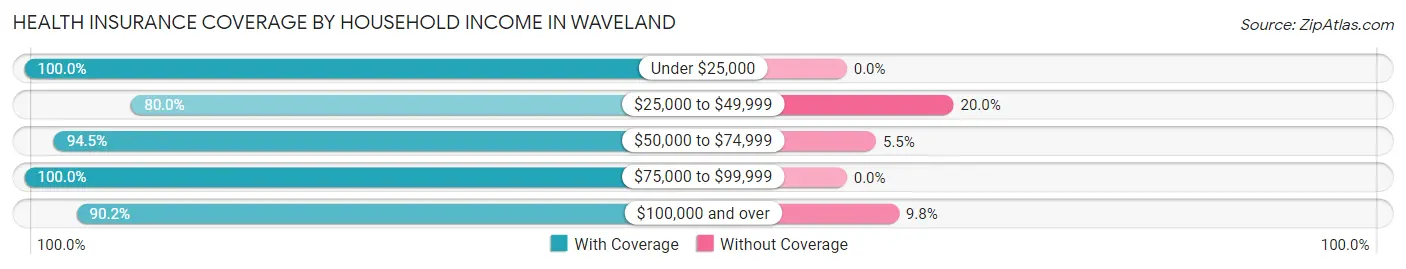
| Household Income | With Coverage | Without Coverage |
| Under $25,000 | 21 (100.0%) | 0 (0.0%) |
| $25,000 to $49,999 | 68 (80.0%) | 17 (20.0%) |
| $50,000 to $74,999 | 69 (94.5%) | 4 (5.5%) |
| $75,000 to $99,999 | 87 (100.0%) | 0 (0.0%) |
| $100,000 and over | 111 (90.2%) | 12 (9.8%) |
Public vs Private Health Insurance Coverage by Age in Waveland
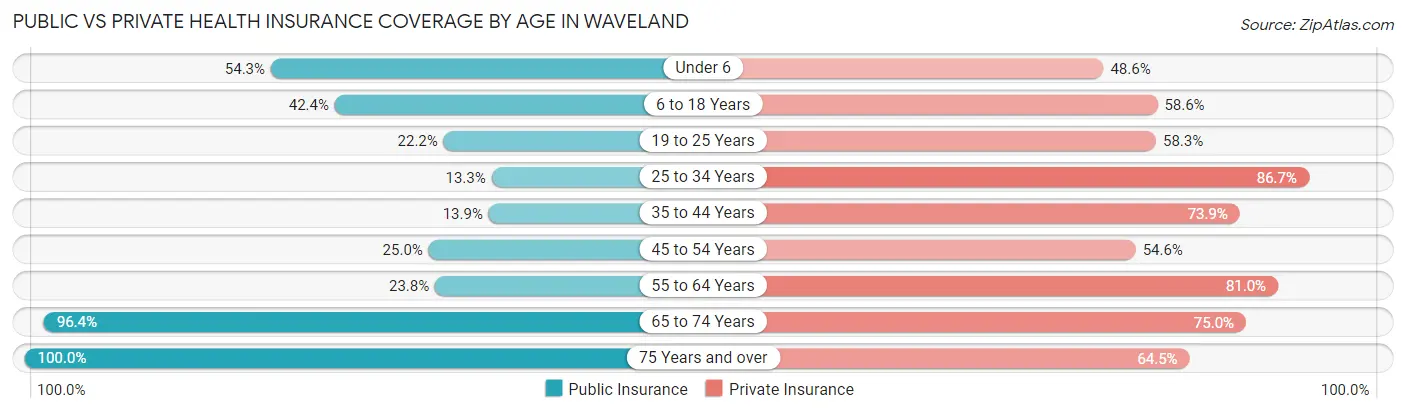
| Age Bracket | Public Insurance | Private Insurance |
| Under 6 | 19 (54.3%) | 17 (48.6%) |
| 6 to 18 Years | 42 (42.4%) | 58 (58.6%) |
| 19 to 25 Years | 8 (22.2%) | 21 (58.3%) |
| 25 to 34 Years | 4 (13.3%) | 26 (86.7%) |
| 35 to 44 Years | 9 (13.9%) | 48 (73.9%) |
| 45 to 54 Years | 11 (25.0%) | 24 (54.5%) |
| 55 to 64 Years | 5 (23.8%) | 17 (80.9%) |
| 65 to 74 Years | 27 (96.4%) | 21 (75.0%) |
| 75 Years and over | 31 (100.0%) | 20 (64.5%) |
| Total | 156 (40.1%) | 252 (64.8%) |
Disability Status by Sex by Age in Waveland
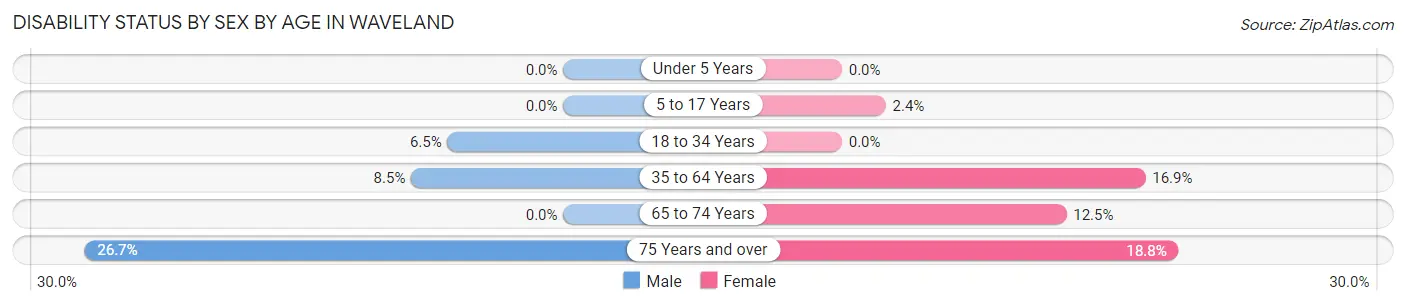
| Age Bracket | Male | Female |
| Under 5 Years | 0 (0.0%) | 0 (0.0%) |
| 5 to 17 Years | 0 (0.0%) | 1 (2.4%) |
| 18 to 34 Years | 2 (6.5%) | 0 (0.0%) |
| 35 to 64 Years | 5 (8.5%) | 12 (16.9%) |
| 65 to 74 Years | 0 (0.0%) | 1 (12.5%) |
| 75 Years and over | 4 (26.7%) | 3 (18.8%) |
Disability Class by Sex by Age in Waveland
Disability Class: Hearing Difficulty
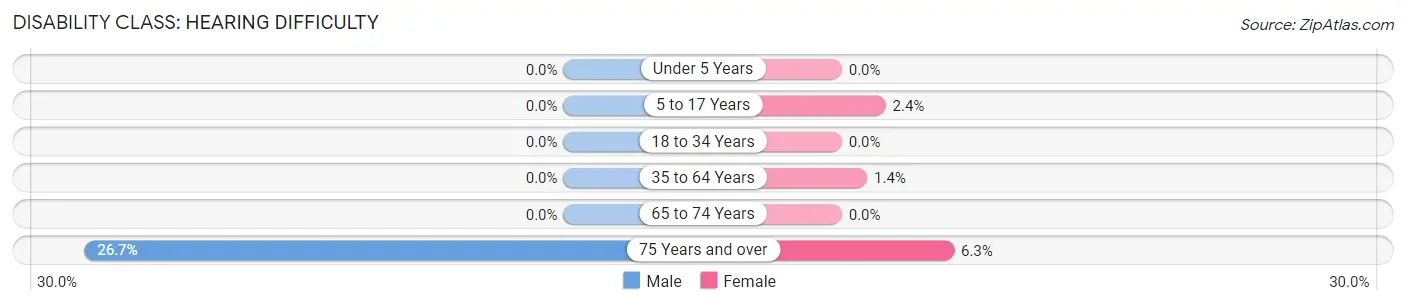
| Age Bracket | Male | Female |
| Under 5 Years | 0 (0.0%) | 0 (0.0%) |
| 5 to 17 Years | 0 (0.0%) | 1 (2.4%) |
| 18 to 34 Years | 0 (0.0%) | 0 (0.0%) |
| 35 to 64 Years | 0 (0.0%) | 1 (1.4%) |
| 65 to 74 Years | 0 (0.0%) | 0 (0.0%) |
| 75 Years and over | 4 (26.7%) | 1 (6.2%) |
Disability Class: Vision Difficulty
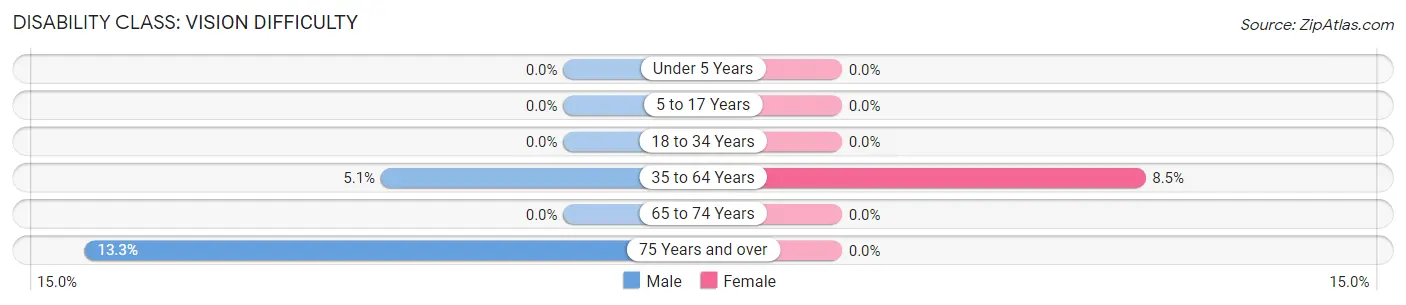
| Age Bracket | Male | Female |
| Under 5 Years | 0 (0.0%) | 0 (0.0%) |
| 5 to 17 Years | 0 (0.0%) | 0 (0.0%) |
| 18 to 34 Years | 0 (0.0%) | 0 (0.0%) |
| 35 to 64 Years | 3 (5.1%) | 6 (8.5%) |
| 65 to 74 Years | 0 (0.0%) | 0 (0.0%) |
| 75 Years and over | 2 (13.3%) | 0 (0.0%) |
Disability Class: Cognitive Difficulty
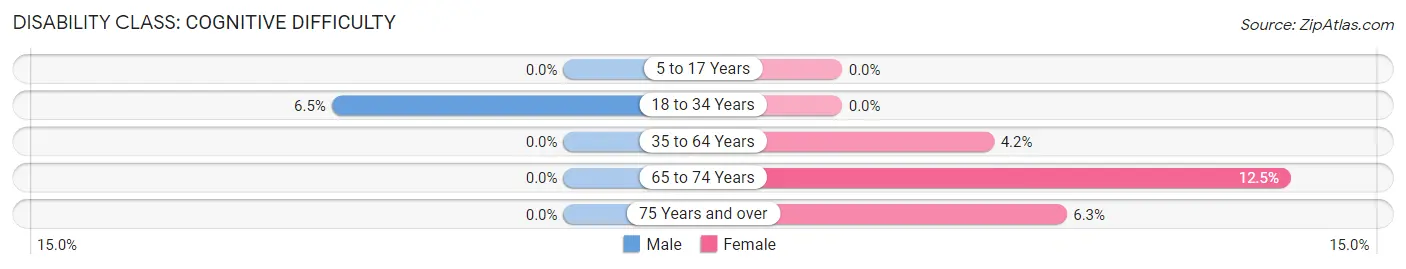
| Age Bracket | Male | Female |
| 5 to 17 Years | 0 (0.0%) | 0 (0.0%) |
| 18 to 34 Years | 2 (6.5%) | 0 (0.0%) |
| 35 to 64 Years | 0 (0.0%) | 3 (4.2%) |
| 65 to 74 Years | 0 (0.0%) | 1 (12.5%) |
| 75 Years and over | 0 (0.0%) | 1 (6.2%) |
Disability Class: Ambulatory Difficulty
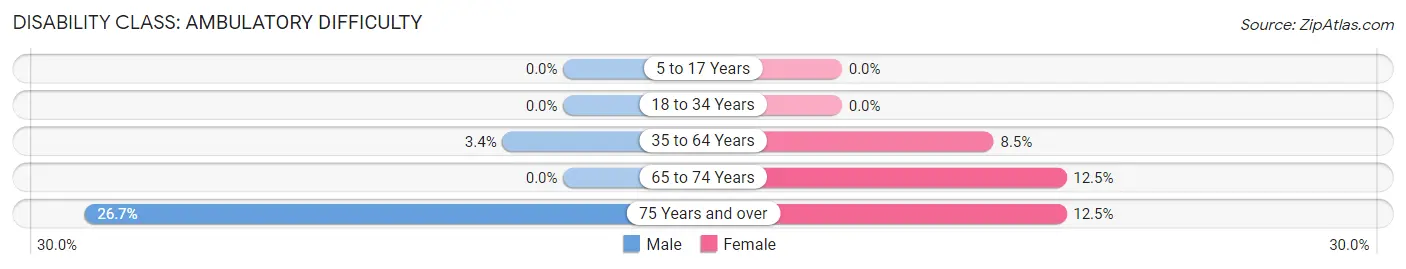
| Age Bracket | Male | Female |
| 5 to 17 Years | 0 (0.0%) | 0 (0.0%) |
| 18 to 34 Years | 0 (0.0%) | 0 (0.0%) |
| 35 to 64 Years | 2 (3.4%) | 6 (8.5%) |
| 65 to 74 Years | 0 (0.0%) | 1 (12.5%) |
| 75 Years and over | 4 (26.7%) | 2 (12.5%) |
Disability Class: Self-Care Difficulty
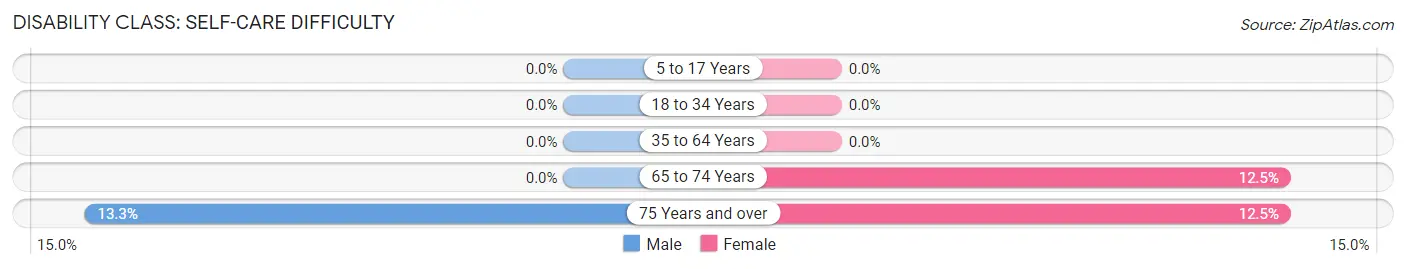
| Age Bracket | Male | Female |
| 5 to 17 Years | 0 (0.0%) | 0 (0.0%) |
| 18 to 34 Years | 0 (0.0%) | 0 (0.0%) |
| 35 to 64 Years | 0 (0.0%) | 0 (0.0%) |
| 65 to 74 Years | 0 (0.0%) | 1 (12.5%) |
| 75 Years and over | 2 (13.3%) | 2 (12.5%) |
Technology Access in Waveland
Computing Device Access in Waveland
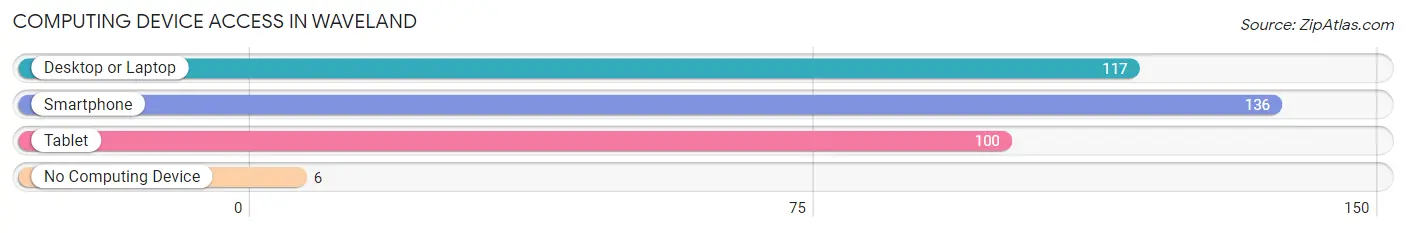
| Device Type | # Households | % Households |
| Desktop or Laptop | 117 | 79.6% |
| Smartphone | 136 | 92.5% |
| Tablet | 100 | 68.0% |
| No Computing Device | 6 | 4.1% |
| Total | 147 | 100.0% |
Internet Access in Waveland
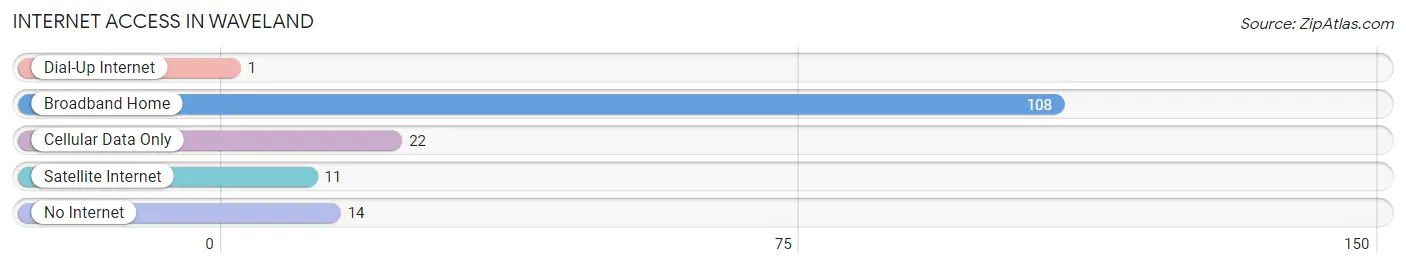
| Internet Type | # Households | % Households |
| Dial-Up Internet | 1 | 0.7% |
| Broadband Home | 108 | 73.5% |
| Cellular Data Only | 22 | 15.0% |
| Satellite Internet | 11 | 7.5% |
| No Internet | 14 | 9.5% |
| Total | 147 | 100.0% |
Waveland Summary
Waveland, Indiana is a small town located in Montgomery County, Indiana. It is situated in the Wabash Valley, approximately 30 miles northwest of the state capital of Indianapolis. The town was founded in 1836 and has a population of approximately 1,500 people.
Waveland is located in the Wabash Valley, which is a region of the Midwest United States that is known for its rich agricultural heritage. The Wabash Valley is home to a variety of crops, including corn, soybeans, wheat, and hay. The area is also known for its limestone quarries, which provide the raw material for many of the buildings in the area.
The town of Waveland is situated on the banks of the Wabash River, which is a major tributary of the Ohio River. The river provides a source of recreation for the town, as well as a means of transportation for goods and services. The town is also home to a variety of businesses, including a grocery store, a hardware store, a bank, and a post office.
The economy of Waveland is largely based on agriculture and manufacturing. The town is home to several large farms, which produce a variety of crops, including corn, soybeans, wheat, and hay. The town also has several manufacturing plants, which produce a variety of products, including furniture, clothing, and automotive parts.
The demographics of Waveland are largely white, with a small percentage of African Americans and Hispanics. The median household income in Waveland is approximately $45,000, which is slightly lower than the national average. The town has a low unemployment rate, and the majority of the population is employed in either agriculture or manufacturing.
The town of Waveland is served by the Waveland-Montgomery County School District, which consists of three elementary schools, one middle school, and one high school. The town also has a library, a community center, and a number of parks and recreational facilities.
Waveland is a small town with a rich history and a strong sense of community. The town is home to a variety of businesses, and the economy is largely based on agriculture and manufacturing. The town is also home to a variety of recreational activities, and the population is largely white. Waveland is a great place to live and work, and it is a great place to raise a family.
Common Questions
What is Per Capita Income in Waveland?
Per Capita income in Waveland is $26,643.
What is the Median Family Income in Waveland?
Median Family Income in Waveland is $81,944.
What is the Median Household income in Waveland?
Median Household Income in Waveland is $59,141.
What is Income or Wage Gap in Waveland?
Income or Wage Gap in Waveland is 44.7%.
Women in Waveland earn 55.3 cents for every dollar earned by a man.
What is Inequality or Gini Index in Waveland?
Inequality or Gini Index in Waveland is 0.33.
What is the Total Population of Waveland?
Total Population of Waveland is 389.
What is the Total Male Population of Waveland?
Total Male Population of Waveland is 192.
What is the Total Female Population of Waveland?
Total Female Population of Waveland is 197.
What is the Ratio of Males per 100 Females in Waveland?
There are 97.46 Males per 100 Females in Waveland.
What is the Ratio of Females per 100 Males in Waveland?
There are 102.60 Females per 100 Males in Waveland.
What is the Median Population Age in Waveland?
Median Population Age in Waveland is 33.9 Years.
What is the Average Family Size in Waveland
Average Family Size in Waveland is 3.5 People.
What is the Average Household Size in Waveland
Average Household Size in Waveland is 2.6 People.
How Large is the Labor Force in Waveland?
There are 196 People in the Labor Forcein in Waveland.
What is the Percentage of People in the Labor Force in Waveland?
72.1% of People are in the Labor Force in Waveland.
What is the Unemployment Rate in Waveland?
Unemployment Rate in Waveland is 6.6%.