Fontanet, IN Map & Demographics
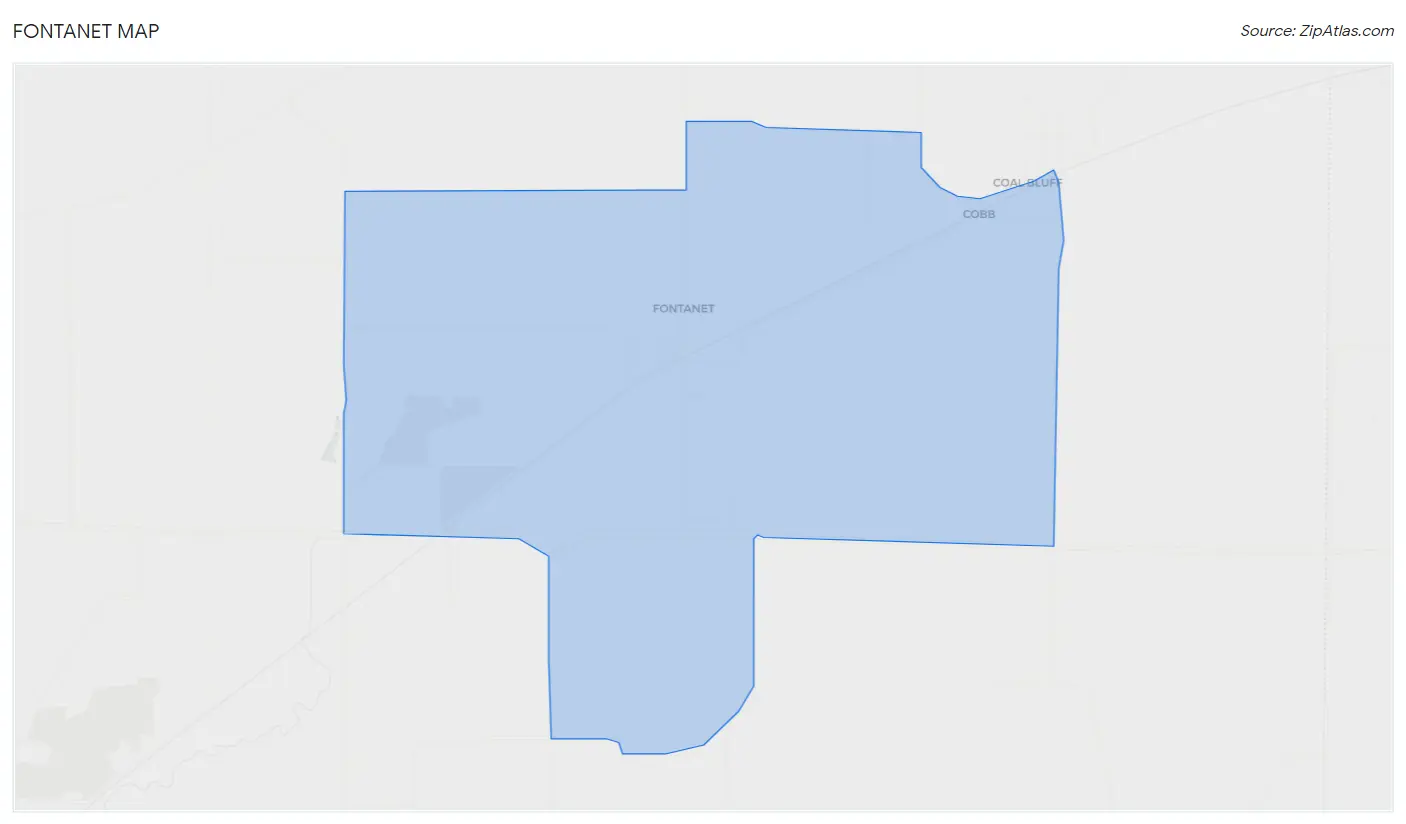
Fontanet Map
Fontanet Overview
$19,434
PER CAPITA INCOME
0.46
INEQUALITY / GINI INDEX
148
TOTAL POPULATION
20
MALE POPULATION
128
FEMALE POPULATION
15.62
MALES / 100 FEMALES
640.00
FEMALES / 100 MALES
47.3
MEDIAN AGE
2.9
AVG FAMILY SIZE
2.1
AVG HOUSEHOLD SIZE
109
LABOR FORCE [ PEOPLE ]
73.6%
PERCENT IN LABOR FORCE
29.4%
UNEMPLOYMENT RATE
Income in Fontanet
Income Overview in Fontanet
| Characteristic | Number | Measure |
| Per Capita Income | 148 | $19,434 |
| Median Family Income | 37 | $0 |
| Mean Family Income | 37 | $0 |
| Median Household Income | 69 | $0 |
| Mean Household Income | 69 | $39,710 |
| Income Deficit | 37 | $0 |
| Wage / Income Gap (%) | 148 | 0.00% |
| Wage / Income Gap ($) | 148 | 100.00¢ per $1 |
| Gini / Inequality Index | 148 | 0.46 |
Earnings by Sex in Fontanet
| Sex | Number | Average Earnings |
| Male | 8 (5.9%) | $0 |
| Female | 128 (94.1%) | $0 |
| Total | 136 (100.0%) | $0 |
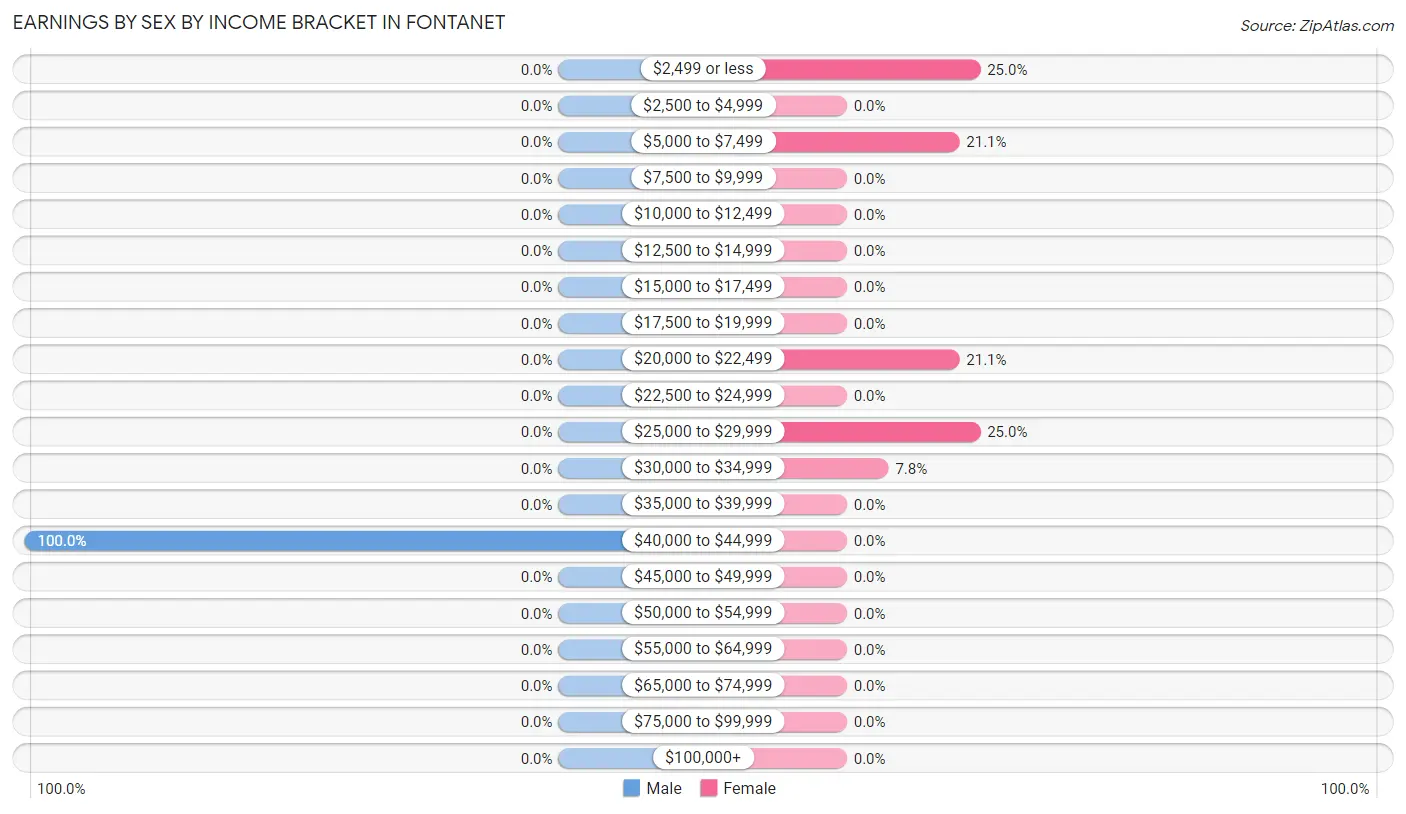
Earnings by Sex by Income Bracket in Fontanet
The most common earnings brackets in Fontanet are $40,000 to $44,999 for men (8 | 100.0%) and $2,499 or less for women (32 | 25.0%).
| Income | Male | Female |
| $2,499 or less | 0 (0.0%) | 32 (25.0%) |
| $2,500 to $4,999 | 0 (0.0%) | 0 (0.0%) |
| $5,000 to $7,499 | 0 (0.0%) | 27 (21.1%) |
| $7,500 to $9,999 | 0 (0.0%) | 0 (0.0%) |
| $10,000 to $12,499 | 0 (0.0%) | 0 (0.0%) |
| $12,500 to $14,999 | 0 (0.0%) | 0 (0.0%) |
| $15,000 to $17,499 | 0 (0.0%) | 0 (0.0%) |
| $17,500 to $19,999 | 0 (0.0%) | 0 (0.0%) |
| $20,000 to $22,499 | 0 (0.0%) | 27 (21.1%) |
| $22,500 to $24,999 | 0 (0.0%) | 0 (0.0%) |
| $25,000 to $29,999 | 0 (0.0%) | 32 (25.0%) |
| $30,000 to $34,999 | 0 (0.0%) | 10 (7.8%) |
| $35,000 to $39,999 | 0 (0.0%) | 0 (0.0%) |
| $40,000 to $44,999 | 8 (100.0%) | 0 (0.0%) |
| $45,000 to $49,999 | 0 (0.0%) | 0 (0.0%) |
| $50,000 to $54,999 | 0 (0.0%) | 0 (0.0%) |
| $55,000 to $64,999 | 0 (0.0%) | 0 (0.0%) |
| $65,000 to $74,999 | 0 (0.0%) | 0 (0.0%) |
| $75,000 to $99,999 | 0 (0.0%) | 0 (0.0%) |
| $100,000+ | 0 (0.0%) | 0 (0.0%) |
| Total | 8 (100.0%) | 128 (100.0%) |
Earnings by Sex by Educational Attainment in Fontanet
| Educational Attainment | Male Income | Female Income |
| Less than High School | - | - |
| High School Diploma | - | - |
| College or Associate's Degree | - | - |
| Bachelor's Degree | - | - |
| Graduate Degree | - | - |
| Total | - | - |
Family Income in Fontanet
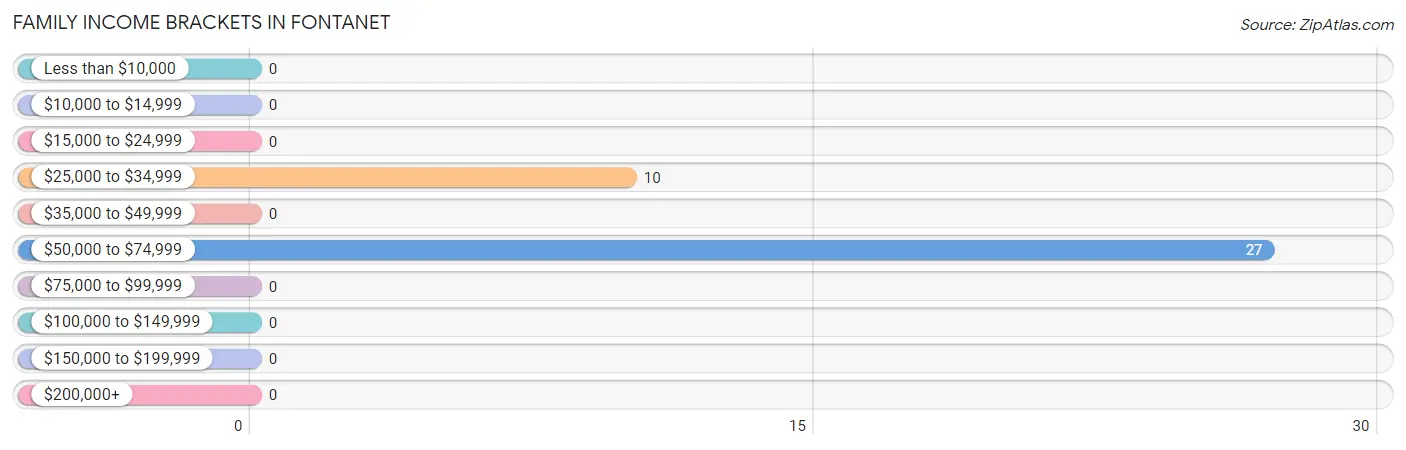
Family Income Brackets in Fontanet
According to the Fontanet family income data, there are 27 families falling into the $50,000 to $74,999 income range, which is the most common income bracket and makes up 73.0% of all families.
| Income Bracket | # Families | % Families |
| Less than $10,000 | 0 | 0.0% |
| $10,000 to $14,999 | 0 | 0.0% |
| $15,000 to $24,999 | 0 | 0.0% |
| $25,000 to $34,999 | 10 | 27.0% |
| $35,000 to $49,999 | 0 | 0.0% |
| $50,000 to $74,999 | 27 | 73.0% |
| $75,000 to $99,999 | 0 | 0.0% |
| $100,000 to $149,999 | 0 | 0.0% |
| $150,000 to $199,999 | 0 | 0.0% |
| $200,000+ | 0 | 0.0% |
Family Income by Famaliy Size in Fontanet
| Income Bracket | # Families | Median Income |
| 2-Person Families | 10 (27.0%) | $0 |
| 3-Person Families | 27 (73.0%) | $0 |
| 4-Person Families | 0 (0.0%) | $0 |
| 5-Person Families | 0 (0.0%) | $0 |
| 6-Person Families | 0 (0.0%) | $0 |
| 7+ Person Families | 0 (0.0%) | $0 |
| Total | 37 (100.0%) | $0 |
Family Income by Number of Earners in Fontanet
| Number of Earners | # Families | Median Income |
| No Earners | 0 (0.0%) | $0 |
| 1 Earner | 10 (27.0%) | $0 |
| 2 Earners | 0 (0.0%) | $0 |
| 3+ Earners | 27 (73.0%) | $0 |
| Total | 37 (100.0%) | $0 |
Household Income in Fontanet
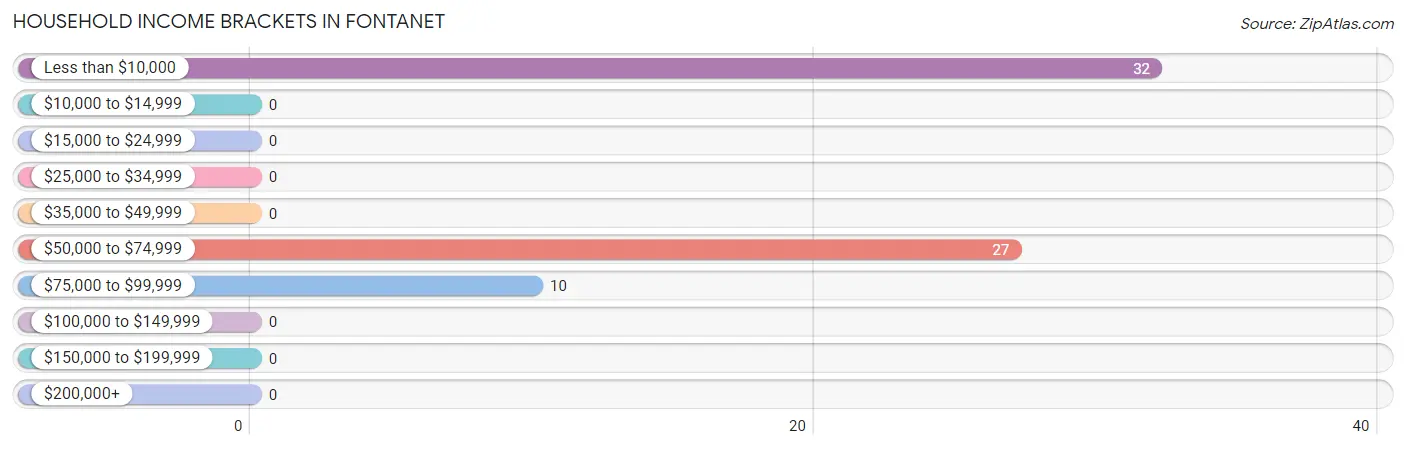
Household Income Brackets in Fontanet
With 32 households falling in the category, the less than $10,000 income range is the most frequent in Fontanet, accounting for 46.4% of all households.
| Income Bracket | # Households | % Households |
| Less than $10,000 | 32 | 46.4% |
| $10,000 to $14,999 | 0 | 0.0% |
| $15,000 to $24,999 | 0 | 0.0% |
| $25,000 to $34,999 | 0 | 0.0% |
| $35,000 to $49,999 | 0 | 0.0% |
| $50,000 to $74,999 | 27 | 39.1% |
| $75,000 to $99,999 | 10 | 14.5% |
| $100,000 to $149,999 | 0 | 0.0% |
| $150,000 to $199,999 | 0 | 0.0% |
| $200,000+ | 0 | 0.0% |
Household Income by Householder Age in Fontanet

| Income Bracket | # Households | Median Income |
| 15 to 24 Years | 32 (46.4%) | $0 |
| 25 to 44 Years | 0 (0.0%) | $0 |
| 45 to 64 Years | 37 (53.6%) | $0 |
| 65+ Years | 0 (0.0%) | $0 |
| Total | 69 (100.0%) | $0 |
Poverty in Fontanet
Income Below Poverty by Sex and Age in Fontanet
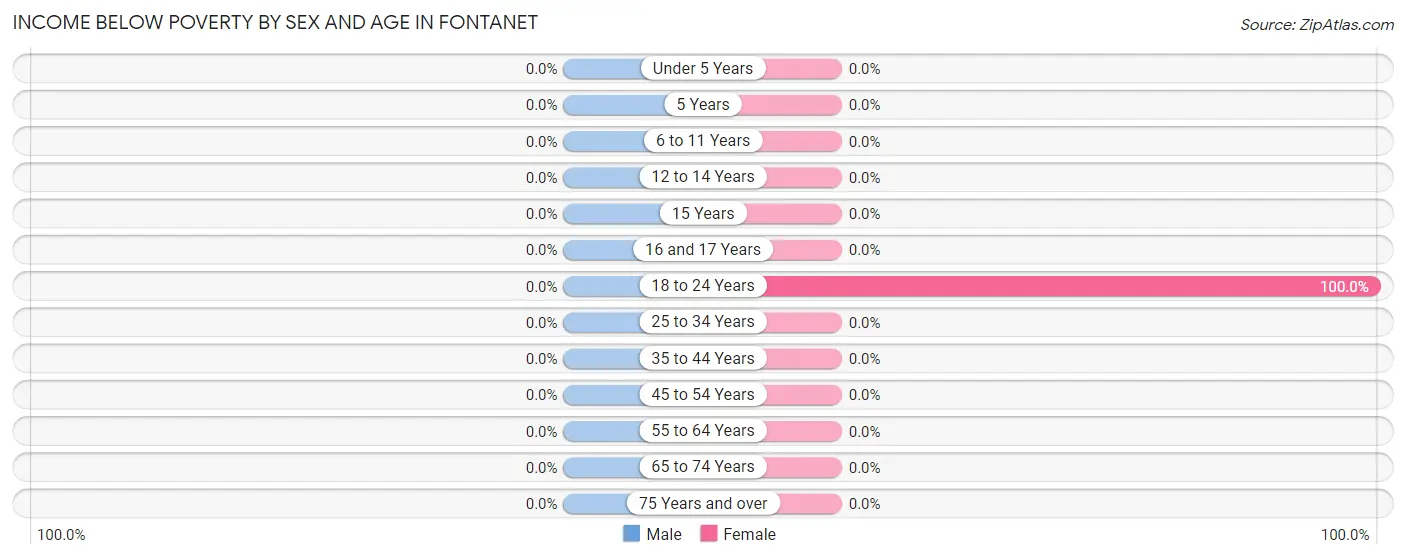
| Age Bracket | Male | Female |
| Under 5 Years | 0 (0.0%) | 0 (0.0%) |
| 5 Years | 0 (0.0%) | 0 (0.0%) |
| 6 to 11 Years | 0 (0.0%) | 0 (0.0%) |
| 12 to 14 Years | 0 (0.0%) | 0 (0.0%) |
| 15 Years | 0 (0.0%) | 0 (0.0%) |
| 16 and 17 Years | 0 (0.0%) | 0 (0.0%) |
| 18 to 24 Years | 0 (0.0%) | 32 (100.0%) |
| 25 to 34 Years | 0 (0.0%) | 0 (0.0%) |
| 35 to 44 Years | 0 (0.0%) | 0 (0.0%) |
| 45 to 54 Years | 0 (0.0%) | 0 (0.0%) |
| 55 to 64 Years | 0 (0.0%) | 0 (0.0%) |
| 65 to 74 Years | 0 (0.0%) | 0 (0.0%) |
| 75 Years and over | 0 (0.0%) | 0 (0.0%) |
| Total | 0 (0.0%) | 32 (25.0%) |
Income Above Poverty by Sex and Age in Fontanet
According to the poverty statistics in Fontanet, males aged 16 and 17 years and females aged 25 to 34 years are the age groups that are most secure financially, with 100.0% of males and 100.0% of females in these age groups living above the poverty line.
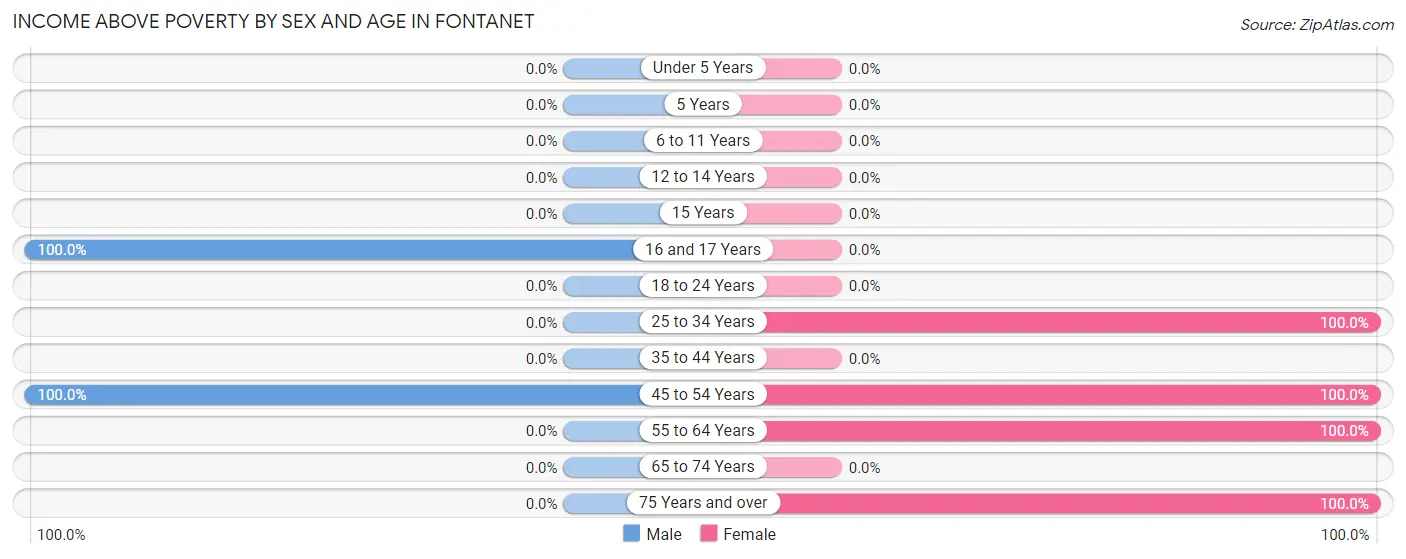
| Age Bracket | Male | Female |
| Under 5 Years | 0 (0.0%) | 0 (0.0%) |
| 5 Years | 0 (0.0%) | 0 (0.0%) |
| 6 to 11 Years | 0 (0.0%) | 0 (0.0%) |
| 12 to 14 Years | 0 (0.0%) | 0 (0.0%) |
| 15 Years | 0 (0.0%) | 0 (0.0%) |
| 16 and 17 Years | 12 (100.0%) | 0 (0.0%) |
| 18 to 24 Years | 0 (0.0%) | 0 (0.0%) |
| 25 to 34 Years | 0 (0.0%) | 27 (100.0%) |
| 35 to 44 Years | 0 (0.0%) | 0 (0.0%) |
| 45 to 54 Years | 8 (100.0%) | 10 (100.0%) |
| 55 to 64 Years | 0 (0.0%) | 27 (100.0%) |
| 65 to 74 Years | 0 (0.0%) | 0 (0.0%) |
| 75 Years and over | 0 (0.0%) | 32 (100.0%) |
| Total | 20 (100.0%) | 96 (75.0%) |
Income Below Poverty Among Married-Couple Families in Fontanet
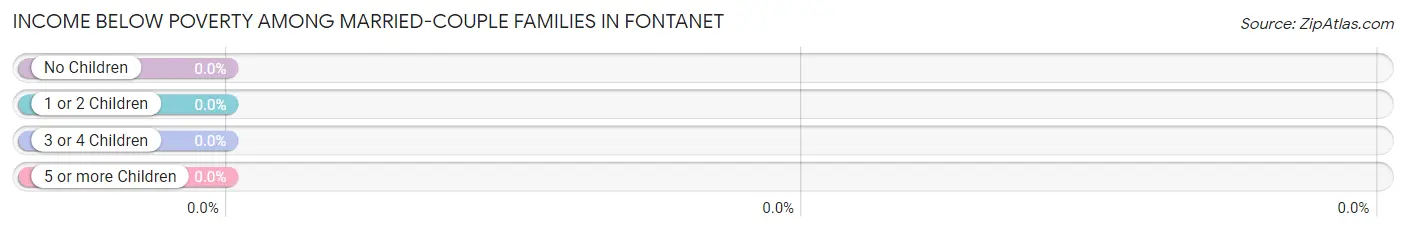
| Children | Above Poverty | Below Poverty |
| No Children | 0 (0.0%) | 0 (0.0%) |
| 1 or 2 Children | 0 (0.0%) | 0 (0.0%) |
| 3 or 4 Children | 0 (0.0%) | 0 (0.0%) |
| 5 or more Children | 0 (0.0%) | 0 (0.0%) |
| Total | 0 (0.0%) | 0 (0.0%) |
Income Below Poverty Among Single-Parent Households in Fontanet
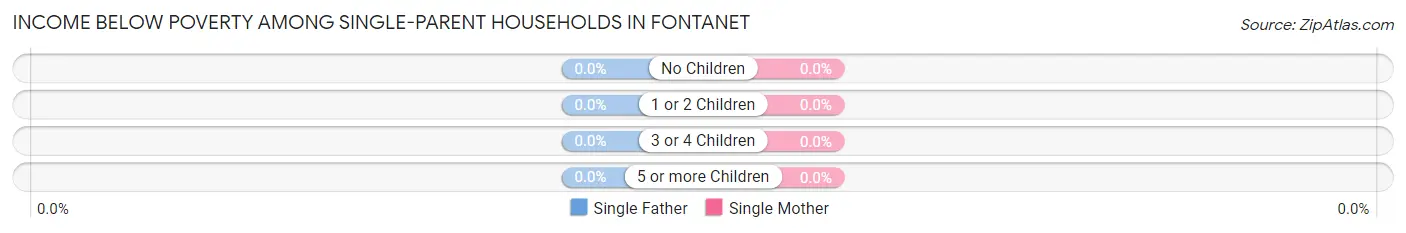
| Children | Single Father | Single Mother |
| No Children | 0 (0.0%) | 0 (0.0%) |
| 1 or 2 Children | 0 (0.0%) | 0 (0.0%) |
| 3 or 4 Children | 0 (0.0%) | 0 (0.0%) |
| 5 or more Children | 0 (0.0%) | 0 (0.0%) |
| Total | 0 (0.0%) | 0 (0.0%) |
Income Below Poverty Among Married-Couple vs Single-Parent Households in Fontanet
| Children | Married-Couple Families | Single-Parent Households |
| No Children | 0 (0.0%) | 0 (0.0%) |
| 1 or 2 Children | 0 (0.0%) | 0 (0.0%) |
| 3 or 4 Children | 0 (0.0%) | 0 (0.0%) |
| 5 or more Children | 0 (0.0%) | 0 (0.0%) |
| Total | 0 (0.0%) | 0 (0.0%) |
Race in Fontanet
The most populous races in Fontanet are , and White / Caucasian (148 | 100.0%).
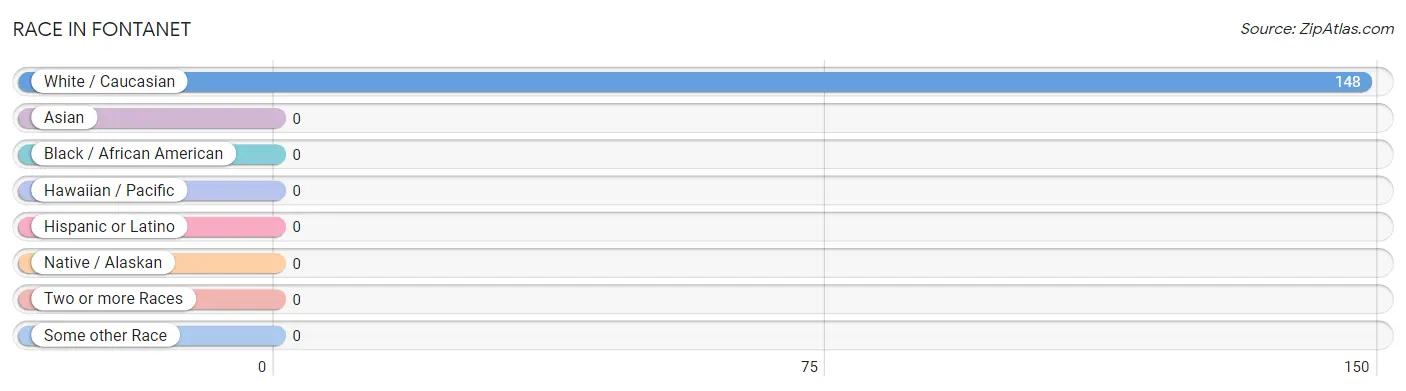
| Race | # Population | % Population |
| Asian | 0 | 0.0% |
| Black / African American | 0 | 0.0% |
| Hawaiian / Pacific | 0 | 0.0% |
| Hispanic or Latino | 0 | 0.0% |
| Native / Alaskan | 0 | 0.0% |
| White / Caucasian | 148 | 100.0% |
| Two or more Races | 0 | 0.0% |
| Some other Race | 0 | 0.0% |
| Total | 148 | 100.0% |
Ancestry in Fontanet
The most populous ancestries reported in Fontanet are German (86 | 58.1%), Irish (86 | 58.1%), American (32 | 21.6%), and Dutch (20 | 13.5%), together accounting for 151.3% of all Fontanet residents.
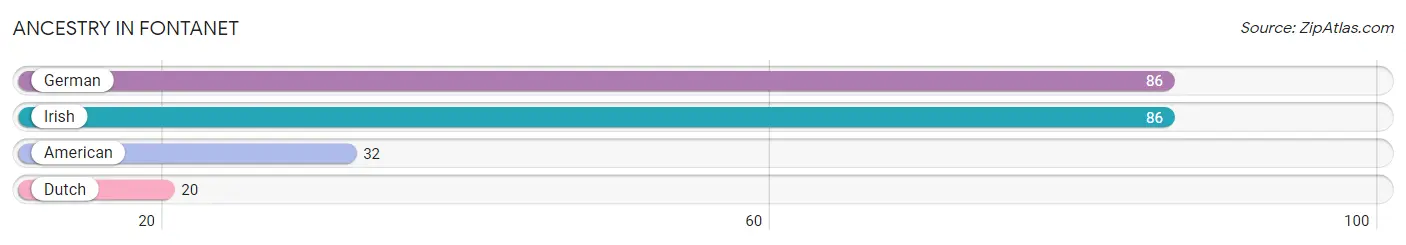
| Ancestry | # Population | % Population |
| American | 32 | 21.6% |
| Dutch | 20 | 13.5% |
| German | 86 | 58.1% |
| Irish | 86 | 58.1% | View All 4 Rows |
Immigrants in Fontanet

| Immigration Origin | # Population | % Population | View All 0 Rows |
Sex and Age in Fontanet
Sex and Age in Fontanet
The most populous age groups in Fontanet are 15 to 19 Years (12 | 60.0%) for men and 20 to 24 Years (32 | 25.0%) for women.
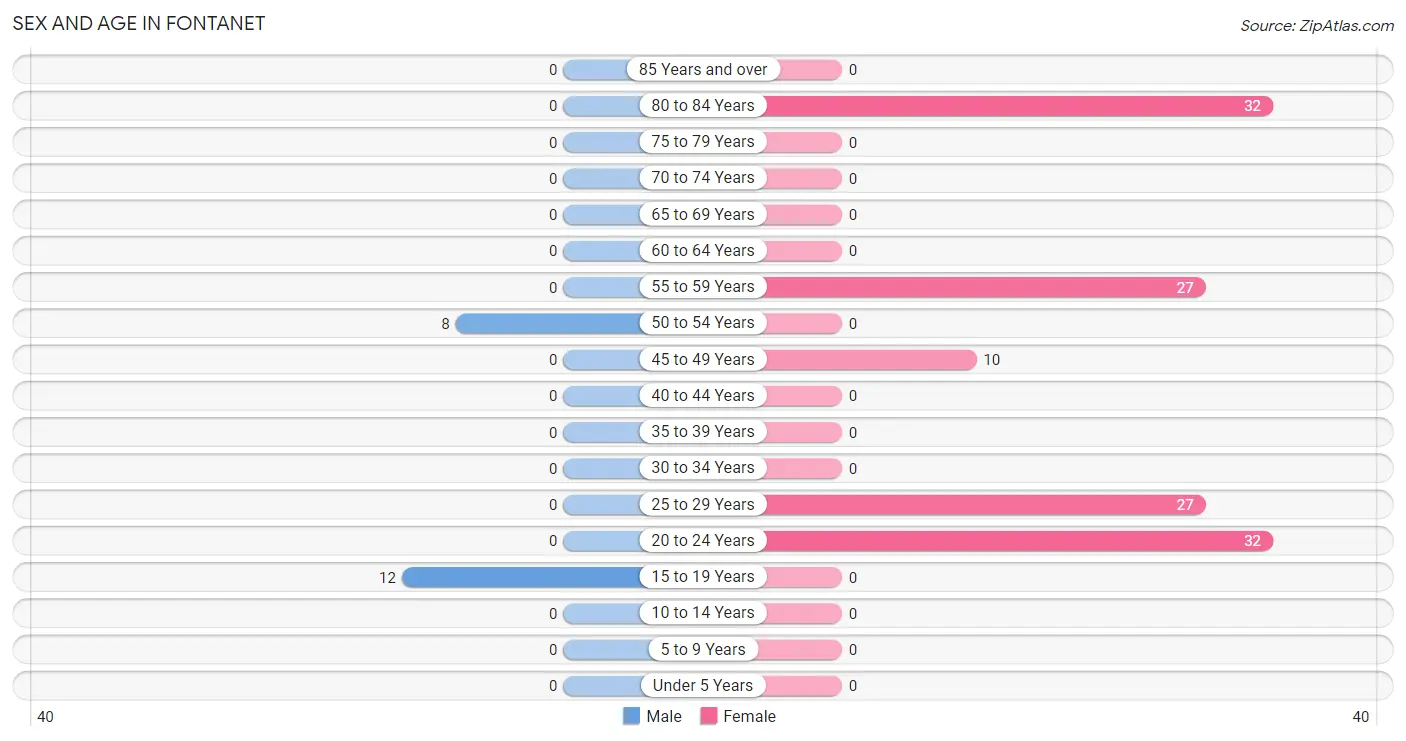
| Age Bracket | Male | Female |
| Under 5 Years | 0 (0.0%) | 0 (0.0%) |
| 5 to 9 Years | 0 (0.0%) | 0 (0.0%) |
| 10 to 14 Years | 0 (0.0%) | 0 (0.0%) |
| 15 to 19 Years | 12 (60.0%) | 0 (0.0%) |
| 20 to 24 Years | 0 (0.0%) | 32 (25.0%) |
| 25 to 29 Years | 0 (0.0%) | 27 (21.1%) |
| 30 to 34 Years | 0 (0.0%) | 0 (0.0%) |
| 35 to 39 Years | 0 (0.0%) | 0 (0.0%) |
| 40 to 44 Years | 0 (0.0%) | 0 (0.0%) |
| 45 to 49 Years | 0 (0.0%) | 10 (7.8%) |
| 50 to 54 Years | 8 (40.0%) | 0 (0.0%) |
| 55 to 59 Years | 0 (0.0%) | 27 (21.1%) |
| 60 to 64 Years | 0 (0.0%) | 0 (0.0%) |
| 65 to 69 Years | 0 (0.0%) | 0 (0.0%) |
| 70 to 74 Years | 0 (0.0%) | 0 (0.0%) |
| 75 to 79 Years | 0 (0.0%) | 0 (0.0%) |
| 80 to 84 Years | 0 (0.0%) | 32 (25.0%) |
| 85 Years and over | 0 (0.0%) | 0 (0.0%) |
| Total | 20 (100.0%) | 128 (100.0%) |
Families and Households in Fontanet
Median Family Size in Fontanet
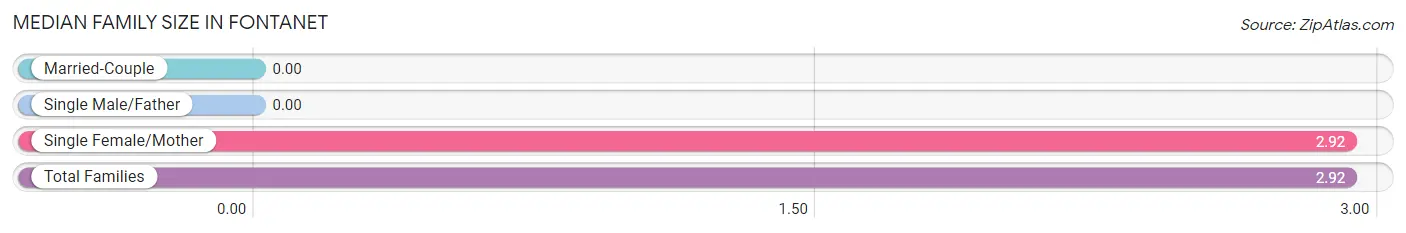
| Family Type | # Families | Family Size |
| Married-Couple | 0 (0.0%) | - |
| Single Male/Father | 0 (0.0%) | - |
| Single Female/Mother | 37 (100.0%) | 2.92 |
| Total Families | 37 (100.0%) | 2.92 |
Median Household Size in Fontanet
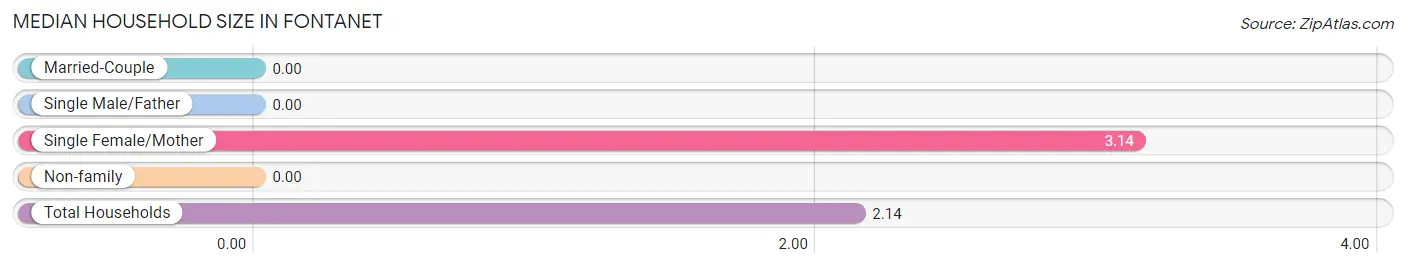
| Household Type | # Households | Household Size |
| Married-Couple | 0 (0.0%) | - |
| Single Male/Father | 0 (0.0%) | - |
| Single Female/Mother | 37 (53.6%) | 3.14 |
| Non-family | 32 (46.4%) | - |
| Total Households | 69 (100.0%) | 2.14 |
Household Size by Marriage Status in Fontanet
Out of a total of 69 households in Fontanet, 37 (53.6%) are family households, while 32 (46.4%) are nonfamily households. The most numerous type of family households are 3-person households, comprising 37, and the most common type of nonfamily households are 1-person households, comprising 32.
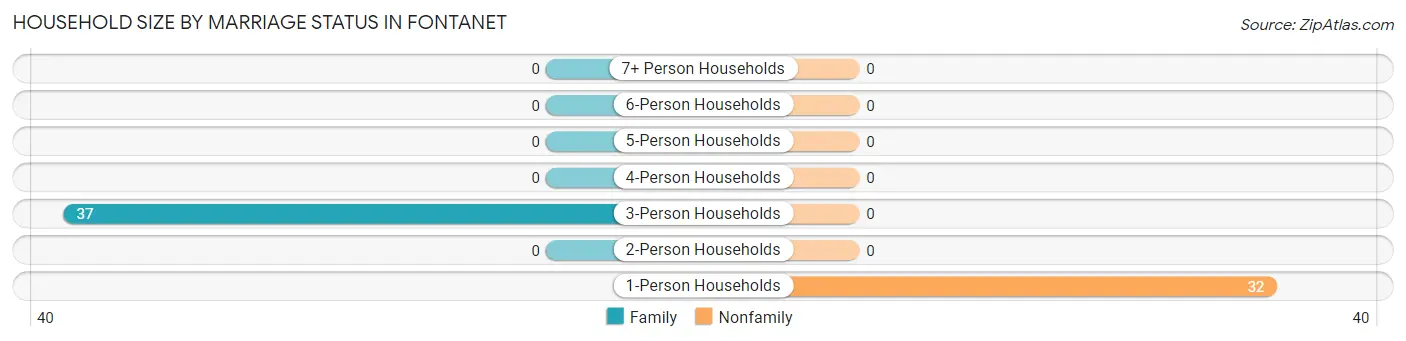
| Household Size | Family Households | Nonfamily Households |
| 1-Person Households | - | 32 (46.4%) |
| 2-Person Households | 0 (0.0%) | 0 (0.0%) |
| 3-Person Households | 37 (53.6%) | 0 (0.0%) |
| 4-Person Households | 0 (0.0%) | 0 (0.0%) |
| 5-Person Households | 0 (0.0%) | 0 (0.0%) |
| 6-Person Households | 0 (0.0%) | 0 (0.0%) |
| 7+ Person Households | 0 (0.0%) | 0 (0.0%) |
| Total | 37 (53.6%) | 32 (46.4%) |
Female Fertility in Fontanet
Fertility by Age in Fontanet
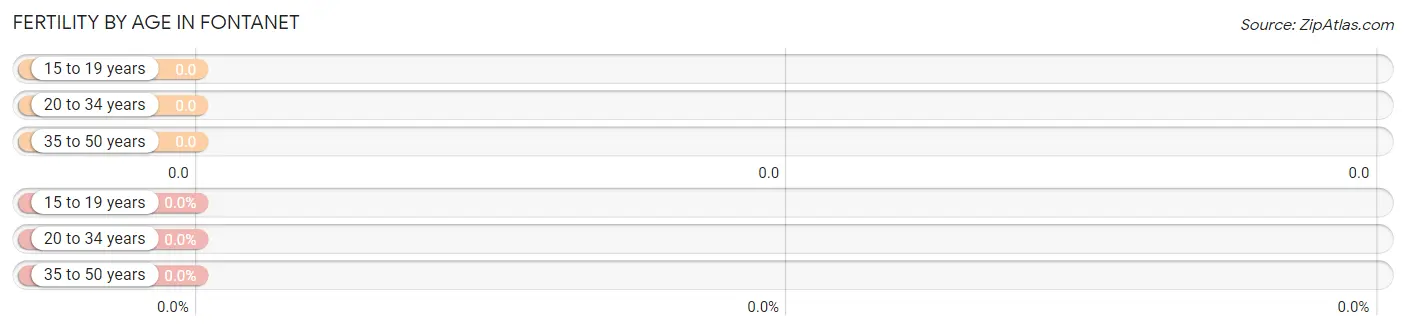
| Age Bracket | Women with Births | Births / 1,000 Women |
| 15 to 19 years | 0 (0.0%) | 0.0 |
| 20 to 34 years | 0 (0.0%) | 0.0 |
| 35 to 50 years | 0 (0.0%) | 0.0 |
| Total | 0 (0.0%) | 0.0 |
Fertility by Age by Marriage Status in Fontanet
| Age Bracket | Married | Unmarried |
| 15 to 19 years | 0 (0.0%) | 0 (0.0%) |
| 20 to 34 years | 0 (0.0%) | 0 (0.0%) |
| 35 to 50 years | 0 (0.0%) | 0 (0.0%) |
| Total | 0 (0.0%) | 0 (0.0%) |
Fertility by Education in Fontanet
| Educational Attainment | Women with Births | Births / 1,000 Women |
| Less than High School | 0 (0.0%) | 0.0 |
| High School Diploma | 0 (0.0%) | 0.0 |
| College or Associate's Degree | 0 (0.0%) | 0.0 |
| Bachelor's Degree | 0 (0.0%) | 0.0 |
| Graduate Degree | 0 (0.0%) | 0.0 |
| Total | 0 (0.0%) | 0.0 |
Fertility by Education by Marriage Status in Fontanet
| Educational Attainment | Married | Unmarried |
| Less than High School | 0 (0.0%) | 0 (0.0%) |
| High School Diploma | 0 (0.0%) | 0 (0.0%) |
| College or Associate's Degree | 0 (0.0%) | 0 (0.0%) |
| Bachelor's Degree | 0 (0.0%) | 0 (0.0%) |
| Graduate Degree | 0 (0.0%) | 0 (0.0%) |
| Total | 0 (0.0%) | 0 (0.0%) |
Employment Characteristics in Fontanet
Employment by Class of Employer in Fontanet
Among the 77 employed individuals in Fontanet, private company employees (40 | 51.9%), local government employees (27 | 35.1%), and not-for-profit organizations (10 | 13.0%) make up the most common classes of employment.
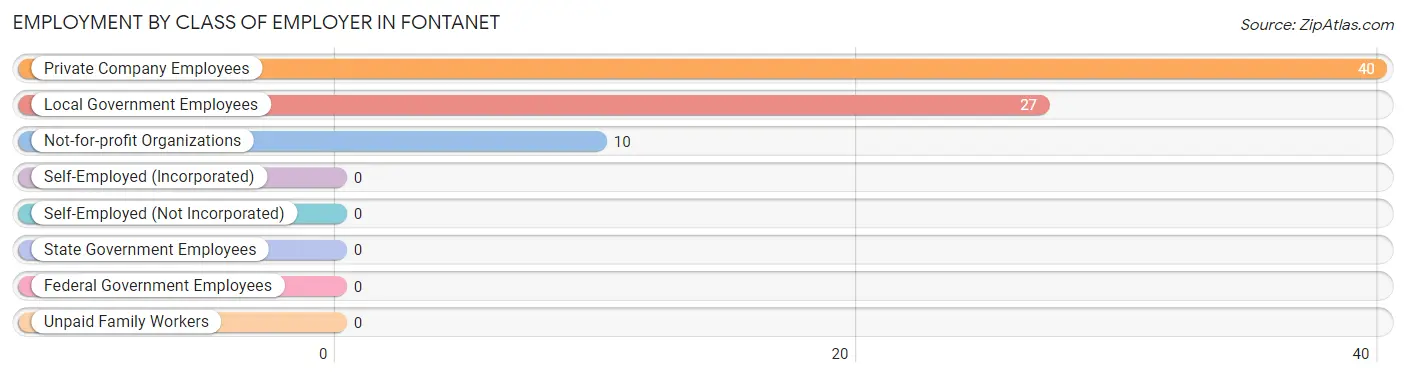
| Employer Class | # Employees | % Employees |
| Private Company Employees | 40 | 51.9% |
| Self-Employed (Incorporated) | 0 | 0.0% |
| Self-Employed (Not Incorporated) | 0 | 0.0% |
| Not-for-profit Organizations | 10 | 13.0% |
| Local Government Employees | 27 | 35.1% |
| State Government Employees | 0 | 0.0% |
| Federal Government Employees | 0 | 0.0% |
| Unpaid Family Workers | 0 | 0.0% |
| Total | 77 | 100.0% |
Employment Status by Age in Fontanet
According to the labor force statistics for Fontanet, out of the total population over 16 years of age (148), 73.6% or 109 individuals are in the labor force, with 29.4% or 32 of them unemployed. The age group with the highest labor force participation rate is 20 to 24 years, with 100.0% or 32 individuals in the labor force. Within the labor force, the 20 to 24 years age range has the highest percentage of unemployed individuals, with 100.0% or 32 of them being unemployed.
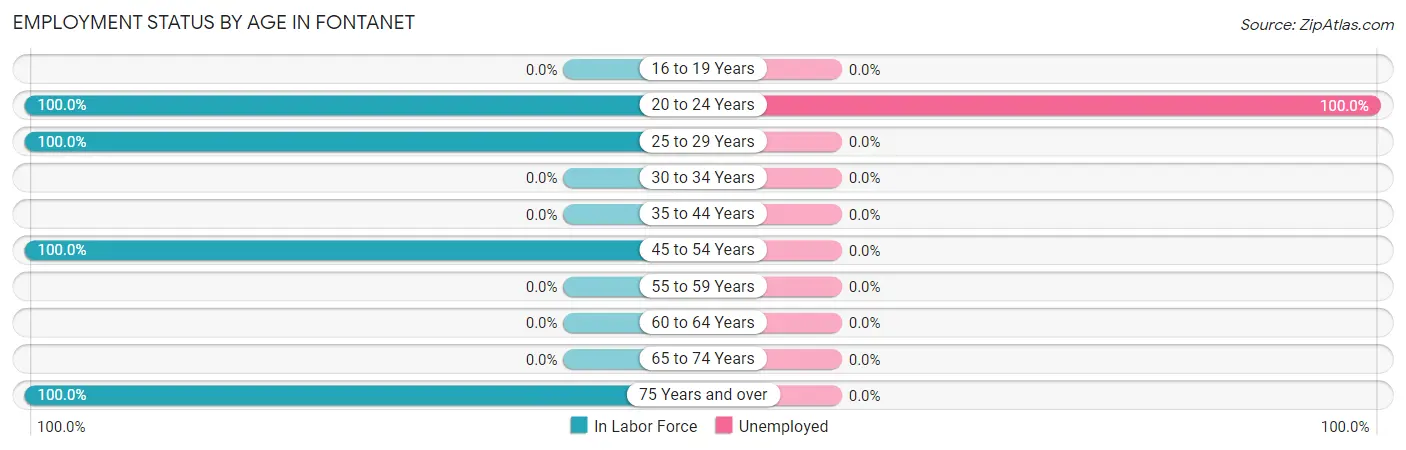
| Age Bracket | In Labor Force | Unemployed |
| 16 to 19 Years | 0 (0.0%) | 0 (0.0%) |
| 20 to 24 Years | 32 (100.0%) | 32 (100.0%) |
| 25 to 29 Years | 27 (100.0%) | 0 (0.0%) |
| 30 to 34 Years | 0 (0.0%) | 0 (0.0%) |
| 35 to 44 Years | 0 (0.0%) | 0 (0.0%) |
| 45 to 54 Years | 18 (100.0%) | 0 (0.0%) |
| 55 to 59 Years | 0 (0.0%) | 0 (0.0%) |
| 60 to 64 Years | 0 (0.0%) | 0 (0.0%) |
| 65 to 74 Years | 0 (0.0%) | 0 (0.0%) |
| 75 Years and over | 32 (100.0%) | 0 (0.0%) |
| Total | 109 (73.6%) | 32 (29.4%) |
Employment Status by Educational Attainment in Fontanet
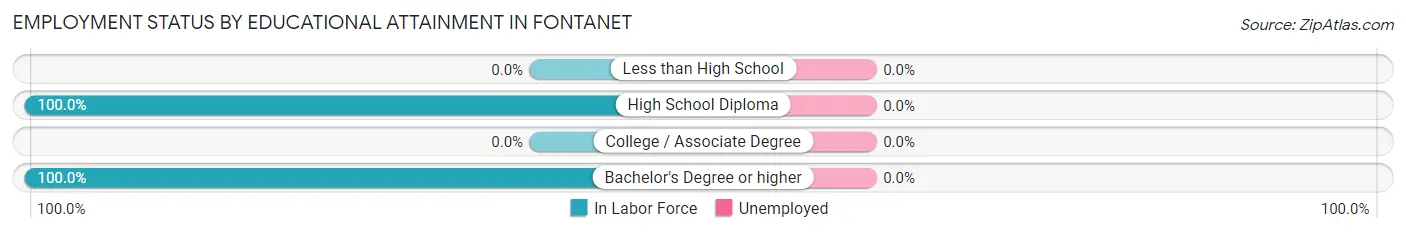
| Educational Attainment | In Labor Force | Unemployed |
| Less than High School | 0 (0.0%) | 0 (0.0%) |
| High School Diploma | 18 (100.0%) | 0 (0.0%) |
| College / Associate Degree | 0 (0.0%) | 0 (0.0%) |
| Bachelor's Degree or higher | 27 (100.0%) | 0 (0.0%) |
| Total | 45 (62.5%) | 0 (0.0%) |
Employment Occupations by Sex in Fontanet
Management, Business, Science and Arts Occupations
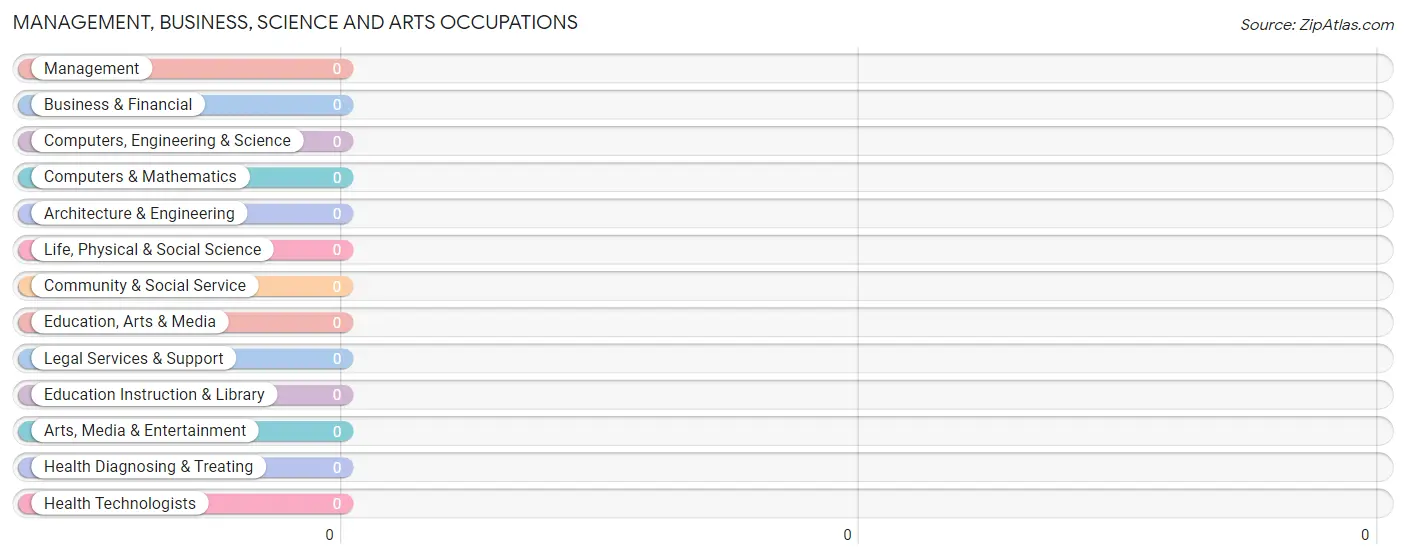
Management, Business, Science and Arts Occupations by Sex
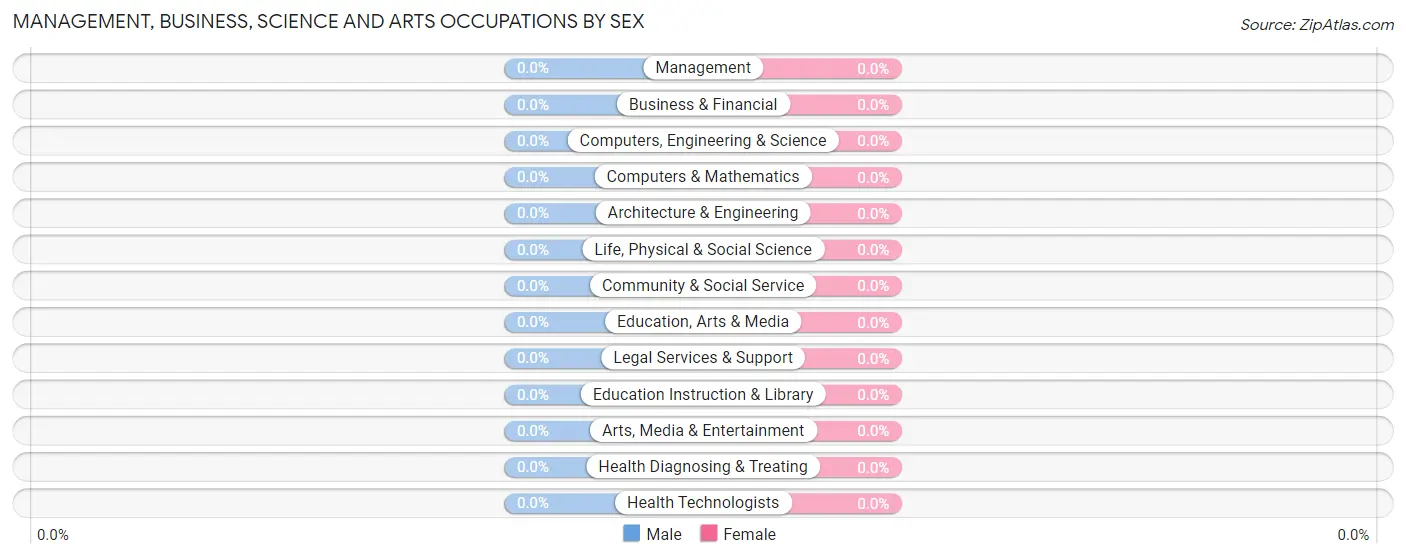
| Occupation | Male | Female |
| Management | 0 (0.0%) | 0 (0.0%) |
| Business & Financial | 0 (0.0%) | 0 (0.0%) |
| Computers, Engineering & Science | 0 (0.0%) | 0 (0.0%) |
| Computers & Mathematics | 0 (0.0%) | 0 (0.0%) |
| Architecture & Engineering | 0 (0.0%) | 0 (0.0%) |
| Life, Physical & Social Science | 0 (0.0%) | 0 (0.0%) |
| Community & Social Service | 0 (0.0%) | 0 (0.0%) |
| Education, Arts & Media | 0 (0.0%) | 0 (0.0%) |
| Legal Services & Support | 0 (0.0%) | 0 (0.0%) |
| Education Instruction & Library | 0 (0.0%) | 0 (0.0%) |
| Arts, Media & Entertainment | 0 (0.0%) | 0 (0.0%) |
| Health Diagnosing & Treating | 0 (0.0%) | 0 (0.0%) |
| Health Technologists | 0 (0.0%) | 0 (0.0%) |
| Total (Category) | 0 (0.0%) | 0 (0.0%) |
| Total (Overall) | 8 (10.4%) | 69 (89.6%) |
Services Occupations
The most common Services occupations in Fontanet are , and Healthcare Support (10 | 13.0%).
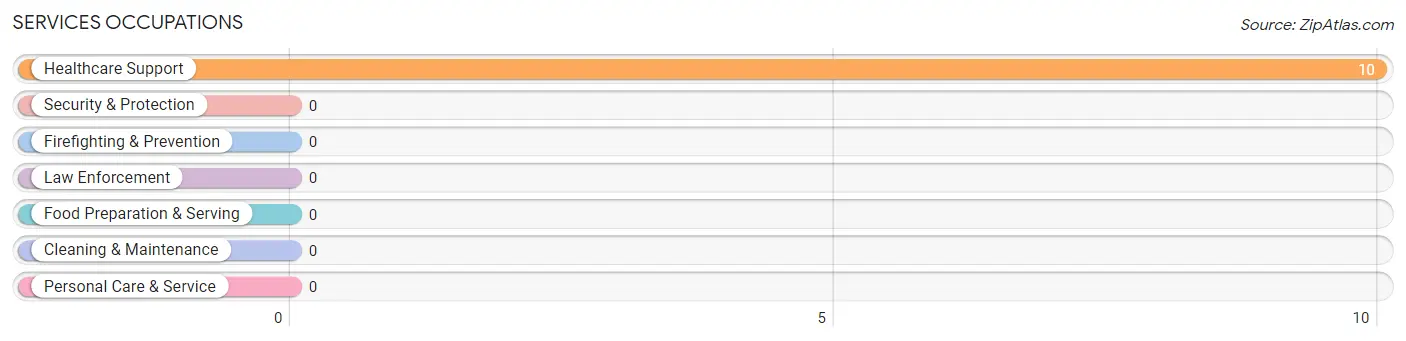
Services Occupations by Sex
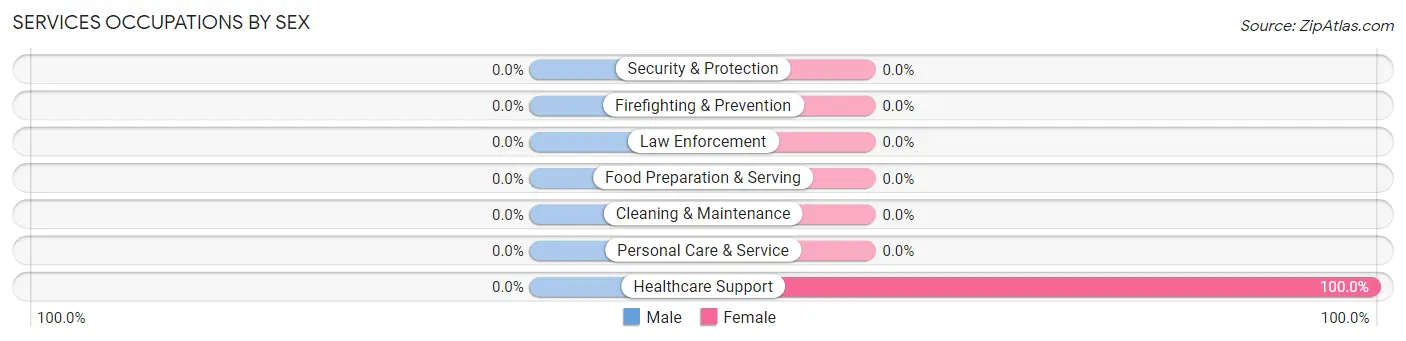
| Occupation | Male | Female |
| Healthcare Support | 0 (0.0%) | 10 (100.0%) |
| Security & Protection | 0 (0.0%) | 0 (0.0%) |
| Firefighting & Prevention | 0 (0.0%) | 0 (0.0%) |
| Law Enforcement | 0 (0.0%) | 0 (0.0%) |
| Food Preparation & Serving | 0 (0.0%) | 0 (0.0%) |
| Cleaning & Maintenance | 0 (0.0%) | 0 (0.0%) |
| Personal Care & Service | 0 (0.0%) | 0 (0.0%) |
| Total (Category) | 0 (0.0%) | 10 (100.0%) |
| Total (Overall) | 8 (10.4%) | 69 (89.6%) |
Sales and Office Occupations
The most common Sales and Office occupations in Fontanet are , and Office & Administration (27 | 35.1%).
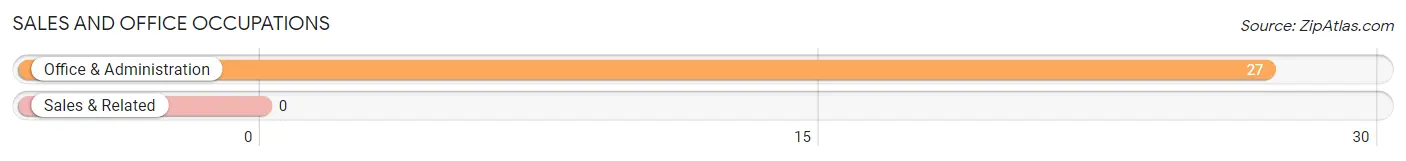
Sales and Office Occupations by Sex
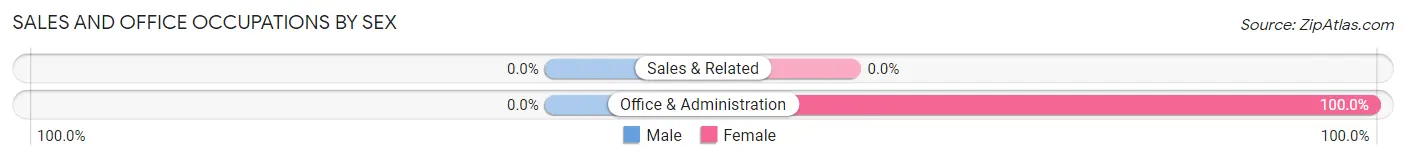
| Occupation | Male | Female |
| Sales & Related | 0 (0.0%) | 0 (0.0%) |
| Office & Administration | 0 (0.0%) | 27 (100.0%) |
| Total (Category) | 0 (0.0%) | 27 (100.0%) |
| Total (Overall) | 8 (10.4%) | 69 (89.6%) |
Natural Resources, Construction and Maintenance Occupations
Natural Resources, Construction and Maintenance Occupations by Sex
| Occupation | Male | Female |
| Farming, Fishing & Forestry | 0 (0.0%) | 0 (0.0%) |
| Construction & Extraction | 0 (0.0%) | 0 (0.0%) |
| Installation, Maintenance & Repair | 0 (0.0%) | 0 (0.0%) |
| Total (Category) | 0 (0.0%) | 0 (0.0%) |
| Total (Overall) | 8 (10.4%) | 69 (89.6%) |
Production, Transportation and Moving Occupations
The most common Production, Transportation and Moving occupations in Fontanet are , and Production (40 | 51.9%).
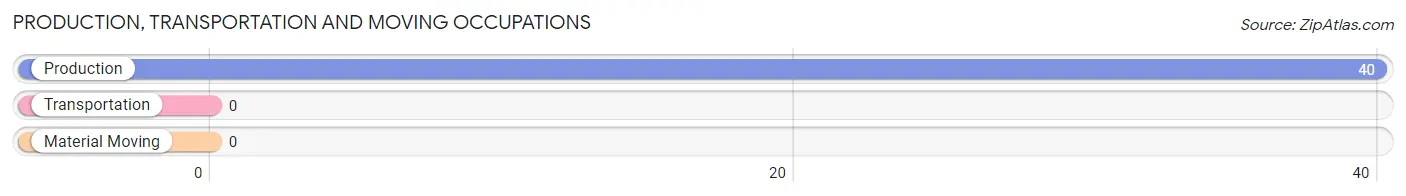
Production, Transportation and Moving Occupations by Sex
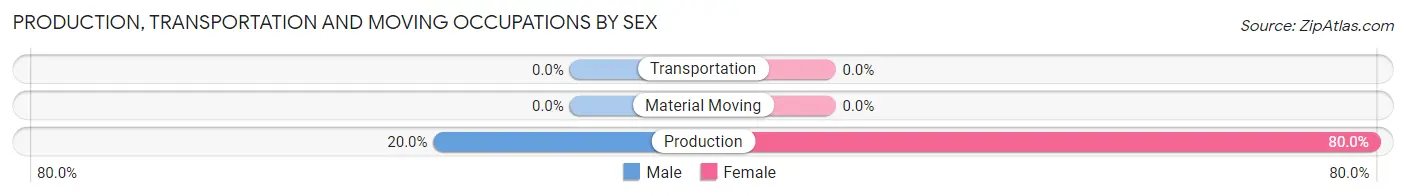
| Occupation | Male | Female |
| Production | 8 (20.0%) | 32 (80.0%) |
| Transportation | 0 (0.0%) | 0 (0.0%) |
| Material Moving | 0 (0.0%) | 0 (0.0%) |
| Total (Category) | 8 (20.0%) | 32 (80.0%) |
| Total (Overall) | 8 (10.4%) | 69 (89.6%) |
Employment Industries by Sex in Fontanet
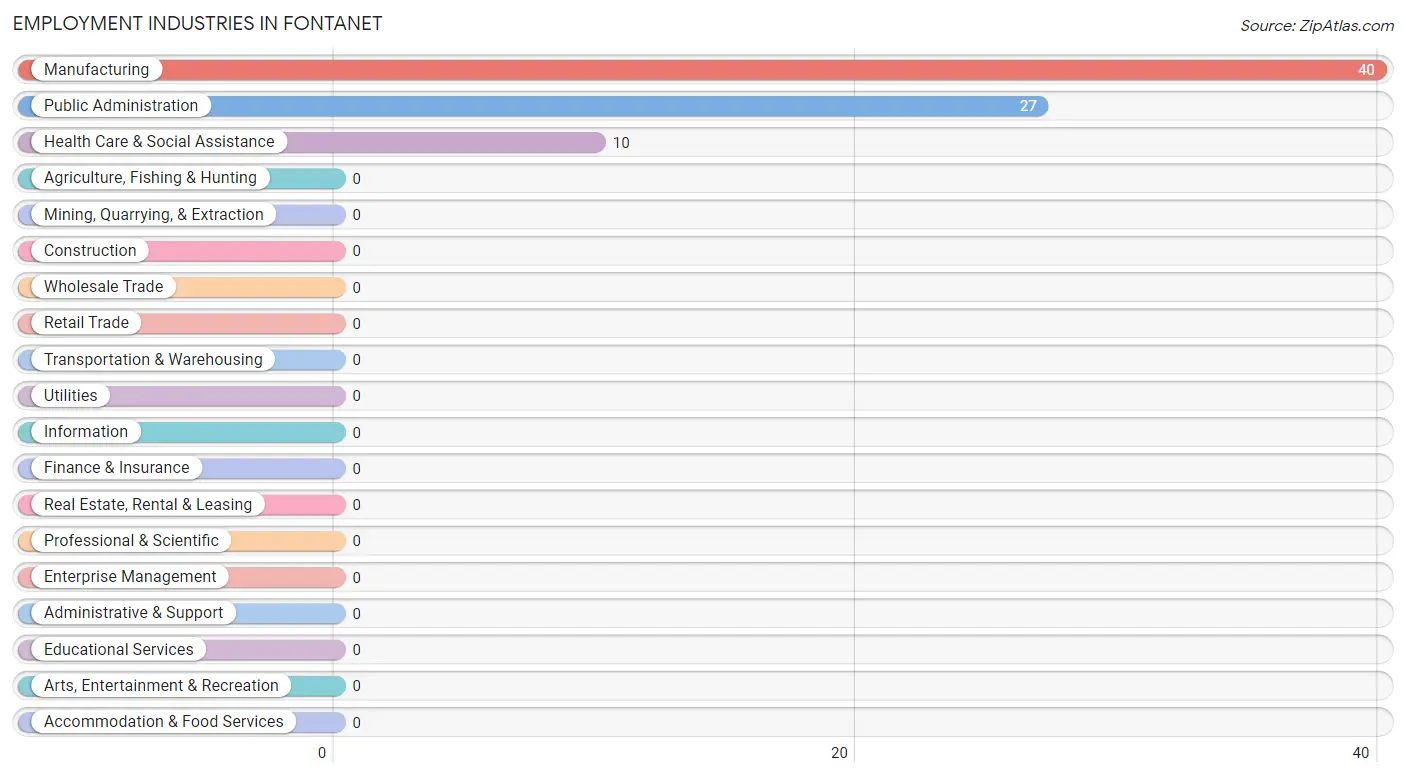
Employment Industries in Fontanet
The major employment industries in Fontanet include Manufacturing (40 | 51.9%), Public Administration (27 | 35.1%), and Health Care & Social Assistance (10 | 13.0%).
Employment Industries by Sex in Fontanet
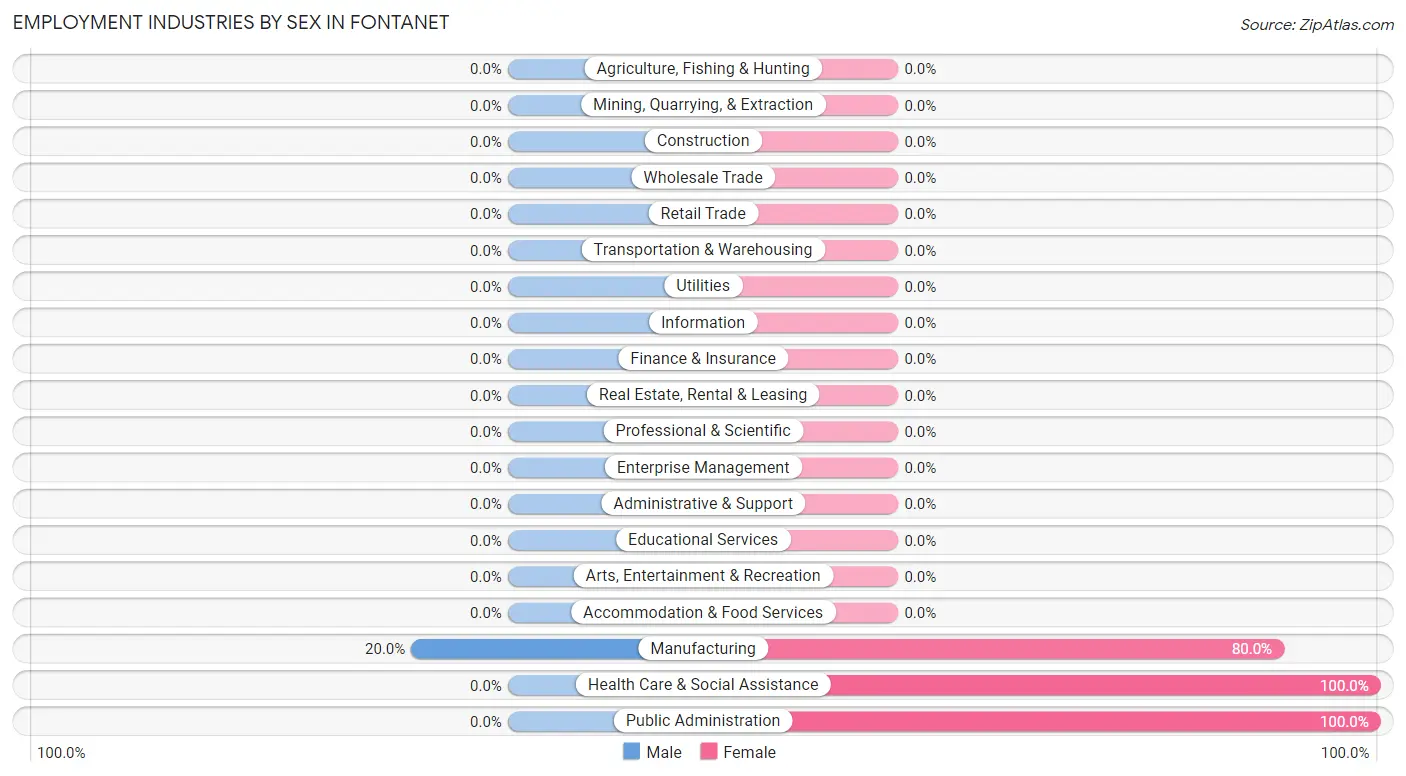
| Industry | Male | Female |
| Agriculture, Fishing & Hunting | 0 (0.0%) | 0 (0.0%) |
| Mining, Quarrying, & Extraction | 0 (0.0%) | 0 (0.0%) |
| Construction | 0 (0.0%) | 0 (0.0%) |
| Manufacturing | 8 (20.0%) | 32 (80.0%) |
| Wholesale Trade | 0 (0.0%) | 0 (0.0%) |
| Retail Trade | 0 (0.0%) | 0 (0.0%) |
| Transportation & Warehousing | 0 (0.0%) | 0 (0.0%) |
| Utilities | 0 (0.0%) | 0 (0.0%) |
| Information | 0 (0.0%) | 0 (0.0%) |
| Finance & Insurance | 0 (0.0%) | 0 (0.0%) |
| Real Estate, Rental & Leasing | 0 (0.0%) | 0 (0.0%) |
| Professional & Scientific | 0 (0.0%) | 0 (0.0%) |
| Enterprise Management | 0 (0.0%) | 0 (0.0%) |
| Administrative & Support | 0 (0.0%) | 0 (0.0%) |
| Educational Services | 0 (0.0%) | 0 (0.0%) |
| Health Care & Social Assistance | 0 (0.0%) | 10 (100.0%) |
| Arts, Entertainment & Recreation | 0 (0.0%) | 0 (0.0%) |
| Accommodation & Food Services | 0 (0.0%) | 0 (0.0%) |
| Public Administration | 0 (0.0%) | 27 (100.0%) |
| Total | 8 (10.4%) | 69 (89.6%) |
Education in Fontanet
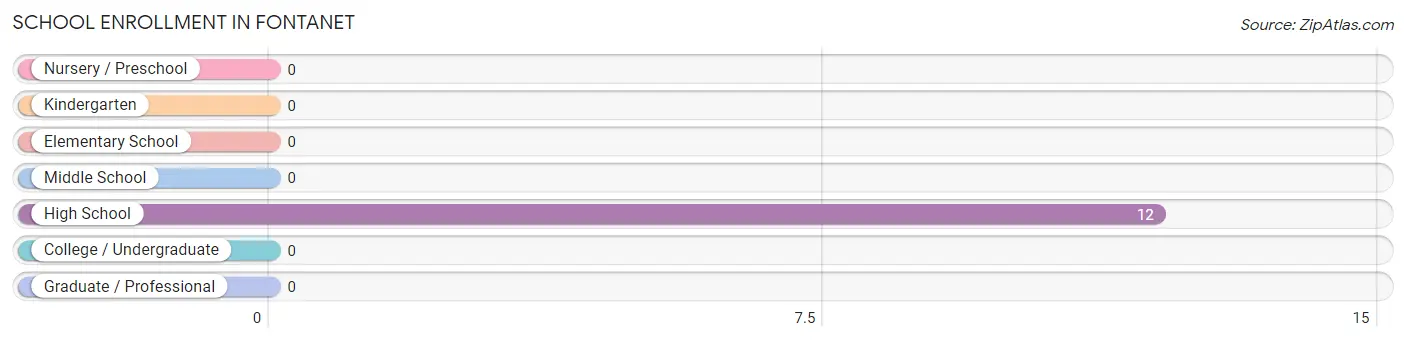
School Enrollment in Fontanet
| School Level | # Students | % Students |
| Nursery / Preschool | 0 | 0.0% |
| Kindergarten | 0 | 0.0% |
| Elementary School | 0 | 0.0% |
| Middle School | 0 | 0.0% |
| High School | 12 | 100.0% |
| College / Undergraduate | 0 | 0.0% |
| Graduate / Professional | 0 | 0.0% |
| Total | 12 | 100.0% |
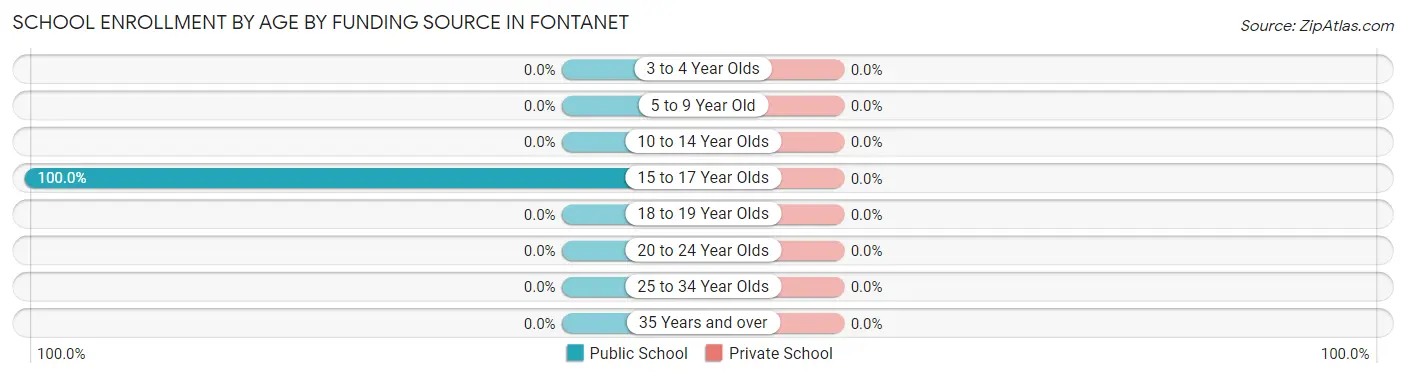
School Enrollment by Age by Funding Source in Fontanet
| Age Bracket | Public School | Private School |
| 3 to 4 Year Olds | 0 (0.0%) | 0 (0.0%) |
| 5 to 9 Year Old | 0 (0.0%) | 0 (0.0%) |
| 10 to 14 Year Olds | 0 (0.0%) | 0 (0.0%) |
| 15 to 17 Year Olds | 12 (100.0%) | 0 (0.0%) |
| 18 to 19 Year Olds | 0 (0.0%) | 0 (0.0%) |
| 20 to 24 Year Olds | 0 (0.0%) | 0 (0.0%) |
| 25 to 34 Year Olds | 0 (0.0%) | 0 (0.0%) |
| 35 Years and over | 0 (0.0%) | 0 (0.0%) |
| Total | 12 (100.0%) | 0 (0.0%) |
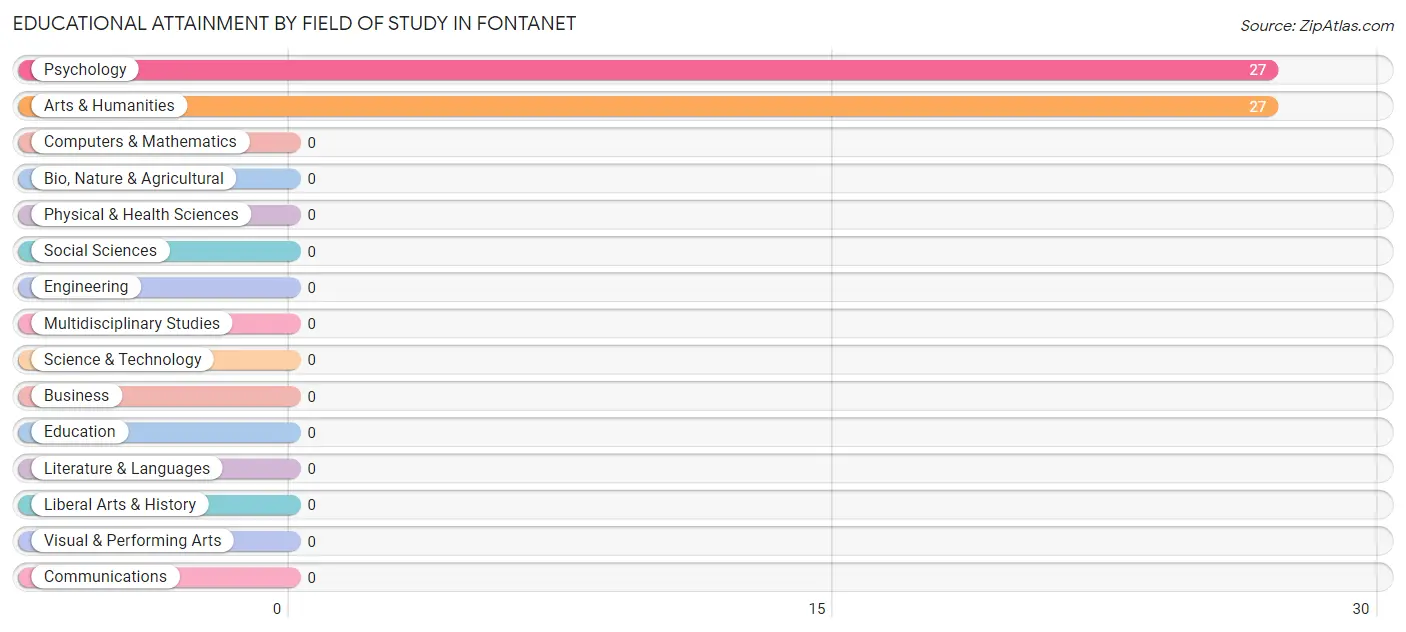
Educational Attainment by Field of Study in Fontanet
Psychology (27 | 50.0%), and arts & humanities (27 | 50.0%) are the most common fields of study among 54 individuals in Fontanet who have obtained a bachelor's degree or higher.
| Field of Study | # Graduates | % Graduates |
| Computers & Mathematics | 0 | 0.0% |
| Bio, Nature & Agricultural | 0 | 0.0% |
| Physical & Health Sciences | 0 | 0.0% |
| Psychology | 27 | 50.0% |
| Social Sciences | 0 | 0.0% |
| Engineering | 0 | 0.0% |
| Multidisciplinary Studies | 0 | 0.0% |
| Science & Technology | 0 | 0.0% |
| Business | 0 | 0.0% |
| Education | 0 | 0.0% |
| Literature & Languages | 0 | 0.0% |
| Liberal Arts & History | 0 | 0.0% |
| Visual & Performing Arts | 0 | 0.0% |
| Communications | 0 | 0.0% |
| Arts & Humanities | 27 | 50.0% |
| Total | 54 | 100.0% |
Transportation & Commute in Fontanet
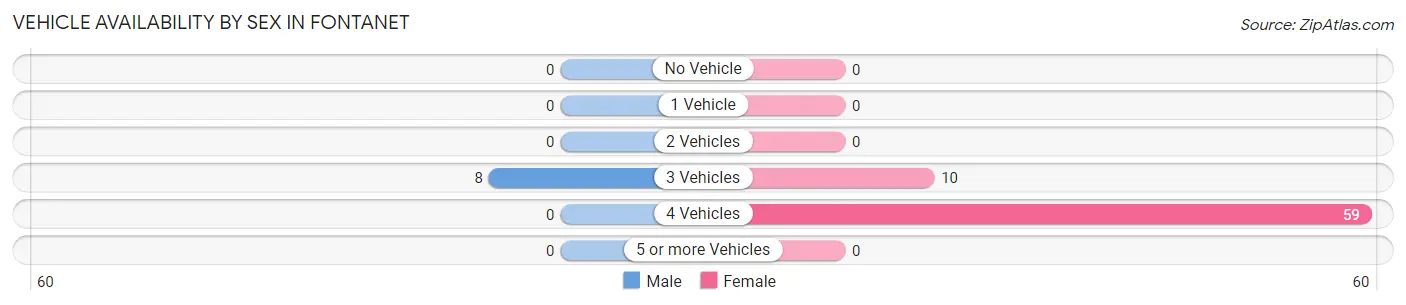
Vehicle Availability by Sex in Fontanet
The most prevalent vehicle ownership categories in Fontanet are males with 3 vehicles (8, accounting for 100.0%) and females with 3 vehicles (10, making up 11.6%).
| Vehicles Available | Male | Female |
| No Vehicle | 0 (0.0%) | 0 (0.0%) |
| 1 Vehicle | 0 (0.0%) | 0 (0.0%) |
| 2 Vehicles | 0 (0.0%) | 0 (0.0%) |
| 3 Vehicles | 8 (100.0%) | 10 (14.5%) |
| 4 Vehicles | 0 (0.0%) | 59 (85.5%) |
| 5 or more Vehicles | 0 (0.0%) | 0 (0.0%) |
| Total | 8 (100.0%) | 69 (100.0%) |
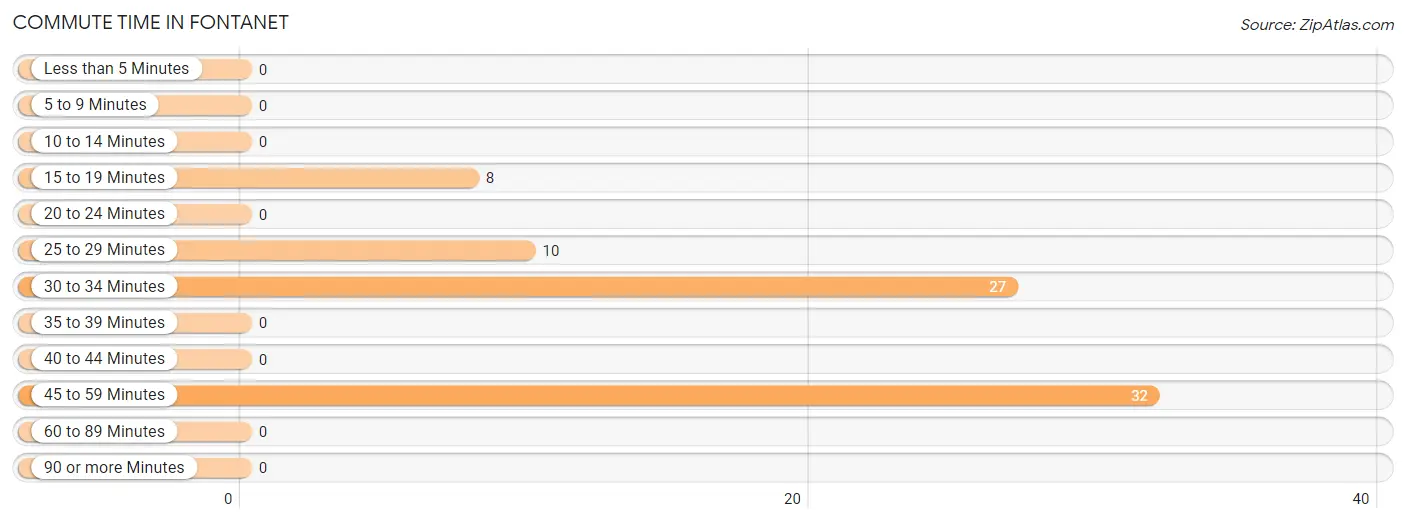
Commute Time in Fontanet
The most frequently occuring commute durations in Fontanet are 45 to 59 minutes (32 commuters, 41.6%), 30 to 34 minutes (27 commuters, 35.1%), and 25 to 29 minutes (10 commuters, 13.0%).
| Commute Time | # Commuters | % Commuters |
| Less than 5 Minutes | 0 | 0.0% |
| 5 to 9 Minutes | 0 | 0.0% |
| 10 to 14 Minutes | 0 | 0.0% |
| 15 to 19 Minutes | 8 | 10.4% |
| 20 to 24 Minutes | 0 | 0.0% |
| 25 to 29 Minutes | 10 | 13.0% |
| 30 to 34 Minutes | 27 | 35.1% |
| 35 to 39 Minutes | 0 | 0.0% |
| 40 to 44 Minutes | 0 | 0.0% |
| 45 to 59 Minutes | 32 | 41.6% |
| 60 to 89 Minutes | 0 | 0.0% |
| 90 or more Minutes | 0 | 0.0% |
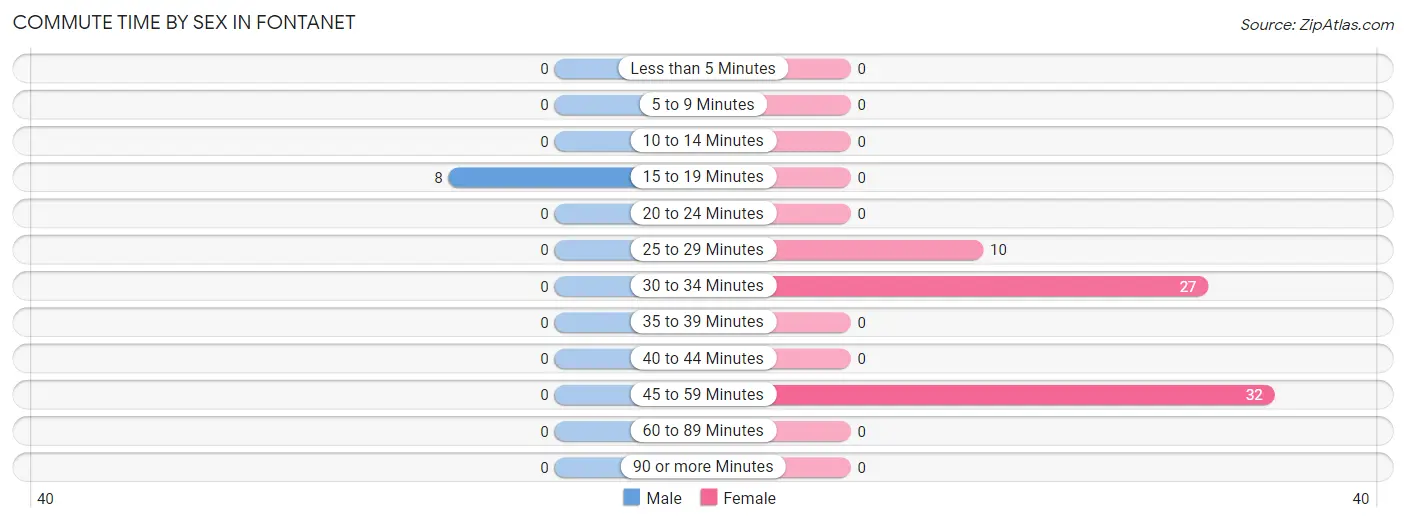
Commute Time by Sex in Fontanet
The most common commute times in Fontanet are 15 to 19 minutes (8 commuters, 100.0%) for males and 45 to 59 minutes (32 commuters, 46.4%) for females.
| Commute Time | Male | Female |
| Less than 5 Minutes | 0 (0.0%) | 0 (0.0%) |
| 5 to 9 Minutes | 0 (0.0%) | 0 (0.0%) |
| 10 to 14 Minutes | 0 (0.0%) | 0 (0.0%) |
| 15 to 19 Minutes | 8 (100.0%) | 0 (0.0%) |
| 20 to 24 Minutes | 0 (0.0%) | 0 (0.0%) |
| 25 to 29 Minutes | 0 (0.0%) | 10 (14.5%) |
| 30 to 34 Minutes | 0 (0.0%) | 27 (39.1%) |
| 35 to 39 Minutes | 0 (0.0%) | 0 (0.0%) |
| 40 to 44 Minutes | 0 (0.0%) | 0 (0.0%) |
| 45 to 59 Minutes | 0 (0.0%) | 32 (46.4%) |
| 60 to 89 Minutes | 0 (0.0%) | 0 (0.0%) |
| 90 or more Minutes | 0 (0.0%) | 0 (0.0%) |
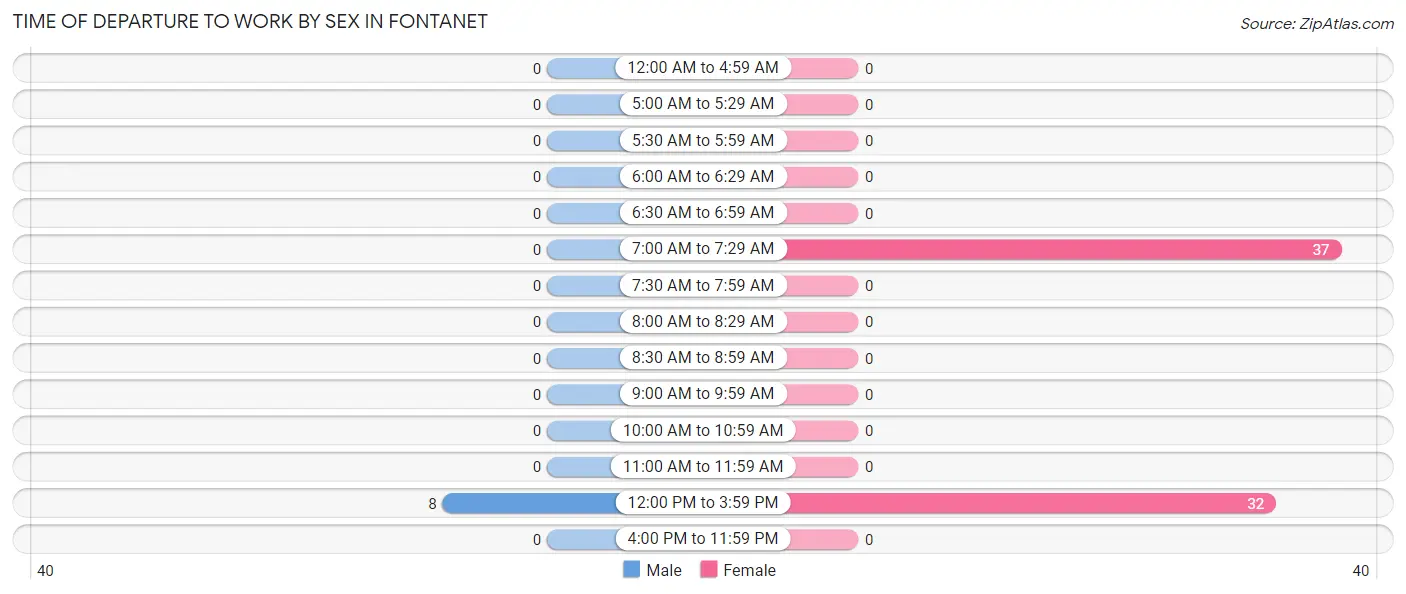
Time of Departure to Work by Sex in Fontanet
The most frequent times of departure to work in Fontanet are 12:00 PM to 3:59 PM (8, 100.0%) for males and 7:00 AM to 7:29 AM (37, 53.6%) for females.
| Time of Departure | Male | Female |
| 12:00 AM to 4:59 AM | 0 (0.0%) | 0 (0.0%) |
| 5:00 AM to 5:29 AM | 0 (0.0%) | 0 (0.0%) |
| 5:30 AM to 5:59 AM | 0 (0.0%) | 0 (0.0%) |
| 6:00 AM to 6:29 AM | 0 (0.0%) | 0 (0.0%) |
| 6:30 AM to 6:59 AM | 0 (0.0%) | 0 (0.0%) |
| 7:00 AM to 7:29 AM | 0 (0.0%) | 37 (53.6%) |
| 7:30 AM to 7:59 AM | 0 (0.0%) | 0 (0.0%) |
| 8:00 AM to 8:29 AM | 0 (0.0%) | 0 (0.0%) |
| 8:30 AM to 8:59 AM | 0 (0.0%) | 0 (0.0%) |
| 9:00 AM to 9:59 AM | 0 (0.0%) | 0 (0.0%) |
| 10:00 AM to 10:59 AM | 0 (0.0%) | 0 (0.0%) |
| 11:00 AM to 11:59 AM | 0 (0.0%) | 0 (0.0%) |
| 12:00 PM to 3:59 PM | 8 (100.0%) | 32 (46.4%) |
| 4:00 PM to 11:59 PM | 0 (0.0%) | 0 (0.0%) |
| Total | 8 (100.0%) | 69 (100.0%) |
Housing Occupancy in Fontanet
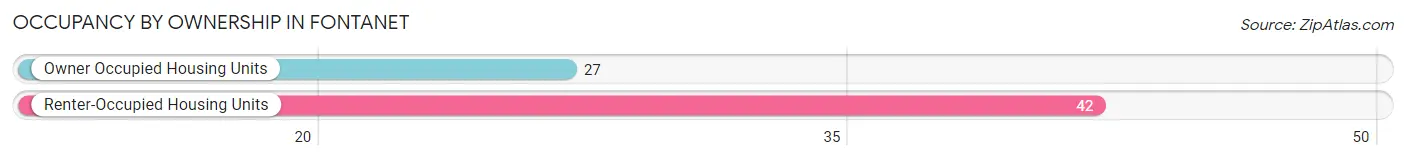
Occupancy by Ownership in Fontanet
Of the total 69 dwellings in Fontanet, owner-occupied units account for 27 (39.1%), while renter-occupied units make up 42 (60.9%).
| Occupancy | # Housing Units | % Housing Units |
| Owner Occupied Housing Units | 27 | 39.1% |
| Renter-Occupied Housing Units | 42 | 60.9% |
| Total Occupied Housing Units | 69 | 100.0% |
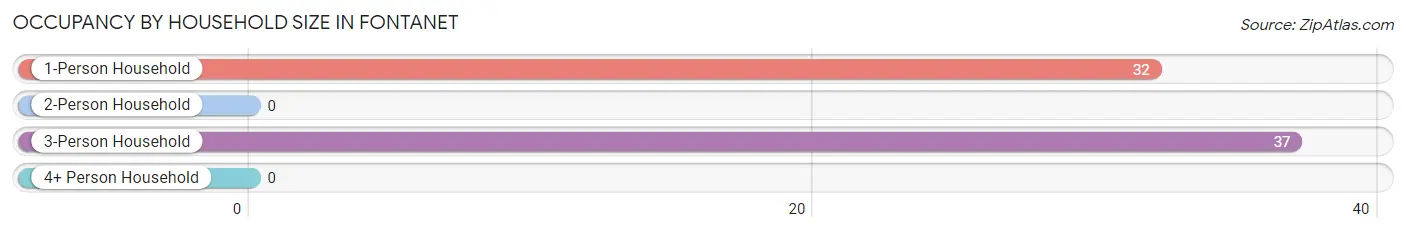
Occupancy by Household Size in Fontanet
| Household Size | # Housing Units | % Housing Units |
| 1-Person Household | 32 | 46.4% |
| 2-Person Household | 0 | 0.0% |
| 3-Person Household | 37 | 53.6% |
| 4+ Person Household | 0 | 0.0% |
| Total Housing Units | 69 | 100.0% |
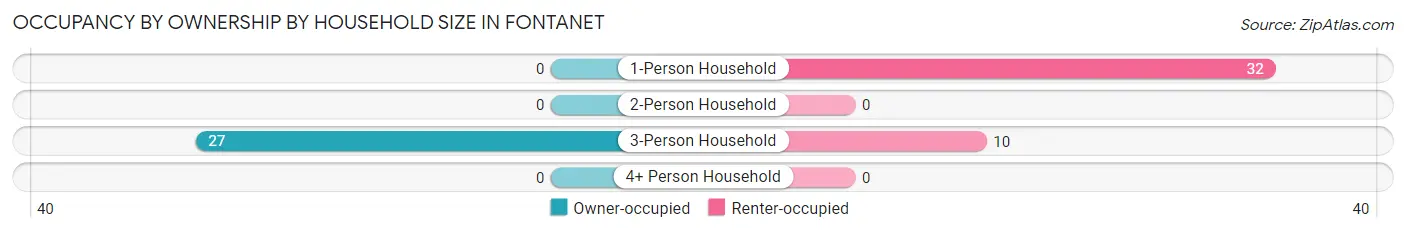
Occupancy by Ownership by Household Size in Fontanet
| Household Size | Owner-occupied | Renter-occupied |
| 1-Person Household | 0 (0.0%) | 32 (100.0%) |
| 2-Person Household | 0 (0.0%) | 0 (0.0%) |
| 3-Person Household | 27 (73.0%) | 10 (27.0%) |
| 4+ Person Household | 0 (0.0%) | 0 (0.0%) |
| Total Housing Units | 27 (39.1%) | 42 (60.9%) |
Occupancy by Educational Attainment in Fontanet
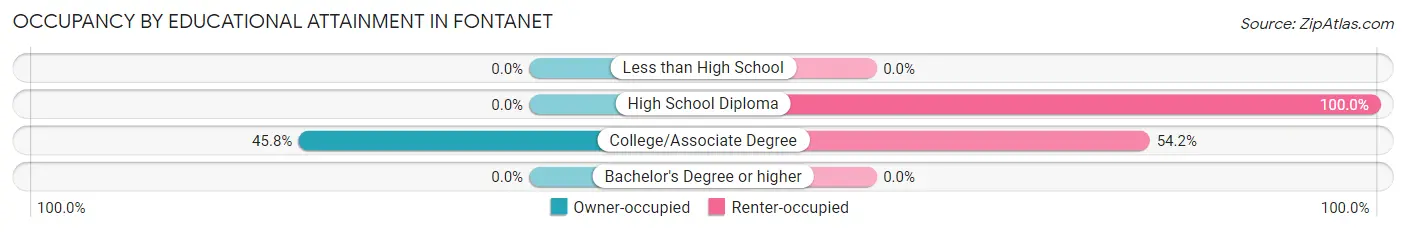
| Household Size | Owner-occupied | Renter-occupied |
| Less than High School | 0 (0.0%) | 0 (0.0%) |
| High School Diploma | 0 (0.0%) | 10 (100.0%) |
| College/Associate Degree | 27 (45.8%) | 32 (54.2%) |
| Bachelor's Degree or higher | 0 (0.0%) | 0 (0.0%) |
Occupancy by Age of Householder in Fontanet
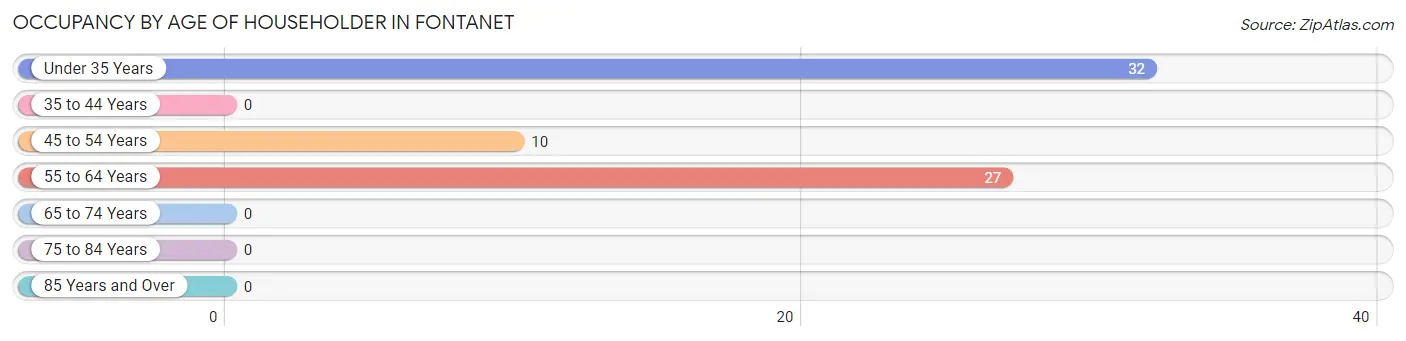
| Age Bracket | # Households | % Households |
| Under 35 Years | 32 | 46.4% |
| 35 to 44 Years | 0 | 0.0% |
| 45 to 54 Years | 10 | 14.5% |
| 55 to 64 Years | 27 | 39.1% |
| 65 to 74 Years | 0 | 0.0% |
| 75 to 84 Years | 0 | 0.0% |
| 85 Years and Over | 0 | 0.0% |
| Total | 69 | 100.0% |
Housing Finances in Fontanet
Median Income by Occupancy in Fontanet
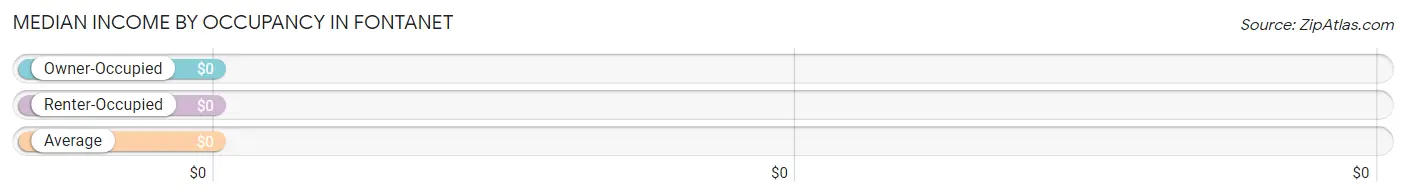
| Occupancy Type | # Households | Median Income |
| Owner-Occupied | 27 (39.1%) | $0 |
| Renter-Occupied | 42 (60.9%) | $0 |
| Average | 69 (100.0%) | $0 |
Occupancy by Householder Income Bracket in Fontanet
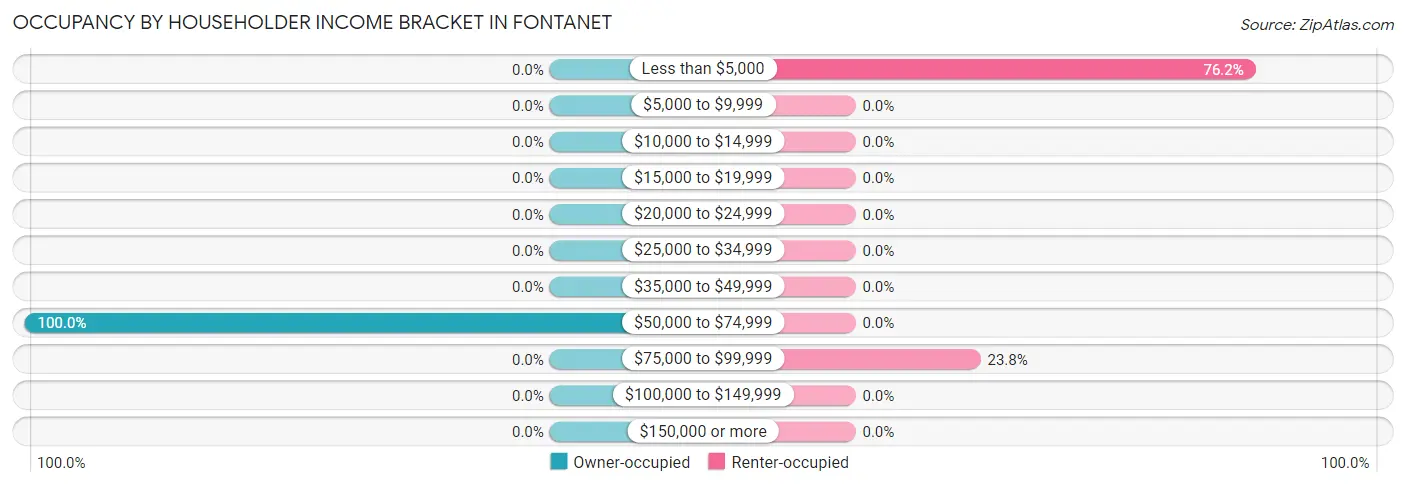
| Income Bracket | Owner-occupied | Renter-occupied |
| Less than $5,000 | 0 (0.0%) | 32 (76.2%) |
| $5,000 to $9,999 | 0 (0.0%) | 0 (0.0%) |
| $10,000 to $14,999 | 0 (0.0%) | 0 (0.0%) |
| $15,000 to $19,999 | 0 (0.0%) | 0 (0.0%) |
| $20,000 to $24,999 | 0 (0.0%) | 0 (0.0%) |
| $25,000 to $34,999 | 0 (0.0%) | 0 (0.0%) |
| $35,000 to $49,999 | 0 (0.0%) | 0 (0.0%) |
| $50,000 to $74,999 | 27 (100.0%) | 0 (0.0%) |
| $75,000 to $99,999 | 0 (0.0%) | 10 (23.8%) |
| $100,000 to $149,999 | 0 (0.0%) | 0 (0.0%) |
| $150,000 or more | 0 (0.0%) | 0 (0.0%) |
| Total | 27 (100.0%) | 42 (100.0%) |
Monthly Housing Cost Tiers in Fontanet
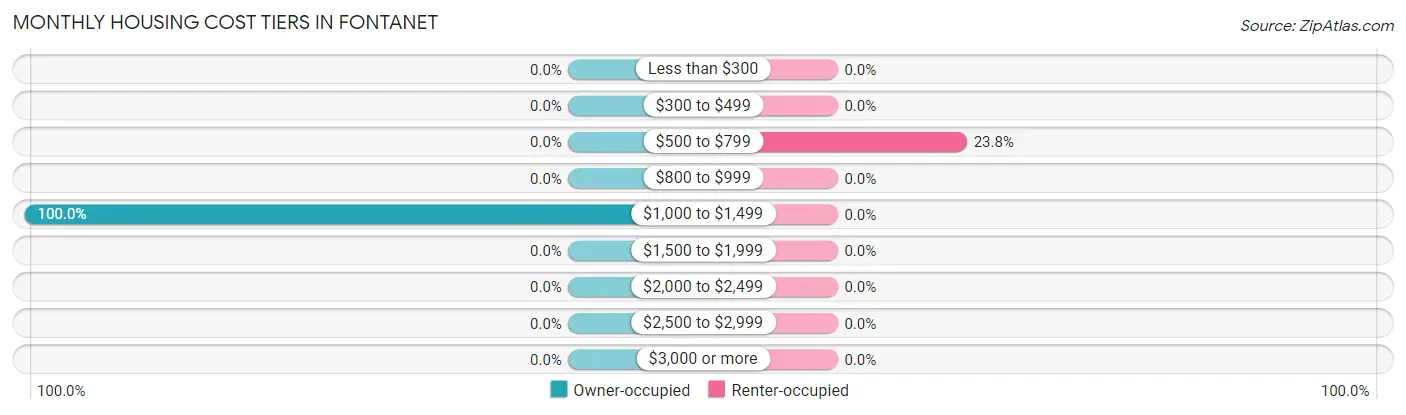
| Monthly Cost | Owner-occupied | Renter-occupied |
| Less than $300 | 0 (0.0%) | 0 (0.0%) |
| $300 to $499 | 0 (0.0%) | 0 (0.0%) |
| $500 to $799 | 0 (0.0%) | 10 (23.8%) |
| $800 to $999 | 0 (0.0%) | 0 (0.0%) |
| $1,000 to $1,499 | 27 (100.0%) | 0 (0.0%) |
| $1,500 to $1,999 | 0 (0.0%) | 0 (0.0%) |
| $2,000 to $2,499 | 0 (0.0%) | 0 (0.0%) |
| $2,500 to $2,999 | 0 (0.0%) | 0 (0.0%) |
| $3,000 or more | 0 (0.0%) | 0 (0.0%) |
| Total | 27 (100.0%) | 42 (100.0%) |
Physical Housing Characteristics in Fontanet
Housing Structures in Fontanet
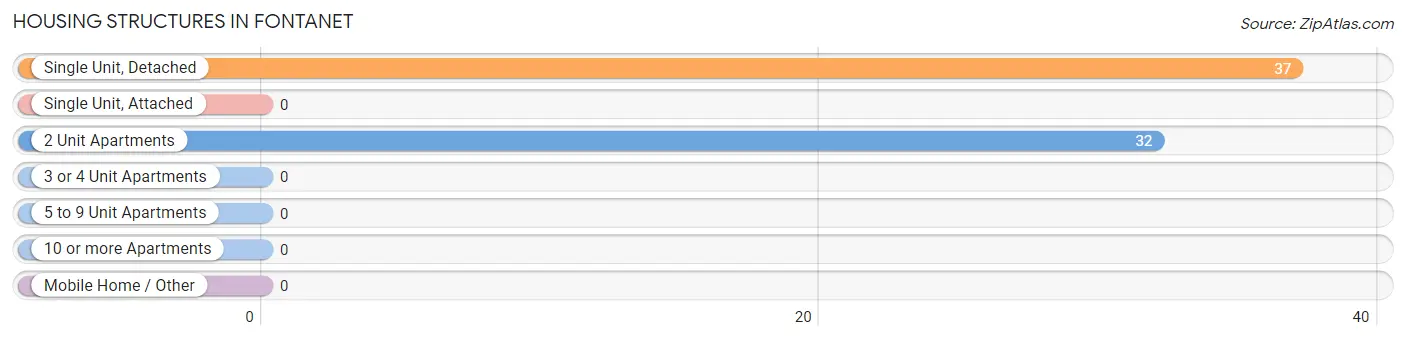
| Structure Type | # Housing Units | % Housing Units |
| Single Unit, Detached | 37 | 53.6% |
| Single Unit, Attached | 0 | 0.0% |
| 2 Unit Apartments | 32 | 46.4% |
| 3 or 4 Unit Apartments | 0 | 0.0% |
| 5 to 9 Unit Apartments | 0 | 0.0% |
| 10 or more Apartments | 0 | 0.0% |
| Mobile Home / Other | 0 | 0.0% |
| Total | 69 | 100.0% |
Housing Structures by Occupancy in Fontanet
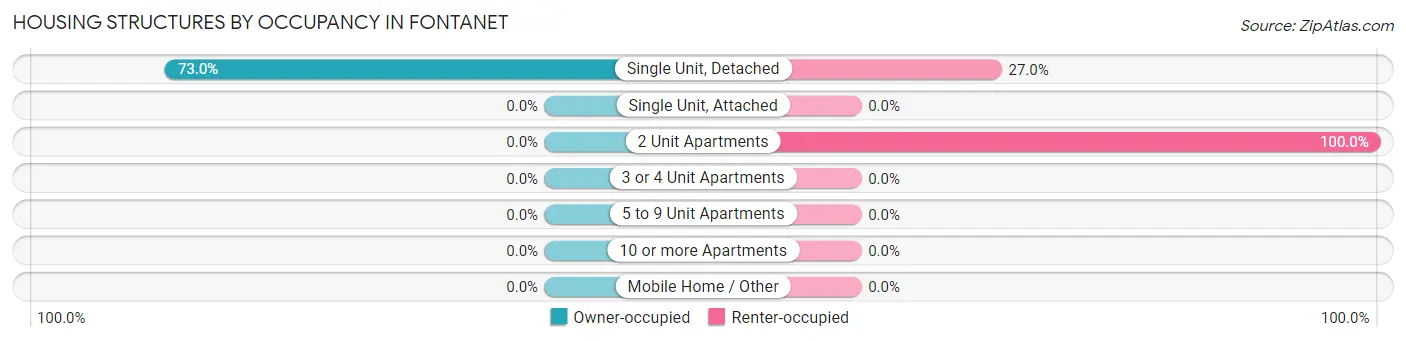
| Structure Type | Owner-occupied | Renter-occupied |
| Single Unit, Detached | 27 (73.0%) | 10 (27.0%) |
| Single Unit, Attached | 0 (0.0%) | 0 (0.0%) |
| 2 Unit Apartments | 0 (0.0%) | 32 (100.0%) |
| 3 or 4 Unit Apartments | 0 (0.0%) | 0 (0.0%) |
| 5 to 9 Unit Apartments | 0 (0.0%) | 0 (0.0%) |
| 10 or more Apartments | 0 (0.0%) | 0 (0.0%) |
| Mobile Home / Other | 0 (0.0%) | 0 (0.0%) |
| Total | 27 (39.1%) | 42 (60.9%) |
Housing Structures by Number of Rooms in Fontanet
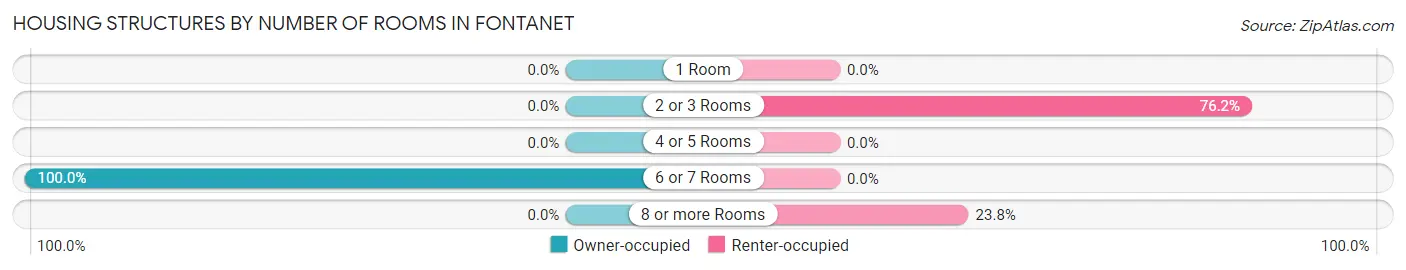
| Number of Rooms | Owner-occupied | Renter-occupied |
| 1 Room | 0 (0.0%) | 0 (0.0%) |
| 2 or 3 Rooms | 0 (0.0%) | 32 (76.2%) |
| 4 or 5 Rooms | 0 (0.0%) | 0 (0.0%) |
| 6 or 7 Rooms | 27 (100.0%) | 0 (0.0%) |
| 8 or more Rooms | 0 (0.0%) | 10 (23.8%) |
| Total | 27 (100.0%) | 42 (100.0%) |
Housing Structure by Heating Type in Fontanet
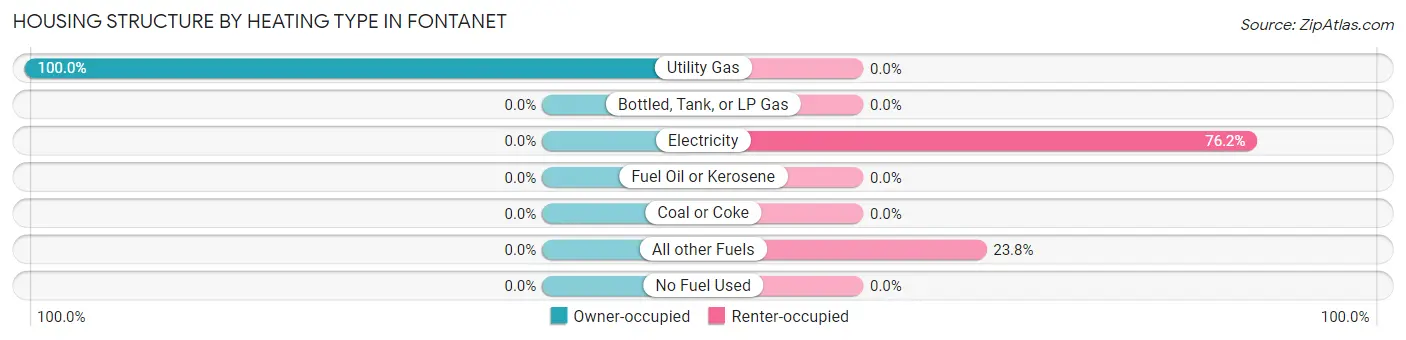
| Heating Type | Owner-occupied | Renter-occupied |
| Utility Gas | 27 (100.0%) | 0 (0.0%) |
| Bottled, Tank, or LP Gas | 0 (0.0%) | 0 (0.0%) |
| Electricity | 0 (0.0%) | 32 (76.2%) |
| Fuel Oil or Kerosene | 0 (0.0%) | 0 (0.0%) |
| Coal or Coke | 0 (0.0%) | 0 (0.0%) |
| All other Fuels | 0 (0.0%) | 10 (23.8%) |
| No Fuel Used | 0 (0.0%) | 0 (0.0%) |
| Total | 27 (100.0%) | 42 (100.0%) |
Household Vehicle Usage in Fontanet
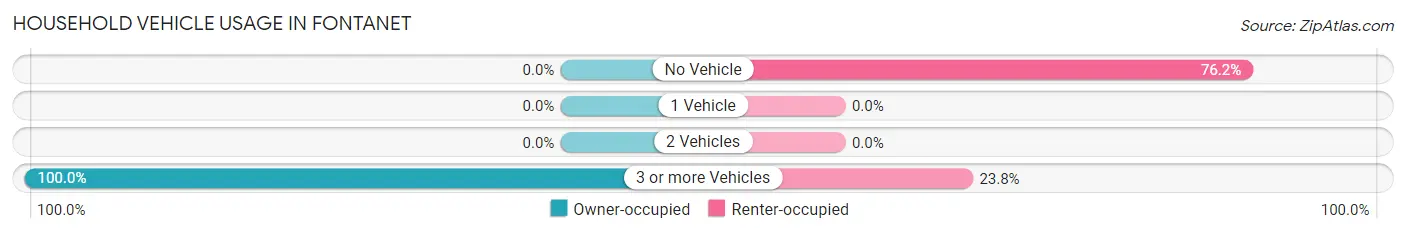
| Vehicles per Household | Owner-occupied | Renter-occupied |
| No Vehicle | 0 (0.0%) | 32 (76.2%) |
| 1 Vehicle | 0 (0.0%) | 0 (0.0%) |
| 2 Vehicles | 0 (0.0%) | 0 (0.0%) |
| 3 or more Vehicles | 27 (100.0%) | 10 (23.8%) |
| Total | 27 (100.0%) | 42 (100.0%) |
Real Estate & Mortgages in Fontanet
Real Estate and Mortgage Overview in Fontanet
| Characteristic | Without Mortgage | With Mortgage |
| Housing Units | 0 | 27 |
| Median Property Value | - | - |
| Median Household Income | - | - |
| Monthly Housing Costs | - | - |
| Real Estate Taxes | - | - |
Property Value by Mortgage Status in Fontanet
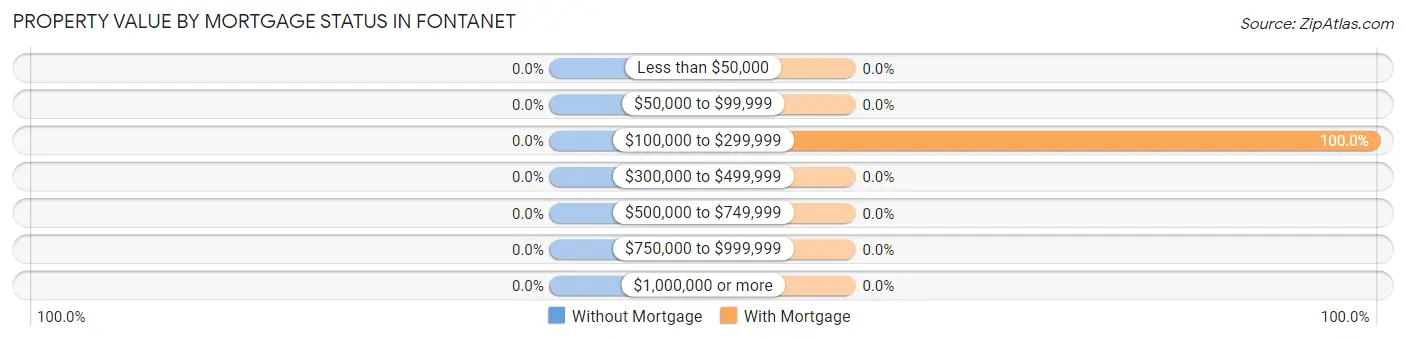
| Property Value | Without Mortgage | With Mortgage |
| Less than $50,000 | 0 (0.0%) | 0 (0.0%) |
| $50,000 to $99,999 | 0 (0.0%) | 0 (0.0%) |
| $100,000 to $299,999 | 0 (0.0%) | 27 (100.0%) |
| $300,000 to $499,999 | 0 (0.0%) | 0 (0.0%) |
| $500,000 to $749,999 | 0 (0.0%) | 0 (0.0%) |
| $750,000 to $999,999 | 0 (0.0%) | 0 (0.0%) |
| $1,000,000 or more | 0 (0.0%) | 0 (0.0%) |
| Total | 0 (0.0%) | 27 (100.0%) |
Household Income by Mortgage Status in Fontanet
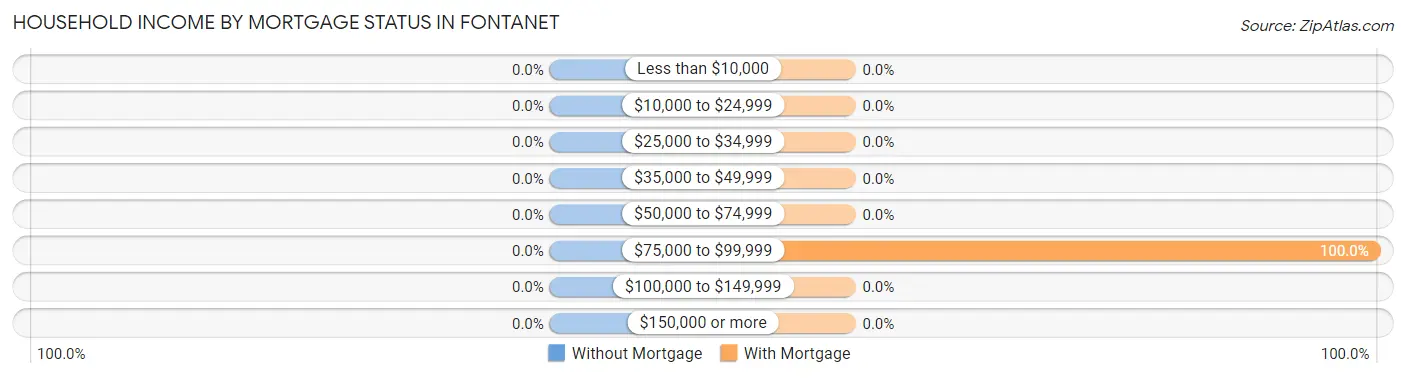
| Household Income | Without Mortgage | With Mortgage |
| Less than $10,000 | 0 (0.0%) | 0 (0.0%) |
| $10,000 to $24,999 | 0 (0.0%) | 0 (0.0%) |
| $25,000 to $34,999 | 0 (0.0%) | 0 (0.0%) |
| $35,000 to $49,999 | 0 (0.0%) | 0 (0.0%) |
| $50,000 to $74,999 | 0 (0.0%) | 0 (0.0%) |
| $75,000 to $99,999 | 0 (0.0%) | 27 (100.0%) |
| $100,000 to $149,999 | 0 (0.0%) | 0 (0.0%) |
| $150,000 or more | 0 (0.0%) | 0 (0.0%) |
| Total | 0 (0.0%) | 27 (100.0%) |
Property Value to Household Income Ratio in Fontanet
| Value-to-Income Ratio | Without Mortgage | With Mortgage |
| Less than 2.0x | 0 (0.0%) | 0 (0.0%) |
| 2.0x to 2.9x | 0 (0.0%) | 0 (0.0%) |
| 3.0x to 3.9x | 0 (0.0%) | 0 (0.0%) |
| 4.0x or more | 0 (0.0%) | 0 (0.0%) |
| Total | 0 (0.0%) | 27 (100.0%) |
Real Estate Taxes by Mortgage Status in Fontanet
| Property Taxes | Without Mortgage | With Mortgage |
| Less than $800 | 0 (0.0%) | 0 (0.0%) |
| $800 to $1,499 | 0 (0.0%) | 0 (0.0%) |
| $800 to $1,499 | 0 (0.0%) | 0 (0.0%) |
| Total | 0 (0.0%) | 27 (100.0%) |
Health & Disability in Fontanet
Health Insurance Coverage by Age in Fontanet
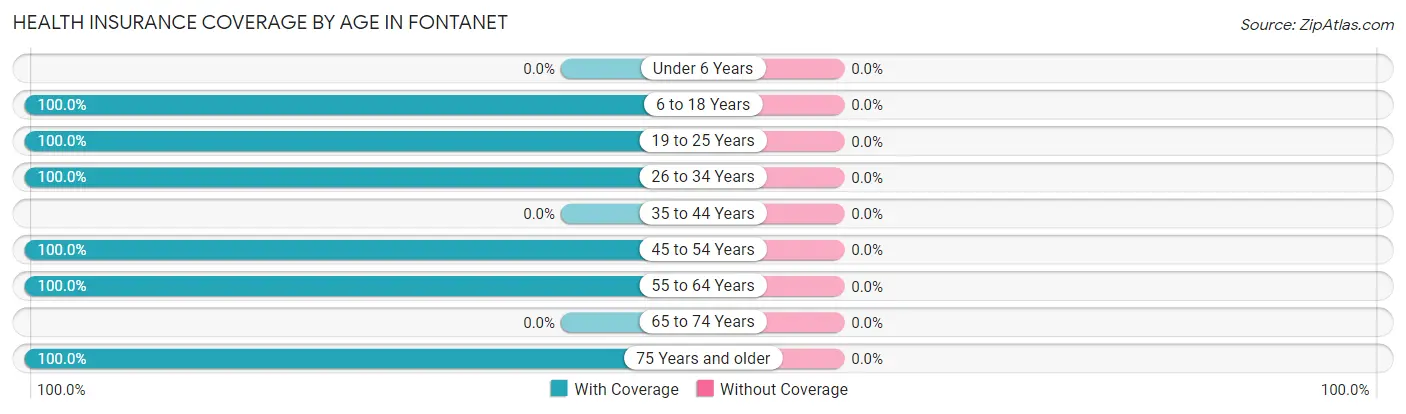
| Age Bracket | With Coverage | Without Coverage |
| Under 6 Years | 0 (0.0%) | 0 (0.0%) |
| 6 to 18 Years | 12 (100.0%) | 0 (0.0%) |
| 19 to 25 Years | 32 (100.0%) | 0 (0.0%) |
| 26 to 34 Years | 27 (100.0%) | 0 (0.0%) |
| 35 to 44 Years | 0 (0.0%) | 0 (0.0%) |
| 45 to 54 Years | 18 (100.0%) | 0 (0.0%) |
| 55 to 64 Years | 27 (100.0%) | 0 (0.0%) |
| 65 to 74 Years | 0 (0.0%) | 0 (0.0%) |
| 75 Years and older | 32 (100.0%) | 0 (0.0%) |
| Total | 148 (100.0%) | 0 (0.0%) |
Health Insurance Coverage by Citizenship Status in Fontanet
| Citizenship Status | With Coverage | Without Coverage |
| Native Born | 0 (0.0%) | 0 (0.0%) |
| Foreign Born, Citizen | 12 (100.0%) | 0 (0.0%) |
| Foreign Born, not a Citizen | 32 (100.0%) | 0 (0.0%) |
Health Insurance Coverage by Household Income in Fontanet
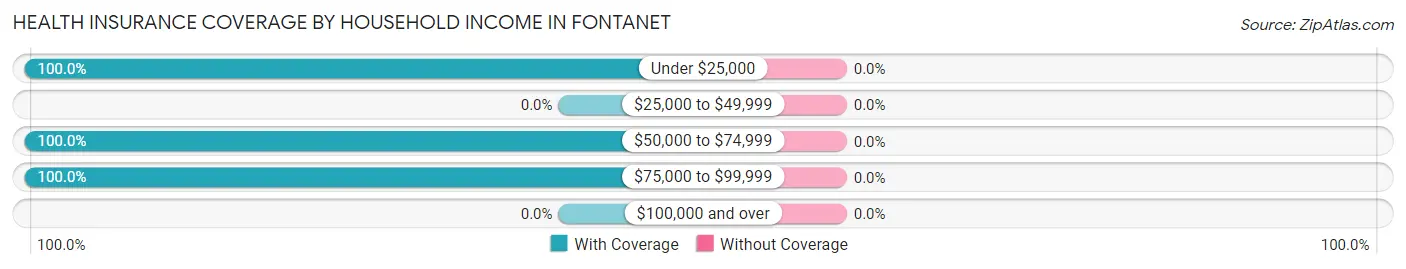
| Household Income | With Coverage | Without Coverage |
| Under $25,000 | 32 (100.0%) | 0 (0.0%) |
| $25,000 to $49,999 | 0 (0.0%) | 0 (0.0%) |
| $50,000 to $74,999 | 86 (100.0%) | 0 (0.0%) |
| $75,000 to $99,999 | 30 (100.0%) | 0 (0.0%) |
| $100,000 and over | 0 (0.0%) | 0 (0.0%) |
Public vs Private Health Insurance Coverage by Age in Fontanet
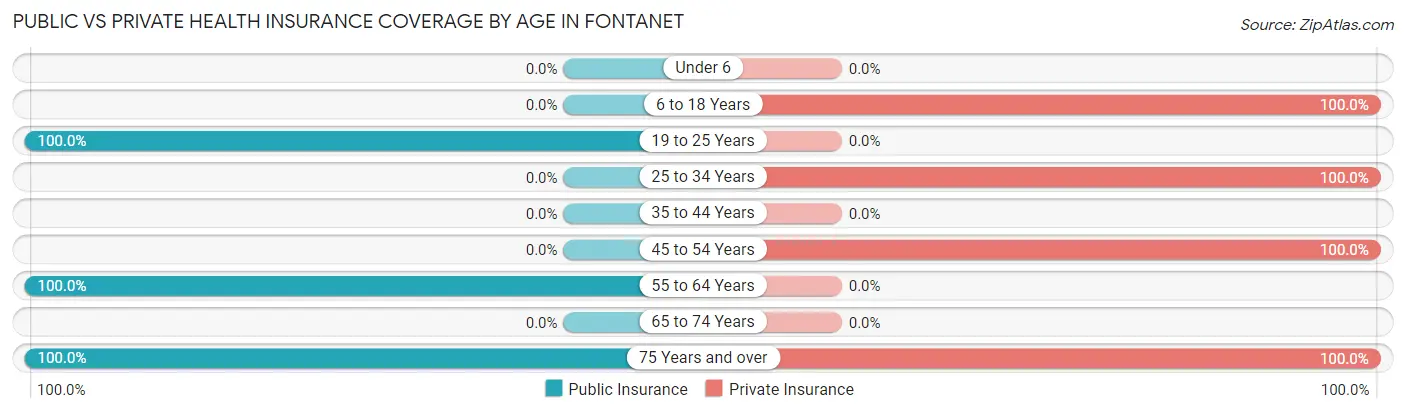
| Age Bracket | Public Insurance | Private Insurance |
| Under 6 | 0 (0.0%) | 0 (0.0%) |
| 6 to 18 Years | 0 (0.0%) | 12 (100.0%) |
| 19 to 25 Years | 32 (100.0%) | 0 (0.0%) |
| 25 to 34 Years | 0 (0.0%) | 27 (100.0%) |
| 35 to 44 Years | 0 (0.0%) | 0 (0.0%) |
| 45 to 54 Years | 0 (0.0%) | 18 (100.0%) |
| 55 to 64 Years | 27 (100.0%) | 0 (0.0%) |
| 65 to 74 Years | 0 (0.0%) | 0 (0.0%) |
| 75 Years and over | 32 (100.0%) | 32 (100.0%) |
| Total | 91 (61.5%) | 89 (60.1%) |
Disability Status by Sex by Age in Fontanet
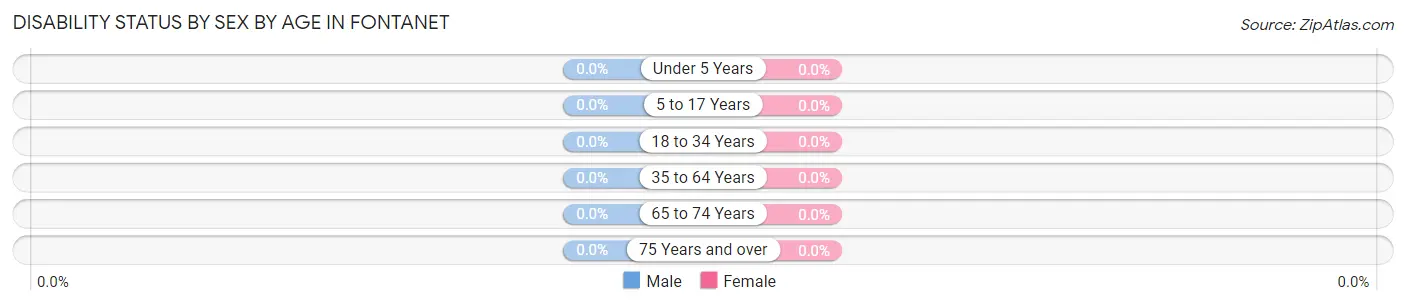
| Age Bracket | Male | Female |
| Under 5 Years | 0 (0.0%) | 0 (0.0%) |
| 5 to 17 Years | 0 (0.0%) | 0 (0.0%) |
| 18 to 34 Years | 0 (0.0%) | 0 (0.0%) |
| 35 to 64 Years | 0 (0.0%) | 0 (0.0%) |
| 65 to 74 Years | 0 (0.0%) | 0 (0.0%) |
| 75 Years and over | 0 (0.0%) | 0 (0.0%) |
Disability Class by Sex by Age in Fontanet
Disability Class: Hearing Difficulty
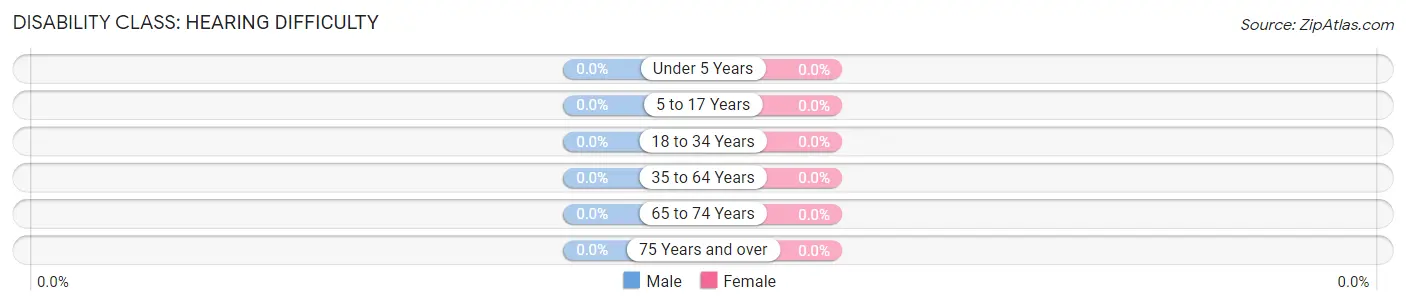
| Age Bracket | Male | Female |
| Under 5 Years | 0 (0.0%) | 0 (0.0%) |
| 5 to 17 Years | 0 (0.0%) | 0 (0.0%) |
| 18 to 34 Years | 0 (0.0%) | 0 (0.0%) |
| 35 to 64 Years | 0 (0.0%) | 0 (0.0%) |
| 65 to 74 Years | 0 (0.0%) | 0 (0.0%) |
| 75 Years and over | 0 (0.0%) | 0 (0.0%) |
Disability Class: Vision Difficulty
| Age Bracket | Male | Female |
| Under 5 Years | 0 (0.0%) | 0 (0.0%) |
| 5 to 17 Years | 0 (0.0%) | 0 (0.0%) |
| 18 to 34 Years | 0 (0.0%) | 0 (0.0%) |
| 35 to 64 Years | 0 (0.0%) | 0 (0.0%) |
| 65 to 74 Years | 0 (0.0%) | 0 (0.0%) |
| 75 Years and over | 0 (0.0%) | 0 (0.0%) |
Disability Class: Cognitive Difficulty
| Age Bracket | Male | Female |
| 5 to 17 Years | 0 (0.0%) | 0 (0.0%) |
| 18 to 34 Years | 0 (0.0%) | 0 (0.0%) |
| 35 to 64 Years | 0 (0.0%) | 0 (0.0%) |
| 65 to 74 Years | 0 (0.0%) | 0 (0.0%) |
| 75 Years and over | 0 (0.0%) | 0 (0.0%) |
Disability Class: Ambulatory Difficulty
| Age Bracket | Male | Female |
| 5 to 17 Years | 0 (0.0%) | 0 (0.0%) |
| 18 to 34 Years | 0 (0.0%) | 0 (0.0%) |
| 35 to 64 Years | 0 (0.0%) | 0 (0.0%) |
| 65 to 74 Years | 0 (0.0%) | 0 (0.0%) |
| 75 Years and over | 0 (0.0%) | 0 (0.0%) |
Disability Class: Self-Care Difficulty

| Age Bracket | Male | Female |
| 5 to 17 Years | 0 (0.0%) | 0 (0.0%) |
| 18 to 34 Years | 0 (0.0%) | 0 (0.0%) |
| 35 to 64 Years | 0 (0.0%) | 0 (0.0%) |
| 65 to 74 Years | 0 (0.0%) | 0 (0.0%) |
| 75 Years and over | 0 (0.0%) | 0 (0.0%) |
Technology Access in Fontanet
Computing Device Access in Fontanet
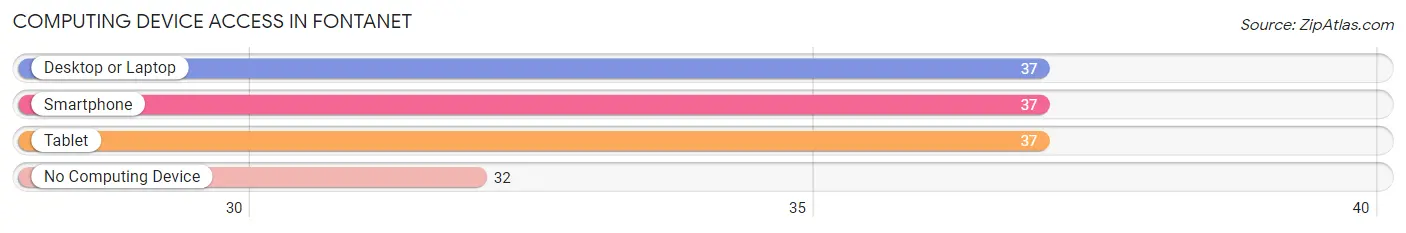
| Device Type | # Households | % Households |
| Desktop or Laptop | 37 | 53.6% |
| Smartphone | 37 | 53.6% |
| Tablet | 37 | 53.6% |
| No Computing Device | 32 | 46.4% |
| Total | 69 | 100.0% |
Internet Access in Fontanet
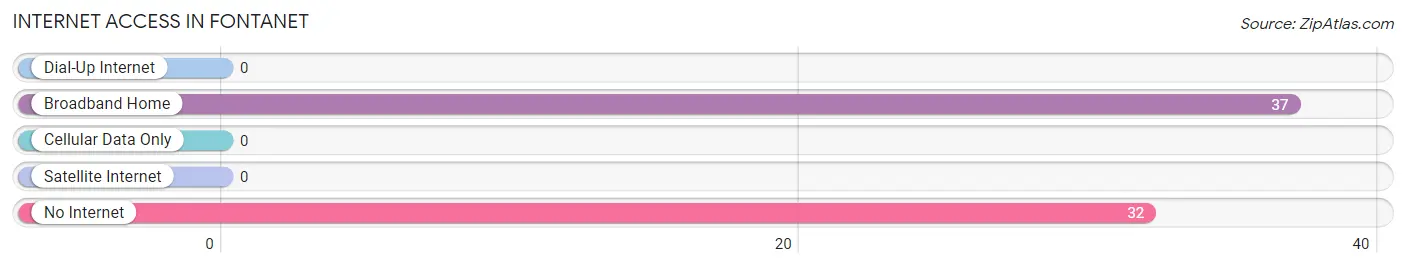
| Internet Type | # Households | % Households |
| Dial-Up Internet | 0 | 0.0% |
| Broadband Home | 37 | 53.6% |
| Cellular Data Only | 0 | 0.0% |
| Satellite Internet | 0 | 0.0% |
| No Internet | 32 | 46.4% |
| Total | 69 | 100.0% |
Fontanet Summary
Fontanet is a small unincorporated community located in Vigo County, Indiana. It is situated in the southwestern part of the state, approximately 10 miles east of Terre Haute. The population of Fontanet was estimated to be around 500 in 2000.
History
Fontanet was founded in 1837 by a group of settlers from France. The town was named after the Fontaine family, who were among the first settlers. The Fontaine family owned a large tract of land in the area and the town was built around their homestead.
The town grew slowly over the years, but it was not until the late 19th century that it began to experience significant growth. In 1887, the Fontanet post office was established and the town was officially incorporated in 1889.
In the early 20th century, Fontanet was a thriving community with a variety of businesses, including a general store, a blacksmith shop, a hotel, a bank, and a lumberyard. The town also had a school, a church, and a newspaper.
Geography
Fontanet is located in the southwestern part of Vigo County, Indiana. It is situated in the Wabash Valley, approximately 10 miles east of Terre Haute. The town is located on the banks of the Wabash River, which provides a scenic backdrop for the town.
The terrain of the area is mostly flat, with some rolling hills. The climate is humid continental, with hot summers and cold winters. The average annual temperature is around 50 degrees Fahrenheit.
Economy
The economy of Fontanet is largely based on agriculture. The town is home to several farms, which produce a variety of crops, including corn, soybeans, and wheat. The town also has a few small businesses, including a general store, a gas station, and a restaurant.
Demographics
As of the 2000 census, the population of Fontanet was estimated to be around 500. The racial makeup of the town was 97.2% White, 0.8% African American, 0.2% Native American, 0.2% Asian, and 1.6% from other races. The median household income was $30,000, and the median family income was $35,000.
Conclusion
Fontanet is a small unincorporated community located in Vigo County, Indiana. It was founded in 1837 by a group of settlers from France and has since grown into a thriving community. The town is situated in the Wabash Valley, on the banks of the Wabash River, and has a humid continental climate. The economy of Fontanet is largely based on agriculture, and the population was estimated to be around 500 in 2000.
Common Questions
What is Per Capita Income in Fontanet?
Per Capita income in Fontanet is $19,434.
What is Inequality or Gini Index in Fontanet?
Inequality or Gini Index in Fontanet is 0.46.
What is the Total Population of Fontanet?
Total Population of Fontanet is 148.
What is the Total Male Population of Fontanet?
Total Male Population of Fontanet is 20.
What is the Total Female Population of Fontanet?
Total Female Population of Fontanet is 128.
What is the Ratio of Males per 100 Females in Fontanet?
There are 15.62 Males per 100 Females in Fontanet.
What is the Ratio of Females per 100 Males in Fontanet?
There are 640.00 Females per 100 Males in Fontanet.
What is the Median Population Age in Fontanet?
Median Population Age in Fontanet is 47.3 Years.
What is the Average Family Size in Fontanet
Average Family Size in Fontanet is 2.9 People.
What is the Average Household Size in Fontanet
Average Household Size in Fontanet is 2.1 People.
How Large is the Labor Force in Fontanet?
There are 109 People in the Labor Forcein in Fontanet.
What is the Percentage of People in the Labor Force in Fontanet?
73.6% of People are in the Labor Force in Fontanet.
What is the Unemployment Rate in Fontanet?
Unemployment Rate in Fontanet is 29.4%.