Beardstown, IL Map & Demographics
Beardstown Map
Beardstown Overview
$23,050
PER CAPITA INCOME
$75,284
AVG FAMILY INCOME
$58,804
AVG HOUSEHOLD INCOME
36.1%
WAGE / INCOME GAP [ % ]
63.9¢/ $1
WAGE / INCOME GAP [ $ ]
0.38
INEQUALITY / GINI INDEX
5,884
TOTAL POPULATION
3,009
MALE POPULATION
2,875
FEMALE POPULATION
104.66
MALES / 100 FEMALES
95.55
FEMALES / 100 MALES
31.7
MEDIAN AGE
3.7
AVG FAMILY SIZE
2.9
AVG HOUSEHOLD SIZE
2,779
LABOR FORCE [ PEOPLE ]
63.4%
PERCENT IN LABOR FORCE
8.3%
UNEMPLOYMENT RATE
Beardstown Zip Codes
Beardstown Area Codes
Income in Beardstown
Income Overview in Beardstown
Per Capita Income in Beardstown is $23,050, while median incomes of families and households are $75,284 and $58,804 respectively.
| Characteristic | Number | Measure |
| Per Capita Income | 5,884 | $23,050 |
| Median Family Income | 1,265 | $75,284 |
| Mean Family Income | 1,265 | $76,466 |
| Median Household Income | 1,992 | $58,804 |
| Mean Household Income | 1,992 | $65,840 |
| Income Deficit | 1,265 | $0 |
| Wage / Income Gap (%) | 5,884 | 36.09% |
| Wage / Income Gap ($) | 5,884 | 63.91¢ per $1 |
| Gini / Inequality Index | 5,884 | 0.38 |
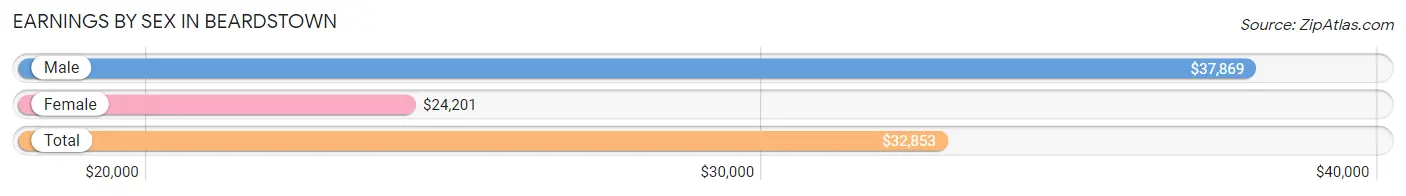
Earnings by Sex in Beardstown
Average Earnings in Beardstown are $32,853, $37,869 for men and $24,201 for women, a difference of 36.1%.
| Sex | Number | Average Earnings |
| Male | 1,705 (56.8%) | $37,869 |
| Female | 1,295 (43.2%) | $24,201 |
| Total | 3,000 (100.0%) | $32,853 |
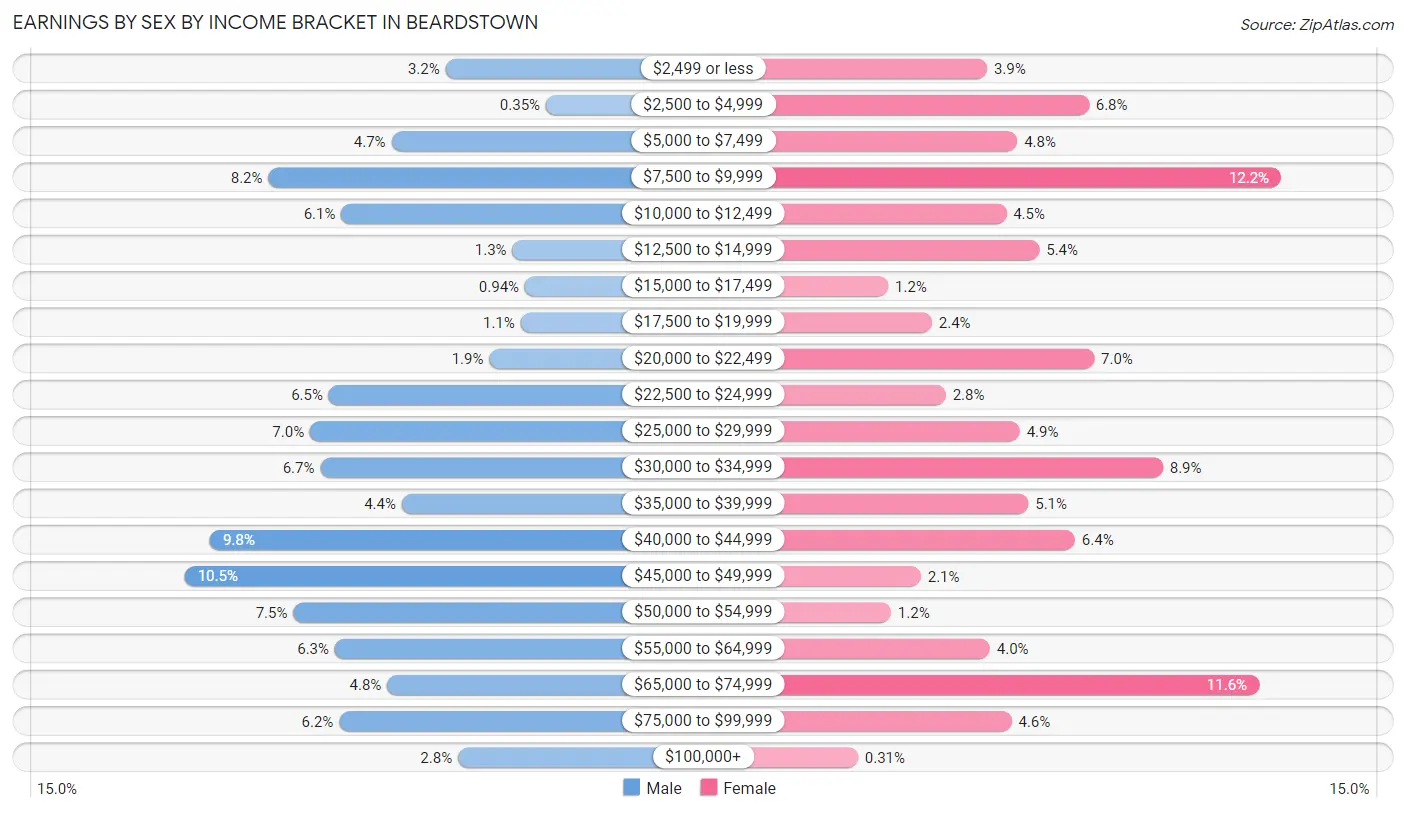
Earnings by Sex by Income Bracket in Beardstown
The most common earnings brackets in Beardstown are $45,000 to $49,999 for men (179 | 10.5%) and $7,500 to $9,999 for women (158 | 12.2%).
| Income | Male | Female |
| $2,499 or less | 54 (3.2%) | 51 (3.9%) |
| $2,500 to $4,999 | 6 (0.4%) | 88 (6.8%) |
| $5,000 to $7,499 | 80 (4.7%) | 62 (4.8%) |
| $7,500 to $9,999 | 139 (8.2%) | 158 (12.2%) |
| $10,000 to $12,499 | 104 (6.1%) | 58 (4.5%) |
| $12,500 to $14,999 | 22 (1.3%) | 70 (5.4%) |
| $15,000 to $17,499 | 16 (0.9%) | 15 (1.2%) |
| $17,500 to $19,999 | 18 (1.1%) | 31 (2.4%) |
| $20,000 to $22,499 | 33 (1.9%) | 90 (7.0%) |
| $22,500 to $24,999 | 110 (6.5%) | 36 (2.8%) |
| $25,000 to $29,999 | 119 (7.0%) | 63 (4.9%) |
| $30,000 to $34,999 | 114 (6.7%) | 115 (8.9%) |
| $35,000 to $39,999 | 75 (4.4%) | 66 (5.1%) |
| $40,000 to $44,999 | 167 (9.8%) | 83 (6.4%) |
| $45,000 to $49,999 | 179 (10.5%) | 27 (2.1%) |
| $50,000 to $54,999 | 127 (7.4%) | 16 (1.2%) |
| $55,000 to $64,999 | 107 (6.3%) | 52 (4.0%) |
| $65,000 to $74,999 | 82 (4.8%) | 150 (11.6%) |
| $75,000 to $99,999 | 105 (6.2%) | 60 (4.6%) |
| $100,000+ | 48 (2.8%) | 4 (0.3%) |
| Total | 1,705 (100.0%) | 1,295 (100.0%) |
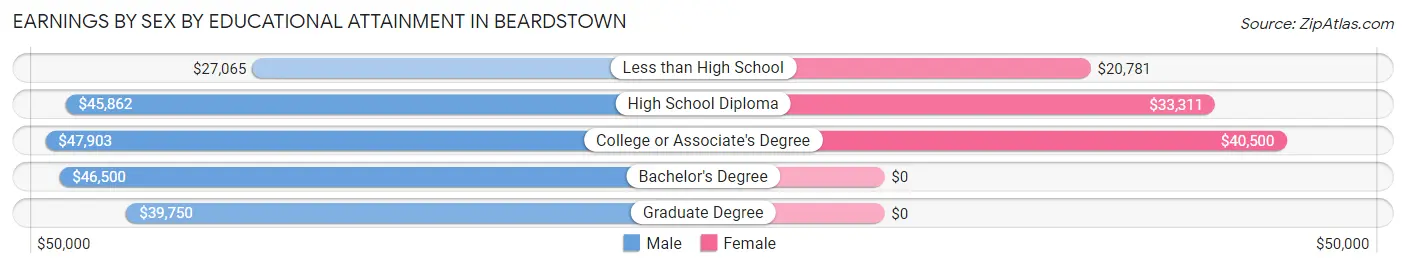
Earnings by Sex by Educational Attainment in Beardstown
Average earnings in Beardstown are $41,932 for men and $32,563 for women, a difference of 22.3%. Men with an educational attainment of college or associate's degree enjoy the highest average annual earnings of $47,903, while those with less than high school education earn the least with $27,065. Women with an educational attainment of college or associate's degree earn the most with the average annual earnings of $40,500, while those with less than high school education have the smallest earnings of $20,781.
| Educational Attainment | Male Income | Female Income |
| Less than High School | $27,065 | $20,781 |
| High School Diploma | $45,862 | $33,311 |
| College or Associate's Degree | $47,903 | $40,500 |
| Bachelor's Degree | $46,500 | $0 |
| Graduate Degree | $39,750 | $0 |
| Total | $41,932 | $32,563 |
Family Income in Beardstown
Family Income Brackets in Beardstown
According to the Beardstown family income data, there are 318 families falling into the $75,000 to $99,999 income range, which is the most common income bracket and makes up 25.1% of all families. Conversely, the $200,000+ income bracket is the least frequent group with only 25 families (2.0%) belonging to this category.
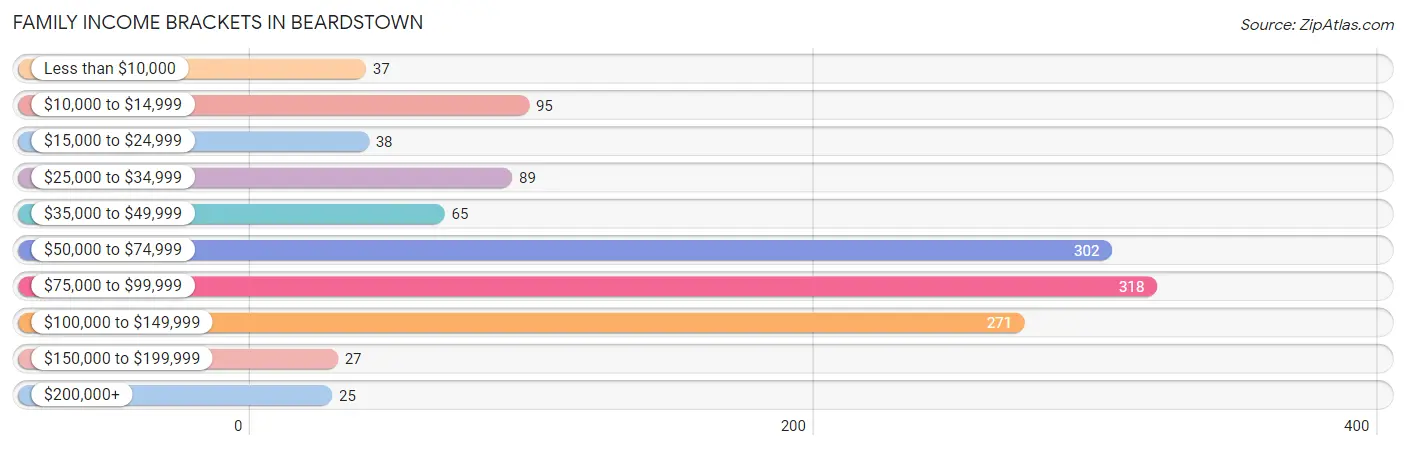
| Income Bracket | # Families | % Families |
| Less than $10,000 | 37 | 2.9% |
| $10,000 to $14,999 | 95 | 7.5% |
| $15,000 to $24,999 | 38 | 3.0% |
| $25,000 to $34,999 | 89 | 7.0% |
| $35,000 to $49,999 | 65 | 5.1% |
| $50,000 to $74,999 | 302 | 23.9% |
| $75,000 to $99,999 | 318 | 25.1% |
| $100,000 to $149,999 | 271 | 21.4% |
| $150,000 to $199,999 | 27 | 2.1% |
| $200,000+ | 25 | 2.0% |
Family Income by Famaliy Size in Beardstown
6-person families (54 | 4.3%) account for the highest median family income in Beardstown with $104,038 per family, while 2-person families (529 | 41.8%) have the highest median income of $39,178 per family member.
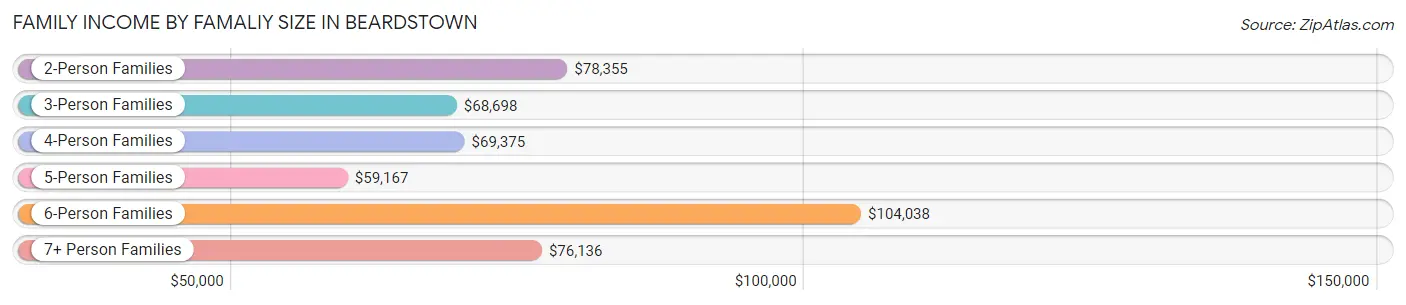
| Income Bracket | # Families | Median Income |
| 2-Person Families | 529 (41.8%) | $78,355 |
| 3-Person Families | 359 (28.4%) | $68,698 |
| 4-Person Families | 149 (11.8%) | $69,375 |
| 5-Person Families | 128 (10.1%) | $59,167 |
| 6-Person Families | 54 (4.3%) | $104,038 |
| 7+ Person Families | 46 (3.6%) | $76,136 |
| Total | 1,265 (100.0%) | $75,284 |
Family Income by Number of Earners in Beardstown
The median family income in Beardstown is $75,284, with families comprising 3+ earners (269) having the highest median family income of $102,120, while families with no earners (159) have the lowest median family income of $13,355, accounting for 21.3% and 12.6% of families, respectively.
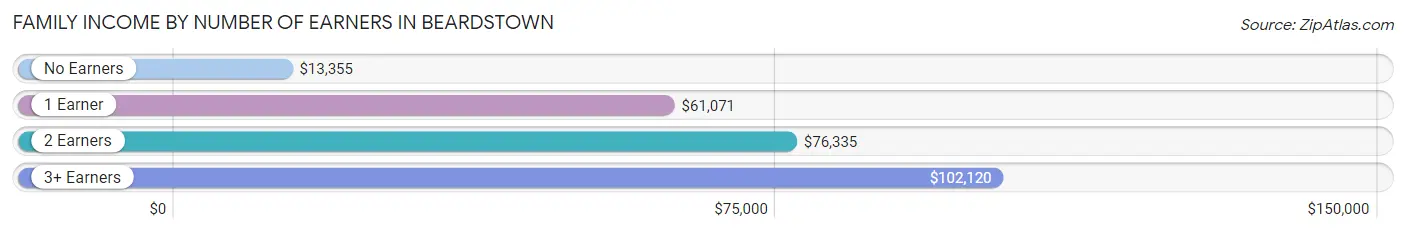
| Number of Earners | # Families | Median Income |
| No Earners | 159 (12.6%) | $13,355 |
| 1 Earner | 354 (28.0%) | $61,071 |
| 2 Earners | 483 (38.2%) | $76,335 |
| 3+ Earners | 269 (21.3%) | $102,120 |
| Total | 1,265 (100.0%) | $75,284 |
Household Income in Beardstown
Household Income Brackets in Beardstown
With 442 households falling in the category, the $75,000 to $99,999 income range is the most frequent in Beardstown, accounting for 22.2% of all households. In contrast, only 26 households (1.3%) fall into the $150,000 to $199,999 income bracket, making it the least populous group.
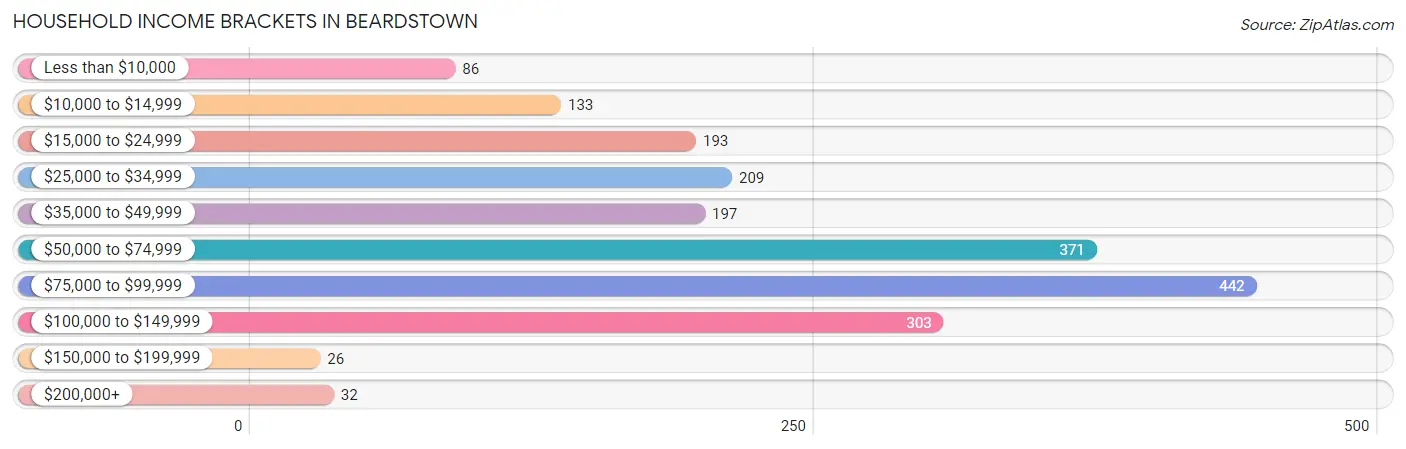
| Income Bracket | # Households | % Households |
| Less than $10,000 | 86 | 4.3% |
| $10,000 to $14,999 | 133 | 6.7% |
| $15,000 to $24,999 | 193 | 9.7% |
| $25,000 to $34,999 | 209 | 10.5% |
| $35,000 to $49,999 | 197 | 9.9% |
| $50,000 to $74,999 | 371 | 18.6% |
| $75,000 to $99,999 | 442 | 22.2% |
| $100,000 to $149,999 | 303 | 15.2% |
| $150,000 to $199,999 | 26 | 1.3% |
| $200,000+ | 32 | 1.6% |
Household Income by Householder Age in Beardstown
The median household income in Beardstown is $58,804, with the highest median household income of $75,872 found in the 45 to 64 years age bracket for the primary householder. A total of 694 households (34.8%) fall into this category. Meanwhile, the 65+ years age bracket for the primary householder has the lowest median household income of $35,208, with 506 households (25.4%) in this group.
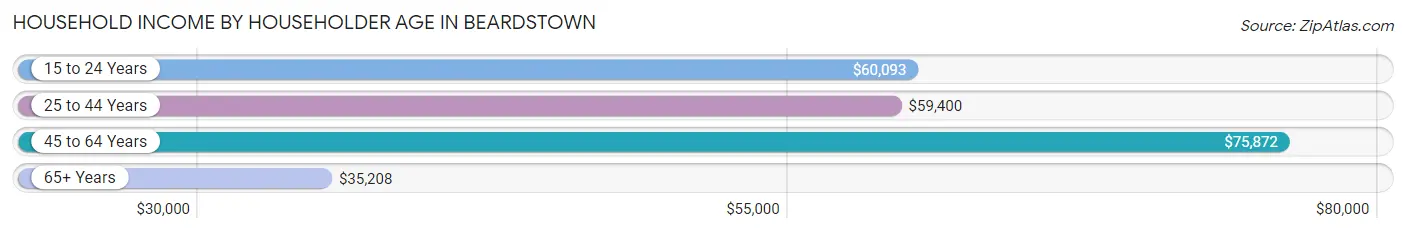
| Income Bracket | # Households | Median Income |
| 15 to 24 Years | 80 (4.0%) | $60,093 |
| 25 to 44 Years | 712 (35.7%) | $59,400 |
| 45 to 64 Years | 694 (34.8%) | $75,872 |
| 65+ Years | 506 (25.4%) | $35,208 |
| Total | 1,992 (100.0%) | $58,804 |
Poverty in Beardstown
Income Below Poverty by Sex and Age in Beardstown
With 10.2% poverty level for males and 22.1% for females among the residents of Beardstown, under 5 year old males and 25 to 34 year old females are the most vulnerable to poverty, with 73 males (65.8%) and 157 females (40.9%) in their respective age groups living below the poverty level.
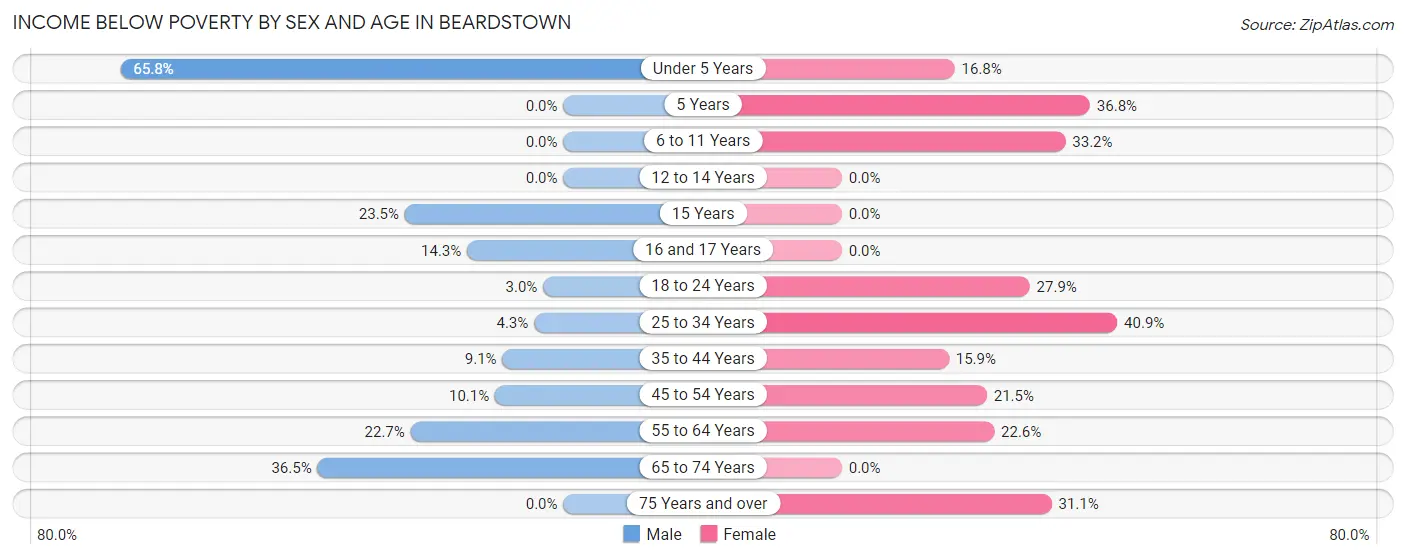
| Age Bracket | Male | Female |
| Under 5 Years | 73 (65.8%) | 32 (16.8%) |
| 5 Years | 0 (0.0%) | 21 (36.8%) |
| 6 to 11 Years | 0 (0.0%) | 81 (33.2%) |
| 12 to 14 Years | 0 (0.0%) | 0 (0.0%) |
| 15 Years | 8 (23.5%) | 0 (0.0%) |
| 16 and 17 Years | 13 (14.3%) | 0 (0.0%) |
| 18 to 24 Years | 11 (3.0%) | 77 (27.9%) |
| 25 to 34 Years | 19 (4.3%) | 157 (40.9%) |
| 35 to 44 Years | 41 (9.0%) | 58 (15.9%) |
| 45 to 54 Years | 35 (10.1%) | 62 (21.5%) |
| 55 to 64 Years | 61 (22.7%) | 83 (22.6%) |
| 65 to 74 Years | 46 (36.5%) | 0 (0.0%) |
| 75 Years and over | 0 (0.0%) | 52 (31.1%) |
| Total | 307 (10.2%) | 623 (22.1%) |
Income Above Poverty by Sex and Age in Beardstown
According to the poverty statistics in Beardstown, males aged 5 years and females aged 12 to 14 years are the age groups that are most secure financially, with 100.0% of males and 100.0% of females in these age groups living above the poverty line.
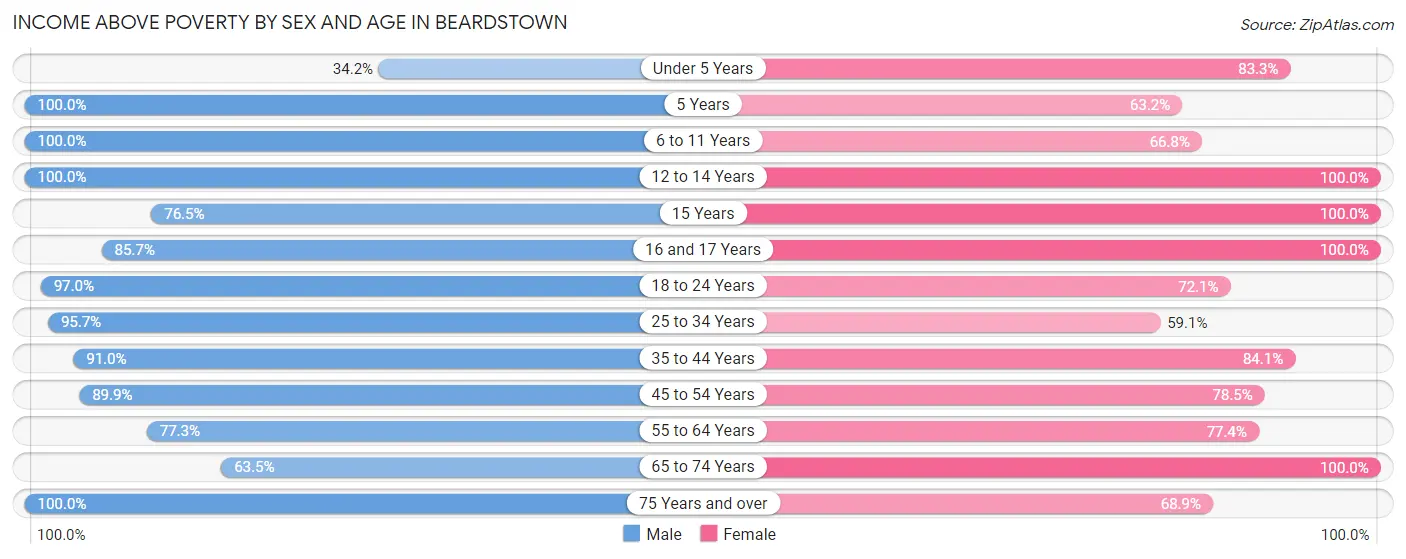
| Age Bracket | Male | Female |
| Under 5 Years | 38 (34.2%) | 159 (83.3%) |
| 5 Years | 66 (100.0%) | 36 (63.2%) |
| 6 to 11 Years | 381 (100.0%) | 163 (66.8%) |
| 12 to 14 Years | 220 (100.0%) | 141 (100.0%) |
| 15 Years | 26 (76.5%) | 56 (100.0%) |
| 16 and 17 Years | 78 (85.7%) | 88 (100.0%) |
| 18 to 24 Years | 356 (97.0%) | 199 (72.1%) |
| 25 to 34 Years | 419 (95.7%) | 227 (59.1%) |
| 35 to 44 Years | 412 (90.9%) | 307 (84.1%) |
| 45 to 54 Years | 310 (89.9%) | 226 (78.5%) |
| 55 to 64 Years | 208 (77.3%) | 284 (77.4%) |
| 65 to 74 Years | 80 (63.5%) | 194 (100.0%) |
| 75 Years and over | 100 (100.0%) | 115 (68.9%) |
| Total | 2,694 (89.8%) | 2,195 (77.9%) |
Income Below Poverty Among Married-Couple Families in Beardstown
The poverty statistics for married-couple families in Beardstown show that 7.3% or 61 of the total 840 families live below the poverty line. Families with 3 or 4 children have the highest poverty rate of 14.7%, comprising of 15 families. On the other hand, families with 5 or more children have the lowest poverty rate of 0.0%, which includes 0 families.
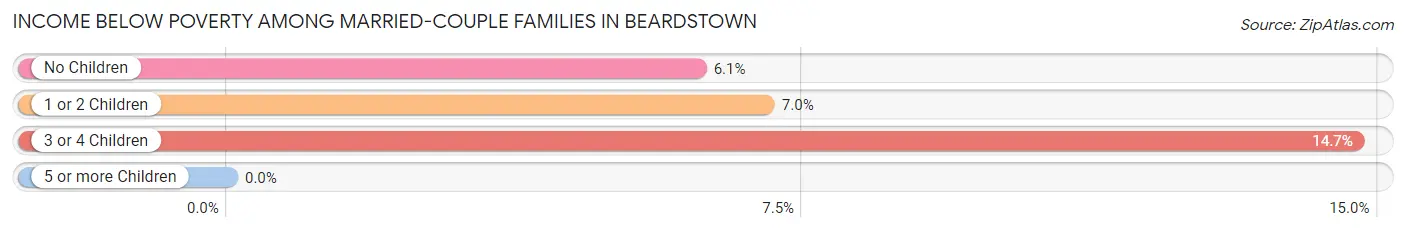
| Children | Above Poverty | Below Poverty |
| No Children | 414 (93.9%) | 27 (6.1%) |
| 1 or 2 Children | 252 (93.0%) | 19 (7.0%) |
| 3 or 4 Children | 87 (85.3%) | 15 (14.7%) |
| 5 or more Children | 26 (100.0%) | 0 (0.0%) |
| Total | 779 (92.7%) | 61 (7.3%) |
Income Below Poverty Among Single-Parent Households in Beardstown
According to the poverty data in Beardstown, 30.6% or 37 single-father households and 28.9% or 88 single-mother households are living below the poverty line. Among single-father households, those with 3 or 4 children have the highest poverty rate, with 11 households (100.0%) experiencing poverty. Likewise, among single-mother households, those with 1 or 2 children have the highest poverty rate, with 75 households (67.0%) falling below the poverty line.
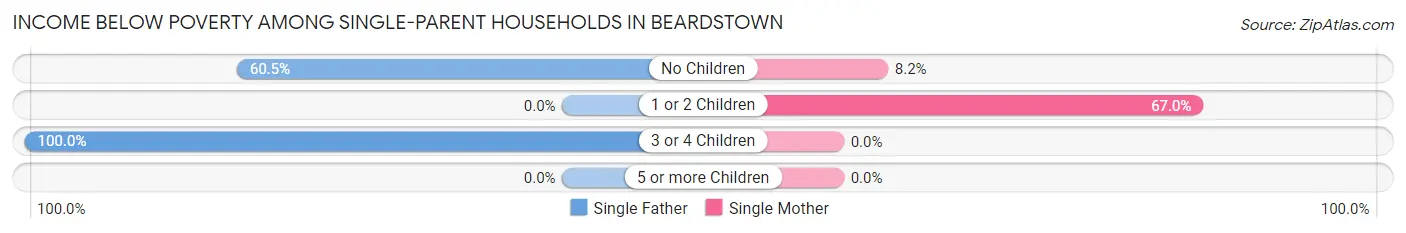
| Children | Single Father | Single Mother |
| No Children | 26 (60.5%) | 13 (8.2%) |
| 1 or 2 Children | 0 (0.0%) | 75 (67.0%) |
| 3 or 4 Children | 11 (100.0%) | 0 (0.0%) |
| 5 or more Children | 0 (0.0%) | 0 (0.0%) |
| Total | 37 (30.6%) | 88 (28.9%) |
Income Below Poverty Among Married-Couple vs Single-Parent Households in Beardstown
The poverty data for Beardstown shows that 61 of the married-couple family households (7.3%) and 125 of the single-parent households (29.4%) are living below the poverty level. Within the married-couple family households, those with 3 or 4 children have the highest poverty rate, with 15 households (14.7%) falling below the poverty line. Among the single-parent households, those with 1 or 2 children have the highest poverty rate, with 75 household (41.9%) living below poverty.
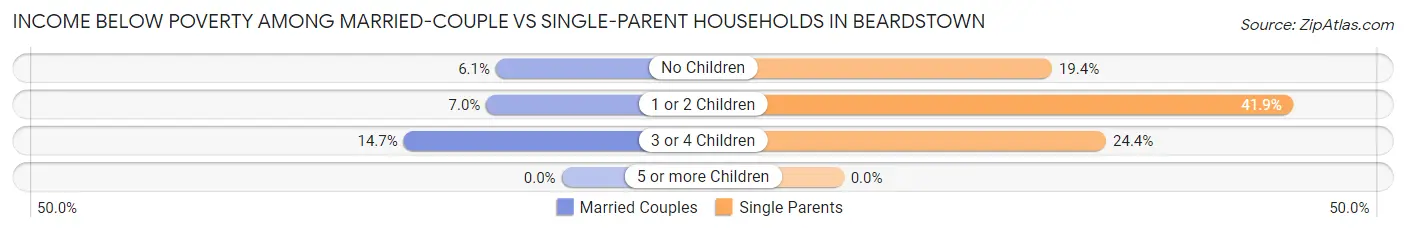
| Children | Married-Couple Families | Single-Parent Households |
| No Children | 27 (6.1%) | 39 (19.4%) |
| 1 or 2 Children | 19 (7.0%) | 75 (41.9%) |
| 3 or 4 Children | 15 (14.7%) | 11 (24.4%) |
| 5 or more Children | 0 (0.0%) | 0 (0.0%) |
| Total | 61 (7.3%) | 125 (29.4%) |
Race in Beardstown
The most populous races in Beardstown are White / Caucasian (3,850 | 65.4%), Hispanic or Latino (2,269 | 38.6%), and Two or more Races (742 | 12.6%).
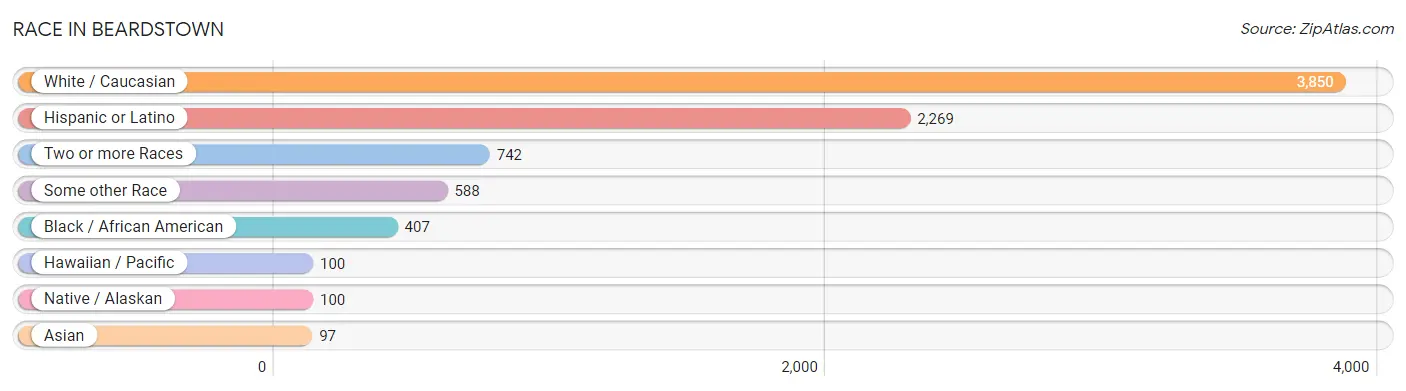
| Race | # Population | % Population |
| Asian | 97 | 1.7% |
| Black / African American | 407 | 6.9% |
| Hawaiian / Pacific | 100 | 1.7% |
| Hispanic or Latino | 2,269 | 38.6% |
| Native / Alaskan | 100 | 1.7% |
| White / Caucasian | 3,850 | 65.4% |
| Two or more Races | 742 | 12.6% |
| Some other Race | 588 | 10.0% |
| Total | 5,884 | 100.0% |
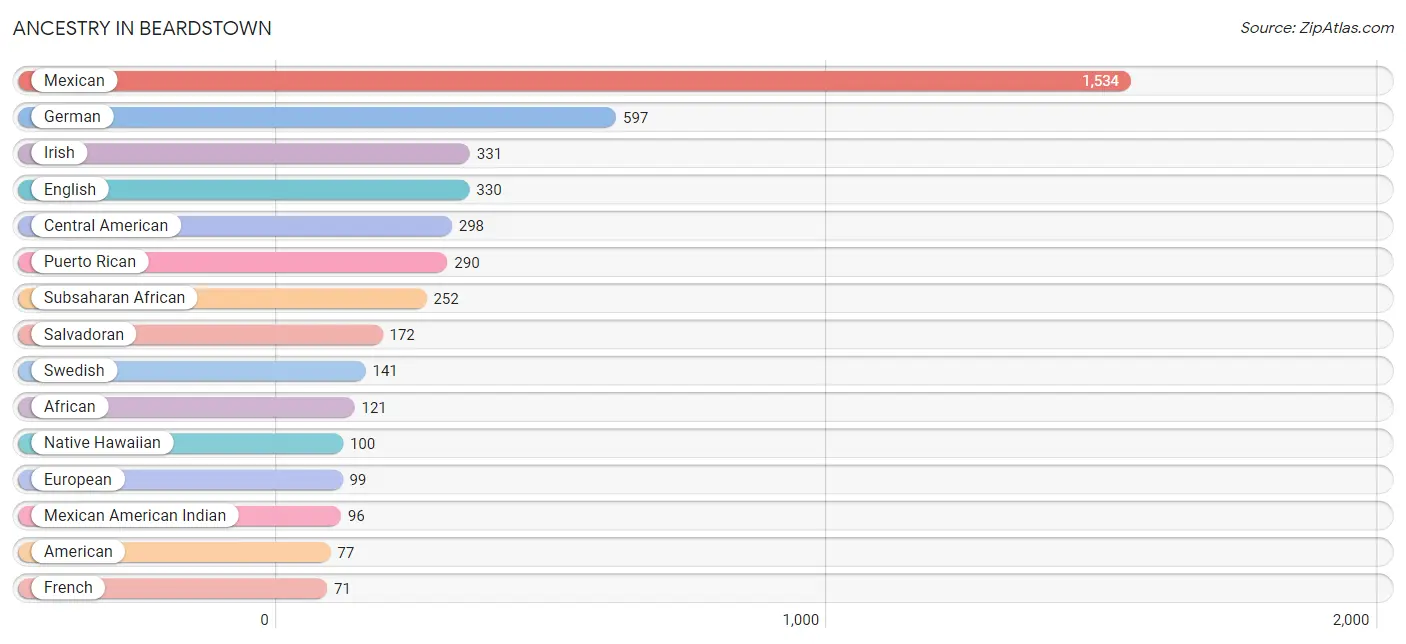
Ancestry in Beardstown
The most populous ancestries reported in Beardstown are Mexican (1,534 | 26.1%), German (597 | 10.2%), Irish (331 | 5.6%), English (330 | 5.6%), and Central American (298 | 5.1%), together accounting for 52.5% of all Beardstown residents.
| Ancestry | # Population | % Population |
| African | 121 | 2.1% |
| American | 77 | 1.3% |
| Central American | 298 | 5.1% |
| Central American Indian | 4 | 0.1% |
| Colombian | 6 | 0.1% |
| Cuban | 68 | 1.2% |
| Danish | 8 | 0.1% |
| Dominican | 46 | 0.8% |
| Dutch | 34 | 0.6% |
| English | 330 | 5.6% |
| European | 99 | 1.7% |
| French | 71 | 1.2% |
| German | 597 | 10.2% |
| Guatemalan | 61 | 1.0% |
| Indian (Asian) | 21 | 0.4% |
| Indonesian | 46 | 0.8% |
| Irish | 331 | 5.6% |
| Italian | 46 | 0.8% |
| Korean | 51 | 0.9% |
| Mexican | 1,534 | 26.1% |
| Mexican American Indian | 96 | 1.6% |
| Native Hawaiian | 100 | 1.7% |
| Northern European | 4 | 0.1% |
| Panamanian | 65 | 1.1% |
| Polish | 70 | 1.2% |
| Portuguese | 58 | 1.0% |
| Puerto Rican | 290 | 4.9% |
| Salvadoran | 172 | 2.9% |
| Scandinavian | 14 | 0.2% |
| Scottish | 19 | 0.3% |
| South American | 33 | 0.6% |
| Subsaharan African | 252 | 4.3% |
| Swedish | 141 | 2.4% |
| Swiss | 44 | 0.7% |
| Uruguayan | 27 | 0.5% | View All 35 Rows |
Immigrants in Beardstown
The most numerous immigrant groups reported in Beardstown came from Latin America (845 | 14.4%), Central America (750 | 12.8%), Mexico (573 | 9.7%), Africa (262 | 4.4%), and Middle Africa (170 | 2.9%), together accounting for 44.2% of all Beardstown residents.
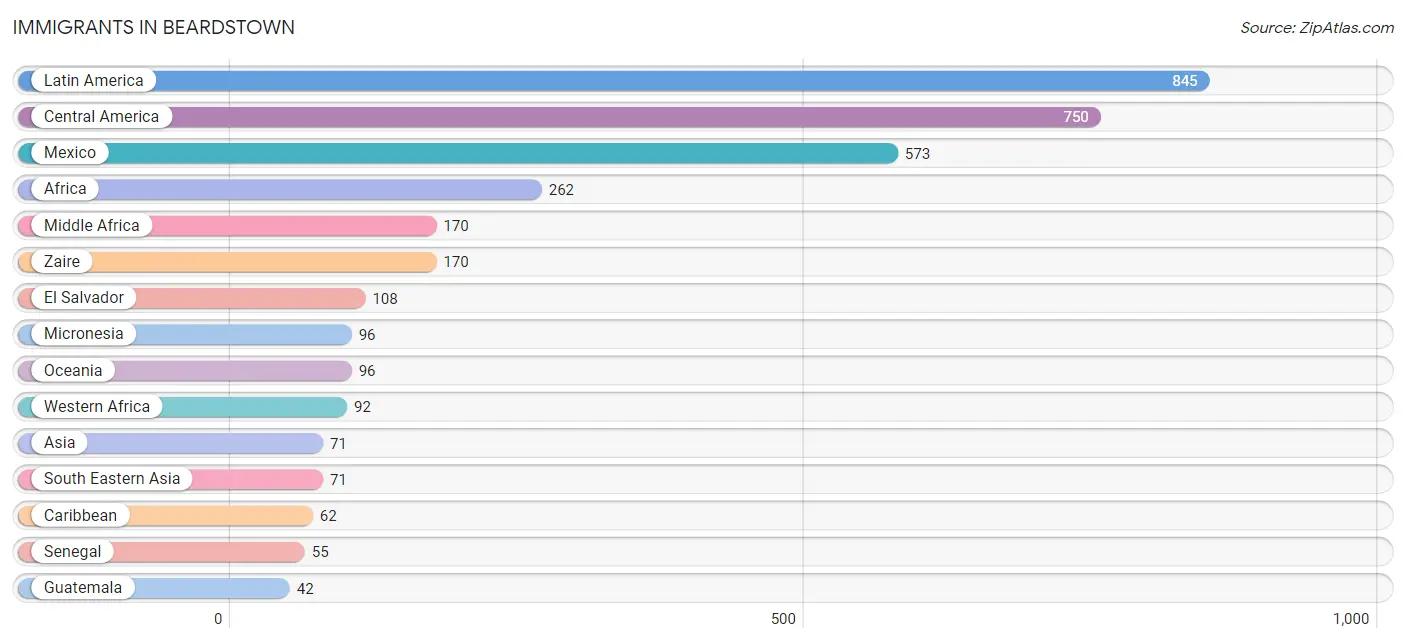
| Immigration Origin | # Population | % Population |
| Africa | 262 | 4.4% |
| Asia | 71 | 1.2% |
| Caribbean | 62 | 1.1% |
| Central America | 750 | 12.8% |
| Colombia | 6 | 0.1% |
| Cuba | 41 | 0.7% |
| Dominican Republic | 21 | 0.4% |
| El Salvador | 108 | 1.8% |
| England | 5 | 0.1% |
| Europe | 5 | 0.1% |
| Guatemala | 42 | 0.7% |
| Latin America | 845 | 14.4% |
| Mexico | 573 | 9.7% |
| Micronesia | 96 | 1.6% |
| Middle Africa | 170 | 2.9% |
| Northern Europe | 5 | 0.1% |
| Oceania | 96 | 1.6% |
| Panama | 27 | 0.5% |
| Philippines | 30 | 0.5% |
| Senegal | 55 | 0.9% |
| Sierra Leone | 5 | 0.1% |
| South America | 33 | 0.6% |
| South Eastern Asia | 71 | 1.2% |
| Uruguay | 27 | 0.5% |
| Western Africa | 92 | 1.6% |
| Zaire | 170 | 2.9% | View All 26 Rows |
Sex and Age in Beardstown
Sex and Age in Beardstown
The most populous age groups in Beardstown are 5 to 9 Years (336 | 11.2%) for men and 15 to 19 Years (260 | 9.0%) for women.
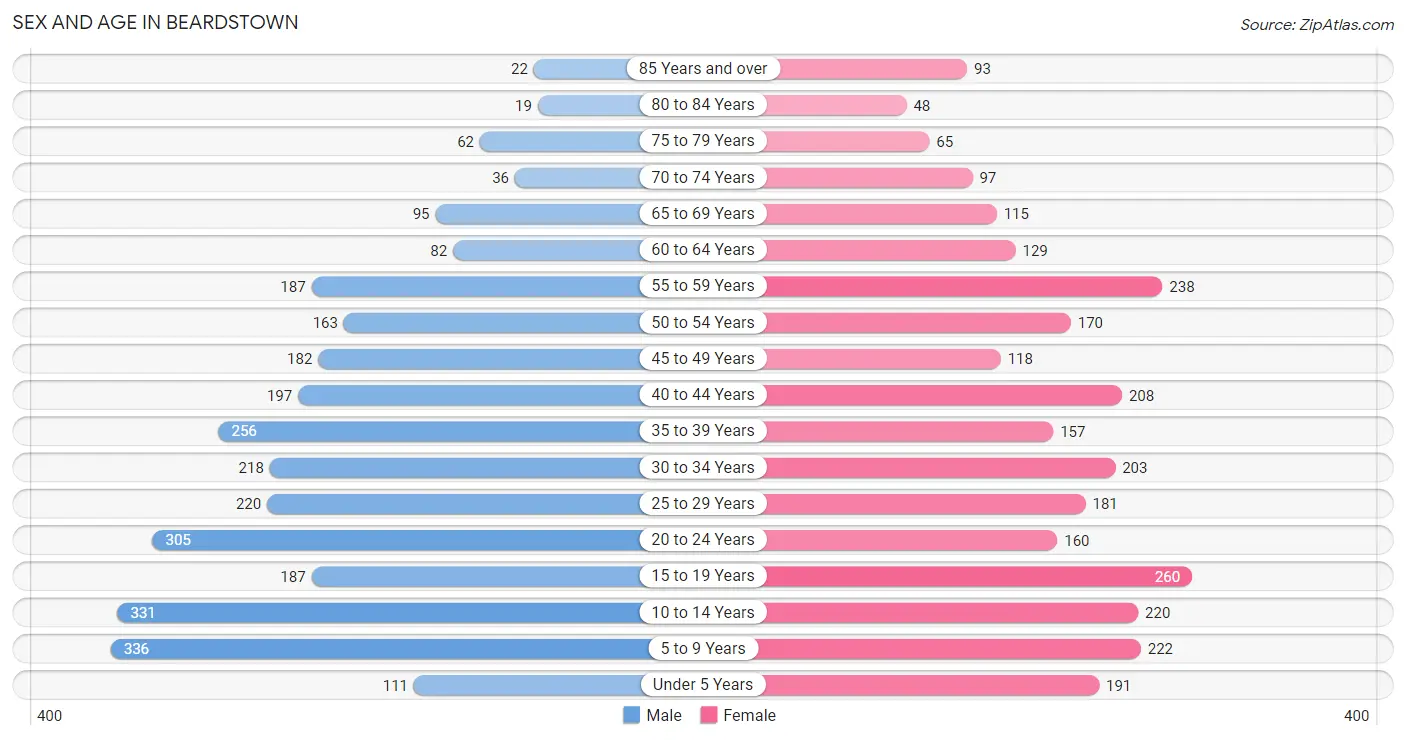
| Age Bracket | Male | Female |
| Under 5 Years | 111 (3.7%) | 191 (6.6%) |
| 5 to 9 Years | 336 (11.2%) | 222 (7.7%) |
| 10 to 14 Years | 331 (11.0%) | 220 (7.6%) |
| 15 to 19 Years | 187 (6.2%) | 260 (9.0%) |
| 20 to 24 Years | 305 (10.1%) | 160 (5.6%) |
| 25 to 29 Years | 220 (7.3%) | 181 (6.3%) |
| 30 to 34 Years | 218 (7.2%) | 203 (7.1%) |
| 35 to 39 Years | 256 (8.5%) | 157 (5.5%) |
| 40 to 44 Years | 197 (6.6%) | 208 (7.2%) |
| 45 to 49 Years | 182 (6.0%) | 118 (4.1%) |
| 50 to 54 Years | 163 (5.4%) | 170 (5.9%) |
| 55 to 59 Years | 187 (6.2%) | 238 (8.3%) |
| 60 to 64 Years | 82 (2.7%) | 129 (4.5%) |
| 65 to 69 Years | 95 (3.2%) | 115 (4.0%) |
| 70 to 74 Years | 36 (1.2%) | 97 (3.4%) |
| 75 to 79 Years | 62 (2.1%) | 65 (2.3%) |
| 80 to 84 Years | 19 (0.6%) | 48 (1.7%) |
| 85 Years and over | 22 (0.7%) | 93 (3.2%) |
| Total | 3,009 (100.0%) | 2,875 (100.0%) |
Families and Households in Beardstown
Median Family Size in Beardstown
The median family size in Beardstown is 3.72 persons per family, with married-couple families (840 | 66.4%) accounting for the largest median family size of 3.96 persons per family. On the other hand, single female/mother families (304 | 24.0%) represent the smallest median family size with 3.08 persons per family.
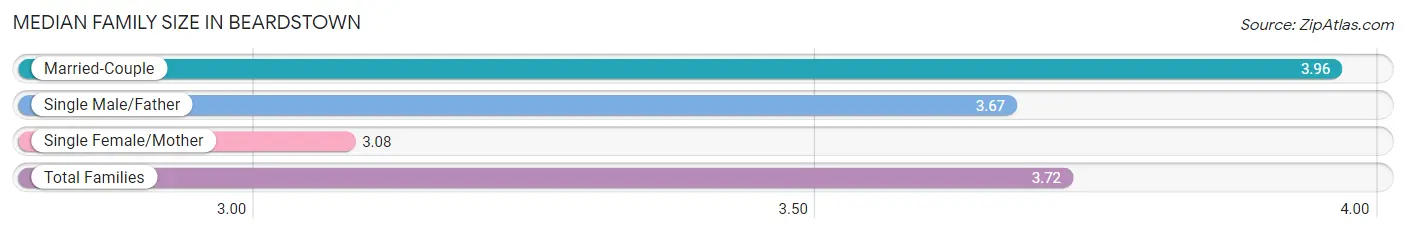
| Family Type | # Families | Family Size |
| Married-Couple | 840 (66.4%) | 3.96 |
| Single Male/Father | 121 (9.6%) | 3.67 |
| Single Female/Mother | 304 (24.0%) | 3.08 |
| Total Families | 1,265 (100.0%) | 3.72 |
Median Household Size in Beardstown
The median household size in Beardstown is 2.90 persons per household, with single male/father households (121 | 6.1%) accounting for the largest median household size of 4.31 persons per household. non-family households (727 | 36.5%) represent the smallest median household size with 1.23 persons per household.
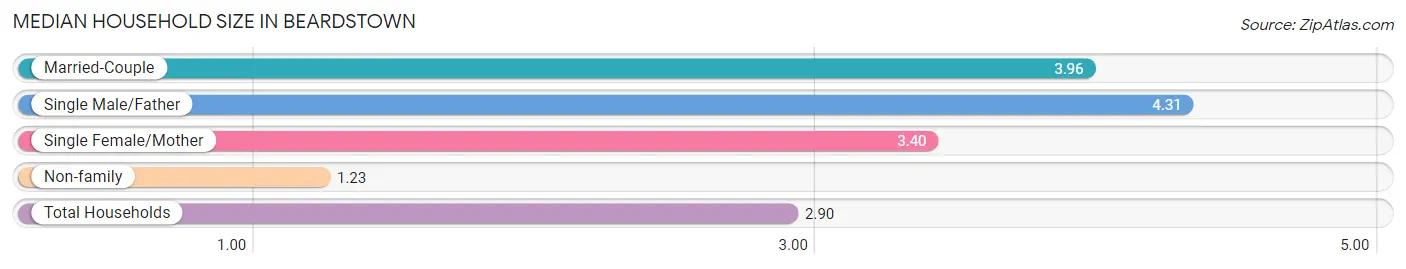
| Household Type | # Households | Household Size |
| Married-Couple | 840 (42.2%) | 3.96 |
| Single Male/Father | 121 (6.1%) | 4.31 |
| Single Female/Mother | 304 (15.3%) | 3.40 |
| Non-family | 727 (36.5%) | 1.23 |
| Total Households | 1,992 (100.0%) | 2.90 |
Household Size by Marriage Status in Beardstown
Out of a total of 1,992 households in Beardstown, 1,265 (63.5%) are family households, while 727 (36.5%) are nonfamily households. The most numerous type of family households are 2-person households, comprising 462, and the most common type of nonfamily households are 1-person households, comprising 630.
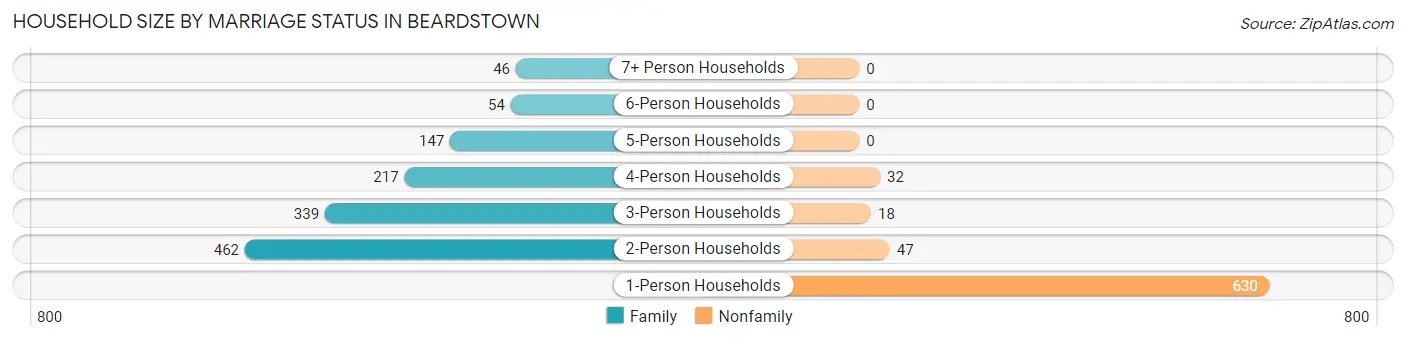
| Household Size | Family Households | Nonfamily Households |
| 1-Person Households | - | 630 (31.6%) |
| 2-Person Households | 462 (23.2%) | 47 (2.4%) |
| 3-Person Households | 339 (17.0%) | 18 (0.9%) |
| 4-Person Households | 217 (10.9%) | 32 (1.6%) |
| 5-Person Households | 147 (7.4%) | 0 (0.0%) |
| 6-Person Households | 54 (2.7%) | 0 (0.0%) |
| 7+ Person Households | 46 (2.3%) | 0 (0.0%) |
| Total | 1,265 (63.5%) | 727 (36.5%) |
Female Fertility in Beardstown
Fertility by Age in Beardstown
Average fertility rate in Beardstown is 137.0 births per 1,000 women. Women in the age bracket of 20 to 34 years have the highest fertility rate with 278.0 births per 1,000 women. Women in the age bracket of 20 to 34 years acount for 84.8% of all women with births.
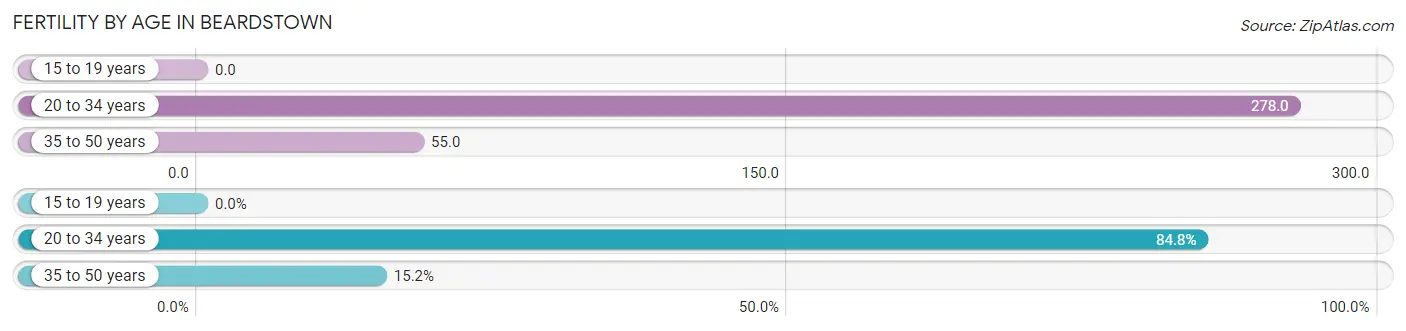
| Age Bracket | Women with Births | Births / 1,000 Women |
| 15 to 19 years | 0 (0.0%) | 0.0 |
| 20 to 34 years | 151 (84.8%) | 278.0 |
| 35 to 50 years | 27 (15.2%) | 55.0 |
| Total | 178 (100.0%) | 137.0 |
Fertility by Age by Marriage Status in Beardstown
90.4% of women with births (178) in Beardstown are married. The highest percentage of unmarried women with births falls into 20 to 34 years age bracket with 11.3% of them unmarried at the time of birth, while the lowest percentage of unmarried women with births belong to 35 to 50 years age bracket with 0.0% of them unmarried.
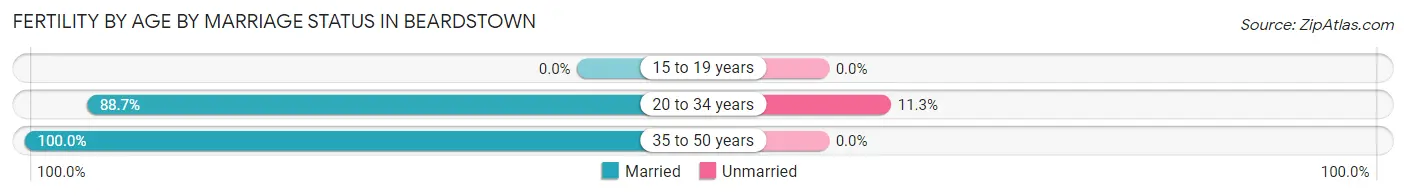
| Age Bracket | Married | Unmarried |
| 15 to 19 years | 0 (0.0%) | 0 (0.0%) |
| 20 to 34 years | 134 (88.7%) | 17 (11.3%) |
| 35 to 50 years | 27 (100.0%) | 0 (0.0%) |
| Total | 161 (90.4%) | 17 (9.6%) |
Fertility by Education in Beardstown
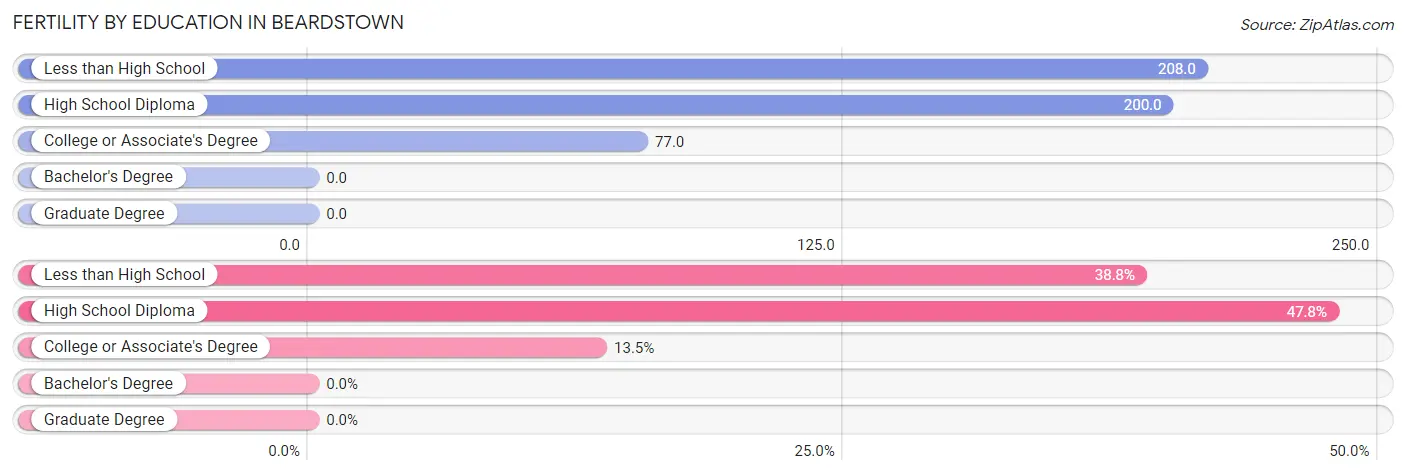
| Educational Attainment | Women with Births | Births / 1,000 Women |
| Less than High School | 69 (38.8%) | 208.0 |
| High School Diploma | 85 (47.7%) | 200.0 |
| College or Associate's Degree | 24 (13.5%) | 77.0 |
| Bachelor's Degree | 0 (0.0%) | 0.0 |
| Graduate Degree | 0 (0.0%) | 0.0 |
| Total | 178 (100.0%) | 137.0 |
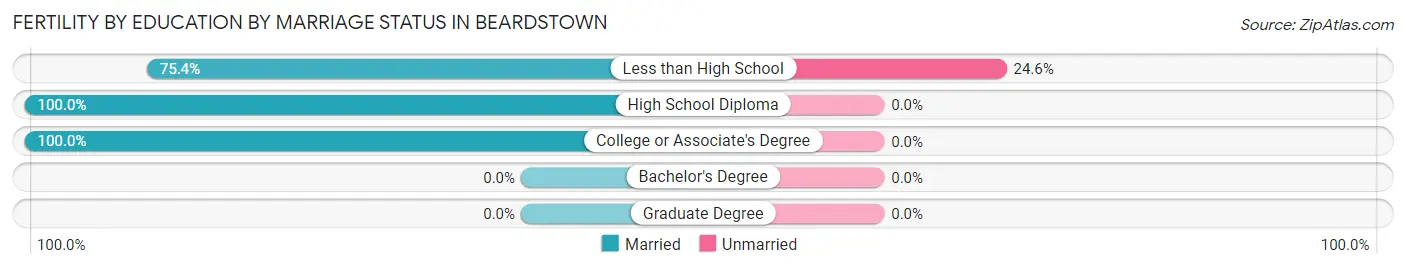
Fertility by Education by Marriage Status in Beardstown
9.6% of women with births in Beardstown are unmarried. Women with the educational attainment of high school diploma are most likely to be married with 100.0% of them married at childbirth, while women with the educational attainment of less than high school are least likely to be married with 24.6% of them unmarried at childbirth.
| Educational Attainment | Married | Unmarried |
| Less than High School | 52 (75.4%) | 17 (24.6%) |
| High School Diploma | 85 (100.0%) | 0 (0.0%) |
| College or Associate's Degree | 24 (100.0%) | 0 (0.0%) |
| Bachelor's Degree | 0 (0.0%) | 0 (0.0%) |
| Graduate Degree | 0 (0.0%) | 0 (0.0%) |
| Total | 161 (90.4%) | 17 (9.6%) |
Employment Characteristics in Beardstown
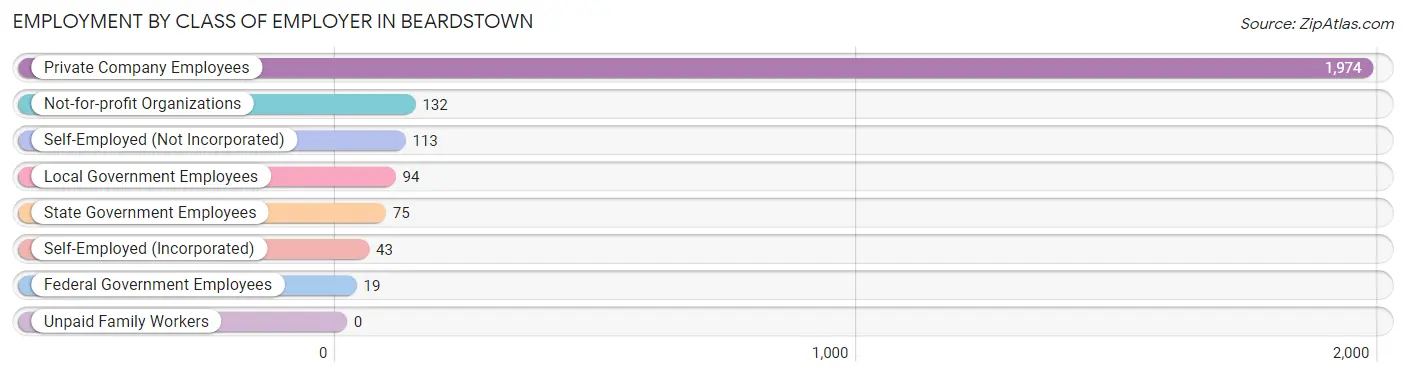
Employment by Class of Employer in Beardstown
Among the 2,450 employed individuals in Beardstown, private company employees (1,974 | 80.6%), not-for-profit organizations (132 | 5.4%), and self-employed (not incorporated) (113 | 4.6%) make up the most common classes of employment.
| Employer Class | # Employees | % Employees |
| Private Company Employees | 1,974 | 80.6% |
| Self-Employed (Incorporated) | 43 | 1.8% |
| Self-Employed (Not Incorporated) | 113 | 4.6% |
| Not-for-profit Organizations | 132 | 5.4% |
| Local Government Employees | 94 | 3.8% |
| State Government Employees | 75 | 3.1% |
| Federal Government Employees | 19 | 0.8% |
| Unpaid Family Workers | 0 | 0.0% |
| Total | 2,450 | 100.0% |
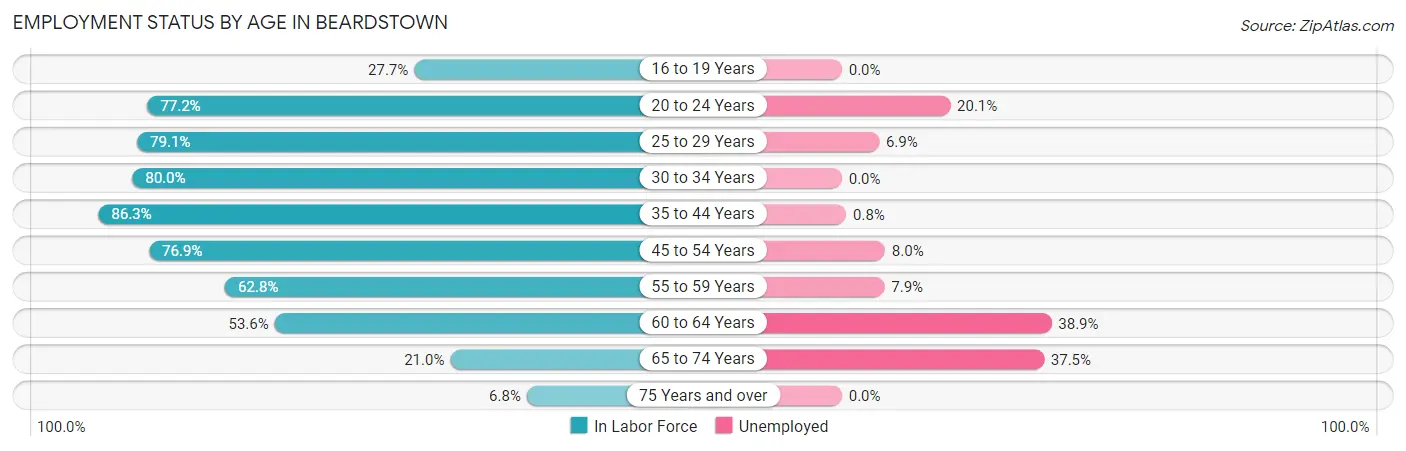
Employment Status by Age in Beardstown
According to the labor force statistics for Beardstown, out of the total population over 16 years of age (4,383), 63.4% or 2,779 individuals are in the labor force, with 8.3% or 231 of them unemployed. The age group with the highest labor force participation rate is 35 to 44 years, with 86.3% or 706 individuals in the labor force. Within the labor force, the 60 to 64 years age range has the highest percentage of unemployed individuals, with 38.9% or 44 of them being unemployed.
| Age Bracket | In Labor Force | Unemployed |
| 16 to 19 Years | 99 (27.7%) | 0 (0.0%) |
| 20 to 24 Years | 359 (77.2%) | 72 (20.1%) |
| 25 to 29 Years | 317 (79.1%) | 22 (6.9%) |
| 30 to 34 Years | 337 (80.0%) | 0 (0.0%) |
| 35 to 44 Years | 706 (86.3%) | 6 (0.8%) |
| 45 to 54 Years | 487 (76.9%) | 39 (8.0%) |
| 55 to 59 Years | 267 (62.8%) | 21 (7.9%) |
| 60 to 64 Years | 113 (53.6%) | 44 (38.9%) |
| 65 to 74 Years | 72 (21.0%) | 27 (37.5%) |
| 75 Years and over | 21 (6.8%) | 0 (0.0%) |
| Total | 2,779 (63.4%) | 231 (8.3%) |
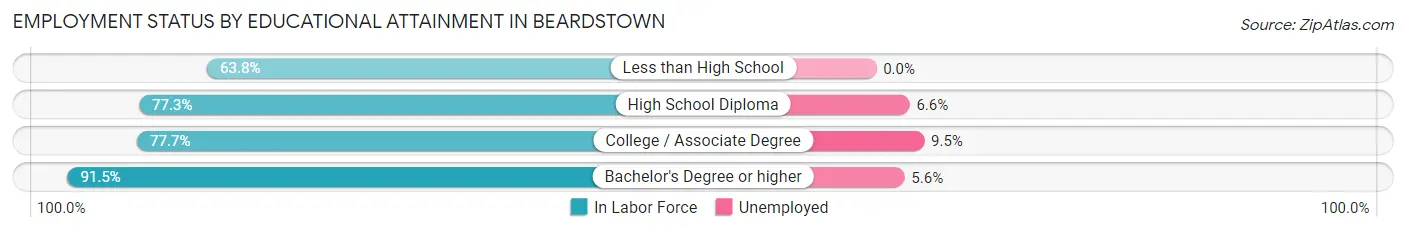
Employment Status by Educational Attainment in Beardstown
According to labor force statistics for Beardstown, 76.6% of individuals (2,228) out of the total population between 25 and 64 years of age (2,909) are in the labor force, with 5.9% or 131 of them being unemployed. The group with the highest labor force participation rate are those with the educational attainment of bachelor's degree or higher, with 91.5% or 376 individuals in the labor force. Within the labor force, individuals with college / associate degree education have the highest percentage of unemployment, with 9.5% or 49 of them being unemployed.
| Educational Attainment | In Labor Force | Unemployed |
| Less than High School | 387 (63.8%) | 0 (0.0%) |
| High School Diploma | 946 (77.3%) | 81 (6.6%) |
| College / Associate Degree | 518 (77.7%) | 63 (9.5%) |
| Bachelor's Degree or higher | 376 (91.5%) | 23 (5.6%) |
| Total | 2,228 (76.6%) | 172 (5.9%) |
Employment Occupations by Sex in Beardstown
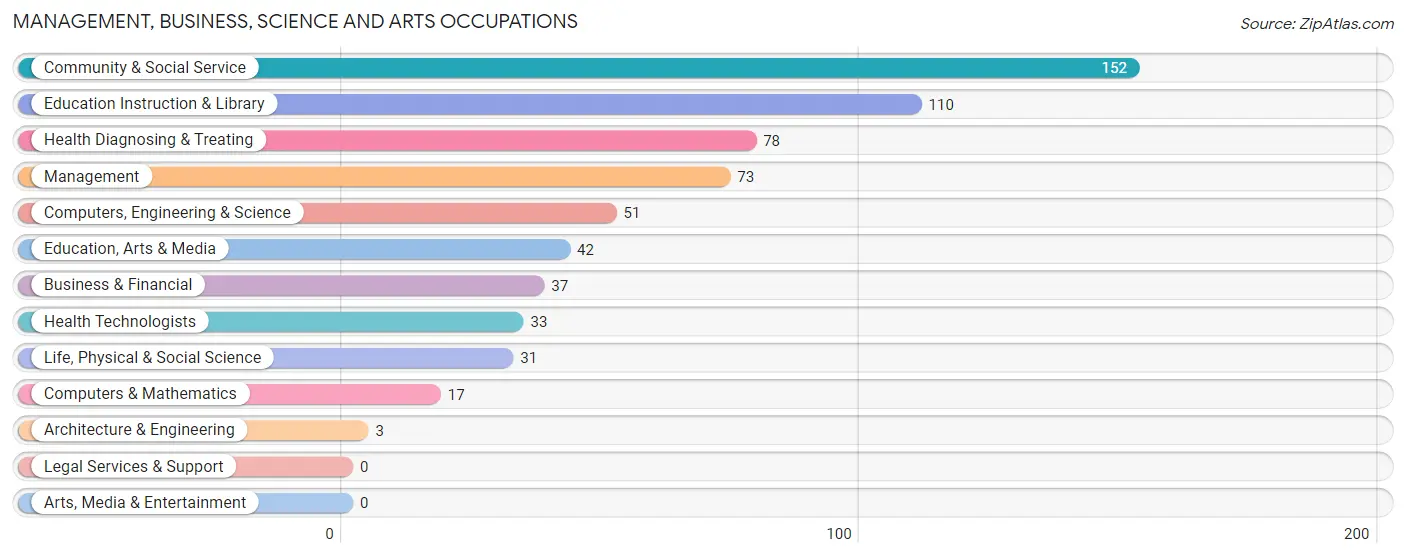
Management, Business, Science and Arts Occupations
The most common Management, Business, Science and Arts occupations in Beardstown are Community & Social Service (152 | 6.0%), Education Instruction & Library (110 | 4.3%), Health Diagnosing & Treating (78 | 3.1%), Management (73 | 2.9%), and Computers, Engineering & Science (51 | 2.0%).
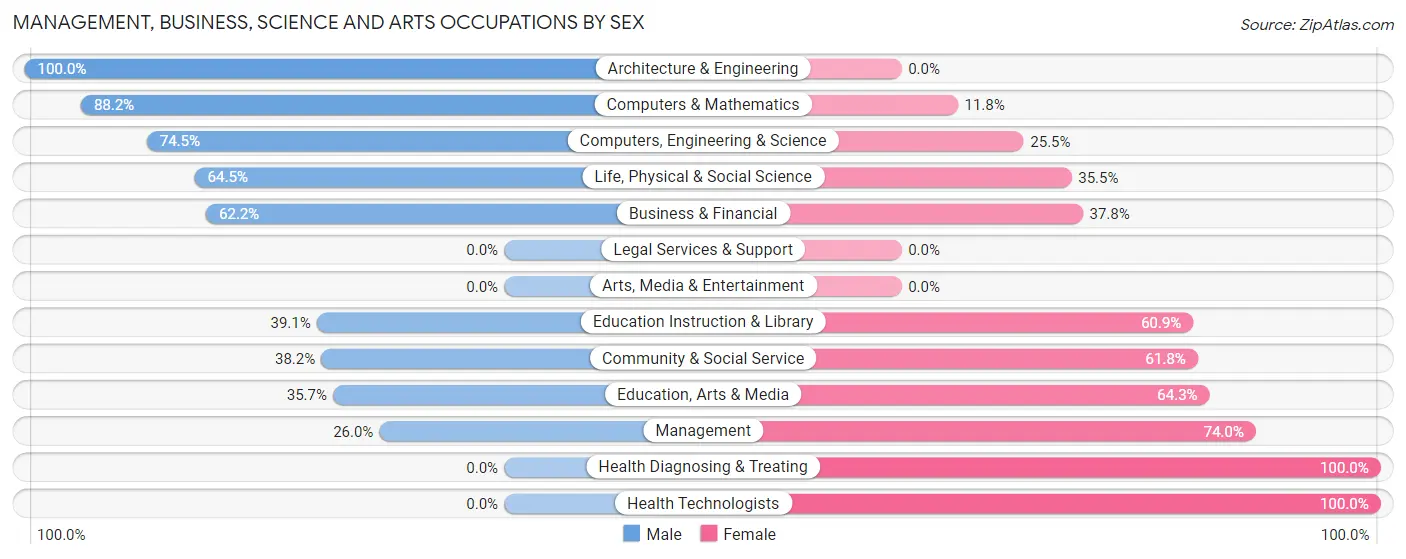
Management, Business, Science and Arts Occupations by Sex
Within the Management, Business, Science and Arts occupations in Beardstown, the most male-oriented occupations are Architecture & Engineering (100.0%), Computers & Mathematics (88.2%), and Computers, Engineering & Science (74.5%), while the most female-oriented occupations are Health Diagnosing & Treating (100.0%), Health Technologists (100.0%), and Management (74.0%).
| Occupation | Male | Female |
| Management | 19 (26.0%) | 54 (74.0%) |
| Business & Financial | 23 (62.2%) | 14 (37.8%) |
| Computers, Engineering & Science | 38 (74.5%) | 13 (25.5%) |
| Computers & Mathematics | 15 (88.2%) | 2 (11.8%) |
| Architecture & Engineering | 3 (100.0%) | 0 (0.0%) |
| Life, Physical & Social Science | 20 (64.5%) | 11 (35.5%) |
| Community & Social Service | 58 (38.2%) | 94 (61.8%) |
| Education, Arts & Media | 15 (35.7%) | 27 (64.3%) |
| Legal Services & Support | 0 (0.0%) | 0 (0.0%) |
| Education Instruction & Library | 43 (39.1%) | 67 (60.9%) |
| Arts, Media & Entertainment | 0 (0.0%) | 0 (0.0%) |
| Health Diagnosing & Treating | 0 (0.0%) | 78 (100.0%) |
| Health Technologists | 0 (0.0%) | 33 (100.0%) |
| Total (Category) | 138 (35.3%) | 253 (64.7%) |
| Total (Overall) | 1,469 (57.7%) | 1,078 (42.3%) |
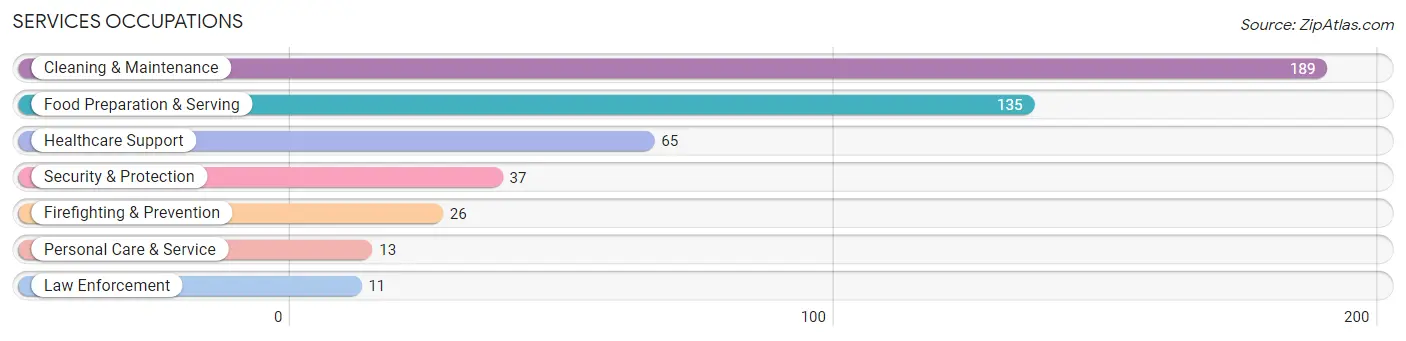
Services Occupations
The most common Services occupations in Beardstown are Cleaning & Maintenance (189 | 7.4%), Food Preparation & Serving (135 | 5.3%), Healthcare Support (65 | 2.5%), Security & Protection (37 | 1.5%), and Firefighting & Prevention (26 | 1.0%).
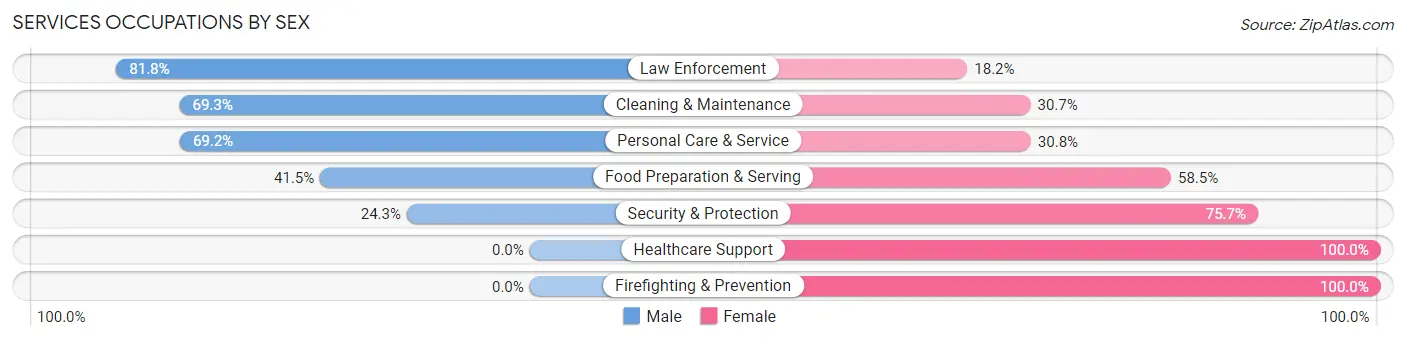
Services Occupations by Sex
Within the Services occupations in Beardstown, the most male-oriented occupations are Law Enforcement (81.8%), Cleaning & Maintenance (69.3%), and Personal Care & Service (69.2%), while the most female-oriented occupations are Healthcare Support (100.0%), Firefighting & Prevention (100.0%), and Security & Protection (75.7%).
| Occupation | Male | Female |
| Healthcare Support | 0 (0.0%) | 65 (100.0%) |
| Security & Protection | 9 (24.3%) | 28 (75.7%) |
| Firefighting & Prevention | 0 (0.0%) | 26 (100.0%) |
| Law Enforcement | 9 (81.8%) | 2 (18.2%) |
| Food Preparation & Serving | 56 (41.5%) | 79 (58.5%) |
| Cleaning & Maintenance | 131 (69.3%) | 58 (30.7%) |
| Personal Care & Service | 9 (69.2%) | 4 (30.8%) |
| Total (Category) | 205 (46.7%) | 234 (53.3%) |
| Total (Overall) | 1,469 (57.7%) | 1,078 (42.3%) |
Sales and Office Occupations
The most common Sales and Office occupations in Beardstown are Office & Administration (277 | 10.9%), and Sales & Related (75 | 2.9%).
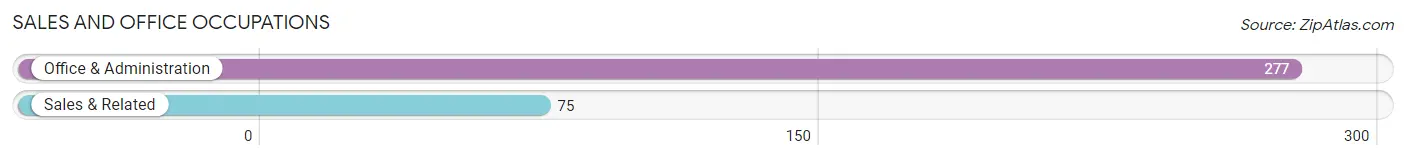
Sales and Office Occupations by Sex
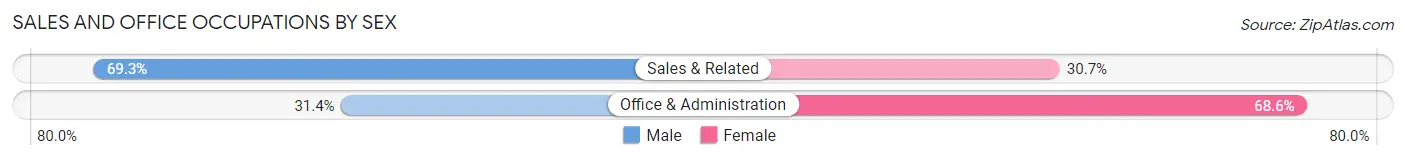
| Occupation | Male | Female |
| Sales & Related | 52 (69.3%) | 23 (30.7%) |
| Office & Administration | 87 (31.4%) | 190 (68.6%) |
| Total (Category) | 139 (39.5%) | 213 (60.5%) |
| Total (Overall) | 1,469 (57.7%) | 1,078 (42.3%) |
Natural Resources, Construction and Maintenance Occupations
The most common Natural Resources, Construction and Maintenance occupations in Beardstown are Farming, Fishing & Forestry (180 | 7.1%), Construction & Extraction (149 | 5.9%), and Installation, Maintenance & Repair (54 | 2.1%).
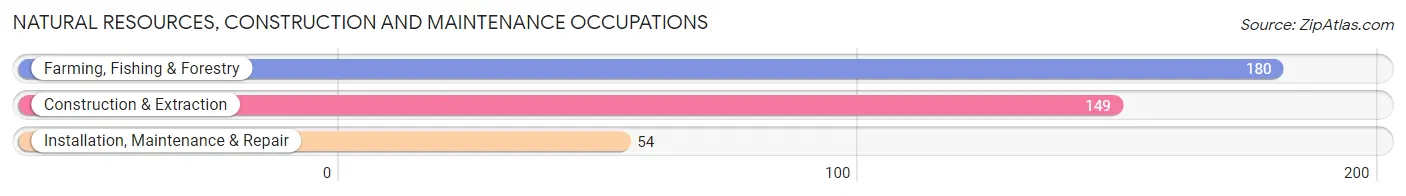
Natural Resources, Construction and Maintenance Occupations by Sex
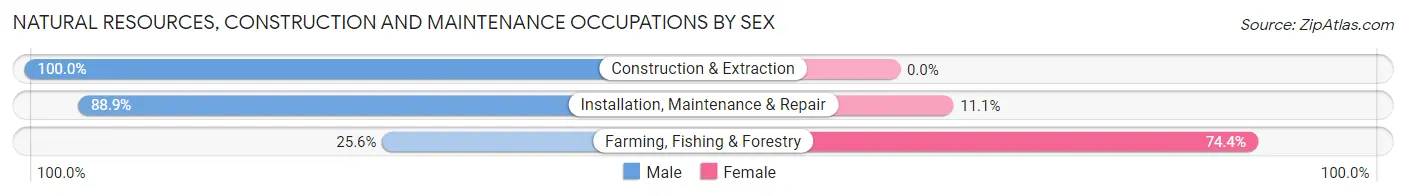
| Occupation | Male | Female |
| Farming, Fishing & Forestry | 46 (25.6%) | 134 (74.4%) |
| Construction & Extraction | 149 (100.0%) | 0 (0.0%) |
| Installation, Maintenance & Repair | 48 (88.9%) | 6 (11.1%) |
| Total (Category) | 243 (63.4%) | 140 (36.5%) |
| Total (Overall) | 1,469 (57.7%) | 1,078 (42.3%) |
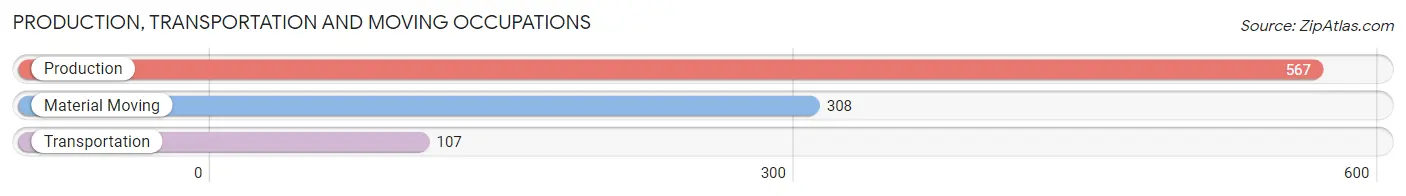
Production, Transportation and Moving Occupations
The most common Production, Transportation and Moving occupations in Beardstown are Production (567 | 22.3%), Material Moving (308 | 12.1%), and Transportation (107 | 4.2%).
Production, Transportation and Moving Occupations by Sex
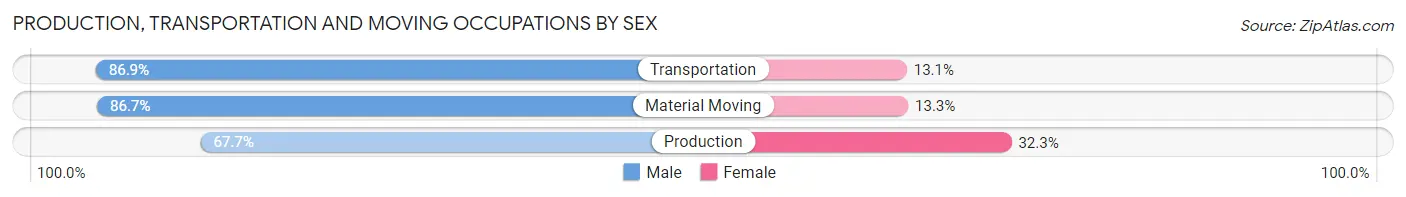
| Occupation | Male | Female |
| Production | 384 (67.7%) | 183 (32.3%) |
| Transportation | 93 (86.9%) | 14 (13.1%) |
| Material Moving | 267 (86.7%) | 41 (13.3%) |
| Total (Category) | 744 (75.8%) | 238 (24.2%) |
| Total (Overall) | 1,469 (57.7%) | 1,078 (42.3%) |
Employment Industries by Sex in Beardstown
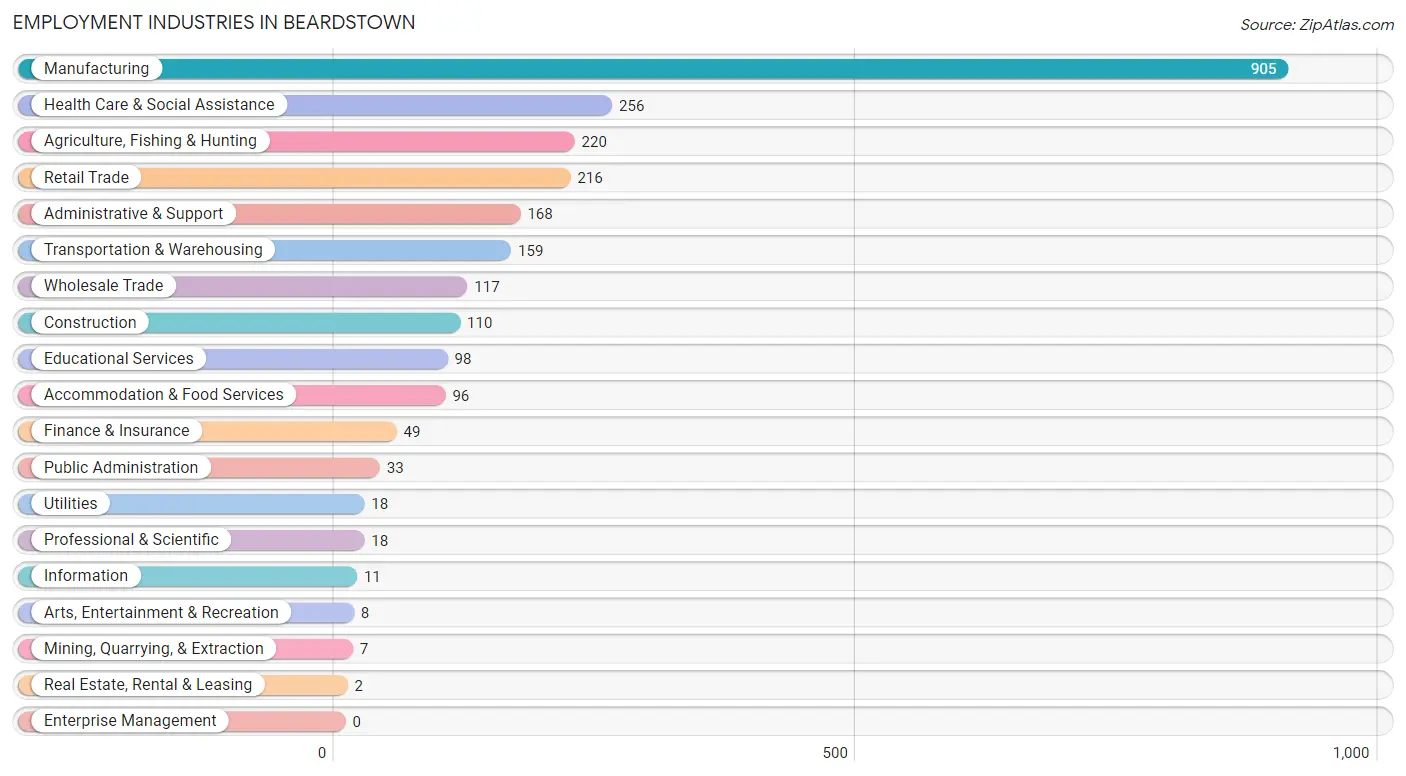
Employment Industries in Beardstown
The major employment industries in Beardstown include Manufacturing (905 | 35.5%), Health Care & Social Assistance (256 | 10.1%), Agriculture, Fishing & Hunting (220 | 8.6%), Retail Trade (216 | 8.5%), and Administrative & Support (168 | 6.6%).
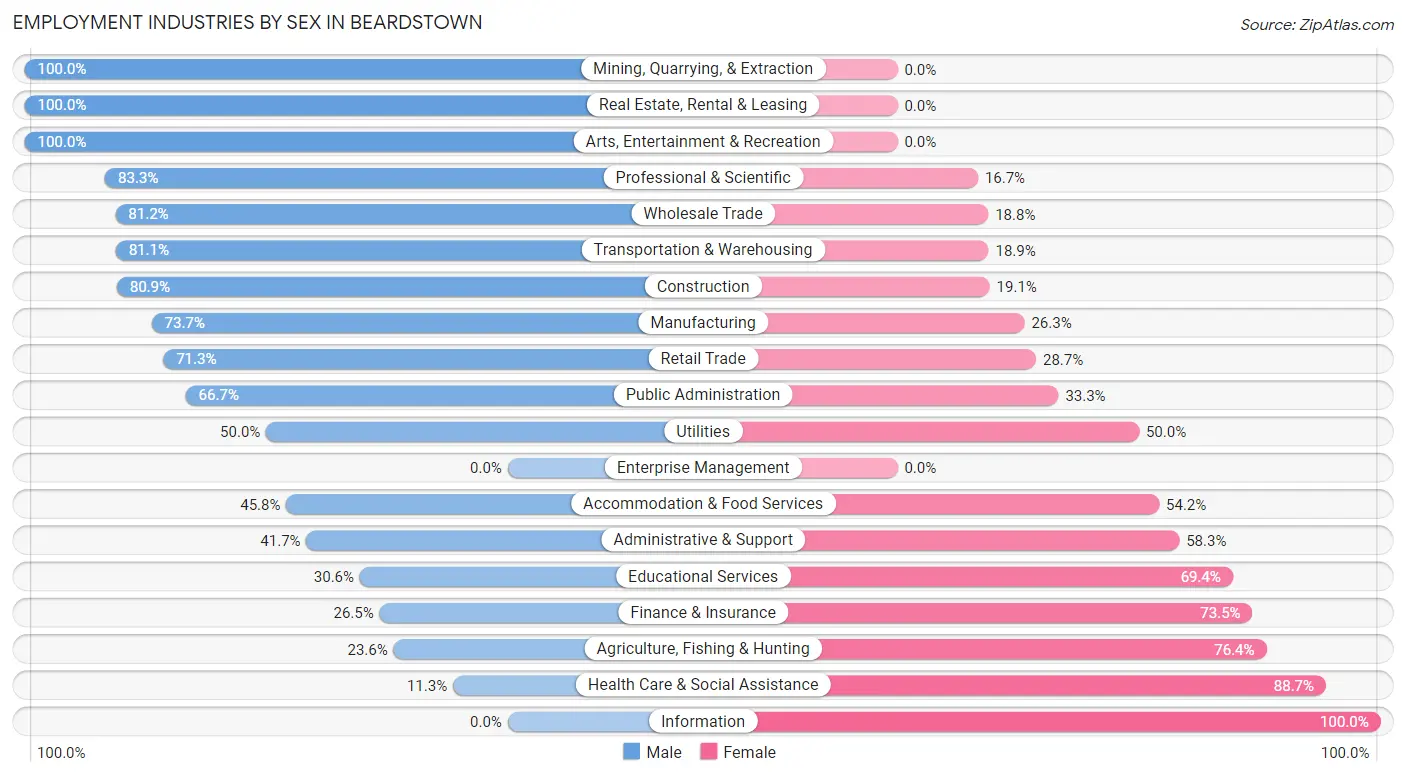
Employment Industries by Sex in Beardstown
The Beardstown industries that see more men than women are Mining, Quarrying, & Extraction (100.0%), Real Estate, Rental & Leasing (100.0%), and Arts, Entertainment & Recreation (100.0%), whereas the industries that tend to have a higher number of women are Information (100.0%), Health Care & Social Assistance (88.7%), and Agriculture, Fishing & Hunting (76.4%).
| Industry | Male | Female |
| Agriculture, Fishing & Hunting | 52 (23.6%) | 168 (76.4%) |
| Mining, Quarrying, & Extraction | 7 (100.0%) | 0 (0.0%) |
| Construction | 89 (80.9%) | 21 (19.1%) |
| Manufacturing | 667 (73.7%) | 238 (26.3%) |
| Wholesale Trade | 95 (81.2%) | 22 (18.8%) |
| Retail Trade | 154 (71.3%) | 62 (28.7%) |
| Transportation & Warehousing | 129 (81.1%) | 30 (18.9%) |
| Utilities | 9 (50.0%) | 9 (50.0%) |
| Information | 0 (0.0%) | 11 (100.0%) |
| Finance & Insurance | 13 (26.5%) | 36 (73.5%) |
| Real Estate, Rental & Leasing | 2 (100.0%) | 0 (0.0%) |
| Professional & Scientific | 15 (83.3%) | 3 (16.7%) |
| Enterprise Management | 0 (0.0%) | 0 (0.0%) |
| Administrative & Support | 70 (41.7%) | 98 (58.3%) |
| Educational Services | 30 (30.6%) | 68 (69.4%) |
| Health Care & Social Assistance | 29 (11.3%) | 227 (88.7%) |
| Arts, Entertainment & Recreation | 8 (100.0%) | 0 (0.0%) |
| Accommodation & Food Services | 44 (45.8%) | 52 (54.2%) |
| Public Administration | 22 (66.7%) | 11 (33.3%) |
| Total | 1,469 (57.7%) | 1,078 (42.3%) |
Education in Beardstown
School Enrollment in Beardstown
The most common levels of schooling among the 1,584 students in Beardstown are high school (433 | 27.3%), middle school (415 | 26.2%), and elementary school (330 | 20.8%).
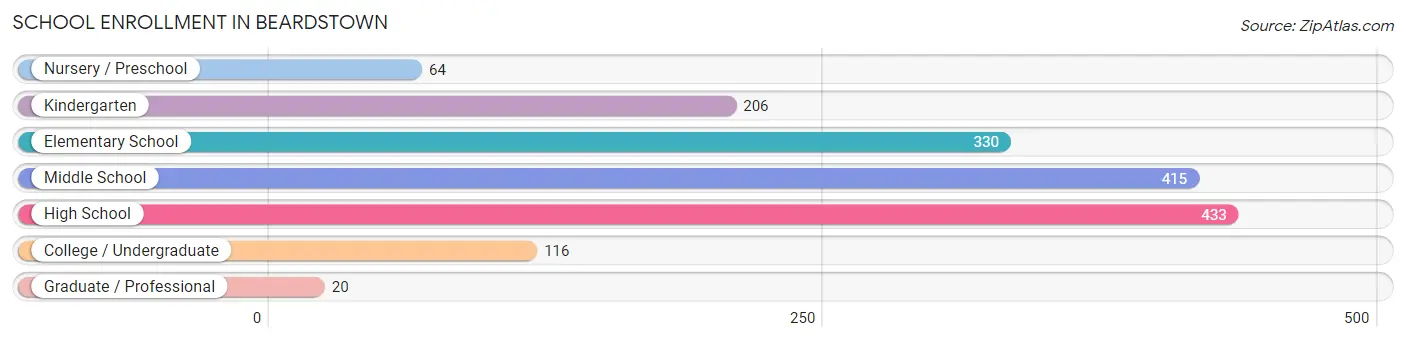
| School Level | # Students | % Students |
| Nursery / Preschool | 64 | 4.0% |
| Kindergarten | 206 | 13.0% |
| Elementary School | 330 | 20.8% |
| Middle School | 415 | 26.2% |
| High School | 433 | 27.3% |
| College / Undergraduate | 116 | 7.3% |
| Graduate / Professional | 20 | 1.3% |
| Total | 1,584 | 100.0% |
School Enrollment by Age by Funding Source in Beardstown
Out of a total of 1,584 students who are enrolled in schools in Beardstown, 204 (12.9%) attend a private institution, while the remaining 1,380 (87.1%) are enrolled in public schools. The age group of 18 to 19 year olds has the highest likelihood of being enrolled in private schools, with 47 (50.5% in the age bracket) enrolled. Conversely, the age group of 25 to 34 year olds has the lowest likelihood of being enrolled in a private school, with 34 (100.0% in the age bracket) attending a public institution.
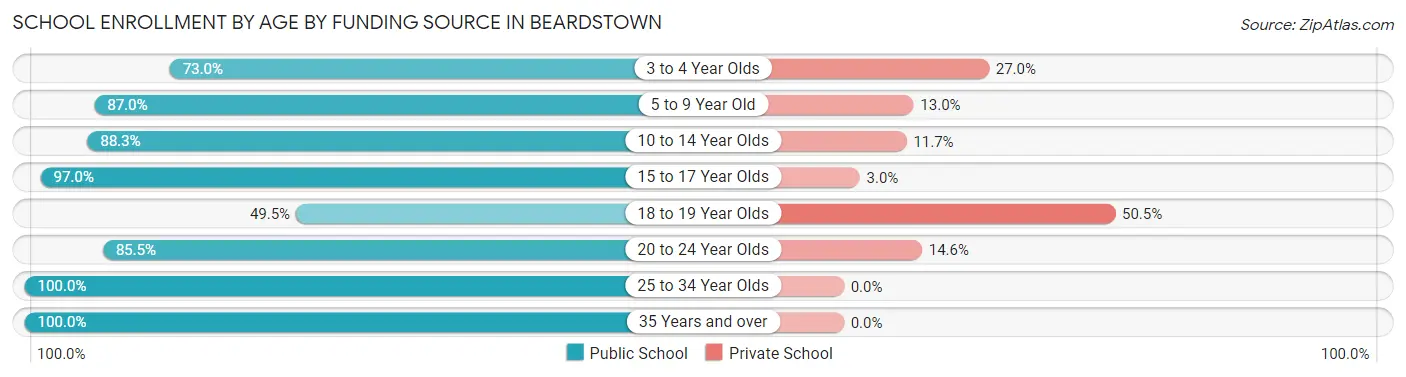
| Age Bracket | Public School | Private School |
| 3 to 4 Year Olds | 27 (73.0%) | 10 (27.0%) |
| 5 to 9 Year Old | 462 (87.0%) | 69 (13.0%) |
| 10 to 14 Year Olds | 476 (88.3%) | 63 (11.7%) |
| 15 to 17 Year Olds | 261 (97.0%) | 8 (3.0%) |
| 18 to 19 Year Olds | 46 (49.5%) | 47 (50.5%) |
| 20 to 24 Year Olds | 47 (85.5%) | 8 (14.5%) |
| 25 to 34 Year Olds | 34 (100.0%) | 0 (0.0%) |
| 35 Years and over | 26 (100.0%) | 0 (0.0%) |
| Total | 1,380 (87.1%) | 204 (12.9%) |
Educational Attainment by Field of Study in Beardstown
Education (117 | 23.0%), bio, nature & agricultural (115 | 22.6%), psychology (51 | 10.0%), arts & humanities (45 | 8.9%), and business (40 | 7.9%) are the most common fields of study among 508 individuals in Beardstown who have obtained a bachelor's degree or higher.
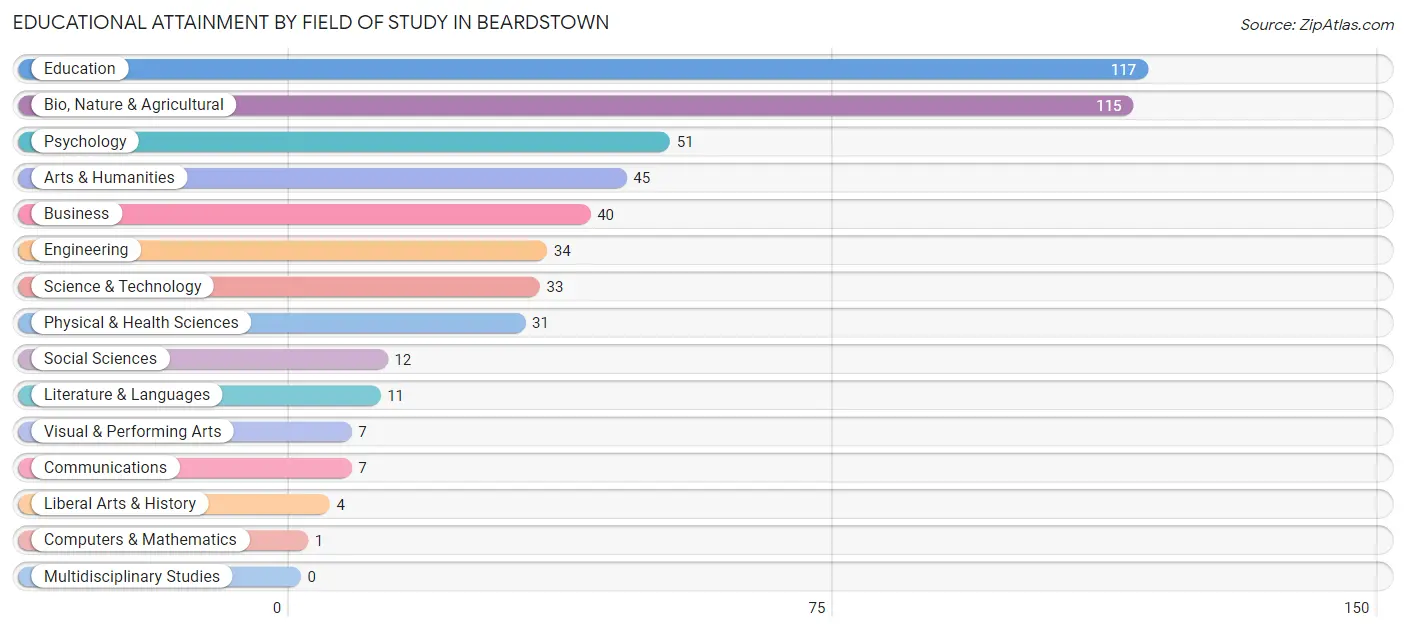
| Field of Study | # Graduates | % Graduates |
| Computers & Mathematics | 1 | 0.2% |
| Bio, Nature & Agricultural | 115 | 22.6% |
| Physical & Health Sciences | 31 | 6.1% |
| Psychology | 51 | 10.0% |
| Social Sciences | 12 | 2.4% |
| Engineering | 34 | 6.7% |
| Multidisciplinary Studies | 0 | 0.0% |
| Science & Technology | 33 | 6.5% |
| Business | 40 | 7.9% |
| Education | 117 | 23.0% |
| Literature & Languages | 11 | 2.2% |
| Liberal Arts & History | 4 | 0.8% |
| Visual & Performing Arts | 7 | 1.4% |
| Communications | 7 | 1.4% |
| Arts & Humanities | 45 | 8.9% |
| Total | 508 | 100.0% |
Transportation & Commute in Beardstown
Vehicle Availability by Sex in Beardstown
The most prevalent vehicle ownership categories in Beardstown are males with 2 vehicles (651, accounting for 44.5%) and females with 2 vehicles (363, making up 66.8%).
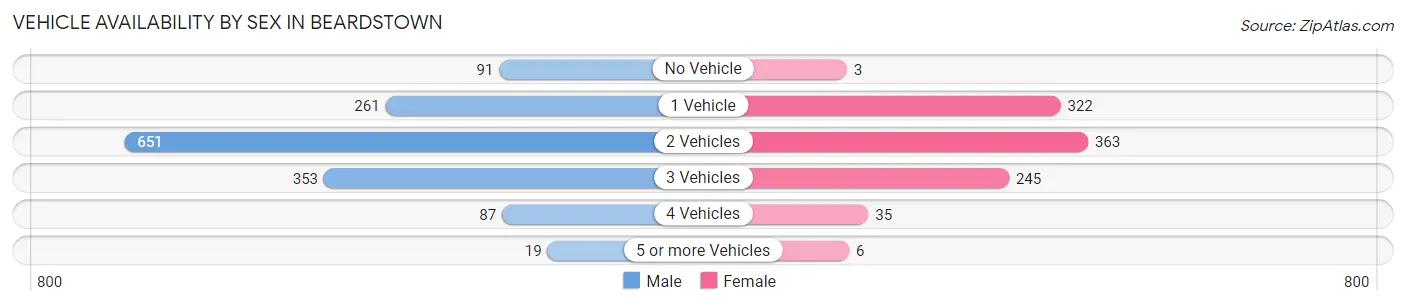
| Vehicles Available | Male | Female |
| No Vehicle | 91 (6.2%) | 3 (0.3%) |
| 1 Vehicle | 261 (17.8%) | 322 (33.1%) |
| 2 Vehicles | 651 (44.5%) | 363 (37.3%) |
| 3 Vehicles | 353 (24.1%) | 245 (25.2%) |
| 4 Vehicles | 87 (5.9%) | 35 (3.6%) |
| 5 or more Vehicles | 19 (1.3%) | 6 (0.6%) |
| Total | 1,462 (100.0%) | 974 (100.0%) |
Commute Time in Beardstown
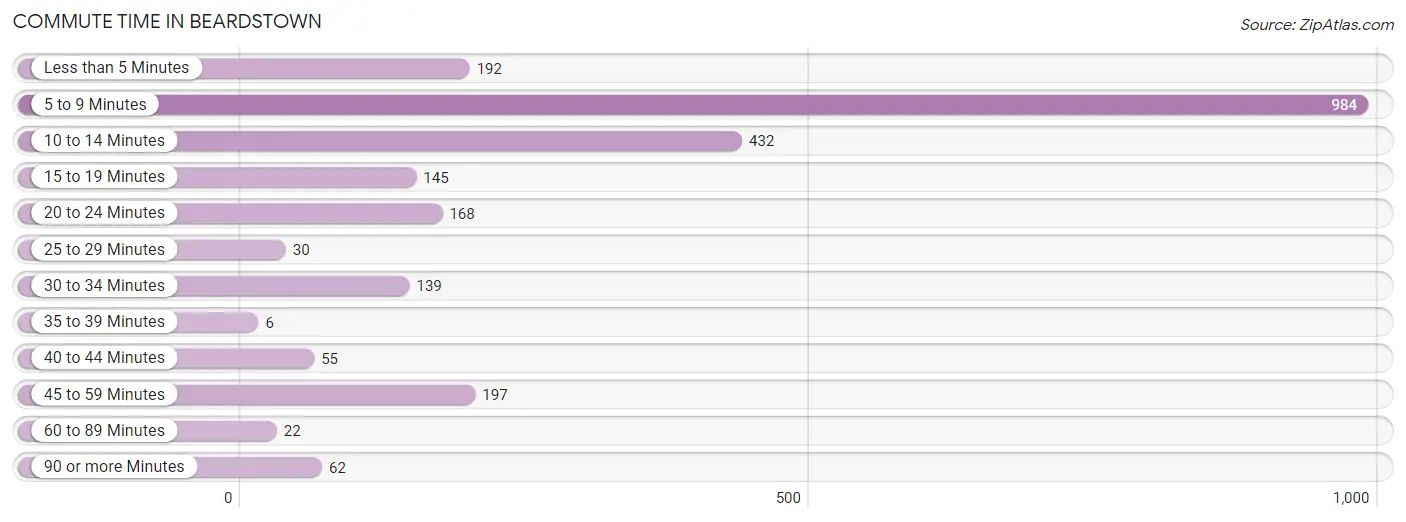
The most frequently occuring commute durations in Beardstown are 5 to 9 minutes (984 commuters, 40.5%), 10 to 14 minutes (432 commuters, 17.8%), and 45 to 59 minutes (197 commuters, 8.1%).
| Commute Time | # Commuters | % Commuters |
| Less than 5 Minutes | 192 | 7.9% |
| 5 to 9 Minutes | 984 | 40.5% |
| 10 to 14 Minutes | 432 | 17.8% |
| 15 to 19 Minutes | 145 | 6.0% |
| 20 to 24 Minutes | 168 | 6.9% |
| 25 to 29 Minutes | 30 | 1.2% |
| 30 to 34 Minutes | 139 | 5.7% |
| 35 to 39 Minutes | 6 | 0.3% |
| 40 to 44 Minutes | 55 | 2.3% |
| 45 to 59 Minutes | 197 | 8.1% |
| 60 to 89 Minutes | 22 | 0.9% |
| 90 or more Minutes | 62 | 2.5% |
Commute Time by Sex in Beardstown
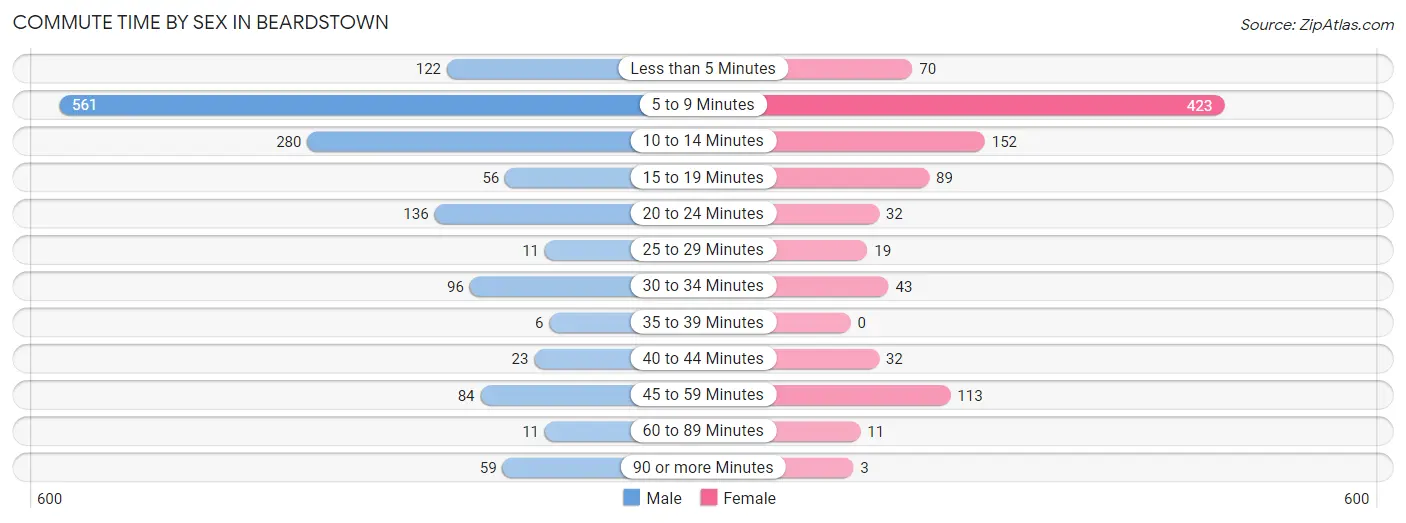
The most common commute times in Beardstown are 5 to 9 minutes (561 commuters, 38.8%) for males and 5 to 9 minutes (423 commuters, 42.9%) for females.
| Commute Time | Male | Female |
| Less than 5 Minutes | 122 (8.4%) | 70 (7.1%) |
| 5 to 9 Minutes | 561 (38.8%) | 423 (42.9%) |
| 10 to 14 Minutes | 280 (19.4%) | 152 (15.4%) |
| 15 to 19 Minutes | 56 (3.9%) | 89 (9.0%) |
| 20 to 24 Minutes | 136 (9.4%) | 32 (3.2%) |
| 25 to 29 Minutes | 11 (0.8%) | 19 (1.9%) |
| 30 to 34 Minutes | 96 (6.6%) | 43 (4.4%) |
| 35 to 39 Minutes | 6 (0.4%) | 0 (0.0%) |
| 40 to 44 Minutes | 23 (1.6%) | 32 (3.2%) |
| 45 to 59 Minutes | 84 (5.8%) | 113 (11.5%) |
| 60 to 89 Minutes | 11 (0.8%) | 11 (1.1%) |
| 90 or more Minutes | 59 (4.1%) | 3 (0.3%) |
Time of Departure to Work by Sex in Beardstown
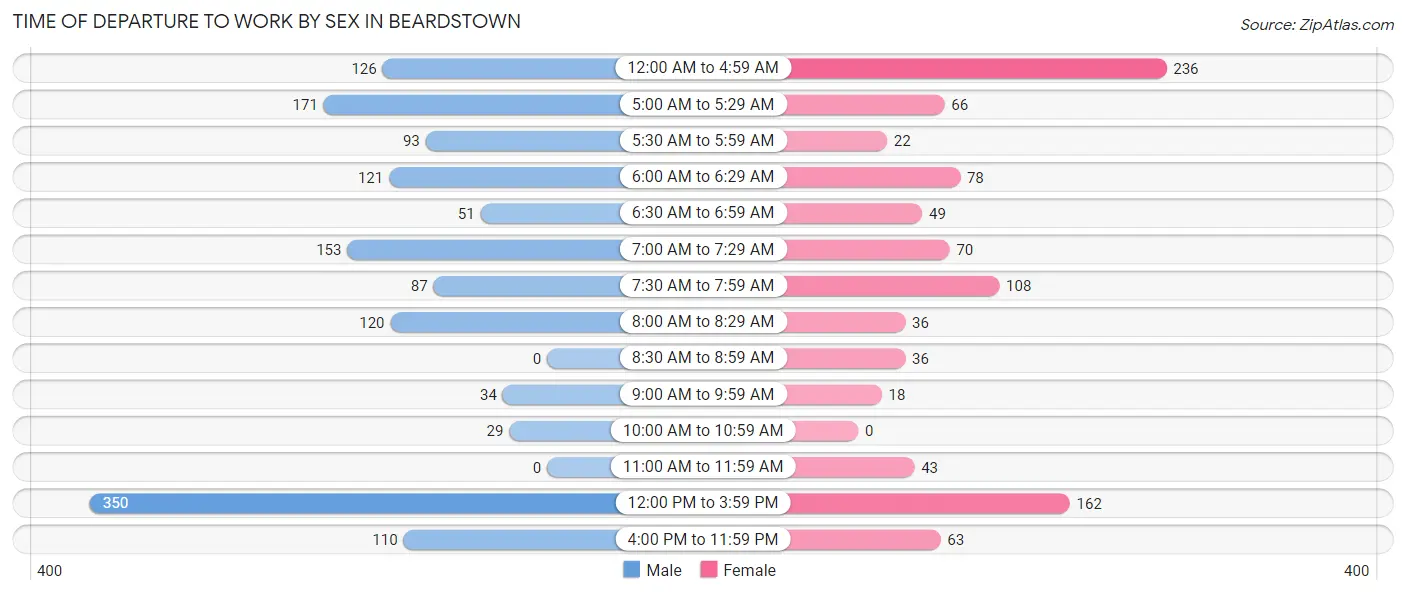
The most frequent times of departure to work in Beardstown are 12:00 PM to 3:59 PM (350, 24.2%) for males and 12:00 AM to 4:59 AM (236, 23.9%) for females.
| Time of Departure | Male | Female |
| 12:00 AM to 4:59 AM | 126 (8.7%) | 236 (23.9%) |
| 5:00 AM to 5:29 AM | 171 (11.8%) | 66 (6.7%) |
| 5:30 AM to 5:59 AM | 93 (6.4%) | 22 (2.2%) |
| 6:00 AM to 6:29 AM | 121 (8.4%) | 78 (7.9%) |
| 6:30 AM to 6:59 AM | 51 (3.5%) | 49 (5.0%) |
| 7:00 AM to 7:29 AM | 153 (10.6%) | 70 (7.1%) |
| 7:30 AM to 7:59 AM | 87 (6.0%) | 108 (10.9%) |
| 8:00 AM to 8:29 AM | 120 (8.3%) | 36 (3.6%) |
| 8:30 AM to 8:59 AM | 0 (0.0%) | 36 (3.6%) |
| 9:00 AM to 9:59 AM | 34 (2.4%) | 18 (1.8%) |
| 10:00 AM to 10:59 AM | 29 (2.0%) | 0 (0.0%) |
| 11:00 AM to 11:59 AM | 0 (0.0%) | 43 (4.4%) |
| 12:00 PM to 3:59 PM | 350 (24.2%) | 162 (16.4%) |
| 4:00 PM to 11:59 PM | 110 (7.6%) | 63 (6.4%) |
| Total | 1,445 (100.0%) | 987 (100.0%) |
Housing Occupancy in Beardstown
Occupancy by Ownership in Beardstown
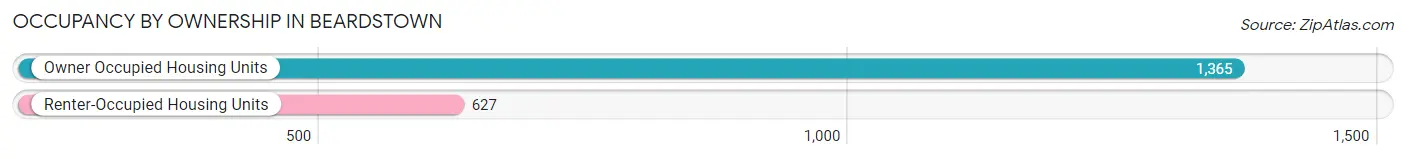
Of the total 1,992 dwellings in Beardstown, owner-occupied units account for 1,365 (68.5%), while renter-occupied units make up 627 (31.5%).
| Occupancy | # Housing Units | % Housing Units |
| Owner Occupied Housing Units | 1,365 | 68.5% |
| Renter-Occupied Housing Units | 627 | 31.5% |
| Total Occupied Housing Units | 1,992 | 100.0% |
Occupancy by Household Size in Beardstown
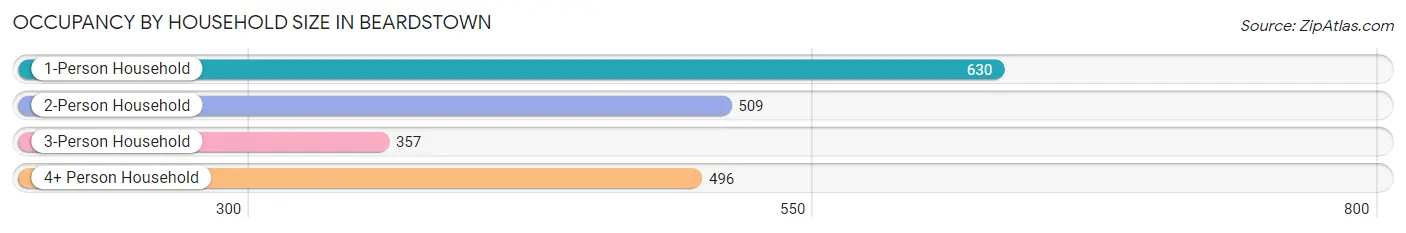
| Household Size | # Housing Units | % Housing Units |
| 1-Person Household | 630 | 31.6% |
| 2-Person Household | 509 | 25.6% |
| 3-Person Household | 357 | 17.9% |
| 4+ Person Household | 496 | 24.9% |
| Total Housing Units | 1,992 | 100.0% |
Occupancy by Ownership by Household Size in Beardstown
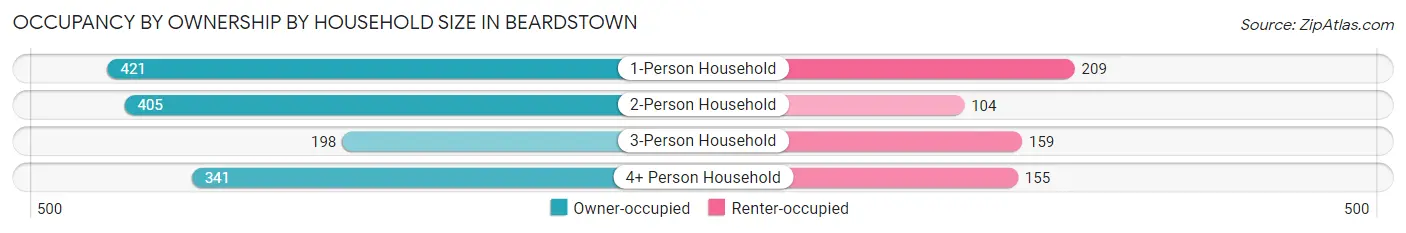
| Household Size | Owner-occupied | Renter-occupied |
| 1-Person Household | 421 (66.8%) | 209 (33.2%) |
| 2-Person Household | 405 (79.6%) | 104 (20.4%) |
| 3-Person Household | 198 (55.5%) | 159 (44.5%) |
| 4+ Person Household | 341 (68.8%) | 155 (31.2%) |
| Total Housing Units | 1,365 (68.5%) | 627 (31.5%) |
Occupancy by Educational Attainment in Beardstown
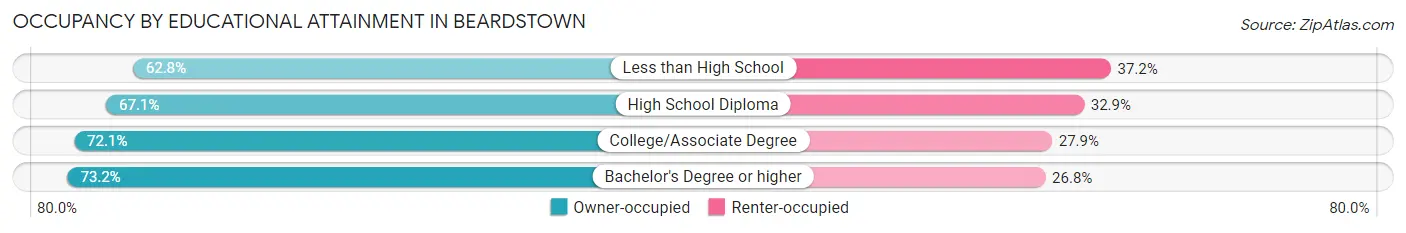
| Household Size | Owner-occupied | Renter-occupied |
| Less than High School | 223 (62.8%) | 132 (37.2%) |
| High School Diploma | 558 (67.1%) | 274 (32.9%) |
| College/Associate Degree | 360 (72.1%) | 139 (27.9%) |
| Bachelor's Degree or higher | 224 (73.2%) | 82 (26.8%) |
Occupancy by Age of Householder in Beardstown
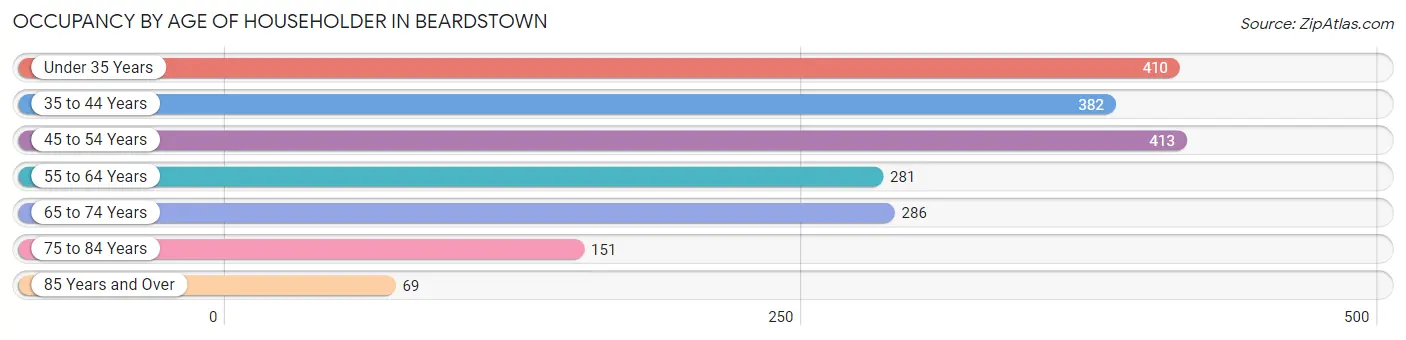
| Age Bracket | # Households | % Households |
| Under 35 Years | 410 | 20.6% |
| 35 to 44 Years | 382 | 19.2% |
| 45 to 54 Years | 413 | 20.7% |
| 55 to 64 Years | 281 | 14.1% |
| 65 to 74 Years | 286 | 14.4% |
| 75 to 84 Years | 151 | 7.6% |
| 85 Years and Over | 69 | 3.5% |
| Total | 1,992 | 100.0% |
Housing Finances in Beardstown
Median Income by Occupancy in Beardstown
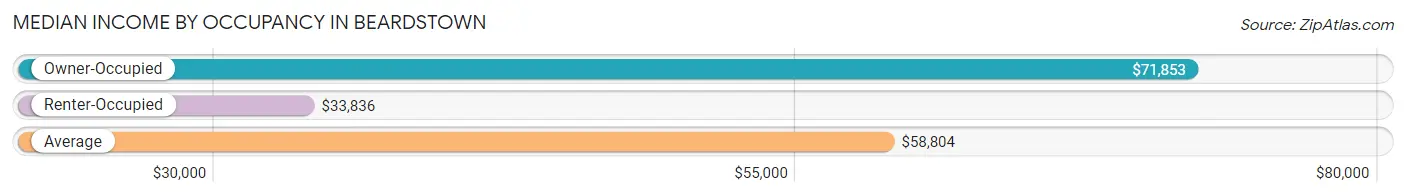
| Occupancy Type | # Households | Median Income |
| Owner-Occupied | 1,365 (68.5%) | $71,853 |
| Renter-Occupied | 627 (31.5%) | $33,836 |
| Average | 1,992 (100.0%) | $58,804 |
Occupancy by Householder Income Bracket in Beardstown
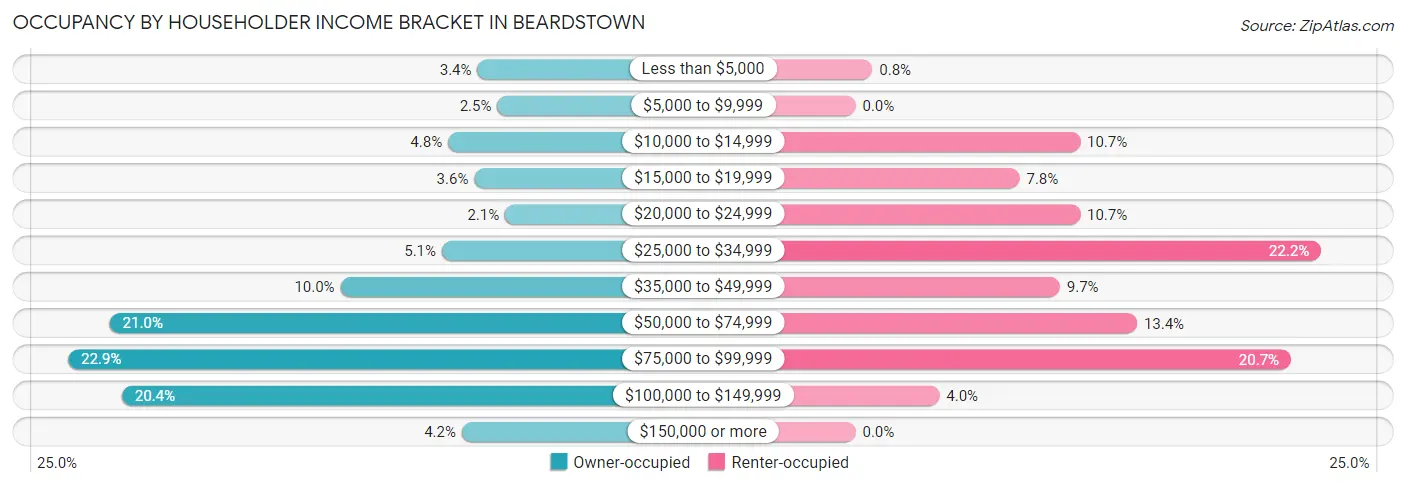
| Income Bracket | Owner-occupied | Renter-occupied |
| Less than $5,000 | 47 (3.4%) | 5 (0.8%) |
| $5,000 to $9,999 | 34 (2.5%) | 0 (0.0%) |
| $10,000 to $14,999 | 66 (4.8%) | 67 (10.7%) |
| $15,000 to $19,999 | 49 (3.6%) | 49 (7.8%) |
| $20,000 to $24,999 | 29 (2.1%) | 67 (10.7%) |
| $25,000 to $34,999 | 70 (5.1%) | 139 (22.2%) |
| $35,000 to $49,999 | 136 (10.0%) | 61 (9.7%) |
| $50,000 to $74,999 | 286 (20.9%) | 84 (13.4%) |
| $75,000 to $99,999 | 313 (22.9%) | 130 (20.7%) |
| $100,000 to $149,999 | 278 (20.4%) | 25 (4.0%) |
| $150,000 or more | 57 (4.2%) | 0 (0.0%) |
| Total | 1,365 (100.0%) | 627 (100.0%) |
Monthly Housing Cost Tiers in Beardstown
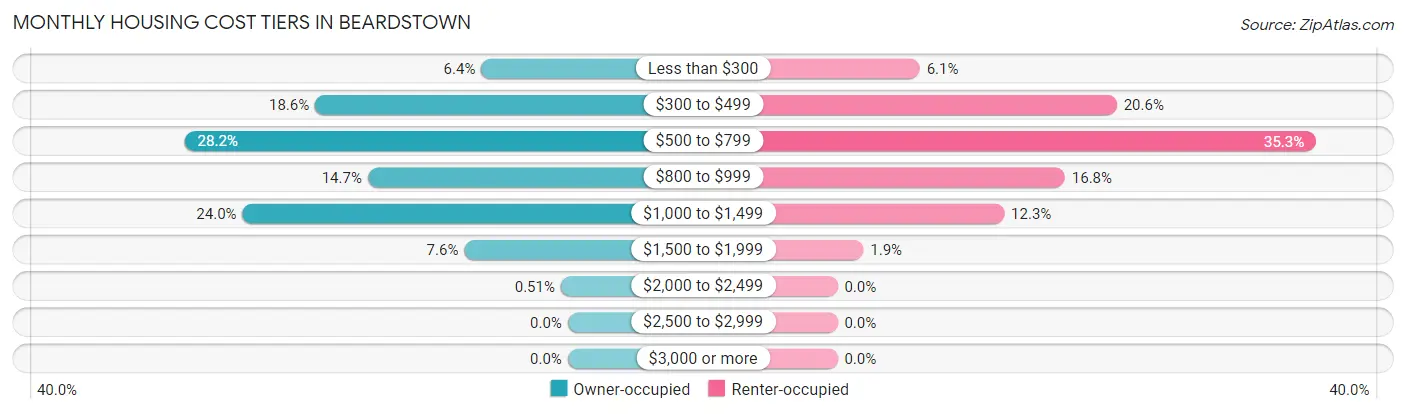
| Monthly Cost | Owner-occupied | Renter-occupied |
| Less than $300 | 87 (6.4%) | 38 (6.1%) |
| $300 to $499 | 254 (18.6%) | 129 (20.6%) |
| $500 to $799 | 385 (28.2%) | 221 (35.2%) |
| $800 to $999 | 201 (14.7%) | 105 (16.8%) |
| $1,000 to $1,499 | 327 (24.0%) | 77 (12.3%) |
| $1,500 to $1,999 | 104 (7.6%) | 12 (1.9%) |
| $2,000 to $2,499 | 7 (0.5%) | 0 (0.0%) |
| $2,500 to $2,999 | 0 (0.0%) | 0 (0.0%) |
| $3,000 or more | 0 (0.0%) | 0 (0.0%) |
| Total | 1,365 (100.0%) | 627 (100.0%) |
Physical Housing Characteristics in Beardstown
Housing Structures in Beardstown
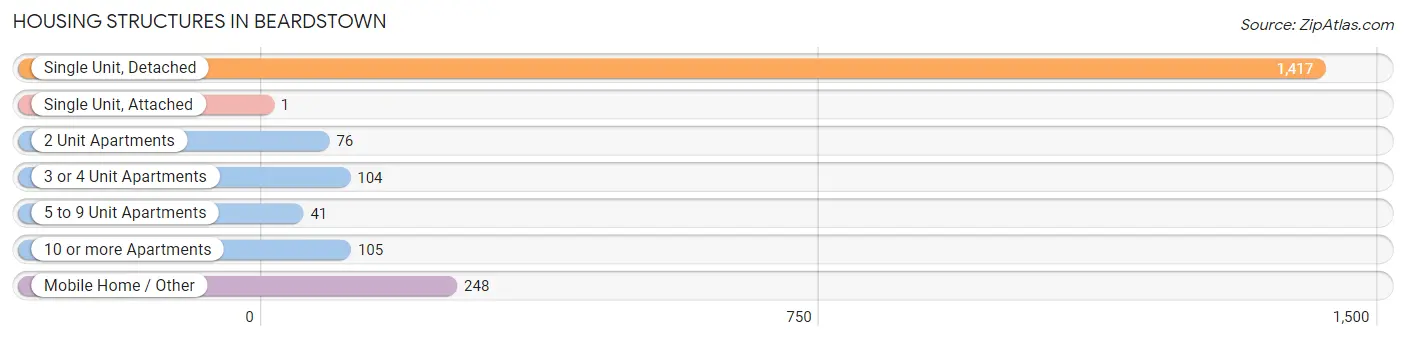
| Structure Type | # Housing Units | % Housing Units |
| Single Unit, Detached | 1,417 | 71.1% |
| Single Unit, Attached | 1 | 0.1% |
| 2 Unit Apartments | 76 | 3.8% |
| 3 or 4 Unit Apartments | 104 | 5.2% |
| 5 to 9 Unit Apartments | 41 | 2.1% |
| 10 or more Apartments | 105 | 5.3% |
| Mobile Home / Other | 248 | 12.4% |
| Total | 1,992 | 100.0% |
Housing Structures by Occupancy in Beardstown
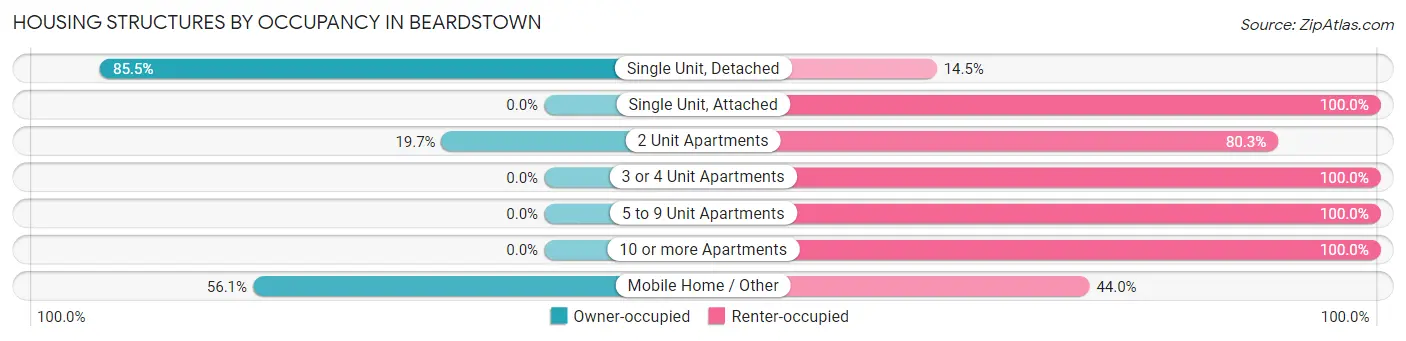
| Structure Type | Owner-occupied | Renter-occupied |
| Single Unit, Detached | 1,211 (85.5%) | 206 (14.5%) |
| Single Unit, Attached | 0 (0.0%) | 1 (100.0%) |
| 2 Unit Apartments | 15 (19.7%) | 61 (80.3%) |
| 3 or 4 Unit Apartments | 0 (0.0%) | 104 (100.0%) |
| 5 to 9 Unit Apartments | 0 (0.0%) | 41 (100.0%) |
| 10 or more Apartments | 0 (0.0%) | 105 (100.0%) |
| Mobile Home / Other | 139 (56.0%) | 109 (44.0%) |
| Total | 1,365 (68.5%) | 627 (31.5%) |
Housing Structures by Number of Rooms in Beardstown
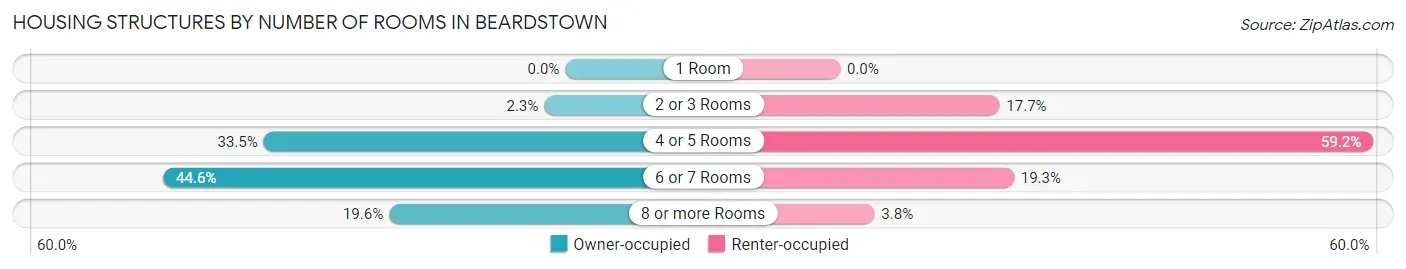
| Number of Rooms | Owner-occupied | Renter-occupied |
| 1 Room | 0 (0.0%) | 0 (0.0%) |
| 2 or 3 Rooms | 32 (2.3%) | 111 (17.7%) |
| 4 or 5 Rooms | 457 (33.5%) | 371 (59.2%) |
| 6 or 7 Rooms | 609 (44.6%) | 121 (19.3%) |
| 8 or more Rooms | 267 (19.6%) | 24 (3.8%) |
| Total | 1,365 (100.0%) | 627 (100.0%) |
Housing Structure by Heating Type in Beardstown
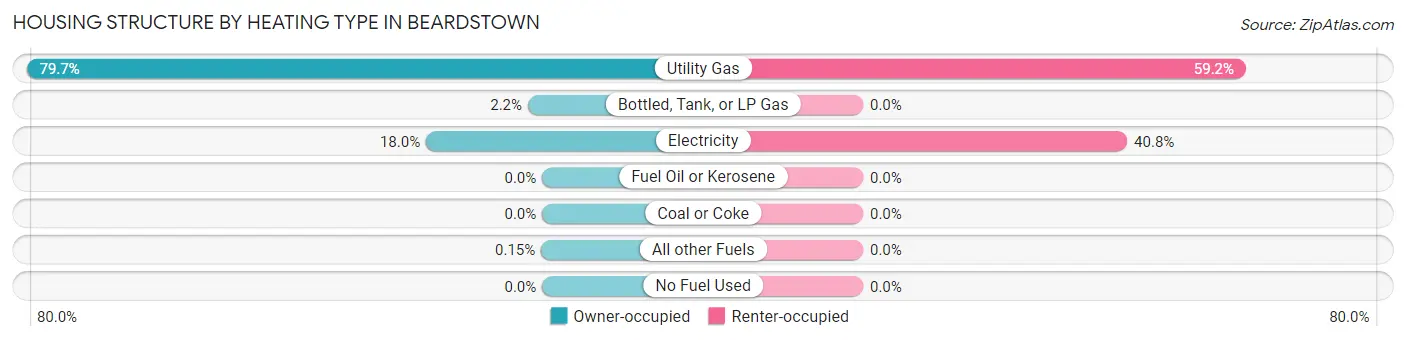
| Heating Type | Owner-occupied | Renter-occupied |
| Utility Gas | 1,088 (79.7%) | 371 (59.2%) |
| Bottled, Tank, or LP Gas | 30 (2.2%) | 0 (0.0%) |
| Electricity | 245 (17.9%) | 256 (40.8%) |
| Fuel Oil or Kerosene | 0 (0.0%) | 0 (0.0%) |
| Coal or Coke | 0 (0.0%) | 0 (0.0%) |
| All other Fuels | 2 (0.2%) | 0 (0.0%) |
| No Fuel Used | 0 (0.0%) | 0 (0.0%) |
| Total | 1,365 (100.0%) | 627 (100.0%) |
Household Vehicle Usage in Beardstown
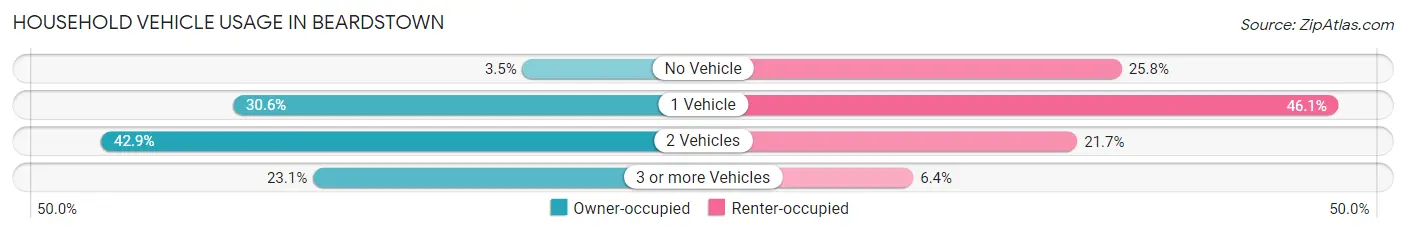
| Vehicles per Household | Owner-occupied | Renter-occupied |
| No Vehicle | 48 (3.5%) | 162 (25.8%) |
| 1 Vehicle | 417 (30.5%) | 289 (46.1%) |
| 2 Vehicles | 585 (42.9%) | 136 (21.7%) |
| 3 or more Vehicles | 315 (23.1%) | 40 (6.4%) |
| Total | 1,365 (100.0%) | 627 (100.0%) |
Real Estate & Mortgages in Beardstown
Real Estate and Mortgage Overview in Beardstown
| Characteristic | Without Mortgage | With Mortgage |
| Housing Units | 649 | 716 |
| Median Property Value | $77,000 | $79,300 |
| Median Household Income | $70,703 | $25 |
| Monthly Housing Costs | $500 | $0 |
| Real Estate Taxes | $1,234 | $29 |
Property Value by Mortgage Status in Beardstown
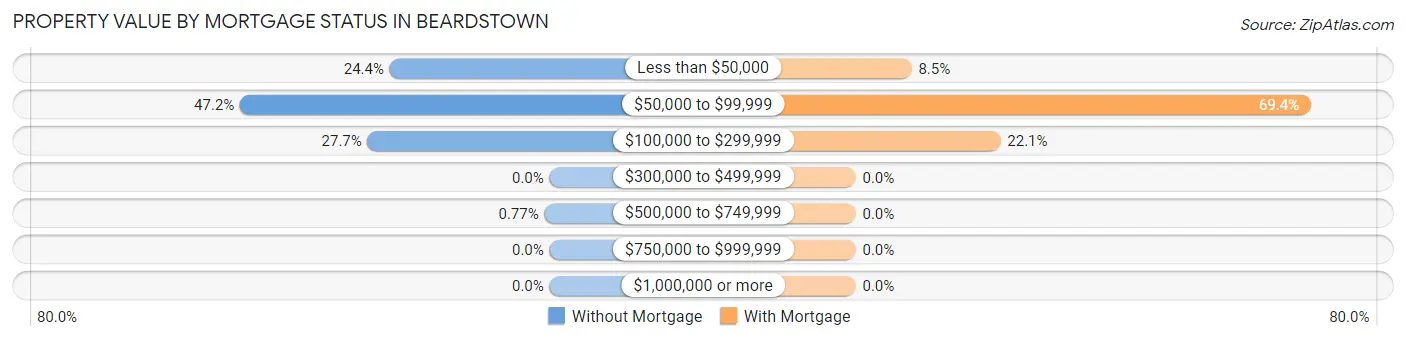
| Property Value | Without Mortgage | With Mortgage |
| Less than $50,000 | 158 (24.3%) | 61 (8.5%) |
| $50,000 to $99,999 | 306 (47.1%) | 497 (69.4%) |
| $100,000 to $299,999 | 180 (27.7%) | 158 (22.1%) |
| $300,000 to $499,999 | 0 (0.0%) | 0 (0.0%) |
| $500,000 to $749,999 | 5 (0.8%) | 0 (0.0%) |
| $750,000 to $999,999 | 0 (0.0%) | 0 (0.0%) |
| $1,000,000 or more | 0 (0.0%) | 0 (0.0%) |
| Total | 649 (100.0%) | 716 (100.0%) |
Household Income by Mortgage Status in Beardstown
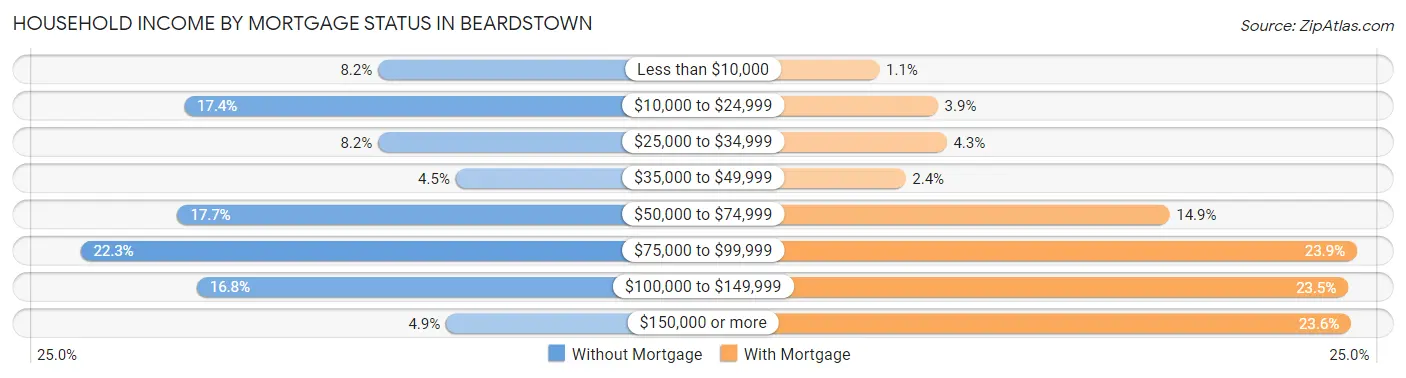
| Household Income | Without Mortgage | With Mortgage |
| Less than $10,000 | 53 (8.2%) | 8 (1.1%) |
| $10,000 to $24,999 | 113 (17.4%) | 28 (3.9%) |
| $25,000 to $34,999 | 53 (8.2%) | 31 (4.3%) |
| $35,000 to $49,999 | 29 (4.5%) | 17 (2.4%) |
| $50,000 to $74,999 | 115 (17.7%) | 107 (14.9%) |
| $75,000 to $99,999 | 145 (22.3%) | 171 (23.9%) |
| $100,000 to $149,999 | 109 (16.8%) | 168 (23.5%) |
| $150,000 or more | 32 (4.9%) | 169 (23.6%) |
| Total | 649 (100.0%) | 716 (100.0%) |
Property Value to Household Income Ratio in Beardstown
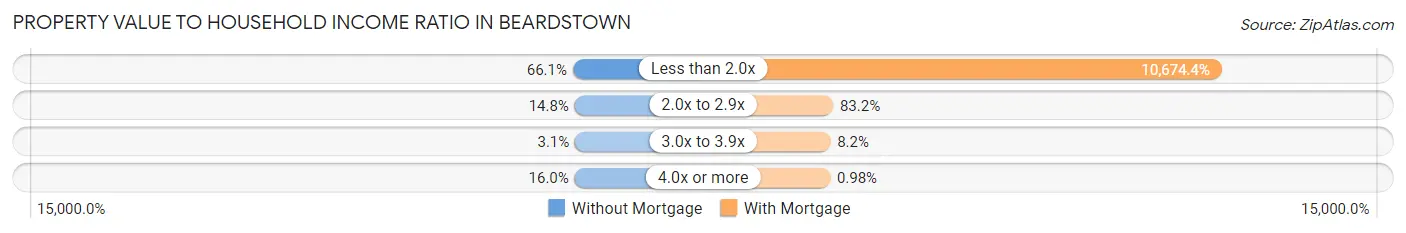
| Value-to-Income Ratio | Without Mortgage | With Mortgage |
| Less than 2.0x | 429 (66.1%) | 76,429 (10,674.4%) |
| 2.0x to 2.9x | 96 (14.8%) | 596 (83.2%) |
| 3.0x to 3.9x | 20 (3.1%) | 59 (8.2%) |
| 4.0x or more | 104 (16.0%) | 7 (1.0%) |
| Total | 649 (100.0%) | 716 (100.0%) |
Real Estate Taxes by Mortgage Status in Beardstown
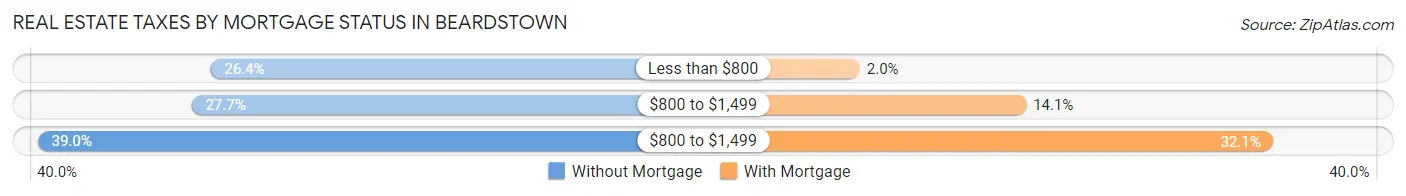
| Property Taxes | Without Mortgage | With Mortgage |
| Less than $800 | 171 (26.4%) | 14 (2.0%) |
| $800 to $1,499 | 180 (27.7%) | 101 (14.1%) |
| $800 to $1,499 | 253 (39.0%) | 230 (32.1%) |
| Total | 649 (100.0%) | 716 (100.0%) |
Health & Disability in Beardstown
Health Insurance Coverage by Age in Beardstown
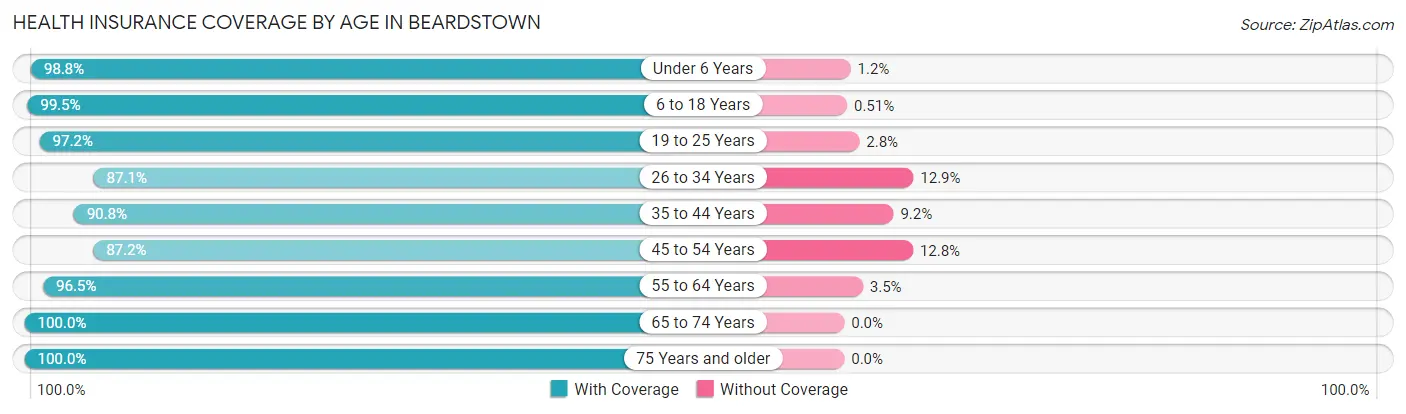
| Age Bracket | With Coverage | Without Coverage |
| Under 6 Years | 420 (98.8%) | 5 (1.2%) |
| 6 to 18 Years | 1,355 (99.5%) | 7 (0.5%) |
| 19 to 25 Years | 588 (97.2%) | 17 (2.8%) |
| 26 to 34 Years | 656 (87.1%) | 97 (12.9%) |
| 35 to 44 Years | 743 (90.8%) | 75 (9.2%) |
| 45 to 54 Years | 552 (87.2%) | 81 (12.8%) |
| 55 to 64 Years | 614 (96.5%) | 22 (3.5%) |
| 65 to 74 Years | 320 (100.0%) | 0 (0.0%) |
| 75 Years and older | 267 (100.0%) | 0 (0.0%) |
| Total | 5,515 (94.8%) | 304 (5.2%) |
Health Insurance Coverage by Citizenship Status in Beardstown
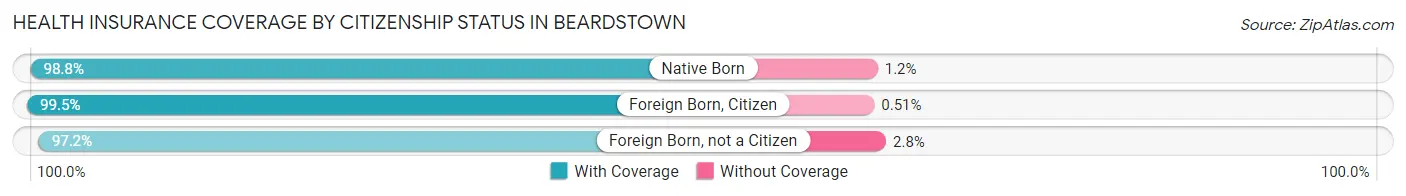
| Citizenship Status | With Coverage | Without Coverage |
| Native Born | 420 (98.8%) | 5 (1.2%) |
| Foreign Born, Citizen | 1,355 (99.5%) | 7 (0.5%) |
| Foreign Born, not a Citizen | 588 (97.2%) | 17 (2.8%) |
Health Insurance Coverage by Household Income in Beardstown
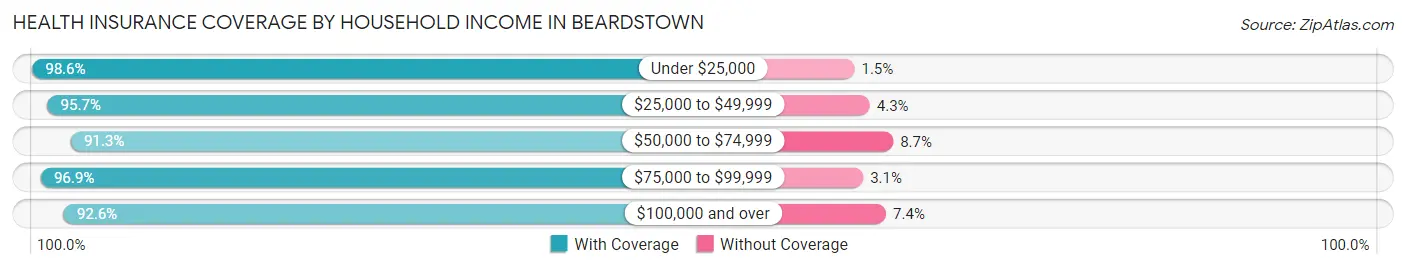
| Household Income | With Coverage | Without Coverage |
| Under $25,000 | 678 (98.6%) | 10 (1.5%) |
| $25,000 to $49,999 | 931 (95.7%) | 42 (4.3%) |
| $50,000 to $74,999 | 1,071 (91.3%) | 102 (8.7%) |
| $75,000 to $99,999 | 1,510 (96.9%) | 48 (3.1%) |
| $100,000 and over | 1,282 (92.6%) | 102 (7.4%) |
Public vs Private Health Insurance Coverage by Age in Beardstown
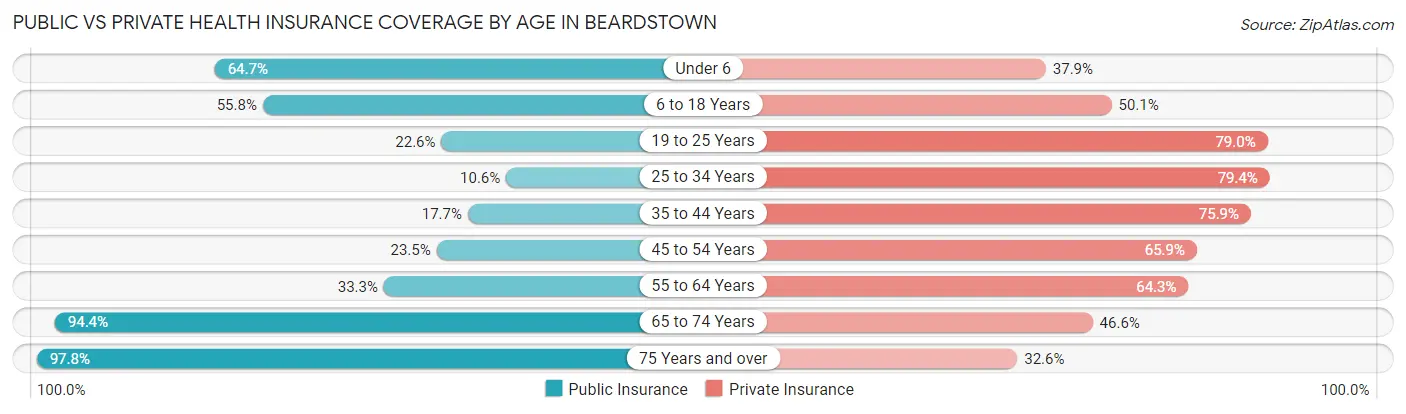
| Age Bracket | Public Insurance | Private Insurance |
| Under 6 | 275 (64.7%) | 161 (37.9%) |
| 6 to 18 Years | 760 (55.8%) | 682 (50.1%) |
| 19 to 25 Years | 137 (22.6%) | 478 (79.0%) |
| 25 to 34 Years | 80 (10.6%) | 598 (79.4%) |
| 35 to 44 Years | 145 (17.7%) | 621 (75.9%) |
| 45 to 54 Years | 149 (23.5%) | 417 (65.9%) |
| 55 to 64 Years | 212 (33.3%) | 409 (64.3%) |
| 65 to 74 Years | 302 (94.4%) | 149 (46.6%) |
| 75 Years and over | 261 (97.8%) | 87 (32.6%) |
| Total | 2,321 (39.9%) | 3,602 (61.9%) |
Disability Status by Sex by Age in Beardstown
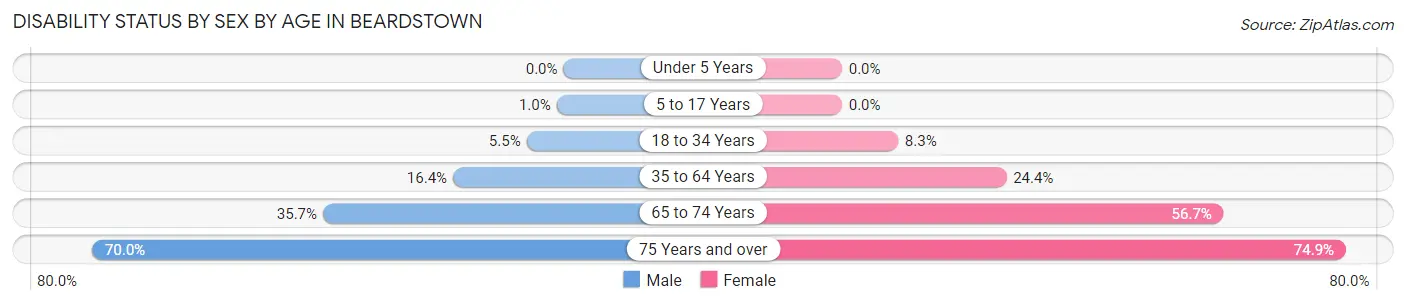
| Age Bracket | Male | Female |
| Under 5 Years | 0 (0.0%) | 0 (0.0%) |
| 5 to 17 Years | 8 (1.0%) | 0 (0.0%) |
| 18 to 34 Years | 44 (5.5%) | 55 (8.3%) |
| 35 to 64 Years | 175 (16.4%) | 249 (24.4%) |
| 65 to 74 Years | 45 (35.7%) | 110 (56.7%) |
| 75 Years and over | 70 (70.0%) | 125 (74.9%) |
Disability Class by Sex by Age in Beardstown
Disability Class: Hearing Difficulty
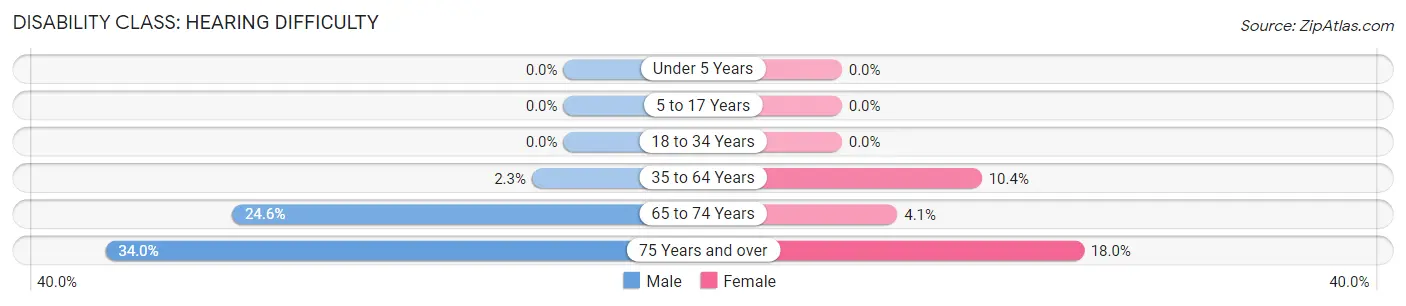
| Age Bracket | Male | Female |
| Under 5 Years | 0 (0.0%) | 0 (0.0%) |
| 5 to 17 Years | 0 (0.0%) | 0 (0.0%) |
| 18 to 34 Years | 0 (0.0%) | 0 (0.0%) |
| 35 to 64 Years | 25 (2.3%) | 106 (10.4%) |
| 65 to 74 Years | 31 (24.6%) | 8 (4.1%) |
| 75 Years and over | 34 (34.0%) | 30 (18.0%) |
Disability Class: Vision Difficulty
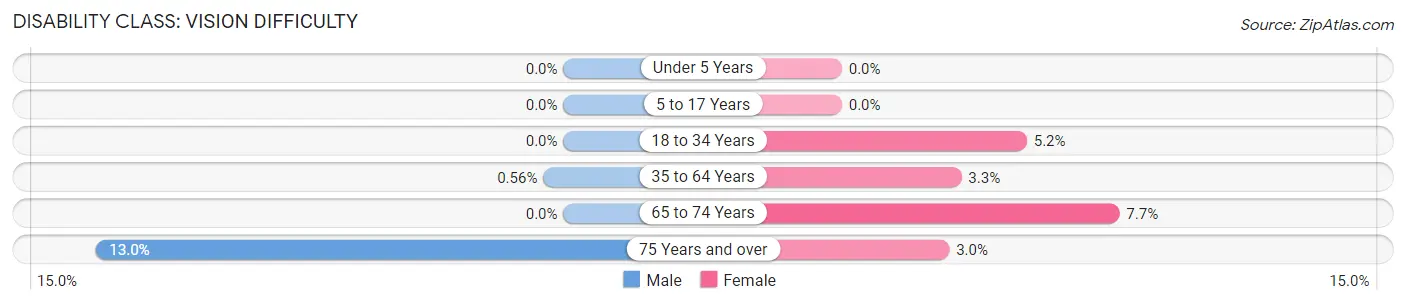
| Age Bracket | Male | Female |
| Under 5 Years | 0 (0.0%) | 0 (0.0%) |
| 5 to 17 Years | 0 (0.0%) | 0 (0.0%) |
| 18 to 34 Years | 0 (0.0%) | 34 (5.1%) |
| 35 to 64 Years | 6 (0.6%) | 34 (3.3%) |
| 65 to 74 Years | 0 (0.0%) | 15 (7.7%) |
| 75 Years and over | 13 (13.0%) | 5 (3.0%) |
Disability Class: Cognitive Difficulty
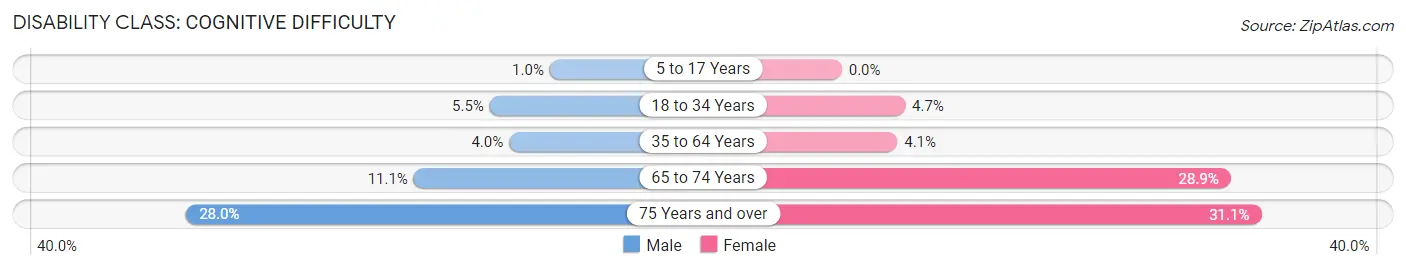
| Age Bracket | Male | Female |
| 5 to 17 Years | 8 (1.0%) | 0 (0.0%) |
| 18 to 34 Years | 44 (5.5%) | 31 (4.7%) |
| 35 to 64 Years | 43 (4.0%) | 42 (4.1%) |
| 65 to 74 Years | 14 (11.1%) | 56 (28.9%) |
| 75 Years and over | 28 (28.0%) | 52 (31.1%) |
Disability Class: Ambulatory Difficulty
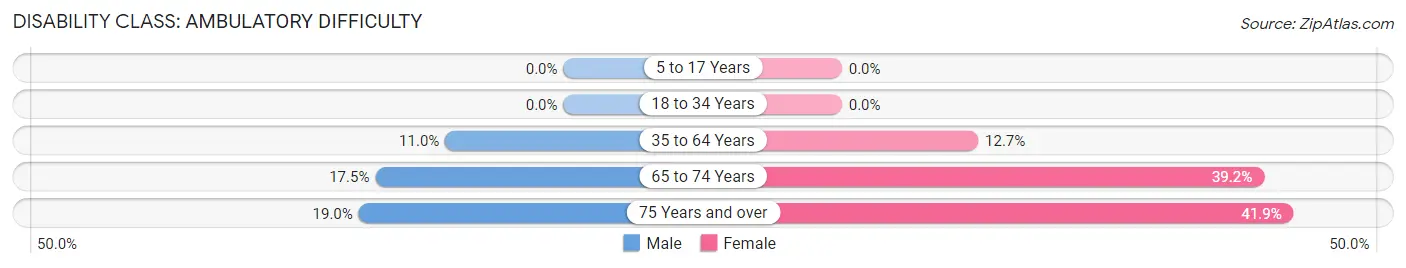
| Age Bracket | Male | Female |
| 5 to 17 Years | 0 (0.0%) | 0 (0.0%) |
| 18 to 34 Years | 0 (0.0%) | 0 (0.0%) |
| 35 to 64 Years | 117 (11.0%) | 129 (12.7%) |
| 65 to 74 Years | 22 (17.5%) | 76 (39.2%) |
| 75 Years and over | 19 (19.0%) | 70 (41.9%) |
Disability Class: Self-Care Difficulty
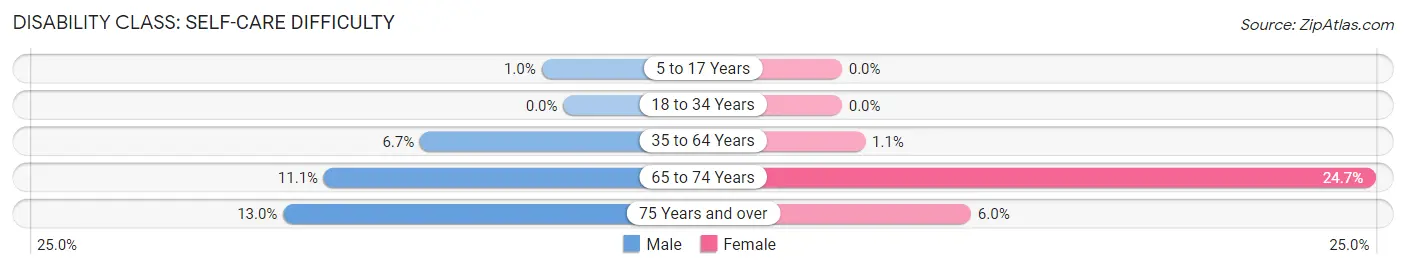
| Age Bracket | Male | Female |
| 5 to 17 Years | 8 (1.0%) | 0 (0.0%) |
| 18 to 34 Years | 0 (0.0%) | 0 (0.0%) |
| 35 to 64 Years | 71 (6.7%) | 11 (1.1%) |
| 65 to 74 Years | 14 (11.1%) | 48 (24.7%) |
| 75 Years and over | 13 (13.0%) | 10 (6.0%) |
Technology Access in Beardstown
Computing Device Access in Beardstown
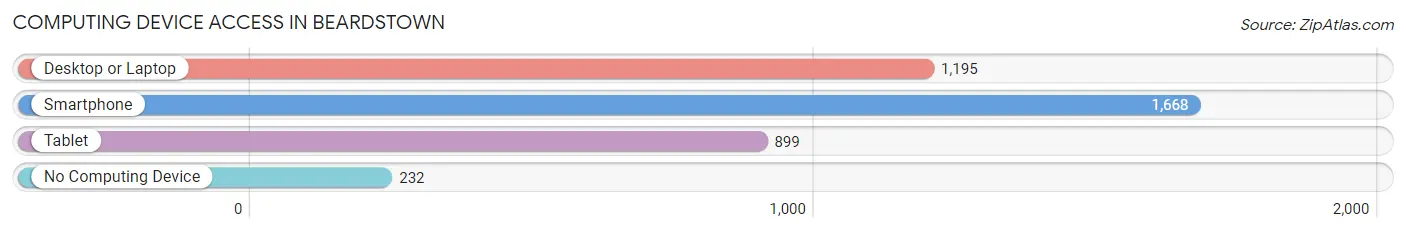
| Device Type | # Households | % Households |
| Desktop or Laptop | 1,195 | 60.0% |
| Smartphone | 1,668 | 83.7% |
| Tablet | 899 | 45.1% |
| No Computing Device | 232 | 11.7% |
| Total | 1,992 | 100.0% |
Internet Access in Beardstown
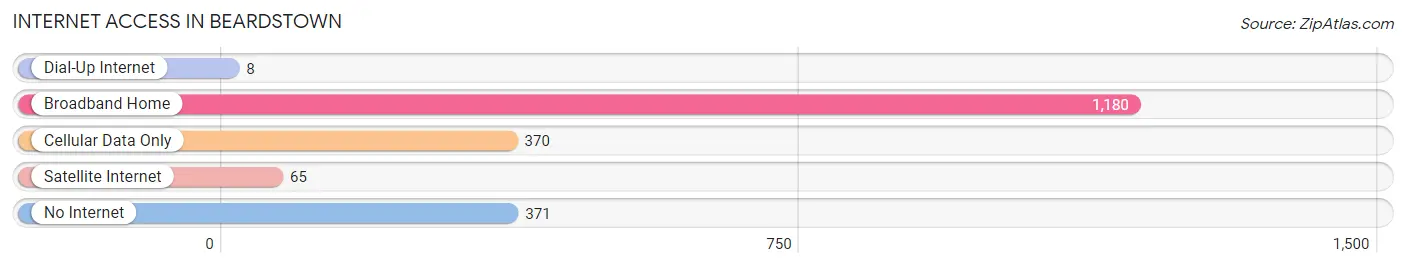
| Internet Type | # Households | % Households |
| Dial-Up Internet | 8 | 0.4% |
| Broadband Home | 1,180 | 59.2% |
| Cellular Data Only | 370 | 18.6% |
| Satellite Internet | 65 | 3.3% |
| No Internet | 371 | 18.6% |
| Total | 1,992 | 100.0% |
Beardstown Summary
Beardstown, Illinois is a small city located in Cass County, Illinois, United States. It is situated on the banks of the Illinois River, approximately 60 miles west of Springfield, the state capital. The city has a population of 6,123 as of the 2010 census, making it the largest city in Cass County.
History
Beardstown was founded in 1819 by Thomas Beard, a Revolutionary War veteran who had moved to the area from Kentucky. He named the town after himself and it quickly became a thriving river port. The town was incorporated in 1844 and soon became a major center for trade and commerce.
In the late 19th century, Beardstown was a major stop on the Chicago, Burlington & Quincy Railroad. This allowed the city to become a major hub for the transportation of goods and services. The city also became a major center for the production of agricultural products, such as corn, wheat, and soybeans.
Geography
Beardstown is located at 40°25'25" North, 90°25'25" West (40.423, -90.423). According to the United States Census Bureau, the city has a total area of 4.2 square miles, all of it land.
The city is situated on the banks of the Illinois River, which provides a major transportation route for goods and services. The city is also located near the intersection of Interstate 72 and U.S. Route 67, which provide easy access to other parts of the state.
Economy
Beardstown is a major center for the production of agricultural products, such as corn, wheat, and soybeans. The city is also home to several manufacturing companies, including a large Tyson Foods plant.
The city is also home to several retail stores, including a Walmart Supercenter, a Lowe's Home Improvement store, and a variety of other stores.
Demographics
As of the 2010 census, there were 6,123 people, 2,521 households, and 1,541 families residing in the city. The population density was 1,457.3 people per square mile. The racial makeup of the city was 87.2% White, 8.2% African American, 0.3% Native American, 0.7% Asian, 0.1% Pacific Islander, 1.2% from other races, and 2.3% from two or more races. Hispanic or Latino of any race were 3.3% of the population.
The median income for a household in the city was $37,917, and the median income for a family was $45,938. Males had a median income of $35,938 versus $25,917 for females. The per capita income for the city was $17,917. About 11.2% of families and 14.2% of the population were below the poverty line, including 19.2% of those under age 18 and 8.2% of those age 65 or over.
Beardstown is a small city with a rich history and a diverse economy. It is home to a variety of businesses and industries, and is a major center for the production of agricultural products. The city is also home to a variety of retail stores, and is conveniently located near major highways and the Illinois River.
Common Questions
What is Per Capita Income in Beardstown?
Per Capita income in Beardstown is $23,050.
What is the Median Family Income in Beardstown?
Median Family Income in Beardstown is $75,284.
What is the Median Household income in Beardstown?
Median Household Income in Beardstown is $58,804.
What is Income or Wage Gap in Beardstown?
Income or Wage Gap in Beardstown is 36.1%.
Women in Beardstown earn 63.9 cents for every dollar earned by a man.
What is Inequality or Gini Index in Beardstown?
Inequality or Gini Index in Beardstown is 0.38.
What is the Total Population of Beardstown?
Total Population of Beardstown is 5,884.
What is the Total Male Population of Beardstown?
Total Male Population of Beardstown is 3,009.
What is the Total Female Population of Beardstown?
Total Female Population of Beardstown is 2,875.
What is the Ratio of Males per 100 Females in Beardstown?
There are 104.66 Males per 100 Females in Beardstown.
What is the Ratio of Females per 100 Males in Beardstown?
There are 95.55 Females per 100 Males in Beardstown.
What is the Median Population Age in Beardstown?
Median Population Age in Beardstown is 31.7 Years.
What is the Average Family Size in Beardstown
Average Family Size in Beardstown is 3.7 People.
What is the Average Household Size in Beardstown
Average Household Size in Beardstown is 2.9 People.
How Large is the Labor Force in Beardstown?
There are 2,779 People in the Labor Forcein in Beardstown.
What is the Percentage of People in the Labor Force in Beardstown?
63.4% of People are in the Labor Force in Beardstown.
What is the Unemployment Rate in Beardstown?
Unemployment Rate in Beardstown is 8.3%.