High Point, NC Map & Demographics
High Point Map
High Point Overview
$33,222
PER CAPITA INCOME
$76,644
AVG FAMILY INCOME
$58,582
AVG HOUSEHOLD INCOME
21.9%
WAGE / INCOME GAP [ % ]
78.1¢/ $1
WAGE / INCOME GAP [ $ ]
$11,471
FAMILY INCOME DEFICIT
0.47
INEQUALITY / GINI INDEX
114,120
TOTAL POPULATION
55,324
MALE POPULATION
58,796
FEMALE POPULATION
94.09
MALES / 100 FEMALES
106.28
FEMALES / 100 MALES
37.7
MEDIAN AGE
3.1
AVG FAMILY SIZE
2.5
AVG HOUSEHOLD SIZE
57,106
LABOR FORCE [ PEOPLE ]
62.6%
PERCENT IN LABOR FORCE
6.2%
UNEMPLOYMENT RATE
High Point Area Codes
Income in High Point
Income Overview in High Point
Per Capita Income in High Point is $33,222, while median incomes of families and households are $76,644 and $58,582 respectively.
| Characteristic | Number | Measure |
| Per Capita Income | 114,120 | $33,222 |
| Median Family Income | 27,812 | $76,644 |
| Mean Family Income | 27,812 | $98,505 |
| Median Household Income | 44,049 | $58,582 |
| Mean Household Income | 44,049 | $83,465 |
| Income Deficit | 27,812 | $11,471 |
| Wage / Income Gap (%) | 114,120 | 21.93% |
| Wage / Income Gap ($) | 114,120 | 78.07¢ per $1 |
| Gini / Inequality Index | 114,120 | 0.47 |
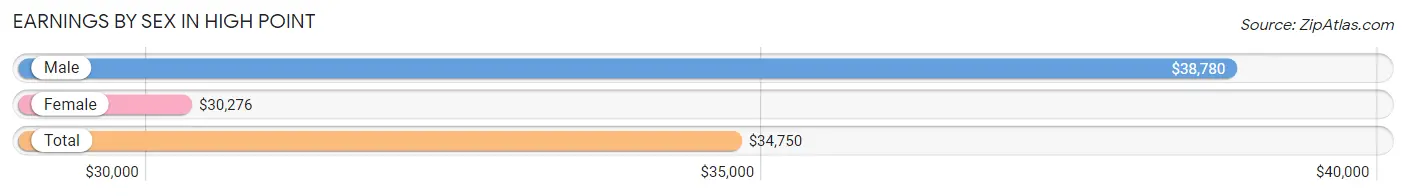
Earnings by Sex in High Point
Average Earnings in High Point are $34,750, $38,780 for men and $30,276 for women, a difference of 21.9%.
| Sex | Number | Average Earnings |
| Male | 30,586 (50.8%) | $38,780 |
| Female | 29,598 (49.2%) | $30,276 |
| Total | 60,184 (100.0%) | $34,750 |
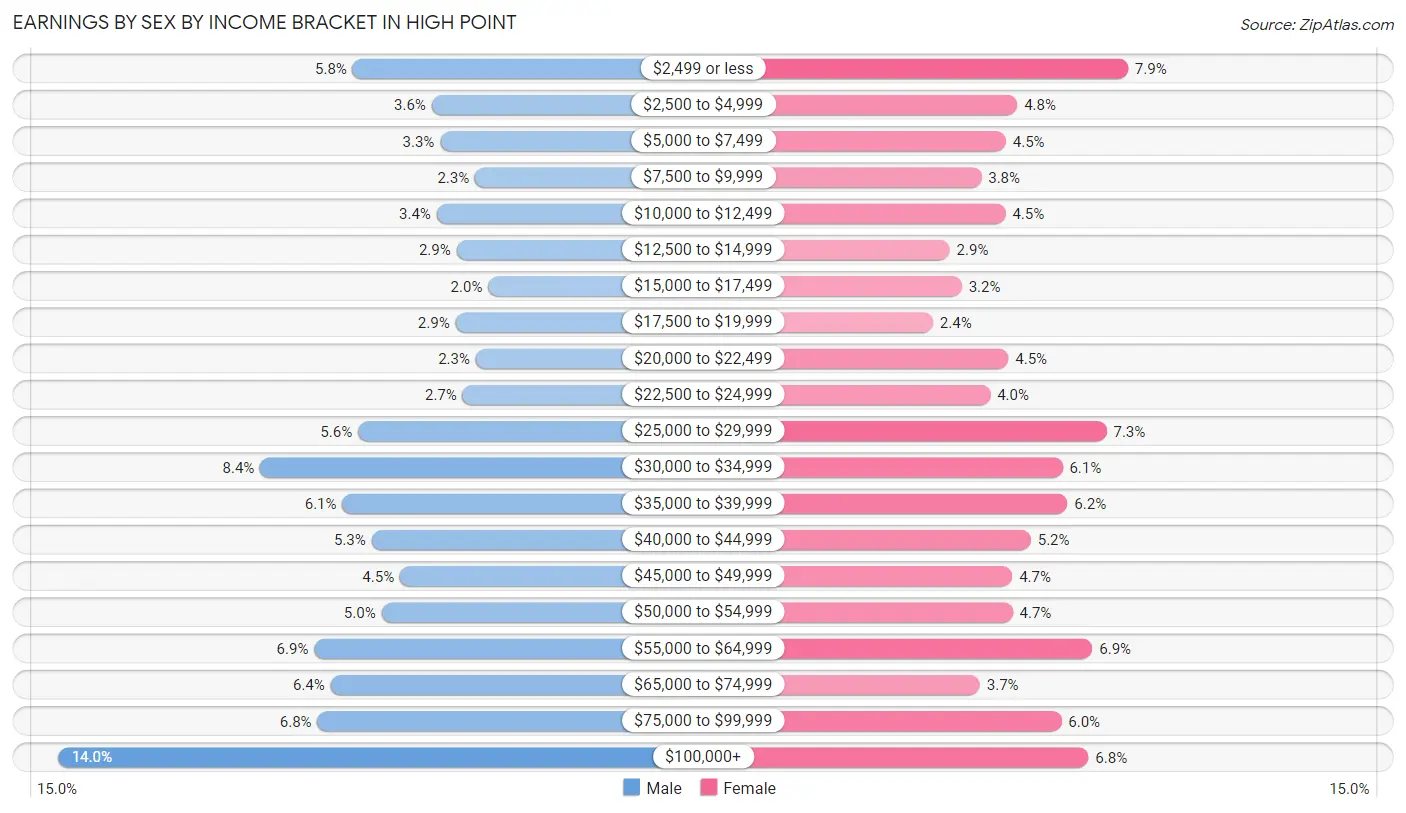
Earnings by Sex by Income Bracket in High Point
The most common earnings brackets in High Point are $100,000+ for men (4,293 | 14.0%) and $2,499 or less for women (2,339 | 7.9%).
| Income | Male | Female |
| $2,499 or less | 1,769 (5.8%) | 2,339 (7.9%) |
| $2,500 to $4,999 | 1,090 (3.6%) | 1,418 (4.8%) |
| $5,000 to $7,499 | 1,015 (3.3%) | 1,322 (4.5%) |
| $7,500 to $9,999 | 716 (2.3%) | 1,120 (3.8%) |
| $10,000 to $12,499 | 1,047 (3.4%) | 1,321 (4.5%) |
| $12,500 to $14,999 | 876 (2.9%) | 854 (2.9%) |
| $15,000 to $17,499 | 604 (2.0%) | 957 (3.2%) |
| $17,500 to $19,999 | 885 (2.9%) | 716 (2.4%) |
| $20,000 to $22,499 | 710 (2.3%) | 1,343 (4.5%) |
| $22,500 to $24,999 | 822 (2.7%) | 1,192 (4.0%) |
| $25,000 to $29,999 | 1,722 (5.6%) | 2,161 (7.3%) |
| $30,000 to $34,999 | 2,563 (8.4%) | 1,793 (6.1%) |
| $35,000 to $39,999 | 1,857 (6.1%) | 1,836 (6.2%) |
| $40,000 to $44,999 | 1,605 (5.2%) | 1,530 (5.2%) |
| $45,000 to $49,999 | 1,361 (4.4%) | 1,377 (4.6%) |
| $50,000 to $54,999 | 1,521 (5.0%) | 1,378 (4.7%) |
| $55,000 to $64,999 | 2,099 (6.9%) | 2,041 (6.9%) |
| $65,000 to $74,999 | 1,959 (6.4%) | 1,106 (3.7%) |
| $75,000 to $99,999 | 2,072 (6.8%) | 1,785 (6.0%) |
| $100,000+ | 4,293 (14.0%) | 2,009 (6.8%) |
| Total | 30,586 (100.0%) | 29,598 (100.0%) |
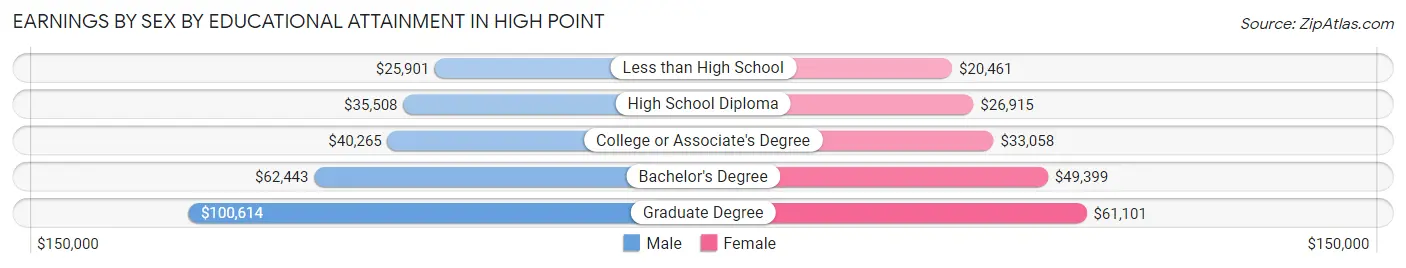
Earnings by Sex by Educational Attainment in High Point
Average earnings in High Point are $45,533 for men and $36,394 for women, a difference of 20.1%. Men with an educational attainment of graduate degree enjoy the highest average annual earnings of $100,614, while those with less than high school education earn the least with $25,901. Women with an educational attainment of graduate degree earn the most with the average annual earnings of $61,101, while those with less than high school education have the smallest earnings of $20,461.
| Educational Attainment | Male Income | Female Income |
| Less than High School | $25,901 | $20,461 |
| High School Diploma | $35,508 | $26,915 |
| College or Associate's Degree | $40,265 | $33,058 |
| Bachelor's Degree | $62,443 | $49,399 |
| Graduate Degree | $100,614 | $61,101 |
| Total | $45,533 | $36,394 |
Family Income in High Point
Family Income Brackets in High Point
According to the High Point family income data, there are 5,368 families falling into the $100,000 to $149,999 income range, which is the most common income bracket and makes up 19.3% of all families. Conversely, the $10,000 to $14,999 income bracket is the least frequent group with only 528 families (1.9%) belonging to this category.
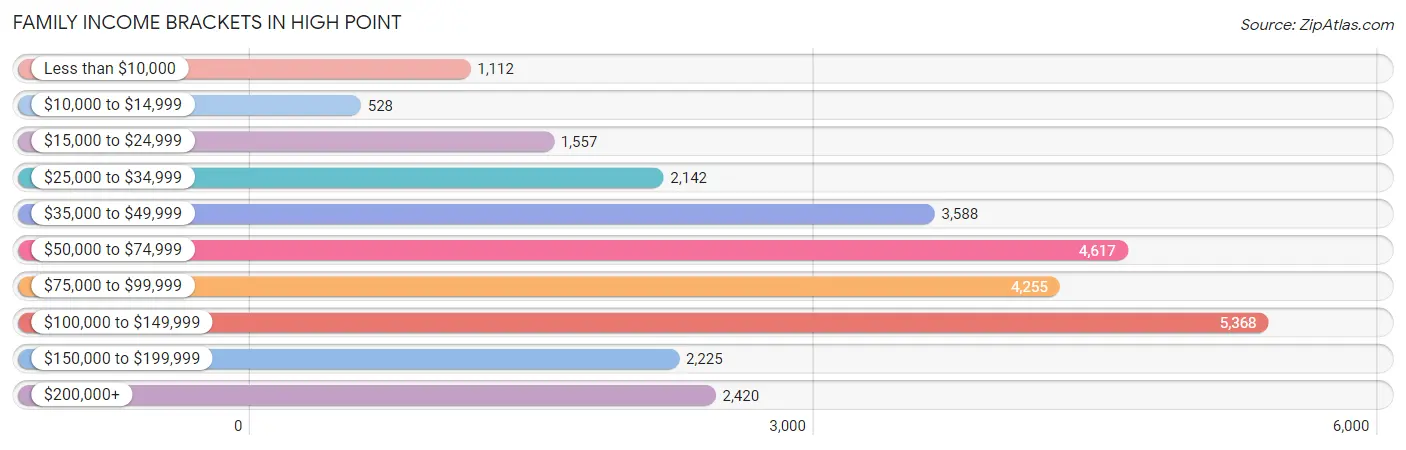
| Income Bracket | # Families | % Families |
| Less than $10,000 | 1,112 | 4.0% |
| $10,000 to $14,999 | 528 | 1.9% |
| $15,000 to $24,999 | 1,557 | 5.6% |
| $25,000 to $34,999 | 2,142 | 7.7% |
| $35,000 to $49,999 | 3,588 | 12.9% |
| $50,000 to $74,999 | 4,617 | 16.6% |
| $75,000 to $99,999 | 4,255 | 15.3% |
| $100,000 to $149,999 | 5,368 | 19.3% |
| $150,000 to $199,999 | 2,225 | 8.0% |
| $200,000+ | 2,420 | 8.7% |
Family Income by Famaliy Size in High Point
4-person families (4,799 | 17.3%) account for the highest median family income in High Point with $95,092 per family, while 2-person families (13,033 | 46.9%) have the highest median income of $35,173 per family member.
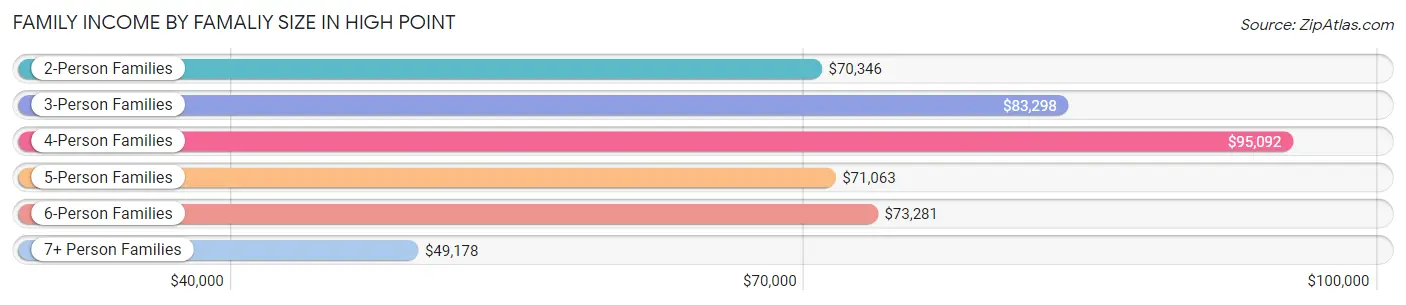
| Income Bracket | # Families | Median Income |
| 2-Person Families | 13,033 (46.9%) | $70,346 |
| 3-Person Families | 6,616 (23.8%) | $83,298 |
| 4-Person Families | 4,799 (17.3%) | $95,092 |
| 5-Person Families | 2,172 (7.8%) | $71,063 |
| 6-Person Families | 899 (3.2%) | $73,281 |
| 7+ Person Families | 293 (1.1%) | $49,178 |
| Total | 27,812 (100.0%) | $76,644 |
Family Income by Number of Earners in High Point
The median family income in High Point is $76,644, with families comprising 3+ earners (2,668) having the highest median family income of $111,667, while families with 1 earner (8,835) have the lowest median family income of $49,009, accounting for 9.6% and 31.8% of families, respectively.
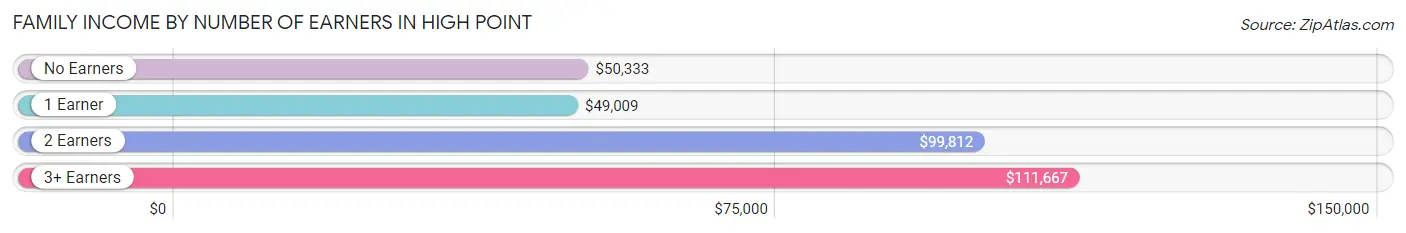
| Number of Earners | # Families | Median Income |
| No Earners | 4,192 (15.1%) | $50,333 |
| 1 Earner | 8,835 (31.8%) | $49,009 |
| 2 Earners | 12,117 (43.6%) | $99,812 |
| 3+ Earners | 2,668 (9.6%) | $111,667 |
| Total | 27,812 (100.0%) | $76,644 |
Household Income in High Point
Household Income Brackets in High Point
With 7,356 households falling in the category, the $50,000 to $74,999 income range is the most frequent in High Point, accounting for 16.7% of all households. In contrast, only 1,894 households (4.3%) fall into the $10,000 to $14,999 income bracket, making it the least populous group.
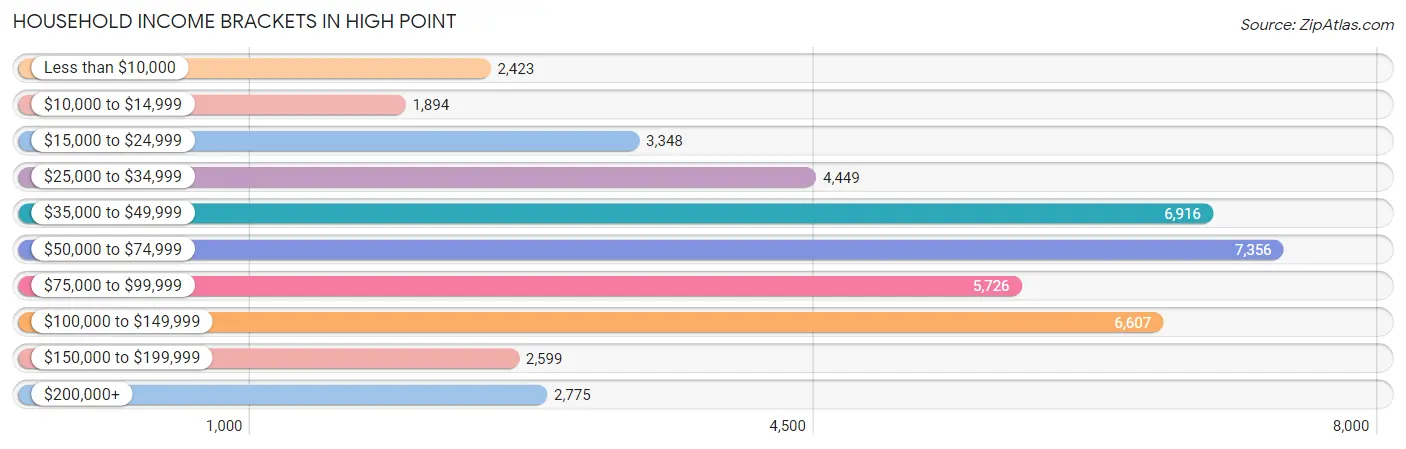
| Income Bracket | # Households | % Households |
| Less than $10,000 | 2,423 | 5.5% |
| $10,000 to $14,999 | 1,894 | 4.3% |
| $15,000 to $24,999 | 3,348 | 7.6% |
| $25,000 to $34,999 | 4,449 | 10.1% |
| $35,000 to $49,999 | 6,916 | 15.7% |
| $50,000 to $74,999 | 7,356 | 16.7% |
| $75,000 to $99,999 | 5,726 | 13.0% |
| $100,000 to $149,999 | 6,607 | 15.0% |
| $150,000 to $199,999 | 2,599 | 5.9% |
| $200,000+ | 2,775 | 6.3% |
Household Income by Householder Age in High Point
The median household income in High Point is $58,582, with the highest median household income of $70,548 found in the 45 to 64 years age bracket for the primary householder. A total of 17,149 households (38.9%) fall into this category. Meanwhile, the 15 to 24 years age bracket for the primary householder has the lowest median household income of $39,560, with 2,156 households (4.9%) in this group.
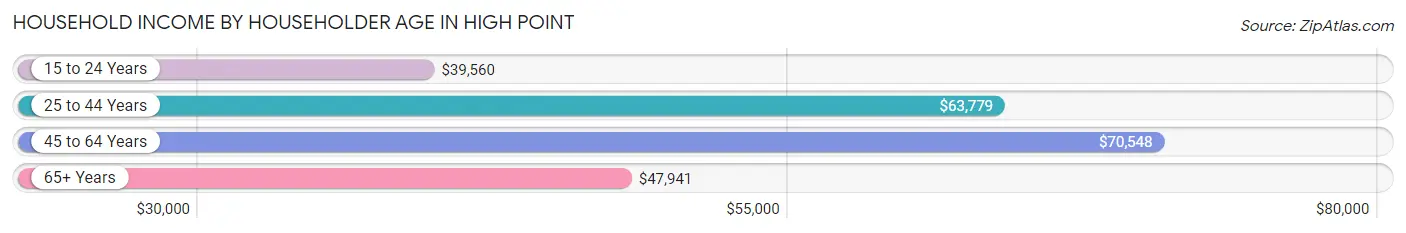
| Income Bracket | # Households | Median Income |
| 15 to 24 Years | 2,156 (4.9%) | $39,560 |
| 25 to 44 Years | 13,739 (31.2%) | $63,779 |
| 45 to 64 Years | 17,149 (38.9%) | $70,548 |
| 65+ Years | 11,005 (25.0%) | $47,941 |
| Total | 44,049 (100.0%) | $58,582 |
Poverty in High Point
Income Below Poverty by Sex and Age in High Point
With 14.1% poverty level for males and 16.6% for females among the residents of High Point, 6 to 11 year old males and 16 and 17 year old females are the most vulnerable to poverty, with 1,080 males (25.7%) and 359 females (24.4%) in their respective age groups living below the poverty level.
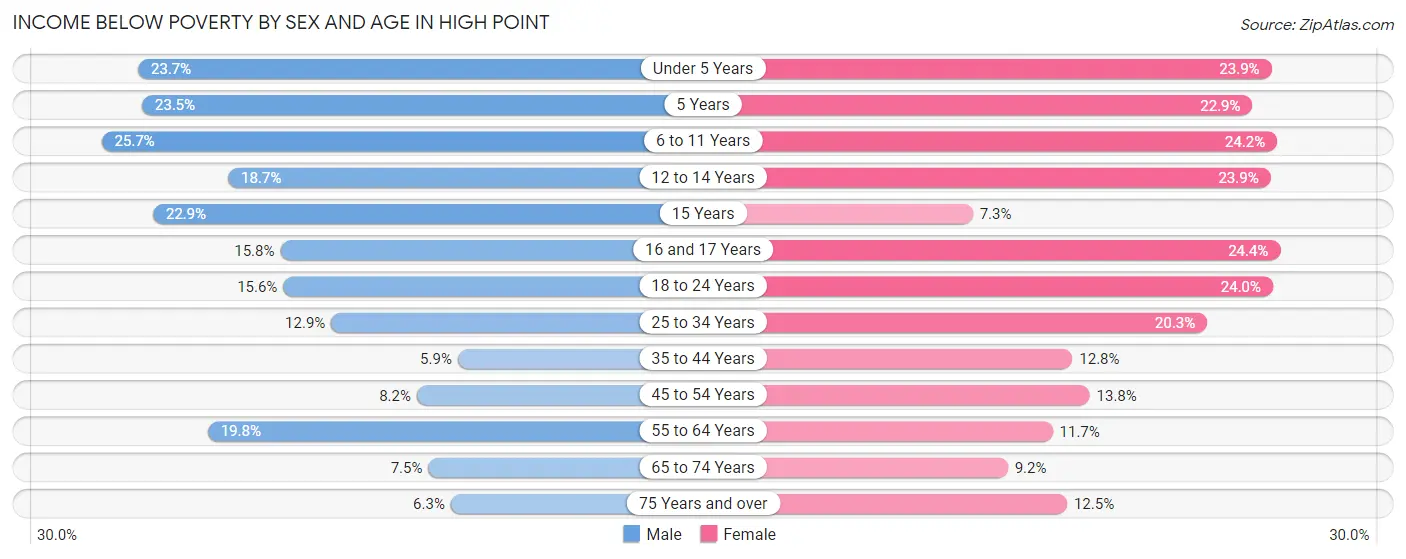
| Age Bracket | Male | Female |
| Under 5 Years | 852 (23.7%) | 814 (23.9%) |
| 5 Years | 157 (23.5%) | 96 (22.9%) |
| 6 to 11 Years | 1,080 (25.7%) | 1,030 (24.2%) |
| 12 to 14 Years | 360 (18.7%) | 482 (23.9%) |
| 15 Years | 182 (22.9%) | 47 (7.3%) |
| 16 and 17 Years | 208 (15.8%) | 359 (24.4%) |
| 18 to 24 Years | 752 (15.6%) | 1,198 (24.0%) |
| 25 to 34 Years | 962 (12.9%) | 1,363 (20.3%) |
| 35 to 44 Years | 394 (5.9%) | 914 (12.8%) |
| 45 to 54 Years | 512 (8.2%) | 1,053 (13.8%) |
| 55 to 64 Years | 1,408 (19.8%) | 868 (11.7%) |
| 65 to 74 Years | 365 (7.5%) | 542 (9.2%) |
| 75 Years and over | 169 (6.3%) | 478 (12.5%) |
| Total | 7,401 (14.1%) | 9,244 (16.6%) |
Income Above Poverty by Sex and Age in High Point
According to the poverty statistics in High Point, males aged 35 to 44 years and females aged 15 years are the age groups that are most secure financially, with 94.1% of males and 92.7% of females in these age groups living above the poverty line.
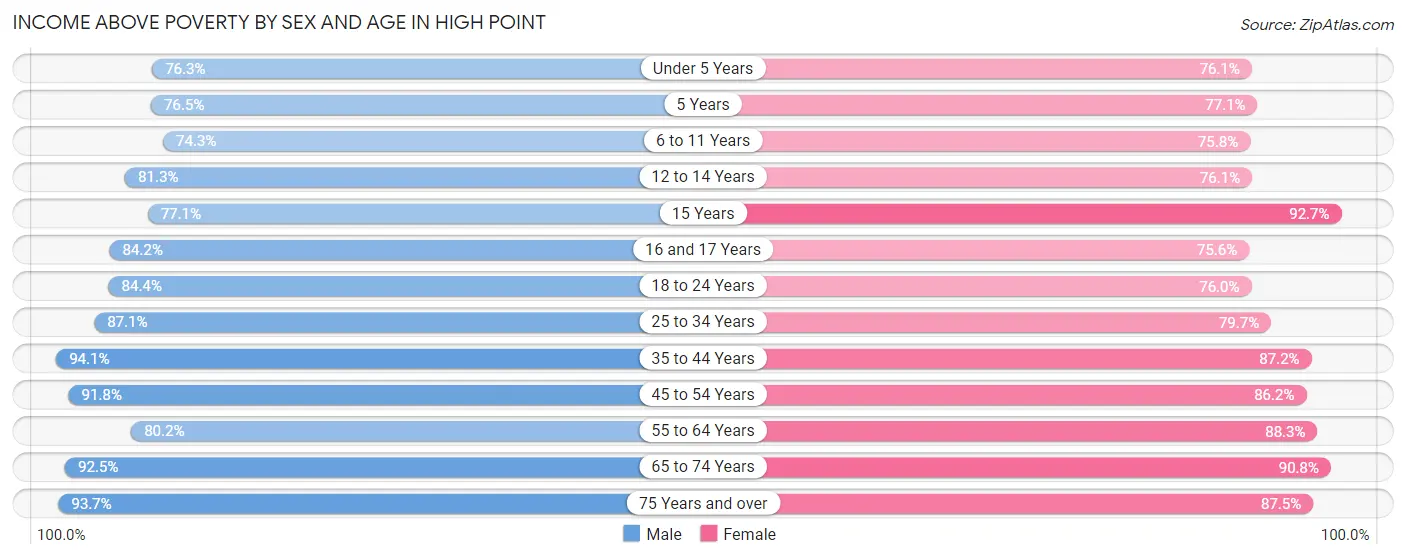
| Age Bracket | Male | Female |
| Under 5 Years | 2,745 (76.3%) | 2,589 (76.1%) |
| 5 Years | 512 (76.5%) | 324 (77.1%) |
| 6 to 11 Years | 3,119 (74.3%) | 3,219 (75.8%) |
| 12 to 14 Years | 1,568 (81.3%) | 1,537 (76.1%) |
| 15 Years | 614 (77.1%) | 598 (92.7%) |
| 16 and 17 Years | 1,112 (84.2%) | 1,112 (75.6%) |
| 18 to 24 Years | 4,067 (84.4%) | 3,793 (76.0%) |
| 25 to 34 Years | 6,478 (87.1%) | 5,339 (79.7%) |
| 35 to 44 Years | 6,311 (94.1%) | 6,202 (87.2%) |
| 45 to 54 Years | 5,763 (91.8%) | 6,580 (86.2%) |
| 55 to 64 Years | 5,702 (80.2%) | 6,527 (88.3%) |
| 65 to 74 Years | 4,488 (92.5%) | 5,324 (90.8%) |
| 75 Years and over | 2,527 (93.7%) | 3,335 (87.5%) |
| Total | 45,006 (85.9%) | 46,479 (83.4%) |
Income Below Poverty Among Married-Couple Families in High Point
The poverty statistics for married-couple families in High Point show that 5.6% or 1,034 of the total 18,613 families live below the poverty line. Families with 5 or more children have the highest poverty rate of 49.2%, comprising of 60 families. On the other hand, families with no children have the lowest poverty rate of 3.8%, which includes 404 families.
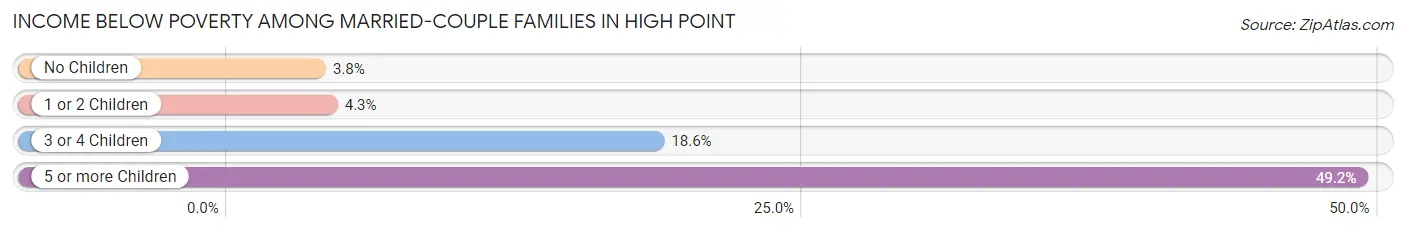
| Children | Above Poverty | Below Poverty |
| No Children | 10,140 (96.2%) | 404 (3.8%) |
| 1 or 2 Children | 6,087 (95.7%) | 276 (4.3%) |
| 3 or 4 Children | 1,290 (81.4%) | 294 (18.6%) |
| 5 or more Children | 62 (50.8%) | 60 (49.2%) |
| Total | 17,579 (94.4%) | 1,034 (5.6%) |
Income Below Poverty Among Single-Parent Households in High Point
According to the poverty data in High Point, 10.0% or 211 single-father households and 26.3% or 1,865 single-mother households are living below the poverty line. Among single-father households, those with 5 or more children have the highest poverty rate, with 14 households (100.0%) experiencing poverty. Likewise, among single-mother households, those with 5 or more children have the highest poverty rate, with 92 households (94.9%) falling below the poverty line.
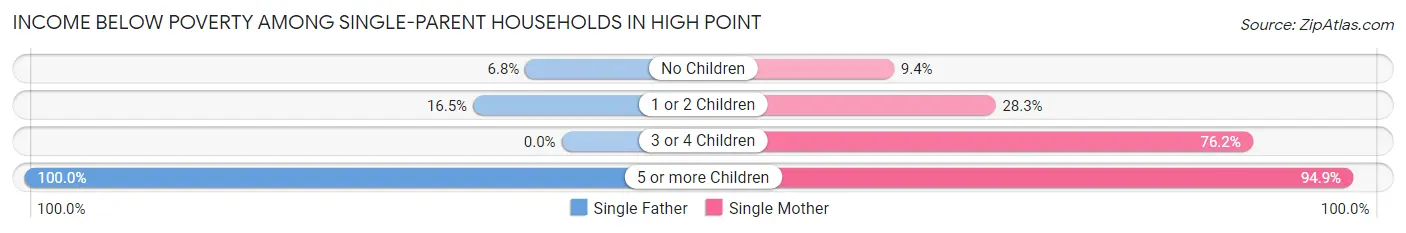
| Children | Single Father | Single Mother |
| No Children | 90 (6.8%) | 276 (9.3%) |
| 1 or 2 Children | 107 (16.5%) | 935 (28.3%) |
| 3 or 4 Children | 0 (0.0%) | 562 (76.1%) |
| 5 or more Children | 14 (100.0%) | 92 (94.9%) |
| Total | 211 (10.0%) | 1,865 (26.3%) |
Income Below Poverty Among Married-Couple vs Single-Parent Households in High Point
The poverty data for High Point shows that 1,034 of the married-couple family households (5.6%) and 2,076 of the single-parent households (22.6%) are living below the poverty level. Within the married-couple family households, those with 5 or more children have the highest poverty rate, with 60 households (49.2%) falling below the poverty line. Among the single-parent households, those with 5 or more children have the highest poverty rate, with 106 household (95.5%) living below poverty.
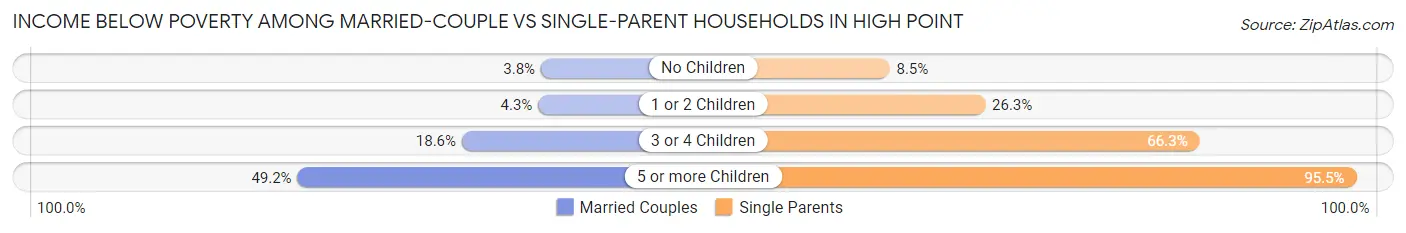
| Children | Married-Couple Families | Single-Parent Households |
| No Children | 404 (3.8%) | 366 (8.5%) |
| 1 or 2 Children | 276 (4.3%) | 1,042 (26.3%) |
| 3 or 4 Children | 294 (18.6%) | 562 (66.3%) |
| 5 or more Children | 60 (49.2%) | 106 (95.5%) |
| Total | 1,034 (5.6%) | 2,076 (22.6%) |
Race in High Point
The most populous races in High Point are White / Caucasian (55,904 | 49.0%), Black / African American (36,808 | 32.3%), and Hispanic or Latino (12,197 | 10.7%).
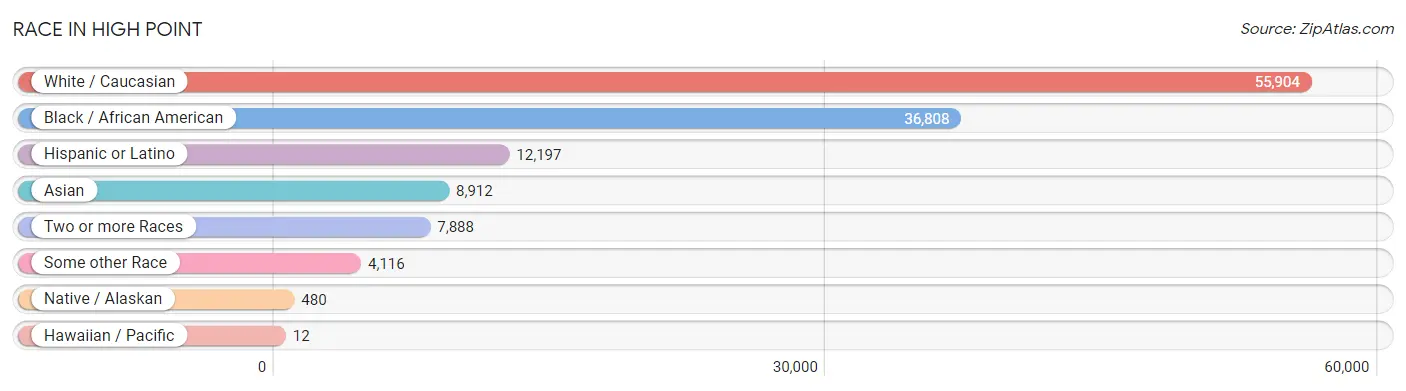
| Race | # Population | % Population |
| Asian | 8,912 | 7.8% |
| Black / African American | 36,808 | 32.3% |
| Hawaiian / Pacific | 12 | 0.0% |
| Hispanic or Latino | 12,197 | 10.7% |
| Native / Alaskan | 480 | 0.4% |
| White / Caucasian | 55,904 | 49.0% |
| Two or more Races | 7,888 | 6.9% |
| Some other Race | 4,116 | 3.6% |
| Total | 114,120 | 100.0% |
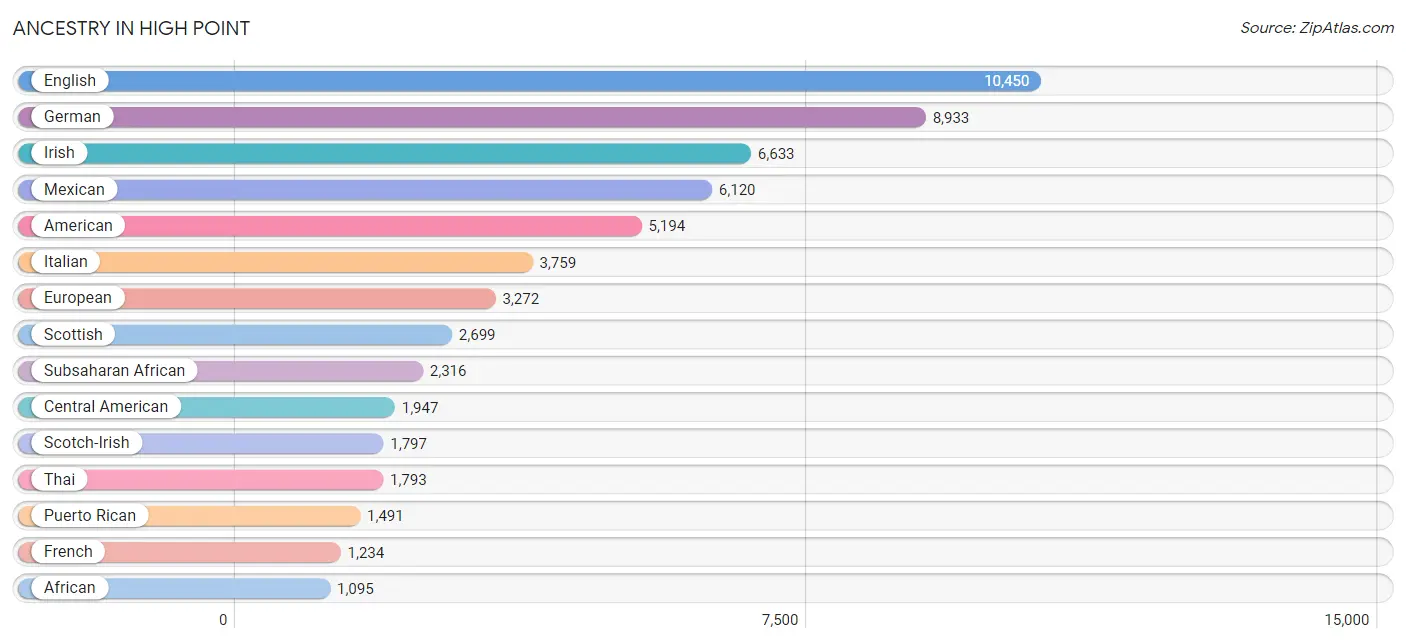
Ancestry in High Point
The most populous ancestries reported in High Point are English (10,450 | 9.2%), German (8,933 | 7.8%), Irish (6,633 | 5.8%), Mexican (6,120 | 5.4%), and American (5,194 | 4.5%), together accounting for 32.7% of all High Point residents.
| Ancestry | # Population | % Population |
| Afghan | 12 | 0.0% |
| African | 1,095 | 1.0% |
| Albanian | 9 | 0.0% |
| American | 5,194 | 4.5% |
| Apache | 6 | 0.0% |
| Arab | 653 | 0.6% |
| Arapaho | 22 | 0.0% |
| Argentinean | 212 | 0.2% |
| Armenian | 9 | 0.0% |
| Australian | 34 | 0.0% |
| Austrian | 81 | 0.1% |
| Bangladeshi | 43 | 0.0% |
| Basque | 35 | 0.0% |
| Belgian | 139 | 0.1% |
| Bermudan | 27 | 0.0% |
| Bhutanese | 99 | 0.1% |
| Bolivian | 20 | 0.0% |
| Brazilian | 50 | 0.0% |
| British | 224 | 0.2% |
| British West Indian | 39 | 0.0% |
| Bulgarian | 22 | 0.0% |
| Burmese | 428 | 0.4% |
| Canadian | 163 | 0.1% |
| Central American | 1,947 | 1.7% |
| Central American Indian | 27 | 0.0% |
| Cherokee | 287 | 0.3% |
| Chickasaw | 2 | 0.0% |
| Chilean | 30 | 0.0% |
| Chippewa | 3 | 0.0% |
| Choctaw | 33 | 0.0% |
| Colombian | 502 | 0.4% |
| Costa Rican | 23 | 0.0% |
| Croatian | 22 | 0.0% |
| Crow | 17 | 0.0% |
| Cuban | 545 | 0.5% |
| Czech | 42 | 0.0% |
| Czechoslovakian | 45 | 0.0% |
| Danish | 194 | 0.2% |
| Dominican | 370 | 0.3% |
| Dutch | 657 | 0.6% |
| Eastern European | 118 | 0.1% |
| Ecuadorian | 111 | 0.1% |
| Egyptian | 121 | 0.1% |
| English | 10,450 | 9.2% |
| Estonian | 3 | 0.0% |
| Ethiopian | 138 | 0.1% |
| European | 3,272 | 2.9% |
| Finnish | 27 | 0.0% |
| French | 1,234 | 1.1% |
| French Canadian | 153 | 0.1% |
| German | 8,933 | 7.8% |
| Ghanaian | 140 | 0.1% |
| Greek | 281 | 0.3% |
| Guamanian / Chamorro | 193 | 0.2% |
| Guatemalan | 390 | 0.3% |
| Haitian | 199 | 0.2% |
| Honduran | 663 | 0.6% |
| Hungarian | 150 | 0.1% |
| Icelander | 17 | 0.0% |
| Indian (Asian) | 944 | 0.8% |
| Indonesian | 608 | 0.5% |
| Iranian | 37 | 0.0% |
| Iraqi | 45 | 0.0% |
| Irish | 6,633 | 5.8% |
| Iroquois | 14 | 0.0% |
| Israeli | 5 | 0.0% |
| Italian | 3,759 | 3.3% |
| Jamaican | 227 | 0.2% |
| Japanese | 26 | 0.0% |
| Korean | 480 | 0.4% |
| Laotian | 7 | 0.0% |
| Lebanese | 86 | 0.1% |
| Liberian | 38 | 0.0% |
| Lithuanian | 117 | 0.1% |
| Lumbee | 461 | 0.4% |
| Malaysian | 1,071 | 0.9% |
| Maltese | 2 | 0.0% |
| Mexican | 6,120 | 5.4% |
| Mexican American Indian | 86 | 0.1% |
| Mongolian | 63 | 0.1% |
| Moroccan | 42 | 0.0% |
| Native Hawaiian | 30 | 0.0% |
| Navajo | 1 | 0.0% |
| Nicaraguan | 62 | 0.1% |
| Nigerian | 82 | 0.1% |
| Northern European | 66 | 0.1% |
| Norwegian | 242 | 0.2% |
| Pakistani | 258 | 0.2% |
| Palestinian | 33 | 0.0% |
| Panamanian | 208 | 0.2% |
| Pennsylvania German | 45 | 0.0% |
| Peruvian | 95 | 0.1% |
| Polish | 982 | 0.9% |
| Portuguese | 136 | 0.1% |
| Puerto Rican | 1,491 | 1.3% |
| Romanian | 99 | 0.1% |
| Russian | 275 | 0.2% |
| Salvadoran | 601 | 0.5% |
| Scandinavian | 131 | 0.1% |
| Scotch-Irish | 1,797 | 1.6% |
| Scottish | 2,699 | 2.4% |
| Slovak | 132 | 0.1% |
| South African | 4 | 0.0% |
| South American | 1,047 | 0.9% |
| Spaniard | 110 | 0.1% |
| Spanish | 93 | 0.1% |
| Sri Lankan | 733 | 0.6% |
| Subsaharan African | 2,316 | 2.0% |
| Sudanese | 172 | 0.2% |
| Swedish | 471 | 0.4% |
| Swiss | 88 | 0.1% |
| Thai | 1,793 | 1.6% |
| Trinidadian and Tobagonian | 79 | 0.1% |
| Turkish | 118 | 0.1% |
| U.S. Virgin Islander | 118 | 0.1% |
| Ukrainian | 69 | 0.1% |
| Uruguayan | 35 | 0.0% |
| Venezuelan | 42 | 0.0% |
| Welsh | 270 | 0.2% |
| West Indian | 69 | 0.1% |
| Yugoslavian | 151 | 0.1% | View All 121 Rows |
Immigrants in High Point
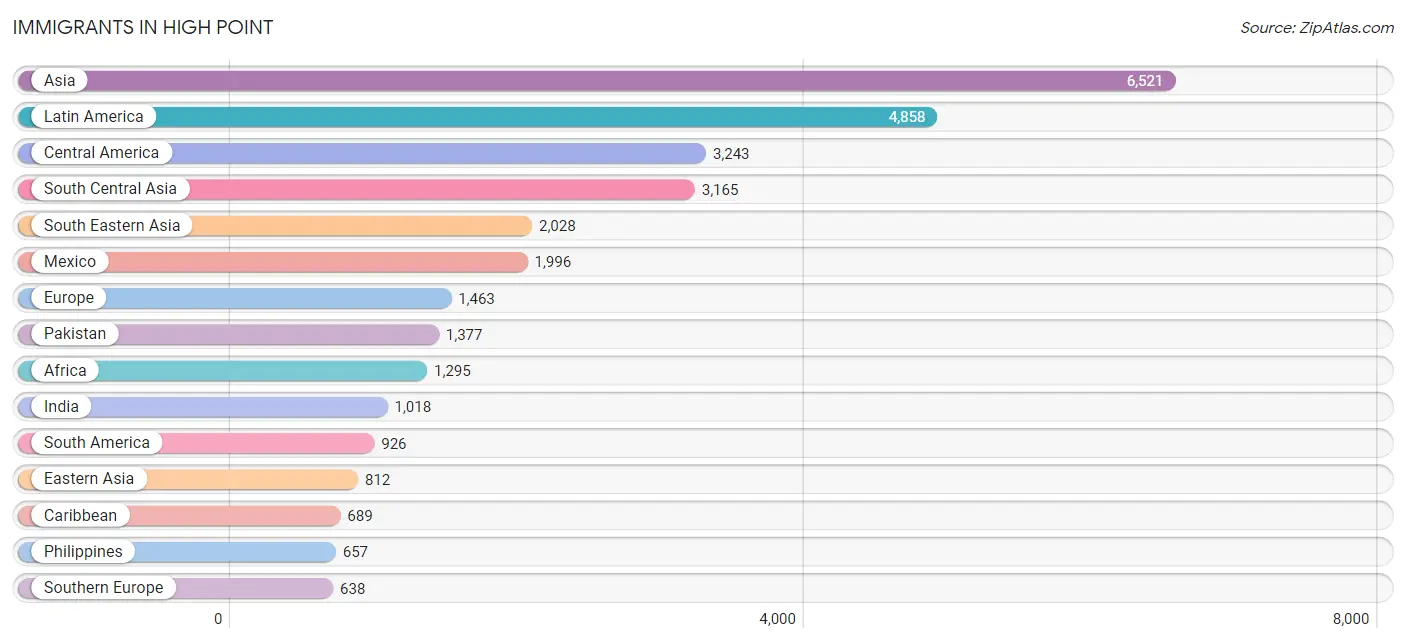
The most numerous immigrant groups reported in High Point came from Asia (6,521 | 5.7%), Latin America (4,858 | 4.3%), Central America (3,243 | 2.8%), South Central Asia (3,165 | 2.8%), and South Eastern Asia (2,028 | 1.8%), together accounting for 17.4% of all High Point residents.
| Immigration Origin | # Population | % Population |
| Afghanistan | 8 | 0.0% |
| Africa | 1,295 | 1.1% |
| Argentina | 178 | 0.2% |
| Asia | 6,521 | 5.7% |
| Australia | 14 | 0.0% |
| Bangladesh | 56 | 0.1% |
| Belarus | 33 | 0.0% |
| Belgium | 3 | 0.0% |
| Bosnia and Herzegovina | 116 | 0.1% |
| Brazil | 151 | 0.1% |
| Bulgaria | 22 | 0.0% |
| Cambodia | 44 | 0.0% |
| Cameroon | 56 | 0.1% |
| Canada | 293 | 0.3% |
| Caribbean | 689 | 0.6% |
| Central America | 3,243 | 2.8% |
| Chile | 10 | 0.0% |
| China | 375 | 0.3% |
| Colombia | 341 | 0.3% |
| Congo | 7 | 0.0% |
| Costa Rica | 11 | 0.0% |
| Cuba | 117 | 0.1% |
| Denmark | 9 | 0.0% |
| Dominican Republic | 148 | 0.1% |
| Eastern Africa | 237 | 0.2% |
| Eastern Asia | 812 | 0.7% |
| Eastern Europe | 315 | 0.3% |
| Ecuador | 101 | 0.1% |
| Egypt | 74 | 0.1% |
| El Salvador | 541 | 0.5% |
| England | 31 | 0.0% |
| Ethiopia | 118 | 0.1% |
| Europe | 1,463 | 1.3% |
| Germany | 205 | 0.2% |
| Ghana | 132 | 0.1% |
| Greece | 51 | 0.0% |
| Guatemala | 156 | 0.1% |
| Guyana | 17 | 0.0% |
| Haiti | 159 | 0.1% |
| Honduras | 387 | 0.3% |
| Hong Kong | 53 | 0.1% |
| India | 1,018 | 0.9% |
| Indonesia | 29 | 0.0% |
| Iran | 27 | 0.0% |
| Iraq | 45 | 0.0% |
| Italy | 557 | 0.5% |
| Jamaica | 141 | 0.1% |
| Japan | 68 | 0.1% |
| Jordan | 14 | 0.0% |
| Kenya | 13 | 0.0% |
| Korea | 369 | 0.3% |
| Kuwait | 60 | 0.1% |
| Laos | 411 | 0.4% |
| Latin America | 4,858 | 4.3% |
| Malaysia | 140 | 0.1% |
| Mexico | 1,996 | 1.8% |
| Middle Africa | 397 | 0.4% |
| Morocco | 7 | 0.0% |
| Nepal | 543 | 0.5% |
| Netherlands | 47 | 0.0% |
| Nicaragua | 27 | 0.0% |
| Nigeria | 44 | 0.0% |
| Northern Africa | 192 | 0.2% |
| Northern Europe | 224 | 0.2% |
| Oceania | 14 | 0.0% |
| Pakistan | 1,377 | 1.2% |
| Panama | 125 | 0.1% |
| Peru | 51 | 0.0% |
| Philippines | 657 | 0.6% |
| Poland | 34 | 0.0% |
| Romania | 52 | 0.1% |
| Russia | 32 | 0.0% |
| Saudi Arabia | 142 | 0.1% |
| Scotland | 9 | 0.0% |
| Senegal | 89 | 0.1% |
| South America | 926 | 0.8% |
| South Central Asia | 3,165 | 2.8% |
| South Eastern Asia | 2,028 | 1.8% |
| Southern Europe | 638 | 0.6% |
| Spain | 30 | 0.0% |
| Sudan | 100 | 0.1% |
| Sweden | 99 | 0.1% |
| Taiwan | 8 | 0.0% |
| Thailand | 220 | 0.2% |
| Trinidad and Tobago | 88 | 0.1% |
| Turkey | 207 | 0.2% |
| Uganda | 66 | 0.1% |
| Ukraine | 17 | 0.0% |
| Uruguay | 35 | 0.0% |
| Venezuela | 42 | 0.0% |
| Vietnam | 265 | 0.2% |
| Western Africa | 309 | 0.3% |
| Western Asia | 484 | 0.4% |
| Western Europe | 255 | 0.2% |
| Zaire | 273 | 0.2% | View All 95 Rows |
Sex and Age in High Point
Sex and Age in High Point
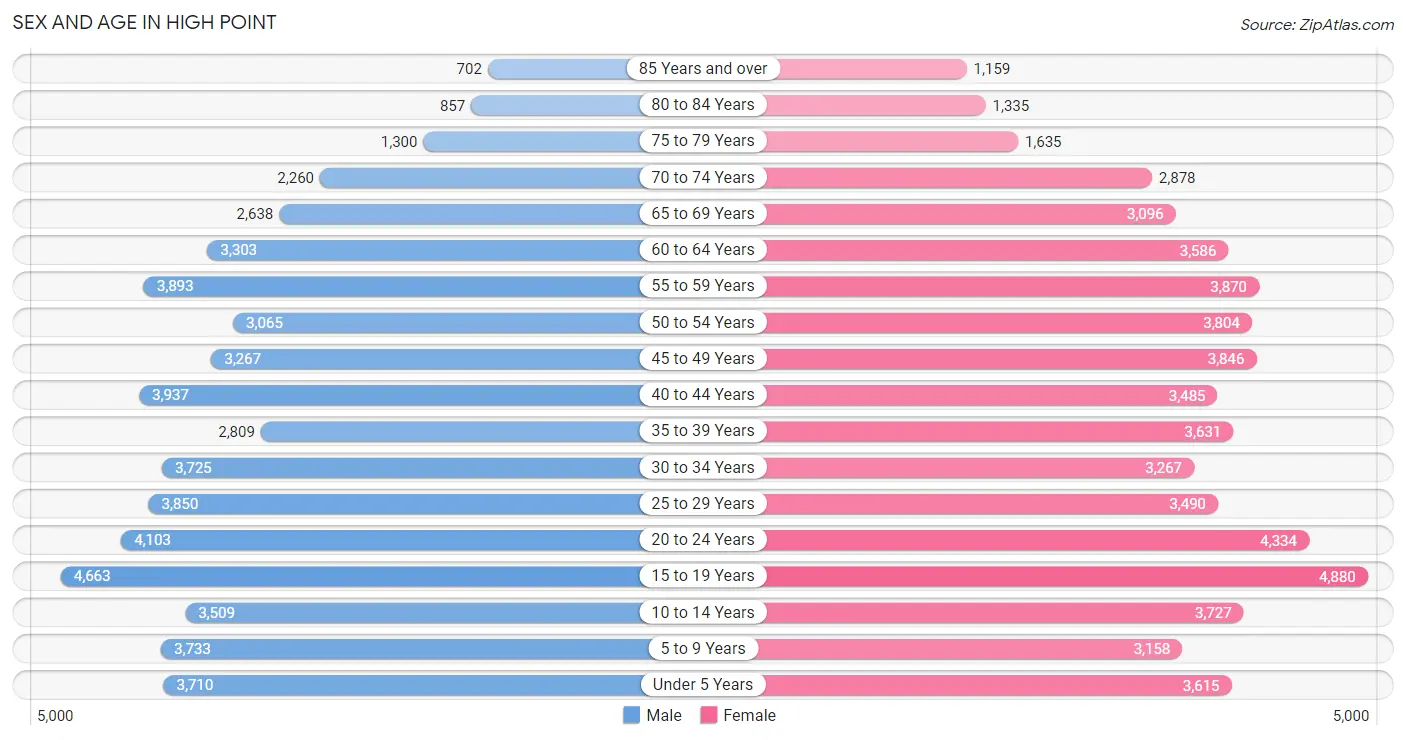
The most populous age groups in High Point are 15 to 19 Years (4,663 | 8.4%) for men and 15 to 19 Years (4,880 | 8.3%) for women.
| Age Bracket | Male | Female |
| Under 5 Years | 3,710 (6.7%) | 3,615 (6.1%) |
| 5 to 9 Years | 3,733 (6.8%) | 3,158 (5.4%) |
| 10 to 14 Years | 3,509 (6.3%) | 3,727 (6.3%) |
| 15 to 19 Years | 4,663 (8.4%) | 4,880 (8.3%) |
| 20 to 24 Years | 4,103 (7.4%) | 4,334 (7.4%) |
| 25 to 29 Years | 3,850 (7.0%) | 3,490 (5.9%) |
| 30 to 34 Years | 3,725 (6.7%) | 3,267 (5.6%) |
| 35 to 39 Years | 2,809 (5.1%) | 3,631 (6.2%) |
| 40 to 44 Years | 3,937 (7.1%) | 3,485 (5.9%) |
| 45 to 49 Years | 3,267 (5.9%) | 3,846 (6.5%) |
| 50 to 54 Years | 3,065 (5.5%) | 3,804 (6.5%) |
| 55 to 59 Years | 3,893 (7.0%) | 3,870 (6.6%) |
| 60 to 64 Years | 3,303 (6.0%) | 3,586 (6.1%) |
| 65 to 69 Years | 2,638 (4.8%) | 3,096 (5.3%) |
| 70 to 74 Years | 2,260 (4.1%) | 2,878 (4.9%) |
| 75 to 79 Years | 1,300 (2.4%) | 1,635 (2.8%) |
| 80 to 84 Years | 857 (1.5%) | 1,335 (2.3%) |
| 85 Years and over | 702 (1.3%) | 1,159 (2.0%) |
| Total | 55,324 (100.0%) | 58,796 (100.0%) |
Families and Households in High Point
Median Family Size in High Point
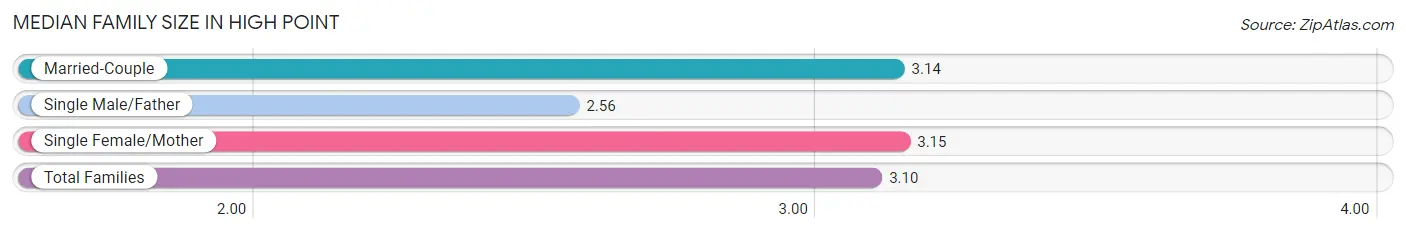
The median family size in High Point is 3.10 persons per family, with single female/mother families (7,094 | 25.5%) accounting for the largest median family size of 3.15 persons per family. On the other hand, single male/father families (2,105 | 7.6%) represent the smallest median family size with 2.56 persons per family.
| Family Type | # Families | Family Size |
| Married-Couple | 18,613 (66.9%) | 3.14 |
| Single Male/Father | 2,105 (7.6%) | 2.56 |
| Single Female/Mother | 7,094 (25.5%) | 3.15 |
| Total Families | 27,812 (100.0%) | 3.10 |
Median Household Size in High Point
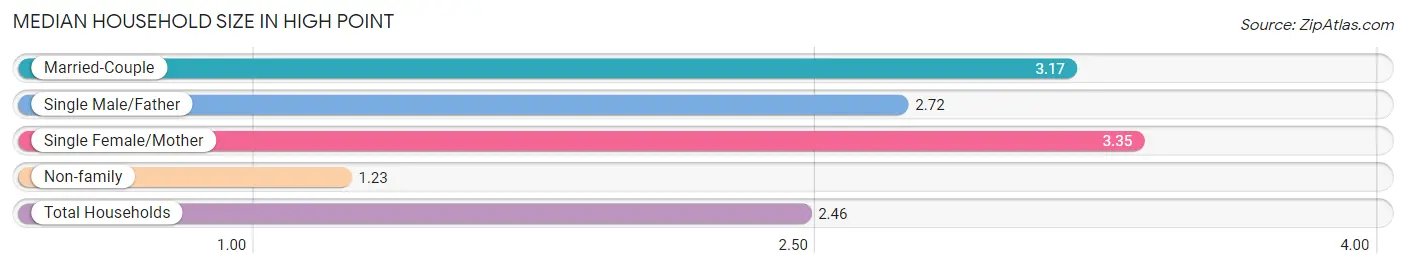
The median household size in High Point is 2.46 persons per household, with single female/mother households (7,094 | 16.1%) accounting for the largest median household size of 3.35 persons per household. non-family households (16,237 | 36.9%) represent the smallest median household size with 1.23 persons per household.
| Household Type | # Households | Household Size |
| Married-Couple | 18,613 (42.3%) | 3.17 |
| Single Male/Father | 2,105 (4.8%) | 2.72 |
| Single Female/Mother | 7,094 (16.1%) | 3.35 |
| Non-family | 16,237 (36.9%) | 1.23 |
| Total Households | 44,049 (100.0%) | 2.46 |
Household Size by Marriage Status in High Point
Out of a total of 44,049 households in High Point, 27,812 (63.1%) are family households, while 16,237 (36.9%) are nonfamily households. The most numerous type of family households are 2-person households, comprising 12,400, and the most common type of nonfamily households are 1-person households, comprising 13,409.
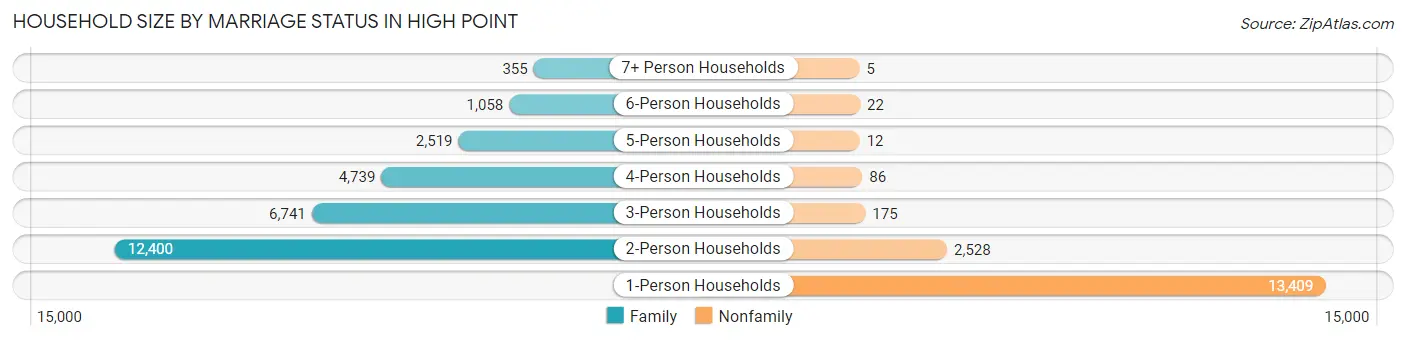
| Household Size | Family Households | Nonfamily Households |
| 1-Person Households | - | 13,409 (30.4%) |
| 2-Person Households | 12,400 (28.1%) | 2,528 (5.7%) |
| 3-Person Households | 6,741 (15.3%) | 175 (0.4%) |
| 4-Person Households | 4,739 (10.8%) | 86 (0.2%) |
| 5-Person Households | 2,519 (5.7%) | 12 (0.0%) |
| 6-Person Households | 1,058 (2.4%) | 22 (0.1%) |
| 7+ Person Households | 355 (0.8%) | 5 (0.0%) |
| Total | 27,812 (63.1%) | 16,237 (36.9%) |
Female Fertility in High Point
Fertility by Age in High Point
Average fertility rate in High Point is 54.0 births per 1,000 women. Women in the age bracket of 20 to 34 years have the highest fertility rate with 94.0 births per 1,000 women. Women in the age bracket of 20 to 34 years acount for 69.5% of all women with births.
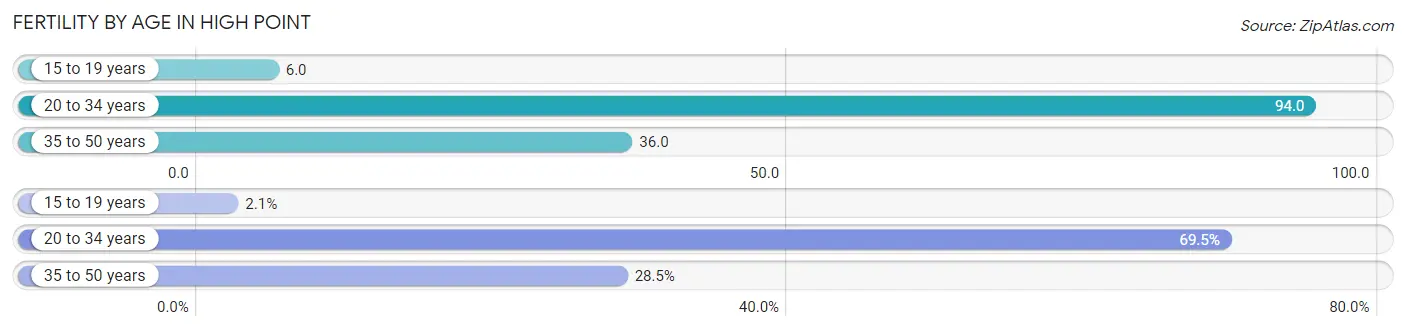
| Age Bracket | Women with Births | Births / 1,000 Women |
| 15 to 19 years | 31 (2.1%) | 6.0 |
| 20 to 34 years | 1,044 (69.5%) | 94.0 |
| 35 to 50 years | 428 (28.5%) | 36.0 |
| Total | 1,503 (100.0%) | 54.0 |
Fertility by Age by Marriage Status in High Point
52.4% of women with births (1,503) in High Point are married. The highest percentage of unmarried women with births falls into 15 to 19 years age bracket with 100.0% of them unmarried at the time of birth, while the lowest percentage of unmarried women with births belong to 35 to 50 years age bracket with 16.8% of them unmarried.
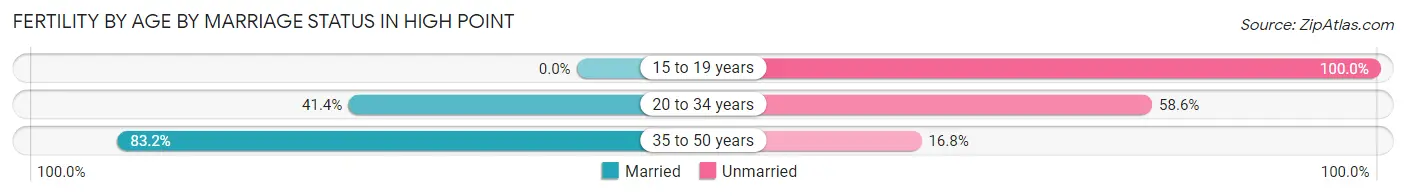
| Age Bracket | Married | Unmarried |
| 15 to 19 years | 0 (0.0%) | 31 (100.0%) |
| 20 to 34 years | 432 (41.4%) | 612 (58.6%) |
| 35 to 50 years | 356 (83.2%) | 72 (16.8%) |
| Total | 788 (52.4%) | 715 (47.6%) |
Fertility by Education in High Point
Average fertility rate in High Point is 54.0 births per 1,000 women. Women with the education attainment of bachelor's degree have the highest fertility rate of 75.0 births per 1,000 women, while women with the education attainment of graduate degree have the lowest fertility at 25.0 births per 1,000 women. Women with the education attainment of bachelor's degree represent 27.0% of all women with births.
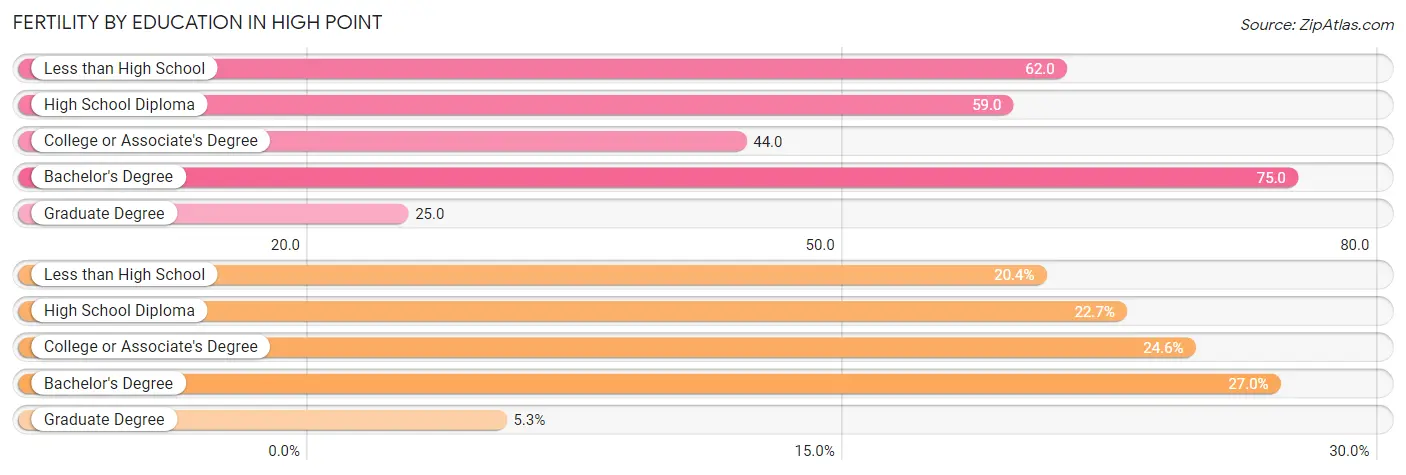
| Educational Attainment | Women with Births | Births / 1,000 Women |
| Less than High School | 307 (20.4%) | 62.0 |
| High School Diploma | 341 (22.7%) | 59.0 |
| College or Associate's Degree | 370 (24.6%) | 44.0 |
| Bachelor's Degree | 406 (27.0%) | 75.0 |
| Graduate Degree | 79 (5.3%) | 25.0 |
| Total | 1,503 (100.0%) | 54.0 |
Fertility by Education by Marriage Status in High Point
47.6% of women with births in High Point are unmarried. Women with the educational attainment of graduate degree are most likely to be married with 100.0% of them married at childbirth, while women with the educational attainment of high school diploma are least likely to be married with 73.0% of them unmarried at childbirth.
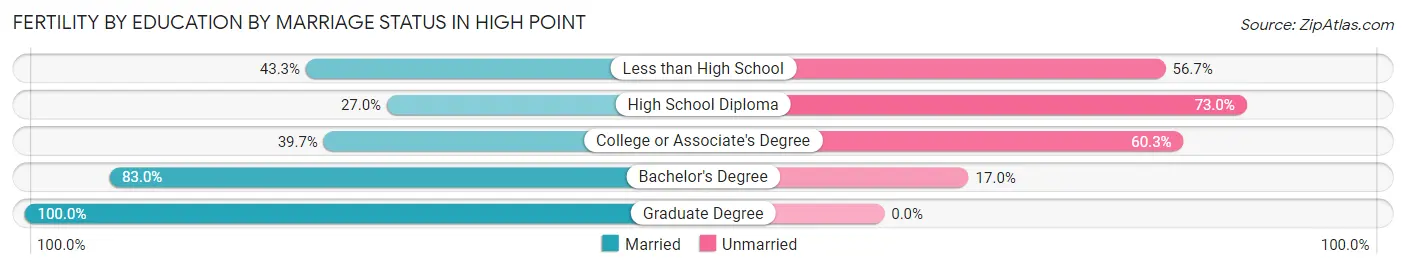
| Educational Attainment | Married | Unmarried |
| Less than High School | 133 (43.3%) | 174 (56.7%) |
| High School Diploma | 92 (27.0%) | 249 (73.0%) |
| College or Associate's Degree | 147 (39.7%) | 223 (60.3%) |
| Bachelor's Degree | 337 (83.0%) | 69 (17.0%) |
| Graduate Degree | 79 (100.0%) | 0 (0.0%) |
| Total | 788 (52.4%) | 715 (47.6%) |
Employment Characteristics in High Point
Employment by Class of Employer in High Point
Among the 51,925 employed individuals in High Point, private company employees (36,555 | 70.4%), not-for-profit organizations (4,592 | 8.8%), and local government employees (3,402 | 6.6%) make up the most common classes of employment.
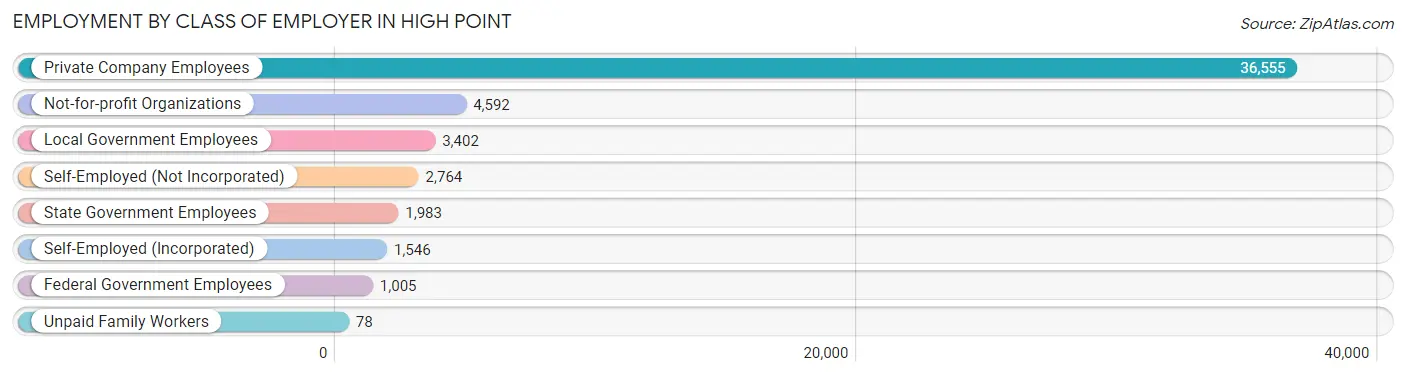
| Employer Class | # Employees | % Employees |
| Private Company Employees | 36,555 | 70.4% |
| Self-Employed (Incorporated) | 1,546 | 3.0% |
| Self-Employed (Not Incorporated) | 2,764 | 5.3% |
| Not-for-profit Organizations | 4,592 | 8.8% |
| Local Government Employees | 3,402 | 6.6% |
| State Government Employees | 1,983 | 3.8% |
| Federal Government Employees | 1,005 | 1.9% |
| Unpaid Family Workers | 78 | 0.2% |
| Total | 51,925 | 100.0% |
Employment Status by Age in High Point
According to the labor force statistics for High Point, out of the total population over 16 years of age (91,224), 62.6% or 57,106 individuals are in the labor force, with 6.2% or 3,541 of them unemployed. The age group with the highest labor force participation rate is 35 to 44 years, with 83.7% or 11,602 individuals in the labor force. Within the labor force, the 16 to 19 years age range has the highest percentage of unemployed individuals, with 19.2% or 488 of them being unemployed.
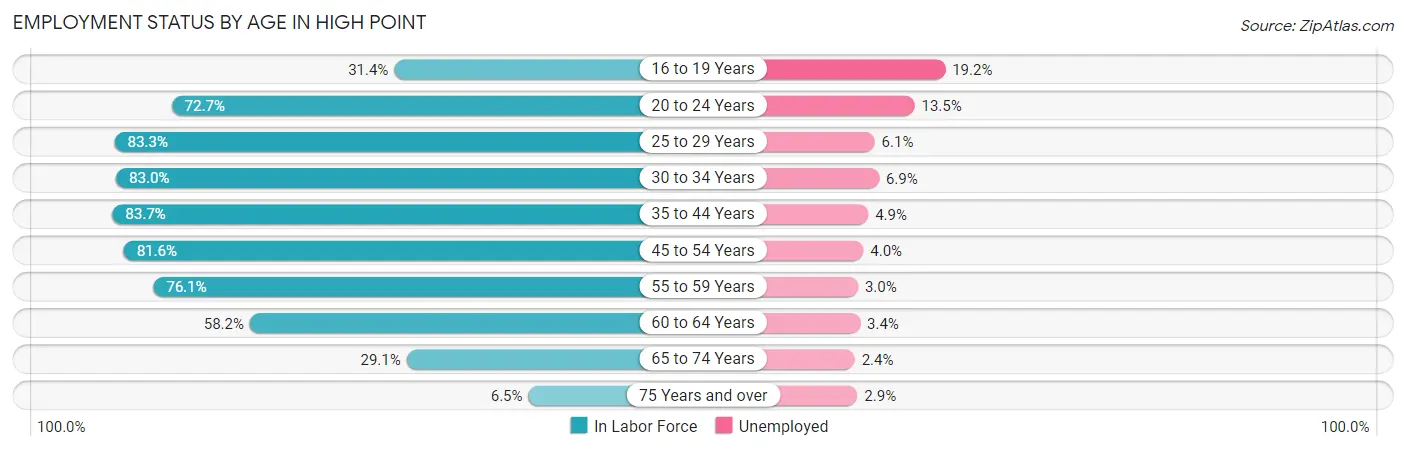
| Age Bracket | In Labor Force | Unemployed |
| 16 to 19 Years | 2,543 (31.4%) | 488 (19.2%) |
| 20 to 24 Years | 6,134 (72.7%) | 828 (13.5%) |
| 25 to 29 Years | 6,114 (83.3%) | 373 (6.1%) |
| 30 to 34 Years | 5,803 (83.0%) | 400 (6.9%) |
| 35 to 44 Years | 11,602 (83.7%) | 568 (4.9%) |
| 45 to 54 Years | 11,409 (81.6%) | 456 (4.0%) |
| 55 to 59 Years | 5,908 (76.1%) | 177 (3.0%) |
| 60 to 64 Years | 4,009 (58.2%) | 136 (3.4%) |
| 65 to 74 Years | 3,164 (29.1%) | 76 (2.4%) |
| 75 Years and over | 454 (6.5%) | 13 (2.9%) |
| Total | 57,106 (62.6%) | 3,541 (6.2%) |
Employment Status by Educational Attainment in High Point
According to labor force statistics for High Point, 78.9% of individuals (44,837) out of the total population between 25 and 64 years of age (56,828) are in the labor force, with 4.7% or 2,107 of them being unemployed. The group with the highest labor force participation rate are those with the educational attainment of bachelor's degree or higher, with 87.0% or 17,270 individuals in the labor force. Within the labor force, individuals with high school diploma education have the highest percentage of unemployment, with 10.6% or 959 of them being unemployed.
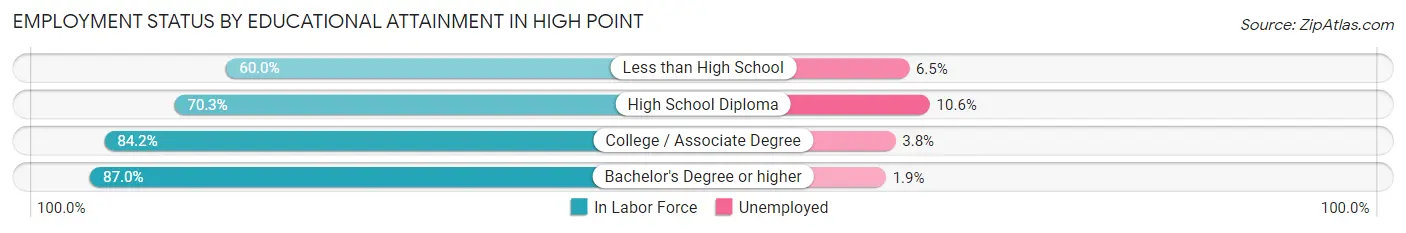
| Educational Attainment | In Labor Force | Unemployed |
| Less than High School | 4,375 (60.0%) | 474 (6.5%) |
| High School Diploma | 9,051 (70.3%) | 1,365 (10.6%) |
| College / Associate Degree | 14,154 (84.2%) | 639 (3.8%) |
| Bachelor's Degree or higher | 17,270 (87.0%) | 377 (1.9%) |
| Total | 44,837 (78.9%) | 2,671 (4.7%) |
Employment Occupations by Sex in High Point
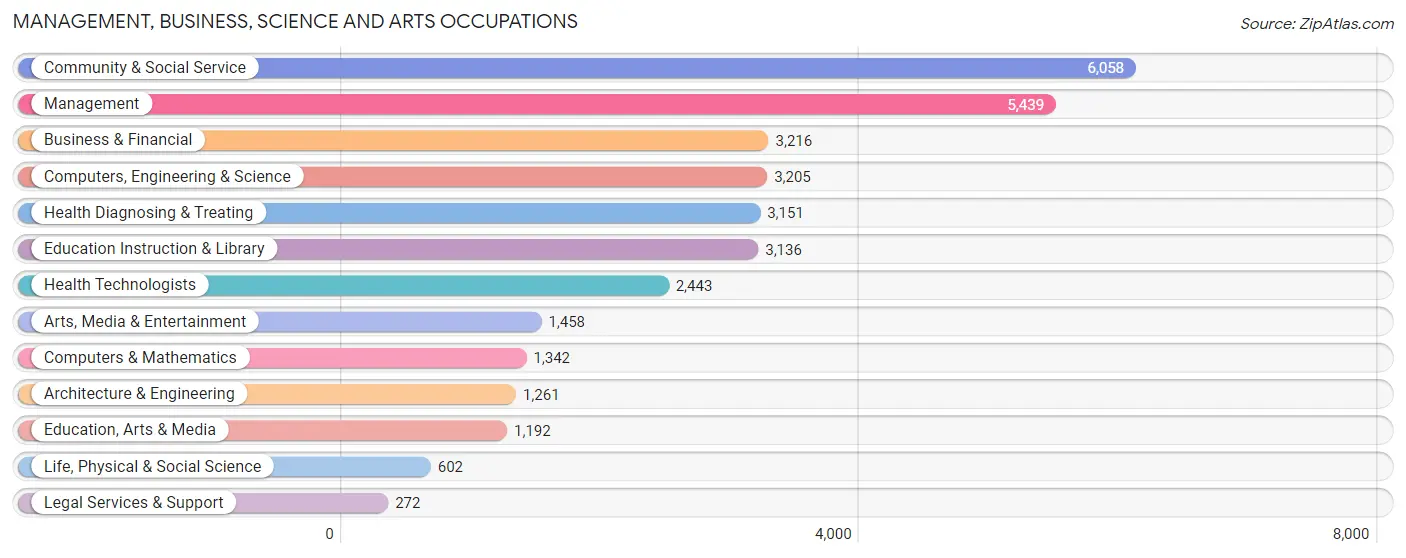
Management, Business, Science and Arts Occupations
The most common Management, Business, Science and Arts occupations in High Point are Community & Social Service (6,058 | 11.3%), Management (5,439 | 10.2%), Business & Financial (3,216 | 6.0%), Computers, Engineering & Science (3,205 | 6.0%), and Health Diagnosing & Treating (3,151 | 5.9%).
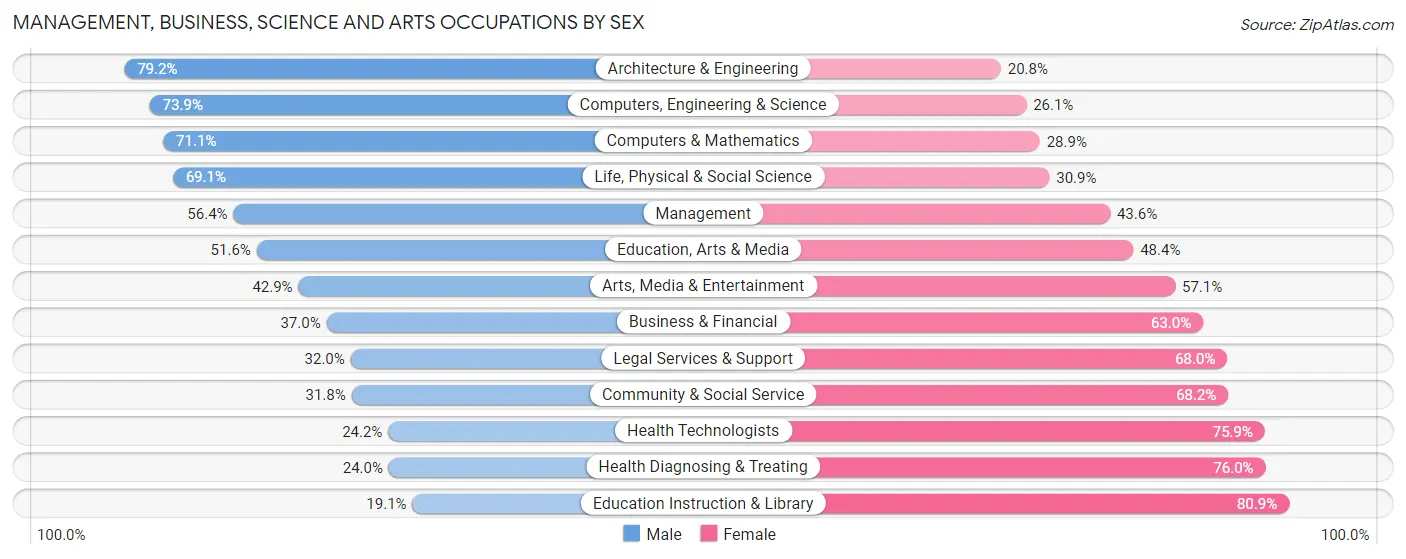
Management, Business, Science and Arts Occupations by Sex
Within the Management, Business, Science and Arts occupations in High Point, the most male-oriented occupations are Architecture & Engineering (79.2%), Computers, Engineering & Science (73.9%), and Computers & Mathematics (71.1%), while the most female-oriented occupations are Education Instruction & Library (80.9%), Health Diagnosing & Treating (76.0%), and Health Technologists (75.8%).
| Occupation | Male | Female |
| Management | 3,070 (56.4%) | 2,369 (43.6%) |
| Business & Financial | 1,191 (37.0%) | 2,025 (63.0%) |
| Computers, Engineering & Science | 2,369 (73.9%) | 836 (26.1%) |
| Computers & Mathematics | 954 (71.1%) | 388 (28.9%) |
| Architecture & Engineering | 999 (79.2%) | 262 (20.8%) |
| Life, Physical & Social Science | 416 (69.1%) | 186 (30.9%) |
| Community & Social Service | 1,926 (31.8%) | 4,132 (68.2%) |
| Education, Arts & Media | 615 (51.6%) | 577 (48.4%) |
| Legal Services & Support | 87 (32.0%) | 185 (68.0%) |
| Education Instruction & Library | 599 (19.1%) | 2,537 (80.9%) |
| Arts, Media & Entertainment | 625 (42.9%) | 833 (57.1%) |
| Health Diagnosing & Treating | 757 (24.0%) | 2,394 (76.0%) |
| Health Technologists | 590 (24.1%) | 1,853 (75.8%) |
| Total (Category) | 9,313 (44.2%) | 11,756 (55.8%) |
| Total (Overall) | 27,297 (51.0%) | 26,200 (49.0%) |
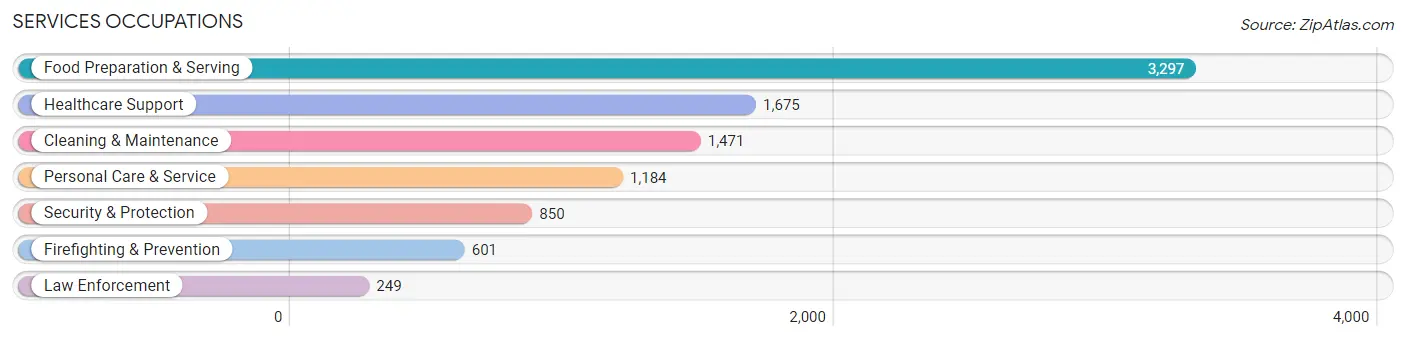
Services Occupations
The most common Services occupations in High Point are Food Preparation & Serving (3,297 | 6.2%), Healthcare Support (1,675 | 3.1%), Cleaning & Maintenance (1,471 | 2.8%), Personal Care & Service (1,184 | 2.2%), and Security & Protection (850 | 1.6%).
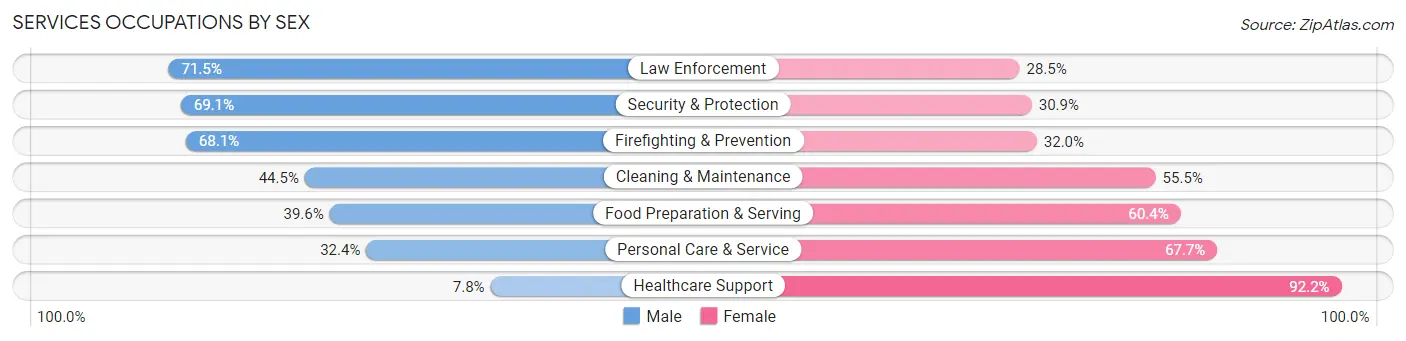
Services Occupations by Sex
Within the Services occupations in High Point, the most male-oriented occupations are Law Enforcement (71.5%), Security & Protection (69.1%), and Firefighting & Prevention (68.0%), while the most female-oriented occupations are Healthcare Support (92.2%), Personal Care & Service (67.6%), and Food Preparation & Serving (60.4%).
| Occupation | Male | Female |
| Healthcare Support | 130 (7.8%) | 1,545 (92.2%) |
| Security & Protection | 587 (69.1%) | 263 (30.9%) |
| Firefighting & Prevention | 409 (68.0%) | 192 (32.0%) |
| Law Enforcement | 178 (71.5%) | 71 (28.5%) |
| Food Preparation & Serving | 1,306 (39.6%) | 1,991 (60.4%) |
| Cleaning & Maintenance | 655 (44.5%) | 816 (55.5%) |
| Personal Care & Service | 383 (32.4%) | 801 (67.6%) |
| Total (Category) | 3,061 (36.1%) | 5,416 (63.9%) |
| Total (Overall) | 27,297 (51.0%) | 26,200 (49.0%) |
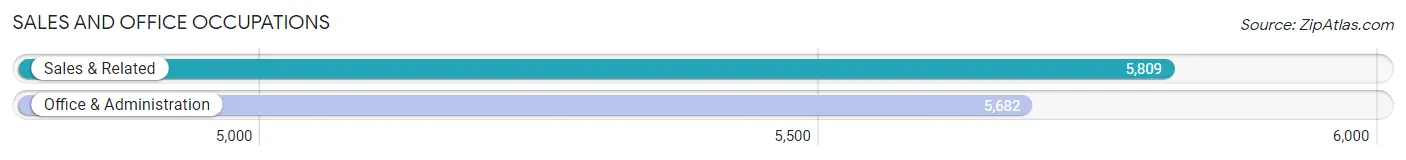
Sales and Office Occupations
The most common Sales and Office occupations in High Point are Sales & Related (5,809 | 10.9%), and Office & Administration (5,682 | 10.6%).
Sales and Office Occupations by Sex
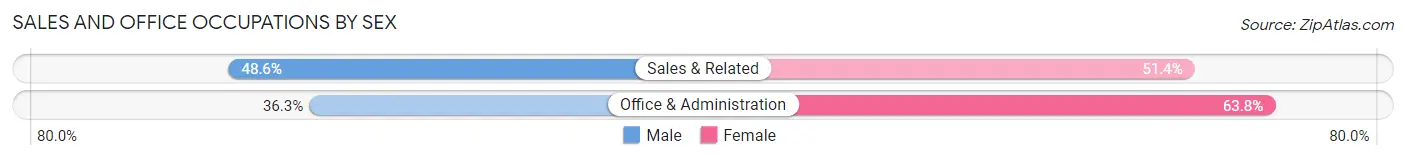
| Occupation | Male | Female |
| Sales & Related | 2,824 (48.6%) | 2,985 (51.4%) |
| Office & Administration | 2,060 (36.2%) | 3,622 (63.7%) |
| Total (Category) | 4,884 (42.5%) | 6,607 (57.5%) |
| Total (Overall) | 27,297 (51.0%) | 26,200 (49.0%) |
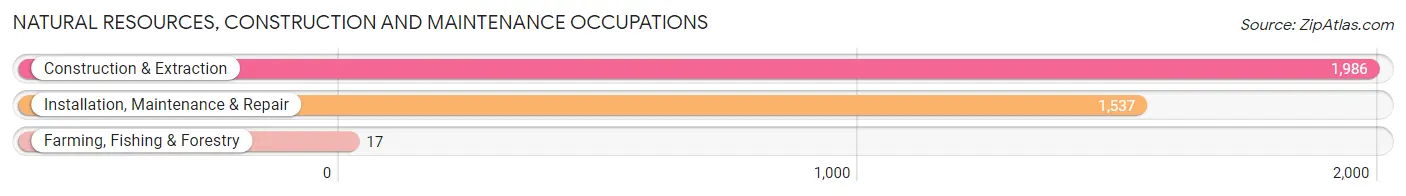
Natural Resources, Construction and Maintenance Occupations
The most common Natural Resources, Construction and Maintenance occupations in High Point are Construction & Extraction (1,986 | 3.7%), Installation, Maintenance & Repair (1,537 | 2.9%), and Farming, Fishing & Forestry (17 | 0.0%).
Natural Resources, Construction and Maintenance Occupations by Sex
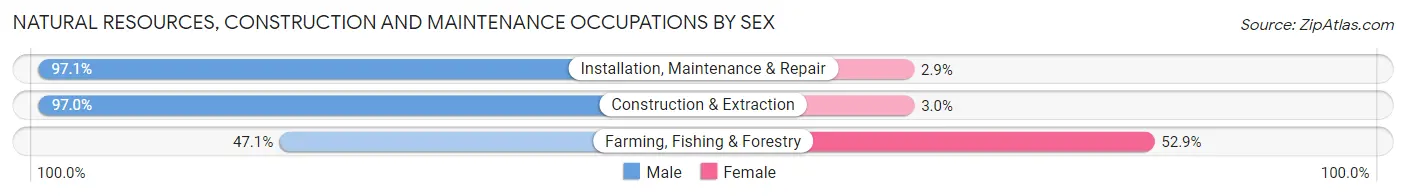
| Occupation | Male | Female |
| Farming, Fishing & Forestry | 8 (47.1%) | 9 (52.9%) |
| Construction & Extraction | 1,927 (97.0%) | 59 (3.0%) |
| Installation, Maintenance & Repair | 1,492 (97.1%) | 45 (2.9%) |
| Total (Category) | 3,427 (96.8%) | 113 (3.2%) |
| Total (Overall) | 27,297 (51.0%) | 26,200 (49.0%) |
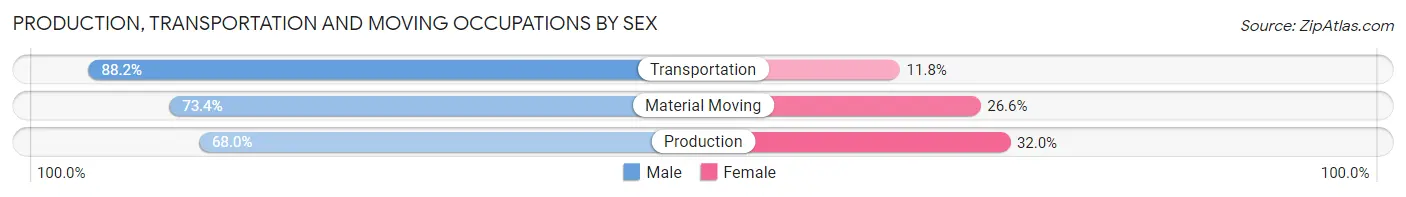
Production, Transportation and Moving Occupations
The most common Production, Transportation and Moving occupations in High Point are Production (4,128 | 7.7%), Material Moving (2,861 | 5.3%), and Transportation (1,931 | 3.6%).

Production, Transportation and Moving Occupations by Sex
| Occupation | Male | Female |
| Production | 2,807 (68.0%) | 1,321 (32.0%) |
| Transportation | 1,704 (88.2%) | 227 (11.8%) |
| Material Moving | 2,101 (73.4%) | 760 (26.6%) |
| Total (Category) | 6,612 (74.1%) | 2,308 (25.9%) |
| Total (Overall) | 27,297 (51.0%) | 26,200 (49.0%) |
Employment Industries by Sex in High Point
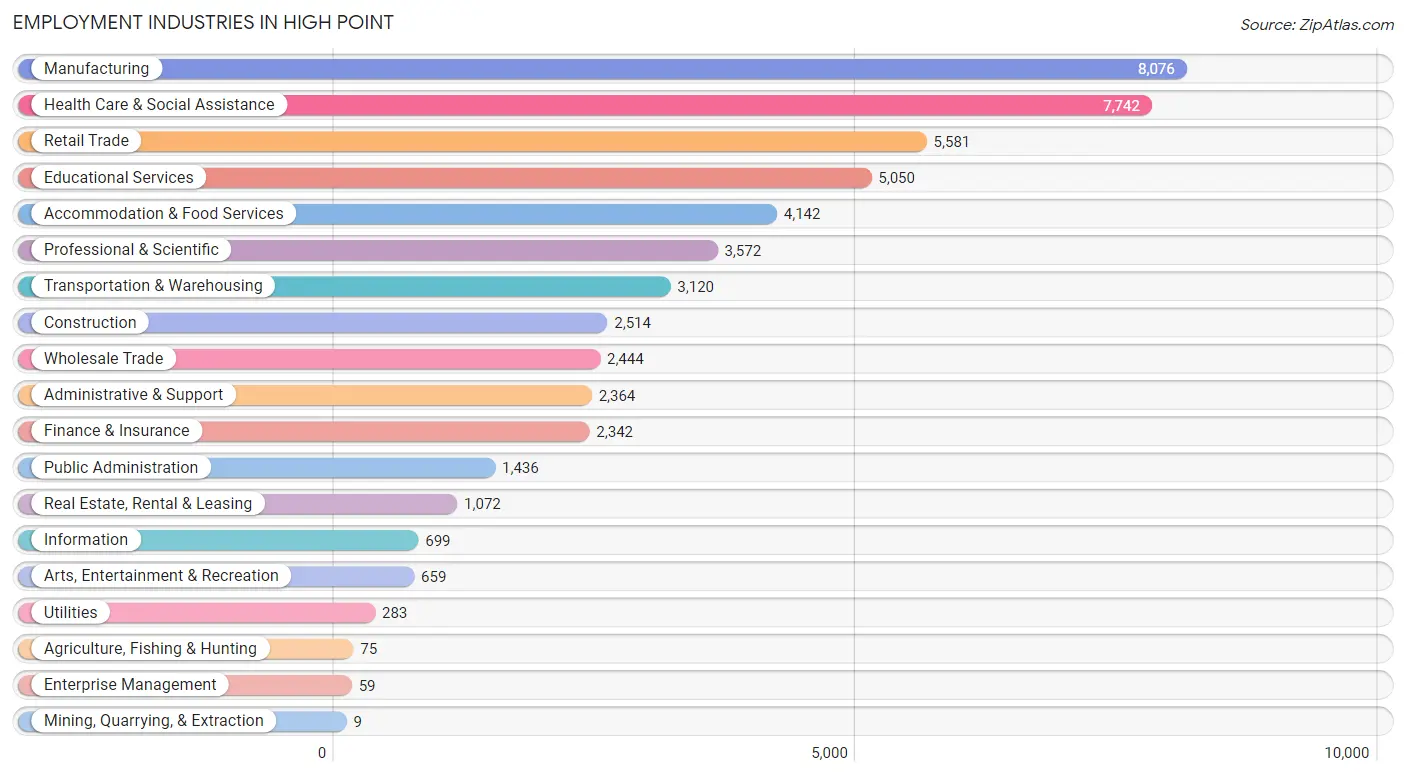
Employment Industries in High Point
The major employment industries in High Point include Manufacturing (8,076 | 15.1%), Health Care & Social Assistance (7,742 | 14.5%), Retail Trade (5,581 | 10.4%), Educational Services (5,050 | 9.4%), and Accommodation & Food Services (4,142 | 7.7%).
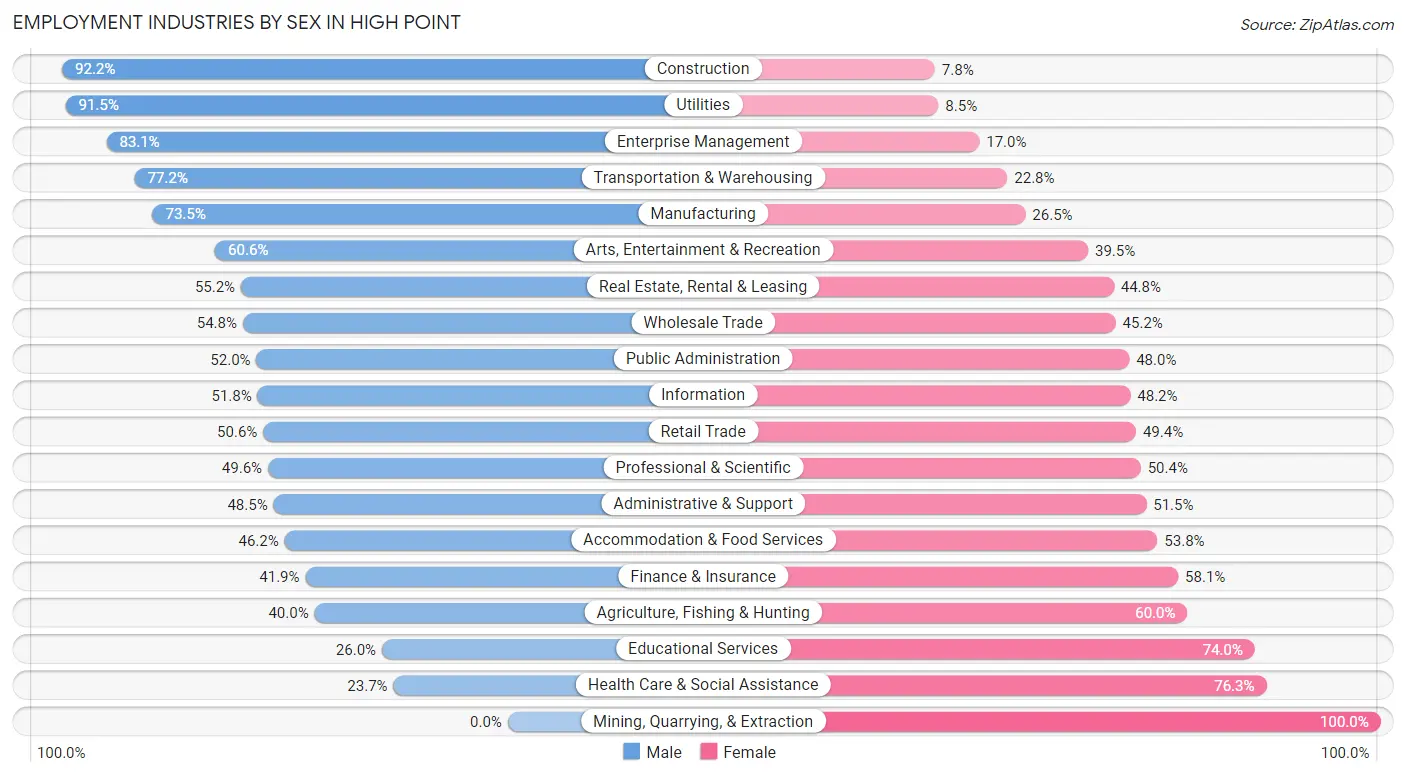
Employment Industries by Sex in High Point
The High Point industries that see more men than women are Construction (92.2%), Utilities (91.5%), and Enterprise Management (83.1%), whereas the industries that tend to have a higher number of women are Mining, Quarrying, & Extraction (100.0%), Health Care & Social Assistance (76.3%), and Educational Services (74.0%).
| Industry | Male | Female |
| Agriculture, Fishing & Hunting | 30 (40.0%) | 45 (60.0%) |
| Mining, Quarrying, & Extraction | 0 (0.0%) | 9 (100.0%) |
| Construction | 2,319 (92.2%) | 195 (7.8%) |
| Manufacturing | 5,937 (73.5%) | 2,139 (26.5%) |
| Wholesale Trade | 1,340 (54.8%) | 1,104 (45.2%) |
| Retail Trade | 2,825 (50.6%) | 2,756 (49.4%) |
| Transportation & Warehousing | 2,410 (77.2%) | 710 (22.8%) |
| Utilities | 259 (91.5%) | 24 (8.5%) |
| Information | 362 (51.8%) | 337 (48.2%) |
| Finance & Insurance | 981 (41.9%) | 1,361 (58.1%) |
| Real Estate, Rental & Leasing | 592 (55.2%) | 480 (44.8%) |
| Professional & Scientific | 1,773 (49.6%) | 1,799 (50.4%) |
| Enterprise Management | 49 (83.1%) | 10 (17.0%) |
| Administrative & Support | 1,146 (48.5%) | 1,218 (51.5%) |
| Educational Services | 1,315 (26.0%) | 3,735 (74.0%) |
| Health Care & Social Assistance | 1,832 (23.7%) | 5,910 (76.3%) |
| Arts, Entertainment & Recreation | 399 (60.6%) | 260 (39.5%) |
| Accommodation & Food Services | 1,913 (46.2%) | 2,229 (53.8%) |
| Public Administration | 747 (52.0%) | 689 (48.0%) |
| Total | 27,297 (51.0%) | 26,200 (49.0%) |
Education in High Point
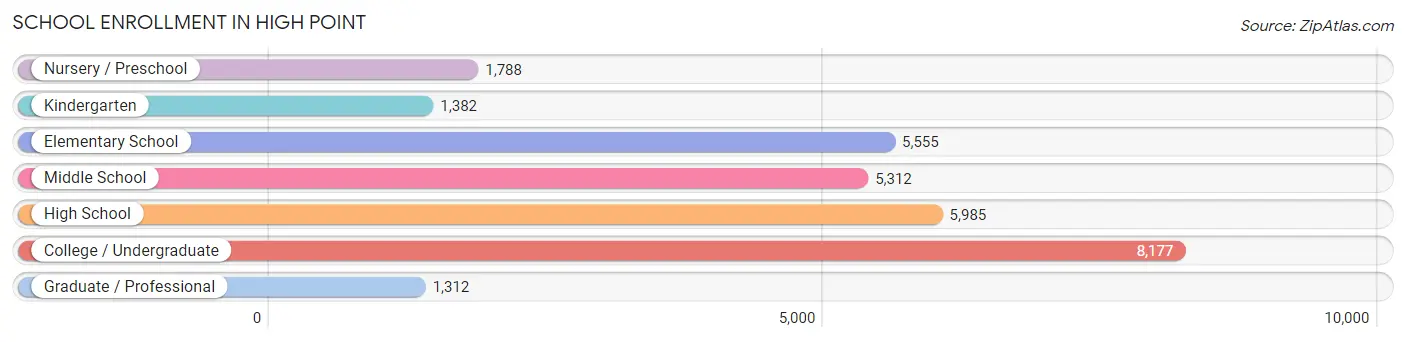
School Enrollment in High Point
The most common levels of schooling among the 29,511 students in High Point are college / undergraduate (8,177 | 27.7%), high school (5,985 | 20.3%), and elementary school (5,555 | 18.8%).
| School Level | # Students | % Students |
| Nursery / Preschool | 1,788 | 6.1% |
| Kindergarten | 1,382 | 4.7% |
| Elementary School | 5,555 | 18.8% |
| Middle School | 5,312 | 18.0% |
| High School | 5,985 | 20.3% |
| College / Undergraduate | 8,177 | 27.7% |
| Graduate / Professional | 1,312 | 4.4% |
| Total | 29,511 | 100.0% |
School Enrollment by Age by Funding Source in High Point
Out of a total of 29,511 students who are enrolled in schools in High Point, 6,788 (23.0%) attend a private institution, while the remaining 22,723 (77.0%) are enrolled in public schools. The age group of 3 to 4 year olds has the highest likelihood of being enrolled in private schools, with 609 (46.3% in the age bracket) enrolled. Conversely, the age group of 15 to 17 year olds has the lowest likelihood of being enrolled in a private school, with 3,647 (88.6% in the age bracket) attending a public institution.
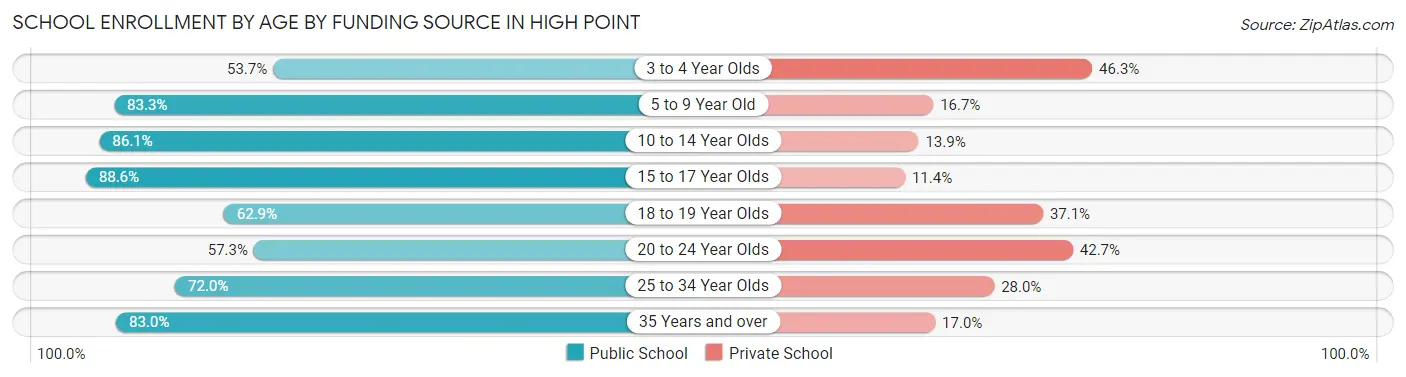
| Age Bracket | Public School | Private School |
| 3 to 4 Year Olds | 707 (53.7%) | 609 (46.3%) |
| 5 to 9 Year Old | 5,445 (83.3%) | 1,090 (16.7%) |
| 10 to 14 Year Olds | 5,956 (86.1%) | 964 (13.9%) |
| 15 to 17 Year Olds | 3,647 (88.6%) | 470 (11.4%) |
| 18 to 19 Year Olds | 2,709 (62.9%) | 1,599 (37.1%) |
| 20 to 24 Year Olds | 1,779 (57.3%) | 1,325 (42.7%) |
| 25 to 34 Year Olds | 1,124 (72.0%) | 438 (28.0%) |
| 35 Years and over | 1,368 (83.0%) | 281 (17.0%) |
| Total | 22,723 (77.0%) | 6,788 (23.0%) |
Educational Attainment by Field of Study in High Point
Business (5,527 | 19.8%), education (3,048 | 10.9%), science & technology (2,876 | 10.3%), arts & humanities (2,514 | 9.0%), and engineering (1,823 | 6.5%) are the most common fields of study among 27,975 individuals in High Point who have obtained a bachelor's degree or higher.
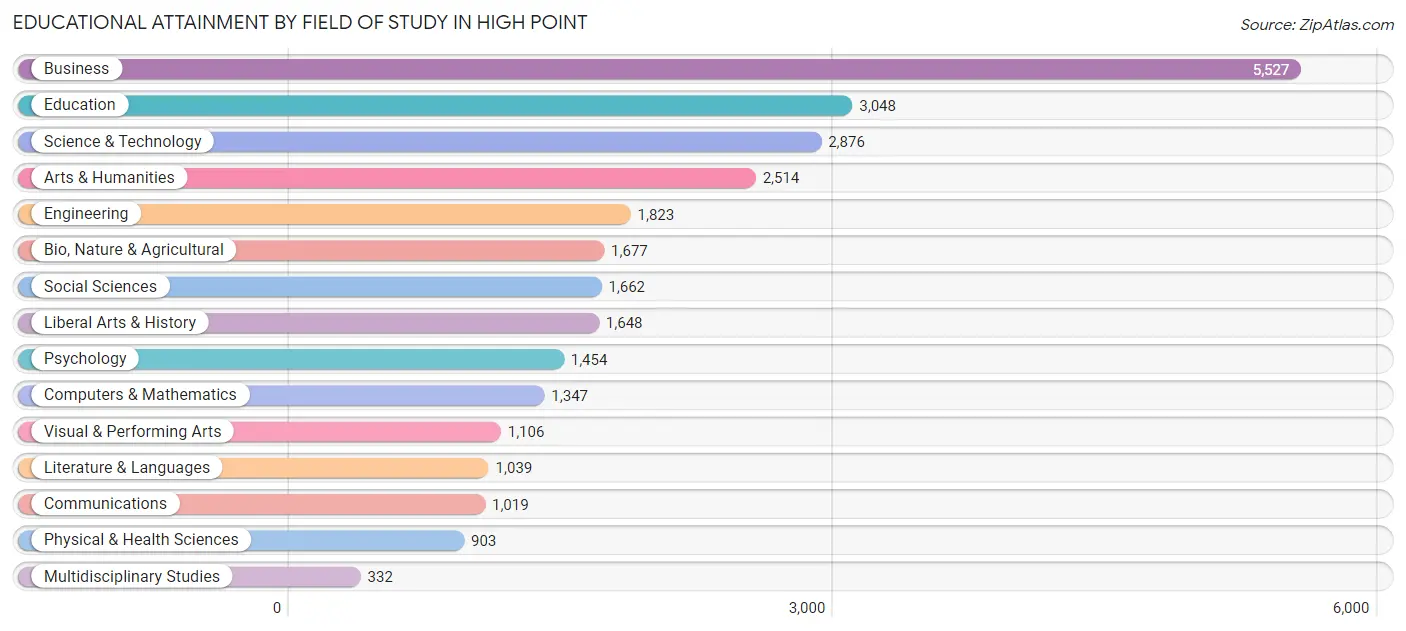
| Field of Study | # Graduates | % Graduates |
| Computers & Mathematics | 1,347 | 4.8% |
| Bio, Nature & Agricultural | 1,677 | 6.0% |
| Physical & Health Sciences | 903 | 3.2% |
| Psychology | 1,454 | 5.2% |
| Social Sciences | 1,662 | 5.9% |
| Engineering | 1,823 | 6.5% |
| Multidisciplinary Studies | 332 | 1.2% |
| Science & Technology | 2,876 | 10.3% |
| Business | 5,527 | 19.8% |
| Education | 3,048 | 10.9% |
| Literature & Languages | 1,039 | 3.7% |
| Liberal Arts & History | 1,648 | 5.9% |
| Visual & Performing Arts | 1,106 | 4.0% |
| Communications | 1,019 | 3.6% |
| Arts & Humanities | 2,514 | 9.0% |
| Total | 27,975 | 100.0% |
Transportation & Commute in High Point
Vehicle Availability by Sex in High Point
The most prevalent vehicle ownership categories in High Point are males with 2 vehicles (11,946, accounting for 45.8%) and females with 2 vehicles (10,166, making up 48.6%).
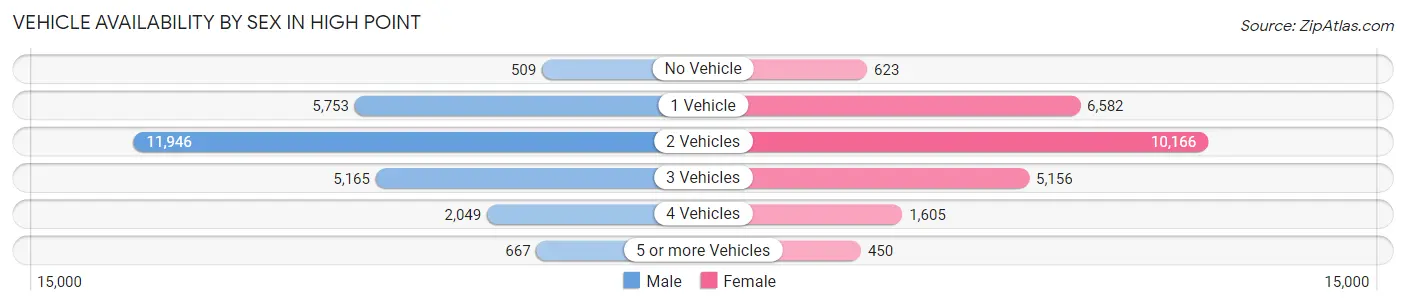
| Vehicles Available | Male | Female |
| No Vehicle | 509 (1.9%) | 623 (2.5%) |
| 1 Vehicle | 5,753 (22.1%) | 6,582 (26.8%) |
| 2 Vehicles | 11,946 (45.8%) | 10,166 (41.4%) |
| 3 Vehicles | 5,165 (19.8%) | 5,156 (21.0%) |
| 4 Vehicles | 2,049 (7.9%) | 1,605 (6.5%) |
| 5 or more Vehicles | 667 (2.6%) | 450 (1.8%) |
| Total | 26,089 (100.0%) | 24,582 (100.0%) |
Commute Time in High Point
The most frequently occuring commute durations in High Point are 10 to 14 minutes (9,936 commuters, 20.8%), 15 to 19 minutes (9,228 commuters, 19.3%), and 20 to 24 minutes (7,193 commuters, 15.0%).
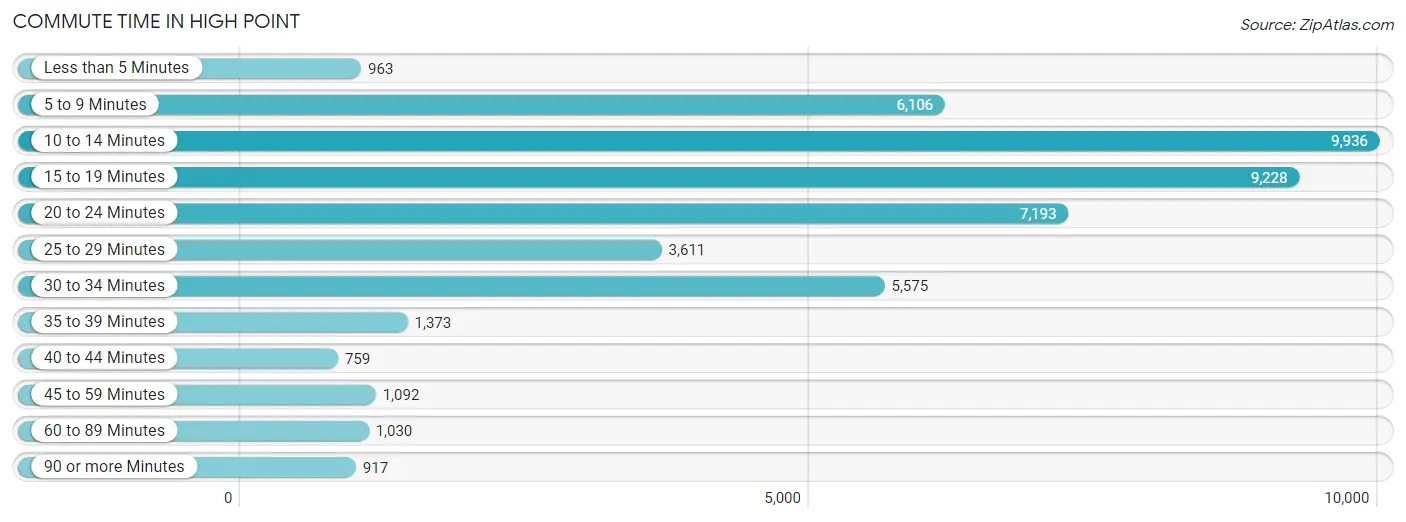
| Commute Time | # Commuters | % Commuters |
| Less than 5 Minutes | 963 | 2.0% |
| 5 to 9 Minutes | 6,106 | 12.8% |
| 10 to 14 Minutes | 9,936 | 20.8% |
| 15 to 19 Minutes | 9,228 | 19.3% |
| 20 to 24 Minutes | 7,193 | 15.0% |
| 25 to 29 Minutes | 3,611 | 7.6% |
| 30 to 34 Minutes | 5,575 | 11.7% |
| 35 to 39 Minutes | 1,373 | 2.9% |
| 40 to 44 Minutes | 759 | 1.6% |
| 45 to 59 Minutes | 1,092 | 2.3% |
| 60 to 89 Minutes | 1,030 | 2.2% |
| 90 or more Minutes | 917 | 1.9% |
Commute Time by Sex in High Point
The most common commute times in High Point are 10 to 14 minutes (5,098 commuters, 20.6%) for males and 10 to 14 minutes (4,838 commuters, 21.0%) for females.
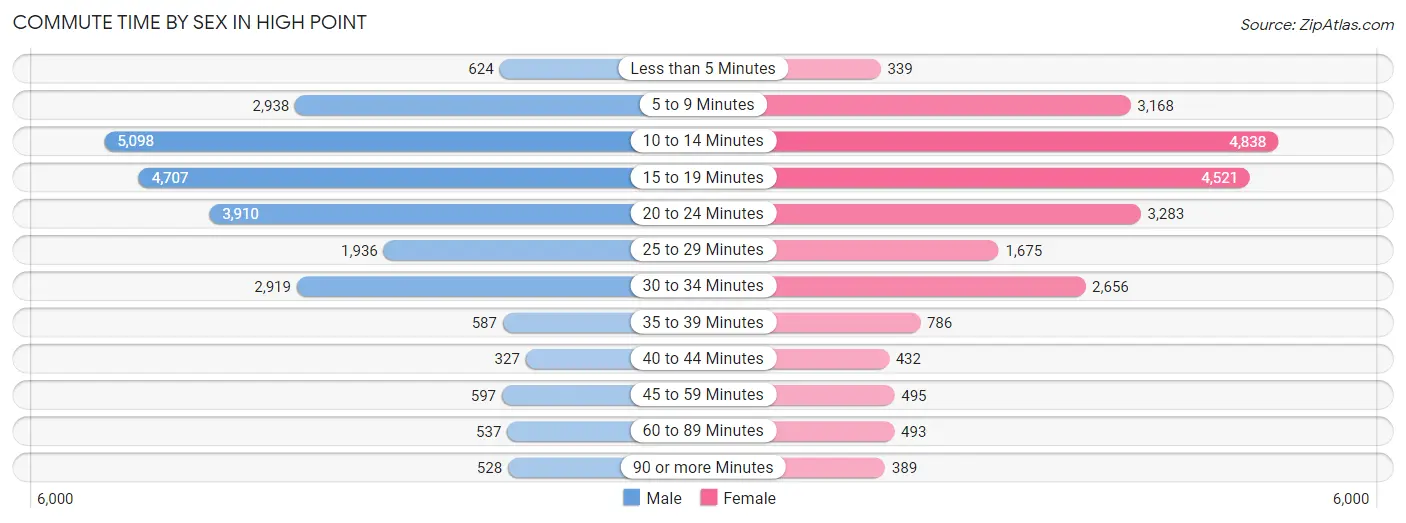
| Commute Time | Male | Female |
| Less than 5 Minutes | 624 (2.5%) | 339 (1.5%) |
| 5 to 9 Minutes | 2,938 (11.9%) | 3,168 (13.7%) |
| 10 to 14 Minutes | 5,098 (20.6%) | 4,838 (21.0%) |
| 15 to 19 Minutes | 4,707 (19.1%) | 4,521 (19.6%) |
| 20 to 24 Minutes | 3,910 (15.8%) | 3,283 (14.2%) |
| 25 to 29 Minutes | 1,936 (7.8%) | 1,675 (7.3%) |
| 30 to 34 Minutes | 2,919 (11.8%) | 2,656 (11.5%) |
| 35 to 39 Minutes | 587 (2.4%) | 786 (3.4%) |
| 40 to 44 Minutes | 327 (1.3%) | 432 (1.9%) |
| 45 to 59 Minutes | 597 (2.4%) | 495 (2.1%) |
| 60 to 89 Minutes | 537 (2.2%) | 493 (2.1%) |
| 90 or more Minutes | 528 (2.1%) | 389 (1.7%) |
Time of Departure to Work by Sex in High Point
The most frequent times of departure to work in High Point are 7:00 AM to 7:29 AM (3,324, 13.5%) for males and 7:30 AM to 7:59 AM (3,910, 16.9%) for females.
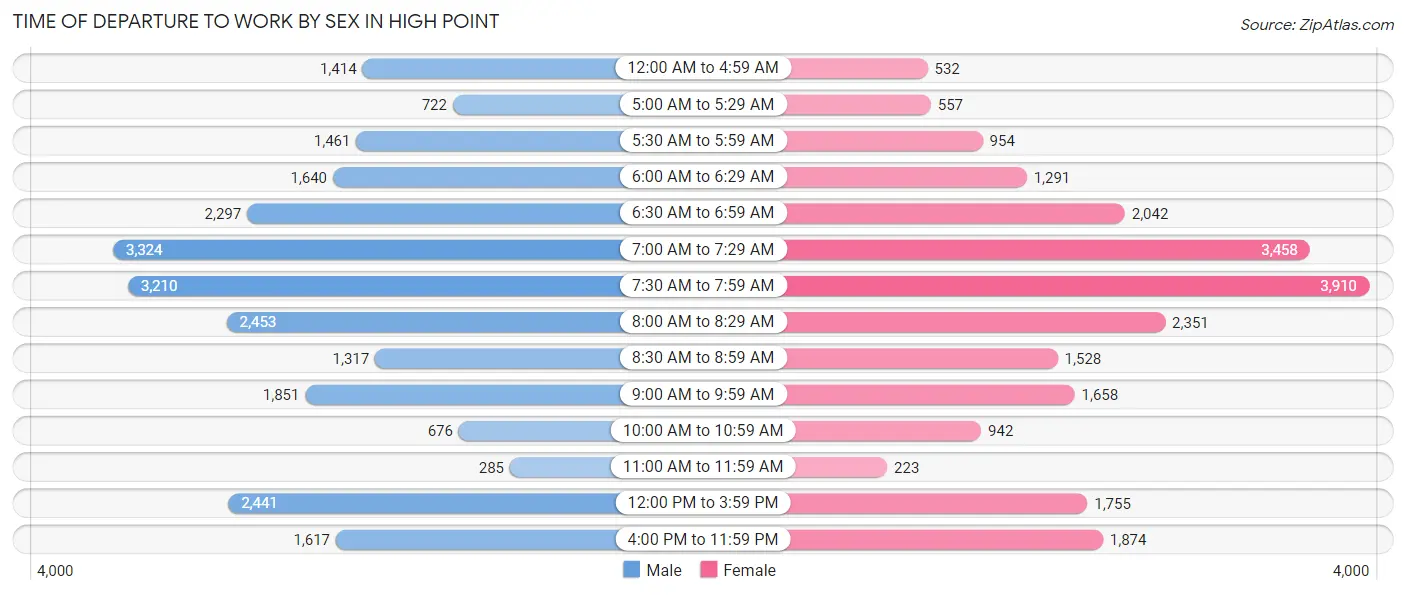
| Time of Departure | Male | Female |
| 12:00 AM to 4:59 AM | 1,414 (5.7%) | 532 (2.3%) |
| 5:00 AM to 5:29 AM | 722 (2.9%) | 557 (2.4%) |
| 5:30 AM to 5:59 AM | 1,461 (5.9%) | 954 (4.1%) |
| 6:00 AM to 6:29 AM | 1,640 (6.6%) | 1,291 (5.6%) |
| 6:30 AM to 6:59 AM | 2,297 (9.3%) | 2,042 (8.8%) |
| 7:00 AM to 7:29 AM | 3,324 (13.5%) | 3,458 (15.0%) |
| 7:30 AM to 7:59 AM | 3,210 (13.0%) | 3,910 (16.9%) |
| 8:00 AM to 8:29 AM | 2,453 (9.9%) | 2,351 (10.2%) |
| 8:30 AM to 8:59 AM | 1,317 (5.3%) | 1,528 (6.6%) |
| 9:00 AM to 9:59 AM | 1,851 (7.5%) | 1,658 (7.2%) |
| 10:00 AM to 10:59 AM | 676 (2.7%) | 942 (4.1%) |
| 11:00 AM to 11:59 AM | 285 (1.1%) | 223 (1.0%) |
| 12:00 PM to 3:59 PM | 2,441 (9.9%) | 1,755 (7.6%) |
| 4:00 PM to 11:59 PM | 1,617 (6.5%) | 1,874 (8.1%) |
| Total | 24,708 (100.0%) | 23,075 (100.0%) |
Housing Occupancy in High Point
Occupancy by Ownership in High Point
Of the total 44,049 dwellings in High Point, owner-occupied units account for 25,604 (58.1%), while renter-occupied units make up 18,445 (41.9%).
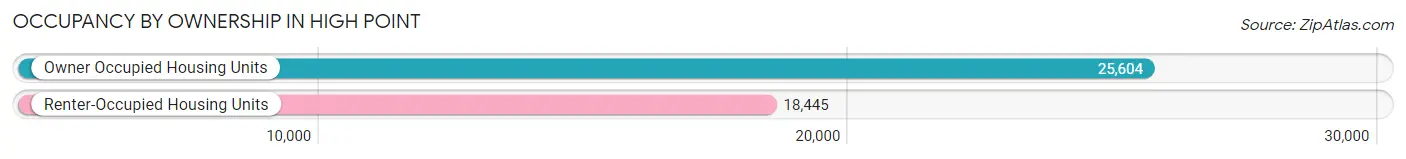
| Occupancy | # Housing Units | % Housing Units |
| Owner Occupied Housing Units | 25,604 | 58.1% |
| Renter-Occupied Housing Units | 18,445 | 41.9% |
| Total Occupied Housing Units | 44,049 | 100.0% |
Occupancy by Household Size in High Point
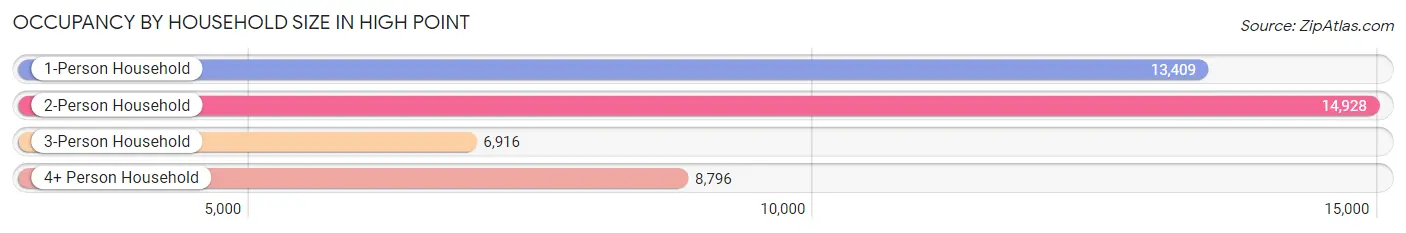
| Household Size | # Housing Units | % Housing Units |
| 1-Person Household | 13,409 | 30.4% |
| 2-Person Household | 14,928 | 33.9% |
| 3-Person Household | 6,916 | 15.7% |
| 4+ Person Household | 8,796 | 20.0% |
| Total Housing Units | 44,049 | 100.0% |
Occupancy by Ownership by Household Size in High Point
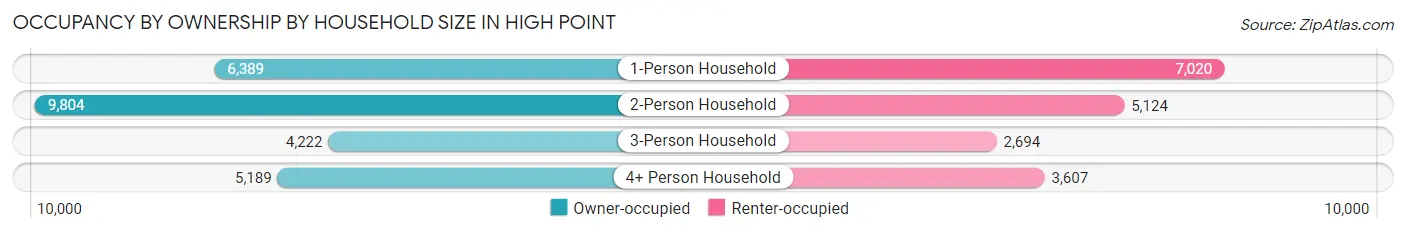
| Household Size | Owner-occupied | Renter-occupied |
| 1-Person Household | 6,389 (47.6%) | 7,020 (52.3%) |
| 2-Person Household | 9,804 (65.7%) | 5,124 (34.3%) |
| 3-Person Household | 4,222 (61.1%) | 2,694 (39.0%) |
| 4+ Person Household | 5,189 (59.0%) | 3,607 (41.0%) |
| Total Housing Units | 25,604 (58.1%) | 18,445 (41.9%) |
Occupancy by Educational Attainment in High Point
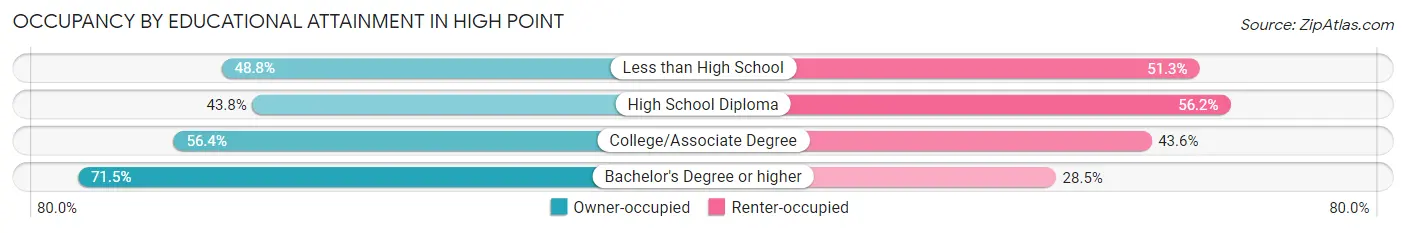
| Household Size | Owner-occupied | Renter-occupied |
| Less than High School | 2,361 (48.7%) | 2,482 (51.2%) |
| High School Diploma | 4,383 (43.8%) | 5,615 (56.2%) |
| College/Associate Degree | 7,558 (56.4%) | 5,850 (43.6%) |
| Bachelor's Degree or higher | 11,302 (71.5%) | 4,498 (28.5%) |
Occupancy by Age of Householder in High Point
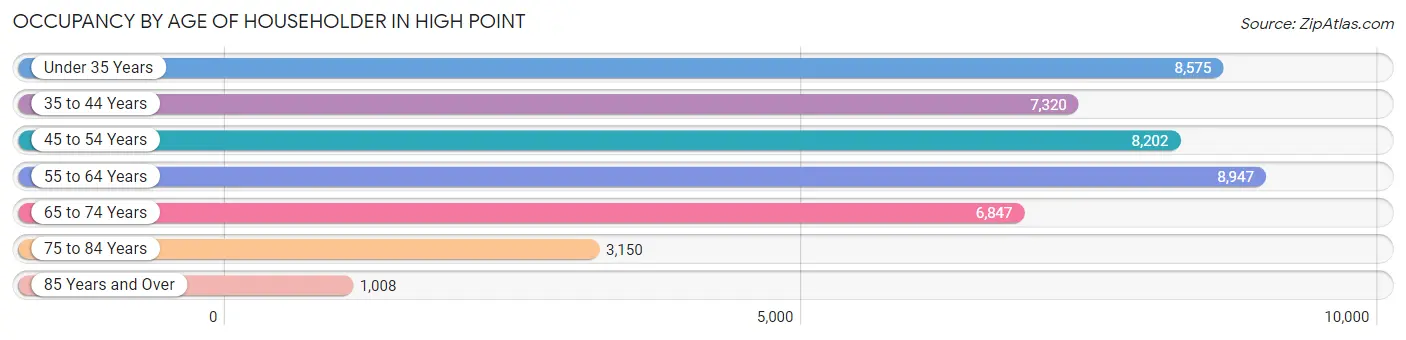
| Age Bracket | # Households | % Households |
| Under 35 Years | 8,575 | 19.5% |
| 35 to 44 Years | 7,320 | 16.6% |
| 45 to 54 Years | 8,202 | 18.6% |
| 55 to 64 Years | 8,947 | 20.3% |
| 65 to 74 Years | 6,847 | 15.5% |
| 75 to 84 Years | 3,150 | 7.1% |
| 85 Years and Over | 1,008 | 2.3% |
| Total | 44,049 | 100.0% |
Housing Finances in High Point
Median Income by Occupancy in High Point
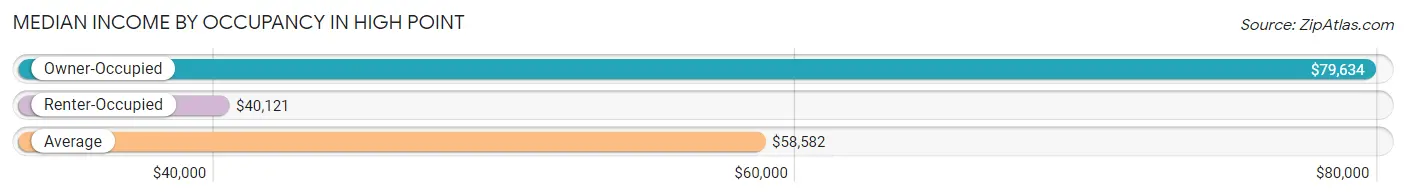
| Occupancy Type | # Households | Median Income |
| Owner-Occupied | 25,604 (58.1%) | $79,634 |
| Renter-Occupied | 18,445 (41.9%) | $40,121 |
| Average | 44,049 (100.0%) | $58,582 |
Occupancy by Householder Income Bracket in High Point
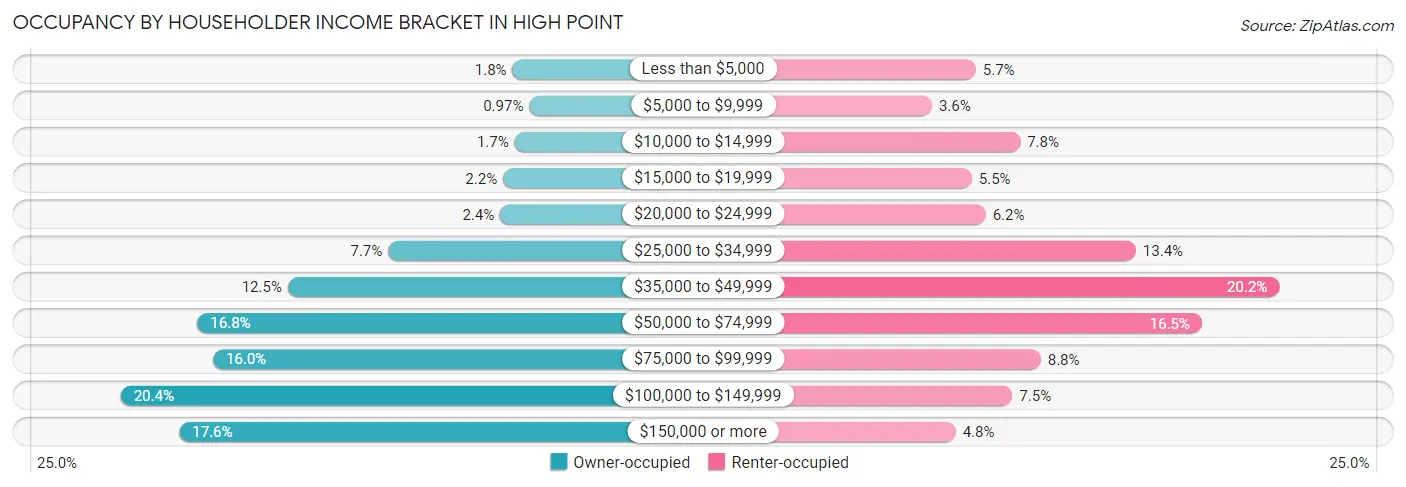
| Income Bracket | Owner-occupied | Renter-occupied |
| Less than $5,000 | 453 (1.8%) | 1,056 (5.7%) |
| $5,000 to $9,999 | 249 (1.0%) | 671 (3.6%) |
| $10,000 to $14,999 | 427 (1.7%) | 1,446 (7.8%) |
| $15,000 to $19,999 | 568 (2.2%) | 1,021 (5.5%) |
| $20,000 to $24,999 | 605 (2.4%) | 1,144 (6.2%) |
| $25,000 to $34,999 | 1,969 (7.7%) | 2,463 (13.4%) |
| $35,000 to $49,999 | 3,192 (12.5%) | 3,720 (20.2%) |
| $50,000 to $74,999 | 4,295 (16.8%) | 3,041 (16.5%) |
| $75,000 to $99,999 | 4,105 (16.0%) | 1,627 (8.8%) |
| $100,000 to $149,999 | 5,228 (20.4%) | 1,377 (7.5%) |
| $150,000 or more | 4,513 (17.6%) | 879 (4.8%) |
| Total | 25,604 (100.0%) | 18,445 (100.0%) |
Monthly Housing Cost Tiers in High Point
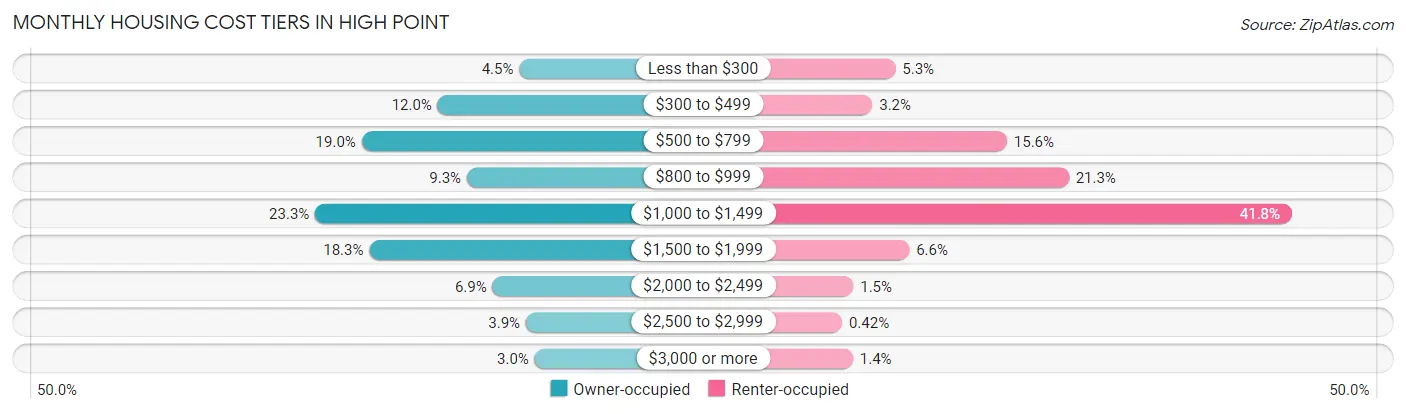
| Monthly Cost | Owner-occupied | Renter-occupied |
| Less than $300 | 1,141 (4.5%) | 983 (5.3%) |
| $300 to $499 | 3,066 (12.0%) | 593 (3.2%) |
| $500 to $799 | 4,858 (19.0%) | 2,878 (15.6%) |
| $800 to $999 | 2,375 (9.3%) | 3,927 (21.3%) |
| $1,000 to $1,499 | 5,952 (23.3%) | 7,715 (41.8%) |
| $1,500 to $1,999 | 4,677 (18.3%) | 1,219 (6.6%) |
| $2,000 to $2,499 | 1,771 (6.9%) | 270 (1.5%) |
| $2,500 to $2,999 | 986 (3.8%) | 78 (0.4%) |
| $3,000 or more | 778 (3.0%) | 261 (1.4%) |
| Total | 25,604 (100.0%) | 18,445 (100.0%) |
Physical Housing Characteristics in High Point
Housing Structures in High Point
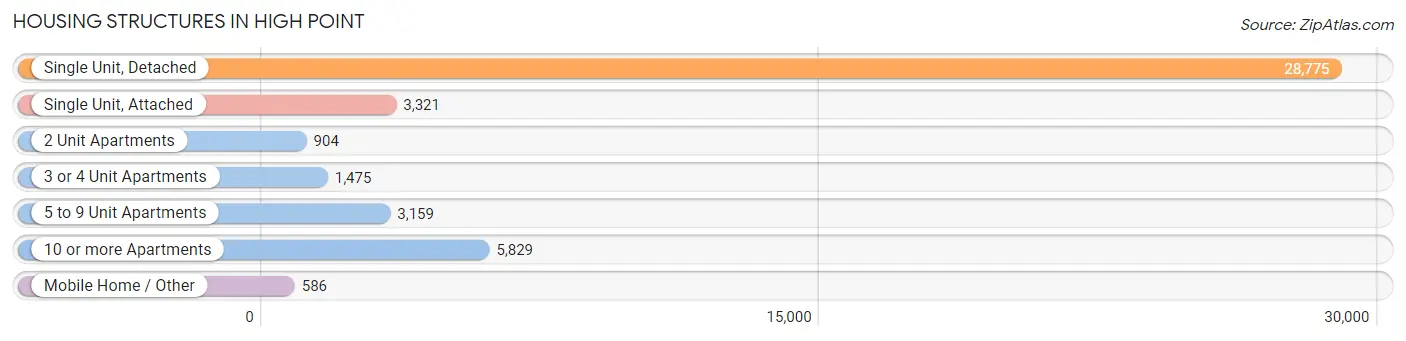
| Structure Type | # Housing Units | % Housing Units |
| Single Unit, Detached | 28,775 | 65.3% |
| Single Unit, Attached | 3,321 | 7.5% |
| 2 Unit Apartments | 904 | 2.1% |
| 3 or 4 Unit Apartments | 1,475 | 3.4% |
| 5 to 9 Unit Apartments | 3,159 | 7.2% |
| 10 or more Apartments | 5,829 | 13.2% |
| Mobile Home / Other | 586 | 1.3% |
| Total | 44,049 | 100.0% |
Housing Structures by Occupancy in High Point
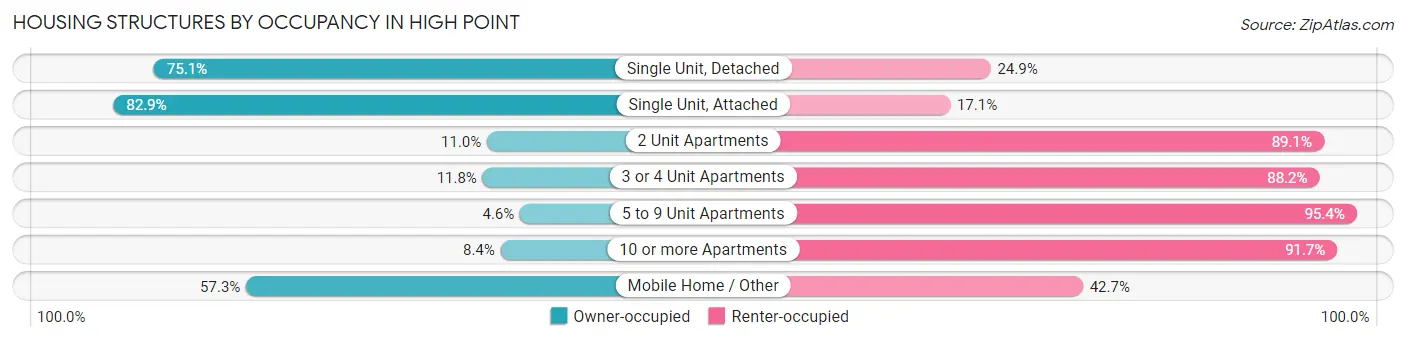
| Structure Type | Owner-occupied | Renter-occupied |
| Single Unit, Detached | 21,610 (75.1%) | 7,165 (24.9%) |
| Single Unit, Attached | 2,753 (82.9%) | 568 (17.1%) |
| 2 Unit Apartments | 99 (11.0%) | 805 (89.0%) |
| 3 or 4 Unit Apartments | 174 (11.8%) | 1,301 (88.2%) |
| 5 to 9 Unit Apartments | 145 (4.6%) | 3,014 (95.4%) |
| 10 or more Apartments | 487 (8.4%) | 5,342 (91.6%) |
| Mobile Home / Other | 336 (57.3%) | 250 (42.7%) |
| Total | 25,604 (58.1%) | 18,445 (41.9%) |
Housing Structures by Number of Rooms in High Point
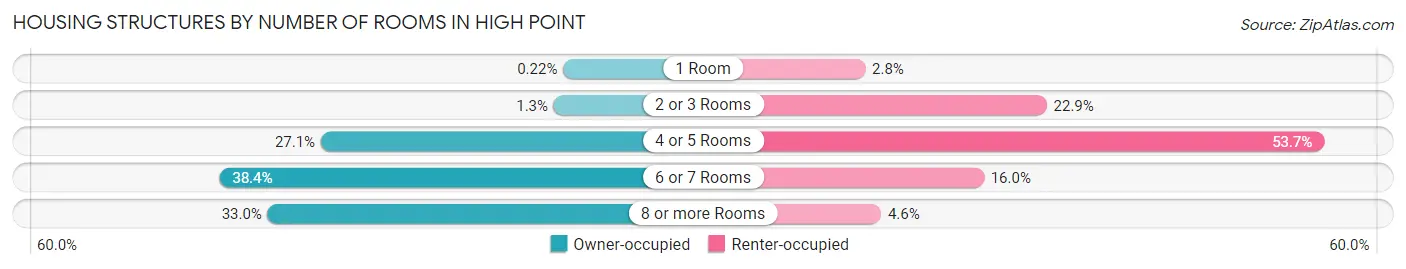
| Number of Rooms | Owner-occupied | Renter-occupied |
| 1 Room | 57 (0.2%) | 515 (2.8%) |
| 2 or 3 Rooms | 323 (1.3%) | 4,232 (22.9%) |
| 4 or 5 Rooms | 6,941 (27.1%) | 9,913 (53.7%) |
| 6 or 7 Rooms | 9,829 (38.4%) | 2,943 (16.0%) |
| 8 or more Rooms | 8,454 (33.0%) | 842 (4.6%) |
| Total | 25,604 (100.0%) | 18,445 (100.0%) |
Housing Structure by Heating Type in High Point
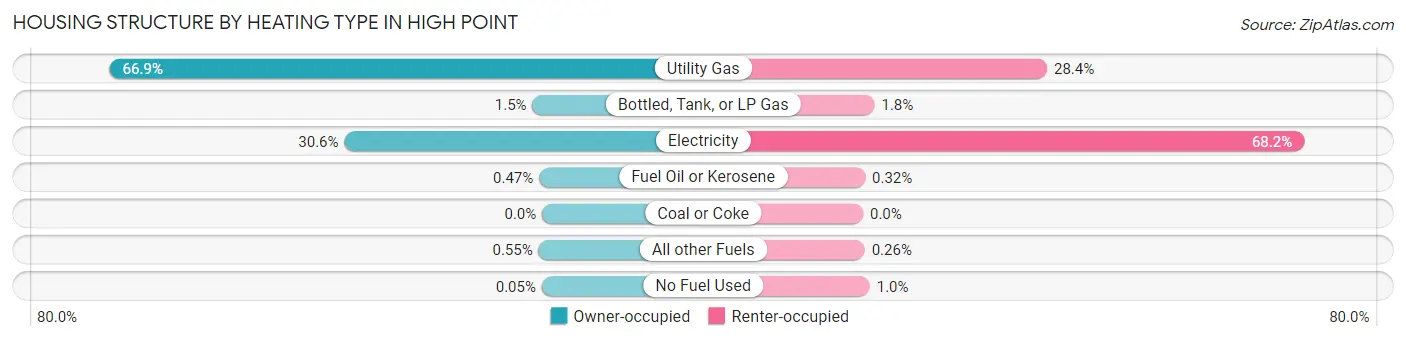
| Heating Type | Owner-occupied | Renter-occupied |
| Utility Gas | 17,118 (66.9%) | 5,246 (28.4%) |
| Bottled, Tank, or LP Gas | 383 (1.5%) | 328 (1.8%) |
| Electricity | 7,826 (30.6%) | 12,572 (68.2%) |
| Fuel Oil or Kerosene | 121 (0.5%) | 59 (0.3%) |
| Coal or Coke | 0 (0.0%) | 0 (0.0%) |
| All other Fuels | 142 (0.5%) | 48 (0.3%) |
| No Fuel Used | 14 (0.1%) | 192 (1.0%) |
| Total | 25,604 (100.0%) | 18,445 (100.0%) |
Household Vehicle Usage in High Point
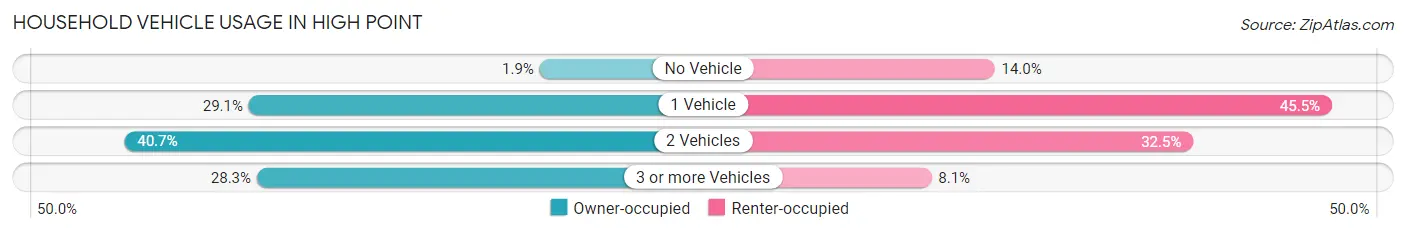
| Vehicles per Household | Owner-occupied | Renter-occupied |
| No Vehicle | 492 (1.9%) | 2,576 (14.0%) |
| 1 Vehicle | 7,443 (29.1%) | 8,385 (45.5%) |
| 2 Vehicles | 10,417 (40.7%) | 5,996 (32.5%) |
| 3 or more Vehicles | 7,252 (28.3%) | 1,488 (8.1%) |
| Total | 25,604 (100.0%) | 18,445 (100.0%) |
Real Estate & Mortgages in High Point
Real Estate and Mortgage Overview in High Point
| Characteristic | Without Mortgage | With Mortgage |
| Housing Units | 8,873 | 16,731 |
| Median Property Value | $159,900 | $213,600 |
| Median Household Income | $60,391 | $3,206 |
| Monthly Housing Costs | $523 | $773 |
| Real Estate Taxes | $1,800 | $195 |
Property Value by Mortgage Status in High Point
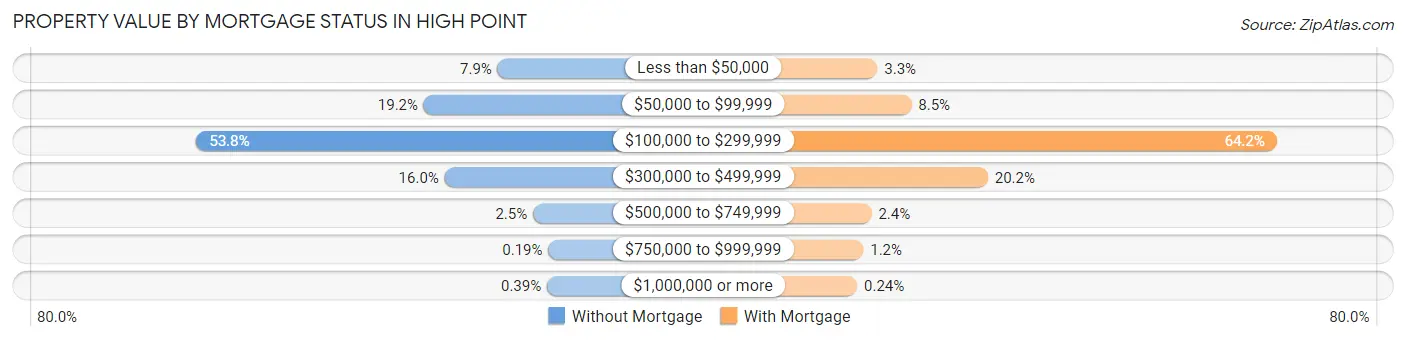
| Property Value | Without Mortgage | With Mortgage |
| Less than $50,000 | 702 (7.9%) | 555 (3.3%) |
| $50,000 to $99,999 | 1,700 (19.2%) | 1,422 (8.5%) |
| $100,000 to $299,999 | 4,776 (53.8%) | 10,740 (64.2%) |
| $300,000 to $499,999 | 1,419 (16.0%) | 3,371 (20.2%) |
| $500,000 to $749,999 | 224 (2.5%) | 406 (2.4%) |
| $750,000 to $999,999 | 17 (0.2%) | 197 (1.2%) |
| $1,000,000 or more | 35 (0.4%) | 40 (0.2%) |
| Total | 8,873 (100.0%) | 16,731 (100.0%) |
Household Income by Mortgage Status in High Point
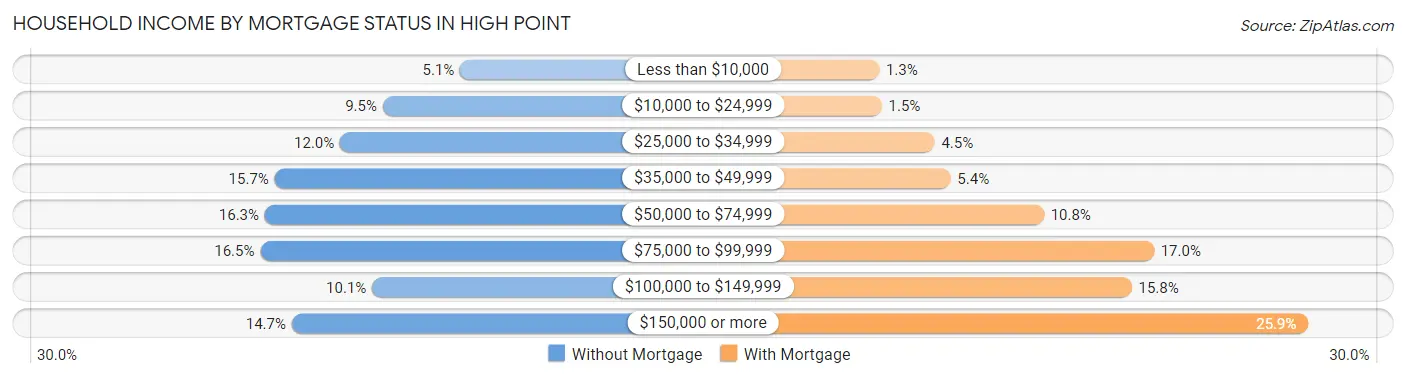
| Household Income | Without Mortgage | With Mortgage |
| Less than $10,000 | 453 (5.1%) | 225 (1.3%) |
| $10,000 to $24,999 | 846 (9.5%) | 249 (1.5%) |
| $25,000 to $34,999 | 1,062 (12.0%) | 754 (4.5%) |
| $35,000 to $49,999 | 1,394 (15.7%) | 907 (5.4%) |
| $50,000 to $74,999 | 1,444 (16.3%) | 1,798 (10.7%) |
| $75,000 to $99,999 | 1,467 (16.5%) | 2,851 (17.0%) |
| $100,000 to $149,999 | 900 (10.1%) | 2,638 (15.8%) |
| $150,000 or more | 1,307 (14.7%) | 4,328 (25.9%) |
| Total | 8,873 (100.0%) | 16,731 (100.0%) |
Property Value to Household Income Ratio in High Point
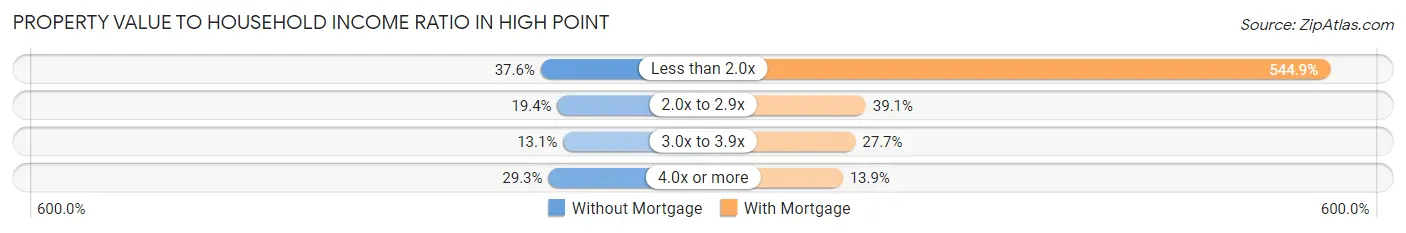
| Value-to-Income Ratio | Without Mortgage | With Mortgage |
| Less than 2.0x | 3,339 (37.6%) | 91,170 (544.9%) |
| 2.0x to 2.9x | 1,718 (19.4%) | 6,548 (39.1%) |
| 3.0x to 3.9x | 1,162 (13.1%) | 4,634 (27.7%) |
| 4.0x or more | 2,600 (29.3%) | 2,326 (13.9%) |
| Total | 8,873 (100.0%) | 16,731 (100.0%) |
Real Estate Taxes by Mortgage Status in High Point
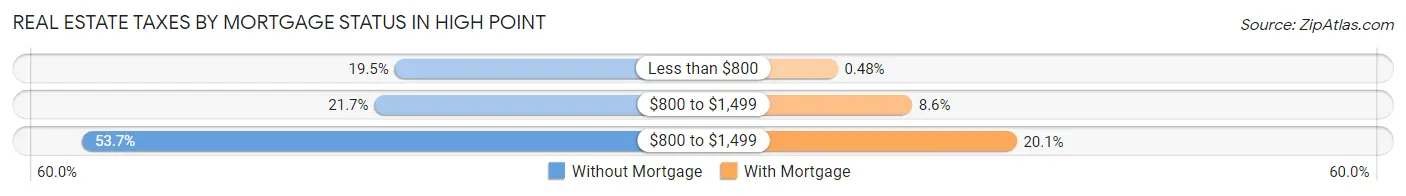
| Property Taxes | Without Mortgage | With Mortgage |
| Less than $800 | 1,726 (19.5%) | 81 (0.5%) |
| $800 to $1,499 | 1,923 (21.7%) | 1,444 (8.6%) |
| $800 to $1,499 | 4,766 (53.7%) | 3,363 (20.1%) |
| Total | 8,873 (100.0%) | 16,731 (100.0%) |
Health & Disability in High Point
Health Insurance Coverage by Age in High Point
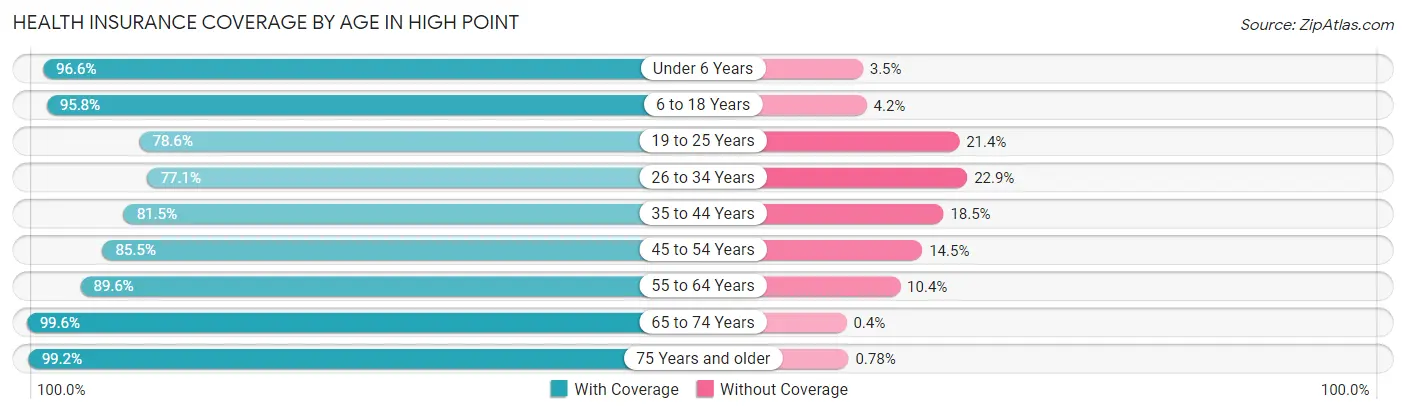
| Age Bracket | With Coverage | Without Coverage |
| Under 6 Years | 8,230 (96.6%) | 294 (3.5%) |
| 6 to 18 Years | 18,749 (95.8%) | 814 (4.2%) |
| 19 to 25 Years | 9,901 (78.6%) | 2,700 (21.4%) |
| 26 to 34 Years | 9,869 (77.1%) | 2,935 (22.9%) |
| 35 to 44 Years | 11,265 (81.5%) | 2,556 (18.5%) |
| 45 to 54 Years | 11,887 (85.5%) | 2,021 (14.5%) |
| 55 to 64 Years | 12,994 (89.6%) | 1,511 (10.4%) |
| 65 to 74 Years | 10,676 (99.6%) | 43 (0.4%) |
| 75 Years and older | 6,458 (99.2%) | 51 (0.8%) |
| Total | 100,029 (88.6%) | 12,925 (11.4%) |
Health Insurance Coverage by Citizenship Status in High Point
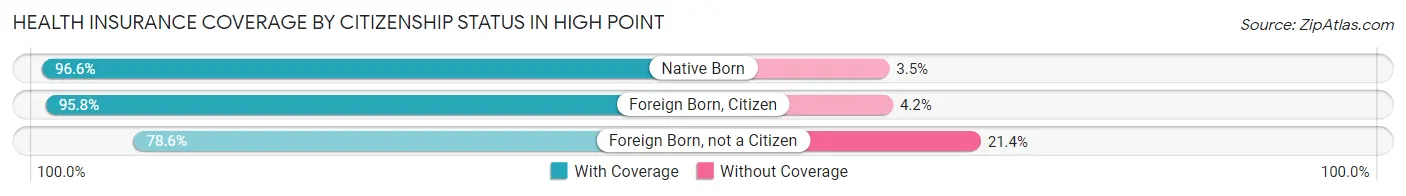
| Citizenship Status | With Coverage | Without Coverage |
| Native Born | 8,230 (96.6%) | 294 (3.5%) |
| Foreign Born, Citizen | 18,749 (95.8%) | 814 (4.2%) |
| Foreign Born, not a Citizen | 9,901 (78.6%) | 2,700 (21.4%) |
Health Insurance Coverage by Household Income in High Point
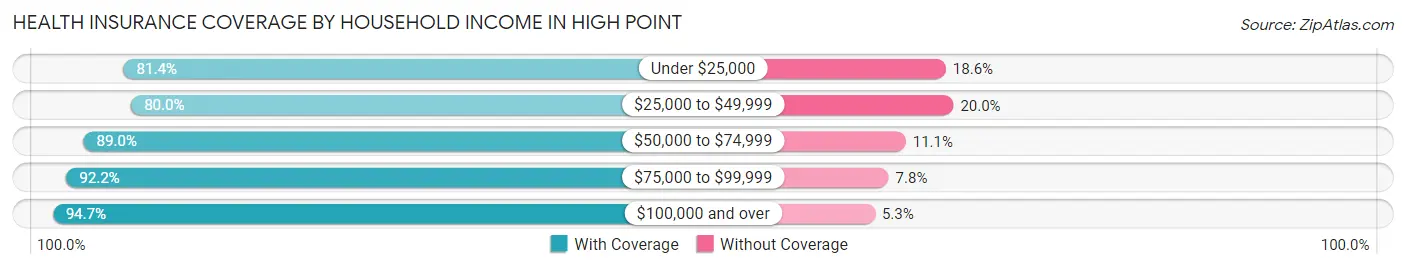
| Household Income | With Coverage | Without Coverage |
| Under $25,000 | 11,600 (81.4%) | 2,645 (18.6%) |
| $25,000 to $49,999 | 19,548 (80.0%) | 4,881 (20.0%) |
| $50,000 to $74,999 | 16,474 (88.9%) | 2,047 (11.1%) |
| $75,000 to $99,999 | 14,626 (92.2%) | 1,244 (7.8%) |
| $100,000 and over | 33,501 (94.7%) | 1,866 (5.3%) |
Public vs Private Health Insurance Coverage by Age in High Point
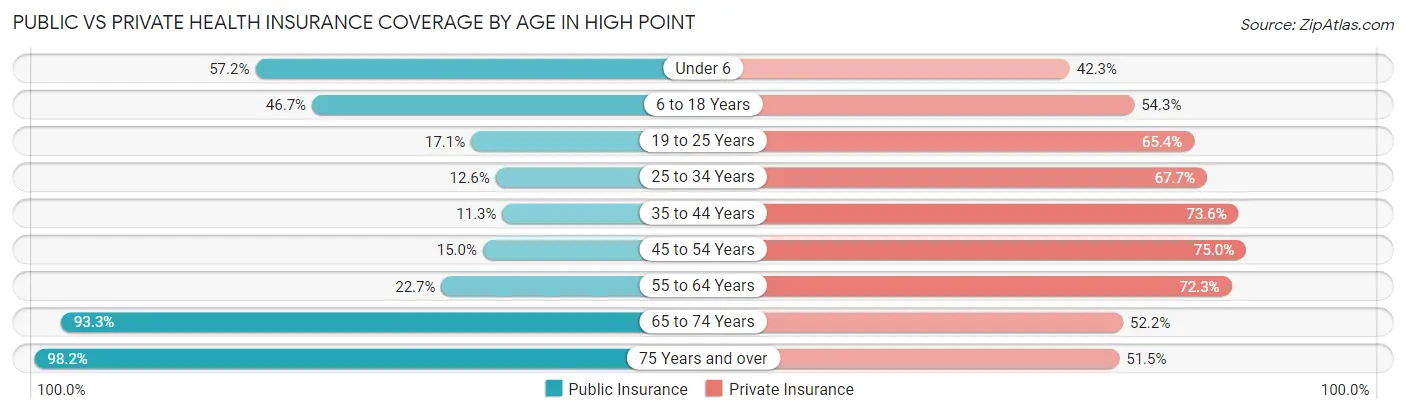
| Age Bracket | Public Insurance | Private Insurance |
| Under 6 | 4,875 (57.2%) | 3,608 (42.3%) |
| 6 to 18 Years | 9,131 (46.7%) | 10,619 (54.3%) |
| 19 to 25 Years | 2,160 (17.1%) | 8,240 (65.4%) |
| 25 to 34 Years | 1,610 (12.6%) | 8,673 (67.7%) |
| 35 to 44 Years | 1,565 (11.3%) | 10,176 (73.6%) |
| 45 to 54 Years | 2,079 (14.9%) | 10,437 (75.0%) |
| 55 to 64 Years | 3,285 (22.7%) | 10,490 (72.3%) |
| 65 to 74 Years | 9,995 (93.2%) | 5,596 (52.2%) |
| 75 Years and over | 6,390 (98.2%) | 3,353 (51.5%) |
| Total | 41,090 (36.4%) | 71,192 (63.0%) |
Disability Status by Sex by Age in High Point
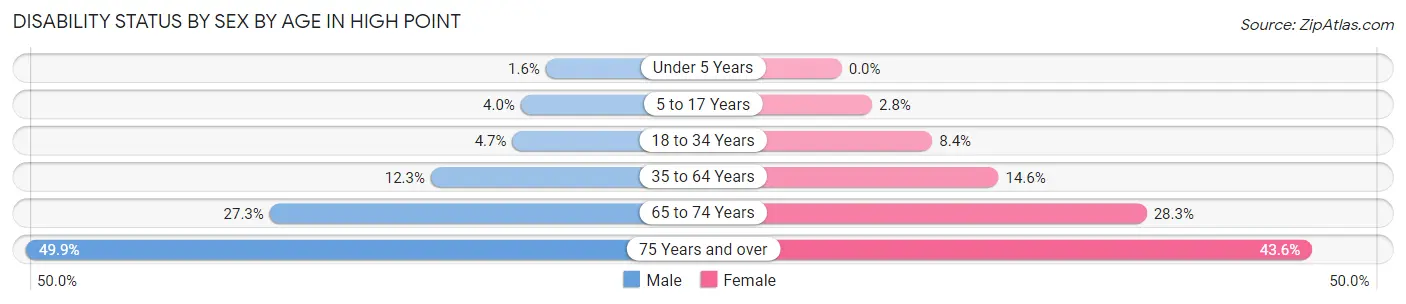
| Age Bracket | Male | Female |
| Under 5 Years | 61 (1.6%) | 0 (0.0%) |
| 5 to 17 Years | 371 (4.0%) | 253 (2.8%) |
| 18 to 34 Years | 666 (4.7%) | 1,155 (8.4%) |
| 35 to 64 Years | 2,471 (12.3%) | 3,222 (14.5%) |
| 65 to 74 Years | 1,323 (27.3%) | 1,660 (28.3%) |
| 75 Years and over | 1,344 (49.8%) | 1,664 (43.6%) |
Disability Class by Sex by Age in High Point
Disability Class: Hearing Difficulty
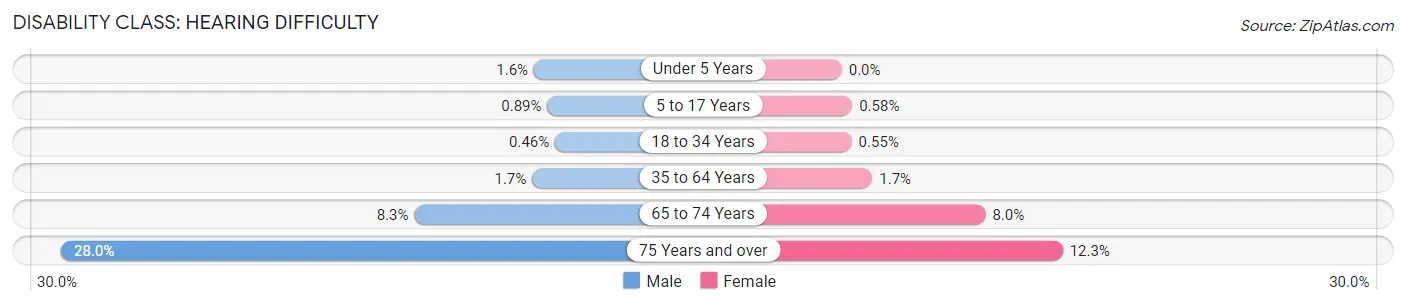
| Age Bracket | Male | Female |
| Under 5 Years | 61 (1.6%) | 0 (0.0%) |
| 5 to 17 Years | 83 (0.9%) | 52 (0.6%) |
| 18 to 34 Years | 64 (0.5%) | 75 (0.5%) |
| 35 to 64 Years | 350 (1.7%) | 377 (1.7%) |
| 65 to 74 Years | 403 (8.3%) | 469 (8.0%) |
| 75 Years and over | 754 (28.0%) | 469 (12.3%) |
Disability Class: Vision Difficulty
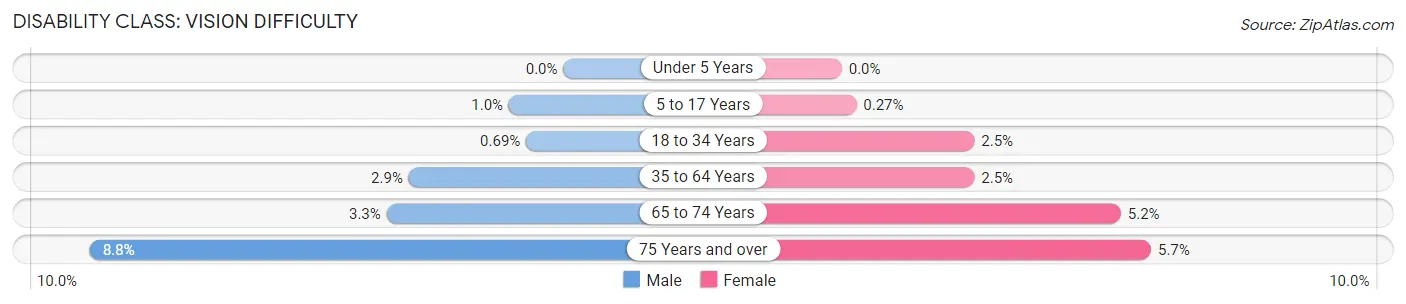
| Age Bracket | Male | Female |
| Under 5 Years | 0 (0.0%) | 0 (0.0%) |
| 5 to 17 Years | 95 (1.0%) | 24 (0.3%) |
| 18 to 34 Years | 97 (0.7%) | 339 (2.5%) |
| 35 to 64 Years | 577 (2.9%) | 545 (2.5%) |
| 65 to 74 Years | 159 (3.3%) | 304 (5.2%) |
| 75 Years and over | 237 (8.8%) | 219 (5.7%) |
Disability Class: Cognitive Difficulty
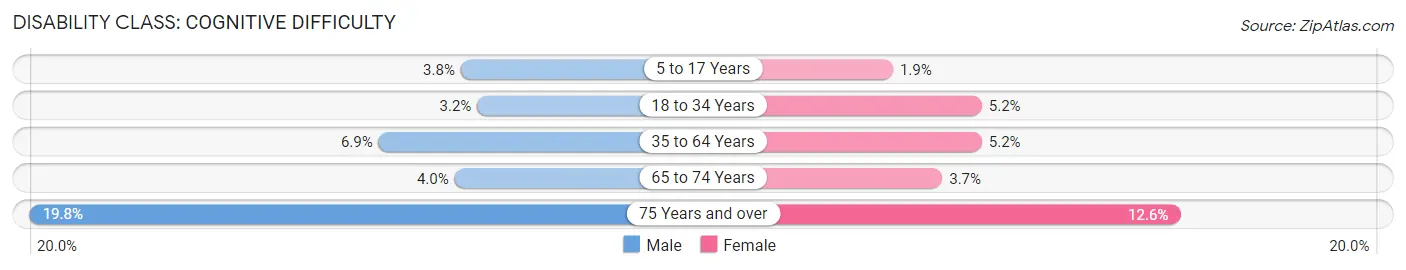
| Age Bracket | Male | Female |
| 5 to 17 Years | 357 (3.8%) | 171 (1.9%) |
| 18 to 34 Years | 450 (3.2%) | 715 (5.2%) |
| 35 to 64 Years | 1,378 (6.9%) | 1,152 (5.2%) |
| 65 to 74 Years | 196 (4.0%) | 219 (3.7%) |
| 75 Years and over | 534 (19.8%) | 479 (12.6%) |
Disability Class: Ambulatory Difficulty
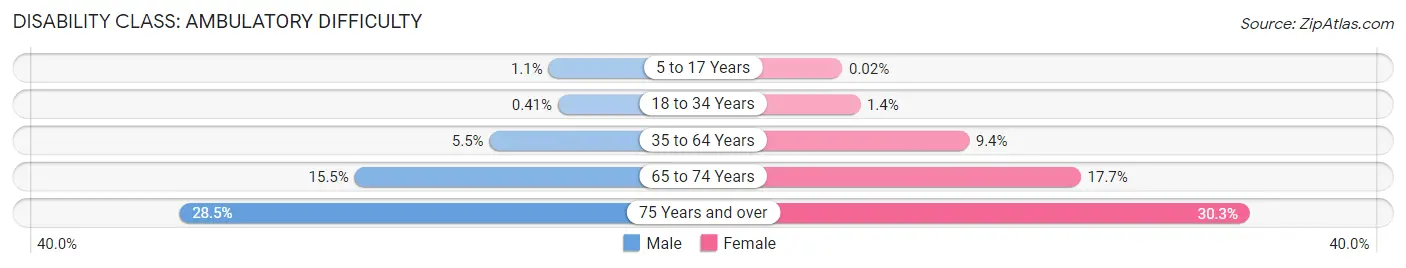
| Age Bracket | Male | Female |
| 5 to 17 Years | 103 (1.1%) | 2 (0.0%) |
| 18 to 34 Years | 57 (0.4%) | 185 (1.3%) |
| 35 to 64 Years | 1,102 (5.5%) | 2,089 (9.4%) |
| 65 to 74 Years | 752 (15.5%) | 1,040 (17.7%) |
| 75 Years and over | 769 (28.5%) | 1,155 (30.3%) |
Disability Class: Self-Care Difficulty
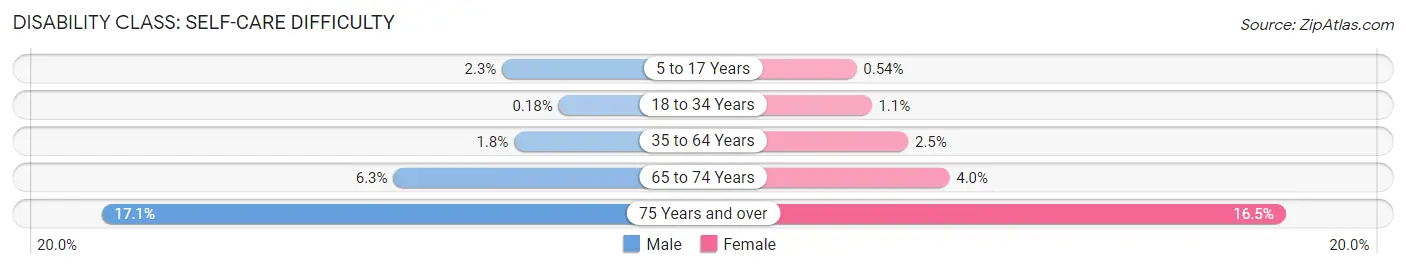
| Age Bracket | Male | Female |
| 5 to 17 Years | 213 (2.3%) | 49 (0.5%) |
| 18 to 34 Years | 25 (0.2%) | 151 (1.1%) |
| 35 to 64 Years | 367 (1.8%) | 544 (2.5%) |
| 65 to 74 Years | 306 (6.3%) | 234 (4.0%) |
| 75 Years and over | 462 (17.1%) | 628 (16.5%) |
Technology Access in High Point
Computing Device Access in High Point
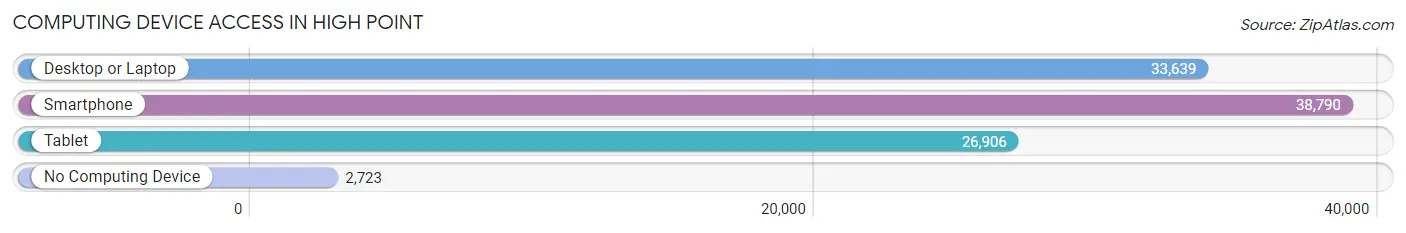
| Device Type | # Households | % Households |
| Desktop or Laptop | 33,639 | 76.4% |
| Smartphone | 38,790 | 88.1% |
| Tablet | 26,906 | 61.1% |
| No Computing Device | 2,723 | 6.2% |
| Total | 44,049 | 100.0% |
Internet Access in High Point
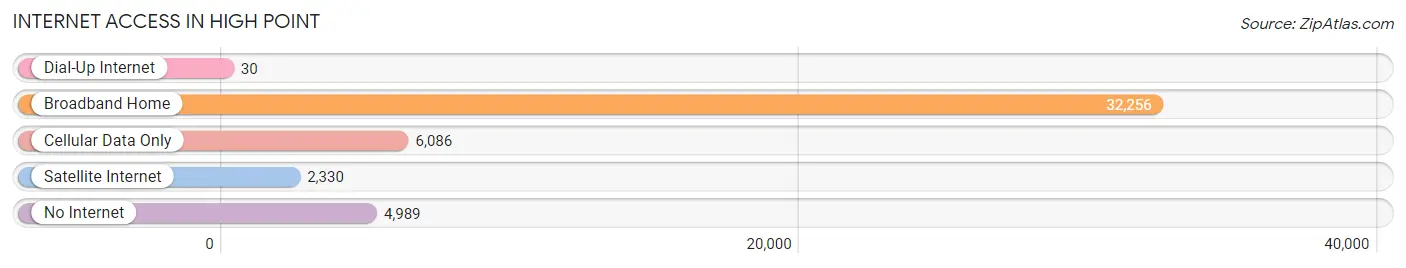
| Internet Type | # Households | % Households |
| Dial-Up Internet | 30 | 0.1% |
| Broadband Home | 32,256 | 73.2% |
| Cellular Data Only | 6,086 | 13.8% |
| Satellite Internet | 2,330 | 5.3% |
| No Internet | 4,989 | 11.3% |
| Total | 44,049 | 100.0% |
High Point Summary
High Point, North Carolina is a city located in the Piedmont Triad region of the state. It is the county seat of Guilford County and the principal city of the High Point Metropolitan Statistical Area. The city is known for its furniture, textiles, and bus manufacturing industries, as well as its high concentration of furniture outlets. High Point is also home to High Point University, a private liberal arts university.
History
High Point was first settled in 1750 by German and Quaker settlers. The town was originally known as “Stony Creek”, but was renamed “High Point” in 1859 due to its location at the highest point of the 1856 North Carolina Railroad. The city was officially incorporated in 1859.
High Point experienced rapid growth in the late 19th and early 20th centuries, due to its location at the intersection of several major railroads. The city became a major center for furniture manufacturing, and by the 1920s, it was known as the “Furniture Capital of the World”. The city’s population grew from 4,000 in 1900 to over 40,000 by 1950.
Geography
High Point is located in the Piedmont Triad region of North Carolina, at the intersection of Interstate 85 and US Highway 311. The city is situated at the highest point of the 1856 North Carolina Railroad, which runs through the city from north to south. High Point is located approximately 50 miles northeast of Charlotte and 80 miles west of Raleigh.
The city has a total area of 33.2 square miles, of which 32.9 square miles is land and 0.3 square miles is water. High Point is located in the Piedmont region of North Carolina, and is characterized by rolling hills and wooded areas. The city is located in the Yadkin-Pee Dee River Basin, and is drained by the Deep River and its tributaries.
Economy
High Point’s economy is largely based on its furniture and textile industries. The city is home to numerous furniture manufacturers, including Thomasville Furniture Industries, Inc., Klaussner Furniture Industries, Inc., and Bassett Furniture Industries, Inc. The city is also home to several textile mills, including Burlington Industries, Inc., and Cone Mills Corporation.
High Point is also home to several major retail outlets, including the High Point Furniture Outlet, the High Point Market, and the High Point Shopping Center. The city is also home to several corporate headquarters, including BB&T Corporation, Unifi, Inc., and Syngenta Crop Protection.
Demographics
As of the 2010 census, High Point had a population of 104,371. The city’s population is racially diverse, with the largest racial group being White (63.2%), followed by African American (25.2%), Hispanic or Latino (7.2%), and Asian (2.3%).
High Point has a median household income of $41,945, and a poverty rate of 17.2%. The city’s unemployment rate is 5.2%, which is lower than the national average. The city’s largest employers are High Point University, Thomasville Furniture Industries, Inc., and Klaussner Furniture Industries, Inc.
Common Questions
What is Per Capita Income in High Point?
Per Capita income in High Point is $33,222.
What is the Median Family Income in High Point?
Median Family Income in High Point is $76,644.
What is the Median Household income in High Point?
Median Household Income in High Point is $58,582.
What is Income or Wage Gap in High Point?
Income or Wage Gap in High Point is 21.9%.
Women in High Point earn 78.1 cents for every dollar earned by a man.
What is Family Income Deficit in High Point?
Family Income Deficit in High Point is $11,471.
Families that are below poverty line in High Point earn $11,471 less on average than the poverty threshold level.
What is Inequality or Gini Index in High Point?
Inequality or Gini Index in High Point is 0.47.
What is the Total Population of High Point?
Total Population of High Point is 114,120.
What is the Total Male Population of High Point?
Total Male Population of High Point is 55,324.
What is the Total Female Population of High Point?
Total Female Population of High Point is 58,796.
What is the Ratio of Males per 100 Females in High Point?
There are 94.09 Males per 100 Females in High Point.
What is the Ratio of Females per 100 Males in High Point?
There are 106.28 Females per 100 Males in High Point.
What is the Median Population Age in High Point?
Median Population Age in High Point is 37.7 Years.
What is the Average Family Size in High Point
Average Family Size in High Point is 3.1 People.
What is the Average Household Size in High Point
Average Household Size in High Point is 2.5 People.
How Large is the Labor Force in High Point?
There are 57,106 People in the Labor Forcein in High Point.
What is the Percentage of People in the Labor Force in High Point?
62.6% of People are in the Labor Force in High Point.
What is the Unemployment Rate in High Point?
Unemployment Rate in High Point is 6.2%.