Brook Park, OH Map & Demographics
Brook Park Map
Brook Park Overview
$31,746
PER CAPITA INCOME
$74,297
AVG FAMILY INCOME
$64,046
AVG HOUSEHOLD INCOME
21.8%
WAGE / INCOME GAP [ % ]
78.2¢/ $1
WAGE / INCOME GAP [ $ ]
$10,047
FAMILY INCOME DEFICIT
0.36
INEQUALITY / GINI INDEX
18,509
TOTAL POPULATION
9,103
MALE POPULATION
9,406
FEMALE POPULATION
96.78
MALES / 100 FEMALES
103.33
FEMALES / 100 MALES
42.8
MEDIAN AGE
3.0
AVG FAMILY SIZE
2.4
AVG HOUSEHOLD SIZE
9,594
LABOR FORCE [ PEOPLE ]
62.9%
PERCENT IN LABOR FORCE
5.3%
UNEMPLOYMENT RATE
Income in Brook Park
Income Overview in Brook Park
Per Capita Income in Brook Park is $31,746, while median incomes of families and households are $74,297 and $64,046 respectively.
| Characteristic | Number | Measure |
| Per Capita Income | 18,509 | $31,746 |
| Median Family Income | 4,828 | $74,297 |
| Mean Family Income | 4,828 | $85,874 |
| Median Household Income | 7,809 | $64,046 |
| Mean Household Income | 7,809 | $73,804 |
| Income Deficit | 4,828 | $10,047 |
| Wage / Income Gap (%) | 18,509 | 21.80% |
| Wage / Income Gap ($) | 18,509 | 78.20¢ per $1 |
| Gini / Inequality Index | 18,509 | 0.36 |
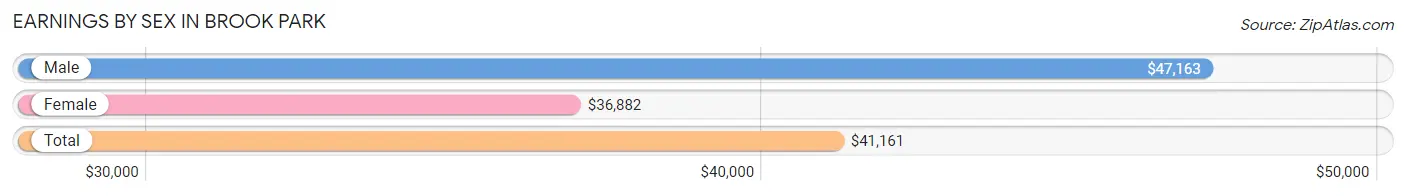
Earnings by Sex in Brook Park
Average Earnings in Brook Park are $41,161, $47,163 for men and $36,882 for women, a difference of 21.8%.
| Sex | Number | Average Earnings |
| Male | 5,173 (51.7%) | $47,163 |
| Female | 4,837 (48.3%) | $36,882 |
| Total | 10,010 (100.0%) | $41,161 |
Earnings by Sex by Income Bracket in Brook Park
The most common earnings brackets in Brook Park are $75,000 to $99,999 for men (748 | 14.5%) and $35,000 to $39,999 for women (460 | 9.5%).
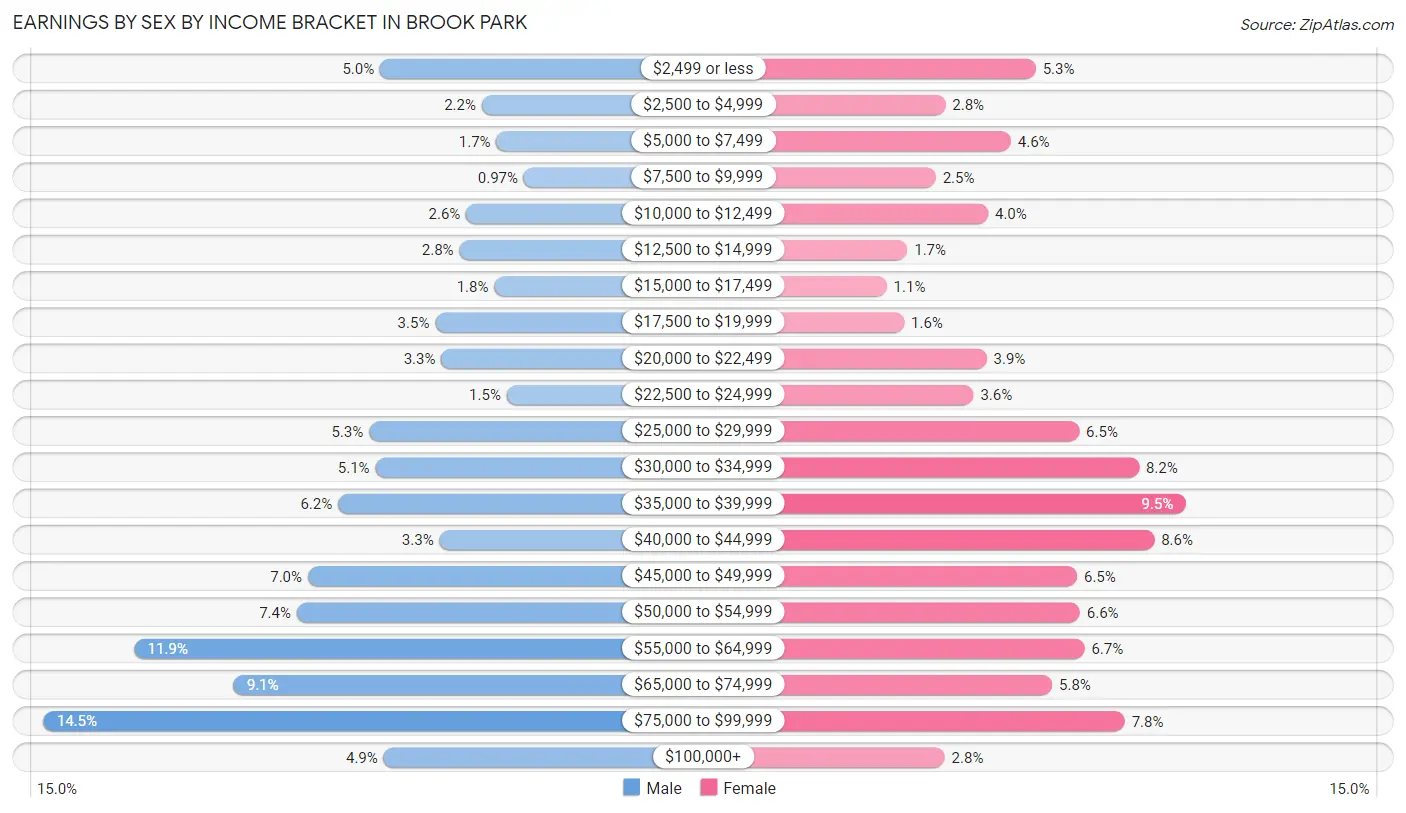
| Income | Male | Female |
| $2,499 or less | 259 (5.0%) | 257 (5.3%) |
| $2,500 to $4,999 | 111 (2.1%) | 134 (2.8%) |
| $5,000 to $7,499 | 90 (1.7%) | 223 (4.6%) |
| $7,500 to $9,999 | 50 (1.0%) | 121 (2.5%) |
| $10,000 to $12,499 | 134 (2.6%) | 192 (4.0%) |
| $12,500 to $14,999 | 144 (2.8%) | 82 (1.7%) |
| $15,000 to $17,499 | 93 (1.8%) | 54 (1.1%) |
| $17,500 to $19,999 | 179 (3.5%) | 78 (1.6%) |
| $20,000 to $22,499 | 170 (3.3%) | 190 (3.9%) |
| $22,500 to $24,999 | 75 (1.5%) | 172 (3.6%) |
| $25,000 to $29,999 | 275 (5.3%) | 316 (6.5%) |
| $30,000 to $34,999 | 266 (5.1%) | 397 (8.2%) |
| $35,000 to $39,999 | 320 (6.2%) | 460 (9.5%) |
| $40,000 to $44,999 | 173 (3.3%) | 418 (8.6%) |
| $45,000 to $49,999 | 364 (7.0%) | 313 (6.5%) |
| $50,000 to $54,999 | 380 (7.3%) | 317 (6.6%) |
| $55,000 to $64,999 | 616 (11.9%) | 323 (6.7%) |
| $65,000 to $74,999 | 472 (9.1%) | 279 (5.8%) |
| $75,000 to $99,999 | 748 (14.5%) | 378 (7.8%) |
| $100,000+ | 254 (4.9%) | 133 (2.8%) |
| Total | 5,173 (100.0%) | 4,837 (100.0%) |
Earnings by Sex by Educational Attainment in Brook Park
Average earnings in Brook Park are $52,691 for men and $38,668 for women, a difference of 26.6%. Men with an educational attainment of graduate degree enjoy the highest average annual earnings of $70,313, while those with less than high school education earn the least with $50,500. Women with an educational attainment of graduate degree earn the most with the average annual earnings of $60,060, while those with less than high school education have the smallest earnings of $28,378.
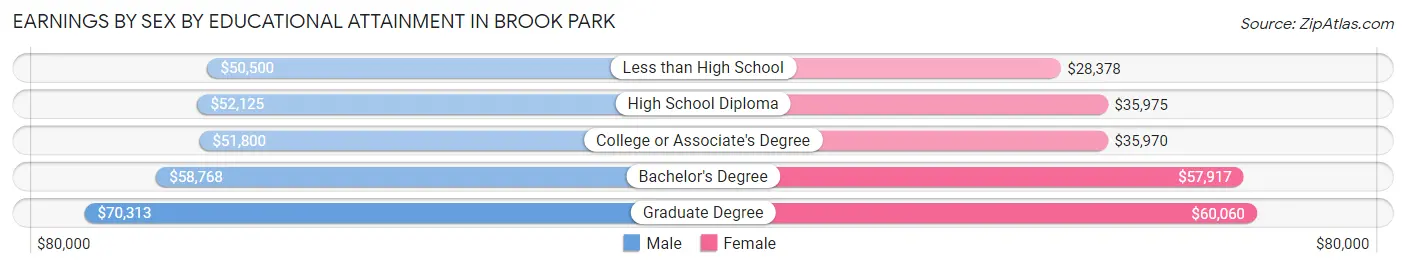
| Educational Attainment | Male Income | Female Income |
| Less than High School | $50,500 | $28,378 |
| High School Diploma | $52,125 | $35,975 |
| College or Associate's Degree | $51,800 | $35,970 |
| Bachelor's Degree | $58,768 | $57,917 |
| Graduate Degree | $70,313 | $60,060 |
| Total | $52,691 | $38,668 |
Family Income in Brook Park
Family Income Brackets in Brook Park
According to the Brook Park family income data, there are 1,386 families falling into the $50,000 to $74,999 income range, which is the most common income bracket and makes up 28.7% of all families. Conversely, the $10,000 to $14,999 income bracket is the least frequent group with only 53 families (1.1%) belonging to this category.
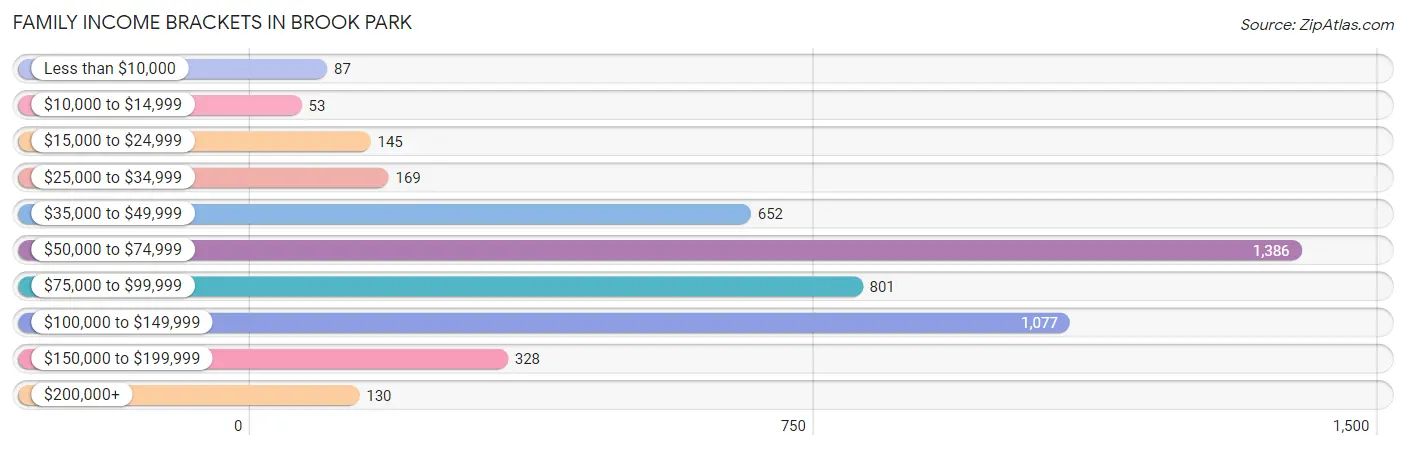
| Income Bracket | # Families | % Families |
| Less than $10,000 | 87 | 1.8% |
| $10,000 to $14,999 | 53 | 1.1% |
| $15,000 to $24,999 | 145 | 3.0% |
| $25,000 to $34,999 | 169 | 3.5% |
| $35,000 to $49,999 | 652 | 13.5% |
| $50,000 to $74,999 | 1,386 | 28.7% |
| $75,000 to $99,999 | 801 | 16.6% |
| $100,000 to $149,999 | 1,077 | 22.3% |
| $150,000 to $199,999 | 328 | 6.8% |
| $200,000+ | 130 | 2.7% |
Family Income by Famaliy Size in Brook Park
7+ person families (78 | 1.6%) account for the highest median family income in Brook Park with $147,949 per family, while 2-person families (2,280 | 47.2%) have the highest median income of $33,199 per family member.
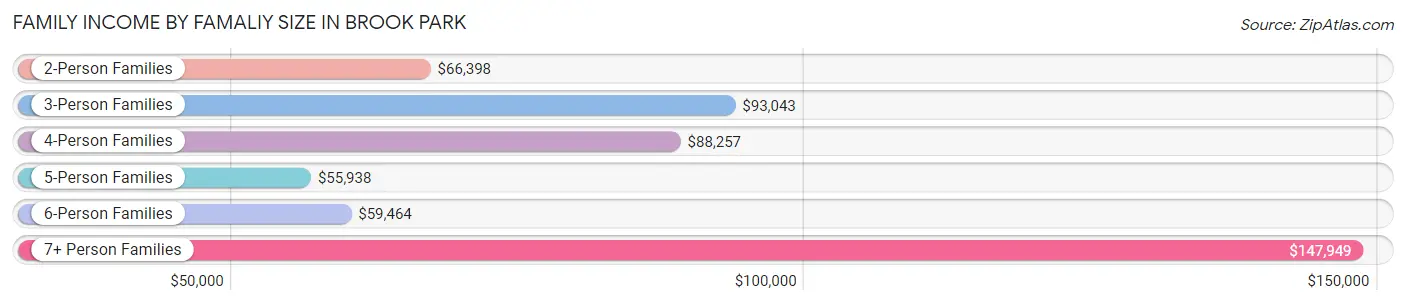
| Income Bracket | # Families | Median Income |
| 2-Person Families | 2,280 (47.2%) | $66,398 |
| 3-Person Families | 1,266 (26.2%) | $93,043 |
| 4-Person Families | 873 (18.1%) | $88,257 |
| 5-Person Families | 308 (6.4%) | $55,938 |
| 6-Person Families | 23 (0.5%) | $59,464 |
| 7+ Person Families | 78 (1.6%) | $147,949 |
| Total | 4,828 (100.0%) | $74,297 |
Family Income by Number of Earners in Brook Park
The median family income in Brook Park is $74,297, with families comprising 3+ earners (523) having the highest median family income of $137,396, while families with no earners (674) have the lowest median family income of $53,779, accounting for 10.8% and 14.0% of families, respectively.
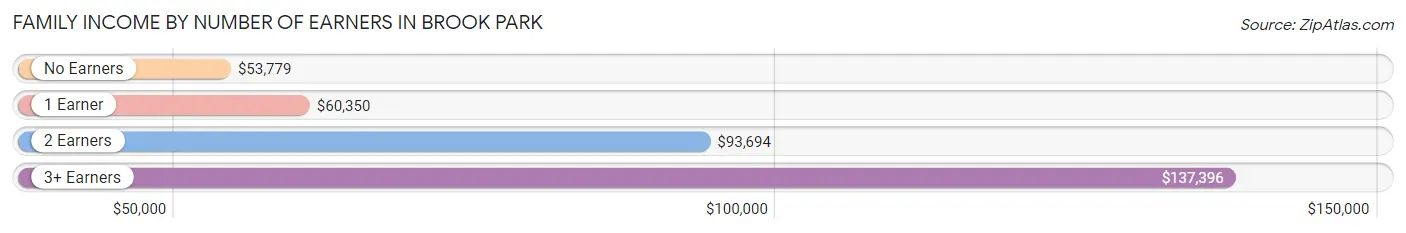
| Number of Earners | # Families | Median Income |
| No Earners | 674 (14.0%) | $53,779 |
| 1 Earner | 1,695 (35.1%) | $60,350 |
| 2 Earners | 1,936 (40.1%) | $93,694 |
| 3+ Earners | 523 (10.8%) | $137,396 |
| Total | 4,828 (100.0%) | $74,297 |
Household Income in Brook Park
Household Income Brackets in Brook Park
With 1,882 households falling in the category, the $50,000 to $74,999 income range is the most frequent in Brook Park, accounting for 24.1% of all households. In contrast, only 172 households (2.2%) fall into the $200,000+ income bracket, making it the least populous group.
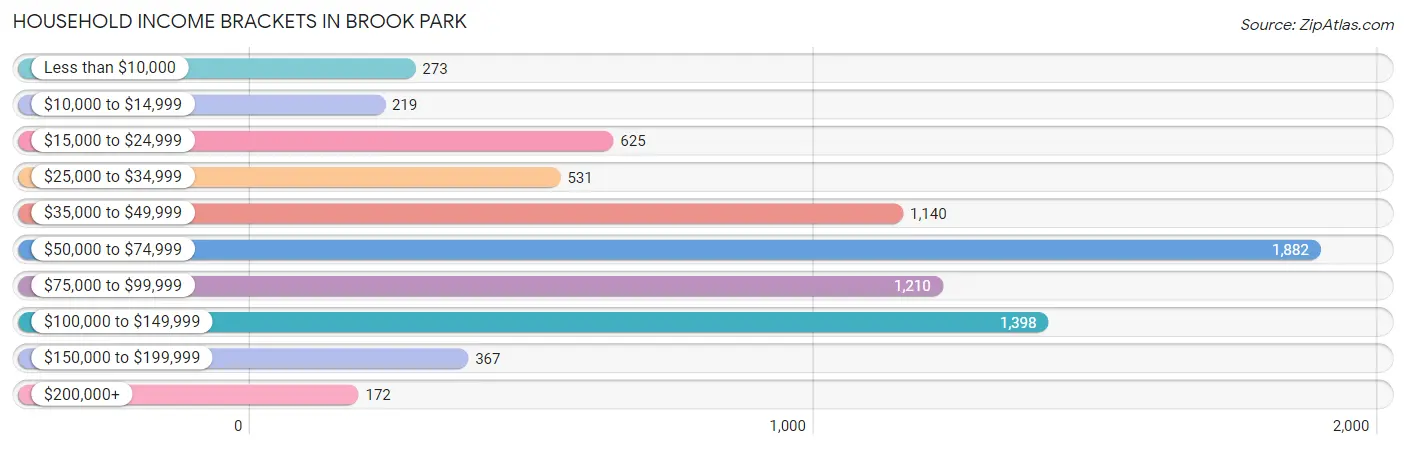
| Income Bracket | # Households | % Households |
| Less than $10,000 | 273 | 3.5% |
| $10,000 to $14,999 | 219 | 2.8% |
| $15,000 to $24,999 | 625 | 8.0% |
| $25,000 to $34,999 | 531 | 6.8% |
| $35,000 to $49,999 | 1,140 | 14.6% |
| $50,000 to $74,999 | 1,882 | 24.1% |
| $75,000 to $99,999 | 1,210 | 15.5% |
| $100,000 to $149,999 | 1,398 | 17.9% |
| $150,000 to $199,999 | 367 | 4.7% |
| $200,000+ | 172 | 2.2% |
Household Income by Householder Age in Brook Park
The median household income in Brook Park is $64,046, with the highest median household income of $85,990 found in the 15 to 24 years age bracket for the primary householder. A total of 129 households (1.7%) fall into this category. Meanwhile, the 65+ years age bracket for the primary householder has the lowest median household income of $45,648, with 2,674 households (34.2%) in this group.
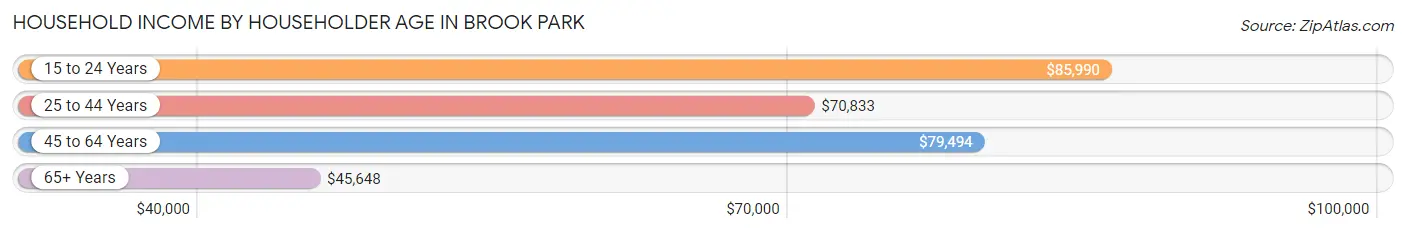
| Income Bracket | # Households | Median Income |
| 15 to 24 Years | 129 (1.7%) | $85,990 |
| 25 to 44 Years | 2,236 (28.6%) | $70,833 |
| 45 to 64 Years | 2,770 (35.5%) | $79,494 |
| 65+ Years | 2,674 (34.2%) | $45,648 |
| Total | 7,809 (100.0%) | $64,046 |
Poverty in Brook Park
Income Below Poverty by Sex and Age in Brook Park
With 7.3% poverty level for males and 9.5% for females among the residents of Brook Park, under 5 year old males and 25 to 34 year old females are the most vulnerable to poverty, with 160 males (24.1%) and 186 females (15.1%) in their respective age groups living below the poverty level.
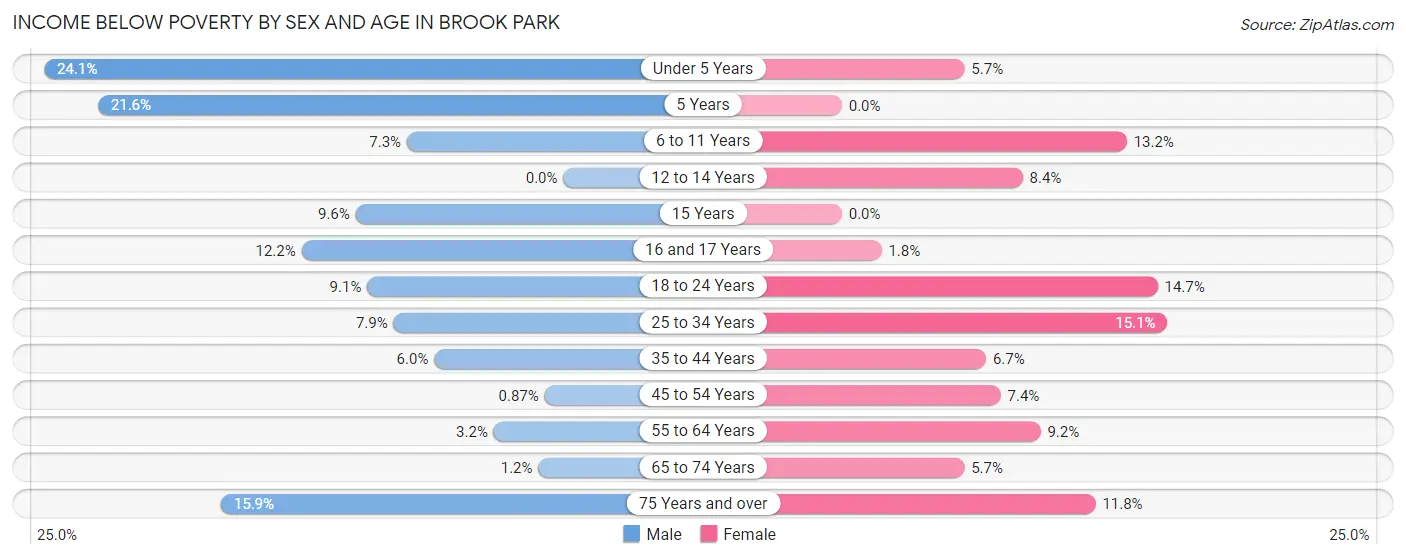
| Age Bracket | Male | Female |
| Under 5 Years | 160 (24.1%) | 41 (5.7%) |
| 5 Years | 27 (21.6%) | 0 (0.0%) |
| 6 to 11 Years | 34 (7.3%) | 80 (13.2%) |
| 12 to 14 Years | 0 (0.0%) | 12 (8.4%) |
| 15 Years | 8 (9.6%) | 0 (0.0%) |
| 16 and 17 Years | 22 (12.1%) | 3 (1.8%) |
| 18 to 24 Years | 60 (9.1%) | 91 (14.6%) |
| 25 to 34 Years | 121 (7.9%) | 186 (15.1%) |
| 35 to 44 Years | 49 (6.0%) | 78 (6.7%) |
| 45 to 54 Years | 9 (0.9%) | 71 (7.4%) |
| 55 to 64 Years | 46 (3.2%) | 145 (9.2%) |
| 65 to 74 Years | 12 (1.2%) | 53 (5.7%) |
| 75 Years and over | 116 (15.9%) | 133 (11.8%) |
| Total | 664 (7.3%) | 893 (9.5%) |
Income Above Poverty by Sex and Age in Brook Park
According to the poverty statistics in Brook Park, males aged 12 to 14 years and females aged 5 years are the age groups that are most secure financially, with 100.0% of males and 100.0% of females in these age groups living above the poverty line.
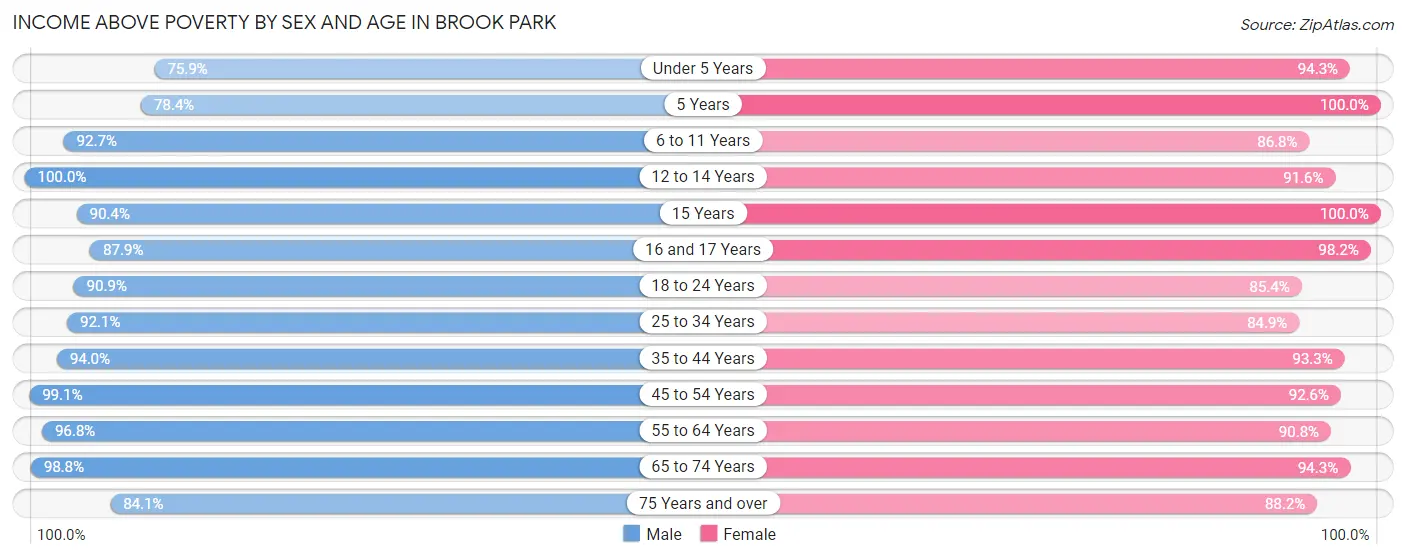
| Age Bracket | Male | Female |
| Under 5 Years | 504 (75.9%) | 680 (94.3%) |
| 5 Years | 98 (78.4%) | 18 (100.0%) |
| 6 to 11 Years | 434 (92.7%) | 525 (86.8%) |
| 12 to 14 Years | 305 (100.0%) | 131 (91.6%) |
| 15 Years | 75 (90.4%) | 104 (100.0%) |
| 16 and 17 Years | 159 (87.8%) | 160 (98.2%) |
| 18 to 24 Years | 599 (90.9%) | 530 (85.4%) |
| 25 to 34 Years | 1,414 (92.1%) | 1,045 (84.9%) |
| 35 to 44 Years | 769 (94.0%) | 1,088 (93.3%) |
| 45 to 54 Years | 1,023 (99.1%) | 892 (92.6%) |
| 55 to 64 Years | 1,376 (96.8%) | 1,427 (90.8%) |
| 65 to 74 Years | 1,022 (98.8%) | 880 (94.3%) |
| 75 Years and over | 614 (84.1%) | 997 (88.2%) |
| Total | 8,392 (92.7%) | 8,477 (90.5%) |
Income Below Poverty Among Married-Couple Families in Brook Park
The poverty statistics for married-couple families in Brook Park show that 1.9% or 64 of the total 3,347 families live below the poverty line. Families with 3 or 4 children have the highest poverty rate of 7.8%, comprising of 8 families. On the other hand, families with 5 or more children have the lowest poverty rate of 0.0%, which includes 0 families.
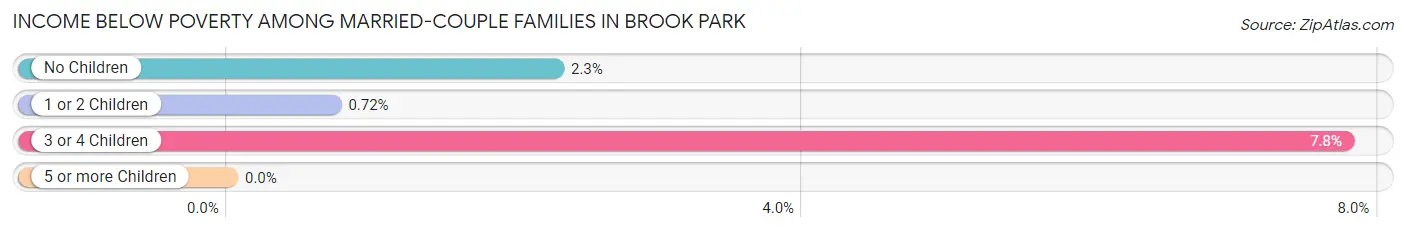
| Children | Above Poverty | Below Poverty |
| No Children | 2,066 (97.7%) | 48 (2.3%) |
| 1 or 2 Children | 1,102 (99.3%) | 8 (0.7%) |
| 3 or 4 Children | 95 (92.2%) | 8 (7.8%) |
| 5 or more Children | 20 (100.0%) | 0 (0.0%) |
| Total | 3,283 (98.1%) | 64 (1.9%) |
Income Below Poverty Among Single-Parent Households in Brook Park
According to the poverty data in Brook Park, 12.4% or 50 single-father households and 15.4% or 166 single-mother households are living below the poverty line. Among single-father households, those with 1 or 2 children have the highest poverty rate, with 50 households (41.0%) experiencing poverty. Likewise, among single-mother households, those with 3 or 4 children have the highest poverty rate, with 77 households (56.2%) falling below the poverty line.
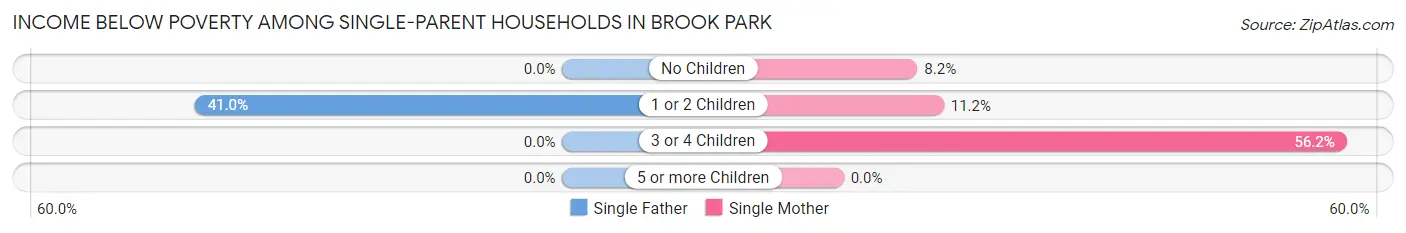
| Children | Single Father | Single Mother |
| No Children | 0 (0.0%) | 44 (8.2%) |
| 1 or 2 Children | 50 (41.0%) | 45 (11.2%) |
| 3 or 4 Children | 0 (0.0%) | 77 (56.2%) |
| 5 or more Children | 0 (0.0%) | 0 (0.0%) |
| Total | 50 (12.4%) | 166 (15.4%) |
Income Below Poverty Among Married-Couple vs Single-Parent Households in Brook Park
The poverty data for Brook Park shows that 64 of the married-couple family households (1.9%) and 216 of the single-parent households (14.6%) are living below the poverty level. Within the married-couple family households, those with 3 or 4 children have the highest poverty rate, with 8 households (7.8%) falling below the poverty line. Among the single-parent households, those with 3 or 4 children have the highest poverty rate, with 77 household (56.2%) living below poverty.
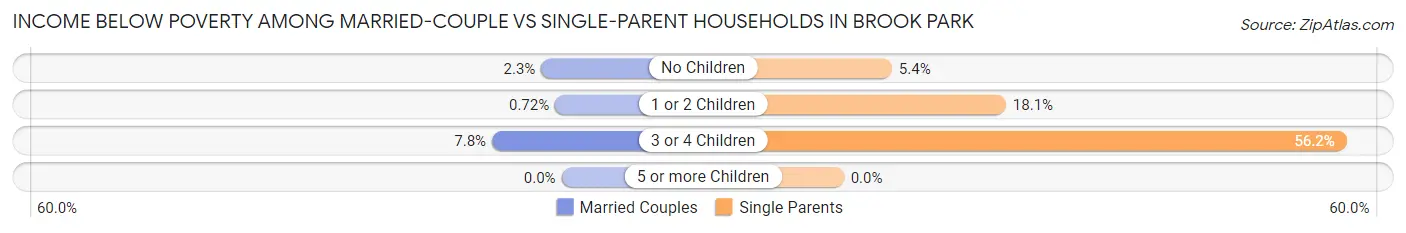
| Children | Married-Couple Families | Single-Parent Households |
| No Children | 48 (2.3%) | 44 (5.4%) |
| 1 or 2 Children | 8 (0.7%) | 95 (18.1%) |
| 3 or 4 Children | 8 (7.8%) | 77 (56.2%) |
| 5 or more Children | 0 (0.0%) | 0 (0.0%) |
| Total | 64 (1.9%) | 216 (14.6%) |
Race in Brook Park
The most populous races in Brook Park are White / Caucasian (15,417 | 83.3%), Hispanic or Latino (1,242 | 6.7%), and Two or more Races (1,158 | 6.3%).
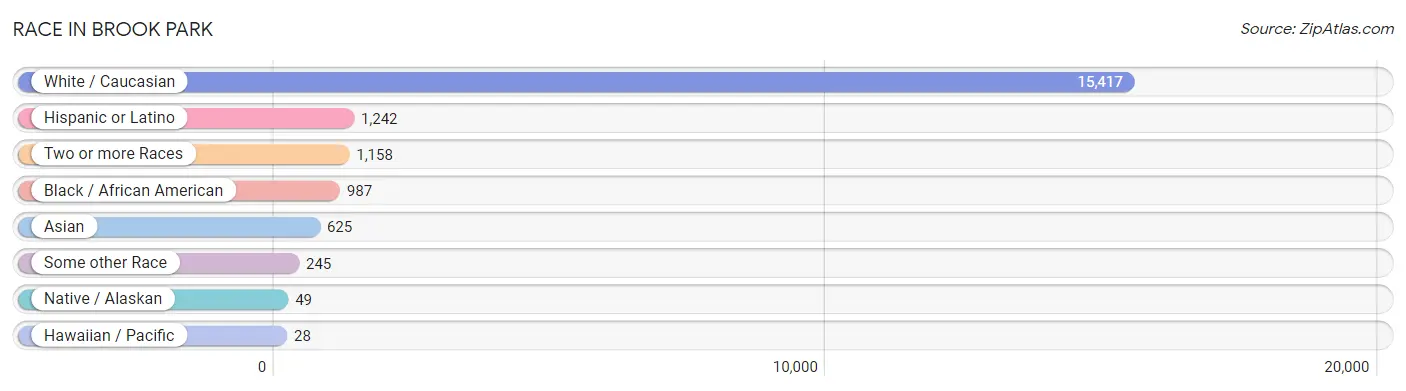
| Race | # Population | % Population |
| Asian | 625 | 3.4% |
| Black / African American | 987 | 5.3% |
| Hawaiian / Pacific | 28 | 0.2% |
| Hispanic or Latino | 1,242 | 6.7% |
| Native / Alaskan | 49 | 0.3% |
| White / Caucasian | 15,417 | 83.3% |
| Two or more Races | 1,158 | 6.3% |
| Some other Race | 245 | 1.3% |
| Total | 18,509 | 100.0% |
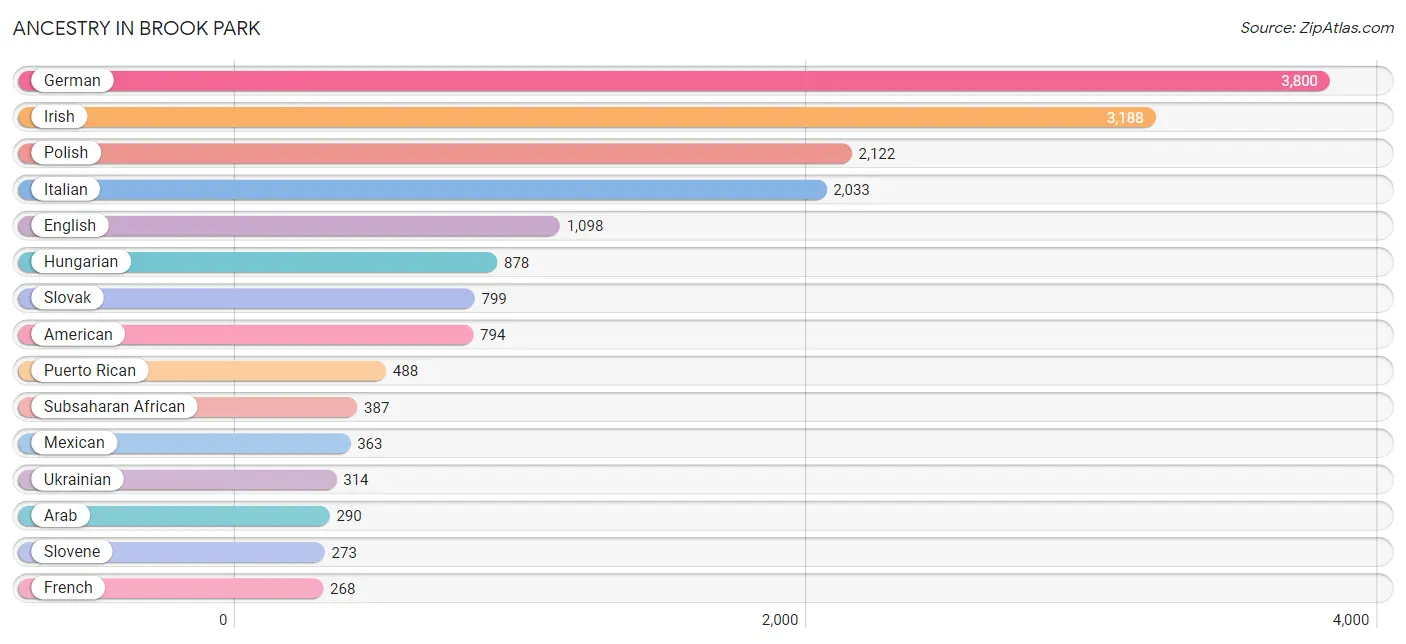
Ancestry in Brook Park
The most populous ancestries reported in Brook Park are German (3,800 | 20.5%), Irish (3,188 | 17.2%), Polish (2,122 | 11.5%), Italian (2,033 | 11.0%), and English (1,098 | 5.9%), together accounting for 66.1% of all Brook Park residents.
| Ancestry | # Population | % Population |
| African | 174 | 0.9% |
| American | 794 | 4.3% |
| Arab | 290 | 1.6% |
| Argentinean | 71 | 0.4% |
| Austrian | 8 | 0.0% |
| Belgian | 19 | 0.1% |
| Bhutanese | 50 | 0.3% |
| Blackfeet | 55 | 0.3% |
| British | 31 | 0.2% |
| Burmese | 71 | 0.4% |
| Cajun | 40 | 0.2% |
| Canadian | 13 | 0.1% |
| Carpatho Rusyn | 7 | 0.0% |
| Central American | 118 | 0.6% |
| Central American Indian | 40 | 0.2% |
| Cherokee | 58 | 0.3% |
| Chilean | 11 | 0.1% |
| Chippewa | 26 | 0.1% |
| Choctaw | 5 | 0.0% |
| Croatian | 73 | 0.4% |
| Cuban | 48 | 0.3% |
| Czech | 208 | 1.1% |
| Czechoslovakian | 70 | 0.4% |
| Danish | 53 | 0.3% |
| Dutch | 210 | 1.1% |
| Eastern European | 19 | 0.1% |
| Ecuadorian | 24 | 0.1% |
| Egyptian | 6 | 0.0% |
| English | 1,098 | 5.9% |
| European | 50 | 0.3% |
| Finnish | 11 | 0.1% |
| French | 268 | 1.5% |
| French Canadian | 43 | 0.2% |
| German | 3,800 | 20.5% |
| Greek | 245 | 1.3% |
| Hungarian | 878 | 4.7% |
| Indian (Asian) | 128 | 0.7% |
| Irish | 3,188 | 17.2% |
| Italian | 2,033 | 11.0% |
| Kenyan | 5 | 0.0% |
| Korean | 36 | 0.2% |
| Latvian | 15 | 0.1% |
| Lebanese | 183 | 1.0% |
| Lithuanian | 36 | 0.2% |
| Macedonian | 6 | 0.0% |
| Mexican | 363 | 2.0% |
| Native Hawaiian | 5 | 0.0% |
| Nigerian | 25 | 0.1% |
| Northern European | 8 | 0.0% |
| Norwegian | 11 | 0.1% |
| Pakistani | 8 | 0.0% |
| Panamanian | 36 | 0.2% |
| Polish | 2,122 | 11.5% |
| Portuguese | 15 | 0.1% |
| Puerto Rican | 488 | 2.6% |
| Romanian | 100 | 0.5% |
| Russian | 198 | 1.1% |
| Salvadoran | 82 | 0.4% |
| Scotch-Irish | 63 | 0.3% |
| Scottish | 120 | 0.6% |
| Serbian | 21 | 0.1% |
| Slavic | 14 | 0.1% |
| Slovak | 799 | 4.3% |
| Slovene | 273 | 1.5% |
| South American | 106 | 0.6% |
| Spaniard | 77 | 0.4% |
| Spanish | 9 | 0.1% |
| Subsaharan African | 387 | 2.1% |
| Swedish | 103 | 0.6% |
| Syrian | 83 | 0.4% |
| Thai | 10 | 0.1% |
| U.S. Virgin Islander | 17 | 0.1% |
| Ukrainian | 314 | 1.7% |
| Welsh | 163 | 0.9% |
| West Indian | 18 | 0.1% |
| Yugoslavian | 8 | 0.0% | View All 76 Rows |
Immigrants in Brook Park
The most numerous immigrant groups reported in Brook Park came from Asia (533 | 2.9%), South Central Asia (304 | 1.6%), Europe (294 | 1.6%), Africa (152 | 0.8%), and Middle Africa (137 | 0.7%), together accounting for 7.7% of all Brook Park residents.
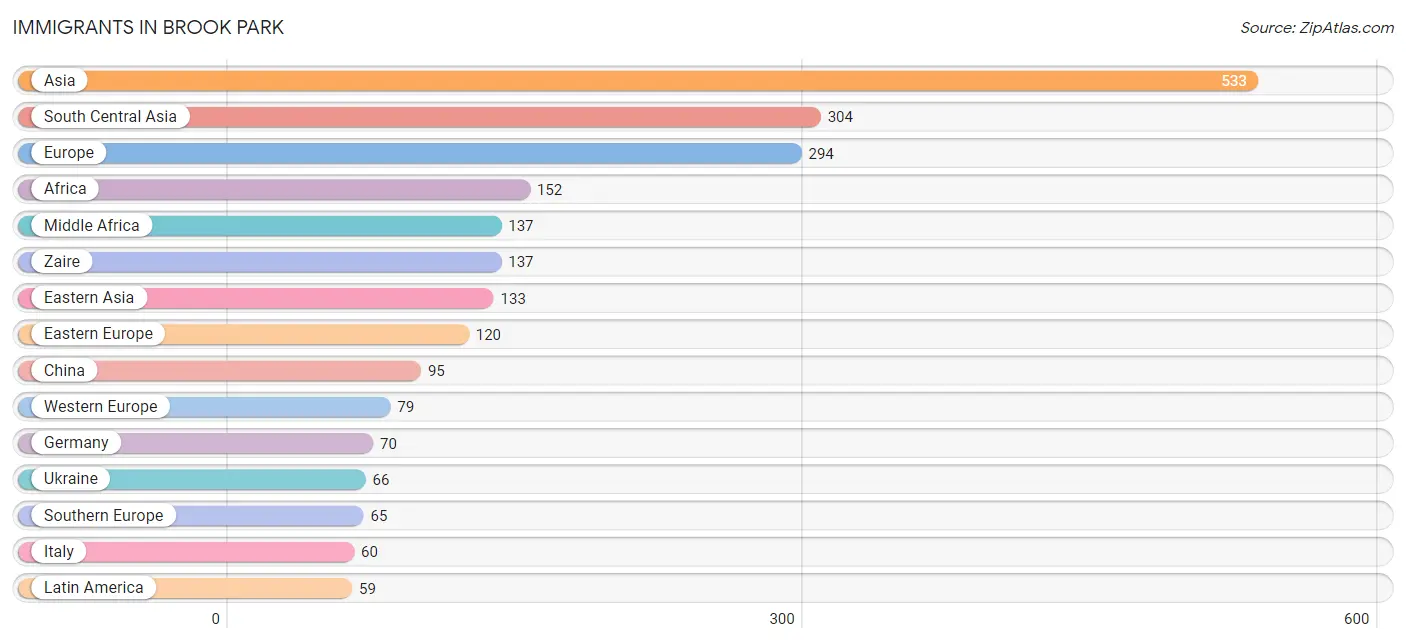
| Immigration Origin | # Population | % Population |
| Africa | 152 | 0.8% |
| Asia | 533 | 2.9% |
| Austria | 9 | 0.1% |
| Canada | 15 | 0.1% |
| Caribbean | 18 | 0.1% |
| Central America | 7 | 0.0% |
| China | 95 | 0.5% |
| Cuba | 18 | 0.1% |
| Eastern Asia | 133 | 0.7% |
| Eastern Europe | 120 | 0.6% |
| Ecuador | 24 | 0.1% |
| Egypt | 15 | 0.1% |
| El Salvador | 7 | 0.0% |
| England | 16 | 0.1% |
| Europe | 294 | 1.6% |
| Germany | 70 | 0.4% |
| Greece | 5 | 0.0% |
| Guyana | 10 | 0.1% |
| Hungary | 21 | 0.1% |
| Ireland | 14 | 0.1% |
| Italy | 60 | 0.3% |
| Jordan | 7 | 0.0% |
| Kazakhstan | 3 | 0.0% |
| Korea | 38 | 0.2% |
| Latin America | 59 | 0.3% |
| Middle Africa | 137 | 0.7% |
| Nepal | 6 | 0.0% |
| North Macedonia | 6 | 0.0% |
| Northern Africa | 15 | 0.1% |
| Northern Europe | 30 | 0.2% |
| Philippines | 20 | 0.1% |
| Romania | 10 | 0.1% |
| South America | 34 | 0.2% |
| South Central Asia | 304 | 1.6% |
| South Eastern Asia | 39 | 0.2% |
| Southern Europe | 65 | 0.4% |
| Syria | 50 | 0.3% |
| Thailand | 8 | 0.0% |
| Ukraine | 66 | 0.4% |
| Vietnam | 11 | 0.1% |
| Western Asia | 57 | 0.3% |
| Western Europe | 79 | 0.4% |
| Zaire | 137 | 0.7% | View All 43 Rows |
Sex and Age in Brook Park
Sex and Age in Brook Park
The most populous age groups in Brook Park are 25 to 29 Years (905 | 9.9%) for men and 55 to 59 Years (1,006 | 10.7%) for women.
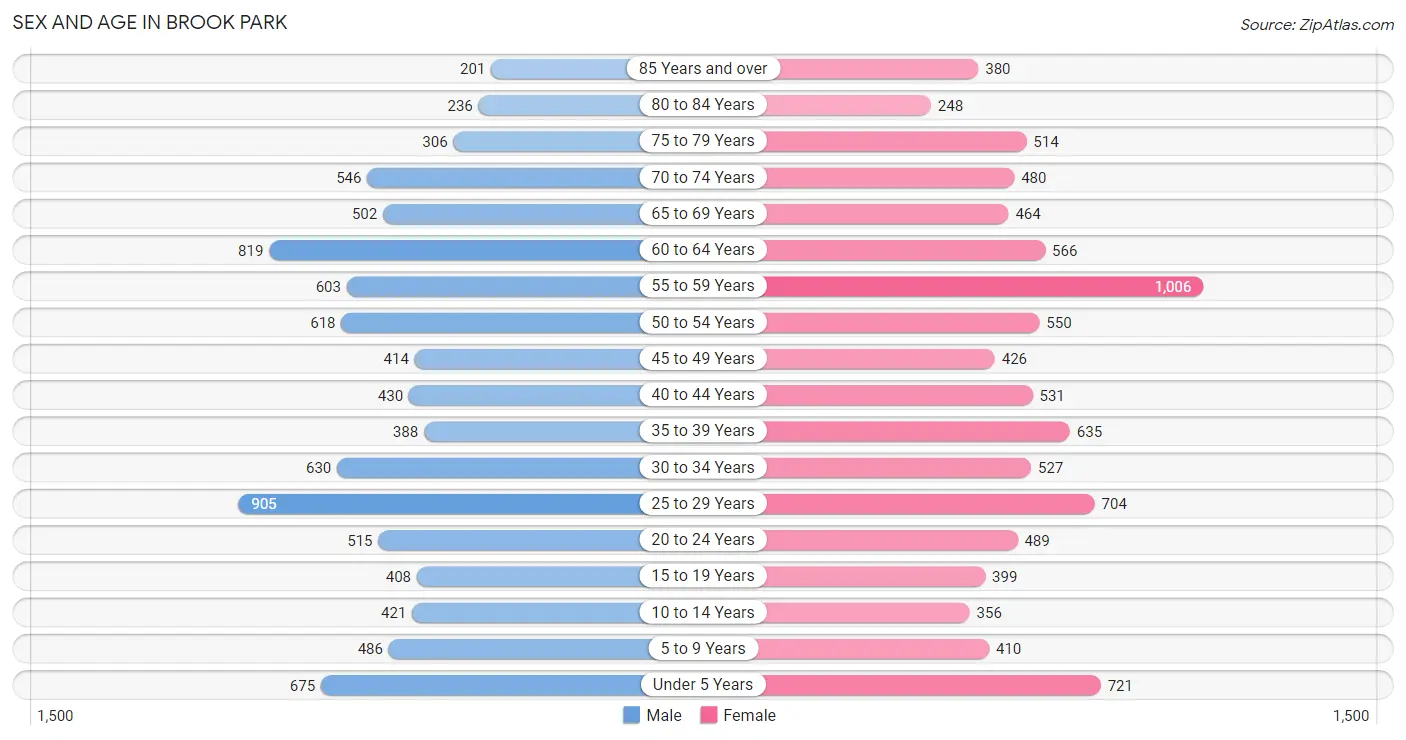
| Age Bracket | Male | Female |
| Under 5 Years | 675 (7.4%) | 721 (7.7%) |
| 5 to 9 Years | 486 (5.3%) | 410 (4.4%) |
| 10 to 14 Years | 421 (4.6%) | 356 (3.8%) |
| 15 to 19 Years | 408 (4.5%) | 399 (4.2%) |
| 20 to 24 Years | 515 (5.7%) | 489 (5.2%) |
| 25 to 29 Years | 905 (9.9%) | 704 (7.5%) |
| 30 to 34 Years | 630 (6.9%) | 527 (5.6%) |
| 35 to 39 Years | 388 (4.3%) | 635 (6.8%) |
| 40 to 44 Years | 430 (4.7%) | 531 (5.7%) |
| 45 to 49 Years | 414 (4.5%) | 426 (4.5%) |
| 50 to 54 Years | 618 (6.8%) | 550 (5.9%) |
| 55 to 59 Years | 603 (6.6%) | 1,006 (10.7%) |
| 60 to 64 Years | 819 (9.0%) | 566 (6.0%) |
| 65 to 69 Years | 502 (5.5%) | 464 (4.9%) |
| 70 to 74 Years | 546 (6.0%) | 480 (5.1%) |
| 75 to 79 Years | 306 (3.4%) | 514 (5.5%) |
| 80 to 84 Years | 236 (2.6%) | 248 (2.6%) |
| 85 Years and over | 201 (2.2%) | 380 (4.0%) |
| Total | 9,103 (100.0%) | 9,406 (100.0%) |
Families and Households in Brook Park
Median Family Size in Brook Park
The median family size in Brook Park is 3.03 persons per family, with married-couple families (3,347 | 69.3%) accounting for the largest median family size of 3.13 persons per family. On the other hand, single male/father families (404 | 8.4%) represent the smallest median family size with 2.46 persons per family.
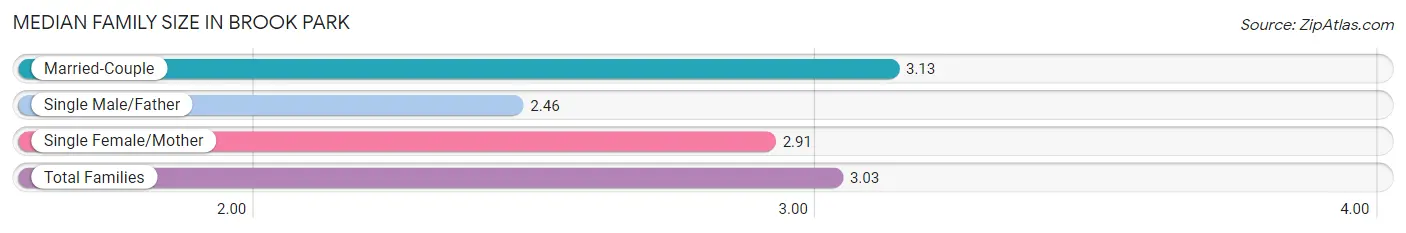
| Family Type | # Families | Family Size |
| Married-Couple | 3,347 (69.3%) | 3.13 |
| Single Male/Father | 404 (8.4%) | 2.46 |
| Single Female/Mother | 1,077 (22.3%) | 2.91 |
| Total Families | 4,828 (100.0%) | 3.03 |
Median Household Size in Brook Park
The median household size in Brook Park is 2.35 persons per household, with single female/mother households (1,077 | 13.8%) accounting for the largest median household size of 3.15 persons per household. non-family households (2,981 | 38.2%) represent the smallest median household size with 1.15 persons per household.
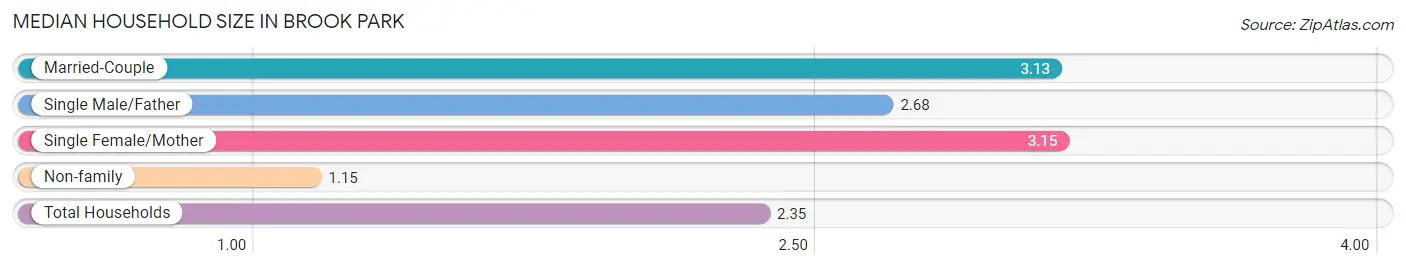
| Household Type | # Households | Household Size |
| Married-Couple | 3,347 (42.9%) | 3.13 |
| Single Male/Father | 404 (5.2%) | 2.68 |
| Single Female/Mother | 1,077 (13.8%) | 3.15 |
| Non-family | 2,981 (38.2%) | 1.15 |
| Total Households | 7,809 (100.0%) | 2.35 |
Household Size by Marriage Status in Brook Park
Out of a total of 7,809 households in Brook Park, 4,828 (61.8%) are family households, while 2,981 (38.2%) are nonfamily households. The most numerous type of family households are 2-person households, comprising 2,116, and the most common type of nonfamily households are 1-person households, comprising 2,559.
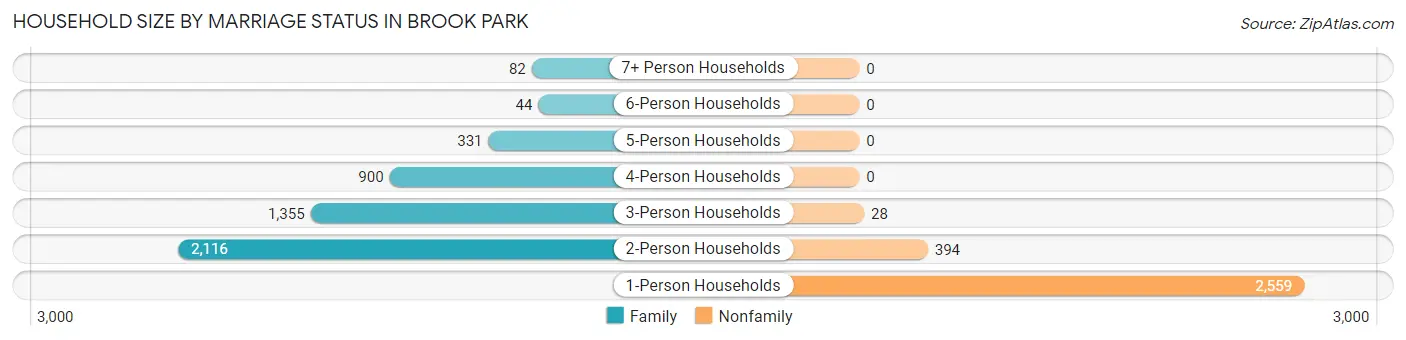
| Household Size | Family Households | Nonfamily Households |
| 1-Person Households | - | 2,559 (32.8%) |
| 2-Person Households | 2,116 (27.1%) | 394 (5.1%) |
| 3-Person Households | 1,355 (17.3%) | 28 (0.4%) |
| 4-Person Households | 900 (11.5%) | 0 (0.0%) |
| 5-Person Households | 331 (4.2%) | 0 (0.0%) |
| 6-Person Households | 44 (0.6%) | 0 (0.0%) |
| 7+ Person Households | 82 (1.1%) | 0 (0.0%) |
| Total | 4,828 (61.8%) | 2,981 (38.2%) |
Female Fertility in Brook Park
Fertility by Age in Brook Park
Average fertility rate in Brook Park is 101.0 births per 1,000 women. Women in the age bracket of 20 to 34 years have the highest fertility rate with 192.0 births per 1,000 women. Women in the age bracket of 20 to 34 years acount for 86.7% of all women with births.
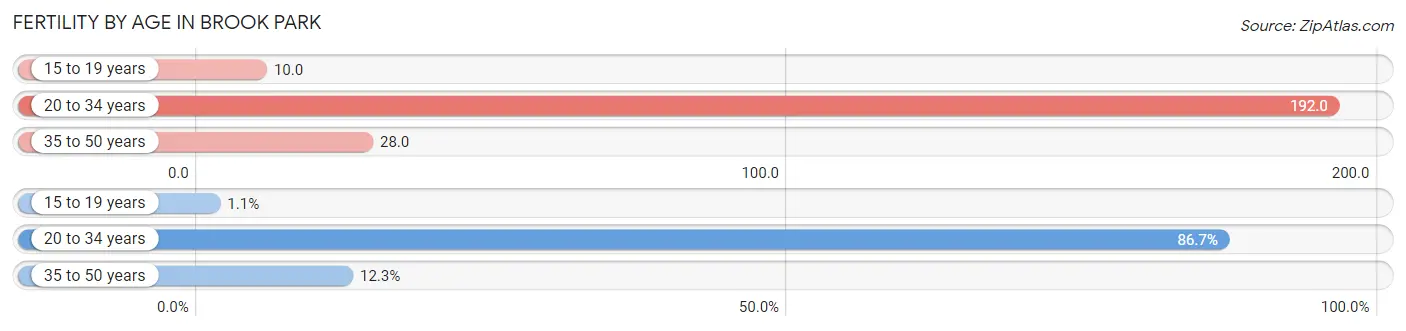
| Age Bracket | Women with Births | Births / 1,000 Women |
| 15 to 19 years | 4 (1.1%) | 10.0 |
| 20 to 34 years | 331 (86.7%) | 192.0 |
| 35 to 50 years | 47 (12.3%) | 28.0 |
| Total | 382 (100.0%) | 101.0 |
Fertility by Age by Marriage Status in Brook Park
72.3% of women with births (382) in Brook Park are married. The highest percentage of unmarried women with births falls into 15 to 19 years age bracket with 100.0% of them unmarried at the time of birth, while the lowest percentage of unmarried women with births belong to 20 to 34 years age bracket with 19.9% of them unmarried.
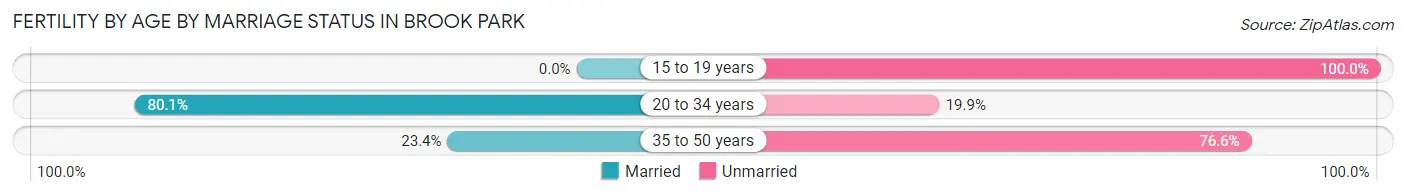
| Age Bracket | Married | Unmarried |
| 15 to 19 years | 0 (0.0%) | 4 (100.0%) |
| 20 to 34 years | 265 (80.1%) | 66 (19.9%) |
| 35 to 50 years | 11 (23.4%) | 36 (76.6%) |
| Total | 276 (72.3%) | 106 (27.8%) |
Fertility by Education in Brook Park
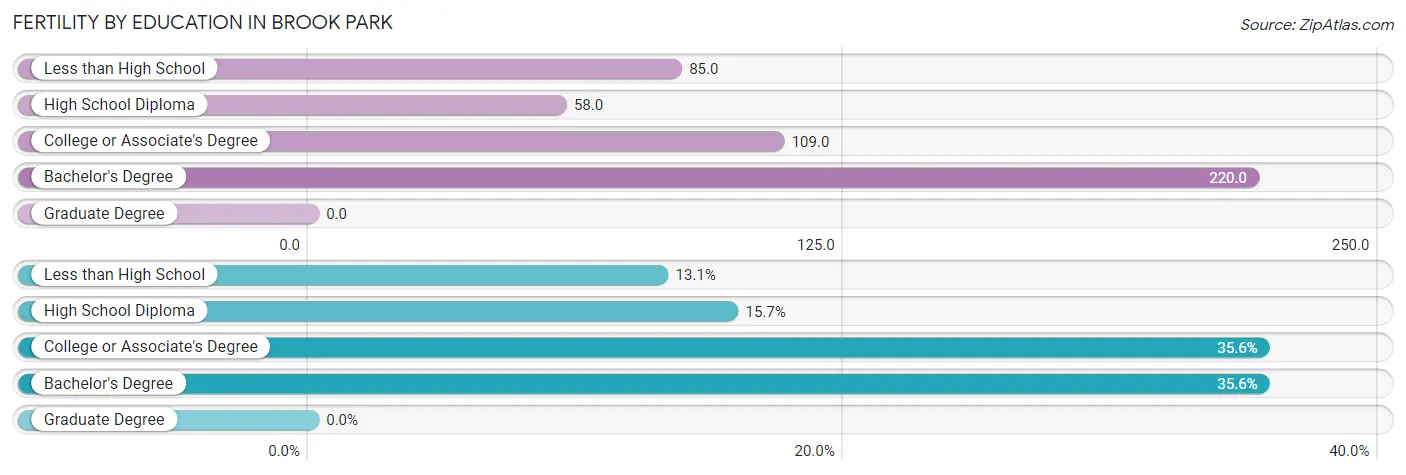
| Educational Attainment | Women with Births | Births / 1,000 Women |
| Less than High School | 50 (13.1%) | 85.0 |
| High School Diploma | 60 (15.7%) | 58.0 |
| College or Associate's Degree | 136 (35.6%) | 109.0 |
| Bachelor's Degree | 136 (35.6%) | 220.0 |
| Graduate Degree | 0 (0.0%) | 0.0 |
| Total | 382 (100.0%) | 101.0 |
Fertility by Education by Marriage Status in Brook Park
27.8% of women with births in Brook Park are unmarried. Women with the educational attainment of bachelor's degree are most likely to be married with 100.0% of them married at childbirth, while women with the educational attainment of college or associate's degree are least likely to be married with 56.6% of them unmarried at childbirth.
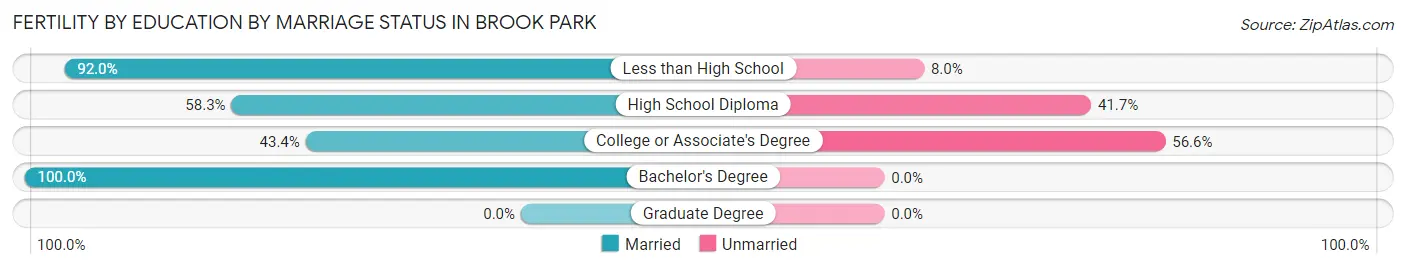
| Educational Attainment | Married | Unmarried |
| Less than High School | 46 (92.0%) | 4 (8.0%) |
| High School Diploma | 35 (58.3%) | 25 (41.7%) |
| College or Associate's Degree | 59 (43.4%) | 77 (56.6%) |
| Bachelor's Degree | 136 (100.0%) | 0 (0.0%) |
| Graduate Degree | 0 (0.0%) | 0 (0.0%) |
| Total | 276 (72.3%) | 106 (27.8%) |
Employment Characteristics in Brook Park
Employment by Class of Employer in Brook Park
Among the 8,871 employed individuals in Brook Park, private company employees (7,044 | 79.4%), local government employees (691 | 7.8%), and not-for-profit organizations (535 | 6.0%) make up the most common classes of employment.
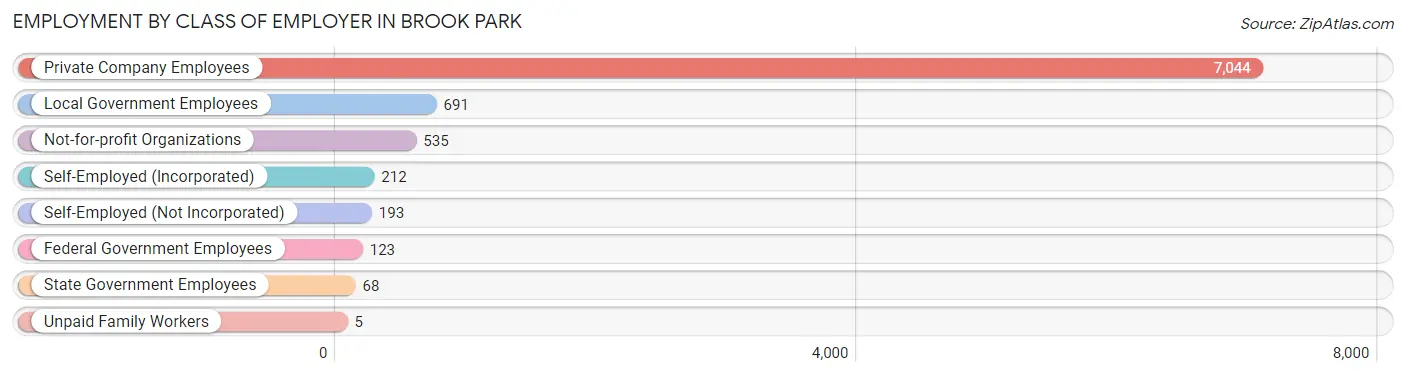
| Employer Class | # Employees | % Employees |
| Private Company Employees | 7,044 | 79.4% |
| Self-Employed (Incorporated) | 212 | 2.4% |
| Self-Employed (Not Incorporated) | 193 | 2.2% |
| Not-for-profit Organizations | 535 | 6.0% |
| Local Government Employees | 691 | 7.8% |
| State Government Employees | 68 | 0.8% |
| Federal Government Employees | 123 | 1.4% |
| Unpaid Family Workers | 5 | 0.1% |
| Total | 8,871 | 100.0% |
Employment Status by Age in Brook Park
According to the labor force statistics for Brook Park, out of the total population over 16 years of age (15,253), 62.9% or 9,594 individuals are in the labor force, with 5.3% or 508 of them unemployed. The age group with the highest labor force participation rate is 25 to 29 years, with 95.1% or 1,530 individuals in the labor force. Within the labor force, the 30 to 34 years age range has the highest percentage of unemployed individuals, with 11.9% or 115 of them being unemployed.
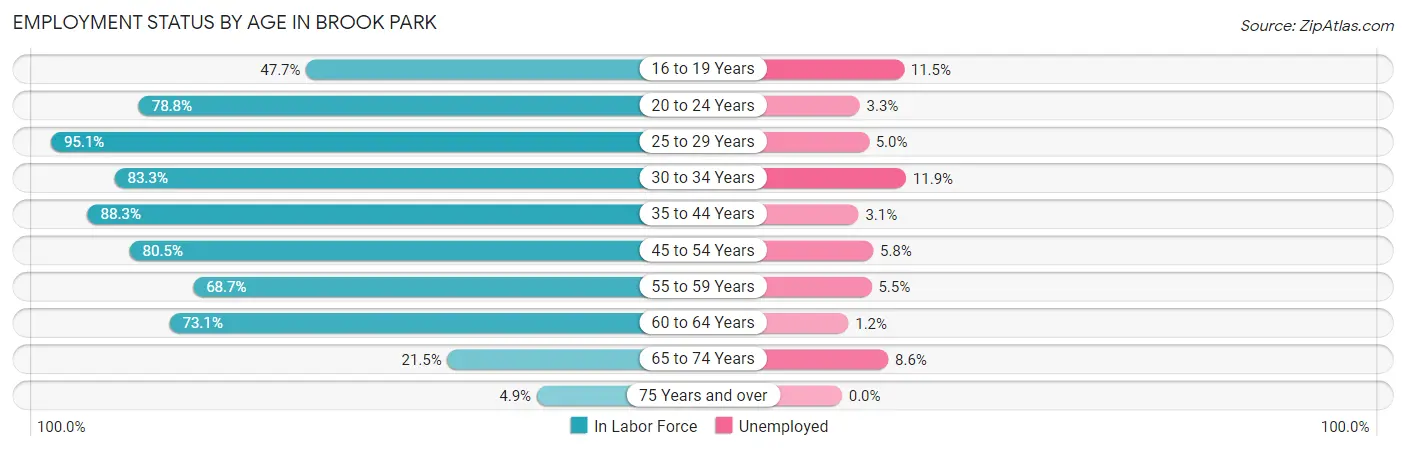
| Age Bracket | In Labor Force | Unemployed |
| 16 to 19 Years | 296 (47.7%) | 34 (11.5%) |
| 20 to 24 Years | 791 (78.8%) | 26 (3.3%) |
| 25 to 29 Years | 1,530 (95.1%) | 76 (5.0%) |
| 30 to 34 Years | 964 (83.3%) | 115 (11.9%) |
| 35 to 44 Years | 1,752 (88.3%) | 54 (3.1%) |
| 45 to 54 Years | 1,616 (80.5%) | 94 (5.8%) |
| 55 to 59 Years | 1,105 (68.7%) | 61 (5.5%) |
| 60 to 64 Years | 1,012 (73.1%) | 12 (1.2%) |
| 65 to 74 Years | 428 (21.5%) | 37 (8.6%) |
| 75 Years and over | 92 (4.9%) | 0 (0.0%) |
| Total | 9,594 (62.9%) | 508 (5.3%) |
Employment Status by Educational Attainment in Brook Park
According to labor force statistics for Brook Park, 81.8% of individuals (7,977) out of the total population between 25 and 64 years of age (9,752) are in the labor force, with 5.2% or 415 of them being unemployed. The group with the highest labor force participation rate are those with the educational attainment of bachelor's degree or higher, with 93.1% or 1,608 individuals in the labor force. Within the labor force, individuals with high school diploma education have the highest percentage of unemployment, with 6.1% or 180 of them being unemployed.
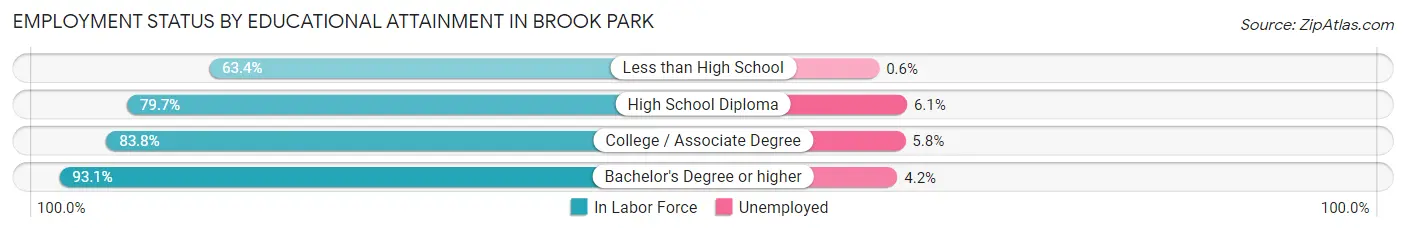
| Educational Attainment | In Labor Force | Unemployed |
| Less than High School | 623 (63.4%) | 6 (0.6%) |
| High School Diploma | 2,951 (79.7%) | 226 (6.1%) |
| College / Associate Degree | 2,798 (83.8%) | 194 (5.8%) |
| Bachelor's Degree or higher | 1,608 (93.1%) | 73 (4.2%) |
| Total | 7,977 (81.8%) | 507 (5.2%) |
Employment Occupations by Sex in Brook Park
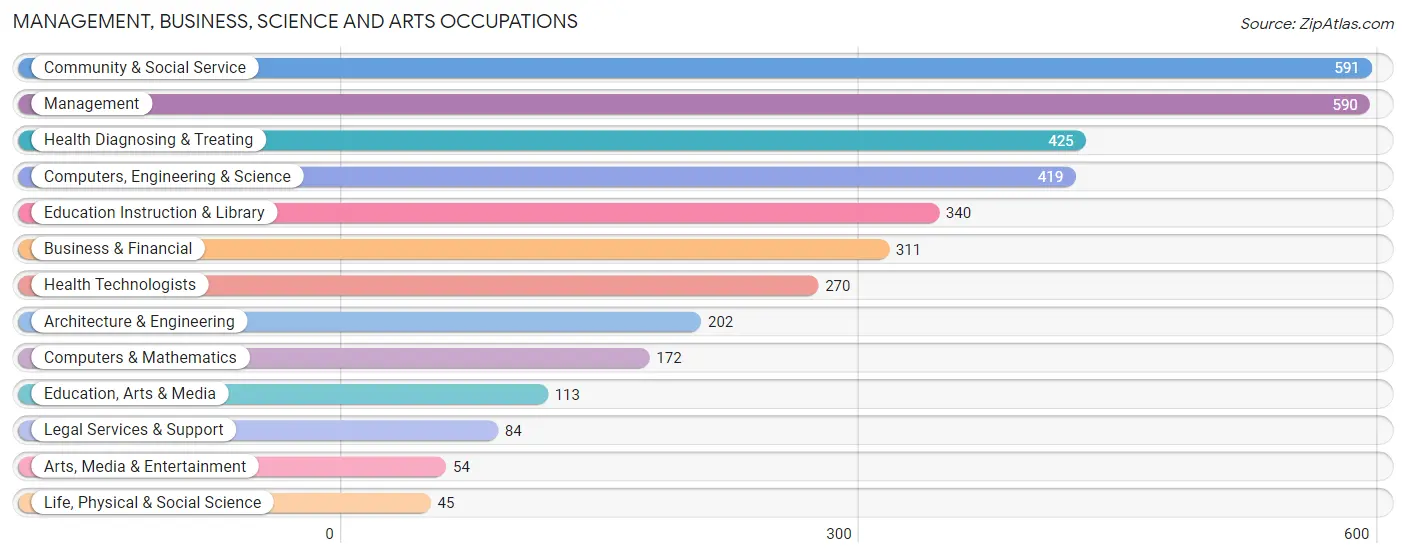
Management, Business, Science and Arts Occupations
The most common Management, Business, Science and Arts occupations in Brook Park are Community & Social Service (591 | 6.5%), Management (590 | 6.5%), Health Diagnosing & Treating (425 | 4.7%), Computers, Engineering & Science (419 | 4.6%), and Education Instruction & Library (340 | 3.7%).
Management, Business, Science and Arts Occupations by Sex
Within the Management, Business, Science and Arts occupations in Brook Park, the most male-oriented occupations are Architecture & Engineering (100.0%), Computers, Engineering & Science (77.8%), and Computers & Mathematics (66.3%), while the most female-oriented occupations are Health Diagnosing & Treating (92.2%), Health Technologists (90.7%), and Education Instruction & Library (88.8%).
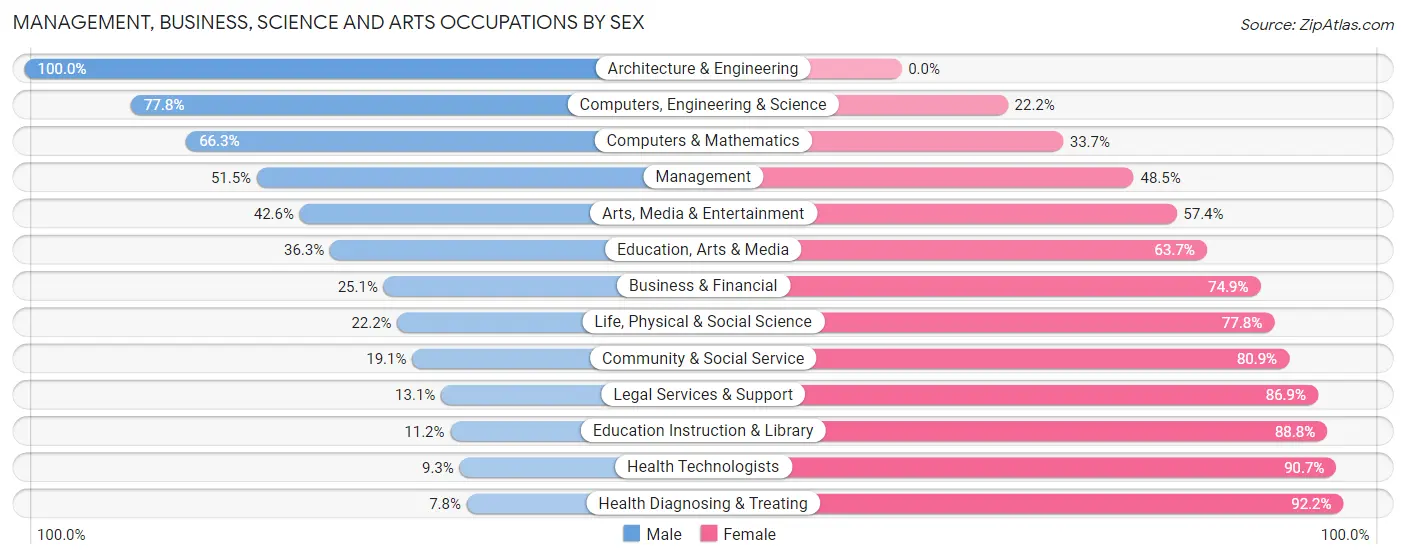
| Occupation | Male | Female |
| Management | 304 (51.5%) | 286 (48.5%) |
| Business & Financial | 78 (25.1%) | 233 (74.9%) |
| Computers, Engineering & Science | 326 (77.8%) | 93 (22.2%) |
| Computers & Mathematics | 114 (66.3%) | 58 (33.7%) |
| Architecture & Engineering | 202 (100.0%) | 0 (0.0%) |
| Life, Physical & Social Science | 10 (22.2%) | 35 (77.8%) |
| Community & Social Service | 113 (19.1%) | 478 (80.9%) |
| Education, Arts & Media | 41 (36.3%) | 72 (63.7%) |
| Legal Services & Support | 11 (13.1%) | 73 (86.9%) |
| Education Instruction & Library | 38 (11.2%) | 302 (88.8%) |
| Arts, Media & Entertainment | 23 (42.6%) | 31 (57.4%) |
| Health Diagnosing & Treating | 33 (7.8%) | 392 (92.2%) |
| Health Technologists | 25 (9.3%) | 245 (90.7%) |
| Total (Category) | 854 (36.6%) | 1,482 (63.4%) |
| Total (Overall) | 4,742 (52.2%) | 4,338 (47.8%) |
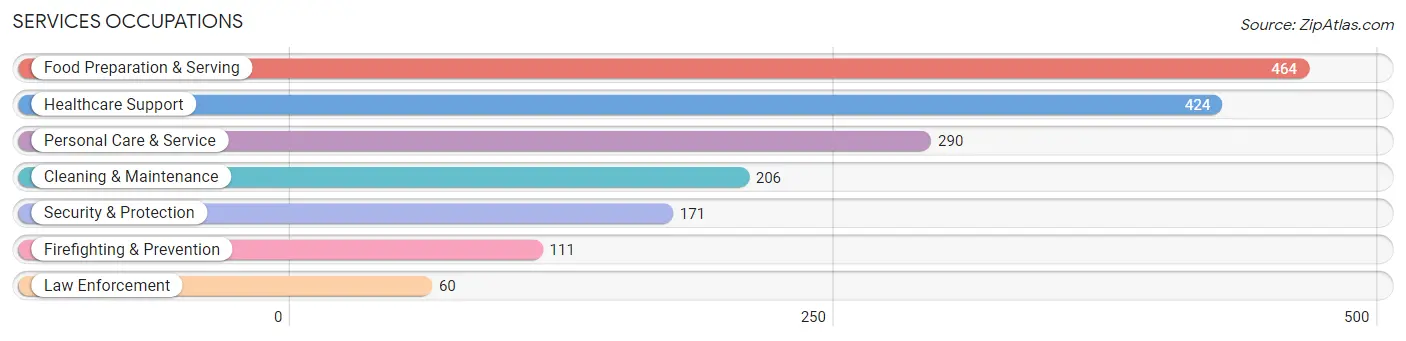
Services Occupations
The most common Services occupations in Brook Park are Food Preparation & Serving (464 | 5.1%), Healthcare Support (424 | 4.7%), Personal Care & Service (290 | 3.2%), Cleaning & Maintenance (206 | 2.3%), and Security & Protection (171 | 1.9%).
Services Occupations by Sex
Within the Services occupations in Brook Park, the most male-oriented occupations are Firefighting & Prevention (75.7%), Security & Protection (60.8%), and Food Preparation & Serving (33.4%), while the most female-oriented occupations are Healthcare Support (88.2%), Personal Care & Service (79.0%), and Cleaning & Maintenance (70.9%).
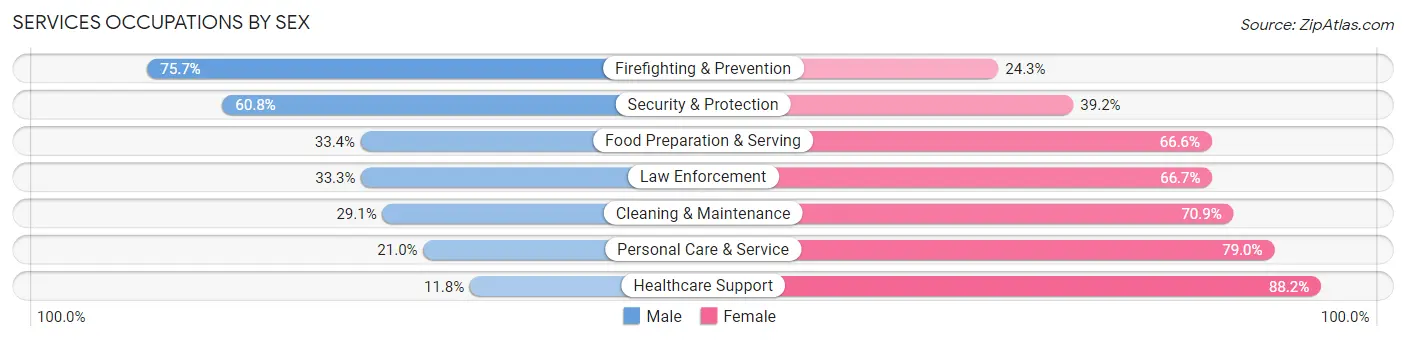
| Occupation | Male | Female |
| Healthcare Support | 50 (11.8%) | 374 (88.2%) |
| Security & Protection | 104 (60.8%) | 67 (39.2%) |
| Firefighting & Prevention | 84 (75.7%) | 27 (24.3%) |
| Law Enforcement | 20 (33.3%) | 40 (66.7%) |
| Food Preparation & Serving | 155 (33.4%) | 309 (66.6%) |
| Cleaning & Maintenance | 60 (29.1%) | 146 (70.9%) |
| Personal Care & Service | 61 (21.0%) | 229 (79.0%) |
| Total (Category) | 430 (27.7%) | 1,125 (72.4%) |
| Total (Overall) | 4,742 (52.2%) | 4,338 (47.8%) |
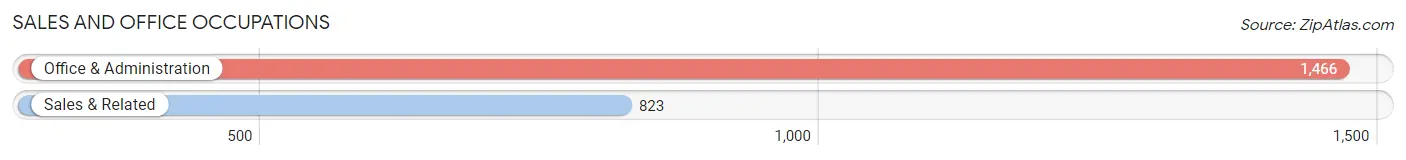
Sales and Office Occupations
The most common Sales and Office occupations in Brook Park are Office & Administration (1,466 | 16.2%), and Sales & Related (823 | 9.1%).
Sales and Office Occupations by Sex
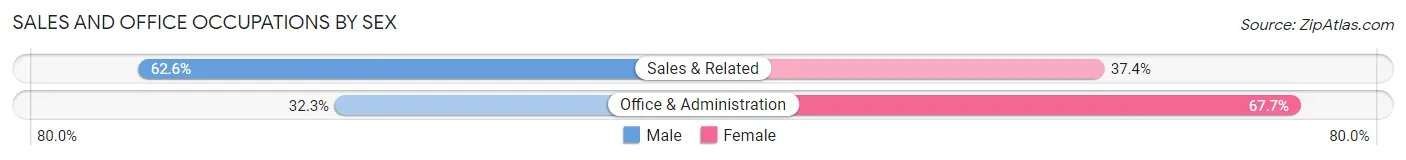
| Occupation | Male | Female |
| Sales & Related | 515 (62.6%) | 308 (37.4%) |
| Office & Administration | 473 (32.3%) | 993 (67.7%) |
| Total (Category) | 988 (43.2%) | 1,301 (56.8%) |
| Total (Overall) | 4,742 (52.2%) | 4,338 (47.8%) |
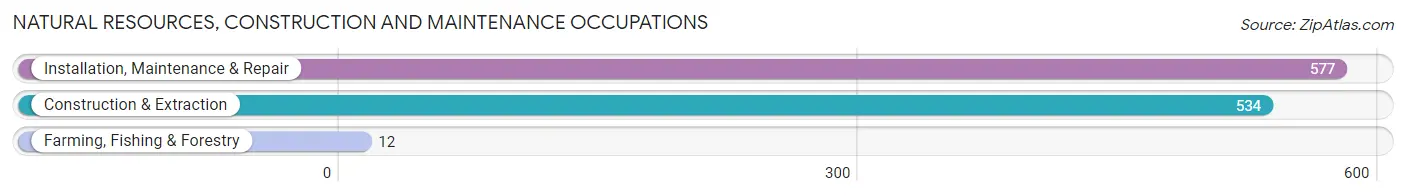
Natural Resources, Construction and Maintenance Occupations
The most common Natural Resources, Construction and Maintenance occupations in Brook Park are Installation, Maintenance & Repair (577 | 6.4%), Construction & Extraction (534 | 5.9%), and Farming, Fishing & Forestry (12 | 0.1%).
Natural Resources, Construction and Maintenance Occupations by Sex
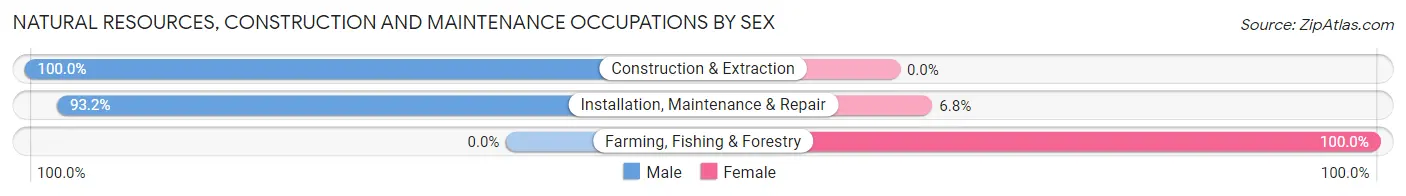
| Occupation | Male | Female |
| Farming, Fishing & Forestry | 0 (0.0%) | 12 (100.0%) |
| Construction & Extraction | 534 (100.0%) | 0 (0.0%) |
| Installation, Maintenance & Repair | 538 (93.2%) | 39 (6.8%) |
| Total (Category) | 1,072 (95.5%) | 51 (4.5%) |
| Total (Overall) | 4,742 (52.2%) | 4,338 (47.8%) |
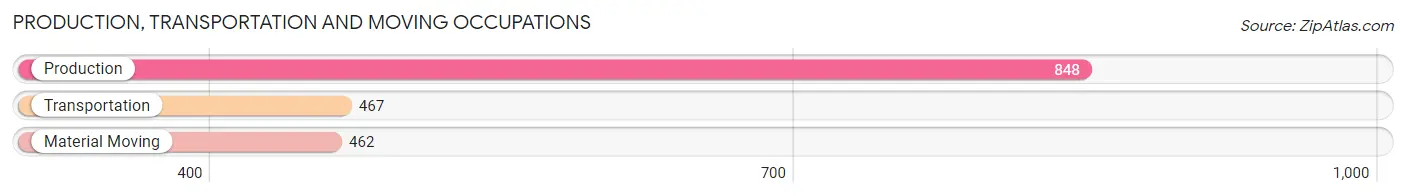
Production, Transportation and Moving Occupations
The most common Production, Transportation and Moving occupations in Brook Park are Production (848 | 9.3%), Transportation (467 | 5.1%), and Material Moving (462 | 5.1%).
Production, Transportation and Moving Occupations by Sex
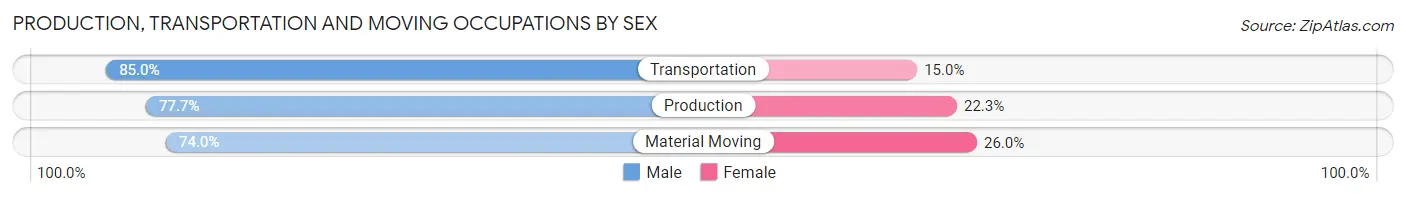
| Occupation | Male | Female |
| Production | 659 (77.7%) | 189 (22.3%) |
| Transportation | 397 (85.0%) | 70 (15.0%) |
| Material Moving | 342 (74.0%) | 120 (26.0%) |
| Total (Category) | 1,398 (78.7%) | 379 (21.3%) |
| Total (Overall) | 4,742 (52.2%) | 4,338 (47.8%) |
Employment Industries by Sex in Brook Park
Employment Industries in Brook Park
The major employment industries in Brook Park include Manufacturing (1,807 | 19.9%), Health Care & Social Assistance (1,297 | 14.3%), Retail Trade (1,020 | 11.2%), Transportation & Warehousing (759 | 8.4%), and Construction (689 | 7.6%).
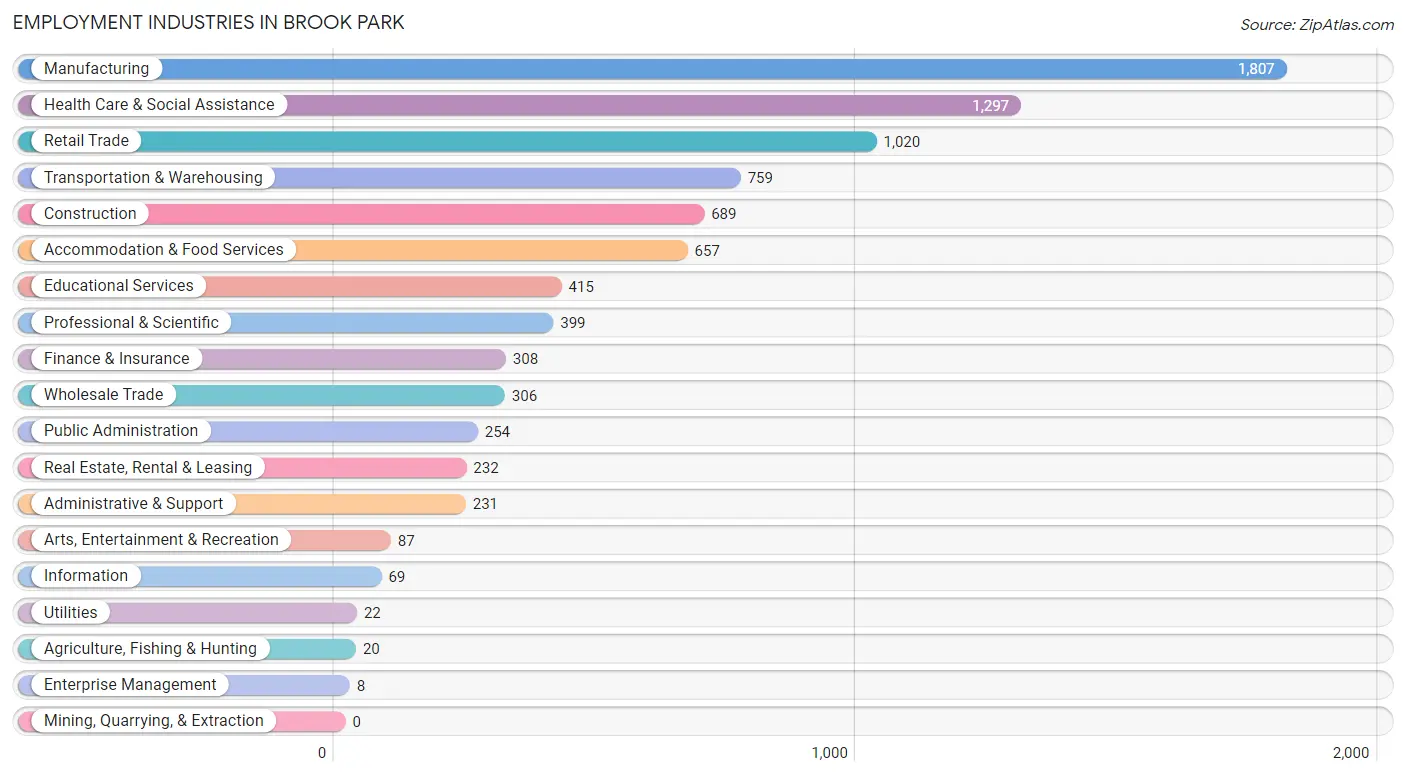
Employment Industries by Sex in Brook Park
The Brook Park industries that see more men than women are Utilities (100.0%), Construction (95.2%), and Arts, Entertainment & Recreation (88.5%), whereas the industries that tend to have a higher number of women are Enterprise Management (100.0%), Educational Services (90.4%), and Health Care & Social Assistance (86.3%).
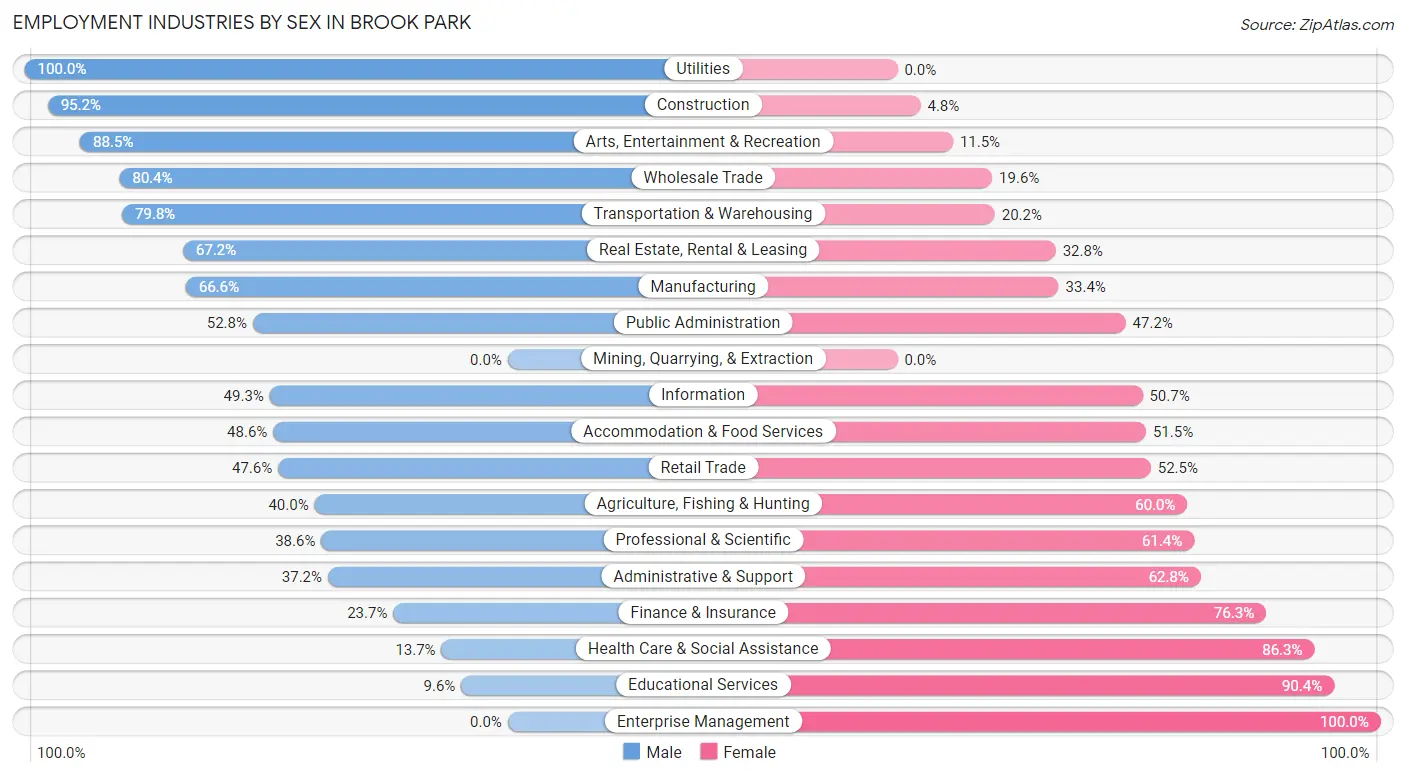
| Industry | Male | Female |
| Agriculture, Fishing & Hunting | 8 (40.0%) | 12 (60.0%) |
| Mining, Quarrying, & Extraction | 0 (0.0%) | 0 (0.0%) |
| Construction | 656 (95.2%) | 33 (4.8%) |
| Manufacturing | 1,204 (66.6%) | 603 (33.4%) |
| Wholesale Trade | 246 (80.4%) | 60 (19.6%) |
| Retail Trade | 485 (47.5%) | 535 (52.4%) |
| Transportation & Warehousing | 606 (79.8%) | 153 (20.2%) |
| Utilities | 22 (100.0%) | 0 (0.0%) |
| Information | 34 (49.3%) | 35 (50.7%) |
| Finance & Insurance | 73 (23.7%) | 235 (76.3%) |
| Real Estate, Rental & Leasing | 156 (67.2%) | 76 (32.8%) |
| Professional & Scientific | 154 (38.6%) | 245 (61.4%) |
| Enterprise Management | 0 (0.0%) | 8 (100.0%) |
| Administrative & Support | 86 (37.2%) | 145 (62.8%) |
| Educational Services | 40 (9.6%) | 375 (90.4%) |
| Health Care & Social Assistance | 178 (13.7%) | 1,119 (86.3%) |
| Arts, Entertainment & Recreation | 77 (88.5%) | 10 (11.5%) |
| Accommodation & Food Services | 319 (48.5%) | 338 (51.4%) |
| Public Administration | 134 (52.8%) | 120 (47.2%) |
| Total | 4,742 (52.2%) | 4,338 (47.8%) |
Education in Brook Park
School Enrollment in Brook Park
The most common levels of schooling among the 2,970 students in Brook Park are middle school (731 | 24.6%), high school (680 | 22.9%), and elementary school (637 | 21.4%).
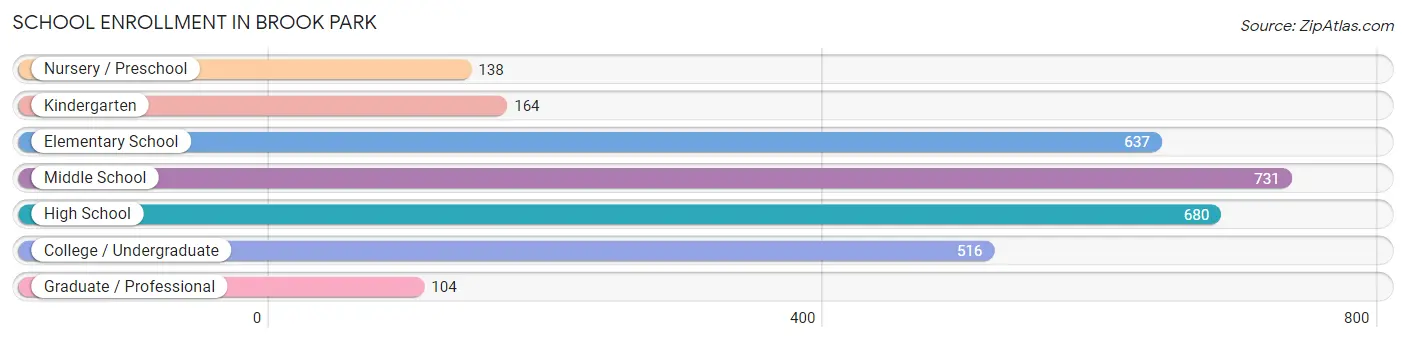
| School Level | # Students | % Students |
| Nursery / Preschool | 138 | 4.6% |
| Kindergarten | 164 | 5.5% |
| Elementary School | 637 | 21.4% |
| Middle School | 731 | 24.6% |
| High School | 680 | 22.9% |
| College / Undergraduate | 516 | 17.4% |
| Graduate / Professional | 104 | 3.5% |
| Total | 2,970 | 100.0% |
School Enrollment by Age by Funding Source in Brook Park
Out of a total of 2,970 students who are enrolled in schools in Brook Park, 252 (8.5%) attend a private institution, while the remaining 2,718 (91.5%) are enrolled in public schools. The age group of 3 to 4 year olds has the highest likelihood of being enrolled in private schools, with 30 (29.4% in the age bracket) enrolled. Conversely, the age group of 15 to 17 year olds has the lowest likelihood of being enrolled in a private school, with 486 (94.9% in the age bracket) attending a public institution.
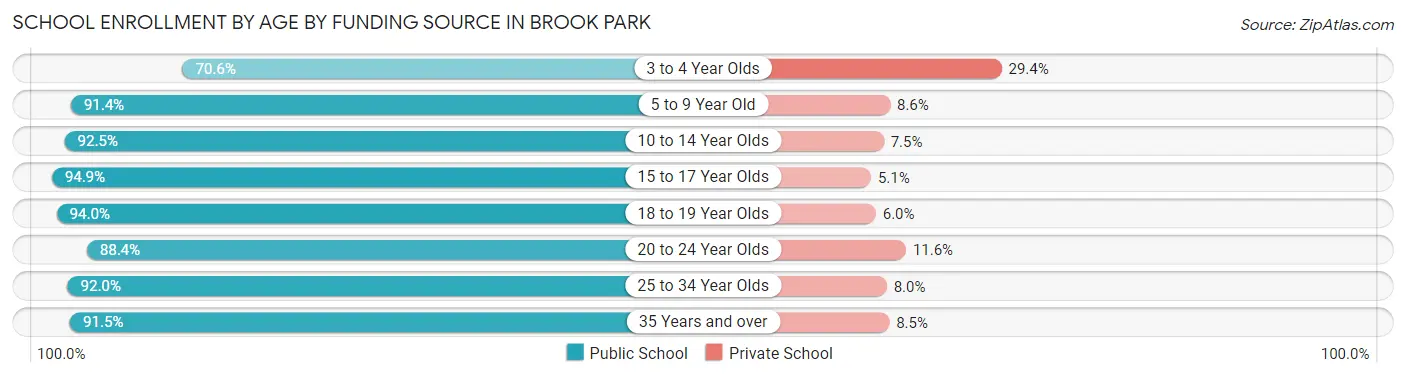
| Age Bracket | Public School | Private School |
| 3 to 4 Year Olds | 72 (70.6%) | 30 (29.4%) |
| 5 to 9 Year Old | 762 (91.4%) | 72 (8.6%) |
| 10 to 14 Year Olds | 719 (92.5%) | 58 (7.5%) |
| 15 to 17 Year Olds | 486 (94.9%) | 26 (5.1%) |
| 18 to 19 Year Olds | 173 (94.0%) | 11 (6.0%) |
| 20 to 24 Year Olds | 259 (88.4%) | 34 (11.6%) |
| 25 to 34 Year Olds | 149 (92.0%) | 13 (8.0%) |
| 35 Years and over | 97 (91.5%) | 9 (8.5%) |
| Total | 2,718 (91.5%) | 252 (8.5%) |
Educational Attainment by Field of Study in Brook Park
Business (505 | 21.6%), science & technology (372 | 16.0%), education (314 | 13.5%), engineering (188 | 8.1%), and social sciences (161 | 6.9%) are the most common fields of study among 2,333 individuals in Brook Park who have obtained a bachelor's degree or higher.
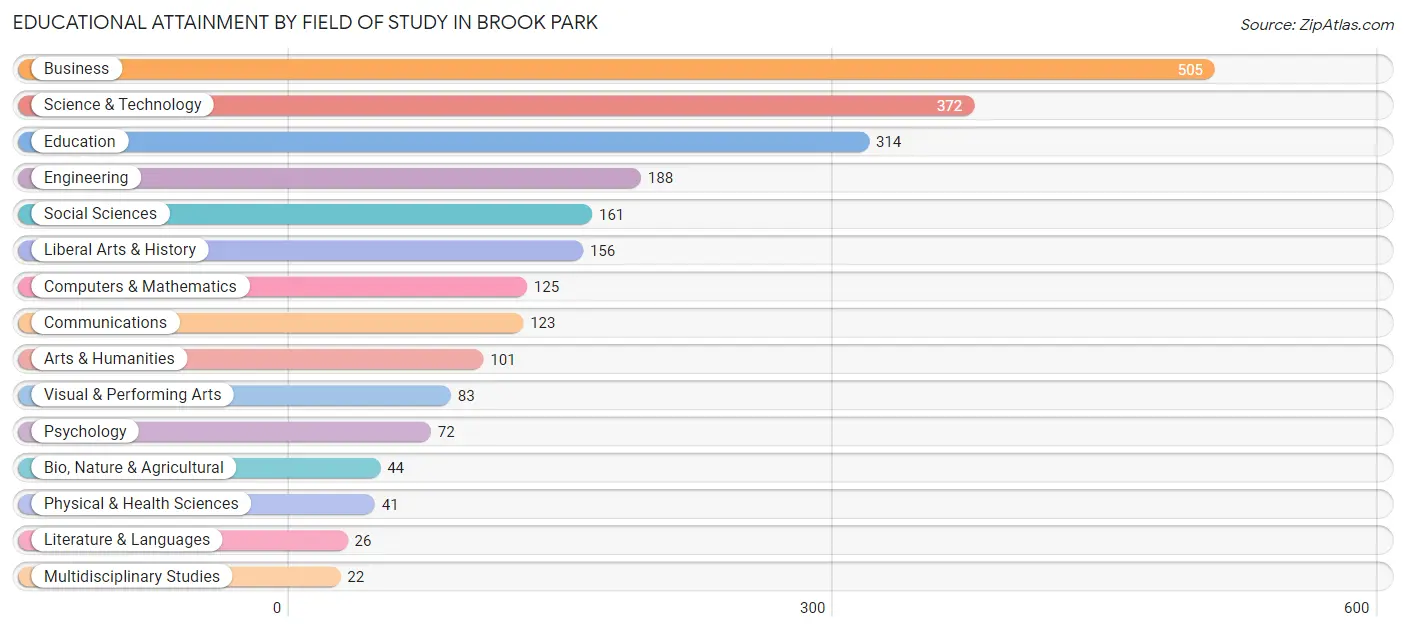
| Field of Study | # Graduates | % Graduates |
| Computers & Mathematics | 125 | 5.4% |
| Bio, Nature & Agricultural | 44 | 1.9% |
| Physical & Health Sciences | 41 | 1.8% |
| Psychology | 72 | 3.1% |
| Social Sciences | 161 | 6.9% |
| Engineering | 188 | 8.1% |
| Multidisciplinary Studies | 22 | 0.9% |
| Science & Technology | 372 | 16.0% |
| Business | 505 | 21.6% |
| Education | 314 | 13.5% |
| Literature & Languages | 26 | 1.1% |
| Liberal Arts & History | 156 | 6.7% |
| Visual & Performing Arts | 83 | 3.6% |
| Communications | 123 | 5.3% |
| Arts & Humanities | 101 | 4.3% |
| Total | 2,333 | 100.0% |
Transportation & Commute in Brook Park
Vehicle Availability by Sex in Brook Park
The most prevalent vehicle ownership categories in Brook Park are males with 2 vehicles (2,102, accounting for 45.4%) and females with 2 vehicles (2,042, making up 49.6%).
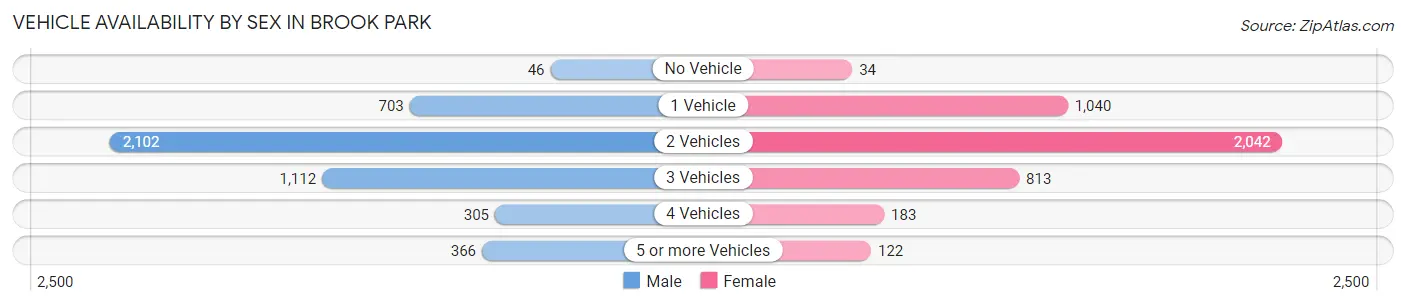
| Vehicles Available | Male | Female |
| No Vehicle | 46 (1.0%) | 34 (0.8%) |
| 1 Vehicle | 703 (15.2%) | 1,040 (24.6%) |
| 2 Vehicles | 2,102 (45.4%) | 2,042 (48.2%) |
| 3 Vehicles | 1,112 (24.0%) | 813 (19.2%) |
| 4 Vehicles | 305 (6.6%) | 183 (4.3%) |
| 5 or more Vehicles | 366 (7.9%) | 122 (2.9%) |
| Total | 4,634 (100.0%) | 4,234 (100.0%) |
Commute Time in Brook Park
The most frequently occuring commute durations in Brook Park are 10 to 14 minutes (1,455 commuters, 17.2%), 20 to 24 minutes (1,341 commuters, 15.9%), and 15 to 19 minutes (1,186 commuters, 14.0%).
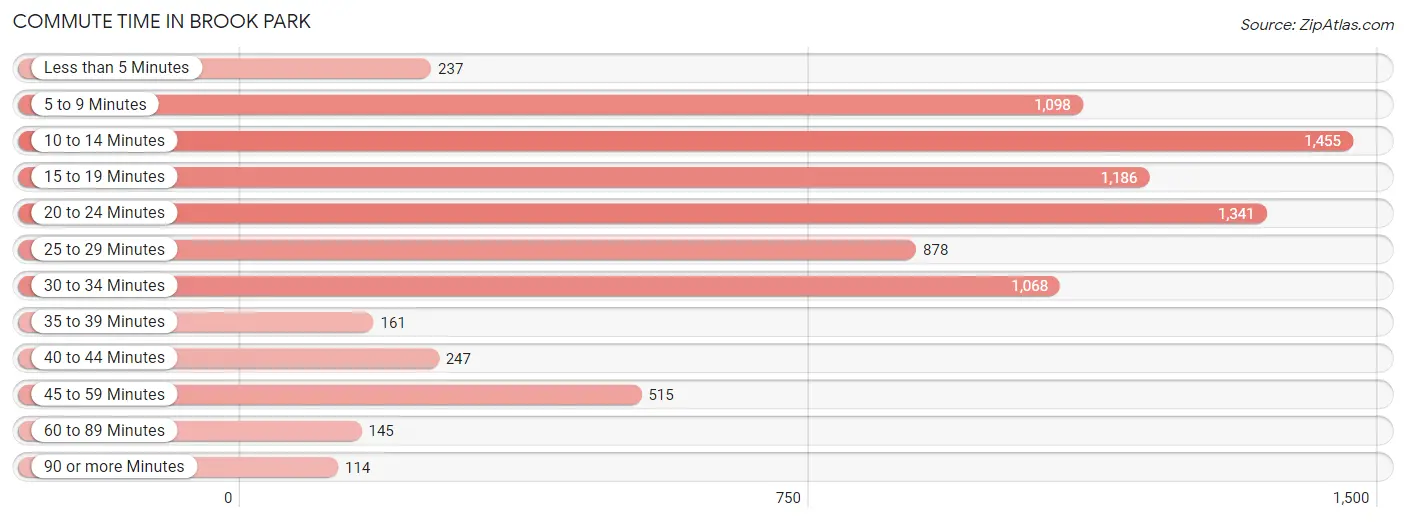
| Commute Time | # Commuters | % Commuters |
| Less than 5 Minutes | 237 | 2.8% |
| 5 to 9 Minutes | 1,098 | 13.0% |
| 10 to 14 Minutes | 1,455 | 17.2% |
| 15 to 19 Minutes | 1,186 | 14.0% |
| 20 to 24 Minutes | 1,341 | 15.9% |
| 25 to 29 Minutes | 878 | 10.4% |
| 30 to 34 Minutes | 1,068 | 12.7% |
| 35 to 39 Minutes | 161 | 1.9% |
| 40 to 44 Minutes | 247 | 2.9% |
| 45 to 59 Minutes | 515 | 6.1% |
| 60 to 89 Minutes | 145 | 1.7% |
| 90 or more Minutes | 114 | 1.3% |
Commute Time by Sex in Brook Park
The most common commute times in Brook Park are 10 to 14 minutes (838 commuters, 19.0%) for males and 10 to 14 minutes (617 commuters, 15.3%) for females.
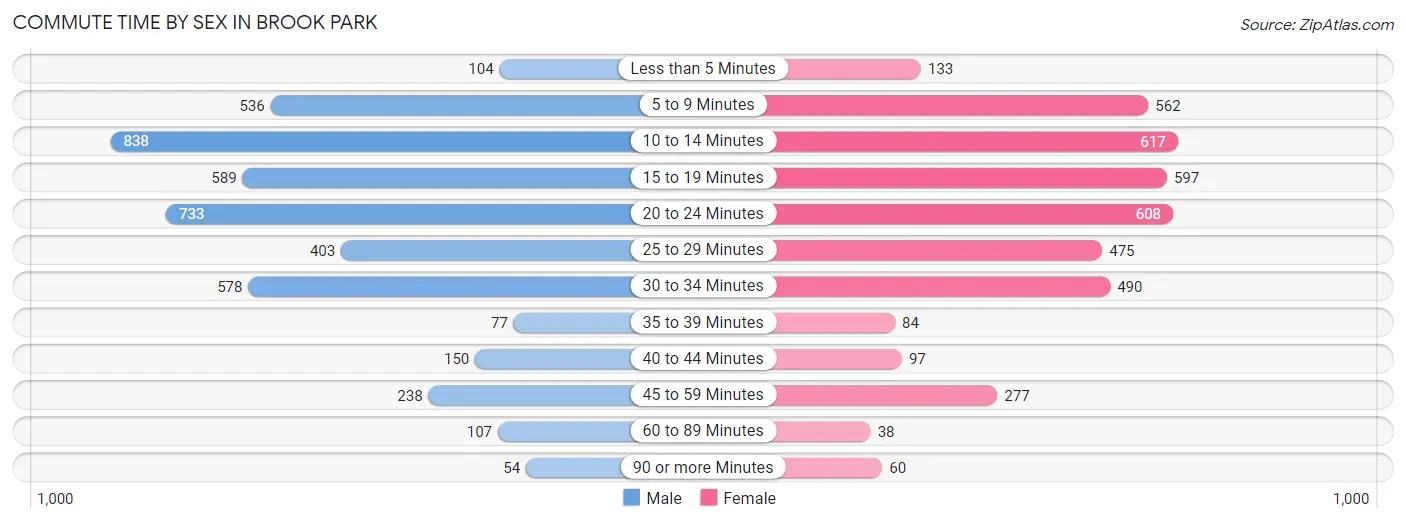
| Commute Time | Male | Female |
| Less than 5 Minutes | 104 (2.4%) | 133 (3.3%) |
| 5 to 9 Minutes | 536 (12.2%) | 562 (13.9%) |
| 10 to 14 Minutes | 838 (19.0%) | 617 (15.3%) |
| 15 to 19 Minutes | 589 (13.4%) | 597 (14.8%) |
| 20 to 24 Minutes | 733 (16.6%) | 608 (15.1%) |
| 25 to 29 Minutes | 403 (9.1%) | 475 (11.8%) |
| 30 to 34 Minutes | 578 (13.1%) | 490 (12.1%) |
| 35 to 39 Minutes | 77 (1.8%) | 84 (2.1%) |
| 40 to 44 Minutes | 150 (3.4%) | 97 (2.4%) |
| 45 to 59 Minutes | 238 (5.4%) | 277 (6.9%) |
| 60 to 89 Minutes | 107 (2.4%) | 38 (0.9%) |
| 90 or more Minutes | 54 (1.2%) | 60 (1.5%) |
Time of Departure to Work by Sex in Brook Park
The most frequent times of departure to work in Brook Park are 4:00 PM to 11:59 PM (625, 14.2%) for males and 7:00 AM to 7:29 AM (703, 17.4%) for females.
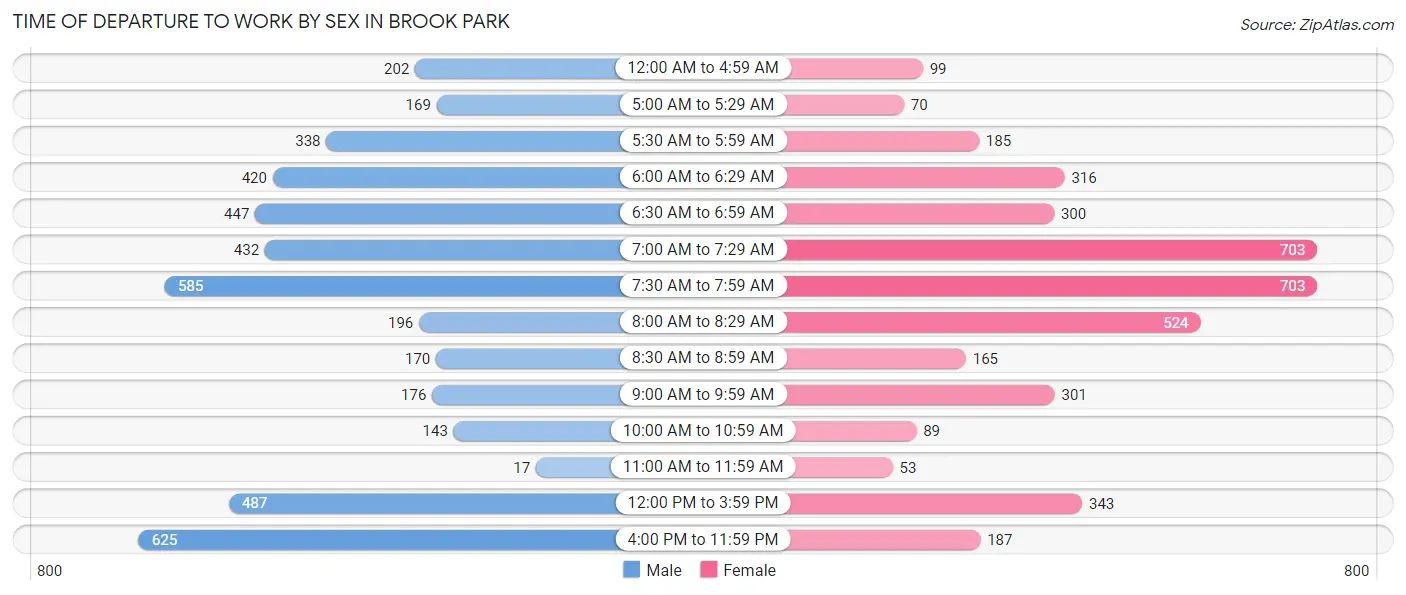
| Time of Departure | Male | Female |
| 12:00 AM to 4:59 AM | 202 (4.6%) | 99 (2.5%) |
| 5:00 AM to 5:29 AM | 169 (3.8%) | 70 (1.7%) |
| 5:30 AM to 5:59 AM | 338 (7.7%) | 185 (4.6%) |
| 6:00 AM to 6:29 AM | 420 (9.5%) | 316 (7.8%) |
| 6:30 AM to 6:59 AM | 447 (10.1%) | 300 (7.4%) |
| 7:00 AM to 7:29 AM | 432 (9.8%) | 703 (17.4%) |
| 7:30 AM to 7:59 AM | 585 (13.3%) | 703 (17.4%) |
| 8:00 AM to 8:29 AM | 196 (4.4%) | 524 (13.0%) |
| 8:30 AM to 8:59 AM | 170 (3.9%) | 165 (4.1%) |
| 9:00 AM to 9:59 AM | 176 (4.0%) | 301 (7.4%) |
| 10:00 AM to 10:59 AM | 143 (3.2%) | 89 (2.2%) |
| 11:00 AM to 11:59 AM | 17 (0.4%) | 53 (1.3%) |
| 12:00 PM to 3:59 PM | 487 (11.1%) | 343 (8.5%) |
| 4:00 PM to 11:59 PM | 625 (14.2%) | 187 (4.6%) |
| Total | 4,407 (100.0%) | 4,038 (100.0%) |
Housing Occupancy in Brook Park
Occupancy by Ownership in Brook Park
Of the total 7,809 dwellings in Brook Park, owner-occupied units account for 6,264 (80.2%), while renter-occupied units make up 1,545 (19.8%).
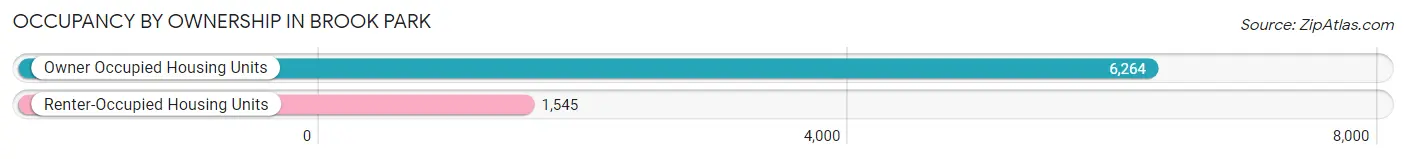
| Occupancy | # Housing Units | % Housing Units |
| Owner Occupied Housing Units | 6,264 | 80.2% |
| Renter-Occupied Housing Units | 1,545 | 19.8% |
| Total Occupied Housing Units | 7,809 | 100.0% |
Occupancy by Household Size in Brook Park
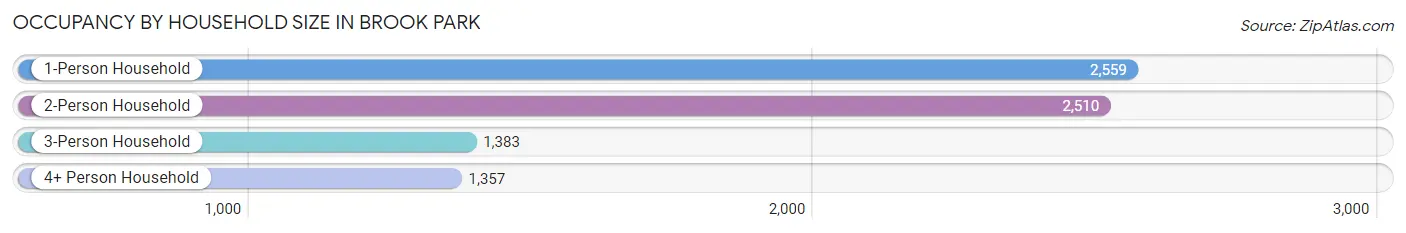
| Household Size | # Housing Units | % Housing Units |
| 1-Person Household | 2,559 | 32.8% |
| 2-Person Household | 2,510 | 32.1% |
| 3-Person Household | 1,383 | 17.7% |
| 4+ Person Household | 1,357 | 17.4% |
| Total Housing Units | 7,809 | 100.0% |
Occupancy by Ownership by Household Size in Brook Park
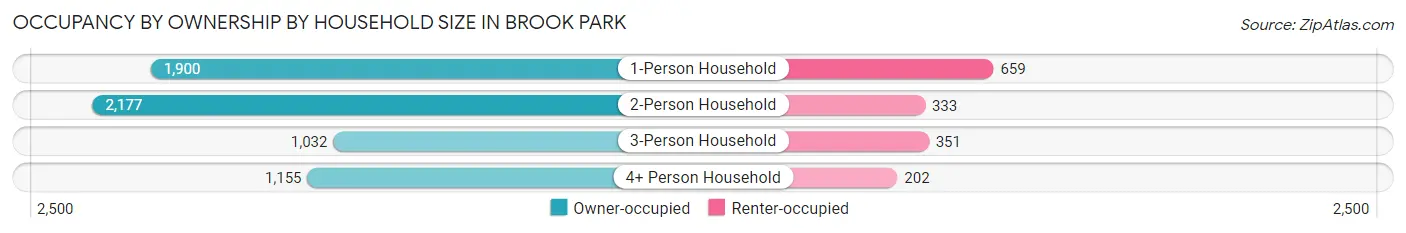
| Household Size | Owner-occupied | Renter-occupied |
| 1-Person Household | 1,900 (74.3%) | 659 (25.8%) |
| 2-Person Household | 2,177 (86.7%) | 333 (13.3%) |
| 3-Person Household | 1,032 (74.6%) | 351 (25.4%) |
| 4+ Person Household | 1,155 (85.1%) | 202 (14.9%) |
| Total Housing Units | 6,264 (80.2%) | 1,545 (19.8%) |
Occupancy by Educational Attainment in Brook Park
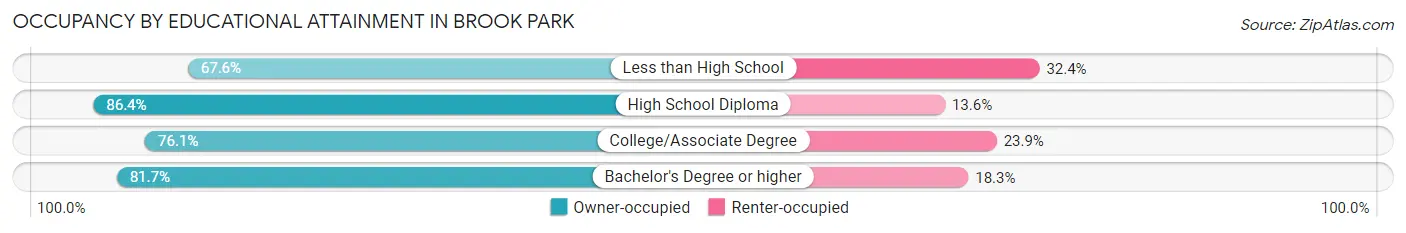
| Household Size | Owner-occupied | Renter-occupied |
| Less than High School | 489 (67.6%) | 234 (32.4%) |
| High School Diploma | 2,666 (86.4%) | 421 (13.6%) |
| College/Associate Degree | 2,156 (76.1%) | 677 (23.9%) |
| Bachelor's Degree or higher | 953 (81.7%) | 213 (18.3%) |
Occupancy by Age of Householder in Brook Park
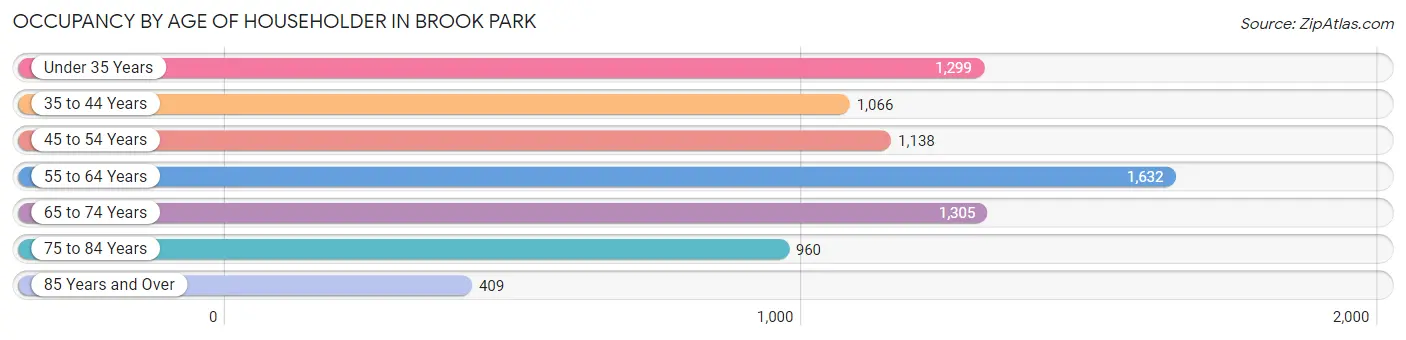
| Age Bracket | # Households | % Households |
| Under 35 Years | 1,299 | 16.6% |
| 35 to 44 Years | 1,066 | 13.7% |
| 45 to 54 Years | 1,138 | 14.6% |
| 55 to 64 Years | 1,632 | 20.9% |
| 65 to 74 Years | 1,305 | 16.7% |
| 75 to 84 Years | 960 | 12.3% |
| 85 Years and Over | 409 | 5.2% |
| Total | 7,809 | 100.0% |
Housing Finances in Brook Park
Median Income by Occupancy in Brook Park
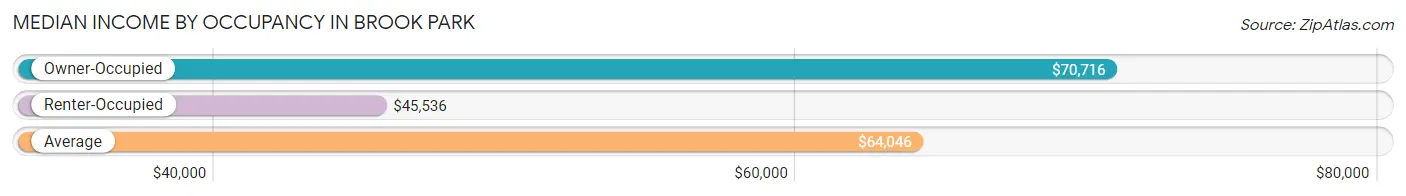
| Occupancy Type | # Households | Median Income |
| Owner-Occupied | 6,264 (80.2%) | $70,716 |
| Renter-Occupied | 1,545 (19.8%) | $45,536 |
| Average | 7,809 (100.0%) | $64,046 |
Occupancy by Householder Income Bracket in Brook Park
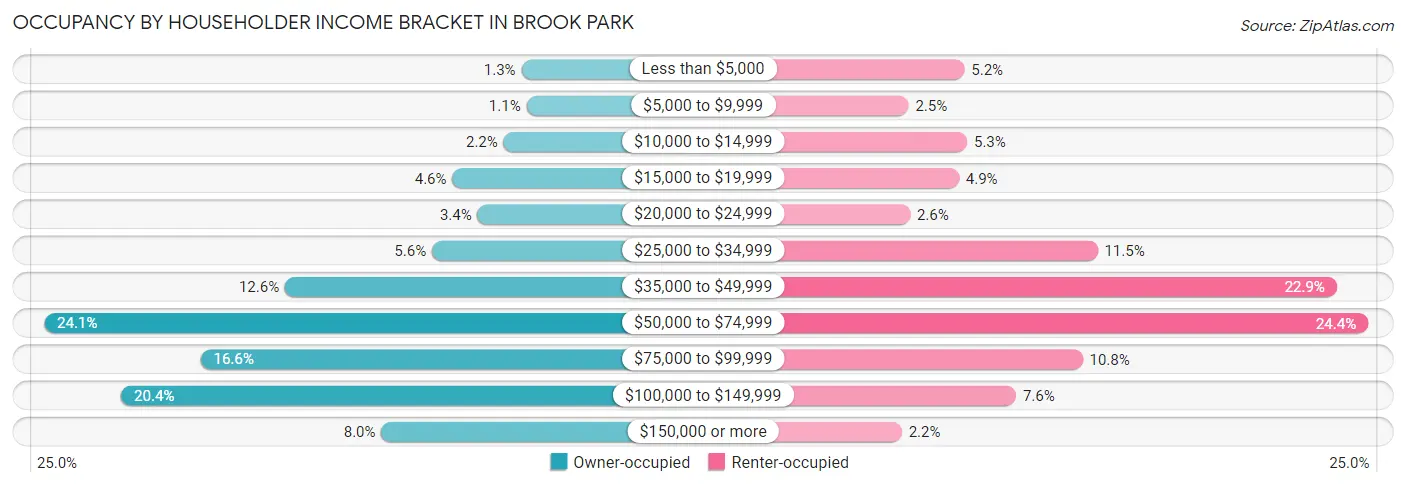
| Income Bracket | Owner-occupied | Renter-occupied |
| Less than $5,000 | 84 (1.3%) | 80 (5.2%) |
| $5,000 to $9,999 | 69 (1.1%) | 39 (2.5%) |
| $10,000 to $14,999 | 137 (2.2%) | 82 (5.3%) |
| $15,000 to $19,999 | 290 (4.6%) | 76 (4.9%) |
| $20,000 to $24,999 | 215 (3.4%) | 40 (2.6%) |
| $25,000 to $34,999 | 351 (5.6%) | 178 (11.5%) |
| $35,000 to $49,999 | 789 (12.6%) | 354 (22.9%) |
| $50,000 to $74,999 | 1,508 (24.1%) | 377 (24.4%) |
| $75,000 to $99,999 | 1,041 (16.6%) | 167 (10.8%) |
| $100,000 to $149,999 | 1,278 (20.4%) | 118 (7.6%) |
| $150,000 or more | 502 (8.0%) | 34 (2.2%) |
| Total | 6,264 (100.0%) | 1,545 (100.0%) |
Monthly Housing Cost Tiers in Brook Park
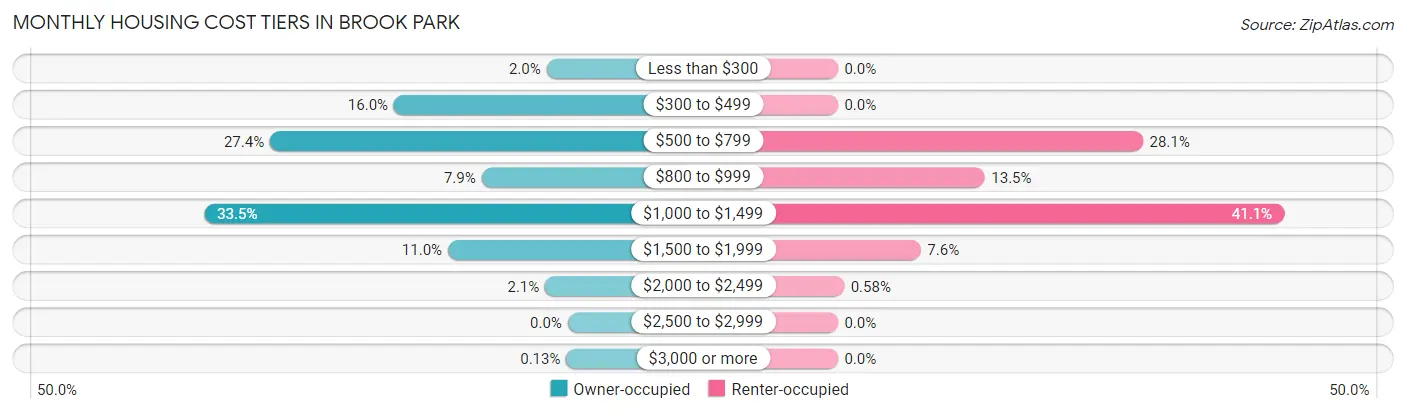
| Monthly Cost | Owner-occupied | Renter-occupied |
| Less than $300 | 122 (1.9%) | 0 (0.0%) |
| $300 to $499 | 1,002 (16.0%) | 0 (0.0%) |
| $500 to $799 | 1,717 (27.4%) | 434 (28.1%) |
| $800 to $999 | 497 (7.9%) | 209 (13.5%) |
| $1,000 to $1,499 | 2,097 (33.5%) | 635 (41.1%) |
| $1,500 to $1,999 | 691 (11.0%) | 118 (7.6%) |
| $2,000 to $2,499 | 130 (2.1%) | 9 (0.6%) |
| $2,500 to $2,999 | 0 (0.0%) | 0 (0.0%) |
| $3,000 or more | 8 (0.1%) | 0 (0.0%) |
| Total | 6,264 (100.0%) | 1,545 (100.0%) |
Physical Housing Characteristics in Brook Park
Housing Structures in Brook Park
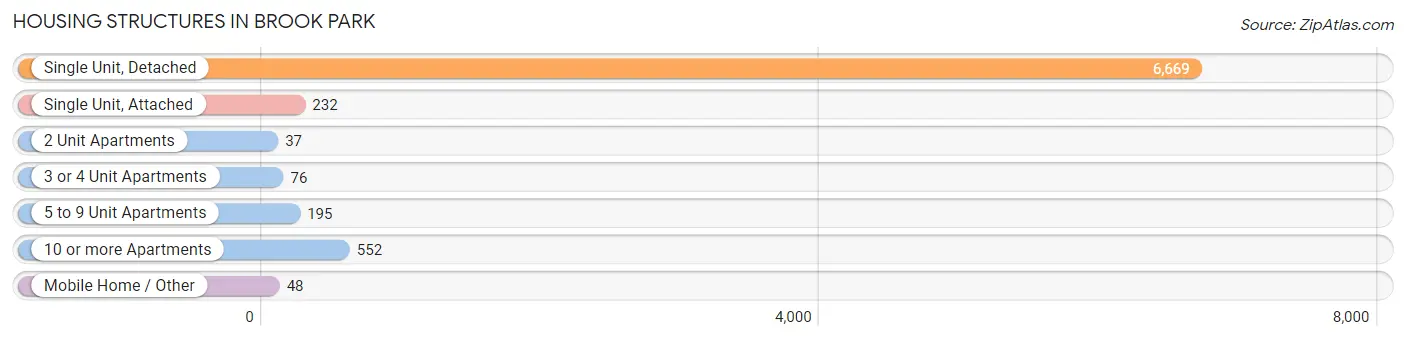
| Structure Type | # Housing Units | % Housing Units |
| Single Unit, Detached | 6,669 | 85.4% |
| Single Unit, Attached | 232 | 3.0% |
| 2 Unit Apartments | 37 | 0.5% |
| 3 or 4 Unit Apartments | 76 | 1.0% |
| 5 to 9 Unit Apartments | 195 | 2.5% |
| 10 or more Apartments | 552 | 7.1% |
| Mobile Home / Other | 48 | 0.6% |
| Total | 7,809 | 100.0% |
Housing Structures by Occupancy in Brook Park
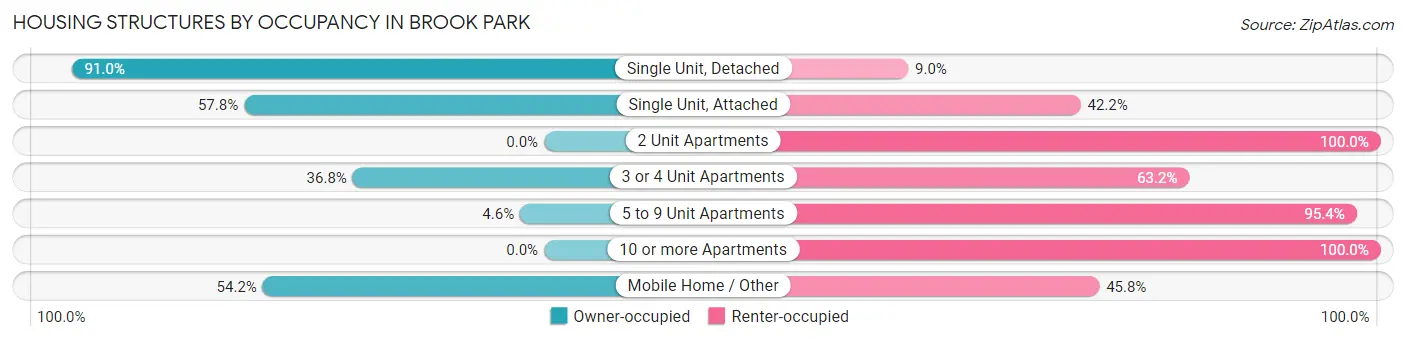
| Structure Type | Owner-occupied | Renter-occupied |
| Single Unit, Detached | 6,067 (91.0%) | 602 (9.0%) |
| Single Unit, Attached | 134 (57.8%) | 98 (42.2%) |
| 2 Unit Apartments | 0 (0.0%) | 37 (100.0%) |
| 3 or 4 Unit Apartments | 28 (36.8%) | 48 (63.2%) |
| 5 to 9 Unit Apartments | 9 (4.6%) | 186 (95.4%) |
| 10 or more Apartments | 0 (0.0%) | 552 (100.0%) |
| Mobile Home / Other | 26 (54.2%) | 22 (45.8%) |
| Total | 6,264 (80.2%) | 1,545 (19.8%) |
Housing Structures by Number of Rooms in Brook Park
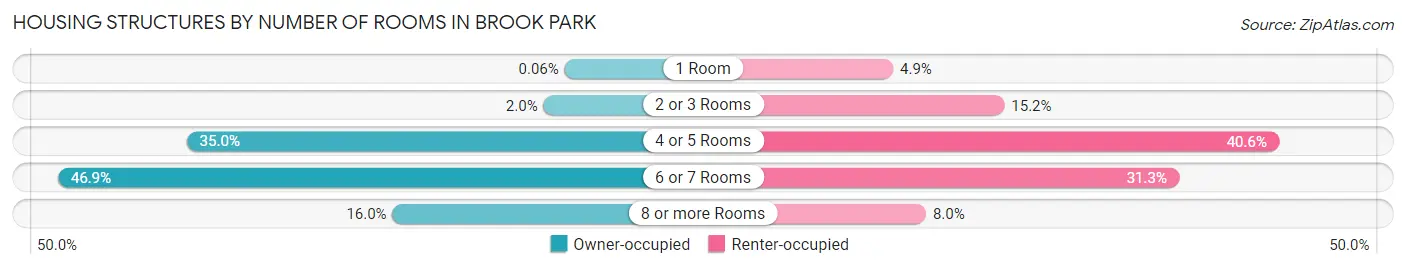
| Number of Rooms | Owner-occupied | Renter-occupied |
| 1 Room | 4 (0.1%) | 76 (4.9%) |
| 2 or 3 Rooms | 126 (2.0%) | 235 (15.2%) |
| 4 or 5 Rooms | 2,193 (35.0%) | 627 (40.6%) |
| 6 or 7 Rooms | 2,940 (46.9%) | 484 (31.3%) |
| 8 or more Rooms | 1,001 (16.0%) | 123 (8.0%) |
| Total | 6,264 (100.0%) | 1,545 (100.0%) |
Housing Structure by Heating Type in Brook Park
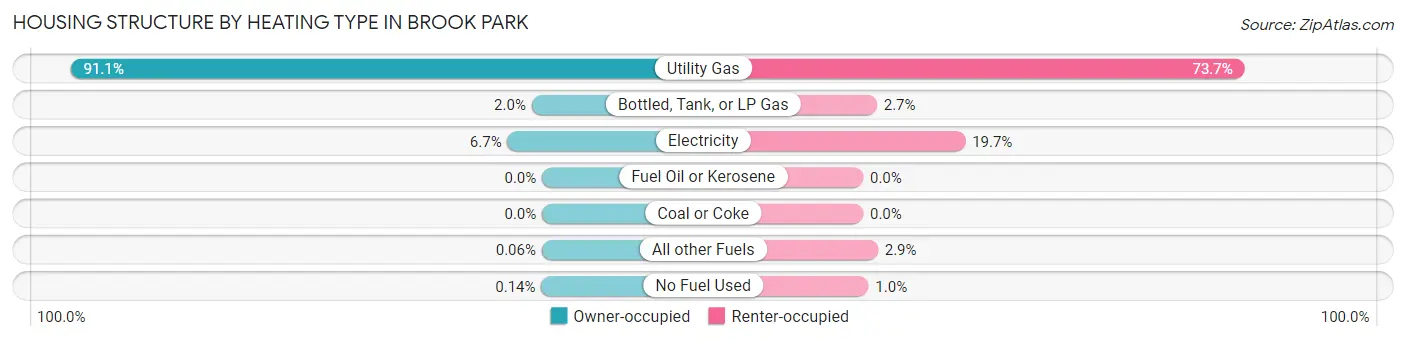
| Heating Type | Owner-occupied | Renter-occupied |
| Utility Gas | 5,707 (91.1%) | 1,139 (73.7%) |
| Bottled, Tank, or LP Gas | 125 (2.0%) | 41 (2.6%) |
| Electricity | 419 (6.7%) | 305 (19.7%) |
| Fuel Oil or Kerosene | 0 (0.0%) | 0 (0.0%) |
| Coal or Coke | 0 (0.0%) | 0 (0.0%) |
| All other Fuels | 4 (0.1%) | 44 (2.9%) |
| No Fuel Used | 9 (0.1%) | 16 (1.0%) |
| Total | 6,264 (100.0%) | 1,545 (100.0%) |
Household Vehicle Usage in Brook Park
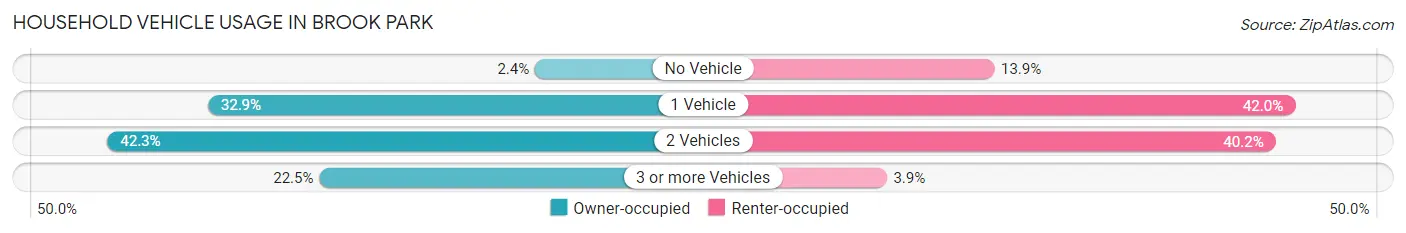
| Vehicles per Household | Owner-occupied | Renter-occupied |
| No Vehicle | 147 (2.4%) | 215 (13.9%) |
| 1 Vehicle | 2,060 (32.9%) | 649 (42.0%) |
| 2 Vehicles | 2,648 (42.3%) | 621 (40.2%) |
| 3 or more Vehicles | 1,409 (22.5%) | 60 (3.9%) |
| Total | 6,264 (100.0%) | 1,545 (100.0%) |
Real Estate & Mortgages in Brook Park
Real Estate and Mortgage Overview in Brook Park
| Characteristic | Without Mortgage | With Mortgage |
| Housing Units | 2,707 | 3,557 |
| Median Property Value | $146,500 | $147,700 |
| Median Household Income | $64,651 | $347 |
| Monthly Housing Costs | $532 | $0 |
| Real Estate Taxes | $2,591 | $35 |
Property Value by Mortgage Status in Brook Park
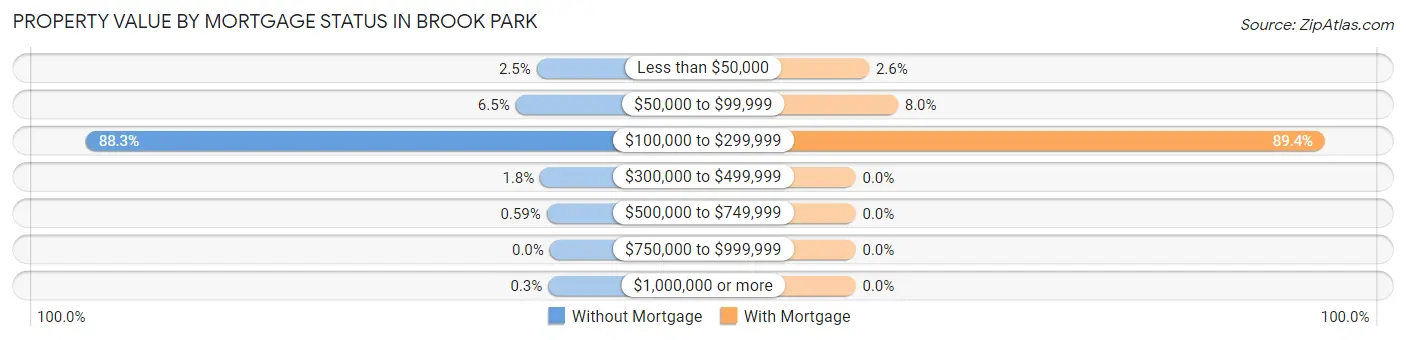
| Property Value | Without Mortgage | With Mortgage |
| Less than $50,000 | 67 (2.5%) | 91 (2.6%) |
| $50,000 to $99,999 | 176 (6.5%) | 286 (8.0%) |
| $100,000 to $299,999 | 2,391 (88.3%) | 3,180 (89.4%) |
| $300,000 to $499,999 | 49 (1.8%) | 0 (0.0%) |
| $500,000 to $749,999 | 16 (0.6%) | 0 (0.0%) |
| $750,000 to $999,999 | 0 (0.0%) | 0 (0.0%) |
| $1,000,000 or more | 8 (0.3%) | 0 (0.0%) |
| Total | 2,707 (100.0%) | 3,557 (100.0%) |
Household Income by Mortgage Status in Brook Park
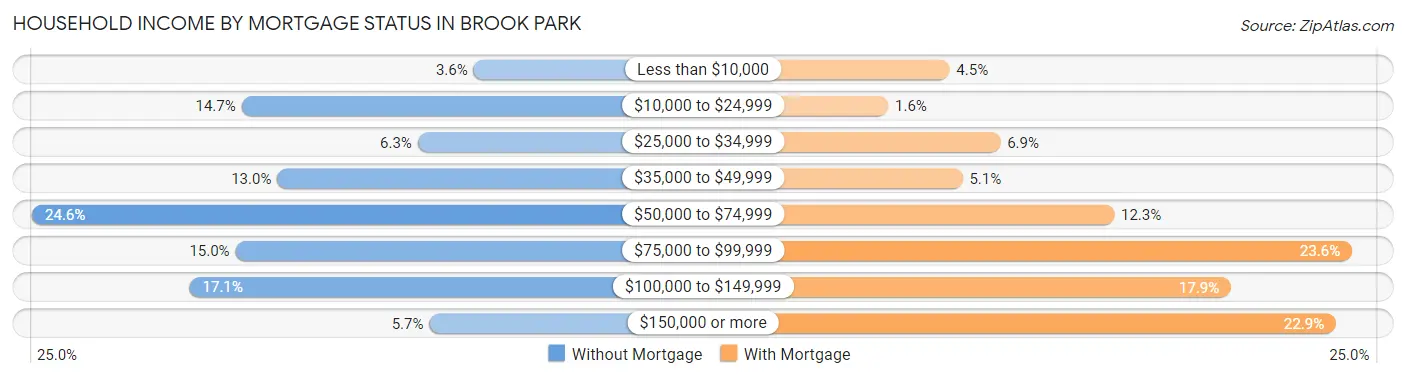
| Household Income | Without Mortgage | With Mortgage |
| Less than $10,000 | 98 (3.6%) | 159 (4.5%) |
| $10,000 to $24,999 | 397 (14.7%) | 55 (1.5%) |
| $25,000 to $34,999 | 170 (6.3%) | 245 (6.9%) |
| $35,000 to $49,999 | 351 (13.0%) | 181 (5.1%) |
| $50,000 to $74,999 | 667 (24.6%) | 438 (12.3%) |
| $75,000 to $99,999 | 405 (15.0%) | 841 (23.6%) |
| $100,000 to $149,999 | 464 (17.1%) | 636 (17.9%) |
| $150,000 or more | 155 (5.7%) | 814 (22.9%) |
| Total | 2,707 (100.0%) | 3,557 (100.0%) |
Property Value to Household Income Ratio in Brook Park
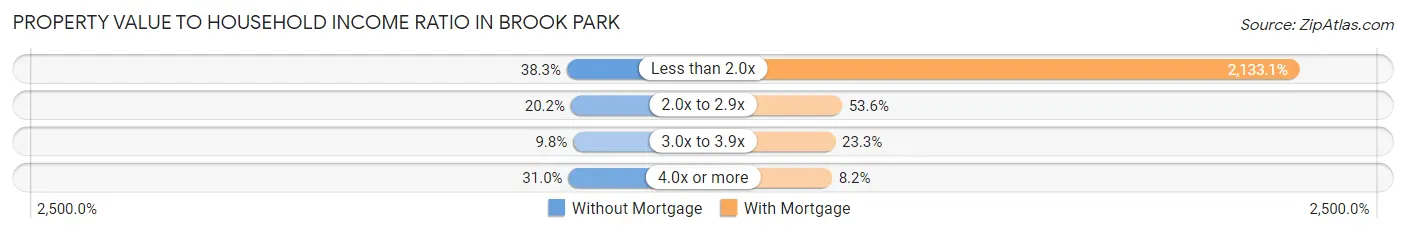
| Value-to-Income Ratio | Without Mortgage | With Mortgage |
| Less than 2.0x | 1,037 (38.3%) | 75,873 (2,133.1%) |
| 2.0x to 2.9x | 548 (20.2%) | 1,907 (53.6%) |
| 3.0x to 3.9x | 266 (9.8%) | 827 (23.3%) |
| 4.0x or more | 838 (31.0%) | 292 (8.2%) |
| Total | 2,707 (100.0%) | 3,557 (100.0%) |
Real Estate Taxes by Mortgage Status in Brook Park
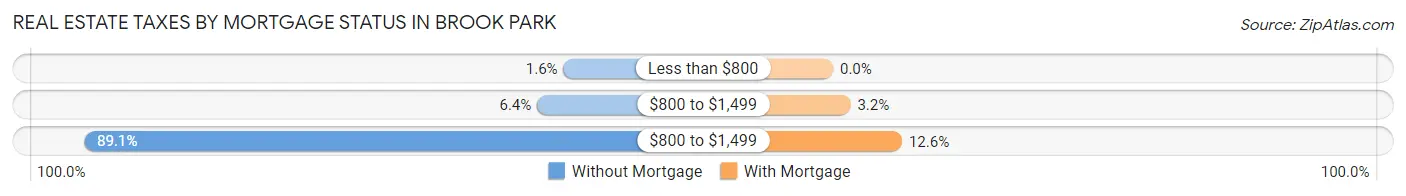
| Property Taxes | Without Mortgage | With Mortgage |
| Less than $800 | 43 (1.6%) | 0 (0.0%) |
| $800 to $1,499 | 173 (6.4%) | 113 (3.2%) |
| $800 to $1,499 | 2,413 (89.1%) | 448 (12.6%) |
| Total | 2,707 (100.0%) | 3,557 (100.0%) |
Health & Disability in Brook Park
Health Insurance Coverage by Age in Brook Park
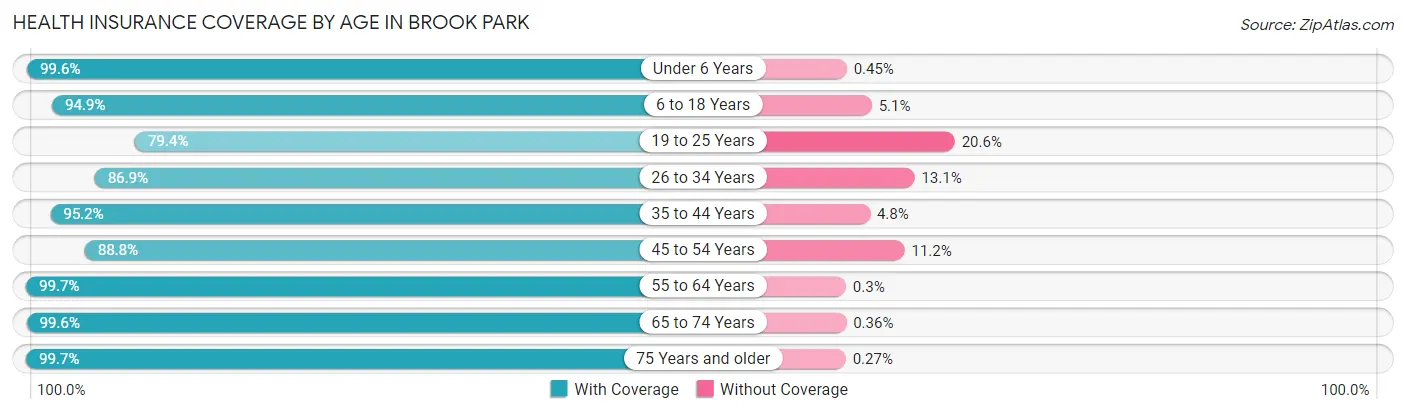
| Age Bracket | With Coverage | Without Coverage |
| Under 6 Years | 1,532 (99.6%) | 7 (0.4%) |
| 6 to 18 Years | 2,093 (94.9%) | 113 (5.1%) |
| 19 to 25 Years | 1,157 (79.4%) | 300 (20.6%) |
| 26 to 34 Years | 2,124 (86.9%) | 320 (13.1%) |
| 35 to 44 Years | 1,889 (95.2%) | 95 (4.8%) |
| 45 to 54 Years | 1,771 (88.8%) | 224 (11.2%) |
| 55 to 64 Years | 2,985 (99.7%) | 9 (0.3%) |
| 65 to 74 Years | 1,960 (99.6%) | 7 (0.4%) |
| 75 Years and older | 1,855 (99.7%) | 5 (0.3%) |
| Total | 17,366 (94.2%) | 1,080 (5.9%) |
Health Insurance Coverage by Citizenship Status in Brook Park
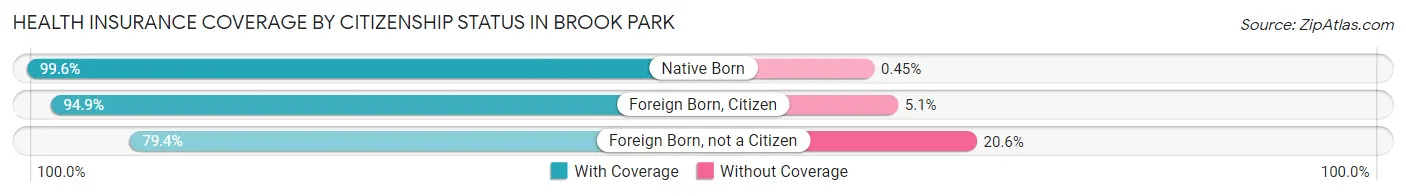
| Citizenship Status | With Coverage | Without Coverage |
| Native Born | 1,532 (99.6%) | 7 (0.4%) |
| Foreign Born, Citizen | 2,093 (94.9%) | 113 (5.1%) |
| Foreign Born, not a Citizen | 1,157 (79.4%) | 300 (20.6%) |
Health Insurance Coverage by Household Income in Brook Park
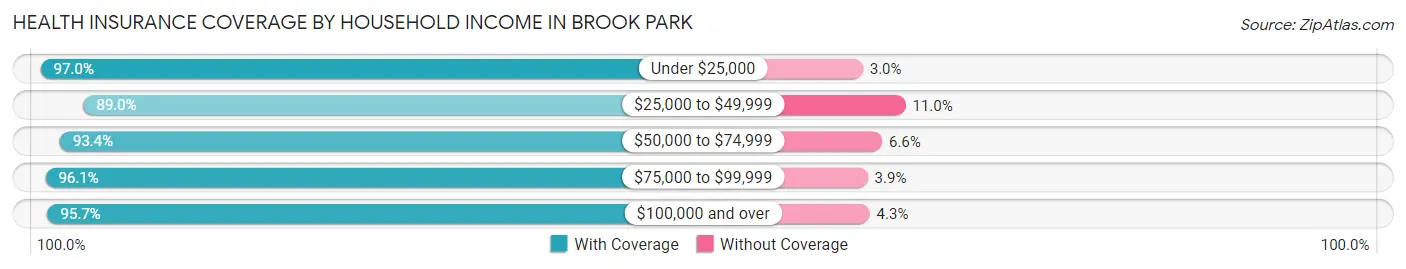
| Household Income | With Coverage | Without Coverage |
| Under $25,000 | 1,586 (97.0%) | 49 (3.0%) |
| $25,000 to $49,999 | 2,920 (89.0%) | 361 (11.0%) |
| $50,000 to $74,999 | 4,228 (93.4%) | 299 (6.6%) |
| $75,000 to $99,999 | 2,853 (96.1%) | 116 (3.9%) |
| $100,000 and over | 5,709 (95.7%) | 255 (4.3%) |
Public vs Private Health Insurance Coverage by Age in Brook Park
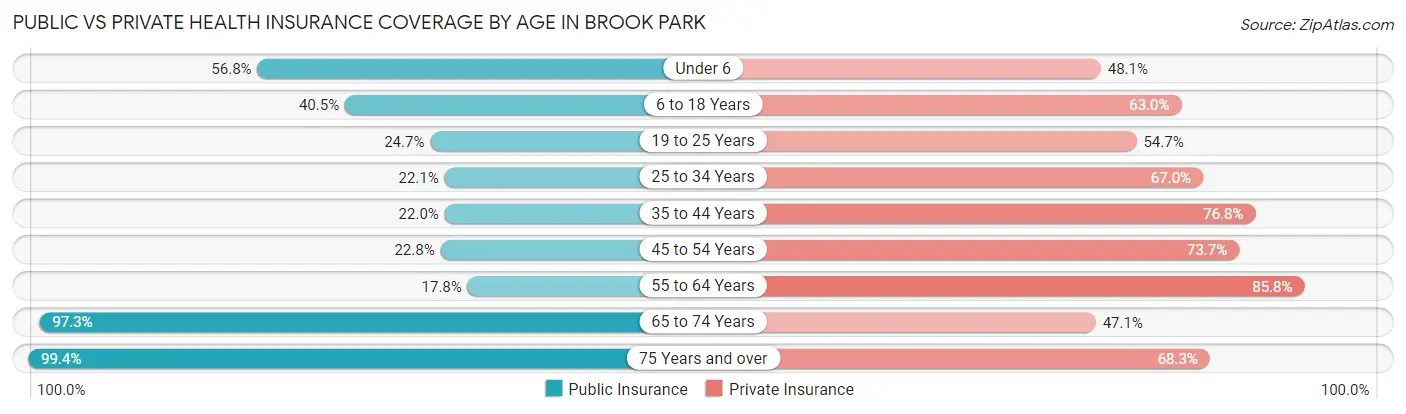
| Age Bracket | Public Insurance | Private Insurance |
| Under 6 | 874 (56.8%) | 740 (48.1%) |
| 6 to 18 Years | 894 (40.5%) | 1,390 (63.0%) |
| 19 to 25 Years | 360 (24.7%) | 797 (54.7%) |
| 25 to 34 Years | 539 (22.1%) | 1,638 (67.0%) |
| 35 to 44 Years | 437 (22.0%) | 1,523 (76.8%) |
| 45 to 54 Years | 455 (22.8%) | 1,471 (73.7%) |
| 55 to 64 Years | 532 (17.8%) | 2,570 (85.8%) |
| 65 to 74 Years | 1,913 (97.3%) | 927 (47.1%) |
| 75 Years and over | 1,848 (99.4%) | 1,270 (68.3%) |
| Total | 7,852 (42.6%) | 12,326 (66.8%) |
Disability Status by Sex by Age in Brook Park
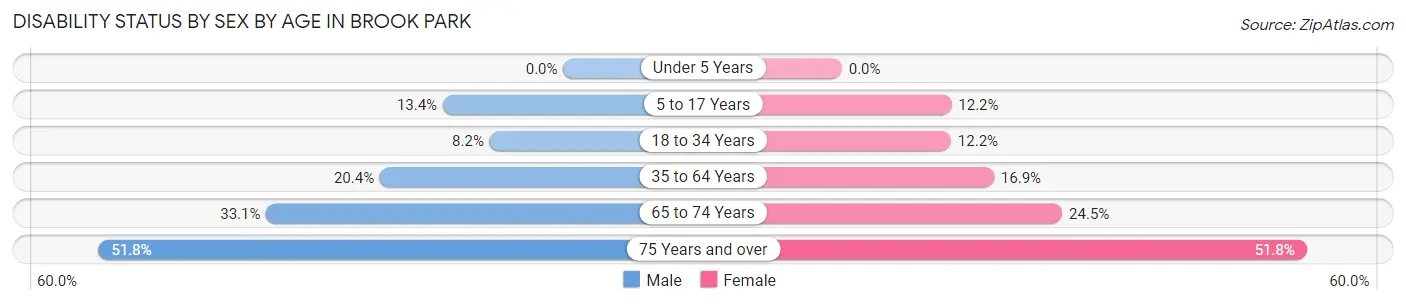
| Age Bracket | Male | Female |
| Under 5 Years | 0 (0.0%) | 0 (0.0%) |
| 5 to 17 Years | 157 (13.4%) | 126 (12.2%) |
| 18 to 34 Years | 180 (8.2%) | 225 (12.1%) |
| 35 to 64 Years | 668 (20.4%) | 627 (16.9%) |
| 65 to 74 Years | 342 (33.1%) | 229 (24.5%) |
| 75 Years and over | 378 (51.8%) | 585 (51.8%) |
Disability Class by Sex by Age in Brook Park
Disability Class: Hearing Difficulty
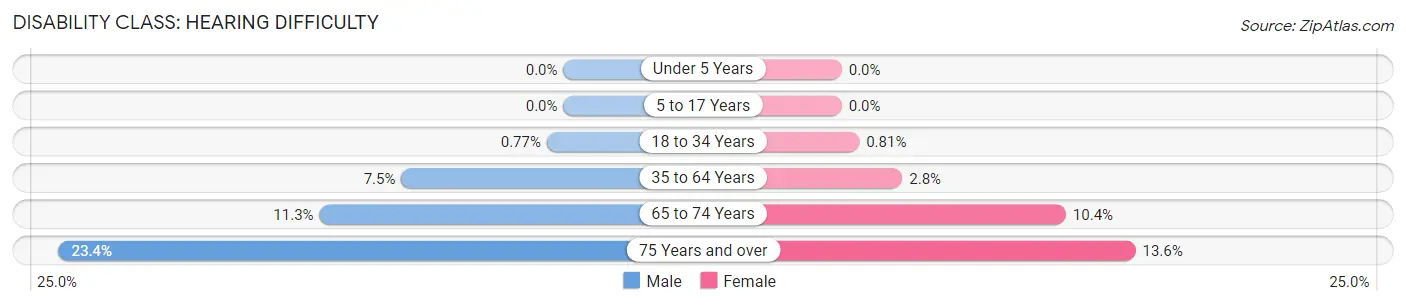
| Age Bracket | Male | Female |
| Under 5 Years | 0 (0.0%) | 0 (0.0%) |
| 5 to 17 Years | 0 (0.0%) | 0 (0.0%) |
| 18 to 34 Years | 17 (0.8%) | 15 (0.8%) |
| 35 to 64 Years | 246 (7.5%) | 104 (2.8%) |
| 65 to 74 Years | 117 (11.3%) | 97 (10.4%) |
| 75 Years and over | 171 (23.4%) | 154 (13.6%) |
Disability Class: Vision Difficulty
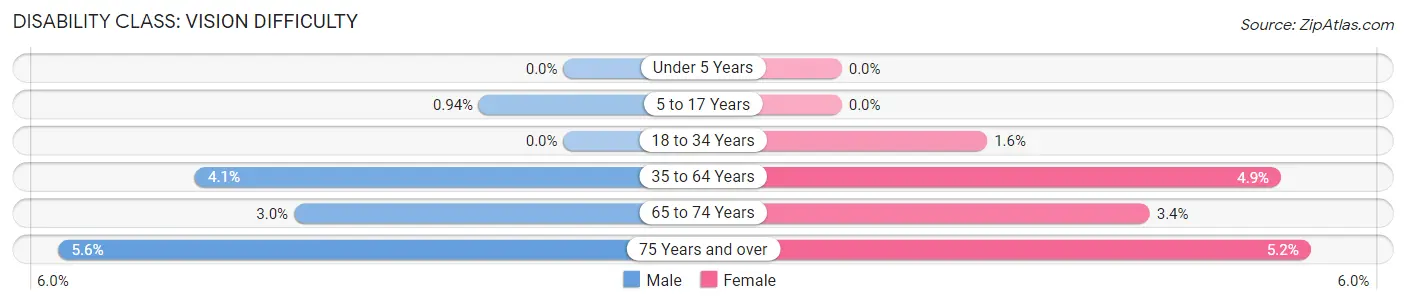
| Age Bracket | Male | Female |
| Under 5 Years | 0 (0.0%) | 0 (0.0%) |
| 5 to 17 Years | 11 (0.9%) | 0 (0.0%) |
| 18 to 34 Years | 0 (0.0%) | 30 (1.6%) |
| 35 to 64 Years | 134 (4.1%) | 181 (4.9%) |
| 65 to 74 Years | 31 (3.0%) | 32 (3.4%) |
| 75 Years and over | 41 (5.6%) | 59 (5.2%) |
Disability Class: Cognitive Difficulty
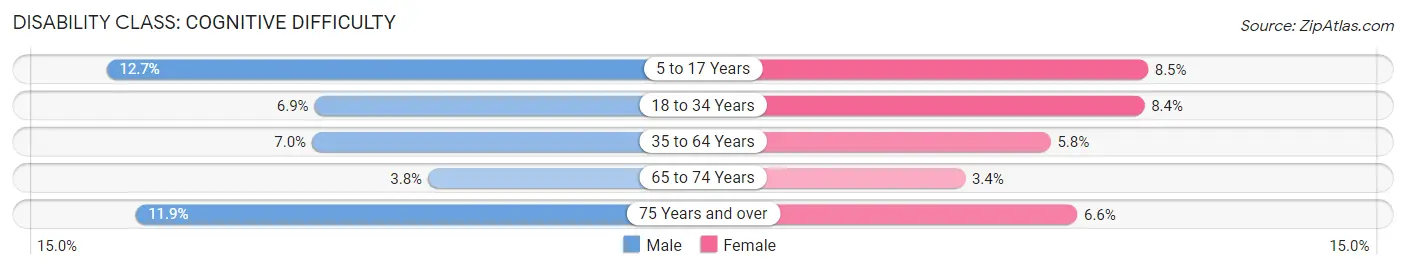
| Age Bracket | Male | Female |
| 5 to 17 Years | 149 (12.7%) | 88 (8.5%) |
| 18 to 34 Years | 152 (6.9%) | 156 (8.4%) |
| 35 to 64 Years | 229 (7.0%) | 215 (5.8%) |
| 65 to 74 Years | 39 (3.8%) | 32 (3.4%) |
| 75 Years and over | 87 (11.9%) | 74 (6.6%) |
Disability Class: Ambulatory Difficulty
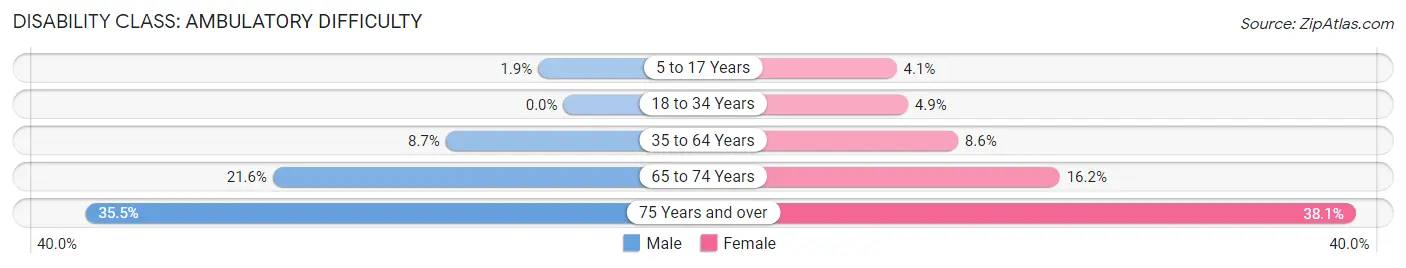
| Age Bracket | Male | Female |
| 5 to 17 Years | 22 (1.9%) | 42 (4.1%) |
| 18 to 34 Years | 0 (0.0%) | 91 (4.9%) |
| 35 to 64 Years | 286 (8.7%) | 319 (8.6%) |
| 65 to 74 Years | 223 (21.6%) | 151 (16.2%) |
| 75 Years and over | 259 (35.5%) | 431 (38.1%) |
Disability Class: Self-Care Difficulty
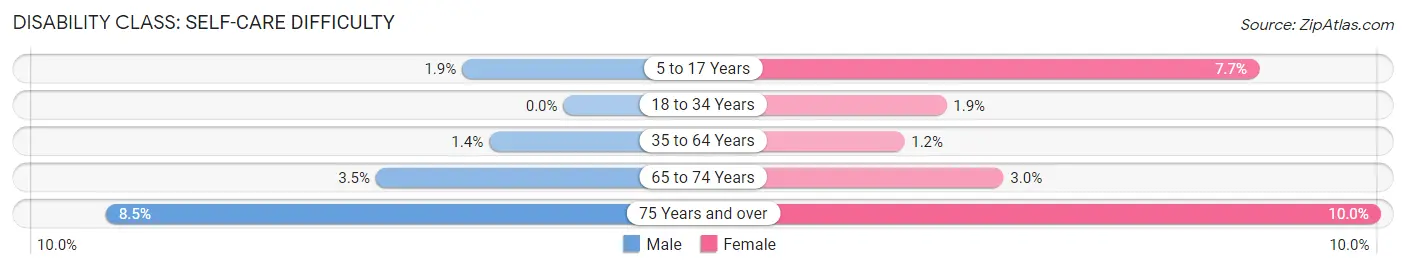
| Age Bracket | Male | Female |
| 5 to 17 Years | 22 (1.9%) | 80 (7.7%) |
| 18 to 34 Years | 0 (0.0%) | 36 (1.9%) |
| 35 to 64 Years | 45 (1.4%) | 43 (1.2%) |
| 65 to 74 Years | 36 (3.5%) | 28 (3.0%) |
| 75 Years and over | 62 (8.5%) | 113 (10.0%) |
Technology Access in Brook Park
Computing Device Access in Brook Park
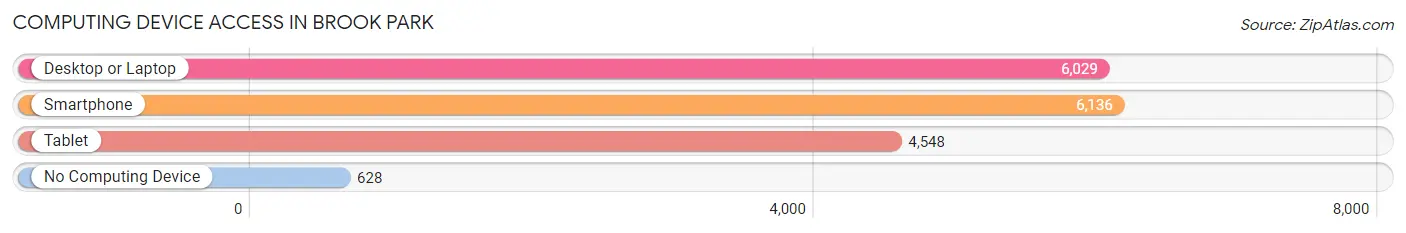
| Device Type | # Households | % Households |
| Desktop or Laptop | 6,029 | 77.2% |
| Smartphone | 6,136 | 78.6% |
| Tablet | 4,548 | 58.2% |
| No Computing Device | 628 | 8.0% |
| Total | 7,809 | 100.0% |
Internet Access in Brook Park
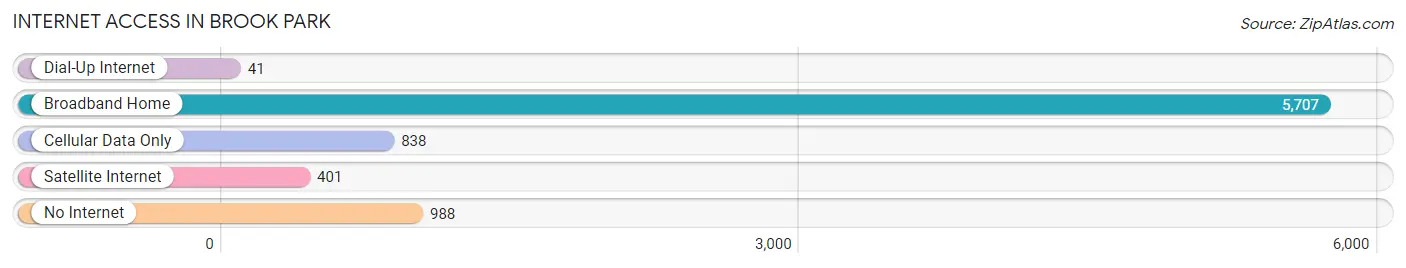
| Internet Type | # Households | % Households |
| Dial-Up Internet | 41 | 0.5% |
| Broadband Home | 5,707 | 73.1% |
| Cellular Data Only | 838 | 10.7% |
| Satellite Internet | 401 | 5.1% |
| No Internet | 988 | 12.7% |
| Total | 7,809 | 100.0% |
Brook Park Summary
History
The city of Brook Park, Ohio is located in Cuyahoga County and is a suburb of Cleveland. The city was first settled in 1810 by a man named John Struthers, who was a Revolutionary War veteran. Struthers built a log cabin on the banks of the Rocky River and named the area “Struthersville”. The area was later renamed “Brook Park” in 1818, after the nearby brook.
In the late 1800s, the area began to grow as a farming community. The first post office was established in 1876 and the first school was built in 1877. The area continued to grow and by the early 1900s, the population had grown to over 500 people.
In the 1950s, the city began to experience rapid growth due to the construction of the Cleveland Hopkins International Airport. The airport brought many new jobs to the area and the population of Brook Park began to grow rapidly. By the 1970s, the population had grown to over 10,000 people.
Geography
Brook Park is located in Cuyahoga County, Ohio. It is situated on the western edge of Cleveland and is bordered by Middleburg Heights to the north, Parma to the east, and Berea to the south. The city covers an area of 4.7 square miles and has a population of 19,719 people, according to the 2010 census.
The city is located on the Rocky River, which flows through the city and is a popular spot for fishing and boating. The city is also home to several parks, including Brook Park Memorial Park, which features a playground, picnic area, and walking trails.
Economy
The economy of Brook Park is largely based on manufacturing and retail. The city is home to several large manufacturing companies, including Ford Motor Company, which has a large plant in the city. Other major employers in the city include the Cleveland Clinic, Cleveland Metroparks, and the Cleveland Hopkins International Airport.
The city also has a thriving retail sector, with several shopping centers and malls located in the city. The largest shopping center in the city is the Southland Shopping Center, which features over 100 stores and restaurants.
Demographics
According to the 2010 census, the population of Brook Park was 19,719 people. The population is largely white (87.3%), with smaller percentages of African Americans (7.2%), Asians (2.2%), and Hispanics (2.2%). The median household income in the city is $45,845, and the median age is 41.7 years.
The city is served by the Berea City School District, which includes four elementary schools, one middle school, and one high school. The city is also home to several private schools, including St. Mary’s Catholic School and the Brook Park Montessori School.
Conclusion
Brook Park, Ohio is a suburb of Cleveland located in Cuyahoga County. The city was first settled in 1810 and has since grown to a population of 19,719 people. The economy of the city is largely based on manufacturing and retail, and the city is served by the Berea City School District. The city is also home to several parks and shopping centers, making it a great place to live and work.
Common Questions
What is Per Capita Income in Brook Park?
Per Capita income in Brook Park is $31,746.
What is the Median Family Income in Brook Park?
Median Family Income in Brook Park is $74,297.
What is the Median Household income in Brook Park?
Median Household Income in Brook Park is $64,046.
What is Income or Wage Gap in Brook Park?
Income or Wage Gap in Brook Park is 21.8%.
Women in Brook Park earn 78.2 cents for every dollar earned by a man.
What is Family Income Deficit in Brook Park?
Family Income Deficit in Brook Park is $10,047.
Families that are below poverty line in Brook Park earn $10,047 less on average than the poverty threshold level.
What is Inequality or Gini Index in Brook Park?
Inequality or Gini Index in Brook Park is 0.36.
What is the Total Population of Brook Park?
Total Population of Brook Park is 18,509.
What is the Total Male Population of Brook Park?
Total Male Population of Brook Park is 9,103.
What is the Total Female Population of Brook Park?
Total Female Population of Brook Park is 9,406.
What is the Ratio of Males per 100 Females in Brook Park?
There are 96.78 Males per 100 Females in Brook Park.
What is the Ratio of Females per 100 Males in Brook Park?
There are 103.33 Females per 100 Males in Brook Park.
What is the Median Population Age in Brook Park?
Median Population Age in Brook Park is 42.8 Years.
What is the Average Family Size in Brook Park
Average Family Size in Brook Park is 3.0 People.
What is the Average Household Size in Brook Park
Average Household Size in Brook Park is 2.4 People.
How Large is the Labor Force in Brook Park?
There are 9,594 People in the Labor Forcein in Brook Park.
What is the Percentage of People in the Labor Force in Brook Park?
62.9% of People are in the Labor Force in Brook Park.
What is the Unemployment Rate in Brook Park?
Unemployment Rate in Brook Park is 5.3%.