Rowlett, TX Map & Demographics
Rowlett Map
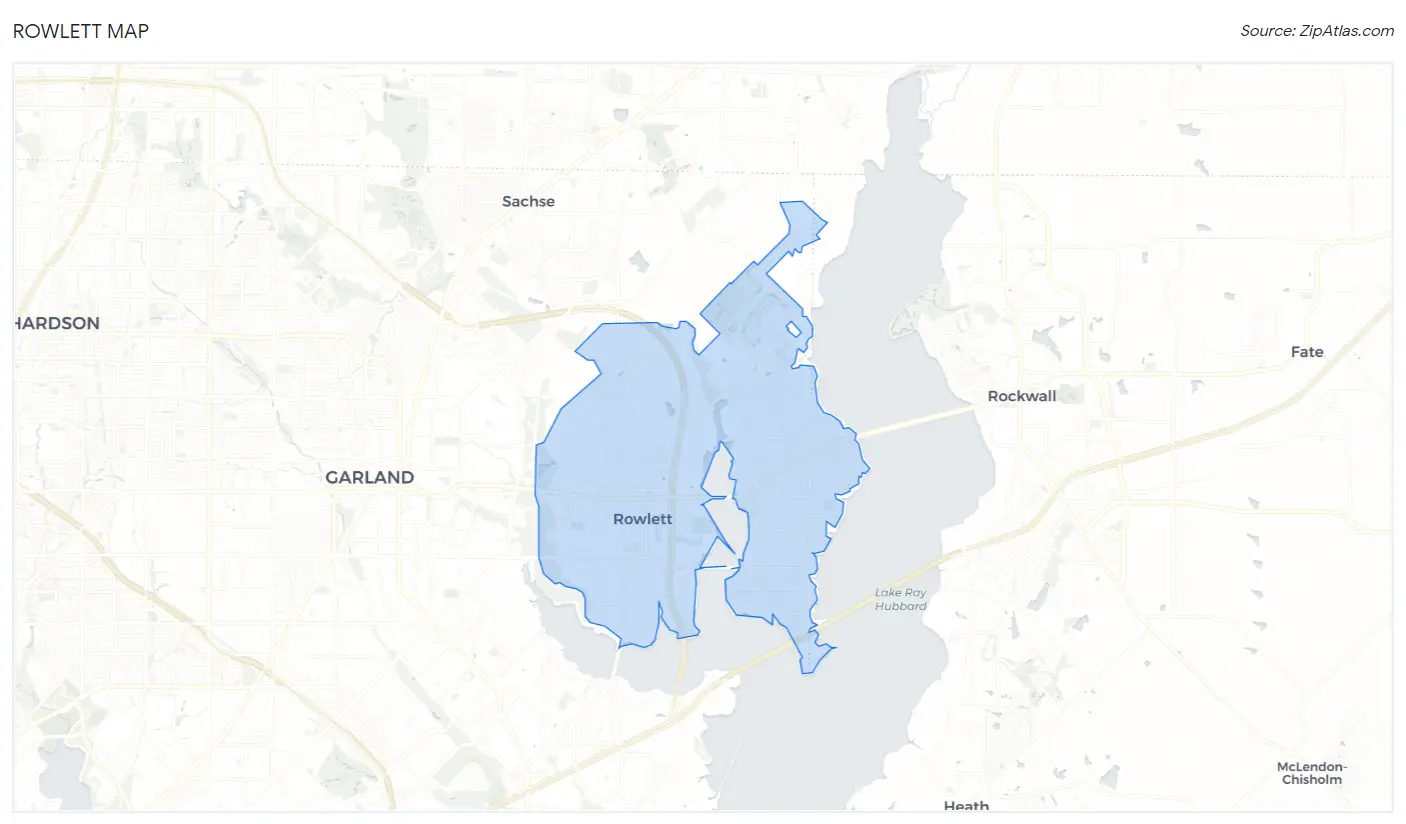
Rowlett Overview
$42,895
PER CAPITA INCOME
$119,200
AVG FAMILY INCOME
$110,954
AVG HOUSEHOLD INCOME
22.0%
WAGE / INCOME GAP [ % ]
78.0¢/ $1
WAGE / INCOME GAP [ $ ]
$10,899
FAMILY INCOME DEFICIT
0.37
INEQUALITY / GINI INDEX
63,291
TOTAL POPULATION
31,857
MALE POPULATION
31,434
FEMALE POPULATION
101.35
MALES / 100 FEMALES
98.67
FEMALES / 100 MALES
38.6
MEDIAN AGE
3.3
AVG FAMILY SIZE
2.9
AVG HOUSEHOLD SIZE
36,058
LABOR FORCE [ PEOPLE ]
71.3%
PERCENT IN LABOR FORCE
4.1%
UNEMPLOYMENT RATE
Income in Rowlett
Income Overview in Rowlett
Per Capita Income in Rowlett is $42,895, while median incomes of families and households are $119,200 and $110,954 respectively.
| Characteristic | Number | Measure |
| Per Capita Income | 63,291 | $42,895 |
| Median Family Income | 17,069 | $119,200 |
| Mean Family Income | 17,069 | $131,412 |
| Median Household Income | 21,371 | $110,954 |
| Mean Household Income | 21,371 | $124,134 |
| Income Deficit | 17,069 | $10,899 |
| Wage / Income Gap (%) | 63,291 | 22.00% |
| Wage / Income Gap ($) | 63,291 | 78.00¢ per $1 |
| Gini / Inequality Index | 63,291 | 0.37 |
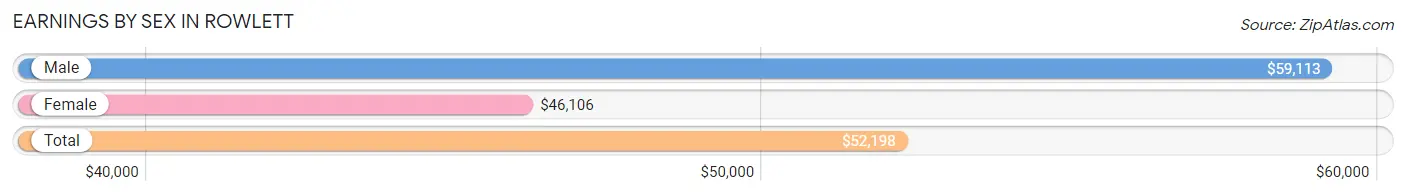
Earnings by Sex in Rowlett
Average Earnings in Rowlett are $52,198, $59,113 for men and $46,106 for women, a difference of 22.0%.
| Sex | Number | Average Earnings |
| Male | 20,253 (54.0%) | $59,113 |
| Female | 17,272 (46.0%) | $46,106 |
| Total | 37,525 (100.0%) | $52,198 |
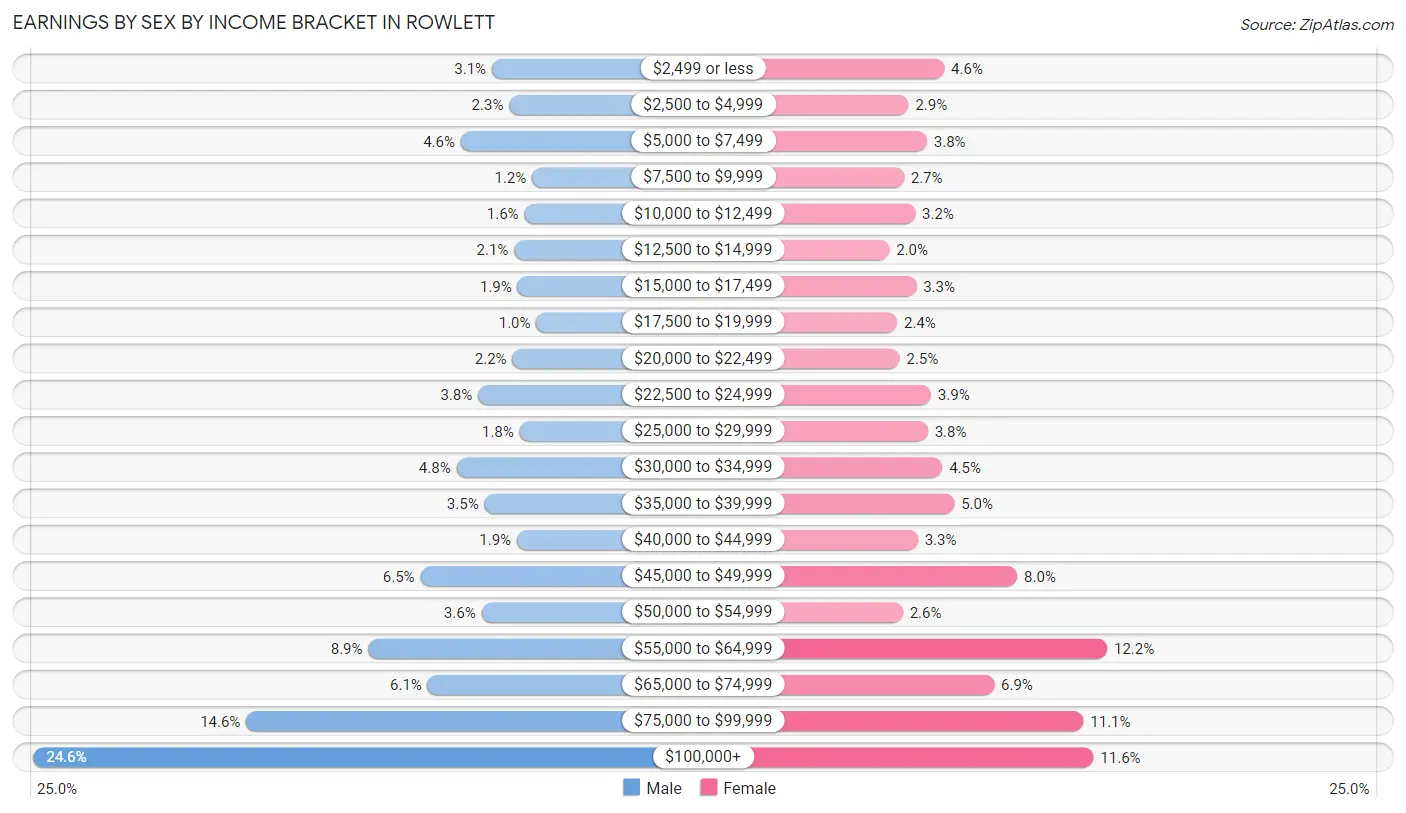
Earnings by Sex by Income Bracket in Rowlett
The most common earnings brackets in Rowlett are $100,000+ for men (4,980 | 24.6%) and $55,000 to $64,999 for women (2,105 | 12.2%).
| Income | Male | Female |
| $2,499 or less | 630 (3.1%) | 788 (4.6%) |
| $2,500 to $4,999 | 466 (2.3%) | 499 (2.9%) |
| $5,000 to $7,499 | 925 (4.6%) | 648 (3.7%) |
| $7,500 to $9,999 | 250 (1.2%) | 462 (2.7%) |
| $10,000 to $12,499 | 322 (1.6%) | 552 (3.2%) |
| $12,500 to $14,999 | 419 (2.1%) | 344 (2.0%) |
| $15,000 to $17,499 | 386 (1.9%) | 562 (3.3%) |
| $17,500 to $19,999 | 209 (1.0%) | 406 (2.4%) |
| $20,000 to $22,499 | 436 (2.1%) | 427 (2.5%) |
| $22,500 to $24,999 | 761 (3.8%) | 680 (3.9%) |
| $25,000 to $29,999 | 368 (1.8%) | 654 (3.8%) |
| $30,000 to $34,999 | 966 (4.8%) | 772 (4.5%) |
| $35,000 to $39,999 | 700 (3.5%) | 868 (5.0%) |
| $40,000 to $44,999 | 392 (1.9%) | 574 (3.3%) |
| $45,000 to $49,999 | 1,309 (6.5%) | 1,379 (8.0%) |
| $50,000 to $54,999 | 730 (3.6%) | 452 (2.6%) |
| $55,000 to $64,999 | 1,803 (8.9%) | 2,105 (12.2%) |
| $65,000 to $74,999 | 1,239 (6.1%) | 1,192 (6.9%) |
| $75,000 to $99,999 | 2,962 (14.6%) | 1,913 (11.1%) |
| $100,000+ | 4,980 (24.6%) | 1,995 (11.6%) |
| Total | 20,253 (100.0%) | 17,272 (100.0%) |
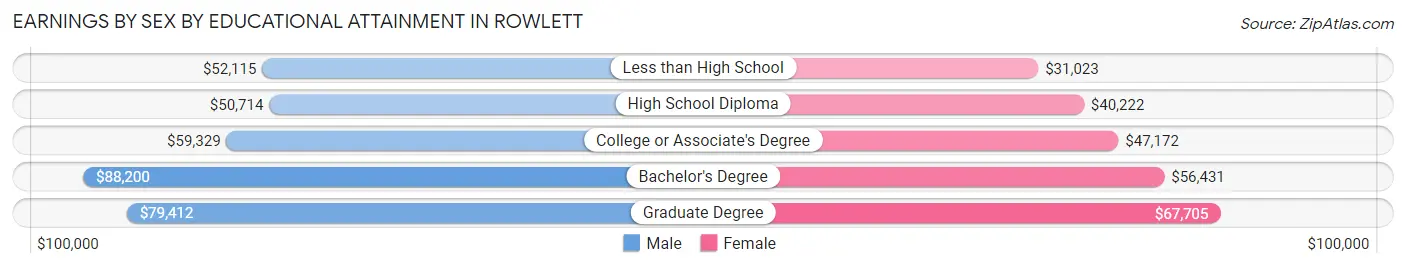
Earnings by Sex by Educational Attainment in Rowlett
Average earnings in Rowlett are $67,201 for men and $48,926 for women, a difference of 27.2%. Men with an educational attainment of bachelor's degree enjoy the highest average annual earnings of $88,200, while those with high school diploma education earn the least with $50,714. Women with an educational attainment of graduate degree earn the most with the average annual earnings of $67,705, while those with less than high school education have the smallest earnings of $31,023.
| Educational Attainment | Male Income | Female Income |
| Less than High School | $52,115 | $31,023 |
| High School Diploma | $50,714 | $40,222 |
| College or Associate's Degree | $59,329 | $47,172 |
| Bachelor's Degree | $88,200 | $56,431 |
| Graduate Degree | $79,412 | $67,705 |
| Total | $67,201 | $48,926 |
Family Income in Rowlett
Family Income Brackets in Rowlett
According to the Rowlett family income data, there are 4,131 families falling into the $100,000 to $149,999 income range, which is the most common income bracket and makes up 24.2% of all families. Conversely, the $10,000 to $14,999 income bracket is the least frequent group with only 256 families (1.5%) belonging to this category.
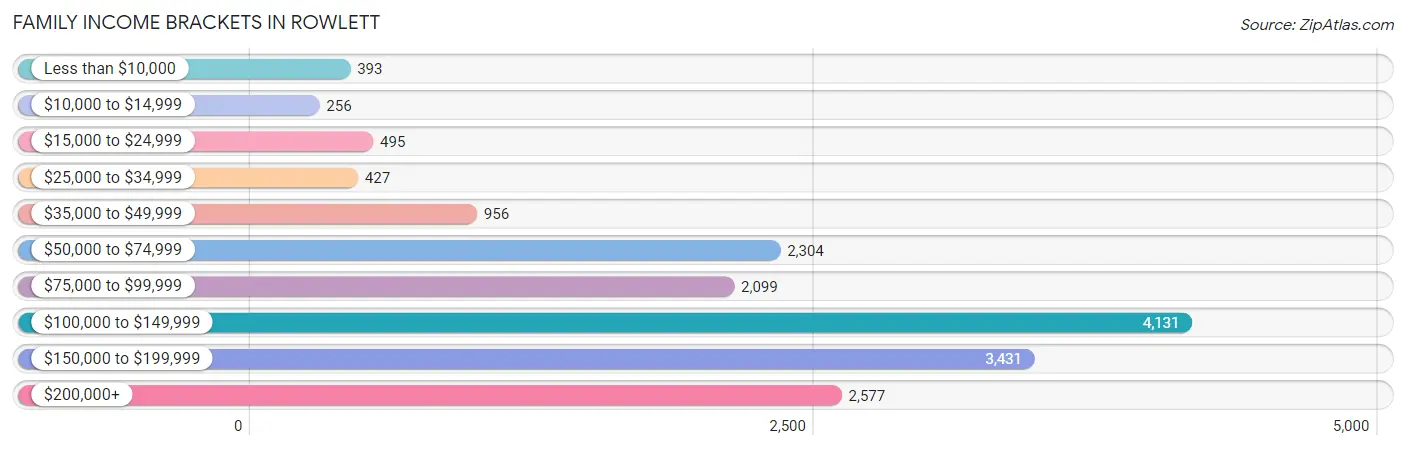
| Income Bracket | # Families | % Families |
| Less than $10,000 | 393 | 2.3% |
| $10,000 to $14,999 | 256 | 1.5% |
| $15,000 to $24,999 | 495 | 2.9% |
| $25,000 to $34,999 | 427 | 2.5% |
| $35,000 to $49,999 | 956 | 5.6% |
| $50,000 to $74,999 | 2,304 | 13.5% |
| $75,000 to $99,999 | 2,099 | 12.3% |
| $100,000 to $149,999 | 4,131 | 24.2% |
| $150,000 to $199,999 | 3,431 | 20.1% |
| $200,000+ | 2,577 | 15.1% |
Family Income by Famaliy Size in Rowlett
6-person families (620 | 3.6%) account for the highest median family income in Rowlett with $158,000 per family, while 2-person families (6,778 | 39.7%) have the highest median income of $55,664 per family member.
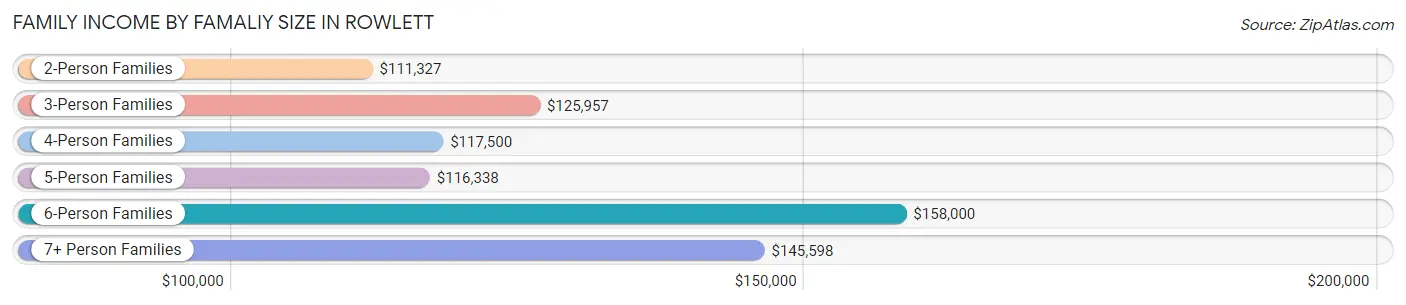
| Income Bracket | # Families | Median Income |
| 2-Person Families | 6,778 (39.7%) | $111,327 |
| 3-Person Families | 4,078 (23.9%) | $125,957 |
| 4-Person Families | 3,812 (22.3%) | $117,500 |
| 5-Person Families | 1,562 (9.1%) | $116,338 |
| 6-Person Families | 620 (3.6%) | $158,000 |
| 7+ Person Families | 219 (1.3%) | $145,598 |
| Total | 17,069 (100.0%) | $119,200 |
Family Income by Number of Earners in Rowlett
The median family income in Rowlett is $119,200, with families comprising 3+ earners (2,940) having the highest median family income of $173,810, while families with no earners (1,476) have the lowest median family income of $47,432, accounting for 17.2% and 8.6% of families, respectively.
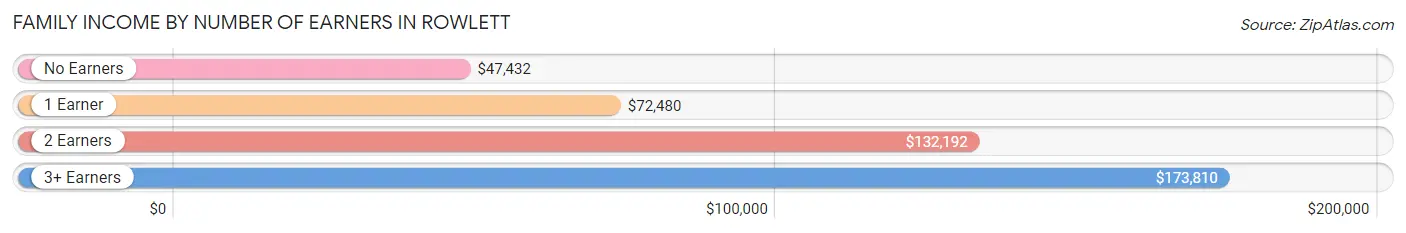
| Number of Earners | # Families | Median Income |
| No Earners | 1,476 (8.6%) | $47,432 |
| 1 Earner | 4,227 (24.8%) | $72,480 |
| 2 Earners | 8,426 (49.4%) | $132,192 |
| 3+ Earners | 2,940 (17.2%) | $173,810 |
| Total | 17,069 (100.0%) | $119,200 |
Household Income in Rowlett
Household Income Brackets in Rowlett
With 4,744 households falling in the category, the $100,000 to $149,999 income range is the most frequent in Rowlett, accounting for 22.2% of all households. In contrast, only 342 households (1.6%) fall into the $10,000 to $14,999 income bracket, making it the least populous group.
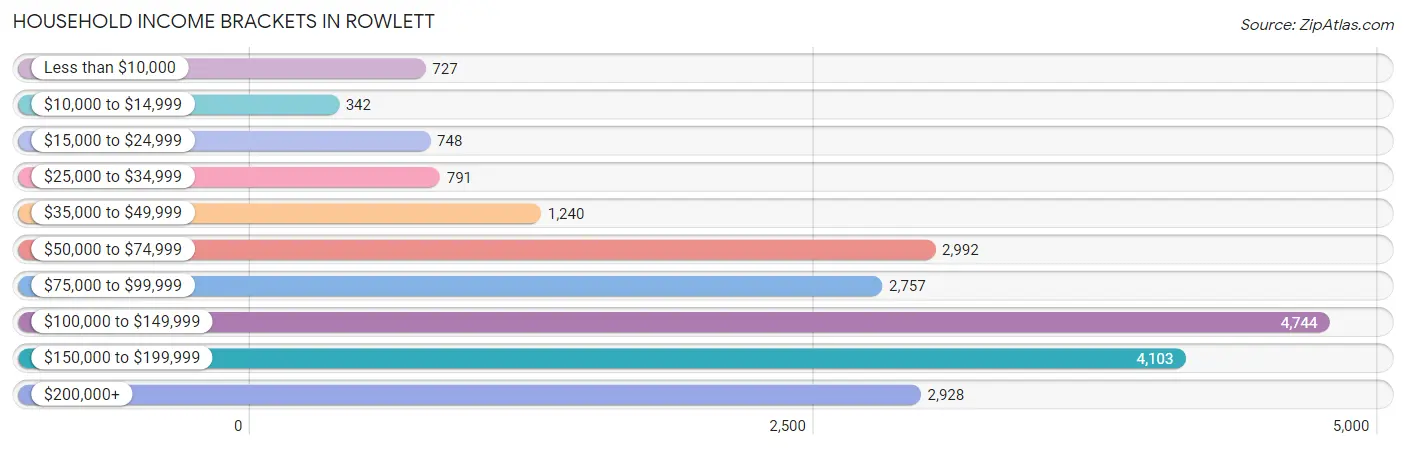
| Income Bracket | # Households | % Households |
| Less than $10,000 | 727 | 3.4% |
| $10,000 to $14,999 | 342 | 1.6% |
| $15,000 to $24,999 | 748 | 3.5% |
| $25,000 to $34,999 | 791 | 3.7% |
| $35,000 to $49,999 | 1,240 | 5.8% |
| $50,000 to $74,999 | 2,992 | 14.0% |
| $75,000 to $99,999 | 2,757 | 12.9% |
| $100,000 to $149,999 | 4,744 | 22.2% |
| $150,000 to $199,999 | 4,103 | 19.2% |
| $200,000+ | 2,928 | 13.7% |
Household Income by Householder Age in Rowlett
The median household income in Rowlett is $110,954, with the highest median household income of $130,792 found in the 45 to 64 years age bracket for the primary householder. A total of 10,144 households (47.5%) fall into this category. Meanwhile, the 15 to 24 years age bracket for the primary householder has the lowest median household income of $61,307, with 308 households (1.4%) in this group.
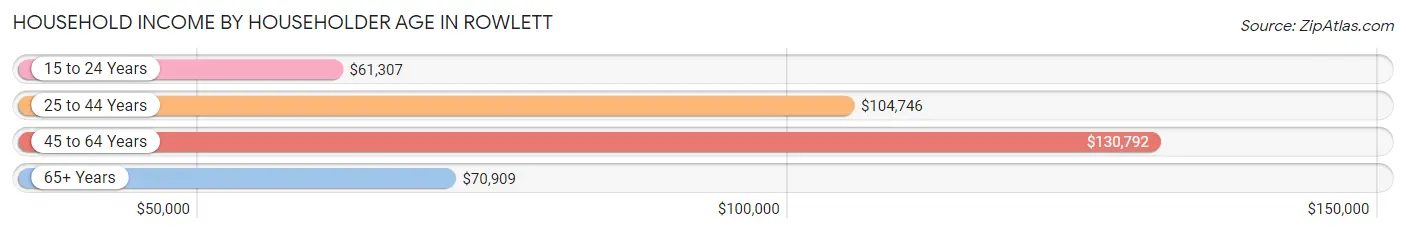
| Income Bracket | # Households | Median Income |
| 15 to 24 Years | 308 (1.4%) | $61,307 |
| 25 to 44 Years | 7,195 (33.7%) | $104,746 |
| 45 to 64 Years | 10,144 (47.5%) | $130,792 |
| 65+ Years | 3,724 (17.4%) | $70,909 |
| Total | 21,371 (100.0%) | $110,954 |
Poverty in Rowlett
Income Below Poverty by Sex and Age in Rowlett
With 6.6% poverty level for males and 8.2% for females among the residents of Rowlett, 5 year old males and 18 to 24 year old females are the most vulnerable to poverty, with 123 males (26.4%) and 338 females (15.6%) in their respective age groups living below the poverty level.
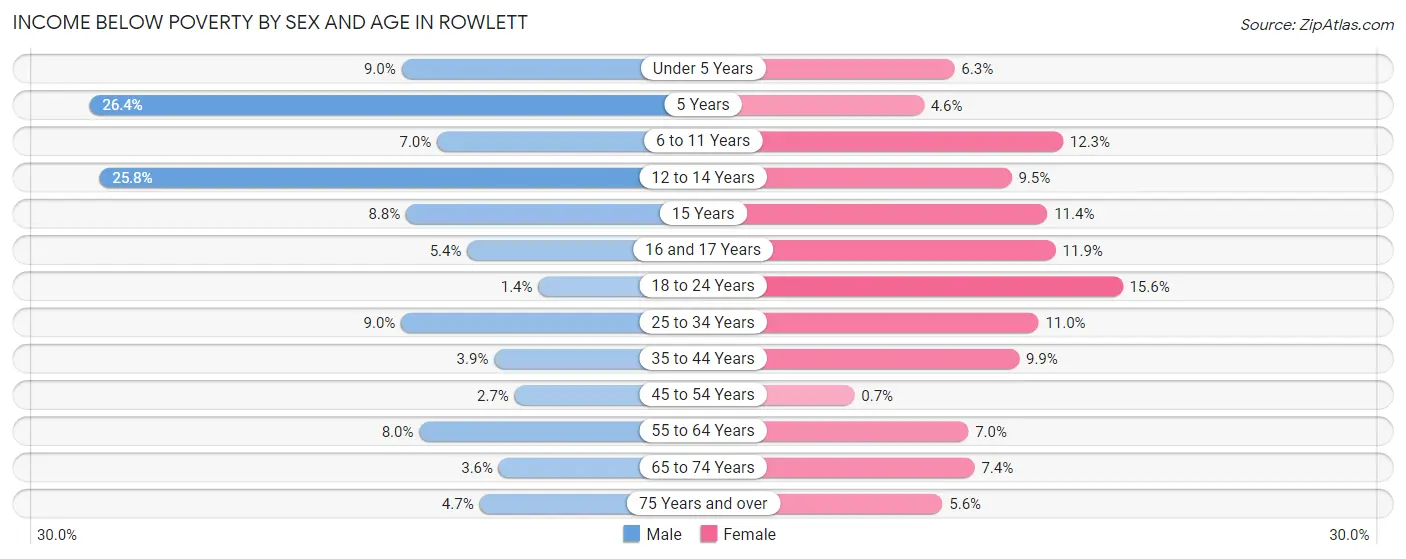
| Age Bracket | Male | Female |
| Under 5 Years | 166 (9.0%) | 126 (6.3%) |
| 5 Years | 123 (26.4%) | 15 (4.6%) |
| 6 to 11 Years | 175 (7.0%) | 298 (12.3%) |
| 12 to 14 Years | 255 (25.8%) | 89 (9.5%) |
| 15 Years | 66 (8.8%) | 47 (11.4%) |
| 16 and 17 Years | 60 (5.3%) | 119 (11.9%) |
| 18 to 24 Years | 38 (1.4%) | 338 (15.6%) |
| 25 to 34 Years | 453 (9.0%) | 458 (11.0%) |
| 35 to 44 Years | 136 (3.8%) | 451 (9.9%) |
| 45 to 54 Years | 132 (2.7%) | 33 (0.7%) |
| 55 to 64 Years | 366 (8.0%) | 323 (7.0%) |
| 65 to 74 Years | 81 (3.6%) | 178 (7.4%) |
| 75 Years and over | 51 (4.7%) | 78 (5.6%) |
| Total | 2,102 (6.6%) | 2,553 (8.2%) |
Income Above Poverty by Sex and Age in Rowlett
According to the poverty statistics in Rowlett, males aged 18 to 24 years and females aged 45 to 54 years are the age groups that are most secure financially, with 98.6% of males and 99.3% of females in these age groups living above the poverty line.
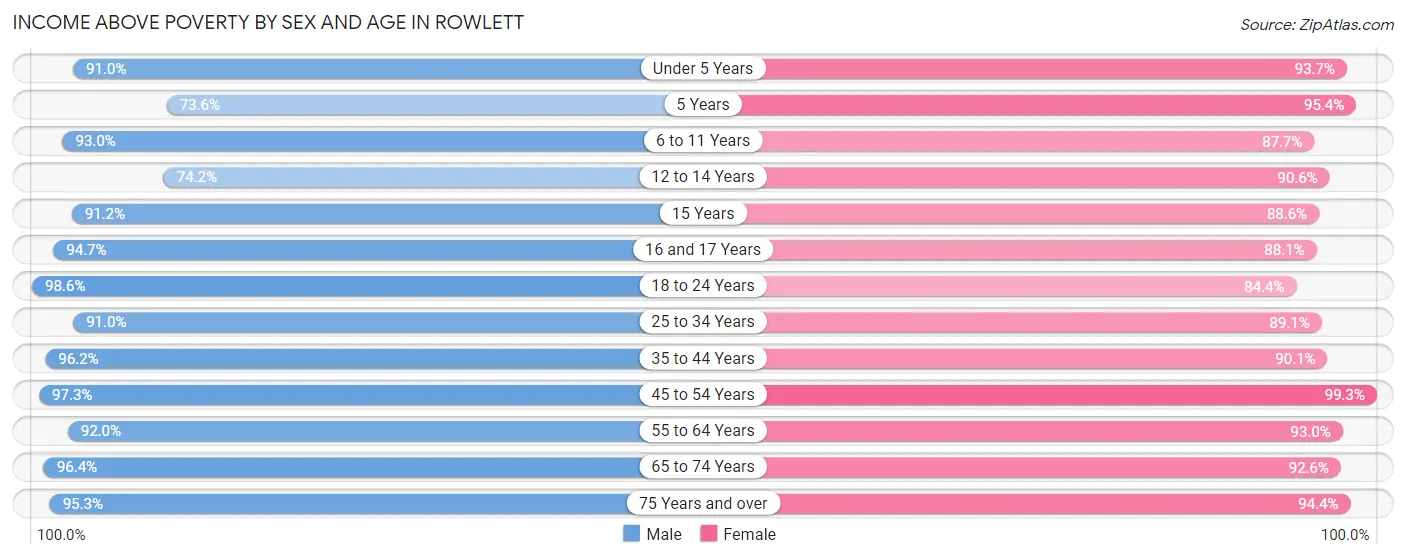
| Age Bracket | Male | Female |
| Under 5 Years | 1,677 (91.0%) | 1,883 (93.7%) |
| 5 Years | 343 (73.6%) | 314 (95.4%) |
| 6 to 11 Years | 2,314 (93.0%) | 2,122 (87.7%) |
| 12 to 14 Years | 732 (74.2%) | 853 (90.5%) |
| 15 Years | 687 (91.2%) | 364 (88.6%) |
| 16 and 17 Years | 1,062 (94.7%) | 880 (88.1%) |
| 18 to 24 Years | 2,698 (98.6%) | 1,824 (84.4%) |
| 25 to 34 Years | 4,561 (91.0%) | 3,726 (89.0%) |
| 35 to 44 Years | 3,395 (96.2%) | 4,118 (90.1%) |
| 45 to 54 Years | 4,732 (97.3%) | 4,698 (99.3%) |
| 55 to 64 Years | 4,200 (92.0%) | 4,267 (93.0%) |
| 65 to 74 Years | 2,175 (96.4%) | 2,232 (92.6%) |
| 75 Years and over | 1,041 (95.3%) | 1,316 (94.4%) |
| Total | 29,617 (93.4%) | 28,597 (91.8%) |
Income Below Poverty Among Married-Couple Families in Rowlett
The poverty statistics for married-couple families in Rowlett show that 4.2% or 591 of the total 14,069 families live below the poverty line. Families with 3 or 4 children have the highest poverty rate of 7.8%, comprising of 60 families. On the other hand, families with 5 or more children have the lowest poverty rate of 0.0%, which includes 0 families.
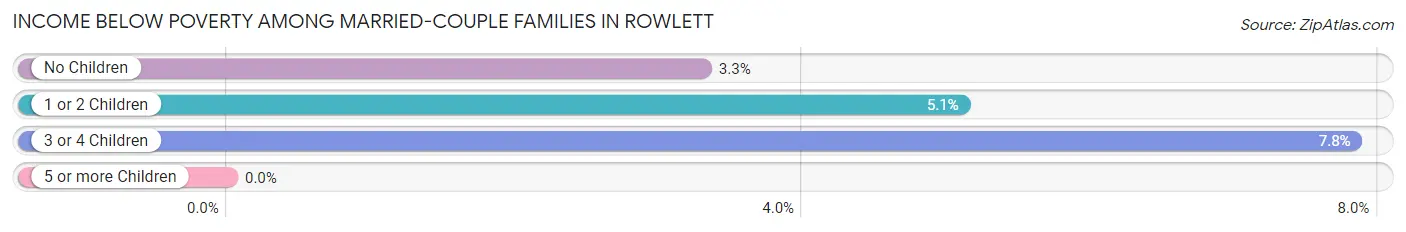
| Children | Above Poverty | Below Poverty |
| No Children | 7,929 (96.7%) | 271 (3.3%) |
| 1 or 2 Children | 4,836 (94.9%) | 260 (5.1%) |
| 3 or 4 Children | 706 (92.2%) | 60 (7.8%) |
| 5 or more Children | 7 (100.0%) | 0 (0.0%) |
| Total | 13,478 (95.8%) | 591 (4.2%) |
Income Below Poverty Among Single-Parent Households in Rowlett
According to the poverty data in Rowlett, 12.1% or 90 single-father households and 14.9% or 336 single-mother households are living below the poverty line. Among single-father households, those with 3 or 4 children have the highest poverty rate, with 12 households (24.5%) experiencing poverty. Likewise, among single-mother households, those with 5 or more children have the highest poverty rate, with 25 households (100.0%) falling below the poverty line.
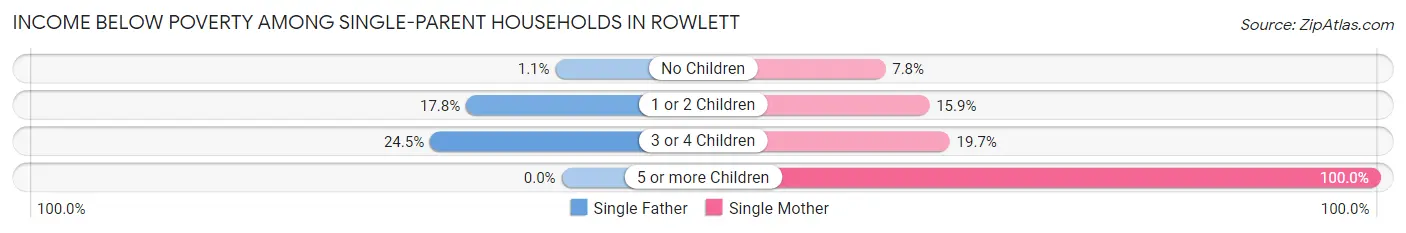
| Children | Single Father | Single Mother |
| No Children | 3 (1.1%) | 59 (7.7%) |
| 1 or 2 Children | 75 (17.8%) | 162 (15.9%) |
| 3 or 4 Children | 12 (24.5%) | 90 (19.7%) |
| 5 or more Children | 0 (0.0%) | 25 (100.0%) |
| Total | 90 (12.1%) | 336 (14.9%) |
Income Below Poverty Among Married-Couple vs Single-Parent Households in Rowlett
The poverty data for Rowlett shows that 591 of the married-couple family households (4.2%) and 426 of the single-parent households (14.2%) are living below the poverty level. Within the married-couple family households, those with 3 or 4 children have the highest poverty rate, with 60 households (7.8%) falling below the poverty line. Among the single-parent households, those with 5 or more children have the highest poverty rate, with 25 household (75.8%) living below poverty.
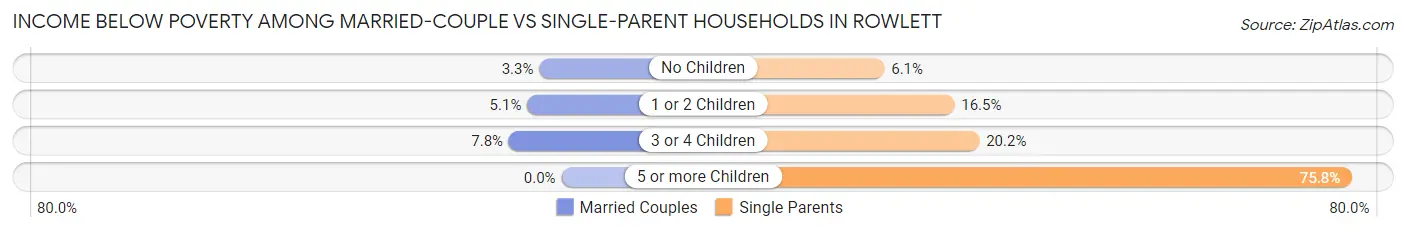
| Children | Married-Couple Families | Single-Parent Households |
| No Children | 271 (3.3%) | 62 (6.0%) |
| 1 or 2 Children | 260 (5.1%) | 237 (16.5%) |
| 3 or 4 Children | 60 (7.8%) | 102 (20.2%) |
| 5 or more Children | 0 (0.0%) | 25 (75.8%) |
| Total | 591 (4.2%) | 426 (14.2%) |
Race in Rowlett
The most populous races in Rowlett are White / Caucasian (36,718 | 58.0%), Black / African American (13,906 | 22.0%), and Hispanic or Latino (13,599 | 21.5%).
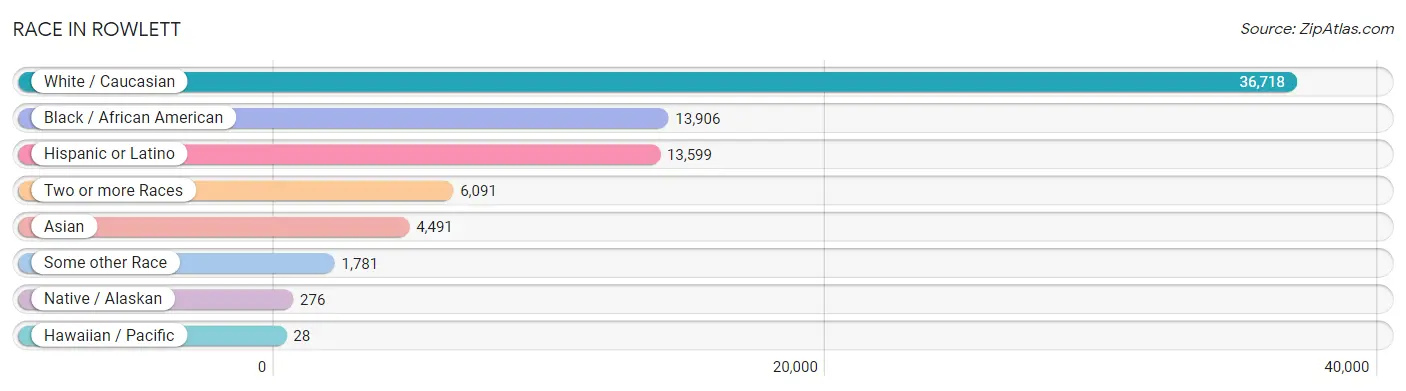
| Race | # Population | % Population |
| Asian | 4,491 | 7.1% |
| Black / African American | 13,906 | 22.0% |
| Hawaiian / Pacific | 28 | 0.0% |
| Hispanic or Latino | 13,599 | 21.5% |
| Native / Alaskan | 276 | 0.4% |
| White / Caucasian | 36,718 | 58.0% |
| Two or more Races | 6,091 | 9.6% |
| Some other Race | 1,781 | 2.8% |
| Total | 63,291 | 100.0% |
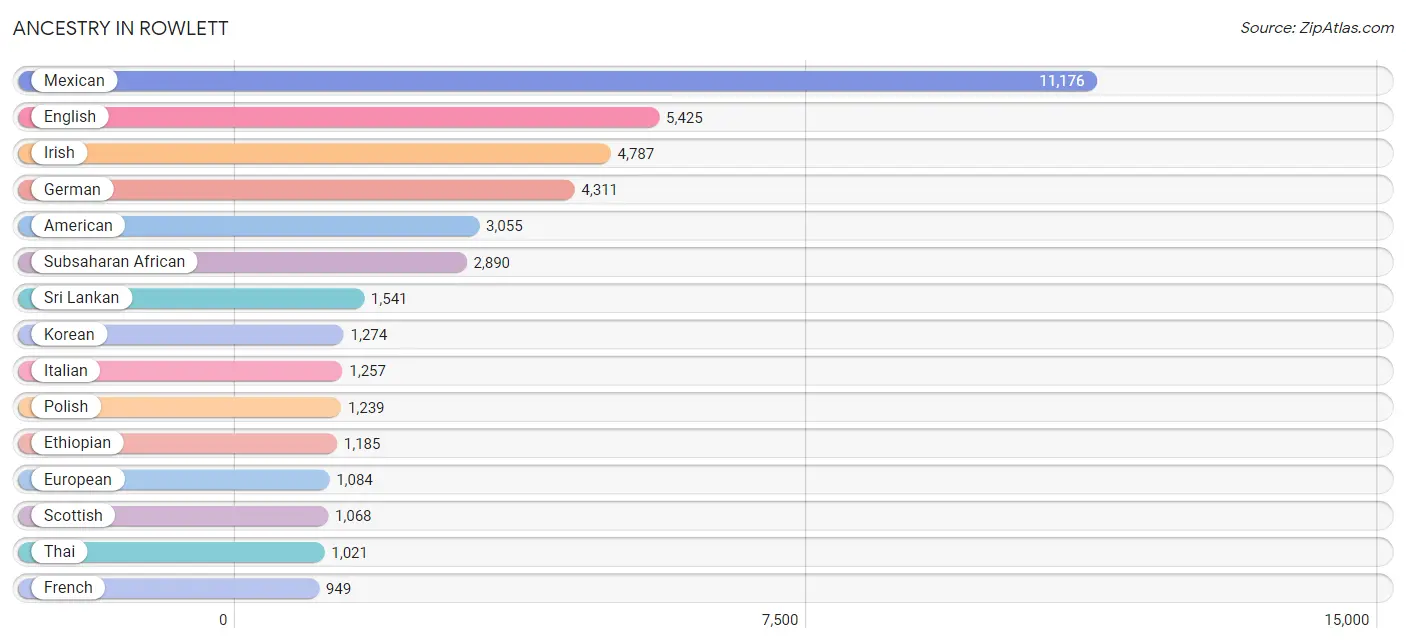
Ancestry in Rowlett
The most populous ancestries reported in Rowlett are Mexican (11,176 | 17.7%), English (5,425 | 8.6%), Irish (4,787 | 7.6%), German (4,311 | 6.8%), and American (3,055 | 4.8%), together accounting for 45.4% of all Rowlett residents.
| Ancestry | # Population | % Population |
| Afghan | 50 | 0.1% |
| African | 710 | 1.1% |
| American | 3,055 | 4.8% |
| Arab | 493 | 0.8% |
| Australian | 23 | 0.0% |
| Austrian | 58 | 0.1% |
| Bangladeshi | 218 | 0.3% |
| Basque | 21 | 0.0% |
| Belgian | 26 | 0.0% |
| Bhutanese | 327 | 0.5% |
| Blackfeet | 9 | 0.0% |
| British | 260 | 0.4% |
| British West Indian | 6 | 0.0% |
| Burmese | 38 | 0.1% |
| Cajun | 16 | 0.0% |
| Canadian | 36 | 0.1% |
| Central American | 815 | 1.3% |
| Central American Indian | 58 | 0.1% |
| Cherokee | 168 | 0.3% |
| Chickasaw | 10 | 0.0% |
| Choctaw | 105 | 0.2% |
| Colombian | 253 | 0.4% |
| Comanche | 11 | 0.0% |
| Costa Rican | 35 | 0.1% |
| Cuban | 154 | 0.2% |
| Czech | 521 | 0.8% |
| Czechoslovakian | 50 | 0.1% |
| Danish | 58 | 0.1% |
| Dominican | 30 | 0.1% |
| Dutch | 607 | 1.0% |
| Dutch West Indian | 32 | 0.1% |
| Eastern European | 227 | 0.4% |
| Ecuadorian | 34 | 0.1% |
| Egyptian | 403 | 0.6% |
| English | 5,425 | 8.6% |
| Ethiopian | 1,185 | 1.9% |
| European | 1,084 | 1.7% |
| Filipino | 18 | 0.0% |
| Finnish | 7 | 0.0% |
| French | 949 | 1.5% |
| French Canadian | 269 | 0.4% |
| German | 4,311 | 6.8% |
| Greek | 120 | 0.2% |
| Guatemalan | 201 | 0.3% |
| Haitian | 75 | 0.1% |
| Honduran | 552 | 0.9% |
| Hungarian | 85 | 0.1% |
| Indian (Asian) | 290 | 0.5% |
| Indonesian | 28 | 0.0% |
| Iranian | 114 | 0.2% |
| Irish | 4,787 | 7.6% |
| Italian | 1,257 | 2.0% |
| Jamaican | 57 | 0.1% |
| Japanese | 77 | 0.1% |
| Korean | 1,274 | 2.0% |
| Lebanese | 81 | 0.1% |
| Lithuanian | 17 | 0.0% |
| Malaysian | 81 | 0.1% |
| Mexican | 11,176 | 17.7% |
| Mexican American Indian | 63 | 0.1% |
| Native Hawaiian | 40 | 0.1% |
| Navajo | 66 | 0.1% |
| Nigerian | 391 | 0.6% |
| Northern European | 125 | 0.2% |
| Norwegian | 352 | 0.6% |
| Pakistani | 245 | 0.4% |
| Pennsylvania German | 21 | 0.0% |
| Peruvian | 308 | 0.5% |
| Polish | 1,239 | 2.0% |
| Portuguese | 72 | 0.1% |
| Puerto Rican | 253 | 0.4% |
| Romanian | 19 | 0.0% |
| Russian | 40 | 0.1% |
| Salvadoran | 27 | 0.0% |
| Scandinavian | 28 | 0.0% |
| Scotch-Irish | 792 | 1.3% |
| Scottish | 1,068 | 1.7% |
| Slavic | 41 | 0.1% |
| South African | 36 | 0.1% |
| South American | 604 | 0.9% |
| South American Indian | 35 | 0.1% |
| Spaniard | 128 | 0.2% |
| Spanish | 133 | 0.2% |
| Sri Lankan | 1,541 | 2.4% |
| Subsaharan African | 2,890 | 4.6% |
| Swedish | 558 | 0.9% |
| Swiss | 46 | 0.1% |
| Thai | 1,021 | 1.6% |
| Tongan | 28 | 0.0% |
| Ukrainian | 61 | 0.1% |
| Venezuelan | 9 | 0.0% |
| Vietnamese | 178 | 0.3% |
| Welsh | 232 | 0.4% |
| Yugoslavian | 37 | 0.1% | View All 94 Rows |
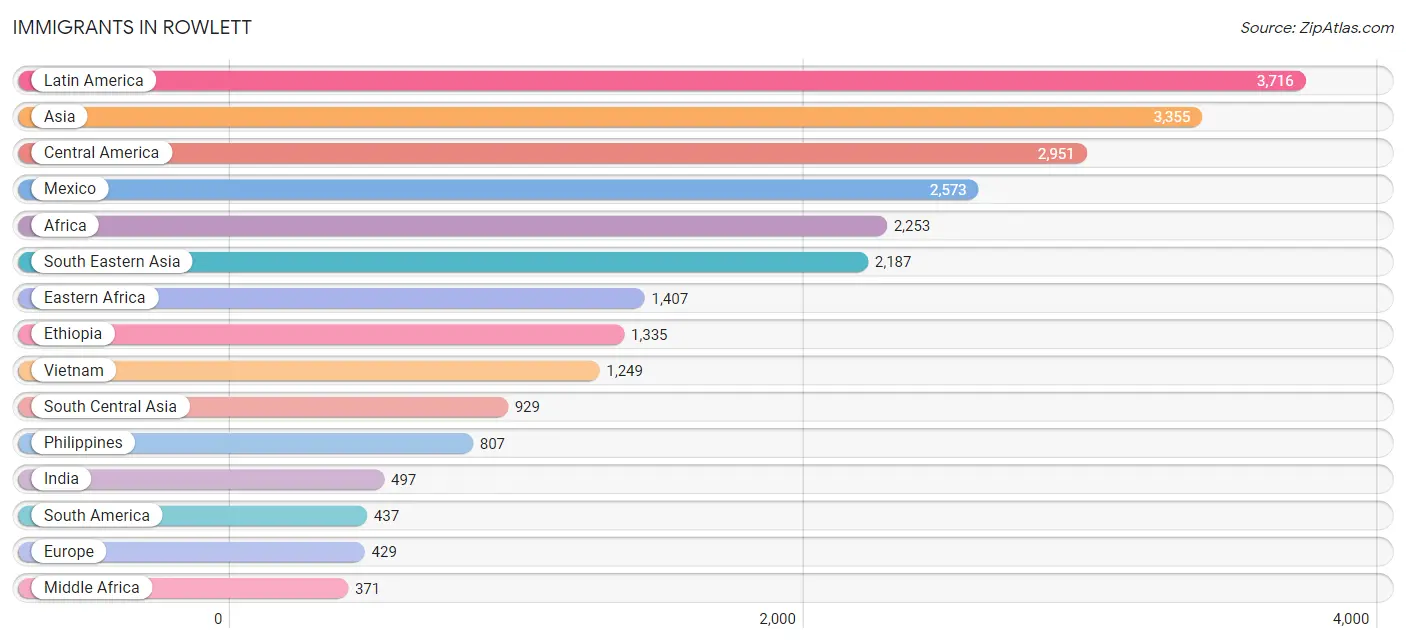
Immigrants in Rowlett
The most numerous immigrant groups reported in Rowlett came from Latin America (3,716 | 5.9%), Asia (3,355 | 5.3%), Central America (2,951 | 4.7%), Mexico (2,573 | 4.1%), and Africa (2,253 | 3.6%), together accounting for 23.5% of all Rowlett residents.
| Immigration Origin | # Population | % Population |
| Africa | 2,253 | 3.6% |
| Asia | 3,355 | 5.3% |
| Austria | 11 | 0.0% |
| Bangladesh | 118 | 0.2% |
| Bosnia and Herzegovina | 49 | 0.1% |
| Cambodia | 48 | 0.1% |
| Cameroon | 188 | 0.3% |
| Canada | 119 | 0.2% |
| Caribbean | 328 | 0.5% |
| Central America | 2,951 | 4.7% |
| China | 152 | 0.2% |
| Colombia | 150 | 0.2% |
| Costa Rica | 120 | 0.2% |
| Cuba | 41 | 0.1% |
| Dominican Republic | 142 | 0.2% |
| Eastern Africa | 1,407 | 2.2% |
| Eastern Asia | 187 | 0.3% |
| Eastern Europe | 137 | 0.2% |
| Ecuador | 17 | 0.0% |
| Egypt | 114 | 0.2% |
| El Salvador | 60 | 0.1% |
| England | 105 | 0.2% |
| Eritrea | 10 | 0.0% |
| Ethiopia | 1,335 | 2.1% |
| Europe | 429 | 0.7% |
| France | 5 | 0.0% |
| Germany | 50 | 0.1% |
| Ghana | 50 | 0.1% |
| Grenada | 6 | 0.0% |
| Guatemala | 97 | 0.2% |
| Haiti | 53 | 0.1% |
| Honduras | 101 | 0.2% |
| Hungary | 4 | 0.0% |
| India | 497 | 0.8% |
| Iran | 112 | 0.2% |
| Israel | 26 | 0.0% |
| Jamaica | 78 | 0.1% |
| Japan | 25 | 0.0% |
| Kenya | 38 | 0.1% |
| Korea | 10 | 0.0% |
| Laos | 17 | 0.0% |
| Latin America | 3,716 | 5.9% |
| Lebanon | 19 | 0.0% |
| Mexico | 2,573 | 4.1% |
| Middle Africa | 371 | 0.6% |
| Nepal | 26 | 0.0% |
| Nigeria | 257 | 0.4% |
| Northern Africa | 114 | 0.2% |
| Northern Europe | 226 | 0.4% |
| Oceania | 66 | 0.1% |
| Pakistan | 176 | 0.3% |
| Peru | 261 | 0.4% |
| Philippines | 807 | 1.3% |
| Poland | 30 | 0.1% |
| Romania | 21 | 0.0% |
| Russia | 15 | 0.0% |
| Scotland | 38 | 0.1% |
| South Africa | 54 | 0.1% |
| South America | 437 | 0.7% |
| South Central Asia | 929 | 1.5% |
| South Eastern Asia | 2,187 | 3.5% |
| Taiwan | 27 | 0.0% |
| Thailand | 38 | 0.1% |
| Trinidad and Tobago | 8 | 0.0% |
| Ukraine | 10 | 0.0% |
| Venezuela | 9 | 0.0% |
| Vietnam | 1,249 | 2.0% |
| Western Africa | 307 | 0.5% |
| Western Asia | 45 | 0.1% |
| Western Europe | 66 | 0.1% |
| Zaire | 183 | 0.3% |
| Zimbabwe | 24 | 0.0% | View All 72 Rows |
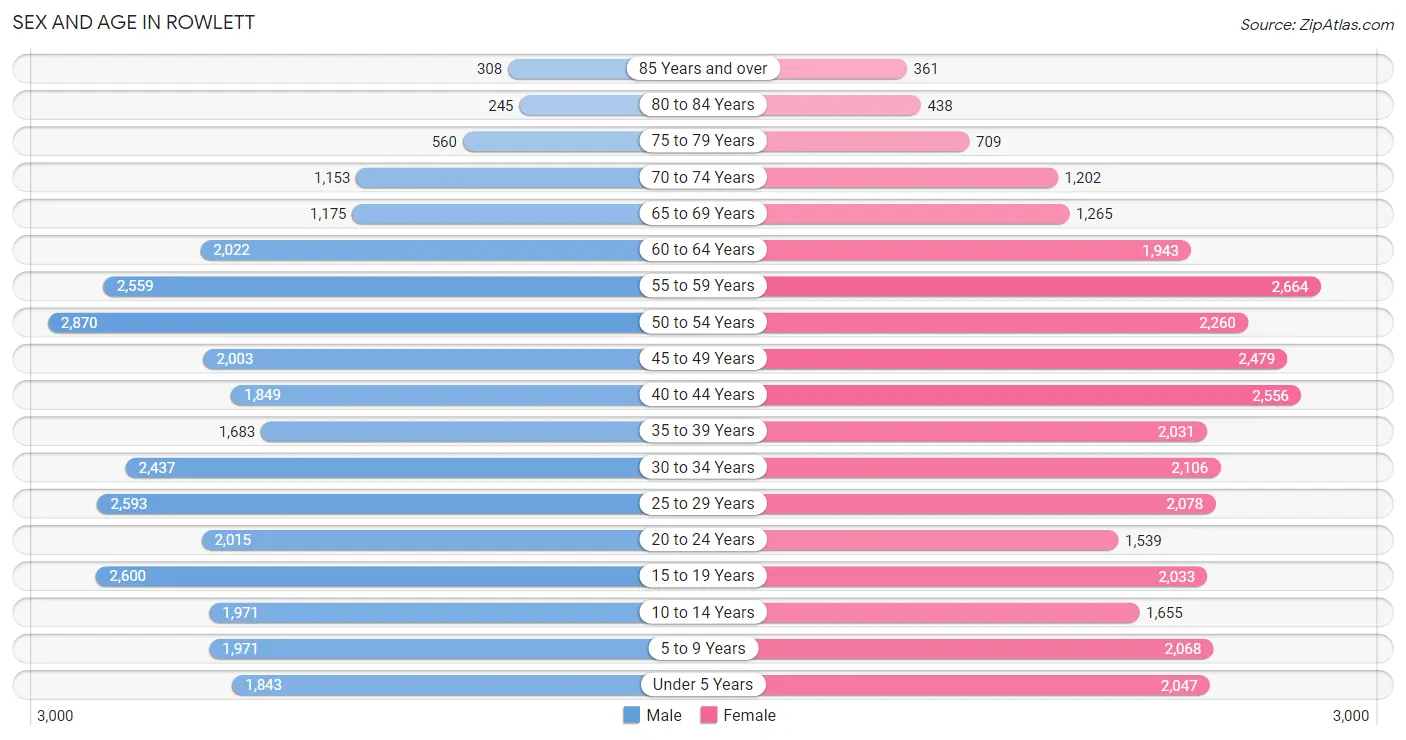
Sex and Age in Rowlett
Sex and Age in Rowlett
The most populous age groups in Rowlett are 50 to 54 Years (2,870 | 9.0%) for men and 55 to 59 Years (2,664 | 8.5%) for women.
| Age Bracket | Male | Female |
| Under 5 Years | 1,843 (5.8%) | 2,047 (6.5%) |
| 5 to 9 Years | 1,971 (6.2%) | 2,068 (6.6%) |
| 10 to 14 Years | 1,971 (6.2%) | 1,655 (5.3%) |
| 15 to 19 Years | 2,600 (8.2%) | 2,033 (6.5%) |
| 20 to 24 Years | 2,015 (6.3%) | 1,539 (4.9%) |
| 25 to 29 Years | 2,593 (8.1%) | 2,078 (6.6%) |
| 30 to 34 Years | 2,437 (7.6%) | 2,106 (6.7%) |
| 35 to 39 Years | 1,683 (5.3%) | 2,031 (6.5%) |
| 40 to 44 Years | 1,849 (5.8%) | 2,556 (8.1%) |
| 45 to 49 Years | 2,003 (6.3%) | 2,479 (7.9%) |
| 50 to 54 Years | 2,870 (9.0%) | 2,260 (7.2%) |
| 55 to 59 Years | 2,559 (8.0%) | 2,664 (8.5%) |
| 60 to 64 Years | 2,022 (6.4%) | 1,943 (6.2%) |
| 65 to 69 Years | 1,175 (3.7%) | 1,265 (4.0%) |
| 70 to 74 Years | 1,153 (3.6%) | 1,202 (3.8%) |
| 75 to 79 Years | 560 (1.8%) | 709 (2.3%) |
| 80 to 84 Years | 245 (0.8%) | 438 (1.4%) |
| 85 Years and over | 308 (1.0%) | 361 (1.1%) |
| Total | 31,857 (100.0%) | 31,434 (100.0%) |
Families and Households in Rowlett
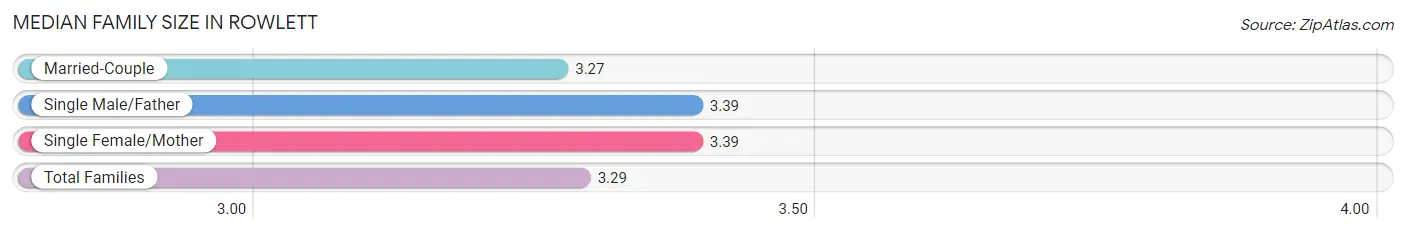
Median Family Size in Rowlett
The median family size in Rowlett is 3.29 persons per family, with single male/father families (742 | 4.3%) accounting for the largest median family size of 3.39 persons per family. On the other hand, married-couple families (14,069 | 82.4%) represent the smallest median family size with 3.27 persons per family.
| Family Type | # Families | Family Size |
| Married-Couple | 14,069 (82.4%) | 3.27 |
| Single Male/Father | 742 (4.3%) | 3.39 |
| Single Female/Mother | 2,258 (13.2%) | 3.39 |
| Total Families | 17,069 (100.0%) | 3.29 |
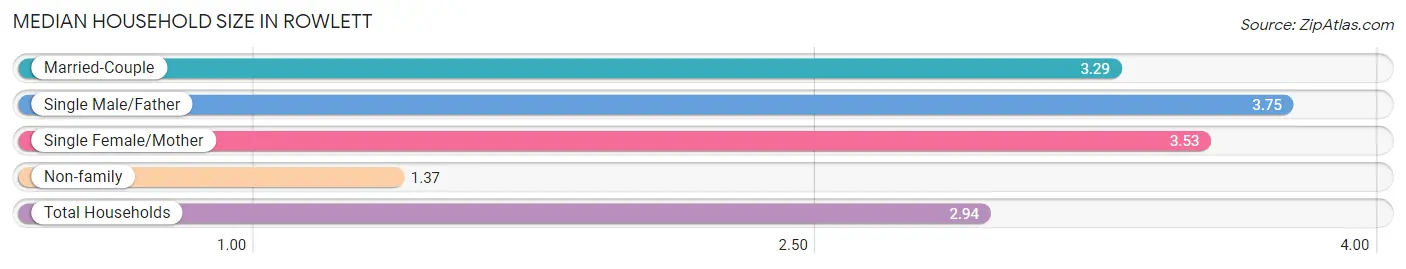
Median Household Size in Rowlett
The median household size in Rowlett is 2.94 persons per household, with single male/father households (742 | 3.5%) accounting for the largest median household size of 3.75 persons per household. non-family households (4,302 | 20.1%) represent the smallest median household size with 1.37 persons per household.
| Household Type | # Households | Household Size |
| Married-Couple | 14,069 (65.8%) | 3.29 |
| Single Male/Father | 742 (3.5%) | 3.75 |
| Single Female/Mother | 2,258 (10.6%) | 3.53 |
| Non-family | 4,302 (20.1%) | 1.37 |
| Total Households | 21,371 (100.0%) | 2.94 |
Household Size by Marriage Status in Rowlett
Out of a total of 21,371 households in Rowlett, 17,069 (79.9%) are family households, while 4,302 (20.1%) are nonfamily households. The most numerous type of family households are 2-person households, comprising 6,618, and the most common type of nonfamily households are 1-person households, comprising 3,452.
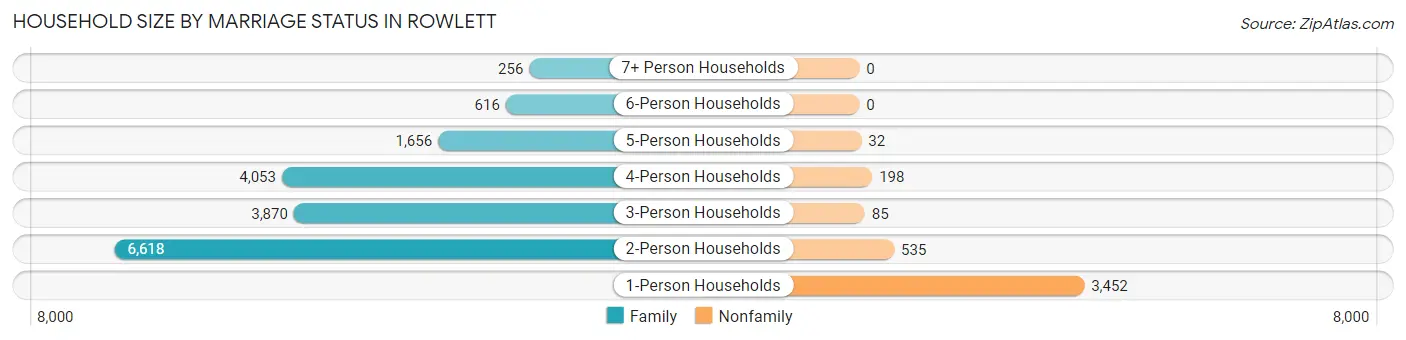
| Household Size | Family Households | Nonfamily Households |
| 1-Person Households | - | 3,452 (16.2%) |
| 2-Person Households | 6,618 (31.0%) | 535 (2.5%) |
| 3-Person Households | 3,870 (18.1%) | 85 (0.4%) |
| 4-Person Households | 4,053 (19.0%) | 198 (0.9%) |
| 5-Person Households | 1,656 (7.7%) | 32 (0.2%) |
| 6-Person Households | 616 (2.9%) | 0 (0.0%) |
| 7+ Person Households | 256 (1.2%) | 0 (0.0%) |
| Total | 17,069 (79.9%) | 4,302 (20.1%) |
Female Fertility in Rowlett
Fertility by Age in Rowlett
Average fertility rate in Rowlett is 62.0 births per 1,000 women. Women in the age bracket of 20 to 34 years have the highest fertility rate with 117.0 births per 1,000 women. Women in the age bracket of 20 to 34 years acount for 71.0% of all women with births.
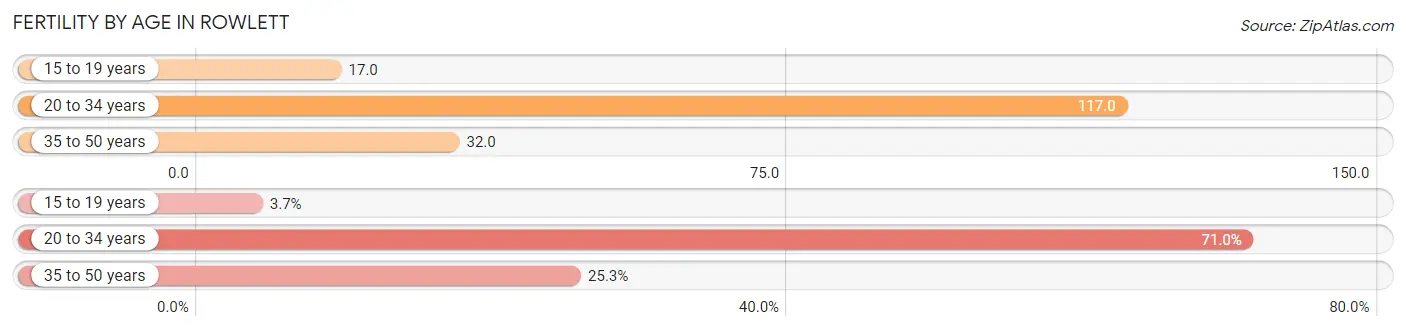
| Age Bracket | Women with Births | Births / 1,000 Women |
| 15 to 19 years | 35 (3.7%) | 17.0 |
| 20 to 34 years | 667 (71.0%) | 117.0 |
| 35 to 50 years | 238 (25.3%) | 32.0 |
| Total | 940 (100.0%) | 62.0 |
Fertility by Age by Marriage Status in Rowlett
97.3% of women with births (940) in Rowlett are married. The highest percentage of unmarried women with births falls into 35 to 50 years age bracket with 10.5% of them unmarried at the time of birth, while the lowest percentage of unmarried women with births belong to 15 to 19 years age bracket with 0.0% of them unmarried.
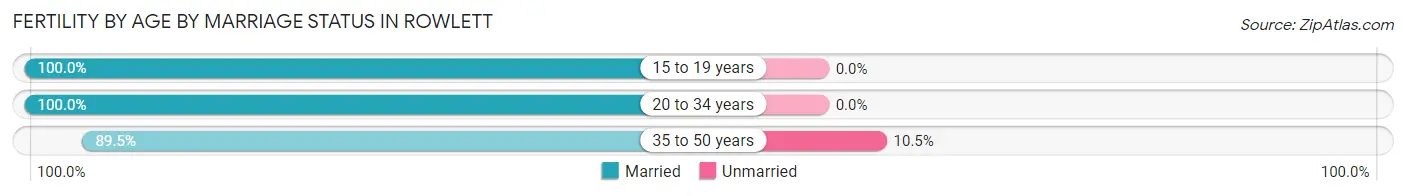
| Age Bracket | Married | Unmarried |
| 15 to 19 years | 35 (100.0%) | 0 (0.0%) |
| 20 to 34 years | 667 (100.0%) | 0 (0.0%) |
| 35 to 50 years | 213 (89.5%) | 25 (10.5%) |
| Total | 915 (97.3%) | 25 (2.7%) |
Fertility by Education in Rowlett
Average fertility rate in Rowlett is 62.0 births per 1,000 women. Women with the education attainment of bachelor's degree have the highest fertility rate of 119.0 births per 1,000 women, while women with the education attainment of less than high school have the lowest fertility at 15.0 births per 1,000 women. Women with the education attainment of bachelor's degree represent 44.0% of all women with births.
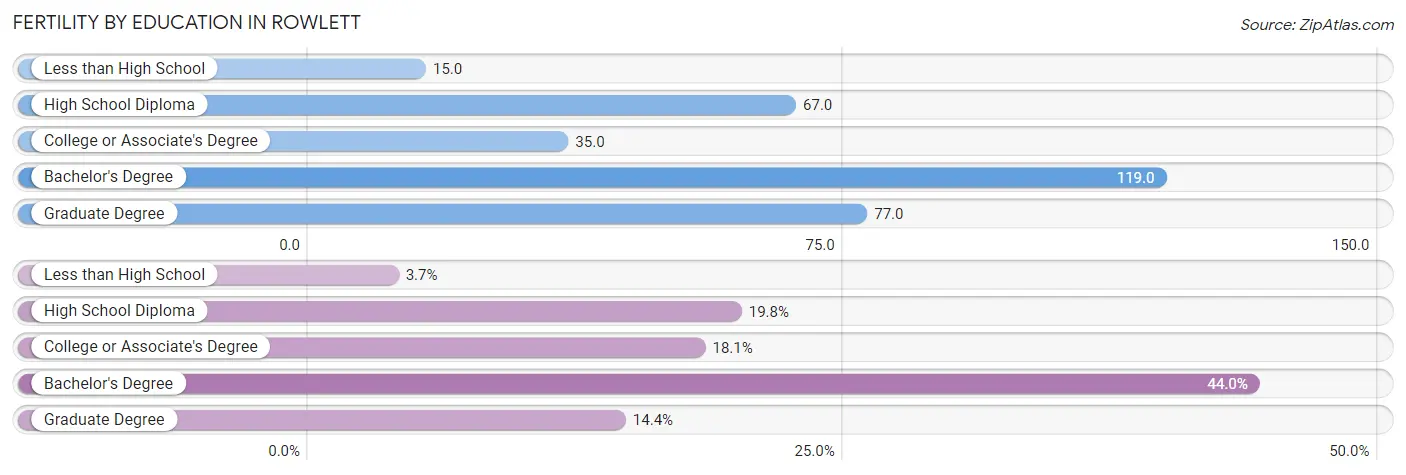
| Educational Attainment | Women with Births | Births / 1,000 Women |
| Less than High School | 35 (3.7%) | 15.0 |
| High School Diploma | 186 (19.8%) | 67.0 |
| College or Associate's Degree | 170 (18.1%) | 35.0 |
| Bachelor's Degree | 414 (44.0%) | 119.0 |
| Graduate Degree | 135 (14.4%) | 77.0 |
| Total | 940 (100.0%) | 62.0 |
Fertility by Education by Marriage Status in Rowlett
2.7% of women with births in Rowlett are unmarried. Women with the educational attainment of less than high school are most likely to be married with 100.0% of them married at childbirth, while women with the educational attainment of high school diploma are least likely to be married with 13.4% of them unmarried at childbirth.
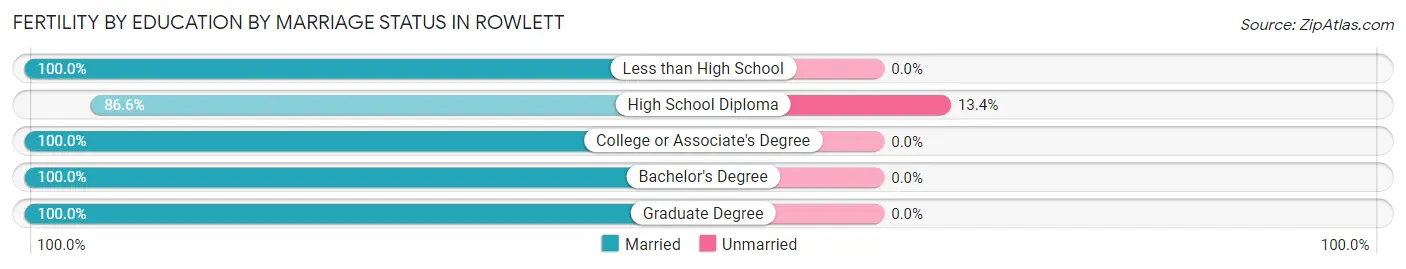
| Educational Attainment | Married | Unmarried |
| Less than High School | 35 (100.0%) | 0 (0.0%) |
| High School Diploma | 161 (86.6%) | 25 (13.4%) |
| College or Associate's Degree | 170 (100.0%) | 0 (0.0%) |
| Bachelor's Degree | 414 (100.0%) | 0 (0.0%) |
| Graduate Degree | 135 (100.0%) | 0 (0.0%) |
| Total | 915 (97.3%) | 25 (2.7%) |
Employment Characteristics in Rowlett
Employment by Class of Employer in Rowlett
Among the 33,841 employed individuals in Rowlett, private company employees (24,266 | 71.7%), local government employees (2,925 | 8.6%), and not-for-profit organizations (2,050 | 6.1%) make up the most common classes of employment.
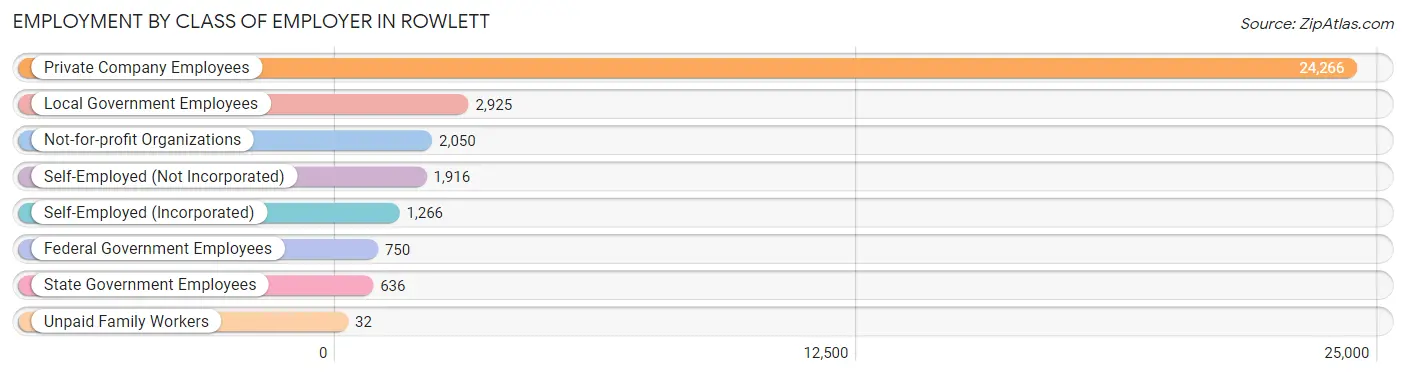
| Employer Class | # Employees | % Employees |
| Private Company Employees | 24,266 | 71.7% |
| Self-Employed (Incorporated) | 1,266 | 3.7% |
| Self-Employed (Not Incorporated) | 1,916 | 5.7% |
| Not-for-profit Organizations | 2,050 | 6.1% |
| Local Government Employees | 2,925 | 8.6% |
| State Government Employees | 636 | 1.9% |
| Federal Government Employees | 750 | 2.2% |
| Unpaid Family Workers | 32 | 0.1% |
| Total | 33,841 | 100.0% |
Employment Status by Age in Rowlett
According to the labor force statistics for Rowlett, out of the total population over 16 years of age (50,572), 71.3% or 36,058 individuals are in the labor force, with 4.1% or 1,478 of them unemployed. The age group with the highest labor force participation rate is 35 to 44 years, with 86.8% or 7,047 individuals in the labor force. Within the labor force, the 75 years and over age range has the highest percentage of unemployed individuals, with 21.3% or 61 of them being unemployed.
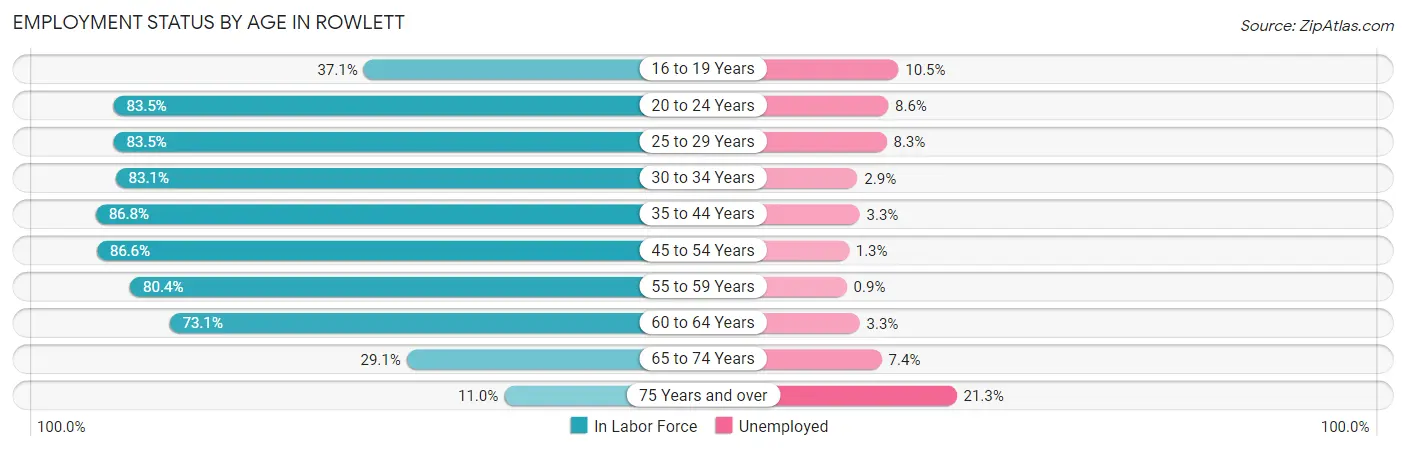
| Age Bracket | In Labor Force | Unemployed |
| 16 to 19 Years | 1,287 (37.1%) | 135 (10.5%) |
| 20 to 24 Years | 2,968 (83.5%) | 255 (8.6%) |
| 25 to 29 Years | 3,900 (83.5%) | 324 (8.3%) |
| 30 to 34 Years | 3,775 (83.1%) | 109 (2.9%) |
| 35 to 44 Years | 7,047 (86.8%) | 233 (3.3%) |
| 45 to 54 Years | 8,324 (86.6%) | 108 (1.3%) |
| 55 to 59 Years | 4,199 (80.4%) | 38 (0.9%) |
| 60 to 64 Years | 2,898 (73.1%) | 96 (3.3%) |
| 65 to 74 Years | 1,395 (29.1%) | 103 (7.4%) |
| 75 Years and over | 288 (11.0%) | 61 (21.3%) |
| Total | 36,058 (71.3%) | 1,478 (4.1%) |
Employment Status by Educational Attainment in Rowlett
According to labor force statistics for Rowlett, 83.4% of individuals (30,135) out of the total population between 25 and 64 years of age (36,133) are in the labor force, with 3.0% or 904 of them being unemployed. The group with the highest labor force participation rate are those with the educational attainment of bachelor's degree or higher, with 86.6% or 12,191 individuals in the labor force. Within the labor force, individuals with less than high school education have the highest percentage of unemployment, with 7.3% or 106 of them being unemployed.
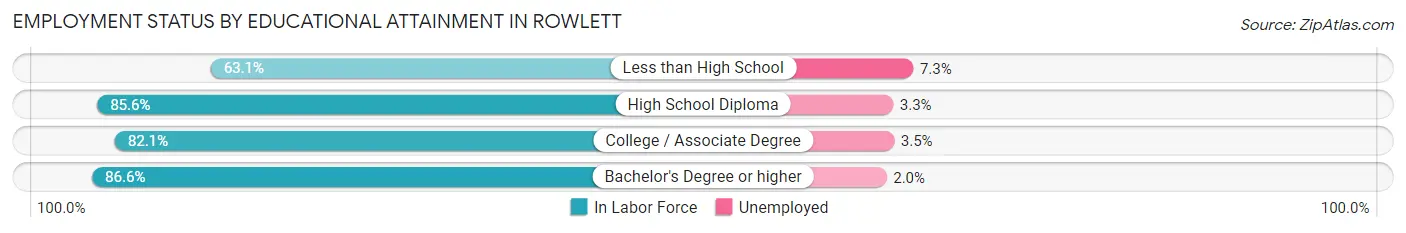
| Educational Attainment | In Labor Force | Unemployed |
| Less than High School | 1,453 (63.1%) | 168 (7.3%) |
| High School Diploma | 6,819 (85.6%) | 263 (3.3%) |
| College / Associate Degree | 9,677 (82.1%) | 413 (3.5%) |
| Bachelor's Degree or higher | 12,191 (86.6%) | 282 (2.0%) |
| Total | 30,135 (83.4%) | 1,084 (3.0%) |
Employment Occupations by Sex in Rowlett
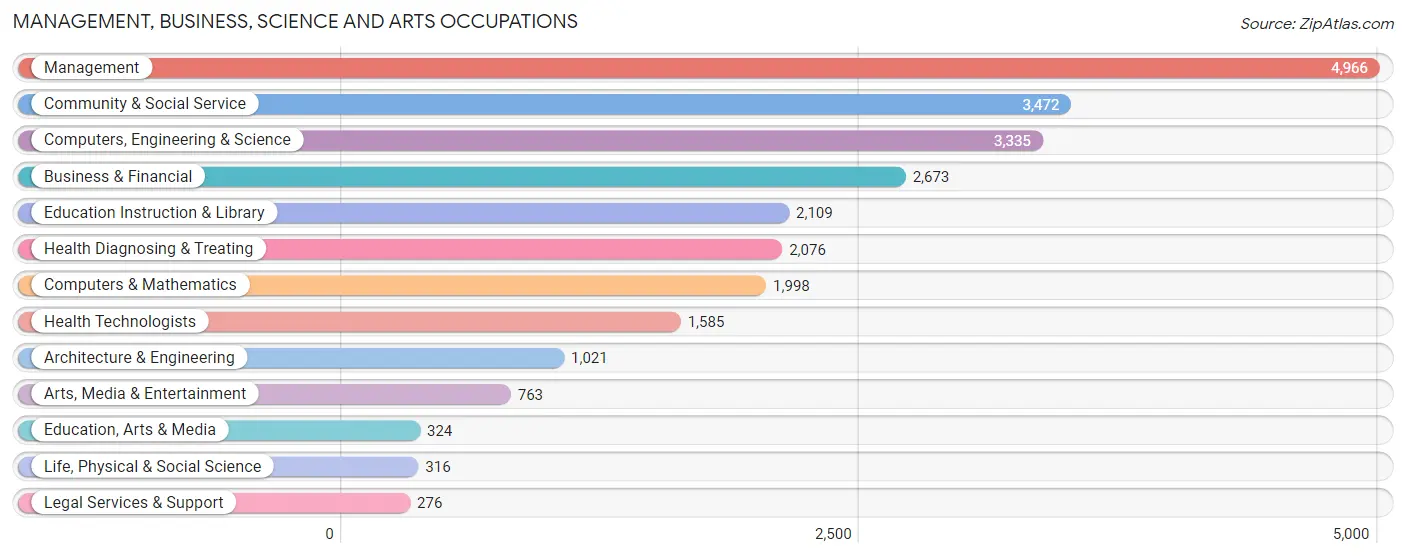
Management, Business, Science and Arts Occupations
The most common Management, Business, Science and Arts occupations in Rowlett are Management (4,966 | 14.3%), Community & Social Service (3,472 | 10.0%), Computers, Engineering & Science (3,335 | 9.6%), Business & Financial (2,673 | 7.7%), and Education Instruction & Library (2,109 | 6.1%).
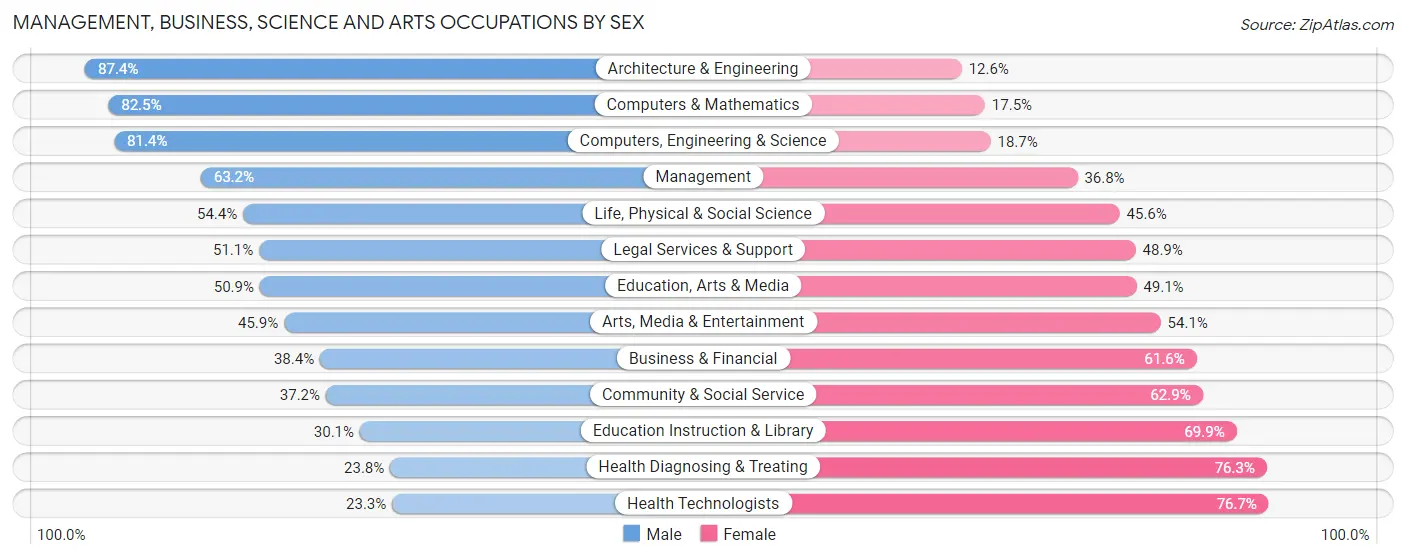
Management, Business, Science and Arts Occupations by Sex
Within the Management, Business, Science and Arts occupations in Rowlett, the most male-oriented occupations are Architecture & Engineering (87.4%), Computers & Mathematics (82.5%), and Computers, Engineering & Science (81.4%), while the most female-oriented occupations are Health Technologists (76.7%), Health Diagnosing & Treating (76.2%), and Education Instruction & Library (69.9%).
| Occupation | Male | Female |
| Management | 3,140 (63.2%) | 1,826 (36.8%) |
| Business & Financial | 1,026 (38.4%) | 1,647 (61.6%) |
| Computers, Engineering & Science | 2,713 (81.4%) | 622 (18.6%) |
| Computers & Mathematics | 1,649 (82.5%) | 349 (17.5%) |
| Architecture & Engineering | 892 (87.4%) | 129 (12.6%) |
| Life, Physical & Social Science | 172 (54.4%) | 144 (45.6%) |
| Community & Social Service | 1,290 (37.1%) | 2,182 (62.8%) |
| Education, Arts & Media | 165 (50.9%) | 159 (49.1%) |
| Legal Services & Support | 141 (51.1%) | 135 (48.9%) |
| Education Instruction & Library | 634 (30.1%) | 1,475 (69.9%) |
| Arts, Media & Entertainment | 350 (45.9%) | 413 (54.1%) |
| Health Diagnosing & Treating | 493 (23.7%) | 1,583 (76.2%) |
| Health Technologists | 370 (23.3%) | 1,215 (76.7%) |
| Total (Category) | 8,662 (52.4%) | 7,860 (47.6%) |
| Total (Overall) | 18,929 (54.7%) | 15,668 (45.3%) |
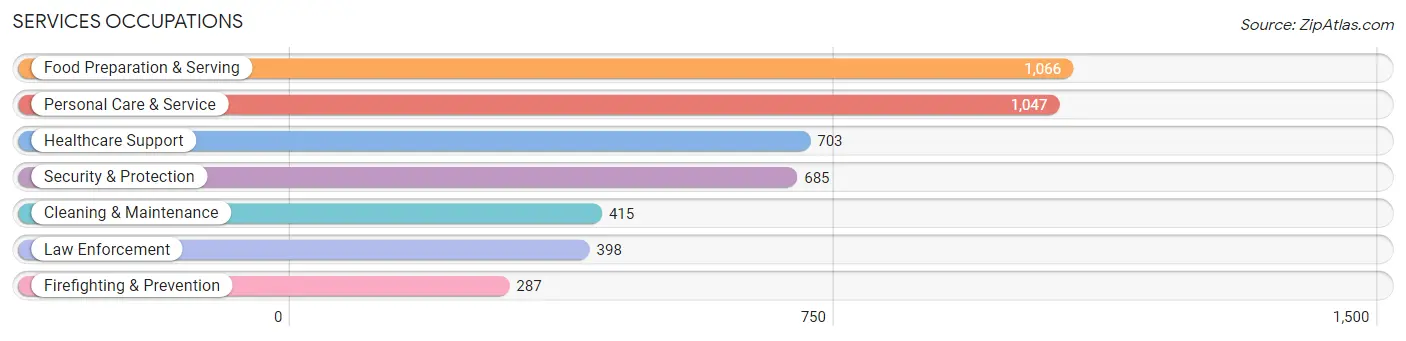
Services Occupations
The most common Services occupations in Rowlett are Food Preparation & Serving (1,066 | 3.1%), Personal Care & Service (1,047 | 3.0%), Healthcare Support (703 | 2.0%), Security & Protection (685 | 2.0%), and Cleaning & Maintenance (415 | 1.2%).
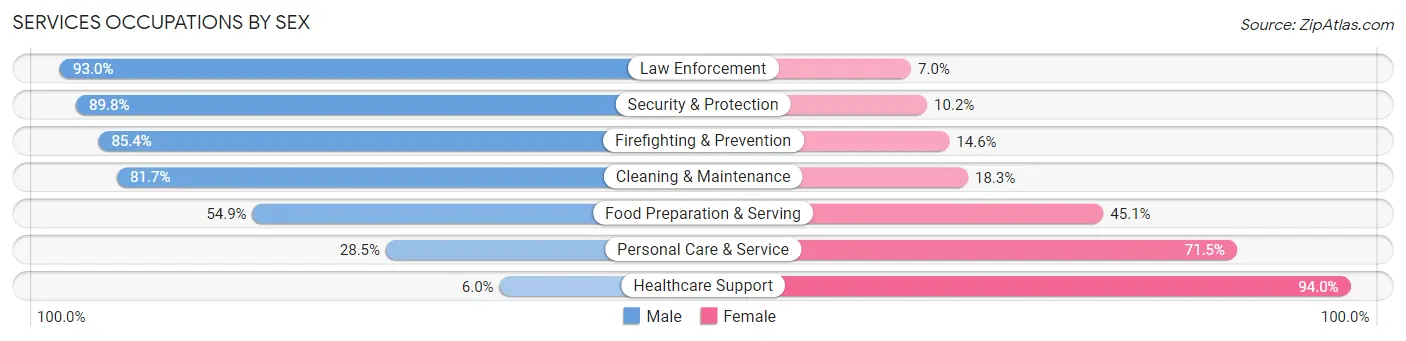
Services Occupations by Sex
Within the Services occupations in Rowlett, the most male-oriented occupations are Law Enforcement (93.0%), Security & Protection (89.8%), and Firefighting & Prevention (85.4%), while the most female-oriented occupations are Healthcare Support (94.0%), Personal Care & Service (71.5%), and Food Preparation & Serving (45.1%).
| Occupation | Male | Female |
| Healthcare Support | 42 (6.0%) | 661 (94.0%) |
| Security & Protection | 615 (89.8%) | 70 (10.2%) |
| Firefighting & Prevention | 245 (85.4%) | 42 (14.6%) |
| Law Enforcement | 370 (93.0%) | 28 (7.0%) |
| Food Preparation & Serving | 585 (54.9%) | 481 (45.1%) |
| Cleaning & Maintenance | 339 (81.7%) | 76 (18.3%) |
| Personal Care & Service | 298 (28.5%) | 749 (71.5%) |
| Total (Category) | 1,879 (48.0%) | 2,037 (52.0%) |
| Total (Overall) | 18,929 (54.7%) | 15,668 (45.3%) |
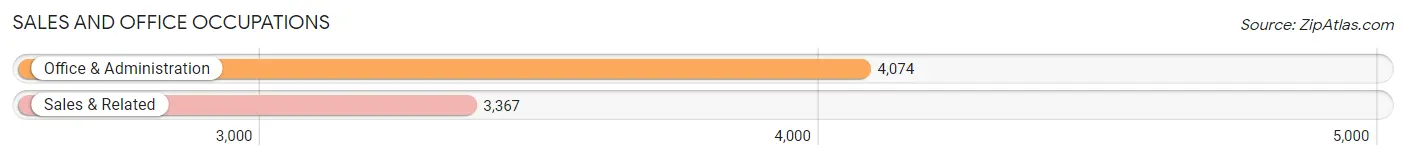
Sales and Office Occupations
The most common Sales and Office occupations in Rowlett are Office & Administration (4,074 | 11.8%), and Sales & Related (3,367 | 9.7%).
Sales and Office Occupations by Sex
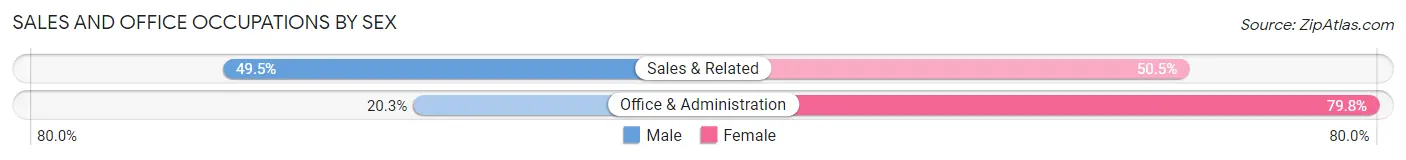
| Occupation | Male | Female |
| Sales & Related | 1,666 (49.5%) | 1,701 (50.5%) |
| Office & Administration | 825 (20.3%) | 3,249 (79.7%) |
| Total (Category) | 2,491 (33.5%) | 4,950 (66.5%) |
| Total (Overall) | 18,929 (54.7%) | 15,668 (45.3%) |
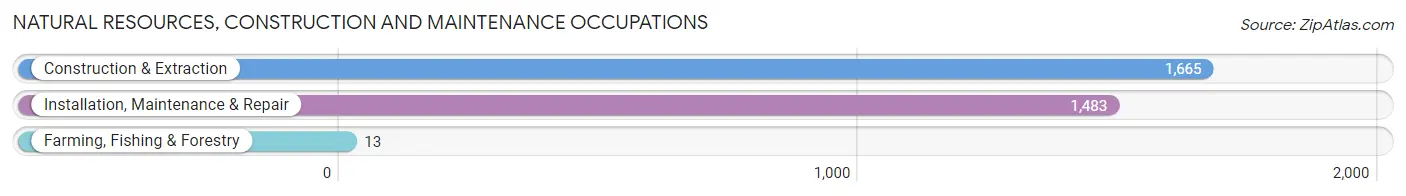
Natural Resources, Construction and Maintenance Occupations
The most common Natural Resources, Construction and Maintenance occupations in Rowlett are Construction & Extraction (1,665 | 4.8%), Installation, Maintenance & Repair (1,483 | 4.3%), and Farming, Fishing & Forestry (13 | 0.0%).
Natural Resources, Construction and Maintenance Occupations by Sex
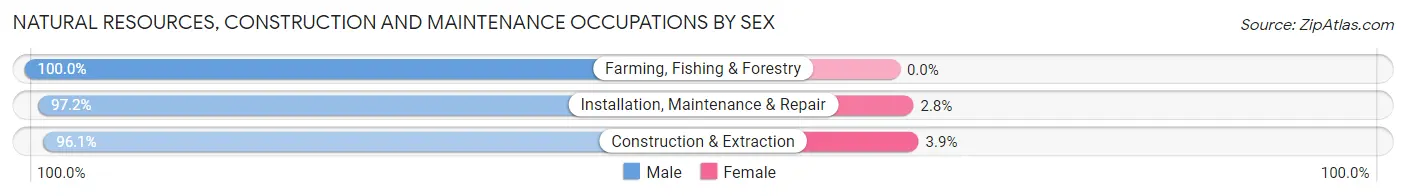
| Occupation | Male | Female |
| Farming, Fishing & Forestry | 13 (100.0%) | 0 (0.0%) |
| Construction & Extraction | 1,600 (96.1%) | 65 (3.9%) |
| Installation, Maintenance & Repair | 1,441 (97.2%) | 42 (2.8%) |
| Total (Category) | 3,054 (96.6%) | 107 (3.4%) |
| Total (Overall) | 18,929 (54.7%) | 15,668 (45.3%) |
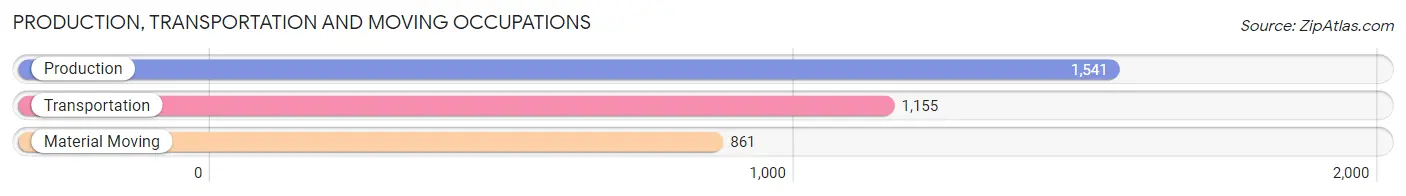
Production, Transportation and Moving Occupations
The most common Production, Transportation and Moving occupations in Rowlett are Production (1,541 | 4.4%), Transportation (1,155 | 3.3%), and Material Moving (861 | 2.5%).
Production, Transportation and Moving Occupations by Sex
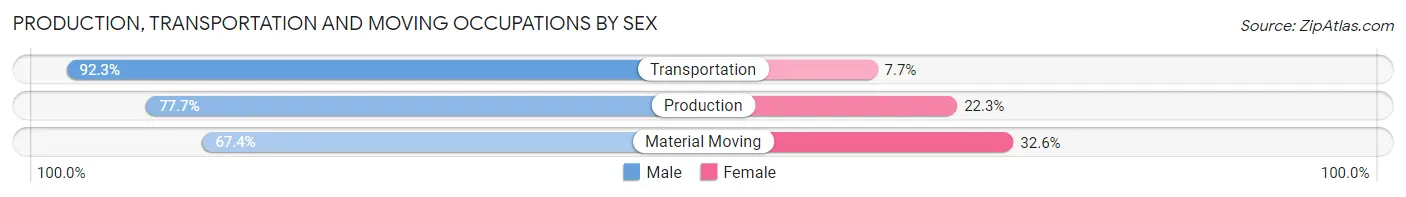
| Occupation | Male | Female |
| Production | 1,197 (77.7%) | 344 (22.3%) |
| Transportation | 1,066 (92.3%) | 89 (7.7%) |
| Material Moving | 580 (67.4%) | 281 (32.6%) |
| Total (Category) | 2,843 (79.9%) | 714 (20.1%) |
| Total (Overall) | 18,929 (54.7%) | 15,668 (45.3%) |
Employment Industries by Sex in Rowlett
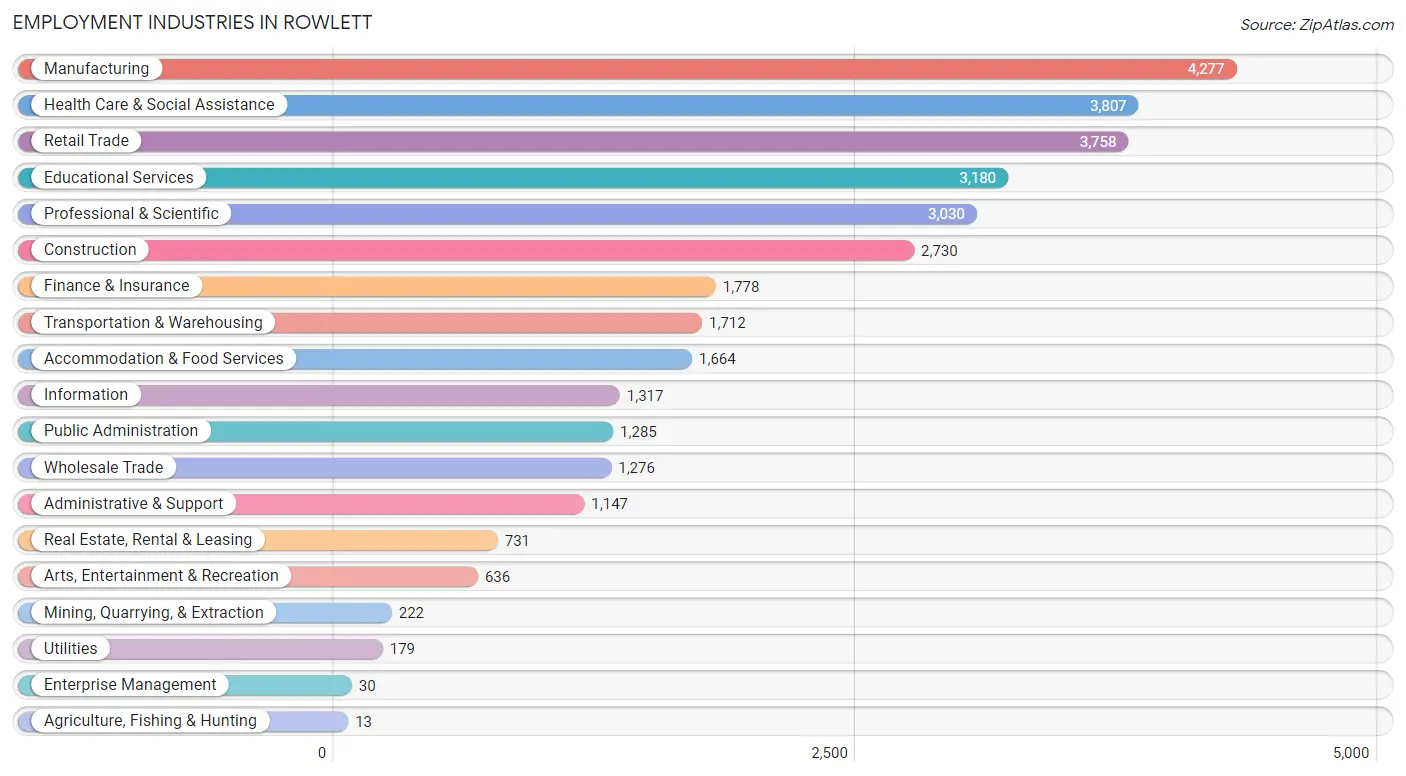
Employment Industries in Rowlett
The major employment industries in Rowlett include Manufacturing (4,277 | 12.4%), Health Care & Social Assistance (3,807 | 11.0%), Retail Trade (3,758 | 10.9%), Educational Services (3,180 | 9.2%), and Professional & Scientific (3,030 | 8.8%).
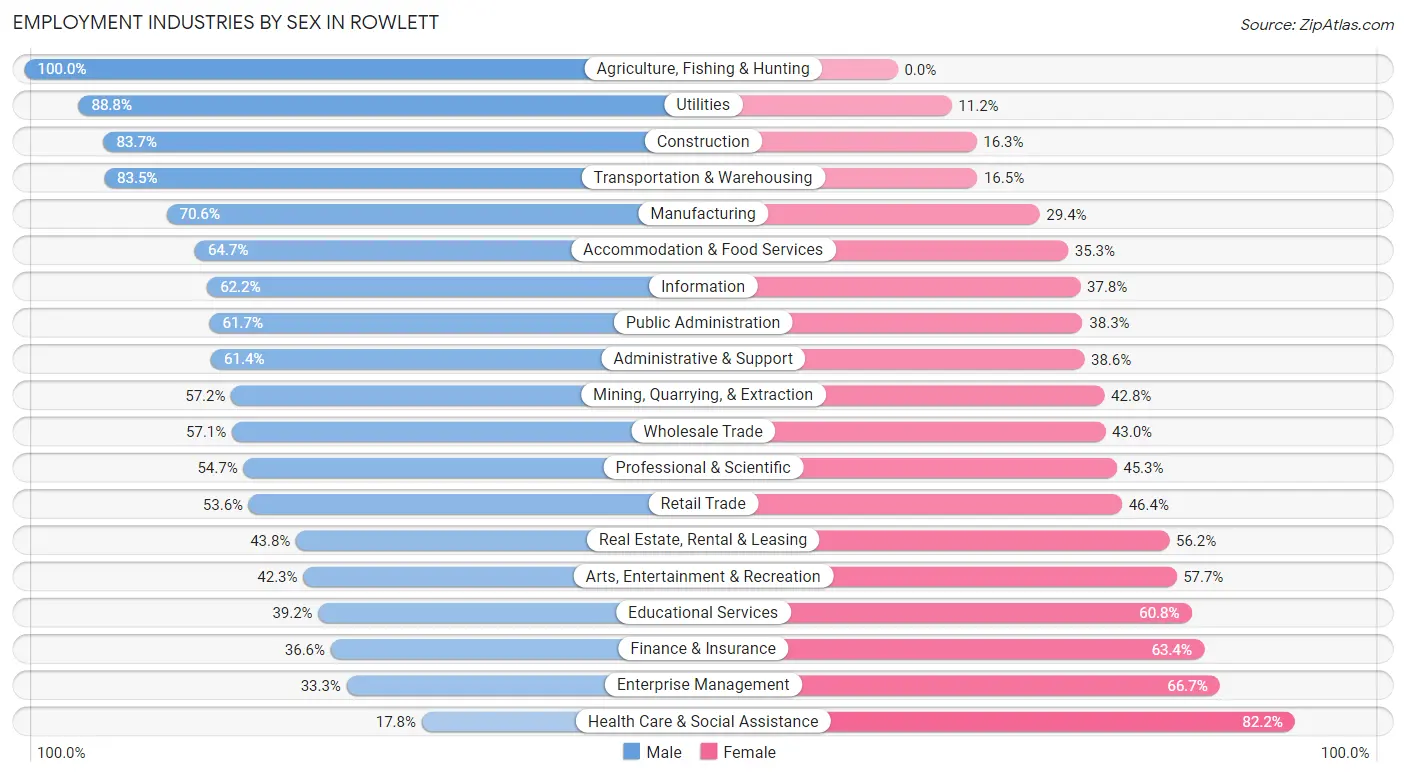
Employment Industries by Sex in Rowlett
The Rowlett industries that see more men than women are Agriculture, Fishing & Hunting (100.0%), Utilities (88.8%), and Construction (83.7%), whereas the industries that tend to have a higher number of women are Health Care & Social Assistance (82.2%), Enterprise Management (66.7%), and Finance & Insurance (63.4%).
| Industry | Male | Female |
| Agriculture, Fishing & Hunting | 13 (100.0%) | 0 (0.0%) |
| Mining, Quarrying, & Extraction | 127 (57.2%) | 95 (42.8%) |
| Construction | 2,284 (83.7%) | 446 (16.3%) |
| Manufacturing | 3,020 (70.6%) | 1,257 (29.4%) |
| Wholesale Trade | 728 (57.1%) | 548 (42.9%) |
| Retail Trade | 2,013 (53.6%) | 1,745 (46.4%) |
| Transportation & Warehousing | 1,430 (83.5%) | 282 (16.5%) |
| Utilities | 159 (88.8%) | 20 (11.2%) |
| Information | 819 (62.2%) | 498 (37.8%) |
| Finance & Insurance | 651 (36.6%) | 1,127 (63.4%) |
| Real Estate, Rental & Leasing | 320 (43.8%) | 411 (56.2%) |
| Professional & Scientific | 1,657 (54.7%) | 1,373 (45.3%) |
| Enterprise Management | 10 (33.3%) | 20 (66.7%) |
| Administrative & Support | 704 (61.4%) | 443 (38.6%) |
| Educational Services | 1,246 (39.2%) | 1,934 (60.8%) |
| Health Care & Social Assistance | 677 (17.8%) | 3,130 (82.2%) |
| Arts, Entertainment & Recreation | 269 (42.3%) | 367 (57.7%) |
| Accommodation & Food Services | 1,077 (64.7%) | 587 (35.3%) |
| Public Administration | 793 (61.7%) | 492 (38.3%) |
| Total | 18,929 (54.7%) | 15,668 (45.3%) |
Education in Rowlett
School Enrollment in Rowlett
The most common levels of schooling among the 15,134 students in Rowlett are high school (3,999 | 26.4%), elementary school (3,257 | 21.5%), and college / undergraduate (2,581 | 17.1%).
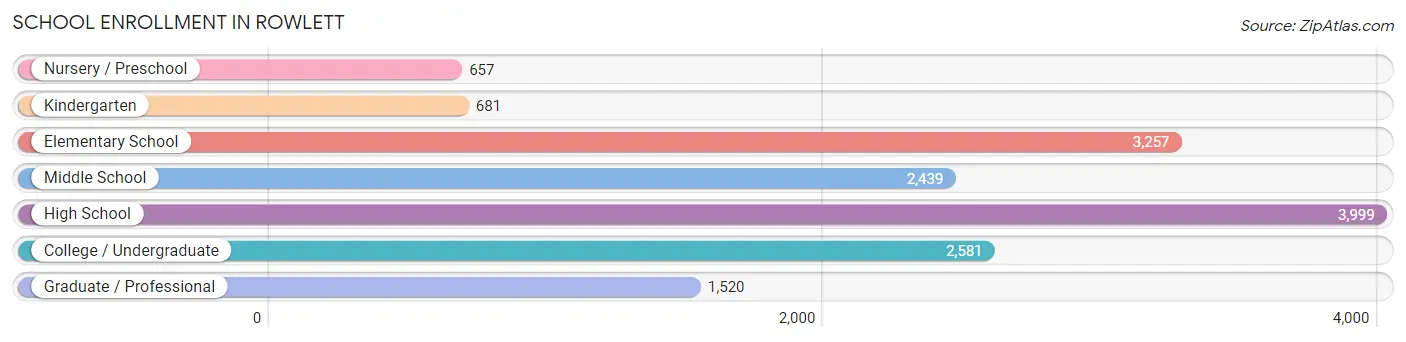
| School Level | # Students | % Students |
| Nursery / Preschool | 657 | 4.3% |
| Kindergarten | 681 | 4.5% |
| Elementary School | 3,257 | 21.5% |
| Middle School | 2,439 | 16.1% |
| High School | 3,999 | 26.4% |
| College / Undergraduate | 2,581 | 17.1% |
| Graduate / Professional | 1,520 | 10.0% |
| Total | 15,134 | 100.0% |
School Enrollment by Age by Funding Source in Rowlett
Out of a total of 15,134 students who are enrolled in schools in Rowlett, 2,512 (16.6%) attend a private institution, while the remaining 12,622 (83.4%) are enrolled in public schools. The age group of 3 to 4 year olds has the highest likelihood of being enrolled in private schools, with 396 (82.0% in the age bracket) enrolled. Conversely, the age group of 15 to 17 year olds has the lowest likelihood of being enrolled in a private school, with 2,914 (96.5% in the age bracket) attending a public institution.
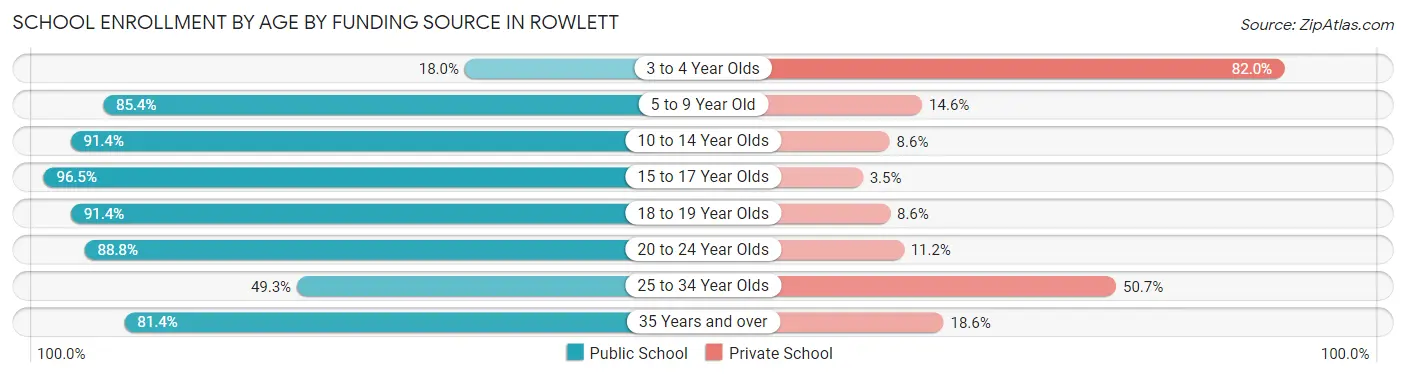
| Age Bracket | Public School | Private School |
| 3 to 4 Year Olds | 87 (18.0%) | 396 (82.0%) |
| 5 to 9 Year Old | 3,177 (85.4%) | 544 (14.6%) |
| 10 to 14 Year Olds | 2,912 (91.4%) | 273 (8.6%) |
| 15 to 17 Year Olds | 2,914 (96.5%) | 107 (3.5%) |
| 18 to 19 Year Olds | 889 (91.4%) | 84 (8.6%) |
| 20 to 24 Year Olds | 914 (88.8%) | 115 (11.2%) |
| 25 to 34 Year Olds | 745 (49.3%) | 767 (50.7%) |
| 35 Years and over | 985 (81.4%) | 225 (18.6%) |
| Total | 12,622 (83.4%) | 2,512 (16.6%) |
Educational Attainment by Field of Study in Rowlett
Business (4,470 | 25.6%), education (2,193 | 12.6%), science & technology (1,888 | 10.8%), engineering (1,826 | 10.4%), and computers & mathematics (1,117 | 6.4%) are the most common fields of study among 17,466 individuals in Rowlett who have obtained a bachelor's degree or higher.
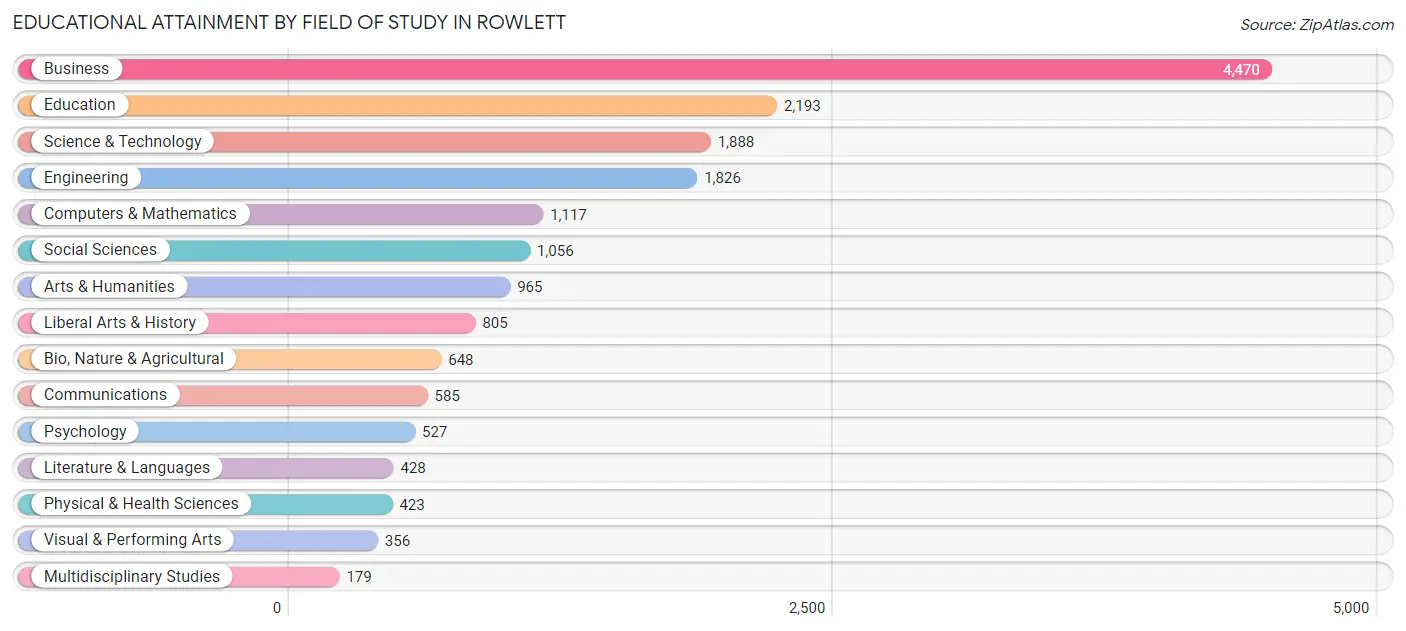
| Field of Study | # Graduates | % Graduates |
| Computers & Mathematics | 1,117 | 6.4% |
| Bio, Nature & Agricultural | 648 | 3.7% |
| Physical & Health Sciences | 423 | 2.4% |
| Psychology | 527 | 3.0% |
| Social Sciences | 1,056 | 6.0% |
| Engineering | 1,826 | 10.4% |
| Multidisciplinary Studies | 179 | 1.0% |
| Science & Technology | 1,888 | 10.8% |
| Business | 4,470 | 25.6% |
| Education | 2,193 | 12.6% |
| Literature & Languages | 428 | 2.5% |
| Liberal Arts & History | 805 | 4.6% |
| Visual & Performing Arts | 356 | 2.0% |
| Communications | 585 | 3.4% |
| Arts & Humanities | 965 | 5.5% |
| Total | 17,466 | 100.0% |
Transportation & Commute in Rowlett
Vehicle Availability by Sex in Rowlett
The most prevalent vehicle ownership categories in Rowlett are males with 2 vehicles (7,082, accounting for 38.3%) and females with 2 vehicles (6,287, making up 46.2%).
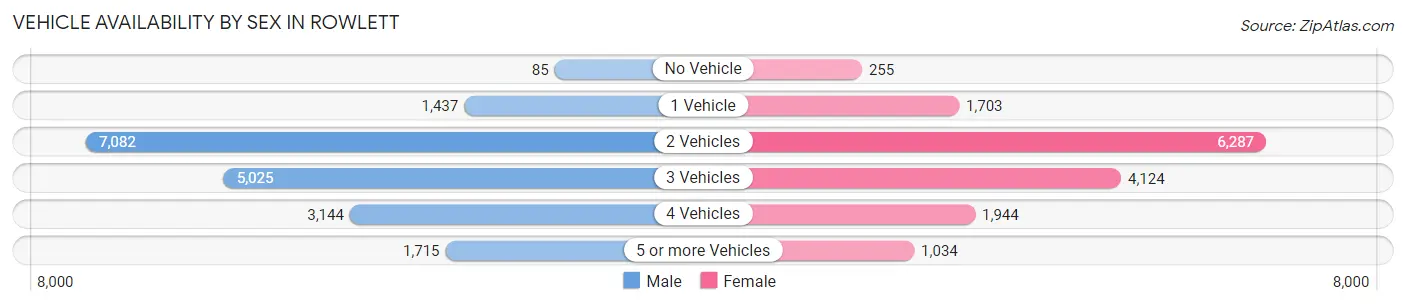
| Vehicles Available | Male | Female |
| No Vehicle | 85 (0.5%) | 255 (1.7%) |
| 1 Vehicle | 1,437 (7.8%) | 1,703 (11.1%) |
| 2 Vehicles | 7,082 (38.3%) | 6,287 (41.0%) |
| 3 Vehicles | 5,025 (27.2%) | 4,124 (26.9%) |
| 4 Vehicles | 3,144 (17.0%) | 1,944 (12.7%) |
| 5 or more Vehicles | 1,715 (9.3%) | 1,034 (6.7%) |
| Total | 18,488 (100.0%) | 15,347 (100.0%) |
Commute Time in Rowlett
The most frequently occuring commute durations in Rowlett are 30 to 34 minutes (4,857 commuters, 16.2%), 45 to 59 minutes (4,793 commuters, 16.0%), and 20 to 24 minutes (3,402 commuters, 11.4%).
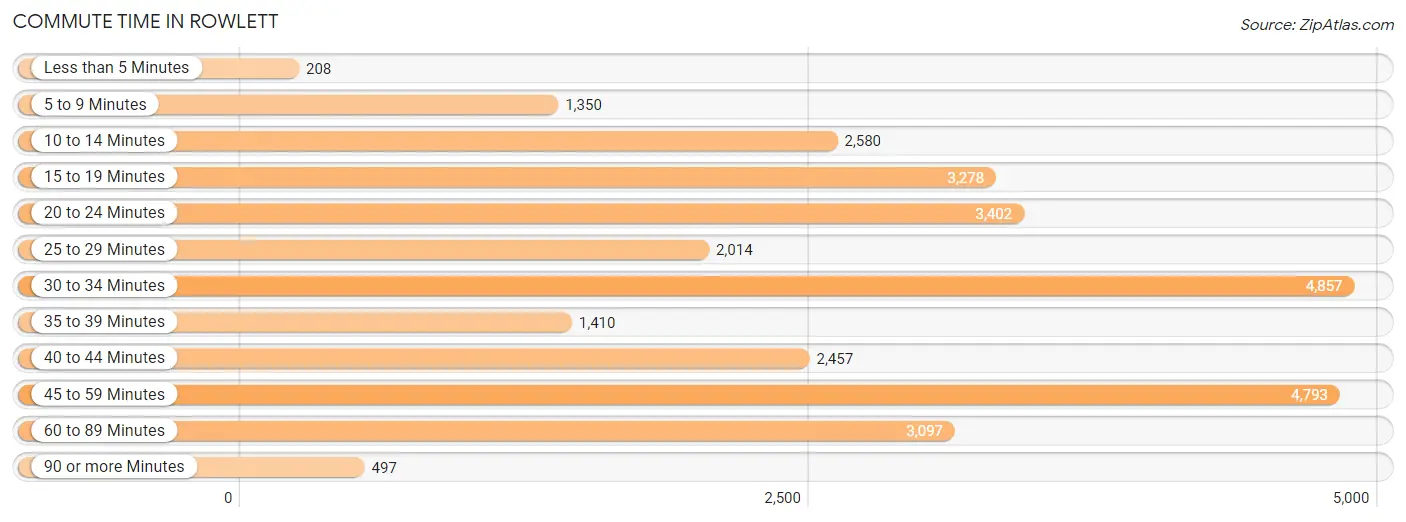
| Commute Time | # Commuters | % Commuters |
| Less than 5 Minutes | 208 | 0.7% |
| 5 to 9 Minutes | 1,350 | 4.5% |
| 10 to 14 Minutes | 2,580 | 8.6% |
| 15 to 19 Minutes | 3,278 | 11.0% |
| 20 to 24 Minutes | 3,402 | 11.4% |
| 25 to 29 Minutes | 2,014 | 6.7% |
| 30 to 34 Minutes | 4,857 | 16.2% |
| 35 to 39 Minutes | 1,410 | 4.7% |
| 40 to 44 Minutes | 2,457 | 8.2% |
| 45 to 59 Minutes | 4,793 | 16.0% |
| 60 to 89 Minutes | 3,097 | 10.3% |
| 90 or more Minutes | 497 | 1.7% |
Commute Time by Sex in Rowlett
The most common commute times in Rowlett are 30 to 34 minutes (2,816 commuters, 17.1%) for males and 45 to 59 minutes (2,063 commuters, 15.4%) for females.
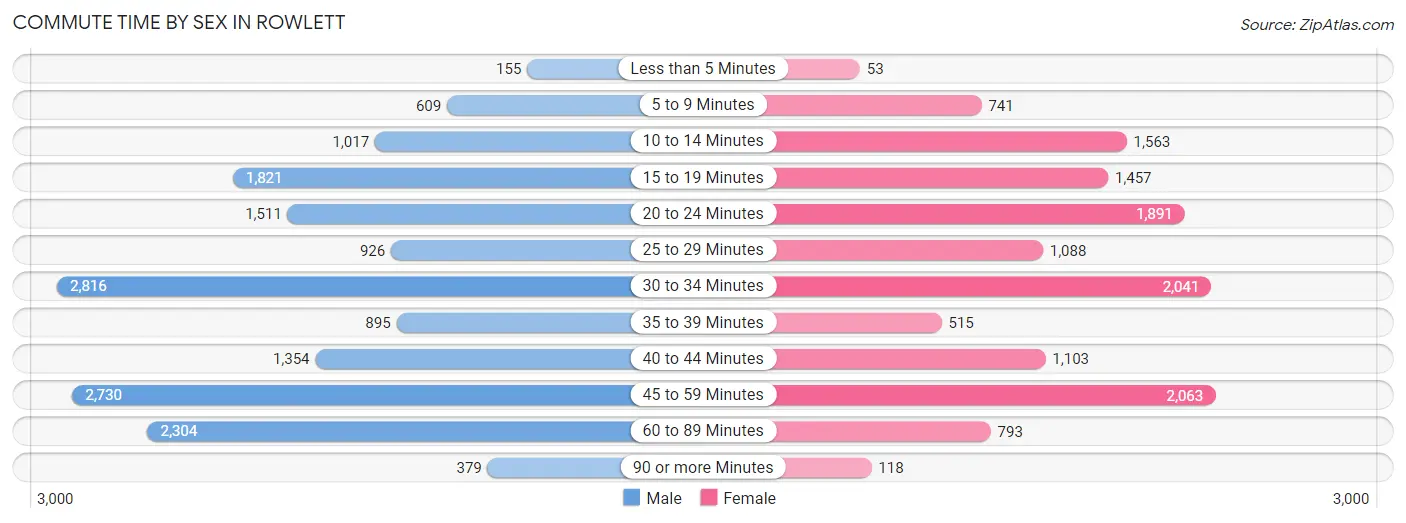
| Commute Time | Male | Female |
| Less than 5 Minutes | 155 (0.9%) | 53 (0.4%) |
| 5 to 9 Minutes | 609 (3.7%) | 741 (5.5%) |
| 10 to 14 Minutes | 1,017 (6.2%) | 1,563 (11.6%) |
| 15 to 19 Minutes | 1,821 (11.0%) | 1,457 (10.8%) |
| 20 to 24 Minutes | 1,511 (9.1%) | 1,891 (14.1%) |
| 25 to 29 Minutes | 926 (5.6%) | 1,088 (8.1%) |
| 30 to 34 Minutes | 2,816 (17.1%) | 2,041 (15.2%) |
| 35 to 39 Minutes | 895 (5.4%) | 515 (3.8%) |
| 40 to 44 Minutes | 1,354 (8.2%) | 1,103 (8.2%) |
| 45 to 59 Minutes | 2,730 (16.5%) | 2,063 (15.4%) |
| 60 to 89 Minutes | 2,304 (14.0%) | 793 (5.9%) |
| 90 or more Minutes | 379 (2.3%) | 118 (0.9%) |
Time of Departure to Work by Sex in Rowlett
The most frequent times of departure to work in Rowlett are 7:00 AM to 7:29 AM (2,815, 17.0%) for males and 7:00 AM to 7:29 AM (2,494, 18.6%) for females.
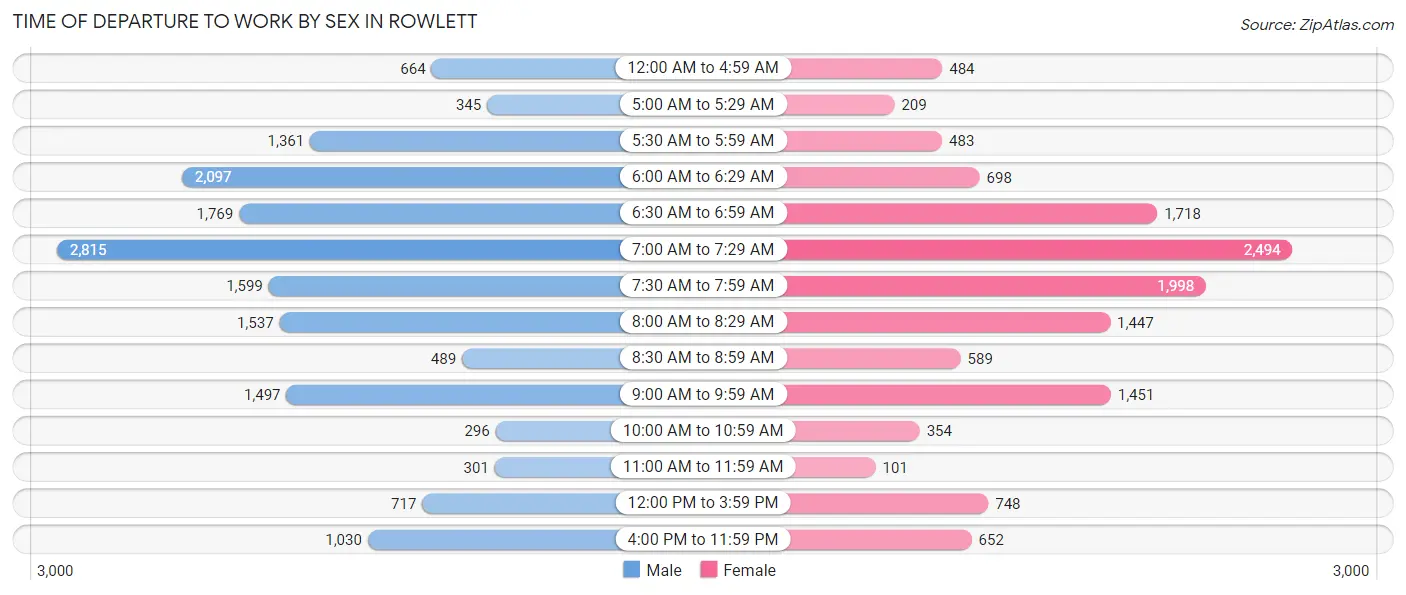
| Time of Departure | Male | Female |
| 12:00 AM to 4:59 AM | 664 (4.0%) | 484 (3.6%) |
| 5:00 AM to 5:29 AM | 345 (2.1%) | 209 (1.6%) |
| 5:30 AM to 5:59 AM | 1,361 (8.2%) | 483 (3.6%) |
| 6:00 AM to 6:29 AM | 2,097 (12.7%) | 698 (5.2%) |
| 6:30 AM to 6:59 AM | 1,769 (10.7%) | 1,718 (12.8%) |
| 7:00 AM to 7:29 AM | 2,815 (17.0%) | 2,494 (18.6%) |
| 7:30 AM to 7:59 AM | 1,599 (9.7%) | 1,998 (14.9%) |
| 8:00 AM to 8:29 AM | 1,537 (9.3%) | 1,447 (10.8%) |
| 8:30 AM to 8:59 AM | 489 (3.0%) | 589 (4.4%) |
| 9:00 AM to 9:59 AM | 1,497 (9.1%) | 1,451 (10.8%) |
| 10:00 AM to 10:59 AM | 296 (1.8%) | 354 (2.6%) |
| 11:00 AM to 11:59 AM | 301 (1.8%) | 101 (0.7%) |
| 12:00 PM to 3:59 PM | 717 (4.3%) | 748 (5.6%) |
| 4:00 PM to 11:59 PM | 1,030 (6.2%) | 652 (4.9%) |
| Total | 16,517 (100.0%) | 13,426 (100.0%) |
Housing Occupancy in Rowlett
Occupancy by Ownership in Rowlett
Of the total 21,371 dwellings in Rowlett, owner-occupied units account for 16,923 (79.2%), while renter-occupied units make up 4,448 (20.8%).
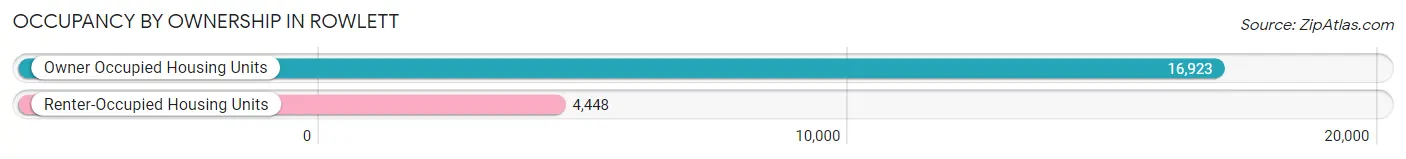
| Occupancy | # Housing Units | % Housing Units |
| Owner Occupied Housing Units | 16,923 | 79.2% |
| Renter-Occupied Housing Units | 4,448 | 20.8% |
| Total Occupied Housing Units | 21,371 | 100.0% |
Occupancy by Household Size in Rowlett
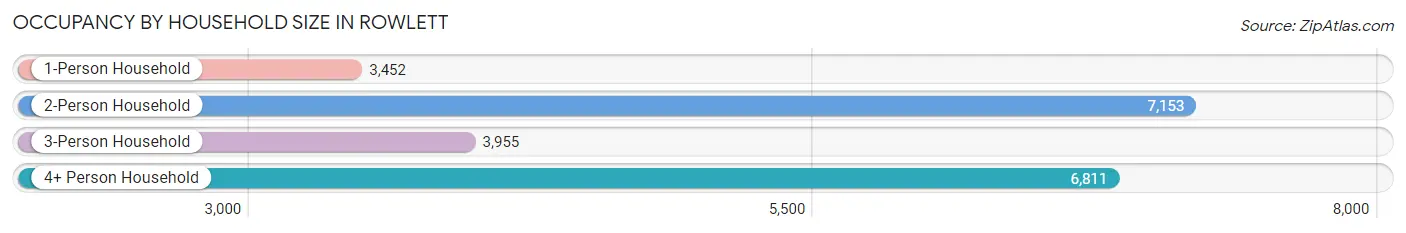
| Household Size | # Housing Units | % Housing Units |
| 1-Person Household | 3,452 | 16.2% |
| 2-Person Household | 7,153 | 33.5% |
| 3-Person Household | 3,955 | 18.5% |
| 4+ Person Household | 6,811 | 31.9% |
| Total Housing Units | 21,371 | 100.0% |
Occupancy by Ownership by Household Size in Rowlett
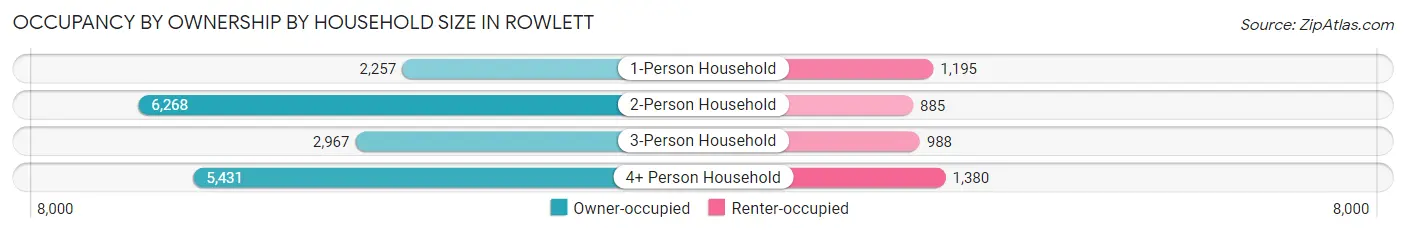
| Household Size | Owner-occupied | Renter-occupied |
| 1-Person Household | 2,257 (65.4%) | 1,195 (34.6%) |
| 2-Person Household | 6,268 (87.6%) | 885 (12.4%) |
| 3-Person Household | 2,967 (75.0%) | 988 (25.0%) |
| 4+ Person Household | 5,431 (79.7%) | 1,380 (20.3%) |
| Total Housing Units | 16,923 (79.2%) | 4,448 (20.8%) |
Occupancy by Educational Attainment in Rowlett
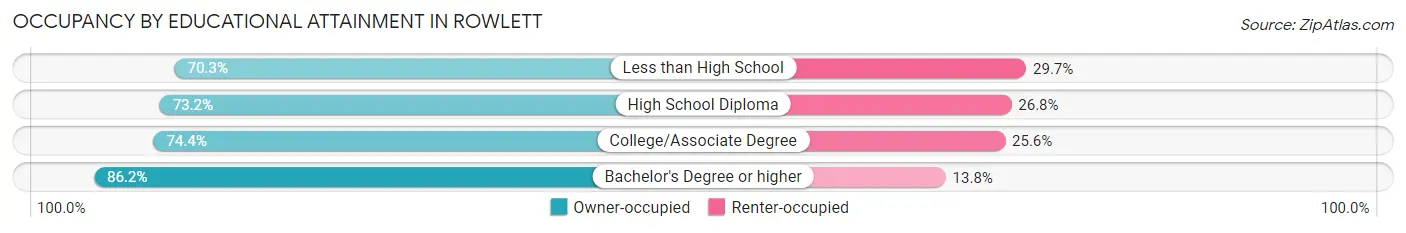
| Household Size | Owner-occupied | Renter-occupied |
| Less than High School | 747 (70.3%) | 316 (29.7%) |
| High School Diploma | 2,518 (73.2%) | 922 (26.8%) |
| College/Associate Degree | 5,599 (74.4%) | 1,922 (25.6%) |
| Bachelor's Degree or higher | 8,059 (86.2%) | 1,288 (13.8%) |
Occupancy by Age of Householder in Rowlett
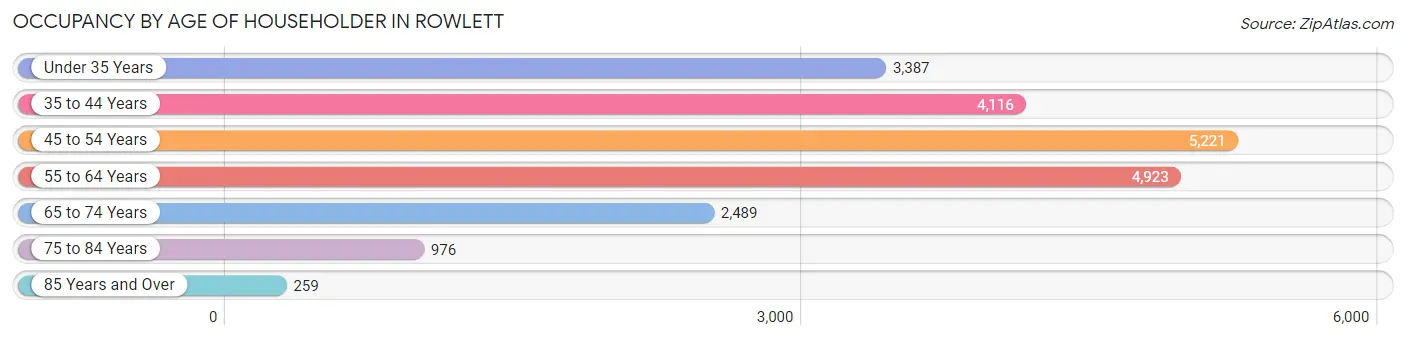
| Age Bracket | # Households | % Households |
| Under 35 Years | 3,387 | 15.9% |
| 35 to 44 Years | 4,116 | 19.3% |
| 45 to 54 Years | 5,221 | 24.4% |
| 55 to 64 Years | 4,923 | 23.0% |
| 65 to 74 Years | 2,489 | 11.7% |
| 75 to 84 Years | 976 | 4.6% |
| 85 Years and Over | 259 | 1.2% |
| Total | 21,371 | 100.0% |
Housing Finances in Rowlett
Median Income by Occupancy in Rowlett
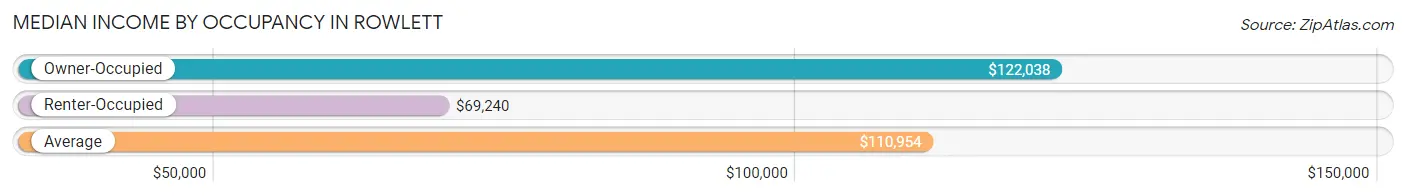
| Occupancy Type | # Households | Median Income |
| Owner-Occupied | 16,923 (79.2%) | $122,038 |
| Renter-Occupied | 4,448 (20.8%) | $69,240 |
| Average | 21,371 (100.0%) | $110,954 |
Occupancy by Householder Income Bracket in Rowlett
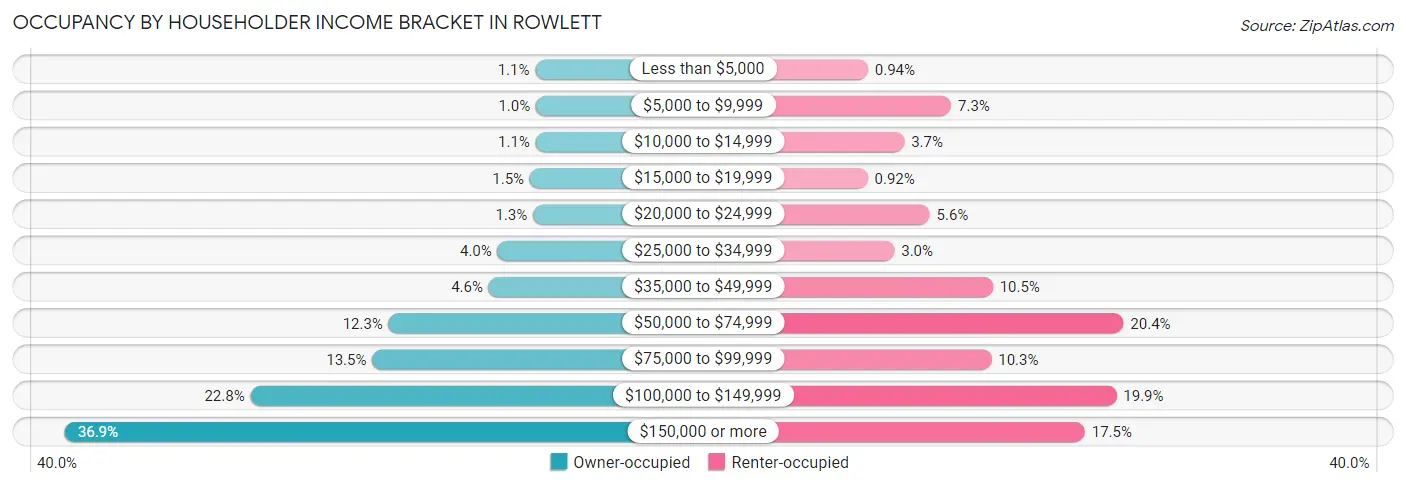
| Income Bracket | Owner-occupied | Renter-occupied |
| Less than $5,000 | 184 (1.1%) | 42 (0.9%) |
| $5,000 to $9,999 | 174 (1.0%) | 324 (7.3%) |
| $10,000 to $14,999 | 180 (1.1%) | 165 (3.7%) |
| $15,000 to $19,999 | 253 (1.5%) | 41 (0.9%) |
| $20,000 to $24,999 | 213 (1.3%) | 251 (5.6%) |
| $25,000 to $34,999 | 670 (4.0%) | 131 (2.9%) |
| $35,000 to $49,999 | 783 (4.6%) | 465 (10.4%) |
| $50,000 to $74,999 | 2,074 (12.3%) | 908 (20.4%) |
| $75,000 to $99,999 | 2,287 (13.5%) | 460 (10.3%) |
| $100,000 to $149,999 | 3,856 (22.8%) | 884 (19.9%) |
| $150,000 or more | 6,249 (36.9%) | 777 (17.5%) |
| Total | 16,923 (100.0%) | 4,448 (100.0%) |
Monthly Housing Cost Tiers in Rowlett
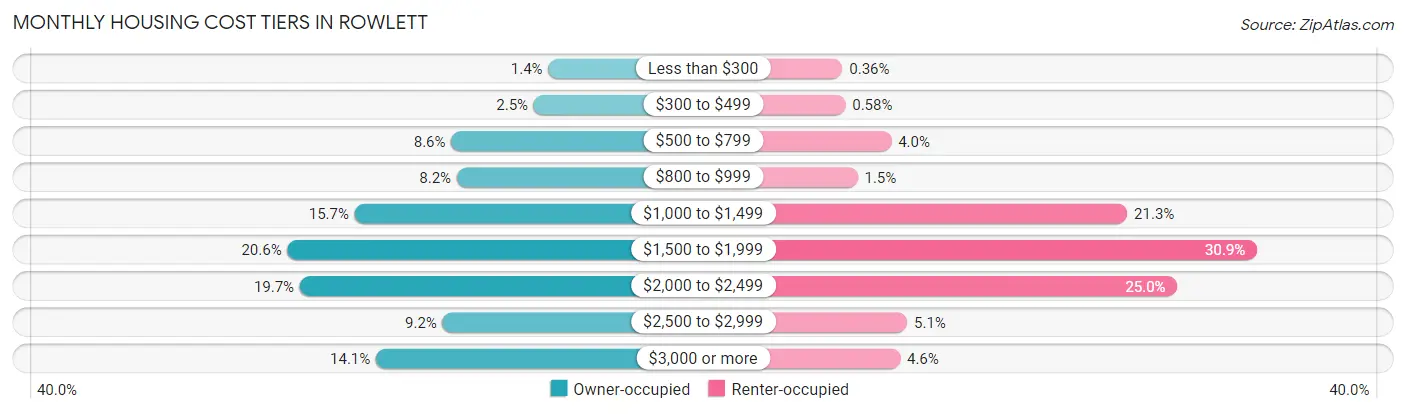
| Monthly Cost | Owner-occupied | Renter-occupied |
| Less than $300 | 240 (1.4%) | 16 (0.4%) |
| $300 to $499 | 422 (2.5%) | 26 (0.6%) |
| $500 to $799 | 1,450 (8.6%) | 176 (4.0%) |
| $800 to $999 | 1,381 (8.2%) | 66 (1.5%) |
| $1,000 to $1,499 | 2,654 (15.7%) | 949 (21.3%) |
| $1,500 to $1,999 | 3,493 (20.6%) | 1,375 (30.9%) |
| $2,000 to $2,499 | 3,337 (19.7%) | 1,114 (25.0%) |
| $2,500 to $2,999 | 1,559 (9.2%) | 228 (5.1%) |
| $3,000 or more | 2,387 (14.1%) | 205 (4.6%) |
| Total | 16,923 (100.0%) | 4,448 (100.0%) |
Physical Housing Characteristics in Rowlett
Housing Structures in Rowlett
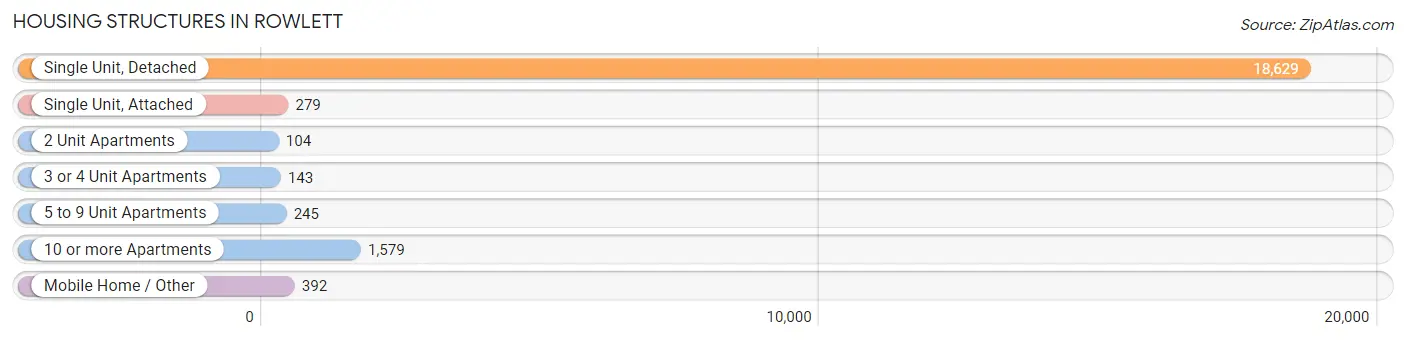
| Structure Type | # Housing Units | % Housing Units |
| Single Unit, Detached | 18,629 | 87.2% |
| Single Unit, Attached | 279 | 1.3% |
| 2 Unit Apartments | 104 | 0.5% |
| 3 or 4 Unit Apartments | 143 | 0.7% |
| 5 to 9 Unit Apartments | 245 | 1.1% |
| 10 or more Apartments | 1,579 | 7.4% |
| Mobile Home / Other | 392 | 1.8% |
| Total | 21,371 | 100.0% |
Housing Structures by Occupancy in Rowlett
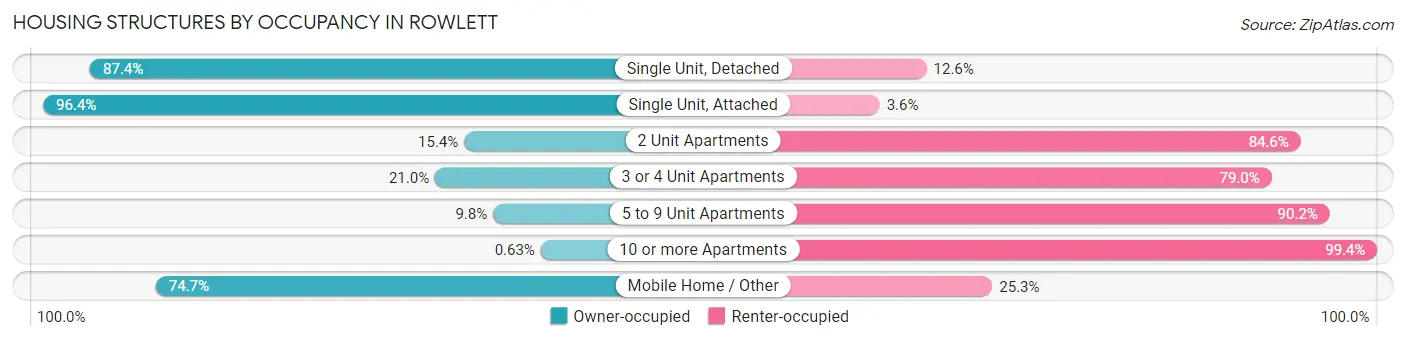
| Structure Type | Owner-occupied | Renter-occupied |
| Single Unit, Detached | 16,281 (87.4%) | 2,348 (12.6%) |
| Single Unit, Attached | 269 (96.4%) | 10 (3.6%) |
| 2 Unit Apartments | 16 (15.4%) | 88 (84.6%) |
| 3 or 4 Unit Apartments | 30 (21.0%) | 113 (79.0%) |
| 5 to 9 Unit Apartments | 24 (9.8%) | 221 (90.2%) |
| 10 or more Apartments | 10 (0.6%) | 1,569 (99.4%) |
| Mobile Home / Other | 293 (74.7%) | 99 (25.3%) |
| Total | 16,923 (79.2%) | 4,448 (20.8%) |
Housing Structures by Number of Rooms in Rowlett
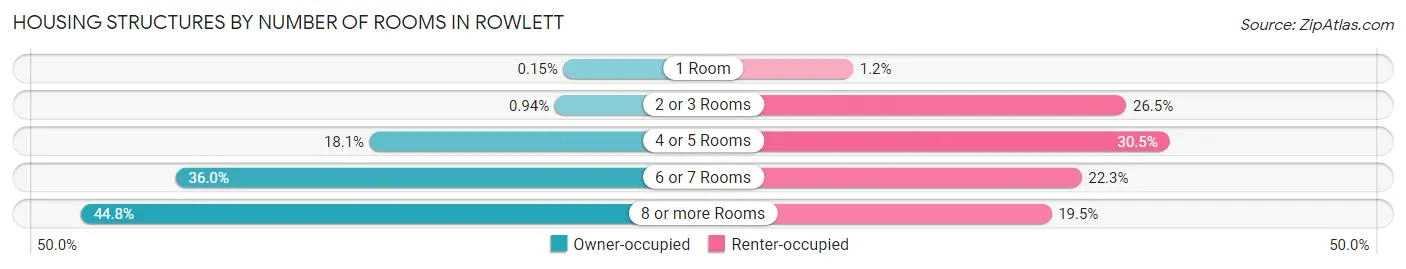
| Number of Rooms | Owner-occupied | Renter-occupied |
| 1 Room | 25 (0.2%) | 53 (1.2%) |
| 2 or 3 Rooms | 159 (0.9%) | 1,177 (26.5%) |
| 4 or 5 Rooms | 3,057 (18.1%) | 1,356 (30.5%) |
| 6 or 7 Rooms | 6,098 (36.0%) | 993 (22.3%) |
| 8 or more Rooms | 7,584 (44.8%) | 869 (19.5%) |
| Total | 16,923 (100.0%) | 4,448 (100.0%) |
Housing Structure by Heating Type in Rowlett
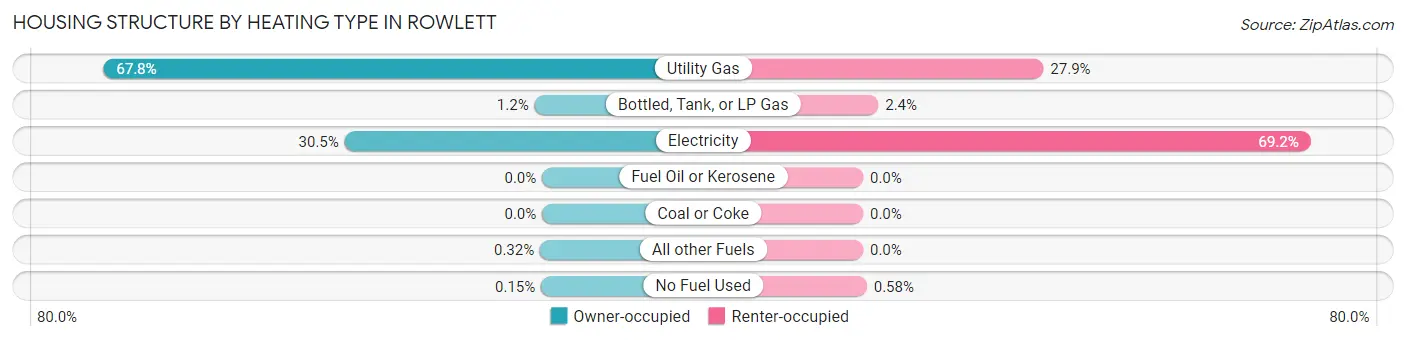
| Heating Type | Owner-occupied | Renter-occupied |
| Utility Gas | 11,477 (67.8%) | 1,240 (27.9%) |
| Bottled, Tank, or LP Gas | 200 (1.2%) | 105 (2.4%) |
| Electricity | 5,166 (30.5%) | 3,077 (69.2%) |
| Fuel Oil or Kerosene | 0 (0.0%) | 0 (0.0%) |
| Coal or Coke | 0 (0.0%) | 0 (0.0%) |
| All other Fuels | 54 (0.3%) | 0 (0.0%) |
| No Fuel Used | 26 (0.2%) | 26 (0.6%) |
| Total | 16,923 (100.0%) | 4,448 (100.0%) |
Household Vehicle Usage in Rowlett
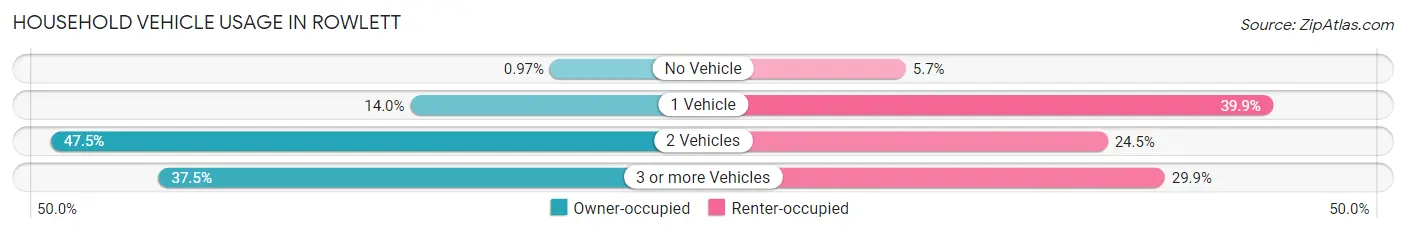
| Vehicles per Household | Owner-occupied | Renter-occupied |
| No Vehicle | 164 (1.0%) | 253 (5.7%) |
| 1 Vehicle | 2,368 (14.0%) | 1,776 (39.9%) |
| 2 Vehicles | 8,046 (47.5%) | 1,091 (24.5%) |
| 3 or more Vehicles | 6,345 (37.5%) | 1,328 (29.9%) |
| Total | 16,923 (100.0%) | 4,448 (100.0%) |
Real Estate & Mortgages in Rowlett
Real Estate and Mortgage Overview in Rowlett
| Characteristic | Without Mortgage | With Mortgage |
| Housing Units | 5,018 | 11,905 |
| Median Property Value | $281,100 | $313,400 |
| Median Household Income | $96,011 | $4,810 |
| Monthly Housing Costs | $900 | $2,379 |
| Real Estate Taxes | $4,544 | $150 |
Property Value by Mortgage Status in Rowlett
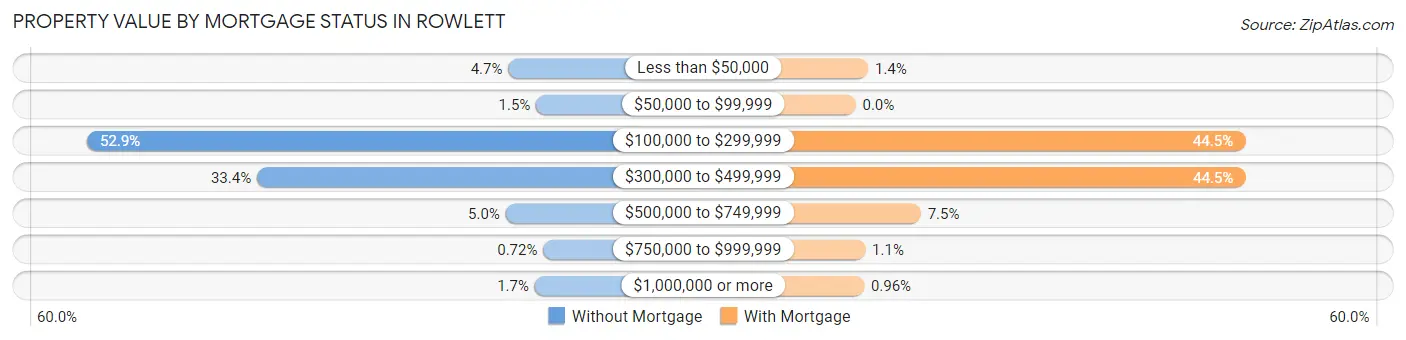
| Property Value | Without Mortgage | With Mortgage |
| Less than $50,000 | 237 (4.7%) | 170 (1.4%) |
| $50,000 to $99,999 | 77 (1.5%) | 0 (0.0%) |
| $100,000 to $299,999 | 2,653 (52.9%) | 5,300 (44.5%) |
| $300,000 to $499,999 | 1,678 (33.4%) | 5,303 (44.5%) |
| $500,000 to $749,999 | 252 (5.0%) | 887 (7.4%) |
| $750,000 to $999,999 | 36 (0.7%) | 131 (1.1%) |
| $1,000,000 or more | 85 (1.7%) | 114 (1.0%) |
| Total | 5,018 (100.0%) | 11,905 (100.0%) |
Household Income by Mortgage Status in Rowlett
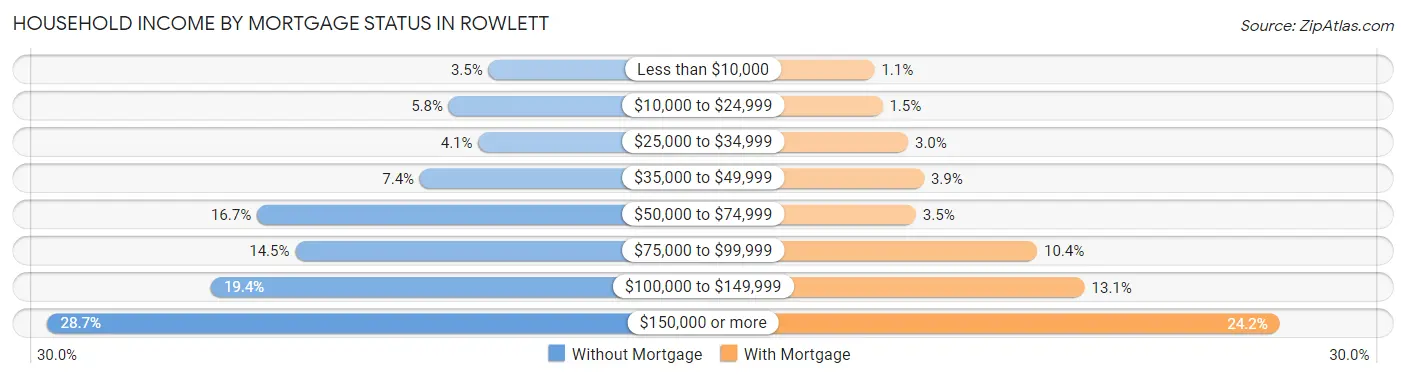
| Household Income | Without Mortgage | With Mortgage |
| Less than $10,000 | 175 (3.5%) | 129 (1.1%) |
| $10,000 to $24,999 | 289 (5.8%) | 183 (1.5%) |
| $25,000 to $34,999 | 204 (4.1%) | 357 (3.0%) |
| $35,000 to $49,999 | 372 (7.4%) | 466 (3.9%) |
| $50,000 to $74,999 | 839 (16.7%) | 411 (3.5%) |
| $75,000 to $99,999 | 729 (14.5%) | 1,235 (10.4%) |
| $100,000 to $149,999 | 971 (19.4%) | 1,558 (13.1%) |
| $150,000 or more | 1,439 (28.7%) | 2,885 (24.2%) |
| Total | 5,018 (100.0%) | 11,905 (100.0%) |
Property Value to Household Income Ratio in Rowlett
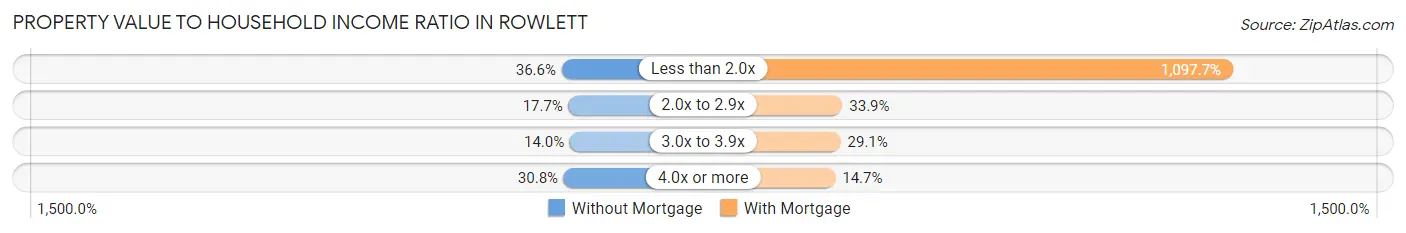
| Value-to-Income Ratio | Without Mortgage | With Mortgage |
| Less than 2.0x | 1,834 (36.5%) | 130,680 (1,097.7%) |
| 2.0x to 2.9x | 889 (17.7%) | 4,033 (33.9%) |
| 3.0x to 3.9x | 704 (14.0%) | 3,469 (29.1%) |
| 4.0x or more | 1,544 (30.8%) | 1,754 (14.7%) |
| Total | 5,018 (100.0%) | 11,905 (100.0%) |
Real Estate Taxes by Mortgage Status in Rowlett
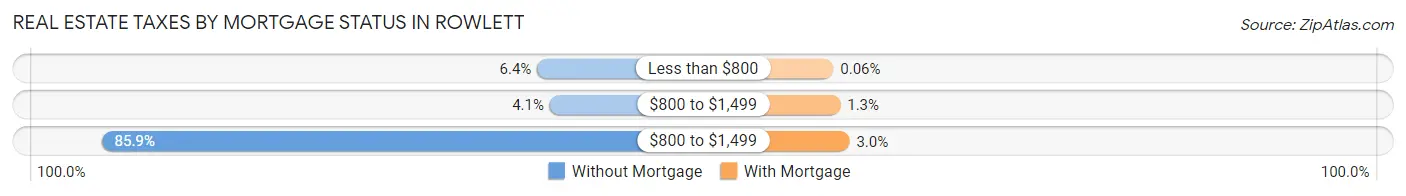
| Property Taxes | Without Mortgage | With Mortgage |
| Less than $800 | 320 (6.4%) | 7 (0.1%) |
| $800 to $1,499 | 204 (4.1%) | 157 (1.3%) |
| $800 to $1,499 | 4,312 (85.9%) | 357 (3.0%) |
| Total | 5,018 (100.0%) | 11,905 (100.0%) |
Health & Disability in Rowlett
Health Insurance Coverage by Age in Rowlett
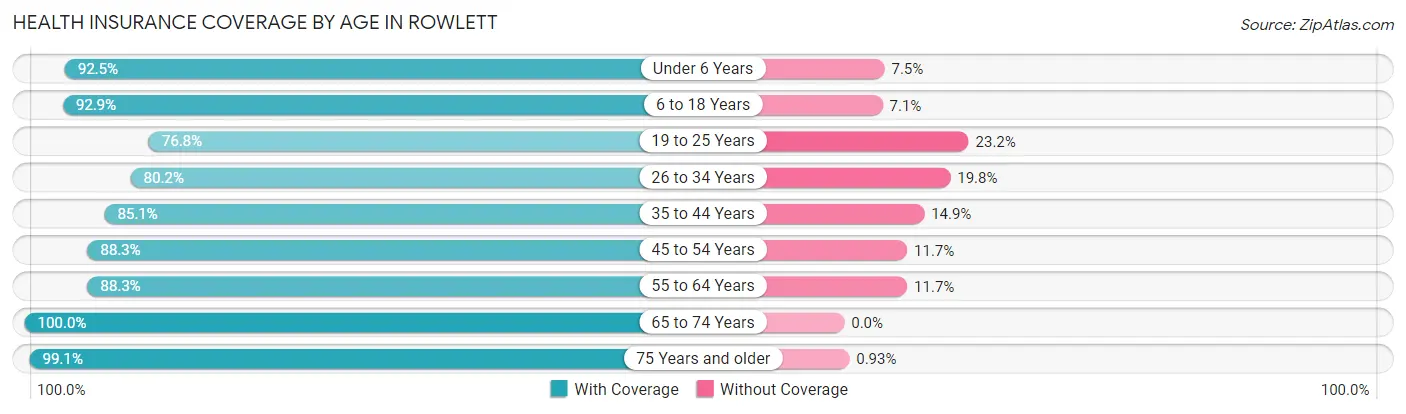
| Age Bracket | With Coverage | Without Coverage |
| Under 6 Years | 4,333 (92.5%) | 352 (7.5%) |
| 6 to 18 Years | 10,163 (92.9%) | 782 (7.1%) |
| 19 to 25 Years | 3,792 (76.8%) | 1,144 (23.2%) |
| 26 to 34 Years | 6,703 (80.2%) | 1,652 (19.8%) |
| 35 to 44 Years | 6,893 (85.1%) | 1,207 (14.9%) |
| 45 to 54 Years | 8,471 (88.3%) | 1,124 (11.7%) |
| 55 to 64 Years | 8,083 (88.3%) | 1,073 (11.7%) |
| 65 to 74 Years | 4,666 (100.0%) | 0 (0.0%) |
| 75 Years and older | 2,463 (99.1%) | 23 (0.9%) |
| Total | 55,567 (88.3%) | 7,357 (11.7%) |
Health Insurance Coverage by Citizenship Status in Rowlett
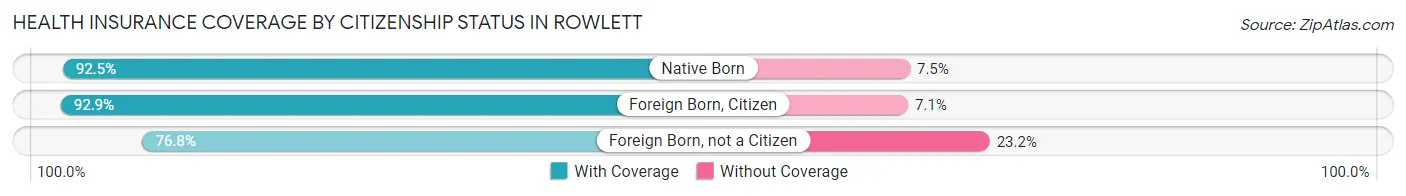
| Citizenship Status | With Coverage | Without Coverage |
| Native Born | 4,333 (92.5%) | 352 (7.5%) |
| Foreign Born, Citizen | 10,163 (92.9%) | 782 (7.1%) |
| Foreign Born, not a Citizen | 3,792 (76.8%) | 1,144 (23.2%) |
Health Insurance Coverage by Household Income in Rowlett
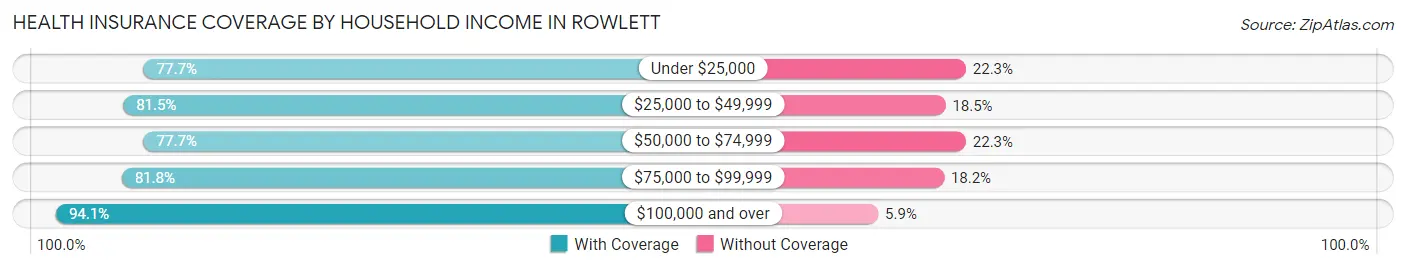
| Household Income | With Coverage | Without Coverage |
| Under $25,000 | 3,330 (77.7%) | 956 (22.3%) |
| $25,000 to $49,999 | 3,903 (81.5%) | 885 (18.5%) |
| $50,000 to $74,999 | 6,555 (77.7%) | 1,882 (22.3%) |
| $75,000 to $99,999 | 6,342 (81.8%) | 1,411 (18.2%) |
| $100,000 and over | 35,424 (94.1%) | 2,215 (5.9%) |
Public vs Private Health Insurance Coverage by Age in Rowlett
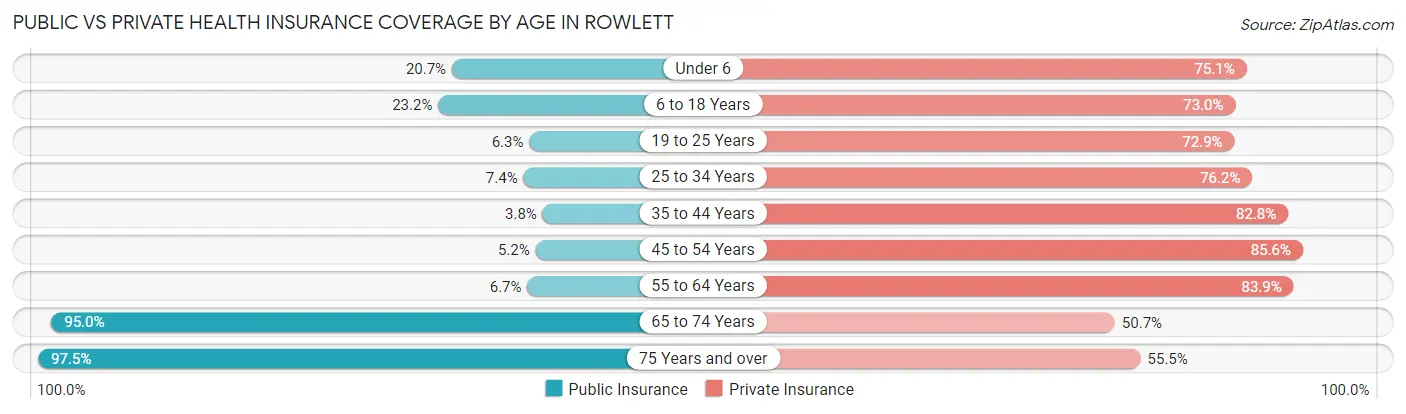
| Age Bracket | Public Insurance | Private Insurance |
| Under 6 | 969 (20.7%) | 3,520 (75.1%) |
| 6 to 18 Years | 2,541 (23.2%) | 7,994 (73.0%) |
| 19 to 25 Years | 312 (6.3%) | 3,597 (72.9%) |
| 25 to 34 Years | 618 (7.4%) | 6,365 (76.2%) |
| 35 to 44 Years | 311 (3.8%) | 6,710 (82.8%) |
| 45 to 54 Years | 495 (5.2%) | 8,210 (85.6%) |
| 55 to 64 Years | 612 (6.7%) | 7,678 (83.9%) |
| 65 to 74 Years | 4,434 (95.0%) | 2,365 (50.7%) |
| 75 Years and over | 2,424 (97.5%) | 1,379 (55.5%) |
| Total | 12,716 (20.2%) | 47,818 (76.0%) |
Disability Status by Sex by Age in Rowlett
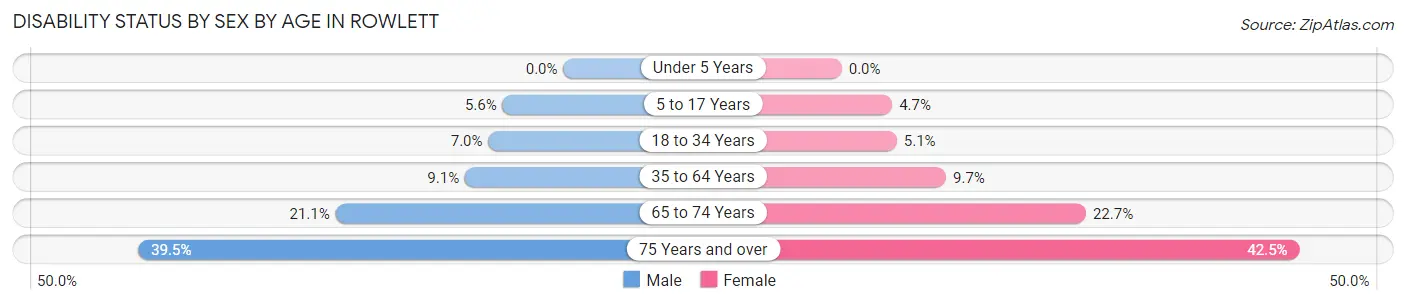
| Age Bracket | Male | Female |
| Under 5 Years | 0 (0.0%) | 0 (0.0%) |
| 5 to 17 Years | 328 (5.6%) | 240 (4.7%) |
| 18 to 34 Years | 538 (7.0%) | 324 (5.1%) |
| 35 to 64 Years | 1,183 (9.1%) | 1,345 (9.7%) |
| 65 to 74 Years | 477 (21.1%) | 546 (22.7%) |
| 75 Years and over | 431 (39.5%) | 592 (42.5%) |
Disability Class by Sex by Age in Rowlett
Disability Class: Hearing Difficulty
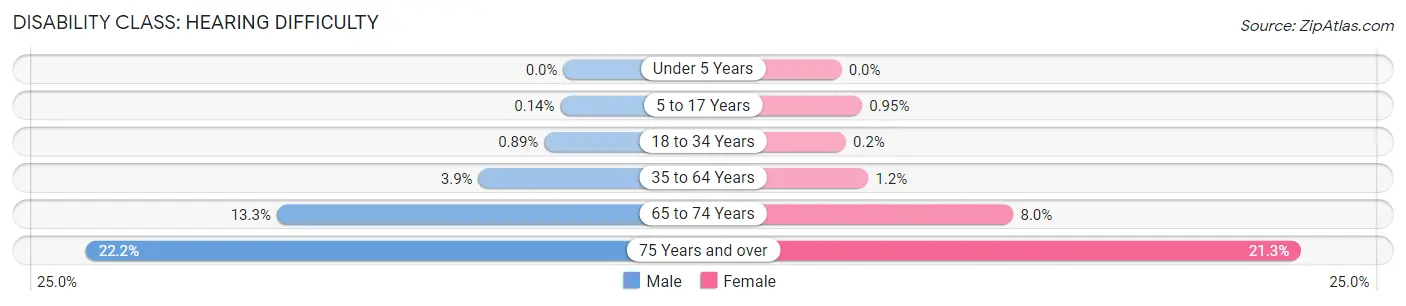
| Age Bracket | Male | Female |
| Under 5 Years | 0 (0.0%) | 0 (0.0%) |
| 5 to 17 Years | 8 (0.1%) | 49 (0.9%) |
| 18 to 34 Years | 69 (0.9%) | 13 (0.2%) |
| 35 to 64 Years | 511 (3.9%) | 172 (1.2%) |
| 65 to 74 Years | 300 (13.3%) | 192 (8.0%) |
| 75 Years and over | 242 (22.2%) | 297 (21.3%) |
Disability Class: Vision Difficulty
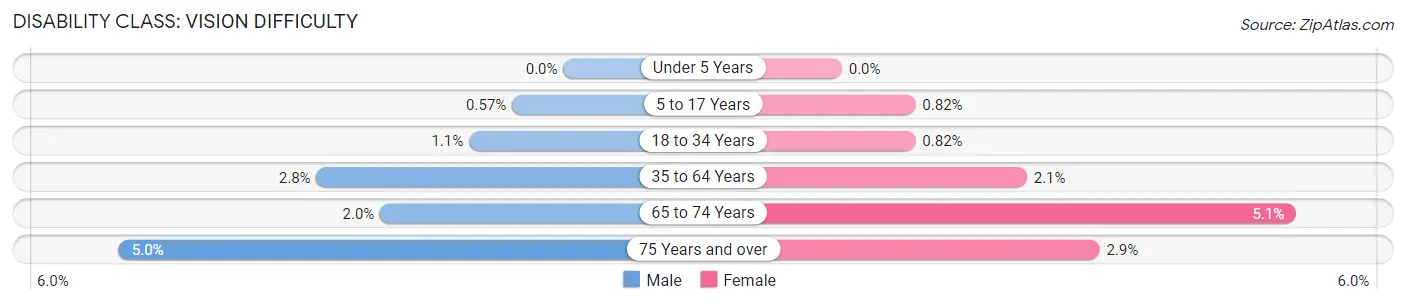
| Age Bracket | Male | Female |
| Under 5 Years | 0 (0.0%) | 0 (0.0%) |
| 5 to 17 Years | 33 (0.6%) | 42 (0.8%) |
| 18 to 34 Years | 81 (1.1%) | 52 (0.8%) |
| 35 to 64 Years | 356 (2.8%) | 286 (2.1%) |
| 65 to 74 Years | 46 (2.0%) | 122 (5.1%) |
| 75 Years and over | 54 (5.0%) | 40 (2.9%) |
Disability Class: Cognitive Difficulty
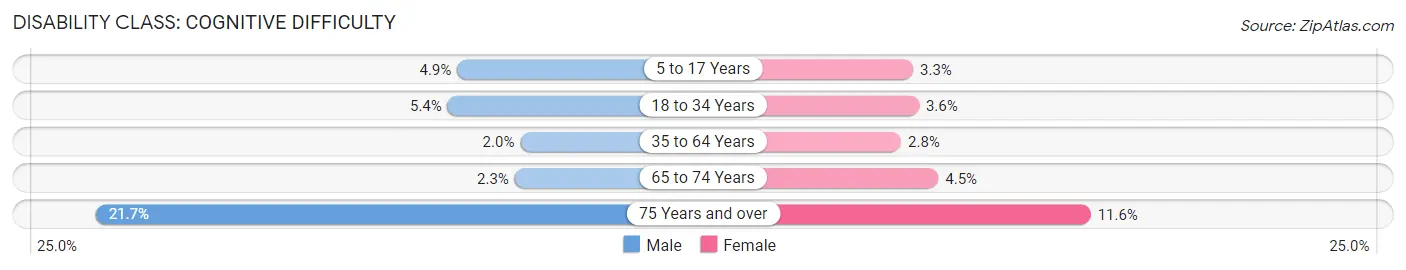
| Age Bracket | Male | Female |
| 5 to 17 Years | 287 (4.9%) | 170 (3.3%) |
| 18 to 34 Years | 415 (5.4%) | 227 (3.6%) |
| 35 to 64 Years | 259 (2.0%) | 382 (2.8%) |
| 65 to 74 Years | 51 (2.3%) | 108 (4.5%) |
| 75 Years and over | 237 (21.7%) | 161 (11.6%) |
Disability Class: Ambulatory Difficulty
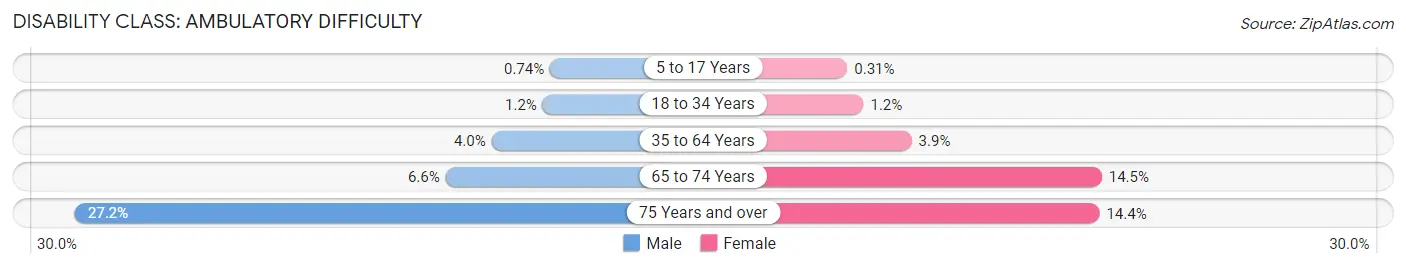
| Age Bracket | Male | Female |
| 5 to 17 Years | 43 (0.7%) | 16 (0.3%) |
| 18 to 34 Years | 89 (1.1%) | 77 (1.2%) |
| 35 to 64 Years | 519 (4.0%) | 540 (3.9%) |
| 65 to 74 Years | 148 (6.6%) | 349 (14.5%) |
| 75 Years and over | 297 (27.2%) | 200 (14.3%) |
Disability Class: Self-Care Difficulty
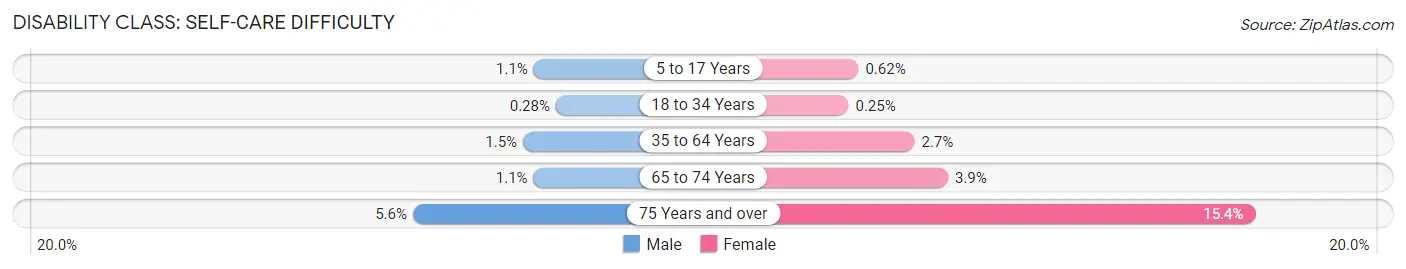
| Age Bracket | Male | Female |
| 5 to 17 Years | 64 (1.1%) | 32 (0.6%) |
| 18 to 34 Years | 22 (0.3%) | 16 (0.3%) |
| 35 to 64 Years | 195 (1.5%) | 375 (2.7%) |
| 65 to 74 Years | 25 (1.1%) | 95 (3.9%) |
| 75 Years and over | 61 (5.6%) | 214 (15.3%) |
Technology Access in Rowlett
Computing Device Access in Rowlett
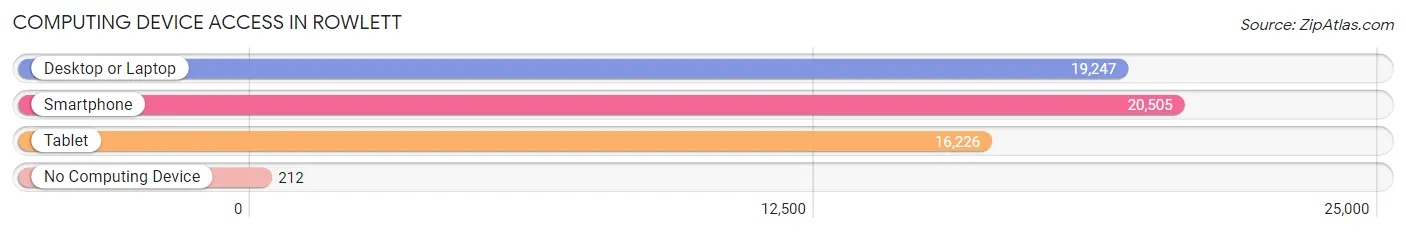
| Device Type | # Households | % Households |
| Desktop or Laptop | 19,247 | 90.1% |
| Smartphone | 20,505 | 96.0% |
| Tablet | 16,226 | 75.9% |
| No Computing Device | 212 | 1.0% |
| Total | 21,371 | 100.0% |
Internet Access in Rowlett
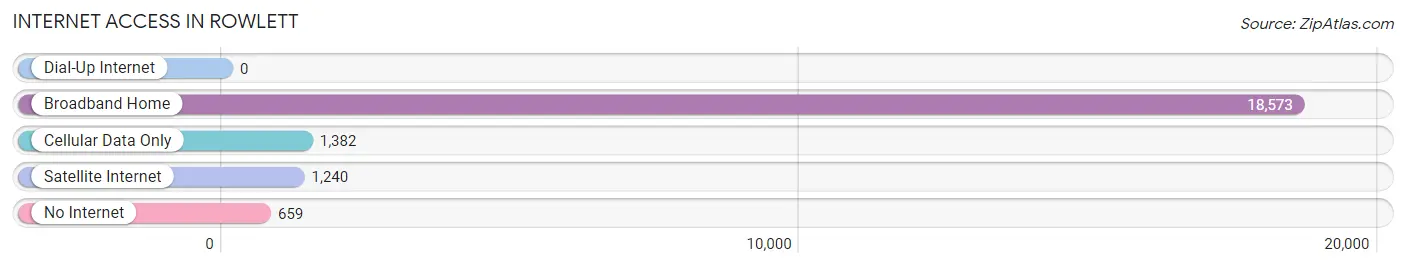
| Internet Type | # Households | % Households |
| Dial-Up Internet | 0 | 0.0% |
| Broadband Home | 18,573 | 86.9% |
| Cellular Data Only | 1,382 | 6.5% |
| Satellite Internet | 1,240 | 5.8% |
| No Internet | 659 | 3.1% |
| Total | 21,371 | 100.0% |
Rowlett Summary
Rowlett, Texas is a city located in Dallas and Rockwall counties in the U.S. state of Texas. It is a suburb of Dallas and part of the Dallas–Fort Worth metroplex. The population was 56,310 at the 2010 census, making it the eighteenth most populous city in the state of Texas.
History
Rowlett was first settled in the 1840s by a small group of settlers from Kentucky and Tennessee. The town was named after Rowlett Creek, which flows through the city. The creek was named after a settler named Rowlett. The town was officially incorporated in 1952.
Geography
Rowlett is located in Dallas and Rockwall counties in the U.S. state of Texas. It is situated on the eastern shore of Lake Ray Hubbard, about 20 miles northeast of downtown Dallas. The city has a total area of 22.2 square miles, of which 21.7 square miles is land and 0.5 square miles is water.
Economy
Rowlett’s economy is largely based on retail and services. The city is home to several large shopping centers, including the Rowlett Towne Center, which features a variety of stores and restaurants. The city also has a number of industrial parks, which provide employment opportunities for many of its residents.
Demographics
As of the 2010 census, there were 56,310 people, 19,945 households, and 15,845 families residing in the city. The population density was 2,567.2 people per square mile. The racial makeup of the city was 75.2% White, 11.3% African American, 0.6% Native American, 4.2% Asian, 0.1% Pacific Islander, 6.2% from other races, and 2.5% from two or more races. Hispanic or Latino of any race were 15.3% of the population.
The median income for a household in the city was $68,945, and the median income for a family was $77,845. The per capita income for the city was $30,945. About 4.2% of families and 5.7% of the population were below the poverty line, including 7.2% of those under age 18 and 4.2% of those age 65 or over.
Rowlett is a diverse and growing city with a strong economy and a vibrant culture. The city is home to a variety of businesses, restaurants, and entertainment venues, making it an attractive destination for both residents and visitors. With its convenient location and strong economy, Rowlett is an ideal place to live, work, and play.
Common Questions
What is Per Capita Income in Rowlett?
Per Capita income in Rowlett is $42,895.
What is the Median Family Income in Rowlett?
Median Family Income in Rowlett is $119,200.
What is the Median Household income in Rowlett?
Median Household Income in Rowlett is $110,954.
What is Income or Wage Gap in Rowlett?
Income or Wage Gap in Rowlett is 22.0%.
Women in Rowlett earn 78.0 cents for every dollar earned by a man.
What is Family Income Deficit in Rowlett?
Family Income Deficit in Rowlett is $10,899.
Families that are below poverty line in Rowlett earn $10,899 less on average than the poverty threshold level.
What is Inequality or Gini Index in Rowlett?
Inequality or Gini Index in Rowlett is 0.37.
What is the Total Population of Rowlett?
Total Population of Rowlett is 63,291.
What is the Total Male Population of Rowlett?
Total Male Population of Rowlett is 31,857.
What is the Total Female Population of Rowlett?
Total Female Population of Rowlett is 31,434.
What is the Ratio of Males per 100 Females in Rowlett?
There are 101.35 Males per 100 Females in Rowlett.
What is the Ratio of Females per 100 Males in Rowlett?
There are 98.67 Females per 100 Males in Rowlett.
What is the Median Population Age in Rowlett?
Median Population Age in Rowlett is 38.6 Years.
What is the Average Family Size in Rowlett
Average Family Size in Rowlett is 3.3 People.
What is the Average Household Size in Rowlett
Average Household Size in Rowlett is 2.9 People.
How Large is the Labor Force in Rowlett?
There are 36,058 People in the Labor Forcein in Rowlett.
What is the Percentage of People in the Labor Force in Rowlett?
71.3% of People are in the Labor Force in Rowlett.
What is the Unemployment Rate in Rowlett?
Unemployment Rate in Rowlett is 4.1%.