Euless, TX Map & Demographics
Euless Map
Euless Overview
$39,240
PER CAPITA INCOME
$85,999
AVG FAMILY INCOME
$77,403
AVG HOUSEHOLD INCOME
5.1%
WAGE / INCOME GAP [ % ]
94.9¢/ $1
WAGE / INCOME GAP [ $ ]
$10,329
FAMILY INCOME DEFICIT
0.39
INEQUALITY / GINI INDEX
60,360
TOTAL POPULATION
30,483
MALE POPULATION
29,877
FEMALE POPULATION
102.03
MALES / 100 FEMALES
98.01
FEMALES / 100 MALES
34.3
MEDIAN AGE
3.3
AVG FAMILY SIZE
2.5
AVG HOUSEHOLD SIZE
36,003
LABOR FORCE [ PEOPLE ]
76.0%
PERCENT IN LABOR FORCE
4.7%
UNEMPLOYMENT RATE
Income in Euless
Income Overview in Euless
Per Capita Income in Euless is $39,240, while median incomes of families and households are $85,999 and $77,403 respectively.
| Characteristic | Number | Measure |
| Per Capita Income | 60,360 | $39,240 |
| Median Family Income | 14,299 | $85,999 |
| Mean Family Income | 14,299 | $108,200 |
| Median Household Income | 24,005 | $77,403 |
| Mean Household Income | 24,005 | $95,591 |
| Income Deficit | 14,299 | $10,329 |
| Wage / Income Gap (%) | 60,360 | 5.06% |
| Wage / Income Gap ($) | 60,360 | 94.94¢ per $1 |
| Gini / Inequality Index | 60,360 | 0.39 |
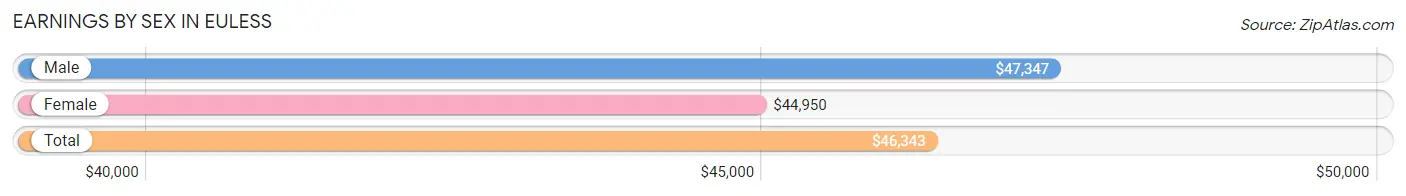
Earnings by Sex in Euless
Average Earnings in Euless are $46,343, $47,347 for men and $44,950 for women, a difference of 5.1%.
| Sex | Number | Average Earnings |
| Male | 20,031 (54.3%) | $47,347 |
| Female | 16,879 (45.7%) | $44,950 |
| Total | 36,910 (100.0%) | $46,343 |
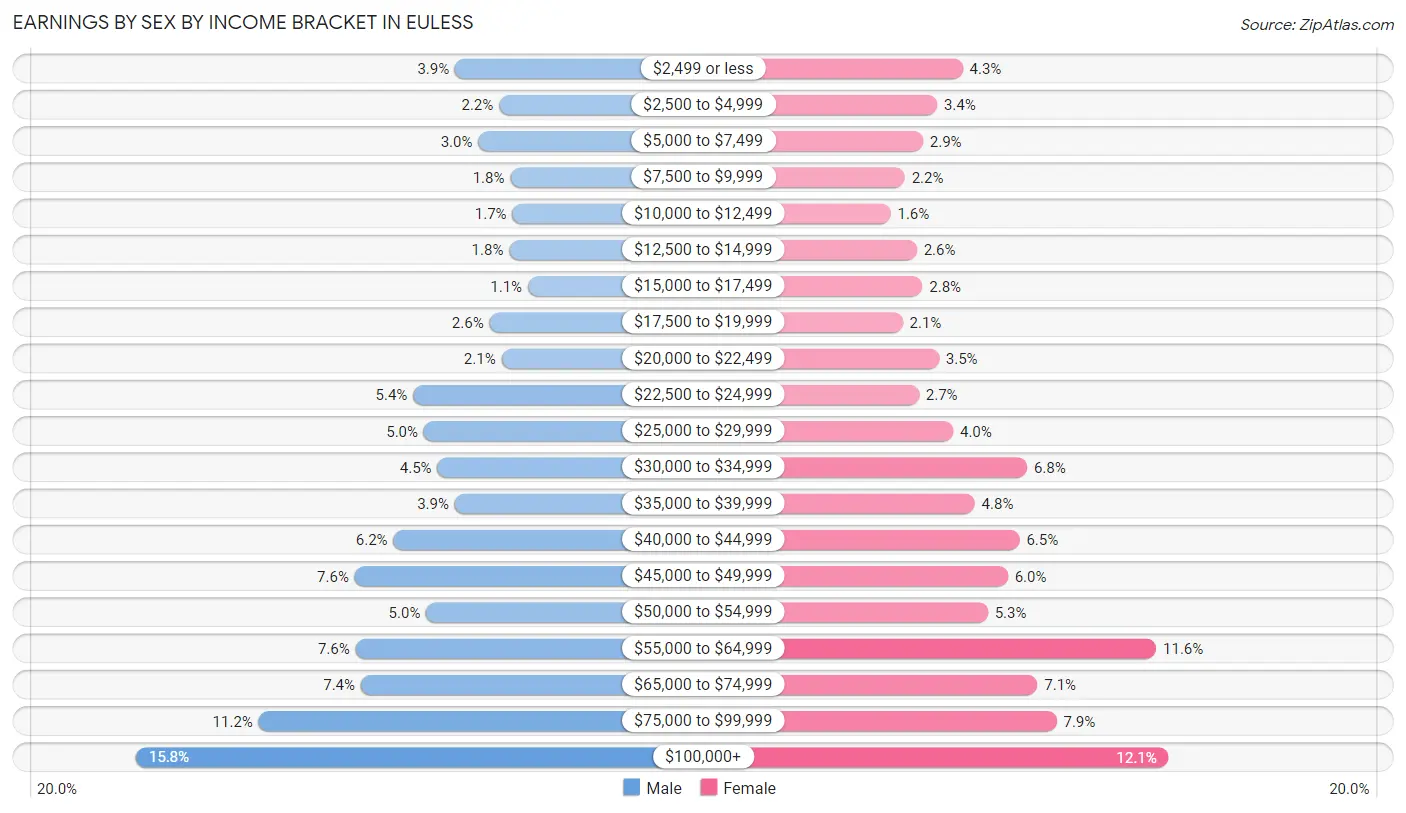
Earnings by Sex by Income Bracket in Euless
The most common earnings brackets in Euless are $100,000+ for men (3,171 | 15.8%) and $100,000+ for women (2,035 | 12.1%).
| Income | Male | Female |
| $2,499 or less | 776 (3.9%) | 732 (4.3%) |
| $2,500 to $4,999 | 444 (2.2%) | 570 (3.4%) |
| $5,000 to $7,499 | 601 (3.0%) | 481 (2.9%) |
| $7,500 to $9,999 | 360 (1.8%) | 367 (2.2%) |
| $10,000 to $12,499 | 345 (1.7%) | 276 (1.6%) |
| $12,500 to $14,999 | 369 (1.8%) | 443 (2.6%) |
| $15,000 to $17,499 | 228 (1.1%) | 477 (2.8%) |
| $17,500 to $19,999 | 517 (2.6%) | 352 (2.1%) |
| $20,000 to $22,499 | 426 (2.1%) | 583 (3.5%) |
| $22,500 to $24,999 | 1,090 (5.4%) | 456 (2.7%) |
| $25,000 to $29,999 | 1,009 (5.0%) | 672 (4.0%) |
| $30,000 to $34,999 | 908 (4.5%) | 1,140 (6.8%) |
| $35,000 to $39,999 | 778 (3.9%) | 808 (4.8%) |
| $40,000 to $44,999 | 1,237 (6.2%) | 1,092 (6.5%) |
| $45,000 to $49,999 | 1,528 (7.6%) | 1,017 (6.0%) |
| $50,000 to $54,999 | 991 (5.0%) | 891 (5.3%) |
| $55,000 to $64,999 | 1,522 (7.6%) | 1,956 (11.6%) |
| $65,000 to $74,999 | 1,482 (7.4%) | 1,205 (7.1%) |
| $75,000 to $99,999 | 2,249 (11.2%) | 1,326 (7.9%) |
| $100,000+ | 3,171 (15.8%) | 2,035 (12.1%) |
| Total | 20,031 (100.0%) | 16,879 (100.0%) |
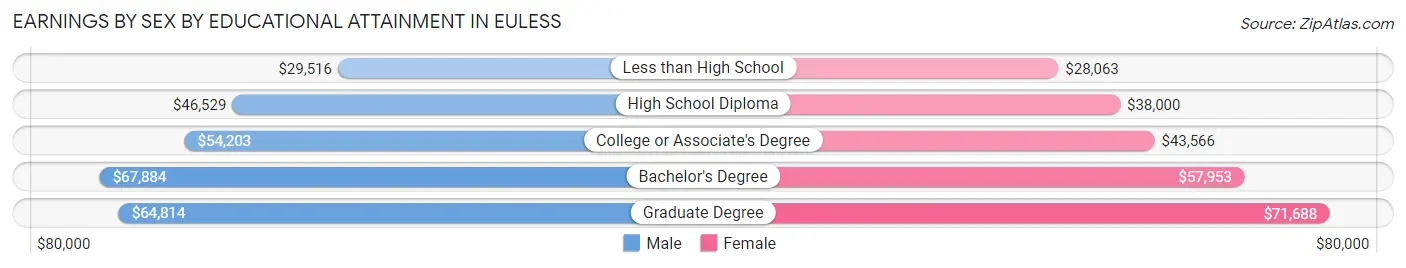
Earnings by Sex by Educational Attainment in Euless
Average earnings in Euless are $53,713 for men and $47,449 for women, a difference of 11.7%. Men with an educational attainment of bachelor's degree enjoy the highest average annual earnings of $67,884, while those with less than high school education earn the least with $29,516. Women with an educational attainment of graduate degree earn the most with the average annual earnings of $71,688, while those with less than high school education have the smallest earnings of $28,063.
| Educational Attainment | Male Income | Female Income |
| Less than High School | $29,516 | $28,063 |
| High School Diploma | $46,529 | $38,000 |
| College or Associate's Degree | $54,203 | $43,566 |
| Bachelor's Degree | $67,884 | $57,953 |
| Graduate Degree | $64,814 | $71,688 |
| Total | $53,713 | $47,449 |
Family Income in Euless
Family Income Brackets in Euless
According to the Euless family income data, there are 2,960 families falling into the $100,000 to $149,999 income range, which is the most common income bracket and makes up 20.7% of all families. Conversely, the $10,000 to $14,999 income bracket is the least frequent group with only 143 families (1.0%) belonging to this category.
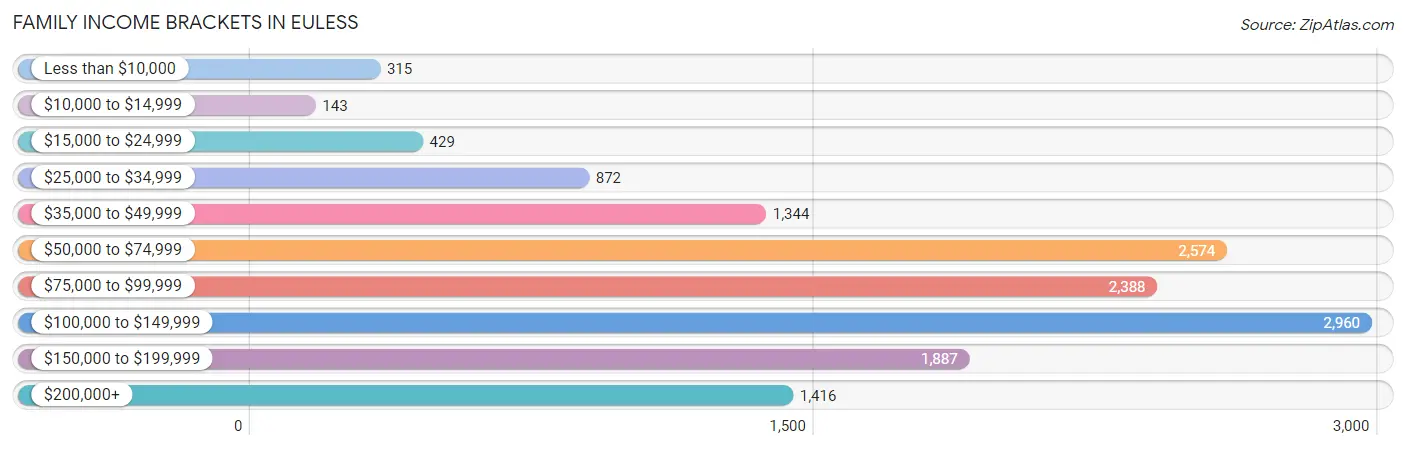
| Income Bracket | # Families | % Families |
| Less than $10,000 | 315 | 2.2% |
| $10,000 to $14,999 | 143 | 1.0% |
| $15,000 to $24,999 | 429 | 3.0% |
| $25,000 to $34,999 | 872 | 6.1% |
| $35,000 to $49,999 | 1,344 | 9.4% |
| $50,000 to $74,999 | 2,574 | 18.0% |
| $75,000 to $99,999 | 2,388 | 16.7% |
| $100,000 to $149,999 | 2,960 | 20.7% |
| $150,000 to $199,999 | 1,887 | 13.2% |
| $200,000+ | 1,416 | 9.9% |
Family Income by Famaliy Size in Euless
7+ person families (263 | 1.8%) account for the highest median family income in Euless with $143,661 per family, while 2-person families (6,111 | 42.7%) have the highest median income of $40,380 per family member.
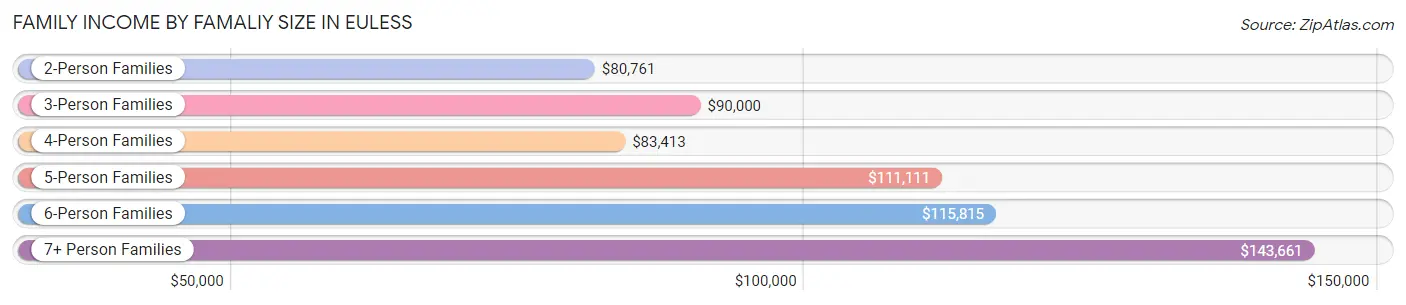
| Income Bracket | # Families | Median Income |
| 2-Person Families | 6,111 (42.7%) | $80,761 |
| 3-Person Families | 3,490 (24.4%) | $90,000 |
| 4-Person Families | 2,606 (18.2%) | $83,413 |
| 5-Person Families | 1,524 (10.7%) | $111,111 |
| 6-Person Families | 305 (2.1%) | $115,815 |
| 7+ Person Families | 263 (1.8%) | $143,661 |
| Total | 14,299 (100.0%) | $85,999 |
Family Income by Number of Earners in Euless
The median family income in Euless is $85,999, with families comprising 3+ earners (1,764) having the highest median family income of $139,131, while families with 1 earner (4,420) have the lowest median family income of $62,301, accounting for 12.3% and 30.9% of families, respectively.
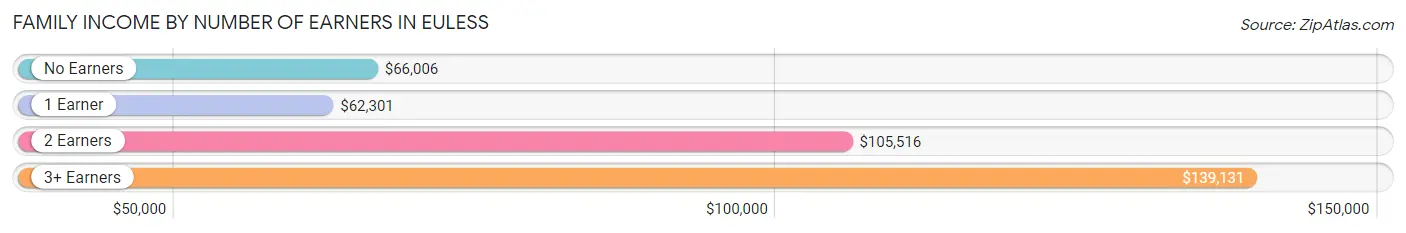
| Number of Earners | # Families | Median Income |
| No Earners | 1,163 (8.1%) | $66,006 |
| 1 Earner | 4,420 (30.9%) | $62,301 |
| 2 Earners | 6,952 (48.6%) | $105,516 |
| 3+ Earners | 1,764 (12.3%) | $139,131 |
| Total | 14,299 (100.0%) | $85,999 |
Household Income in Euless
Household Income Brackets in Euless
With 4,561 households falling in the category, the $100,000 to $149,999 income range is the most frequent in Euless, accounting for 19.0% of all households. In contrast, only 672 households (2.8%) fall into the $10,000 to $14,999 income bracket, making it the least populous group.
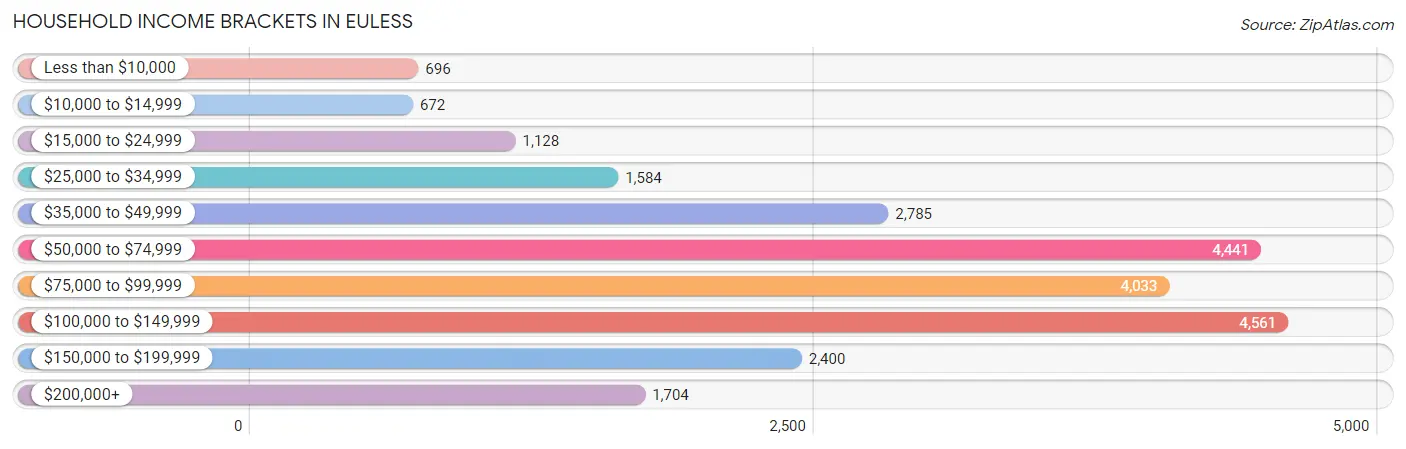
| Income Bracket | # Households | % Households |
| Less than $10,000 | 696 | 2.9% |
| $10,000 to $14,999 | 672 | 2.8% |
| $15,000 to $24,999 | 1,128 | 4.7% |
| $25,000 to $34,999 | 1,584 | 6.6% |
| $35,000 to $49,999 | 2,785 | 11.6% |
| $50,000 to $74,999 | 4,441 | 18.5% |
| $75,000 to $99,999 | 4,033 | 16.8% |
| $100,000 to $149,999 | 4,561 | 19.0% |
| $150,000 to $199,999 | 2,400 | 10.0% |
| $200,000+ | 1,704 | 7.1% |
Household Income by Householder Age in Euless
The median household income in Euless is $77,403, with the highest median household income of $88,824 found in the 45 to 64 years age bracket for the primary householder. A total of 8,568 households (35.7%) fall into this category. Meanwhile, the 15 to 24 years age bracket for the primary householder has the lowest median household income of $46,944, with 1,190 households (5.0%) in this group.
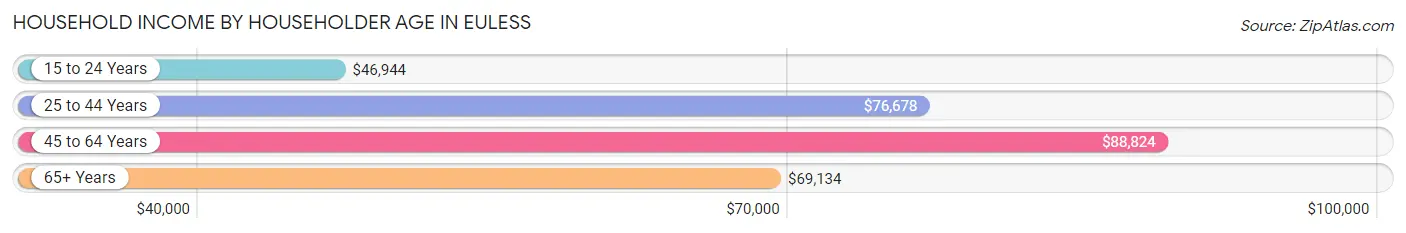
| Income Bracket | # Households | Median Income |
| 15 to 24 Years | 1,190 (5.0%) | $46,944 |
| 25 to 44 Years | 10,526 (43.9%) | $76,678 |
| 45 to 64 Years | 8,568 (35.7%) | $88,824 |
| 65+ Years | 3,721 (15.5%) | $69,134 |
| Total | 24,005 (100.0%) | $77,403 |
Poverty in Euless
Income Below Poverty by Sex and Age in Euless
With 7.7% poverty level for males and 8.7% for females among the residents of Euless, 5 year old males and 16 and 17 year old females are the most vulnerable to poverty, with 98 males (25.8%) and 152 females (25.3%) in their respective age groups living below the poverty level.
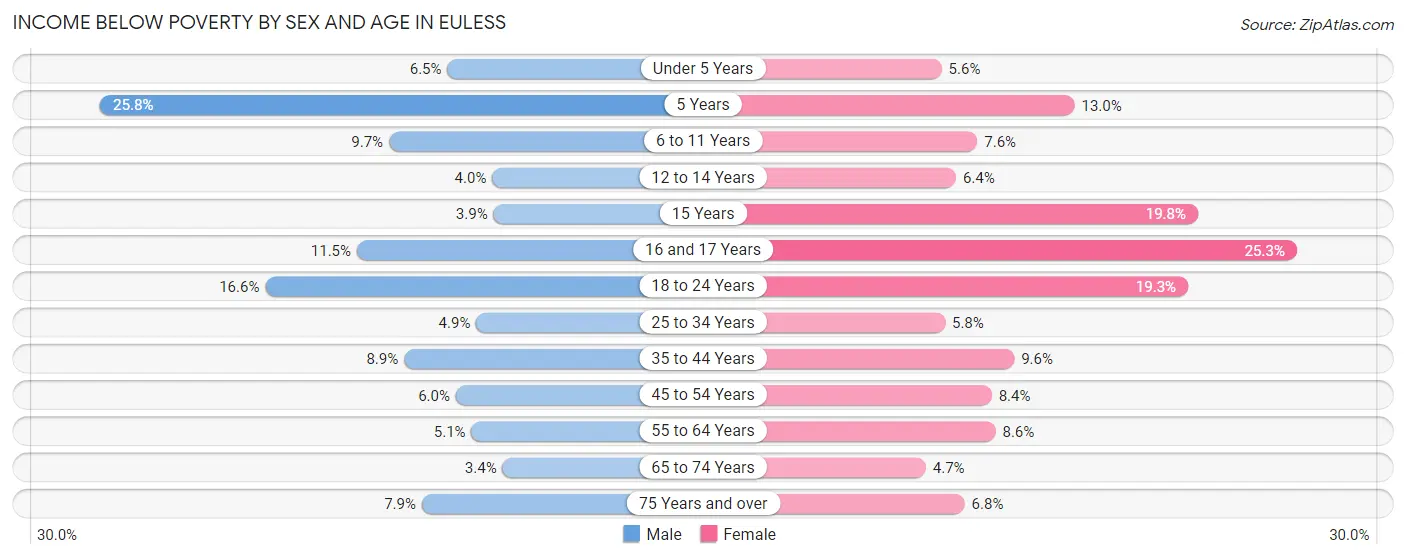
| Age Bracket | Male | Female |
| Under 5 Years | 110 (6.5%) | 117 (5.6%) |
| 5 Years | 98 (25.8%) | 74 (13.0%) |
| 6 to 11 Years | 236 (9.7%) | 169 (7.5%) |
| 12 to 14 Years | 57 (4.0%) | 80 (6.4%) |
| 15 Years | 18 (3.9%) | 65 (19.8%) |
| 16 and 17 Years | 99 (11.5%) | 152 (25.3%) |
| 18 to 24 Years | 543 (16.6%) | 425 (19.3%) |
| 25 to 34 Years | 264 (4.9%) | 325 (5.8%) |
| 35 to 44 Years | 359 (8.9%) | 443 (9.6%) |
| 45 to 54 Years | 232 (6.0%) | 318 (8.4%) |
| 55 to 64 Years | 189 (5.1%) | 245 (8.6%) |
| 65 to 74 Years | 57 (3.4%) | 110 (4.7%) |
| 75 Years and over | 86 (7.9%) | 83 (6.8%) |
| Total | 2,348 (7.7%) | 2,606 (8.7%) |
Income Above Poverty by Sex and Age in Euless
According to the poverty statistics in Euless, males aged 65 to 74 years and females aged 65 to 74 years are the age groups that are most secure financially, with 96.6% of males and 95.3% of females in these age groups living above the poverty line.
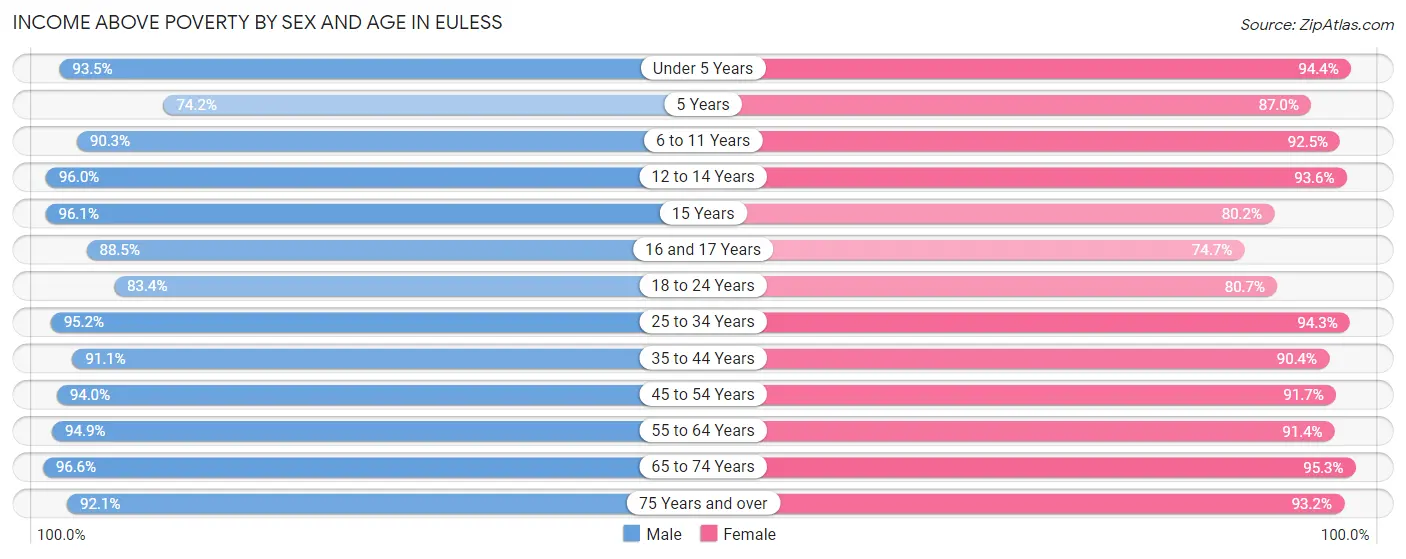
| Age Bracket | Male | Female |
| Under 5 Years | 1,592 (93.5%) | 1,988 (94.4%) |
| 5 Years | 282 (74.2%) | 497 (87.0%) |
| 6 to 11 Years | 2,195 (90.3%) | 2,068 (92.4%) |
| 12 to 14 Years | 1,381 (96.0%) | 1,177 (93.6%) |
| 15 Years | 445 (96.1%) | 263 (80.2%) |
| 16 and 17 Years | 762 (88.5%) | 448 (74.7%) |
| 18 to 24 Years | 2,729 (83.4%) | 1,780 (80.7%) |
| 25 to 34 Years | 5,181 (95.2%) | 5,330 (94.3%) |
| 35 to 44 Years | 3,688 (91.1%) | 4,172 (90.4%) |
| 45 to 54 Years | 3,639 (94.0%) | 3,492 (91.6%) |
| 55 to 64 Years | 3,503 (94.9%) | 2,616 (91.4%) |
| 65 to 74 Years | 1,622 (96.6%) | 2,240 (95.3%) |
| 75 Years and over | 1,006 (92.1%) | 1,130 (93.2%) |
| Total | 28,025 (92.3%) | 27,201 (91.3%) |
Income Below Poverty Among Married-Couple Families in Euless
The poverty statistics for married-couple families in Euless show that 2.8% or 278 of the total 9,862 families live below the poverty line. Families with 3 or 4 children have the highest poverty rate of 15.0%, comprising of 104 families. On the other hand, families with 5 or more children have the lowest poverty rate of 0.0%, which includes 0 families.
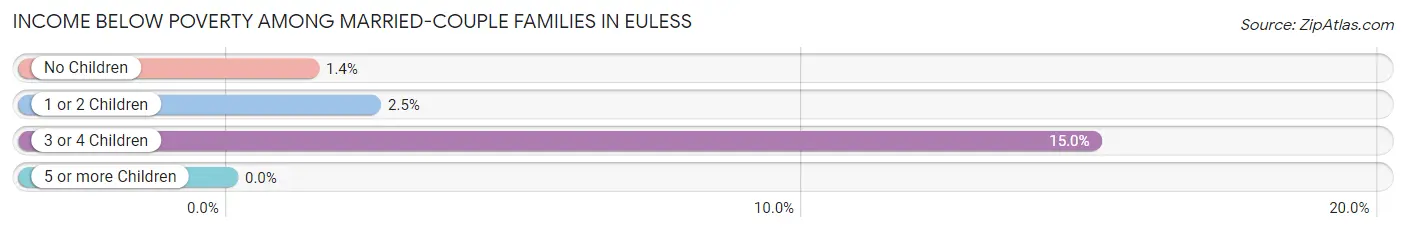
| Children | Above Poverty | Below Poverty |
| No Children | 4,819 (98.6%) | 69 (1.4%) |
| 1 or 2 Children | 4,114 (97.5%) | 105 (2.5%) |
| 3 or 4 Children | 588 (85.0%) | 104 (15.0%) |
| 5 or more Children | 63 (100.0%) | 0 (0.0%) |
| Total | 9,584 (97.2%) | 278 (2.8%) |
Income Below Poverty Among Single-Parent Households in Euless
According to the poverty data in Euless, 10.5% or 128 single-father households and 14.6% or 471 single-mother households are living below the poverty line. Among single-father households, those with no children have the highest poverty rate, with 71 households (12.3%) experiencing poverty. Likewise, among single-mother households, those with 5 or more children have the highest poverty rate, with 47 households (100.0%) falling below the poverty line.
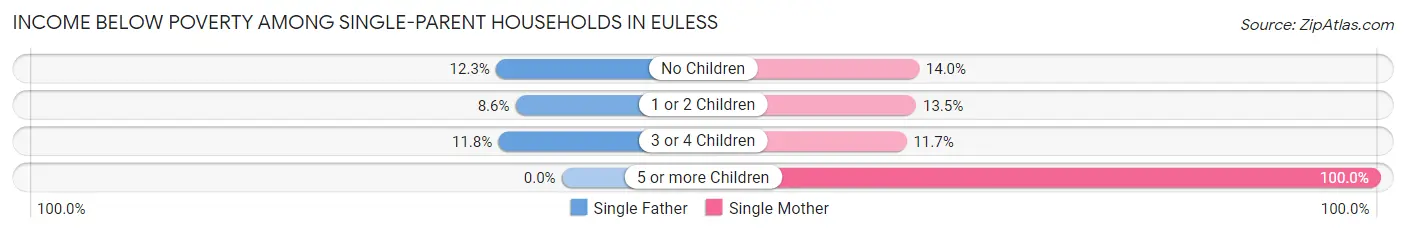
| Children | Single Father | Single Mother |
| No Children | 71 (12.3%) | 170 (14.0%) |
| 1 or 2 Children | 40 (8.6%) | 192 (13.5%) |
| 3 or 4 Children | 17 (11.8%) | 62 (11.7%) |
| 5 or more Children | 0 (0.0%) | 47 (100.0%) |
| Total | 128 (10.5%) | 471 (14.6%) |
Income Below Poverty Among Married-Couple vs Single-Parent Households in Euless
The poverty data for Euless shows that 278 of the married-couple family households (2.8%) and 599 of the single-parent households (13.5%) are living below the poverty level. Within the married-couple family households, those with 3 or 4 children have the highest poverty rate, with 104 households (15.0%) falling below the poverty line. Among the single-parent households, those with 5 or more children have the highest poverty rate, with 47 household (58.0%) living below poverty.
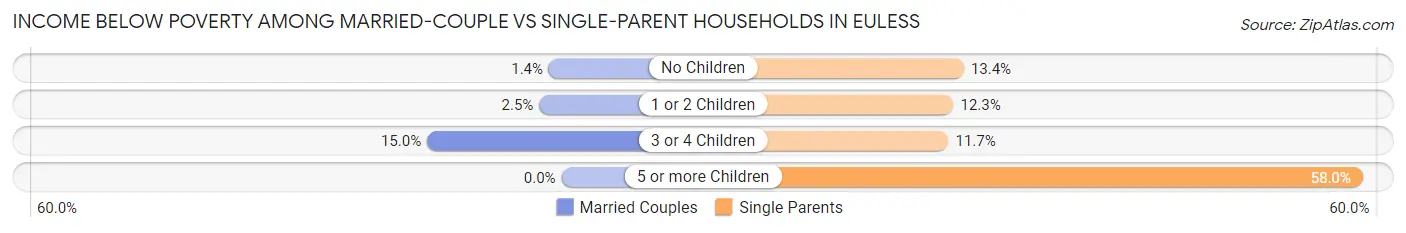
| Children | Married-Couple Families | Single-Parent Households |
| No Children | 69 (1.4%) | 241 (13.4%) |
| 1 or 2 Children | 105 (2.5%) | 232 (12.3%) |
| 3 or 4 Children | 104 (15.0%) | 79 (11.7%) |
| 5 or more Children | 0 (0.0%) | 47 (58.0%) |
| Total | 278 (2.8%) | 599 (13.5%) |
Race in Euless
The most populous races in Euless are White / Caucasian (30,525 | 50.6%), Hispanic or Latino (12,079 | 20.0%), and Black / African American (10,184 | 16.9%).
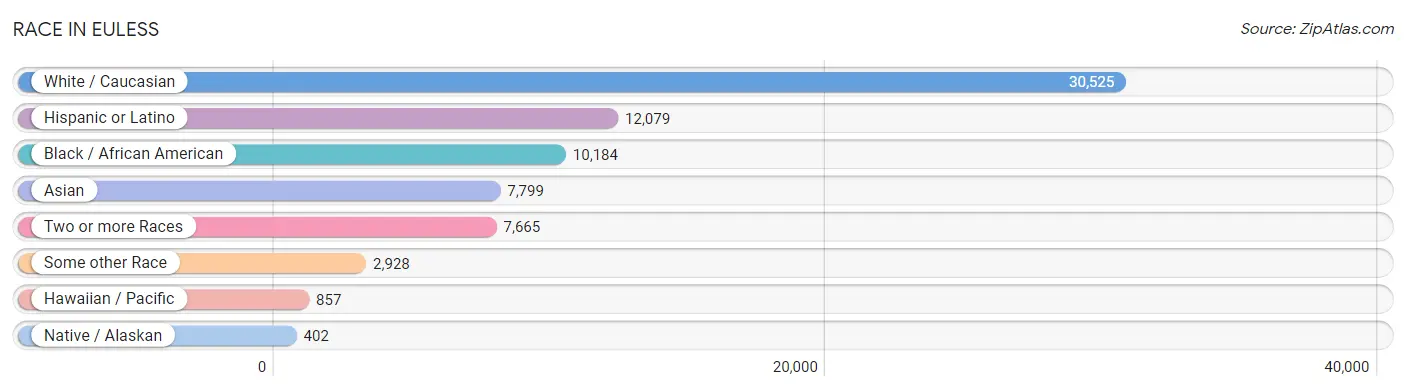
| Race | # Population | % Population |
| Asian | 7,799 | 12.9% |
| Black / African American | 10,184 | 16.9% |
| Hawaiian / Pacific | 857 | 1.4% |
| Hispanic or Latino | 12,079 | 20.0% |
| Native / Alaskan | 402 | 0.7% |
| White / Caucasian | 30,525 | 50.6% |
| Two or more Races | 7,665 | 12.7% |
| Some other Race | 2,928 | 4.9% |
| Total | 60,360 | 100.0% |
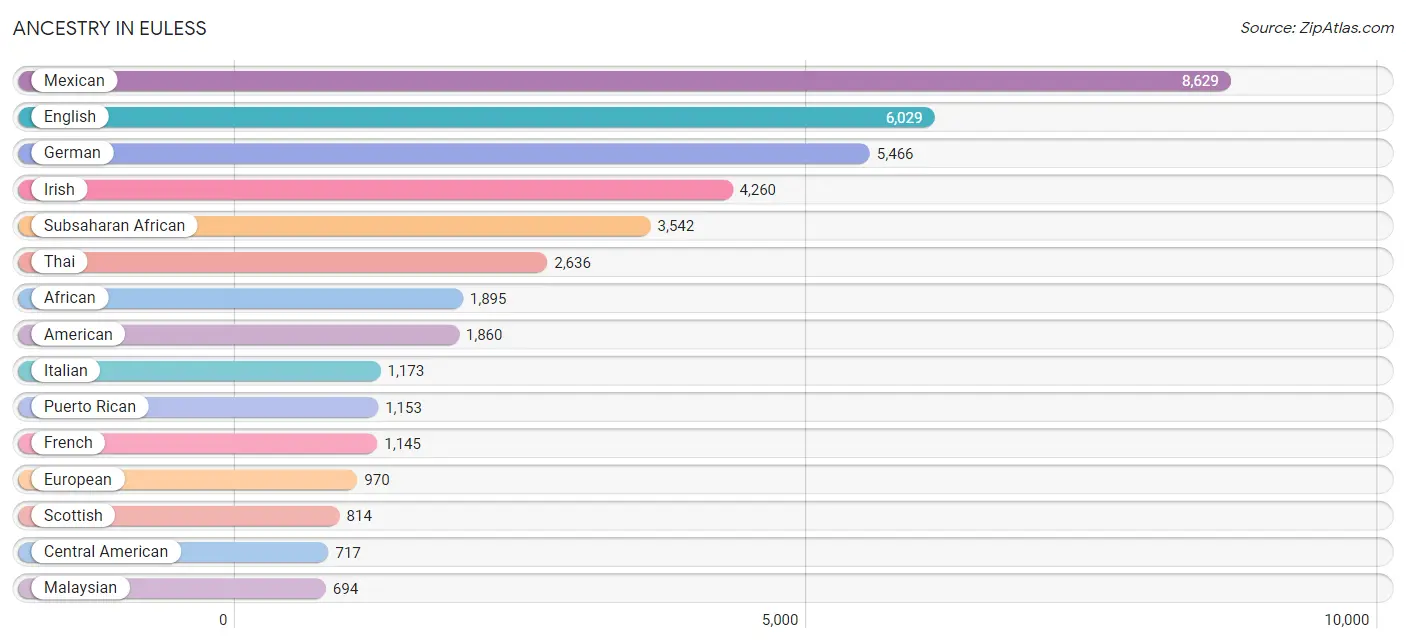
Ancestry in Euless
The most populous ancestries reported in Euless are Mexican (8,629 | 14.3%), English (6,029 | 10.0%), German (5,466 | 9.1%), Irish (4,260 | 7.1%), and Subsaharan African (3,542 | 5.9%), together accounting for 46.3% of all Euless residents.
| Ancestry | # Population | % Population |
| African | 1,895 | 3.1% |
| Albanian | 14 | 0.0% |
| American | 1,860 | 3.1% |
| Apache | 40 | 0.1% |
| Arab | 364 | 0.6% |
| Austrian | 49 | 0.1% |
| Bangladeshi | 16 | 0.0% |
| Belgian | 55 | 0.1% |
| Bhutanese | 92 | 0.2% |
| Blackfeet | 124 | 0.2% |
| Brazilian | 256 | 0.4% |
| British | 291 | 0.5% |
| Bulgarian | 61 | 0.1% |
| Burmese | 249 | 0.4% |
| Cajun | 67 | 0.1% |
| Canadian | 134 | 0.2% |
| Celtic | 18 | 0.0% |
| Central American | 717 | 1.2% |
| Central American Indian | 65 | 0.1% |
| Cherokee | 262 | 0.4% |
| Chickasaw | 18 | 0.0% |
| Chilean | 22 | 0.0% |
| Choctaw | 55 | 0.1% |
| Colombian | 225 | 0.4% |
| Comanche | 58 | 0.1% |
| Costa Rican | 18 | 0.0% |
| Cree | 5 | 0.0% |
| Croatian | 10 | 0.0% |
| Cuban | 256 | 0.4% |
| Czech | 435 | 0.7% |
| Czechoslovakian | 67 | 0.1% |
| Danish | 76 | 0.1% |
| Delaware | 24 | 0.0% |
| Dominican | 111 | 0.2% |
| Dutch | 399 | 0.7% |
| Eastern European | 101 | 0.2% |
| Ecuadorian | 309 | 0.5% |
| Egyptian | 163 | 0.3% |
| English | 6,029 | 10.0% |
| Ethiopian | 84 | 0.1% |
| European | 970 | 1.6% |
| Fijian | 12 | 0.0% |
| Finnish | 57 | 0.1% |
| French | 1,145 | 1.9% |
| French American Indian | 7 | 0.0% |
| French Canadian | 55 | 0.1% |
| German | 5,466 | 9.1% |
| Ghanaian | 348 | 0.6% |
| Greek | 138 | 0.2% |
| Guamanian / Chamorro | 254 | 0.4% |
| Haitian | 99 | 0.2% |
| Honduran | 141 | 0.2% |
| Hopi | 9 | 0.0% |
| Hungarian | 34 | 0.1% |
| Indian (Asian) | 468 | 0.8% |
| Iranian | 103 | 0.2% |
| Irish | 4,260 | 7.1% |
| Italian | 1,173 | 1.9% |
| Jamaican | 127 | 0.2% |
| Japanese | 28 | 0.1% |
| Kenyan | 177 | 0.3% |
| Korean | 476 | 0.8% |
| Lebanese | 15 | 0.0% |
| Liberian | 46 | 0.1% |
| Lumbee | 19 | 0.0% |
| Malaysian | 694 | 1.1% |
| Maltese | 66 | 0.1% |
| Mexican | 8,629 | 14.3% |
| Mexican American Indian | 201 | 0.3% |
| Mongolian | 6 | 0.0% |
| Moroccan | 20 | 0.0% |
| Native Hawaiian | 144 | 0.2% |
| Navajo | 16 | 0.0% |
| Nicaraguan | 28 | 0.1% |
| Nigerian | 136 | 0.2% |
| Northern European | 24 | 0.0% |
| Norwegian | 347 | 0.6% |
| Osage | 19 | 0.0% |
| Pakistani | 268 | 0.4% |
| Panamanian | 138 | 0.2% |
| Peruvian | 128 | 0.2% |
| Polish | 521 | 0.9% |
| Portuguese | 140 | 0.2% |
| Potawatomi | 20 | 0.0% |
| Puerto Rican | 1,153 | 1.9% |
| Romanian | 22 | 0.0% |
| Russian | 143 | 0.2% |
| Salvadoran | 392 | 0.6% |
| Samoan | 299 | 0.5% |
| Scandinavian | 215 | 0.4% |
| Scotch-Irish | 692 | 1.1% |
| Scottish | 814 | 1.3% |
| Senegalese | 25 | 0.0% |
| Serbian | 47 | 0.1% |
| Slavic | 17 | 0.0% |
| Slovak | 28 | 0.1% |
| South African | 65 | 0.1% |
| South American | 692 | 1.1% |
| Spaniard | 163 | 0.3% |
| Spanish | 142 | 0.2% |
| Sri Lankan | 683 | 1.1% |
| Subsaharan African | 3,542 | 5.9% |
| Sudanese | 130 | 0.2% |
| Swedish | 318 | 0.5% |
| Swiss | 59 | 0.1% |
| Thai | 2,636 | 4.4% |
| Tongan | 361 | 0.6% |
| Trinidadian and Tobagonian | 15 | 0.0% |
| Turkish | 67 | 0.1% |
| Ugandan | 95 | 0.2% |
| Ukrainian | 92 | 0.2% |
| Venezuelan | 8 | 0.0% |
| Vietnamese | 72 | 0.1% |
| Welsh | 442 | 0.7% |
| West Indian | 53 | 0.1% |
| Yaqui | 44 | 0.1% |
| Yugoslavian | 12 | 0.0% | View All 117 Rows |
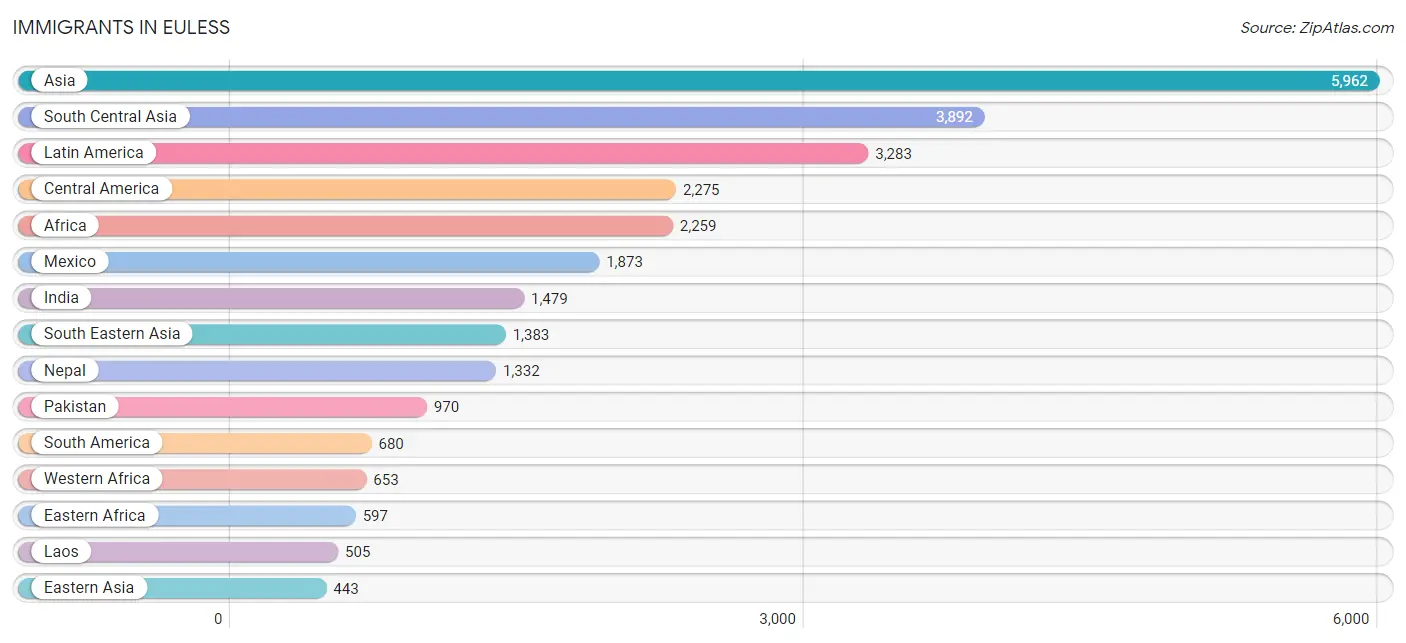
Immigrants in Euless
The most numerous immigrant groups reported in Euless came from Asia (5,962 | 9.9%), South Central Asia (3,892 | 6.5%), Latin America (3,283 | 5.4%), Central America (2,275 | 3.8%), and Africa (2,259 | 3.7%), together accounting for 29.3% of all Euless residents.
| Immigration Origin | # Population | % Population |
| Africa | 2,259 | 3.7% |
| Asia | 5,962 | 9.9% |
| Bangladesh | 57 | 0.1% |
| Belgium | 15 | 0.0% |
| Bosnia and Herzegovina | 12 | 0.0% |
| Brazil | 255 | 0.4% |
| Bulgaria | 46 | 0.1% |
| Canada | 83 | 0.1% |
| Caribbean | 328 | 0.5% |
| Central America | 2,275 | 3.8% |
| Chile | 22 | 0.0% |
| China | 188 | 0.3% |
| Colombia | 35 | 0.1% |
| Congo | 68 | 0.1% |
| Costa Rica | 18 | 0.0% |
| Cuba | 68 | 0.1% |
| Czechoslovakia | 13 | 0.0% |
| Dominica | 8 | 0.0% |
| Dominican Republic | 97 | 0.2% |
| Eastern Africa | 597 | 1.0% |
| Eastern Asia | 443 | 0.7% |
| Eastern Europe | 100 | 0.2% |
| Ecuador | 258 | 0.4% |
| Egypt | 133 | 0.2% |
| El Salvador | 238 | 0.4% |
| Ethiopia | 59 | 0.1% |
| Europe | 381 | 0.6% |
| France | 88 | 0.2% |
| Germany | 67 | 0.1% |
| Ghana | 338 | 0.6% |
| Guatemala | 1 | 0.0% |
| Honduras | 50 | 0.1% |
| India | 1,479 | 2.5% |
| Indonesia | 16 | 0.0% |
| Iran | 44 | 0.1% |
| Iraq | 34 | 0.1% |
| Ireland | 49 | 0.1% |
| Italy | 21 | 0.0% |
| Jamaica | 110 | 0.2% |
| Japan | 13 | 0.0% |
| Kenya | 304 | 0.5% |
| Korea | 242 | 0.4% |
| Kuwait | 15 | 0.0% |
| Laos | 505 | 0.8% |
| Latin America | 3,283 | 5.4% |
| Malaysia | 6 | 0.0% |
| Mexico | 1,873 | 3.1% |
| Micronesia | 114 | 0.2% |
| Middle Africa | 400 | 0.7% |
| Nepal | 1,332 | 2.2% |
| Nigeria | 151 | 0.3% |
| Northern Africa | 345 | 0.6% |
| Northern Europe | 57 | 0.1% |
| Oceania | 383 | 0.6% |
| Pakistan | 970 | 1.6% |
| Panama | 95 | 0.2% |
| Peru | 110 | 0.2% |
| Philippines | 320 | 0.5% |
| Poland | 29 | 0.1% |
| Saudi Arabia | 24 | 0.0% |
| Scotland | 8 | 0.0% |
| Senegal | 25 | 0.0% |
| Sierra Leone | 41 | 0.1% |
| Somalia | 104 | 0.2% |
| South Africa | 122 | 0.2% |
| South America | 680 | 1.1% |
| South Central Asia | 3,892 | 6.5% |
| South Eastern Asia | 1,383 | 2.3% |
| Southern Europe | 54 | 0.1% |
| Spain | 33 | 0.1% |
| Sri Lanka | 10 | 0.0% |
| St. Vincent and the Grenadines | 40 | 0.1% |
| Sudan | 122 | 0.2% |
| Taiwan | 33 | 0.1% |
| Thailand | 151 | 0.3% |
| Trinidad and Tobago | 5 | 0.0% |
| Turkey | 57 | 0.1% |
| Uganda | 66 | 0.1% |
| Vietnam | 385 | 0.6% |
| Western Africa | 653 | 1.1% |
| Western Asia | 244 | 0.4% |
| Western Europe | 170 | 0.3% |
| Zaire | 294 | 0.5% | View All 83 Rows |
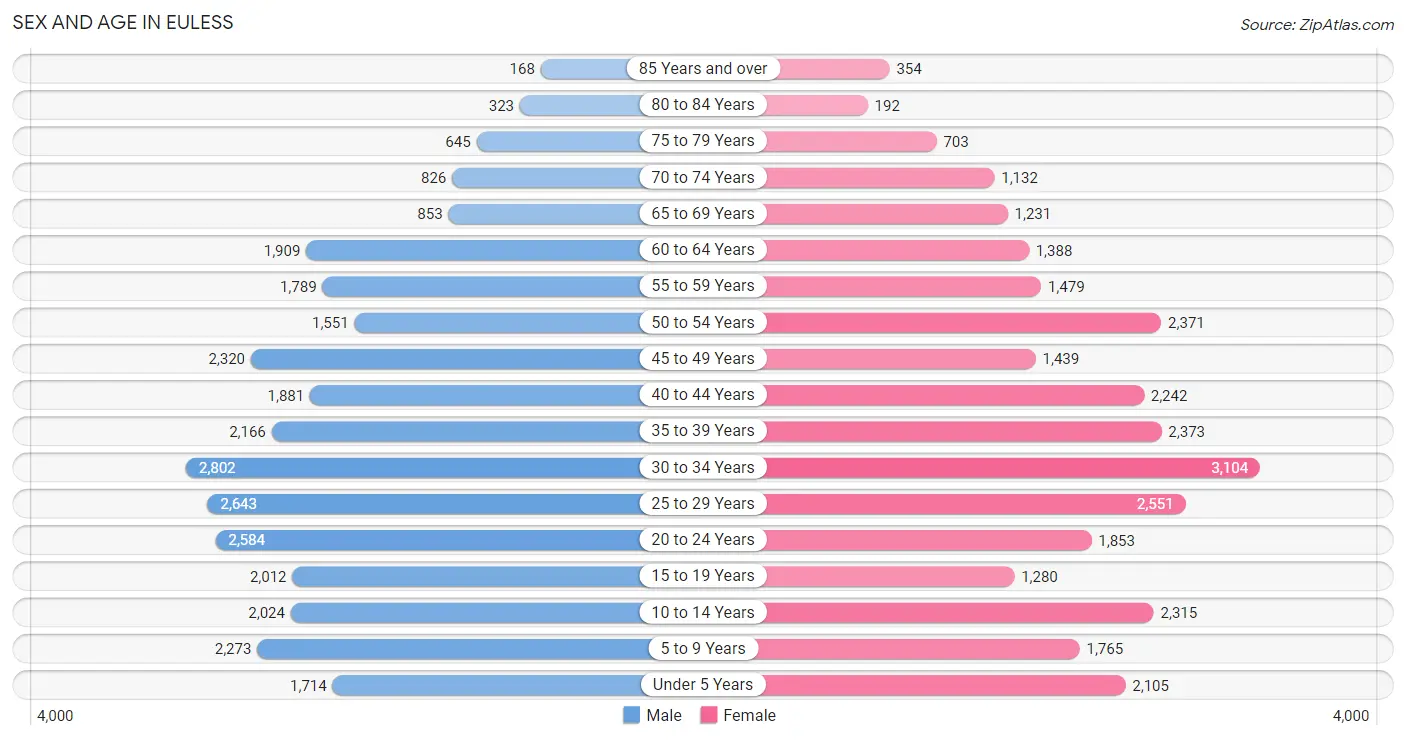
Sex and Age in Euless
Sex and Age in Euless
The most populous age groups in Euless are 30 to 34 Years (2,802 | 9.2%) for men and 30 to 34 Years (3,104 | 10.4%) for women.
| Age Bracket | Male | Female |
| Under 5 Years | 1,714 (5.6%) | 2,105 (7.0%) |
| 5 to 9 Years | 2,273 (7.5%) | 1,765 (5.9%) |
| 10 to 14 Years | 2,024 (6.6%) | 2,315 (7.7%) |
| 15 to 19 Years | 2,012 (6.6%) | 1,280 (4.3%) |
| 20 to 24 Years | 2,584 (8.5%) | 1,853 (6.2%) |
| 25 to 29 Years | 2,643 (8.7%) | 2,551 (8.5%) |
| 30 to 34 Years | 2,802 (9.2%) | 3,104 (10.4%) |
| 35 to 39 Years | 2,166 (7.1%) | 2,373 (7.9%) |
| 40 to 44 Years | 1,881 (6.2%) | 2,242 (7.5%) |
| 45 to 49 Years | 2,320 (7.6%) | 1,439 (4.8%) |
| 50 to 54 Years | 1,551 (5.1%) | 2,371 (7.9%) |
| 55 to 59 Years | 1,789 (5.9%) | 1,479 (5.0%) |
| 60 to 64 Years | 1,909 (6.3%) | 1,388 (4.6%) |
| 65 to 69 Years | 853 (2.8%) | 1,231 (4.1%) |
| 70 to 74 Years | 826 (2.7%) | 1,132 (3.8%) |
| 75 to 79 Years | 645 (2.1%) | 703 (2.4%) |
| 80 to 84 Years | 323 (1.1%) | 192 (0.6%) |
| 85 Years and over | 168 (0.5%) | 354 (1.2%) |
| Total | 30,483 (100.0%) | 29,877 (100.0%) |
Families and Households in Euless
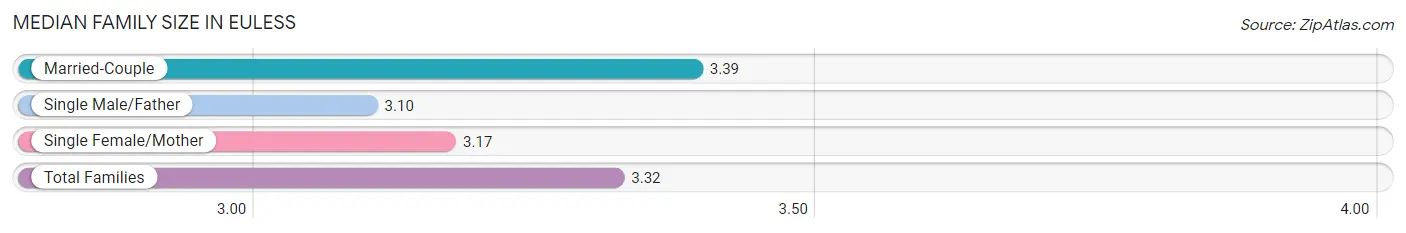
Median Family Size in Euless
The median family size in Euless is 3.32 persons per family, with married-couple families (9,862 | 69.0%) accounting for the largest median family size of 3.39 persons per family. On the other hand, single male/father families (1,222 | 8.6%) represent the smallest median family size with 3.10 persons per family.
| Family Type | # Families | Family Size |
| Married-Couple | 9,862 (69.0%) | 3.39 |
| Single Male/Father | 1,222 (8.6%) | 3.10 |
| Single Female/Mother | 3,215 (22.5%) | 3.17 |
| Total Families | 14,299 (100.0%) | 3.32 |
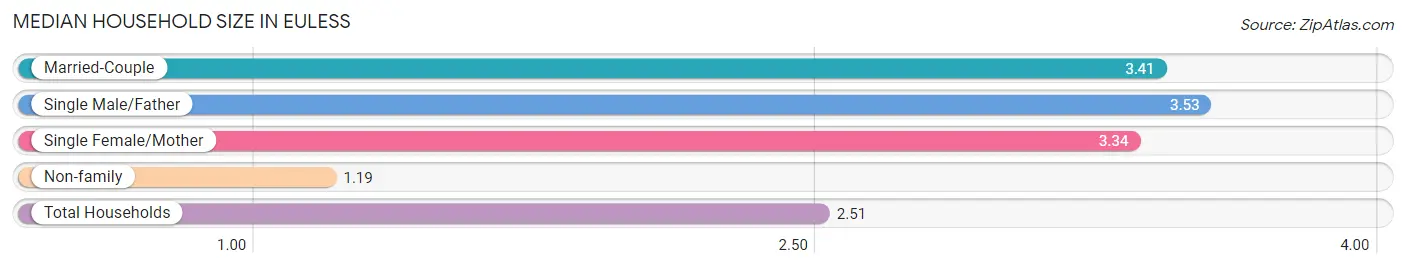
Median Household Size in Euless
The median household size in Euless is 2.51 persons per household, with single male/father households (1,222 | 5.1%) accounting for the largest median household size of 3.53 persons per household. non-family households (9,706 | 40.4%) represent the smallest median household size with 1.19 persons per household.
| Household Type | # Households | Household Size |
| Married-Couple | 9,862 (41.1%) | 3.41 |
| Single Male/Father | 1,222 (5.1%) | 3.53 |
| Single Female/Mother | 3,215 (13.4%) | 3.34 |
| Non-family | 9,706 (40.4%) | 1.19 |
| Total Households | 24,005 (100.0%) | 2.51 |
Household Size by Marriage Status in Euless
Out of a total of 24,005 households in Euless, 14,299 (59.6%) are family households, while 9,706 (40.4%) are nonfamily households. The most numerous type of family households are 2-person households, comprising 5,555, and the most common type of nonfamily households are 1-person households, comprising 8,184.
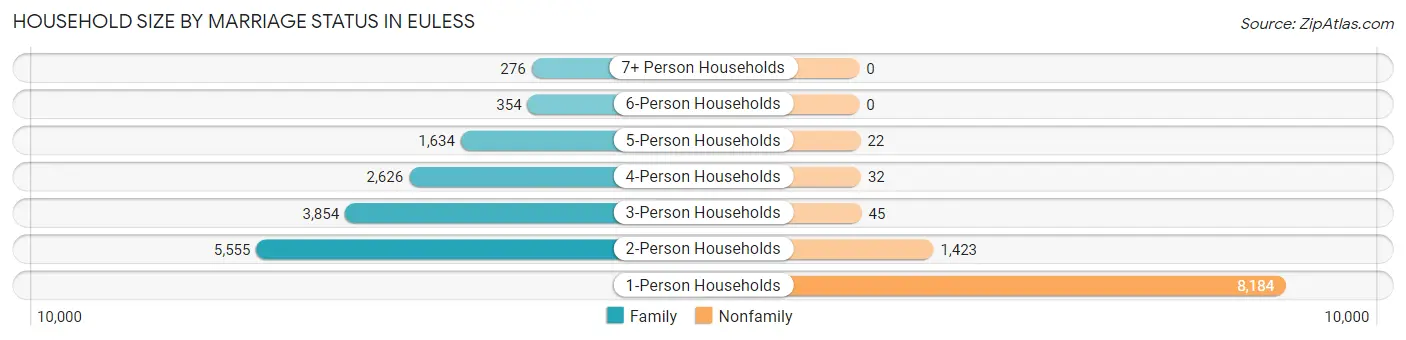
| Household Size | Family Households | Nonfamily Households |
| 1-Person Households | - | 8,184 (34.1%) |
| 2-Person Households | 5,555 (23.1%) | 1,423 (5.9%) |
| 3-Person Households | 3,854 (16.1%) | 45 (0.2%) |
| 4-Person Households | 2,626 (10.9%) | 32 (0.1%) |
| 5-Person Households | 1,634 (6.8%) | 22 (0.1%) |
| 6-Person Households | 354 (1.5%) | 0 (0.0%) |
| 7+ Person Households | 276 (1.1%) | 0 (0.0%) |
| Total | 14,299 (59.6%) | 9,706 (40.4%) |
Female Fertility in Euless
Fertility by Age in Euless
Average fertility rate in Euless is 49.0 births per 1,000 women. Women in the age bracket of 20 to 34 years have the highest fertility rate with 74.0 births per 1,000 women. Women in the age bracket of 20 to 34 years acount for 73.7% of all women with births.
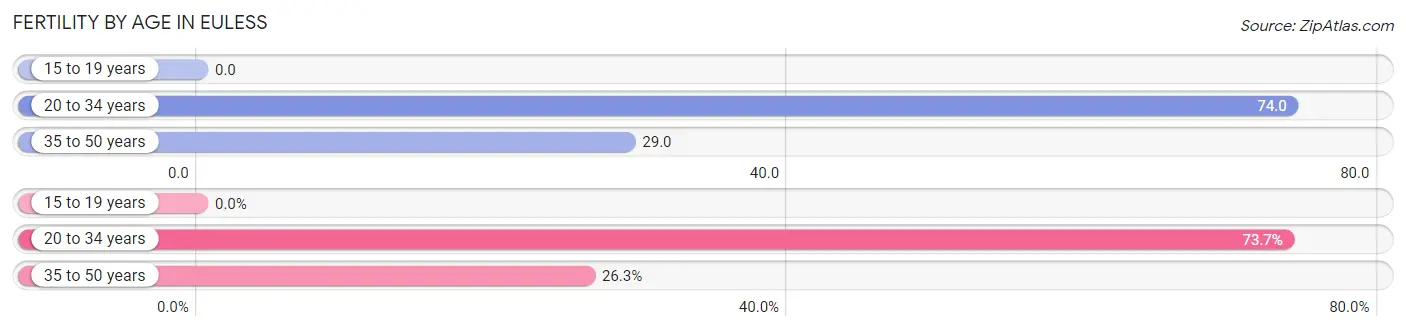
| Age Bracket | Women with Births | Births / 1,000 Women |
| 15 to 19 years | 0 (0.0%) | 0.0 |
| 20 to 34 years | 556 (73.7%) | 74.0 |
| 35 to 50 years | 198 (26.3%) | 29.0 |
| Total | 754 (100.0%) | 49.0 |
Fertility by Age by Marriage Status in Euless
65.9% of women with births (754) in Euless are married. The highest percentage of unmarried women with births falls into 20 to 34 years age bracket with 37.8% of them unmarried at the time of birth, while the lowest percentage of unmarried women with births belong to 35 to 50 years age bracket with 23.7% of them unmarried.
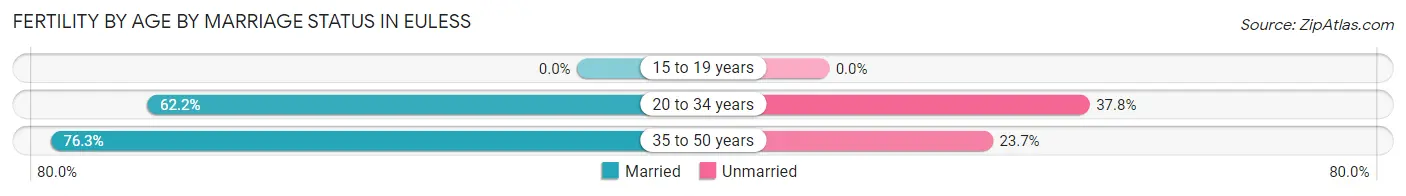
| Age Bracket | Married | Unmarried |
| 15 to 19 years | 0 (0.0%) | 0 (0.0%) |
| 20 to 34 years | 346 (62.2%) | 210 (37.8%) |
| 35 to 50 years | 151 (76.3%) | 47 (23.7%) |
| Total | 497 (65.9%) | 257 (34.1%) |
Fertility by Education in Euless
Average fertility rate in Euless is 49.0 births per 1,000 women. Women with the education attainment of high school diploma have the highest fertility rate of 92.0 births per 1,000 women, while women with the education attainment of less than high school have the lowest fertility at 25.0 births per 1,000 women. Women with the education attainment of high school diploma represent 31.7% of all women with births.
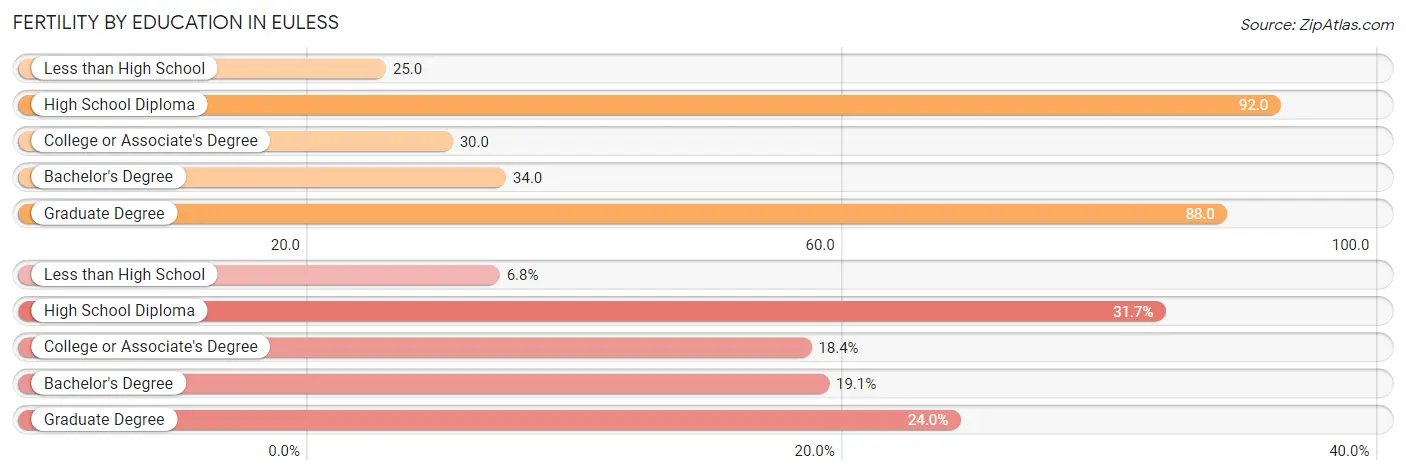
| Educational Attainment | Women with Births | Births / 1,000 Women |
| Less than High School | 51 (6.8%) | 25.0 |
| High School Diploma | 239 (31.7%) | 92.0 |
| College or Associate's Degree | 139 (18.4%) | 30.0 |
| Bachelor's Degree | 144 (19.1%) | 34.0 |
| Graduate Degree | 181 (24.0%) | 88.0 |
| Total | 754 (100.0%) | 49.0 |
Fertility by Education by Marriage Status in Euless
34.1% of women with births in Euless are unmarried. Women with the educational attainment of less than high school are most likely to be married with 100.0% of them married at childbirth, while women with the educational attainment of college or associate's degree are least likely to be married with 65.5% of them unmarried at childbirth.
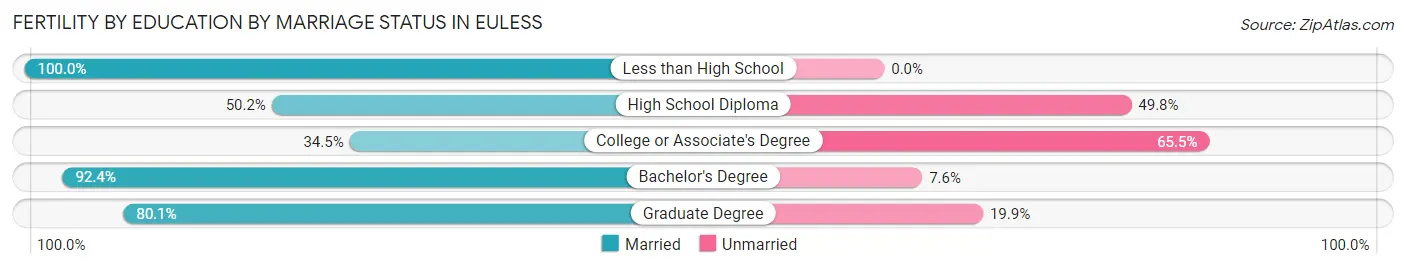
| Educational Attainment | Married | Unmarried |
| Less than High School | 51 (100.0%) | 0 (0.0%) |
| High School Diploma | 120 (50.2%) | 119 (49.8%) |
| College or Associate's Degree | 48 (34.5%) | 91 (65.5%) |
| Bachelor's Degree | 133 (92.4%) | 11 (7.6%) |
| Graduate Degree | 145 (80.1%) | 36 (19.9%) |
| Total | 497 (65.9%) | 257 (34.1%) |
Employment Characteristics in Euless
Employment by Class of Employer in Euless
Among the 33,935 employed individuals in Euless, private company employees (25,660 | 75.6%), local government employees (2,278 | 6.7%), and not-for-profit organizations (1,969 | 5.8%) make up the most common classes of employment.
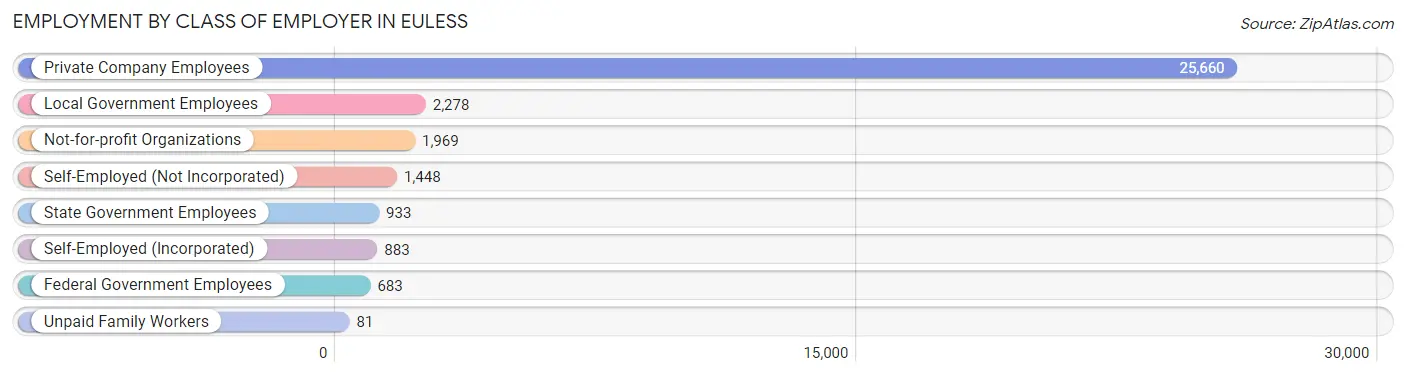
| Employer Class | # Employees | % Employees |
| Private Company Employees | 25,660 | 75.6% |
| Self-Employed (Incorporated) | 883 | 2.6% |
| Self-Employed (Not Incorporated) | 1,448 | 4.3% |
| Not-for-profit Organizations | 1,969 | 5.8% |
| Local Government Employees | 2,278 | 6.7% |
| State Government Employees | 933 | 2.8% |
| Federal Government Employees | 683 | 2.0% |
| Unpaid Family Workers | 81 | 0.2% |
| Total | 33,935 | 100.0% |
Employment Status by Age in Euless
According to the labor force statistics for Euless, out of the total population over 16 years of age (47,373), 76.0% or 36,003 individuals are in the labor force, with 4.7% or 1,692 of them unemployed. The age group with the highest labor force participation rate is 45 to 54 years, with 90.4% or 6,944 individuals in the labor force. Within the labor force, the 16 to 19 years age range has the highest percentage of unemployed individuals, with 15.5% or 164 of them being unemployed.
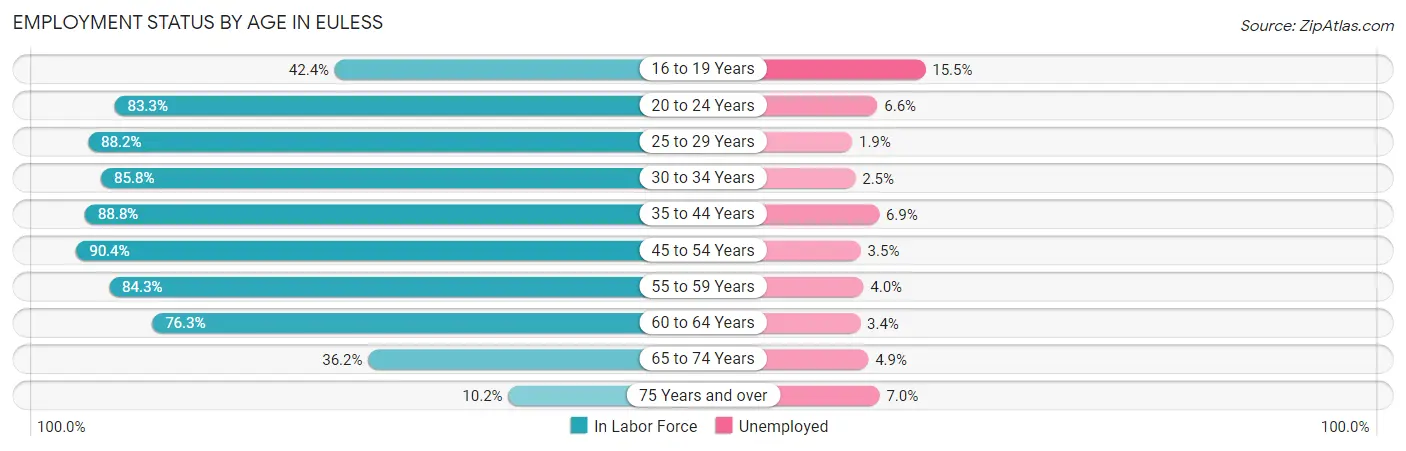
| Age Bracket | In Labor Force | Unemployed |
| 16 to 19 Years | 1,060 (42.4%) | 164 (15.5%) |
| 20 to 24 Years | 3,696 (83.3%) | 244 (6.6%) |
| 25 to 29 Years | 4,581 (88.2%) | 87 (1.9%) |
| 30 to 34 Years | 5,067 (85.8%) | 127 (2.5%) |
| 35 to 44 Years | 7,692 (88.8%) | 531 (6.9%) |
| 45 to 54 Years | 6,944 (90.4%) | 243 (3.5%) |
| 55 to 59 Years | 2,755 (84.3%) | 110 (4.0%) |
| 60 to 64 Years | 2,516 (76.3%) | 86 (3.4%) |
| 65 to 74 Years | 1,463 (36.2%) | 72 (4.9%) |
| 75 Years and over | 243 (10.2%) | 17 (7.0%) |
| Total | 36,003 (76.0%) | 1,692 (4.7%) |
Employment Status by Educational Attainment in Euless
According to labor force statistics for Euless, 86.9% of individuals (29,553) out of the total population between 25 and 64 years of age (34,008) are in the labor force, with 4.0% or 1,182 of them being unemployed. The group with the highest labor force participation rate are those with the educational attainment of bachelor's degree or higher, with 91.4% or 12,482 individuals in the labor force. Within the labor force, individuals with bachelor's degree or higher education have the highest percentage of unemployment, with 5.0% or 624 of them being unemployed.
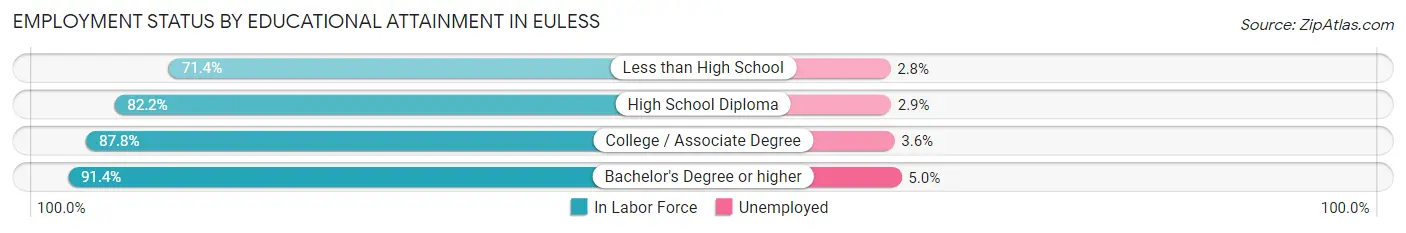
| Educational Attainment | In Labor Force | Unemployed |
| Less than High School | 1,842 (71.4%) | 72 (2.8%) |
| High School Diploma | 5,573 (82.2%) | 197 (2.9%) |
| College / Associate Degree | 9,650 (87.8%) | 396 (3.6%) |
| Bachelor's Degree or higher | 12,482 (91.4%) | 683 (5.0%) |
| Total | 29,553 (86.9%) | 1,360 (4.0%) |
Employment Occupations by Sex in Euless
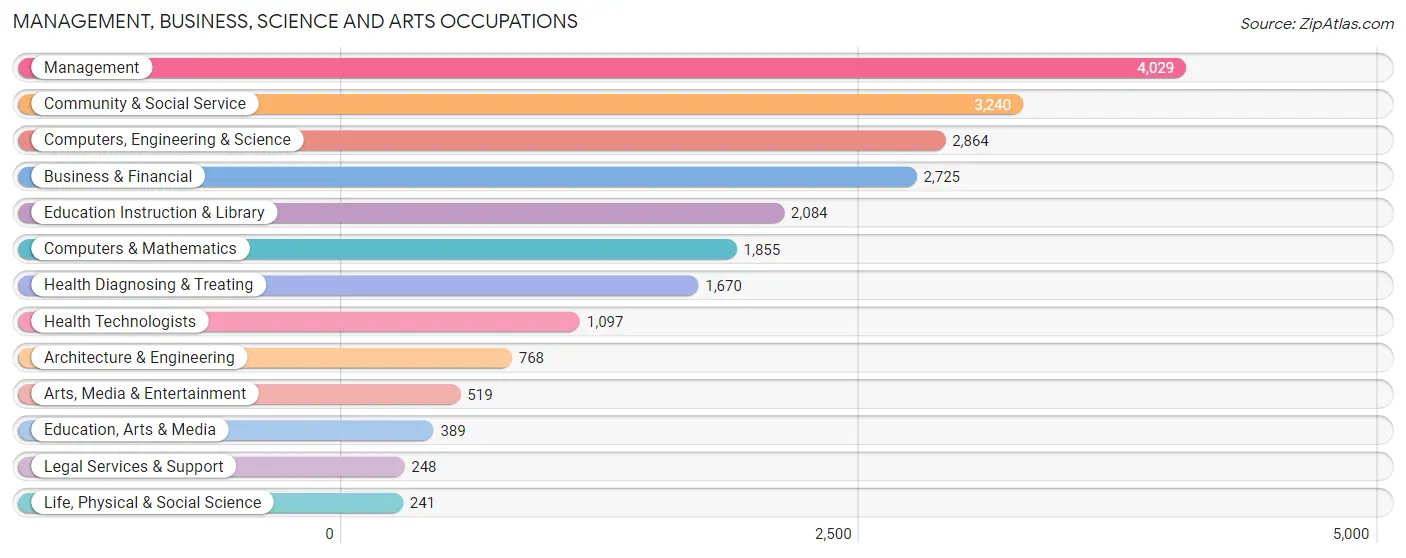
Management, Business, Science and Arts Occupations
The most common Management, Business, Science and Arts occupations in Euless are Management (4,029 | 11.7%), Community & Social Service (3,240 | 9.4%), Computers, Engineering & Science (2,864 | 8.3%), Business & Financial (2,725 | 7.9%), and Education Instruction & Library (2,084 | 6.1%).
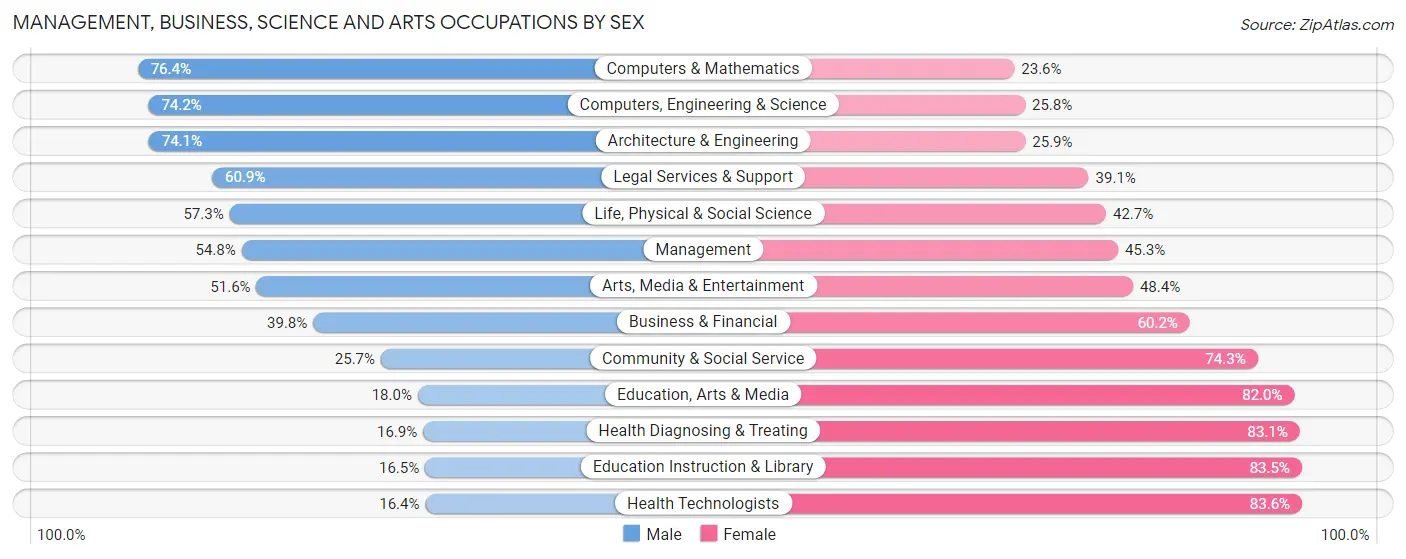
Management, Business, Science and Arts Occupations by Sex
Within the Management, Business, Science and Arts occupations in Euless, the most male-oriented occupations are Computers & Mathematics (76.4%), Computers, Engineering & Science (74.2%), and Architecture & Engineering (74.1%), while the most female-oriented occupations are Health Technologists (83.6%), Education Instruction & Library (83.5%), and Health Diagnosing & Treating (83.1%).
| Occupation | Male | Female |
| Management | 2,206 (54.7%) | 1,823 (45.3%) |
| Business & Financial | 1,085 (39.8%) | 1,640 (60.2%) |
| Computers, Engineering & Science | 2,124 (74.2%) | 740 (25.8%) |
| Computers & Mathematics | 1,417 (76.4%) | 438 (23.6%) |
| Architecture & Engineering | 569 (74.1%) | 199 (25.9%) |
| Life, Physical & Social Science | 138 (57.3%) | 103 (42.7%) |
| Community & Social Service | 832 (25.7%) | 2,408 (74.3%) |
| Education, Arts & Media | 70 (18.0%) | 319 (82.0%) |
| Legal Services & Support | 151 (60.9%) | 97 (39.1%) |
| Education Instruction & Library | 343 (16.5%) | 1,741 (83.5%) |
| Arts, Media & Entertainment | 268 (51.6%) | 251 (48.4%) |
| Health Diagnosing & Treating | 282 (16.9%) | 1,388 (83.1%) |
| Health Technologists | 180 (16.4%) | 917 (83.6%) |
| Total (Category) | 6,529 (44.9%) | 7,999 (55.1%) |
| Total (Overall) | 18,755 (54.6%) | 15,576 (45.4%) |
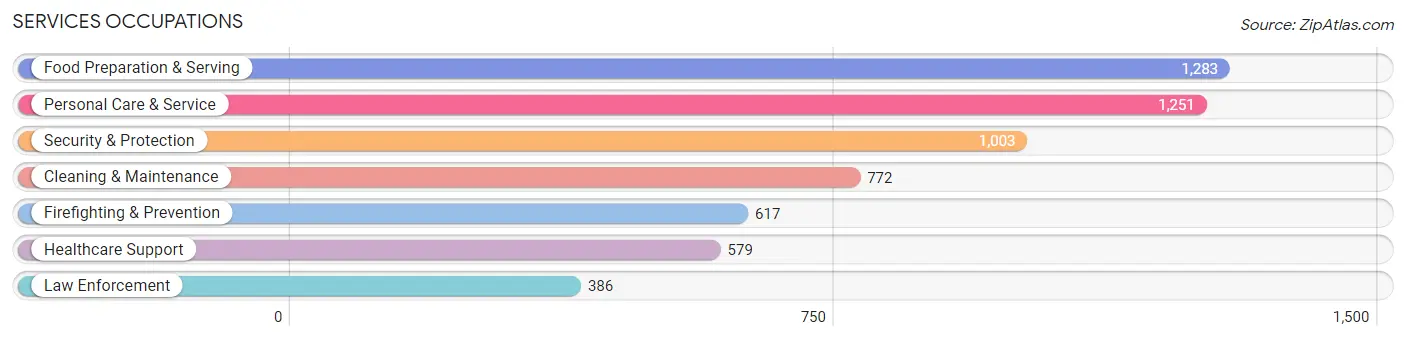
Services Occupations
The most common Services occupations in Euless are Food Preparation & Serving (1,283 | 3.7%), Personal Care & Service (1,251 | 3.6%), Security & Protection (1,003 | 2.9%), Cleaning & Maintenance (772 | 2.2%), and Firefighting & Prevention (617 | 1.8%).
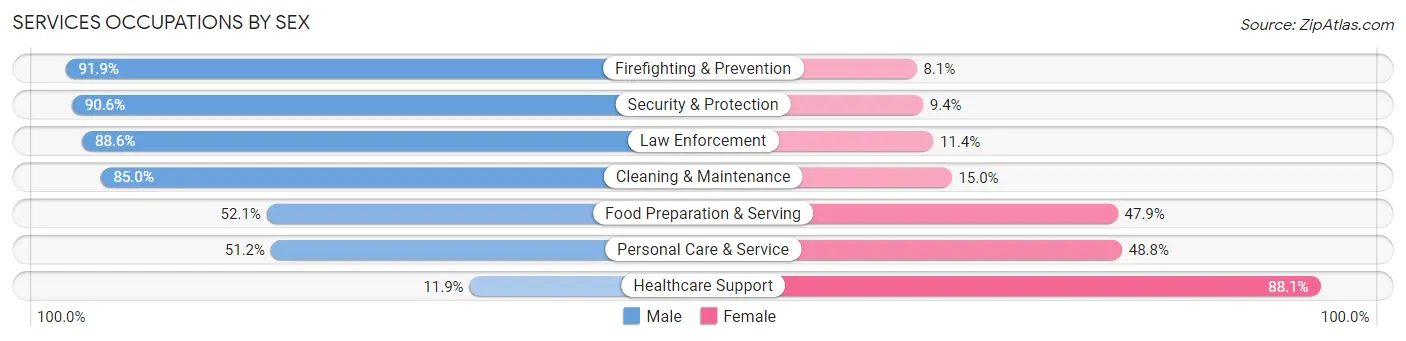
Services Occupations by Sex
Within the Services occupations in Euless, the most male-oriented occupations are Firefighting & Prevention (91.9%), Security & Protection (90.6%), and Law Enforcement (88.6%), while the most female-oriented occupations are Healthcare Support (88.1%), Personal Care & Service (48.8%), and Food Preparation & Serving (47.9%).
| Occupation | Male | Female |
| Healthcare Support | 69 (11.9%) | 510 (88.1%) |
| Security & Protection | 909 (90.6%) | 94 (9.4%) |
| Firefighting & Prevention | 567 (91.9%) | 50 (8.1%) |
| Law Enforcement | 342 (88.6%) | 44 (11.4%) |
| Food Preparation & Serving | 668 (52.1%) | 615 (47.9%) |
| Cleaning & Maintenance | 656 (85.0%) | 116 (15.0%) |
| Personal Care & Service | 641 (51.2%) | 610 (48.8%) |
| Total (Category) | 2,943 (60.2%) | 1,945 (39.8%) |
| Total (Overall) | 18,755 (54.6%) | 15,576 (45.4%) |
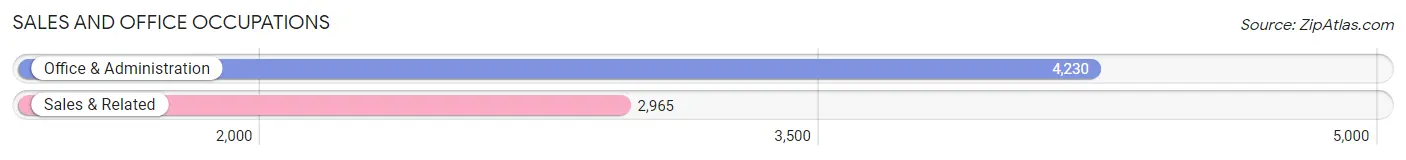
Sales and Office Occupations
The most common Sales and Office occupations in Euless are Office & Administration (4,230 | 12.3%), and Sales & Related (2,965 | 8.6%).
Sales and Office Occupations by Sex
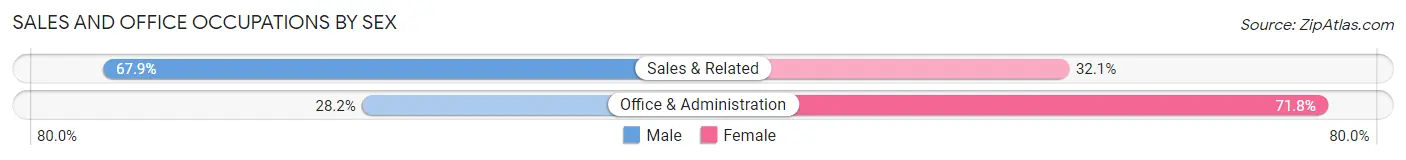
| Occupation | Male | Female |
| Sales & Related | 2,014 (67.9%) | 951 (32.1%) |
| Office & Administration | 1,191 (28.2%) | 3,039 (71.8%) |
| Total (Category) | 3,205 (44.5%) | 3,990 (55.5%) |
| Total (Overall) | 18,755 (54.6%) | 15,576 (45.4%) |
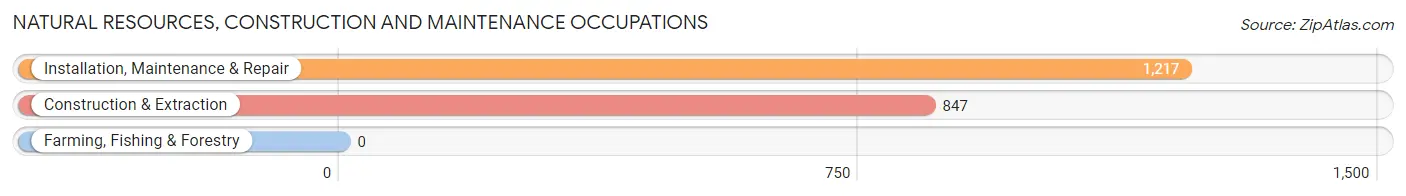
Natural Resources, Construction and Maintenance Occupations
The most common Natural Resources, Construction and Maintenance occupations in Euless are Installation, Maintenance & Repair (1,217 | 3.5%), and Construction & Extraction (847 | 2.5%).
Natural Resources, Construction and Maintenance Occupations by Sex
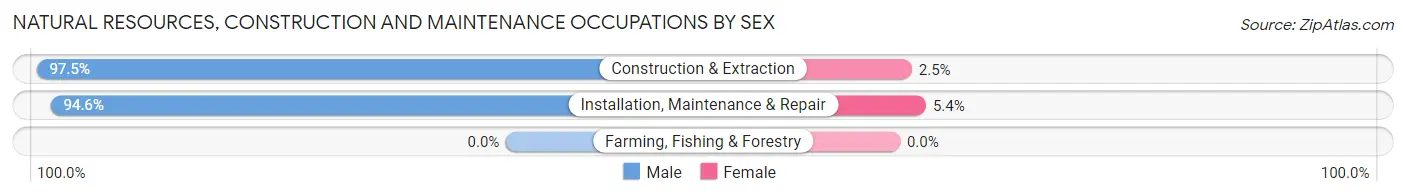
| Occupation | Male | Female |
| Farming, Fishing & Forestry | 0 (0.0%) | 0 (0.0%) |
| Construction & Extraction | 826 (97.5%) | 21 (2.5%) |
| Installation, Maintenance & Repair | 1,151 (94.6%) | 66 (5.4%) |
| Total (Category) | 1,977 (95.8%) | 87 (4.2%) |
| Total (Overall) | 18,755 (54.6%) | 15,576 (45.4%) |
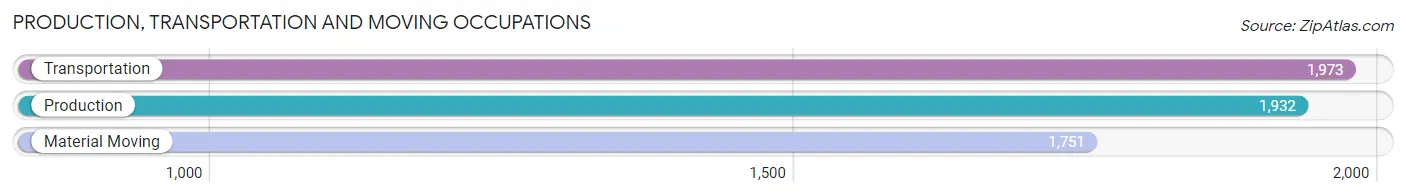
Production, Transportation and Moving Occupations
The most common Production, Transportation and Moving occupations in Euless are Transportation (1,973 | 5.8%), Production (1,932 | 5.6%), and Material Moving (1,751 | 5.1%).
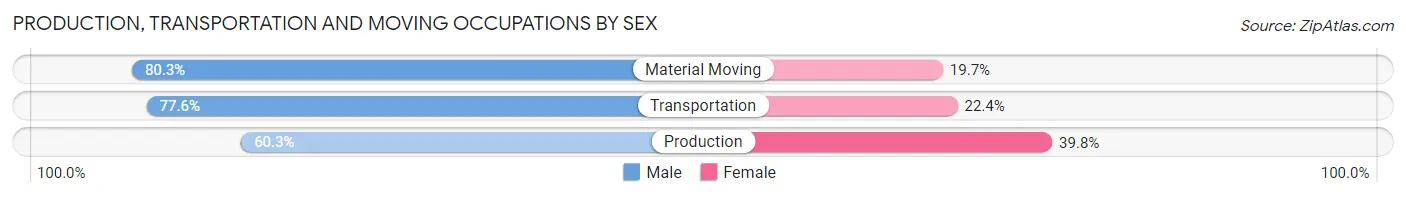
Production, Transportation and Moving Occupations by Sex
| Occupation | Male | Female |
| Production | 1,164 (60.3%) | 768 (39.8%) |
| Transportation | 1,531 (77.6%) | 442 (22.4%) |
| Material Moving | 1,406 (80.3%) | 345 (19.7%) |
| Total (Category) | 4,101 (72.5%) | 1,555 (27.5%) |
| Total (Overall) | 18,755 (54.6%) | 15,576 (45.4%) |
Employment Industries by Sex in Euless
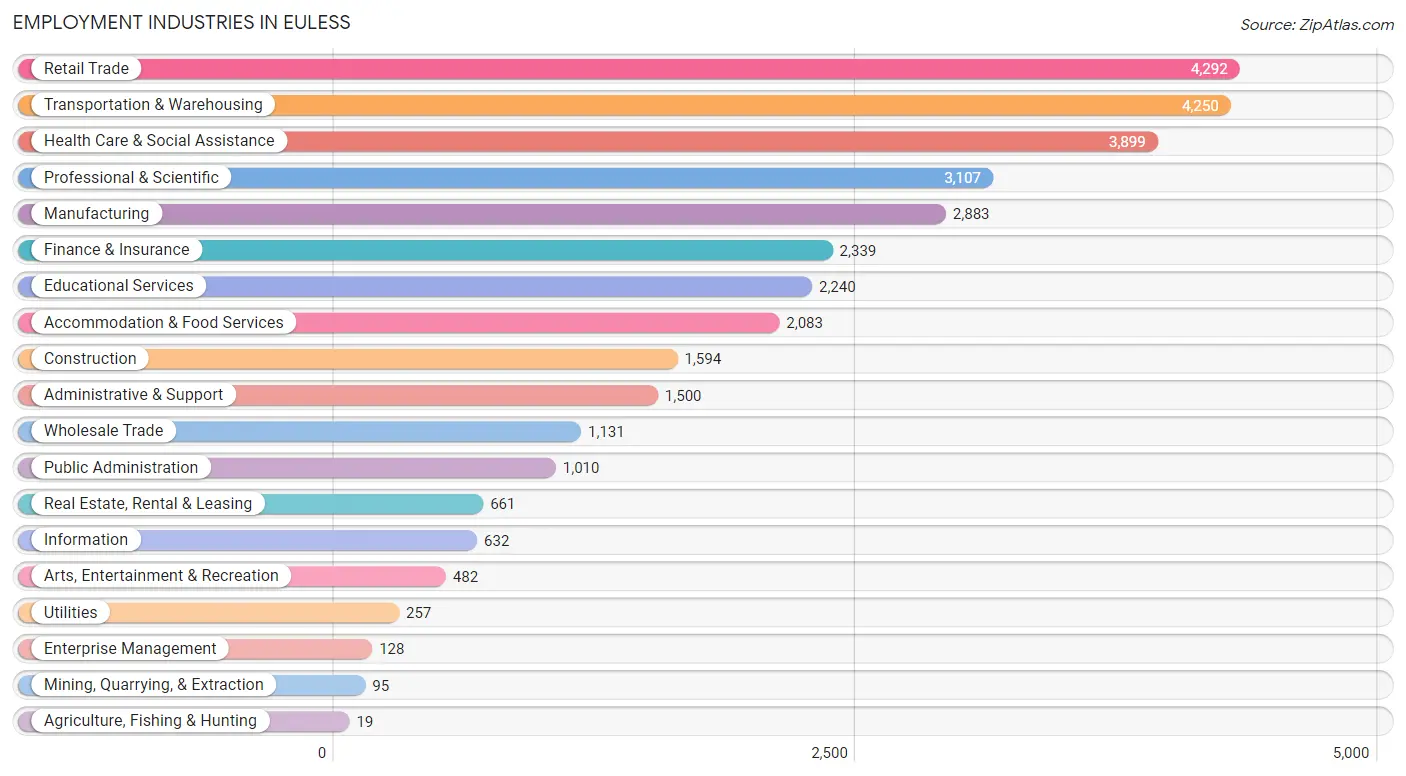
Employment Industries in Euless
The major employment industries in Euless include Retail Trade (4,292 | 12.5%), Transportation & Warehousing (4,250 | 12.4%), Health Care & Social Assistance (3,899 | 11.4%), Professional & Scientific (3,107 | 9.0%), and Manufacturing (2,883 | 8.4%).
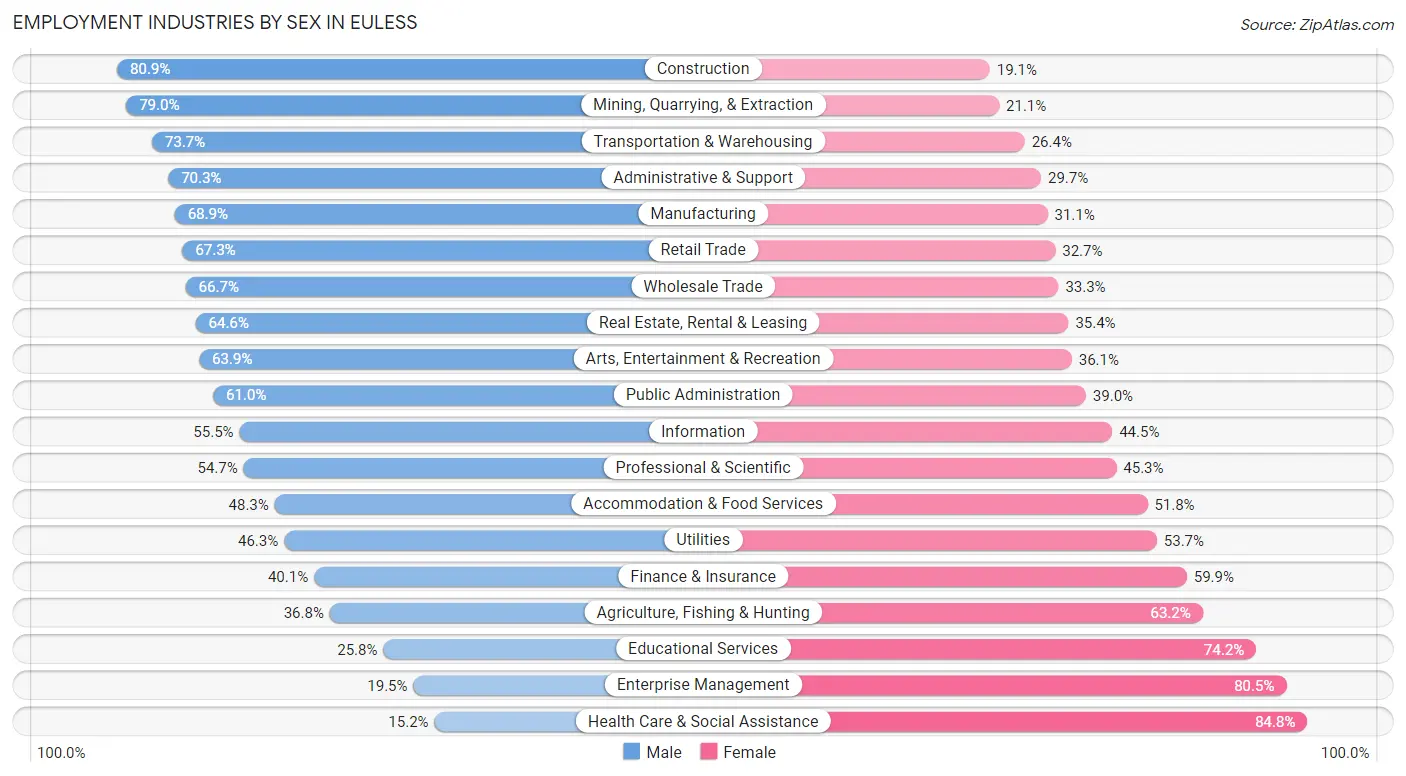
Employment Industries by Sex in Euless
The Euless industries that see more men than women are Construction (80.9%), Mining, Quarrying, & Extraction (78.9%), and Transportation & Warehousing (73.7%), whereas the industries that tend to have a higher number of women are Health Care & Social Assistance (84.8%), Enterprise Management (80.5%), and Educational Services (74.2%).
| Industry | Male | Female |
| Agriculture, Fishing & Hunting | 7 (36.8%) | 12 (63.2%) |
| Mining, Quarrying, & Extraction | 75 (78.9%) | 20 (21.0%) |
| Construction | 1,289 (80.9%) | 305 (19.1%) |
| Manufacturing | 1,987 (68.9%) | 896 (31.1%) |
| Wholesale Trade | 754 (66.7%) | 377 (33.3%) |
| Retail Trade | 2,890 (67.3%) | 1,402 (32.7%) |
| Transportation & Warehousing | 3,130 (73.7%) | 1,120 (26.4%) |
| Utilities | 119 (46.3%) | 138 (53.7%) |
| Information | 351 (55.5%) | 281 (44.5%) |
| Finance & Insurance | 938 (40.1%) | 1,401 (59.9%) |
| Real Estate, Rental & Leasing | 427 (64.6%) | 234 (35.4%) |
| Professional & Scientific | 1,699 (54.7%) | 1,408 (45.3%) |
| Enterprise Management | 25 (19.5%) | 103 (80.5%) |
| Administrative & Support | 1,054 (70.3%) | 446 (29.7%) |
| Educational Services | 577 (25.8%) | 1,663 (74.2%) |
| Health Care & Social Assistance | 592 (15.2%) | 3,307 (84.8%) |
| Arts, Entertainment & Recreation | 308 (63.9%) | 174 (36.1%) |
| Accommodation & Food Services | 1,005 (48.2%) | 1,078 (51.7%) |
| Public Administration | 616 (61.0%) | 394 (39.0%) |
| Total | 18,755 (54.6%) | 15,576 (45.4%) |
Education in Euless
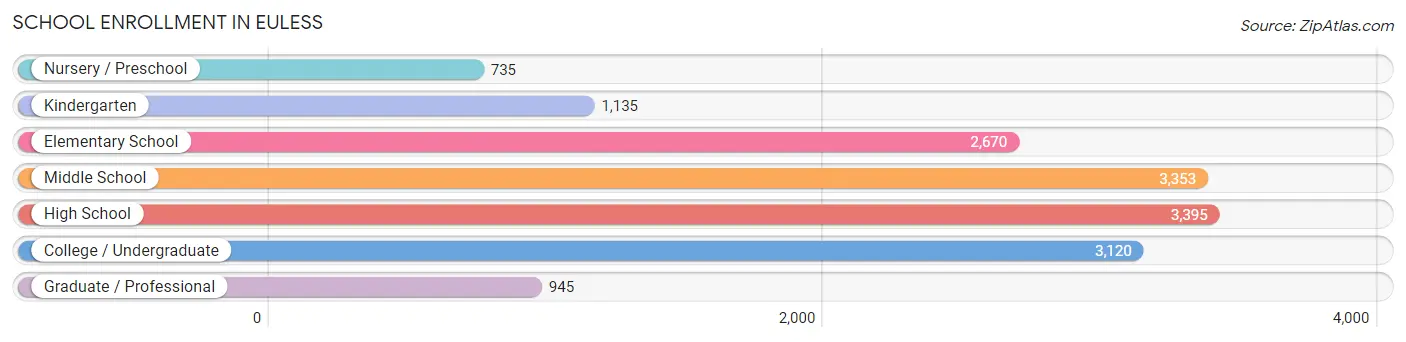
School Enrollment in Euless
The most common levels of schooling among the 15,353 students in Euless are high school (3,395 | 22.1%), middle school (3,353 | 21.8%), and college / undergraduate (3,120 | 20.3%).
| School Level | # Students | % Students |
| Nursery / Preschool | 735 | 4.8% |
| Kindergarten | 1,135 | 7.4% |
| Elementary School | 2,670 | 17.4% |
| Middle School | 3,353 | 21.8% |
| High School | 3,395 | 22.1% |
| College / Undergraduate | 3,120 | 20.3% |
| Graduate / Professional | 945 | 6.2% |
| Total | 15,353 | 100.0% |
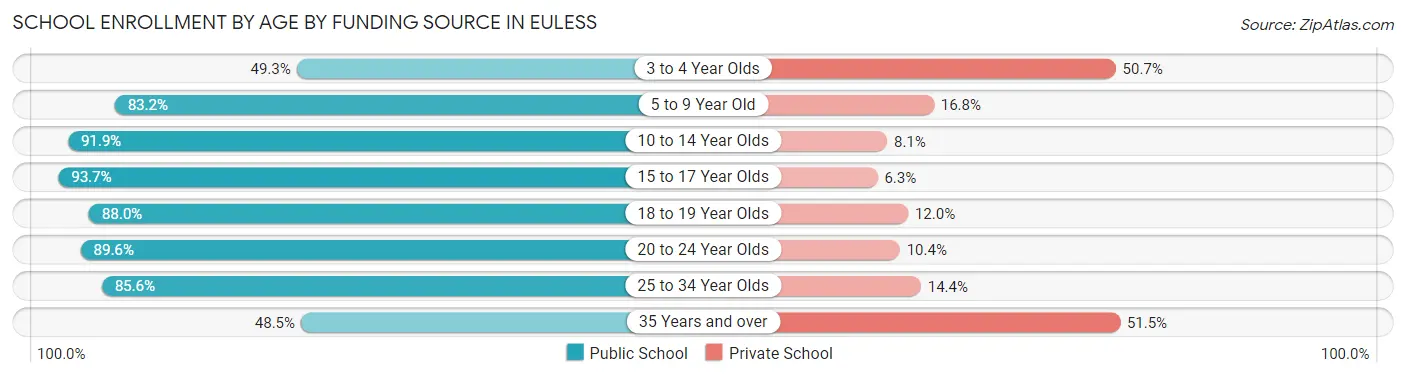
School Enrollment by Age by Funding Source in Euless
Out of a total of 15,353 students who are enrolled in schools in Euless, 2,472 (16.1%) attend a private institution, while the remaining 12,881 (83.9%) are enrolled in public schools. The age group of 35 years and over has the highest likelihood of being enrolled in private schools, with 635 (51.5% in the age bracket) enrolled. Conversely, the age group of 15 to 17 year olds has the lowest likelihood of being enrolled in a private school, with 2,071 (93.7% in the age bracket) attending a public institution.
| Age Bracket | Public School | Private School |
| 3 to 4 Year Olds | 336 (49.3%) | 345 (50.7%) |
| 5 to 9 Year Old | 3,009 (83.2%) | 607 (16.8%) |
| 10 to 14 Year Olds | 3,950 (91.9%) | 347 (8.1%) |
| 15 to 17 Year Olds | 2,071 (93.7%) | 139 (6.3%) |
| 18 to 19 Year Olds | 801 (88.0%) | 109 (12.0%) |
| 20 to 24 Year Olds | 1,269 (89.6%) | 148 (10.4%) |
| 25 to 34 Year Olds | 846 (85.6%) | 142 (14.4%) |
| 35 Years and over | 599 (48.5%) | 635 (51.5%) |
| Total | 12,881 (83.9%) | 2,472 (16.1%) |
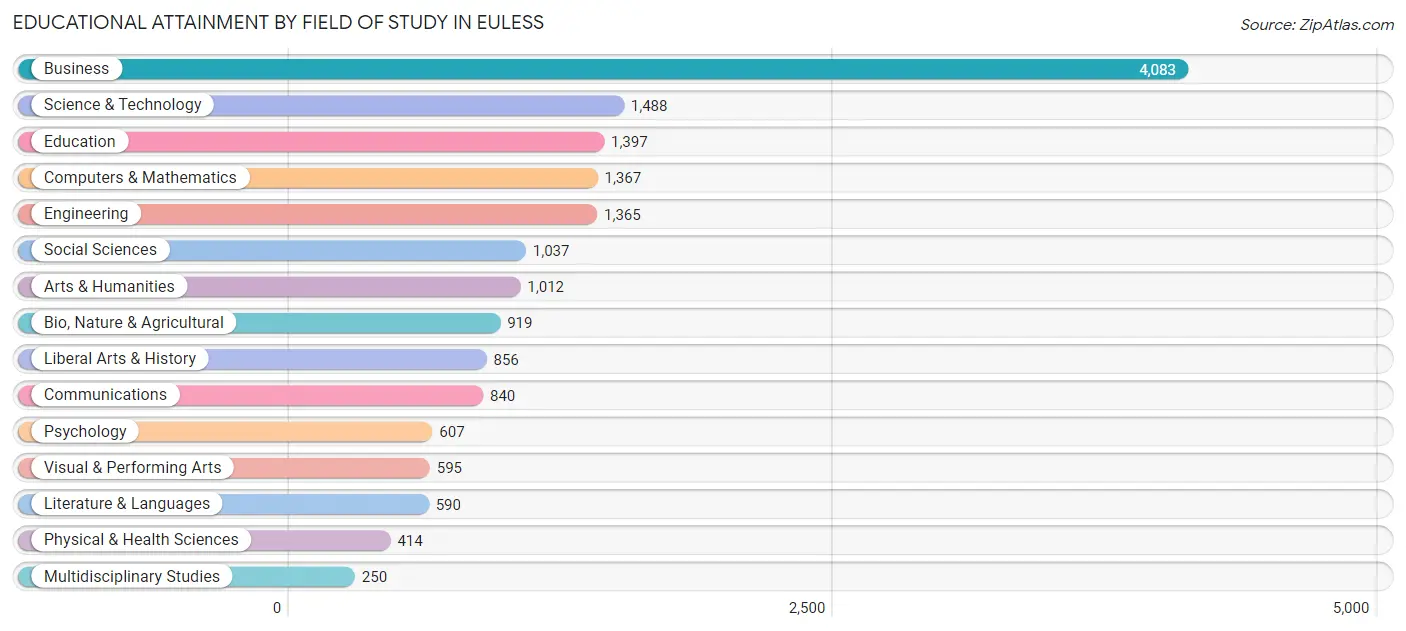
Educational Attainment by Field of Study in Euless
Business (4,083 | 24.3%), science & technology (1,488 | 8.8%), education (1,397 | 8.3%), computers & mathematics (1,367 | 8.1%), and engineering (1,365 | 8.1%) are the most common fields of study among 16,820 individuals in Euless who have obtained a bachelor's degree or higher.
| Field of Study | # Graduates | % Graduates |
| Computers & Mathematics | 1,367 | 8.1% |
| Bio, Nature & Agricultural | 919 | 5.5% |
| Physical & Health Sciences | 414 | 2.5% |
| Psychology | 607 | 3.6% |
| Social Sciences | 1,037 | 6.2% |
| Engineering | 1,365 | 8.1% |
| Multidisciplinary Studies | 250 | 1.5% |
| Science & Technology | 1,488 | 8.8% |
| Business | 4,083 | 24.3% |
| Education | 1,397 | 8.3% |
| Literature & Languages | 590 | 3.5% |
| Liberal Arts & History | 856 | 5.1% |
| Visual & Performing Arts | 595 | 3.5% |
| Communications | 840 | 5.0% |
| Arts & Humanities | 1,012 | 6.0% |
| Total | 16,820 | 100.0% |
Transportation & Commute in Euless
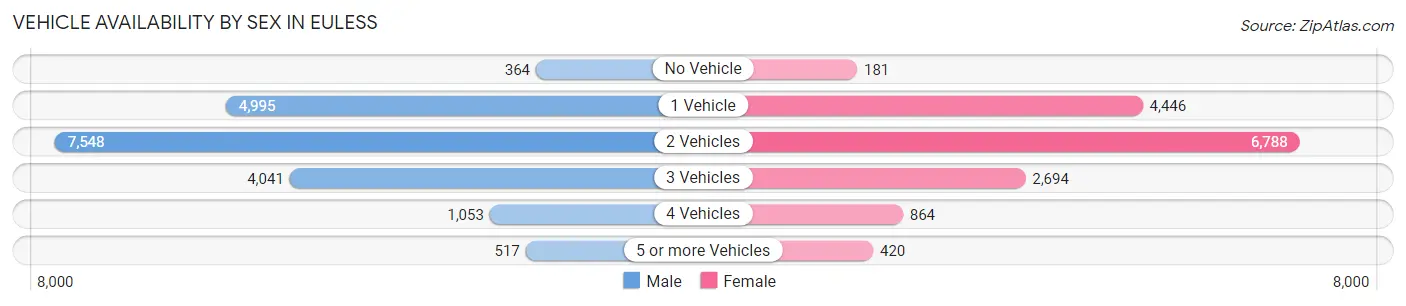
Vehicle Availability by Sex in Euless
The most prevalent vehicle ownership categories in Euless are males with 2 vehicles (7,548, accounting for 40.8%) and females with 2 vehicles (6,788, making up 49.0%).
| Vehicles Available | Male | Female |
| No Vehicle | 364 (2.0%) | 181 (1.2%) |
| 1 Vehicle | 4,995 (27.0%) | 4,446 (28.9%) |
| 2 Vehicles | 7,548 (40.8%) | 6,788 (44.1%) |
| 3 Vehicles | 4,041 (21.8%) | 2,694 (17.5%) |
| 4 Vehicles | 1,053 (5.7%) | 864 (5.6%) |
| 5 or more Vehicles | 517 (2.8%) | 420 (2.7%) |
| Total | 18,518 (100.0%) | 15,393 (100.0%) |
Commute Time in Euless
The most frequently occuring commute durations in Euless are 15 to 19 minutes (5,143 commuters, 17.6%), 20 to 24 minutes (5,035 commuters, 17.2%), and 30 to 34 minutes (4,312 commuters, 14.7%).
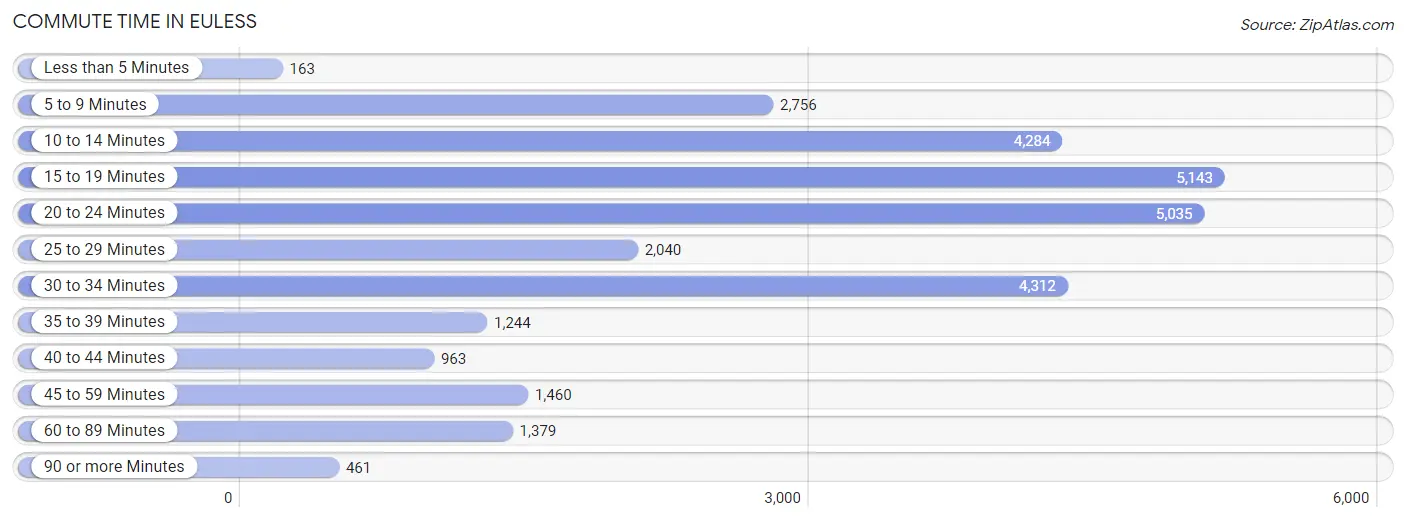
| Commute Time | # Commuters | % Commuters |
| Less than 5 Minutes | 163 | 0.6% |
| 5 to 9 Minutes | 2,756 | 9.4% |
| 10 to 14 Minutes | 4,284 | 14.6% |
| 15 to 19 Minutes | 5,143 | 17.6% |
| 20 to 24 Minutes | 5,035 | 17.2% |
| 25 to 29 Minutes | 2,040 | 7.0% |
| 30 to 34 Minutes | 4,312 | 14.7% |
| 35 to 39 Minutes | 1,244 | 4.3% |
| 40 to 44 Minutes | 963 | 3.3% |
| 45 to 59 Minutes | 1,460 | 5.0% |
| 60 to 89 Minutes | 1,379 | 4.7% |
| 90 or more Minutes | 461 | 1.6% |
Commute Time by Sex in Euless
The most common commute times in Euless are 20 to 24 minutes (3,081 commuters, 19.0%) for males and 15 to 19 minutes (2,740 commuters, 21.1%) for females.
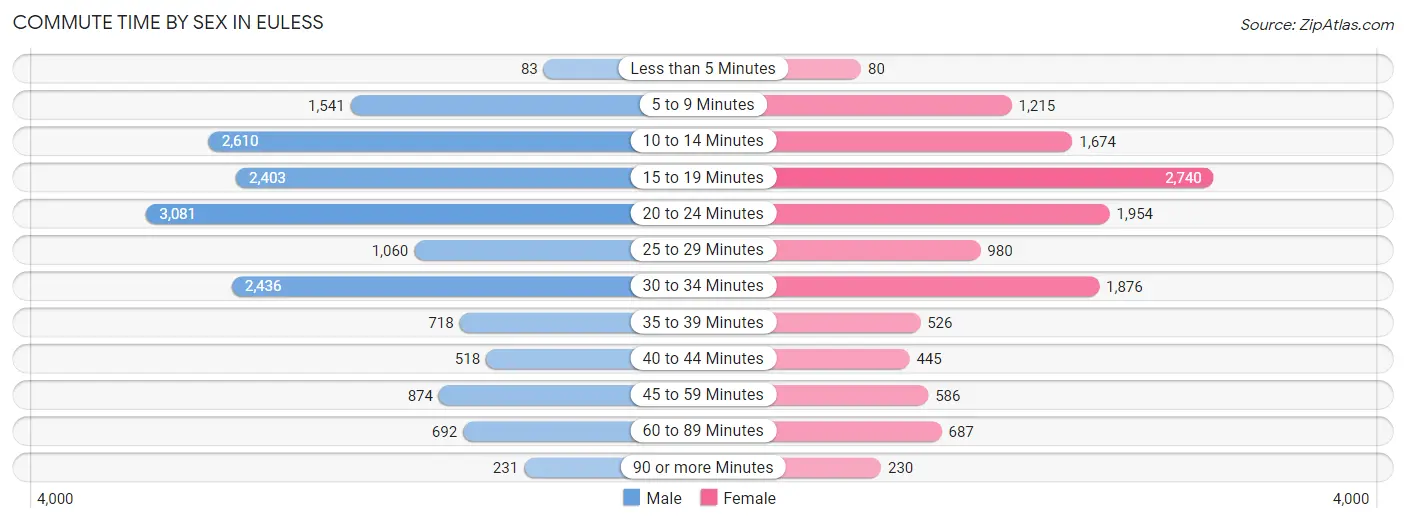
| Commute Time | Male | Female |
| Less than 5 Minutes | 83 (0.5%) | 80 (0.6%) |
| 5 to 9 Minutes | 1,541 (9.5%) | 1,215 (9.3%) |
| 10 to 14 Minutes | 2,610 (16.1%) | 1,674 (12.9%) |
| 15 to 19 Minutes | 2,403 (14.8%) | 2,740 (21.1%) |
| 20 to 24 Minutes | 3,081 (19.0%) | 1,954 (15.0%) |
| 25 to 29 Minutes | 1,060 (6.5%) | 980 (7.5%) |
| 30 to 34 Minutes | 2,436 (15.0%) | 1,876 (14.4%) |
| 35 to 39 Minutes | 718 (4.4%) | 526 (4.1%) |
| 40 to 44 Minutes | 518 (3.2%) | 445 (3.4%) |
| 45 to 59 Minutes | 874 (5.4%) | 586 (4.5%) |
| 60 to 89 Minutes | 692 (4.3%) | 687 (5.3%) |
| 90 or more Minutes | 231 (1.4%) | 230 (1.8%) |
Time of Departure to Work by Sex in Euless
The most frequent times of departure to work in Euless are 7:00 AM to 7:29 AM (2,360, 14.5%) for males and 7:00 AM to 7:29 AM (2,486, 19.1%) for females.
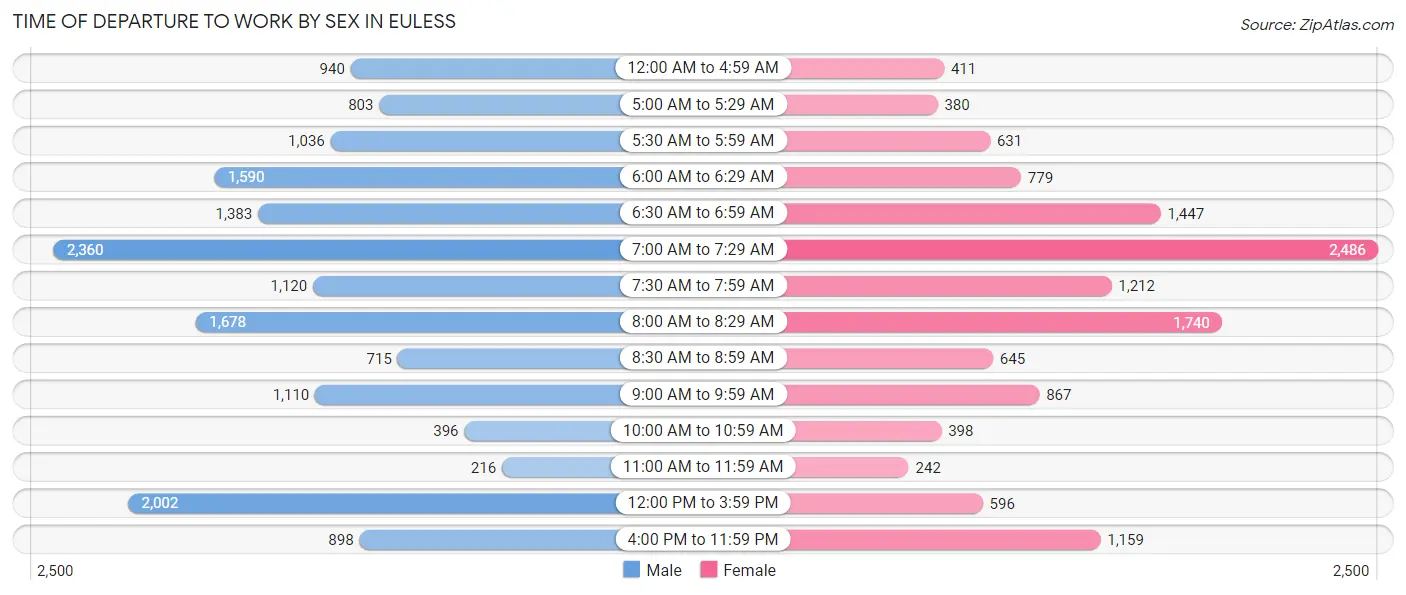
| Time of Departure | Male | Female |
| 12:00 AM to 4:59 AM | 940 (5.8%) | 411 (3.2%) |
| 5:00 AM to 5:29 AM | 803 (4.9%) | 380 (2.9%) |
| 5:30 AM to 5:59 AM | 1,036 (6.4%) | 631 (4.9%) |
| 6:00 AM to 6:29 AM | 1,590 (9.8%) | 779 (6.0%) |
| 6:30 AM to 6:59 AM | 1,383 (8.5%) | 1,447 (11.1%) |
| 7:00 AM to 7:29 AM | 2,360 (14.5%) | 2,486 (19.1%) |
| 7:30 AM to 7:59 AM | 1,120 (6.9%) | 1,212 (9.3%) |
| 8:00 AM to 8:29 AM | 1,678 (10.3%) | 1,740 (13.4%) |
| 8:30 AM to 8:59 AM | 715 (4.4%) | 645 (5.0%) |
| 9:00 AM to 9:59 AM | 1,110 (6.8%) | 867 (6.7%) |
| 10:00 AM to 10:59 AM | 396 (2.4%) | 398 (3.1%) |
| 11:00 AM to 11:59 AM | 216 (1.3%) | 242 (1.9%) |
| 12:00 PM to 3:59 PM | 2,002 (12.3%) | 596 (4.6%) |
| 4:00 PM to 11:59 PM | 898 (5.5%) | 1,159 (8.9%) |
| Total | 16,247 (100.0%) | 12,993 (100.0%) |
Housing Occupancy in Euless
Occupancy by Ownership in Euless
Of the total 24,005 dwellings in Euless, owner-occupied units account for 9,484 (39.5%), while renter-occupied units make up 14,521 (60.5%).
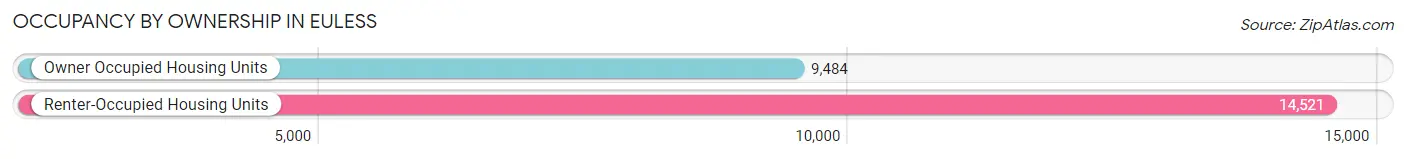
| Occupancy | # Housing Units | % Housing Units |
| Owner Occupied Housing Units | 9,484 | 39.5% |
| Renter-Occupied Housing Units | 14,521 | 60.5% |
| Total Occupied Housing Units | 24,005 | 100.0% |
Occupancy by Household Size in Euless
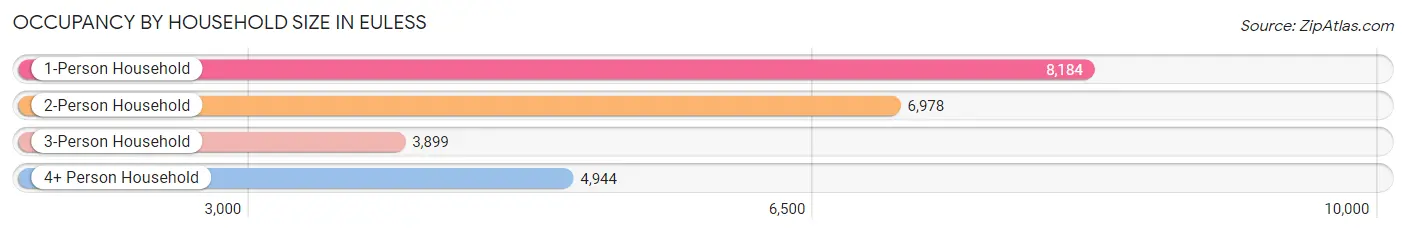
| Household Size | # Housing Units | % Housing Units |
| 1-Person Household | 8,184 | 34.1% |
| 2-Person Household | 6,978 | 29.1% |
| 3-Person Household | 3,899 | 16.2% |
| 4+ Person Household | 4,944 | 20.6% |
| Total Housing Units | 24,005 | 100.0% |
Occupancy by Ownership by Household Size in Euless
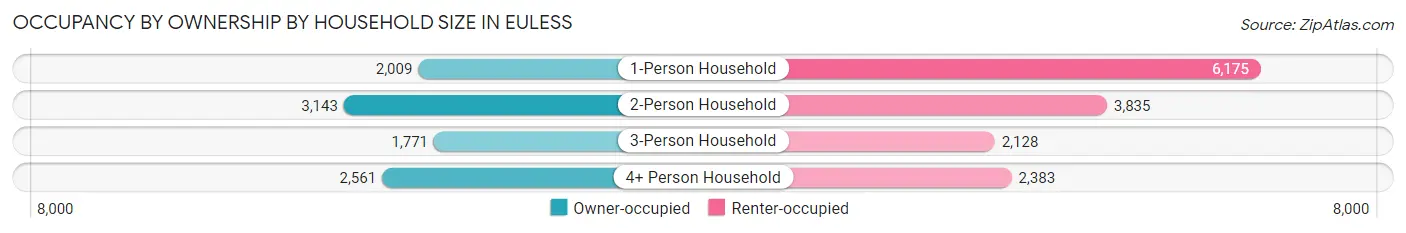
| Household Size | Owner-occupied | Renter-occupied |
| 1-Person Household | 2,009 (24.5%) | 6,175 (75.4%) |
| 2-Person Household | 3,143 (45.0%) | 3,835 (55.0%) |
| 3-Person Household | 1,771 (45.4%) | 2,128 (54.6%) |
| 4+ Person Household | 2,561 (51.8%) | 2,383 (48.2%) |
| Total Housing Units | 9,484 (39.5%) | 14,521 (60.5%) |
Occupancy by Educational Attainment in Euless
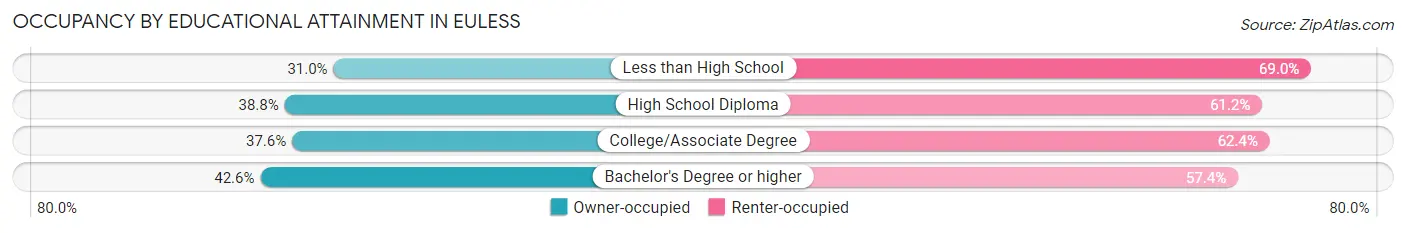
| Household Size | Owner-occupied | Renter-occupied |
| Less than High School | 463 (31.0%) | 1,030 (69.0%) |
| High School Diploma | 1,623 (38.8%) | 2,563 (61.2%) |
| College/Associate Degree | 3,066 (37.6%) | 5,093 (62.4%) |
| Bachelor's Degree or higher | 4,332 (42.6%) | 5,835 (57.4%) |
Occupancy by Age of Householder in Euless
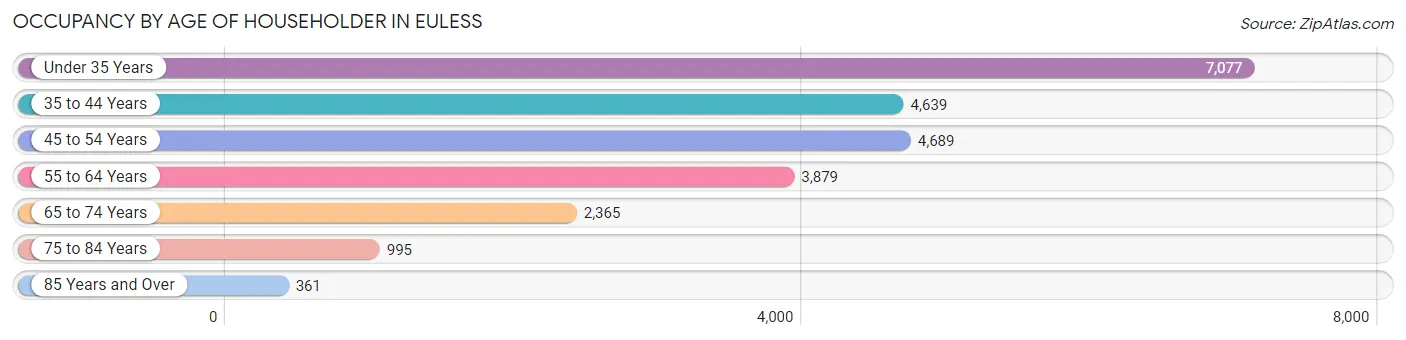
| Age Bracket | # Households | % Households |
| Under 35 Years | 7,077 | 29.5% |
| 35 to 44 Years | 4,639 | 19.3% |
| 45 to 54 Years | 4,689 | 19.5% |
| 55 to 64 Years | 3,879 | 16.2% |
| 65 to 74 Years | 2,365 | 9.9% |
| 75 to 84 Years | 995 | 4.1% |
| 85 Years and Over | 361 | 1.5% |
| Total | 24,005 | 100.0% |
Housing Finances in Euless
Median Income by Occupancy in Euless
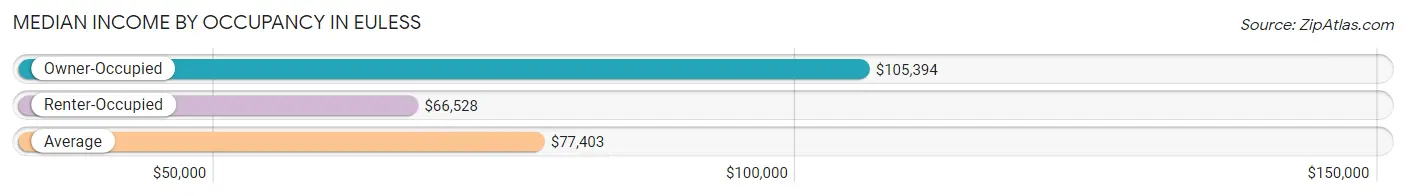
| Occupancy Type | # Households | Median Income |
| Owner-Occupied | 9,484 (39.5%) | $105,394 |
| Renter-Occupied | 14,521 (60.5%) | $66,528 |
| Average | 24,005 (100.0%) | $77,403 |
Occupancy by Householder Income Bracket in Euless
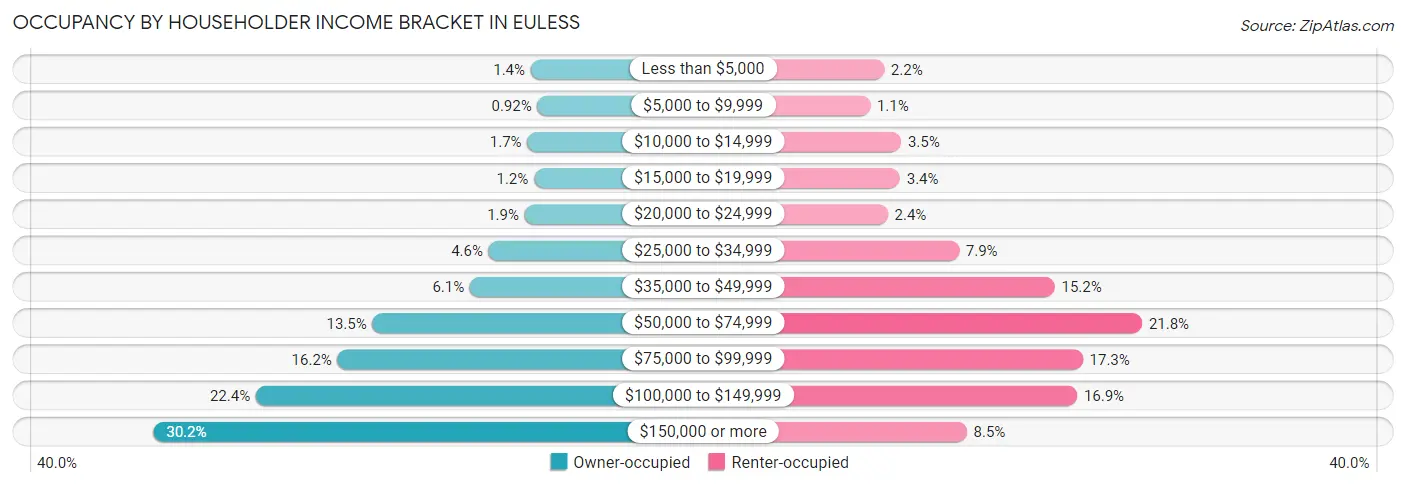
| Income Bracket | Owner-occupied | Renter-occupied |
| Less than $5,000 | 136 (1.4%) | 313 (2.2%) |
| $5,000 to $9,999 | 87 (0.9%) | 160 (1.1%) |
| $10,000 to $14,999 | 160 (1.7%) | 503 (3.5%) |
| $15,000 to $19,999 | 112 (1.2%) | 489 (3.4%) |
| $20,000 to $24,999 | 179 (1.9%) | 354 (2.4%) |
| $25,000 to $34,999 | 439 (4.6%) | 1,143 (7.9%) |
| $35,000 to $49,999 | 575 (6.1%) | 2,201 (15.2%) |
| $50,000 to $74,999 | 1,279 (13.5%) | 3,168 (21.8%) |
| $75,000 to $99,999 | 1,532 (16.2%) | 2,512 (17.3%) |
| $100,000 to $149,999 | 2,122 (22.4%) | 2,450 (16.9%) |
| $150,000 or more | 2,863 (30.2%) | 1,228 (8.5%) |
| Total | 9,484 (100.0%) | 14,521 (100.0%) |
Monthly Housing Cost Tiers in Euless
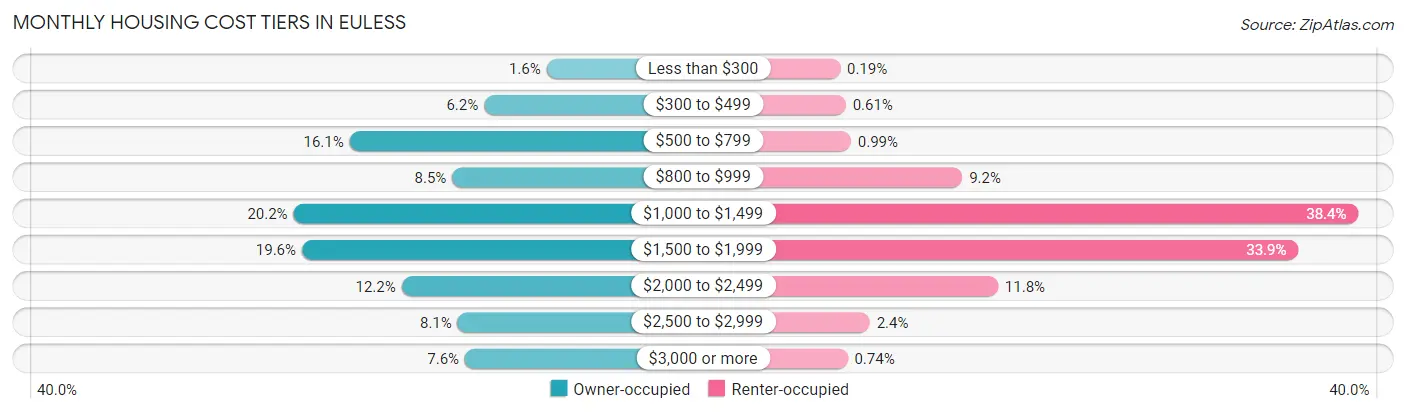
| Monthly Cost | Owner-occupied | Renter-occupied |
| Less than $300 | 148 (1.6%) | 28 (0.2%) |
| $300 to $499 | 584 (6.2%) | 89 (0.6%) |
| $500 to $799 | 1,524 (16.1%) | 144 (1.0%) |
| $800 to $999 | 807 (8.5%) | 1,334 (9.2%) |
| $1,000 to $1,499 | 1,916 (20.2%) | 5,570 (38.4%) |
| $1,500 to $1,999 | 1,857 (19.6%) | 4,928 (33.9%) |
| $2,000 to $2,499 | 1,161 (12.2%) | 1,716 (11.8%) |
| $2,500 to $2,999 | 769 (8.1%) | 345 (2.4%) |
| $3,000 or more | 718 (7.6%) | 108 (0.7%) |
| Total | 9,484 (100.0%) | 14,521 (100.0%) |
Physical Housing Characteristics in Euless
Housing Structures in Euless
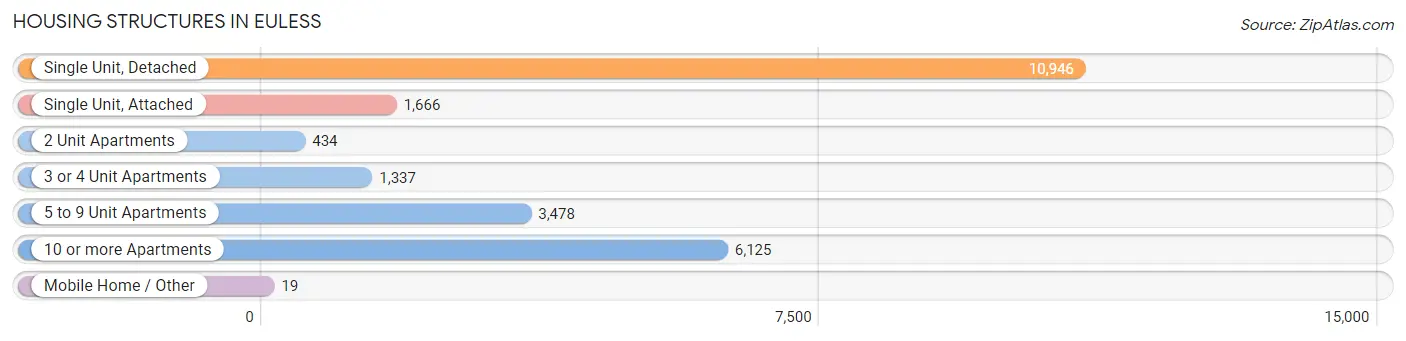
| Structure Type | # Housing Units | % Housing Units |
| Single Unit, Detached | 10,946 | 45.6% |
| Single Unit, Attached | 1,666 | 6.9% |
| 2 Unit Apartments | 434 | 1.8% |
| 3 or 4 Unit Apartments | 1,337 | 5.6% |
| 5 to 9 Unit Apartments | 3,478 | 14.5% |
| 10 or more Apartments | 6,125 | 25.5% |
| Mobile Home / Other | 19 | 0.1% |
| Total | 24,005 | 100.0% |
Housing Structures by Occupancy in Euless
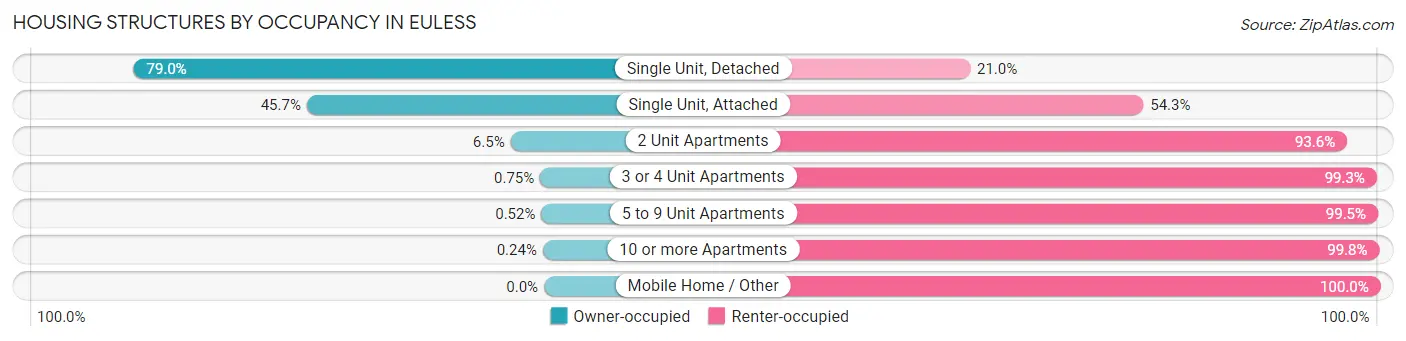
| Structure Type | Owner-occupied | Renter-occupied |
| Single Unit, Detached | 8,652 (79.0%) | 2,294 (21.0%) |
| Single Unit, Attached | 761 (45.7%) | 905 (54.3%) |
| 2 Unit Apartments | 28 (6.5%) | 406 (93.5%) |
| 3 or 4 Unit Apartments | 10 (0.7%) | 1,327 (99.3%) |
| 5 to 9 Unit Apartments | 18 (0.5%) | 3,460 (99.5%) |
| 10 or more Apartments | 15 (0.2%) | 6,110 (99.8%) |
| Mobile Home / Other | 0 (0.0%) | 19 (100.0%) |
| Total | 9,484 (39.5%) | 14,521 (60.5%) |
Housing Structures by Number of Rooms in Euless
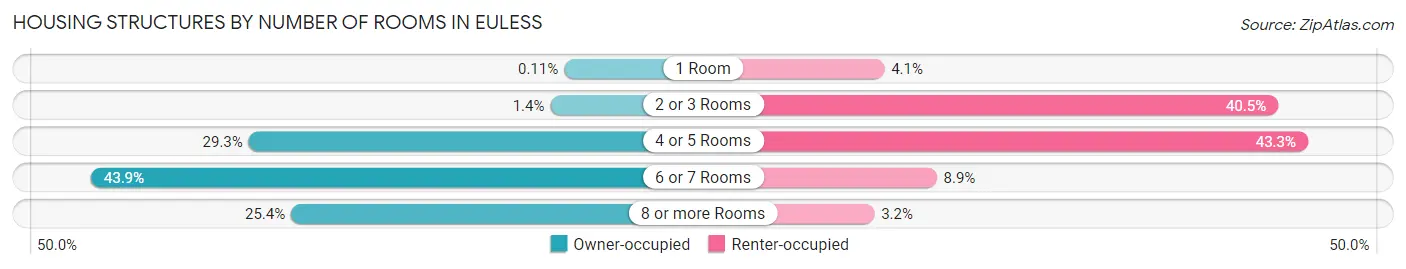
| Number of Rooms | Owner-occupied | Renter-occupied |
| 1 Room | 10 (0.1%) | 596 (4.1%) |
| 2 or 3 Rooms | 131 (1.4%) | 5,884 (40.5%) |
| 4 or 5 Rooms | 2,777 (29.3%) | 6,283 (43.3%) |
| 6 or 7 Rooms | 4,161 (43.9%) | 1,298 (8.9%) |
| 8 or more Rooms | 2,405 (25.4%) | 460 (3.2%) |
| Total | 9,484 (100.0%) | 14,521 (100.0%) |
Housing Structure by Heating Type in Euless
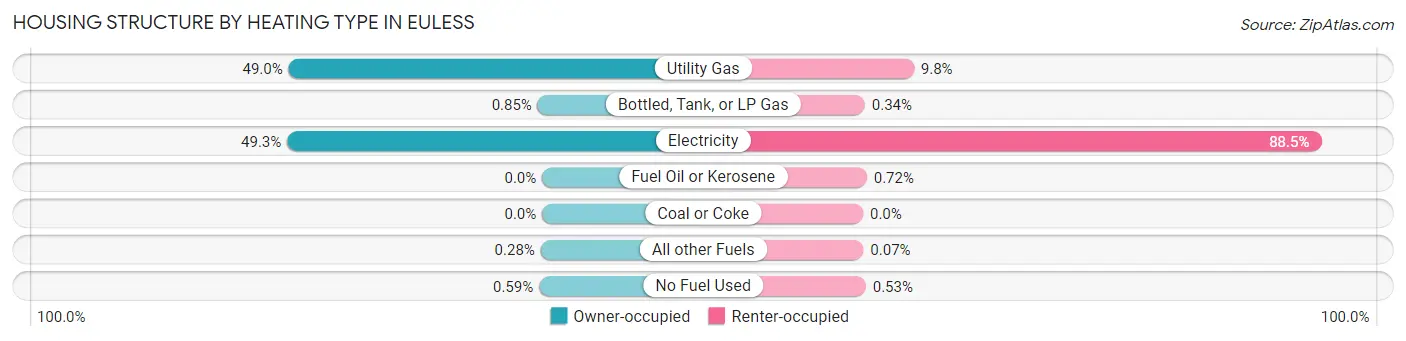
| Heating Type | Owner-occupied | Renter-occupied |
| Utility Gas | 4,647 (49.0%) | 1,426 (9.8%) |
| Bottled, Tank, or LP Gas | 81 (0.9%) | 49 (0.3%) |
| Electricity | 4,673 (49.3%) | 12,855 (88.5%) |
| Fuel Oil or Kerosene | 0 (0.0%) | 104 (0.7%) |
| Coal or Coke | 0 (0.0%) | 0 (0.0%) |
| All other Fuels | 27 (0.3%) | 10 (0.1%) |
| No Fuel Used | 56 (0.6%) | 77 (0.5%) |
| Total | 9,484 (100.0%) | 14,521 (100.0%) |
Household Vehicle Usage in Euless
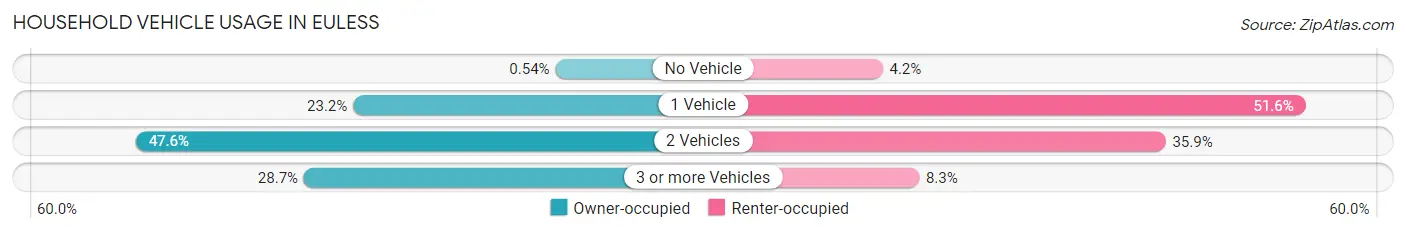
| Vehicles per Household | Owner-occupied | Renter-occupied |
| No Vehicle | 51 (0.5%) | 611 (4.2%) |
| 1 Vehicle | 2,200 (23.2%) | 7,491 (51.6%) |
| 2 Vehicles | 4,510 (47.5%) | 5,215 (35.9%) |
| 3 or more Vehicles | 2,723 (28.7%) | 1,204 (8.3%) |
| Total | 9,484 (100.0%) | 14,521 (100.0%) |
Real Estate & Mortgages in Euless
Real Estate and Mortgage Overview in Euless
| Characteristic | Without Mortgage | With Mortgage |
| Housing Units | 3,411 | 6,073 |
| Median Property Value | $246,600 | $283,300 |
| Median Household Income | $82,816 | $2,179 |
| Monthly Housing Costs | $675 | $705 |
| Real Estate Taxes | $3,517 | $116 |
Property Value by Mortgage Status in Euless
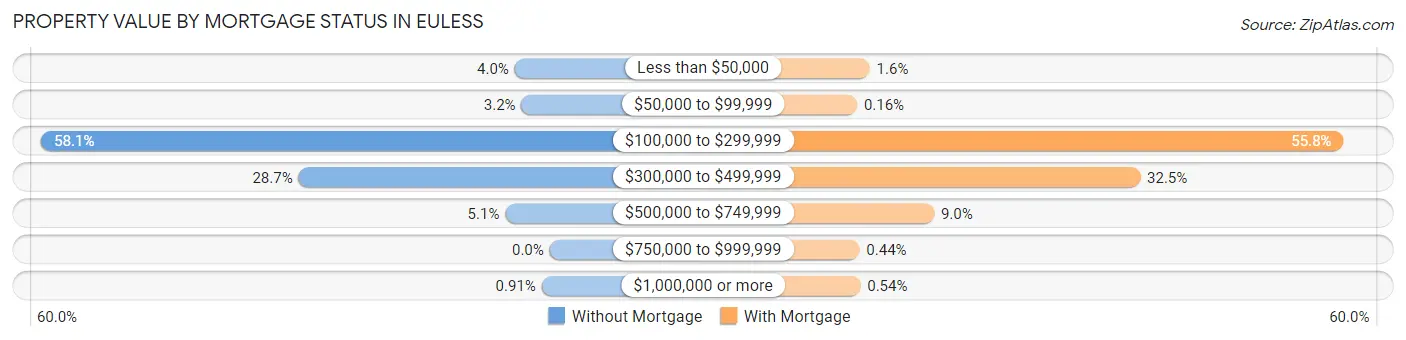
| Property Value | Without Mortgage | With Mortgage |
| Less than $50,000 | 136 (4.0%) | 98 (1.6%) |
| $50,000 to $99,999 | 110 (3.2%) | 10 (0.2%) |
| $100,000 to $299,999 | 1,982 (58.1%) | 3,386 (55.7%) |
| $300,000 to $499,999 | 979 (28.7%) | 1,975 (32.5%) |
| $500,000 to $749,999 | 173 (5.1%) | 544 (9.0%) |
| $750,000 to $999,999 | 0 (0.0%) | 27 (0.4%) |
| $1,000,000 or more | 31 (0.9%) | 33 (0.5%) |
| Total | 3,411 (100.0%) | 6,073 (100.0%) |
Household Income by Mortgage Status in Euless
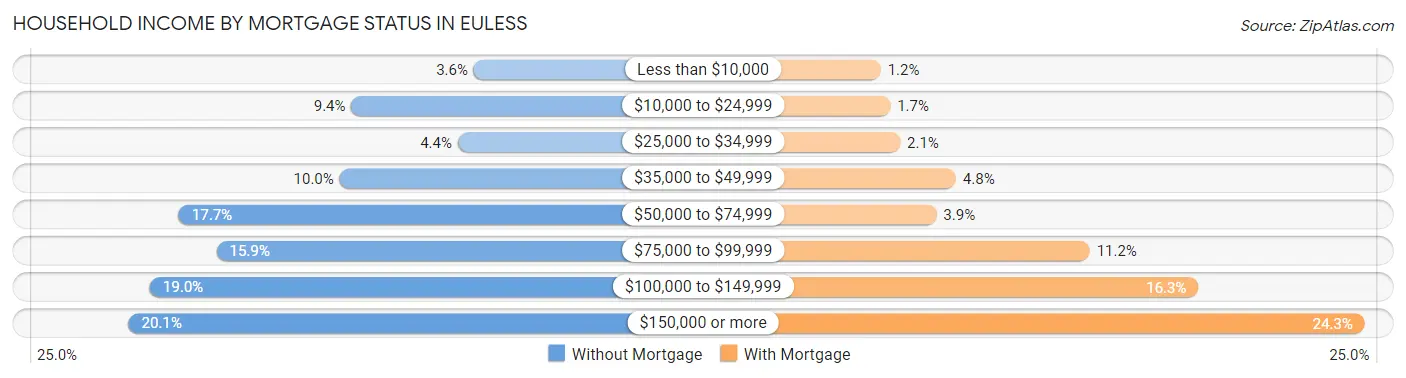
| Household Income | Without Mortgage | With Mortgage |
| Less than $10,000 | 123 (3.6%) | 73 (1.2%) |
| $10,000 to $24,999 | 322 (9.4%) | 100 (1.7%) |
| $25,000 to $34,999 | 149 (4.4%) | 129 (2.1%) |
| $35,000 to $49,999 | 341 (10.0%) | 290 (4.8%) |
| $50,000 to $74,999 | 602 (17.6%) | 234 (3.8%) |
| $75,000 to $99,999 | 541 (15.9%) | 677 (11.2%) |
| $100,000 to $149,999 | 649 (19.0%) | 991 (16.3%) |
| $150,000 or more | 684 (20.1%) | 1,473 (24.2%) |
| Total | 3,411 (100.0%) | 6,073 (100.0%) |
Property Value to Household Income Ratio in Euless
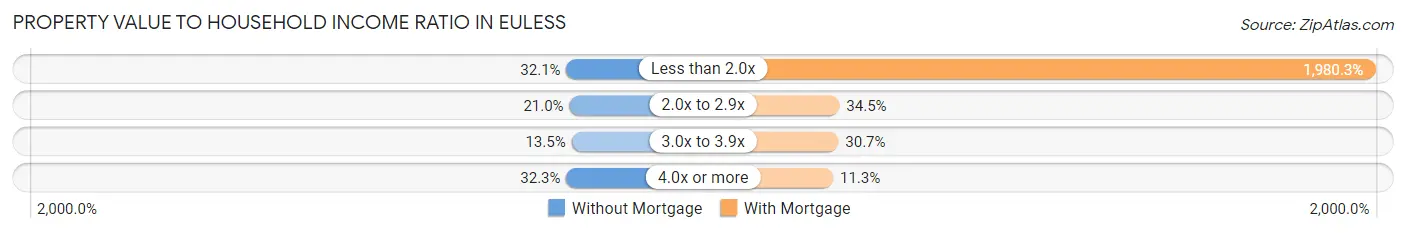
| Value-to-Income Ratio | Without Mortgage | With Mortgage |
| Less than 2.0x | 1,095 (32.1%) | 120,263 (1,980.3%) |
| 2.0x to 2.9x | 717 (21.0%) | 2,093 (34.5%) |
| 3.0x to 3.9x | 461 (13.5%) | 1,865 (30.7%) |
| 4.0x or more | 1,100 (32.3%) | 688 (11.3%) |
| Total | 3,411 (100.0%) | 6,073 (100.0%) |
Real Estate Taxes by Mortgage Status in Euless
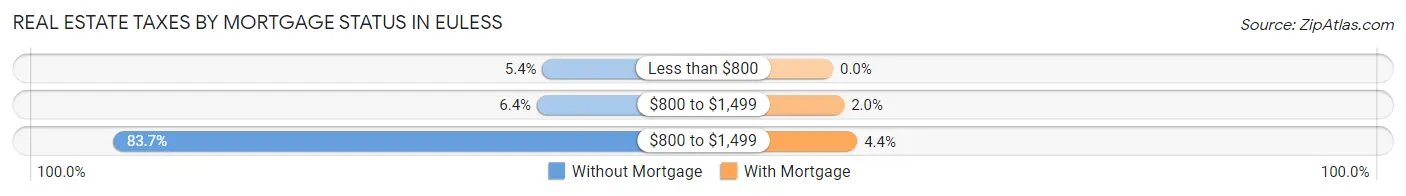
| Property Taxes | Without Mortgage | With Mortgage |
| Less than $800 | 185 (5.4%) | 0 (0.0%) |
| $800 to $1,499 | 219 (6.4%) | 124 (2.0%) |
| $800 to $1,499 | 2,855 (83.7%) | 268 (4.4%) |
| Total | 3,411 (100.0%) | 6,073 (100.0%) |
Health & Disability in Euless
Health Insurance Coverage by Age in Euless
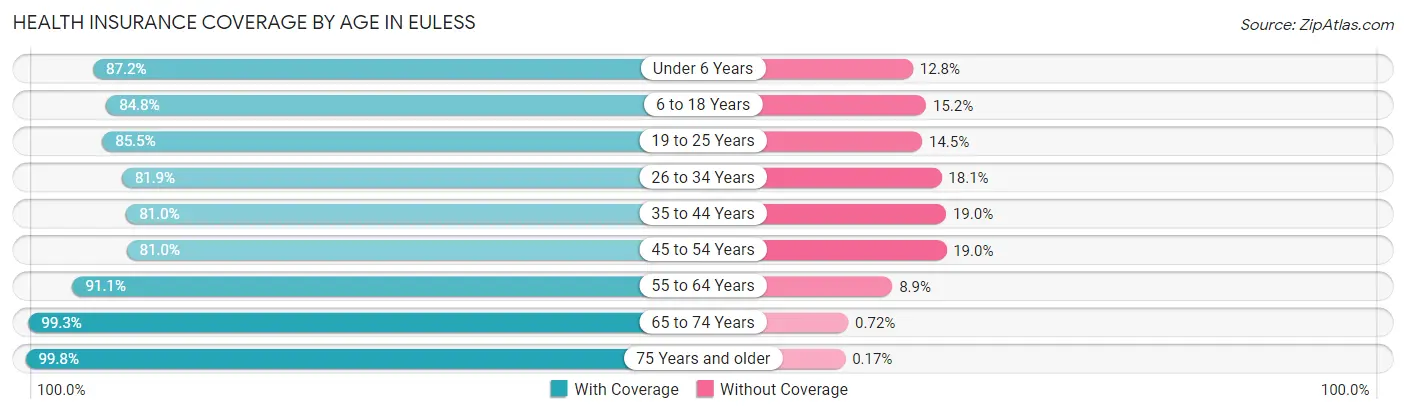
| Age Bracket | With Coverage | Without Coverage |
| Under 6 Years | 4,160 (87.2%) | 610 (12.8%) |
| 6 to 18 Years | 8,737 (84.8%) | 1,571 (15.2%) |
| 19 to 25 Years | 5,123 (85.5%) | 869 (14.5%) |
| 26 to 34 Years | 8,152 (81.9%) | 1,803 (18.1%) |
| 35 to 44 Years | 7,020 (81.0%) | 1,642 (19.0%) |
| 45 to 54 Years | 6,221 (81.0%) | 1,460 (19.0%) |
| 55 to 64 Years | 5,967 (91.1%) | 586 (8.9%) |
| 65 to 74 Years | 4,000 (99.3%) | 29 (0.7%) |
| 75 Years and older | 2,301 (99.8%) | 4 (0.2%) |
| Total | 51,681 (85.8%) | 8,574 (14.2%) |
Health Insurance Coverage by Citizenship Status in Euless
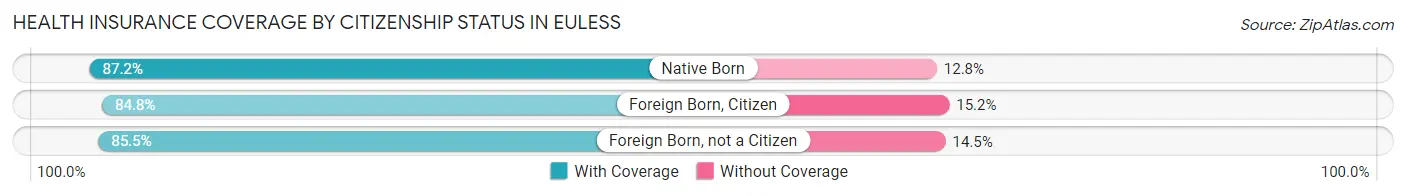
| Citizenship Status | With Coverage | Without Coverage |
| Native Born | 4,160 (87.2%) | 610 (12.8%) |
| Foreign Born, Citizen | 8,737 (84.8%) | 1,571 (15.2%) |
| Foreign Born, not a Citizen | 5,123 (85.5%) | 869 (14.5%) |
Health Insurance Coverage by Household Income in Euless
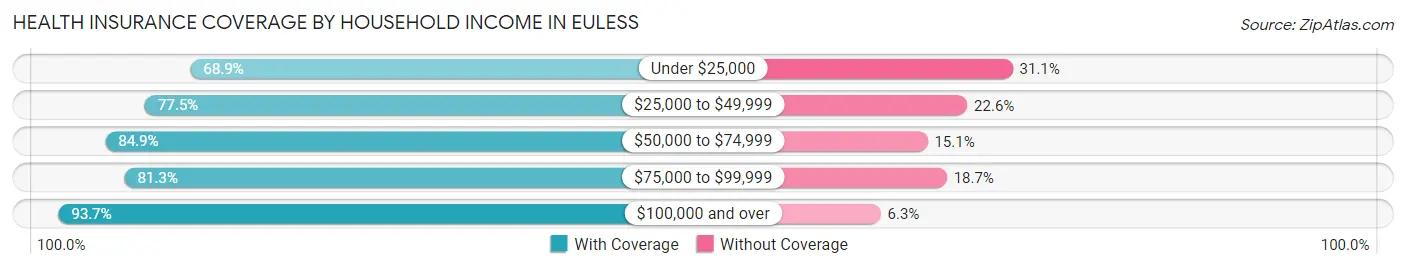
| Household Income | With Coverage | Without Coverage |
| Under $25,000 | 2,773 (68.9%) | 1,250 (31.1%) |
| $25,000 to $49,999 | 7,052 (77.4%) | 2,053 (22.6%) |
| $50,000 to $74,999 | 9,035 (84.9%) | 1,610 (15.1%) |
| $75,000 to $99,999 | 8,819 (81.3%) | 2,031 (18.7%) |
| $100,000 and over | 23,976 (93.7%) | 1,621 (6.3%) |
Public vs Private Health Insurance Coverage by Age in Euless
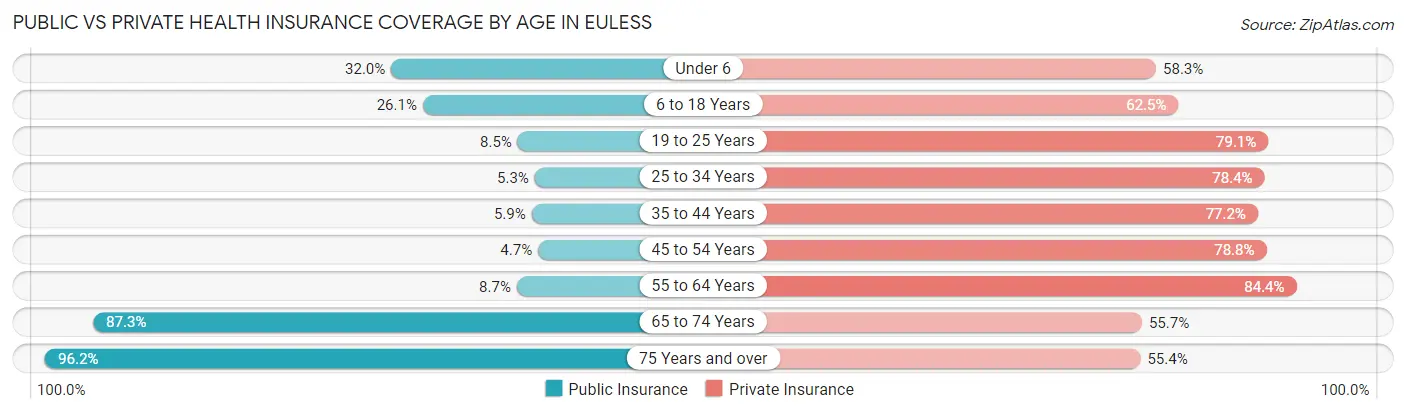
| Age Bracket | Public Insurance | Private Insurance |
| Under 6 | 1,525 (32.0%) | 2,783 (58.3%) |
| 6 to 18 Years | 2,690 (26.1%) | 6,438 (62.5%) |
| 19 to 25 Years | 508 (8.5%) | 4,741 (79.1%) |
| 25 to 34 Years | 530 (5.3%) | 7,809 (78.4%) |
| 35 to 44 Years | 511 (5.9%) | 6,686 (77.2%) |
| 45 to 54 Years | 362 (4.7%) | 6,052 (78.8%) |
| 55 to 64 Years | 567 (8.6%) | 5,529 (84.4%) |
| 65 to 74 Years | 3,517 (87.3%) | 2,245 (55.7%) |
| 75 Years and over | 2,217 (96.2%) | 1,278 (55.4%) |
| Total | 12,427 (20.6%) | 43,561 (72.3%) |
Disability Status by Sex by Age in Euless
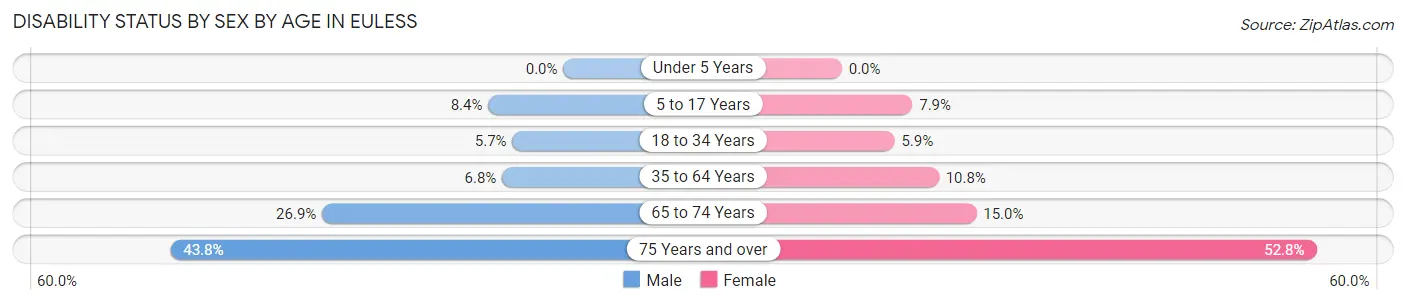
| Age Bracket | Male | Female |
| Under 5 Years | 0 (0.0%) | 0 (0.0%) |
| 5 to 17 Years | 470 (8.4%) | 393 (7.9%) |
| 18 to 34 Years | 494 (5.7%) | 461 (5.9%) |
| 35 to 64 Years | 791 (6.8%) | 1,218 (10.8%) |
| 65 to 74 Years | 451 (26.9%) | 352 (15.0%) |
| 75 Years and over | 478 (43.8%) | 641 (52.8%) |
Disability Class by Sex by Age in Euless
Disability Class: Hearing Difficulty
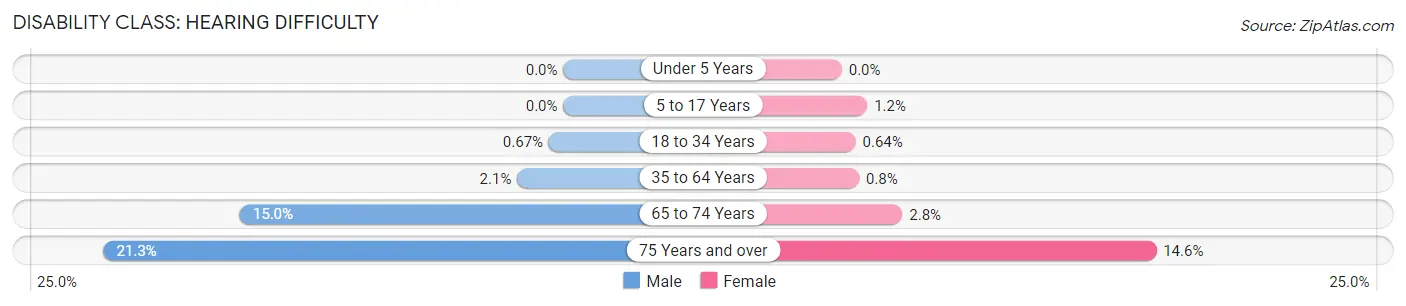
| Age Bracket | Male | Female |
| Under 5 Years | 0 (0.0%) | 0 (0.0%) |
| 5 to 17 Years | 0 (0.0%) | 59 (1.2%) |
| 18 to 34 Years | 58 (0.7%) | 50 (0.6%) |
| 35 to 64 Years | 248 (2.1%) | 90 (0.8%) |
| 65 to 74 Years | 252 (15.0%) | 66 (2.8%) |
| 75 Years and over | 233 (21.3%) | 177 (14.6%) |
Disability Class: Vision Difficulty
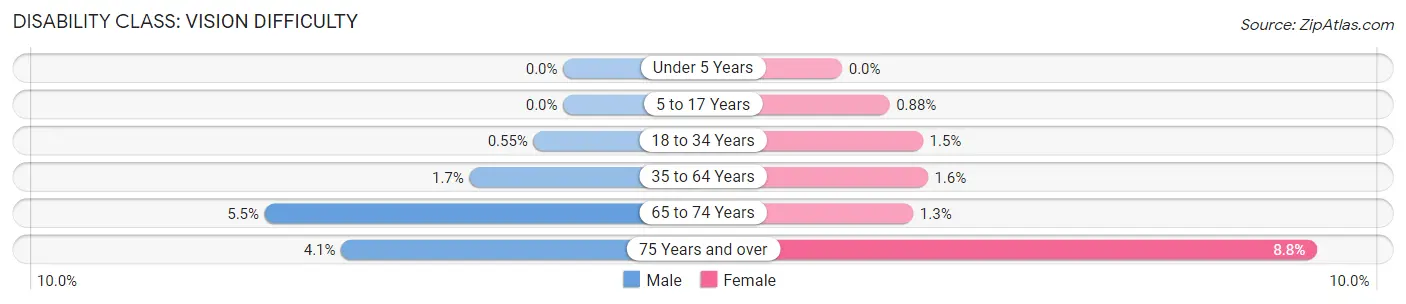
| Age Bracket | Male | Female |
| Under 5 Years | 0 (0.0%) | 0 (0.0%) |
| 5 to 17 Years | 0 (0.0%) | 44 (0.9%) |
| 18 to 34 Years | 48 (0.5%) | 118 (1.5%) |
| 35 to 64 Years | 202 (1.7%) | 180 (1.6%) |
| 65 to 74 Years | 93 (5.5%) | 31 (1.3%) |
| 75 Years and over | 45 (4.1%) | 107 (8.8%) |
Disability Class: Cognitive Difficulty
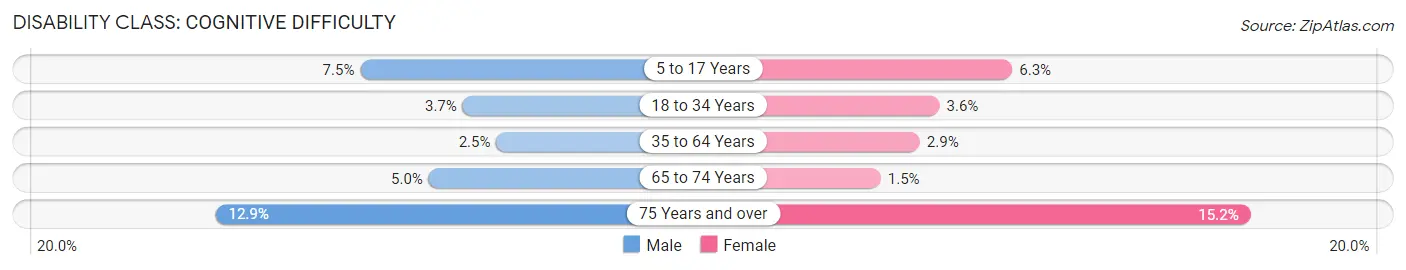
| Age Bracket | Male | Female |
| 5 to 17 Years | 424 (7.5%) | 317 (6.3%) |
| 18 to 34 Years | 326 (3.7%) | 285 (3.6%) |
| 35 to 64 Years | 289 (2.5%) | 327 (2.9%) |
| 65 to 74 Years | 84 (5.0%) | 34 (1.5%) |
| 75 Years and over | 141 (12.9%) | 184 (15.2%) |
Disability Class: Ambulatory Difficulty
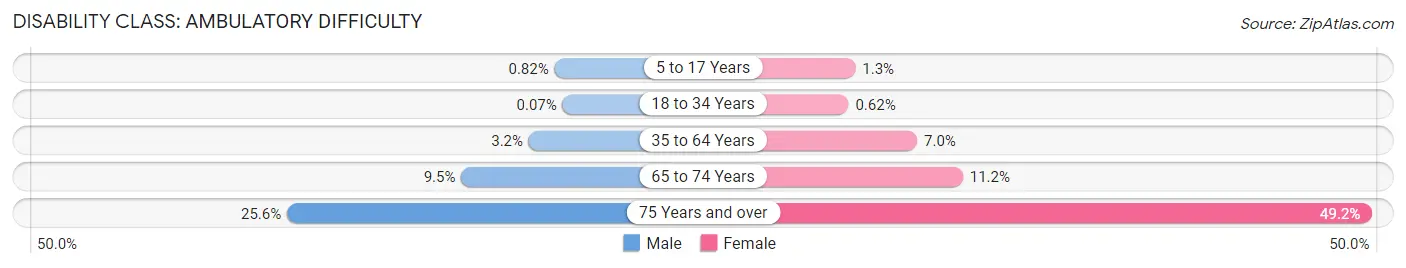
| Age Bracket | Male | Female |
| 5 to 17 Years | 46 (0.8%) | 63 (1.3%) |
| 18 to 34 Years | 6 (0.1%) | 49 (0.6%) |
| 35 to 64 Years | 371 (3.2%) | 789 (7.0%) |
| 65 to 74 Years | 159 (9.5%) | 264 (11.2%) |
| 75 Years and over | 280 (25.6%) | 597 (49.2%) |
Disability Class: Self-Care Difficulty
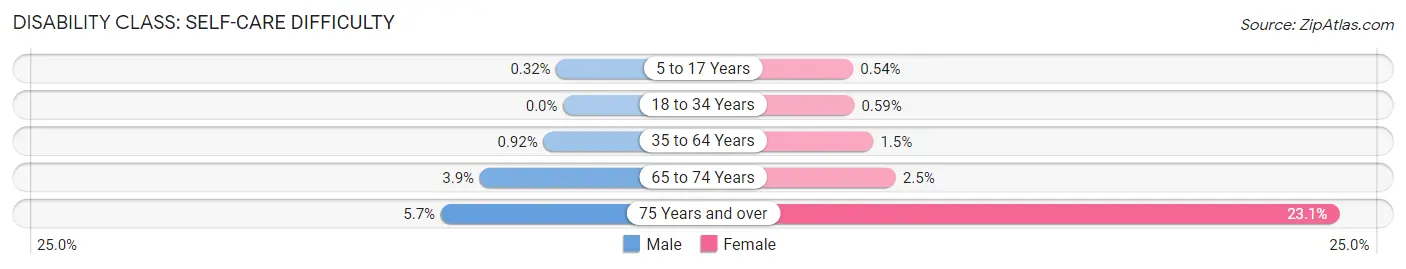
| Age Bracket | Male | Female |
| 5 to 17 Years | 18 (0.3%) | 27 (0.5%) |
| 18 to 34 Years | 0 (0.0%) | 46 (0.6%) |
| 35 to 64 Years | 107 (0.9%) | 166 (1.5%) |
| 65 to 74 Years | 65 (3.9%) | 59 (2.5%) |
| 75 Years and over | 62 (5.7%) | 280 (23.1%) |
Technology Access in Euless
Computing Device Access in Euless
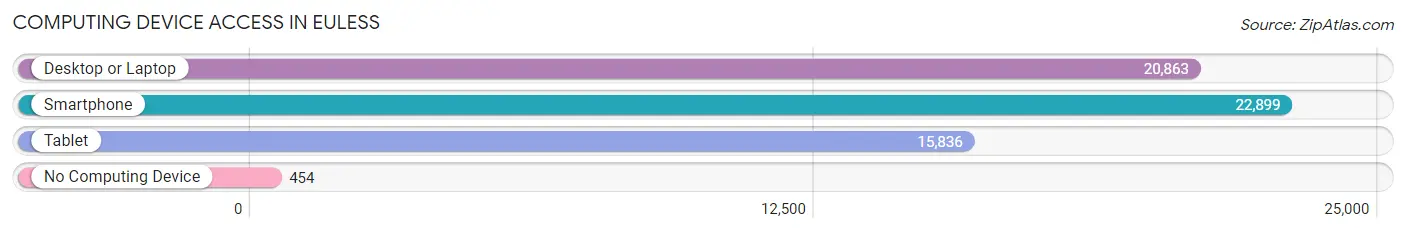
| Device Type | # Households | % Households |
| Desktop or Laptop | 20,863 | 86.9% |
| Smartphone | 22,899 | 95.4% |
| Tablet | 15,836 | 66.0% |
| No Computing Device | 454 | 1.9% |
| Total | 24,005 | 100.0% |
Internet Access in Euless
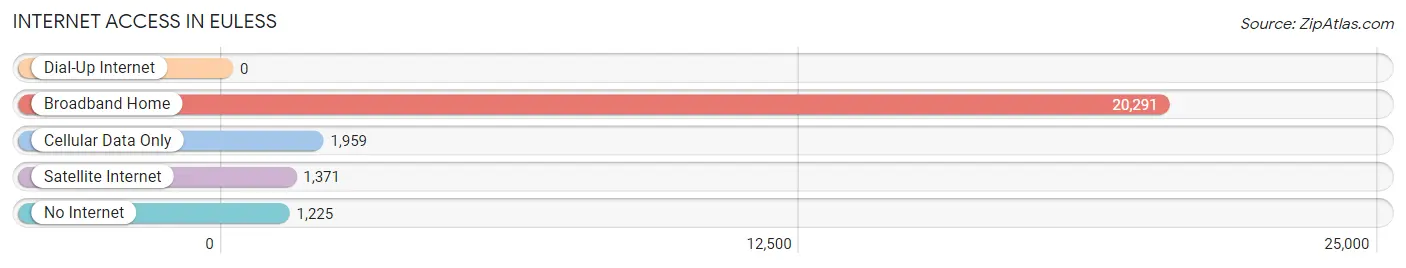
| Internet Type | # Households | % Households |
| Dial-Up Internet | 0 | 0.0% |
| Broadband Home | 20,291 | 84.5% |
| Cellular Data Only | 1,959 | 8.2% |
| Satellite Internet | 1,371 | 5.7% |
| No Internet | 1,225 | 5.1% |
| Total | 24,005 | 100.0% |
Euless Summary
Euless, Texas is a city located in Tarrant County, Texas, United States. It is part of the Dallas-Fort Worth-Arlington metropolitan area. The city is located in the heart of the Dallas-Fort Worth Metroplex, and is bordered by Hurst, Bedford, Colleyville, and Grapevine. The city has a population of 51,277 as of the 2010 census.
Geography
Euless is located at 32°51'25" North, 97°6'45" West (32.856944, -97.112500). According to the United States Census Bureau, the city has a total area of 11.2 square miles (29.0 km2), of which 11.1 square miles (28.7 km2) is land and 0.1 square miles (0.3 km2) is water.
History
Euless was founded in 1879 by William Euless, a farmer from Tennessee. The city was originally known as Eules, but the name was changed to Euless in 1892. The city was incorporated in 1952.
Economy
Euless is home to many businesses, including American Airlines, Bell Helicopter, and Lockheed Martin. The city is also home to several large retail stores, including Walmart, Target, and Home Depot.
Demographics
As of the 2010 census, there were 51,277 people, 19,945 households, and 13,845 families residing in the city. The population density was 4,619.3 people per square mile (1,785.2/km2). There were 21,072 housing units at an average density of 1,892.3 per square mile (730.2/km2). The racial makeup of the city was 68.2% White, 8.3% African American, 0.6% Native American, 8.3% Asian, 0.1% Pacific Islander, 11.7% from other races, and 3.8% from two or more races. Hispanic or Latino of any race were 28.2% of the population.
There were 19,945 households, out of which 37.2% had children under the age of 18 living with them, 51.2% were married couples living together, 13.3% had a female householder with no husband present, and 30.2% were non-families. 24.2% of all households were made up of individuals, and 6.2% had someone living alone who was 65 years of age or older. The average household size was 2.58 and the average family size was 3.09.
In the city, the population was spread out, with 26.7% under the age of 18, 8.7% from 18 to 24, 33.2% from 25 to 44, 21.7% from 45 to 64, and 9.7% who were 65 years of age or older. The median age was 34 years. For every 100 females, there were 94.2 males. For every 100 females age 18 and over, there were 90.7 males.
The median income for a household in the city was $50,945, and the median income for a family was $58,945. Males had a median income of $41,945 versus $30,945 for females. The per capita income for the city was $23,945. About 6.2% of families and 8.2% of the population were below the poverty line, including 10.2% of those under age 18 and 6.2% of those age 65 or over.
Common Questions
What is Per Capita Income in Euless?
Per Capita income in Euless is $39,240.
What is the Median Family Income in Euless?
Median Family Income in Euless is $85,999.
What is the Median Household income in Euless?
Median Household Income in Euless is $77,403.
What is Income or Wage Gap in Euless?
Income or Wage Gap in Euless is 5.1%.
Women in Euless earn 94.9 cents for every dollar earned by a man.
What is Family Income Deficit in Euless?
Family Income Deficit in Euless is $10,329.
Families that are below poverty line in Euless earn $10,329 less on average than the poverty threshold level.
What is Inequality or Gini Index in Euless?
Inequality or Gini Index in Euless is 0.39.
What is the Total Population of Euless?
Total Population of Euless is 60,360.
What is the Total Male Population of Euless?
Total Male Population of Euless is 30,483.
What is the Total Female Population of Euless?
Total Female Population of Euless is 29,877.
What is the Ratio of Males per 100 Females in Euless?
There are 102.03 Males per 100 Females in Euless.
What is the Ratio of Females per 100 Males in Euless?
There are 98.01 Females per 100 Males in Euless.
What is the Median Population Age in Euless?
Median Population Age in Euless is 34.3 Years.
What is the Average Family Size in Euless
Average Family Size in Euless is 3.3 People.
What is the Average Household Size in Euless
Average Household Size in Euless is 2.5 People.
How Large is the Labor Force in Euless?
There are 36,003 People in the Labor Forcein in Euless.
What is the Percentage of People in the Labor Force in Euless?
76.0% of People are in the Labor Force in Euless.
What is the Unemployment Rate in Euless?
Unemployment Rate in Euless is 4.7%.