Kalamazoo, MI Map & Demographics
Kalamazoo Map
Kalamazoo Overview
$27,191
PER CAPITA INCOME
$61,336
AVG FAMILY INCOME
$48,649
AVG HOUSEHOLD INCOME
30.2%
WAGE / INCOME GAP [ % ]
69.8¢/ $1
WAGE / INCOME GAP [ $ ]
$10,938
FAMILY INCOME DEFICIT
0.48
INEQUALITY / GINI INDEX
73,342
TOTAL POPULATION
36,162
MALE POPULATION
37,180
FEMALE POPULATION
97.26
MALES / 100 FEMALES
102.82
FEMALES / 100 MALES
25.9
MEDIAN AGE
3.0
AVG FAMILY SIZE
2.3
AVG HOUSEHOLD SIZE
40,306
LABOR FORCE [ PEOPLE ]
65.9%
PERCENT IN LABOR FORCE
8.1%
UNEMPLOYMENT RATE
Kalamazoo Area Codes
Income in Kalamazoo
Income Overview in Kalamazoo
Per Capita Income in Kalamazoo is $27,191, while median incomes of families and households are $61,336 and $48,649 respectively.
| Characteristic | Number | Measure |
| Per Capita Income | 73,342 | $27,191 |
| Median Family Income | 12,946 | $61,336 |
| Mean Family Income | 12,946 | $86,883 |
| Median Household Income | 29,111 | $48,649 |
| Mean Household Income | 29,111 | $67,308 |
| Income Deficit | 12,946 | $10,938 |
| Wage / Income Gap (%) | 73,342 | 30.22% |
| Wage / Income Gap ($) | 73,342 | 69.78¢ per $1 |
| Gini / Inequality Index | 73,342 | 0.48 |
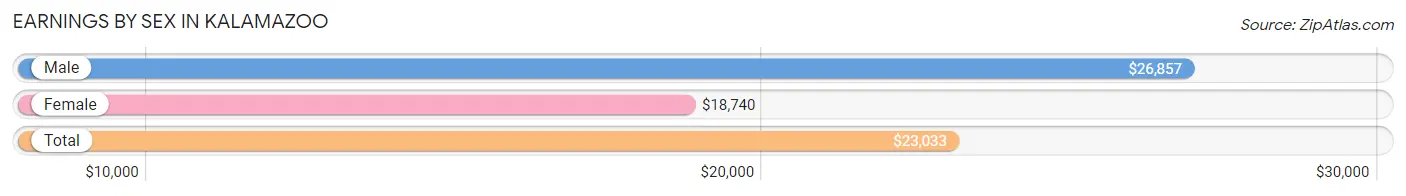
Earnings by Sex in Kalamazoo
Average Earnings in Kalamazoo are $23,033, $26,857 for men and $18,740 for women, a difference of 30.2%.
| Sex | Number | Average Earnings |
| Male | 21,939 (49.8%) | $26,857 |
| Female | 22,084 (50.2%) | $18,740 |
| Total | 44,023 (100.0%) | $23,033 |
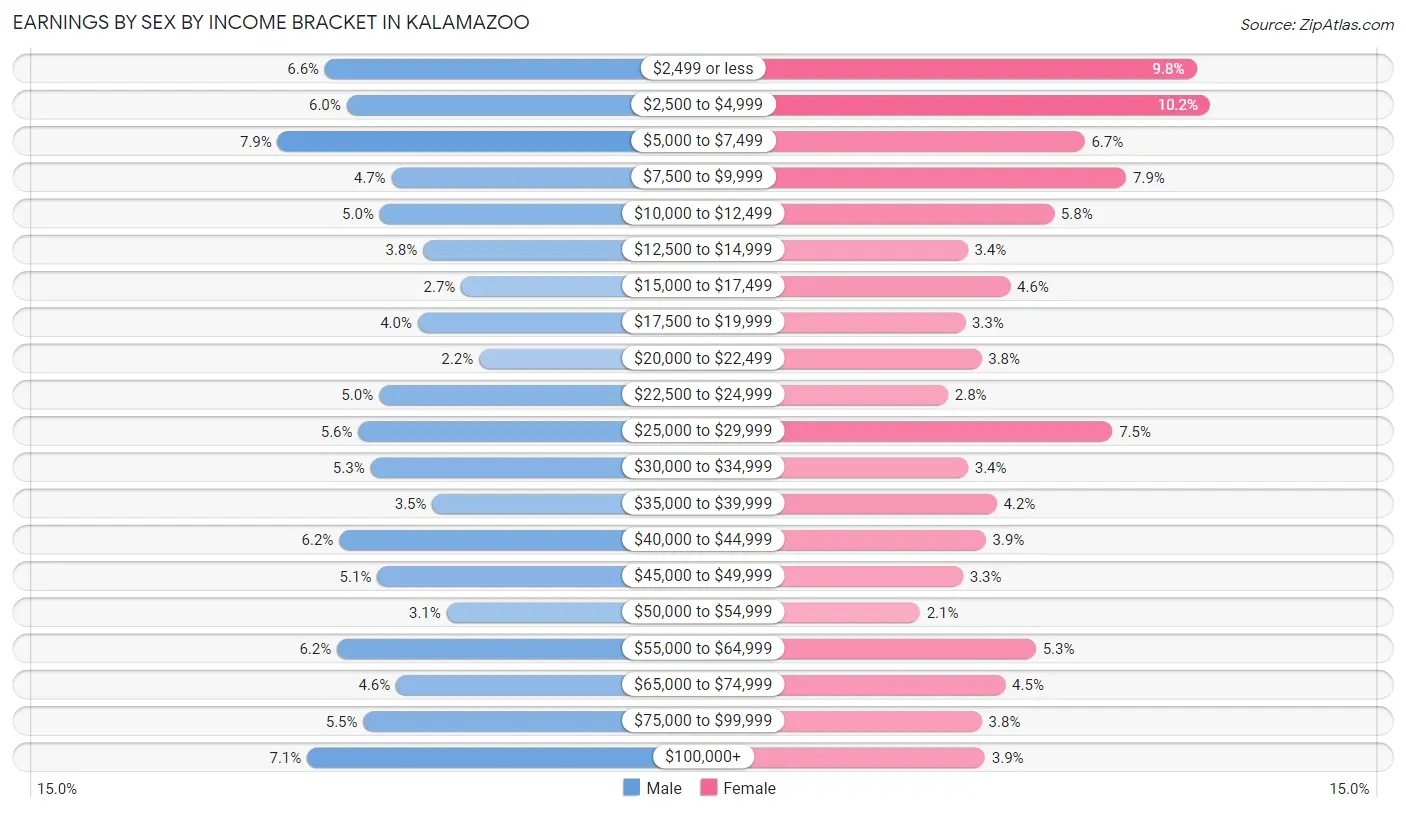
Earnings by Sex by Income Bracket in Kalamazoo
The most common earnings brackets in Kalamazoo are $5,000 to $7,499 for men (1,732 | 7.9%) and $2,500 to $4,999 for women (2,252 | 10.2%).
| Income | Male | Female |
| $2,499 or less | 1,439 (6.6%) | 2,168 (9.8%) |
| $2,500 to $4,999 | 1,306 (5.9%) | 2,252 (10.2%) |
| $5,000 to $7,499 | 1,732 (7.9%) | 1,476 (6.7%) |
| $7,500 to $9,999 | 1,029 (4.7%) | 1,733 (7.9%) |
| $10,000 to $12,499 | 1,101 (5.0%) | 1,286 (5.8%) |
| $12,500 to $14,999 | 834 (3.8%) | 749 (3.4%) |
| $15,000 to $17,499 | 598 (2.7%) | 1,014 (4.6%) |
| $17,500 to $19,999 | 866 (4.0%) | 734 (3.3%) |
| $20,000 to $22,499 | 490 (2.2%) | 835 (3.8%) |
| $22,500 to $24,999 | 1,105 (5.0%) | 627 (2.8%) |
| $25,000 to $29,999 | 1,233 (5.6%) | 1,648 (7.5%) |
| $30,000 to $34,999 | 1,158 (5.3%) | 751 (3.4%) |
| $35,000 to $39,999 | 776 (3.5%) | 930 (4.2%) |
| $40,000 to $44,999 | 1,352 (6.2%) | 862 (3.9%) |
| $45,000 to $49,999 | 1,117 (5.1%) | 720 (3.3%) |
| $50,000 to $54,999 | 688 (3.1%) | 453 (2.1%) |
| $55,000 to $64,999 | 1,364 (6.2%) | 1,172 (5.3%) |
| $65,000 to $74,999 | 1,000 (4.6%) | 982 (4.4%) |
| $75,000 to $99,999 | 1,203 (5.5%) | 836 (3.8%) |
| $100,000+ | 1,548 (7.1%) | 856 (3.9%) |
| Total | 21,939 (100.0%) | 22,084 (100.0%) |
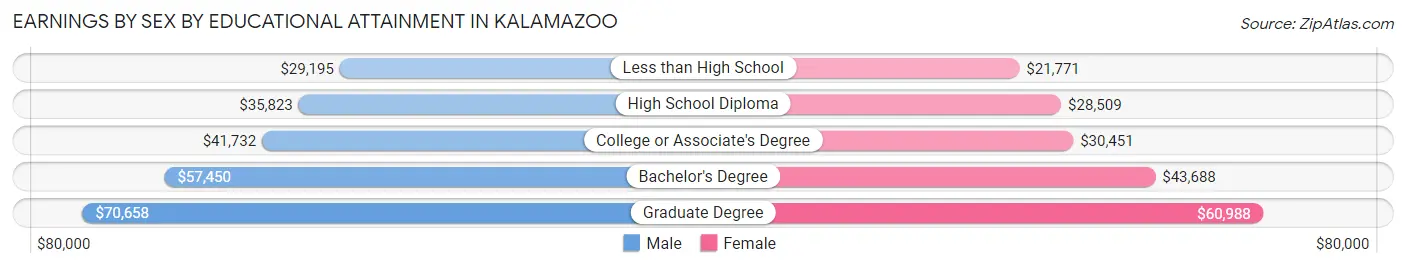
Earnings by Sex by Educational Attainment in Kalamazoo
Average earnings in Kalamazoo are $44,757 for men and $36,190 for women, a difference of 19.1%. Men with an educational attainment of graduate degree enjoy the highest average annual earnings of $70,658, while those with less than high school education earn the least with $29,195. Women with an educational attainment of graduate degree earn the most with the average annual earnings of $60,988, while those with less than high school education have the smallest earnings of $21,771.
| Educational Attainment | Male Income | Female Income |
| Less than High School | $29,195 | $21,771 |
| High School Diploma | $35,823 | $28,509 |
| College or Associate's Degree | $41,732 | $30,451 |
| Bachelor's Degree | $57,450 | $43,688 |
| Graduate Degree | $70,658 | $60,988 |
| Total | $44,757 | $36,190 |
Family Income in Kalamazoo
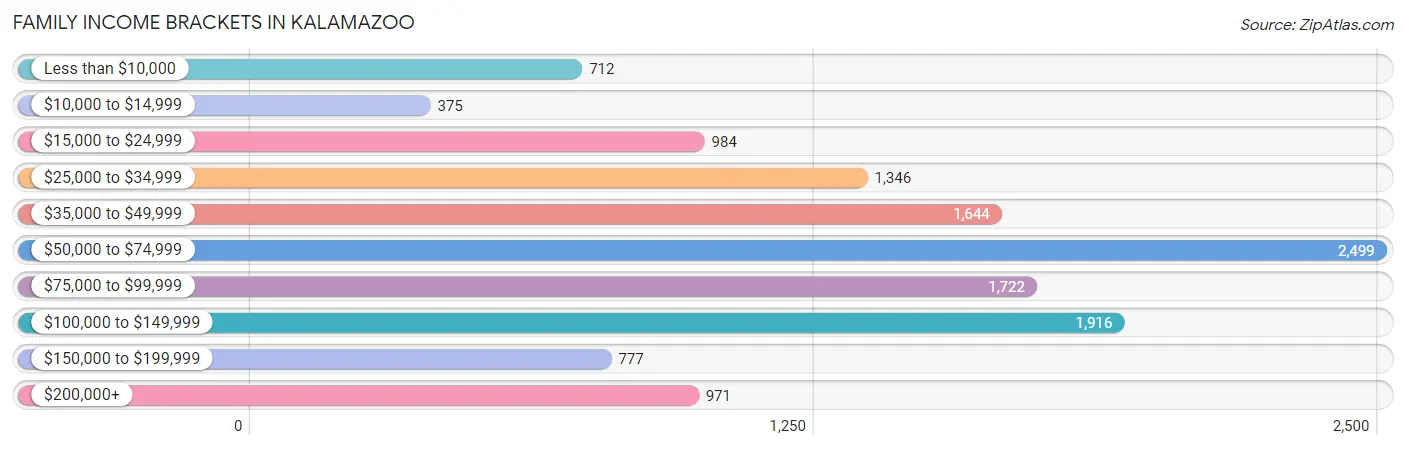
Family Income Brackets in Kalamazoo
According to the Kalamazoo family income data, there are 2,499 families falling into the $50,000 to $74,999 income range, which is the most common income bracket and makes up 19.3% of all families. Conversely, the $10,000 to $14,999 income bracket is the least frequent group with only 375 families (2.9%) belonging to this category.
| Income Bracket | # Families | % Families |
| Less than $10,000 | 712 | 5.5% |
| $10,000 to $14,999 | 375 | 2.9% |
| $15,000 to $24,999 | 984 | 7.6% |
| $25,000 to $34,999 | 1,346 | 10.4% |
| $35,000 to $49,999 | 1,644 | 12.7% |
| $50,000 to $74,999 | 2,499 | 19.3% |
| $75,000 to $99,999 | 1,722 | 13.3% |
| $100,000 to $149,999 | 1,916 | 14.8% |
| $150,000 to $199,999 | 777 | 6.0% |
| $200,000+ | 971 | 7.5% |
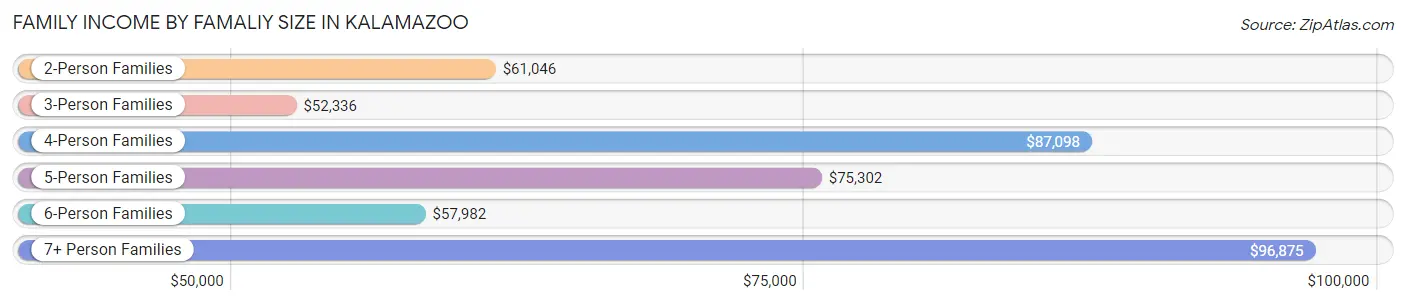
Family Income by Famaliy Size in Kalamazoo
7+ person families (296 | 2.3%) account for the highest median family income in Kalamazoo with $96,875 per family, while 2-person families (6,642 | 51.3%) have the highest median income of $30,523 per family member.
| Income Bracket | # Families | Median Income |
| 2-Person Families | 6,642 (51.3%) | $61,046 |
| 3-Person Families | 2,945 (22.8%) | $52,336 |
| 4-Person Families | 1,646 (12.7%) | $87,098 |
| 5-Person Families | 1,053 (8.1%) | $75,302 |
| 6-Person Families | 364 (2.8%) | $57,982 |
| 7+ Person Families | 296 (2.3%) | $96,875 |
| Total | 12,946 (100.0%) | $61,336 |
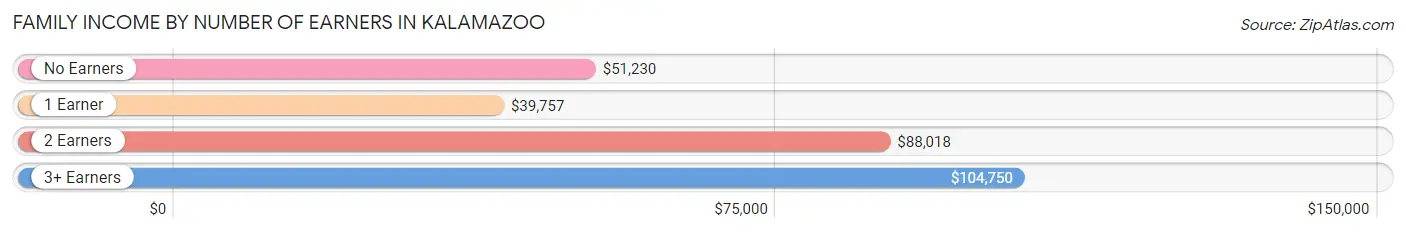
Family Income by Number of Earners in Kalamazoo
The median family income in Kalamazoo is $61,336, with families comprising 3+ earners (1,072) having the highest median family income of $104,750, while families with 1 earner (4,779) have the lowest median family income of $39,757, accounting for 8.3% and 36.9% of families, respectively.
| Number of Earners | # Families | Median Income |
| No Earners | 1,778 (13.7%) | $51,230 |
| 1 Earner | 4,779 (36.9%) | $39,757 |
| 2 Earners | 5,317 (41.1%) | $88,018 |
| 3+ Earners | 1,072 (8.3%) | $104,750 |
| Total | 12,946 (100.0%) | $61,336 |
Household Income in Kalamazoo
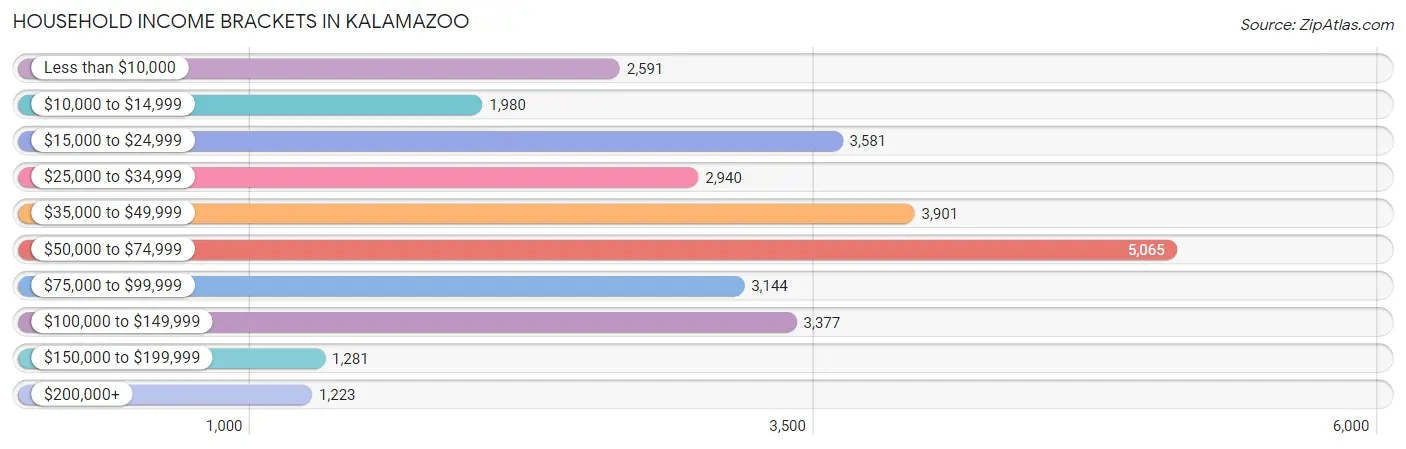
Household Income Brackets in Kalamazoo
With 5,065 households falling in the category, the $50,000 to $74,999 income range is the most frequent in Kalamazoo, accounting for 17.4% of all households. In contrast, only 1,223 households (4.2%) fall into the $200,000+ income bracket, making it the least populous group.
| Income Bracket | # Households | % Households |
| Less than $10,000 | 2,591 | 8.9% |
| $10,000 to $14,999 | 1,980 | 6.8% |
| $15,000 to $24,999 | 3,581 | 12.3% |
| $25,000 to $34,999 | 2,940 | 10.1% |
| $35,000 to $49,999 | 3,901 | 13.4% |
| $50,000 to $74,999 | 5,065 | 17.4% |
| $75,000 to $99,999 | 3,144 | 10.8% |
| $100,000 to $149,999 | 3,377 | 11.6% |
| $150,000 to $199,999 | 1,281 | 4.4% |
| $200,000+ | 1,223 | 4.2% |
Household Income by Householder Age in Kalamazoo
The median household income in Kalamazoo is $48,649, with the highest median household income of $57,693 found in the 25 to 44 years age bracket for the primary householder. A total of 9,996 households (34.3%) fall into this category. Meanwhile, the 15 to 24 years age bracket for the primary householder has the lowest median household income of $24,754, with 6,344 households (21.8%) in this group.
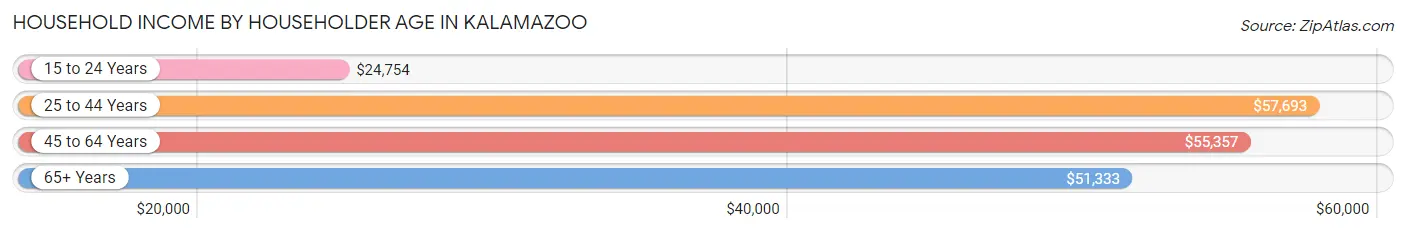
| Income Bracket | # Households | Median Income |
| 15 to 24 Years | 6,344 (21.8%) | $24,754 |
| 25 to 44 Years | 9,996 (34.3%) | $57,693 |
| 45 to 64 Years | 7,560 (26.0%) | $55,357 |
| 65+ Years | 5,211 (17.9%) | $51,333 |
| Total | 29,111 (100.0%) | $48,649 |
Poverty in Kalamazoo
Income Below Poverty by Sex and Age in Kalamazoo
With 25.2% poverty level for males and 28.4% for females among the residents of Kalamazoo, 5 year old males and 18 to 24 year old females are the most vulnerable to poverty, with 187 males (44.8%) and 4,536 females (54.7%) in their respective age groups living below the poverty level.
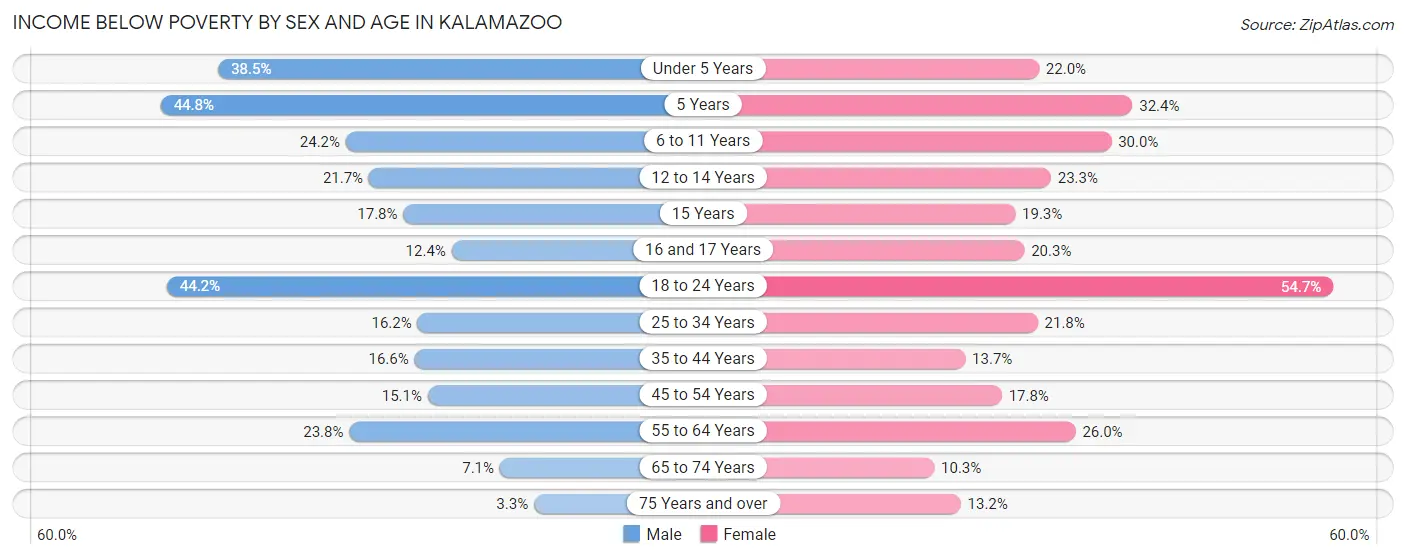
| Age Bracket | Male | Female |
| Under 5 Years | 805 (38.5%) | 381 (22.0%) |
| 5 Years | 187 (44.8%) | 175 (32.4%) |
| 6 to 11 Years | 541 (24.2%) | 582 (30.0%) |
| 12 to 14 Years | 218 (21.6%) | 302 (23.3%) |
| 15 Years | 54 (17.8%) | 44 (19.3%) |
| 16 and 17 Years | 107 (12.4%) | 154 (20.3%) |
| 18 to 24 Years | 3,620 (44.2%) | 4,536 (54.7%) |
| 25 to 34 Years | 844 (16.2%) | 1,160 (21.8%) |
| 35 to 44 Years | 610 (16.6%) | 484 (13.7%) |
| 45 to 54 Years | 480 (15.1%) | 509 (17.8%) |
| 55 to 64 Years | 703 (23.8%) | 812 (26.0%) |
| 65 to 74 Years | 132 (7.1%) | 267 (10.3%) |
| 75 Years and over | 36 (3.3%) | 230 (13.2%) |
| Total | 8,337 (25.2%) | 9,636 (28.4%) |
Income Above Poverty by Sex and Age in Kalamazoo
According to the poverty statistics in Kalamazoo, males aged 75 years and over and females aged 65 to 74 years are the age groups that are most secure financially, with 96.7% of males and 89.7% of females in these age groups living above the poverty line.
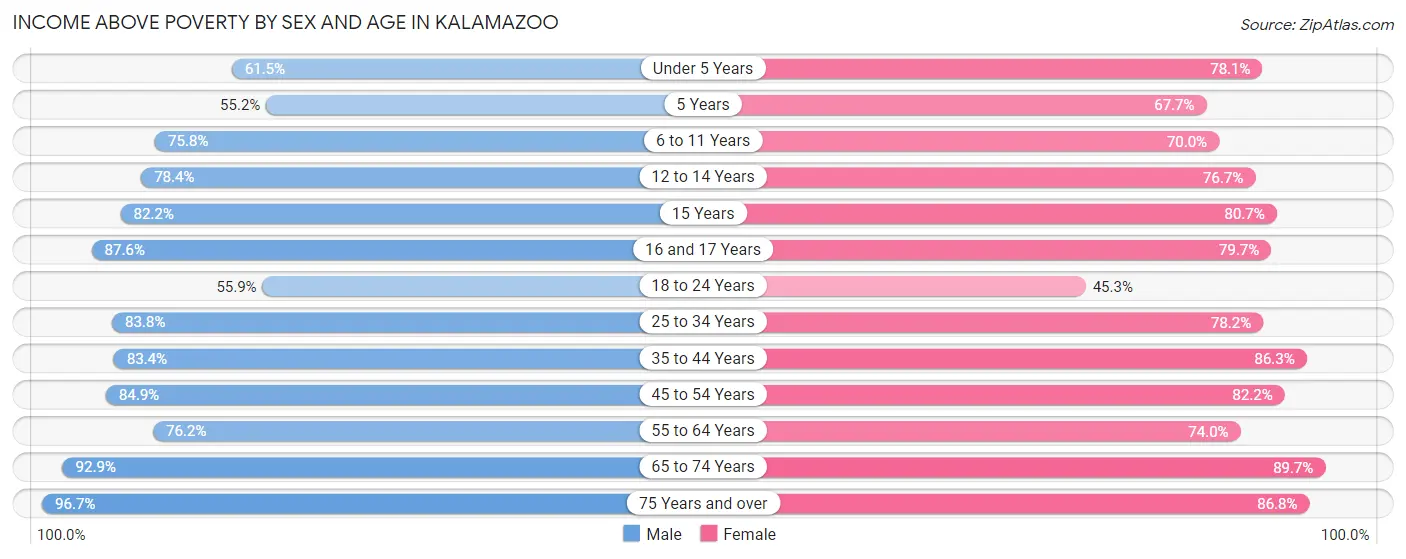
| Age Bracket | Male | Female |
| Under 5 Years | 1,288 (61.5%) | 1,355 (78.0%) |
| 5 Years | 230 (55.2%) | 366 (67.6%) |
| 6 to 11 Years | 1,693 (75.8%) | 1,358 (70.0%) |
| 12 to 14 Years | 789 (78.3%) | 995 (76.7%) |
| 15 Years | 249 (82.2%) | 184 (80.7%) |
| 16 and 17 Years | 753 (87.6%) | 604 (79.7%) |
| 18 to 24 Years | 4,580 (55.8%) | 3,753 (45.3%) |
| 25 to 34 Years | 4,354 (83.8%) | 4,159 (78.2%) |
| 35 to 44 Years | 3,071 (83.4%) | 3,038 (86.3%) |
| 45 to 54 Years | 2,699 (84.9%) | 2,349 (82.2%) |
| 55 to 64 Years | 2,246 (76.2%) | 2,309 (74.0%) |
| 65 to 74 Years | 1,736 (92.9%) | 2,330 (89.7%) |
| 75 Years and over | 1,065 (96.7%) | 1,509 (86.8%) |
| Total | 24,753 (74.8%) | 24,309 (71.6%) |
Income Below Poverty Among Married-Couple Families in Kalamazoo
The poverty statistics for married-couple families in Kalamazoo show that 8.5% or 690 of the total 8,131 families live below the poverty line. Families with 3 or 4 children have the highest poverty rate of 19.5%, comprising of 140 families. On the other hand, families with 5 or more children have the lowest poverty rate of 1.0%, which includes 1 families.
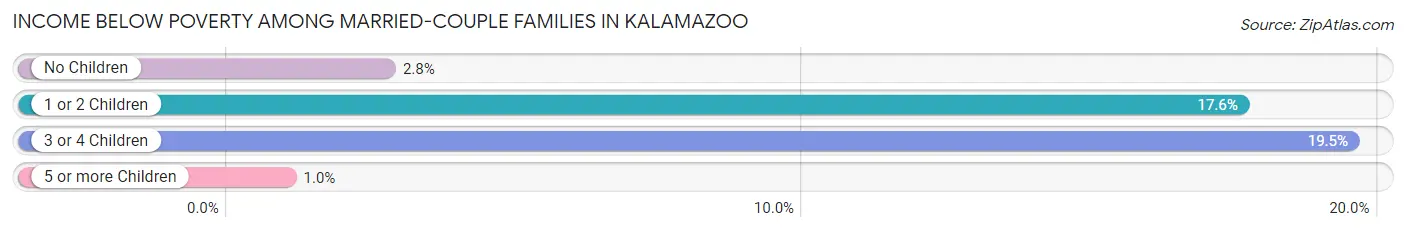
| Children | Above Poverty | Below Poverty |
| No Children | 4,839 (97.3%) | 137 (2.8%) |
| 1 or 2 Children | 1,928 (82.4%) | 412 (17.6%) |
| 3 or 4 Children | 577 (80.5%) | 140 (19.5%) |
| 5 or more Children | 97 (99.0%) | 1 (1.0%) |
| Total | 7,441 (91.5%) | 690 (8.5%) |
Income Below Poverty Among Single-Parent Households in Kalamazoo
According to the poverty data in Kalamazoo, 14.7% or 207 single-father households and 31.0% or 1,059 single-mother households are living below the poverty line. Among single-father households, those with 1 or 2 children have the highest poverty rate, with 145 households (22.8%) experiencing poverty. Likewise, among single-mother households, those with 5 or more children have the highest poverty rate, with 102 households (100.0%) falling below the poverty line.
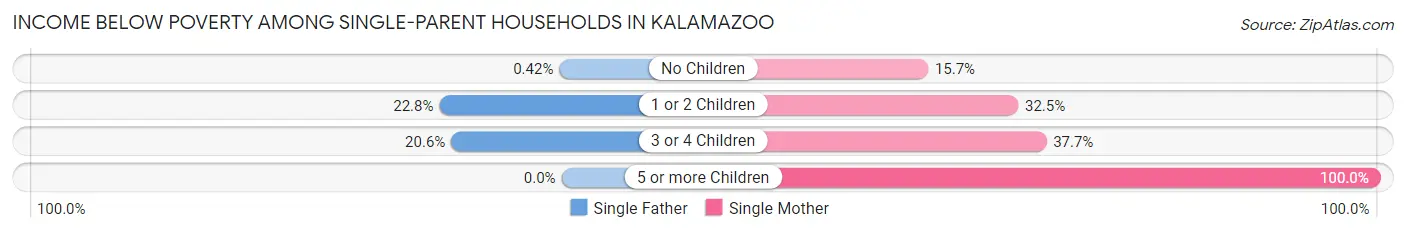
| Children | Single Father | Single Mother |
| No Children | 2 (0.4%) | 130 (15.7%) |
| 1 or 2 Children | 145 (22.8%) | 675 (32.5%) |
| 3 or 4 Children | 60 (20.5%) | 152 (37.7%) |
| 5 or more Children | 0 (0.0%) | 102 (100.0%) |
| Total | 207 (14.7%) | 1,059 (31.0%) |
Income Below Poverty Among Married-Couple vs Single-Parent Households in Kalamazoo
The poverty data for Kalamazoo shows that 690 of the married-couple family households (8.5%) and 1,266 of the single-parent households (26.3%) are living below the poverty level. Within the married-couple family households, those with 3 or 4 children have the highest poverty rate, with 140 households (19.5%) falling below the poverty line. Among the single-parent households, those with 5 or more children have the highest poverty rate, with 102 household (100.0%) living below poverty.
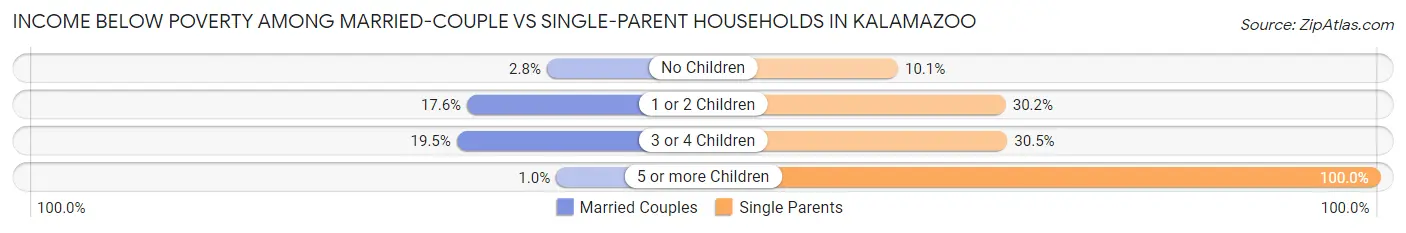
| Children | Married-Couple Families | Single-Parent Households |
| No Children | 137 (2.8%) | 132 (10.1%) |
| 1 or 2 Children | 412 (17.6%) | 820 (30.2%) |
| 3 or 4 Children | 140 (19.5%) | 212 (30.5%) |
| 5 or more Children | 1 (1.0%) | 102 (100.0%) |
| Total | 690 (8.5%) | 1,266 (26.3%) |
Race in Kalamazoo
The most populous races in Kalamazoo are White / Caucasian (47,519 | 64.8%), Black / African American (16,232 | 22.1%), and Two or more Races (6,038 | 8.2%).
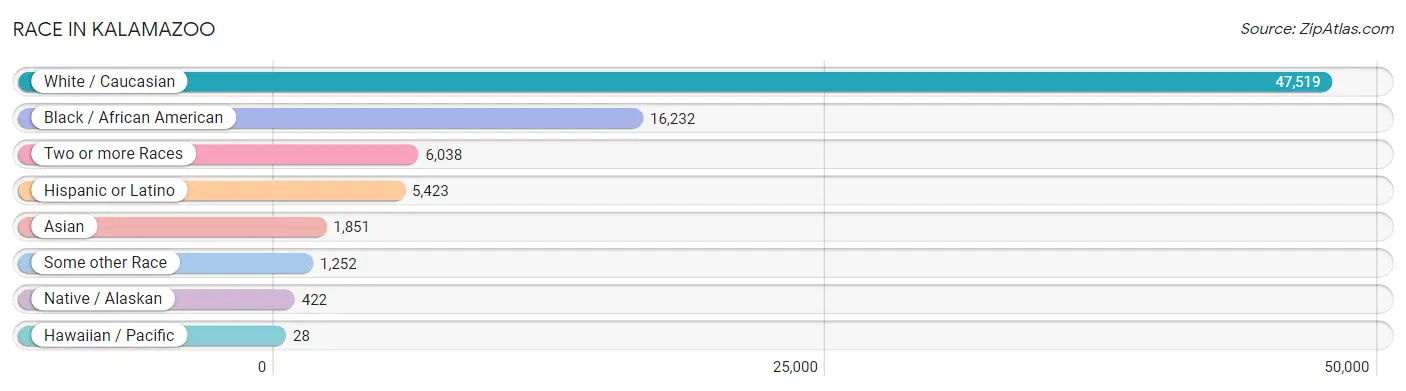
| Race | # Population | % Population |
| Asian | 1,851 | 2.5% |
| Black / African American | 16,232 | 22.1% |
| Hawaiian / Pacific | 28 | 0.0% |
| Hispanic or Latino | 5,423 | 7.4% |
| Native / Alaskan | 422 | 0.6% |
| White / Caucasian | 47,519 | 64.8% |
| Two or more Races | 6,038 | 8.2% |
| Some other Race | 1,252 | 1.7% |
| Total | 73,342 | 100.0% |
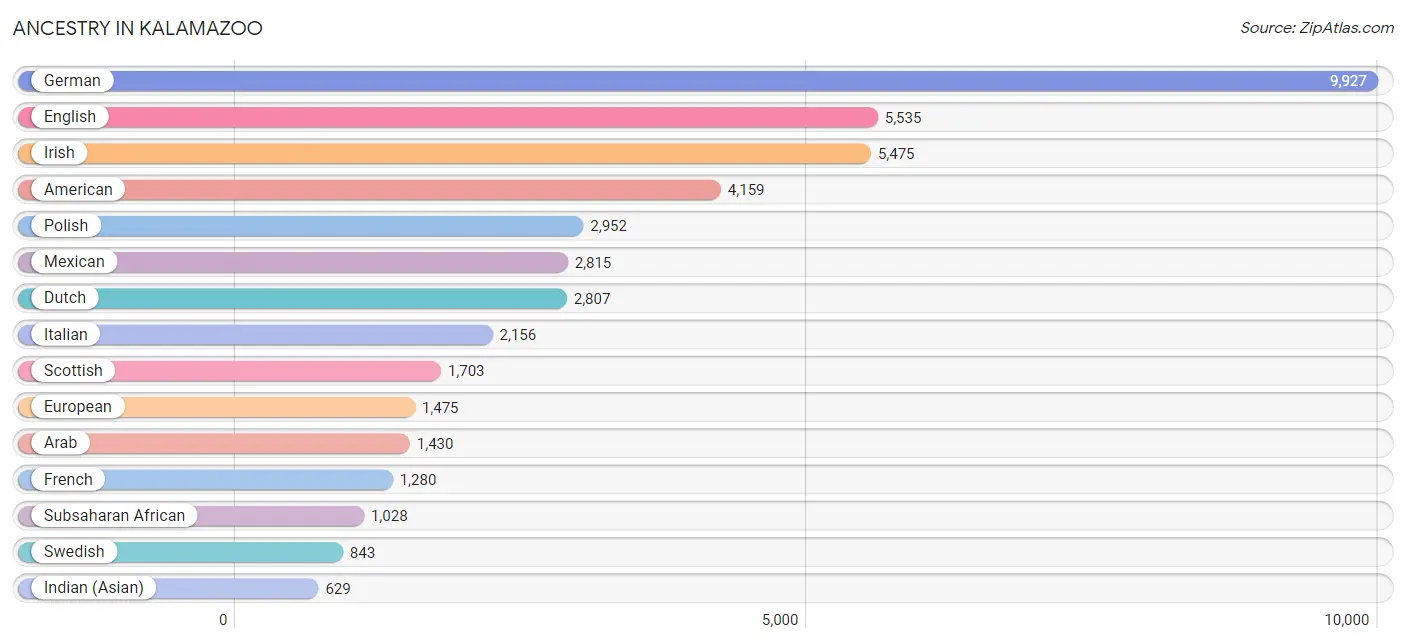
Ancestry in Kalamazoo
The most populous ancestries reported in Kalamazoo are German (9,927 | 13.5%), English (5,535 | 7.5%), Irish (5,475 | 7.5%), American (4,159 | 5.7%), and Polish (2,952 | 4.0%), together accounting for 38.2% of all Kalamazoo residents.
| Ancestry | # Population | % Population |
| African | 368 | 0.5% |
| Alaska Native | 3 | 0.0% |
| American | 4,159 | 5.7% |
| Apache | 34 | 0.1% |
| Arab | 1,430 | 1.9% |
| Armenian | 42 | 0.1% |
| Australian | 14 | 0.0% |
| Austrian | 384 | 0.5% |
| Belgian | 86 | 0.1% |
| Bhutanese | 194 | 0.3% |
| Blackfeet | 259 | 0.4% |
| Bolivian | 28 | 0.0% |
| Brazilian | 123 | 0.2% |
| British | 440 | 0.6% |
| British West Indian | 18 | 0.0% |
| Bulgarian | 15 | 0.0% |
| Burmese | 242 | 0.3% |
| Cajun | 32 | 0.0% |
| Canadian | 213 | 0.3% |
| Cape Verdean | 25 | 0.0% |
| Central American | 582 | 0.8% |
| Central American Indian | 261 | 0.4% |
| Cherokee | 332 | 0.4% |
| Chilean | 14 | 0.0% |
| Chippewa | 67 | 0.1% |
| Choctaw | 12 | 0.0% |
| Colombian | 193 | 0.3% |
| Croatian | 172 | 0.2% |
| Cuban | 384 | 0.5% |
| Czech | 196 | 0.3% |
| Czechoslovakian | 10 | 0.0% |
| Danish | 261 | 0.4% |
| Dominican | 279 | 0.4% |
| Dutch | 2,807 | 3.8% |
| Eastern European | 146 | 0.2% |
| Ecuadorian | 14 | 0.0% |
| Egyptian | 52 | 0.1% |
| English | 5,535 | 7.5% |
| Ethiopian | 5 | 0.0% |
| European | 1,475 | 2.0% |
| Filipino | 26 | 0.0% |
| Finnish | 296 | 0.4% |
| French | 1,280 | 1.8% |
| French Canadian | 348 | 0.5% |
| German | 9,927 | 13.5% |
| Greek | 207 | 0.3% |
| Guatemalan | 433 | 0.6% |
| Haitian | 5 | 0.0% |
| Honduran | 66 | 0.1% |
| Hungarian | 373 | 0.5% |
| Indian (Asian) | 629 | 0.9% |
| Indonesian | 73 | 0.1% |
| Iranian | 51 | 0.1% |
| Iraqi | 24 | 0.0% |
| Irish | 5,475 | 7.5% |
| Iroquois | 22 | 0.0% |
| Italian | 2,156 | 2.9% |
| Jamaican | 14 | 0.0% |
| Japanese | 22 | 0.0% |
| Kenyan | 36 | 0.1% |
| Korean | 394 | 0.5% |
| Laotian | 66 | 0.1% |
| Latvian | 148 | 0.2% |
| Lebanese | 310 | 0.4% |
| Lithuanian | 93 | 0.1% |
| Luxembourger | 8 | 0.0% |
| Macedonian | 28 | 0.0% |
| Mexican | 2,815 | 3.8% |
| Mexican American Indian | 267 | 0.4% |
| Moroccan | 11 | 0.0% |
| Native Hawaiian | 28 | 0.0% |
| Nigerian | 236 | 0.3% |
| Northern European | 117 | 0.2% |
| Norwegian | 587 | 0.8% |
| Ottawa | 5 | 0.0% |
| Pakistani | 19 | 0.0% |
| Panamanian | 83 | 0.1% |
| Pennsylvania German | 10 | 0.0% |
| Peruvian | 41 | 0.1% |
| Polish | 2,952 | 4.0% |
| Portuguese | 92 | 0.1% |
| Potawatomi | 29 | 0.0% |
| Puerto Rican | 392 | 0.5% |
| Romanian | 45 | 0.1% |
| Russian | 168 | 0.2% |
| Scandinavian | 195 | 0.3% |
| Scotch-Irish | 504 | 0.7% |
| Scottish | 1,703 | 2.3% |
| Serbian | 45 | 0.1% |
| Slovak | 87 | 0.1% |
| Somali | 9 | 0.0% |
| South African | 44 | 0.1% |
| South American | 290 | 0.4% |
| South American Indian | 14 | 0.0% |
| Spaniard | 163 | 0.2% |
| Spanish | 64 | 0.1% |
| Spanish American Indian | 3 | 0.0% |
| Sri Lankan | 45 | 0.1% |
| Subsaharan African | 1,028 | 1.4% |
| Swedish | 843 | 1.1% |
| Swiss | 228 | 0.3% |
| Syrian | 371 | 0.5% |
| Thai | 455 | 0.6% |
| Trinidadian and Tobagonian | 24 | 0.0% |
| Turkish | 54 | 0.1% |
| Ugandan | 175 | 0.2% |
| Ukrainian | 171 | 0.2% |
| Vietnamese | 3 | 0.0% |
| Welsh | 546 | 0.7% |
| West Indian | 5 | 0.0% |
| Yugoslavian | 94 | 0.1% | View All 111 Rows |
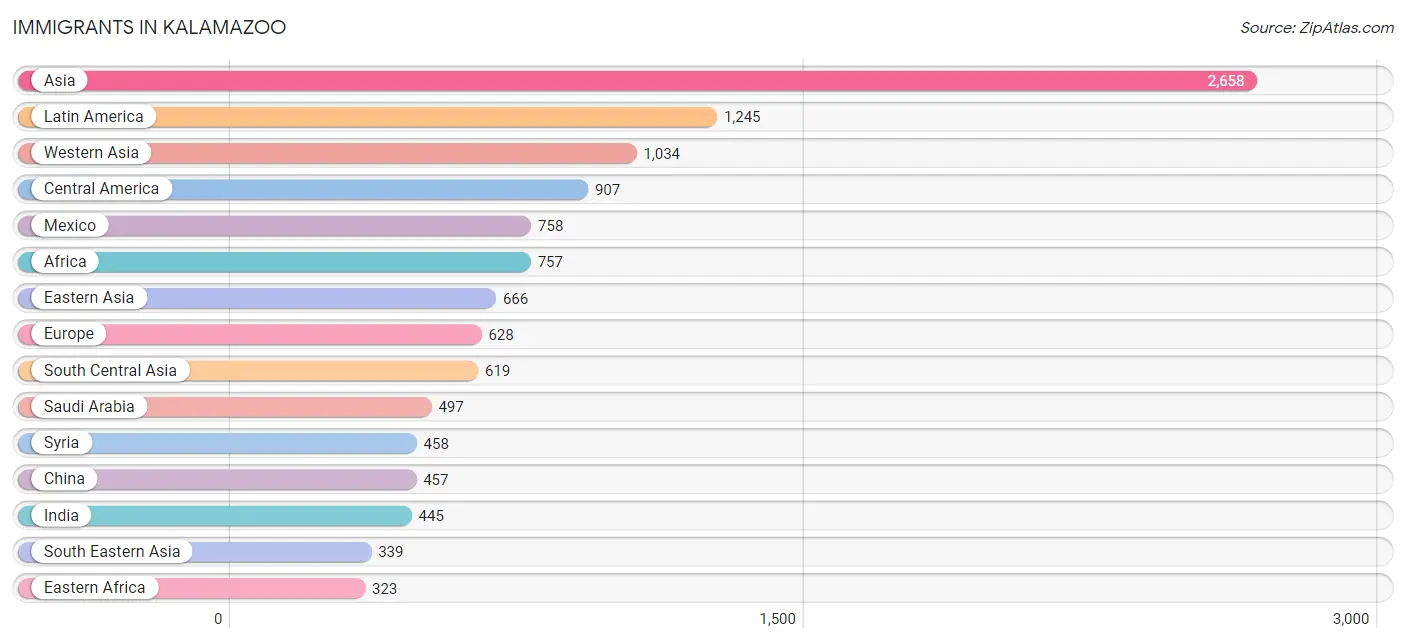
Immigrants in Kalamazoo
The most numerous immigrant groups reported in Kalamazoo came from Asia (2,658 | 3.6%), Latin America (1,245 | 1.7%), Western Asia (1,034 | 1.4%), Central America (907 | 1.2%), and Mexico (758 | 1.0%), together accounting for 9.0% of all Kalamazoo residents.
| Immigration Origin | # Population | % Population |
| Africa | 757 | 1.0% |
| Asia | 2,658 | 3.6% |
| Australia | 2 | 0.0% |
| Austria | 10 | 0.0% |
| Bangladesh | 31 | 0.0% |
| Belarus | 4 | 0.0% |
| Brazil | 123 | 0.2% |
| Bulgaria | 8 | 0.0% |
| Canada | 191 | 0.3% |
| Caribbean | 159 | 0.2% |
| Central America | 907 | 1.2% |
| China | 457 | 0.6% |
| Colombia | 22 | 0.0% |
| Congo | 63 | 0.1% |
| Cuba | 8 | 0.0% |
| Czechoslovakia | 17 | 0.0% |
| Denmark | 31 | 0.0% |
| Dominican Republic | 133 | 0.2% |
| Eastern Africa | 323 | 0.4% |
| Eastern Asia | 666 | 0.9% |
| Eastern Europe | 116 | 0.2% |
| Ecuador | 15 | 0.0% |
| Egypt | 61 | 0.1% |
| England | 38 | 0.1% |
| Ethiopia | 7 | 0.0% |
| Europe | 628 | 0.9% |
| France | 37 | 0.1% |
| Germany | 104 | 0.1% |
| Greece | 11 | 0.0% |
| Guatemala | 145 | 0.2% |
| Honduras | 4 | 0.0% |
| India | 445 | 0.6% |
| Indonesia | 46 | 0.1% |
| Iran | 34 | 0.1% |
| Jamaica | 18 | 0.0% |
| Japan | 66 | 0.1% |
| Kenya | 96 | 0.1% |
| Korea | 139 | 0.2% |
| Latin America | 1,245 | 1.7% |
| Latvia | 31 | 0.0% |
| Lebanon | 72 | 0.1% |
| Liberia | 1 | 0.0% |
| Malaysia | 5 | 0.0% |
| Mexico | 758 | 1.0% |
| Middle Africa | 203 | 0.3% |
| Morocco | 6 | 0.0% |
| Netherlands | 170 | 0.2% |
| Nigeria | 34 | 0.1% |
| Northern Africa | 115 | 0.2% |
| Northern Europe | 129 | 0.2% |
| Oceania | 2 | 0.0% |
| Pakistan | 109 | 0.2% |
| Philippines | 183 | 0.3% |
| Poland | 4 | 0.0% |
| Portugal | 21 | 0.0% |
| Romania | 10 | 0.0% |
| Russia | 15 | 0.0% |
| Saudi Arabia | 497 | 0.7% |
| Somalia | 2 | 0.0% |
| South Africa | 25 | 0.0% |
| South America | 179 | 0.2% |
| South Central Asia | 619 | 0.8% |
| South Eastern Asia | 339 | 0.5% |
| Southern Europe | 62 | 0.1% |
| Spain | 30 | 0.0% |
| Sudan | 48 | 0.1% |
| Syria | 458 | 0.6% |
| Taiwan | 70 | 0.1% |
| Uganda | 175 | 0.2% |
| Ukraine | 7 | 0.0% |
| Venezuela | 19 | 0.0% |
| Vietnam | 12 | 0.0% |
| Western Africa | 91 | 0.1% |
| Western Asia | 1,034 | 1.4% |
| Western Europe | 321 | 0.4% |
| Zaire | 140 | 0.2% | View All 76 Rows |
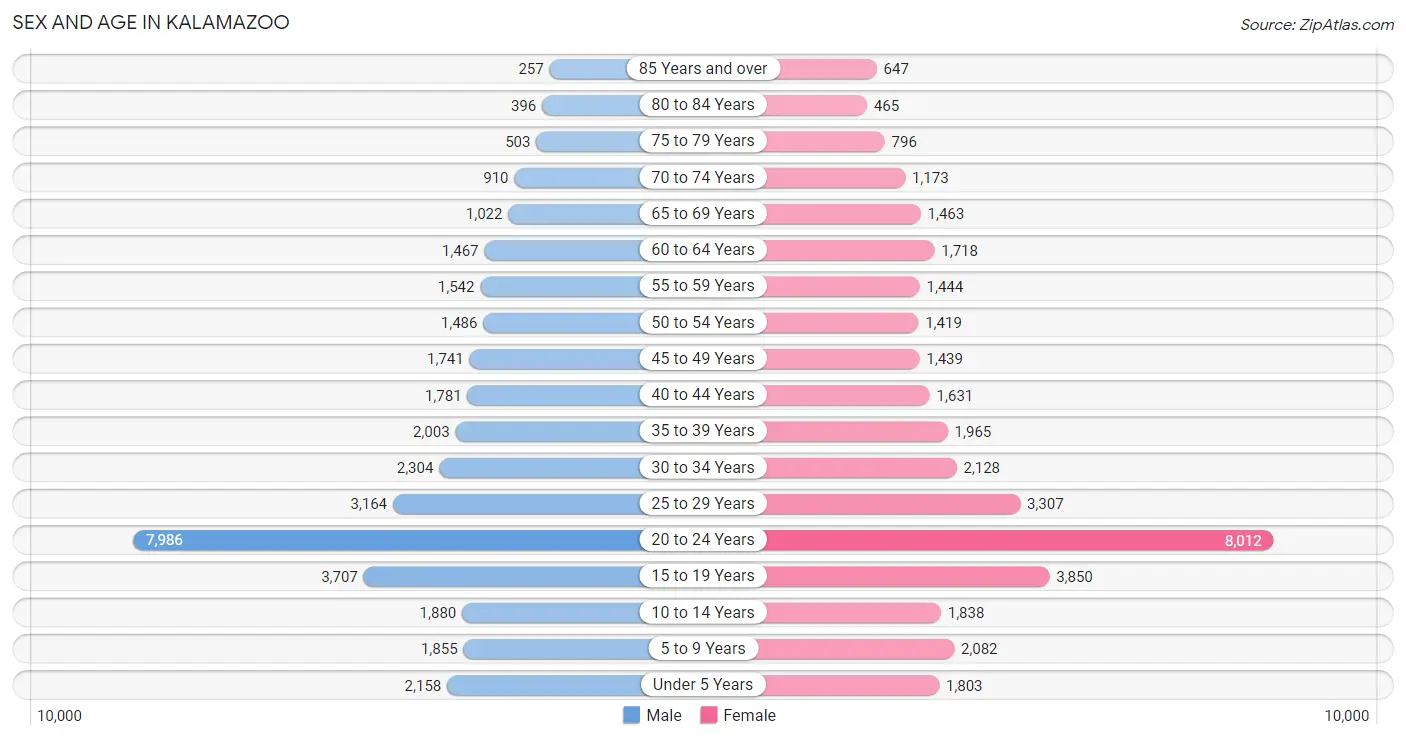
Sex and Age in Kalamazoo
Sex and Age in Kalamazoo
The most populous age groups in Kalamazoo are 20 to 24 Years (7,986 | 22.1%) for men and 20 to 24 Years (8,012 | 21.5%) for women.
| Age Bracket | Male | Female |
| Under 5 Years | 2,158 (6.0%) | 1,803 (4.9%) |
| 5 to 9 Years | 1,855 (5.1%) | 2,082 (5.6%) |
| 10 to 14 Years | 1,880 (5.2%) | 1,838 (4.9%) |
| 15 to 19 Years | 3,707 (10.2%) | 3,850 (10.4%) |
| 20 to 24 Years | 7,986 (22.1%) | 8,012 (21.5%) |
| 25 to 29 Years | 3,164 (8.7%) | 3,307 (8.9%) |
| 30 to 34 Years | 2,304 (6.4%) | 2,128 (5.7%) |
| 35 to 39 Years | 2,003 (5.5%) | 1,965 (5.3%) |
| 40 to 44 Years | 1,781 (4.9%) | 1,631 (4.4%) |
| 45 to 49 Years | 1,741 (4.8%) | 1,439 (3.9%) |
| 50 to 54 Years | 1,486 (4.1%) | 1,419 (3.8%) |
| 55 to 59 Years | 1,542 (4.3%) | 1,444 (3.9%) |
| 60 to 64 Years | 1,467 (4.1%) | 1,718 (4.6%) |
| 65 to 69 Years | 1,022 (2.8%) | 1,463 (3.9%) |
| 70 to 74 Years | 910 (2.5%) | 1,173 (3.2%) |
| 75 to 79 Years | 503 (1.4%) | 796 (2.1%) |
| 80 to 84 Years | 396 (1.1%) | 465 (1.3%) |
| 85 Years and over | 257 (0.7%) | 647 (1.7%) |
| Total | 36,162 (100.0%) | 37,180 (100.0%) |
Families and Households in Kalamazoo
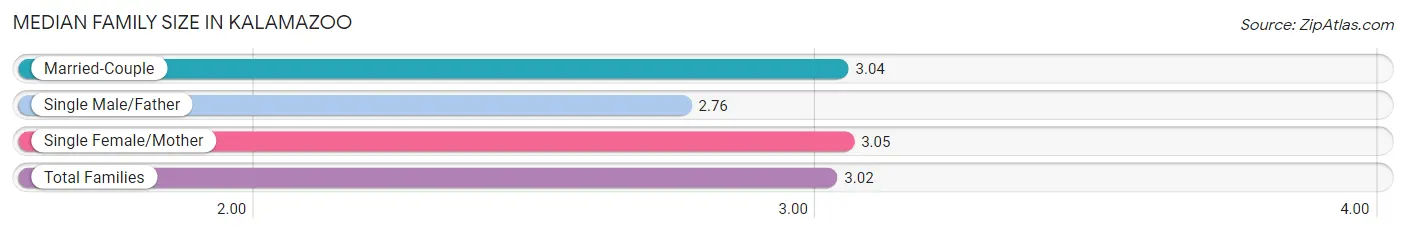
Median Family Size in Kalamazoo
The median family size in Kalamazoo is 3.02 persons per family, with single female/mother families (3,411 | 26.4%) accounting for the largest median family size of 3.05 persons per family. On the other hand, single male/father families (1,404 | 10.8%) represent the smallest median family size with 2.76 persons per family.
| Family Type | # Families | Family Size |
| Married-Couple | 8,131 (62.8%) | 3.04 |
| Single Male/Father | 1,404 (10.8%) | 2.76 |
| Single Female/Mother | 3,411 (26.4%) | 3.05 |
| Total Families | 12,946 (100.0%) | 3.02 |
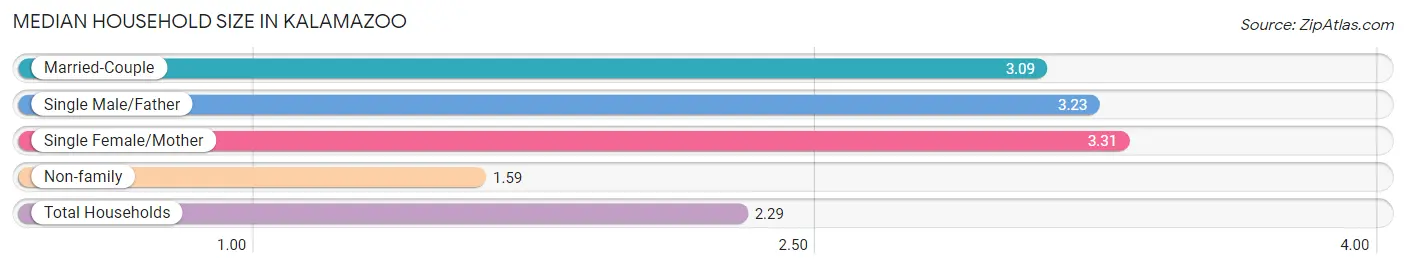
Median Household Size in Kalamazoo
The median household size in Kalamazoo is 2.29 persons per household, with single female/mother households (3,411 | 11.7%) accounting for the largest median household size of 3.31 persons per household. non-family households (16,165 | 55.5%) represent the smallest median household size with 1.59 persons per household.
| Household Type | # Households | Household Size |
| Married-Couple | 8,131 (27.9%) | 3.09 |
| Single Male/Father | 1,404 (4.8%) | 3.23 |
| Single Female/Mother | 3,411 (11.7%) | 3.31 |
| Non-family | 16,165 (55.5%) | 1.59 |
| Total Households | 29,111 (100.0%) | 2.29 |
Household Size by Marriage Status in Kalamazoo
Out of a total of 29,111 households in Kalamazoo, 12,946 (44.5%) are family households, while 16,165 (55.5%) are nonfamily households. The most numerous type of family households are 2-person households, comprising 5,853, and the most common type of nonfamily households are 1-person households, comprising 10,651.
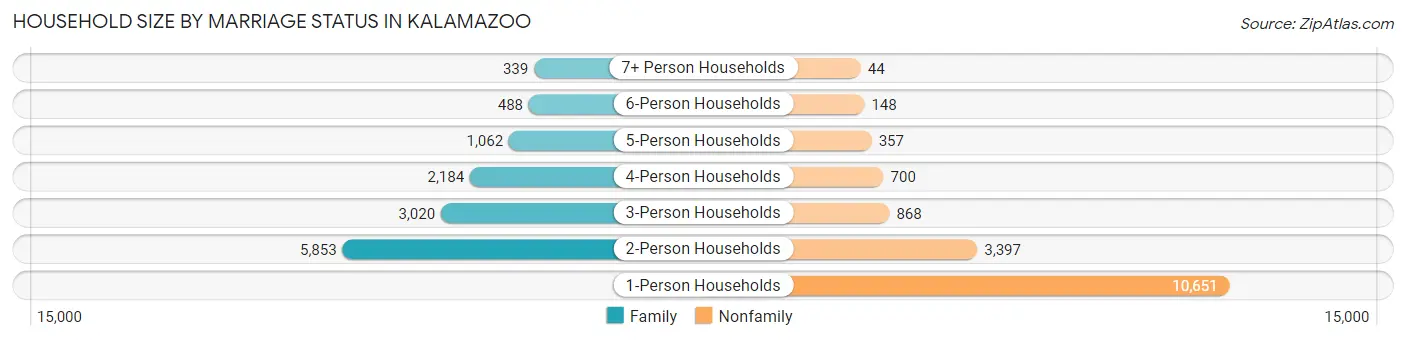
| Household Size | Family Households | Nonfamily Households |
| 1-Person Households | - | 10,651 (36.6%) |
| 2-Person Households | 5,853 (20.1%) | 3,397 (11.7%) |
| 3-Person Households | 3,020 (10.4%) | 868 (3.0%) |
| 4-Person Households | 2,184 (7.5%) | 700 (2.4%) |
| 5-Person Households | 1,062 (3.6%) | 357 (1.2%) |
| 6-Person Households | 488 (1.7%) | 148 (0.5%) |
| 7+ Person Households | 339 (1.2%) | 44 (0.2%) |
| Total | 12,946 (44.5%) | 16,165 (55.5%) |
Female Fertility in Kalamazoo
Fertility by Age in Kalamazoo
Average fertility rate in Kalamazoo is 47.0 births per 1,000 women. Women in the age bracket of 20 to 34 years have the highest fertility rate with 72.0 births per 1,000 women. Women in the age bracket of 20 to 34 years acount for 90.5% of all women with births.
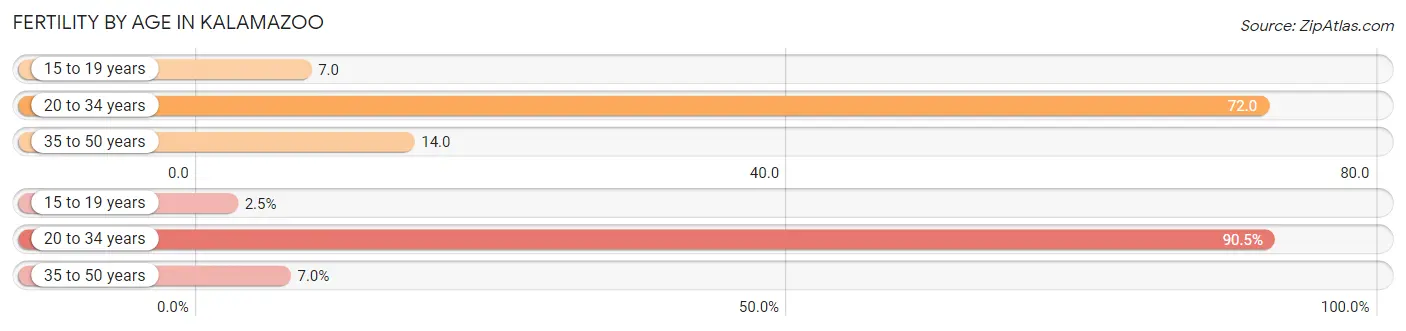
| Age Bracket | Women with Births | Births / 1,000 Women |
| 15 to 19 years | 27 (2.5%) | 7.0 |
| 20 to 34 years | 970 (90.5%) | 72.0 |
| 35 to 50 years | 75 (7.0%) | 14.0 |
| Total | 1,072 (100.0%) | 47.0 |
Fertility by Age by Marriage Status in Kalamazoo
46.9% of women with births (1,072) in Kalamazoo are married. The highest percentage of unmarried women with births falls into 15 to 19 years age bracket with 100.0% of them unmarried at the time of birth, while the lowest percentage of unmarried women with births belong to 35 to 50 years age bracket with 10.7% of them unmarried.
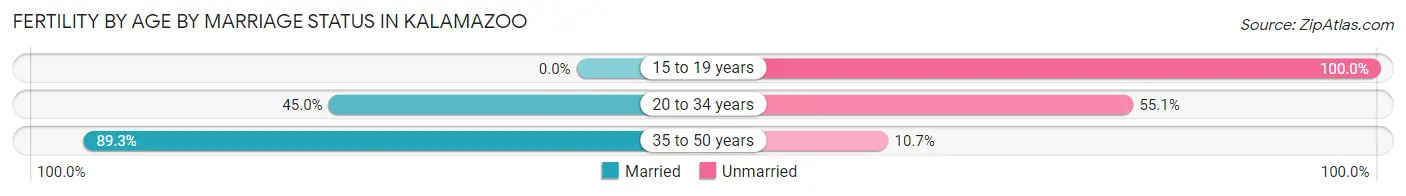
| Age Bracket | Married | Unmarried |
| 15 to 19 years | 0 (0.0%) | 27 (100.0%) |
| 20 to 34 years | 436 (45.0%) | 534 (55.0%) |
| 35 to 50 years | 67 (89.3%) | 8 (10.7%) |
| Total | 503 (46.9%) | 569 (53.1%) |
Fertility by Education in Kalamazoo
Average fertility rate in Kalamazoo is 47.0 births per 1,000 women. Women with the education attainment of less than high school have the highest fertility rate of 96.0 births per 1,000 women, while women with the education attainment of college or associate's degree have the lowest fertility at 25.0 births per 1,000 women. Women with the education attainment of high school diploma represent 37.8% of all women with births.
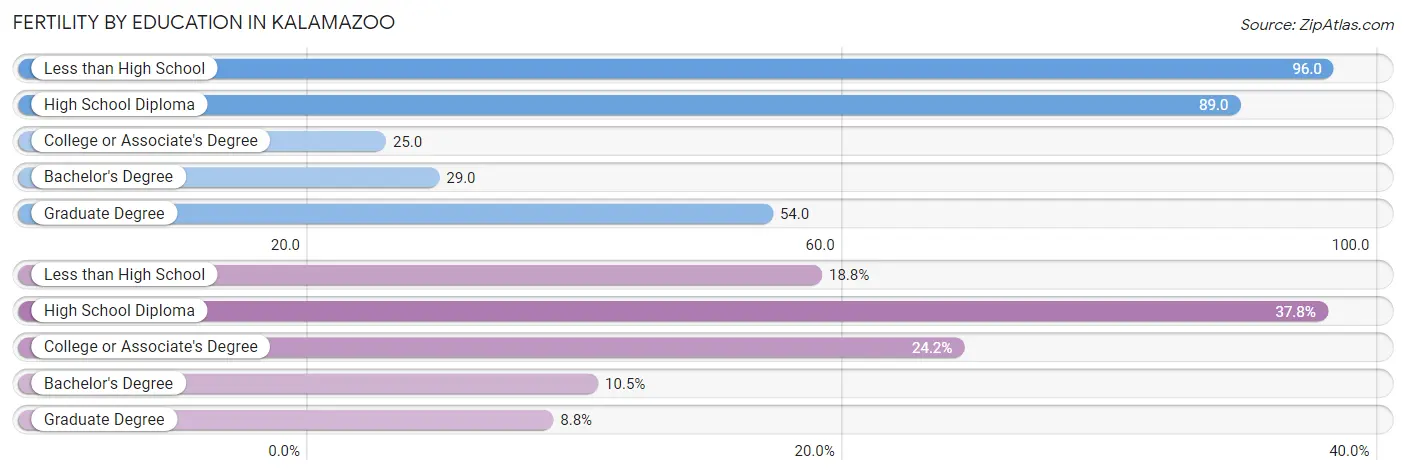
| Educational Attainment | Women with Births | Births / 1,000 Women |
| Less than High School | 202 (18.8%) | 96.0 |
| High School Diploma | 405 (37.8%) | 89.0 |
| College or Associate's Degree | 259 (24.2%) | 25.0 |
| Bachelor's Degree | 112 (10.4%) | 29.0 |
| Graduate Degree | 94 (8.8%) | 54.0 |
| Total | 1,072 (100.0%) | 47.0 |
Fertility by Education by Marriage Status in Kalamazoo
53.1% of women with births in Kalamazoo are unmarried. Women with the educational attainment of graduate degree are most likely to be married with 100.0% of them married at childbirth, while women with the educational attainment of less than high school are least likely to be married with 92.1% of them unmarried at childbirth.
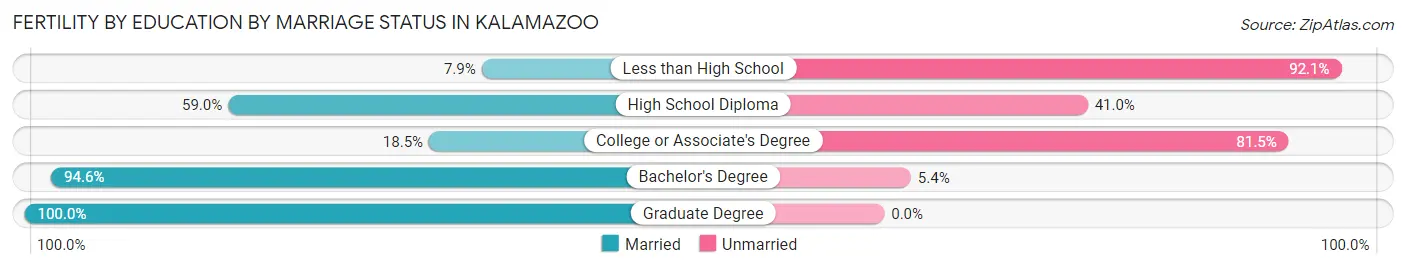
| Educational Attainment | Married | Unmarried |
| Less than High School | 16 (7.9%) | 186 (92.1%) |
| High School Diploma | 239 (59.0%) | 166 (41.0%) |
| College or Associate's Degree | 48 (18.5%) | 211 (81.5%) |
| Bachelor's Degree | 106 (94.6%) | 6 (5.4%) |
| Graduate Degree | 94 (100.0%) | 0 (0.0%) |
| Total | 503 (46.9%) | 569 (53.1%) |
Employment Characteristics in Kalamazoo
Employment by Class of Employer in Kalamazoo
Among the 36,242 employed individuals in Kalamazoo, private company employees (26,067 | 71.9%), not-for-profit organizations (4,155 | 11.5%), and state government employees (1,908 | 5.3%) make up the most common classes of employment.
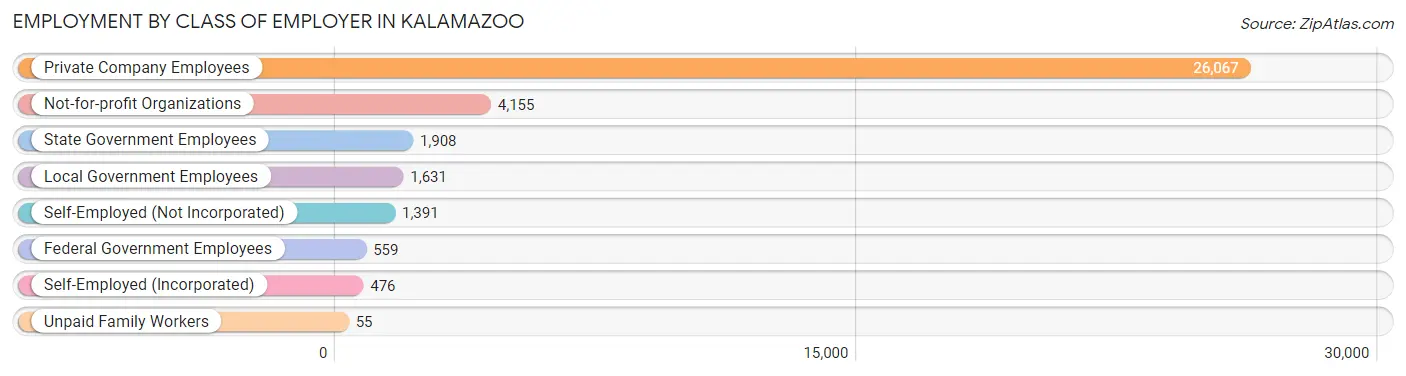
| Employer Class | # Employees | % Employees |
| Private Company Employees | 26,067 | 71.9% |
| Self-Employed (Incorporated) | 476 | 1.3% |
| Self-Employed (Not Incorporated) | 1,391 | 3.8% |
| Not-for-profit Organizations | 4,155 | 11.5% |
| Local Government Employees | 1,631 | 4.5% |
| State Government Employees | 1,908 | 5.3% |
| Federal Government Employees | 559 | 1.5% |
| Unpaid Family Workers | 55 | 0.2% |
| Total | 36,242 | 100.0% |
Employment Status by Age in Kalamazoo
According to the labor force statistics for Kalamazoo, out of the total population over 16 years of age (61,162), 65.9% or 40,306 individuals are in the labor force, with 8.1% or 3,265 of them unemployed. The age group with the highest labor force participation rate is 35 to 44 years, with 85.1% or 6,280 individuals in the labor force. Within the labor force, the 20 to 24 years age range has the highest percentage of unemployed individuals, with 11.7% or 1,396 of them being unemployed.
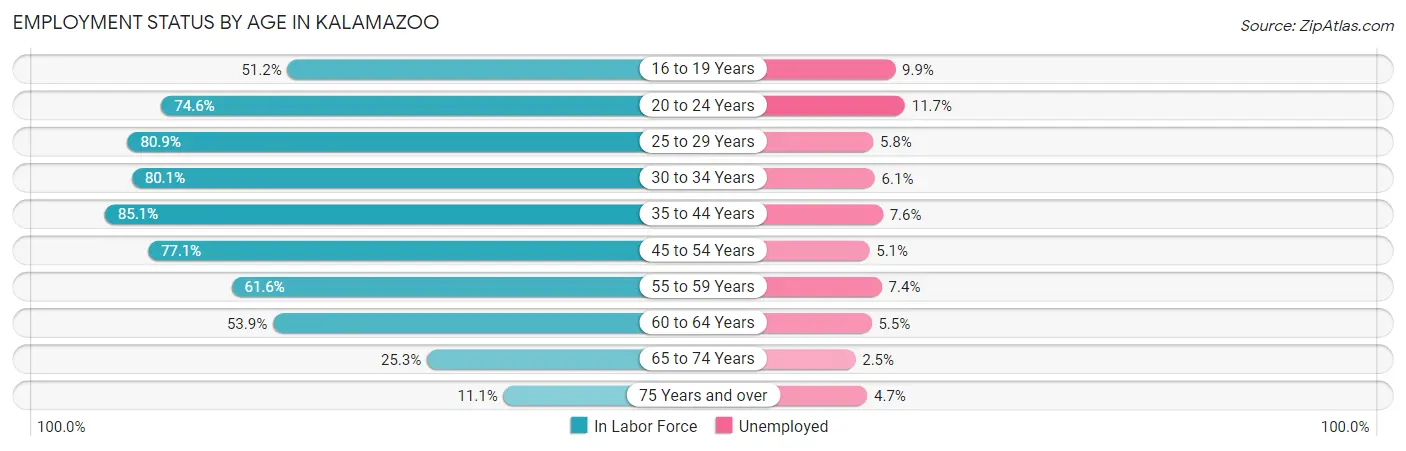
| Age Bracket | In Labor Force | Unemployed |
| 16 to 19 Years | 3,580 (51.2%) | 354 (9.9%) |
| 20 to 24 Years | 11,935 (74.6%) | 1,396 (11.7%) |
| 25 to 29 Years | 5,235 (80.9%) | 304 (5.8%) |
| 30 to 34 Years | 3,550 (80.1%) | 217 (6.1%) |
| 35 to 44 Years | 6,280 (85.1%) | 477 (7.6%) |
| 45 to 54 Years | 4,692 (77.1%) | 239 (5.1%) |
| 55 to 59 Years | 1,839 (61.6%) | 136 (7.4%) |
| 60 to 64 Years | 1,717 (53.9%) | 94 (5.5%) |
| 65 to 74 Years | 1,156 (25.3%) | 29 (2.5%) |
| 75 Years and over | 340 (11.1%) | 16 (4.7%) |
| Total | 40,306 (65.9%) | 3,265 (8.1%) |
Employment Status by Educational Attainment in Kalamazoo
According to labor force statistics for Kalamazoo, 76.4% of individuals (23,332) out of the total population between 25 and 64 years of age (30,539) are in the labor force, with 6.3% or 1,470 of them being unemployed. The group with the highest labor force participation rate are those with the educational attainment of bachelor's degree or higher, with 85.5% or 9,328 individuals in the labor force. Within the labor force, individuals with less than high school education have the highest percentage of unemployment, with 18.6% or 267 of them being unemployed.
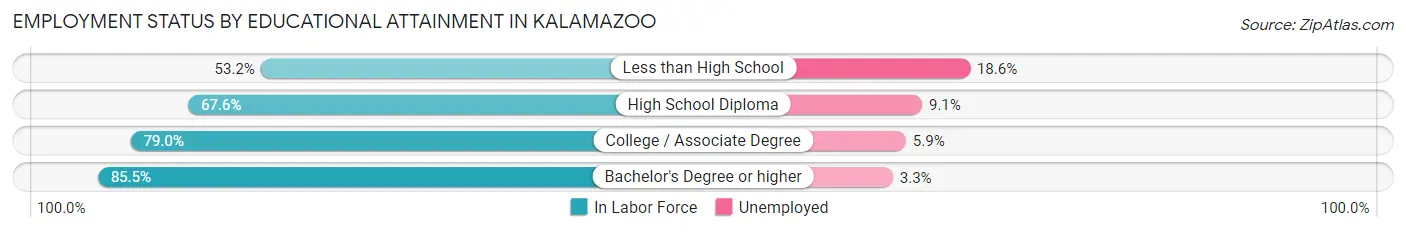
| Educational Attainment | In Labor Force | Unemployed |
| Less than High School | 1,437 (53.2%) | 502 (18.6%) |
| High School Diploma | 4,823 (67.6%) | 649 (9.1%) |
| College / Associate Degree | 7,736 (79.0%) | 578 (5.9%) |
| Bachelor's Degree or higher | 9,328 (85.5%) | 360 (3.3%) |
| Total | 23,332 (76.4%) | 1,924 (6.3%) |
Employment Occupations by Sex in Kalamazoo
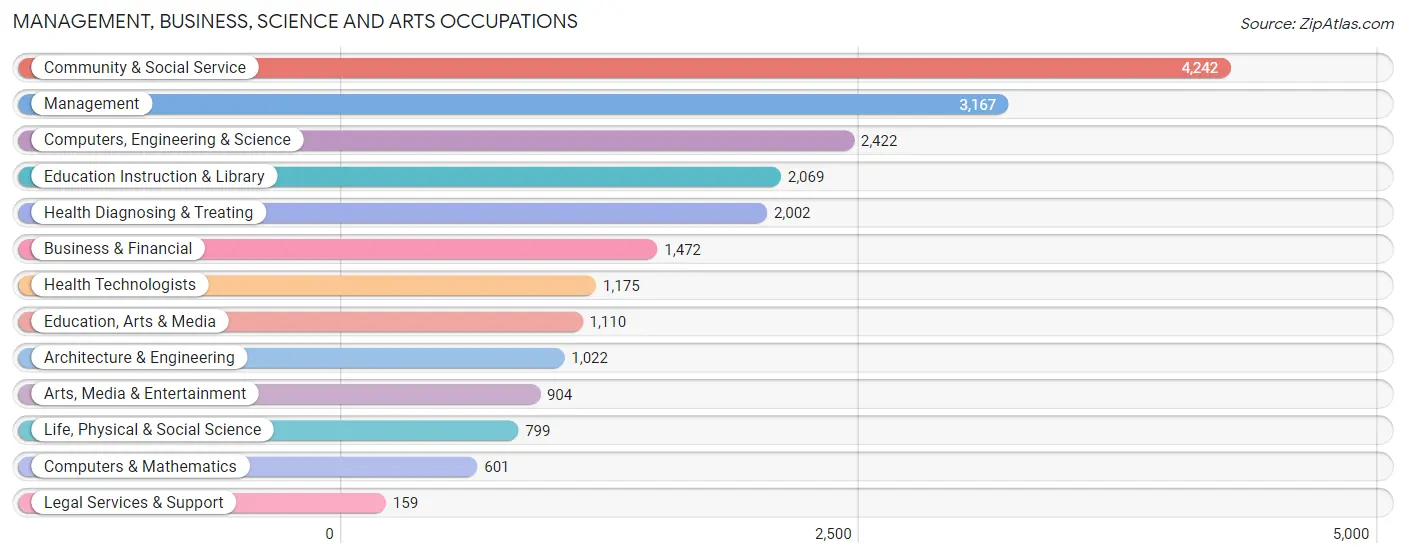
Management, Business, Science and Arts Occupations
The most common Management, Business, Science and Arts occupations in Kalamazoo are Community & Social Service (4,242 | 11.5%), Management (3,167 | 8.6%), Computers, Engineering & Science (2,422 | 6.5%), Education Instruction & Library (2,069 | 5.6%), and Health Diagnosing & Treating (2,002 | 5.4%).
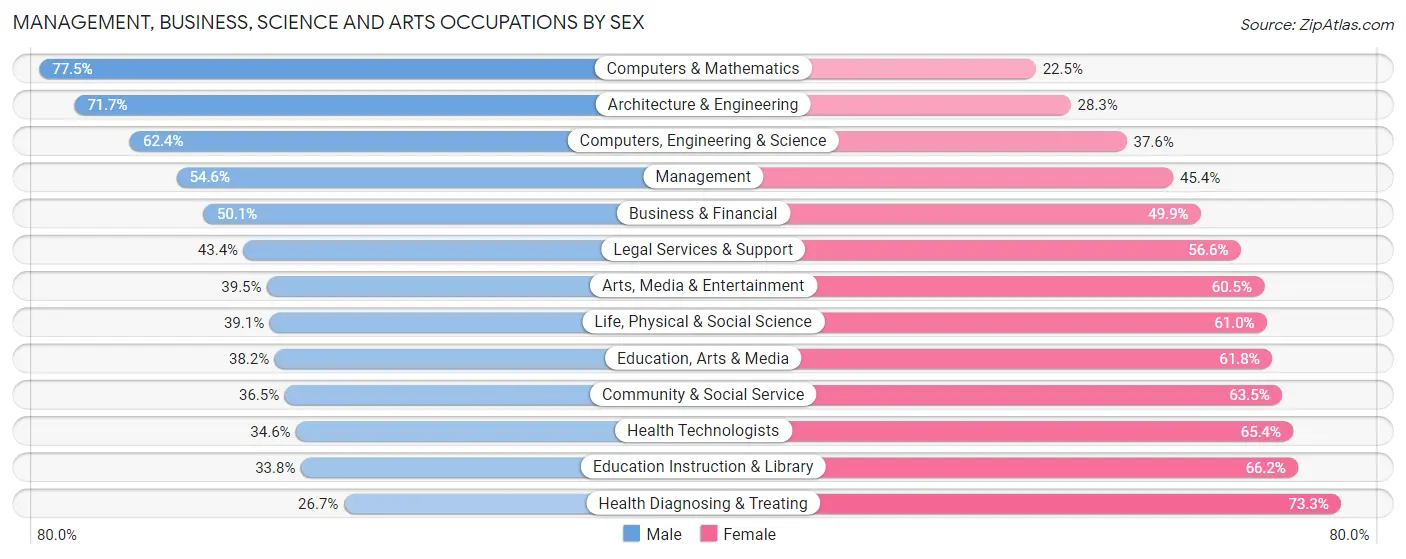
Management, Business, Science and Arts Occupations by Sex
Within the Management, Business, Science and Arts occupations in Kalamazoo, the most male-oriented occupations are Computers & Mathematics (77.5%), Architecture & Engineering (71.7%), and Computers, Engineering & Science (62.4%), while the most female-oriented occupations are Health Diagnosing & Treating (73.3%), Education Instruction & Library (66.2%), and Health Technologists (65.4%).
| Occupation | Male | Female |
| Management | 1,730 (54.6%) | 1,437 (45.4%) |
| Business & Financial | 737 (50.1%) | 735 (49.9%) |
| Computers, Engineering & Science | 1,511 (62.4%) | 911 (37.6%) |
| Computers & Mathematics | 466 (77.5%) | 135 (22.5%) |
| Architecture & Engineering | 733 (71.7%) | 289 (28.3%) |
| Life, Physical & Social Science | 312 (39.1%) | 487 (61.0%) |
| Community & Social Service | 1,550 (36.5%) | 2,692 (63.5%) |
| Education, Arts & Media | 424 (38.2%) | 686 (61.8%) |
| Legal Services & Support | 69 (43.4%) | 90 (56.6%) |
| Education Instruction & Library | 700 (33.8%) | 1,369 (66.2%) |
| Arts, Media & Entertainment | 357 (39.5%) | 547 (60.5%) |
| Health Diagnosing & Treating | 534 (26.7%) | 1,468 (73.3%) |
| Health Technologists | 407 (34.6%) | 768 (65.4%) |
| Total (Category) | 6,062 (45.6%) | 7,243 (54.4%) |
| Total (Overall) | 18,273 (49.3%) | 18,766 (50.7%) |
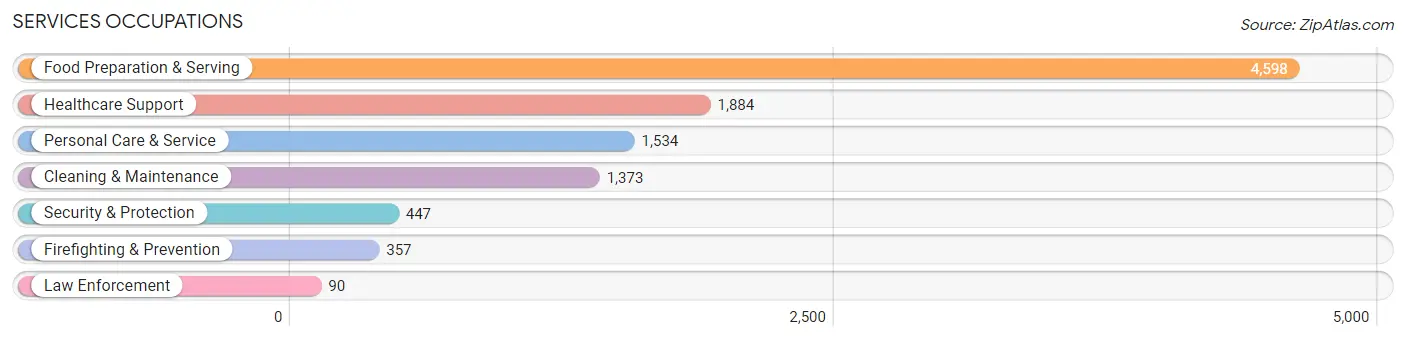
Services Occupations
The most common Services occupations in Kalamazoo are Food Preparation & Serving (4,598 | 12.4%), Healthcare Support (1,884 | 5.1%), Personal Care & Service (1,534 | 4.1%), Cleaning & Maintenance (1,373 | 3.7%), and Security & Protection (447 | 1.2%).
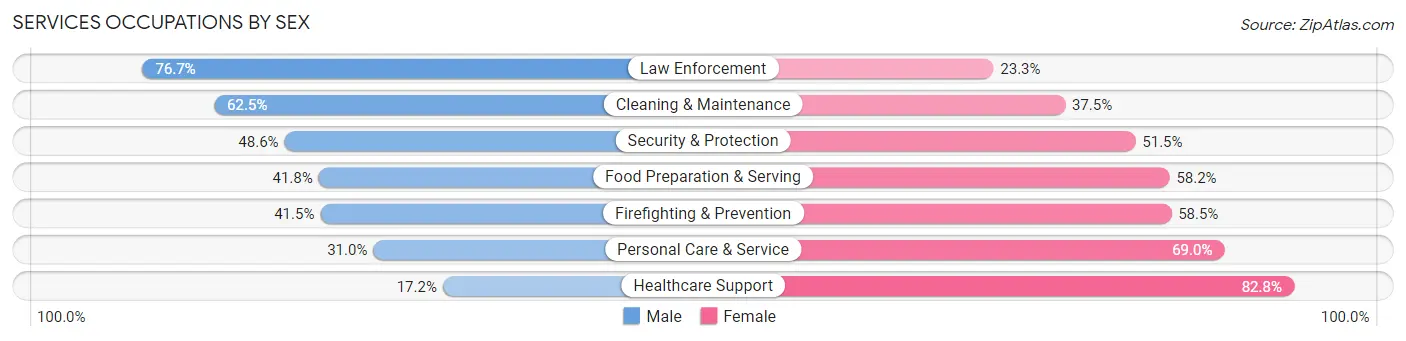
Services Occupations by Sex
Within the Services occupations in Kalamazoo, the most male-oriented occupations are Law Enforcement (76.7%), Cleaning & Maintenance (62.5%), and Security & Protection (48.5%), while the most female-oriented occupations are Healthcare Support (82.8%), Personal Care & Service (69.0%), and Firefighting & Prevention (58.5%).
| Occupation | Male | Female |
| Healthcare Support | 324 (17.2%) | 1,560 (82.8%) |
| Security & Protection | 217 (48.5%) | 230 (51.4%) |
| Firefighting & Prevention | 148 (41.5%) | 209 (58.5%) |
| Law Enforcement | 69 (76.7%) | 21 (23.3%) |
| Food Preparation & Serving | 1,922 (41.8%) | 2,676 (58.2%) |
| Cleaning & Maintenance | 858 (62.5%) | 515 (37.5%) |
| Personal Care & Service | 475 (31.0%) | 1,059 (69.0%) |
| Total (Category) | 3,796 (38.6%) | 6,040 (61.4%) |
| Total (Overall) | 18,273 (49.3%) | 18,766 (50.7%) |
Sales and Office Occupations
The most common Sales and Office occupations in Kalamazoo are Office & Administration (3,737 | 10.1%), and Sales & Related (3,380 | 9.1%).

Sales and Office Occupations by Sex
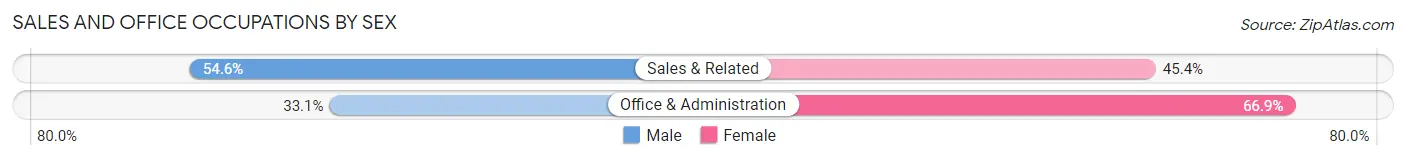
| Occupation | Male | Female |
| Sales & Related | 1,844 (54.6%) | 1,536 (45.4%) |
| Office & Administration | 1,238 (33.1%) | 2,499 (66.9%) |
| Total (Category) | 3,082 (43.3%) | 4,035 (56.7%) |
| Total (Overall) | 18,273 (49.3%) | 18,766 (50.7%) |
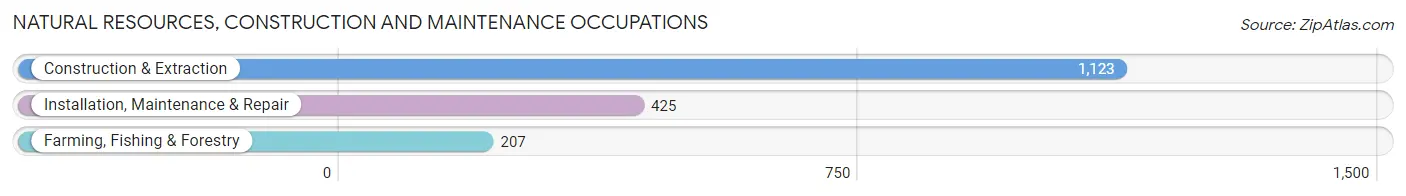
Natural Resources, Construction and Maintenance Occupations
The most common Natural Resources, Construction and Maintenance occupations in Kalamazoo are Construction & Extraction (1,123 | 3.0%), Installation, Maintenance & Repair (425 | 1.1%), and Farming, Fishing & Forestry (207 | 0.6%).
Natural Resources, Construction and Maintenance Occupations by Sex
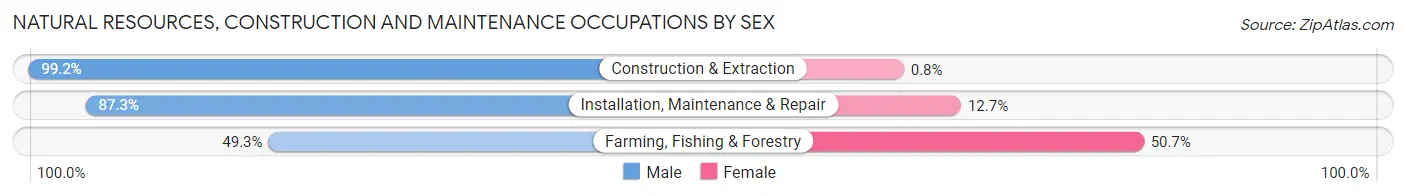
| Occupation | Male | Female |
| Farming, Fishing & Forestry | 102 (49.3%) | 105 (50.7%) |
| Construction & Extraction | 1,114 (99.2%) | 9 (0.8%) |
| Installation, Maintenance & Repair | 371 (87.3%) | 54 (12.7%) |
| Total (Category) | 1,587 (90.4%) | 168 (9.6%) |
| Total (Overall) | 18,273 (49.3%) | 18,766 (50.7%) |
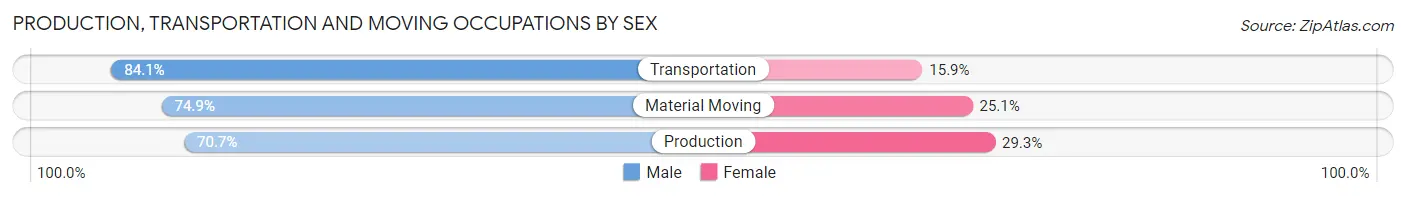
Production, Transportation and Moving Occupations
The most common Production, Transportation and Moving occupations in Kalamazoo are Production (2,419 | 6.5%), Material Moving (1,703 | 4.6%), and Transportation (904 | 2.4%).
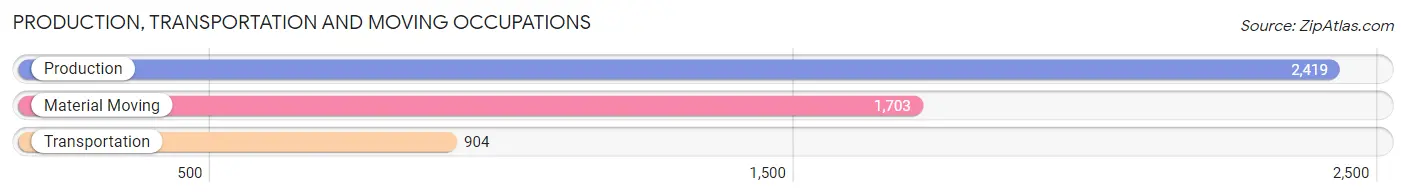
Production, Transportation and Moving Occupations by Sex
| Occupation | Male | Female |
| Production | 1,711 (70.7%) | 708 (29.3%) |
| Transportation | 760 (84.1%) | 144 (15.9%) |
| Material Moving | 1,275 (74.9%) | 428 (25.1%) |
| Total (Category) | 3,746 (74.5%) | 1,280 (25.5%) |
| Total (Overall) | 18,273 (49.3%) | 18,766 (50.7%) |
Employment Industries by Sex in Kalamazoo
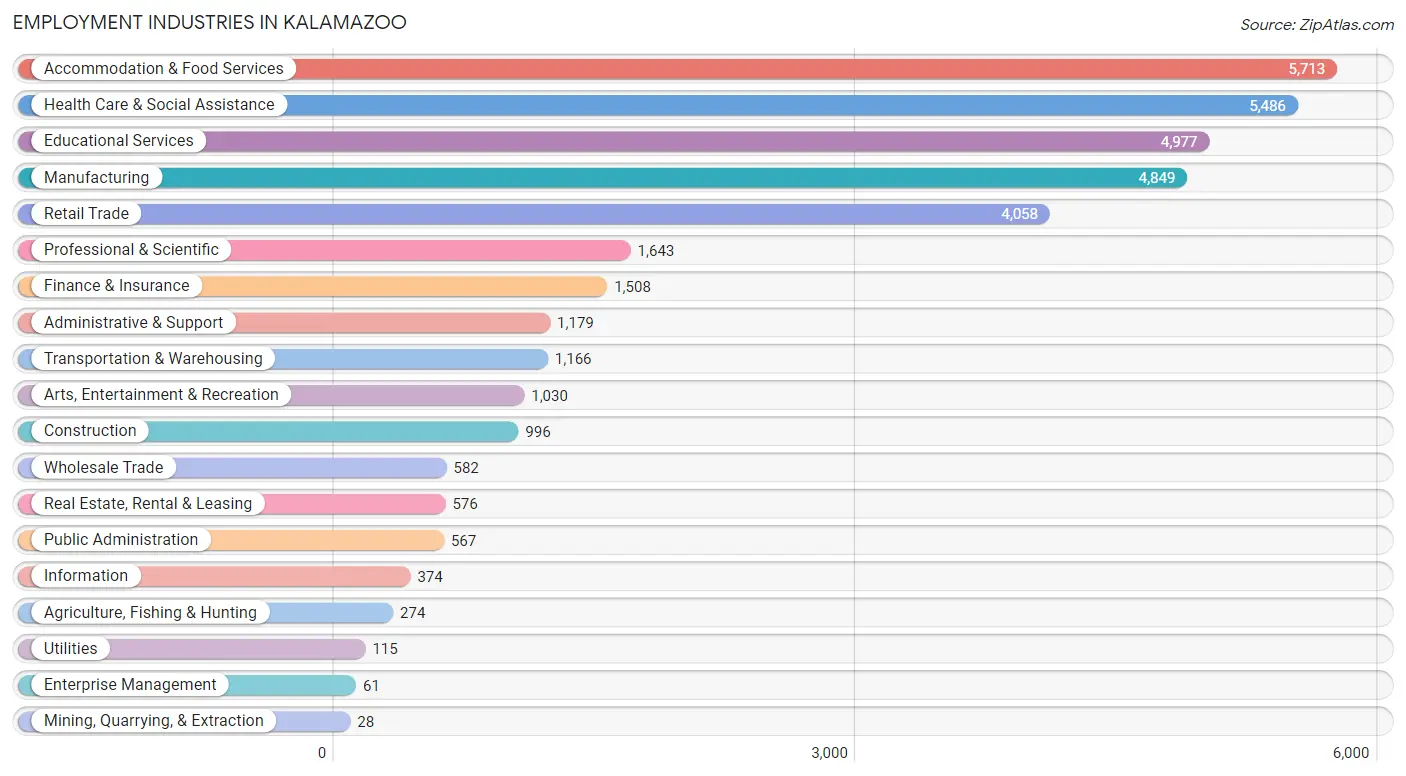
Employment Industries in Kalamazoo
The major employment industries in Kalamazoo include Accommodation & Food Services (5,713 | 15.4%), Health Care & Social Assistance (5,486 | 14.8%), Educational Services (4,977 | 13.4%), Manufacturing (4,849 | 13.1%), and Retail Trade (4,058 | 11.0%).
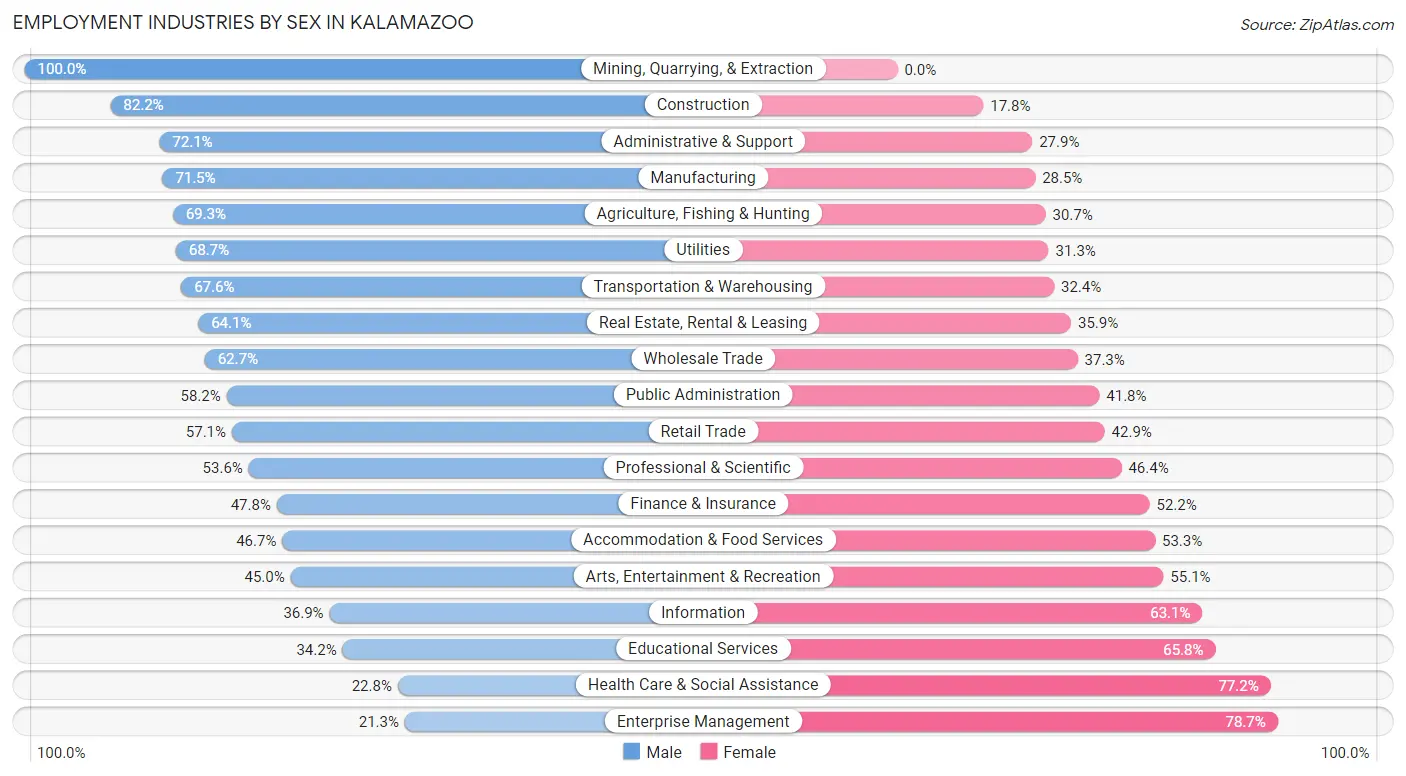
Employment Industries by Sex in Kalamazoo
The Kalamazoo industries that see more men than women are Mining, Quarrying, & Extraction (100.0%), Construction (82.2%), and Administrative & Support (72.1%), whereas the industries that tend to have a higher number of women are Enterprise Management (78.7%), Health Care & Social Assistance (77.2%), and Educational Services (65.8%).
| Industry | Male | Female |
| Agriculture, Fishing & Hunting | 190 (69.3%) | 84 (30.7%) |
| Mining, Quarrying, & Extraction | 28 (100.0%) | 0 (0.0%) |
| Construction | 819 (82.2%) | 177 (17.8%) |
| Manufacturing | 3,466 (71.5%) | 1,383 (28.5%) |
| Wholesale Trade | 365 (62.7%) | 217 (37.3%) |
| Retail Trade | 2,317 (57.1%) | 1,741 (42.9%) |
| Transportation & Warehousing | 788 (67.6%) | 378 (32.4%) |
| Utilities | 79 (68.7%) | 36 (31.3%) |
| Information | 138 (36.9%) | 236 (63.1%) |
| Finance & Insurance | 721 (47.8%) | 787 (52.2%) |
| Real Estate, Rental & Leasing | 369 (64.1%) | 207 (35.9%) |
| Professional & Scientific | 881 (53.6%) | 762 (46.4%) |
| Enterprise Management | 13 (21.3%) | 48 (78.7%) |
| Administrative & Support | 850 (72.1%) | 329 (27.9%) |
| Educational Services | 1,702 (34.2%) | 3,275 (65.8%) |
| Health Care & Social Assistance | 1,249 (22.8%) | 4,237 (77.2%) |
| Arts, Entertainment & Recreation | 463 (45.0%) | 567 (55.0%) |
| Accommodation & Food Services | 2,666 (46.7%) | 3,047 (53.3%) |
| Public Administration | 330 (58.2%) | 237 (41.8%) |
| Total | 18,273 (49.3%) | 18,766 (50.7%) |
Education in Kalamazoo
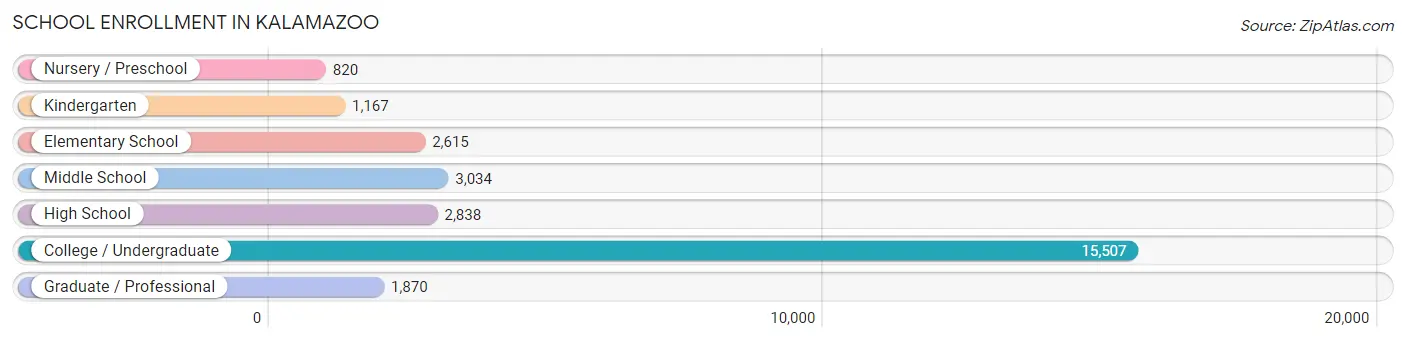
School Enrollment in Kalamazoo
The most common levels of schooling among the 27,851 students in Kalamazoo are college / undergraduate (15,507 | 55.7%), middle school (3,034 | 10.9%), and high school (2,838 | 10.2%).
| School Level | # Students | % Students |
| Nursery / Preschool | 820 | 2.9% |
| Kindergarten | 1,167 | 4.2% |
| Elementary School | 2,615 | 9.4% |
| Middle School | 3,034 | 10.9% |
| High School | 2,838 | 10.2% |
| College / Undergraduate | 15,507 | 55.7% |
| Graduate / Professional | 1,870 | 6.7% |
| Total | 27,851 | 100.0% |
School Enrollment by Age by Funding Source in Kalamazoo
Out of a total of 27,851 students who are enrolled in schools in Kalamazoo, 3,231 (11.6%) attend a private institution, while the remaining 24,620 (88.4%) are enrolled in public schools. The age group of 3 to 4 year olds has the highest likelihood of being enrolled in private schools, with 169 (28.1% in the age bracket) enrolled. Conversely, the age group of 15 to 17 year olds has the lowest likelihood of being enrolled in a private school, with 1,983 (95.4% in the age bracket) attending a public institution.
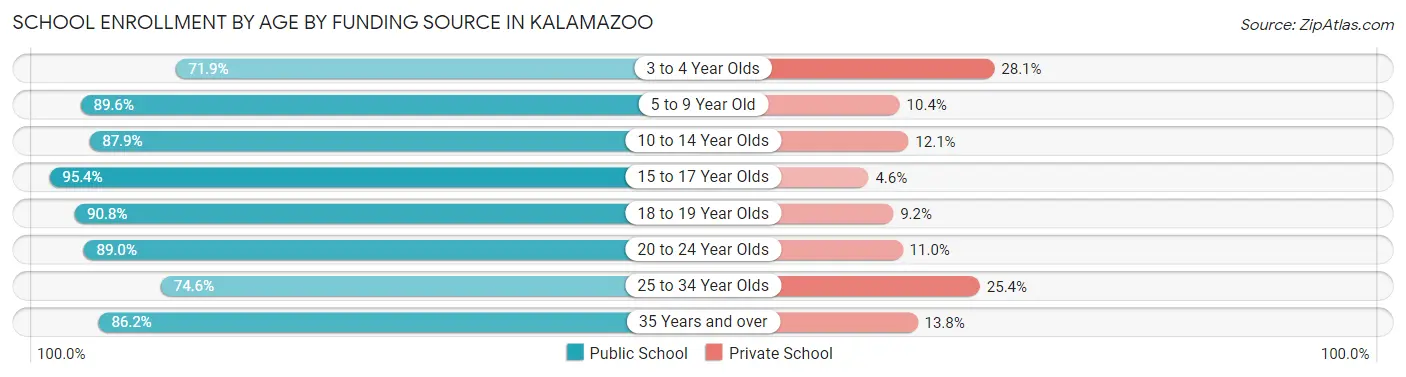
| Age Bracket | Public School | Private School |
| 3 to 4 Year Olds | 433 (71.9%) | 169 (28.1%) |
| 5 to 9 Year Old | 3,323 (89.6%) | 387 (10.4%) |
| 10 to 14 Year Olds | 3,222 (87.9%) | 442 (12.1%) |
| 15 to 17 Year Olds | 1,983 (95.4%) | 96 (4.6%) |
| 18 to 19 Year Olds | 4,237 (90.8%) | 431 (9.2%) |
| 20 to 24 Year Olds | 9,571 (89.0%) | 1,182 (11.0%) |
| 25 to 34 Year Olds | 1,306 (74.6%) | 444 (25.4%) |
| 35 Years and over | 539 (86.2%) | 86 (13.8%) |
| Total | 24,620 (88.4%) | 3,231 (11.6%) |
Educational Attainment by Field of Study in Kalamazoo
Business (2,292 | 14.0%), education (2,010 | 12.3%), science & technology (1,363 | 8.4%), arts & humanities (1,298 | 8.0%), and social sciences (1,284 | 7.9%) are the most common fields of study among 16,320 individuals in Kalamazoo who have obtained a bachelor's degree or higher.
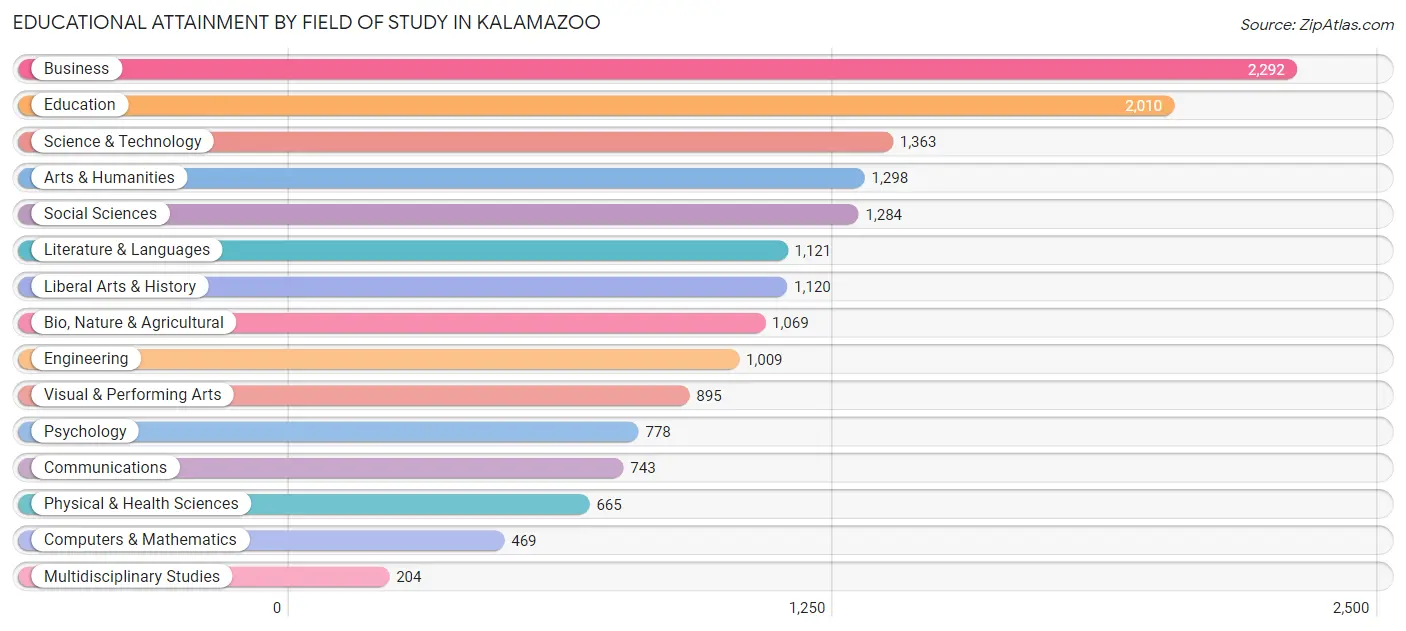
| Field of Study | # Graduates | % Graduates |
| Computers & Mathematics | 469 | 2.9% |
| Bio, Nature & Agricultural | 1,069 | 6.6% |
| Physical & Health Sciences | 665 | 4.1% |
| Psychology | 778 | 4.8% |
| Social Sciences | 1,284 | 7.9% |
| Engineering | 1,009 | 6.2% |
| Multidisciplinary Studies | 204 | 1.3% |
| Science & Technology | 1,363 | 8.4% |
| Business | 2,292 | 14.0% |
| Education | 2,010 | 12.3% |
| Literature & Languages | 1,121 | 6.9% |
| Liberal Arts & History | 1,120 | 6.9% |
| Visual & Performing Arts | 895 | 5.5% |
| Communications | 743 | 4.5% |
| Arts & Humanities | 1,298 | 8.0% |
| Total | 16,320 | 100.0% |
Transportation & Commute in Kalamazoo
Vehicle Availability by Sex in Kalamazoo
The most prevalent vehicle ownership categories in Kalamazoo are males with 2 vehicles (7,404, accounting for 43.6%) and females with 2 vehicles (6,799, making up 44.8%).
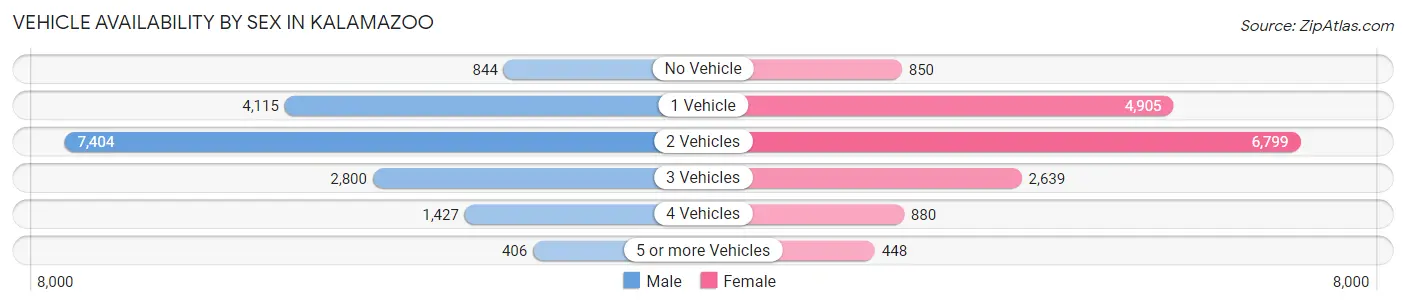
| Vehicles Available | Male | Female |
| No Vehicle | 844 (5.0%) | 850 (5.1%) |
| 1 Vehicle | 4,115 (24.2%) | 4,905 (29.7%) |
| 2 Vehicles | 7,404 (43.6%) | 6,799 (41.1%) |
| 3 Vehicles | 2,800 (16.5%) | 2,639 (16.0%) |
| 4 Vehicles | 1,427 (8.4%) | 880 (5.3%) |
| 5 or more Vehicles | 406 (2.4%) | 448 (2.7%) |
| Total | 16,996 (100.0%) | 16,521 (100.0%) |
Commute Time in Kalamazoo
The most frequently occuring commute durations in Kalamazoo are 10 to 14 minutes (8,451 commuters, 25.1%), 15 to 19 minutes (7,615 commuters, 22.6%), and 5 to 9 minutes (5,429 commuters, 16.1%).
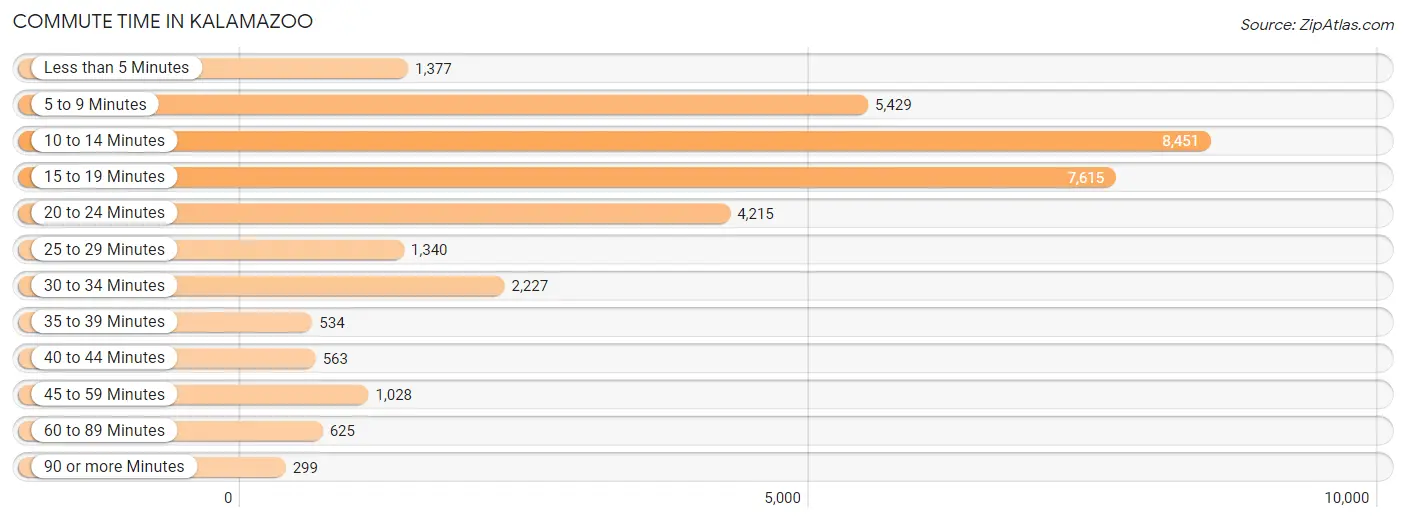
| Commute Time | # Commuters | % Commuters |
| Less than 5 Minutes | 1,377 | 4.1% |
| 5 to 9 Minutes | 5,429 | 16.1% |
| 10 to 14 Minutes | 8,451 | 25.1% |
| 15 to 19 Minutes | 7,615 | 22.6% |
| 20 to 24 Minutes | 4,215 | 12.5% |
| 25 to 29 Minutes | 1,340 | 4.0% |
| 30 to 34 Minutes | 2,227 | 6.6% |
| 35 to 39 Minutes | 534 | 1.6% |
| 40 to 44 Minutes | 563 | 1.7% |
| 45 to 59 Minutes | 1,028 | 3.0% |
| 60 to 89 Minutes | 625 | 1.8% |
| 90 or more Minutes | 299 | 0.9% |
Commute Time by Sex in Kalamazoo
The most common commute times in Kalamazoo are 10 to 14 minutes (4,057 commuters, 23.8%) for males and 10 to 14 minutes (4,394 commuters, 26.4%) for females.
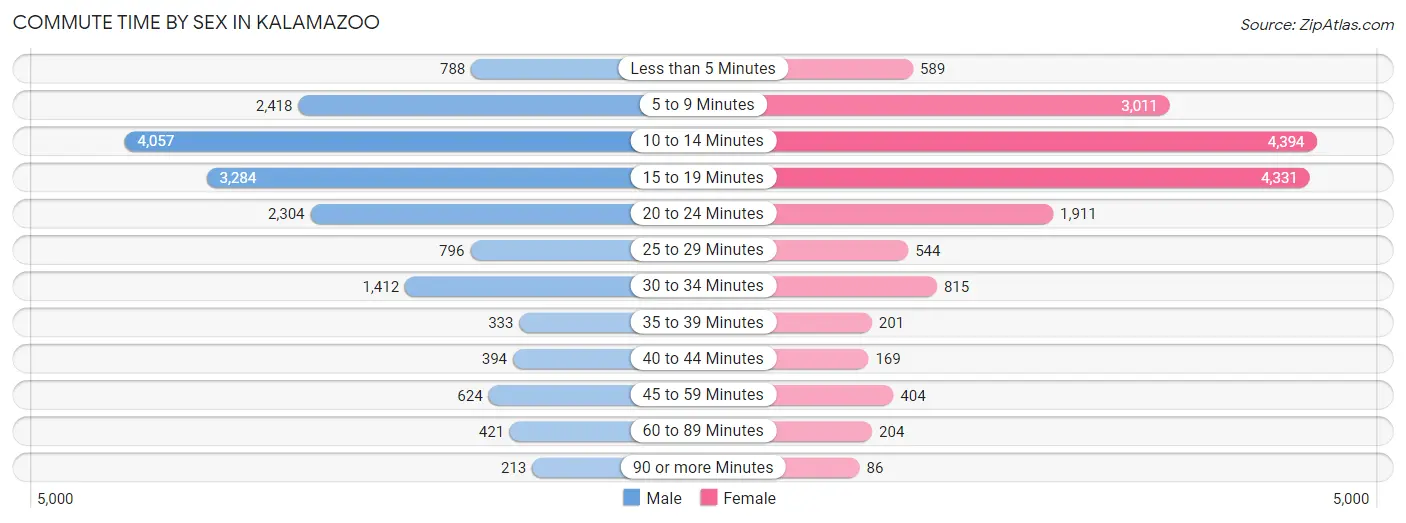
| Commute Time | Male | Female |
| Less than 5 Minutes | 788 (4.6%) | 589 (3.5%) |
| 5 to 9 Minutes | 2,418 (14.2%) | 3,011 (18.1%) |
| 10 to 14 Minutes | 4,057 (23.8%) | 4,394 (26.4%) |
| 15 to 19 Minutes | 3,284 (19.3%) | 4,331 (26.0%) |
| 20 to 24 Minutes | 2,304 (13.5%) | 1,911 (11.5%) |
| 25 to 29 Minutes | 796 (4.7%) | 544 (3.3%) |
| 30 to 34 Minutes | 1,412 (8.3%) | 815 (4.9%) |
| 35 to 39 Minutes | 333 (1.9%) | 201 (1.2%) |
| 40 to 44 Minutes | 394 (2.3%) | 169 (1.0%) |
| 45 to 59 Minutes | 624 (3.7%) | 404 (2.4%) |
| 60 to 89 Minutes | 421 (2.5%) | 204 (1.2%) |
| 90 or more Minutes | 213 (1.3%) | 86 (0.5%) |
Time of Departure to Work by Sex in Kalamazoo
The most frequent times of departure to work in Kalamazoo are 7:30 AM to 7:59 AM (2,392, 14.0%) for males and 12:00 PM to 3:59 PM (2,621, 15.7%) for females.
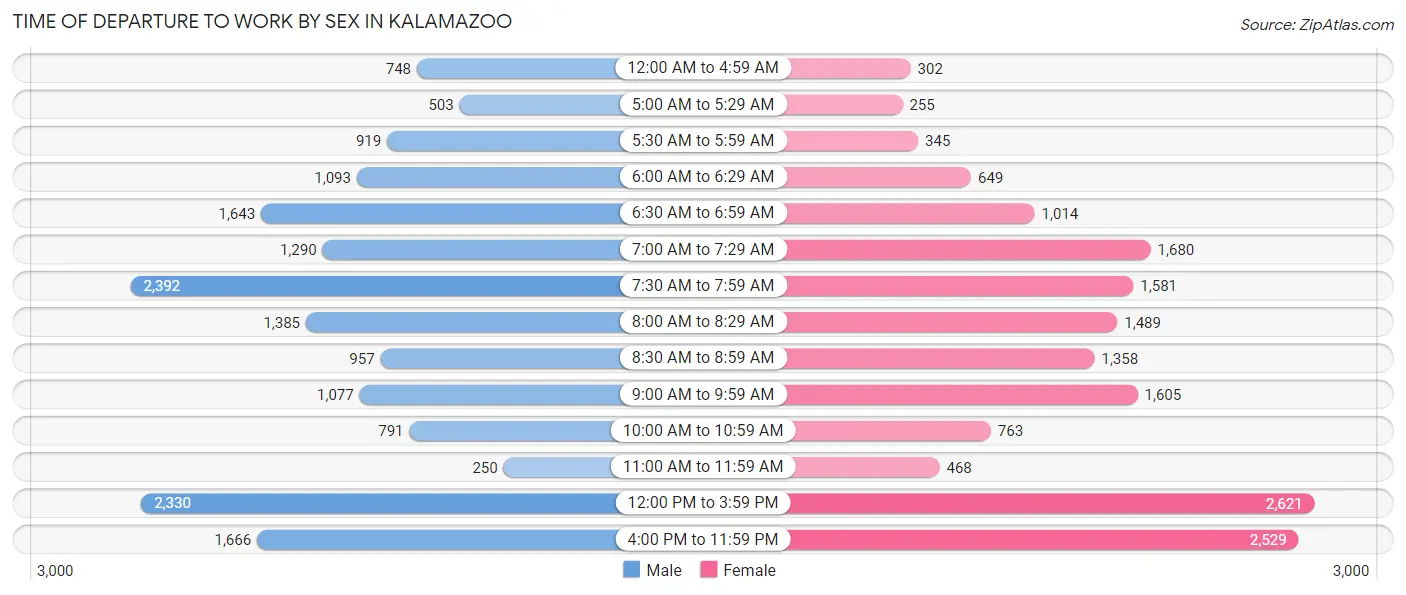
| Time of Departure | Male | Female |
| 12:00 AM to 4:59 AM | 748 (4.4%) | 302 (1.8%) |
| 5:00 AM to 5:29 AM | 503 (2.9%) | 255 (1.5%) |
| 5:30 AM to 5:59 AM | 919 (5.4%) | 345 (2.1%) |
| 6:00 AM to 6:29 AM | 1,093 (6.4%) | 649 (3.9%) |
| 6:30 AM to 6:59 AM | 1,643 (9.6%) | 1,014 (6.1%) |
| 7:00 AM to 7:29 AM | 1,290 (7.6%) | 1,680 (10.1%) |
| 7:30 AM to 7:59 AM | 2,392 (14.0%) | 1,581 (9.5%) |
| 8:00 AM to 8:29 AM | 1,385 (8.1%) | 1,489 (8.9%) |
| 8:30 AM to 8:59 AM | 957 (5.6%) | 1,358 (8.2%) |
| 9:00 AM to 9:59 AM | 1,077 (6.3%) | 1,605 (9.6%) |
| 10:00 AM to 10:59 AM | 791 (4.6%) | 763 (4.6%) |
| 11:00 AM to 11:59 AM | 250 (1.5%) | 468 (2.8%) |
| 12:00 PM to 3:59 PM | 2,330 (13.7%) | 2,621 (15.7%) |
| 4:00 PM to 11:59 PM | 1,666 (9.8%) | 2,529 (15.2%) |
| Total | 17,044 (100.0%) | 16,659 (100.0%) |
Housing Occupancy in Kalamazoo
Occupancy by Ownership in Kalamazoo
Of the total 29,111 dwellings in Kalamazoo, owner-occupied units account for 12,691 (43.6%), while renter-occupied units make up 16,420 (56.4%).
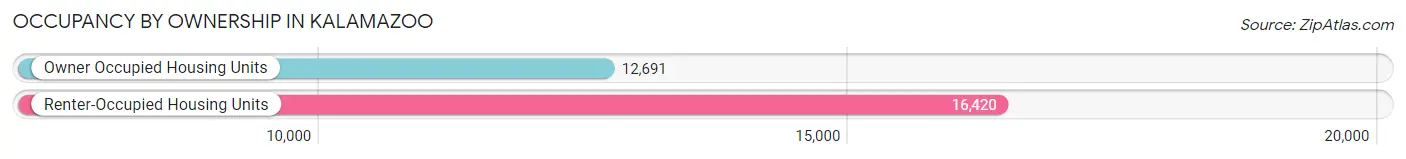
| Occupancy | # Housing Units | % Housing Units |
| Owner Occupied Housing Units | 12,691 | 43.6% |
| Renter-Occupied Housing Units | 16,420 | 56.4% |
| Total Occupied Housing Units | 29,111 | 100.0% |
Occupancy by Household Size in Kalamazoo
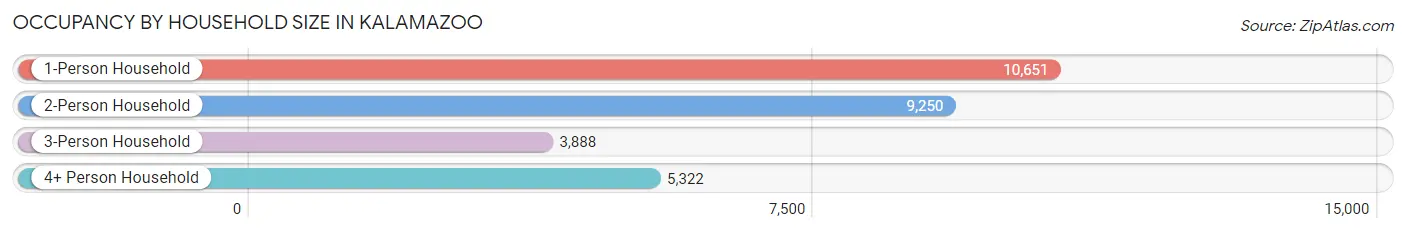
| Household Size | # Housing Units | % Housing Units |
| 1-Person Household | 10,651 | 36.6% |
| 2-Person Household | 9,250 | 31.8% |
| 3-Person Household | 3,888 | 13.4% |
| 4+ Person Household | 5,322 | 18.3% |
| Total Housing Units | 29,111 | 100.0% |
Occupancy by Ownership by Household Size in Kalamazoo
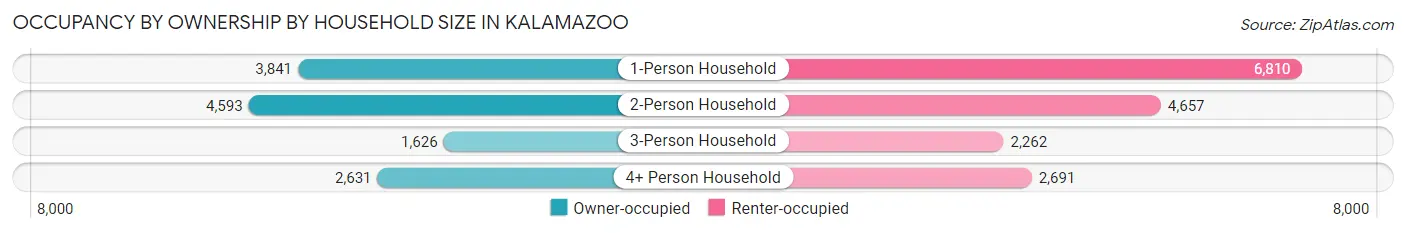
| Household Size | Owner-occupied | Renter-occupied |
| 1-Person Household | 3,841 (36.1%) | 6,810 (63.9%) |
| 2-Person Household | 4,593 (49.6%) | 4,657 (50.3%) |
| 3-Person Household | 1,626 (41.8%) | 2,262 (58.2%) |
| 4+ Person Household | 2,631 (49.4%) | 2,691 (50.6%) |
| Total Housing Units | 12,691 (43.6%) | 16,420 (56.4%) |
Occupancy by Educational Attainment in Kalamazoo
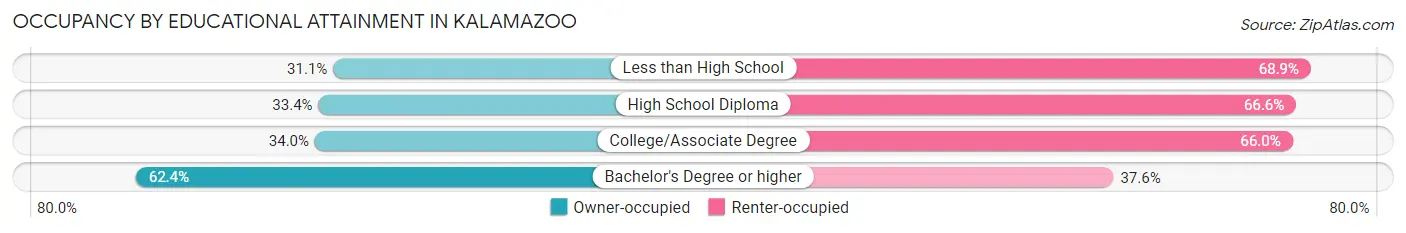
| Household Size | Owner-occupied | Renter-occupied |
| Less than High School | 620 (31.1%) | 1,376 (68.9%) |
| High School Diploma | 1,985 (33.4%) | 3,958 (66.6%) |
| College/Associate Degree | 3,728 (34.0%) | 7,249 (66.0%) |
| Bachelor's Degree or higher | 6,358 (62.4%) | 3,837 (37.6%) |
Occupancy by Age of Householder in Kalamazoo
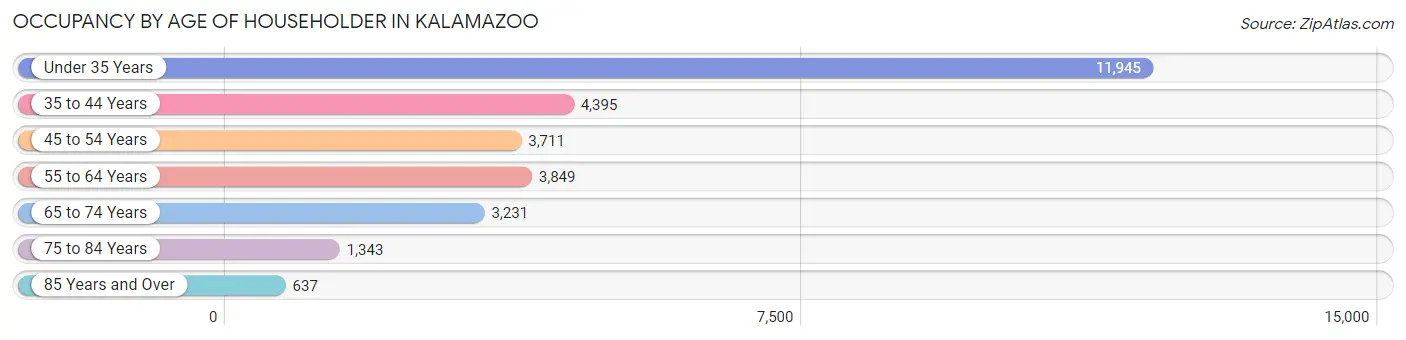
| Age Bracket | # Households | % Households |
| Under 35 Years | 11,945 | 41.0% |
| 35 to 44 Years | 4,395 | 15.1% |
| 45 to 54 Years | 3,711 | 12.8% |
| 55 to 64 Years | 3,849 | 13.2% |
| 65 to 74 Years | 3,231 | 11.1% |
| 75 to 84 Years | 1,343 | 4.6% |
| 85 Years and Over | 637 | 2.2% |
| Total | 29,111 | 100.0% |
Housing Finances in Kalamazoo
Median Income by Occupancy in Kalamazoo
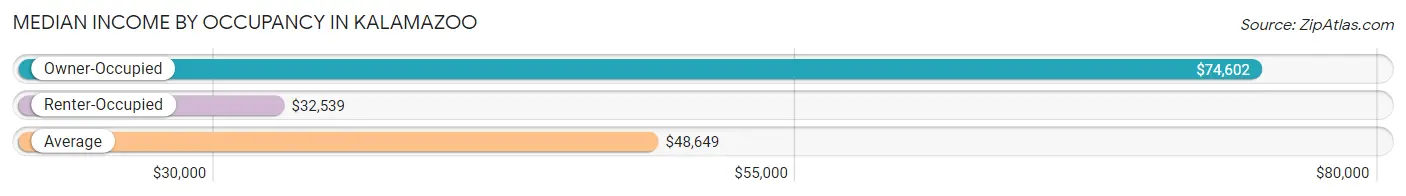
| Occupancy Type | # Households | Median Income |
| Owner-Occupied | 12,691 (43.6%) | $74,602 |
| Renter-Occupied | 16,420 (56.4%) | $32,539 |
| Average | 29,111 (100.0%) | $48,649 |
Occupancy by Householder Income Bracket in Kalamazoo
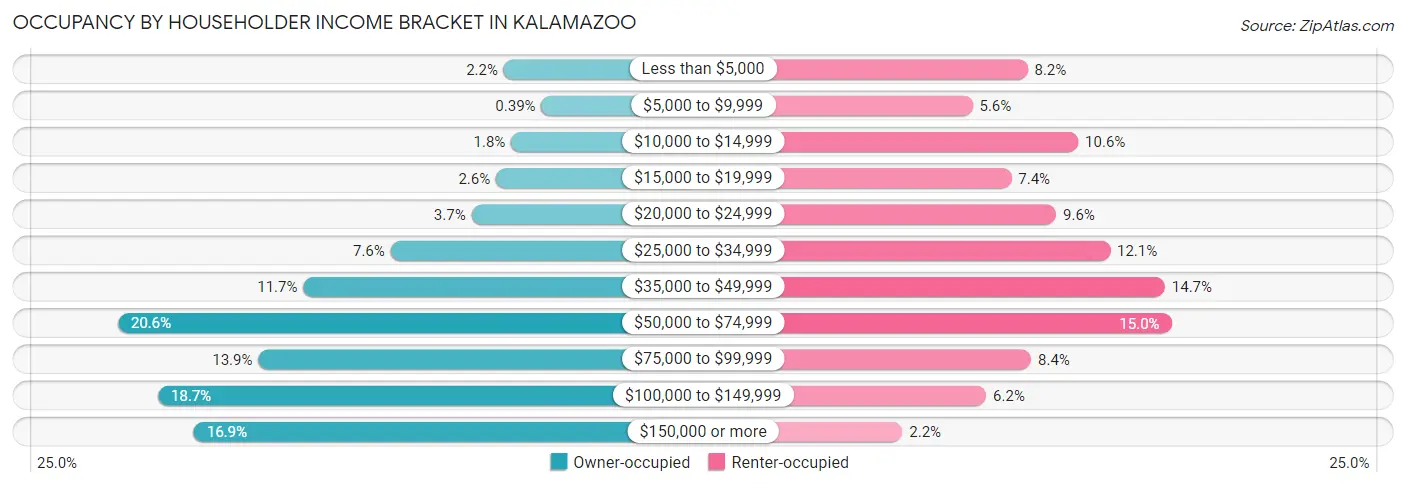
| Income Bracket | Owner-occupied | Renter-occupied |
| Less than $5,000 | 277 (2.2%) | 1,344 (8.2%) |
| $5,000 to $9,999 | 50 (0.4%) | 914 (5.6%) |
| $10,000 to $14,999 | 232 (1.8%) | 1,740 (10.6%) |
| $15,000 to $19,999 | 324 (2.5%) | 1,218 (7.4%) |
| $20,000 to $24,999 | 472 (3.7%) | 1,568 (9.6%) |
| $25,000 to $34,999 | 961 (7.6%) | 1,990 (12.1%) |
| $35,000 to $49,999 | 1,489 (11.7%) | 2,418 (14.7%) |
| $50,000 to $74,999 | 2,609 (20.6%) | 2,469 (15.0%) |
| $75,000 to $99,999 | 1,760 (13.9%) | 1,372 (8.4%) |
| $100,000 to $149,999 | 2,367 (18.6%) | 1,021 (6.2%) |
| $150,000 or more | 2,150 (16.9%) | 366 (2.2%) |
| Total | 12,691 (100.0%) | 16,420 (100.0%) |
Monthly Housing Cost Tiers in Kalamazoo
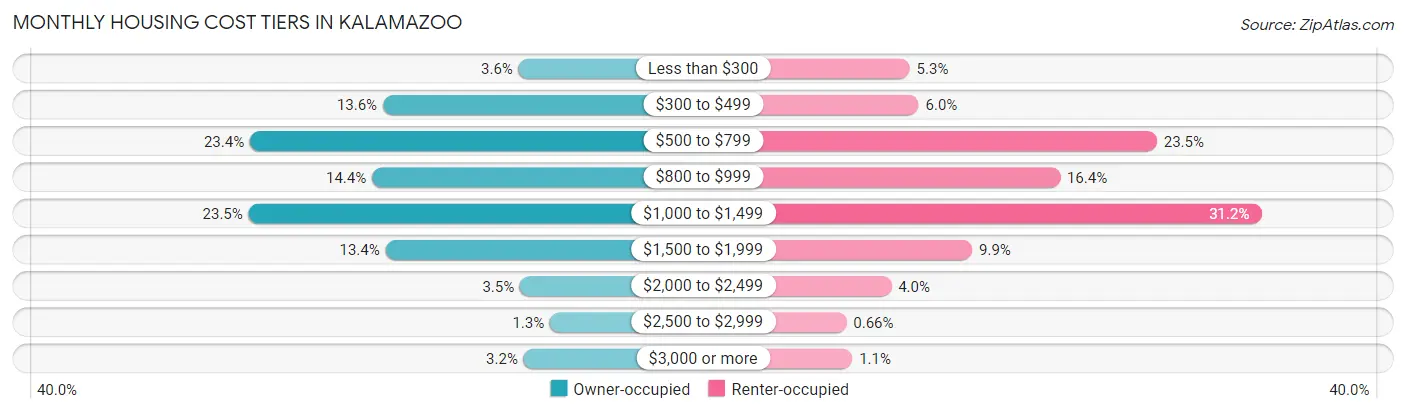
| Monthly Cost | Owner-occupied | Renter-occupied |
| Less than $300 | 458 (3.6%) | 874 (5.3%) |
| $300 to $499 | 1,727 (13.6%) | 982 (6.0%) |
| $500 to $799 | 2,970 (23.4%) | 3,862 (23.5%) |
| $800 to $999 | 1,829 (14.4%) | 2,691 (16.4%) |
| $1,000 to $1,499 | 2,983 (23.5%) | 5,125 (31.2%) |
| $1,500 to $1,999 | 1,703 (13.4%) | 1,629 (9.9%) |
| $2,000 to $2,499 | 445 (3.5%) | 651 (4.0%) |
| $2,500 to $2,999 | 165 (1.3%) | 108 (0.7%) |
| $3,000 or more | 411 (3.2%) | 179 (1.1%) |
| Total | 12,691 (100.0%) | 16,420 (100.0%) |
Physical Housing Characteristics in Kalamazoo
Housing Structures in Kalamazoo
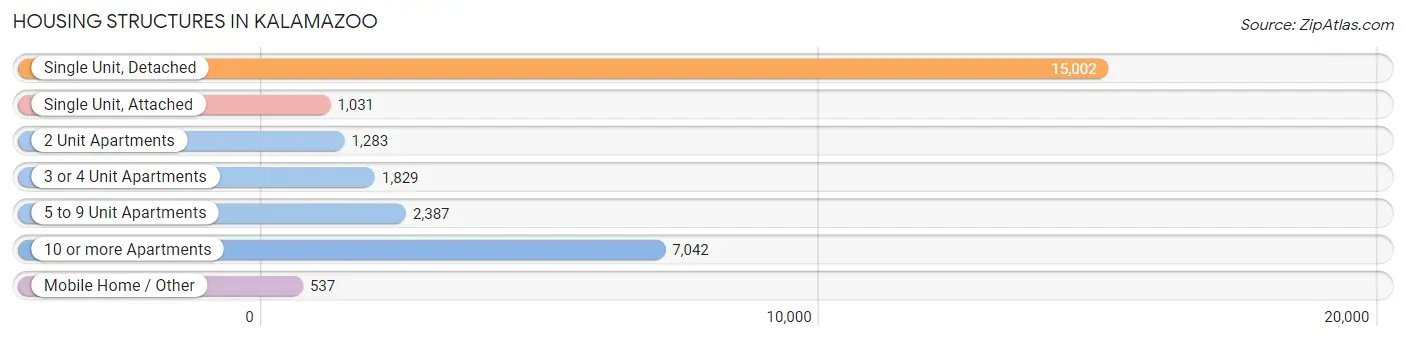
| Structure Type | # Housing Units | % Housing Units |
| Single Unit, Detached | 15,002 | 51.5% |
| Single Unit, Attached | 1,031 | 3.5% |
| 2 Unit Apartments | 1,283 | 4.4% |
| 3 or 4 Unit Apartments | 1,829 | 6.3% |
| 5 to 9 Unit Apartments | 2,387 | 8.2% |
| 10 or more Apartments | 7,042 | 24.2% |
| Mobile Home / Other | 537 | 1.8% |
| Total | 29,111 | 100.0% |
Housing Structures by Occupancy in Kalamazoo
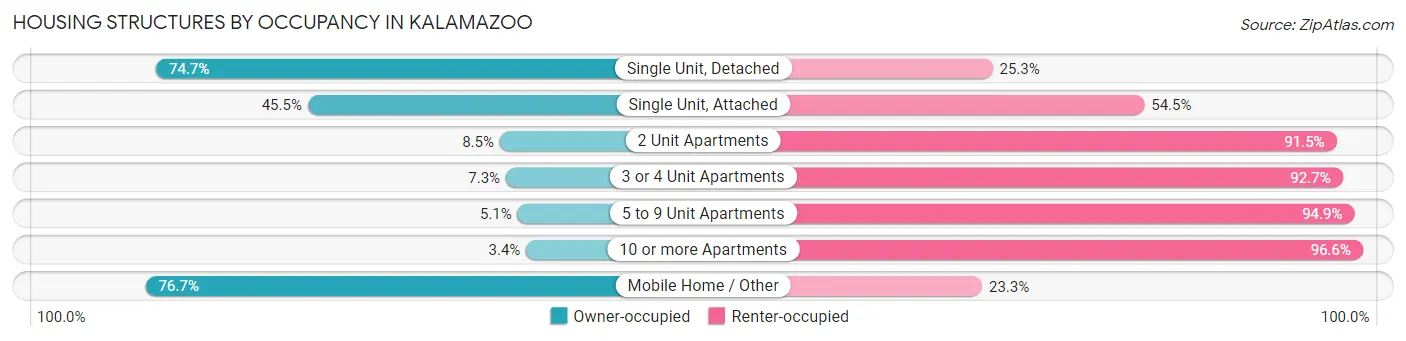
| Structure Type | Owner-occupied | Renter-occupied |
| Single Unit, Detached | 11,205 (74.7%) | 3,797 (25.3%) |
| Single Unit, Attached | 469 (45.5%) | 562 (54.5%) |
| 2 Unit Apartments | 109 (8.5%) | 1,174 (91.5%) |
| 3 or 4 Unit Apartments | 134 (7.3%) | 1,695 (92.7%) |
| 5 to 9 Unit Apartments | 121 (5.1%) | 2,266 (94.9%) |
| 10 or more Apartments | 241 (3.4%) | 6,801 (96.6%) |
| Mobile Home / Other | 412 (76.7%) | 125 (23.3%) |
| Total | 12,691 (43.6%) | 16,420 (56.4%) |
Housing Structures by Number of Rooms in Kalamazoo
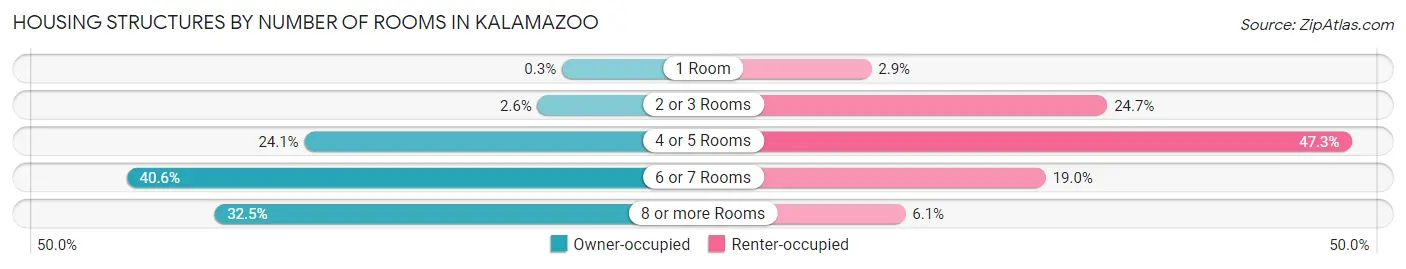
| Number of Rooms | Owner-occupied | Renter-occupied |
| 1 Room | 38 (0.3%) | 478 (2.9%) |
| 2 or 3 Rooms | 324 (2.5%) | 4,059 (24.7%) |
| 4 or 5 Rooms | 3,061 (24.1%) | 7,765 (47.3%) |
| 6 or 7 Rooms | 5,148 (40.6%) | 3,125 (19.0%) |
| 8 or more Rooms | 4,120 (32.5%) | 993 (6.0%) |
| Total | 12,691 (100.0%) | 16,420 (100.0%) |
Housing Structure by Heating Type in Kalamazoo
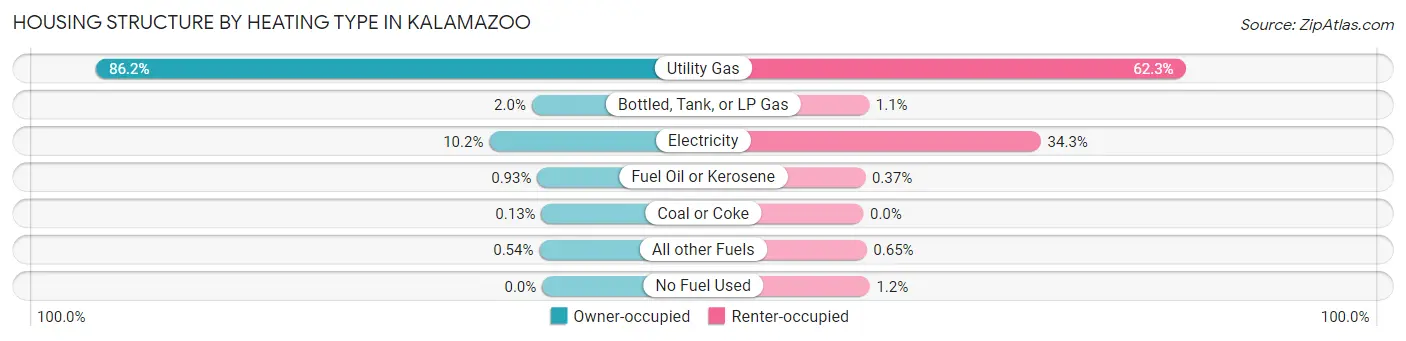
| Heating Type | Owner-occupied | Renter-occupied |
| Utility Gas | 10,937 (86.2%) | 10,228 (62.3%) |
| Bottled, Tank, or LP Gas | 254 (2.0%) | 184 (1.1%) |
| Electricity | 1,297 (10.2%) | 5,636 (34.3%) |
| Fuel Oil or Kerosene | 118 (0.9%) | 61 (0.4%) |
| Coal or Coke | 17 (0.1%) | 0 (0.0%) |
| All other Fuels | 68 (0.5%) | 107 (0.6%) |
| No Fuel Used | 0 (0.0%) | 204 (1.2%) |
| Total | 12,691 (100.0%) | 16,420 (100.0%) |
Household Vehicle Usage in Kalamazoo
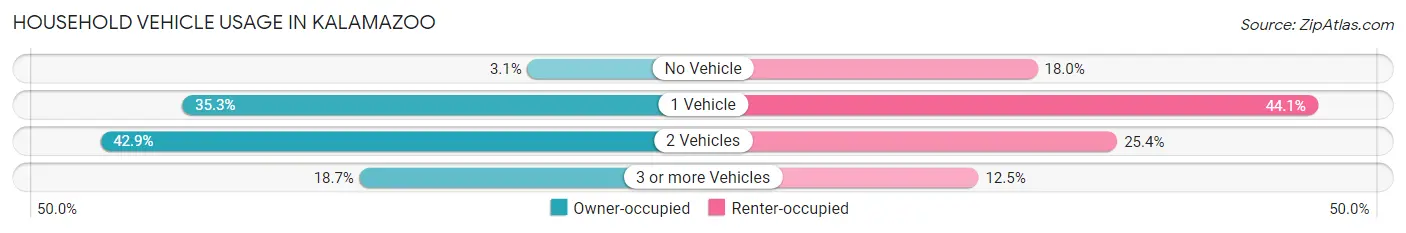
| Vehicles per Household | Owner-occupied | Renter-occupied |
| No Vehicle | 387 (3.0%) | 2,953 (18.0%) |
| 1 Vehicle | 4,479 (35.3%) | 7,246 (44.1%) |
| 2 Vehicles | 5,449 (42.9%) | 4,174 (25.4%) |
| 3 or more Vehicles | 2,376 (18.7%) | 2,047 (12.5%) |
| Total | 12,691 (100.0%) | 16,420 (100.0%) |
Real Estate & Mortgages in Kalamazoo
Real Estate and Mortgage Overview in Kalamazoo
| Characteristic | Without Mortgage | With Mortgage |
| Housing Units | 5,046 | 7,645 |
| Median Property Value | $129,900 | $162,600 |
| Median Household Income | $59,625 | $1,511 |
| Monthly Housing Costs | $572 | $411 |
| Real Estate Taxes | $2,477 | $188 |
Property Value by Mortgage Status in Kalamazoo
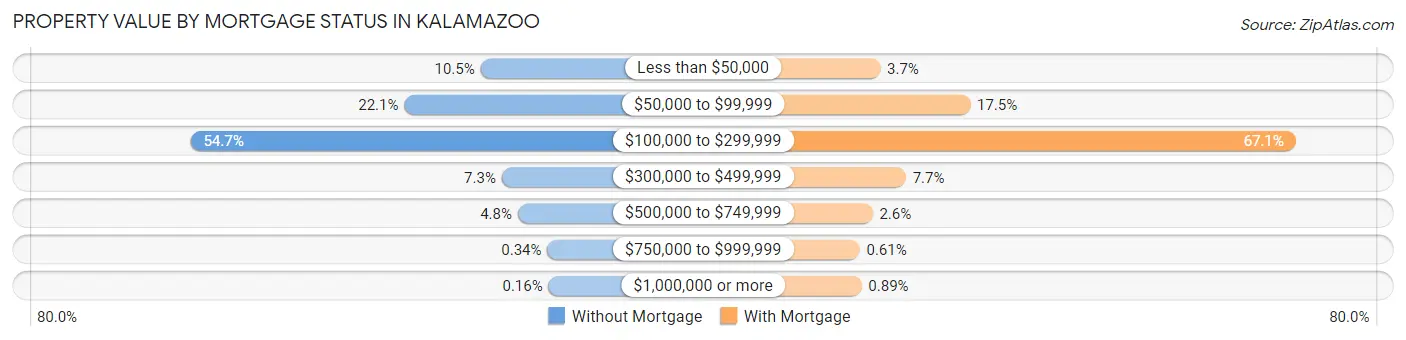
| Property Value | Without Mortgage | With Mortgage |
| Less than $50,000 | 531 (10.5%) | 286 (3.7%) |
| $50,000 to $99,999 | 1,117 (22.1%) | 1,334 (17.4%) |
| $100,000 to $299,999 | 2,761 (54.7%) | 5,128 (67.1%) |
| $300,000 to $499,999 | 368 (7.3%) | 585 (7.6%) |
| $500,000 to $749,999 | 244 (4.8%) | 197 (2.6%) |
| $750,000 to $999,999 | 17 (0.3%) | 47 (0.6%) |
| $1,000,000 or more | 8 (0.2%) | 68 (0.9%) |
| Total | 5,046 (100.0%) | 7,645 (100.0%) |
Household Income by Mortgage Status in Kalamazoo
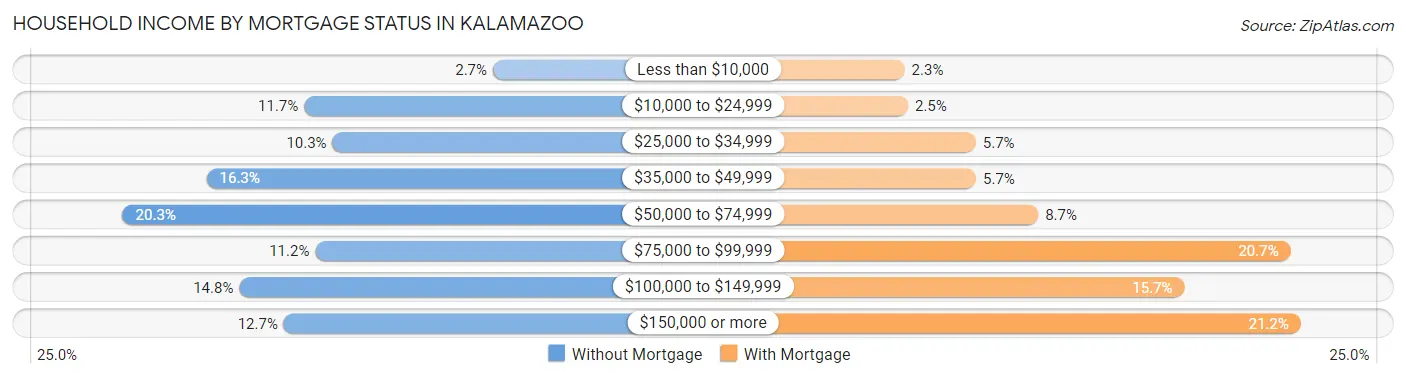
| Household Income | Without Mortgage | With Mortgage |
| Less than $10,000 | 136 (2.7%) | 179 (2.3%) |
| $10,000 to $24,999 | 590 (11.7%) | 191 (2.5%) |
| $25,000 to $34,999 | 522 (10.3%) | 438 (5.7%) |
| $35,000 to $49,999 | 824 (16.3%) | 439 (5.7%) |
| $50,000 to $74,999 | 1,026 (20.3%) | 665 (8.7%) |
| $75,000 to $99,999 | 563 (11.2%) | 1,583 (20.7%) |
| $100,000 to $149,999 | 746 (14.8%) | 1,197 (15.7%) |
| $150,000 or more | 639 (12.7%) | 1,621 (21.2%) |
| Total | 5,046 (100.0%) | 7,645 (100.0%) |
Property Value to Household Income Ratio in Kalamazoo
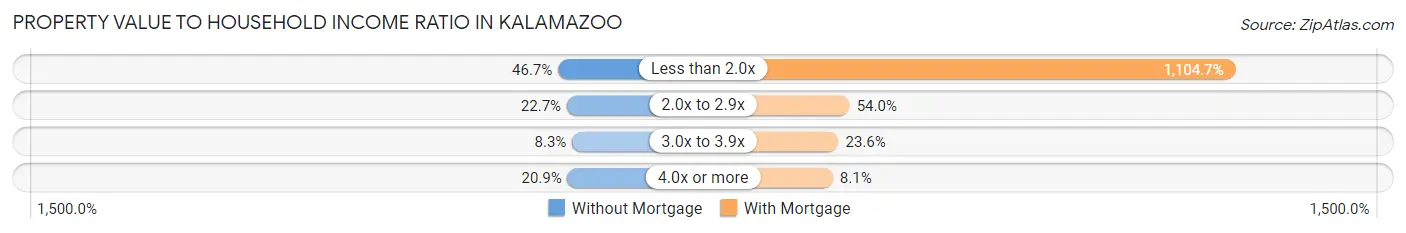
| Value-to-Income Ratio | Without Mortgage | With Mortgage |
| Less than 2.0x | 2,355 (46.7%) | 84,454 (1,104.7%) |
| 2.0x to 2.9x | 1,146 (22.7%) | 4,129 (54.0%) |
| 3.0x to 3.9x | 419 (8.3%) | 1,806 (23.6%) |
| 4.0x or more | 1,054 (20.9%) | 620 (8.1%) |
| Total | 5,046 (100.0%) | 7,645 (100.0%) |
Real Estate Taxes by Mortgage Status in Kalamazoo
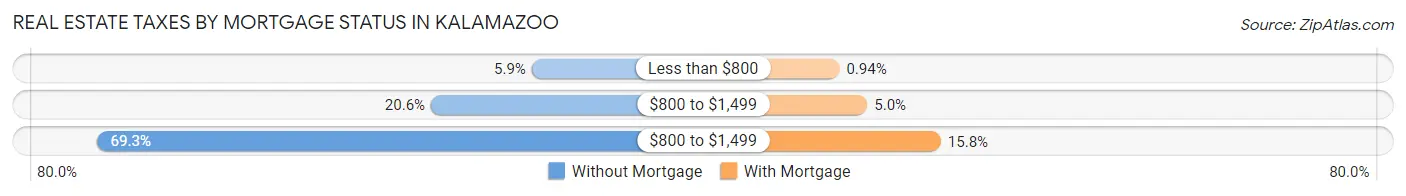
| Property Taxes | Without Mortgage | With Mortgage |
| Less than $800 | 298 (5.9%) | 72 (0.9%) |
| $800 to $1,499 | 1,041 (20.6%) | 383 (5.0%) |
| $800 to $1,499 | 3,498 (69.3%) | 1,205 (15.8%) |
| Total | 5,046 (100.0%) | 7,645 (100.0%) |
Health & Disability in Kalamazoo
Health Insurance Coverage by Age in Kalamazoo
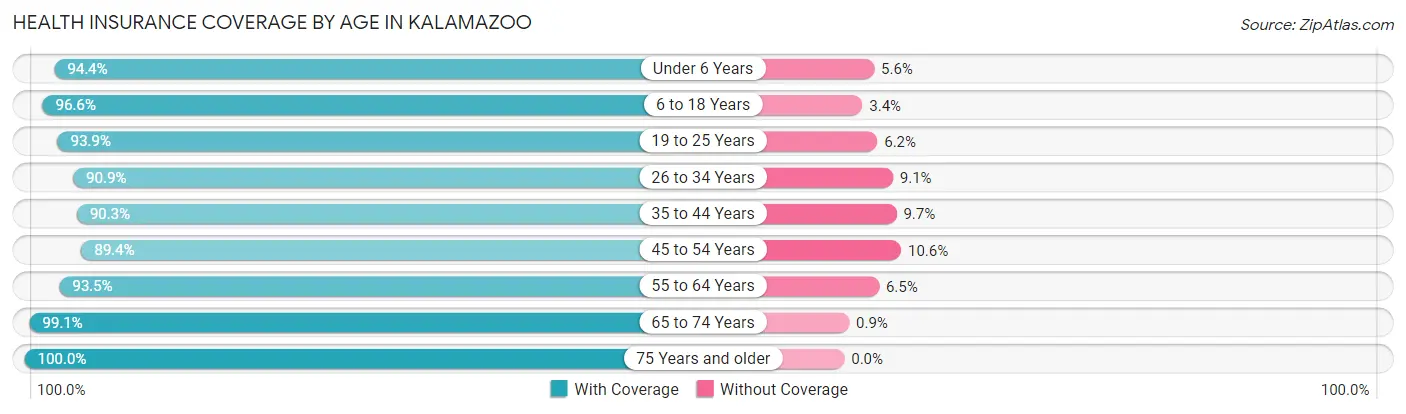
| Age Bracket | With Coverage | Without Coverage |
| Under 6 Years | 4,720 (94.4%) | 278 (5.6%) |
| 6 to 18 Years | 10,541 (96.6%) | 366 (3.4%) |
| 19 to 25 Years | 19,449 (93.9%) | 1,274 (6.1%) |
| 26 to 34 Years | 8,149 (90.9%) | 812 (9.1%) |
| 35 to 44 Years | 6,548 (90.3%) | 706 (9.7%) |
| 45 to 54 Years | 5,393 (89.4%) | 638 (10.6%) |
| 55 to 64 Years | 5,682 (93.5%) | 393 (6.5%) |
| 65 to 74 Years | 4,425 (99.1%) | 40 (0.9%) |
| 75 Years and older | 2,840 (100.0%) | 0 (0.0%) |
| Total | 67,747 (93.8%) | 4,507 (6.2%) |
Health Insurance Coverage by Citizenship Status in Kalamazoo
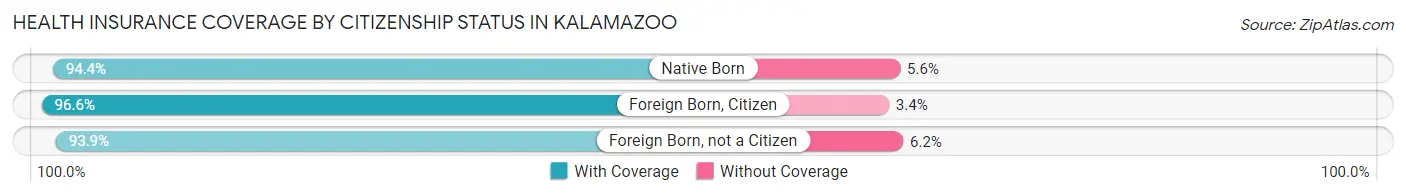
| Citizenship Status | With Coverage | Without Coverage |
| Native Born | 4,720 (94.4%) | 278 (5.6%) |
| Foreign Born, Citizen | 10,541 (96.6%) | 366 (3.4%) |
| Foreign Born, not a Citizen | 19,449 (93.9%) | 1,274 (6.1%) |
Health Insurance Coverage by Household Income in Kalamazoo
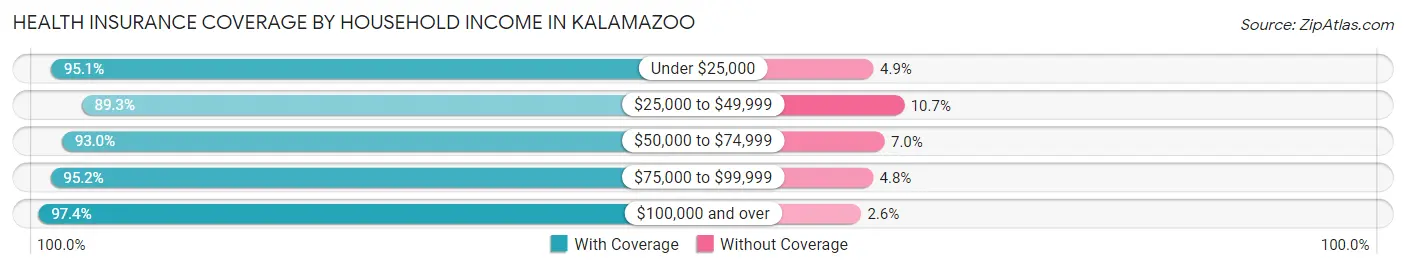
| Household Income | With Coverage | Without Coverage |
| Under $25,000 | 13,094 (95.1%) | 679 (4.9%) |
| $25,000 to $49,999 | 13,493 (89.3%) | 1,611 (10.7%) |
| $50,000 to $74,999 | 11,281 (93.0%) | 847 (7.0%) |
| $75,000 to $99,999 | 7,757 (95.2%) | 394 (4.8%) |
| $100,000 and over | 16,925 (97.4%) | 445 (2.6%) |
Public vs Private Health Insurance Coverage by Age in Kalamazoo
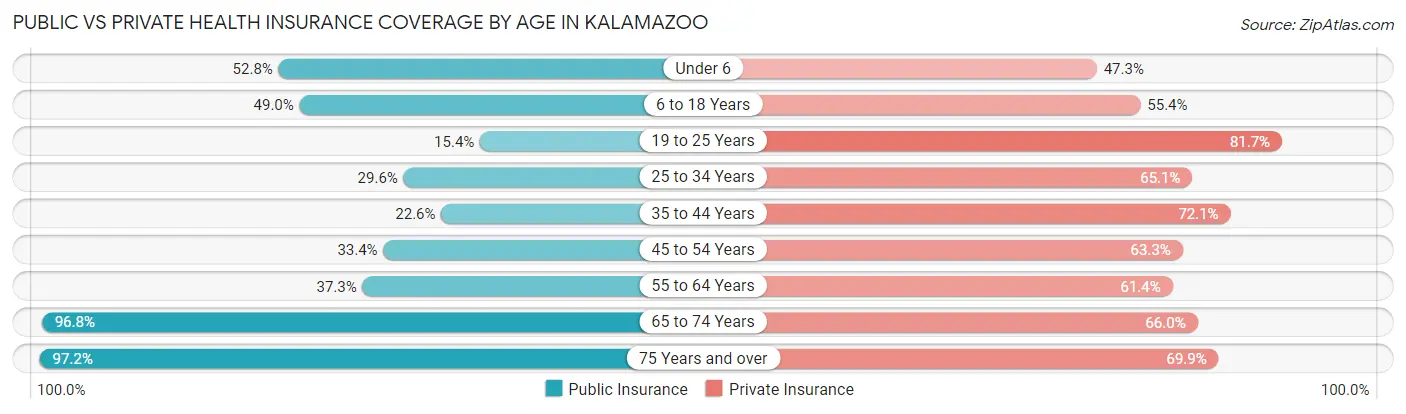
| Age Bracket | Public Insurance | Private Insurance |
| Under 6 | 2,641 (52.8%) | 2,365 (47.3%) |
| 6 to 18 Years | 5,339 (48.9%) | 6,045 (55.4%) |
| 19 to 25 Years | 3,199 (15.4%) | 16,928 (81.7%) |
| 25 to 34 Years | 2,656 (29.6%) | 5,829 (65.0%) |
| 35 to 44 Years | 1,642 (22.6%) | 5,232 (72.1%) |
| 45 to 54 Years | 2,014 (33.4%) | 3,815 (63.3%) |
| 55 to 64 Years | 2,264 (37.3%) | 3,729 (61.4%) |
| 65 to 74 Years | 4,323 (96.8%) | 2,948 (66.0%) |
| 75 Years and over | 2,761 (97.2%) | 1,986 (69.9%) |
| Total | 26,839 (37.1%) | 48,877 (67.6%) |
Disability Status by Sex by Age in Kalamazoo
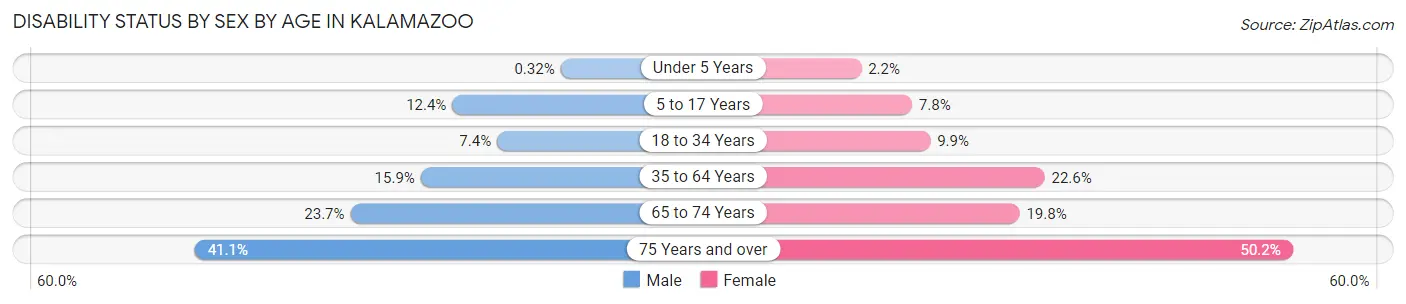
| Age Bracket | Male | Female |
| Under 5 Years | 7 (0.3%) | 39 (2.2%) |
| 5 to 17 Years | 603 (12.4%) | 384 (7.8%) |
| 18 to 34 Years | 1,156 (7.4%) | 1,596 (9.9%) |
| 35 to 64 Years | 1,559 (15.9%) | 2,156 (22.6%) |
| 65 to 74 Years | 443 (23.7%) | 514 (19.8%) |
| 75 Years and over | 452 (41.0%) | 873 (50.2%) |
Disability Class by Sex by Age in Kalamazoo
Disability Class: Hearing Difficulty
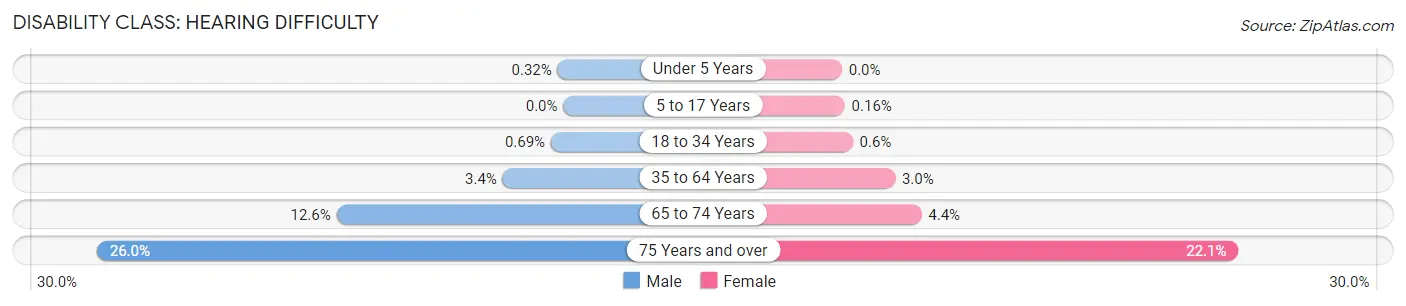
| Age Bracket | Male | Female |
| Under 5 Years | 7 (0.3%) | 0 (0.0%) |
| 5 to 17 Years | 0 (0.0%) | 8 (0.2%) |
| 18 to 34 Years | 108 (0.7%) | 97 (0.6%) |
| 35 to 64 Years | 332 (3.4%) | 283 (3.0%) |
| 65 to 74 Years | 236 (12.6%) | 115 (4.4%) |
| 75 Years and over | 286 (26.0%) | 384 (22.1%) |
Disability Class: Vision Difficulty
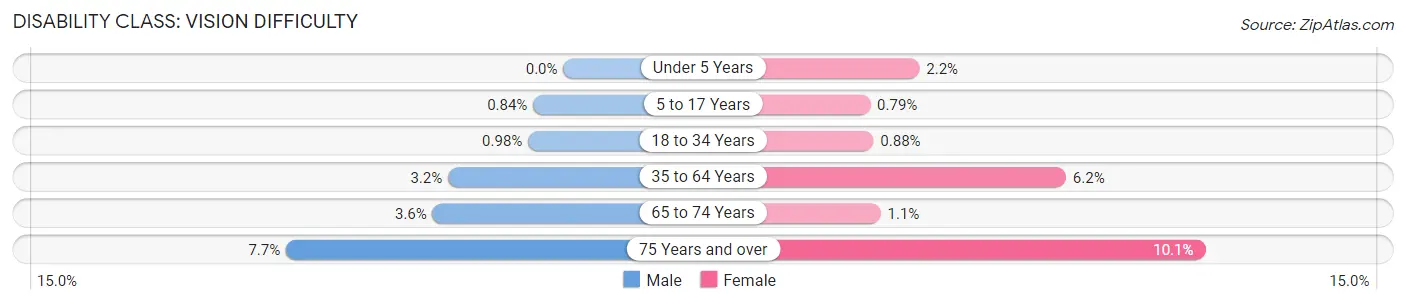
| Age Bracket | Male | Female |
| Under 5 Years | 0 (0.0%) | 39 (2.2%) |
| 5 to 17 Years | 41 (0.8%) | 39 (0.8%) |
| 18 to 34 Years | 153 (1.0%) | 142 (0.9%) |
| 35 to 64 Years | 315 (3.2%) | 596 (6.2%) |
| 65 to 74 Years | 68 (3.6%) | 28 (1.1%) |
| 75 Years and over | 85 (7.7%) | 176 (10.1%) |
Disability Class: Cognitive Difficulty
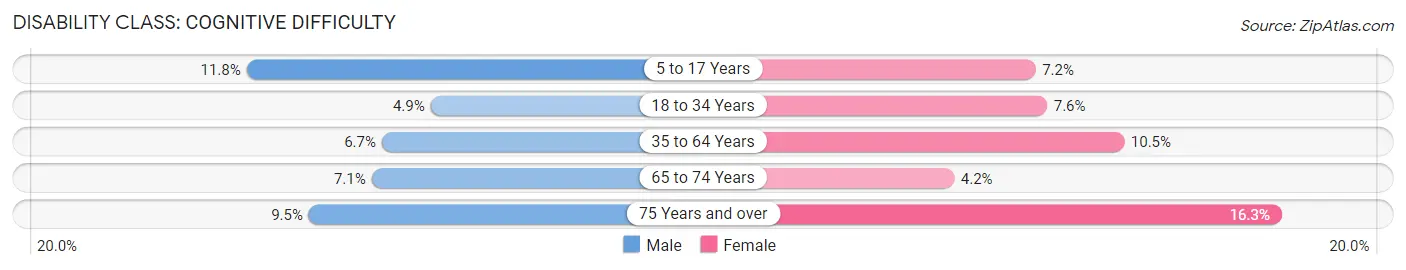
| Age Bracket | Male | Female |
| 5 to 17 Years | 573 (11.8%) | 353 (7.2%) |
| 18 to 34 Years | 771 (4.9%) | 1,233 (7.6%) |
| 35 to 64 Years | 661 (6.7%) | 1,000 (10.5%) |
| 65 to 74 Years | 133 (7.1%) | 108 (4.2%) |
| 75 Years and over | 104 (9.5%) | 284 (16.3%) |
Disability Class: Ambulatory Difficulty
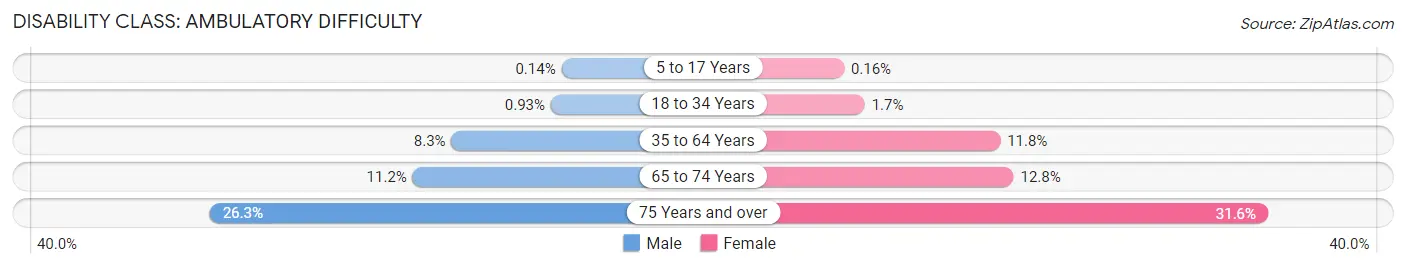
| Age Bracket | Male | Female |
| 5 to 17 Years | 7 (0.1%) | 8 (0.2%) |
| 18 to 34 Years | 146 (0.9%) | 276 (1.7%) |
| 35 to 64 Years | 815 (8.3%) | 1,123 (11.8%) |
| 65 to 74 Years | 209 (11.2%) | 331 (12.8%) |
| 75 Years and over | 289 (26.3%) | 550 (31.6%) |
Disability Class: Self-Care Difficulty
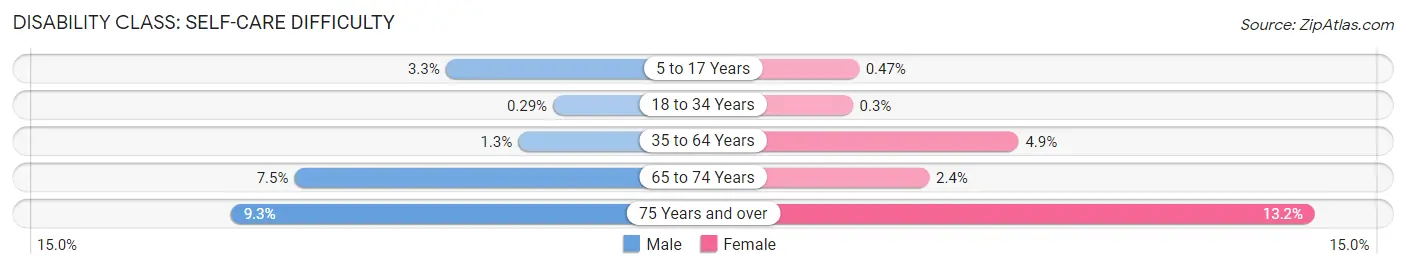
| Age Bracket | Male | Female |
| 5 to 17 Years | 160 (3.3%) | 23 (0.5%) |
| 18 to 34 Years | 45 (0.3%) | 49 (0.3%) |
| 35 to 64 Years | 124 (1.3%) | 470 (4.9%) |
| 65 to 74 Years | 140 (7.5%) | 63 (2.4%) |
| 75 Years and over | 102 (9.3%) | 229 (13.2%) |
Technology Access in Kalamazoo
Computing Device Access in Kalamazoo
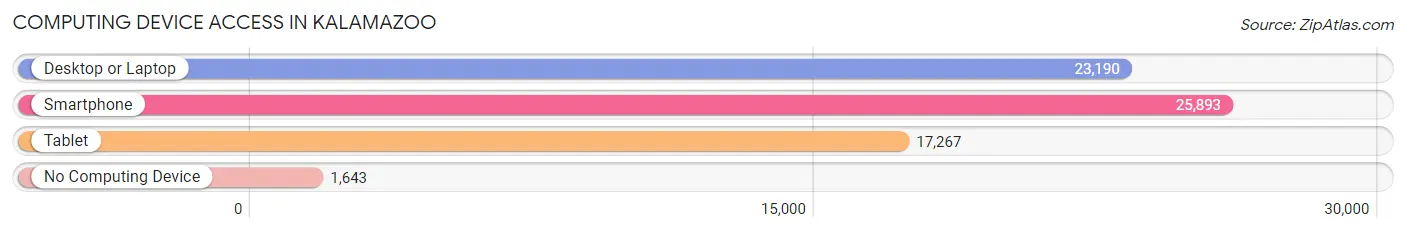
| Device Type | # Households | % Households |
| Desktop or Laptop | 23,190 | 79.7% |
| Smartphone | 25,893 | 88.9% |
| Tablet | 17,267 | 59.3% |
| No Computing Device | 1,643 | 5.6% |
| Total | 29,111 | 100.0% |
Internet Access in Kalamazoo
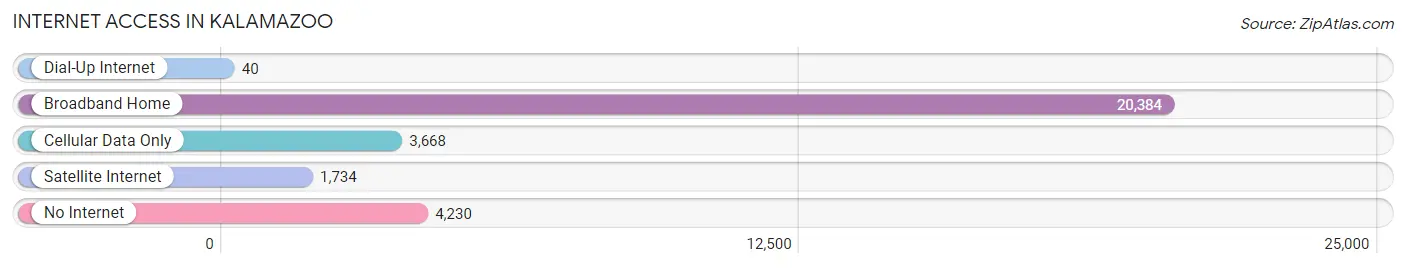
| Internet Type | # Households | % Households |
| Dial-Up Internet | 40 | 0.1% |
| Broadband Home | 20,384 | 70.0% |
| Cellular Data Only | 3,668 | 12.6% |
| Satellite Internet | 1,734 | 6.0% |
| No Internet | 4,230 | 14.5% |
| Total | 29,111 | 100.0% |
Kalamazoo Summary
Kalamazoo, Michigan is a city located in the southwestern region of the state. It is the county seat of Kalamazoo County and is the largest city in the county. The city is situated along the Kalamazoo River and is home to a population of approximately 75,000 people.
History
The area that is now Kalamazoo was first settled by Native Americans in the early 1800s. The Potawatomi were the first to inhabit the area, followed by the Ottawa and Chippewa tribes. The first European settlers arrived in the area in the 1830s and the city was officially founded in 1829. The city was named after the Kalamazoo River, which was named by the Potawatomi.
The city quickly grew in the mid-1800s due to its location along the Michigan Central Railroad. The city was also home to several industries, including paper mills, furniture factories, and breweries. The city was also home to the first paper mill in the United States.
In the late 1800s, the city was home to several educational institutions, including Kalamazoo College and Western Michigan University. The city was also home to several prominent businesses, including Gibson Guitar Company and Checker Motors.
Geography
Kalamazoo is located in the southwestern region of Michigan, approximately 90 miles east of Chicago. The city is situated along the Kalamazoo River and is surrounded by several lakes, including Gull Lake, Long Lake, and Eagle Lake. The city is also located near several state parks, including Fort Custer State Park and Kalamazoo State Park.
The city has a total area of 25.6 square miles, of which 24.7 square miles is land and 0.9 square miles is water. The city has a humid continental climate, with hot summers and cold winters.
Economy
Kalamazoo is home to a diverse economy, with several major industries. The city is home to several large employers, including Stryker Corporation, Pfizer, and Upjohn. The city is also home to several educational institutions, including Kalamazoo College and Western Michigan University.
The city is also home to several major cultural attractions, including the Kalamazoo Institute of Arts, the Kalamazoo Valley Museum, and the Kalamazoo Symphony Orchestra. The city is also home to several major festivals, including the Kalamazoo Blues Festival and the Kalamazoo Beer Week.
Demographics
As of the 2010 census, the population of Kalamazoo was 74,262. The racial makeup of the city was 73.2% White, 17.3% African American, 0.5% Native American, 3.2% Asian, and 5.8% from other races. The median household income was $37,890 and the median family income was $50,867.
The city is home to several religious denominations, including Christianity, Judaism, and Islam. The city is also home to several cultural attractions, including the Kalamazoo Institute of Arts, the Kalamazoo Valley Museum, and the Kalamazoo Symphony Orchestra.
Conclusion
Kalamazoo, Michigan is a city located in the southwestern region of the state. It is the county seat of Kalamazoo County and is the largest city in the county. The city is situated along the Kalamazoo River and is home to a population of approximately 75,000 people. The city has a diverse economy, with several major industries, educational institutions, and cultural attractions. The city is also home to several religious denominations and is home to several major festivals. The city has a total area of 25.6 square miles, of which 24.7 square miles is land and 0.9 square miles is water. The city has a humid continental climate, with hot summers and cold winters.
Common Questions
What is Per Capita Income in Kalamazoo?
Per Capita income in Kalamazoo is $27,191.
What is the Median Family Income in Kalamazoo?
Median Family Income in Kalamazoo is $61,336.
What is the Median Household income in Kalamazoo?
Median Household Income in Kalamazoo is $48,649.
What is Income or Wage Gap in Kalamazoo?
Income or Wage Gap in Kalamazoo is 30.2%.
Women in Kalamazoo earn 69.8 cents for every dollar earned by a man.
What is Family Income Deficit in Kalamazoo?
Family Income Deficit in Kalamazoo is $10,938.
Families that are below poverty line in Kalamazoo earn $10,938 less on average than the poverty threshold level.
What is Inequality or Gini Index in Kalamazoo?
Inequality or Gini Index in Kalamazoo is 0.48.
What is the Total Population of Kalamazoo?
Total Population of Kalamazoo is 73,342.
What is the Total Male Population of Kalamazoo?
Total Male Population of Kalamazoo is 36,162.
What is the Total Female Population of Kalamazoo?
Total Female Population of Kalamazoo is 37,180.
What is the Ratio of Males per 100 Females in Kalamazoo?
There are 97.26 Males per 100 Females in Kalamazoo.
What is the Ratio of Females per 100 Males in Kalamazoo?
There are 102.82 Females per 100 Males in Kalamazoo.
What is the Median Population Age in Kalamazoo?
Median Population Age in Kalamazoo is 25.9 Years.
What is the Average Family Size in Kalamazoo
Average Family Size in Kalamazoo is 3.0 People.
What is the Average Household Size in Kalamazoo
Average Household Size in Kalamazoo is 2.3 People.
How Large is the Labor Force in Kalamazoo?
There are 40,306 People in the Labor Forcein in Kalamazoo.
What is the Percentage of People in the Labor Force in Kalamazoo?
65.9% of People are in the Labor Force in Kalamazoo.
What is the Unemployment Rate in Kalamazoo?
Unemployment Rate in Kalamazoo is 8.1%.