Champaign, IL Map & Demographics
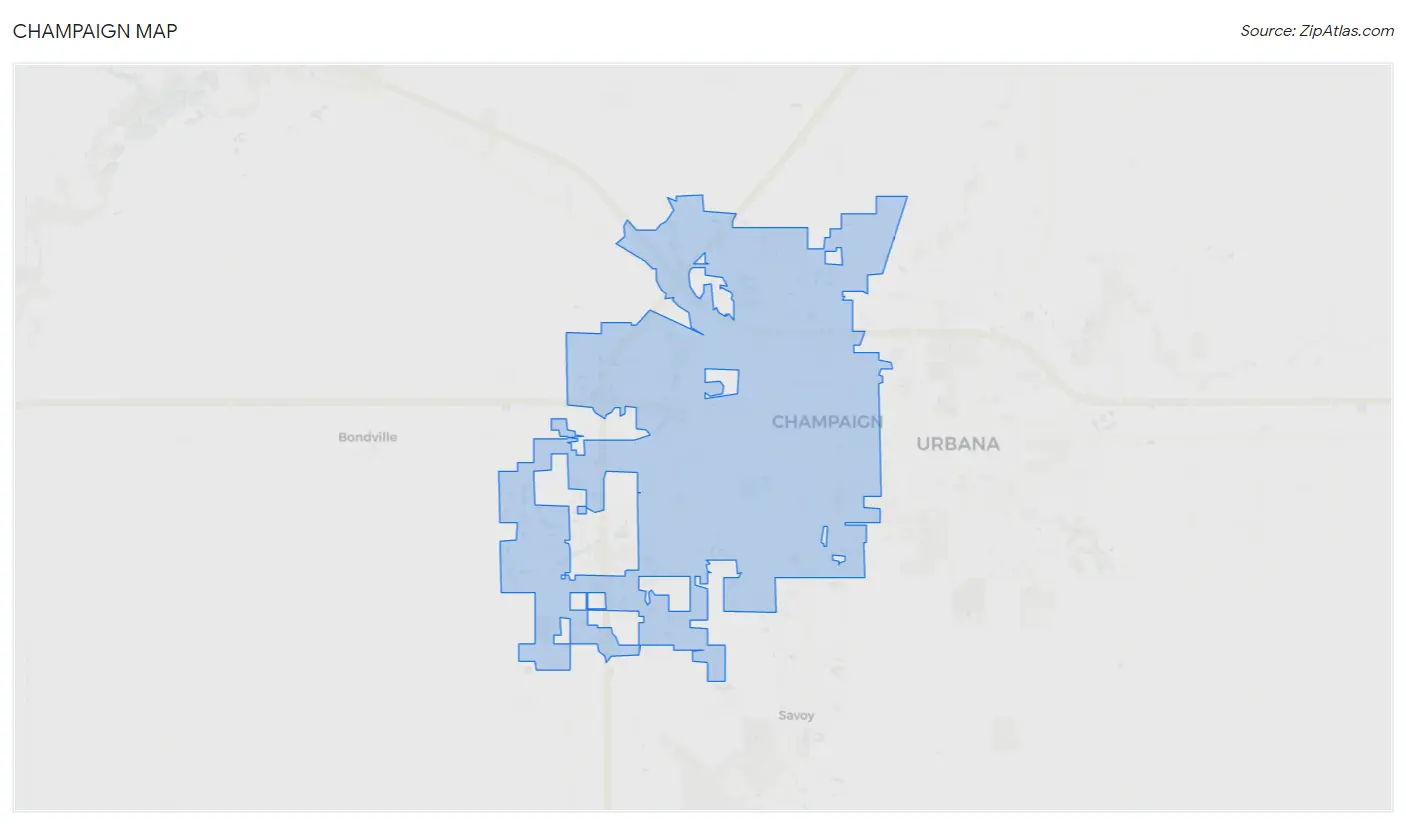
Champaign Map
Champaign Overview
$34,879
PER CAPITA INCOME
$88,990
AVG FAMILY INCOME
$58,273
AVG HOUSEHOLD INCOME
26.0%
WAGE / INCOME GAP [ % ]
74.0¢/ $1
WAGE / INCOME GAP [ $ ]
$10,397
FAMILY INCOME DEFICIT
0.53
INEQUALITY / GINI INDEX
88,628
TOTAL POPULATION
45,558
MALE POPULATION
43,070
FEMALE POPULATION
105.78
MALES / 100 FEMALES
94.54
FEMALES / 100 MALES
27.0
MEDIAN AGE
3.1
AVG FAMILY SIZE
2.3
AVG HOUSEHOLD SIZE
45,698
LABOR FORCE [ PEOPLE ]
60.9%
PERCENT IN LABOR FORCE
4.8%
UNEMPLOYMENT RATE
Champaign Area Codes
Income in Champaign
Income Overview in Champaign
Per Capita Income in Champaign is $34,879, while median incomes of families and households are $88,990 and $58,273 respectively.
| Characteristic | Number | Measure |
| Per Capita Income | 88,628 | $34,879 |
| Median Family Income | 16,511 | $88,990 |
| Mean Family Income | 16,511 | $119,244 |
| Median Household Income | 35,300 | $58,273 |
| Mean Household Income | 35,300 | $83,729 |
| Income Deficit | 16,511 | $10,397 |
| Wage / Income Gap (%) | 88,628 | 25.98% |
| Wage / Income Gap ($) | 88,628 | 74.02¢ per $1 |
| Gini / Inequality Index | 88,628 | 0.53 |
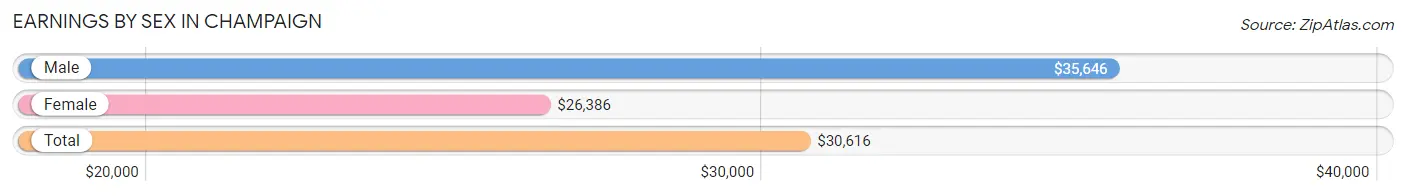
Earnings by Sex in Champaign
Average Earnings in Champaign are $30,616, $35,646 for men and $26,386 for women, a difference of 26.0%.
| Sex | Number | Average Earnings |
| Male | 27,844 (53.5%) | $35,646 |
| Female | 24,212 (46.5%) | $26,386 |
| Total | 52,056 (100.0%) | $30,616 |
Earnings by Sex by Income Bracket in Champaign
The most common earnings brackets in Champaign are $100,000+ for men (3,894 | 14.0%) and $2,499 or less for women (2,791 | 11.5%).
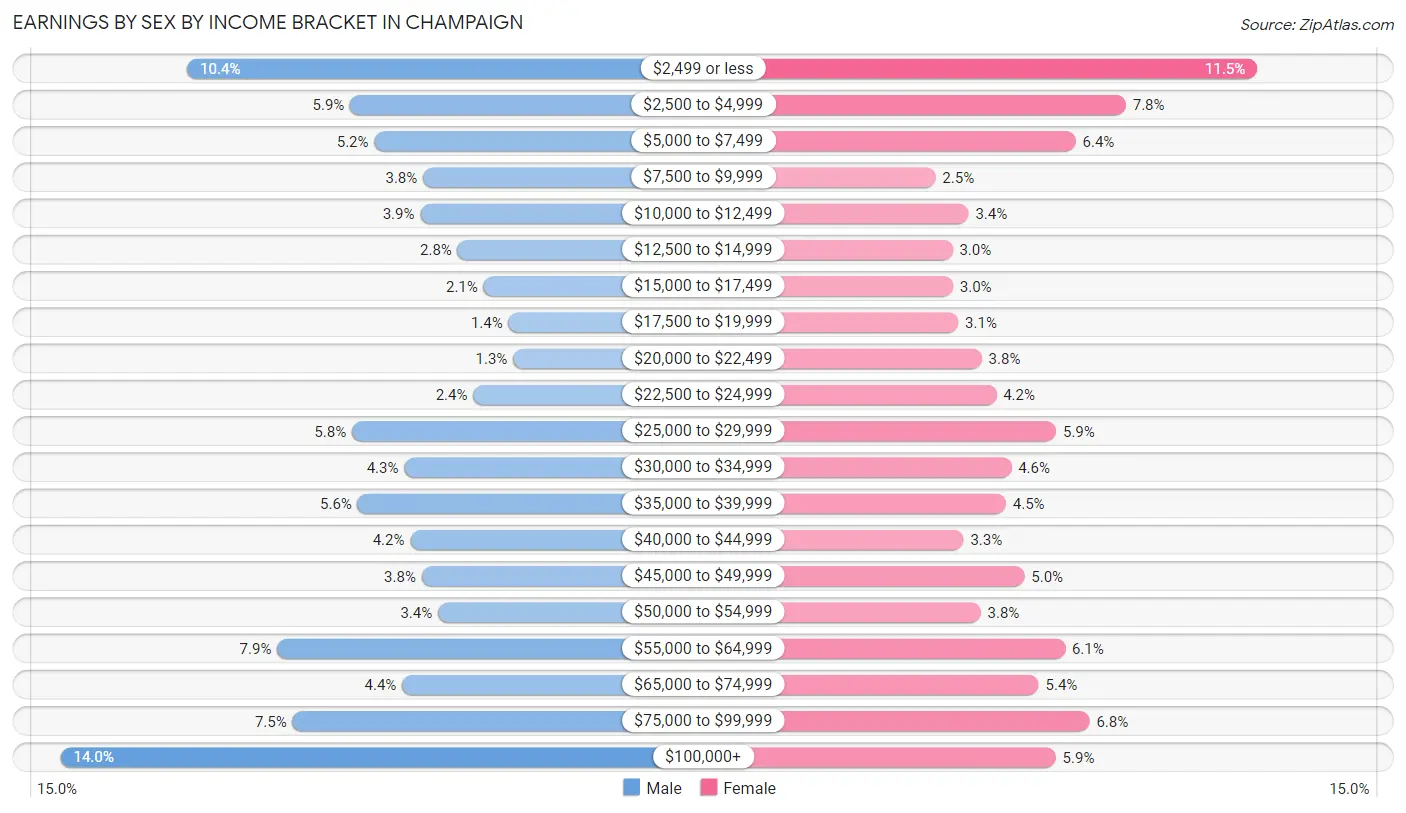
| Income | Male | Female |
| $2,499 or less | 2,903 (10.4%) | 2,791 (11.5%) |
| $2,500 to $4,999 | 1,628 (5.9%) | 1,898 (7.8%) |
| $5,000 to $7,499 | 1,439 (5.2%) | 1,558 (6.4%) |
| $7,500 to $9,999 | 1,058 (3.8%) | 602 (2.5%) |
| $10,000 to $12,499 | 1,079 (3.9%) | 828 (3.4%) |
| $12,500 to $14,999 | 787 (2.8%) | 720 (3.0%) |
| $15,000 to $17,499 | 586 (2.1%) | 721 (3.0%) |
| $17,500 to $19,999 | 389 (1.4%) | 757 (3.1%) |
| $20,000 to $22,499 | 355 (1.3%) | 918 (3.8%) |
| $22,500 to $24,999 | 666 (2.4%) | 1,018 (4.2%) |
| $25,000 to $29,999 | 1,615 (5.8%) | 1,424 (5.9%) |
| $30,000 to $34,999 | 1,205 (4.3%) | 1,118 (4.6%) |
| $35,000 to $39,999 | 1,570 (5.6%) | 1,083 (4.5%) |
| $40,000 to $44,999 | 1,158 (4.2%) | 795 (3.3%) |
| $45,000 to $49,999 | 1,068 (3.8%) | 1,209 (5.0%) |
| $50,000 to $54,999 | 942 (3.4%) | 910 (3.8%) |
| $55,000 to $64,999 | 2,201 (7.9%) | 1,484 (6.1%) |
| $65,000 to $74,999 | 1,222 (4.4%) | 1,305 (5.4%) |
| $75,000 to $99,999 | 2,079 (7.5%) | 1,651 (6.8%) |
| $100,000+ | 3,894 (14.0%) | 1,422 (5.9%) |
| Total | 27,844 (100.0%) | 24,212 (100.0%) |
Earnings by Sex by Educational Attainment in Champaign
Average earnings in Champaign are $53,407 for men and $42,603 for women, a difference of 20.2%. Men with an educational attainment of graduate degree enjoy the highest average annual earnings of $88,301, while those with less than high school education earn the least with $29,973. Women with an educational attainment of graduate degree earn the most with the average annual earnings of $61,698, while those with less than high school education have the smallest earnings of $21,487.
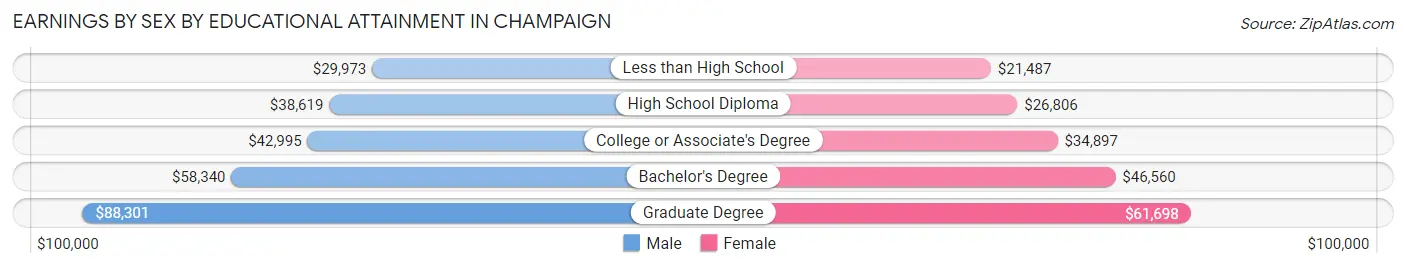
| Educational Attainment | Male Income | Female Income |
| Less than High School | $29,973 | $21,487 |
| High School Diploma | $38,619 | $26,806 |
| College or Associate's Degree | $42,995 | $34,897 |
| Bachelor's Degree | $58,340 | $46,560 |
| Graduate Degree | $88,301 | $61,698 |
| Total | $53,407 | $42,603 |
Family Income in Champaign
Family Income Brackets in Champaign
According to the Champaign family income data, there are 3,319 families falling into the $100,000 to $149,999 income range, which is the most common income bracket and makes up 20.1% of all families. Conversely, the $10,000 to $14,999 income bracket is the least frequent group with only 248 families (1.5%) belonging to this category.
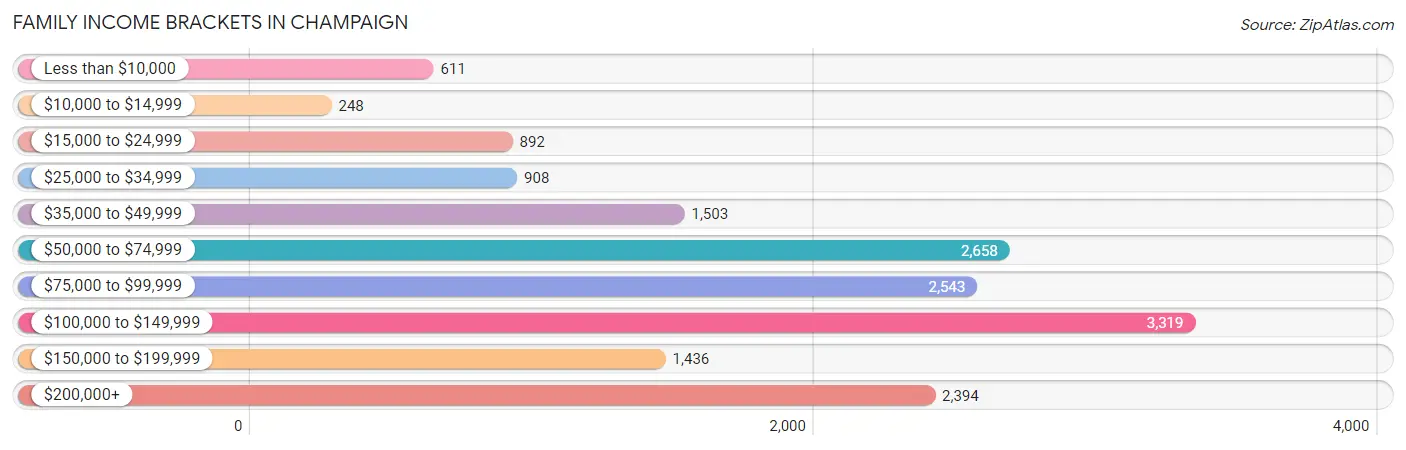
| Income Bracket | # Families | % Families |
| Less than $10,000 | 611 | 3.7% |
| $10,000 to $14,999 | 248 | 1.5% |
| $15,000 to $24,999 | 892 | 5.4% |
| $25,000 to $34,999 | 908 | 5.5% |
| $35,000 to $49,999 | 1,503 | 9.1% |
| $50,000 to $74,999 | 2,658 | 16.1% |
| $75,000 to $99,999 | 2,543 | 15.4% |
| $100,000 to $149,999 | 3,319 | 20.1% |
| $150,000 to $199,999 | 1,436 | 8.7% |
| $200,000+ | 2,394 | 14.5% |
Family Income by Famaliy Size in Champaign
4-person families (2,860 | 17.3%) account for the highest median family income in Champaign with $96,368 per family, while 2-person families (8,551 | 51.8%) have the highest median income of $44,670 per family member.
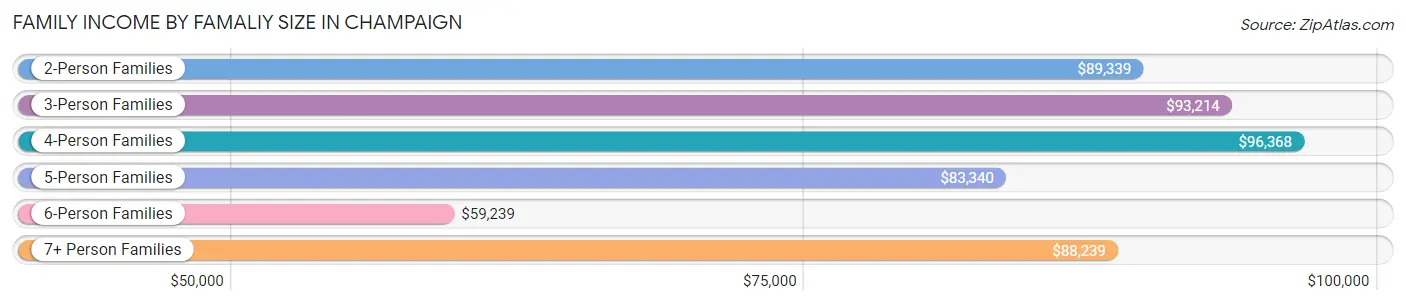
| Income Bracket | # Families | Median Income |
| 2-Person Families | 8,551 (51.8%) | $89,339 |
| 3-Person Families | 3,712 (22.5%) | $93,214 |
| 4-Person Families | 2,860 (17.3%) | $96,368 |
| 5-Person Families | 773 (4.7%) | $83,340 |
| 6-Person Families | 442 (2.7%) | $59,239 |
| 7+ Person Families | 173 (1.1%) | $88,239 |
| Total | 16,511 (100.0%) | $88,990 |
Family Income by Number of Earners in Champaign
The median family income in Champaign is $88,990, with families comprising 3+ earners (1,156) having the highest median family income of $126,667, while families with 1 earner (5,713) have the lowest median family income of $59,891, accounting for 7.0% and 34.6% of families, respectively.
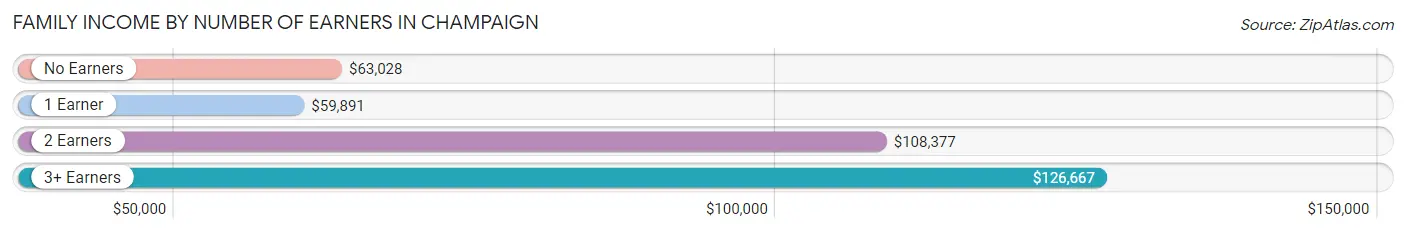
| Number of Earners | # Families | Median Income |
| No Earners | 2,193 (13.3%) | $63,028 |
| 1 Earner | 5,713 (34.6%) | $59,891 |
| 2 Earners | 7,449 (45.1%) | $108,377 |
| 3+ Earners | 1,156 (7.0%) | $126,667 |
| Total | 16,511 (100.0%) | $88,990 |
Household Income in Champaign
Household Income Brackets in Champaign
With 6,107 households falling in the category, the $50,000 to $74,999 income range is the most frequent in Champaign, accounting for 17.3% of all households. In contrast, only 1,094 households (3.1%) fall into the $10,000 to $14,999 income bracket, making it the least populous group.
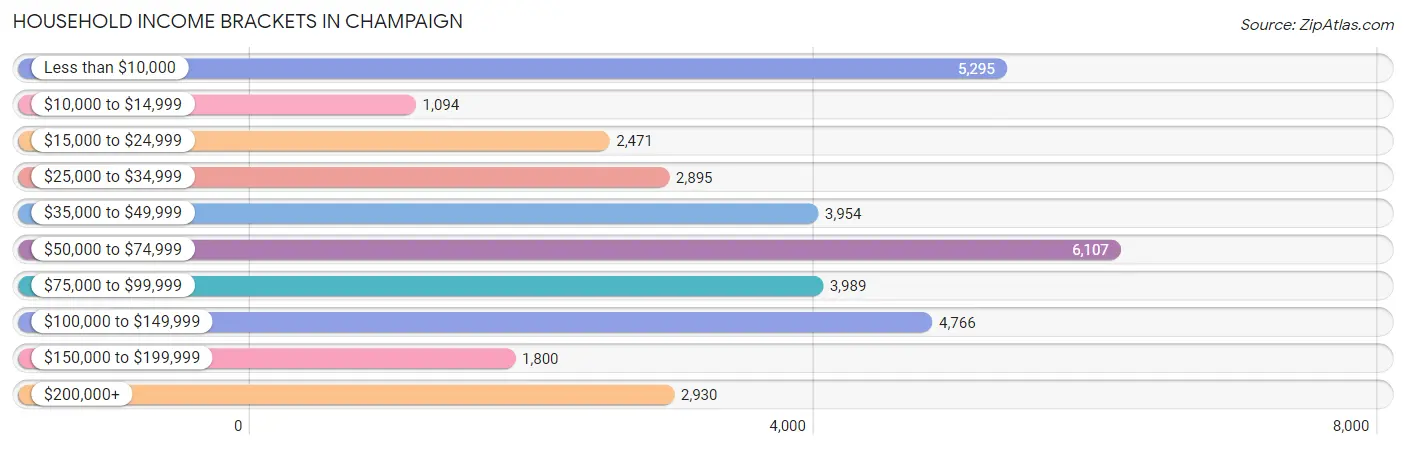
| Income Bracket | # Households | % Households |
| Less than $10,000 | 5,295 | 15.0% |
| $10,000 to $14,999 | 1,094 | 3.1% |
| $15,000 to $24,999 | 2,471 | 7.0% |
| $25,000 to $34,999 | 2,895 | 8.2% |
| $35,000 to $49,999 | 3,954 | 11.2% |
| $50,000 to $74,999 | 6,107 | 17.3% |
| $75,000 to $99,999 | 3,989 | 11.3% |
| $100,000 to $149,999 | 4,766 | 13.5% |
| $150,000 to $199,999 | 1,800 | 5.1% |
| $200,000+ | 2,930 | 8.3% |
Household Income by Householder Age in Champaign
The median household income in Champaign is $58,273, with the highest median household income of $87,850 found in the 45 to 64 years age bracket for the primary householder. A total of 8,804 households (24.9%) fall into this category. Meanwhile, the 15 to 24 years age bracket for the primary householder has the lowest median household income of $15,398, with 7,287 households (20.6%) in this group.
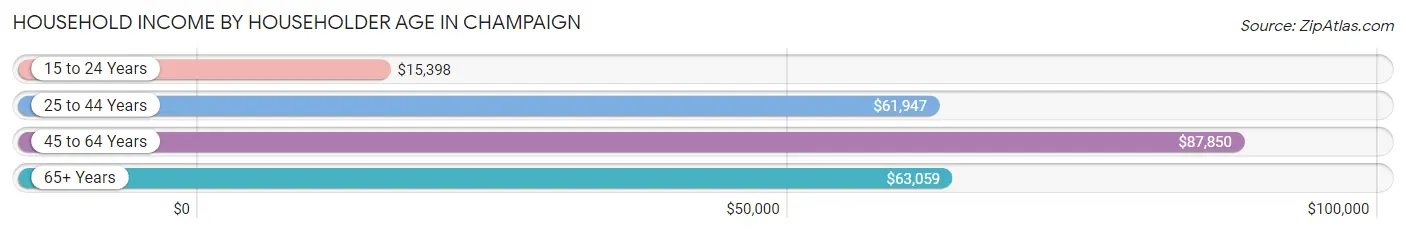
| Income Bracket | # Households | Median Income |
| 15 to 24 Years | 7,287 (20.6%) | $15,398 |
| 25 to 44 Years | 13,042 (36.9%) | $61,947 |
| 45 to 64 Years | 8,804 (24.9%) | $87,850 |
| 65+ Years | 6,167 (17.5%) | $63,059 |
| Total | 35,300 (100.0%) | $58,273 |
Poverty in Champaign
Income Below Poverty by Sex and Age in Champaign
With 23.1% poverty level for males and 24.0% for females among the residents of Champaign, 18 to 24 year old males and 18 to 24 year old females are the most vulnerable to poverty, with 5,901 males (61.2%) and 5,372 females (57.1%) in their respective age groups living below the poverty level.
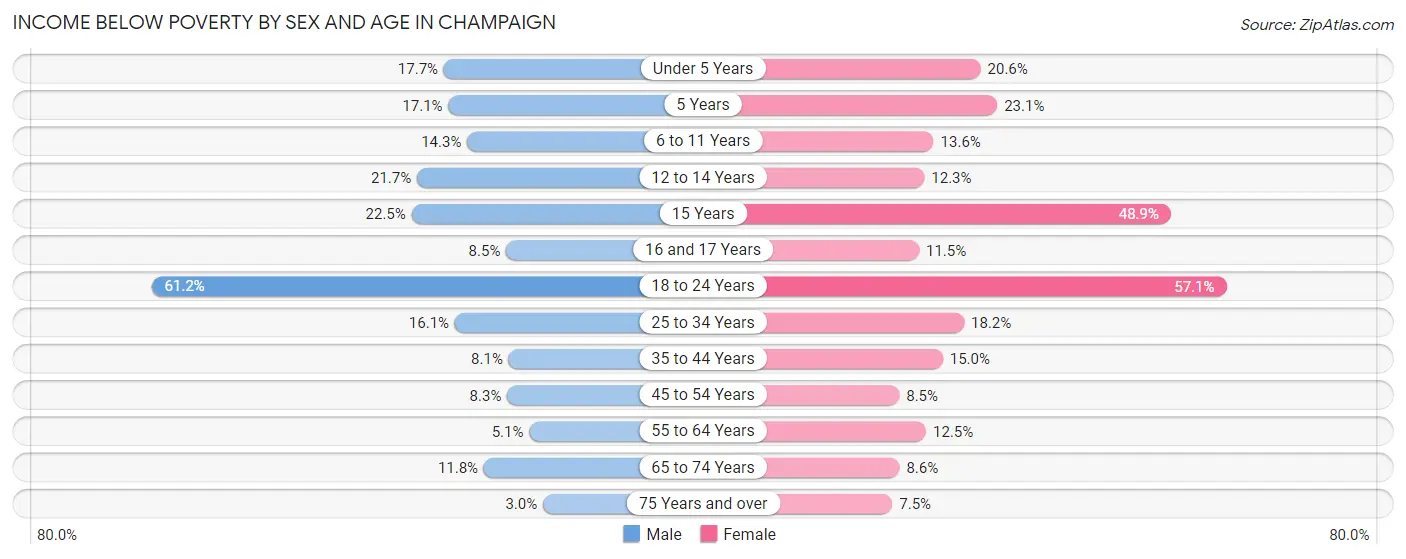
| Age Bracket | Male | Female |
| Under 5 Years | 423 (17.7%) | 434 (20.6%) |
| 5 Years | 70 (17.1%) | 108 (23.1%) |
| 6 to 11 Years | 412 (14.3%) | 264 (13.6%) |
| 12 to 14 Years | 201 (21.7%) | 201 (12.3%) |
| 15 Years | 98 (22.5%) | 128 (48.8%) |
| 16 and 17 Years | 74 (8.5%) | 82 (11.5%) |
| 18 to 24 Years | 5,901 (61.2%) | 5,372 (57.1%) |
| 25 to 34 Years | 1,137 (16.1%) | 1,075 (18.2%) |
| 35 to 44 Years | 403 (8.1%) | 672 (15.0%) |
| 45 to 54 Years | 309 (8.3%) | 309 (8.5%) |
| 55 to 64 Years | 194 (5.1%) | 465 (12.5%) |
| 65 to 74 Years | 309 (11.8%) | 280 (8.6%) |
| 75 Years and over | 49 (3.0%) | 165 (7.5%) |
| Total | 9,580 (23.1%) | 9,555 (24.0%) |
Income Above Poverty by Sex and Age in Champaign
According to the poverty statistics in Champaign, males aged 75 years and over and females aged 75 years and over are the age groups that are most secure financially, with 97.0% of males and 92.5% of females in these age groups living above the poverty line.
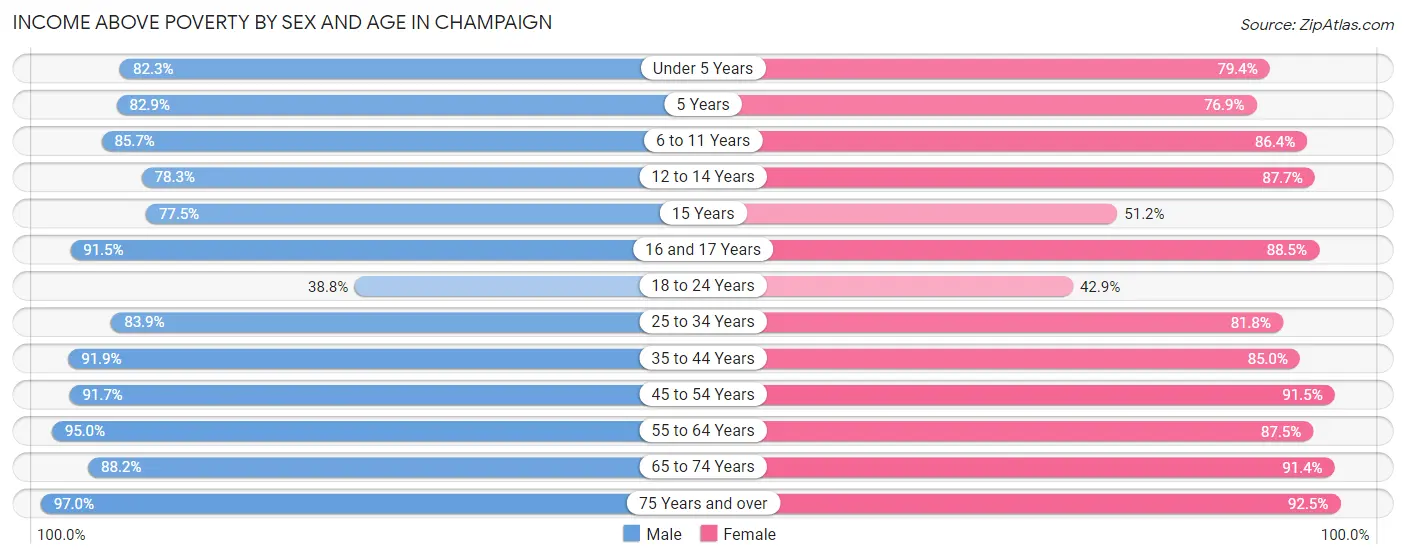
| Age Bracket | Male | Female |
| Under 5 Years | 1,962 (82.3%) | 1,672 (79.4%) |
| 5 Years | 340 (82.9%) | 360 (76.9%) |
| 6 to 11 Years | 2,475 (85.7%) | 1,672 (86.4%) |
| 12 to 14 Years | 724 (78.3%) | 1,439 (87.7%) |
| 15 Years | 337 (77.5%) | 134 (51.1%) |
| 16 and 17 Years | 799 (91.5%) | 633 (88.5%) |
| 18 to 24 Years | 3,747 (38.8%) | 4,038 (42.9%) |
| 25 to 34 Years | 5,927 (83.9%) | 4,845 (81.8%) |
| 35 to 44 Years | 4,566 (91.9%) | 3,809 (85.0%) |
| 45 to 54 Years | 3,399 (91.7%) | 3,308 (91.5%) |
| 55 to 64 Years | 3,649 (95.0%) | 3,249 (87.5%) |
| 65 to 74 Years | 2,311 (88.2%) | 2,992 (91.4%) |
| 75 Years and over | 1,578 (97.0%) | 2,033 (92.5%) |
| Total | 31,814 (76.9%) | 30,184 (76.0%) |
Income Below Poverty Among Married-Couple Families in Champaign
The poverty statistics for married-couple families in Champaign show that 3.9% or 469 of the total 12,068 families live below the poverty line. Families with 5 or more children have the highest poverty rate of 26.9%, comprising of 18 families. On the other hand, families with 1 or 2 children have the lowest poverty rate of 3.0%, which includes 118 families.
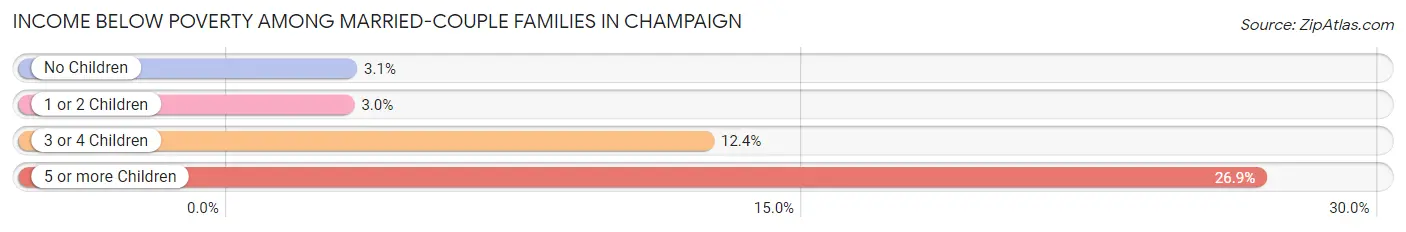
| Children | Above Poverty | Below Poverty |
| No Children | 7,037 (96.9%) | 226 (3.1%) |
| 1 or 2 Children | 3,759 (97.0%) | 118 (3.0%) |
| 3 or 4 Children | 754 (87.6%) | 107 (12.4%) |
| 5 or more Children | 49 (73.1%) | 18 (26.9%) |
| Total | 11,599 (96.1%) | 469 (3.9%) |
Income Below Poverty Among Single-Parent Households in Champaign
According to the poverty data in Champaign, 15.9% or 186 single-father households and 26.1% or 856 single-mother households are living below the poverty line. Among single-father households, those with no children have the highest poverty rate, with 91 households (18.1%) experiencing poverty. Likewise, among single-mother households, those with 3 or 4 children have the highest poverty rate, with 182 households (40.0%) falling below the poverty line.
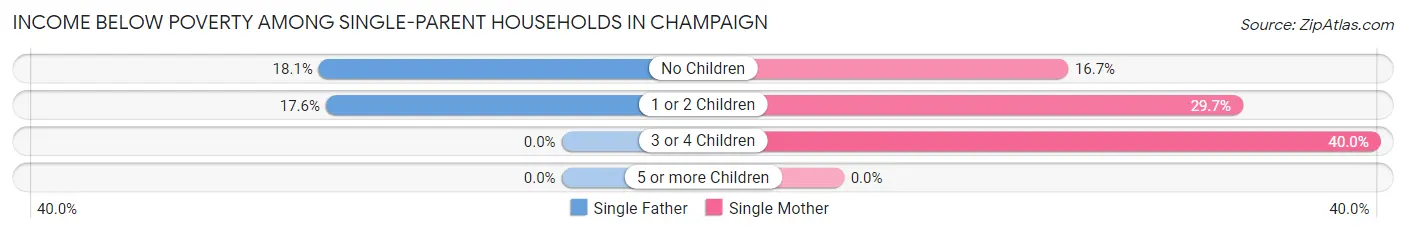
| Children | Single Father | Single Mother |
| No Children | 91 (18.1%) | 193 (16.7%) |
| 1 or 2 Children | 95 (17.6%) | 481 (29.7%) |
| 3 or 4 Children | 0 (0.0%) | 182 (40.0%) |
| 5 or more Children | 0 (0.0%) | 0 (0.0%) |
| Total | 186 (15.9%) | 856 (26.1%) |
Income Below Poverty Among Married-Couple vs Single-Parent Households in Champaign
The poverty data for Champaign shows that 469 of the married-couple family households (3.9%) and 1,042 of the single-parent households (23.4%) are living below the poverty level. Within the married-couple family households, those with 5 or more children have the highest poverty rate, with 18 households (26.9%) falling below the poverty line. Among the single-parent households, those with 3 or 4 children have the highest poverty rate, with 182 household (31.4%) living below poverty.
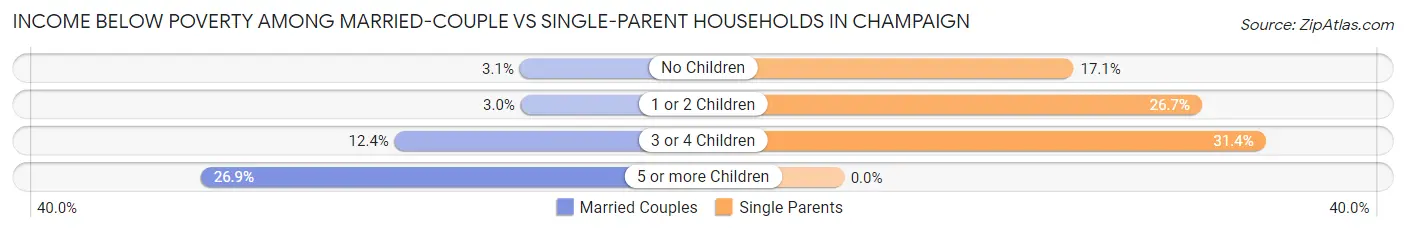
| Children | Married-Couple Families | Single-Parent Households |
| No Children | 226 (3.1%) | 284 (17.1%) |
| 1 or 2 Children | 118 (3.0%) | 576 (26.7%) |
| 3 or 4 Children | 107 (12.4%) | 182 (31.4%) |
| 5 or more Children | 18 (26.9%) | 0 (0.0%) |
| Total | 469 (3.9%) | 1,042 (23.4%) |
Race in Champaign
The most populous races in Champaign are White / Caucasian (52,904 | 59.7%), Black / African American (15,246 | 17.2%), and Asian (14,060 | 15.9%).
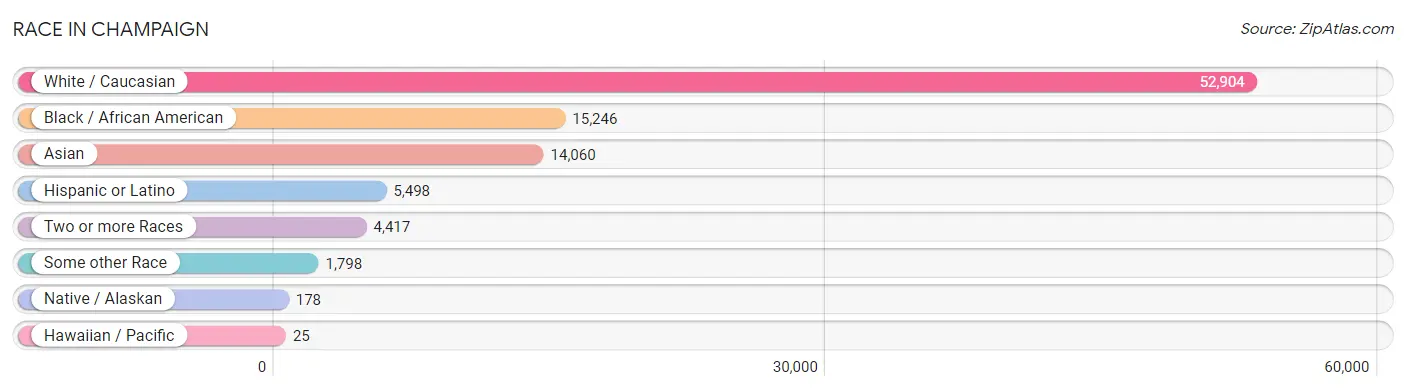
| Race | # Population | % Population |
| Asian | 14,060 | 15.9% |
| Black / African American | 15,246 | 17.2% |
| Hawaiian / Pacific | 25 | 0.0% |
| Hispanic or Latino | 5,498 | 6.2% |
| Native / Alaskan | 178 | 0.2% |
| White / Caucasian | 52,904 | 59.7% |
| Two or more Races | 4,417 | 5.0% |
| Some other Race | 1,798 | 2.0% |
| Total | 88,628 | 100.0% |
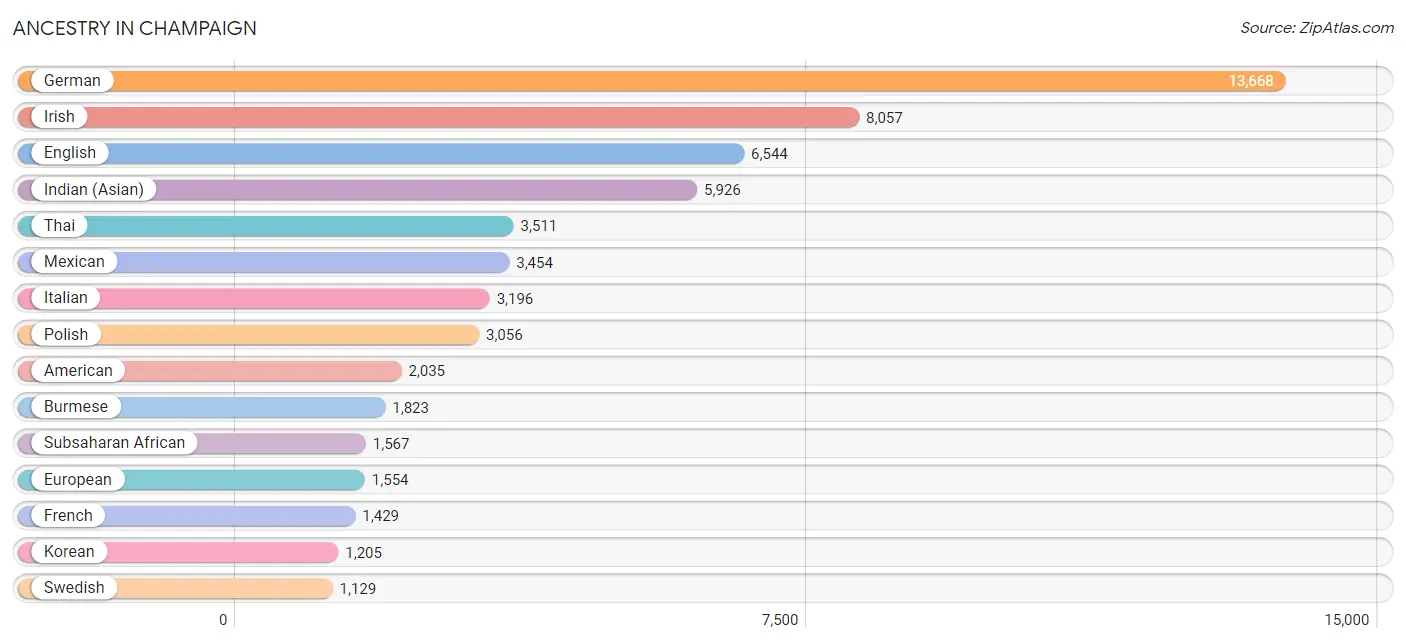
Ancestry in Champaign
The most populous ancestries reported in Champaign are German (13,668 | 15.4%), Irish (8,057 | 9.1%), English (6,544 | 7.4%), Indian (Asian) (5,926 | 6.7%), and Thai (3,511 | 4.0%), together accounting for 42.5% of all Champaign residents.
| Ancestry | # Population | % Population |
| African | 821 | 0.9% |
| Albanian | 3 | 0.0% |
| American | 2,035 | 2.3% |
| Apache | 24 | 0.0% |
| Arab | 552 | 0.6% |
| Argentinean | 101 | 0.1% |
| Armenian | 86 | 0.1% |
| Australian | 5 | 0.0% |
| Austrian | 245 | 0.3% |
| Bangladeshi | 9 | 0.0% |
| Belgian | 82 | 0.1% |
| Belizean | 18 | 0.0% |
| Bermudan | 17 | 0.0% |
| Bhutanese | 224 | 0.3% |
| Blackfeet | 18 | 0.0% |
| Bolivian | 49 | 0.1% |
| Brazilian | 98 | 0.1% |
| British | 421 | 0.5% |
| Bulgarian | 3 | 0.0% |
| Burmese | 1,823 | 2.1% |
| Cambodian | 100 | 0.1% |
| Canadian | 115 | 0.1% |
| Carpatho Rusyn | 16 | 0.0% |
| Central American | 673 | 0.8% |
| Central American Indian | 98 | 0.1% |
| Cherokee | 70 | 0.1% |
| Chickasaw | 21 | 0.0% |
| Chilean | 33 | 0.0% |
| Chippewa | 21 | 0.0% |
| Colombian | 56 | 0.1% |
| Costa Rican | 124 | 0.1% |
| Creek | 32 | 0.0% |
| Croatian | 131 | 0.2% |
| Cuban | 76 | 0.1% |
| Cypriot | 8 | 0.0% |
| Czech | 233 | 0.3% |
| Czechoslovakian | 100 | 0.1% |
| Danish | 256 | 0.3% |
| Dominican | 78 | 0.1% |
| Dutch | 615 | 0.7% |
| Eastern European | 235 | 0.3% |
| Ecuadorian | 49 | 0.1% |
| Egyptian | 153 | 0.2% |
| English | 6,544 | 7.4% |
| Ethiopian | 9 | 0.0% |
| European | 1,554 | 1.8% |
| Filipino | 230 | 0.3% |
| Finnish | 115 | 0.1% |
| French | 1,429 | 1.6% |
| French Canadian | 135 | 0.2% |
| German | 13,668 | 15.4% |
| German Russian | 18 | 0.0% |
| Ghanaian | 5 | 0.0% |
| Greek | 324 | 0.4% |
| Guatemalan | 459 | 0.5% |
| Guyanese | 1 | 0.0% |
| Haitian | 2 | 0.0% |
| Honduran | 11 | 0.0% |
| Hungarian | 256 | 0.3% |
| Indian (Asian) | 5,926 | 6.7% |
| Indonesian | 18 | 0.0% |
| Iranian | 147 | 0.2% |
| Irish | 8,057 | 9.1% |
| Israeli | 72 | 0.1% |
| Italian | 3,196 | 3.6% |
| Jamaican | 33 | 0.0% |
| Japanese | 51 | 0.1% |
| Jordanian | 28 | 0.0% |
| Kenyan | 14 | 0.0% |
| Korean | 1,205 | 1.4% |
| Laotian | 33 | 0.0% |
| Latvian | 18 | 0.0% |
| Lebanese | 91 | 0.1% |
| Lithuanian | 123 | 0.1% |
| Malaysian | 108 | 0.1% |
| Mexican | 3,454 | 3.9% |
| Mexican American Indian | 22 | 0.0% |
| Mongolian | 54 | 0.1% |
| Moroccan | 83 | 0.1% |
| Native Hawaiian | 6 | 0.0% |
| Nigerian | 54 | 0.1% |
| Northern European | 448 | 0.5% |
| Norwegian | 857 | 1.0% |
| Pakistani | 470 | 0.5% |
| Palestinian | 44 | 0.1% |
| Panamanian | 19 | 0.0% |
| Peruvian | 135 | 0.2% |
| Polish | 3,056 | 3.5% |
| Portuguese | 122 | 0.1% |
| Potawatomi | 12 | 0.0% |
| Puerto Rican | 431 | 0.5% |
| Romanian | 12 | 0.0% |
| Russian | 788 | 0.9% |
| Salvadoran | 60 | 0.1% |
| Samoan | 40 | 0.1% |
| Scandinavian | 324 | 0.4% |
| Scotch-Irish | 682 | 0.8% |
| Scottish | 1,098 | 1.2% |
| Serbian | 29 | 0.0% |
| Slovak | 178 | 0.2% |
| Slovene | 17 | 0.0% |
| South African | 43 | 0.1% |
| South American | 478 | 0.5% |
| Spaniard | 127 | 0.1% |
| Spanish | 43 | 0.1% |
| Sri Lankan | 832 | 0.9% |
| Subsaharan African | 1,567 | 1.8% |
| Swedish | 1,129 | 1.3% |
| Swiss | 369 | 0.4% |
| Thai | 3,511 | 4.0% |
| Turkish | 84 | 0.1% |
| Ukrainian | 83 | 0.1% |
| Venezuelan | 55 | 0.1% |
| Vietnamese | 59 | 0.1% |
| Welsh | 333 | 0.4% |
| West Indian | 17 | 0.0% |
| Yugoslavian | 22 | 0.0% | View All 117 Rows |
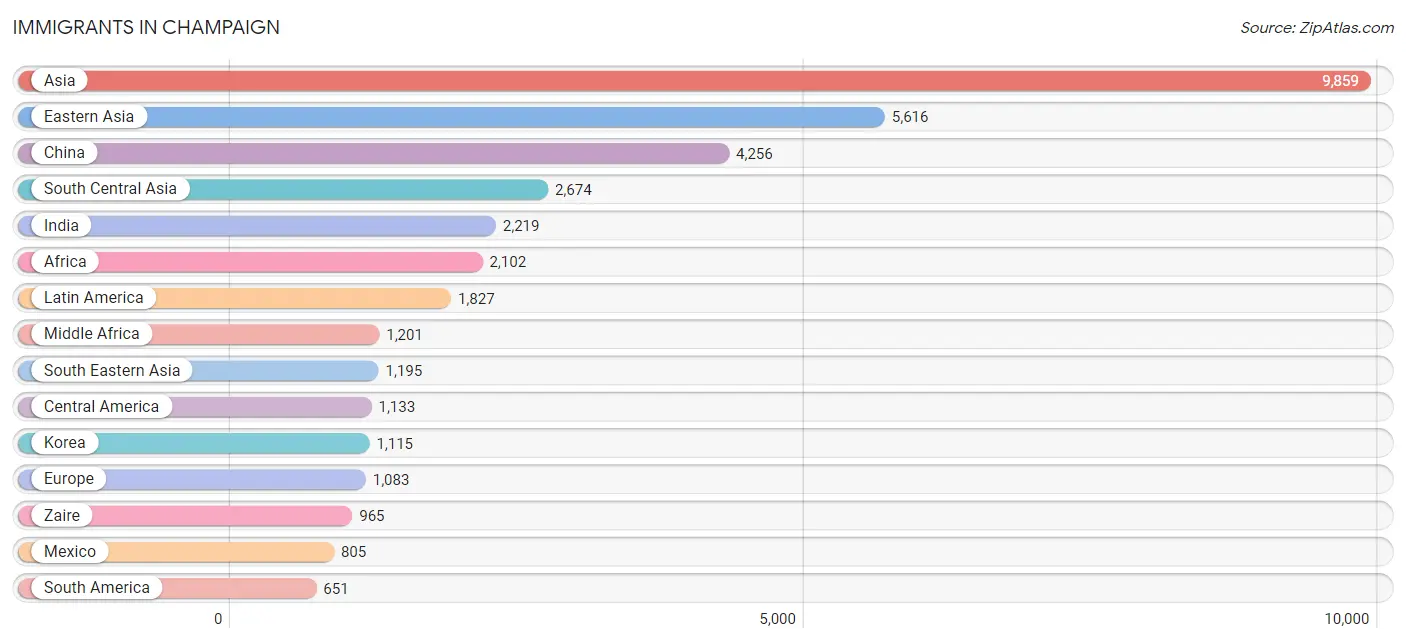
Immigrants in Champaign
The most numerous immigrant groups reported in Champaign came from Asia (9,859 | 11.1%), Eastern Asia (5,616 | 6.3%), China (4,256 | 4.8%), South Central Asia (2,674 | 3.0%), and India (2,219 | 2.5%), together accounting for 27.8% of all Champaign residents.
| Immigration Origin | # Population | % Population |
| Africa | 2,102 | 2.4% |
| Argentina | 139 | 0.2% |
| Asia | 9,859 | 11.1% |
| Australia | 5 | 0.0% |
| Austria | 48 | 0.1% |
| Bangladesh | 81 | 0.1% |
| Brazil | 299 | 0.3% |
| Bulgaria | 3 | 0.0% |
| Cameroon | 181 | 0.2% |
| Canada | 166 | 0.2% |
| Caribbean | 43 | 0.1% |
| Central America | 1,133 | 1.3% |
| Chile | 3 | 0.0% |
| China | 4,256 | 4.8% |
| Colombia | 49 | 0.1% |
| Congo | 55 | 0.1% |
| Costa Rica | 29 | 0.0% |
| Cuba | 27 | 0.0% |
| Czechoslovakia | 35 | 0.0% |
| Eastern Africa | 53 | 0.1% |
| Eastern Asia | 5,616 | 6.3% |
| Eastern Europe | 434 | 0.5% |
| Ecuador | 18 | 0.0% |
| Egypt | 152 | 0.2% |
| El Salvador | 66 | 0.1% |
| England | 18 | 0.0% |
| Ethiopia | 9 | 0.0% |
| Europe | 1,083 | 1.2% |
| Germany | 122 | 0.1% |
| Greece | 26 | 0.0% |
| Guatemala | 166 | 0.2% |
| Haiti | 2 | 0.0% |
| Hong Kong | 36 | 0.0% |
| Hungary | 17 | 0.0% |
| India | 2,219 | 2.5% |
| Indonesia | 13 | 0.0% |
| Iran | 124 | 0.1% |
| Ireland | 11 | 0.0% |
| Israel | 74 | 0.1% |
| Italy | 112 | 0.1% |
| Jamaica | 14 | 0.0% |
| Japan | 145 | 0.2% |
| Jordan | 125 | 0.1% |
| Kazakhstan | 36 | 0.0% |
| Korea | 1,115 | 1.3% |
| Laos | 94 | 0.1% |
| Latin America | 1,827 | 2.1% |
| Lebanon | 25 | 0.0% |
| Malaysia | 9 | 0.0% |
| Mexico | 805 | 0.9% |
| Micronesia | 24 | 0.0% |
| Middle Africa | 1,201 | 1.4% |
| Morocco | 51 | 0.1% |
| Nepal | 103 | 0.1% |
| Netherlands | 15 | 0.0% |
| Nigeria | 121 | 0.1% |
| Northern Africa | 252 | 0.3% |
| Northern Europe | 300 | 0.3% |
| Norway | 71 | 0.1% |
| Oceania | 42 | 0.1% |
| Pakistan | 101 | 0.1% |
| Panama | 67 | 0.1% |
| Peru | 89 | 0.1% |
| Philippines | 624 | 0.7% |
| Poland | 116 | 0.1% |
| Portugal | 15 | 0.0% |
| Russia | 209 | 0.2% |
| Saudi Arabia | 54 | 0.1% |
| Serbia | 23 | 0.0% |
| South Africa | 20 | 0.0% |
| South America | 651 | 0.7% |
| South Central Asia | 2,674 | 3.0% |
| South Eastern Asia | 1,195 | 1.3% |
| Southern Europe | 164 | 0.2% |
| Spain | 11 | 0.0% |
| Sri Lanka | 10 | 0.0% |
| Sweden | 8 | 0.0% |
| Syria | 23 | 0.0% |
| Taiwan | 189 | 0.2% |
| Thailand | 52 | 0.1% |
| Turkey | 58 | 0.1% |
| Ukraine | 23 | 0.0% |
| Venezuela | 54 | 0.1% |
| Vietnam | 401 | 0.4% |
| Western Africa | 129 | 0.2% |
| Western Asia | 374 | 0.4% |
| Western Europe | 185 | 0.2% |
| Zaire | 965 | 1.1% | View All 88 Rows |
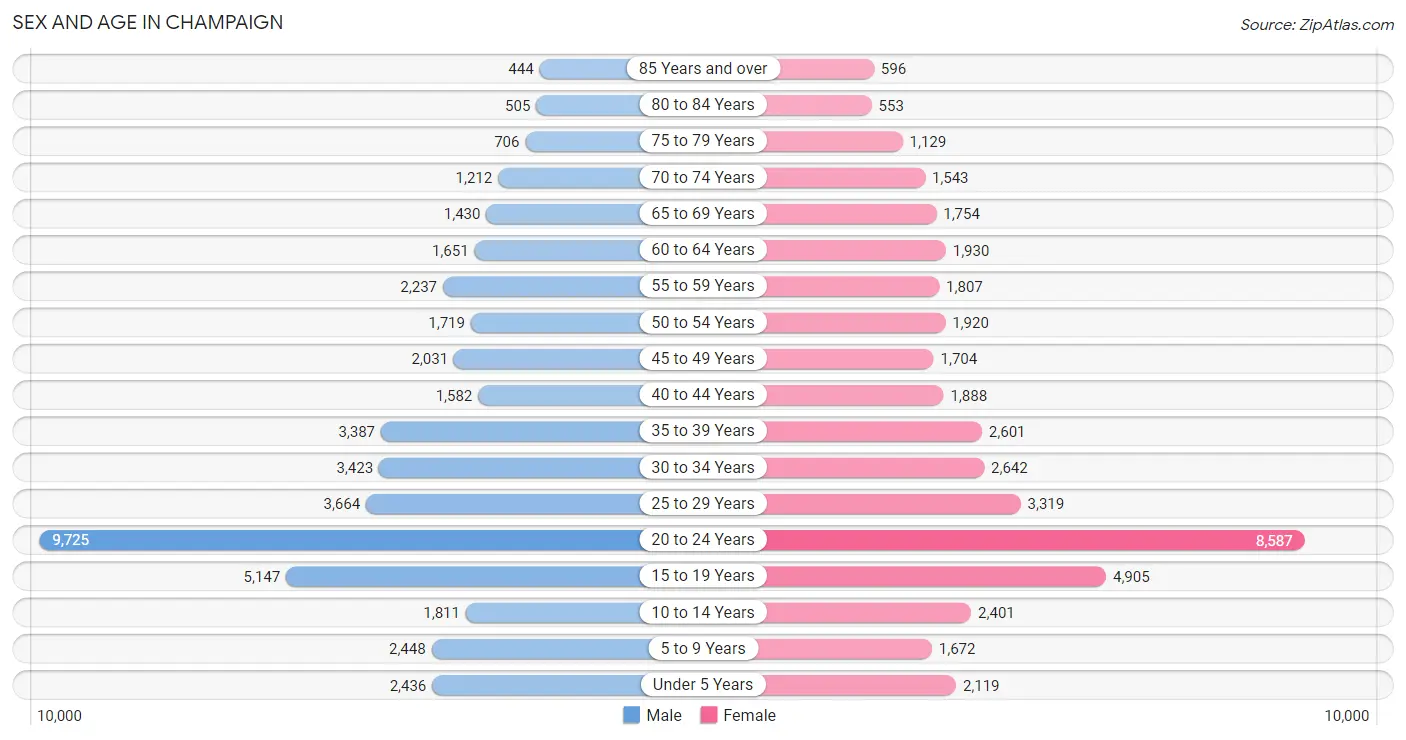
Sex and Age in Champaign
Sex and Age in Champaign
The most populous age groups in Champaign are 20 to 24 Years (9,725 | 21.3%) for men and 20 to 24 Years (8,587 | 19.9%) for women.
| Age Bracket | Male | Female |
| Under 5 Years | 2,436 (5.3%) | 2,119 (4.9%) |
| 5 to 9 Years | 2,448 (5.4%) | 1,672 (3.9%) |
| 10 to 14 Years | 1,811 (4.0%) | 2,401 (5.6%) |
| 15 to 19 Years | 5,147 (11.3%) | 4,905 (11.4%) |
| 20 to 24 Years | 9,725 (21.3%) | 8,587 (19.9%) |
| 25 to 29 Years | 3,664 (8.0%) | 3,319 (7.7%) |
| 30 to 34 Years | 3,423 (7.5%) | 2,642 (6.1%) |
| 35 to 39 Years | 3,387 (7.4%) | 2,601 (6.0%) |
| 40 to 44 Years | 1,582 (3.5%) | 1,888 (4.4%) |
| 45 to 49 Years | 2,031 (4.5%) | 1,704 (4.0%) |
| 50 to 54 Years | 1,719 (3.8%) | 1,920 (4.5%) |
| 55 to 59 Years | 2,237 (4.9%) | 1,807 (4.2%) |
| 60 to 64 Years | 1,651 (3.6%) | 1,930 (4.5%) |
| 65 to 69 Years | 1,430 (3.1%) | 1,754 (4.1%) |
| 70 to 74 Years | 1,212 (2.7%) | 1,543 (3.6%) |
| 75 to 79 Years | 706 (1.5%) | 1,129 (2.6%) |
| 80 to 84 Years | 505 (1.1%) | 553 (1.3%) |
| 85 Years and over | 444 (1.0%) | 596 (1.4%) |
| Total | 45,558 (100.0%) | 43,070 (100.0%) |
Families and Households in Champaign
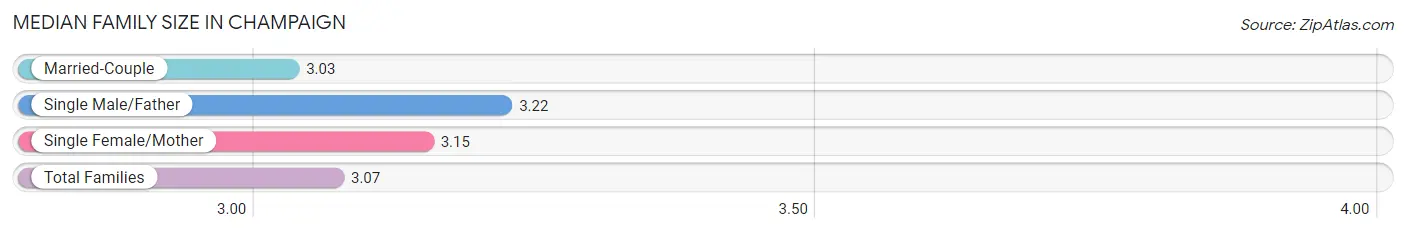
Median Family Size in Champaign
The median family size in Champaign is 3.07 persons per family, with single male/father families (1,168 | 7.1%) accounting for the largest median family size of 3.22 persons per family. On the other hand, married-couple families (12,068 | 73.1%) represent the smallest median family size with 3.03 persons per family.
| Family Type | # Families | Family Size |
| Married-Couple | 12,068 (73.1%) | 3.03 |
| Single Male/Father | 1,168 (7.1%) | 3.22 |
| Single Female/Mother | 3,275 (19.8%) | 3.15 |
| Total Families | 16,511 (100.0%) | 3.07 |
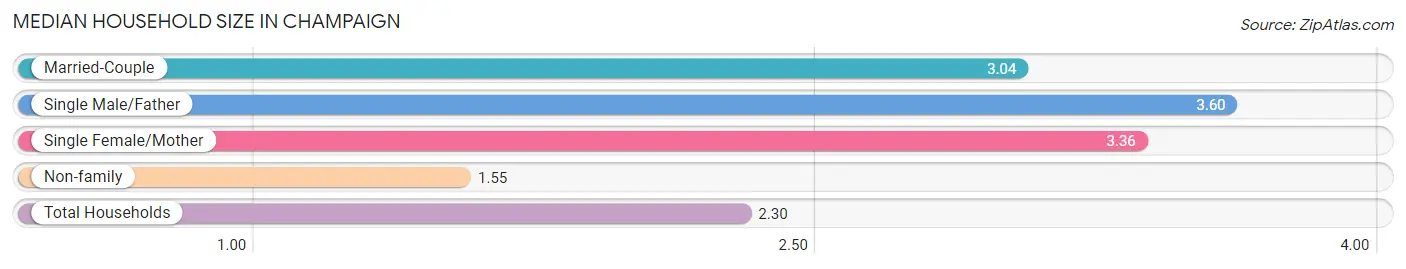
Median Household Size in Champaign
The median household size in Champaign is 2.30 persons per household, with single male/father households (1,168 | 3.3%) accounting for the largest median household size of 3.6 persons per household. non-family households (18,789 | 53.2%) represent the smallest median household size with 1.55 persons per household.
| Household Type | # Households | Household Size |
| Married-Couple | 12,068 (34.2%) | 3.04 |
| Single Male/Father | 1,168 (3.3%) | 3.60 |
| Single Female/Mother | 3,275 (9.3%) | 3.36 |
| Non-family | 18,789 (53.2%) | 1.55 |
| Total Households | 35,300 (100.0%) | 2.30 |
Household Size by Marriage Status in Champaign
Out of a total of 35,300 households in Champaign, 16,511 (46.8%) are family households, while 18,789 (53.2%) are nonfamily households. The most numerous type of family households are 2-person households, comprising 8,067, and the most common type of nonfamily households are 1-person households, comprising 13,462.
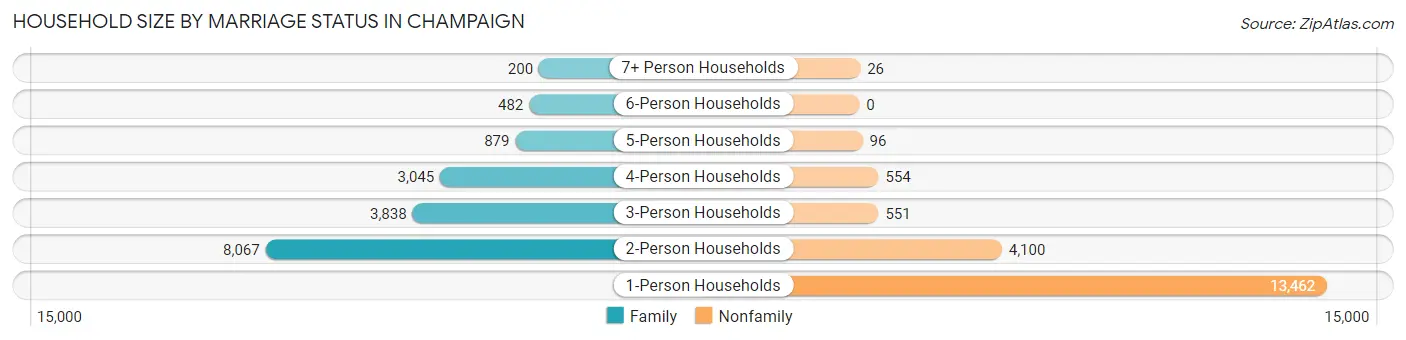
| Household Size | Family Households | Nonfamily Households |
| 1-Person Households | - | 13,462 (38.1%) |
| 2-Person Households | 8,067 (22.9%) | 4,100 (11.6%) |
| 3-Person Households | 3,838 (10.9%) | 551 (1.6%) |
| 4-Person Households | 3,045 (8.6%) | 554 (1.6%) |
| 5-Person Households | 879 (2.5%) | 96 (0.3%) |
| 6-Person Households | 482 (1.4%) | 0 (0.0%) |
| 7+ Person Households | 200 (0.6%) | 26 (0.1%) |
| Total | 16,511 (46.8%) | 18,789 (53.2%) |
Female Fertility in Champaign
Fertility by Age in Champaign
Average fertility rate in Champaign is 41.0 births per 1,000 women. Women in the age bracket of 35 to 50 years have the highest fertility rate with 54.0 births per 1,000 women. Women in the age bracket of 20 to 34 years acount for 61.9% of all women with births.
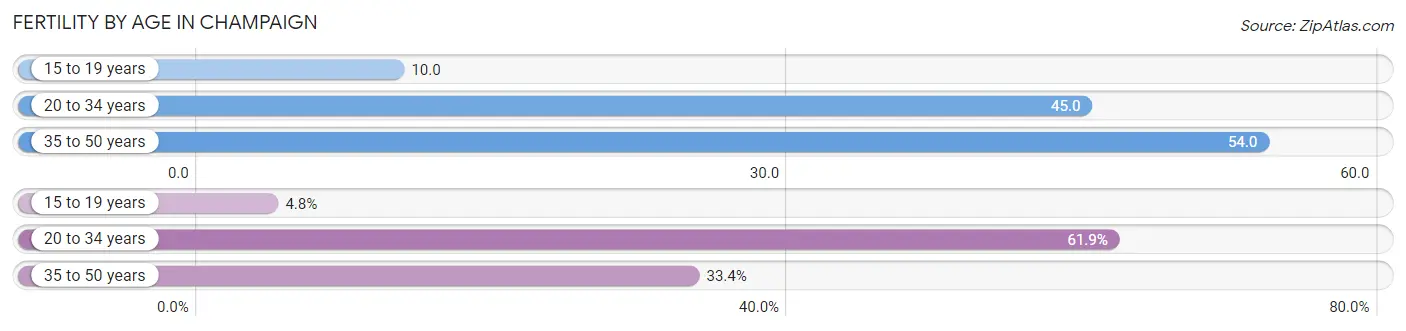
| Age Bracket | Women with Births | Births / 1,000 Women |
| 15 to 19 years | 51 (4.8%) | 10.0 |
| 20 to 34 years | 660 (61.9%) | 45.0 |
| 35 to 50 years | 356 (33.4%) | 54.0 |
| Total | 1,067 (100.0%) | 41.0 |
Fertility by Age by Marriage Status in Champaign
69.4% of women with births (1,067) in Champaign are married. The highest percentage of unmarried women with births falls into 15 to 19 years age bracket with 100.0% of them unmarried at the time of birth, while the lowest percentage of unmarried women with births belong to 20 to 34 years age bracket with 25.6% of them unmarried.
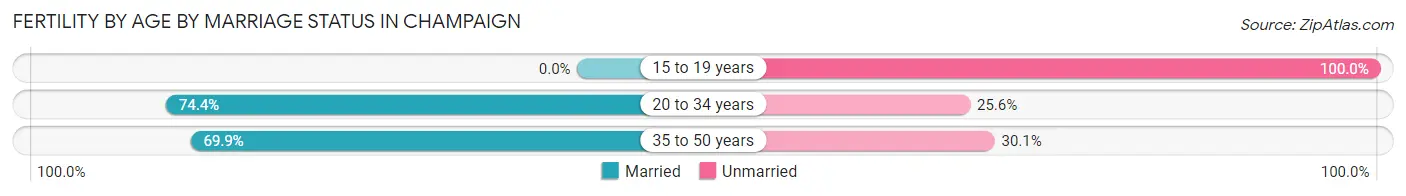
| Age Bracket | Married | Unmarried |
| 15 to 19 years | 0 (0.0%) | 51 (100.0%) |
| 20 to 34 years | 491 (74.4%) | 169 (25.6%) |
| 35 to 50 years | 249 (69.9%) | 107 (30.1%) |
| Total | 740 (69.4%) | 327 (30.6%) |
Fertility by Education in Champaign
Average fertility rate in Champaign is 41.0 births per 1,000 women. Women with the education attainment of bachelor's degree have the highest fertility rate of 67.0 births per 1,000 women, while women with the education attainment of college or associate's degree have the lowest fertility at 21.0 births per 1,000 women. Women with the education attainment of bachelor's degree represent 28.4% of all women with births.
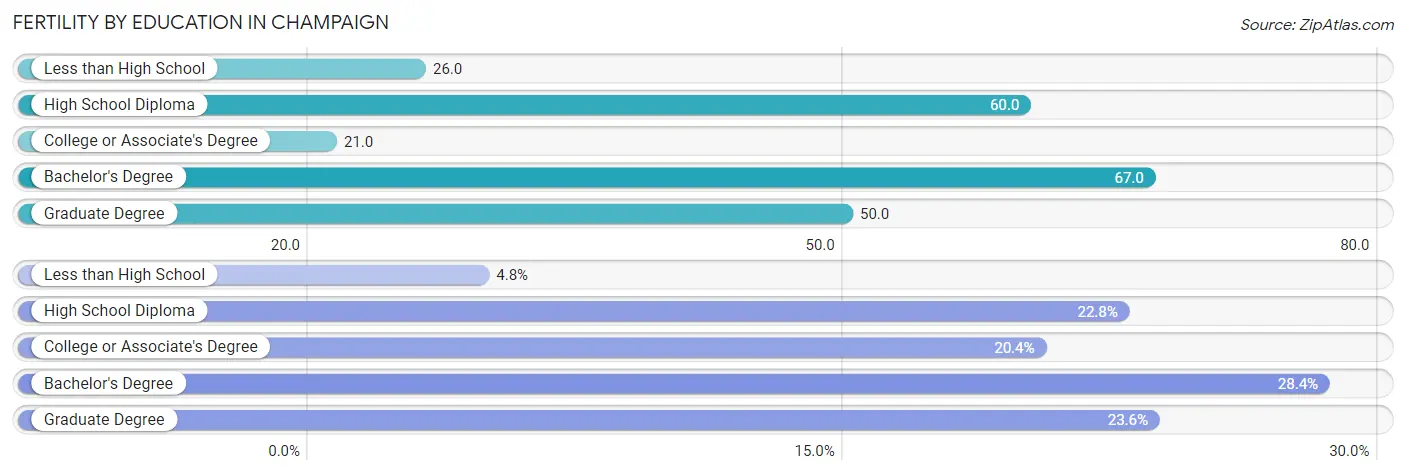
| Educational Attainment | Women with Births | Births / 1,000 Women |
| Less than High School | 51 (4.8%) | 26.0 |
| High School Diploma | 243 (22.8%) | 60.0 |
| College or Associate's Degree | 218 (20.4%) | 21.0 |
| Bachelor's Degree | 303 (28.4%) | 67.0 |
| Graduate Degree | 252 (23.6%) | 50.0 |
| Total | 1,067 (100.0%) | 41.0 |
Fertility by Education by Marriage Status in Champaign
30.6% of women with births in Champaign are unmarried. Women with the educational attainment of bachelor's degree are most likely to be married with 100.0% of them married at childbirth, while women with the educational attainment of less than high school are least likely to be married with 100.0% of them unmarried at childbirth.
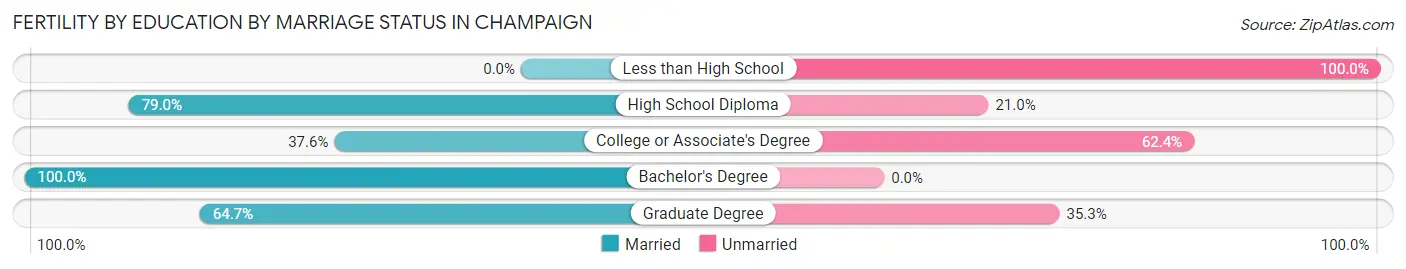
| Educational Attainment | Married | Unmarried |
| Less than High School | 0 (0.0%) | 51 (100.0%) |
| High School Diploma | 192 (79.0%) | 51 (21.0%) |
| College or Associate's Degree | 82 (37.6%) | 136 (62.4%) |
| Bachelor's Degree | 303 (100.0%) | 0 (0.0%) |
| Graduate Degree | 163 (64.7%) | 89 (35.3%) |
| Total | 740 (69.4%) | 327 (30.6%) |
Employment Characteristics in Champaign
Employment by Class of Employer in Champaign
Among the 42,247 employed individuals in Champaign, private company employees (22,957 | 54.3%), state government employees (9,237 | 21.9%), and not-for-profit organizations (3,978 | 9.4%) make up the most common classes of employment.
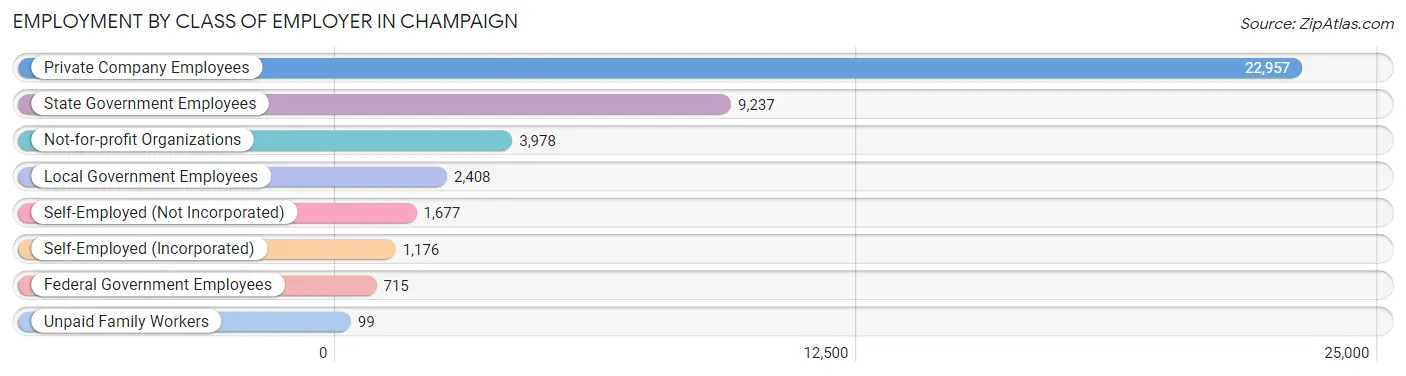
| Employer Class | # Employees | % Employees |
| Private Company Employees | 22,957 | 54.3% |
| Self-Employed (Incorporated) | 1,176 | 2.8% |
| Self-Employed (Not Incorporated) | 1,677 | 4.0% |
| Not-for-profit Organizations | 3,978 | 9.4% |
| Local Government Employees | 2,408 | 5.7% |
| State Government Employees | 9,237 | 21.9% |
| Federal Government Employees | 715 | 1.7% |
| Unpaid Family Workers | 99 | 0.2% |
| Total | 42,247 | 100.0% |
Employment Status by Age in Champaign
According to the labor force statistics for Champaign, out of the total population over 16 years of age (75,037), 60.9% or 45,698 individuals are in the labor force, with 4.8% or 2,194 of them unemployed. The age group with the highest labor force participation rate is 35 to 44 years, with 86.8% or 8,210 individuals in the labor force. Within the labor force, the 16 to 19 years age range has the highest percentage of unemployed individuals, with 14.0% or 385 of them being unemployed.
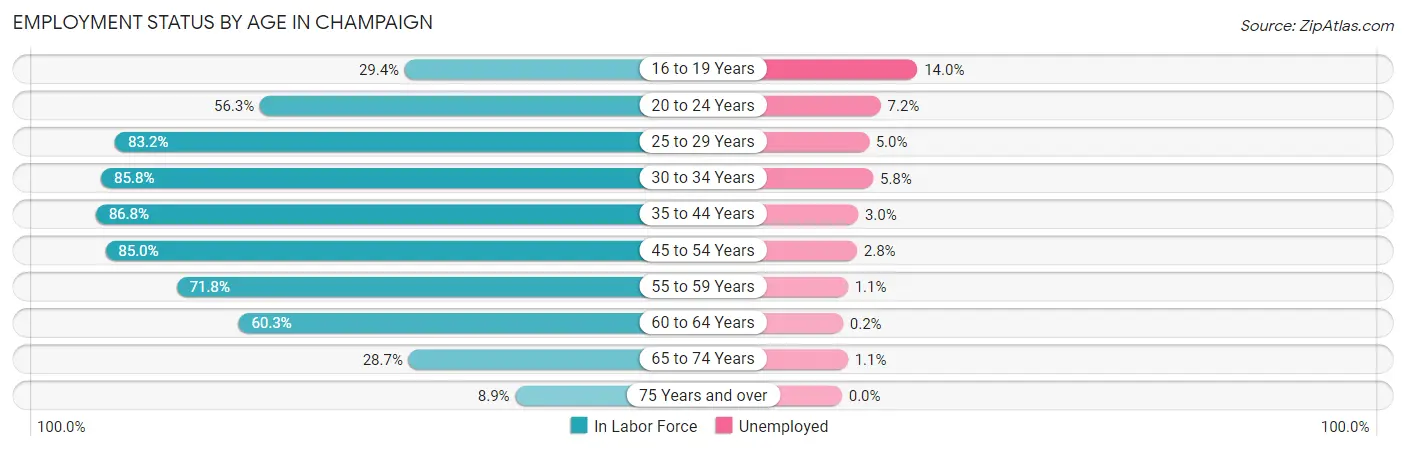
| Age Bracket | In Labor Force | Unemployed |
| 16 to 19 Years | 2,748 (29.4%) | 385 (14.0%) |
| 20 to 24 Years | 10,310 (56.3%) | 742 (7.2%) |
| 25 to 29 Years | 5,810 (83.2%) | 290 (5.0%) |
| 30 to 34 Years | 5,204 (85.8%) | 302 (5.8%) |
| 35 to 44 Years | 8,210 (86.8%) | 246 (3.0%) |
| 45 to 54 Years | 6,268 (85.0%) | 176 (2.8%) |
| 55 to 59 Years | 2,904 (71.8%) | 32 (1.1%) |
| 60 to 64 Years | 2,159 (60.3%) | 4 (0.2%) |
| 65 to 74 Years | 1,704 (28.7%) | 19 (1.1%) |
| 75 Years and over | 350 (8.9%) | 0 (0.0%) |
| Total | 45,698 (60.9%) | 2,194 (4.8%) |
Employment Status by Educational Attainment in Champaign
According to labor force statistics for Champaign, 81.5% of individuals (30,567) out of the total population between 25 and 64 years of age (37,505) are in the labor force, with 3.4% or 1,039 of them being unemployed. The group with the highest labor force participation rate are those with the educational attainment of bachelor's degree or higher, with 85.4% or 17,167 individuals in the labor force. Within the labor force, individuals with less than high school education have the highest percentage of unemployment, with 11.1% or 185 of them being unemployed.
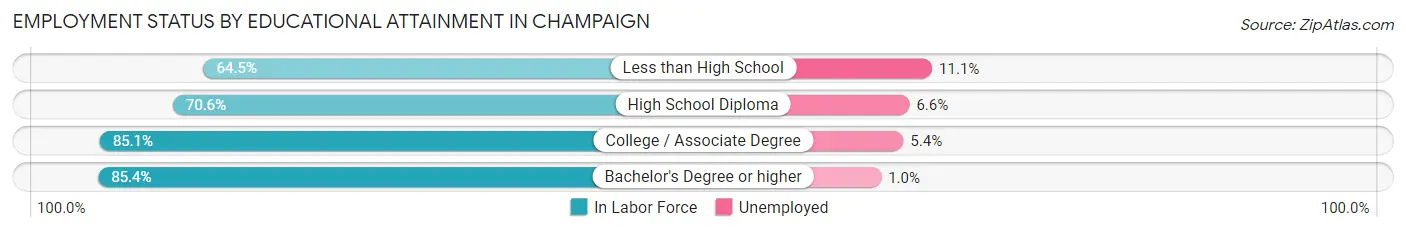
| Educational Attainment | In Labor Force | Unemployed |
| Less than High School | 1,663 (64.5%) | 286 (11.1%) |
| High School Diploma | 4,301 (70.6%) | 402 (6.6%) |
| College / Associate Degree | 7,432 (85.1%) | 472 (5.4%) |
| Bachelor's Degree or higher | 17,167 (85.4%) | 201 (1.0%) |
| Total | 30,567 (81.5%) | 1,275 (3.4%) |
Employment Occupations by Sex in Champaign
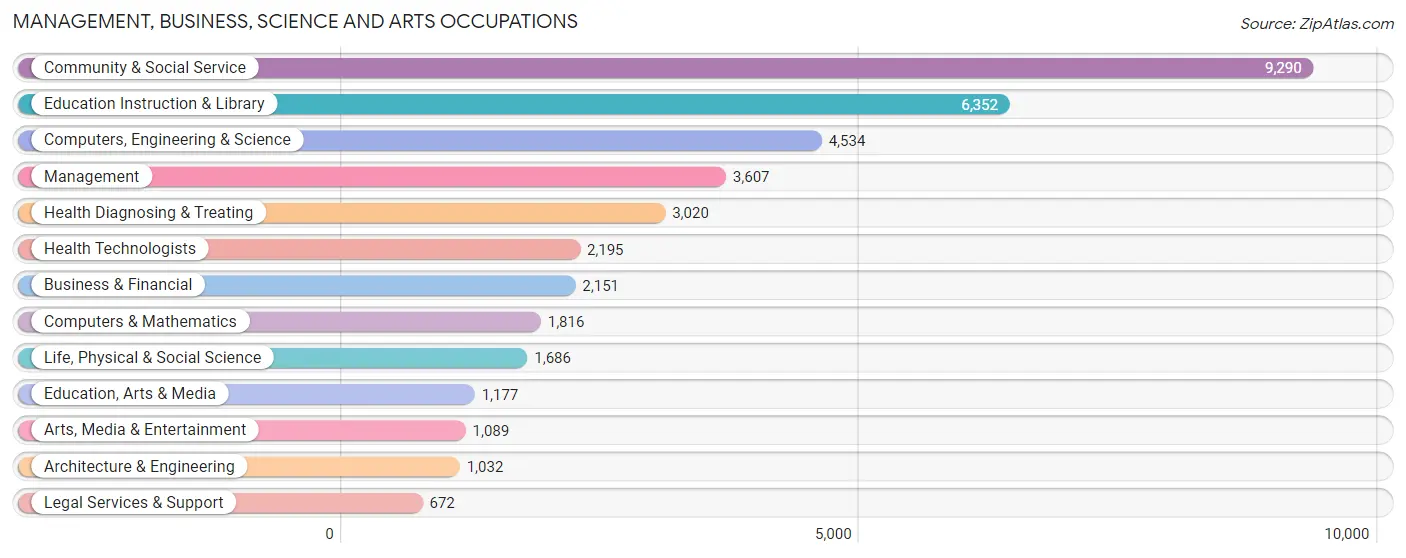
Management, Business, Science and Arts Occupations
The most common Management, Business, Science and Arts occupations in Champaign are Community & Social Service (9,290 | 21.4%), Education Instruction & Library (6,352 | 14.6%), Computers, Engineering & Science (4,534 | 10.4%), Management (3,607 | 8.3%), and Health Diagnosing & Treating (3,020 | 7.0%).
Management, Business, Science and Arts Occupations by Sex
Within the Management, Business, Science and Arts occupations in Champaign, the most male-oriented occupations are Architecture & Engineering (80.0%), Computers & Mathematics (71.6%), and Computers, Engineering & Science (67.9%), while the most female-oriented occupations are Education, Arts & Media (70.0%), Health Diagnosing & Treating (66.4%), and Health Technologists (63.9%).
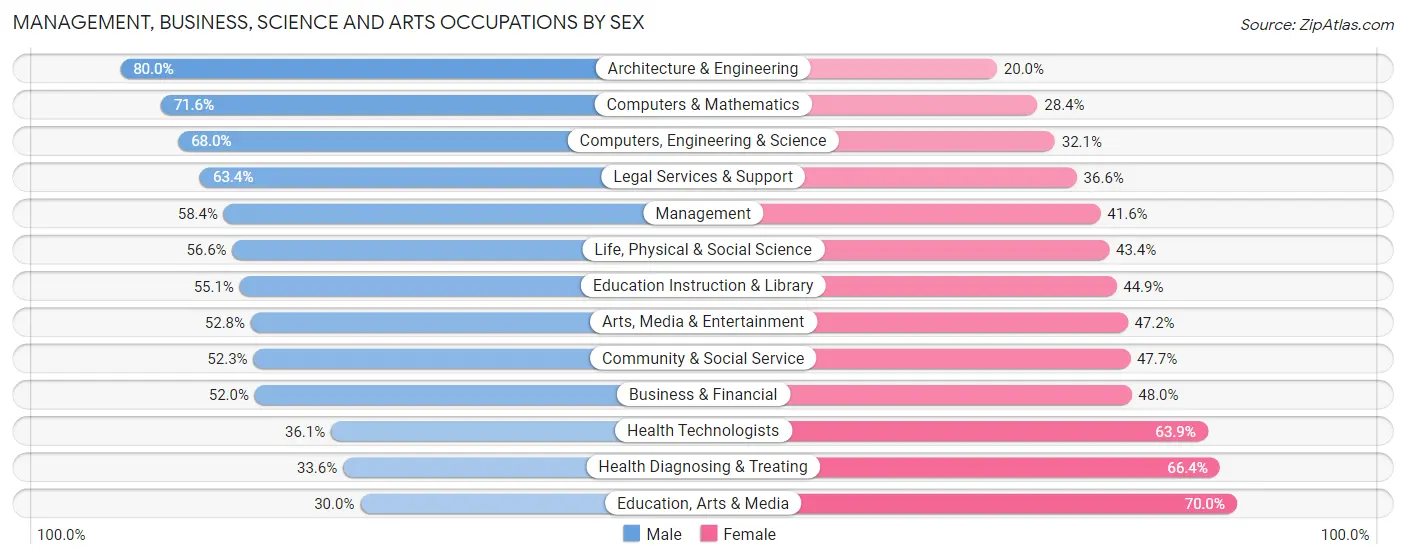
| Occupation | Male | Female |
| Management | 2,108 (58.4%) | 1,499 (41.6%) |
| Business & Financial | 1,118 (52.0%) | 1,033 (48.0%) |
| Computers, Engineering & Science | 3,081 (67.9%) | 1,453 (32.1%) |
| Computers & Mathematics | 1,300 (71.6%) | 516 (28.4%) |
| Architecture & Engineering | 826 (80.0%) | 206 (20.0%) |
| Life, Physical & Social Science | 955 (56.6%) | 731 (43.4%) |
| Community & Social Service | 4,856 (52.3%) | 4,434 (47.7%) |
| Education, Arts & Media | 353 (30.0%) | 824 (70.0%) |
| Legal Services & Support | 426 (63.4%) | 246 (36.6%) |
| Education Instruction & Library | 3,502 (55.1%) | 2,850 (44.9%) |
| Arts, Media & Entertainment | 575 (52.8%) | 514 (47.2%) |
| Health Diagnosing & Treating | 1,014 (33.6%) | 2,006 (66.4%) |
| Health Technologists | 792 (36.1%) | 1,403 (63.9%) |
| Total (Category) | 12,177 (53.9%) | 10,425 (46.1%) |
| Total (Overall) | 23,054 (53.1%) | 20,379 (46.9%) |
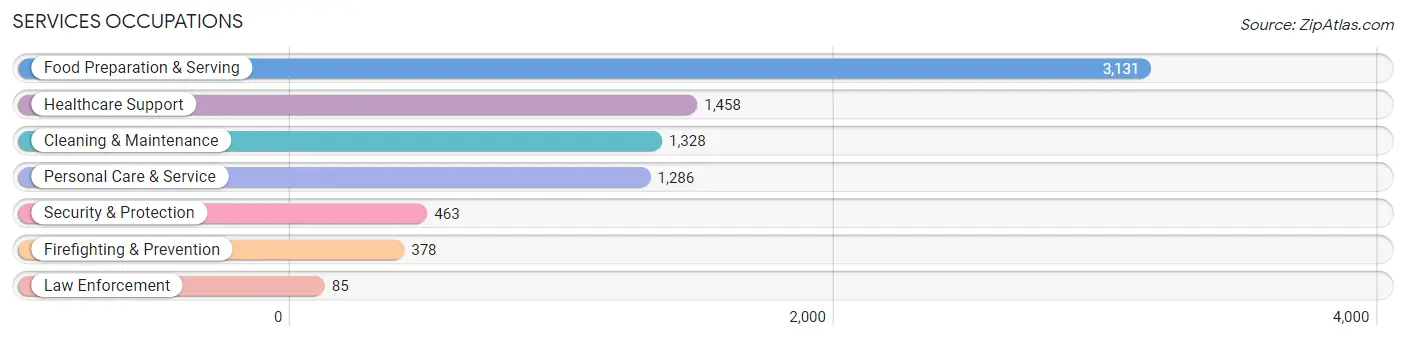
Services Occupations
The most common Services occupations in Champaign are Food Preparation & Serving (3,131 | 7.2%), Healthcare Support (1,458 | 3.4%), Cleaning & Maintenance (1,328 | 3.1%), Personal Care & Service (1,286 | 3.0%), and Security & Protection (463 | 1.1%).
Services Occupations by Sex
Within the Services occupations in Champaign, the most male-oriented occupations are Cleaning & Maintenance (79.7%), Firefighting & Prevention (74.1%), and Security & Protection (68.7%), while the most female-oriented occupations are Healthcare Support (90.2%), Personal Care & Service (70.8%), and Food Preparation & Serving (55.4%).
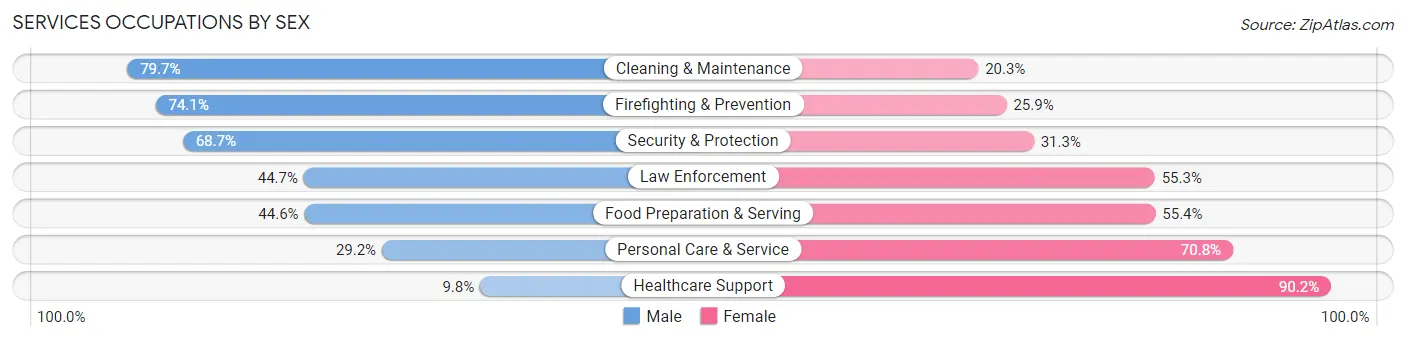
| Occupation | Male | Female |
| Healthcare Support | 143 (9.8%) | 1,315 (90.2%) |
| Security & Protection | 318 (68.7%) | 145 (31.3%) |
| Firefighting & Prevention | 280 (74.1%) | 98 (25.9%) |
| Law Enforcement | 38 (44.7%) | 47 (55.3%) |
| Food Preparation & Serving | 1,396 (44.6%) | 1,735 (55.4%) |
| Cleaning & Maintenance | 1,058 (79.7%) | 270 (20.3%) |
| Personal Care & Service | 376 (29.2%) | 910 (70.8%) |
| Total (Category) | 3,291 (42.9%) | 4,375 (57.1%) |
| Total (Overall) | 23,054 (53.1%) | 20,379 (46.9%) |
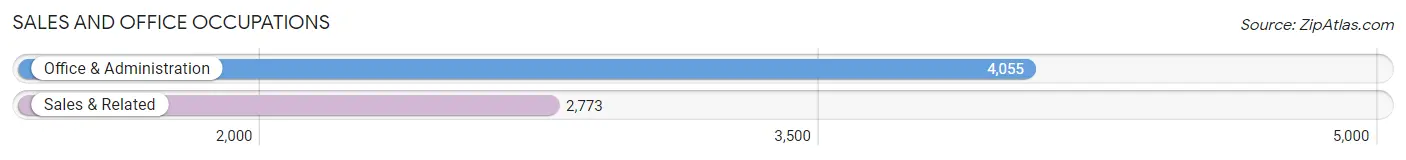
Sales and Office Occupations
The most common Sales and Office occupations in Champaign are Office & Administration (4,055 | 9.3%), and Sales & Related (2,773 | 6.4%).
Sales and Office Occupations by Sex
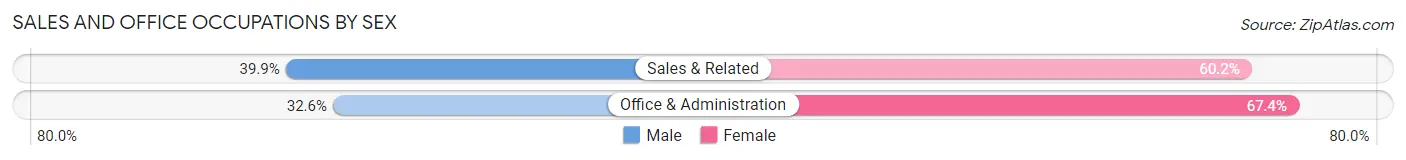
| Occupation | Male | Female |
| Sales & Related | 1,105 (39.9%) | 1,668 (60.2%) |
| Office & Administration | 1,321 (32.6%) | 2,734 (67.4%) |
| Total (Category) | 2,426 (35.5%) | 4,402 (64.5%) |
| Total (Overall) | 23,054 (53.1%) | 20,379 (46.9%) |
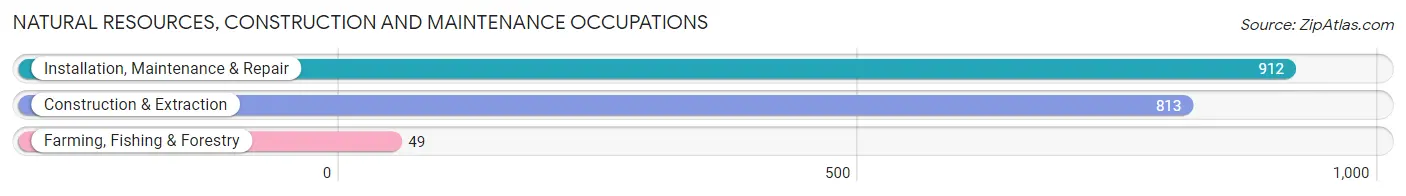
Natural Resources, Construction and Maintenance Occupations
The most common Natural Resources, Construction and Maintenance occupations in Champaign are Installation, Maintenance & Repair (912 | 2.1%), Construction & Extraction (813 | 1.9%), and Farming, Fishing & Forestry (49 | 0.1%).
Natural Resources, Construction and Maintenance Occupations by Sex
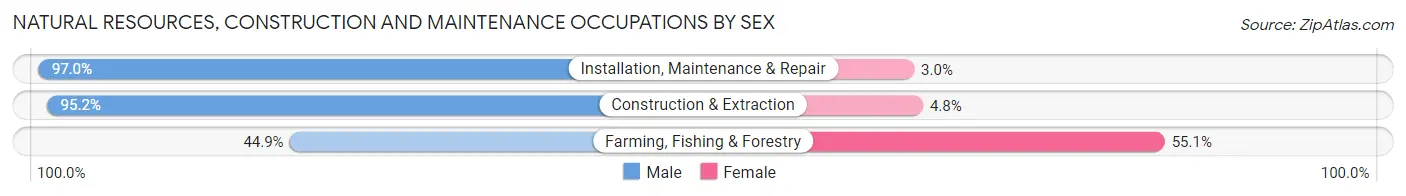
| Occupation | Male | Female |
| Farming, Fishing & Forestry | 22 (44.9%) | 27 (55.1%) |
| Construction & Extraction | 774 (95.2%) | 39 (4.8%) |
| Installation, Maintenance & Repair | 885 (97.0%) | 27 (3.0%) |
| Total (Category) | 1,681 (94.8%) | 93 (5.2%) |
| Total (Overall) | 23,054 (53.1%) | 20,379 (46.9%) |
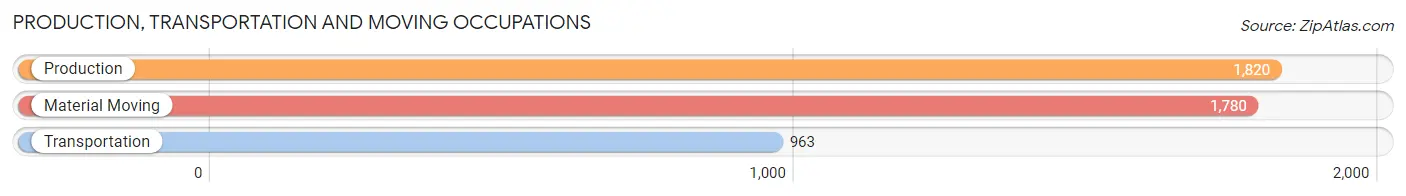
Production, Transportation and Moving Occupations
The most common Production, Transportation and Moving occupations in Champaign are Production (1,820 | 4.2%), Material Moving (1,780 | 4.1%), and Transportation (963 | 2.2%).
Production, Transportation and Moving Occupations by Sex
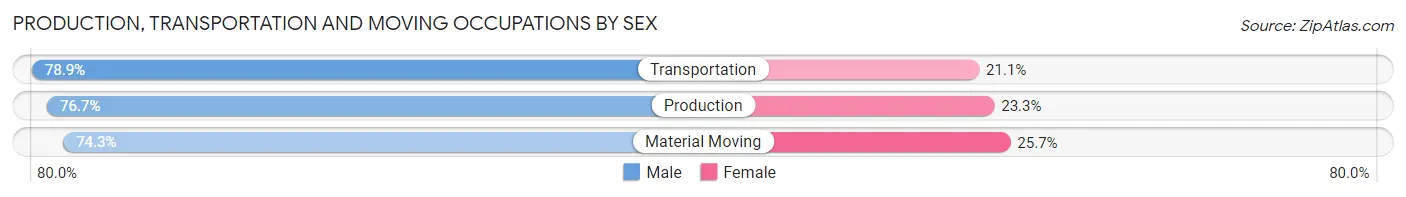
| Occupation | Male | Female |
| Production | 1,396 (76.7%) | 424 (23.3%) |
| Transportation | 760 (78.9%) | 203 (21.1%) |
| Material Moving | 1,323 (74.3%) | 457 (25.7%) |
| Total (Category) | 3,479 (76.2%) | 1,084 (23.8%) |
| Total (Overall) | 23,054 (53.1%) | 20,379 (46.9%) |
Employment Industries by Sex in Champaign
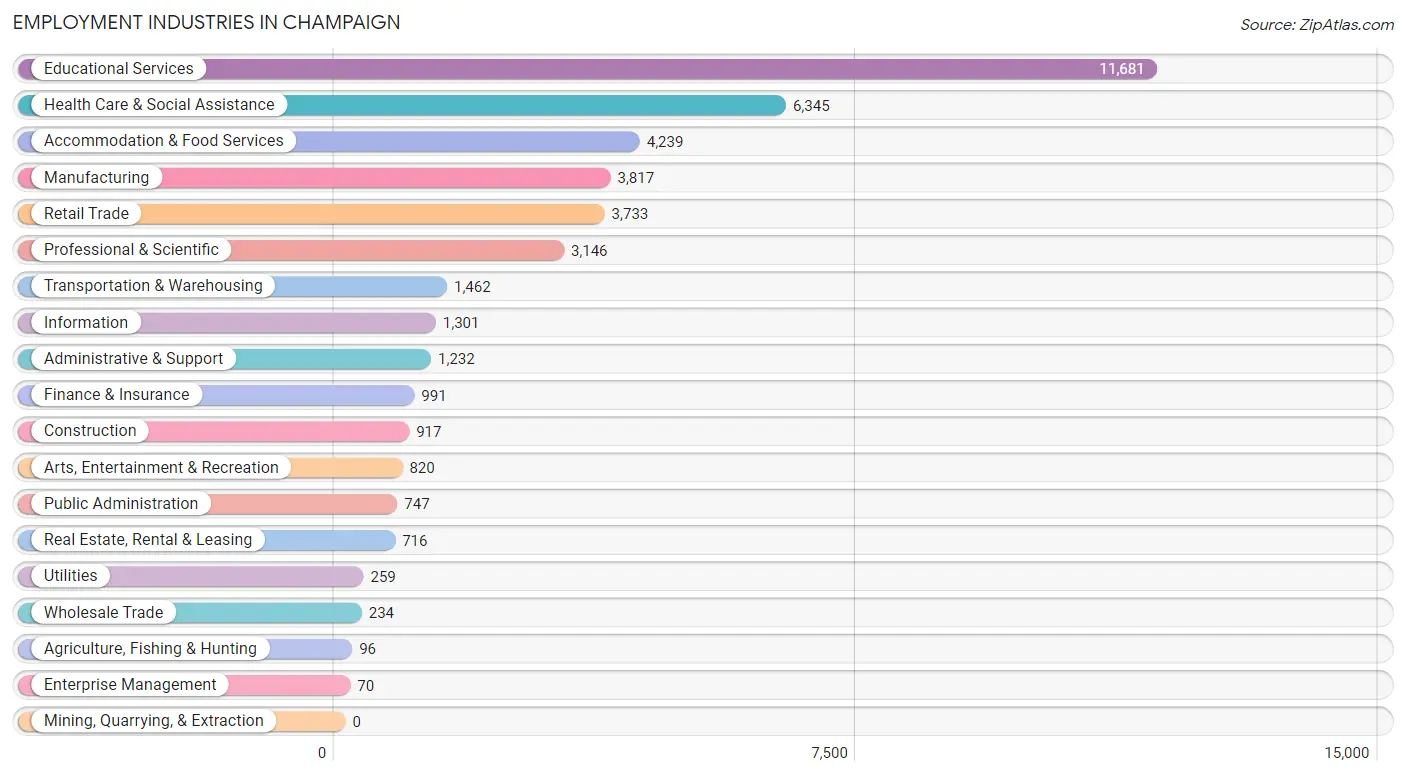
Employment Industries in Champaign
The major employment industries in Champaign include Educational Services (11,681 | 26.9%), Health Care & Social Assistance (6,345 | 14.6%), Accommodation & Food Services (4,239 | 9.8%), Manufacturing (3,817 | 8.8%), and Retail Trade (3,733 | 8.6%).
Employment Industries by Sex in Champaign
The Champaign industries that see more men than women are Construction (92.5%), Wholesale Trade (82.1%), and Manufacturing (75.5%), whereas the industries that tend to have a higher number of women are Enterprise Management (100.0%), Health Care & Social Assistance (74.9%), and Arts, Entertainment & Recreation (62.7%).
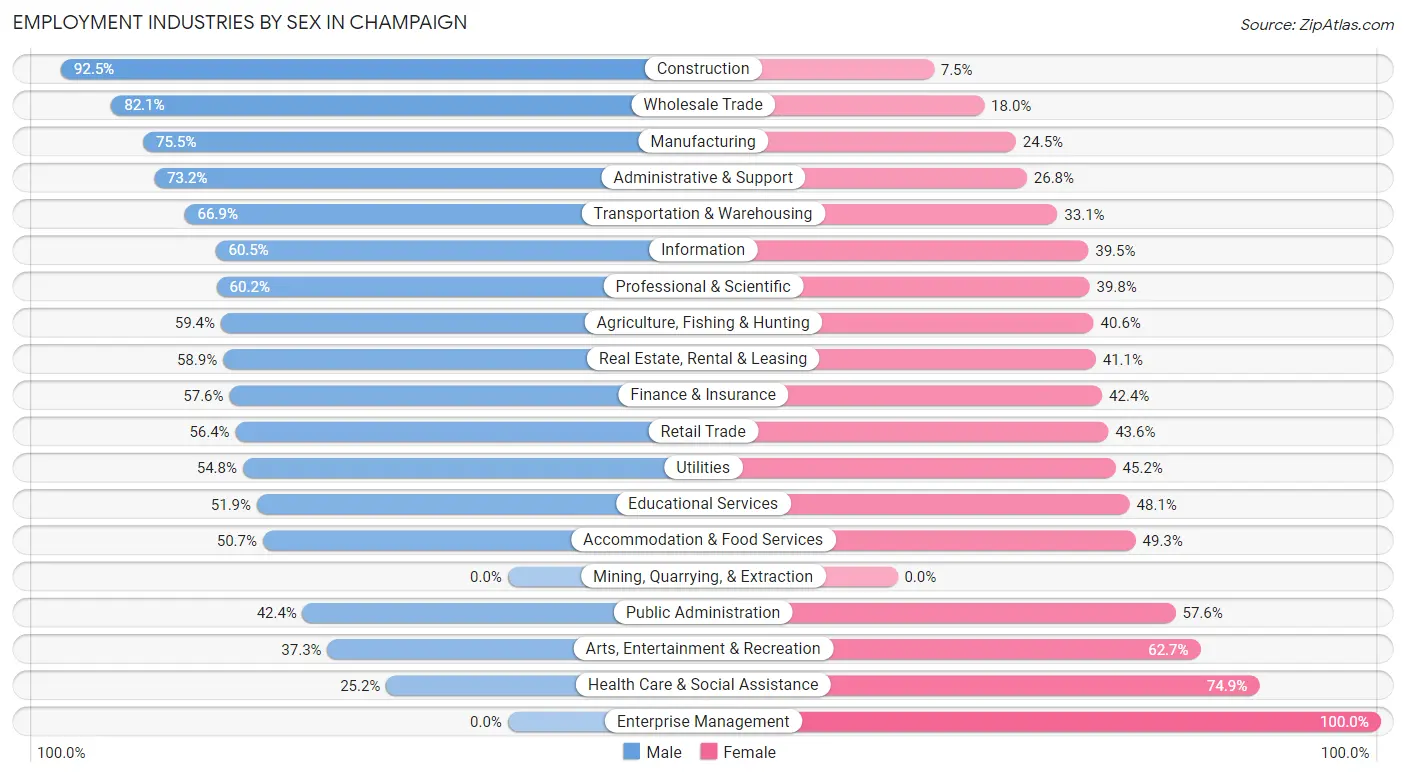
| Industry | Male | Female |
| Agriculture, Fishing & Hunting | 57 (59.4%) | 39 (40.6%) |
| Mining, Quarrying, & Extraction | 0 (0.0%) | 0 (0.0%) |
| Construction | 848 (92.5%) | 69 (7.5%) |
| Manufacturing | 2,881 (75.5%) | 936 (24.5%) |
| Wholesale Trade | 192 (82.1%) | 42 (17.9%) |
| Retail Trade | 2,104 (56.4%) | 1,629 (43.6%) |
| Transportation & Warehousing | 978 (66.9%) | 484 (33.1%) |
| Utilities | 142 (54.8%) | 117 (45.2%) |
| Information | 787 (60.5%) | 514 (39.5%) |
| Finance & Insurance | 571 (57.6%) | 420 (42.4%) |
| Real Estate, Rental & Leasing | 422 (58.9%) | 294 (41.1%) |
| Professional & Scientific | 1,895 (60.2%) | 1,251 (39.8%) |
| Enterprise Management | 0 (0.0%) | 70 (100.0%) |
| Administrative & Support | 902 (73.2%) | 330 (26.8%) |
| Educational Services | 6,066 (51.9%) | 5,615 (48.1%) |
| Health Care & Social Assistance | 1,596 (25.2%) | 4,749 (74.9%) |
| Arts, Entertainment & Recreation | 306 (37.3%) | 514 (62.7%) |
| Accommodation & Food Services | 2,149 (50.7%) | 2,090 (49.3%) |
| Public Administration | 317 (42.4%) | 430 (57.6%) |
| Total | 23,054 (53.1%) | 20,379 (46.9%) |
Education in Champaign
School Enrollment in Champaign
The most common levels of schooling among the 36,059 students in Champaign are college / undergraduate (18,647 | 51.7%), graduate / professional (5,894 | 16.4%), and middle school (3,529 | 9.8%).
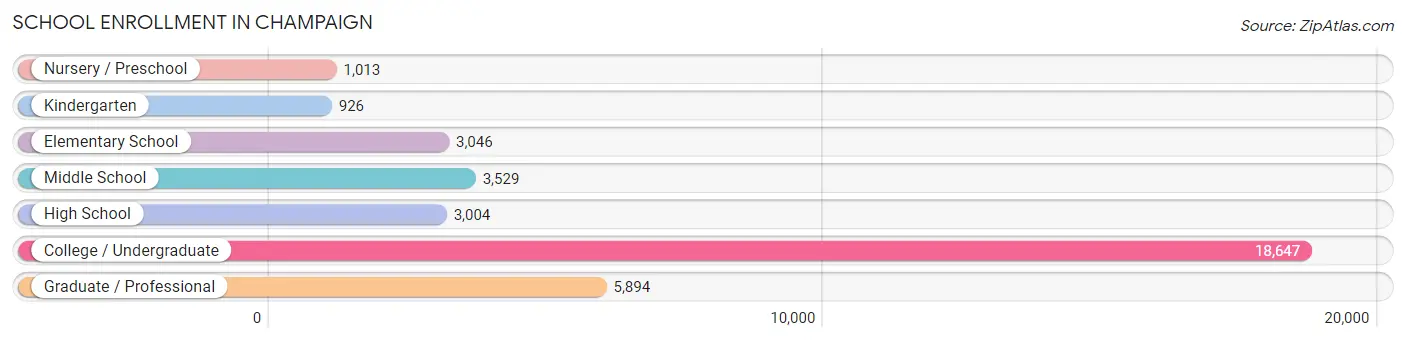
| School Level | # Students | % Students |
| Nursery / Preschool | 1,013 | 2.8% |
| Kindergarten | 926 | 2.6% |
| Elementary School | 3,046 | 8.5% |
| Middle School | 3,529 | 9.8% |
| High School | 3,004 | 8.3% |
| College / Undergraduate | 18,647 | 51.7% |
| Graduate / Professional | 5,894 | 16.4% |
| Total | 36,059 | 100.0% |
School Enrollment by Age by Funding Source in Champaign
Out of a total of 36,059 students who are enrolled in schools in Champaign, 3,570 (9.9%) attend a private institution, while the remaining 32,489 (90.1%) are enrolled in public schools. The age group of 3 to 4 year olds has the highest likelihood of being enrolled in private schools, with 384 (48.3% in the age bracket) enrolled. Conversely, the age group of 18 to 19 year olds has the lowest likelihood of being enrolled in a private school, with 6,676 (96.8% in the age bracket) attending a public institution.
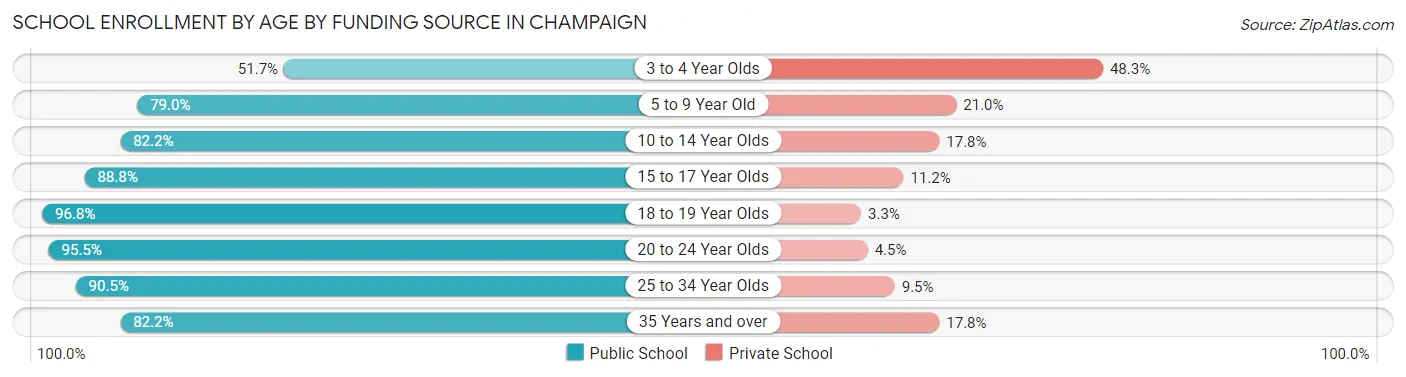
| Age Bracket | Public School | Private School |
| 3 to 4 Year Olds | 411 (51.7%) | 384 (48.3%) |
| 5 to 9 Year Old | 3,131 (79.0%) | 832 (21.0%) |
| 10 to 14 Year Olds | 3,362 (82.2%) | 729 (17.8%) |
| 15 to 17 Year Olds | 1,974 (88.8%) | 248 (11.2%) |
| 18 to 19 Year Olds | 6,676 (96.8%) | 224 (3.3%) |
| 20 to 24 Year Olds | 12,772 (95.5%) | 599 (4.5%) |
| 25 to 34 Year Olds | 3,070 (90.5%) | 323 (9.5%) |
| 35 Years and over | 1,088 (82.2%) | 236 (17.8%) |
| Total | 32,489 (90.1%) | 3,570 (9.9%) |
Educational Attainment by Field of Study in Champaign
Business (2,750 | 10.3%), engineering (2,629 | 9.9%), education (2,513 | 9.5%), science & technology (2,448 | 9.2%), and bio, nature & agricultural (2,335 | 8.8%) are the most common fields of study among 26,595 individuals in Champaign who have obtained a bachelor's degree or higher.
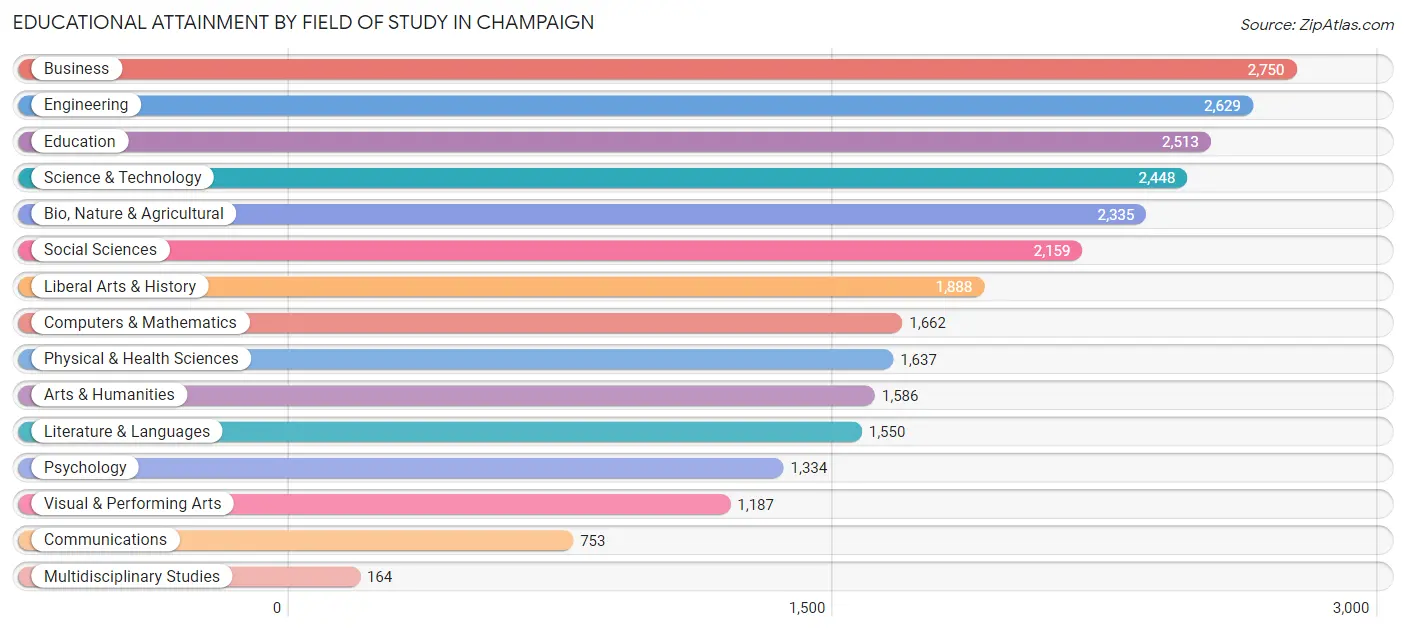
| Field of Study | # Graduates | % Graduates |
| Computers & Mathematics | 1,662 | 6.2% |
| Bio, Nature & Agricultural | 2,335 | 8.8% |
| Physical & Health Sciences | 1,637 | 6.2% |
| Psychology | 1,334 | 5.0% |
| Social Sciences | 2,159 | 8.1% |
| Engineering | 2,629 | 9.9% |
| Multidisciplinary Studies | 164 | 0.6% |
| Science & Technology | 2,448 | 9.2% |
| Business | 2,750 | 10.3% |
| Education | 2,513 | 9.5% |
| Literature & Languages | 1,550 | 5.8% |
| Liberal Arts & History | 1,888 | 7.1% |
| Visual & Performing Arts | 1,187 | 4.5% |
| Communications | 753 | 2.8% |
| Arts & Humanities | 1,586 | 6.0% |
| Total | 26,595 | 100.0% |
Transportation & Commute in Champaign
Vehicle Availability by Sex in Champaign
The most prevalent vehicle ownership categories in Champaign are males with 2 vehicles (9,560, accounting for 44.5%) and females with 2 vehicles (7,962, making up 50.7%).
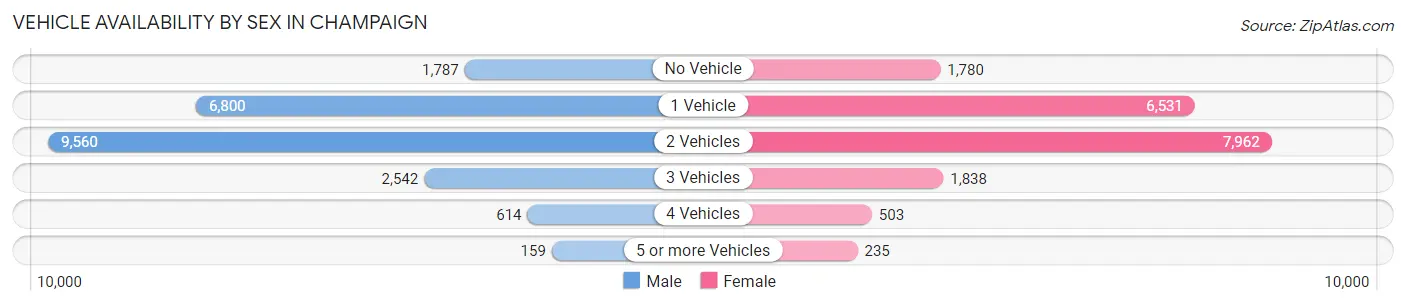
| Vehicles Available | Male | Female |
| No Vehicle | 1,787 (8.3%) | 1,780 (9.4%) |
| 1 Vehicle | 6,800 (31.7%) | 6,531 (34.6%) |
| 2 Vehicles | 9,560 (44.5%) | 7,962 (42.2%) |
| 3 Vehicles | 2,542 (11.8%) | 1,838 (9.8%) |
| 4 Vehicles | 614 (2.9%) | 503 (2.7%) |
| 5 or more Vehicles | 159 (0.7%) | 235 (1.3%) |
| Total | 21,462 (100.0%) | 18,849 (100.0%) |
Commute Time in Champaign
The most frequently occuring commute durations in Champaign are 10 to 14 minutes (11,098 commuters, 30.3%), 15 to 19 minutes (10,148 commuters, 27.7%), and 5 to 9 minutes (6,810 commuters, 18.6%).
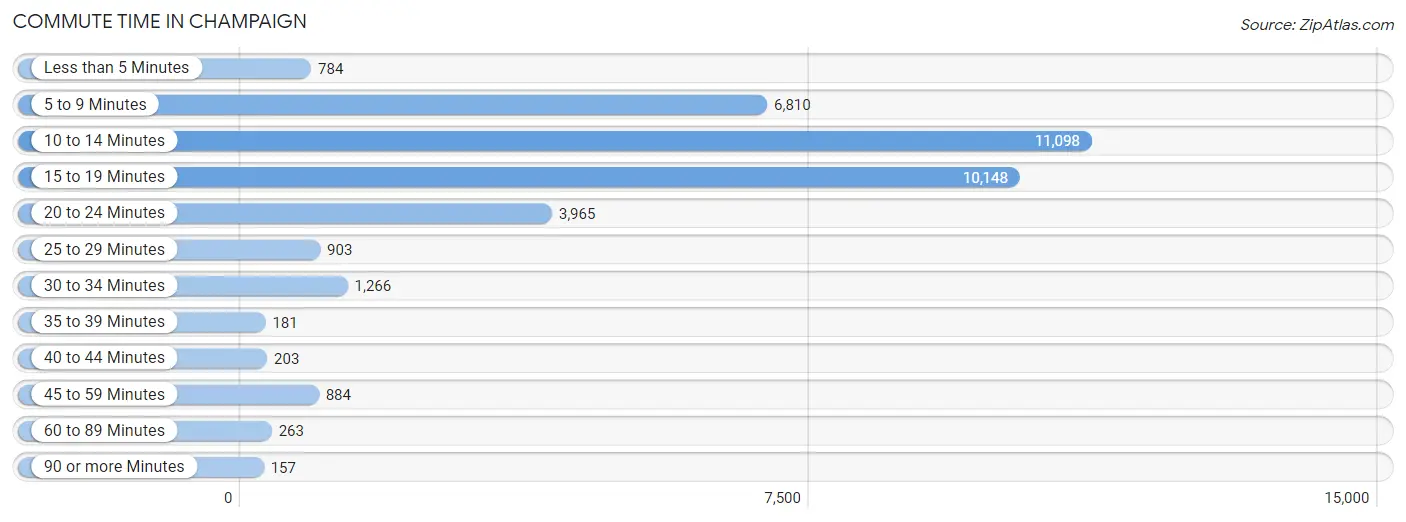
| Commute Time | # Commuters | % Commuters |
| Less than 5 Minutes | 784 | 2.1% |
| 5 to 9 Minutes | 6,810 | 18.6% |
| 10 to 14 Minutes | 11,098 | 30.3% |
| 15 to 19 Minutes | 10,148 | 27.7% |
| 20 to 24 Minutes | 3,965 | 10.8% |
| 25 to 29 Minutes | 903 | 2.5% |
| 30 to 34 Minutes | 1,266 | 3.5% |
| 35 to 39 Minutes | 181 | 0.5% |
| 40 to 44 Minutes | 203 | 0.5% |
| 45 to 59 Minutes | 884 | 2.4% |
| 60 to 89 Minutes | 263 | 0.7% |
| 90 or more Minutes | 157 | 0.4% |
Commute Time by Sex in Champaign
The most common commute times in Champaign are 10 to 14 minutes (6,245 commuters, 32.1%) for males and 10 to 14 minutes (4,853 commuters, 28.2%) for females.
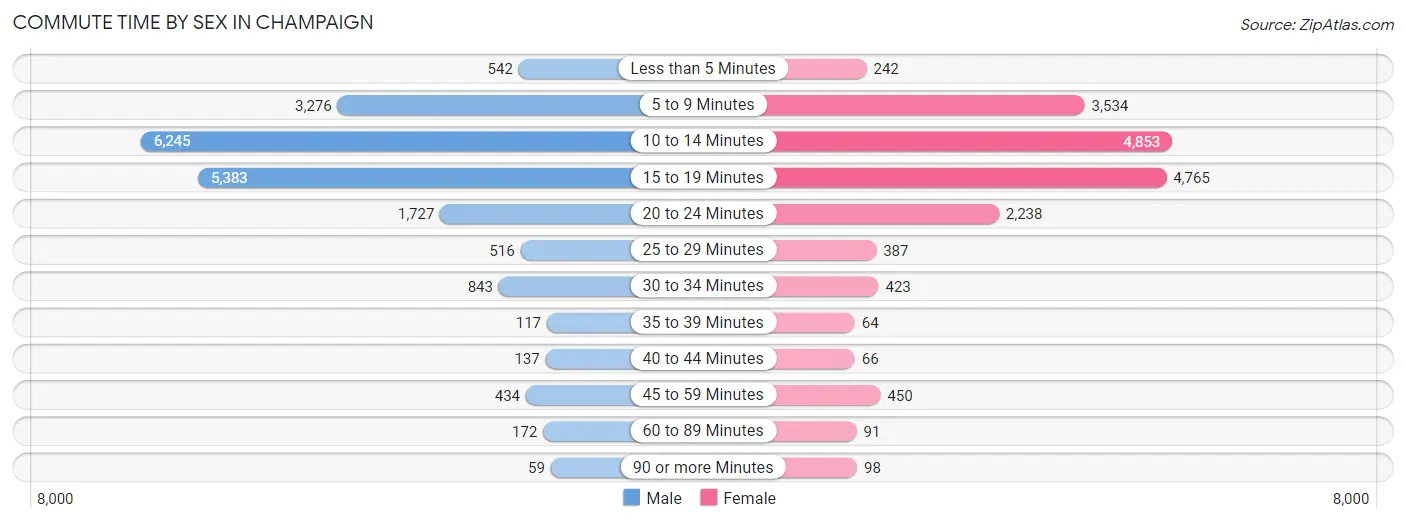
| Commute Time | Male | Female |
| Less than 5 Minutes | 542 (2.8%) | 242 (1.4%) |
| 5 to 9 Minutes | 3,276 (16.8%) | 3,534 (20.5%) |
| 10 to 14 Minutes | 6,245 (32.1%) | 4,853 (28.2%) |
| 15 to 19 Minutes | 5,383 (27.7%) | 4,765 (27.7%) |
| 20 to 24 Minutes | 1,727 (8.9%) | 2,238 (13.0%) |
| 25 to 29 Minutes | 516 (2.6%) | 387 (2.2%) |
| 30 to 34 Minutes | 843 (4.3%) | 423 (2.5%) |
| 35 to 39 Minutes | 117 (0.6%) | 64 (0.4%) |
| 40 to 44 Minutes | 137 (0.7%) | 66 (0.4%) |
| 45 to 59 Minutes | 434 (2.2%) | 450 (2.6%) |
| 60 to 89 Minutes | 172 (0.9%) | 91 (0.5%) |
| 90 or more Minutes | 59 (0.3%) | 98 (0.6%) |
Time of Departure to Work by Sex in Champaign
The most frequent times of departure to work in Champaign are 7:30 AM to 7:59 AM (3,032, 15.6%) for males and 7:30 AM to 7:59 AM (2,757, 16.0%) for females.
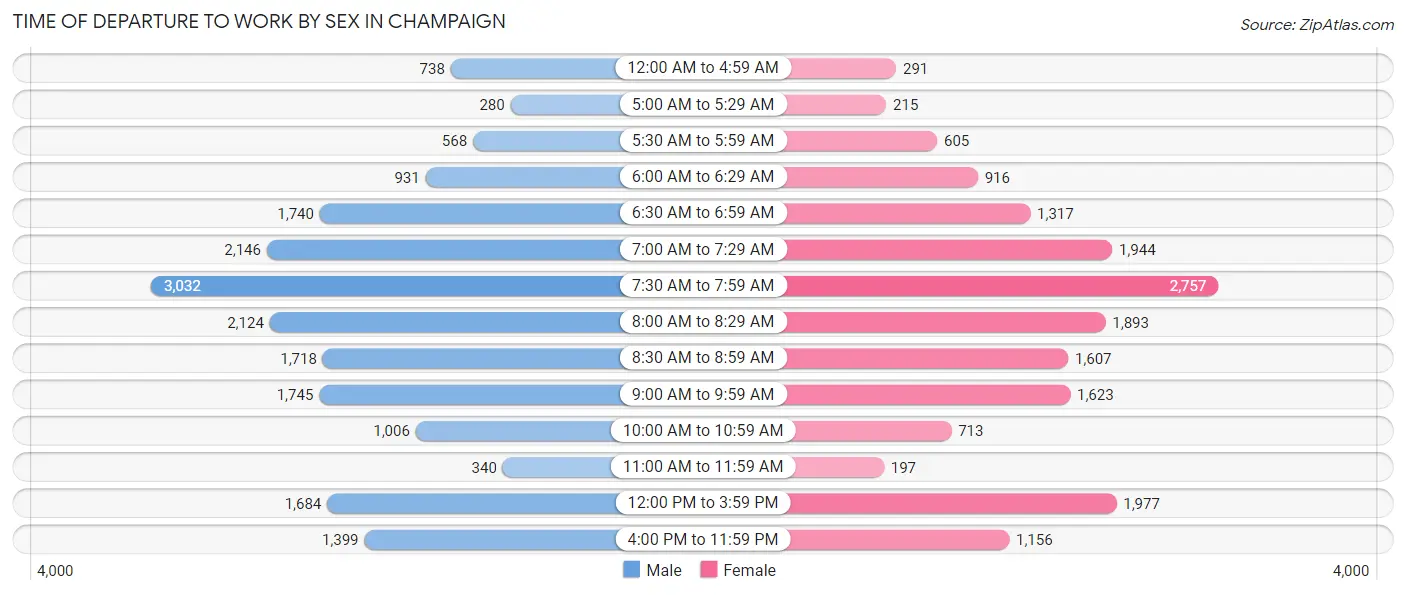
| Time of Departure | Male | Female |
| 12:00 AM to 4:59 AM | 738 (3.8%) | 291 (1.7%) |
| 5:00 AM to 5:29 AM | 280 (1.4%) | 215 (1.3%) |
| 5:30 AM to 5:59 AM | 568 (2.9%) | 605 (3.5%) |
| 6:00 AM to 6:29 AM | 931 (4.8%) | 916 (5.3%) |
| 6:30 AM to 6:59 AM | 1,740 (8.9%) | 1,317 (7.6%) |
| 7:00 AM to 7:29 AM | 2,146 (11.0%) | 1,944 (11.3%) |
| 7:30 AM to 7:59 AM | 3,032 (15.6%) | 2,757 (16.0%) |
| 8:00 AM to 8:29 AM | 2,124 (10.9%) | 1,893 (11.0%) |
| 8:30 AM to 8:59 AM | 1,718 (8.8%) | 1,607 (9.3%) |
| 9:00 AM to 9:59 AM | 1,745 (9.0%) | 1,623 (9.4%) |
| 10:00 AM to 10:59 AM | 1,006 (5.2%) | 713 (4.1%) |
| 11:00 AM to 11:59 AM | 340 (1.8%) | 197 (1.1%) |
| 12:00 PM to 3:59 PM | 1,684 (8.7%) | 1,977 (11.5%) |
| 4:00 PM to 11:59 PM | 1,399 (7.2%) | 1,156 (6.7%) |
| Total | 19,451 (100.0%) | 17,211 (100.0%) |
Housing Occupancy in Champaign
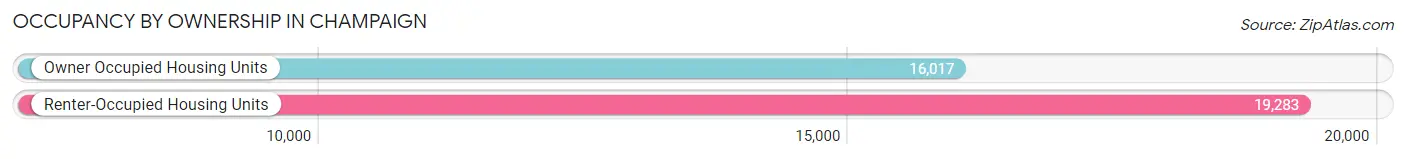
Occupancy by Ownership in Champaign
Of the total 35,300 dwellings in Champaign, owner-occupied units account for 16,017 (45.4%), while renter-occupied units make up 19,283 (54.6%).
| Occupancy | # Housing Units | % Housing Units |
| Owner Occupied Housing Units | 16,017 | 45.4% |
| Renter-Occupied Housing Units | 19,283 | 54.6% |
| Total Occupied Housing Units | 35,300 | 100.0% |
Occupancy by Household Size in Champaign
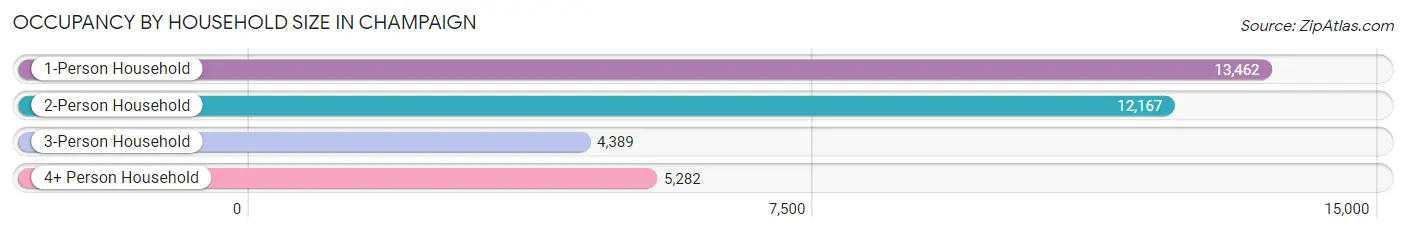
| Household Size | # Housing Units | % Housing Units |
| 1-Person Household | 13,462 | 38.1% |
| 2-Person Household | 12,167 | 34.5% |
| 3-Person Household | 4,389 | 12.4% |
| 4+ Person Household | 5,282 | 15.0% |
| Total Housing Units | 35,300 | 100.0% |
Occupancy by Ownership by Household Size in Champaign
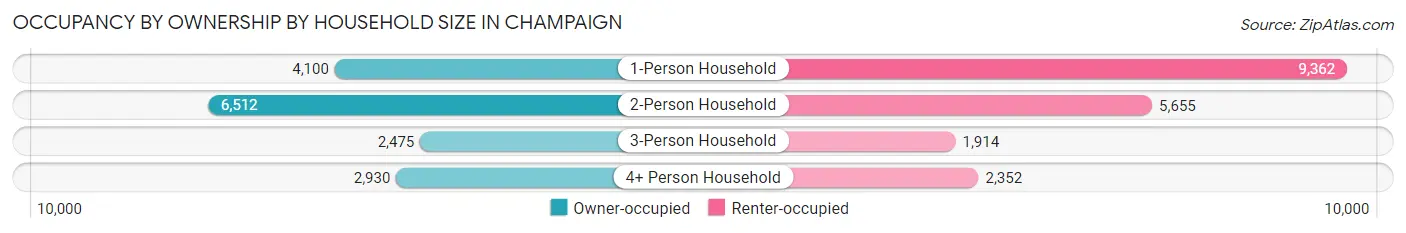
| Household Size | Owner-occupied | Renter-occupied |
| 1-Person Household | 4,100 (30.5%) | 9,362 (69.5%) |
| 2-Person Household | 6,512 (53.5%) | 5,655 (46.5%) |
| 3-Person Household | 2,475 (56.4%) | 1,914 (43.6%) |
| 4+ Person Household | 2,930 (55.5%) | 2,352 (44.5%) |
| Total Housing Units | 16,017 (45.4%) | 19,283 (54.6%) |
Occupancy by Educational Attainment in Champaign
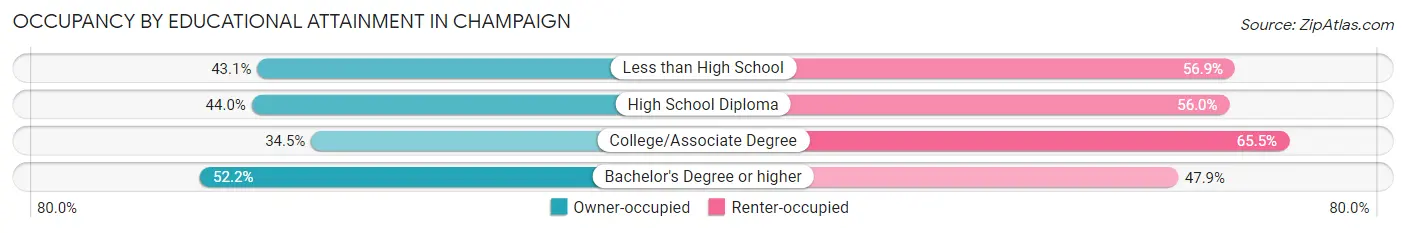
| Household Size | Owner-occupied | Renter-occupied |
| Less than High School | 622 (43.1%) | 821 (56.9%) |
| High School Diploma | 2,366 (44.0%) | 3,013 (56.0%) |
| College/Associate Degree | 3,576 (34.5%) | 6,776 (65.5%) |
| Bachelor's Degree or higher | 9,453 (52.1%) | 8,673 (47.8%) |
Occupancy by Age of Householder in Champaign
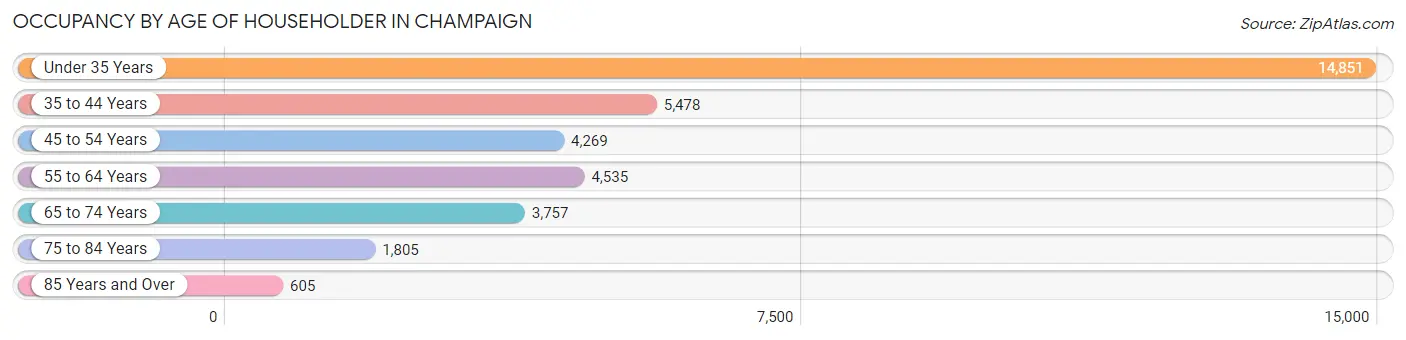
| Age Bracket | # Households | % Households |
| Under 35 Years | 14,851 | 42.1% |
| 35 to 44 Years | 5,478 | 15.5% |
| 45 to 54 Years | 4,269 | 12.1% |
| 55 to 64 Years | 4,535 | 12.9% |
| 65 to 74 Years | 3,757 | 10.6% |
| 75 to 84 Years | 1,805 | 5.1% |
| 85 Years and Over | 605 | 1.7% |
| Total | 35,300 | 100.0% |
Housing Finances in Champaign
Median Income by Occupancy in Champaign
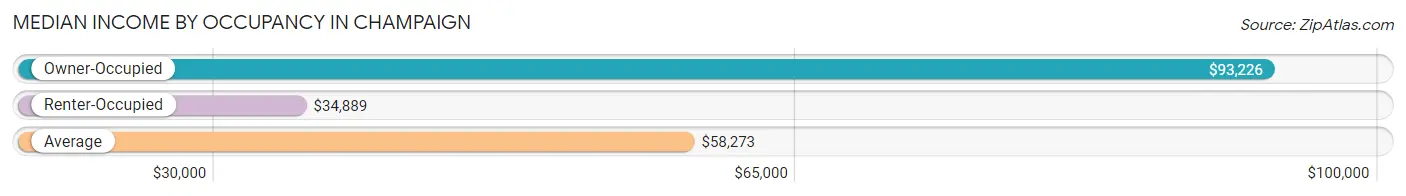
| Occupancy Type | # Households | Median Income |
| Owner-Occupied | 16,017 (45.4%) | $93,226 |
| Renter-Occupied | 19,283 (54.6%) | $34,889 |
| Average | 35,300 (100.0%) | $58,273 |
Occupancy by Householder Income Bracket in Champaign
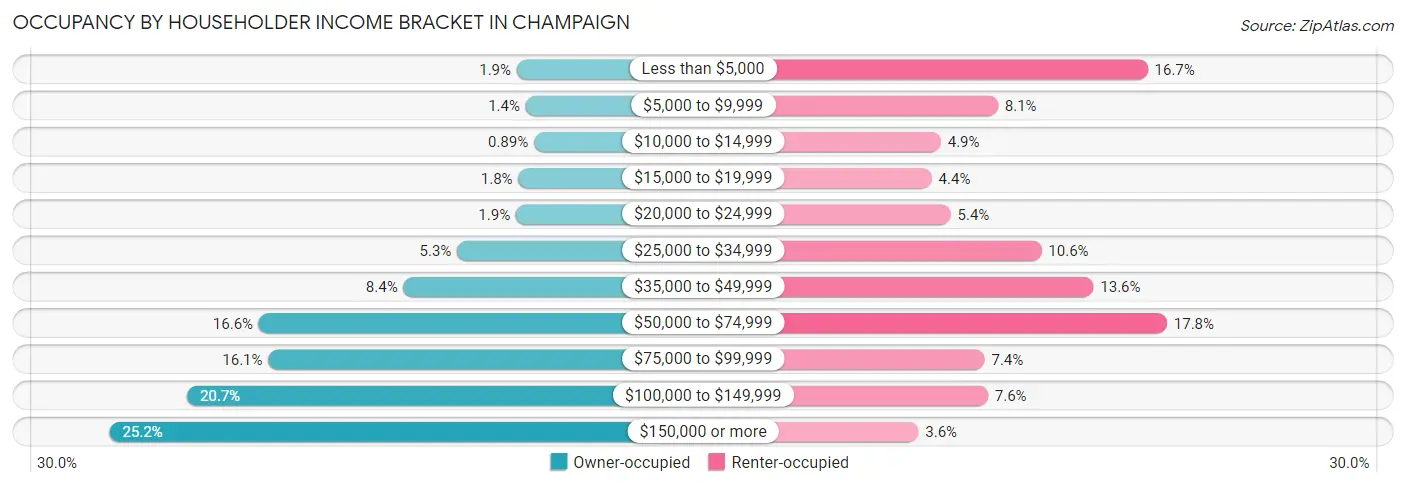
| Income Bracket | Owner-occupied | Renter-occupied |
| Less than $5,000 | 299 (1.9%) | 3,219 (16.7%) |
| $5,000 to $9,999 | 218 (1.4%) | 1,568 (8.1%) |
| $10,000 to $14,999 | 142 (0.9%) | 940 (4.9%) |
| $15,000 to $19,999 | 285 (1.8%) | 839 (4.3%) |
| $20,000 to $24,999 | 308 (1.9%) | 1,047 (5.4%) |
| $25,000 to $34,999 | 846 (5.3%) | 2,047 (10.6%) |
| $35,000 to $49,999 | 1,337 (8.4%) | 2,621 (13.6%) |
| $50,000 to $74,999 | 2,661 (16.6%) | 3,430 (17.8%) |
| $75,000 to $99,999 | 2,574 (16.1%) | 1,422 (7.4%) |
| $100,000 to $149,999 | 3,319 (20.7%) | 1,457 (7.6%) |
| $150,000 or more | 4,028 (25.2%) | 693 (3.6%) |
| Total | 16,017 (100.0%) | 19,283 (100.0%) |
Monthly Housing Cost Tiers in Champaign
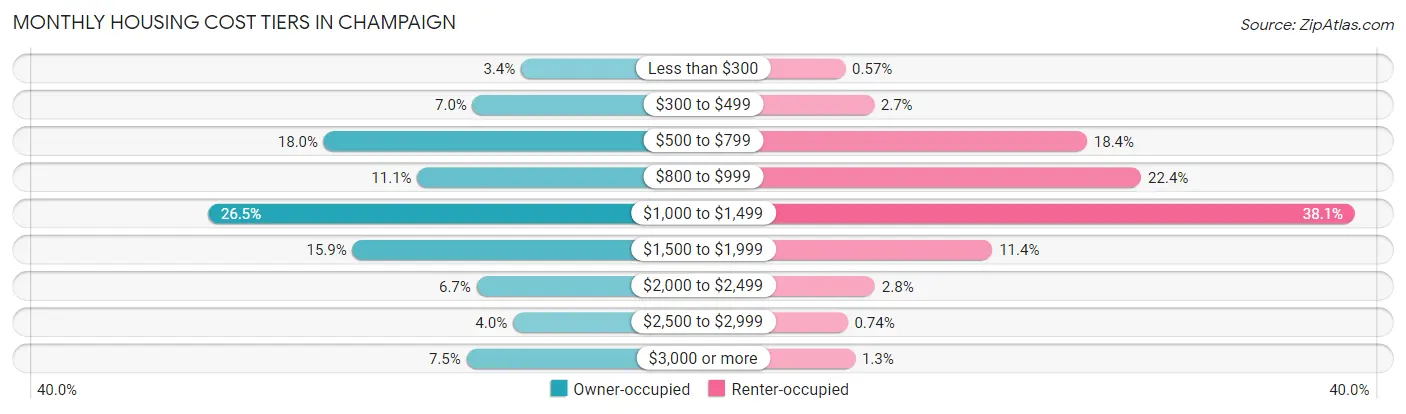
| Monthly Cost | Owner-occupied | Renter-occupied |
| Less than $300 | 551 (3.4%) | 109 (0.6%) |
| $300 to $499 | 1,121 (7.0%) | 517 (2.7%) |
| $500 to $799 | 2,877 (18.0%) | 3,543 (18.4%) |
| $800 to $999 | 1,773 (11.1%) | 4,313 (22.4%) |
| $1,000 to $1,499 | 4,245 (26.5%) | 7,348 (38.1%) |
| $1,500 to $1,999 | 2,538 (15.9%) | 2,198 (11.4%) |
| $2,000 to $2,499 | 1,074 (6.7%) | 532 (2.8%) |
| $2,500 to $2,999 | 645 (4.0%) | 142 (0.7%) |
| $3,000 or more | 1,193 (7.4%) | 249 (1.3%) |
| Total | 16,017 (100.0%) | 19,283 (100.0%) |
Physical Housing Characteristics in Champaign
Housing Structures in Champaign
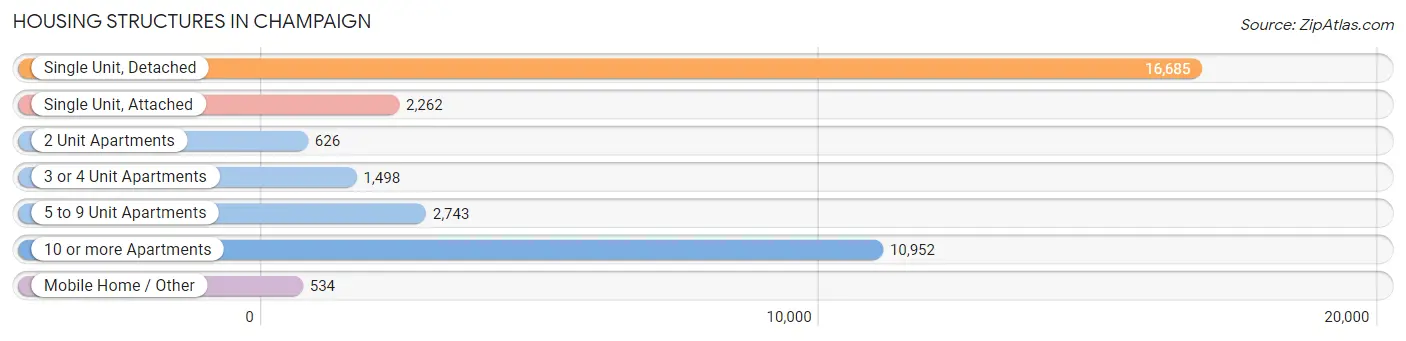
| Structure Type | # Housing Units | % Housing Units |
| Single Unit, Detached | 16,685 | 47.3% |
| Single Unit, Attached | 2,262 | 6.4% |
| 2 Unit Apartments | 626 | 1.8% |
| 3 or 4 Unit Apartments | 1,498 | 4.2% |
| 5 to 9 Unit Apartments | 2,743 | 7.8% |
| 10 or more Apartments | 10,952 | 31.0% |
| Mobile Home / Other | 534 | 1.5% |
| Total | 35,300 | 100.0% |
Housing Structures by Occupancy in Champaign
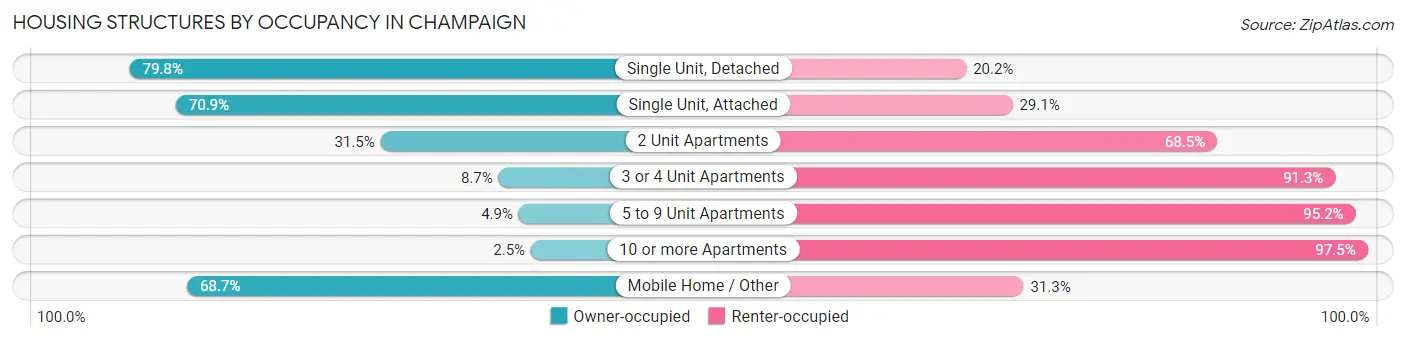
| Structure Type | Owner-occupied | Renter-occupied |
| Single Unit, Detached | 13,311 (79.8%) | 3,374 (20.2%) |
| Single Unit, Attached | 1,603 (70.9%) | 659 (29.1%) |
| 2 Unit Apartments | 197 (31.5%) | 429 (68.5%) |
| 3 or 4 Unit Apartments | 131 (8.7%) | 1,367 (91.3%) |
| 5 to 9 Unit Apartments | 133 (4.9%) | 2,610 (95.2%) |
| 10 or more Apartments | 275 (2.5%) | 10,677 (97.5%) |
| Mobile Home / Other | 367 (68.7%) | 167 (31.3%) |
| Total | 16,017 (45.4%) | 19,283 (54.6%) |
Housing Structures by Number of Rooms in Champaign
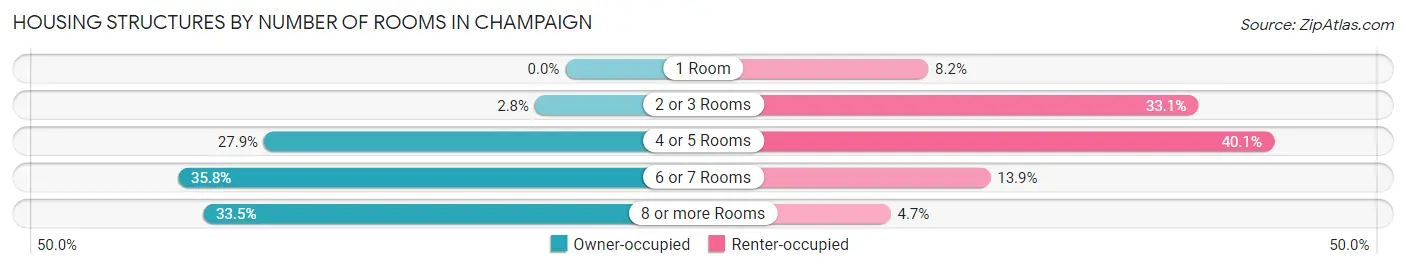
| Number of Rooms | Owner-occupied | Renter-occupied |
| 1 Room | 0 (0.0%) | 1,574 (8.2%) |
| 2 or 3 Rooms | 450 (2.8%) | 6,387 (33.1%) |
| 4 or 5 Rooms | 4,464 (27.9%) | 7,737 (40.1%) |
| 6 or 7 Rooms | 5,737 (35.8%) | 2,683 (13.9%) |
| 8 or more Rooms | 5,366 (33.5%) | 902 (4.7%) |
| Total | 16,017 (100.0%) | 19,283 (100.0%) |
Housing Structure by Heating Type in Champaign
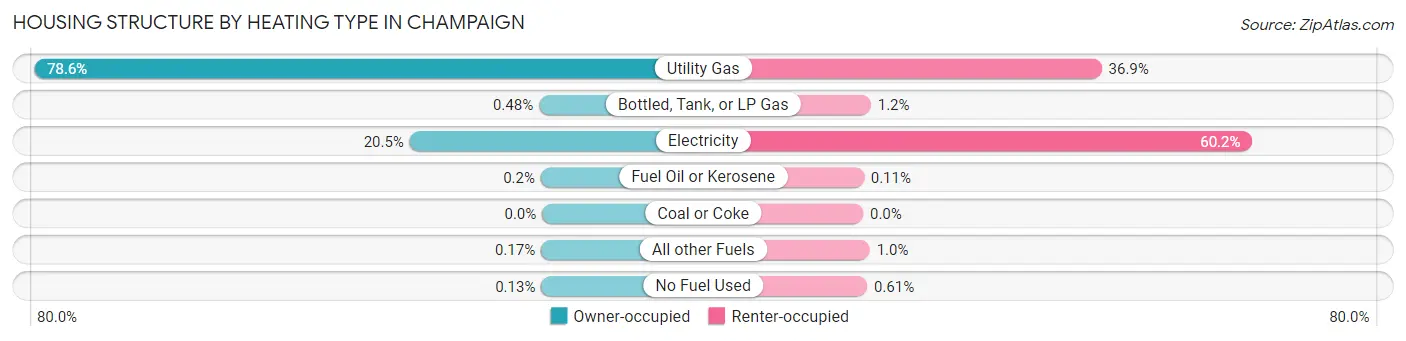
| Heating Type | Owner-occupied | Renter-occupied |
| Utility Gas | 12,582 (78.5%) | 7,112 (36.9%) |
| Bottled, Tank, or LP Gas | 77 (0.5%) | 231 (1.2%) |
| Electricity | 3,278 (20.5%) | 11,602 (60.2%) |
| Fuel Oil or Kerosene | 32 (0.2%) | 22 (0.1%) |
| Coal or Coke | 0 (0.0%) | 0 (0.0%) |
| All other Fuels | 27 (0.2%) | 199 (1.0%) |
| No Fuel Used | 21 (0.1%) | 117 (0.6%) |
| Total | 16,017 (100.0%) | 19,283 (100.0%) |
Household Vehicle Usage in Champaign
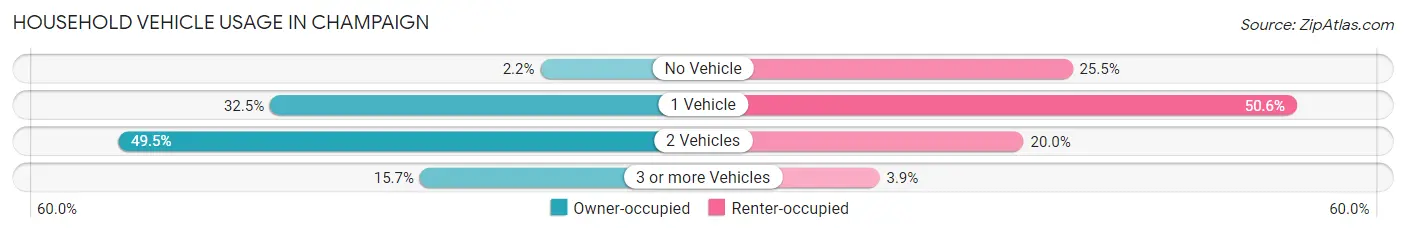
| Vehicles per Household | Owner-occupied | Renter-occupied |
| No Vehicle | 357 (2.2%) | 4,916 (25.5%) |
| 1 Vehicle | 5,207 (32.5%) | 9,759 (50.6%) |
| 2 Vehicles | 7,933 (49.5%) | 3,859 (20.0%) |
| 3 or more Vehicles | 2,520 (15.7%) | 749 (3.9%) |
| Total | 16,017 (100.0%) | 19,283 (100.0%) |
Real Estate & Mortgages in Champaign
Real Estate and Mortgage Overview in Champaign
| Characteristic | Without Mortgage | With Mortgage |
| Housing Units | 6,329 | 9,688 |
| Median Property Value | $185,900 | $194,300 |
| Median Household Income | $76,225 | $2,635 |
| Monthly Housing Costs | $689 | $1,149 |
| Real Estate Taxes | $4,191 | $149 |
Property Value by Mortgage Status in Champaign
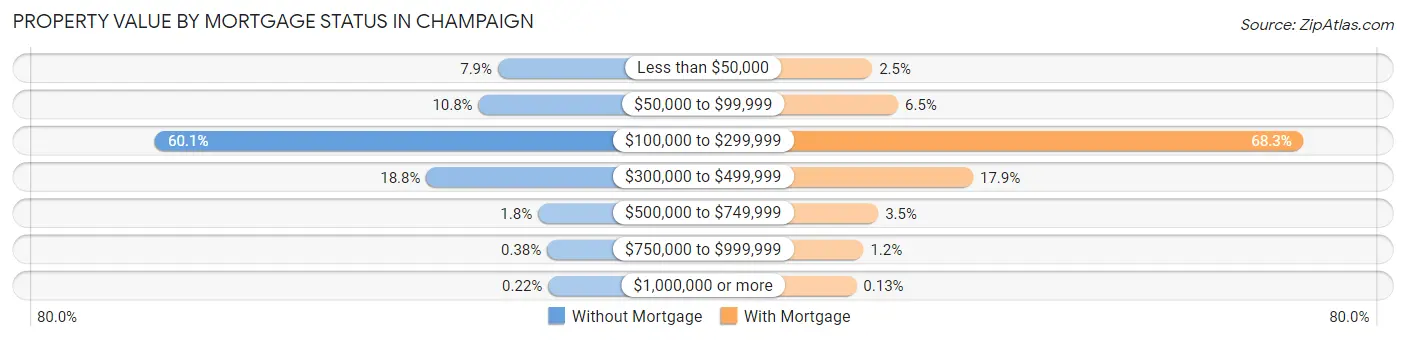
| Property Value | Without Mortgage | With Mortgage |
| Less than $50,000 | 499 (7.9%) | 246 (2.5%) |
| $50,000 to $99,999 | 686 (10.8%) | 628 (6.5%) |
| $100,000 to $299,999 | 3,805 (60.1%) | 6,614 (68.3%) |
| $300,000 to $499,999 | 1,189 (18.8%) | 1,735 (17.9%) |
| $500,000 to $749,999 | 112 (1.8%) | 335 (3.5%) |
| $750,000 to $999,999 | 24 (0.4%) | 117 (1.2%) |
| $1,000,000 or more | 14 (0.2%) | 13 (0.1%) |
| Total | 6,329 (100.0%) | 9,688 (100.0%) |
Household Income by Mortgage Status in Champaign
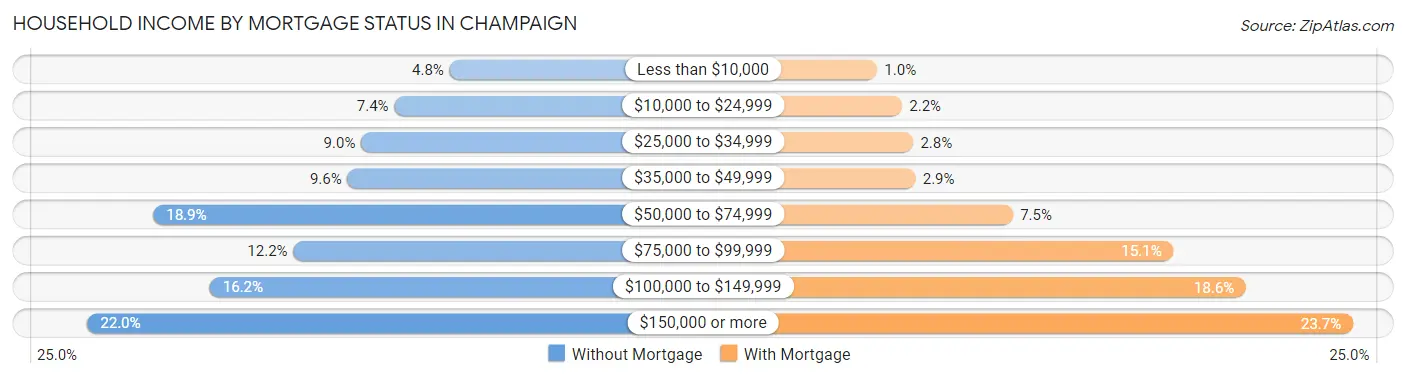
| Household Income | Without Mortgage | With Mortgage |
| Less than $10,000 | 301 (4.8%) | 101 (1.0%) |
| $10,000 to $24,999 | 468 (7.4%) | 216 (2.2%) |
| $25,000 to $34,999 | 568 (9.0%) | 267 (2.8%) |
| $35,000 to $49,999 | 609 (9.6%) | 278 (2.9%) |
| $50,000 to $74,999 | 1,194 (18.9%) | 728 (7.5%) |
| $75,000 to $99,999 | 772 (12.2%) | 1,467 (15.1%) |
| $100,000 to $149,999 | 1,024 (16.2%) | 1,802 (18.6%) |
| $150,000 or more | 1,393 (22.0%) | 2,295 (23.7%) |
| Total | 6,329 (100.0%) | 9,688 (100.0%) |
Property Value to Household Income Ratio in Champaign
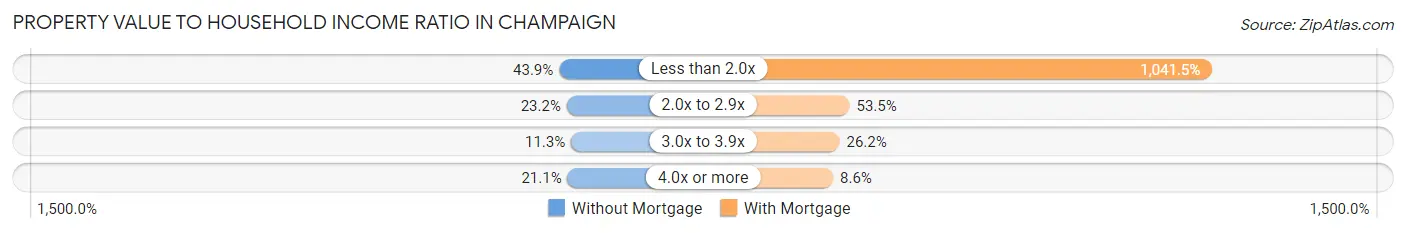
| Value-to-Income Ratio | Without Mortgage | With Mortgage |
| Less than 2.0x | 2,775 (43.9%) | 100,900 (1,041.5%) |
| 2.0x to 2.9x | 1,467 (23.2%) | 5,184 (53.5%) |
| 3.0x to 3.9x | 714 (11.3%) | 2,538 (26.2%) |
| 4.0x or more | 1,334 (21.1%) | 831 (8.6%) |
| Total | 6,329 (100.0%) | 9,688 (100.0%) |
Real Estate Taxes by Mortgage Status in Champaign
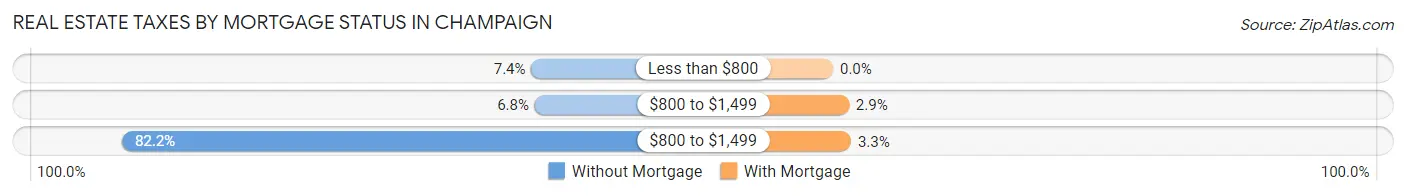
| Property Taxes | Without Mortgage | With Mortgage |
| Less than $800 | 471 (7.4%) | 0 (0.0%) |
| $800 to $1,499 | 431 (6.8%) | 281 (2.9%) |
| $800 to $1,499 | 5,203 (82.2%) | 317 (3.3%) |
| Total | 6,329 (100.0%) | 9,688 (100.0%) |
Health & Disability in Champaign
Health Insurance Coverage by Age in Champaign
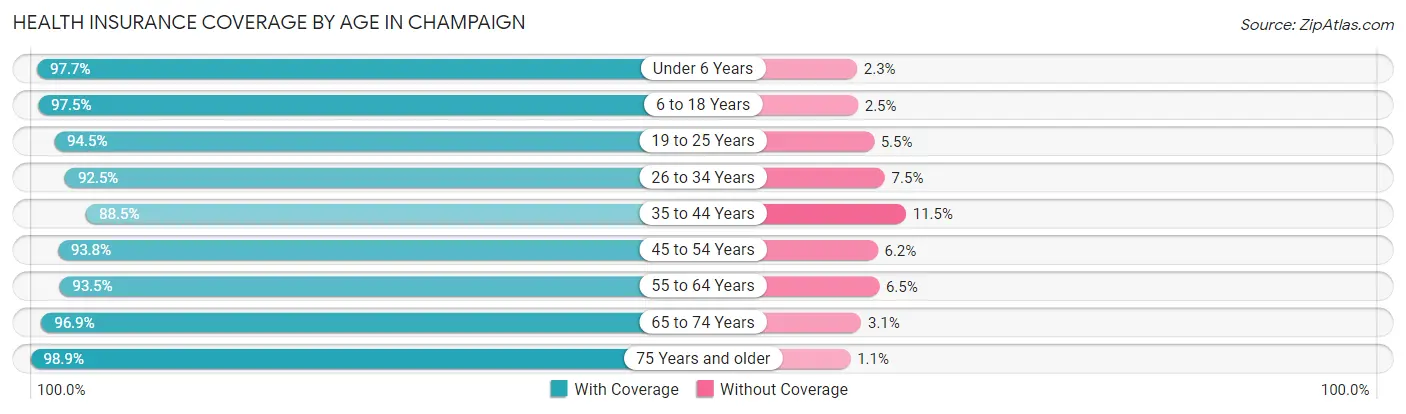
| Age Bracket | With Coverage | Without Coverage |
| Under 6 Years | 5,306 (97.7%) | 127 (2.3%) |
| 6 to 18 Years | 13,170 (97.5%) | 339 (2.5%) |
| 19 to 25 Years | 22,535 (94.5%) | 1,308 (5.5%) |
| 26 to 34 Years | 10,534 (92.5%) | 858 (7.5%) |
| 35 to 44 Years | 8,373 (88.5%) | 1,085 (11.5%) |
| 45 to 54 Years | 6,871 (93.8%) | 454 (6.2%) |
| 55 to 64 Years | 7,068 (93.5%) | 489 (6.5%) |
| 65 to 74 Years | 5,708 (96.9%) | 184 (3.1%) |
| 75 Years and older | 3,783 (98.9%) | 42 (1.1%) |
| Total | 83,348 (94.5%) | 4,886 (5.5%) |
Health Insurance Coverage by Citizenship Status in Champaign
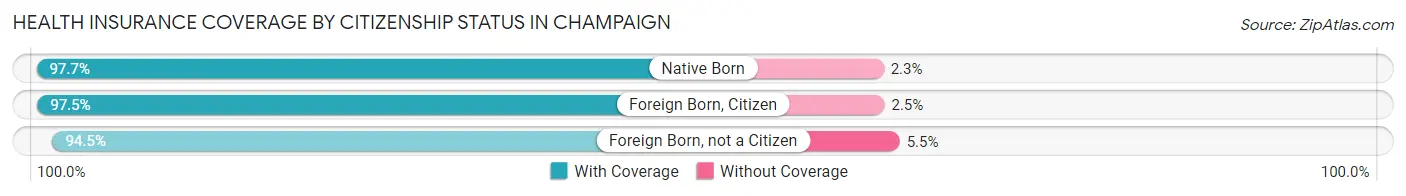
| Citizenship Status | With Coverage | Without Coverage |
| Native Born | 5,306 (97.7%) | 127 (2.3%) |
| Foreign Born, Citizen | 13,170 (97.5%) | 339 (2.5%) |
| Foreign Born, not a Citizen | 22,535 (94.5%) | 1,308 (5.5%) |
Health Insurance Coverage by Household Income in Champaign
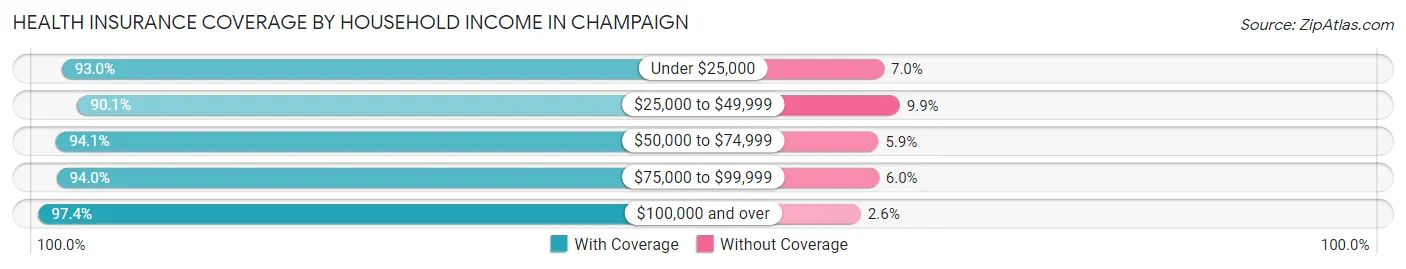
| Household Income | With Coverage | Without Coverage |
| Under $25,000 | 15,392 (93.0%) | 1,155 (7.0%) |
| $25,000 to $49,999 | 13,249 (90.1%) | 1,462 (9.9%) |
| $50,000 to $74,999 | 12,822 (94.1%) | 809 (5.9%) |
| $75,000 to $99,999 | 9,612 (94.0%) | 613 (6.0%) |
| $100,000 and over | 25,212 (97.4%) | 684 (2.6%) |
Public vs Private Health Insurance Coverage by Age in Champaign
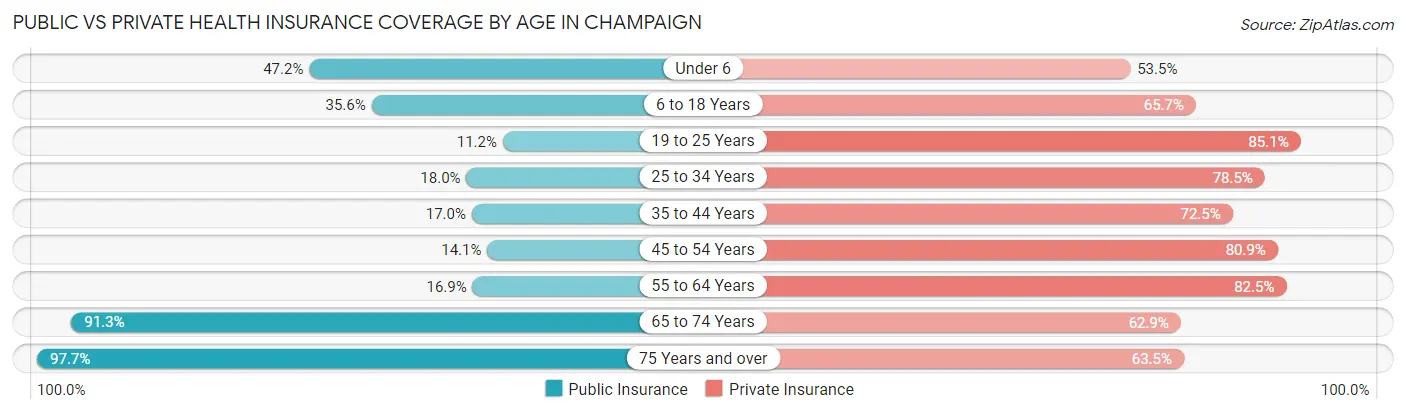
| Age Bracket | Public Insurance | Private Insurance |
| Under 6 | 2,563 (47.2%) | 2,909 (53.5%) |
| 6 to 18 Years | 4,809 (35.6%) | 8,876 (65.7%) |
| 19 to 25 Years | 2,680 (11.2%) | 20,298 (85.1%) |
| 25 to 34 Years | 2,049 (18.0%) | 8,942 (78.5%) |
| 35 to 44 Years | 1,608 (17.0%) | 6,859 (72.5%) |
| 45 to 54 Years | 1,034 (14.1%) | 5,926 (80.9%) |
| 55 to 64 Years | 1,273 (16.9%) | 6,234 (82.5%) |
| 65 to 74 Years | 5,381 (91.3%) | 3,706 (62.9%) |
| 75 Years and over | 3,736 (97.7%) | 2,428 (63.5%) |
| Total | 25,133 (28.5%) | 66,178 (75.0%) |
Disability Status by Sex by Age in Champaign
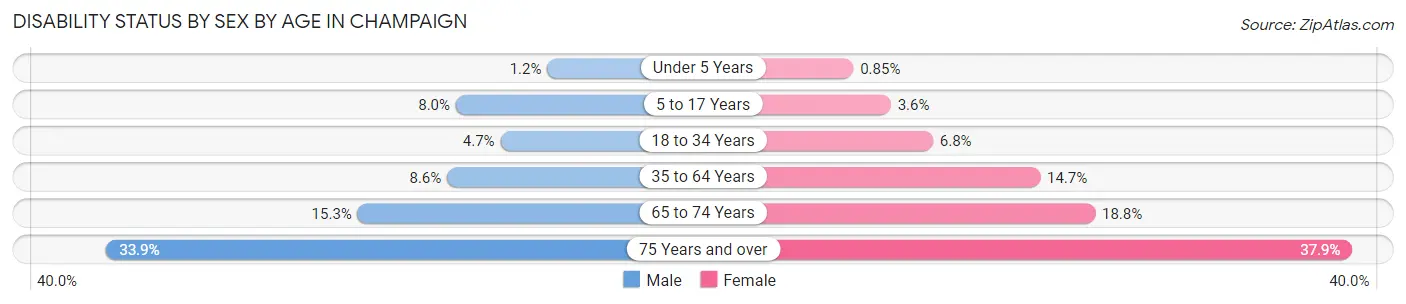
| Age Bracket | Male | Female |
| Under 5 Years | 29 (1.2%) | 18 (0.9%) |
| 5 to 17 Years | 444 (8.0%) | 185 (3.6%) |
| 18 to 34 Years | 961 (4.7%) | 1,243 (6.8%) |
| 35 to 64 Years | 1,081 (8.6%) | 1,740 (14.7%) |
| 65 to 74 Years | 400 (15.3%) | 615 (18.8%) |
| 75 Years and over | 552 (33.9%) | 833 (37.9%) |
Disability Class by Sex by Age in Champaign
Disability Class: Hearing Difficulty
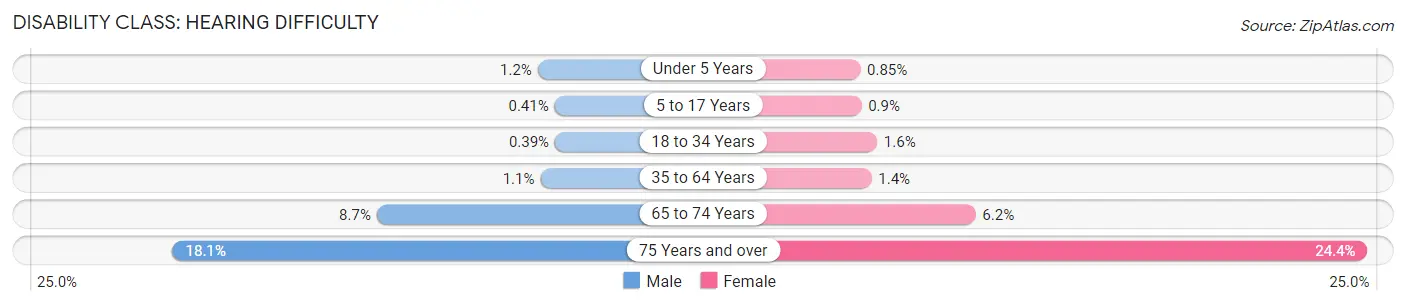
| Age Bracket | Male | Female |
| Under 5 Years | 29 (1.2%) | 18 (0.9%) |
| 5 to 17 Years | 23 (0.4%) | 46 (0.9%) |
| 18 to 34 Years | 80 (0.4%) | 300 (1.6%) |
| 35 to 64 Years | 134 (1.1%) | 162 (1.4%) |
| 65 to 74 Years | 227 (8.7%) | 203 (6.2%) |
| 75 Years and over | 295 (18.1%) | 536 (24.4%) |
Disability Class: Vision Difficulty
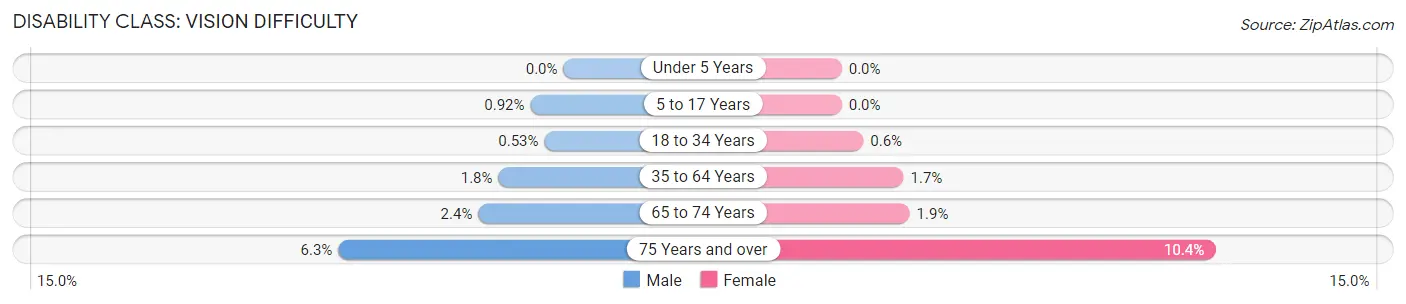
| Age Bracket | Male | Female |
| Under 5 Years | 0 (0.0%) | 0 (0.0%) |
| 5 to 17 Years | 51 (0.9%) | 0 (0.0%) |
| 18 to 34 Years | 109 (0.5%) | 110 (0.6%) |
| 35 to 64 Years | 226 (1.8%) | 203 (1.7%) |
| 65 to 74 Years | 62 (2.4%) | 62 (1.9%) |
| 75 Years and over | 102 (6.3%) | 229 (10.4%) |
Disability Class: Cognitive Difficulty
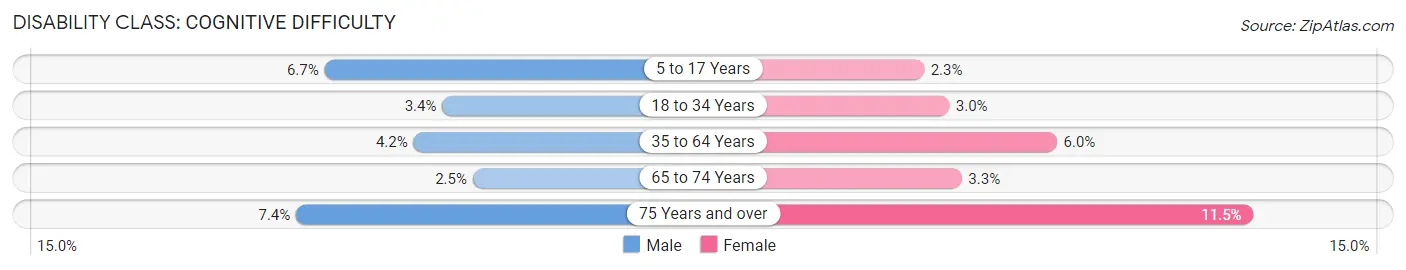
| Age Bracket | Male | Female |
| 5 to 17 Years | 370 (6.7%) | 116 (2.3%) |
| 18 to 34 Years | 694 (3.4%) | 549 (3.0%) |
| 35 to 64 Years | 522 (4.2%) | 707 (6.0%) |
| 65 to 74 Years | 66 (2.5%) | 109 (3.3%) |
| 75 Years and over | 121 (7.4%) | 252 (11.5%) |
Disability Class: Ambulatory Difficulty
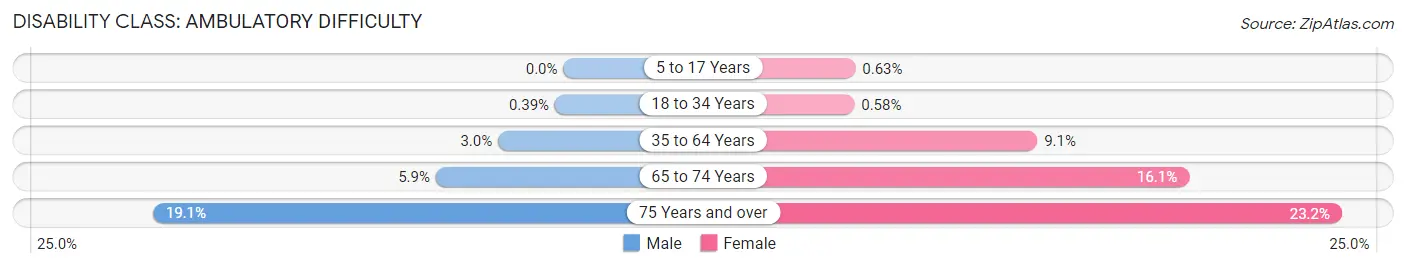
| Age Bracket | Male | Female |
| 5 to 17 Years | 0 (0.0%) | 32 (0.6%) |
| 18 to 34 Years | 81 (0.4%) | 106 (0.6%) |
| 35 to 64 Years | 379 (3.0%) | 1,072 (9.1%) |
| 65 to 74 Years | 155 (5.9%) | 527 (16.1%) |
| 75 Years and over | 310 (19.1%) | 510 (23.2%) |
Disability Class: Self-Care Difficulty
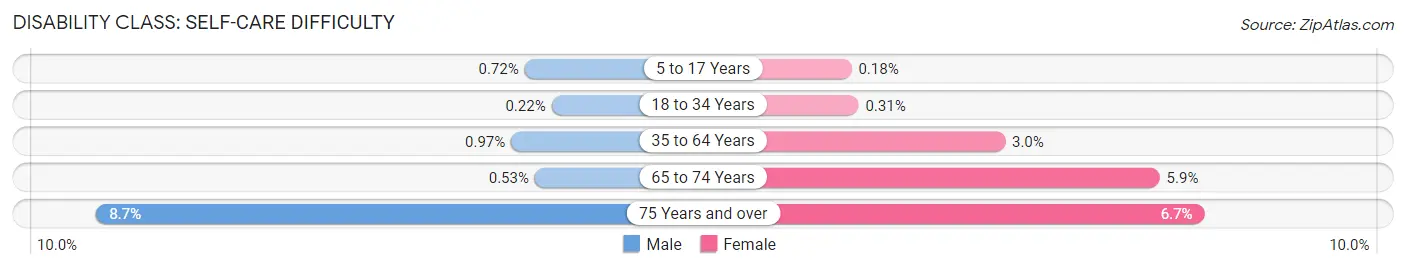
| Age Bracket | Male | Female |
| 5 to 17 Years | 40 (0.7%) | 9 (0.2%) |
| 18 to 34 Years | 45 (0.2%) | 57 (0.3%) |
| 35 to 64 Years | 121 (1.0%) | 358 (3.0%) |
| 65 to 74 Years | 14 (0.5%) | 193 (5.9%) |
| 75 Years and over | 141 (8.7%) | 148 (6.7%) |
Technology Access in Champaign
Computing Device Access in Champaign
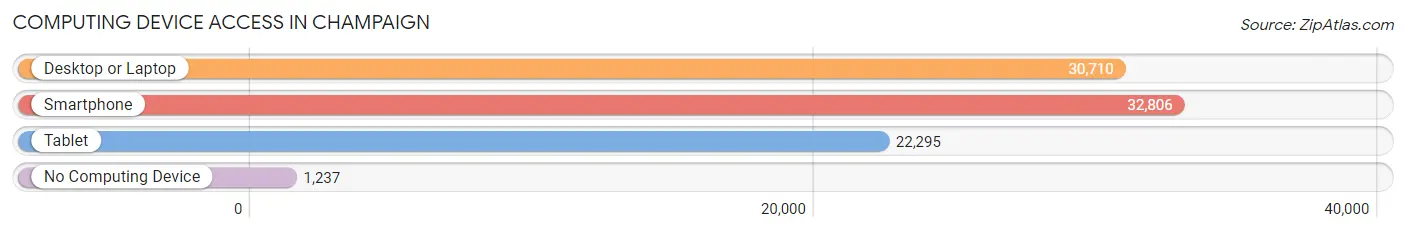
| Device Type | # Households | % Households |
| Desktop or Laptop | 30,710 | 87.0% |
| Smartphone | 32,806 | 92.9% |
| Tablet | 22,295 | 63.2% |
| No Computing Device | 1,237 | 3.5% |
| Total | 35,300 | 100.0% |
Internet Access in Champaign
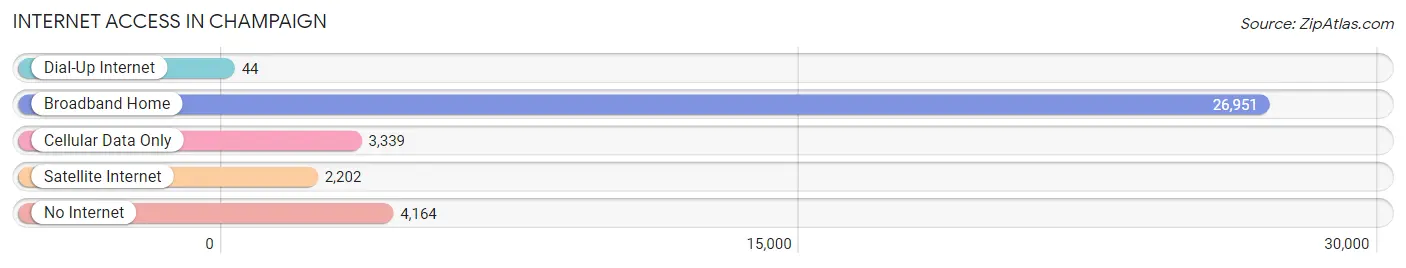
| Internet Type | # Households | % Households |
| Dial-Up Internet | 44 | 0.1% |
| Broadband Home | 26,951 | 76.3% |
| Cellular Data Only | 3,339 | 9.5% |
| Satellite Internet | 2,202 | 6.2% |
| No Internet | 4,164 | 11.8% |
| Total | 35,300 | 100.0% |
Champaign Summary
History
The city of Champaign, Illinois is located in the east-central part of the state, about 140 miles south of Chicago. It is the county seat of Champaign County and is part of the Champaign-Urbana metropolitan area. The city was founded in 1855 and was named after the county, which was named after the Champaign County, Ohio.
The area was originally inhabited by the Kickapoo and Potawatomi Native American tribes. The first European settlers arrived in the area in the early 1800s. The first permanent settlement was established in 1822 by William and Mary Busey, who named the settlement West Urbana. The settlement was later renamed Champaign in 1833.
The city grew rapidly in the late 19th century, becoming a major agricultural center and a hub for the railroad industry. The University of Illinois at Urbana-Champaign was established in 1867, and the city became a major educational center. The city also became a major manufacturing center in the early 20th century, with the establishment of the International Harvester Company in 1902.
Geography
Champaign is located in east-central Illinois, about 140 miles south of Chicago. It is situated in the Champaign-Urbana metropolitan area, which includes the cities of Champaign, Urbana, and Savoy. The city is located in the Champaign-Urbana-Rantoul-Mahomet-Tolono metropolitan statistical area.
The city is situated on the banks of the Sangamon River, which flows through the city from north to south. The city is located in a flat, low-lying area, with an elevation of about 600 feet above sea level. The city is surrounded by agricultural land, with the exception of the northern part of the city, which is bordered by the University of Illinois campus.
Economy
The economy of Champaign is largely driven by the University of Illinois at Urbana-Champaign, which is the city’s largest employer. Other major employers in the city include Carle Foundation Hospital, Kraft Foods, and the Champaign-Urbana Mass Transit District.
The city is also home to a number of technology companies, including Wolfram Research, Wolfram Alpha, and the National Center for Supercomputing Applications. The city is also home to a number of manufacturing companies, including the International Harvester Company, which was founded in 1902.
Demographics
As of the 2010 census, the population of Champaign was 81,055. The racial makeup of the city was 73.3% White, 15.3% African American, 0.3% Native American, 5.2% Asian, 0.1% Pacific Islander, and 5.7% from other races. The median household income was $41,943, and the median family income was $54,828.
The city is home to a large student population, with the University of Illinois at Urbana-Champaign enrolling over 44,000 students. The city also has a large Hispanic population, with over 10% of the population identifying as Hispanic or Latino. The city also has a large Asian population, with over 5% of the population identifying as Asian.
Common Questions
What is Per Capita Income in Champaign?
Per Capita income in Champaign is $34,879.
What is the Median Family Income in Champaign?
Median Family Income in Champaign is $88,990.
What is the Median Household income in Champaign?
Median Household Income in Champaign is $58,273.
What is Income or Wage Gap in Champaign?
Income or Wage Gap in Champaign is 26.0%.
Women in Champaign earn 74.0 cents for every dollar earned by a man.
What is Family Income Deficit in Champaign?
Family Income Deficit in Champaign is $10,397.
Families that are below poverty line in Champaign earn $10,397 less on average than the poverty threshold level.
What is Inequality or Gini Index in Champaign?
Inequality or Gini Index in Champaign is 0.53.
What is the Total Population of Champaign?
Total Population of Champaign is 88,628.
What is the Total Male Population of Champaign?
Total Male Population of Champaign is 45,558.
What is the Total Female Population of Champaign?
Total Female Population of Champaign is 43,070.
What is the Ratio of Males per 100 Females in Champaign?
There are 105.78 Males per 100 Females in Champaign.
What is the Ratio of Females per 100 Males in Champaign?
There are 94.54 Females per 100 Males in Champaign.
What is the Median Population Age in Champaign?
Median Population Age in Champaign is 27.0 Years.
What is the Average Family Size in Champaign
Average Family Size in Champaign is 3.1 People.
What is the Average Household Size in Champaign
Average Household Size in Champaign is 2.3 People.
How Large is the Labor Force in Champaign?
There are 45,698 People in the Labor Forcein in Champaign.
What is the Percentage of People in the Labor Force in Champaign?
60.9% of People are in the Labor Force in Champaign.
What is the Unemployment Rate in Champaign?
Unemployment Rate in Champaign is 4.8%.