Monroe, NC Map & Demographics
Monroe Map
Monroe Overview
$28,611
PER CAPITA INCOME
$78,617
AVG FAMILY INCOME
$63,982
AVG HOUSEHOLD INCOME
26.7%
WAGE / INCOME GAP [ % ]
73.3¢/ $1
WAGE / INCOME GAP [ $ ]
$10,006
FAMILY INCOME DEFICIT
0.42
INEQUALITY / GINI INDEX
34,897
TOTAL POPULATION
17,232
MALE POPULATION
17,665
FEMALE POPULATION
97.55
MALES / 100 FEMALES
102.51
FEMALES / 100 MALES
36.1
MEDIAN AGE
3.5
AVG FAMILY SIZE
2.9
AVG HOUSEHOLD SIZE
17,881
LABOR FORCE [ PEOPLE ]
64.5%
PERCENT IN LABOR FORCE
6.2%
UNEMPLOYMENT RATE
Income in Monroe
Income Overview in Monroe
Per Capita Income in Monroe is $28,611, while median incomes of families and households are $78,617 and $63,982 respectively.
| Characteristic | Number | Measure |
| Per Capita Income | 34,897 | $28,611 |
| Median Family Income | 8,153 | $78,617 |
| Mean Family Income | 8,153 | $92,359 |
| Median Household Income | 11,700 | $63,982 |
| Mean Household Income | 11,700 | $82,663 |
| Income Deficit | 8,153 | $10,006 |
| Wage / Income Gap (%) | 34,897 | 26.66% |
| Wage / Income Gap ($) | 34,897 | 73.34¢ per $1 |
| Gini / Inequality Index | 34,897 | 0.42 |
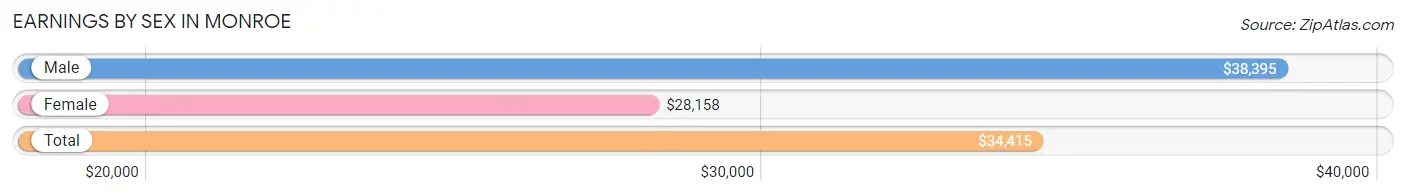
Earnings by Sex in Monroe
Average Earnings in Monroe are $34,415, $38,395 for men and $28,158 for women, a difference of 26.7%.
| Sex | Number | Average Earnings |
| Male | 10,238 (55.2%) | $38,395 |
| Female | 8,310 (44.8%) | $28,158 |
| Total | 18,548 (100.0%) | $34,415 |
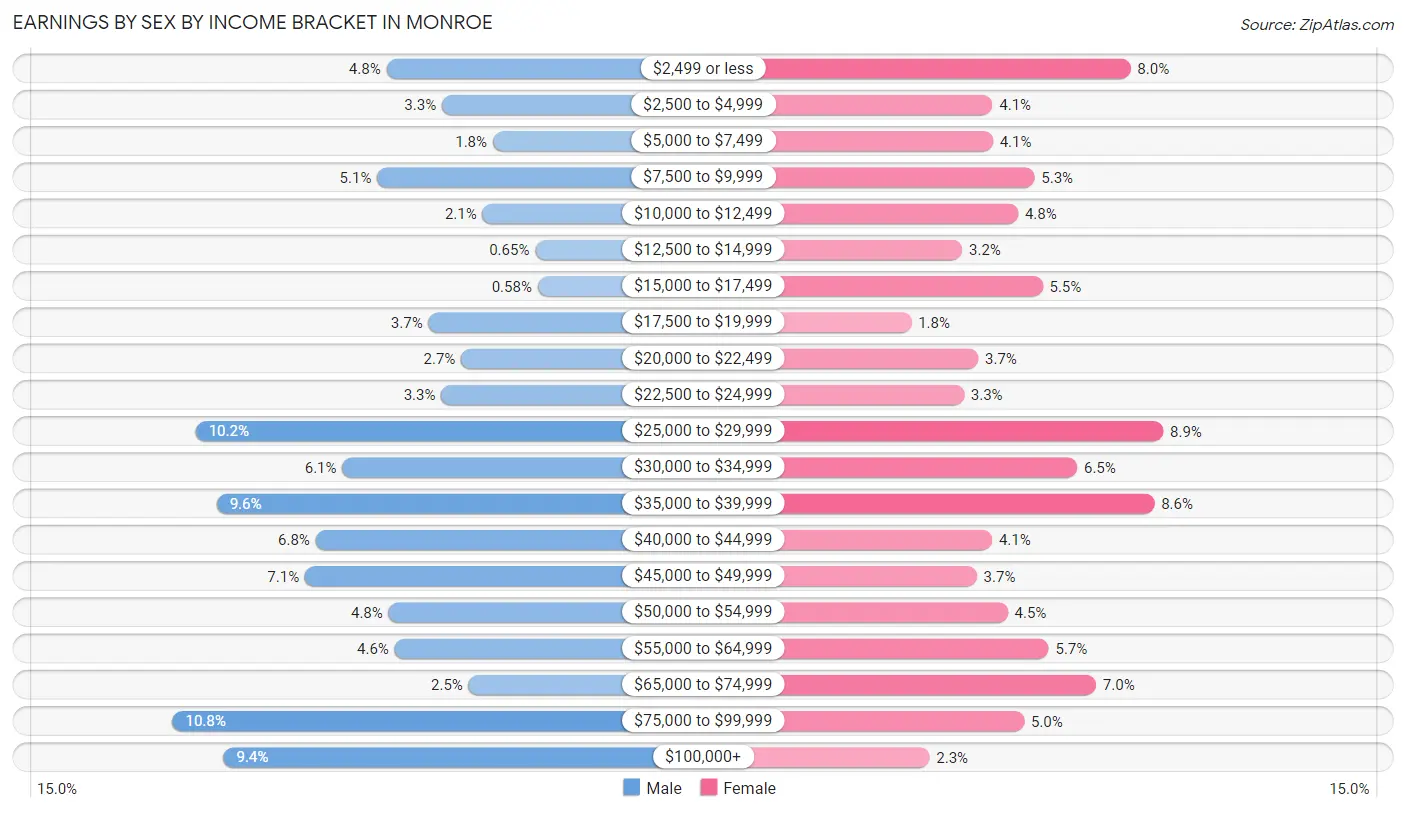
Earnings by Sex by Income Bracket in Monroe
The most common earnings brackets in Monroe are $75,000 to $99,999 for men (1,110 | 10.8%) and $25,000 to $29,999 for women (739 | 8.9%).
| Income | Male | Female |
| $2,499 or less | 495 (4.8%) | 662 (8.0%) |
| $2,500 to $4,999 | 335 (3.3%) | 340 (4.1%) |
| $5,000 to $7,499 | 188 (1.8%) | 341 (4.1%) |
| $7,500 to $9,999 | 521 (5.1%) | 438 (5.3%) |
| $10,000 to $12,499 | 218 (2.1%) | 400 (4.8%) |
| $12,500 to $14,999 | 67 (0.6%) | 269 (3.2%) |
| $15,000 to $17,499 | 59 (0.6%) | 457 (5.5%) |
| $17,500 to $19,999 | 374 (3.6%) | 150 (1.8%) |
| $20,000 to $22,499 | 280 (2.7%) | 307 (3.7%) |
| $22,500 to $24,999 | 337 (3.3%) | 273 (3.3%) |
| $25,000 to $29,999 | 1,043 (10.2%) | 739 (8.9%) |
| $30,000 to $34,999 | 621 (6.1%) | 538 (6.5%) |
| $35,000 to $39,999 | 983 (9.6%) | 718 (8.6%) |
| $40,000 to $44,999 | 698 (6.8%) | 339 (4.1%) |
| $45,000 to $49,999 | 729 (7.1%) | 303 (3.6%) |
| $50,000 to $54,999 | 488 (4.8%) | 376 (4.5%) |
| $55,000 to $64,999 | 471 (4.6%) | 471 (5.7%) |
| $65,000 to $74,999 | 258 (2.5%) | 582 (7.0%) |
| $75,000 to $99,999 | 1,110 (10.8%) | 414 (5.0%) |
| $100,000+ | 963 (9.4%) | 193 (2.3%) |
| Total | 10,238 (100.0%) | 8,310 (100.0%) |
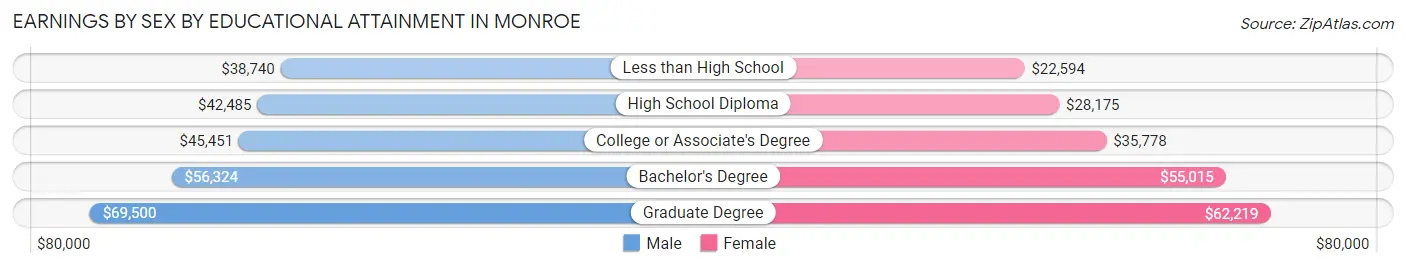
Earnings by Sex by Educational Attainment in Monroe
Average earnings in Monroe are $43,092 for men and $35,197 for women, a difference of 18.3%. Men with an educational attainment of graduate degree enjoy the highest average annual earnings of $69,500, while those with less than high school education earn the least with $38,740. Women with an educational attainment of graduate degree earn the most with the average annual earnings of $62,219, while those with less than high school education have the smallest earnings of $22,594.
| Educational Attainment | Male Income | Female Income |
| Less than High School | $38,740 | $22,594 |
| High School Diploma | $42,485 | $28,175 |
| College or Associate's Degree | $45,451 | $35,778 |
| Bachelor's Degree | $56,324 | $55,015 |
| Graduate Degree | $69,500 | $62,219 |
| Total | $43,092 | $35,197 |
Family Income in Monroe
Family Income Brackets in Monroe
According to the Monroe family income data, there are 1,459 families falling into the $75,000 to $99,999 income range, which is the most common income bracket and makes up 17.9% of all families. Conversely, the $10,000 to $14,999 income bracket is the least frequent group with only 57 families (0.7%) belonging to this category.
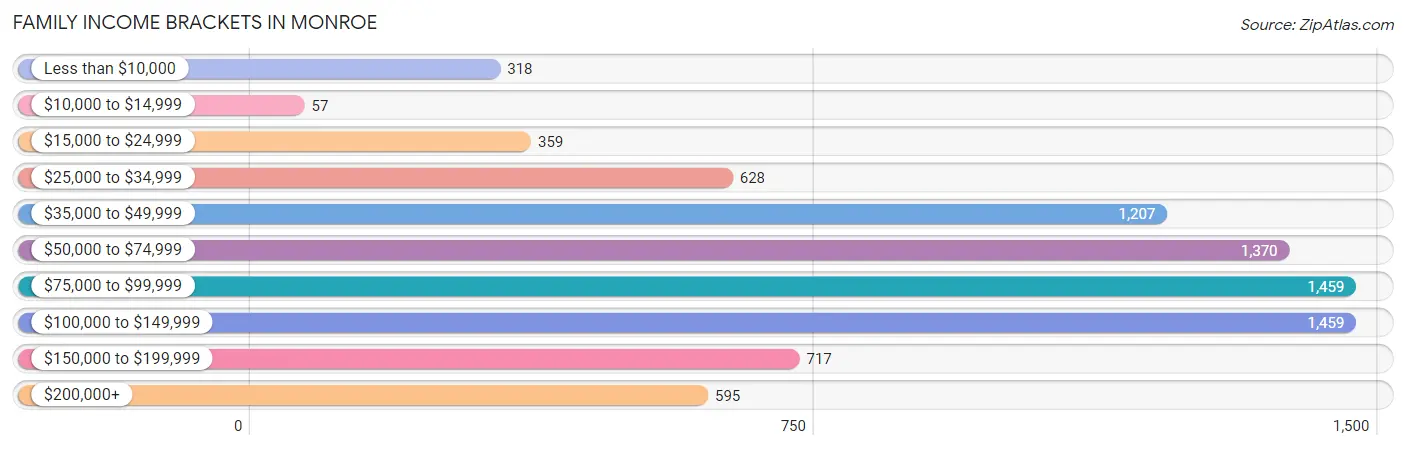
| Income Bracket | # Families | % Families |
| Less than $10,000 | 318 | 3.9% |
| $10,000 to $14,999 | 57 | 0.7% |
| $15,000 to $24,999 | 359 | 4.4% |
| $25,000 to $34,999 | 628 | 7.7% |
| $35,000 to $49,999 | 1,207 | 14.8% |
| $50,000 to $74,999 | 1,370 | 16.8% |
| $75,000 to $99,999 | 1,459 | 17.9% |
| $100,000 to $149,999 | 1,459 | 17.9% |
| $150,000 to $199,999 | 717 | 8.8% |
| $200,000+ | 595 | 7.3% |
Family Income by Famaliy Size in Monroe
6-person families (448 | 5.5%) account for the highest median family income in Monroe with $148,100 per family, while 2-person families (3,347 | 41.0%) have the highest median income of $34,708 per family member.
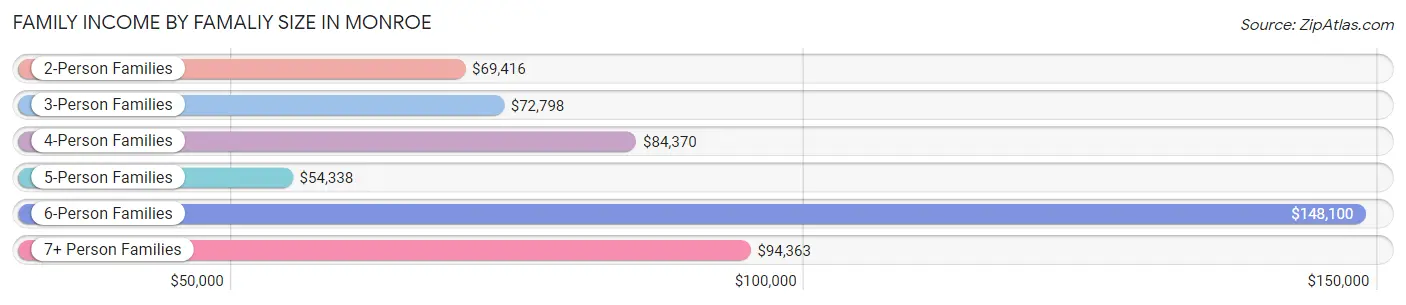
| Income Bracket | # Families | Median Income |
| 2-Person Families | 3,347 (41.0%) | $69,416 |
| 3-Person Families | 1,406 (17.2%) | $72,798 |
| 4-Person Families | 1,785 (21.9%) | $84,370 |
| 5-Person Families | 981 (12.0%) | $54,338 |
| 6-Person Families | 448 (5.5%) | $148,100 |
| 7+ Person Families | 186 (2.3%) | $94,363 |
| Total | 8,153 (100.0%) | $78,617 |
Family Income by Number of Earners in Monroe
The median family income in Monroe is $78,617, with families comprising 3+ earners (1,442) having the highest median family income of $123,026, while families with no earners (1,219) have the lowest median family income of $44,343, accounting for 17.7% and 14.9% of families, respectively.
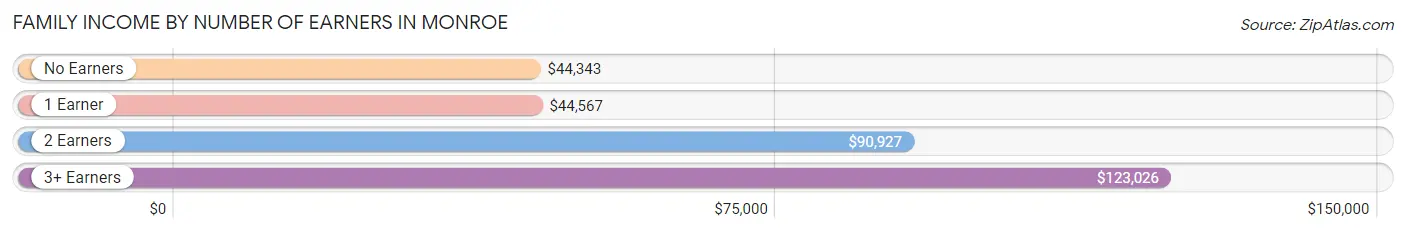
| Number of Earners | # Families | Median Income |
| No Earners | 1,219 (14.9%) | $44,343 |
| 1 Earner | 2,452 (30.1%) | $44,567 |
| 2 Earners | 3,040 (37.3%) | $90,927 |
| 3+ Earners | 1,442 (17.7%) | $123,026 |
| Total | 8,153 (100.0%) | $78,617 |
Household Income in Monroe
Household Income Brackets in Monroe
With 1,989 households falling in the category, the $35,000 to $49,999 income range is the most frequent in Monroe, accounting for 17.0% of all households. In contrast, only 222 households (1.9%) fall into the $10,000 to $14,999 income bracket, making it the least populous group.
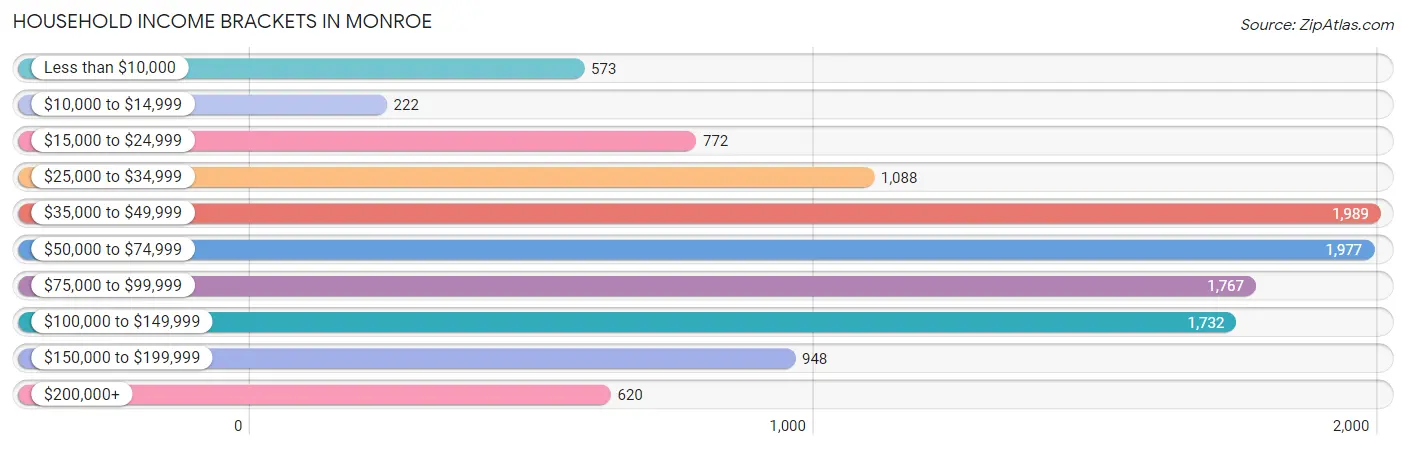
| Income Bracket | # Households | % Households |
| Less than $10,000 | 573 | 4.9% |
| $10,000 to $14,999 | 222 | 1.9% |
| $15,000 to $24,999 | 772 | 6.6% |
| $25,000 to $34,999 | 1,088 | 9.3% |
| $35,000 to $49,999 | 1,989 | 17.0% |
| $50,000 to $74,999 | 1,977 | 16.9% |
| $75,000 to $99,999 | 1,767 | 15.1% |
| $100,000 to $149,999 | 1,732 | 14.8% |
| $150,000 to $199,999 | 948 | 8.1% |
| $200,000+ | 620 | 5.3% |
Household Income by Householder Age in Monroe
The median household income in Monroe is $63,982, with the highest median household income of $81,913 found in the 45 to 64 years age bracket for the primary householder. A total of 4,261 households (36.4%) fall into this category. Meanwhile, the 15 to 24 years age bracket for the primary householder has the lowest median household income of $37,238, with 447 households (3.8%) in this group.
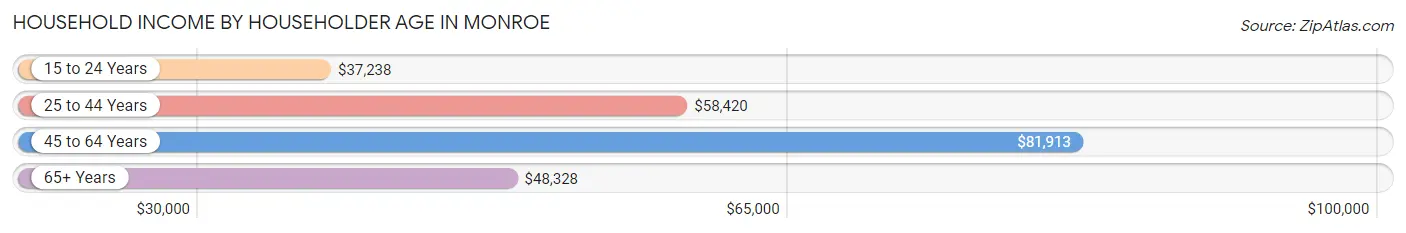
| Income Bracket | # Households | Median Income |
| 15 to 24 Years | 447 (3.8%) | $37,238 |
| 25 to 44 Years | 4,123 (35.2%) | $58,420 |
| 45 to 64 Years | 4,261 (36.4%) | $81,913 |
| 65+ Years | 2,869 (24.5%) | $48,328 |
| Total | 11,700 (100.0%) | $63,982 |
Poverty in Monroe
Income Below Poverty by Sex and Age in Monroe
With 9.7% poverty level for males and 13.7% for females among the residents of Monroe, 12 to 14 year old males and under 5 year old females are the most vulnerable to poverty, with 200 males (27.0%) and 215 females (24.1%) in their respective age groups living below the poverty level.
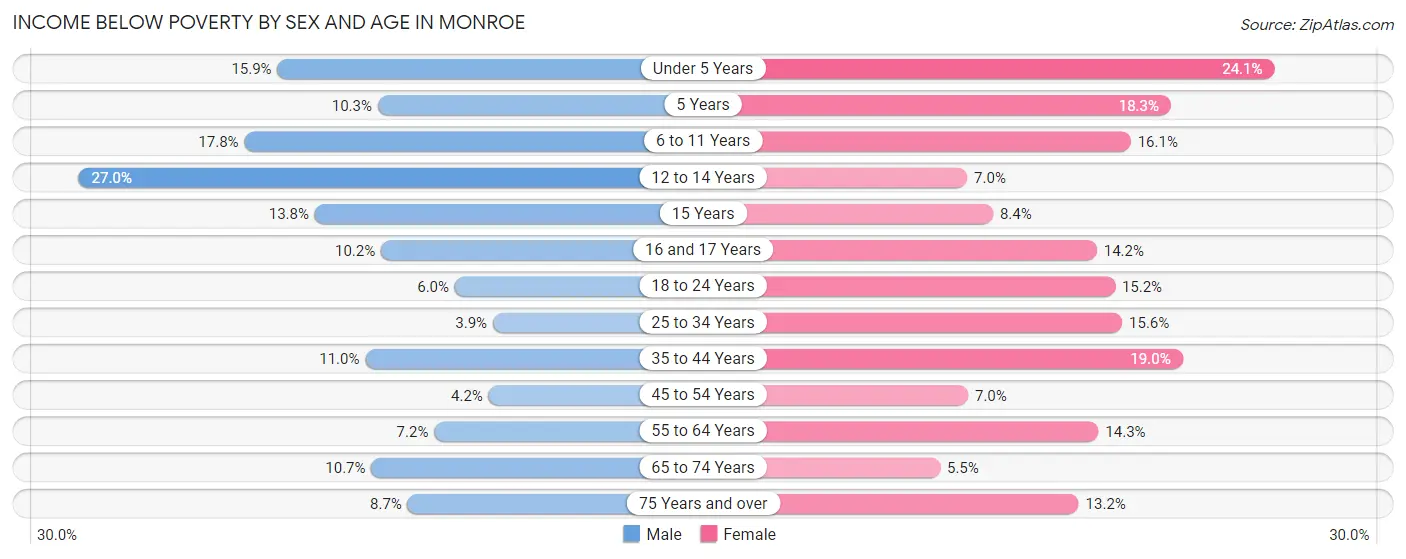
| Age Bracket | Male | Female |
| Under 5 Years | 180 (15.9%) | 215 (24.1%) |
| 5 Years | 19 (10.3%) | 50 (18.3%) |
| 6 to 11 Years | 228 (17.8%) | 232 (16.1%) |
| 12 to 14 Years | 200 (27.0%) | 43 (7.0%) |
| 15 Years | 40 (13.8%) | 17 (8.4%) |
| 16 and 17 Years | 69 (10.2%) | 98 (14.2%) |
| 18 to 24 Years | 139 (6.0%) | 329 (15.2%) |
| 25 to 34 Years | 81 (3.9%) | 312 (15.6%) |
| 35 to 44 Years | 278 (11.0%) | 418 (19.0%) |
| 45 to 54 Years | 85 (4.2%) | 167 (7.0%) |
| 55 to 64 Years | 130 (7.2%) | 248 (14.3%) |
| 65 to 74 Years | 113 (10.7%) | 83 (5.5%) |
| 75 Years and over | 68 (8.7%) | 167 (13.2%) |
| Total | 1,630 (9.7%) | 2,379 (13.7%) |
Income Above Poverty by Sex and Age in Monroe
According to the poverty statistics in Monroe, males aged 25 to 34 years and females aged 65 to 74 years are the age groups that are most secure financially, with 96.1% of males and 94.5% of females in these age groups living above the poverty line.
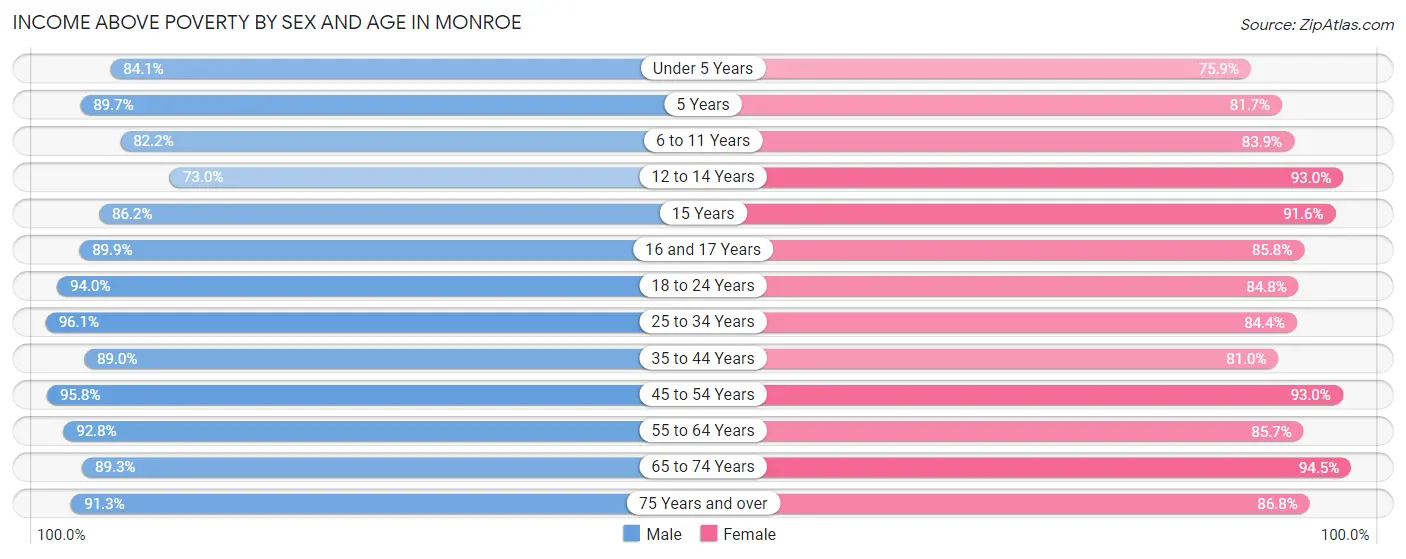
| Age Bracket | Male | Female |
| Under 5 Years | 951 (84.1%) | 678 (75.9%) |
| 5 Years | 165 (89.7%) | 223 (81.7%) |
| 6 to 11 Years | 1,056 (82.2%) | 1,210 (83.9%) |
| 12 to 14 Years | 541 (73.0%) | 573 (93.0%) |
| 15 Years | 249 (86.2%) | 185 (91.6%) |
| 16 and 17 Years | 611 (89.8%) | 592 (85.8%) |
| 18 to 24 Years | 2,164 (94.0%) | 1,834 (84.8%) |
| 25 to 34 Years | 1,985 (96.1%) | 1,687 (84.4%) |
| 35 to 44 Years | 2,243 (89.0%) | 1,786 (81.0%) |
| 45 to 54 Years | 1,957 (95.8%) | 2,209 (93.0%) |
| 55 to 64 Years | 1,678 (92.8%) | 1,487 (85.7%) |
| 65 to 74 Years | 944 (89.3%) | 1,435 (94.5%) |
| 75 Years and over | 716 (91.3%) | 1,099 (86.8%) |
| Total | 15,260 (90.3%) | 14,998 (86.3%) |
Income Below Poverty Among Married-Couple Families in Monroe
The poverty statistics for married-couple families in Monroe show that 4.8% or 268 of the total 5,576 families live below the poverty line. Families with 3 or 4 children have the highest poverty rate of 17.5%, comprising of 86 families. On the other hand, families with 5 or more children have the lowest poverty rate of 0.0%, which includes 0 families.
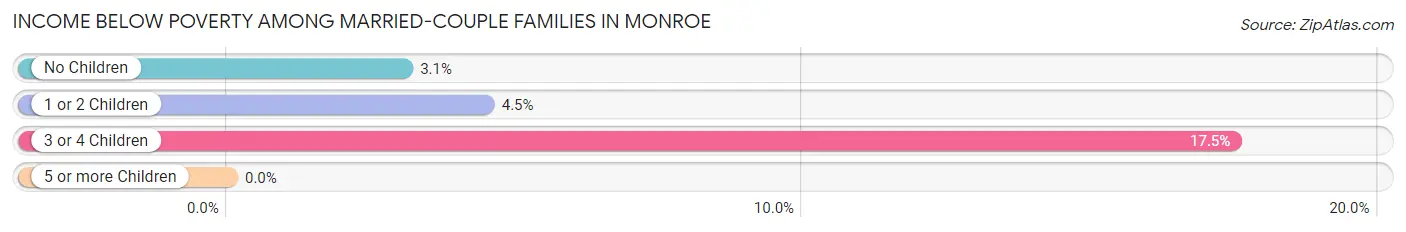
| Children | Above Poverty | Below Poverty |
| No Children | 2,829 (97.0%) | 89 (3.0%) |
| 1 or 2 Children | 1,989 (95.5%) | 93 (4.5%) |
| 3 or 4 Children | 406 (82.5%) | 86 (17.5%) |
| 5 or more Children | 84 (100.0%) | 0 (0.0%) |
| Total | 5,308 (95.2%) | 268 (4.8%) |
Income Below Poverty Among Single-Parent Households in Monroe
According to the poverty data in Monroe, 12.9% or 89 single-father households and 27.0% or 510 single-mother households are living below the poverty line. Among single-father households, those with 1 or 2 children have the highest poverty rate, with 75 households (20.1%) experiencing poverty. Likewise, among single-mother households, those with 3 or 4 children have the highest poverty rate, with 182 households (48.3%) falling below the poverty line.
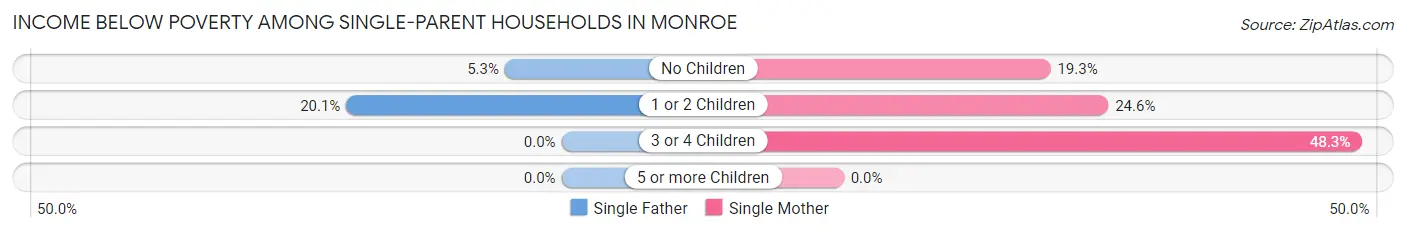
| Children | Single Father | Single Mother |
| No Children | 14 (5.3%) | 157 (19.3%) |
| 1 or 2 Children | 75 (20.1%) | 171 (24.6%) |
| 3 or 4 Children | 0 (0.0%) | 182 (48.3%) |
| 5 or more Children | 0 (0.0%) | 0 (0.0%) |
| Total | 89 (12.9%) | 510 (27.0%) |
Income Below Poverty Among Married-Couple vs Single-Parent Households in Monroe
The poverty data for Monroe shows that 268 of the married-couple family households (4.8%) and 599 of the single-parent households (23.2%) are living below the poverty level. Within the married-couple family households, those with 3 or 4 children have the highest poverty rate, with 86 households (17.5%) falling below the poverty line. Among the single-parent households, those with 3 or 4 children have the highest poverty rate, with 182 household (42.4%) living below poverty.
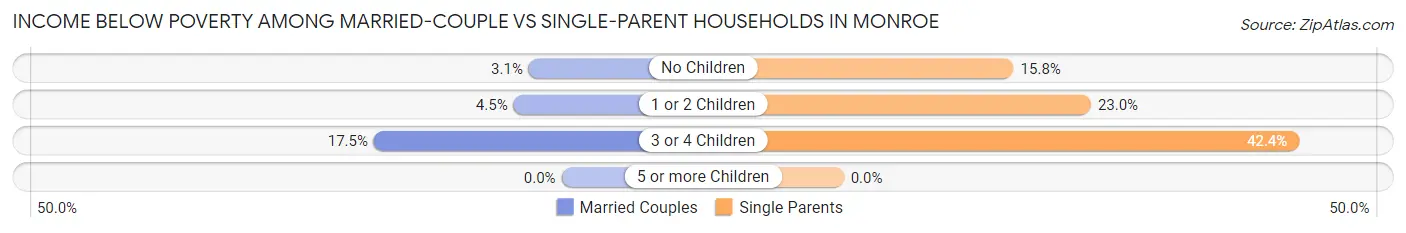
| Children | Married-Couple Families | Single-Parent Households |
| No Children | 89 (3.0%) | 171 (15.8%) |
| 1 or 2 Children | 93 (4.5%) | 246 (23.0%) |
| 3 or 4 Children | 86 (17.5%) | 182 (42.4%) |
| 5 or more Children | 0 (0.0%) | 0 (0.0%) |
| Total | 268 (4.8%) | 599 (23.2%) |
Race in Monroe
The most populous races in Monroe are White / Caucasian (19,262 | 55.2%), Hispanic or Latino (9,772 | 28.0%), and Black / African American (8,044 | 23.1%).
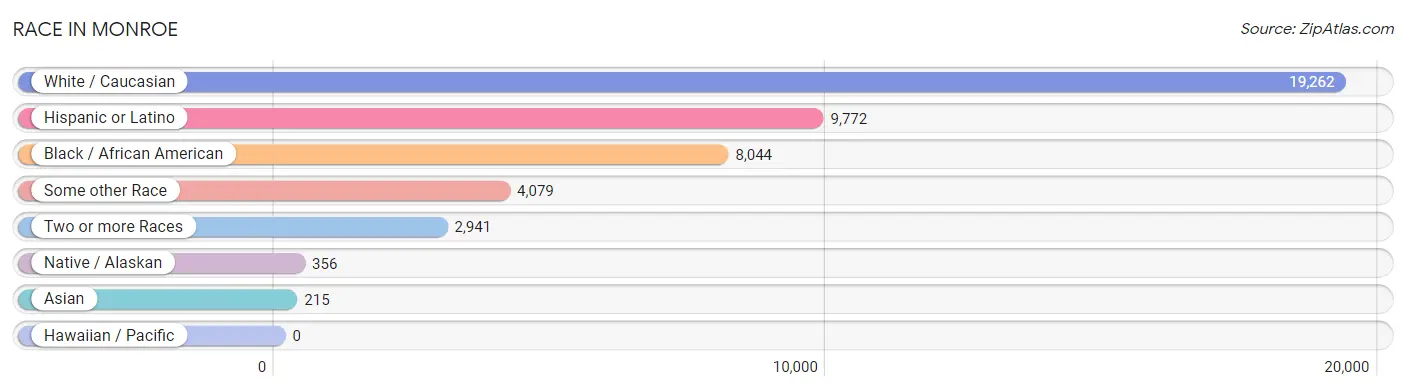
| Race | # Population | % Population |
| Asian | 215 | 0.6% |
| Black / African American | 8,044 | 23.1% |
| Hawaiian / Pacific | 0 | 0.0% |
| Hispanic or Latino | 9,772 | 28.0% |
| Native / Alaskan | 356 | 1.0% |
| White / Caucasian | 19,262 | 55.2% |
| Two or more Races | 2,941 | 8.4% |
| Some other Race | 4,079 | 11.7% |
| Total | 34,897 | 100.0% |
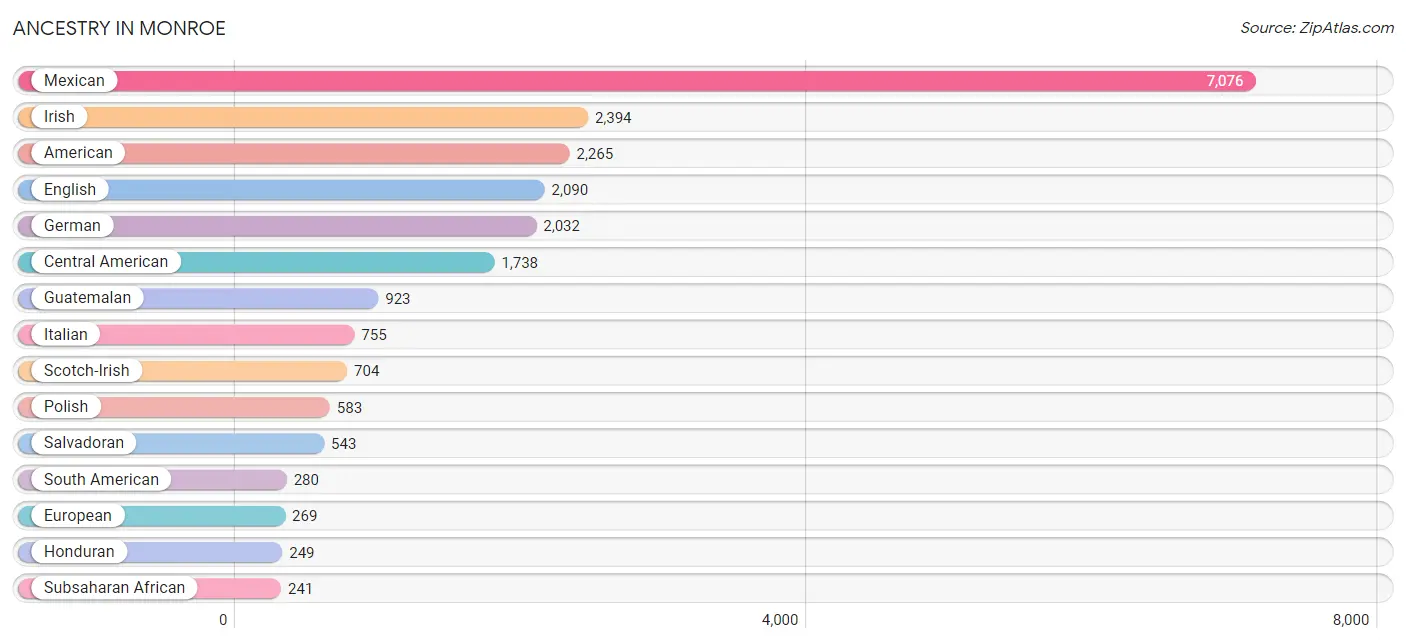
Ancestry in Monroe
The most populous ancestries reported in Monroe are Mexican (7,076 | 20.3%), Irish (2,394 | 6.9%), American (2,265 | 6.5%), English (2,090 | 6.0%), and German (2,032 | 5.8%), together accounting for 45.4% of all Monroe residents.
| Ancestry | # Population | % Population |
| African | 63 | 0.2% |
| American | 2,265 | 6.5% |
| Arab | 8 | 0.0% |
| Armenian | 8 | 0.0% |
| Bangladeshi | 13 | 0.0% |
| Barbadian | 26 | 0.1% |
| Bhutanese | 12 | 0.0% |
| Blackfeet | 25 | 0.1% |
| British | 64 | 0.2% |
| British West Indian | 29 | 0.1% |
| Burmese | 94 | 0.3% |
| Central American | 1,738 | 5.0% |
| Central American Indian | 40 | 0.1% |
| Cherokee | 92 | 0.3% |
| Chippewa | 14 | 0.0% |
| Colombian | 70 | 0.2% |
| Czech | 60 | 0.2% |
| Dominican | 147 | 0.4% |
| Dutch | 236 | 0.7% |
| Ecuadorian | 122 | 0.4% |
| English | 2,090 | 6.0% |
| Ethiopian | 42 | 0.1% |
| European | 269 | 0.8% |
| Finnish | 28 | 0.1% |
| French | 227 | 0.6% |
| French American Indian | 1 | 0.0% |
| French Canadian | 107 | 0.3% |
| German | 2,032 | 5.8% |
| Greek | 118 | 0.3% |
| Guatemalan | 923 | 2.6% |
| Haitian | 14 | 0.0% |
| Honduran | 249 | 0.7% |
| Hungarian | 81 | 0.2% |
| Indian (Asian) | 80 | 0.2% |
| Irish | 2,394 | 6.9% |
| Italian | 755 | 2.2% |
| Jamaican | 28 | 0.1% |
| Kenyan | 7 | 0.0% |
| Korean | 108 | 0.3% |
| Lebanese | 8 | 0.0% |
| Liberian | 7 | 0.0% |
| Lithuanian | 97 | 0.3% |
| Lumbee | 84 | 0.2% |
| Mexican | 7,076 | 20.3% |
| Mexican American Indian | 188 | 0.5% |
| Nicaraguan | 23 | 0.1% |
| Nigerian | 60 | 0.2% |
| Northern European | 16 | 0.1% |
| Norwegian | 57 | 0.2% |
| Pennsylvania German | 8 | 0.0% |
| Peruvian | 71 | 0.2% |
| Polish | 583 | 1.7% |
| Puerto Rican | 202 | 0.6% |
| Russian | 43 | 0.1% |
| Salvadoran | 543 | 1.6% |
| Scotch-Irish | 704 | 2.0% |
| Scottish | 239 | 0.7% |
| Serbian | 13 | 0.0% |
| Sierra Leonean | 32 | 0.1% |
| Slovak | 27 | 0.1% |
| Slovene | 5 | 0.0% |
| South American | 280 | 0.8% |
| South American Indian | 71 | 0.2% |
| Sri Lankan | 24 | 0.1% |
| Subsaharan African | 241 | 0.7% |
| Swedish | 139 | 0.4% |
| Thai | 34 | 0.1% |
| Trinidadian and Tobagonian | 28 | 0.1% |
| Turkish | 131 | 0.4% |
| Ukrainian | 22 | 0.1% |
| Welsh | 203 | 0.6% |
| West Indian | 39 | 0.1% | View All 72 Rows |
Immigrants in Monroe
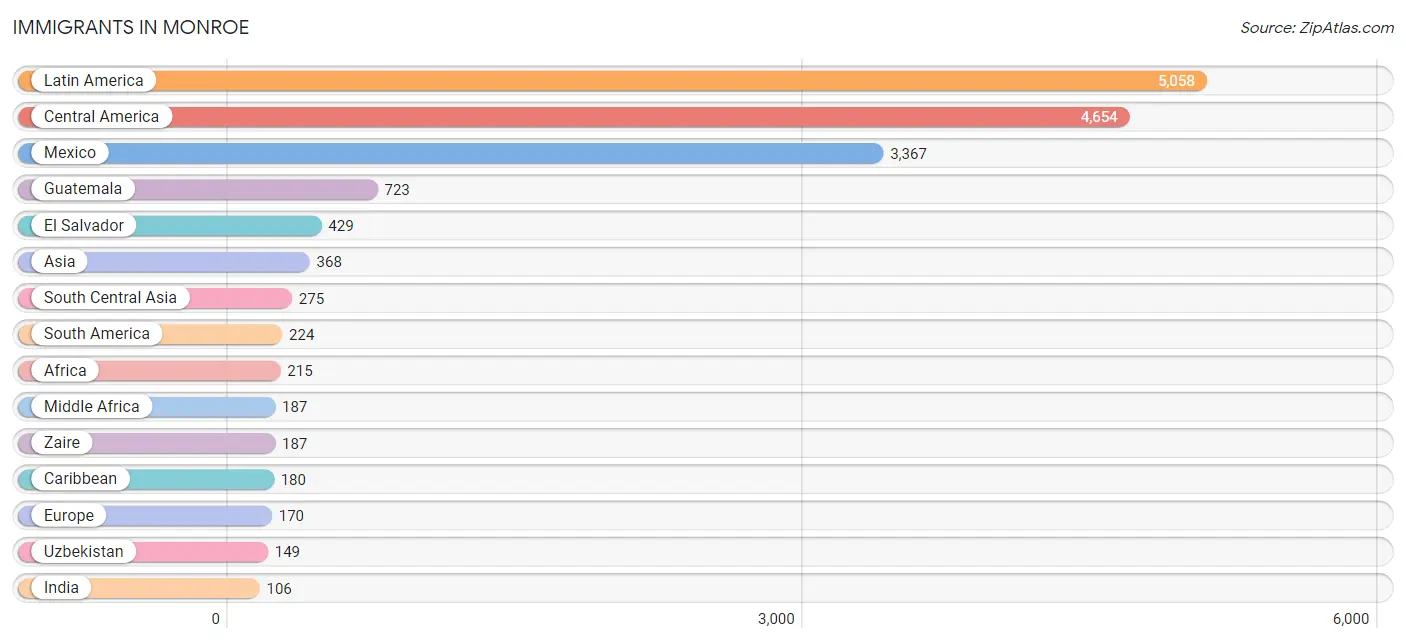
The most numerous immigrant groups reported in Monroe came from Latin America (5,058 | 14.5%), Central America (4,654 | 13.3%), Mexico (3,367 | 9.7%), Guatemala (723 | 2.1%), and El Salvador (429 | 1.2%), together accounting for 40.8% of all Monroe residents.
| Immigration Origin | # Population | % Population |
| Africa | 215 | 0.6% |
| Asia | 368 | 1.1% |
| Belarus | 20 | 0.1% |
| Belize | 9 | 0.0% |
| Brazil | 27 | 0.1% |
| Caribbean | 180 | 0.5% |
| Central America | 4,654 | 13.3% |
| China | 6 | 0.0% |
| Colombia | 60 | 0.2% |
| Dominican Republic | 86 | 0.3% |
| Eastern Africa | 14 | 0.0% |
| Eastern Asia | 23 | 0.1% |
| Eastern Europe | 57 | 0.2% |
| Ecuador | 74 | 0.2% |
| El Salvador | 429 | 1.2% |
| England | 21 | 0.1% |
| Europe | 170 | 0.5% |
| Germany | 35 | 0.1% |
| Grenada | 29 | 0.1% |
| Guatemala | 723 | 2.1% |
| Guyana | 9 | 0.0% |
| Haiti | 14 | 0.0% |
| Honduras | 103 | 0.3% |
| Hungary | 9 | 0.0% |
| India | 106 | 0.3% |
| Israel | 19 | 0.1% |
| Italy | 12 | 0.0% |
| Jamaica | 23 | 0.1% |
| Japan | 12 | 0.0% |
| Kazakhstan | 13 | 0.0% |
| Kenya | 14 | 0.0% |
| Korea | 5 | 0.0% |
| Laos | 3 | 0.0% |
| Latin America | 5,058 | 14.5% |
| Liberia | 14 | 0.0% |
| Mexico | 3,367 | 9.7% |
| Middle Africa | 187 | 0.5% |
| Nicaragua | 23 | 0.1% |
| Northern Europe | 37 | 0.1% |
| Peru | 26 | 0.1% |
| Philippines | 45 | 0.1% |
| Portugal | 29 | 0.1% |
| Russia | 28 | 0.1% |
| South America | 224 | 0.6% |
| South Central Asia | 275 | 0.8% |
| South Eastern Asia | 51 | 0.2% |
| Southern Europe | 41 | 0.1% |
| Sweden | 6 | 0.0% |
| Thailand | 3 | 0.0% |
| Trinidad and Tobago | 28 | 0.1% |
| Uzbekistan | 149 | 0.4% |
| Venezuela | 28 | 0.1% |
| Western Africa | 14 | 0.0% |
| Western Asia | 19 | 0.1% |
| Western Europe | 35 | 0.1% |
| Zaire | 187 | 0.5% | View All 56 Rows |
Sex and Age in Monroe
Sex and Age in Monroe
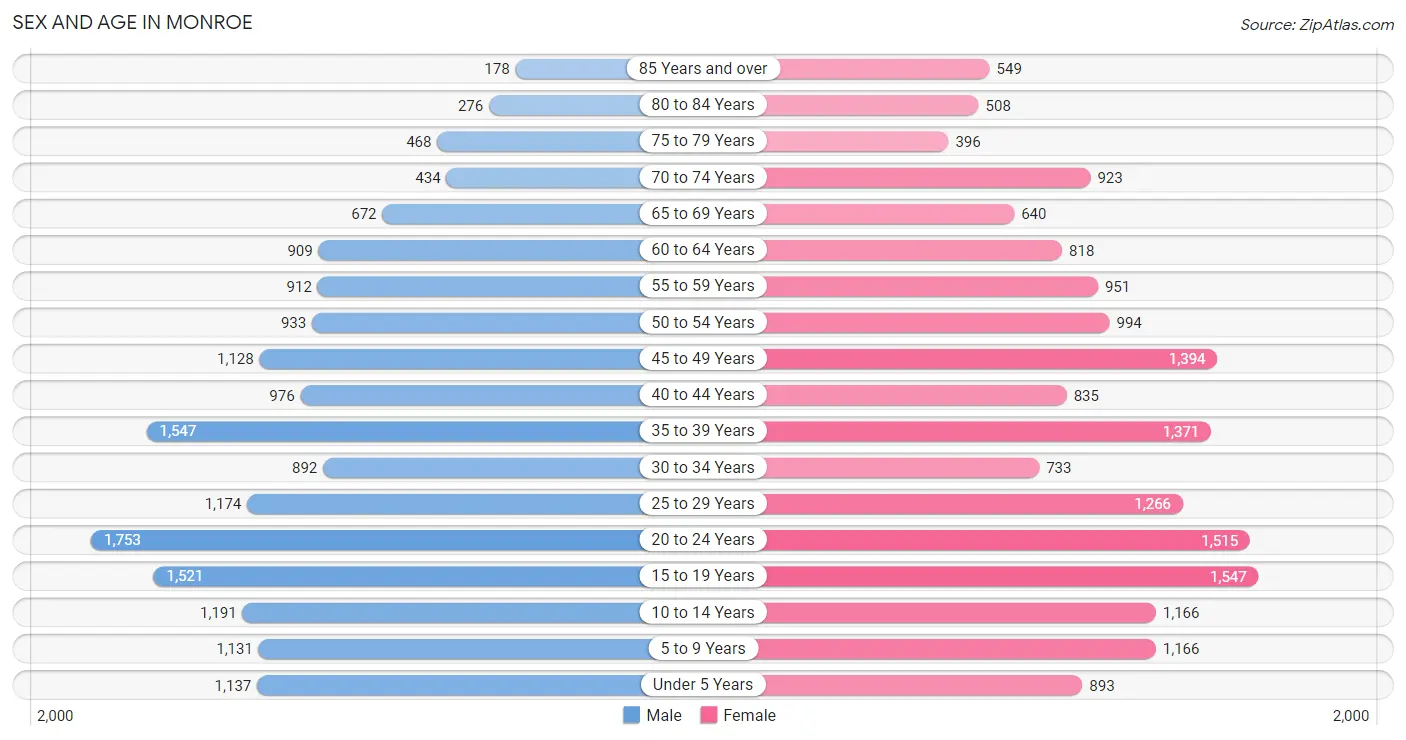
The most populous age groups in Monroe are 20 to 24 Years (1,753 | 10.2%) for men and 15 to 19 Years (1,547 | 8.8%) for women.
| Age Bracket | Male | Female |
| Under 5 Years | 1,137 (6.6%) | 893 (5.1%) |
| 5 to 9 Years | 1,131 (6.6%) | 1,166 (6.6%) |
| 10 to 14 Years | 1,191 (6.9%) | 1,166 (6.6%) |
| 15 to 19 Years | 1,521 (8.8%) | 1,547 (8.8%) |
| 20 to 24 Years | 1,753 (10.2%) | 1,515 (8.6%) |
| 25 to 29 Years | 1,174 (6.8%) | 1,266 (7.2%) |
| 30 to 34 Years | 892 (5.2%) | 733 (4.2%) |
| 35 to 39 Years | 1,547 (9.0%) | 1,371 (7.8%) |
| 40 to 44 Years | 976 (5.7%) | 835 (4.7%) |
| 45 to 49 Years | 1,128 (6.6%) | 1,394 (7.9%) |
| 50 to 54 Years | 933 (5.4%) | 994 (5.6%) |
| 55 to 59 Years | 912 (5.3%) | 951 (5.4%) |
| 60 to 64 Years | 909 (5.3%) | 818 (4.6%) |
| 65 to 69 Years | 672 (3.9%) | 640 (3.6%) |
| 70 to 74 Years | 434 (2.5%) | 923 (5.2%) |
| 75 to 79 Years | 468 (2.7%) | 396 (2.2%) |
| 80 to 84 Years | 276 (1.6%) | 508 (2.9%) |
| 85 Years and over | 178 (1.0%) | 549 (3.1%) |
| Total | 17,232 (100.0%) | 17,665 (100.0%) |
Families and Households in Monroe
Median Family Size in Monroe
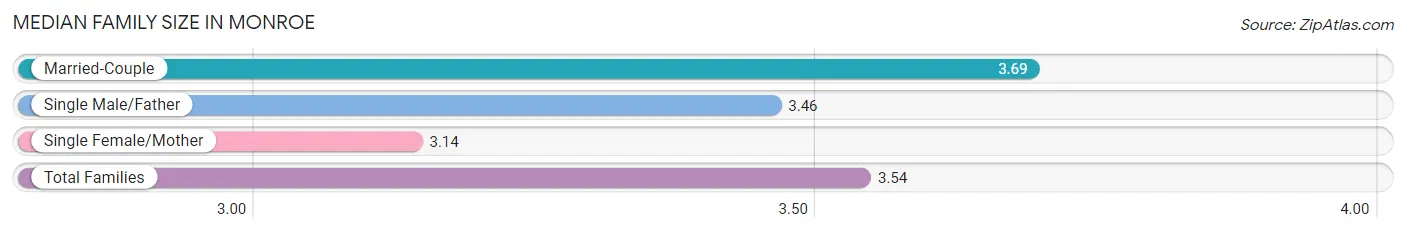
The median family size in Monroe is 3.54 persons per family, with married-couple families (5,576 | 68.4%) accounting for the largest median family size of 3.69 persons per family. On the other hand, single female/mother families (1,886 | 23.1%) represent the smallest median family size with 3.14 persons per family.
| Family Type | # Families | Family Size |
| Married-Couple | 5,576 (68.4%) | 3.69 |
| Single Male/Father | 691 (8.5%) | 3.46 |
| Single Female/Mother | 1,886 (23.1%) | 3.14 |
| Total Families | 8,153 (100.0%) | 3.54 |
Median Household Size in Monroe
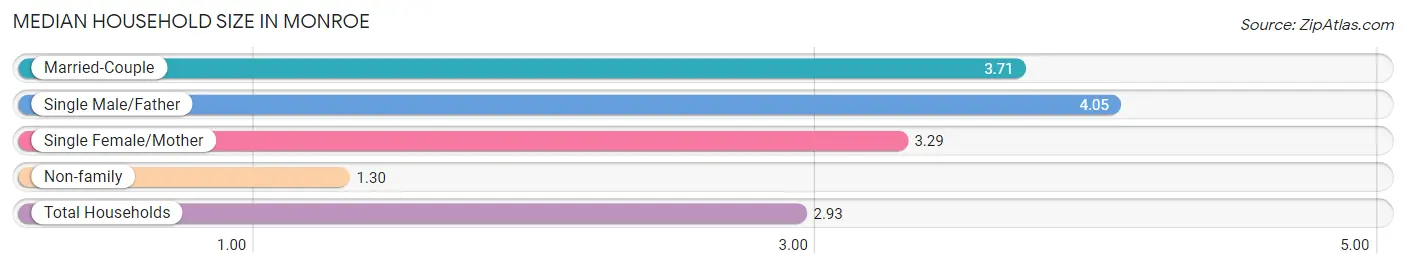
The median household size in Monroe is 2.93 persons per household, with single male/father households (691 | 5.9%) accounting for the largest median household size of 4.05 persons per household. non-family households (3,547 | 30.3%) represent the smallest median household size with 1.30 persons per household.
| Household Type | # Households | Household Size |
| Married-Couple | 5,576 (47.7%) | 3.71 |
| Single Male/Father | 691 (5.9%) | 4.05 |
| Single Female/Mother | 1,886 (16.1%) | 3.29 |
| Non-family | 3,547 (30.3%) | 1.30 |
| Total Households | 11,700 (100.0%) | 2.93 |
Household Size by Marriage Status in Monroe
Out of a total of 11,700 households in Monroe, 8,153 (69.7%) are family households, while 3,547 (30.3%) are nonfamily households. The most numerous type of family households are 2-person households, comprising 3,043, and the most common type of nonfamily households are 1-person households, comprising 2,705.
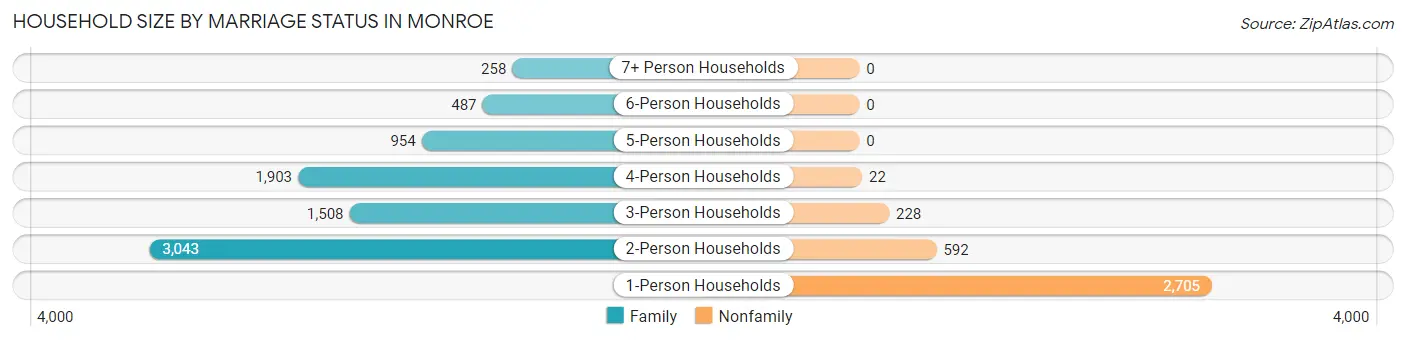
| Household Size | Family Households | Nonfamily Households |
| 1-Person Households | - | 2,705 (23.1%) |
| 2-Person Households | 3,043 (26.0%) | 592 (5.1%) |
| 3-Person Households | 1,508 (12.9%) | 228 (1.9%) |
| 4-Person Households | 1,903 (16.3%) | 22 (0.2%) |
| 5-Person Households | 954 (8.2%) | 0 (0.0%) |
| 6-Person Households | 487 (4.2%) | 0 (0.0%) |
| 7+ Person Households | 258 (2.2%) | 0 (0.0%) |
| Total | 8,153 (69.7%) | 3,547 (30.3%) |
Female Fertility in Monroe
Fertility by Age in Monroe
Average fertility rate in Monroe is 62.0 births per 1,000 women. Women in the age bracket of 20 to 34 years have the highest fertility rate with 124.0 births per 1,000 women. Women in the age bracket of 20 to 34 years acount for 79.4% of all women with births.
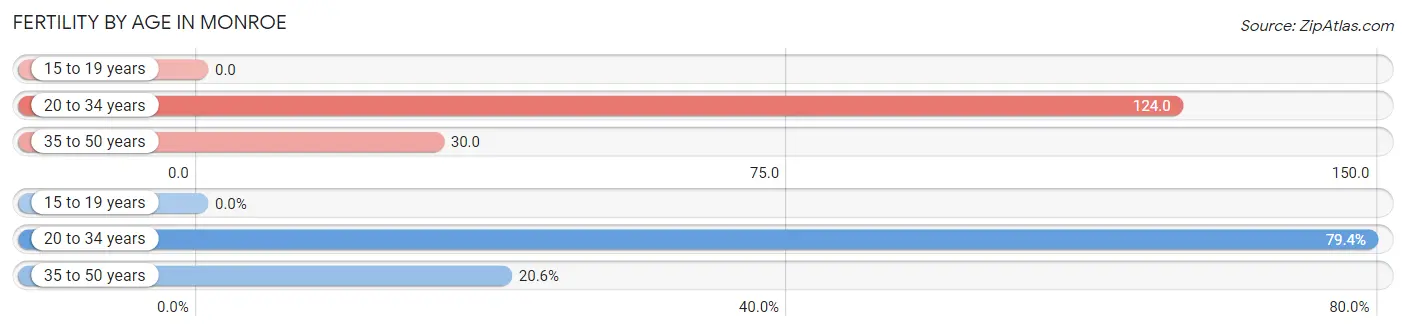
| Age Bracket | Women with Births | Births / 1,000 Women |
| 15 to 19 years | 0 (0.0%) | 0.0 |
| 20 to 34 years | 435 (79.4%) | 124.0 |
| 35 to 50 years | 113 (20.6%) | 30.0 |
| Total | 548 (100.0%) | 62.0 |
Fertility by Age by Marriage Status in Monroe
75.0% of women with births (548) in Monroe are married. The highest percentage of unmarried women with births falls into 20 to 34 years age bracket with 29.2% of them unmarried at the time of birth, while the lowest percentage of unmarried women with births belong to 35 to 50 years age bracket with 8.9% of them unmarried.
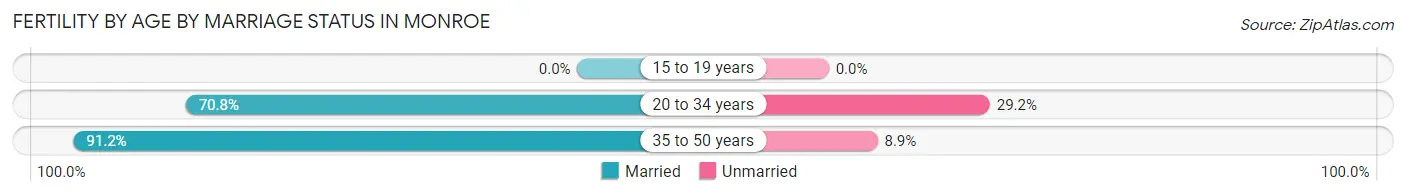
| Age Bracket | Married | Unmarried |
| 15 to 19 years | 0 (0.0%) | 0 (0.0%) |
| 20 to 34 years | 308 (70.8%) | 127 (29.2%) |
| 35 to 50 years | 103 (91.1%) | 10 (8.8%) |
| Total | 411 (75.0%) | 137 (25.0%) |
Fertility by Education in Monroe
Average fertility rate in Monroe is 62.0 births per 1,000 women. Women with the education attainment of high school diploma have the highest fertility rate of 130.0 births per 1,000 women, while women with the education attainment of less than high school have the lowest fertility at 12.0 births per 1,000 women. Women with the education attainment of high school diploma represent 54.9% of all women with births.
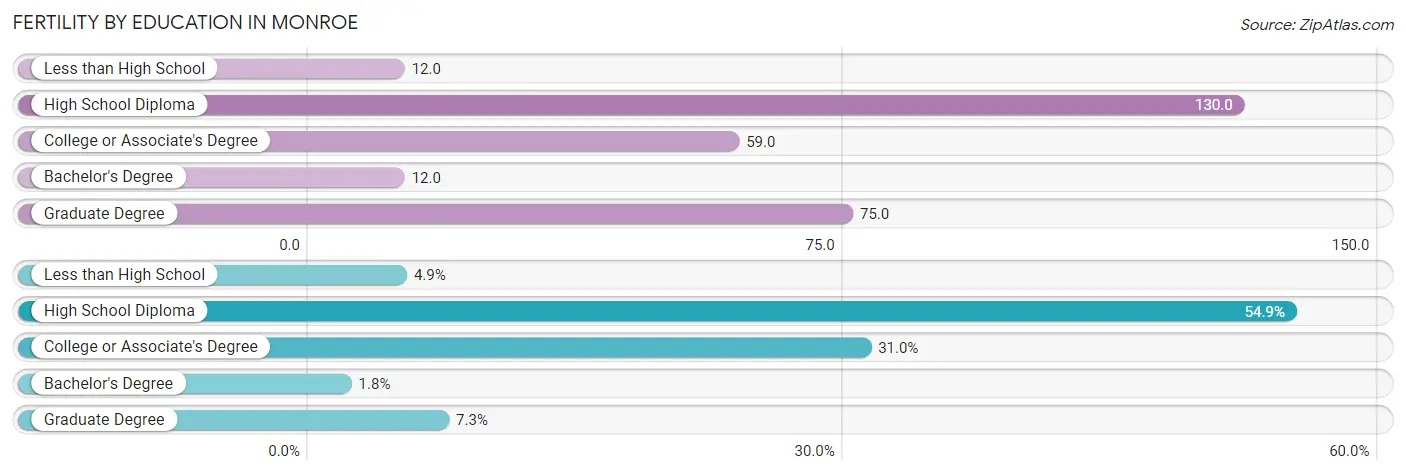
| Educational Attainment | Women with Births | Births / 1,000 Women |
| Less than High School | 27 (4.9%) | 12.0 |
| High School Diploma | 301 (54.9%) | 130.0 |
| College or Associate's Degree | 170 (31.0%) | 59.0 |
| Bachelor's Degree | 10 (1.8%) | 12.0 |
| Graduate Degree | 40 (7.3%) | 75.0 |
| Total | 548 (100.0%) | 62.0 |
Fertility by Education by Marriage Status in Monroe
25.0% of women with births in Monroe are unmarried. Women with the educational attainment of less than high school are most likely to be married with 100.0% of them married at childbirth, while women with the educational attainment of bachelor's degree are least likely to be married with 100.0% of them unmarried at childbirth.
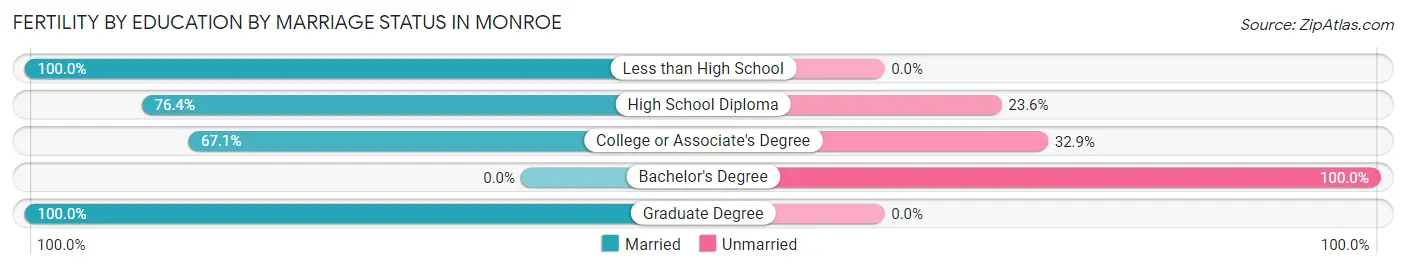
| Educational Attainment | Married | Unmarried |
| Less than High School | 27 (100.0%) | 0 (0.0%) |
| High School Diploma | 230 (76.4%) | 71 (23.6%) |
| College or Associate's Degree | 114 (67.1%) | 56 (32.9%) |
| Bachelor's Degree | 0 (0.0%) | 10 (100.0%) |
| Graduate Degree | 40 (100.0%) | 0 (0.0%) |
| Total | 411 (75.0%) | 137 (25.0%) |
Employment Characteristics in Monroe
Employment by Class of Employer in Monroe
Among the 16,496 employed individuals in Monroe, private company employees (12,406 | 75.2%), local government employees (1,075 | 6.5%), and self-employed (not incorporated) (895 | 5.4%) make up the most common classes of employment.
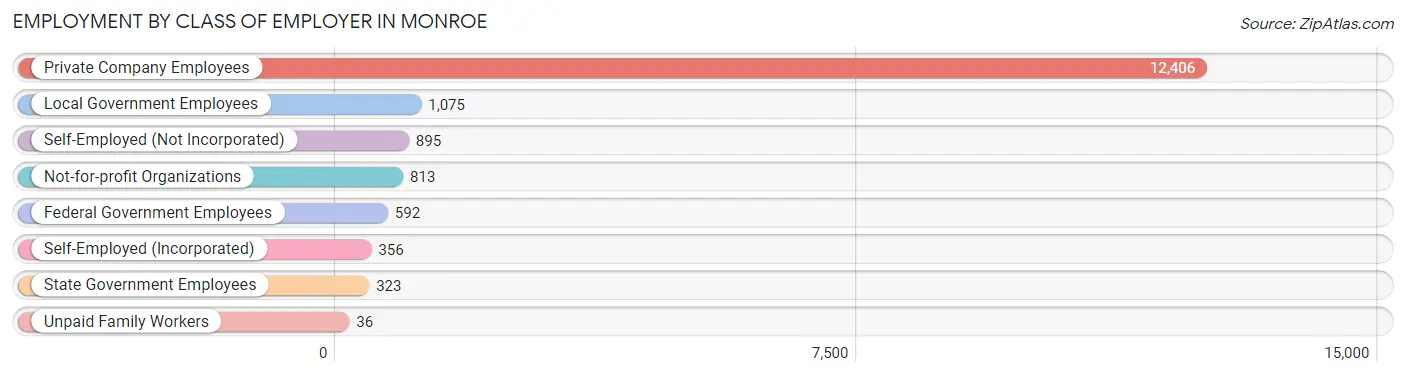
| Employer Class | # Employees | % Employees |
| Private Company Employees | 12,406 | 75.2% |
| Self-Employed (Incorporated) | 356 | 2.2% |
| Self-Employed (Not Incorporated) | 895 | 5.4% |
| Not-for-profit Organizations | 813 | 4.9% |
| Local Government Employees | 1,075 | 6.5% |
| State Government Employees | 323 | 2.0% |
| Federal Government Employees | 592 | 3.6% |
| Unpaid Family Workers | 36 | 0.2% |
| Total | 16,496 | 100.0% |
Employment Status by Age in Monroe
According to the labor force statistics for Monroe, out of the total population over 16 years of age (27,722), 64.5% or 17,881 individuals are in the labor force, with 6.2% or 1,109 of them unemployed. The age group with the highest labor force participation rate is 45 to 54 years, with 87.5% or 3,893 individuals in the labor force. Within the labor force, the 16 to 19 years age range has the highest percentage of unemployed individuals, with 19.4% or 252 of them being unemployed.
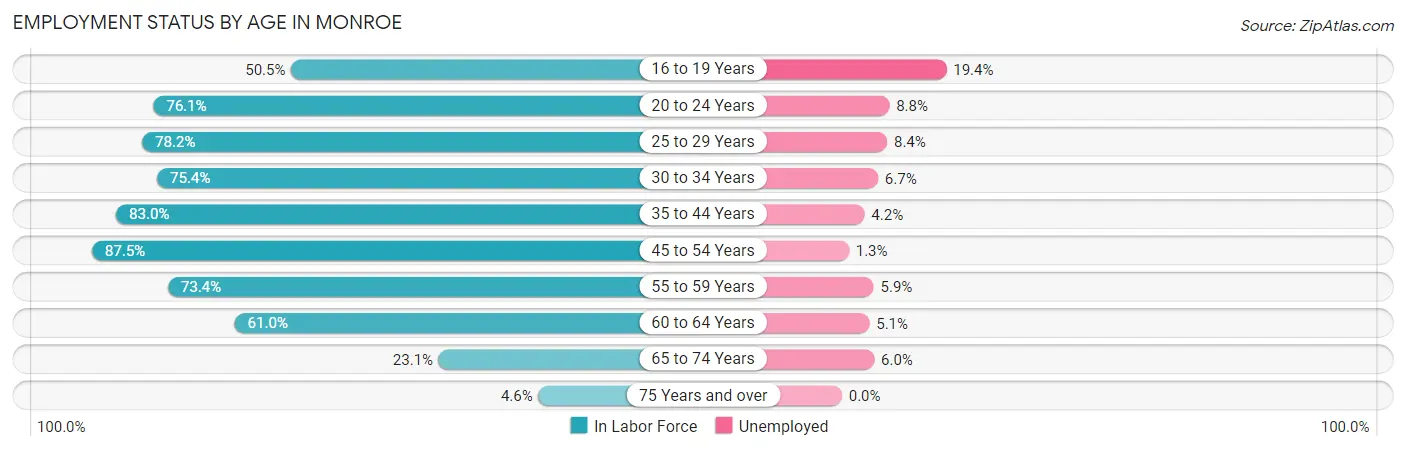
| Age Bracket | In Labor Force | Unemployed |
| 16 to 19 Years | 1,301 (50.5%) | 252 (19.4%) |
| 20 to 24 Years | 2,487 (76.1%) | 219 (8.8%) |
| 25 to 29 Years | 1,908 (78.2%) | 160 (8.4%) |
| 30 to 34 Years | 1,225 (75.4%) | 82 (6.7%) |
| 35 to 44 Years | 3,925 (83.0%) | 165 (4.2%) |
| 45 to 54 Years | 3,893 (87.5%) | 51 (1.3%) |
| 55 to 59 Years | 1,367 (73.4%) | 81 (5.9%) |
| 60 to 64 Years | 1,053 (61.0%) | 54 (5.1%) |
| 65 to 74 Years | 617 (23.1%) | 37 (6.0%) |
| 75 Years and over | 109 (4.6%) | 0 (0.0%) |
| Total | 17,881 (64.5%) | 1,109 (6.2%) |
Employment Status by Educational Attainment in Monroe
According to labor force statistics for Monroe, 79.4% of individuals (13,365) out of the total population between 25 and 64 years of age (16,833) are in the labor force, with 4.4% or 588 of them being unemployed. The group with the highest labor force participation rate are those with the educational attainment of college / associate degree, with 84.6% or 4,653 individuals in the labor force. Within the labor force, individuals with less than high school education have the highest percentage of unemployment, with 10.9% or 241 of them being unemployed.
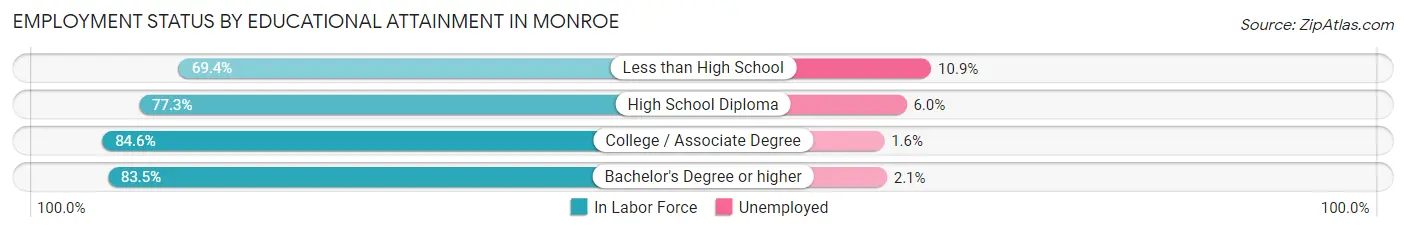
| Educational Attainment | In Labor Force | Unemployed |
| Less than High School | 2,215 (69.4%) | 348 (10.9%) |
| High School Diploma | 3,656 (77.3%) | 284 (6.0%) |
| College / Associate Degree | 4,653 (84.6%) | 88 (1.6%) |
| Bachelor's Degree or higher | 2,849 (83.5%) | 72 (2.1%) |
| Total | 13,365 (79.4%) | 741 (4.4%) |
Employment Occupations by Sex in Monroe
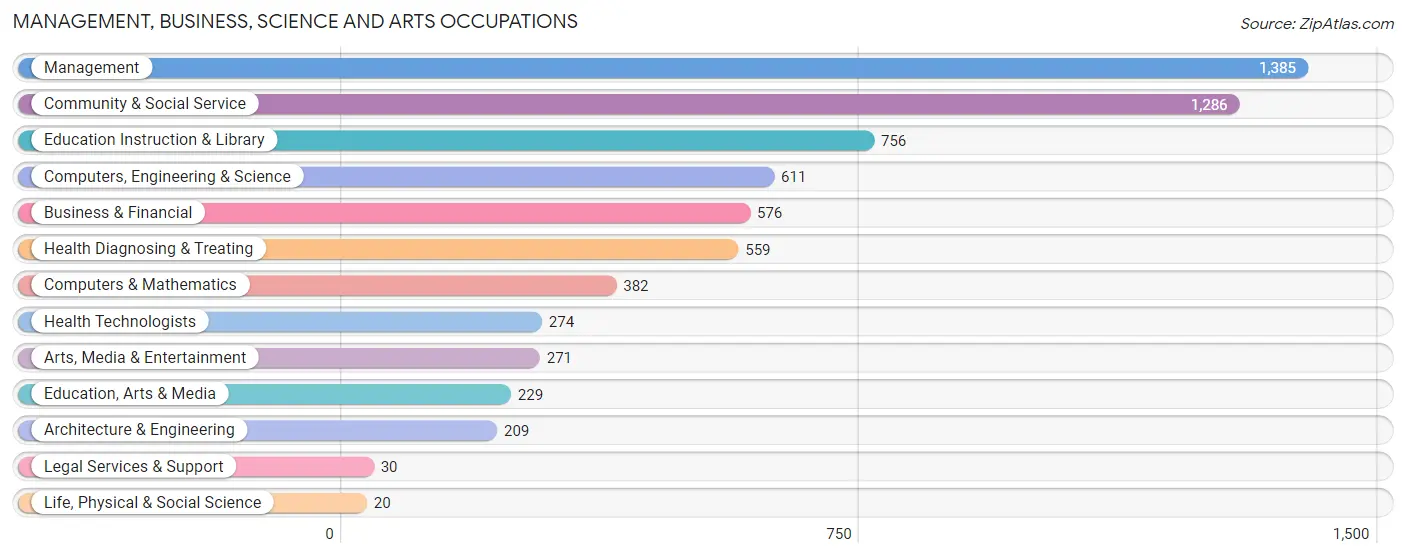
Management, Business, Science and Arts Occupations
The most common Management, Business, Science and Arts occupations in Monroe are Management (1,385 | 8.3%), Community & Social Service (1,286 | 7.7%), Education Instruction & Library (756 | 4.5%), Computers, Engineering & Science (611 | 3.6%), and Business & Financial (576 | 3.4%).
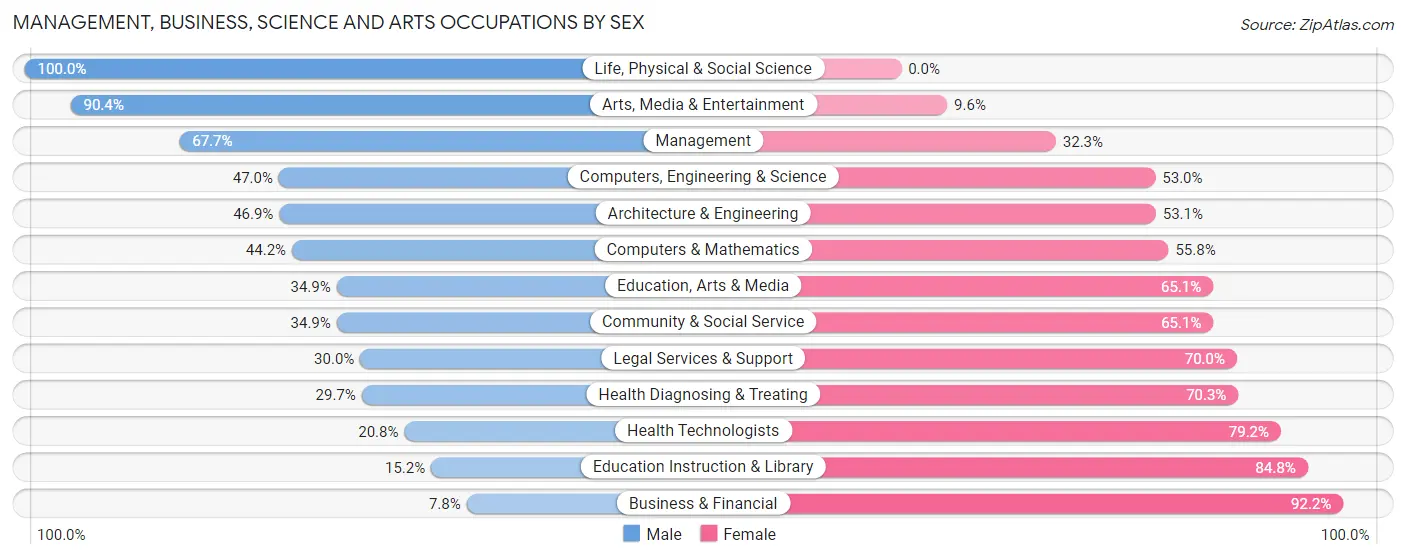
Management, Business, Science and Arts Occupations by Sex
Within the Management, Business, Science and Arts occupations in Monroe, the most male-oriented occupations are Life, Physical & Social Science (100.0%), Arts, Media & Entertainment (90.4%), and Management (67.7%), while the most female-oriented occupations are Business & Financial (92.2%), Education Instruction & Library (84.8%), and Health Technologists (79.2%).
| Occupation | Male | Female |
| Management | 938 (67.7%) | 447 (32.3%) |
| Business & Financial | 45 (7.8%) | 531 (92.2%) |
| Computers, Engineering & Science | 287 (47.0%) | 324 (53.0%) |
| Computers & Mathematics | 169 (44.2%) | 213 (55.8%) |
| Architecture & Engineering | 98 (46.9%) | 111 (53.1%) |
| Life, Physical & Social Science | 20 (100.0%) | 0 (0.0%) |
| Community & Social Service | 449 (34.9%) | 837 (65.1%) |
| Education, Arts & Media | 80 (34.9%) | 149 (65.1%) |
| Legal Services & Support | 9 (30.0%) | 21 (70.0%) |
| Education Instruction & Library | 115 (15.2%) | 641 (84.8%) |
| Arts, Media & Entertainment | 245 (90.4%) | 26 (9.6%) |
| Health Diagnosing & Treating | 166 (29.7%) | 393 (70.3%) |
| Health Technologists | 57 (20.8%) | 217 (79.2%) |
| Total (Category) | 1,885 (42.7%) | 2,532 (57.3%) |
| Total (Overall) | 9,282 (55.3%) | 7,491 (44.7%) |
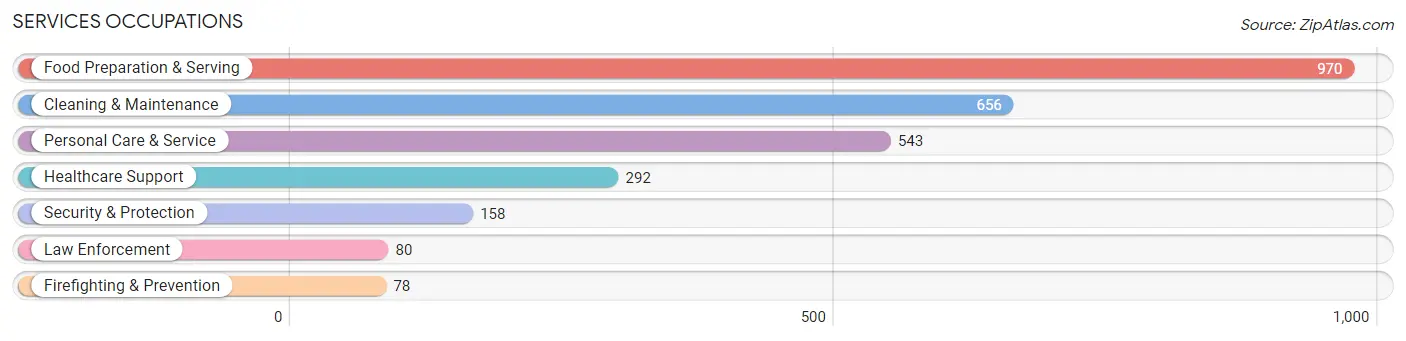
Services Occupations
The most common Services occupations in Monroe are Food Preparation & Serving (970 | 5.8%), Cleaning & Maintenance (656 | 3.9%), Personal Care & Service (543 | 3.2%), Healthcare Support (292 | 1.7%), and Security & Protection (158 | 0.9%).
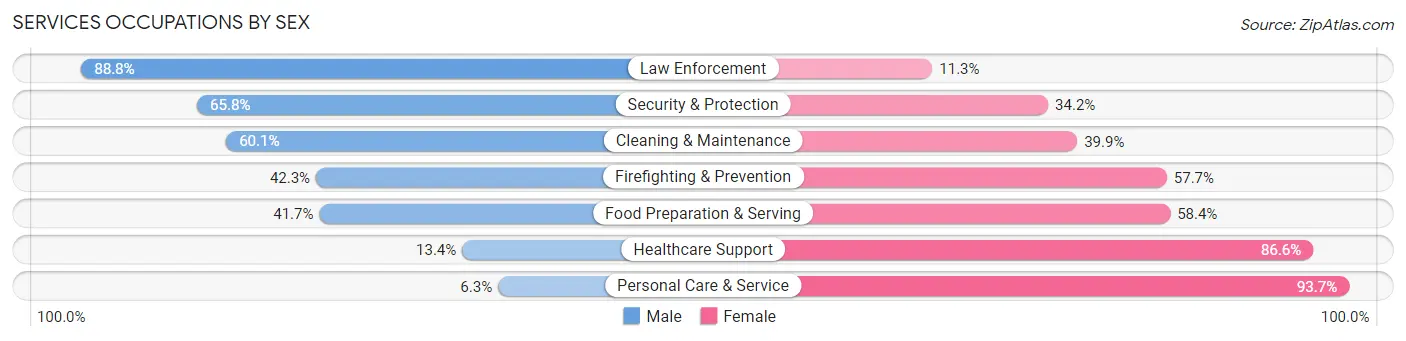
Services Occupations by Sex
Within the Services occupations in Monroe, the most male-oriented occupations are Law Enforcement (88.7%), Security & Protection (65.8%), and Cleaning & Maintenance (60.1%), while the most female-oriented occupations are Personal Care & Service (93.7%), Healthcare Support (86.6%), and Food Preparation & Serving (58.4%).
| Occupation | Male | Female |
| Healthcare Support | 39 (13.4%) | 253 (86.6%) |
| Security & Protection | 104 (65.8%) | 54 (34.2%) |
| Firefighting & Prevention | 33 (42.3%) | 45 (57.7%) |
| Law Enforcement | 71 (88.7%) | 9 (11.3%) |
| Food Preparation & Serving | 404 (41.6%) | 566 (58.4%) |
| Cleaning & Maintenance | 394 (60.1%) | 262 (39.9%) |
| Personal Care & Service | 34 (6.3%) | 509 (93.7%) |
| Total (Category) | 975 (37.2%) | 1,644 (62.8%) |
| Total (Overall) | 9,282 (55.3%) | 7,491 (44.7%) |
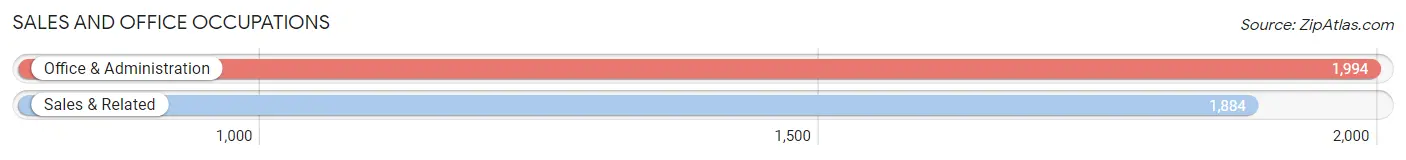
Sales and Office Occupations
The most common Sales and Office occupations in Monroe are Office & Administration (1,994 | 11.9%), and Sales & Related (1,884 | 11.2%).
Sales and Office Occupations by Sex
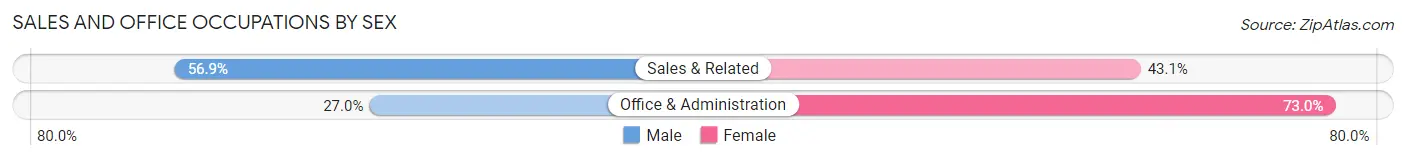
| Occupation | Male | Female |
| Sales & Related | 1,072 (56.9%) | 812 (43.1%) |
| Office & Administration | 538 (27.0%) | 1,456 (73.0%) |
| Total (Category) | 1,610 (41.5%) | 2,268 (58.5%) |
| Total (Overall) | 9,282 (55.3%) | 7,491 (44.7%) |
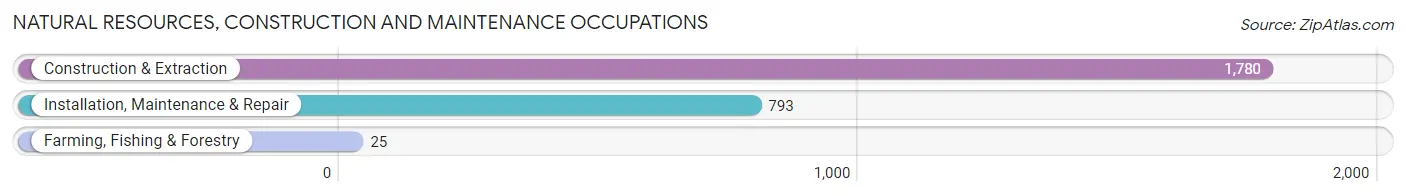
Natural Resources, Construction and Maintenance Occupations
The most common Natural Resources, Construction and Maintenance occupations in Monroe are Construction & Extraction (1,780 | 10.6%), Installation, Maintenance & Repair (793 | 4.7%), and Farming, Fishing & Forestry (25 | 0.2%).
Natural Resources, Construction and Maintenance Occupations by Sex
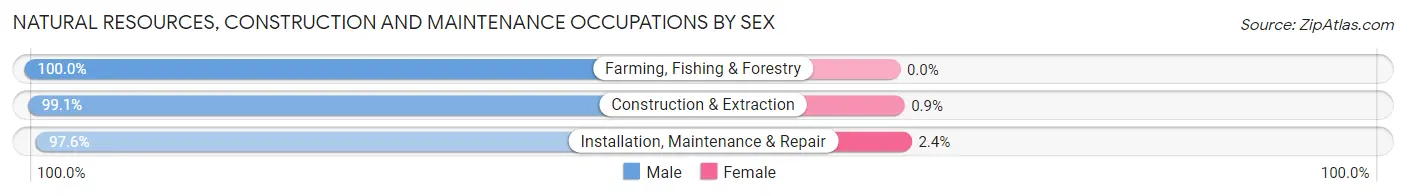
| Occupation | Male | Female |
| Farming, Fishing & Forestry | 25 (100.0%) | 0 (0.0%) |
| Construction & Extraction | 1,764 (99.1%) | 16 (0.9%) |
| Installation, Maintenance & Repair | 774 (97.6%) | 19 (2.4%) |
| Total (Category) | 2,563 (98.7%) | 35 (1.3%) |
| Total (Overall) | 9,282 (55.3%) | 7,491 (44.7%) |
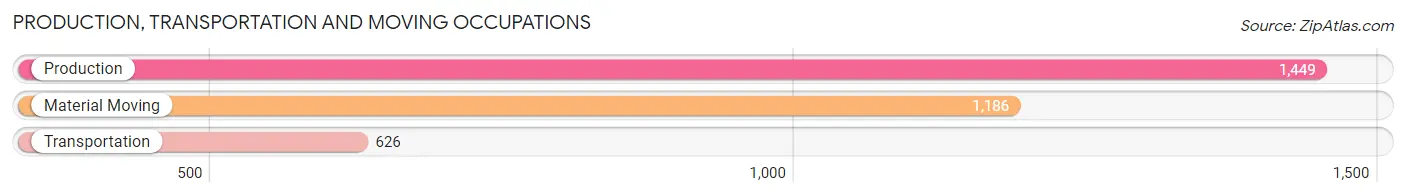
Production, Transportation and Moving Occupations
The most common Production, Transportation and Moving occupations in Monroe are Production (1,449 | 8.6%), Material Moving (1,186 | 7.1%), and Transportation (626 | 3.7%).
Production, Transportation and Moving Occupations by Sex
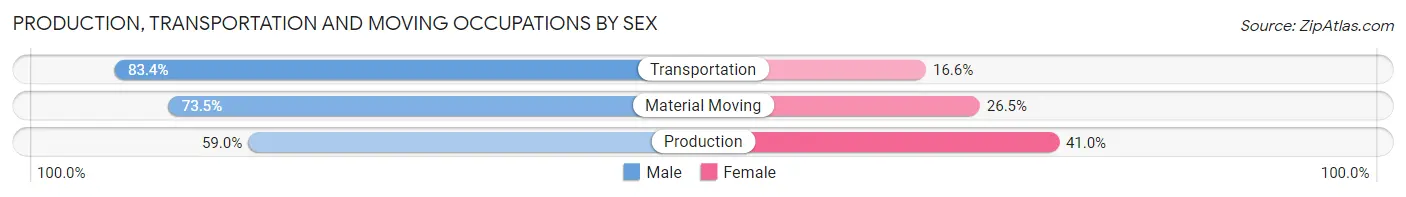
| Occupation | Male | Female |
| Production | 855 (59.0%) | 594 (41.0%) |
| Transportation | 522 (83.4%) | 104 (16.6%) |
| Material Moving | 872 (73.5%) | 314 (26.5%) |
| Total (Category) | 2,249 (69.0%) | 1,012 (31.0%) |
| Total (Overall) | 9,282 (55.3%) | 7,491 (44.7%) |
Employment Industries by Sex in Monroe
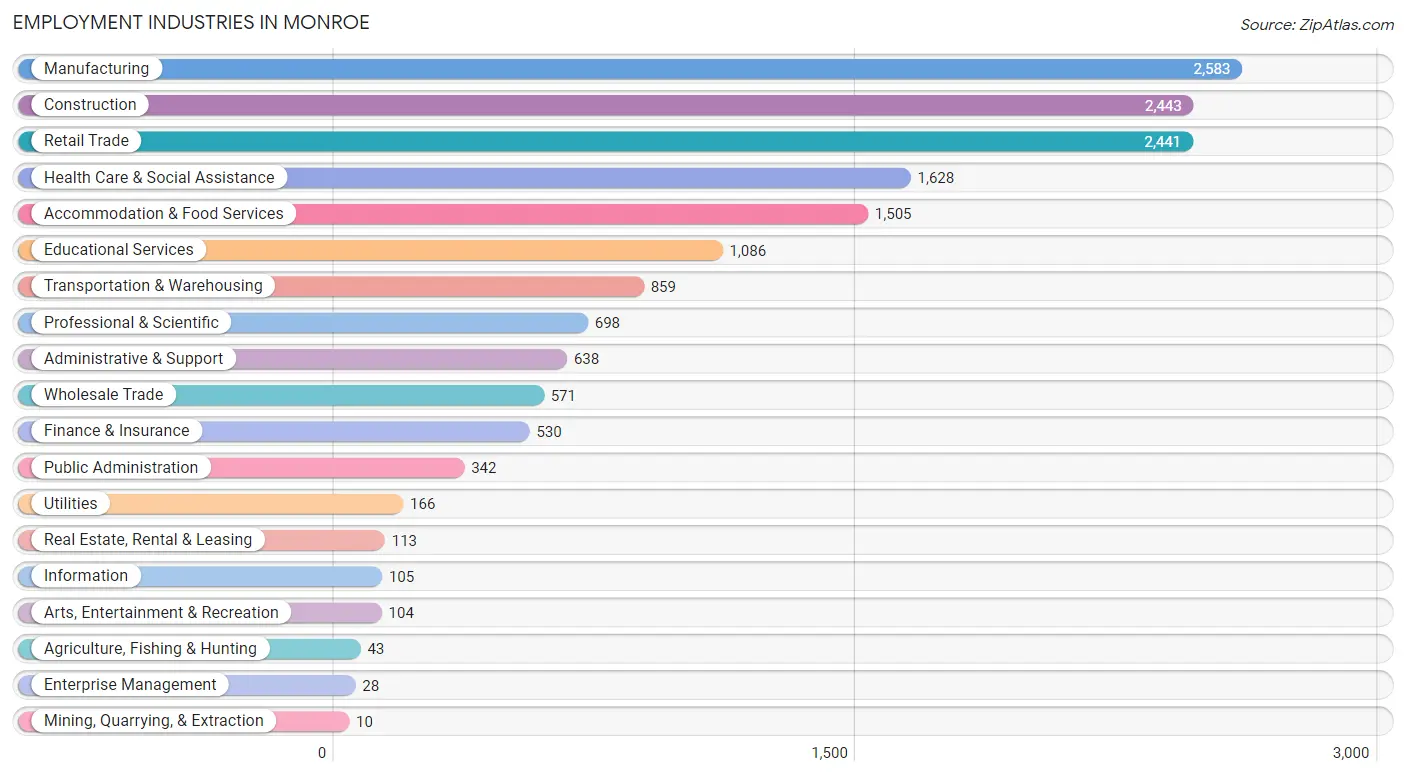
Employment Industries in Monroe
The major employment industries in Monroe include Manufacturing (2,583 | 15.4%), Construction (2,443 | 14.6%), Retail Trade (2,441 | 14.5%), Health Care & Social Assistance (1,628 | 9.7%), and Accommodation & Food Services (1,505 | 9.0%).
Employment Industries by Sex in Monroe
The Monroe industries that see more men than women are Agriculture, Fishing & Hunting (100.0%), Mining, Quarrying, & Extraction (100.0%), and Wholesale Trade (100.0%), whereas the industries that tend to have a higher number of women are Enterprise Management (100.0%), Health Care & Social Assistance (81.2%), and Real Estate, Rental & Leasing (78.8%).
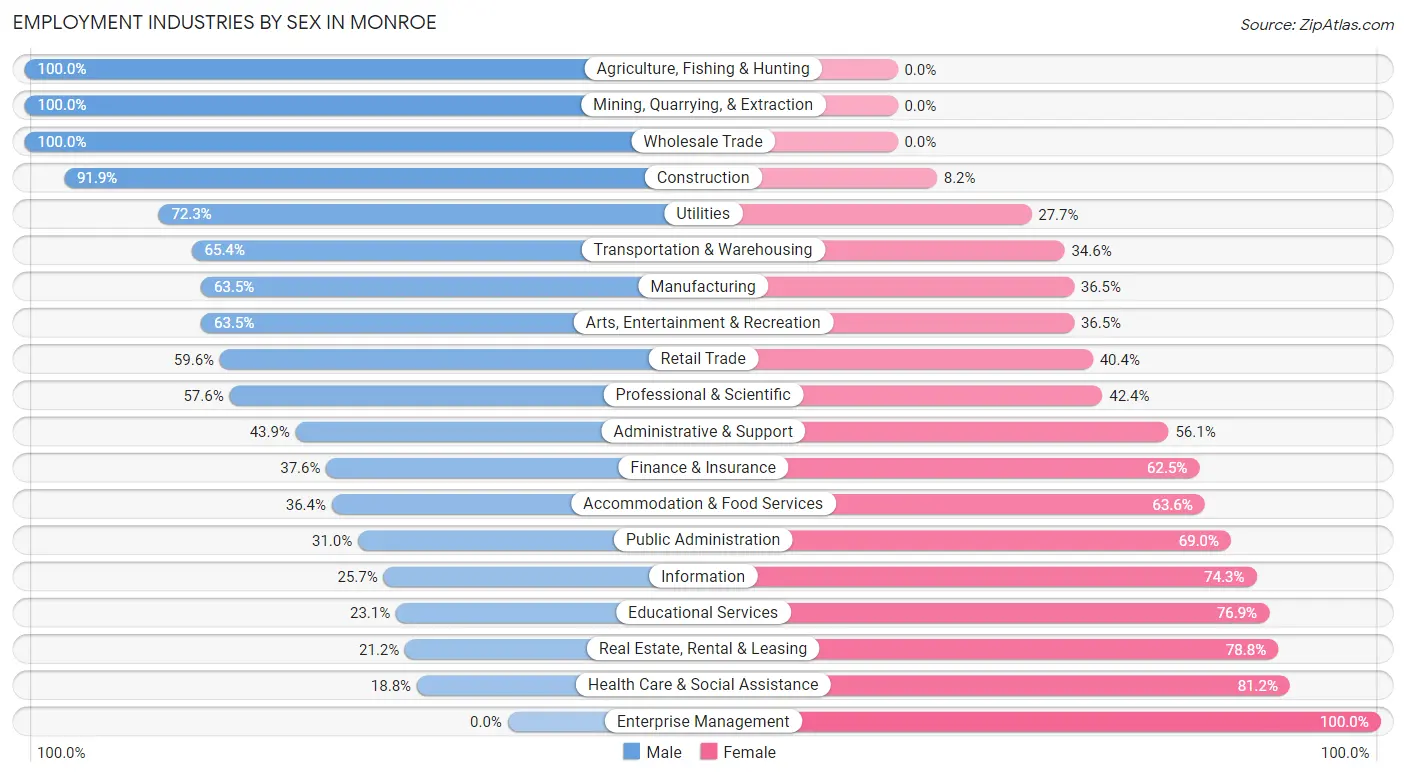
| Industry | Male | Female |
| Agriculture, Fishing & Hunting | 43 (100.0%) | 0 (0.0%) |
| Mining, Quarrying, & Extraction | 10 (100.0%) | 0 (0.0%) |
| Construction | 2,244 (91.8%) | 199 (8.2%) |
| Manufacturing | 1,640 (63.5%) | 943 (36.5%) |
| Wholesale Trade | 571 (100.0%) | 0 (0.0%) |
| Retail Trade | 1,454 (59.6%) | 987 (40.4%) |
| Transportation & Warehousing | 562 (65.4%) | 297 (34.6%) |
| Utilities | 120 (72.3%) | 46 (27.7%) |
| Information | 27 (25.7%) | 78 (74.3%) |
| Finance & Insurance | 199 (37.6%) | 331 (62.5%) |
| Real Estate, Rental & Leasing | 24 (21.2%) | 89 (78.8%) |
| Professional & Scientific | 402 (57.6%) | 296 (42.4%) |
| Enterprise Management | 0 (0.0%) | 28 (100.0%) |
| Administrative & Support | 280 (43.9%) | 358 (56.1%) |
| Educational Services | 251 (23.1%) | 835 (76.9%) |
| Health Care & Social Assistance | 306 (18.8%) | 1,322 (81.2%) |
| Arts, Entertainment & Recreation | 66 (63.5%) | 38 (36.5%) |
| Accommodation & Food Services | 548 (36.4%) | 957 (63.6%) |
| Public Administration | 106 (31.0%) | 236 (69.0%) |
| Total | 9,282 (55.3%) | 7,491 (44.7%) |
Education in Monroe
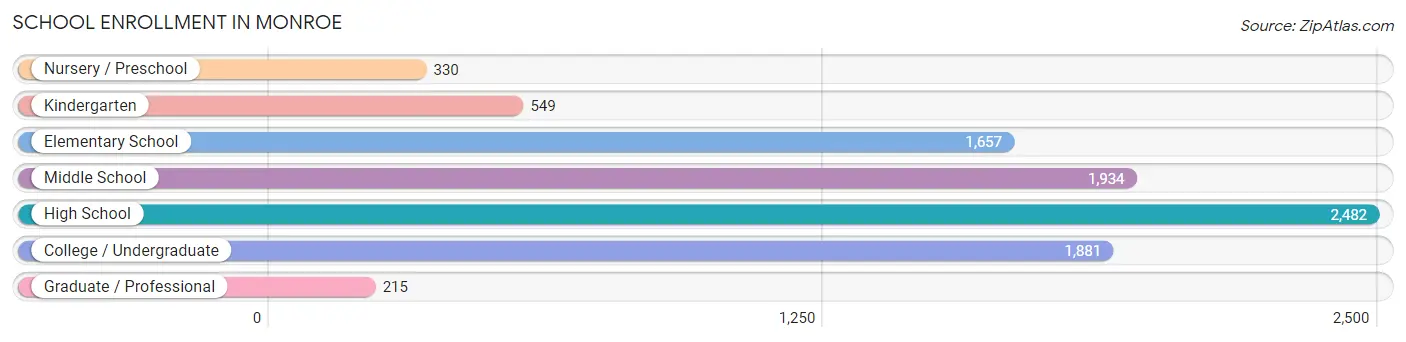
School Enrollment in Monroe
The most common levels of schooling among the 9,048 students in Monroe are high school (2,482 | 27.4%), middle school (1,934 | 21.4%), and college / undergraduate (1,881 | 20.8%).
| School Level | # Students | % Students |
| Nursery / Preschool | 330 | 3.6% |
| Kindergarten | 549 | 6.1% |
| Elementary School | 1,657 | 18.3% |
| Middle School | 1,934 | 21.4% |
| High School | 2,482 | 27.4% |
| College / Undergraduate | 1,881 | 20.8% |
| Graduate / Professional | 215 | 2.4% |
| Total | 9,048 | 100.0% |
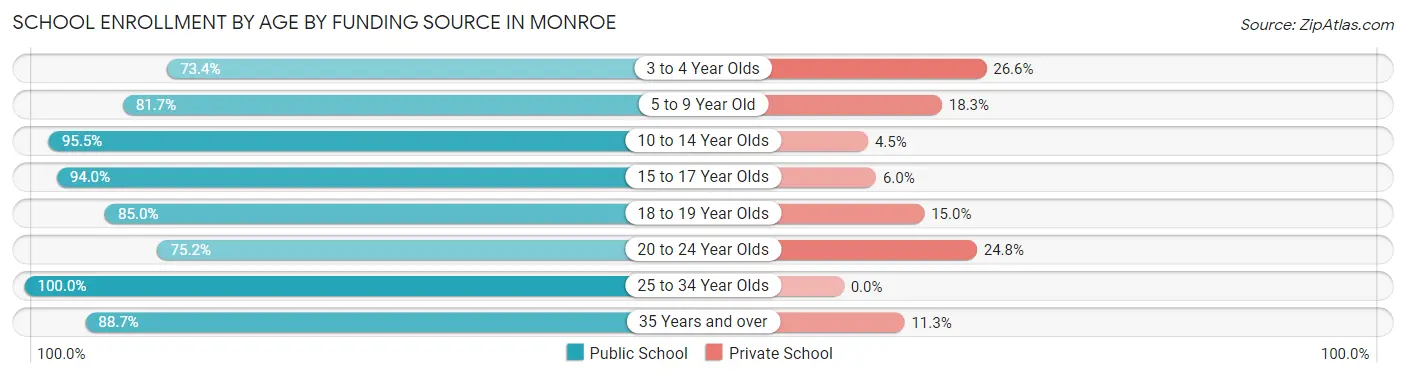
School Enrollment by Age by Funding Source in Monroe
Out of a total of 9,048 students who are enrolled in schools in Monroe, 1,068 (11.8%) attend a private institution, while the remaining 7,980 (88.2%) are enrolled in public schools. The age group of 3 to 4 year olds has the highest likelihood of being enrolled in private schools, with 72 (26.6% in the age bracket) enrolled. Conversely, the age group of 25 to 34 year olds has the lowest likelihood of being enrolled in a private school, with 350 (100.0% in the age bracket) attending a public institution.
| Age Bracket | Public School | Private School |
| 3 to 4 Year Olds | 199 (73.4%) | 72 (26.6%) |
| 5 to 9 Year Old | 1,631 (81.7%) | 365 (18.3%) |
| 10 to 14 Year Olds | 2,190 (95.5%) | 104 (4.5%) |
| 15 to 17 Year Olds | 1,721 (94.0%) | 110 (6.0%) |
| 18 to 19 Year Olds | 623 (85.0%) | 110 (15.0%) |
| 20 to 24 Year Olds | 725 (75.2%) | 239 (24.8%) |
| 25 to 34 Year Olds | 350 (100.0%) | 0 (0.0%) |
| 35 Years and over | 540 (88.7%) | 69 (11.3%) |
| Total | 7,980 (88.2%) | 1,068 (11.8%) |
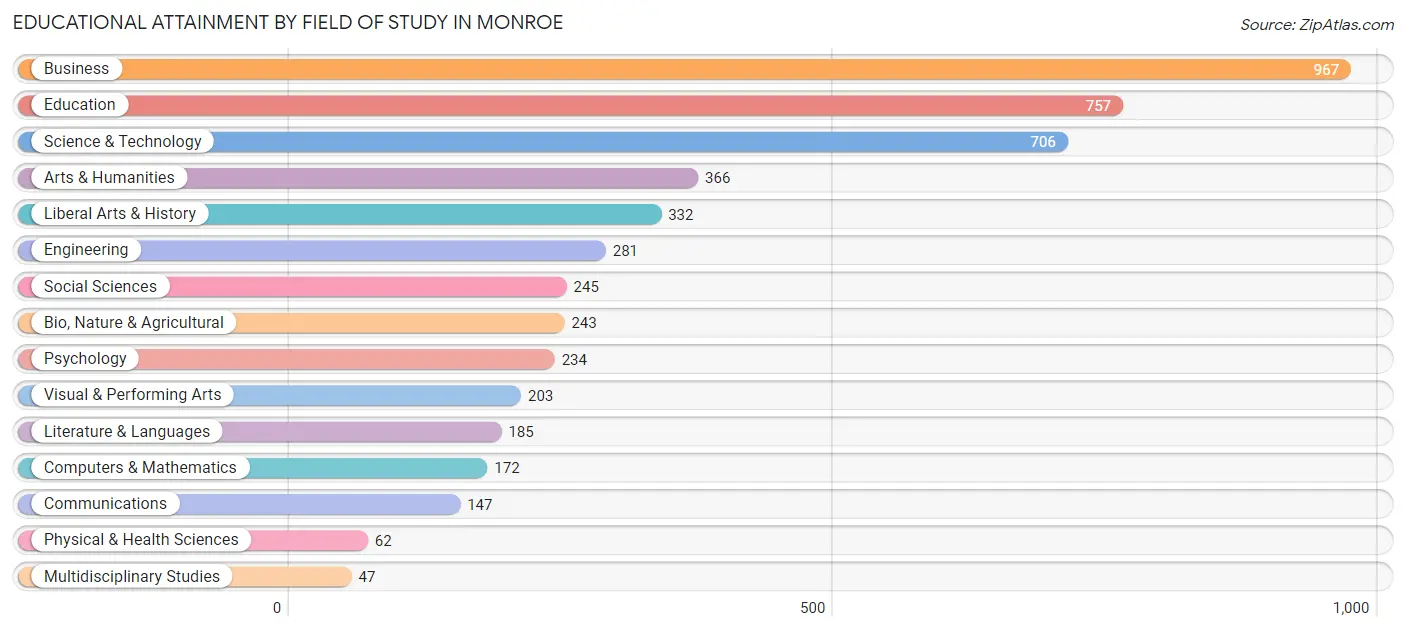
Educational Attainment by Field of Study in Monroe
Business (967 | 19.6%), education (757 | 15.3%), science & technology (706 | 14.3%), arts & humanities (366 | 7.4%), and liberal arts & history (332 | 6.7%) are the most common fields of study among 4,947 individuals in Monroe who have obtained a bachelor's degree or higher.
| Field of Study | # Graduates | % Graduates |
| Computers & Mathematics | 172 | 3.5% |
| Bio, Nature & Agricultural | 243 | 4.9% |
| Physical & Health Sciences | 62 | 1.3% |
| Psychology | 234 | 4.7% |
| Social Sciences | 245 | 5.0% |
| Engineering | 281 | 5.7% |
| Multidisciplinary Studies | 47 | 0.9% |
| Science & Technology | 706 | 14.3% |
| Business | 967 | 19.6% |
| Education | 757 | 15.3% |
| Literature & Languages | 185 | 3.7% |
| Liberal Arts & History | 332 | 6.7% |
| Visual & Performing Arts | 203 | 4.1% |
| Communications | 147 | 3.0% |
| Arts & Humanities | 366 | 7.4% |
| Total | 4,947 | 100.0% |
Transportation & Commute in Monroe
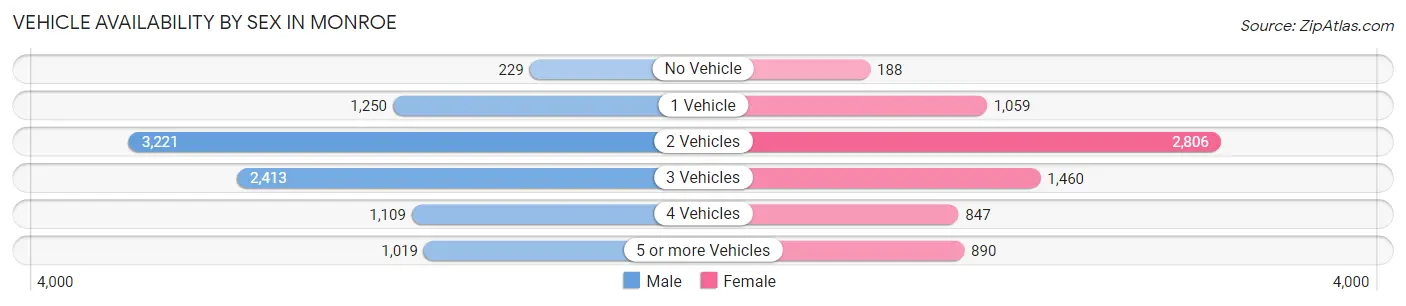
Vehicle Availability by Sex in Monroe
The most prevalent vehicle ownership categories in Monroe are males with 2 vehicles (3,221, accounting for 34.9%) and females with 2 vehicles (2,806, making up 44.4%).
| Vehicles Available | Male | Female |
| No Vehicle | 229 (2.5%) | 188 (2.6%) |
| 1 Vehicle | 1,250 (13.5%) | 1,059 (14.6%) |
| 2 Vehicles | 3,221 (34.9%) | 2,806 (38.7%) |
| 3 Vehicles | 2,413 (26.1%) | 1,460 (20.1%) |
| 4 Vehicles | 1,109 (12.0%) | 847 (11.7%) |
| 5 or more Vehicles | 1,019 (11.0%) | 890 (12.3%) |
| Total | 9,241 (100.0%) | 7,250 (100.0%) |
Commute Time in Monroe
The most frequently occuring commute durations in Monroe are 10 to 14 minutes (2,819 commuters, 17.7%), 15 to 19 minutes (2,253 commuters, 14.2%), and 5 to 9 minutes (1,813 commuters, 11.4%).
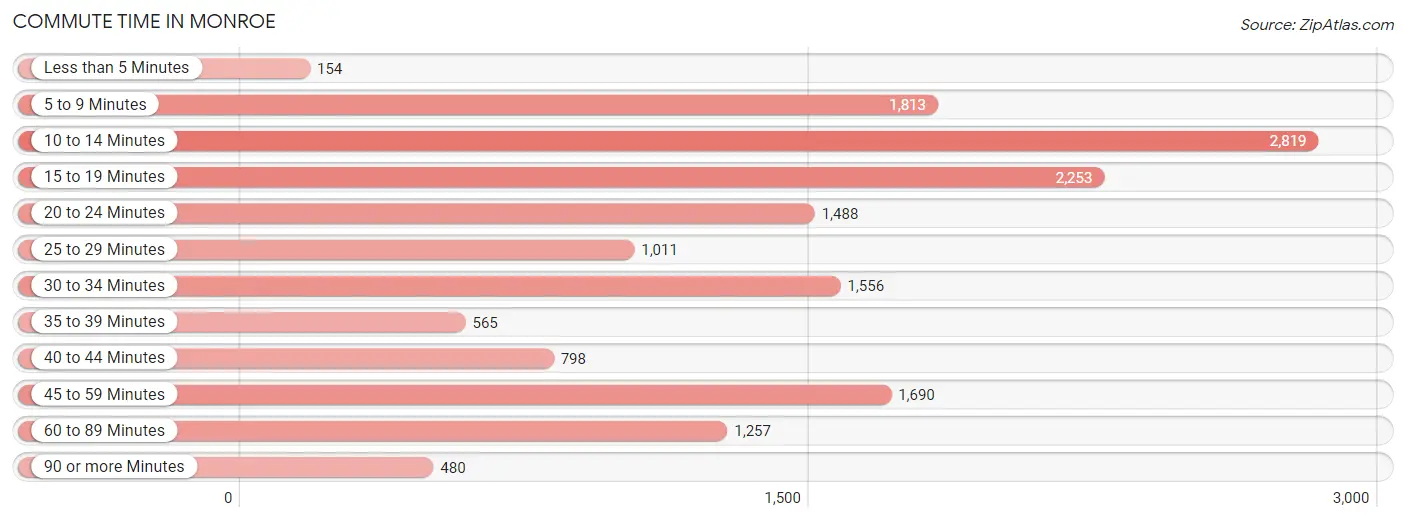
| Commute Time | # Commuters | % Commuters |
| Less than 5 Minutes | 154 | 1.0% |
| 5 to 9 Minutes | 1,813 | 11.4% |
| 10 to 14 Minutes | 2,819 | 17.7% |
| 15 to 19 Minutes | 2,253 | 14.2% |
| 20 to 24 Minutes | 1,488 | 9.4% |
| 25 to 29 Minutes | 1,011 | 6.4% |
| 30 to 34 Minutes | 1,556 | 9.8% |
| 35 to 39 Minutes | 565 | 3.6% |
| 40 to 44 Minutes | 798 | 5.0% |
| 45 to 59 Minutes | 1,690 | 10.6% |
| 60 to 89 Minutes | 1,257 | 7.9% |
| 90 or more Minutes | 480 | 3.0% |
Commute Time by Sex in Monroe
The most common commute times in Monroe are 10 to 14 minutes (1,648 commuters, 18.4%) for males and 10 to 14 minutes (1,171 commuters, 16.9%) for females.
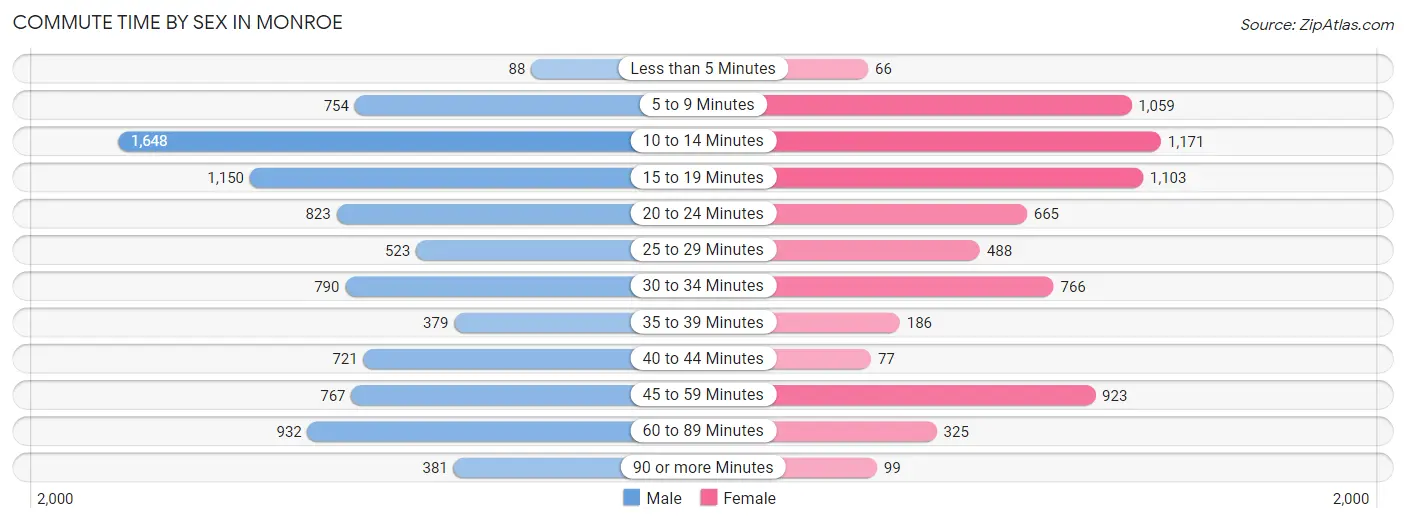
| Commute Time | Male | Female |
| Less than 5 Minutes | 88 (1.0%) | 66 (0.9%) |
| 5 to 9 Minutes | 754 (8.4%) | 1,059 (15.3%) |
| 10 to 14 Minutes | 1,648 (18.4%) | 1,171 (16.9%) |
| 15 to 19 Minutes | 1,150 (12.8%) | 1,103 (15.9%) |
| 20 to 24 Minutes | 823 (9.2%) | 665 (9.6%) |
| 25 to 29 Minutes | 523 (5.8%) | 488 (7.0%) |
| 30 to 34 Minutes | 790 (8.8%) | 766 (11.1%) |
| 35 to 39 Minutes | 379 (4.2%) | 186 (2.7%) |
| 40 to 44 Minutes | 721 (8.1%) | 77 (1.1%) |
| 45 to 59 Minutes | 767 (8.6%) | 923 (13.3%) |
| 60 to 89 Minutes | 932 (10.4%) | 325 (4.7%) |
| 90 or more Minutes | 381 (4.3%) | 99 (1.4%) |
Time of Departure to Work by Sex in Monroe
The most frequent times of departure to work in Monroe are 7:00 AM to 7:29 AM (1,901, 21.2%) for males and 7:30 AM to 7:59 AM (951, 13.7%) for females.
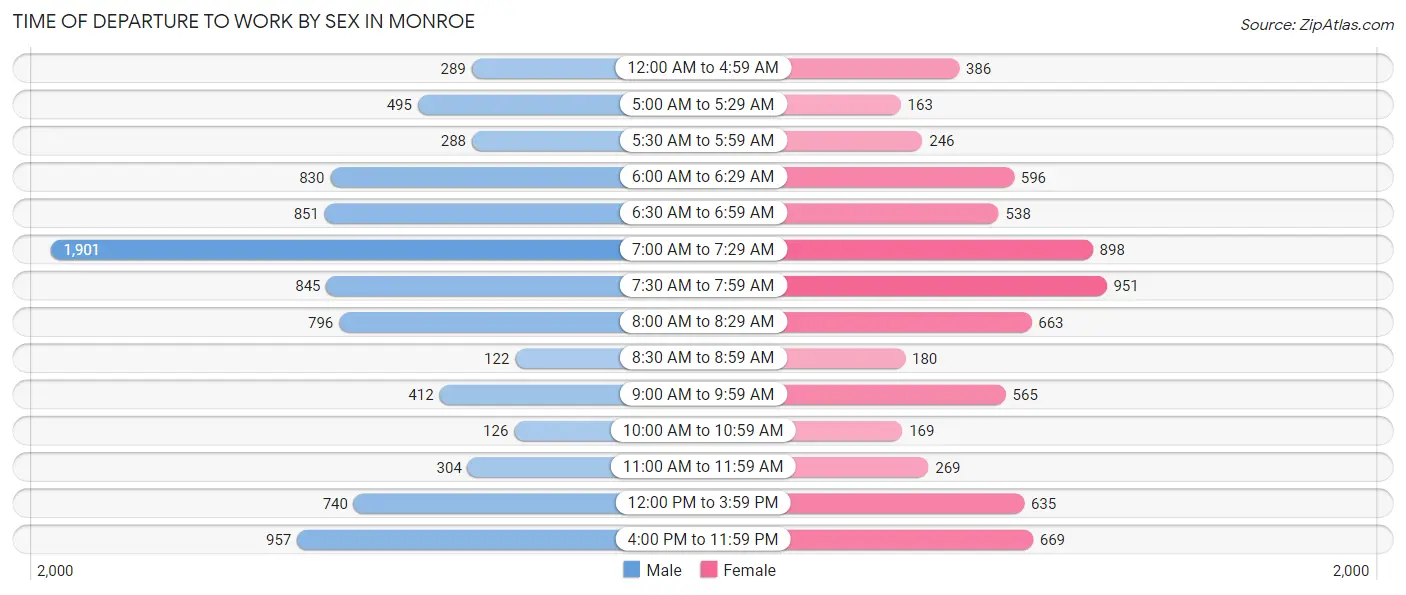
| Time of Departure | Male | Female |
| 12:00 AM to 4:59 AM | 289 (3.2%) | 386 (5.6%) |
| 5:00 AM to 5:29 AM | 495 (5.5%) | 163 (2.4%) |
| 5:30 AM to 5:59 AM | 288 (3.2%) | 246 (3.5%) |
| 6:00 AM to 6:29 AM | 830 (9.3%) | 596 (8.6%) |
| 6:30 AM to 6:59 AM | 851 (9.5%) | 538 (7.8%) |
| 7:00 AM to 7:29 AM | 1,901 (21.2%) | 898 (13.0%) |
| 7:30 AM to 7:59 AM | 845 (9.4%) | 951 (13.7%) |
| 8:00 AM to 8:29 AM | 796 (8.9%) | 663 (9.6%) |
| 8:30 AM to 8:59 AM | 122 (1.4%) | 180 (2.6%) |
| 9:00 AM to 9:59 AM | 412 (4.6%) | 565 (8.2%) |
| 10:00 AM to 10:59 AM | 126 (1.4%) | 169 (2.4%) |
| 11:00 AM to 11:59 AM | 304 (3.4%) | 269 (3.9%) |
| 12:00 PM to 3:59 PM | 740 (8.3%) | 635 (9.2%) |
| 4:00 PM to 11:59 PM | 957 (10.7%) | 669 (9.7%) |
| Total | 8,956 (100.0%) | 6,928 (100.0%) |
Housing Occupancy in Monroe
Occupancy by Ownership in Monroe
Of the total 11,700 dwellings in Monroe, owner-occupied units account for 6,961 (59.5%), while renter-occupied units make up 4,739 (40.5%).
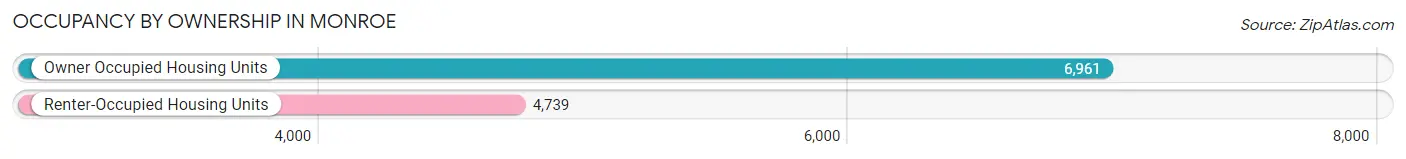
| Occupancy | # Housing Units | % Housing Units |
| Owner Occupied Housing Units | 6,961 | 59.5% |
| Renter-Occupied Housing Units | 4,739 | 40.5% |
| Total Occupied Housing Units | 11,700 | 100.0% |
Occupancy by Household Size in Monroe
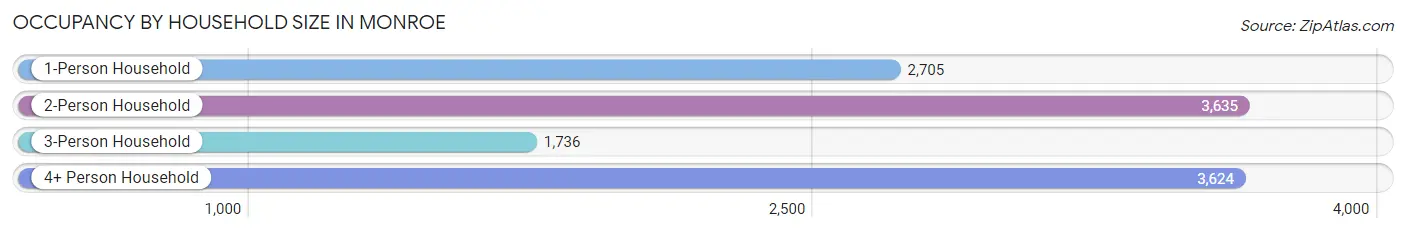
| Household Size | # Housing Units | % Housing Units |
| 1-Person Household | 2,705 | 23.1% |
| 2-Person Household | 3,635 | 31.1% |
| 3-Person Household | 1,736 | 14.8% |
| 4+ Person Household | 3,624 | 31.0% |
| Total Housing Units | 11,700 | 100.0% |
Occupancy by Ownership by Household Size in Monroe
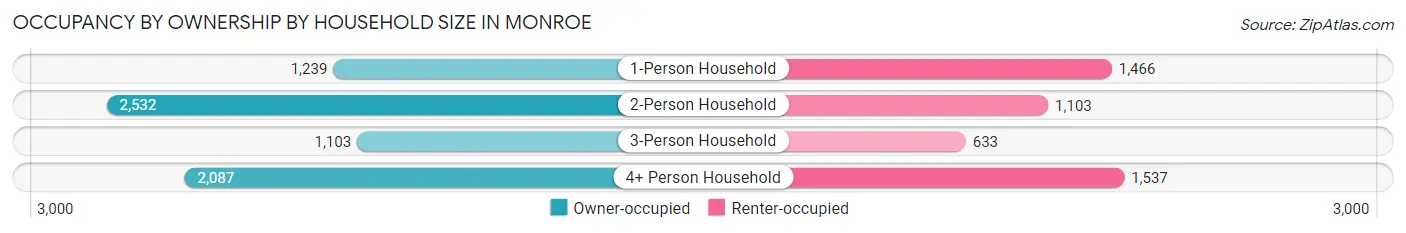
| Household Size | Owner-occupied | Renter-occupied |
| 1-Person Household | 1,239 (45.8%) | 1,466 (54.2%) |
| 2-Person Household | 2,532 (69.7%) | 1,103 (30.3%) |
| 3-Person Household | 1,103 (63.5%) | 633 (36.5%) |
| 4+ Person Household | 2,087 (57.6%) | 1,537 (42.4%) |
| Total Housing Units | 6,961 (59.5%) | 4,739 (40.5%) |
Occupancy by Educational Attainment in Monroe
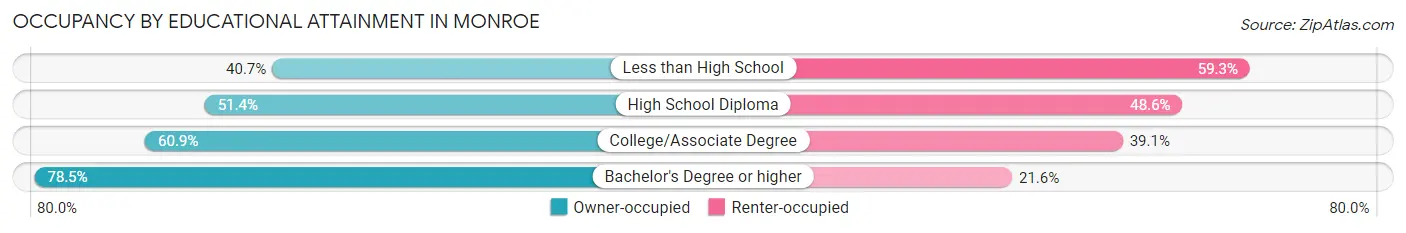
| Household Size | Owner-occupied | Renter-occupied |
| Less than High School | 717 (40.7%) | 1,043 (59.3%) |
| High School Diploma | 1,507 (51.4%) | 1,423 (48.6%) |
| College/Associate Degree | 2,644 (60.9%) | 1,698 (39.1%) |
| Bachelor's Degree or higher | 2,093 (78.4%) | 575 (21.5%) |
Occupancy by Age of Householder in Monroe
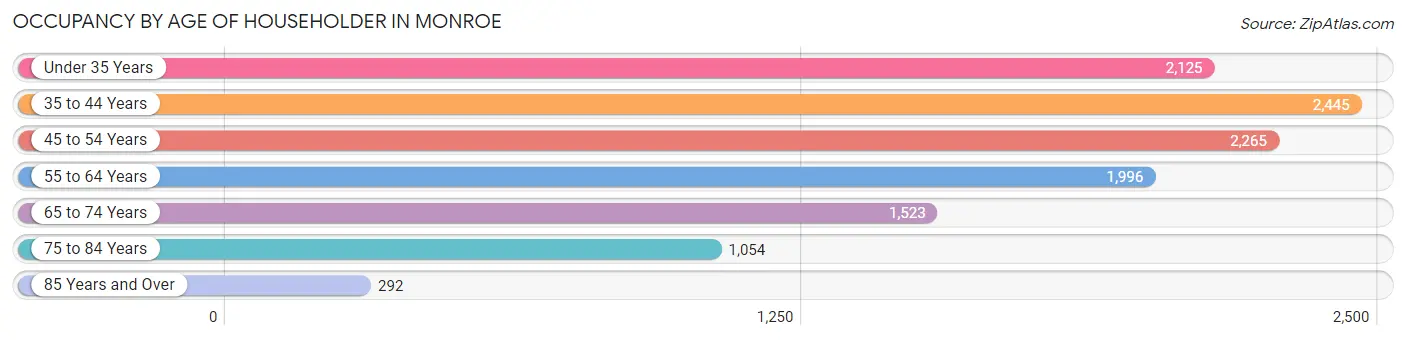
| Age Bracket | # Households | % Households |
| Under 35 Years | 2,125 | 18.2% |
| 35 to 44 Years | 2,445 | 20.9% |
| 45 to 54 Years | 2,265 | 19.4% |
| 55 to 64 Years | 1,996 | 17.1% |
| 65 to 74 Years | 1,523 | 13.0% |
| 75 to 84 Years | 1,054 | 9.0% |
| 85 Years and Over | 292 | 2.5% |
| Total | 11,700 | 100.0% |
Housing Finances in Monroe
Median Income by Occupancy in Monroe
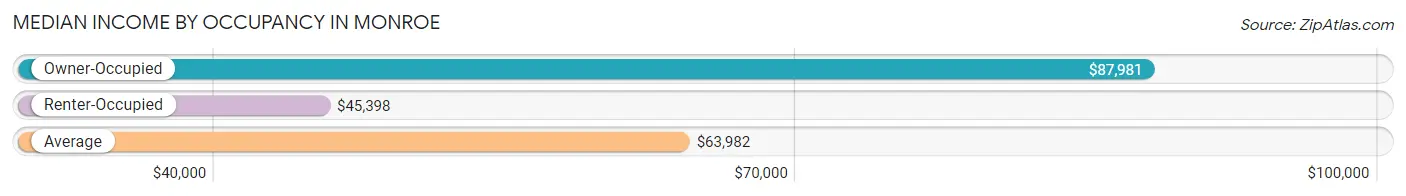
| Occupancy Type | # Households | Median Income |
| Owner-Occupied | 6,961 (59.5%) | $87,981 |
| Renter-Occupied | 4,739 (40.5%) | $45,398 |
| Average | 11,700 (100.0%) | $63,982 |
Occupancy by Householder Income Bracket in Monroe
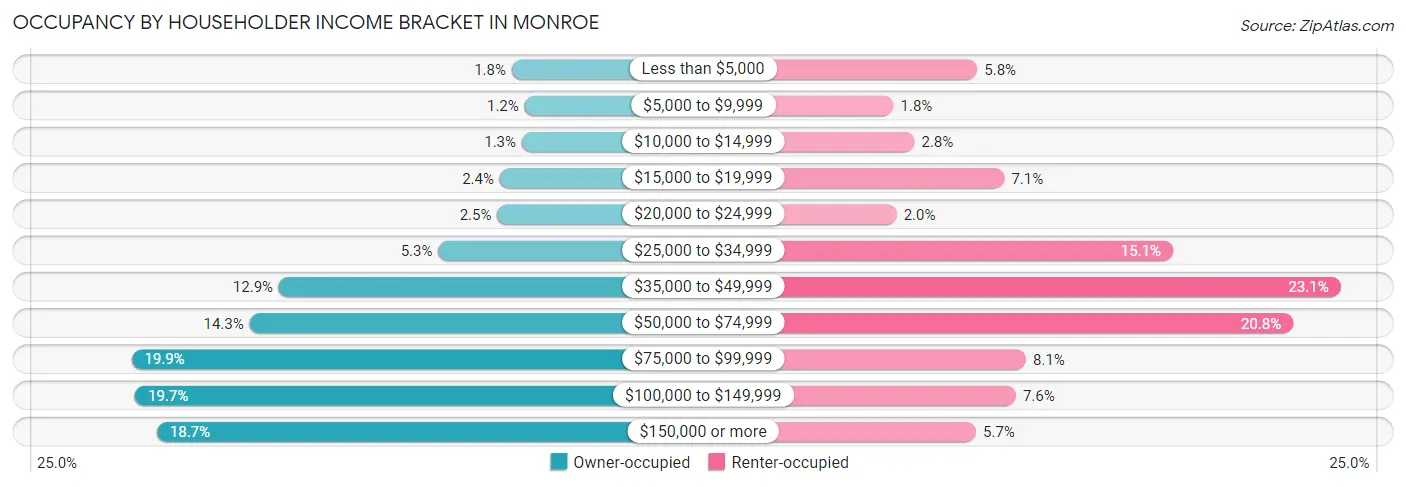
| Income Bracket | Owner-occupied | Renter-occupied |
| Less than $5,000 | 125 (1.8%) | 275 (5.8%) |
| $5,000 to $9,999 | 83 (1.2%) | 86 (1.8%) |
| $10,000 to $14,999 | 92 (1.3%) | 133 (2.8%) |
| $15,000 to $19,999 | 165 (2.4%) | 336 (7.1%) |
| $20,000 to $24,999 | 173 (2.5%) | 93 (2.0%) |
| $25,000 to $34,999 | 369 (5.3%) | 716 (15.1%) |
| $35,000 to $49,999 | 897 (12.9%) | 1,094 (23.1%) |
| $50,000 to $74,999 | 995 (14.3%) | 987 (20.8%) |
| $75,000 to $99,999 | 1,386 (19.9%) | 385 (8.1%) |
| $100,000 to $149,999 | 1,374 (19.7%) | 362 (7.6%) |
| $150,000 or more | 1,302 (18.7%) | 272 (5.7%) |
| Total | 6,961 (100.0%) | 4,739 (100.0%) |
Monthly Housing Cost Tiers in Monroe
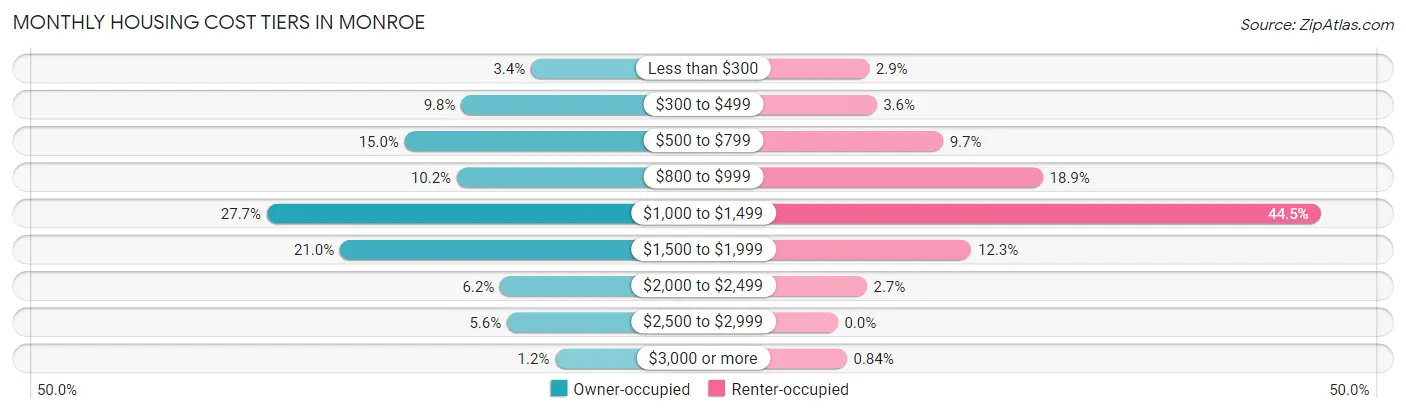
| Monthly Cost | Owner-occupied | Renter-occupied |
| Less than $300 | 235 (3.4%) | 137 (2.9%) |
| $300 to $499 | 682 (9.8%) | 169 (3.6%) |
| $500 to $799 | 1,045 (15.0%) | 459 (9.7%) |
| $800 to $999 | 710 (10.2%) | 895 (18.9%) |
| $1,000 to $1,499 | 1,928 (27.7%) | 2,107 (44.5%) |
| $1,500 to $1,999 | 1,459 (21.0%) | 583 (12.3%) |
| $2,000 to $2,499 | 433 (6.2%) | 127 (2.7%) |
| $2,500 to $2,999 | 389 (5.6%) | 0 (0.0%) |
| $3,000 or more | 80 (1.1%) | 40 (0.8%) |
| Total | 6,961 (100.0%) | 4,739 (100.0%) |
Physical Housing Characteristics in Monroe
Housing Structures in Monroe
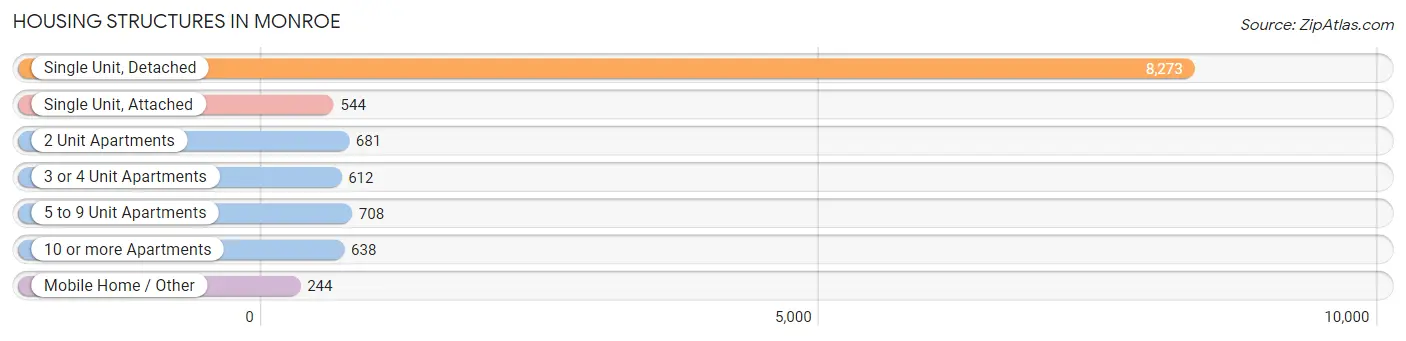
| Structure Type | # Housing Units | % Housing Units |
| Single Unit, Detached | 8,273 | 70.7% |
| Single Unit, Attached | 544 | 4.6% |
| 2 Unit Apartments | 681 | 5.8% |
| 3 or 4 Unit Apartments | 612 | 5.2% |
| 5 to 9 Unit Apartments | 708 | 6.0% |
| 10 or more Apartments | 638 | 5.4% |
| Mobile Home / Other | 244 | 2.1% |
| Total | 11,700 | 100.0% |
Housing Structures by Occupancy in Monroe
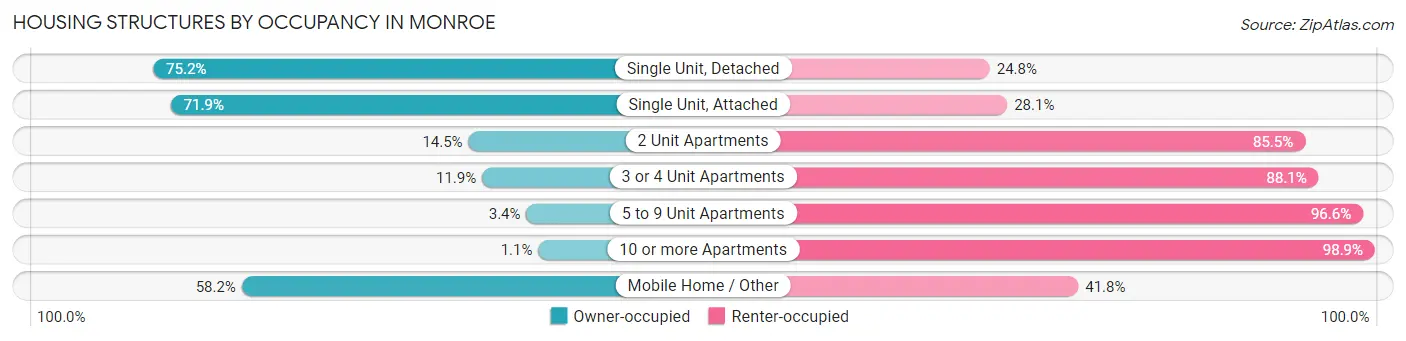
| Structure Type | Owner-occupied | Renter-occupied |
| Single Unit, Detached | 6,225 (75.2%) | 2,048 (24.8%) |
| Single Unit, Attached | 391 (71.9%) | 153 (28.1%) |
| 2 Unit Apartments | 99 (14.5%) | 582 (85.5%) |
| 3 or 4 Unit Apartments | 73 (11.9%) | 539 (88.1%) |
| 5 to 9 Unit Apartments | 24 (3.4%) | 684 (96.6%) |
| 10 or more Apartments | 7 (1.1%) | 631 (98.9%) |
| Mobile Home / Other | 142 (58.2%) | 102 (41.8%) |
| Total | 6,961 (59.5%) | 4,739 (40.5%) |
Housing Structures by Number of Rooms in Monroe
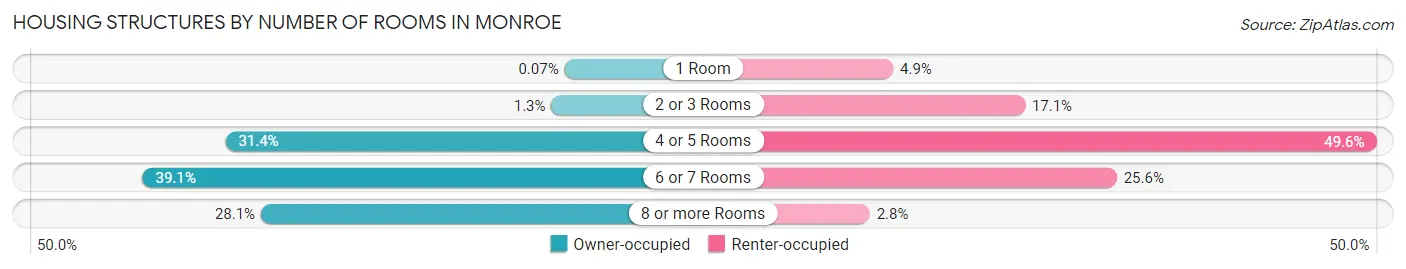
| Number of Rooms | Owner-occupied | Renter-occupied |
| 1 Room | 5 (0.1%) | 233 (4.9%) |
| 2 or 3 Rooms | 89 (1.3%) | 811 (17.1%) |
| 4 or 5 Rooms | 2,187 (31.4%) | 2,351 (49.6%) |
| 6 or 7 Rooms | 2,721 (39.1%) | 1,213 (25.6%) |
| 8 or more Rooms | 1,959 (28.1%) | 131 (2.8%) |
| Total | 6,961 (100.0%) | 4,739 (100.0%) |
Housing Structure by Heating Type in Monroe
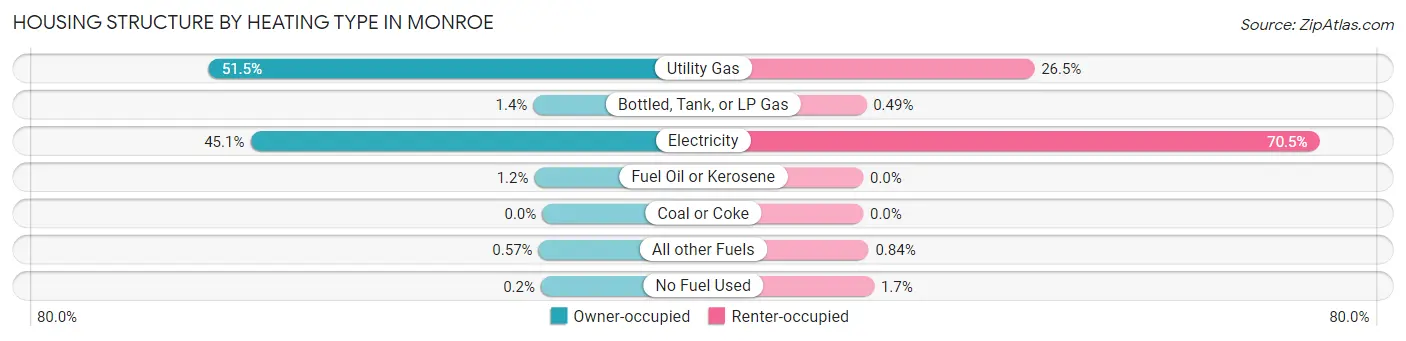
| Heating Type | Owner-occupied | Renter-occupied |
| Utility Gas | 3,586 (51.5%) | 1,254 (26.5%) |
| Bottled, Tank, or LP Gas | 96 (1.4%) | 23 (0.5%) |
| Electricity | 3,141 (45.1%) | 3,342 (70.5%) |
| Fuel Oil or Kerosene | 84 (1.2%) | 0 (0.0%) |
| Coal or Coke | 0 (0.0%) | 0 (0.0%) |
| All other Fuels | 40 (0.6%) | 40 (0.8%) |
| No Fuel Used | 14 (0.2%) | 80 (1.7%) |
| Total | 6,961 (100.0%) | 4,739 (100.0%) |
Household Vehicle Usage in Monroe
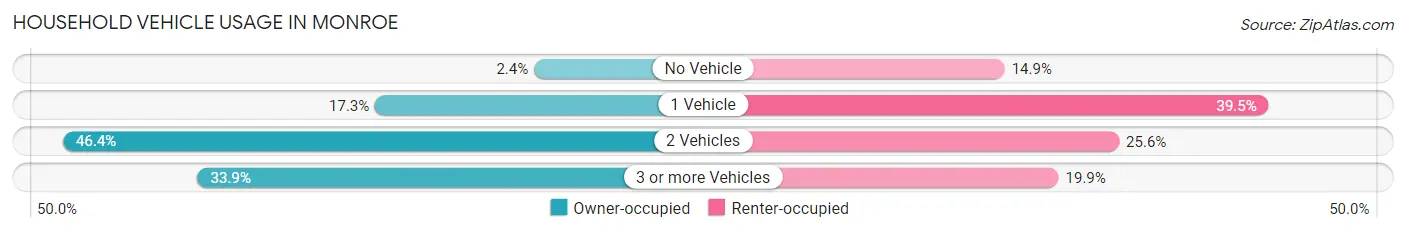
| Vehicles per Household | Owner-occupied | Renter-occupied |
| No Vehicle | 170 (2.4%) | 707 (14.9%) |
| 1 Vehicle | 1,203 (17.3%) | 1,874 (39.5%) |
| 2 Vehicles | 3,231 (46.4%) | 1,213 (25.6%) |
| 3 or more Vehicles | 2,357 (33.9%) | 945 (19.9%) |
| Total | 6,961 (100.0%) | 4,739 (100.0%) |
Real Estate & Mortgages in Monroe
Real Estate and Mortgage Overview in Monroe
| Characteristic | Without Mortgage | With Mortgage |
| Housing Units | 1,945 | 5,016 |
| Median Property Value | $223,700 | $236,300 |
| Median Household Income | $57,470 | $1,008 |
| Monthly Housing Costs | $535 | $80 |
| Real Estate Taxes | $1,840 | $65 |
Property Value by Mortgage Status in Monroe
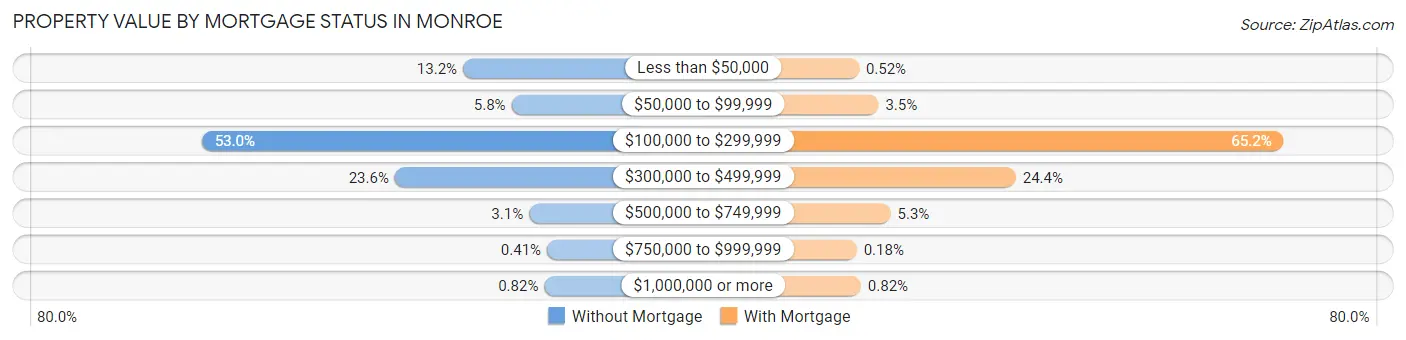
| Property Value | Without Mortgage | With Mortgage |
| Less than $50,000 | 257 (13.2%) | 26 (0.5%) |
| $50,000 to $99,999 | 113 (5.8%) | 175 (3.5%) |
| $100,000 to $299,999 | 1,031 (53.0%) | 3,272 (65.2%) |
| $300,000 to $499,999 | 459 (23.6%) | 1,225 (24.4%) |
| $500,000 to $749,999 | 61 (3.1%) | 268 (5.3%) |
| $750,000 to $999,999 | 8 (0.4%) | 9 (0.2%) |
| $1,000,000 or more | 16 (0.8%) | 41 (0.8%) |
| Total | 1,945 (100.0%) | 5,016 (100.0%) |
Household Income by Mortgage Status in Monroe
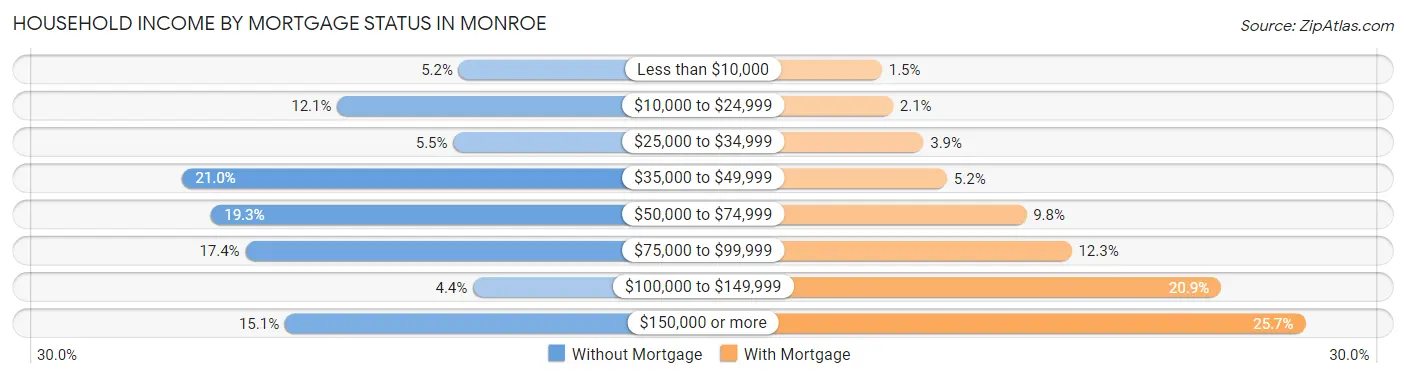
| Household Income | Without Mortgage | With Mortgage |
| Less than $10,000 | 101 (5.2%) | 75 (1.5%) |
| $10,000 to $24,999 | 236 (12.1%) | 107 (2.1%) |
| $25,000 to $34,999 | 107 (5.5%) | 194 (3.9%) |
| $35,000 to $49,999 | 408 (21.0%) | 262 (5.2%) |
| $50,000 to $74,999 | 376 (19.3%) | 489 (9.8%) |
| $75,000 to $99,999 | 338 (17.4%) | 619 (12.3%) |
| $100,000 to $149,999 | 85 (4.4%) | 1,048 (20.9%) |
| $150,000 or more | 294 (15.1%) | 1,289 (25.7%) |
| Total | 1,945 (100.0%) | 5,016 (100.0%) |
Property Value to Household Income Ratio in Monroe
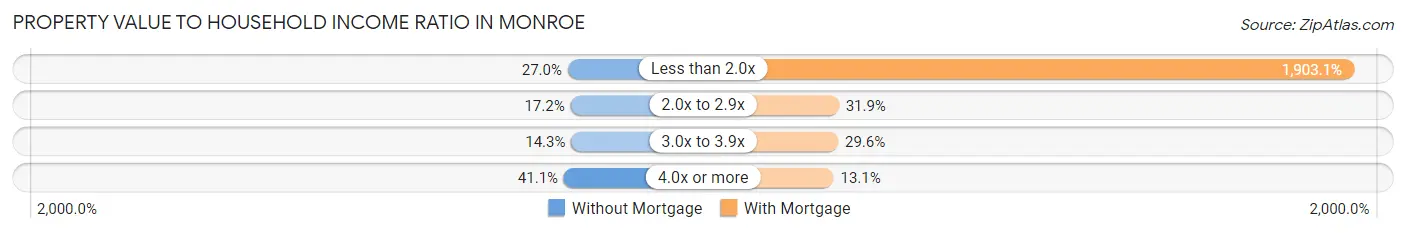
| Value-to-Income Ratio | Without Mortgage | With Mortgage |
| Less than 2.0x | 526 (27.0%) | 95,461 (1,903.1%) |
| 2.0x to 2.9x | 335 (17.2%) | 1,601 (31.9%) |
| 3.0x to 3.9x | 278 (14.3%) | 1,484 (29.6%) |
| 4.0x or more | 799 (41.1%) | 659 (13.1%) |
| Total | 1,945 (100.0%) | 5,016 (100.0%) |
Real Estate Taxes by Mortgage Status in Monroe
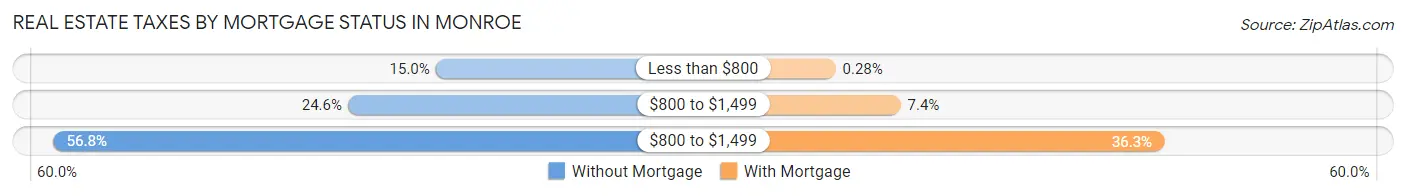
| Property Taxes | Without Mortgage | With Mortgage |
| Less than $800 | 291 (15.0%) | 14 (0.3%) |
| $800 to $1,499 | 478 (24.6%) | 371 (7.4%) |
| $800 to $1,499 | 1,105 (56.8%) | 1,819 (36.3%) |
| Total | 1,945 (100.0%) | 5,016 (100.0%) |
Health & Disability in Monroe
Health Insurance Coverage by Age in Monroe
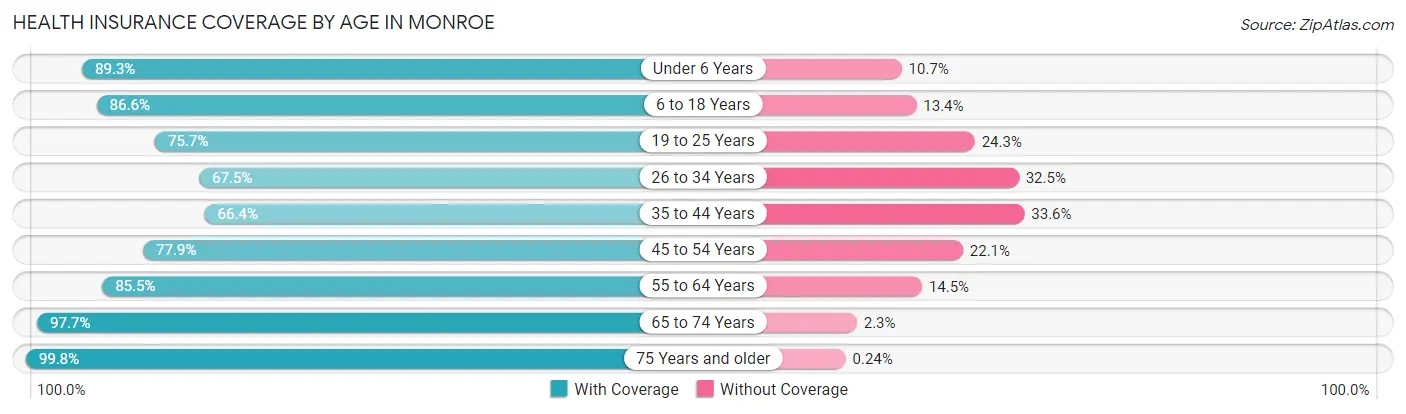
| Age Bracket | With Coverage | Without Coverage |
| Under 6 Years | 2,221 (89.3%) | 266 (10.7%) |
| 6 to 18 Years | 5,771 (86.6%) | 896 (13.4%) |
| 19 to 25 Years | 3,258 (75.7%) | 1,047 (24.3%) |
| 26 to 34 Years | 2,441 (67.5%) | 1,177 (32.5%) |
| 35 to 44 Years | 3,129 (66.4%) | 1,582 (33.6%) |
| 45 to 54 Years | 3,441 (77.9%) | 977 (22.1%) |
| 55 to 64 Years | 3,030 (85.5%) | 513 (14.5%) |
| 65 to 74 Years | 2,515 (97.7%) | 60 (2.3%) |
| 75 Years and older | 2,045 (99.8%) | 5 (0.2%) |
| Total | 27,851 (81.0%) | 6,523 (19.0%) |
Health Insurance Coverage by Citizenship Status in Monroe
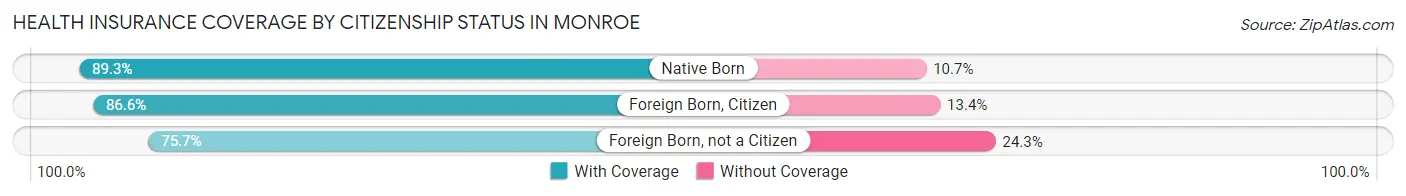
| Citizenship Status | With Coverage | Without Coverage |
| Native Born | 2,221 (89.3%) | 266 (10.7%) |
| Foreign Born, Citizen | 5,771 (86.6%) | 896 (13.4%) |
| Foreign Born, not a Citizen | 3,258 (75.7%) | 1,047 (24.3%) |
Health Insurance Coverage by Household Income in Monroe
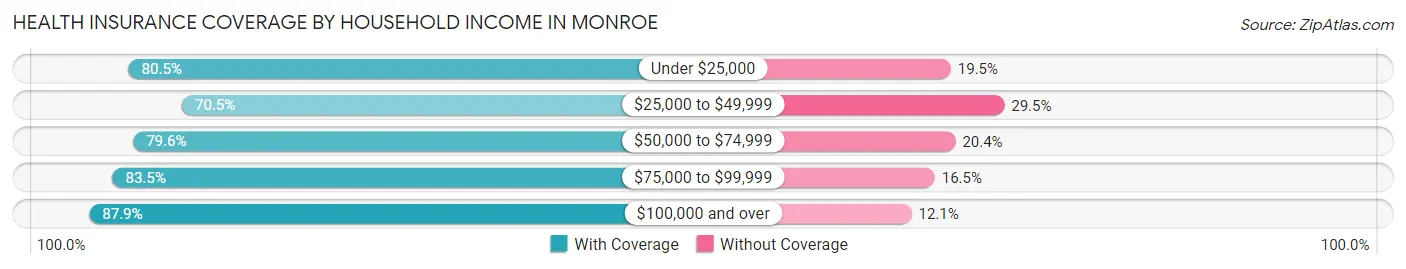
| Household Income | With Coverage | Without Coverage |
| Under $25,000 | 2,241 (80.5%) | 543 (19.5%) |
| $25,000 to $49,999 | 5,627 (70.5%) | 2,356 (29.5%) |
| $50,000 to $74,999 | 4,533 (79.6%) | 1,159 (20.4%) |
| $75,000 to $99,999 | 5,060 (83.5%) | 999 (16.5%) |
| $100,000 and over | 10,332 (87.9%) | 1,427 (12.1%) |
Public vs Private Health Insurance Coverage by Age in Monroe
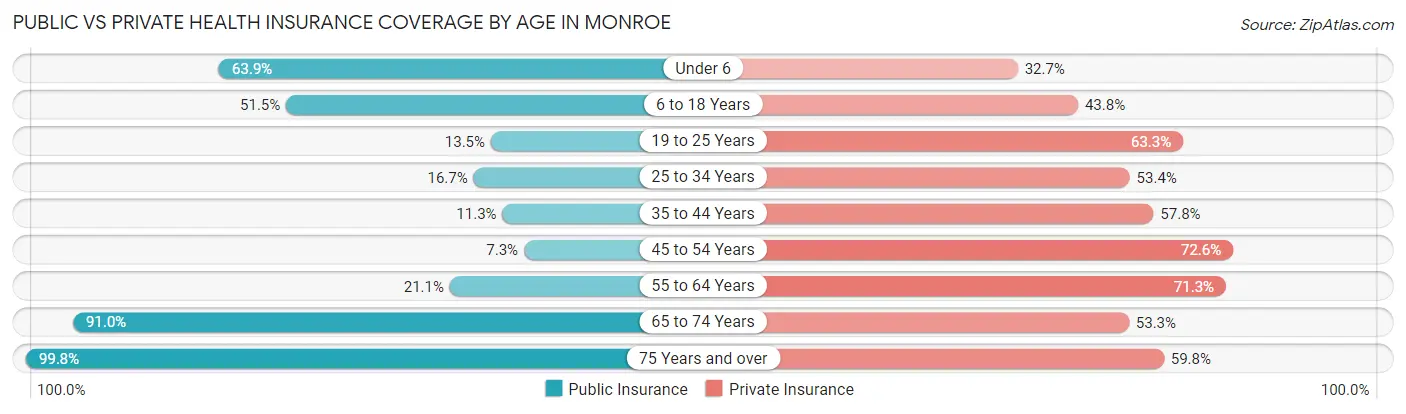
| Age Bracket | Public Insurance | Private Insurance |
| Under 6 | 1,590 (63.9%) | 812 (32.7%) |
| 6 to 18 Years | 3,431 (51.5%) | 2,923 (43.8%) |
| 19 to 25 Years | 579 (13.5%) | 2,727 (63.3%) |
| 25 to 34 Years | 603 (16.7%) | 1,933 (53.4%) |
| 35 to 44 Years | 533 (11.3%) | 2,725 (57.8%) |
| 45 to 54 Years | 323 (7.3%) | 3,208 (72.6%) |
| 55 to 64 Years | 747 (21.1%) | 2,526 (71.3%) |
| 65 to 74 Years | 2,344 (91.0%) | 1,372 (53.3%) |
| 75 Years and over | 2,045 (99.8%) | 1,225 (59.8%) |
| Total | 12,195 (35.5%) | 19,451 (56.6%) |
Disability Status by Sex by Age in Monroe
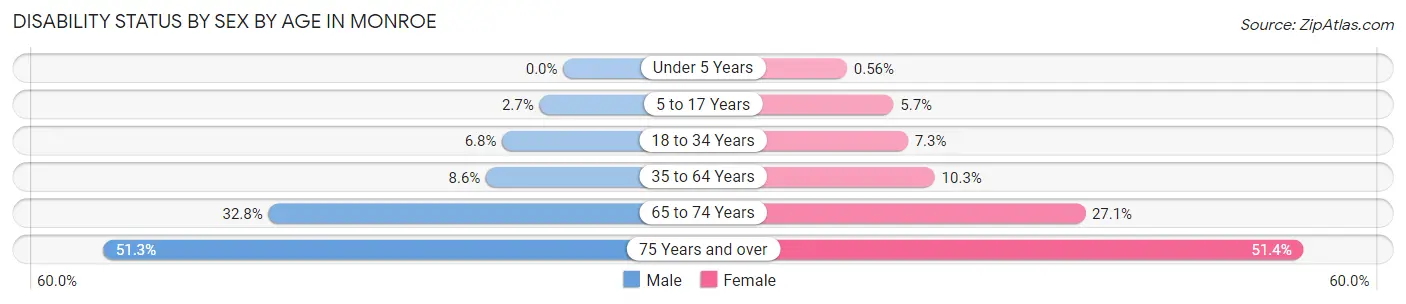
| Age Bracket | Male | Female |
| Under 5 Years | 0 (0.0%) | 5 (0.6%) |
| 5 to 17 Years | 87 (2.6%) | 185 (5.7%) |
| 18 to 34 Years | 297 (6.8%) | 306 (7.3%) |
| 35 to 64 Years | 546 (8.6%) | 653 (10.3%) |
| 65 to 74 Years | 347 (32.8%) | 411 (27.1%) |
| 75 Years and over | 402 (51.3%) | 651 (51.4%) |
Disability Class by Sex by Age in Monroe
Disability Class: Hearing Difficulty
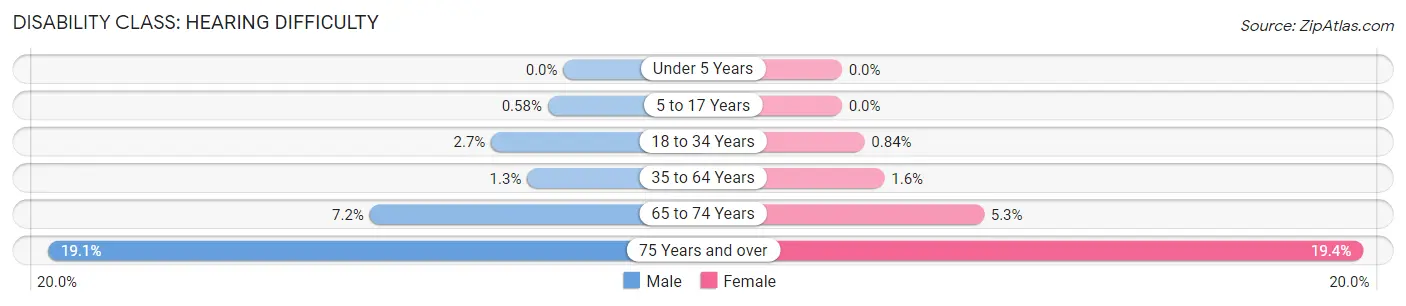
| Age Bracket | Male | Female |
| Under 5 Years | 0 (0.0%) | 0 (0.0%) |
| 5 to 17 Years | 19 (0.6%) | 0 (0.0%) |
| 18 to 34 Years | 117 (2.7%) | 35 (0.8%) |
| 35 to 64 Years | 85 (1.3%) | 100 (1.6%) |
| 65 to 74 Years | 76 (7.2%) | 80 (5.3%) |
| 75 Years and over | 150 (19.1%) | 245 (19.4%) |
Disability Class: Vision Difficulty
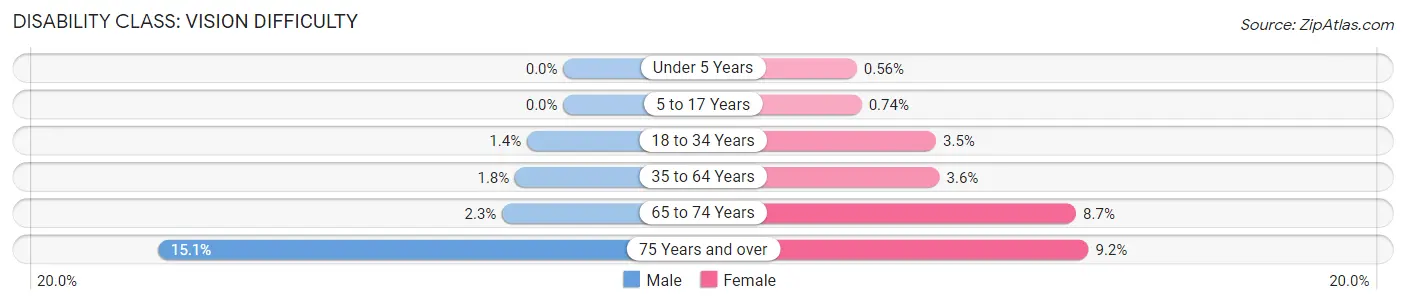
| Age Bracket | Male | Female |
| Under 5 Years | 0 (0.0%) | 5 (0.6%) |
| 5 to 17 Years | 0 (0.0%) | 24 (0.7%) |
| 18 to 34 Years | 59 (1.3%) | 146 (3.5%) |
| 35 to 64 Years | 114 (1.8%) | 229 (3.6%) |
| 65 to 74 Years | 24 (2.3%) | 132 (8.7%) |
| 75 Years and over | 118 (15.0%) | 116 (9.2%) |
Disability Class: Cognitive Difficulty
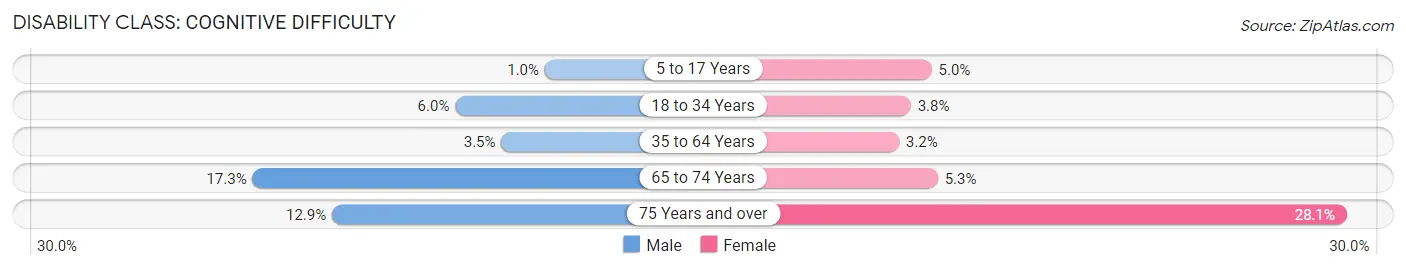
| Age Bracket | Male | Female |
| 5 to 17 Years | 34 (1.0%) | 161 (5.0%) |
| 18 to 34 Years | 263 (6.0%) | 160 (3.8%) |
| 35 to 64 Years | 219 (3.5%) | 201 (3.2%) |
| 65 to 74 Years | 183 (17.3%) | 81 (5.3%) |
| 75 Years and over | 101 (12.9%) | 356 (28.1%) |
Disability Class: Ambulatory Difficulty
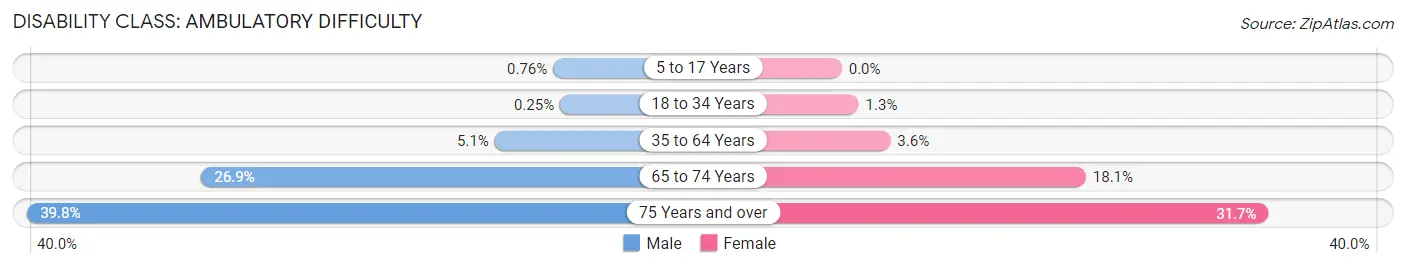
| Age Bracket | Male | Female |
| 5 to 17 Years | 25 (0.8%) | 0 (0.0%) |
| 18 to 34 Years | 11 (0.3%) | 52 (1.3%) |
| 35 to 64 Years | 324 (5.1%) | 228 (3.6%) |
| 65 to 74 Years | 284 (26.9%) | 275 (18.1%) |
| 75 Years and over | 312 (39.8%) | 401 (31.7%) |
Disability Class: Self-Care Difficulty
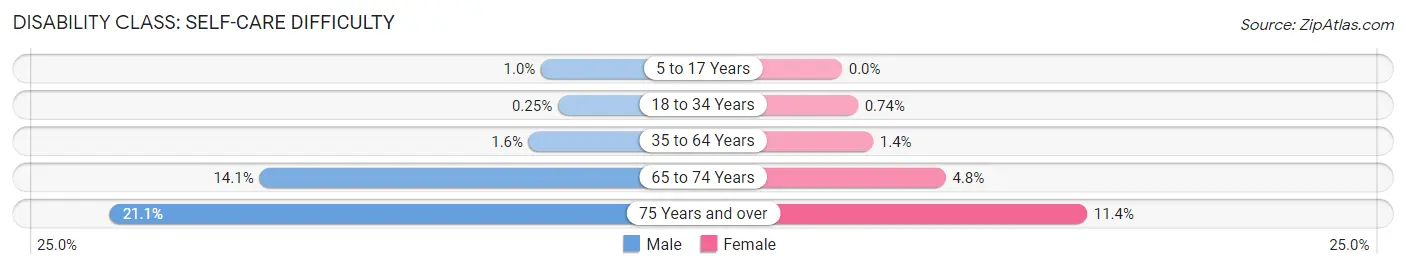
| Age Bracket | Male | Female |
| 5 to 17 Years | 34 (1.0%) | 0 (0.0%) |
| 18 to 34 Years | 11 (0.3%) | 31 (0.7%) |
| 35 to 64 Years | 102 (1.6%) | 91 (1.4%) |
| 65 to 74 Years | 149 (14.1%) | 73 (4.8%) |
| 75 Years and over | 165 (21.0%) | 144 (11.4%) |
Technology Access in Monroe
Computing Device Access in Monroe
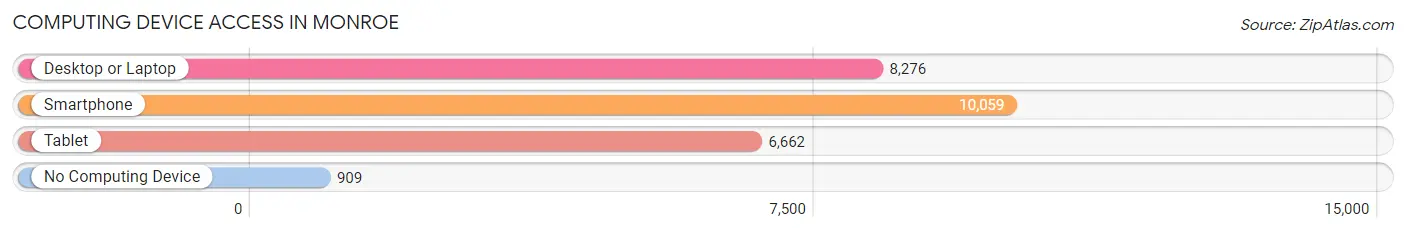
| Device Type | # Households | % Households |
| Desktop or Laptop | 8,276 | 70.7% |
| Smartphone | 10,059 | 86.0% |
| Tablet | 6,662 | 56.9% |
| No Computing Device | 909 | 7.8% |
| Total | 11,700 | 100.0% |
Internet Access in Monroe
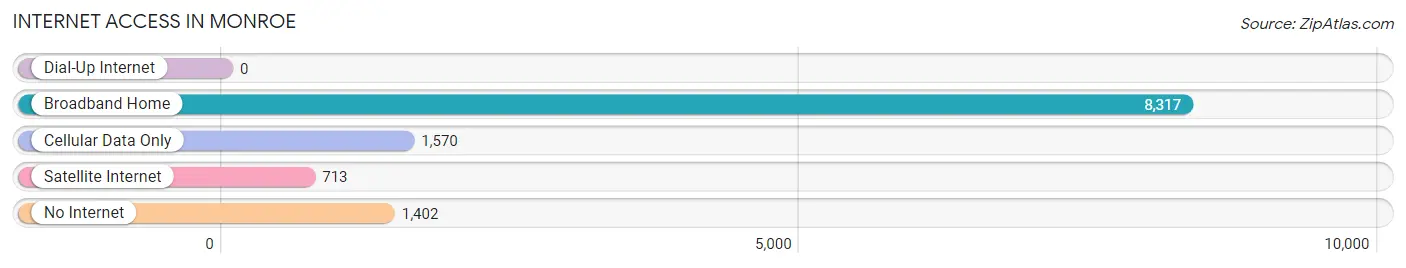
| Internet Type | # Households | % Households |
| Dial-Up Internet | 0 | 0.0% |
| Broadband Home | 8,317 | 71.1% |
| Cellular Data Only | 1,570 | 13.4% |
| Satellite Internet | 713 | 6.1% |
| No Internet | 1,402 | 12.0% |
| Total | 11,700 | 100.0% |
Monroe Summary
Monroe, North Carolina is a city located in Union County, North Carolina. It is the county seat of Union County and is located approximately 25 miles southeast of Charlotte. The city has a population of approximately 34,000 people and is part of the Charlotte metropolitan area.
Geography
Monroe is located in the Piedmont region of North Carolina, which is characterized by rolling hills and flat plains. The city is situated on the banks of the Rocky River, which is a tributary of the Catawba River. The city is located at an elevation of 645 feet above sea level. The city has a total area of 16.2 square miles, of which 16.1 square miles is land and 0.1 square miles is water.
Climate
Monroe has a humid subtropical climate, with hot, humid summers and mild winters. The average annual temperature is 61.3°F, with an average high of 79.2°F in July and an average low of 43.4°F in January. The average annual precipitation is 44.3 inches, with an average of 4.3 inches of snowfall per year.
Demographics
As of the 2010 census, Monroe had a population of 34,039 people. The racial makeup of the city was 68.2% White, 24.3% African American, 0.4% Native American, 2.2% Asian, 0.1% Pacific Islander, 2.7% from other races, and 2.2% from two or more races. Hispanic or Latino of any race were 6.7% of the population.
Economy
Monroe is home to a variety of businesses and industries, including manufacturing, retail, and healthcare. The city is home to several major employers, including Union Power Cooperative, Union County Public Schools, and Union Regional Medical Center. The city is also home to several smaller businesses, including restaurants, shops, and other services.
Monroe is also home to several educational institutions, including Wingate University, Union County Public Schools, and Central Piedmont Community College. The city is also home to several parks and recreational facilities, including the Monroe Aquatics Center, the Monroe Skate Park, and the Monroe Nature Preserve.
Monroe is served by the Charlotte Douglas International Airport, which is located approximately 25 miles away. The city is also served by several major highways, including Interstate 85, US Highway 74, and US Highway 601.
Conclusion
Monroe, North Carolina is a city located in Union County, North Carolina. It is the county seat of Union County and is located approximately 25 miles southeast of Charlotte. The city has a population of approximately 34,000 people and is part of the Charlotte metropolitan area. Monroe has a humid subtropical climate, with hot, humid summers and mild winters. The city is home to a variety of businesses and industries, including manufacturing, retail, and healthcare. The city is also home to several educational institutions, parks, and recreational facilities. Monroe is served by the Charlotte Douglas International Airport and several major highways.
Common Questions
What is Per Capita Income in Monroe?
Per Capita income in Monroe is $28,611.
What is the Median Family Income in Monroe?
Median Family Income in Monroe is $78,617.
What is the Median Household income in Monroe?
Median Household Income in Monroe is $63,982.
What is Income or Wage Gap in Monroe?
Income or Wage Gap in Monroe is 26.7%.
Women in Monroe earn 73.3 cents for every dollar earned by a man.
What is Family Income Deficit in Monroe?
Family Income Deficit in Monroe is $10,006.
Families that are below poverty line in Monroe earn $10,006 less on average than the poverty threshold level.
What is Inequality or Gini Index in Monroe?
Inequality or Gini Index in Monroe is 0.42.
What is the Total Population of Monroe?
Total Population of Monroe is 34,897.
What is the Total Male Population of Monroe?
Total Male Population of Monroe is 17,232.
What is the Total Female Population of Monroe?
Total Female Population of Monroe is 17,665.
What is the Ratio of Males per 100 Females in Monroe?
There are 97.55 Males per 100 Females in Monroe.
What is the Ratio of Females per 100 Males in Monroe?
There are 102.51 Females per 100 Males in Monroe.
What is the Median Population Age in Monroe?
Median Population Age in Monroe is 36.1 Years.
What is the Average Family Size in Monroe
Average Family Size in Monroe is 3.5 People.
What is the Average Household Size in Monroe
Average Household Size in Monroe is 2.9 People.
How Large is the Labor Force in Monroe?
There are 17,881 People in the Labor Forcein in Monroe.
What is the Percentage of People in the Labor Force in Monroe?
64.5% of People are in the Labor Force in Monroe.
What is the Unemployment Rate in Monroe?
Unemployment Rate in Monroe is 6.2%.