Randallstown, MD Map & Demographics
Randallstown Map
Randallstown Overview
$40,680
PER CAPITA INCOME
$102,710
AVG FAMILY INCOME
$89,484
AVG HOUSEHOLD INCOME
5.4%
WAGE / INCOME GAP [ % ]
94.6¢/ $1
WAGE / INCOME GAP [ $ ]
0.39
INEQUALITY / GINI INDEX
36,223
TOTAL POPULATION
16,233
MALE POPULATION
19,990
FEMALE POPULATION
81.21
MALES / 100 FEMALES
123.14
FEMALES / 100 MALES
46.1
MEDIAN AGE
3.3
AVG FAMILY SIZE
2.6
AVG HOUSEHOLD SIZE
19,887
LABOR FORCE [ PEOPLE ]
65.3%
PERCENT IN LABOR FORCE
6.6%
UNEMPLOYMENT RATE
Randallstown Zip Codes
Income in Randallstown
Income Overview in Randallstown
Per Capita Income in Randallstown is $40,680, while median incomes of families and households are $102,710 and $89,484 respectively.
| Characteristic | Number | Measure |
| Per Capita Income | 36,223 | $40,680 |
| Median Family Income | 8,863 | $102,710 |
| Mean Family Income | 8,863 | $120,226 |
| Median Household Income | 13,530 | $89,484 |
| Mean Household Income | 13,530 | $103,966 |
| Income Deficit | 8,863 | $0 |
| Wage / Income Gap (%) | 36,223 | 5.38% |
| Wage / Income Gap ($) | 36,223 | 94.62¢ per $1 |
| Gini / Inequality Index | 36,223 | 0.39 |
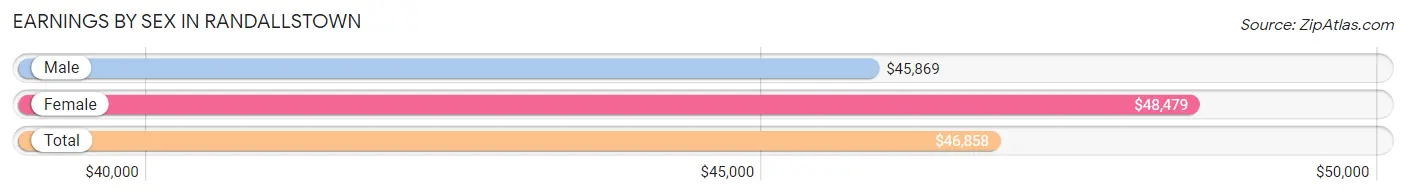
Earnings by Sex in Randallstown
Average Earnings in Randallstown are $46,858, $45,869 for men and $48,479 for women, a difference of 5.4%.
| Sex | Number | Average Earnings |
| Male | 9,223 (45.9%) | $45,869 |
| Female | 10,866 (54.1%) | $48,479 |
| Total | 20,089 (100.0%) | $46,858 |
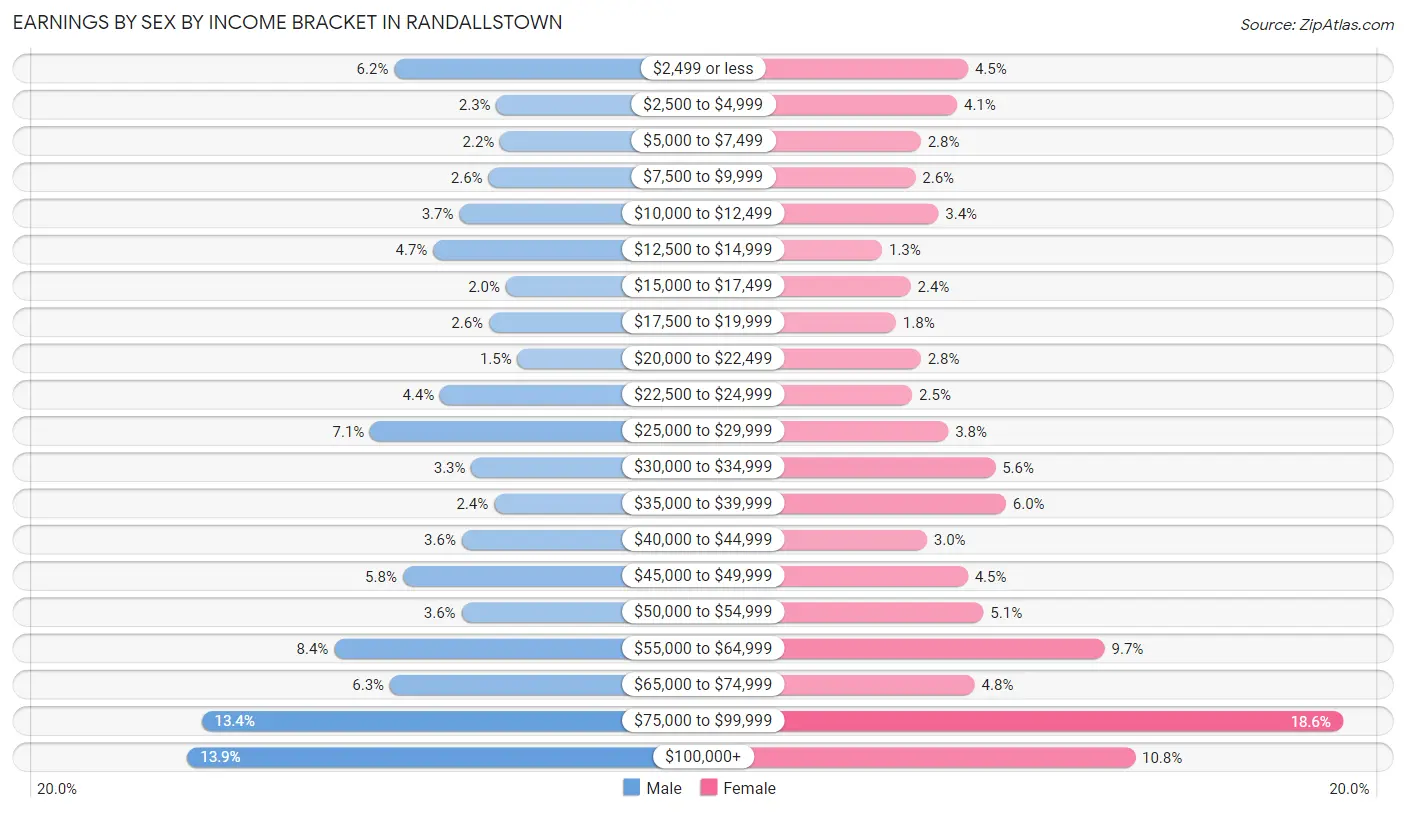
Earnings by Sex by Income Bracket in Randallstown
The most common earnings brackets in Randallstown are $100,000+ for men (1,282 | 13.9%) and $75,000 to $99,999 for women (2,019 | 18.6%).
| Income | Male | Female |
| $2,499 or less | 567 (6.1%) | 493 (4.5%) |
| $2,500 to $4,999 | 214 (2.3%) | 449 (4.1%) |
| $5,000 to $7,499 | 201 (2.2%) | 301 (2.8%) |
| $7,500 to $9,999 | 242 (2.6%) | 279 (2.6%) |
| $10,000 to $12,499 | 342 (3.7%) | 373 (3.4%) |
| $12,500 to $14,999 | 433 (4.7%) | 143 (1.3%) |
| $15,000 to $17,499 | 182 (2.0%) | 260 (2.4%) |
| $17,500 to $19,999 | 240 (2.6%) | 200 (1.8%) |
| $20,000 to $22,499 | 141 (1.5%) | 301 (2.8%) |
| $22,500 to $24,999 | 409 (4.4%) | 266 (2.5%) |
| $25,000 to $29,999 | 650 (7.0%) | 413 (3.8%) |
| $30,000 to $34,999 | 301 (3.3%) | 604 (5.6%) |
| $35,000 to $39,999 | 222 (2.4%) | 648 (6.0%) |
| $40,000 to $44,999 | 334 (3.6%) | 326 (3.0%) |
| $45,000 to $49,999 | 538 (5.8%) | 492 (4.5%) |
| $50,000 to $54,999 | 335 (3.6%) | 556 (5.1%) |
| $55,000 to $64,999 | 775 (8.4%) | 1,050 (9.7%) |
| $65,000 to $74,999 | 582 (6.3%) | 520 (4.8%) |
| $75,000 to $99,999 | 1,233 (13.4%) | 2,019 (18.6%) |
| $100,000+ | 1,282 (13.9%) | 1,173 (10.8%) |
| Total | 9,223 (100.0%) | 10,866 (100.0%) |
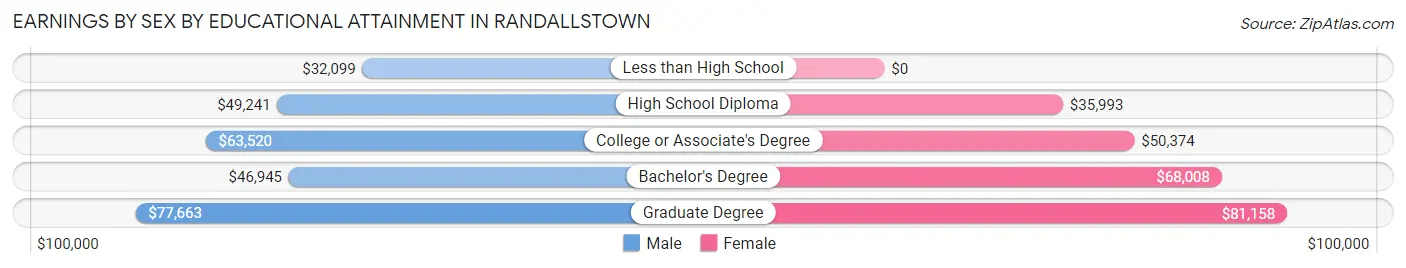
Earnings by Sex by Educational Attainment in Randallstown
Average earnings in Randallstown are $53,967 for men and $55,765 for women, a difference of 3.2%. Men with an educational attainment of graduate degree enjoy the highest average annual earnings of $77,663, while those with less than high school education earn the least with $32,099. Women with an educational attainment of graduate degree earn the most with the average annual earnings of $81,158, while those with high school diploma education have the smallest earnings of $35,993.
| Educational Attainment | Male Income | Female Income |
| Less than High School | $32,099 | $0 |
| High School Diploma | $49,241 | $35,993 |
| College or Associate's Degree | $63,520 | $50,374 |
| Bachelor's Degree | $46,945 | $68,008 |
| Graduate Degree | $77,663 | $81,158 |
| Total | $53,967 | $55,765 |
Family Income in Randallstown
Family Income Brackets in Randallstown
According to the Randallstown family income data, there are 2,482 families falling into the $100,000 to $149,999 income range, which is the most common income bracket and makes up 28.0% of all families. Conversely, the $10,000 to $14,999 income bracket is the least frequent group with only 53 families (0.6%) belonging to this category.
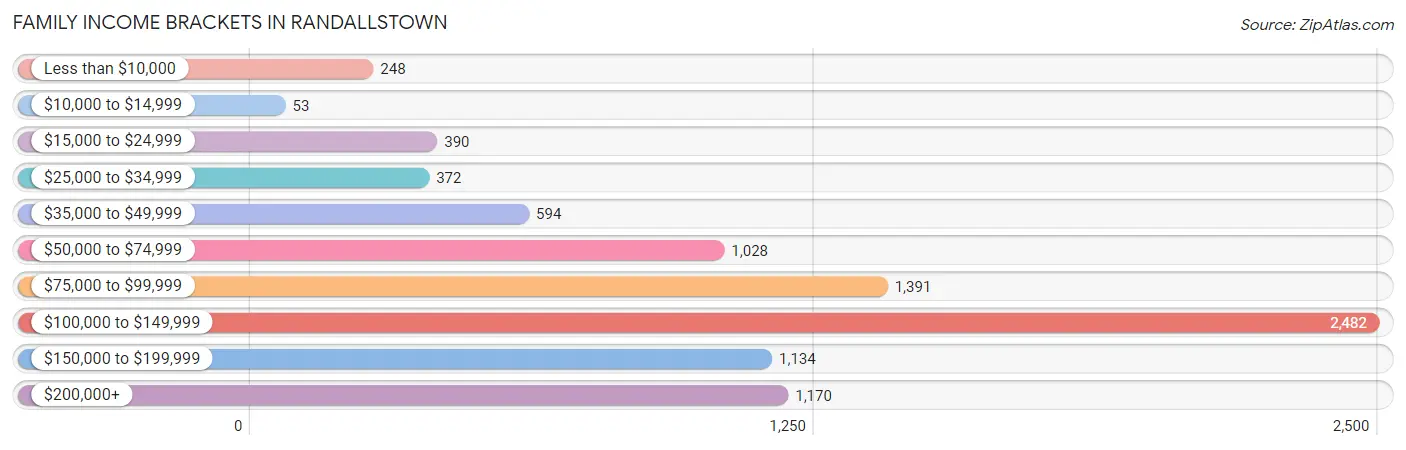
| Income Bracket | # Families | % Families |
| Less than $10,000 | 248 | 2.8% |
| $10,000 to $14,999 | 53 | 0.6% |
| $15,000 to $24,999 | 390 | 4.4% |
| $25,000 to $34,999 | 372 | 4.2% |
| $35,000 to $49,999 | 594 | 6.7% |
| $50,000 to $74,999 | 1,028 | 11.6% |
| $75,000 to $99,999 | 1,391 | 15.7% |
| $100,000 to $149,999 | 2,482 | 28.0% |
| $150,000 to $199,999 | 1,134 | 12.8% |
| $200,000+ | 1,170 | 13.2% |
Family Income by Famaliy Size in Randallstown
3-person families (2,268 | 25.6%) account for the highest median family income in Randallstown with $128,000 per family, while 2-person families (4,092 | 46.2%) have the highest median income of $46,742 per family member.
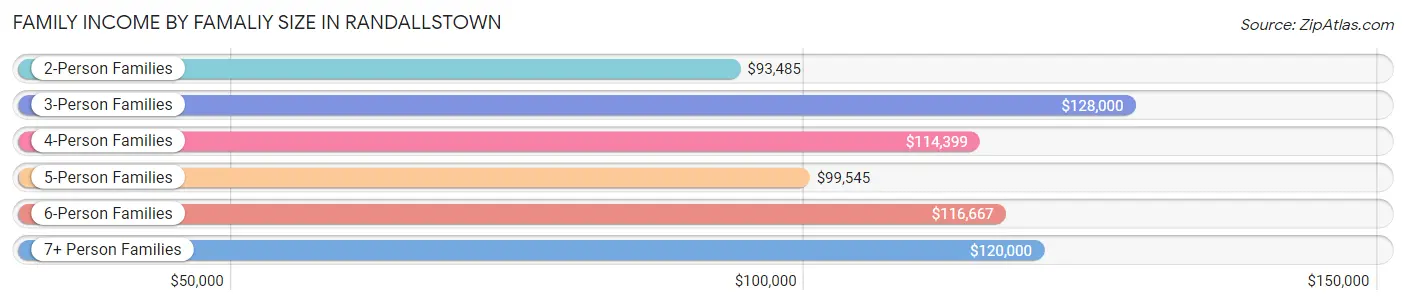
| Income Bracket | # Families | Median Income |
| 2-Person Families | 4,092 (46.2%) | $93,485 |
| 3-Person Families | 2,268 (25.6%) | $128,000 |
| 4-Person Families | 1,259 (14.2%) | $114,399 |
| 5-Person Families | 558 (6.3%) | $99,545 |
| 6-Person Families | 416 (4.7%) | $116,667 |
| 7+ Person Families | 270 (3.0%) | $120,000 |
| Total | 8,863 (100.0%) | $102,710 |
Family Income by Number of Earners in Randallstown
The median family income in Randallstown is $102,710, with families comprising 3+ earners (1,496) having the highest median family income of $168,636, while families with no earners (1,173) have the lowest median family income of $72,981, accounting for 16.9% and 13.2% of families, respectively.
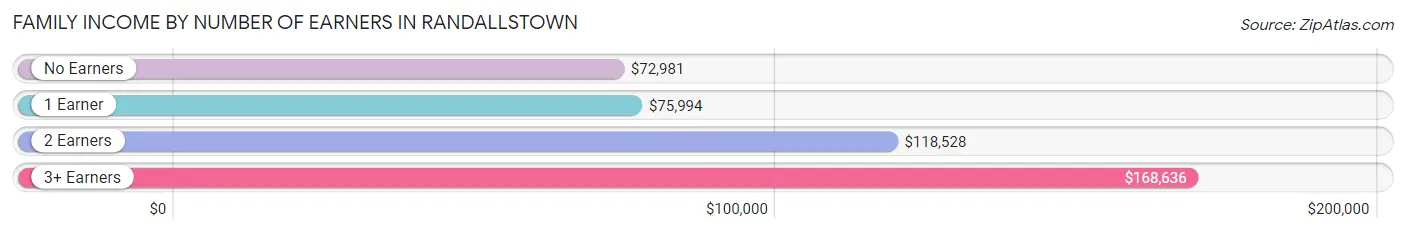
| Number of Earners | # Families | Median Income |
| No Earners | 1,173 (13.2%) | $72,981 |
| 1 Earner | 2,753 (31.1%) | $75,994 |
| 2 Earners | 3,441 (38.8%) | $118,528 |
| 3+ Earners | 1,496 (16.9%) | $168,636 |
| Total | 8,863 (100.0%) | $102,710 |
Household Income in Randallstown
Household Income Brackets in Randallstown
With 3,031 households falling in the category, the $100,000 to $149,999 income range is the most frequent in Randallstown, accounting for 22.4% of all households. In contrast, only 189 households (1.4%) fall into the $10,000 to $14,999 income bracket, making it the least populous group.
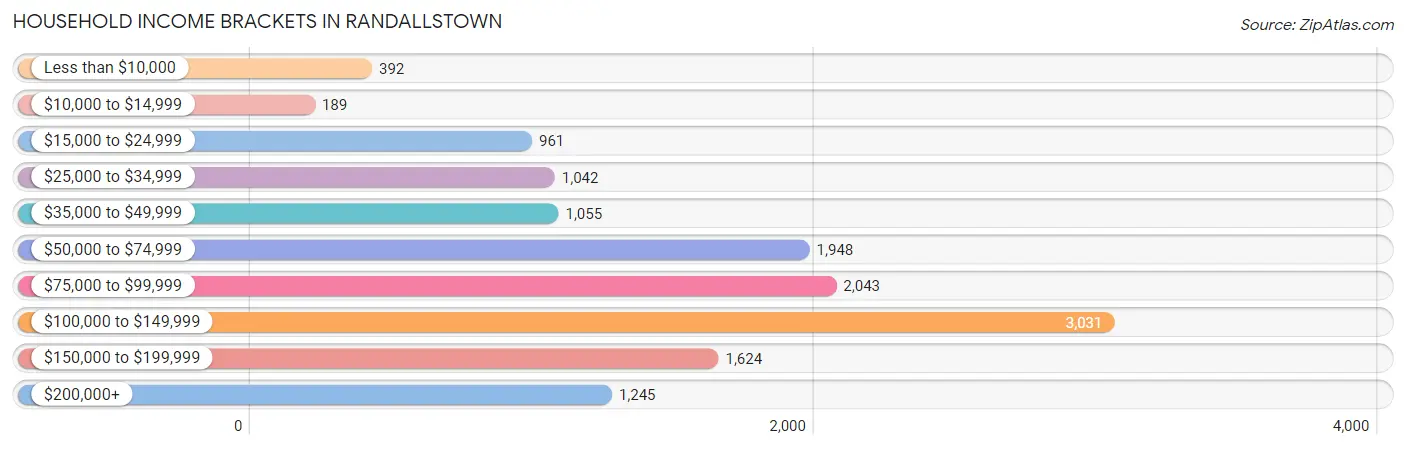
| Income Bracket | # Households | % Households |
| Less than $10,000 | 392 | 2.9% |
| $10,000 to $14,999 | 189 | 1.4% |
| $15,000 to $24,999 | 961 | 7.1% |
| $25,000 to $34,999 | 1,042 | 7.7% |
| $35,000 to $49,999 | 1,055 | 7.8% |
| $50,000 to $74,999 | 1,948 | 14.4% |
| $75,000 to $99,999 | 2,043 | 15.1% |
| $100,000 to $149,999 | 3,031 | 22.4% |
| $150,000 to $199,999 | 1,624 | 12.0% |
| $200,000+ | 1,245 | 9.2% |
Household Income by Householder Age in Randallstown
The median household income in Randallstown is $89,484, with the highest median household income of $103,730 found in the 45 to 64 years age bracket for the primary householder. A total of 6,137 households (45.4%) fall into this category. Meanwhile, the 15 to 24 years age bracket for the primary householder has the lowest median household income of $0, with 66 households (0.5%) in this group.
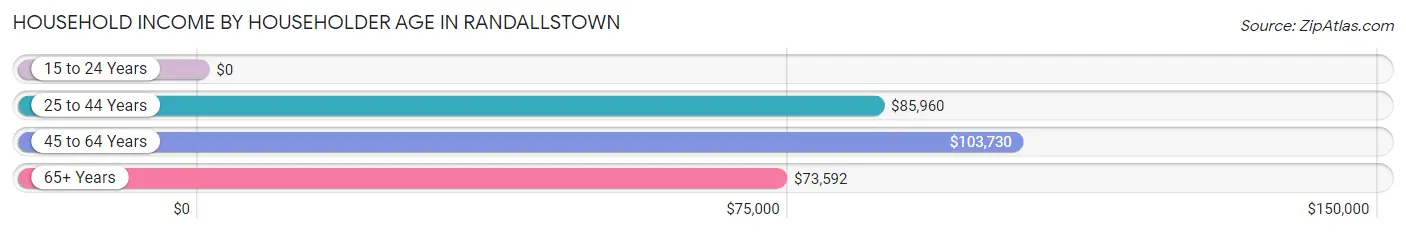
| Income Bracket | # Households | Median Income |
| 15 to 24 Years | 66 (0.5%) | $0 |
| 25 to 44 Years | 2,976 (22.0%) | $85,960 |
| 45 to 64 Years | 6,137 (45.4%) | $103,730 |
| 65+ Years | 4,351 (32.2%) | $73,592 |
| Total | 13,530 (100.0%) | $89,484 |
Poverty in Randallstown
Income Below Poverty by Sex and Age in Randallstown
With 9.6% poverty level for males and 10.2% for females among the residents of Randallstown, 5 year old males and 6 to 11 year old females are the most vulnerable to poverty, with 28 males (100.0%) and 243 females (24.3%) in their respective age groups living below the poverty level.
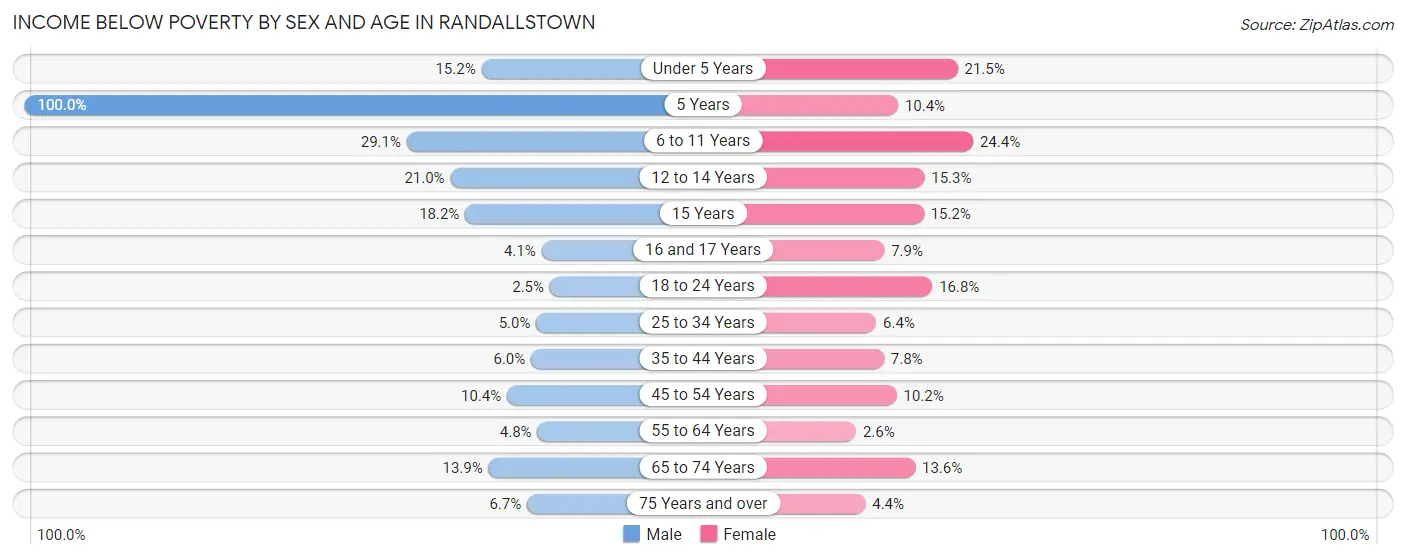
| Age Bracket | Male | Female |
| Under 5 Years | 109 (15.2%) | 168 (21.5%) |
| 5 Years | 28 (100.0%) | 35 (10.4%) |
| 6 to 11 Years | 238 (29.1%) | 243 (24.3%) |
| 12 to 14 Years | 161 (21.0%) | 139 (15.3%) |
| 15 Years | 45 (18.2%) | 19 (15.2%) |
| 16 and 17 Years | 17 (4.1%) | 45 (7.9%) |
| 18 to 24 Years | 43 (2.5%) | 243 (16.8%) |
| 25 to 34 Years | 91 (5.0%) | 108 (6.4%) |
| 35 to 44 Years | 96 (6.0%) | 191 (7.8%) |
| 45 to 54 Years | 253 (10.4%) | 301 (10.2%) |
| 55 to 64 Years | 121 (4.8%) | 85 (2.6%) |
| 65 to 74 Years | 276 (13.9%) | 358 (13.6%) |
| 75 Years and over | 68 (6.7%) | 70 (4.4%) |
| Total | 1,546 (9.6%) | 2,005 (10.2%) |
Income Above Poverty by Sex and Age in Randallstown
According to the poverty statistics in Randallstown, males aged 18 to 24 years and females aged 55 to 64 years are the age groups that are most secure financially, with 97.5% of males and 97.4% of females in these age groups living above the poverty line.
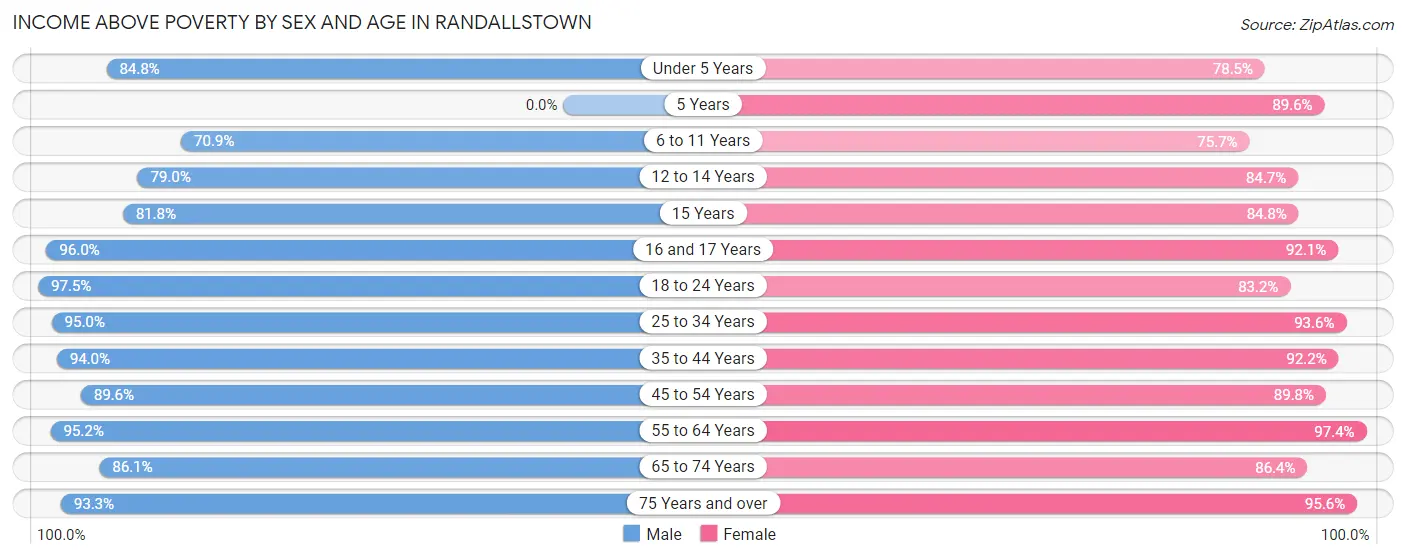
| Age Bracket | Male | Female |
| Under 5 Years | 608 (84.8%) | 614 (78.5%) |
| 5 Years | 0 (0.0%) | 301 (89.6%) |
| 6 to 11 Years | 581 (70.9%) | 755 (75.6%) |
| 12 to 14 Years | 607 (79.0%) | 769 (84.7%) |
| 15 Years | 202 (81.8%) | 106 (84.8%) |
| 16 and 17 Years | 403 (96.0%) | 526 (92.1%) |
| 18 to 24 Years | 1,676 (97.5%) | 1,205 (83.2%) |
| 25 to 34 Years | 1,722 (95.0%) | 1,585 (93.6%) |
| 35 to 44 Years | 1,510 (94.0%) | 2,258 (92.2%) |
| 45 to 54 Years | 2,171 (89.6%) | 2,661 (89.8%) |
| 55 to 64 Years | 2,394 (95.2%) | 3,143 (97.4%) |
| 65 to 74 Years | 1,713 (86.1%) | 2,276 (86.4%) |
| 75 Years and over | 941 (93.3%) | 1,536 (95.6%) |
| Total | 14,528 (90.4%) | 17,735 (89.8%) |
Income Below Poverty Among Married-Couple Families in Randallstown
The poverty statistics for married-couple families in Randallstown show that 5.2% or 298 of the total 5,701 families live below the poverty line. Families with 3 or 4 children have the highest poverty rate of 31.4%, comprising of 149 families. On the other hand, families with 5 or more children have the lowest poverty rate of 0.0%, which includes 0 families.
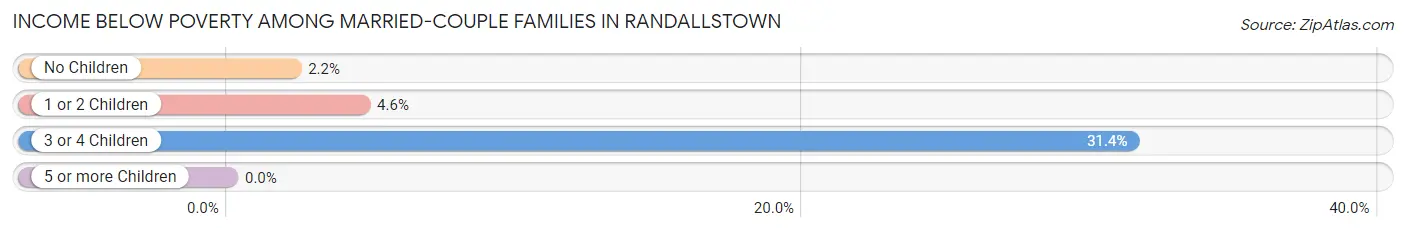
| Children | Above Poverty | Below Poverty |
| No Children | 3,596 (97.8%) | 81 (2.2%) |
| 1 or 2 Children | 1,409 (95.4%) | 68 (4.6%) |
| 3 or 4 Children | 326 (68.6%) | 149 (31.4%) |
| 5 or more Children | 72 (100.0%) | 0 (0.0%) |
| Total | 5,403 (94.8%) | 298 (5.2%) |
Income Below Poverty Among Single-Parent Households in Randallstown
According to the poverty data in Randallstown, 2.9% or 14 single-father households and 10.4% or 279 single-mother households are living below the poverty line. Among single-father households, those with 1 or 2 children have the highest poverty rate, with 14 households (10.2%) experiencing poverty. Likewise, among single-mother households, those with 3 or 4 children have the highest poverty rate, with 125 households (60.1%) falling below the poverty line.
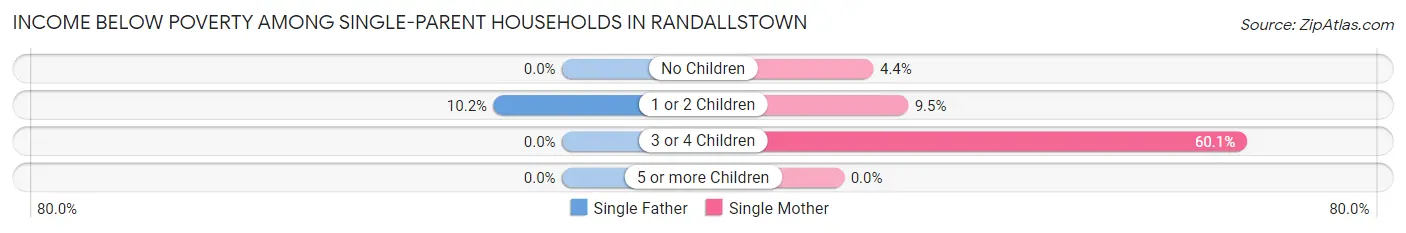
| Children | Single Father | Single Mother |
| No Children | 0 (0.0%) | 68 (4.4%) |
| 1 or 2 Children | 14 (10.2%) | 86 (9.5%) |
| 3 or 4 Children | 0 (0.0%) | 125 (60.1%) |
| 5 or more Children | 0 (0.0%) | 0 (0.0%) |
| Total | 14 (2.9%) | 279 (10.4%) |
Income Below Poverty Among Married-Couple vs Single-Parent Households in Randallstown
The poverty data for Randallstown shows that 298 of the married-couple family households (5.2%) and 293 of the single-parent households (9.3%) are living below the poverty level. Within the married-couple family households, those with 3 or 4 children have the highest poverty rate, with 149 households (31.4%) falling below the poverty line. Among the single-parent households, those with 3 or 4 children have the highest poverty rate, with 125 household (55.1%) living below poverty.
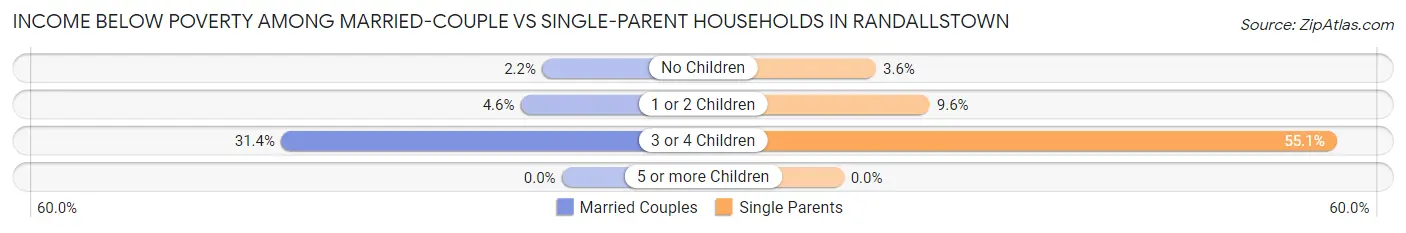
| Children | Married-Couple Families | Single-Parent Households |
| No Children | 81 (2.2%) | 68 (3.6%) |
| 1 or 2 Children | 68 (4.6%) | 100 (9.6%) |
| 3 or 4 Children | 149 (31.4%) | 125 (55.1%) |
| 5 or more Children | 0 (0.0%) | 0 (0.0%) |
| Total | 298 (5.2%) | 293 (9.3%) |
Race in Randallstown
The most populous races in Randallstown are Black / African American (28,614 | 79.0%), White / Caucasian (4,881 | 13.5%), and Hispanic or Latino (1,466 | 4.1%).
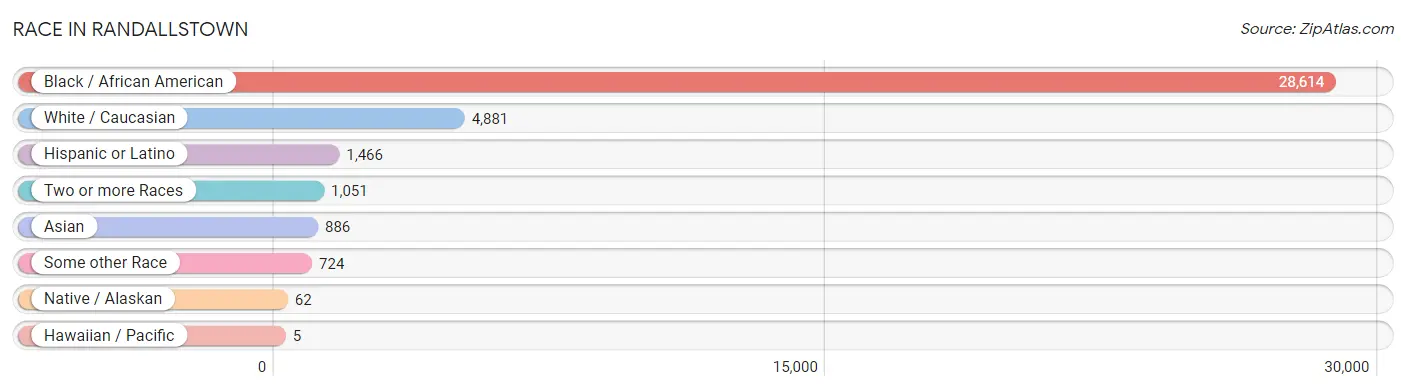
| Race | # Population | % Population |
| Asian | 886 | 2.5% |
| Black / African American | 28,614 | 79.0% |
| Hawaiian / Pacific | 5 | 0.0% |
| Hispanic or Latino | 1,466 | 4.1% |
| Native / Alaskan | 62 | 0.2% |
| White / Caucasian | 4,881 | 13.5% |
| Two or more Races | 1,051 | 2.9% |
| Some other Race | 724 | 2.0% |
| Total | 36,223 | 100.0% |
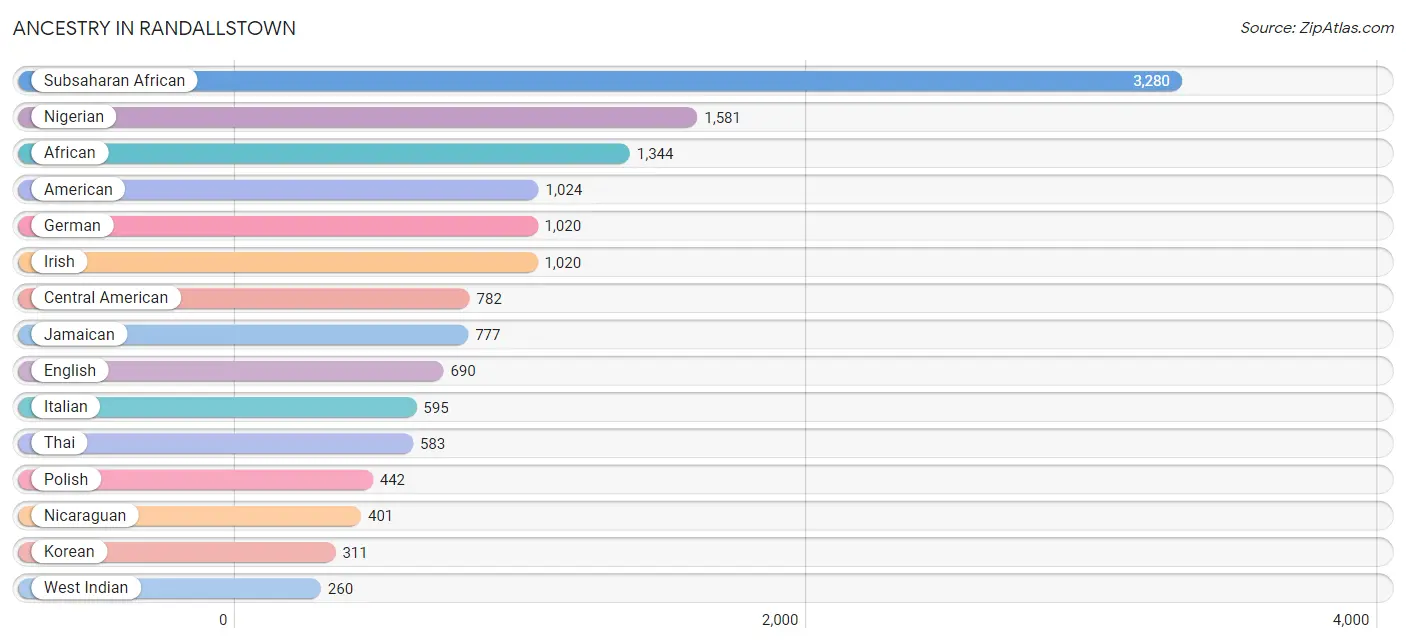
Ancestry in Randallstown
The most populous ancestries reported in Randallstown are Subsaharan African (3,280 | 9.1%), Nigerian (1,581 | 4.4%), African (1,344 | 3.7%), American (1,024 | 2.8%), and German (1,020 | 2.8%), together accounting for 22.8% of all Randallstown residents.
| Ancestry | # Population | % Population |
| African | 1,344 | 3.7% |
| American | 1,024 | 2.8% |
| Arab | 187 | 0.5% |
| Armenian | 21 | 0.1% |
| Austrian | 24 | 0.1% |
| Belgian | 29 | 0.1% |
| British | 55 | 0.2% |
| British West Indian | 31 | 0.1% |
| Burmese | 48 | 0.1% |
| Central American | 782 | 2.2% |
| Cherokee | 76 | 0.2% |
| Croatian | 22 | 0.1% |
| Czech | 10 | 0.0% |
| Czechoslovakian | 27 | 0.1% |
| Danish | 16 | 0.0% |
| Dutch | 12 | 0.0% |
| Eastern European | 54 | 0.2% |
| Ecuadorian | 220 | 0.6% |
| Egyptian | 187 | 0.5% |
| English | 690 | 1.9% |
| Ethiopian | 55 | 0.2% |
| European | 144 | 0.4% |
| Finnish | 62 | 0.2% |
| French | 225 | 0.6% |
| French Canadian | 2 | 0.0% |
| German | 1,020 | 2.8% |
| Ghanaian | 42 | 0.1% |
| Greek | 26 | 0.1% |
| Guamanian / Chamorro | 5 | 0.0% |
| Guatemalan | 146 | 0.4% |
| Haitian | 166 | 0.5% |
| Honduran | 36 | 0.1% |
| Hungarian | 54 | 0.2% |
| Indian (Asian) | 44 | 0.1% |
| Iranian | 58 | 0.2% |
| Irish | 1,020 | 2.8% |
| Israeli | 4 | 0.0% |
| Italian | 595 | 1.6% |
| Jamaican | 777 | 2.1% |
| Kenyan | 94 | 0.3% |
| Korean | 311 | 0.9% |
| Liberian | 29 | 0.1% |
| Lithuanian | 50 | 0.1% |
| Mexican | 185 | 0.5% |
| Nicaraguan | 401 | 1.1% |
| Nigerian | 1,581 | 4.4% |
| Northern European | 25 | 0.1% |
| Norwegian | 21 | 0.1% |
| Panamanian | 106 | 0.3% |
| Paraguayan | 23 | 0.1% |
| Peruvian | 16 | 0.0% |
| Polish | 442 | 1.2% |
| Portuguese | 8 | 0.0% |
| Potawatomi | 11 | 0.0% |
| Puerto Rican | 224 | 0.6% |
| Russian | 245 | 0.7% |
| Salvadoran | 93 | 0.3% |
| Scandinavian | 64 | 0.2% |
| Scotch-Irish | 160 | 0.4% |
| Scottish | 41 | 0.1% |
| Senegalese | 8 | 0.0% |
| South American | 259 | 0.7% |
| Sri Lankan | 37 | 0.1% |
| Subsaharan African | 3,280 | 9.1% |
| Swiss | 23 | 0.1% |
| Thai | 583 | 1.6% |
| Trinidadian and Tobagonian | 99 | 0.3% |
| Turkish | 15 | 0.0% |
| U.S. Virgin Islander | 64 | 0.2% |
| Welsh | 22 | 0.1% |
| West Indian | 260 | 0.7% | View All 71 Rows |
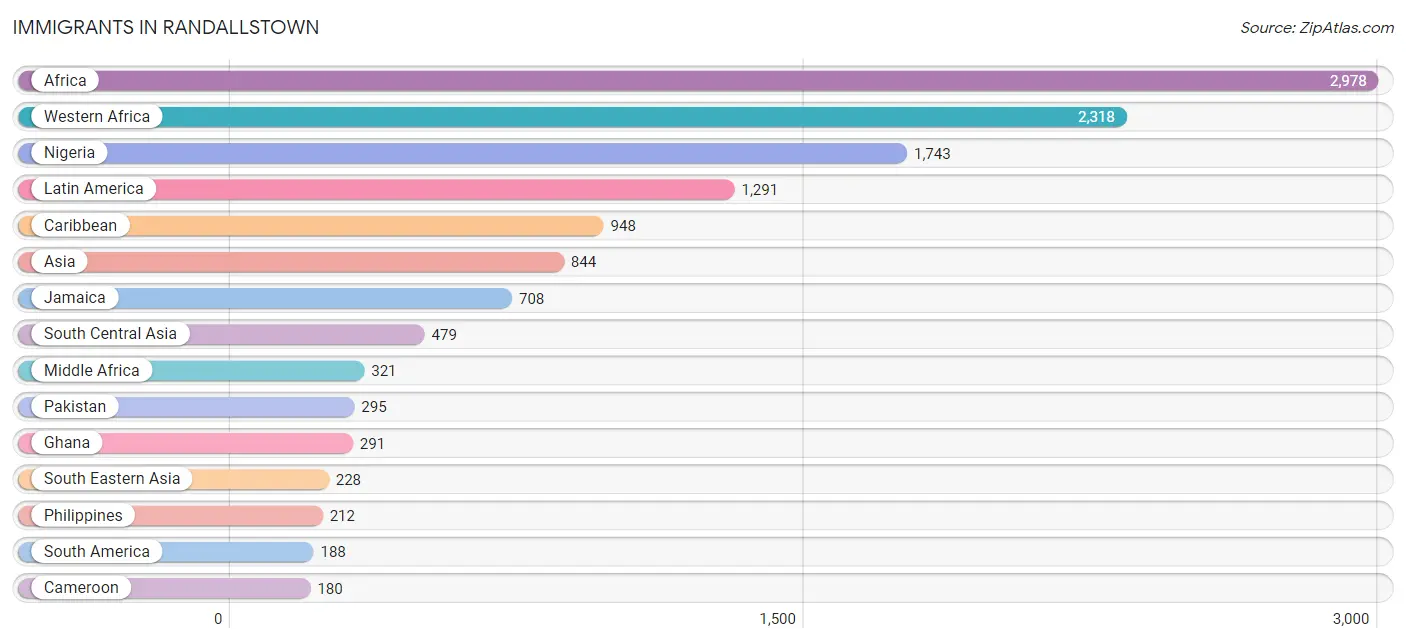
Immigrants in Randallstown
The most numerous immigrant groups reported in Randallstown came from Africa (2,978 | 8.2%), Western Africa (2,318 | 6.4%), Nigeria (1,743 | 4.8%), Latin America (1,291 | 3.6%), and Caribbean (948 | 2.6%), together accounting for 25.6% of all Randallstown residents.
| Immigration Origin | # Population | % Population |
| Africa | 2,978 | 8.2% |
| Asia | 844 | 2.3% |
| Brazil | 7 | 0.0% |
| Cameroon | 180 | 0.5% |
| Canada | 12 | 0.0% |
| Caribbean | 948 | 2.6% |
| Central America | 155 | 0.4% |
| China | 63 | 0.2% |
| Eastern Africa | 171 | 0.5% |
| Eastern Asia | 111 | 0.3% |
| Eastern Europe | 53 | 0.2% |
| Ecuador | 158 | 0.4% |
| Egypt | 129 | 0.4% |
| El Salvador | 23 | 0.1% |
| Europe | 115 | 0.3% |
| France | 42 | 0.1% |
| Germany | 7 | 0.0% |
| Ghana | 291 | 0.8% |
| Greece | 13 | 0.0% |
| Grenada | 6 | 0.0% |
| Guatemala | 12 | 0.0% |
| Haiti | 119 | 0.3% |
| Honduras | 36 | 0.1% |
| India | 58 | 0.2% |
| Iran | 58 | 0.2% |
| Israel | 4 | 0.0% |
| Jamaica | 708 | 1.9% |
| Kenya | 99 | 0.3% |
| Korea | 48 | 0.1% |
| Latin America | 1,291 | 3.6% |
| Liberia | 141 | 0.4% |
| Mexico | 18 | 0.1% |
| Middle Africa | 321 | 0.9% |
| Morocco | 18 | 0.1% |
| Nicaragua | 20 | 0.1% |
| Nigeria | 1,743 | 4.8% |
| Northern Africa | 147 | 0.4% |
| Pakistan | 295 | 0.8% |
| Panama | 46 | 0.1% |
| Philippines | 212 | 0.6% |
| Russia | 34 | 0.1% |
| South America | 188 | 0.5% |
| South Central Asia | 479 | 1.3% |
| South Eastern Asia | 228 | 0.6% |
| Southern Europe | 13 | 0.0% |
| Sri Lanka | 68 | 0.2% |
| Trinidad and Tobago | 115 | 0.3% |
| Vietnam | 16 | 0.0% |
| Western Africa | 2,318 | 6.4% |
| Western Asia | 26 | 0.1% |
| Western Europe | 49 | 0.1% |
| Zaire | 141 | 0.4% | View All 52 Rows |
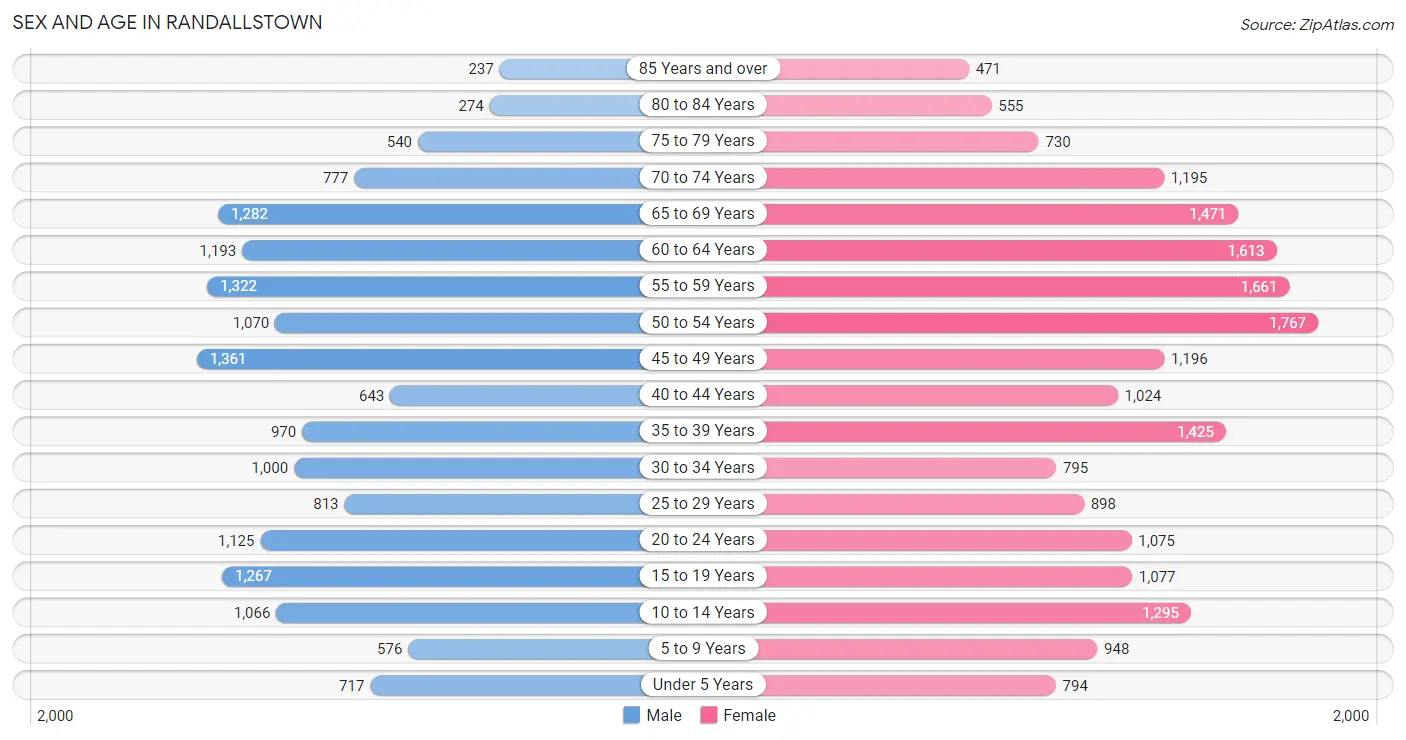
Sex and Age in Randallstown
Sex and Age in Randallstown
The most populous age groups in Randallstown are 45 to 49 Years (1,361 | 8.4%) for men and 50 to 54 Years (1,767 | 8.8%) for women.
| Age Bracket | Male | Female |
| Under 5 Years | 717 (4.4%) | 794 (4.0%) |
| 5 to 9 Years | 576 (3.5%) | 948 (4.7%) |
| 10 to 14 Years | 1,066 (6.6%) | 1,295 (6.5%) |
| 15 to 19 Years | 1,267 (7.8%) | 1,077 (5.4%) |
| 20 to 24 Years | 1,125 (6.9%) | 1,075 (5.4%) |
| 25 to 29 Years | 813 (5.0%) | 898 (4.5%) |
| 30 to 34 Years | 1,000 (6.2%) | 795 (4.0%) |
| 35 to 39 Years | 970 (6.0%) | 1,425 (7.1%) |
| 40 to 44 Years | 643 (4.0%) | 1,024 (5.1%) |
| 45 to 49 Years | 1,361 (8.4%) | 1,196 (6.0%) |
| 50 to 54 Years | 1,070 (6.6%) | 1,767 (8.8%) |
| 55 to 59 Years | 1,322 (8.1%) | 1,661 (8.3%) |
| 60 to 64 Years | 1,193 (7.3%) | 1,613 (8.1%) |
| 65 to 69 Years | 1,282 (7.9%) | 1,471 (7.4%) |
| 70 to 74 Years | 777 (4.8%) | 1,195 (6.0%) |
| 75 to 79 Years | 540 (3.3%) | 730 (3.6%) |
| 80 to 84 Years | 274 (1.7%) | 555 (2.8%) |
| 85 Years and over | 237 (1.5%) | 471 (2.4%) |
| Total | 16,233 (100.0%) | 19,990 (100.0%) |
Families and Households in Randallstown
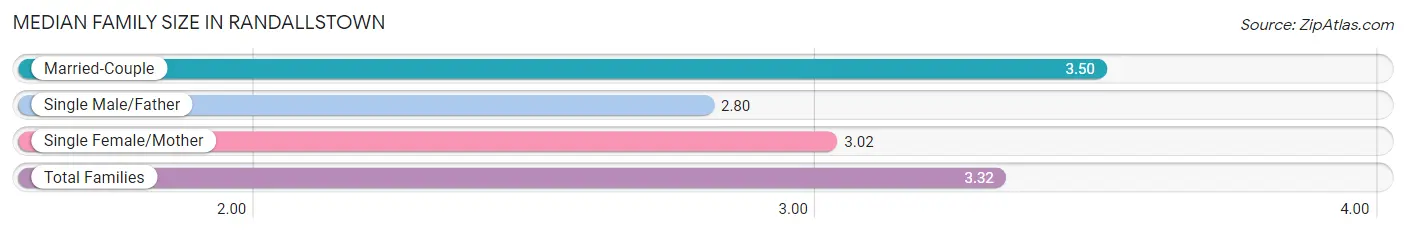
Median Family Size in Randallstown
The median family size in Randallstown is 3.32 persons per family, with married-couple families (5,701 | 64.3%) accounting for the largest median family size of 3.5 persons per family. On the other hand, single male/father families (483 | 5.4%) represent the smallest median family size with 2.80 persons per family.
| Family Type | # Families | Family Size |
| Married-Couple | 5,701 (64.3%) | 3.50 |
| Single Male/Father | 483 (5.4%) | 2.80 |
| Single Female/Mother | 2,679 (30.2%) | 3.02 |
| Total Families | 8,863 (100.0%) | 3.32 |
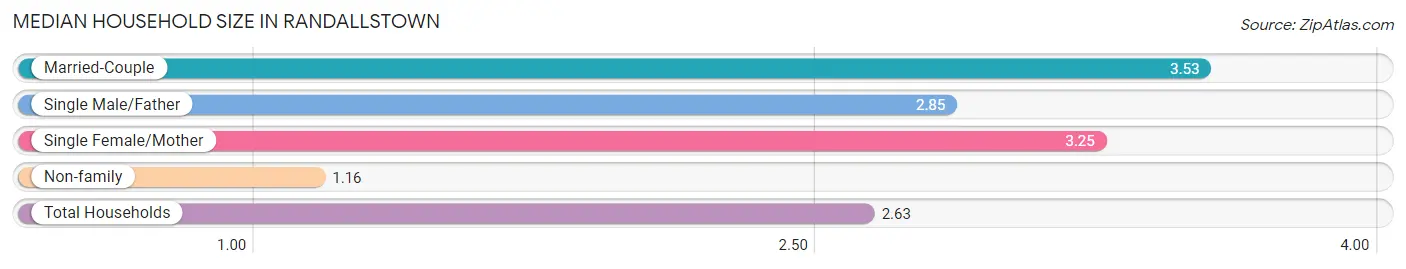
Median Household Size in Randallstown
The median household size in Randallstown is 2.63 persons per household, with married-couple households (5,701 | 42.1%) accounting for the largest median household size of 3.53 persons per household. non-family households (4,667 | 34.5%) represent the smallest median household size with 1.16 persons per household.
| Household Type | # Households | Household Size |
| Married-Couple | 5,701 (42.1%) | 3.53 |
| Single Male/Father | 483 (3.6%) | 2.85 |
| Single Female/Mother | 2,679 (19.8%) | 3.25 |
| Non-family | 4,667 (34.5%) | 1.16 |
| Total Households | 13,530 (100.0%) | 2.63 |
Household Size by Marriage Status in Randallstown
Out of a total of 13,530 households in Randallstown, 8,863 (65.5%) are family households, while 4,667 (34.5%) are nonfamily households. The most numerous type of family households are 2-person households, comprising 3,614, and the most common type of nonfamily households are 1-person households, comprising 3,904.
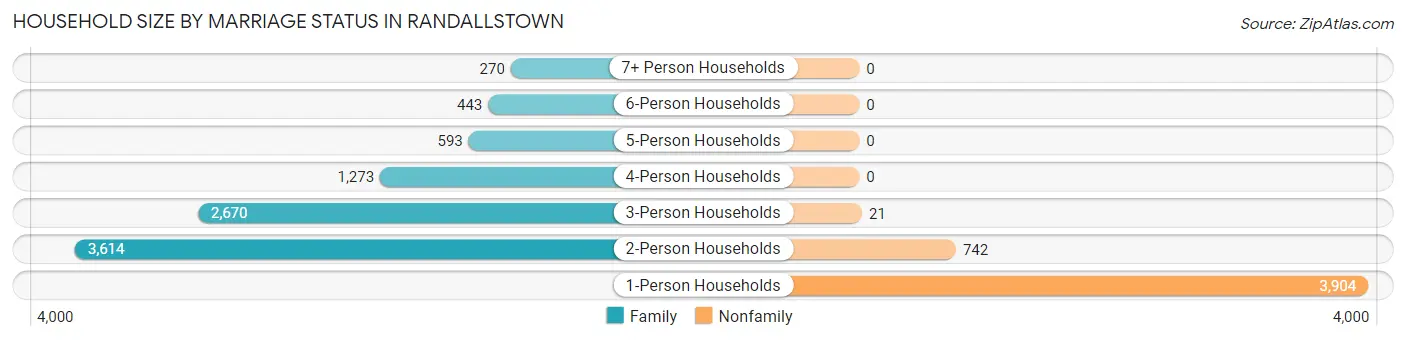
| Household Size | Family Households | Nonfamily Households |
| 1-Person Households | - | 3,904 (28.8%) |
| 2-Person Households | 3,614 (26.7%) | 742 (5.5%) |
| 3-Person Households | 2,670 (19.7%) | 21 (0.2%) |
| 4-Person Households | 1,273 (9.4%) | 0 (0.0%) |
| 5-Person Households | 593 (4.4%) | 0 (0.0%) |
| 6-Person Households | 443 (3.3%) | 0 (0.0%) |
| 7+ Person Households | 270 (2.0%) | 0 (0.0%) |
| Total | 8,863 (65.5%) | 4,667 (34.5%) |
Female Fertility in Randallstown
Fertility by Age in Randallstown
Average fertility rate in Randallstown is 46.0 births per 1,000 women. Women in the age bracket of 20 to 34 years have the highest fertility rate with 55.0 births per 1,000 women. Women in the age bracket of 35 to 50 years acount for 58.4% of all women with births.
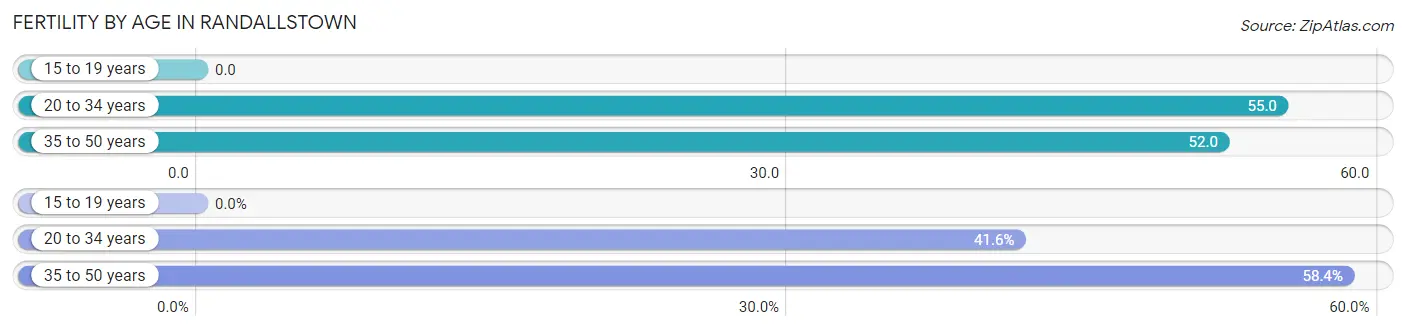
| Age Bracket | Women with Births | Births / 1,000 Women |
| 15 to 19 years | 0 (0.0%) | 0.0 |
| 20 to 34 years | 152 (41.6%) | 55.0 |
| 35 to 50 years | 213 (58.4%) | 52.0 |
| Total | 365 (100.0%) | 46.0 |
Fertility by Age by Marriage Status in Randallstown
70.4% of women with births (365) in Randallstown are married. The highest percentage of unmarried women with births falls into 20 to 34 years age bracket with 47.4% of them unmarried at the time of birth, while the lowest percentage of unmarried women with births belong to 35 to 50 years age bracket with 16.9% of them unmarried.
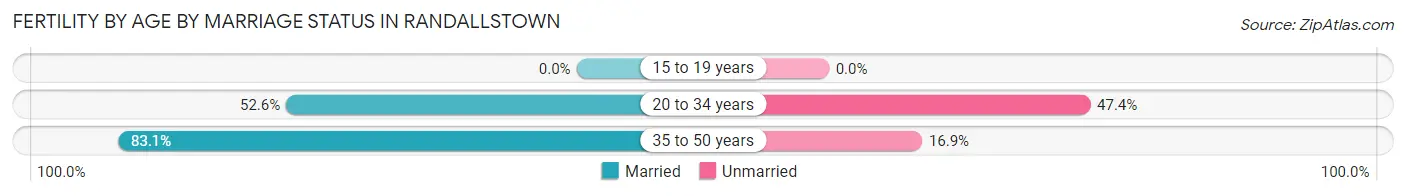
| Age Bracket | Married | Unmarried |
| 15 to 19 years | 0 (0.0%) | 0 (0.0%) |
| 20 to 34 years | 80 (52.6%) | 72 (47.4%) |
| 35 to 50 years | 177 (83.1%) | 36 (16.9%) |
| Total | 257 (70.4%) | 108 (29.6%) |
Fertility by Education in Randallstown
Average fertility rate in Randallstown is 46.0 births per 1,000 women. Women with the education attainment of high school diploma have the highest fertility rate of 77.0 births per 1,000 women, while women with the education attainment of less than high school have the lowest fertility at 12.0 births per 1,000 women. Women with the education attainment of high school diploma represent 37.5% of all women with births.
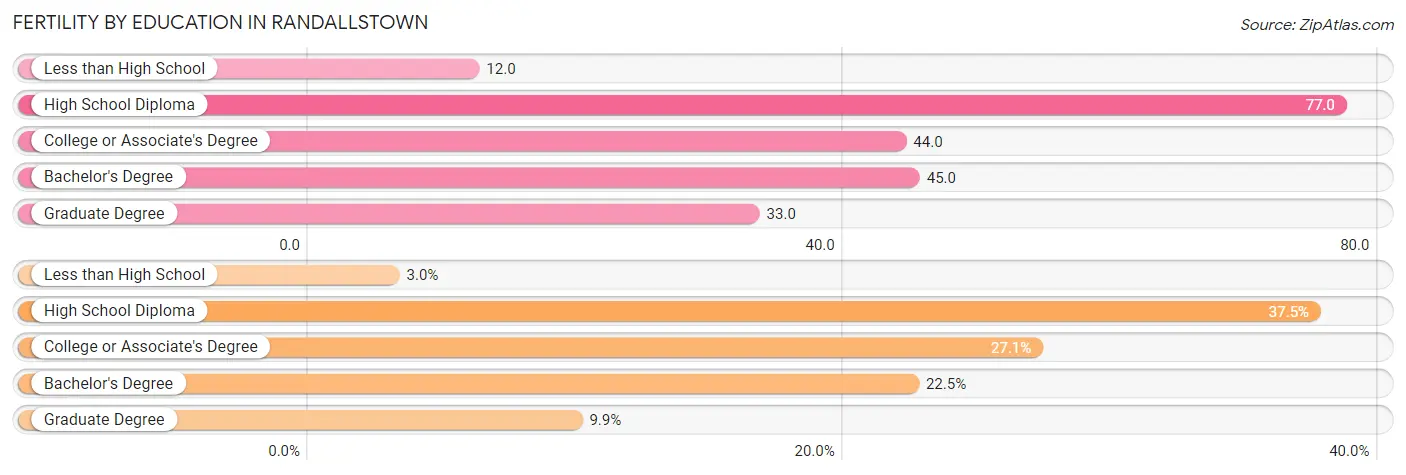
| Educational Attainment | Women with Births | Births / 1,000 Women |
| Less than High School | 11 (3.0%) | 12.0 |
| High School Diploma | 137 (37.5%) | 77.0 |
| College or Associate's Degree | 99 (27.1%) | 44.0 |
| Bachelor's Degree | 82 (22.5%) | 45.0 |
| Graduate Degree | 36 (9.9%) | 33.0 |
| Total | 365 (100.0%) | 46.0 |
Fertility by Education by Marriage Status in Randallstown
29.6% of women with births in Randallstown are unmarried. Women with the educational attainment of less than high school are most likely to be married with 100.0% of them married at childbirth, while women with the educational attainment of graduate degree are least likely to be married with 100.0% of them unmarried at childbirth.
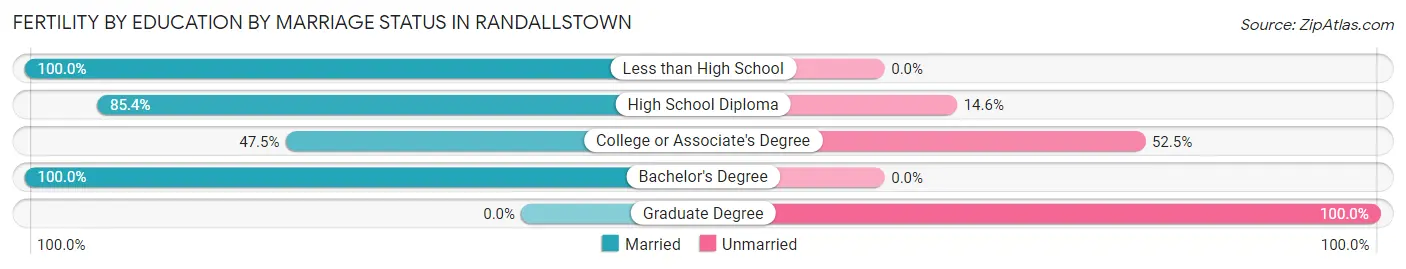
| Educational Attainment | Married | Unmarried |
| Less than High School | 11 (100.0%) | 0 (0.0%) |
| High School Diploma | 117 (85.4%) | 20 (14.6%) |
| College or Associate's Degree | 47 (47.5%) | 52 (52.5%) |
| Bachelor's Degree | 82 (100.0%) | 0 (0.0%) |
| Graduate Degree | 0 (0.0%) | 36 (100.0%) |
| Total | 257 (70.4%) | 108 (29.6%) |
Employment Characteristics in Randallstown
Employment by Class of Employer in Randallstown
Among the 18,285 employed individuals in Randallstown, private company employees (10,009 | 54.7%), not-for-profit organizations (2,232 | 12.2%), and local government employees (1,765 | 9.7%) make up the most common classes of employment.
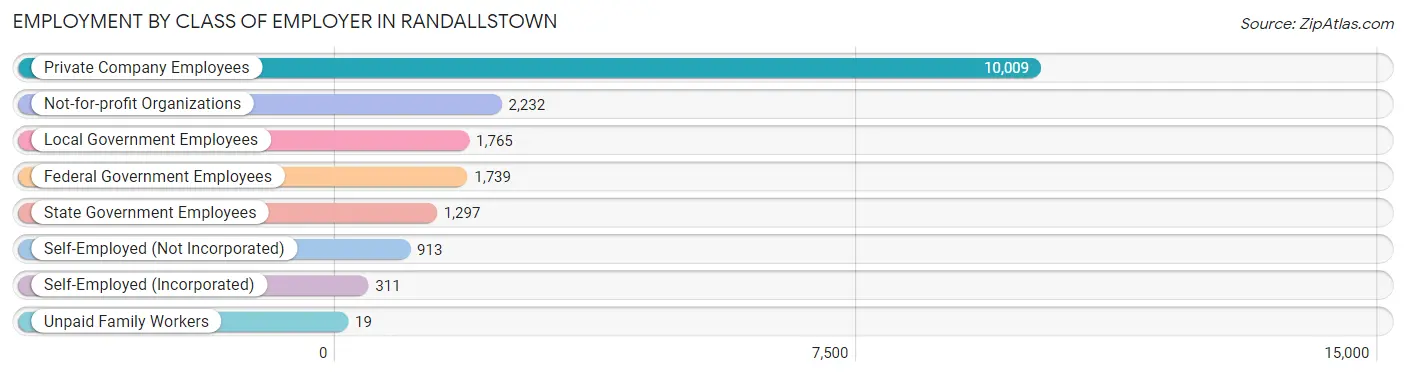
| Employer Class | # Employees | % Employees |
| Private Company Employees | 10,009 | 54.7% |
| Self-Employed (Incorporated) | 311 | 1.7% |
| Self-Employed (Not Incorporated) | 913 | 5.0% |
| Not-for-profit Organizations | 2,232 | 12.2% |
| Local Government Employees | 1,765 | 9.7% |
| State Government Employees | 1,297 | 7.1% |
| Federal Government Employees | 1,739 | 9.5% |
| Unpaid Family Workers | 19 | 0.1% |
| Total | 18,285 | 100.0% |
Employment Status by Age in Randallstown
According to the labor force statistics for Randallstown, out of the total population over 16 years of age (30,455), 65.3% or 19,887 individuals are in the labor force, with 6.6% or 1,313 of them unemployed. The age group with the highest labor force participation rate is 35 to 44 years, with 89.7% or 3,644 individuals in the labor force. Within the labor force, the 20 to 24 years age range has the highest percentage of unemployed individuals, with 18.0% or 352 of them being unemployed.
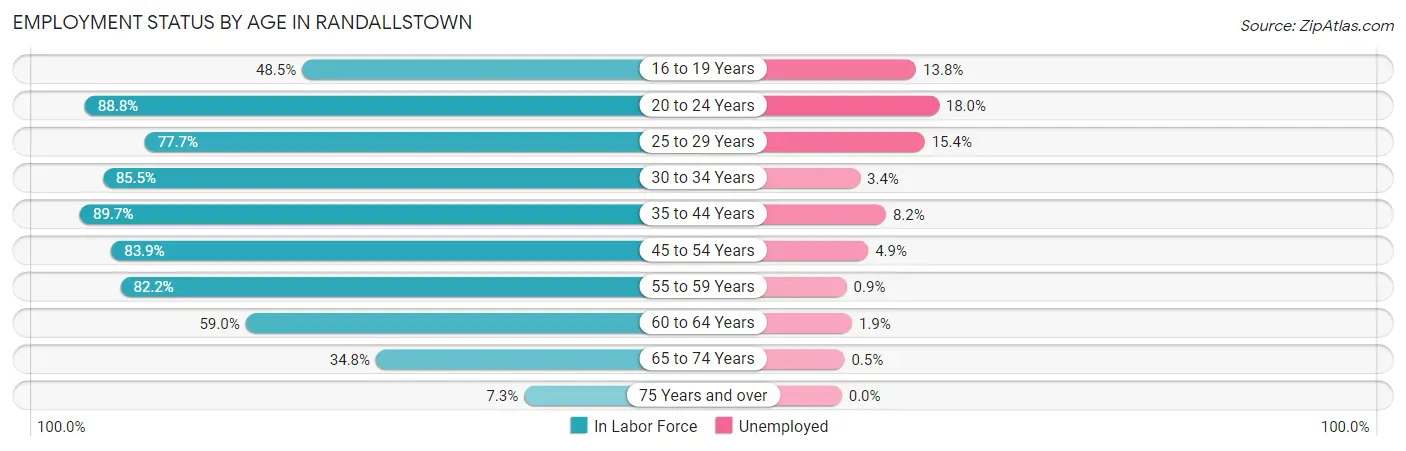
| Age Bracket | In Labor Force | Unemployed |
| 16 to 19 Years | 956 (48.5%) | 132 (13.8%) |
| 20 to 24 Years | 1,954 (88.8%) | 352 (18.0%) |
| 25 to 29 Years | 1,329 (77.7%) | 205 (15.4%) |
| 30 to 34 Years | 1,535 (85.5%) | 52 (3.4%) |
| 35 to 44 Years | 3,644 (89.7%) | 299 (8.2%) |
| 45 to 54 Years | 4,526 (83.9%) | 222 (4.9%) |
| 55 to 59 Years | 2,452 (82.2%) | 22 (0.9%) |
| 60 to 64 Years | 1,656 (59.0%) | 31 (1.9%) |
| 65 to 74 Years | 1,644 (34.8%) | 8 (0.5%) |
| 75 Years and over | 205 (7.3%) | 0 (0.0%) |
| Total | 19,887 (65.3%) | 1,313 (6.6%) |
Employment Status by Educational Attainment in Randallstown
According to labor force statistics for Randallstown, 80.7% of individuals (15,132) out of the total population between 25 and 64 years of age (18,751) are in the labor force, with 5.5% or 832 of them being unemployed. The group with the highest labor force participation rate are those with the educational attainment of bachelor's degree or higher, with 88.5% or 6,206 individuals in the labor force. Within the labor force, individuals with less than high school education have the highest percentage of unemployment, with 20.0% or 149 of them being unemployed.
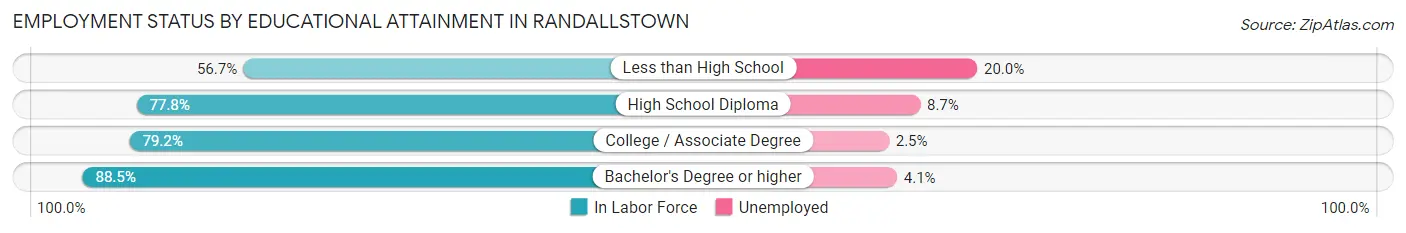
| Educational Attainment | In Labor Force | Unemployed |
| Less than High School | 745 (56.7%) | 263 (20.0%) |
| High School Diploma | 3,639 (77.8%) | 407 (8.7%) |
| College / Associate Degree | 4,552 (79.2%) | 144 (2.5%) |
| Bachelor's Degree or higher | 6,206 (88.5%) | 287 (4.1%) |
| Total | 15,132 (80.7%) | 1,031 (5.5%) |
Employment Occupations by Sex in Randallstown
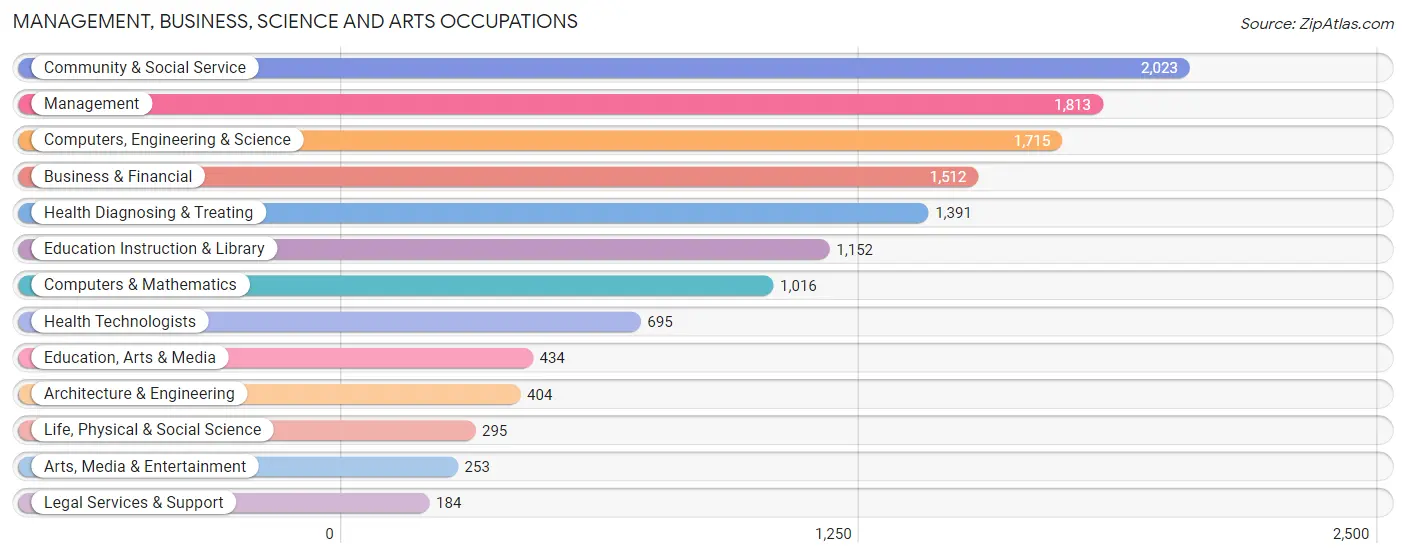
Management, Business, Science and Arts Occupations
The most common Management, Business, Science and Arts occupations in Randallstown are Community & Social Service (2,023 | 10.9%), Management (1,813 | 9.8%), Computers, Engineering & Science (1,715 | 9.2%), Business & Financial (1,512 | 8.2%), and Health Diagnosing & Treating (1,391 | 7.5%).
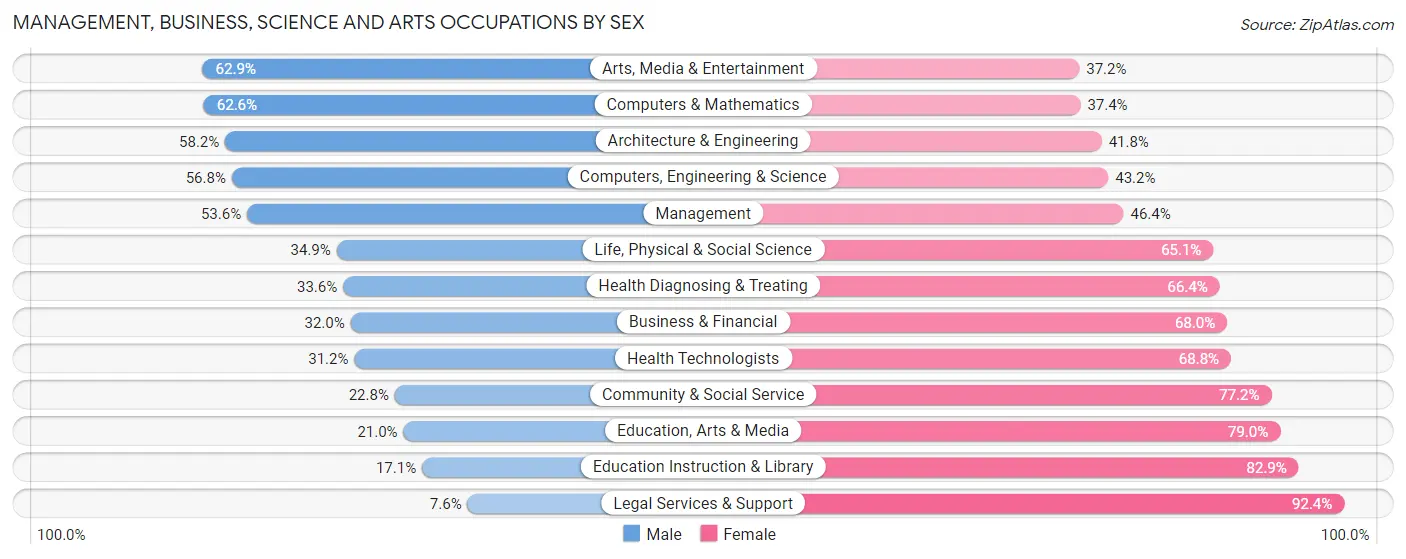
Management, Business, Science and Arts Occupations by Sex
Within the Management, Business, Science and Arts occupations in Randallstown, the most male-oriented occupations are Arts, Media & Entertainment (62.8%), Computers & Mathematics (62.6%), and Architecture & Engineering (58.2%), while the most female-oriented occupations are Legal Services & Support (92.4%), Education Instruction & Library (82.9%), and Education, Arts & Media (79.0%).
| Occupation | Male | Female |
| Management | 972 (53.6%) | 841 (46.4%) |
| Business & Financial | 484 (32.0%) | 1,028 (68.0%) |
| Computers, Engineering & Science | 974 (56.8%) | 741 (43.2%) |
| Computers & Mathematics | 636 (62.6%) | 380 (37.4%) |
| Architecture & Engineering | 235 (58.2%) | 169 (41.8%) |
| Life, Physical & Social Science | 103 (34.9%) | 192 (65.1%) |
| Community & Social Service | 461 (22.8%) | 1,562 (77.2%) |
| Education, Arts & Media | 91 (21.0%) | 343 (79.0%) |
| Legal Services & Support | 14 (7.6%) | 170 (92.4%) |
| Education Instruction & Library | 197 (17.1%) | 955 (82.9%) |
| Arts, Media & Entertainment | 159 (62.8%) | 94 (37.1%) |
| Health Diagnosing & Treating | 467 (33.6%) | 924 (66.4%) |
| Health Technologists | 217 (31.2%) | 478 (68.8%) |
| Total (Category) | 3,358 (39.7%) | 5,096 (60.3%) |
| Total (Overall) | 8,367 (45.1%) | 10,193 (54.9%) |
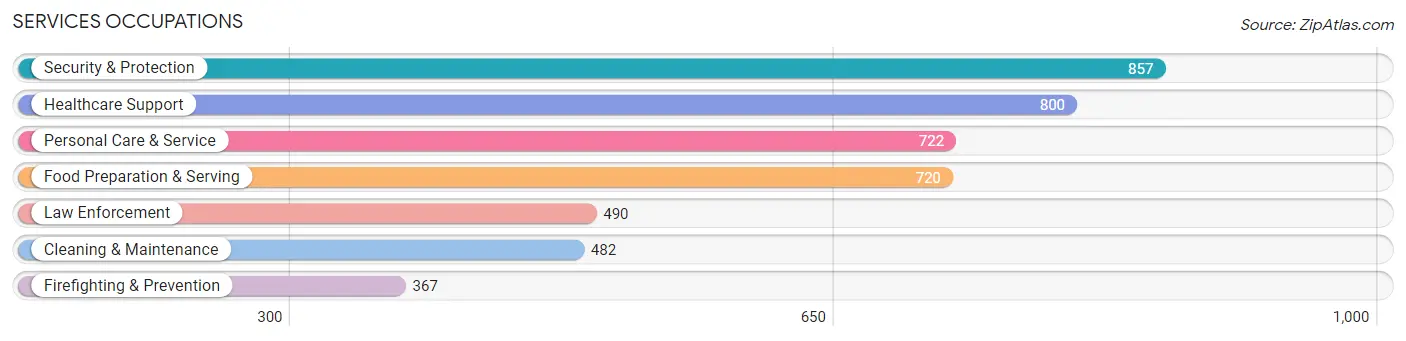
Services Occupations
The most common Services occupations in Randallstown are Security & Protection (857 | 4.6%), Healthcare Support (800 | 4.3%), Personal Care & Service (722 | 3.9%), Food Preparation & Serving (720 | 3.9%), and Law Enforcement (490 | 2.6%).
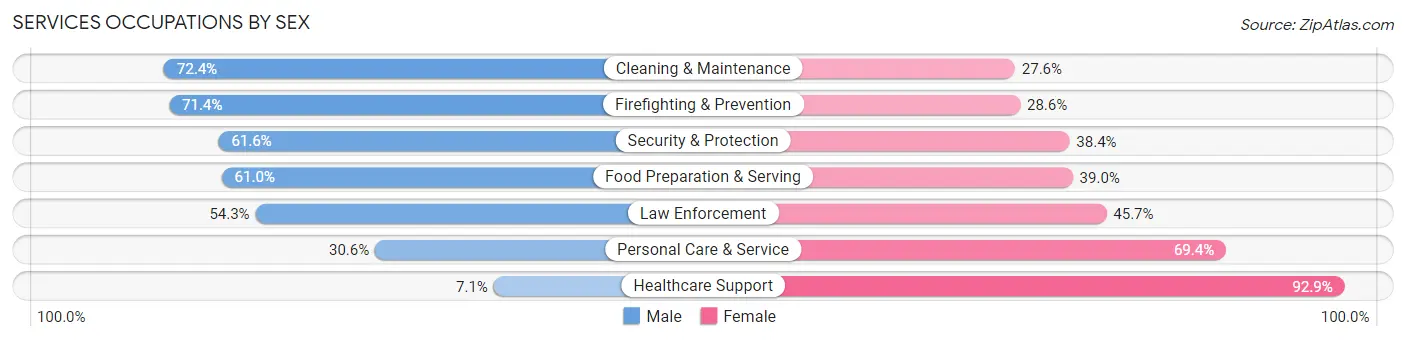
Services Occupations by Sex
Within the Services occupations in Randallstown, the most male-oriented occupations are Cleaning & Maintenance (72.4%), Firefighting & Prevention (71.4%), and Security & Protection (61.6%), while the most female-oriented occupations are Healthcare Support (92.9%), Personal Care & Service (69.4%), and Law Enforcement (45.7%).
| Occupation | Male | Female |
| Healthcare Support | 57 (7.1%) | 743 (92.9%) |
| Security & Protection | 528 (61.6%) | 329 (38.4%) |
| Firefighting & Prevention | 262 (71.4%) | 105 (28.6%) |
| Law Enforcement | 266 (54.3%) | 224 (45.7%) |
| Food Preparation & Serving | 439 (61.0%) | 281 (39.0%) |
| Cleaning & Maintenance | 349 (72.4%) | 133 (27.6%) |
| Personal Care & Service | 221 (30.6%) | 501 (69.4%) |
| Total (Category) | 1,594 (44.5%) | 1,987 (55.5%) |
| Total (Overall) | 8,367 (45.1%) | 10,193 (54.9%) |
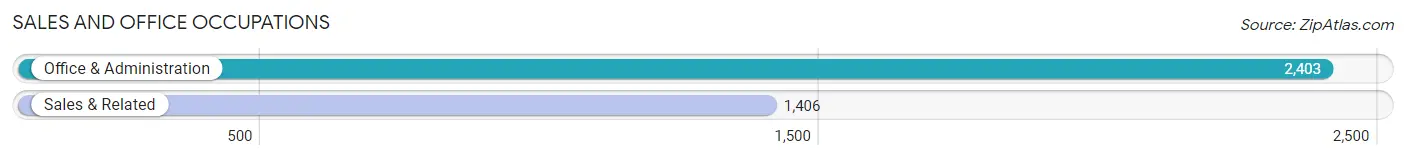
Sales and Office Occupations
The most common Sales and Office occupations in Randallstown are Office & Administration (2,403 | 13.0%), and Sales & Related (1,406 | 7.6%).
Sales and Office Occupations by Sex
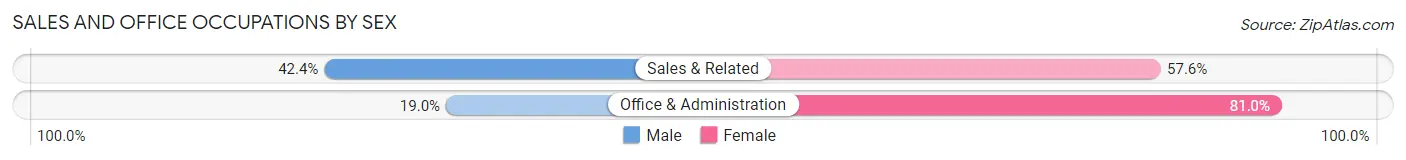
| Occupation | Male | Female |
| Sales & Related | 596 (42.4%) | 810 (57.6%) |
| Office & Administration | 456 (19.0%) | 1,947 (81.0%) |
| Total (Category) | 1,052 (27.6%) | 2,757 (72.4%) |
| Total (Overall) | 8,367 (45.1%) | 10,193 (54.9%) |
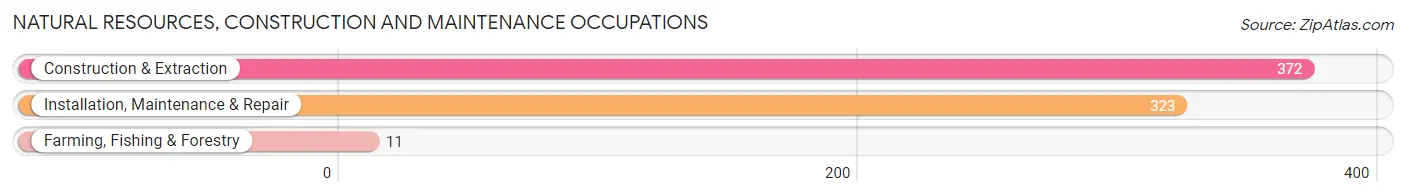
Natural Resources, Construction and Maintenance Occupations
The most common Natural Resources, Construction and Maintenance occupations in Randallstown are Construction & Extraction (372 | 2.0%), Installation, Maintenance & Repair (323 | 1.7%), and Farming, Fishing & Forestry (11 | 0.1%).
Natural Resources, Construction and Maintenance Occupations by Sex
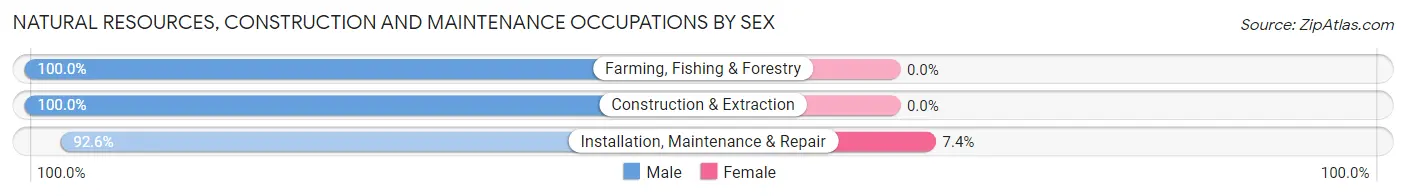
| Occupation | Male | Female |
| Farming, Fishing & Forestry | 11 (100.0%) | 0 (0.0%) |
| Construction & Extraction | 372 (100.0%) | 0 (0.0%) |
| Installation, Maintenance & Repair | 299 (92.6%) | 24 (7.4%) |
| Total (Category) | 682 (96.6%) | 24 (3.4%) |
| Total (Overall) | 8,367 (45.1%) | 10,193 (54.9%) |
Production, Transportation and Moving Occupations
The most common Production, Transportation and Moving occupations in Randallstown are Transportation (755 | 4.1%), Material Moving (750 | 4.0%), and Production (505 | 2.7%).
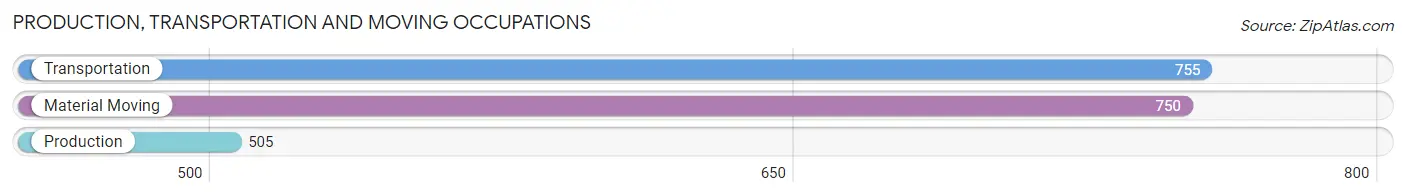
Production, Transportation and Moving Occupations by Sex
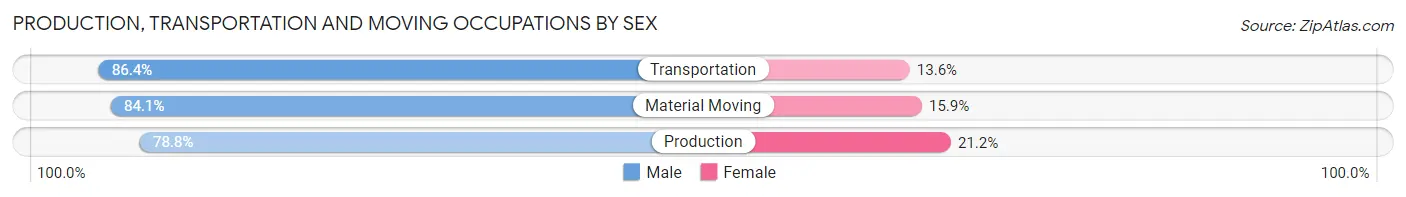
| Occupation | Male | Female |
| Production | 398 (78.8%) | 107 (21.2%) |
| Transportation | 652 (86.4%) | 103 (13.6%) |
| Material Moving | 631 (84.1%) | 119 (15.9%) |
| Total (Category) | 1,681 (83.6%) | 329 (16.4%) |
| Total (Overall) | 8,367 (45.1%) | 10,193 (54.9%) |
Employment Industries by Sex in Randallstown
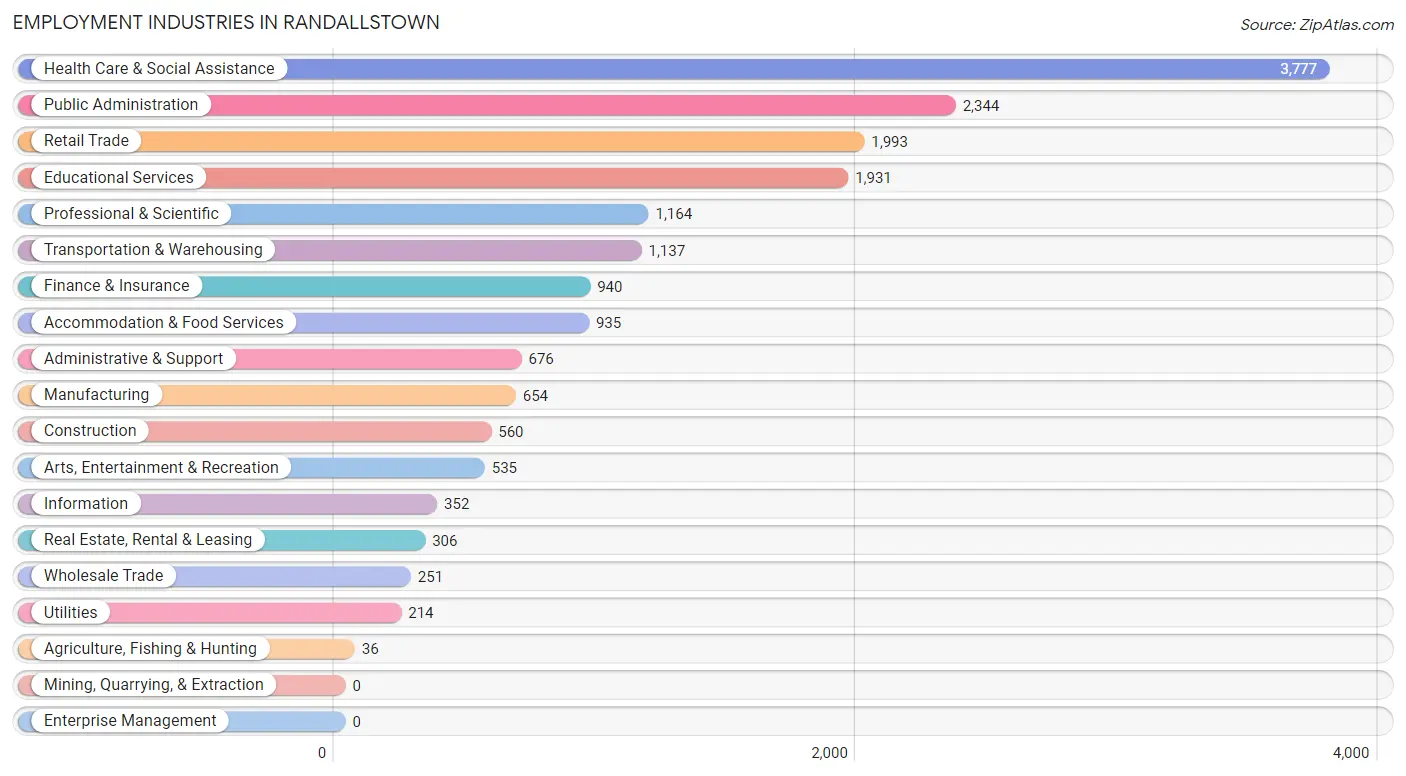
Employment Industries in Randallstown
The major employment industries in Randallstown include Health Care & Social Assistance (3,777 | 20.3%), Public Administration (2,344 | 12.6%), Retail Trade (1,993 | 10.7%), Educational Services (1,931 | 10.4%), and Professional & Scientific (1,164 | 6.3%).
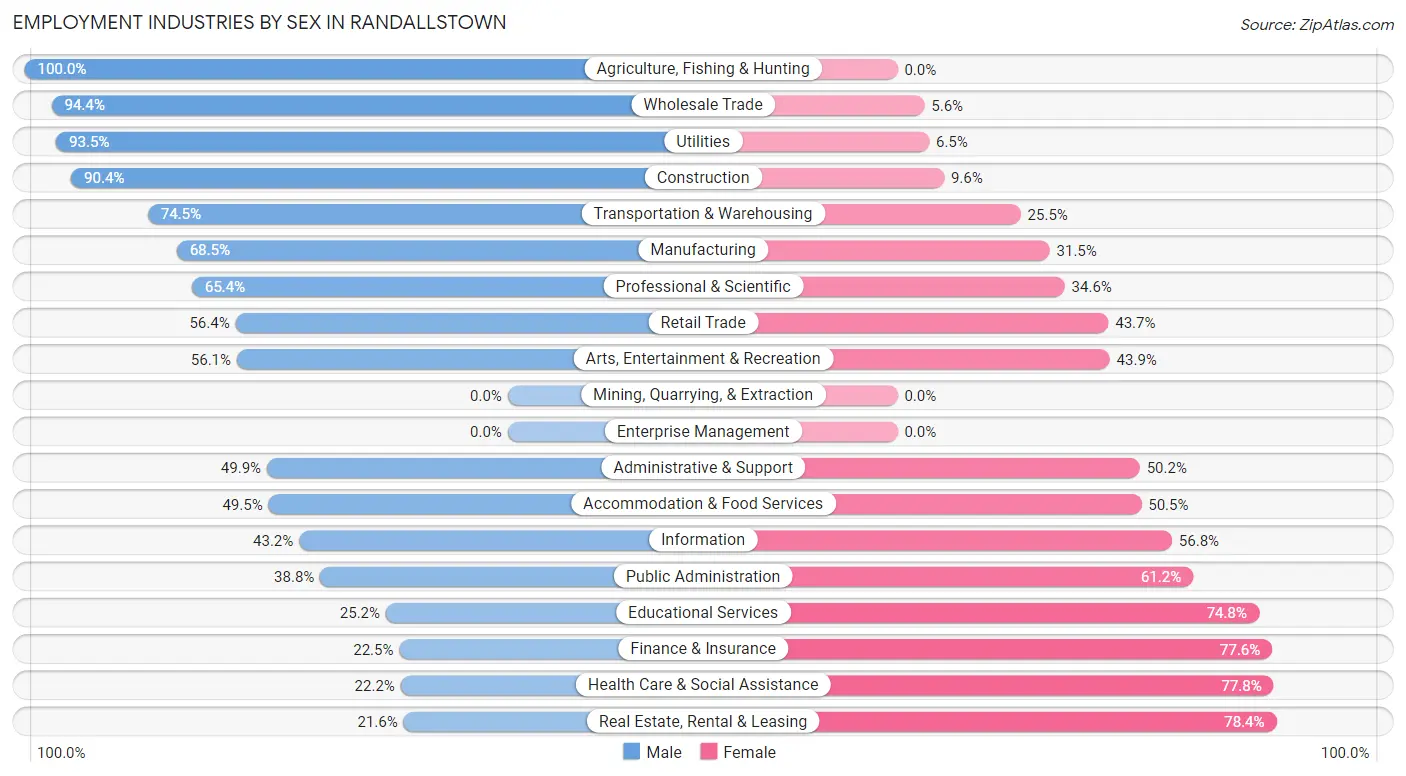
Employment Industries by Sex in Randallstown
The Randallstown industries that see more men than women are Agriculture, Fishing & Hunting (100.0%), Wholesale Trade (94.4%), and Utilities (93.5%), whereas the industries that tend to have a higher number of women are Real Estate, Rental & Leasing (78.4%), Health Care & Social Assistance (77.8%), and Finance & Insurance (77.5%).
| Industry | Male | Female |
| Agriculture, Fishing & Hunting | 36 (100.0%) | 0 (0.0%) |
| Mining, Quarrying, & Extraction | 0 (0.0%) | 0 (0.0%) |
| Construction | 506 (90.4%) | 54 (9.6%) |
| Manufacturing | 448 (68.5%) | 206 (31.5%) |
| Wholesale Trade | 237 (94.4%) | 14 (5.6%) |
| Retail Trade | 1,123 (56.4%) | 870 (43.6%) |
| Transportation & Warehousing | 847 (74.5%) | 290 (25.5%) |
| Utilities | 200 (93.5%) | 14 (6.5%) |
| Information | 152 (43.2%) | 200 (56.8%) |
| Finance & Insurance | 211 (22.5%) | 729 (77.5%) |
| Real Estate, Rental & Leasing | 66 (21.6%) | 240 (78.4%) |
| Professional & Scientific | 761 (65.4%) | 403 (34.6%) |
| Enterprise Management | 0 (0.0%) | 0 (0.0%) |
| Administrative & Support | 337 (49.8%) | 339 (50.1%) |
| Educational Services | 487 (25.2%) | 1,444 (74.8%) |
| Health Care & Social Assistance | 837 (22.2%) | 2,940 (77.8%) |
| Arts, Entertainment & Recreation | 300 (56.1%) | 235 (43.9%) |
| Accommodation & Food Services | 463 (49.5%) | 472 (50.5%) |
| Public Administration | 910 (38.8%) | 1,434 (61.2%) |
| Total | 8,367 (45.1%) | 10,193 (54.9%) |
Education in Randallstown
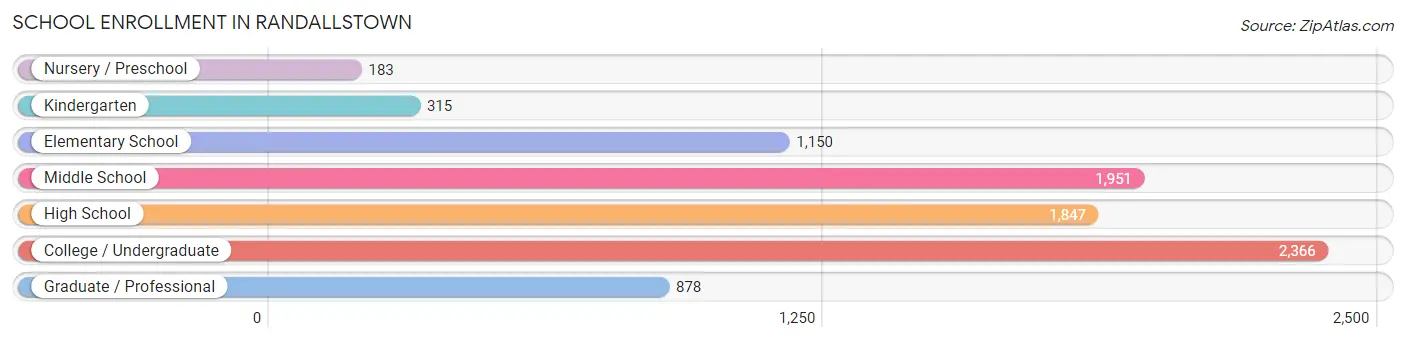
School Enrollment in Randallstown
The most common levels of schooling among the 8,690 students in Randallstown are college / undergraduate (2,366 | 27.2%), middle school (1,951 | 22.5%), and high school (1,847 | 21.2%).
| School Level | # Students | % Students |
| Nursery / Preschool | 183 | 2.1% |
| Kindergarten | 315 | 3.6% |
| Elementary School | 1,150 | 13.2% |
| Middle School | 1,951 | 22.5% |
| High School | 1,847 | 21.2% |
| College / Undergraduate | 2,366 | 27.2% |
| Graduate / Professional | 878 | 10.1% |
| Total | 8,690 | 100.0% |
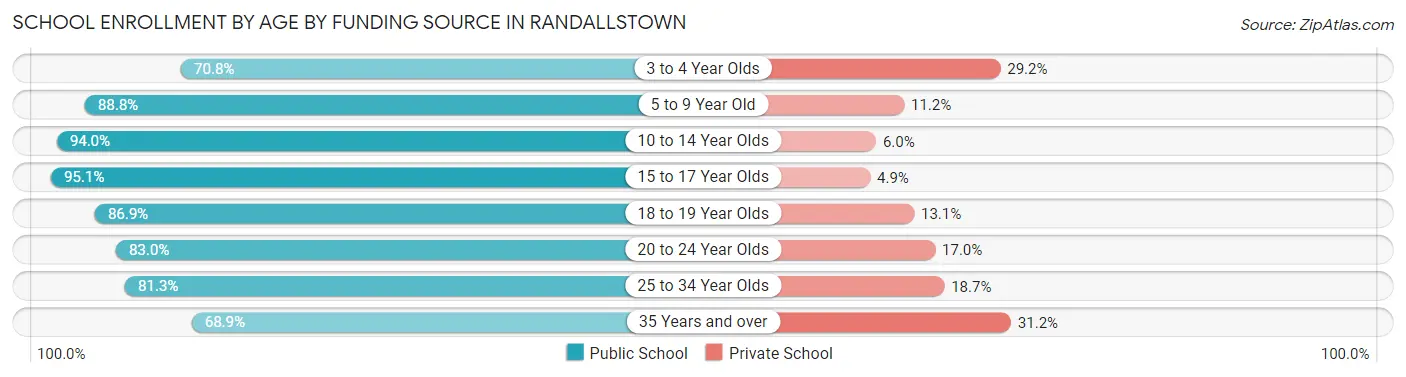
School Enrollment by Age by Funding Source in Randallstown
Out of a total of 8,690 students who are enrolled in schools in Randallstown, 1,156 (13.3%) attend a private institution, while the remaining 7,534 (86.7%) are enrolled in public schools. The age group of 35 years and over has the highest likelihood of being enrolled in private schools, with 348 (31.1% in the age bracket) enrolled. Conversely, the age group of 15 to 17 year olds has the lowest likelihood of being enrolled in a private school, with 1,218 (95.1% in the age bracket) attending a public institution.
| Age Bracket | Public School | Private School |
| 3 to 4 Year Olds | 102 (70.8%) | 42 (29.2%) |
| 5 to 9 Year Old | 1,248 (88.8%) | 158 (11.2%) |
| 10 to 14 Year Olds | 2,112 (94.0%) | 135 (6.0%) |
| 15 to 17 Year Olds | 1,218 (95.1%) | 63 (4.9%) |
| 18 to 19 Year Olds | 623 (86.9%) | 94 (13.1%) |
| 20 to 24 Year Olds | 833 (83.0%) | 171 (17.0%) |
| 25 to 34 Year Olds | 629 (81.3%) | 145 (18.7%) |
| 35 Years and over | 769 (68.9%) | 348 (31.1%) |
| Total | 7,534 (86.7%) | 1,156 (13.3%) |
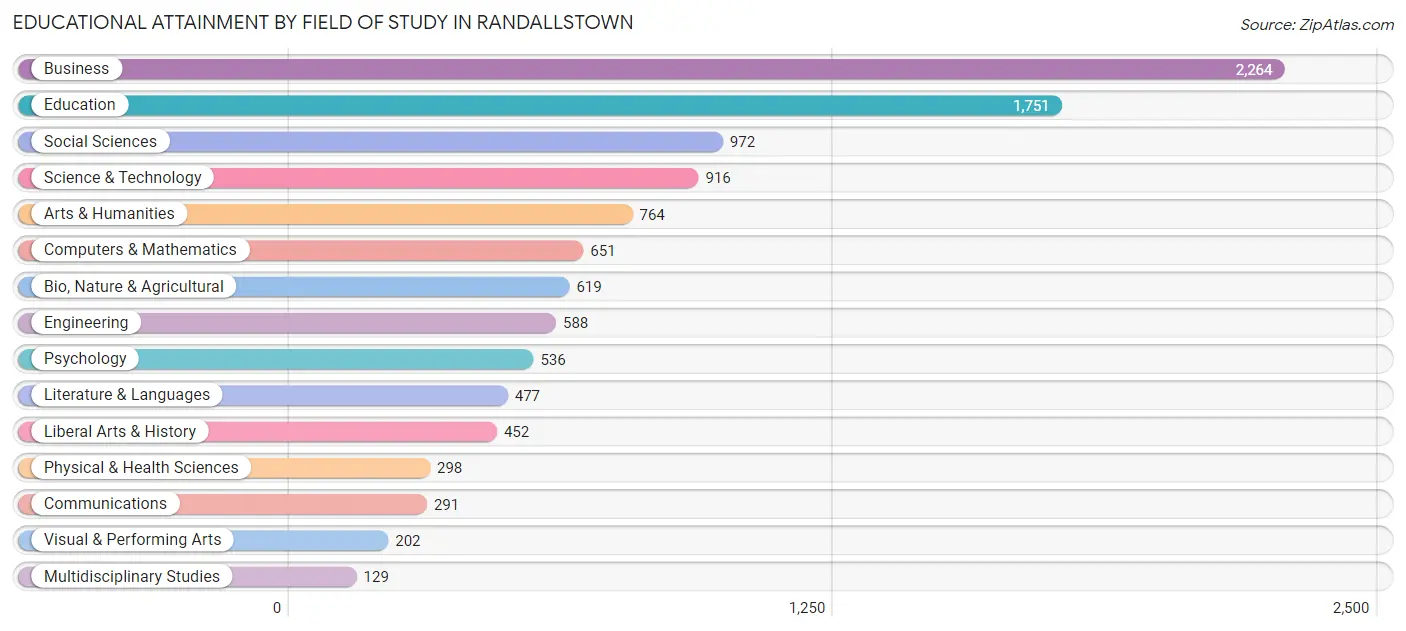
Educational Attainment by Field of Study in Randallstown
Business (2,264 | 20.7%), education (1,751 | 16.1%), social sciences (972 | 8.9%), science & technology (916 | 8.4%), and arts & humanities (764 | 7.0%) are the most common fields of study among 10,910 individuals in Randallstown who have obtained a bachelor's degree or higher.
| Field of Study | # Graduates | % Graduates |
| Computers & Mathematics | 651 | 6.0% |
| Bio, Nature & Agricultural | 619 | 5.7% |
| Physical & Health Sciences | 298 | 2.7% |
| Psychology | 536 | 4.9% |
| Social Sciences | 972 | 8.9% |
| Engineering | 588 | 5.4% |
| Multidisciplinary Studies | 129 | 1.2% |
| Science & Technology | 916 | 8.4% |
| Business | 2,264 | 20.7% |
| Education | 1,751 | 16.1% |
| Literature & Languages | 477 | 4.4% |
| Liberal Arts & History | 452 | 4.1% |
| Visual & Performing Arts | 202 | 1.8% |
| Communications | 291 | 2.7% |
| Arts & Humanities | 764 | 7.0% |
| Total | 10,910 | 100.0% |
Transportation & Commute in Randallstown
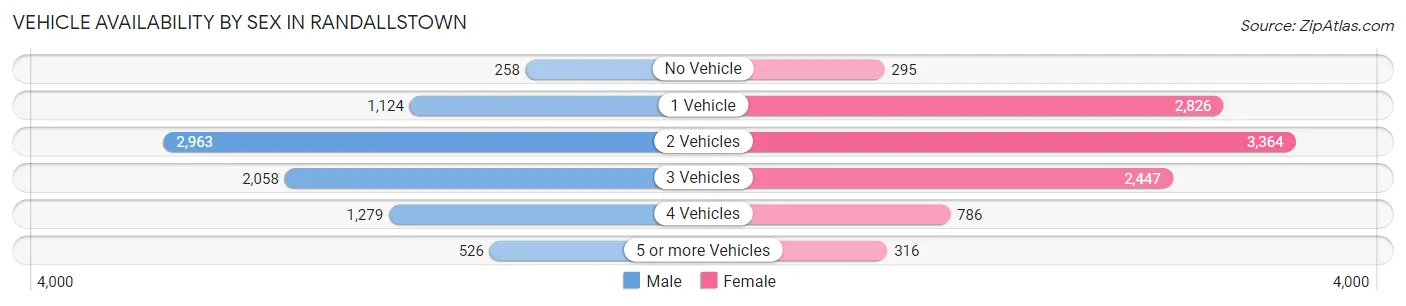
Vehicle Availability by Sex in Randallstown
The most prevalent vehicle ownership categories in Randallstown are males with 2 vehicles (2,963, accounting for 36.1%) and females with 2 vehicles (3,364, making up 29.5%).
| Vehicles Available | Male | Female |
| No Vehicle | 258 (3.1%) | 295 (2.9%) |
| 1 Vehicle | 1,124 (13.7%) | 2,826 (28.2%) |
| 2 Vehicles | 2,963 (36.1%) | 3,364 (33.5%) |
| 3 Vehicles | 2,058 (25.1%) | 2,447 (24.4%) |
| 4 Vehicles | 1,279 (15.6%) | 786 (7.8%) |
| 5 or more Vehicles | 526 (6.4%) | 316 (3.2%) |
| Total | 8,208 (100.0%) | 10,034 (100.0%) |
Commute Time in Randallstown
The most frequently occuring commute durations in Randallstown are 30 to 34 minutes (3,934 commuters, 24.0%), 45 to 59 minutes (2,037 commuters, 12.4%), and 60 to 89 minutes (1,782 commuters, 10.9%).
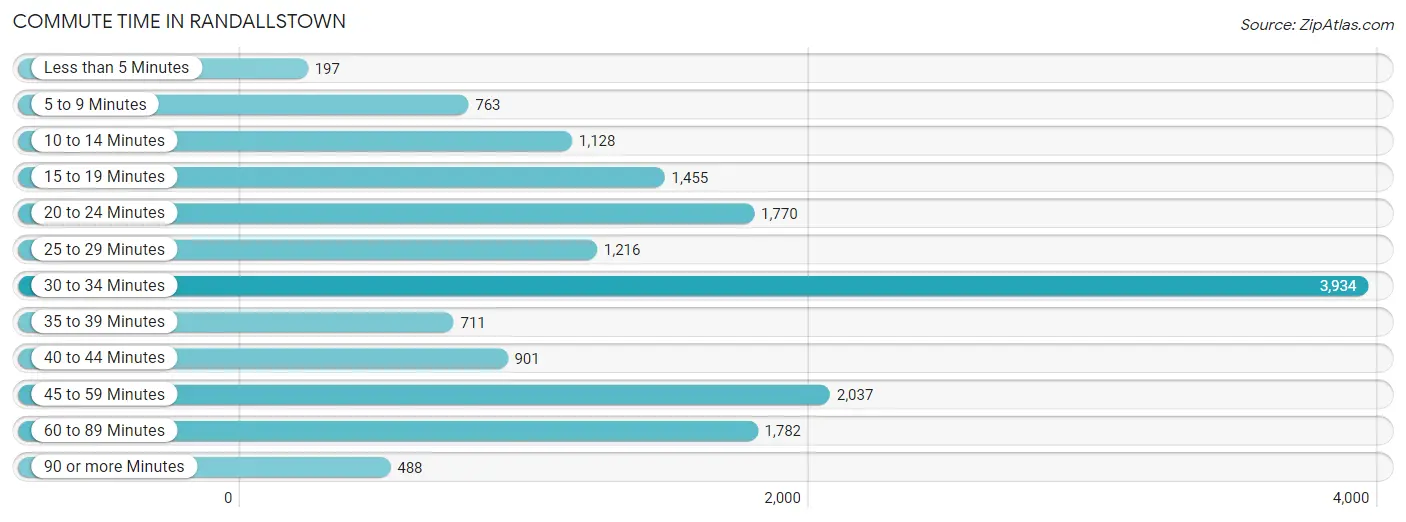
| Commute Time | # Commuters | % Commuters |
| Less than 5 Minutes | 197 | 1.2% |
| 5 to 9 Minutes | 763 | 4.7% |
| 10 to 14 Minutes | 1,128 | 6.9% |
| 15 to 19 Minutes | 1,455 | 8.9% |
| 20 to 24 Minutes | 1,770 | 10.8% |
| 25 to 29 Minutes | 1,216 | 7.4% |
| 30 to 34 Minutes | 3,934 | 24.0% |
| 35 to 39 Minutes | 711 | 4.3% |
| 40 to 44 Minutes | 901 | 5.5% |
| 45 to 59 Minutes | 2,037 | 12.4% |
| 60 to 89 Minutes | 1,782 | 10.9% |
| 90 or more Minutes | 488 | 3.0% |
Commute Time by Sex in Randallstown
The most common commute times in Randallstown are 30 to 34 minutes (1,817 commuters, 23.9%) for males and 30 to 34 minutes (2,117 commuters, 24.1%) for females.
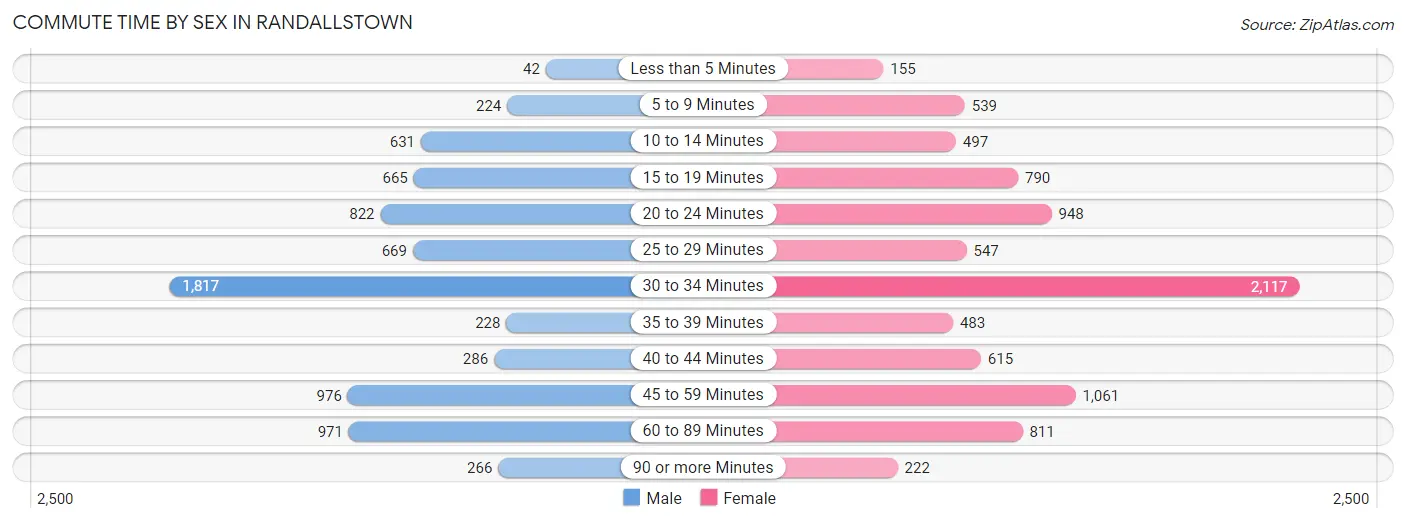
| Commute Time | Male | Female |
| Less than 5 Minutes | 42 (0.5%) | 155 (1.8%) |
| 5 to 9 Minutes | 224 (2.9%) | 539 (6.1%) |
| 10 to 14 Minutes | 631 (8.3%) | 497 (5.7%) |
| 15 to 19 Minutes | 665 (8.7%) | 790 (9.0%) |
| 20 to 24 Minutes | 822 (10.8%) | 948 (10.8%) |
| 25 to 29 Minutes | 669 (8.8%) | 547 (6.2%) |
| 30 to 34 Minutes | 1,817 (23.9%) | 2,117 (24.1%) |
| 35 to 39 Minutes | 228 (3.0%) | 483 (5.5%) |
| 40 to 44 Minutes | 286 (3.8%) | 615 (7.0%) |
| 45 to 59 Minutes | 976 (12.9%) | 1,061 (12.1%) |
| 60 to 89 Minutes | 971 (12.8%) | 811 (9.2%) |
| 90 or more Minutes | 266 (3.5%) | 222 (2.5%) |
Time of Departure to Work by Sex in Randallstown
The most frequent times of departure to work in Randallstown are 7:30 AM to 7:59 AM (1,073, 14.1%) for males and 7:00 AM to 7:29 AM (1,376, 15.7%) for females.
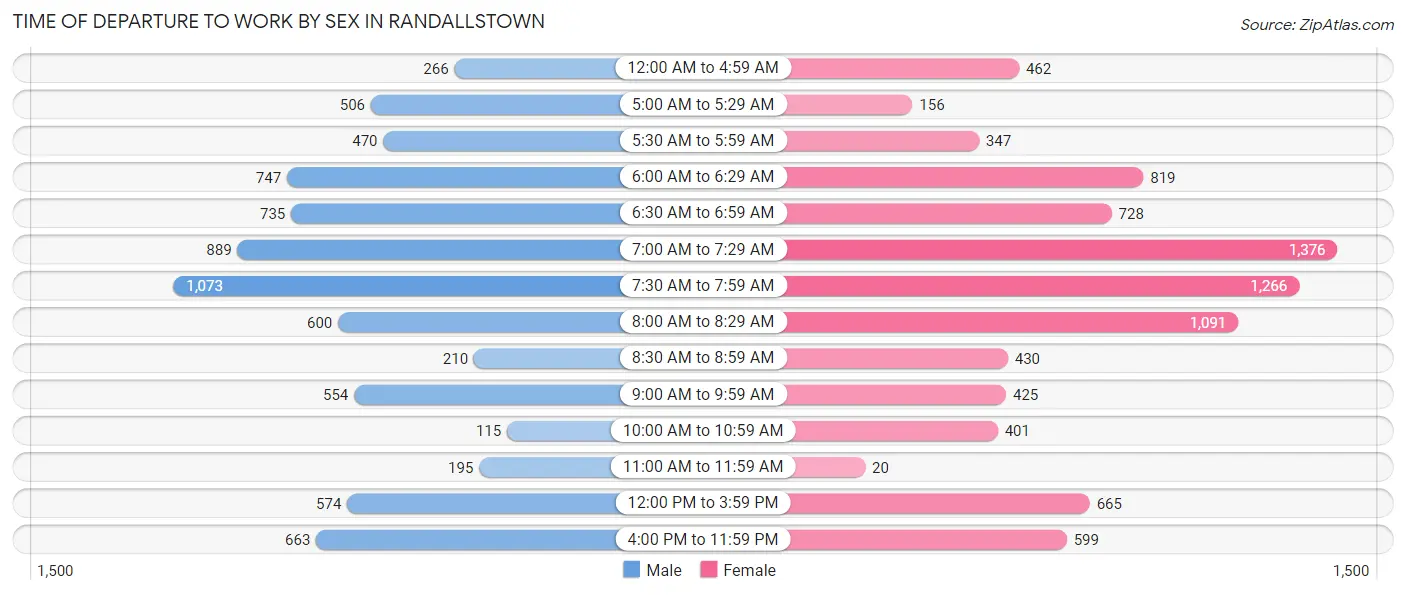
| Time of Departure | Male | Female |
| 12:00 AM to 4:59 AM | 266 (3.5%) | 462 (5.3%) |
| 5:00 AM to 5:29 AM | 506 (6.7%) | 156 (1.8%) |
| 5:30 AM to 5:59 AM | 470 (6.2%) | 347 (4.0%) |
| 6:00 AM to 6:29 AM | 747 (9.8%) | 819 (9.3%) |
| 6:30 AM to 6:59 AM | 735 (9.7%) | 728 (8.3%) |
| 7:00 AM to 7:29 AM | 889 (11.7%) | 1,376 (15.7%) |
| 7:30 AM to 7:59 AM | 1,073 (14.1%) | 1,266 (14.4%) |
| 8:00 AM to 8:29 AM | 600 (7.9%) | 1,091 (12.4%) |
| 8:30 AM to 8:59 AM | 210 (2.8%) | 430 (4.9%) |
| 9:00 AM to 9:59 AM | 554 (7.3%) | 425 (4.8%) |
| 10:00 AM to 10:59 AM | 115 (1.5%) | 401 (4.6%) |
| 11:00 AM to 11:59 AM | 195 (2.6%) | 20 (0.2%) |
| 12:00 PM to 3:59 PM | 574 (7.6%) | 665 (7.6%) |
| 4:00 PM to 11:59 PM | 663 (8.7%) | 599 (6.8%) |
| Total | 7,597 (100.0%) | 8,785 (100.0%) |
Housing Occupancy in Randallstown
Occupancy by Ownership in Randallstown
Of the total 13,530 dwellings in Randallstown, owner-occupied units account for 10,032 (74.2%), while renter-occupied units make up 3,498 (25.9%).
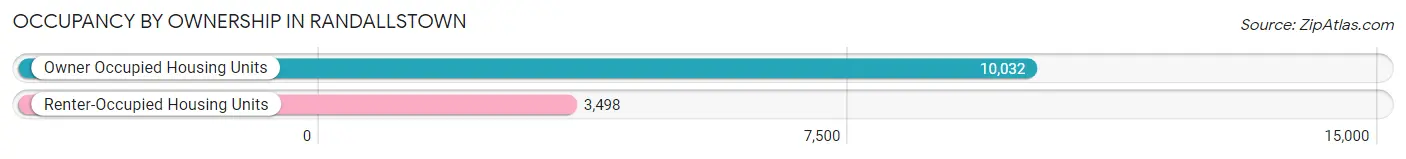
| Occupancy | # Housing Units | % Housing Units |
| Owner Occupied Housing Units | 10,032 | 74.2% |
| Renter-Occupied Housing Units | 3,498 | 25.9% |
| Total Occupied Housing Units | 13,530 | 100.0% |
Occupancy by Household Size in Randallstown
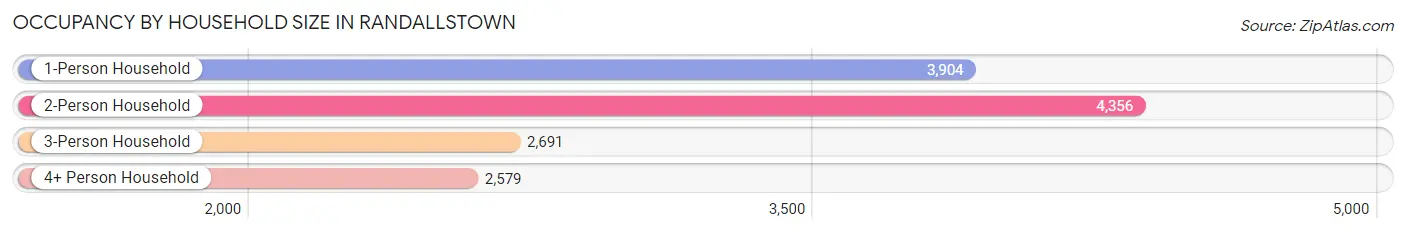
| Household Size | # Housing Units | % Housing Units |
| 1-Person Household | 3,904 | 28.8% |
| 2-Person Household | 4,356 | 32.2% |
| 3-Person Household | 2,691 | 19.9% |
| 4+ Person Household | 2,579 | 19.1% |
| Total Housing Units | 13,530 | 100.0% |
Occupancy by Ownership by Household Size in Randallstown
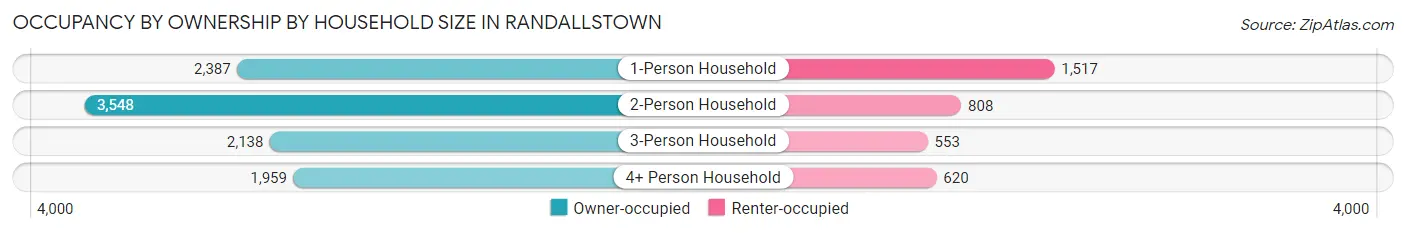
| Household Size | Owner-occupied | Renter-occupied |
| 1-Person Household | 2,387 (61.1%) | 1,517 (38.9%) |
| 2-Person Household | 3,548 (81.5%) | 808 (18.5%) |
| 3-Person Household | 2,138 (79.4%) | 553 (20.5%) |
| 4+ Person Household | 1,959 (76.0%) | 620 (24.0%) |
| Total Housing Units | 10,032 (74.2%) | 3,498 (25.9%) |
Occupancy by Educational Attainment in Randallstown
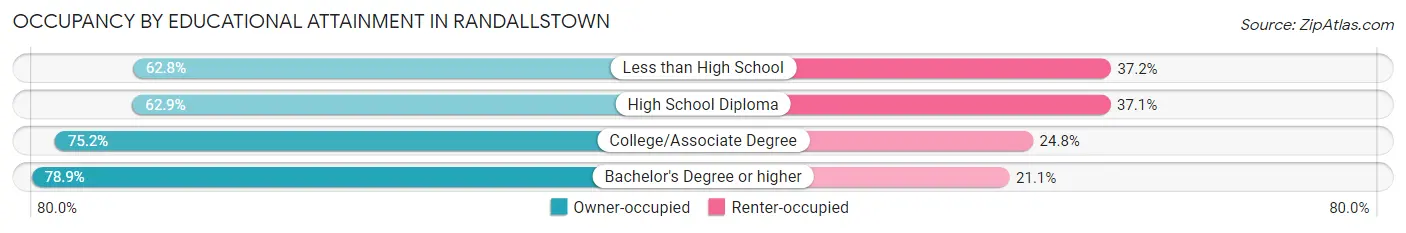
| Household Size | Owner-occupied | Renter-occupied |
| Less than High School | 411 (62.8%) | 243 (37.2%) |
| High School Diploma | 1,453 (62.9%) | 857 (37.1%) |
| College/Associate Degree | 3,417 (75.2%) | 1,128 (24.8%) |
| Bachelor's Degree or higher | 4,751 (78.9%) | 1,270 (21.1%) |
Occupancy by Age of Householder in Randallstown
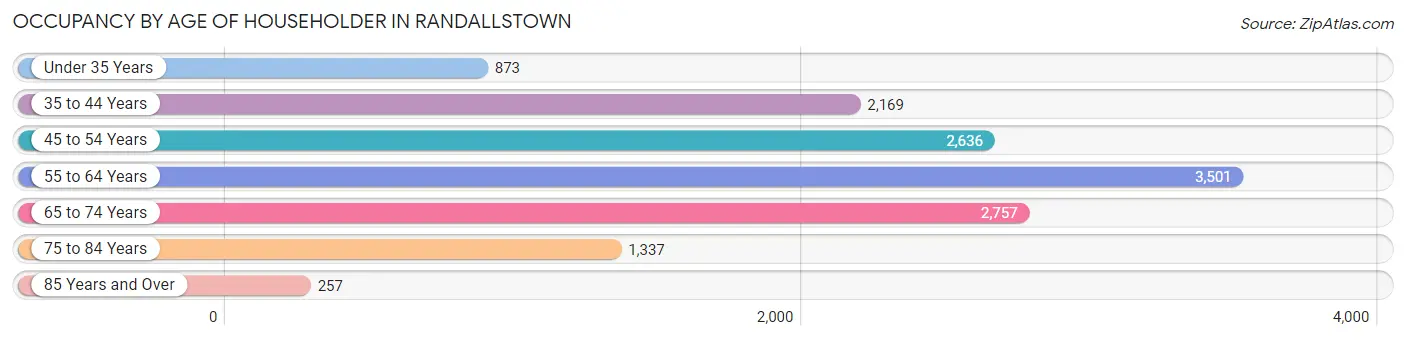
| Age Bracket | # Households | % Households |
| Under 35 Years | 873 | 6.5% |
| 35 to 44 Years | 2,169 | 16.0% |
| 45 to 54 Years | 2,636 | 19.5% |
| 55 to 64 Years | 3,501 | 25.9% |
| 65 to 74 Years | 2,757 | 20.4% |
| 75 to 84 Years | 1,337 | 9.9% |
| 85 Years and Over | 257 | 1.9% |
| Total | 13,530 | 100.0% |
Housing Finances in Randallstown
Median Income by Occupancy in Randallstown
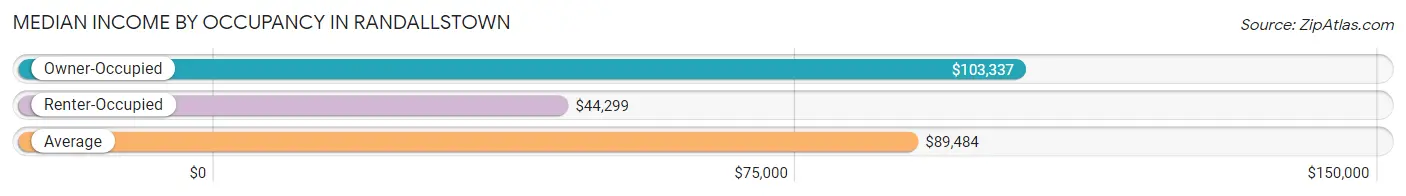
| Occupancy Type | # Households | Median Income |
| Owner-Occupied | 10,032 (74.2%) | $103,337 |
| Renter-Occupied | 3,498 (25.9%) | $44,299 |
| Average | 13,530 (100.0%) | $89,484 |
Occupancy by Householder Income Bracket in Randallstown
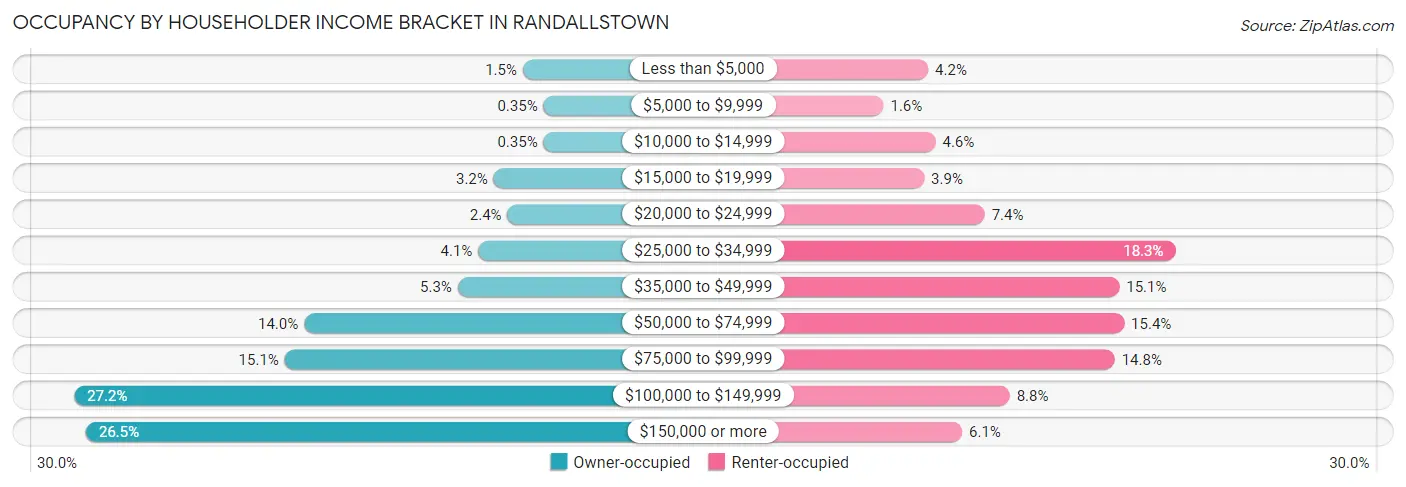
| Income Bracket | Owner-occupied | Renter-occupied |
| Less than $5,000 | 153 (1.5%) | 145 (4.2%) |
| $5,000 to $9,999 | 35 (0.4%) | 56 (1.6%) |
| $10,000 to $14,999 | 35 (0.4%) | 160 (4.6%) |
| $15,000 to $19,999 | 321 (3.2%) | 137 (3.9%) |
| $20,000 to $24,999 | 242 (2.4%) | 258 (7.4%) |
| $25,000 to $34,999 | 409 (4.1%) | 639 (18.3%) |
| $35,000 to $49,999 | 527 (5.2%) | 527 (15.1%) |
| $50,000 to $74,999 | 1,407 (14.0%) | 537 (15.3%) |
| $75,000 to $99,999 | 1,519 (15.1%) | 518 (14.8%) |
| $100,000 to $149,999 | 2,726 (27.2%) | 308 (8.8%) |
| $150,000 or more | 2,658 (26.5%) | 213 (6.1%) |
| Total | 10,032 (100.0%) | 3,498 (100.0%) |
Monthly Housing Cost Tiers in Randallstown
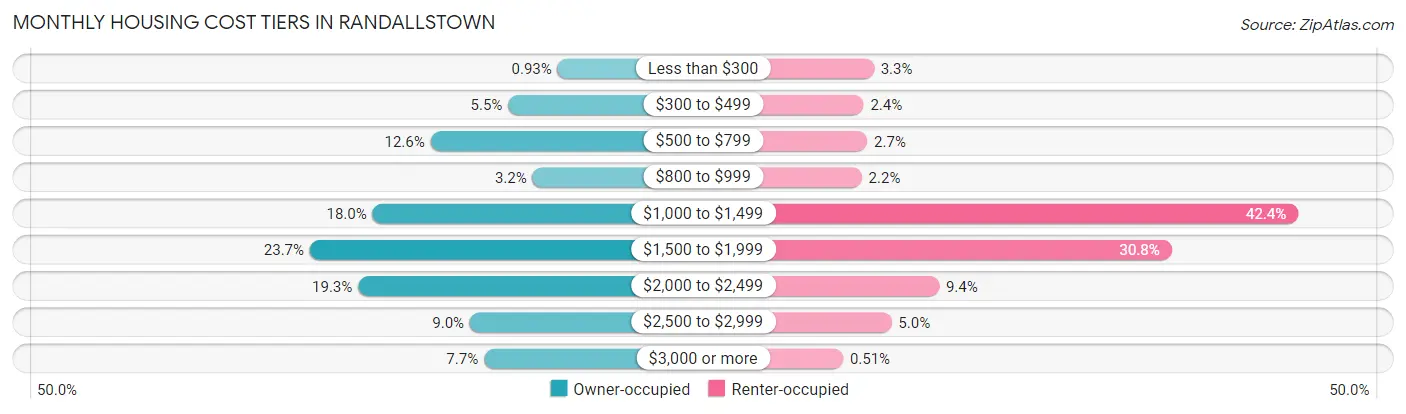
| Monthly Cost | Owner-occupied | Renter-occupied |
| Less than $300 | 93 (0.9%) | 117 (3.3%) |
| $300 to $499 | 550 (5.5%) | 84 (2.4%) |
| $500 to $799 | 1,267 (12.6%) | 96 (2.7%) |
| $800 to $999 | 325 (3.2%) | 78 (2.2%) |
| $1,000 to $1,499 | 1,803 (18.0%) | 1,483 (42.4%) |
| $1,500 to $1,999 | 2,382 (23.7%) | 1,076 (30.8%) |
| $2,000 to $2,499 | 1,936 (19.3%) | 327 (9.3%) |
| $2,500 to $2,999 | 903 (9.0%) | 174 (5.0%) |
| $3,000 or more | 773 (7.7%) | 18 (0.5%) |
| Total | 10,032 (100.0%) | 3,498 (100.0%) |
Physical Housing Characteristics in Randallstown
Housing Structures in Randallstown
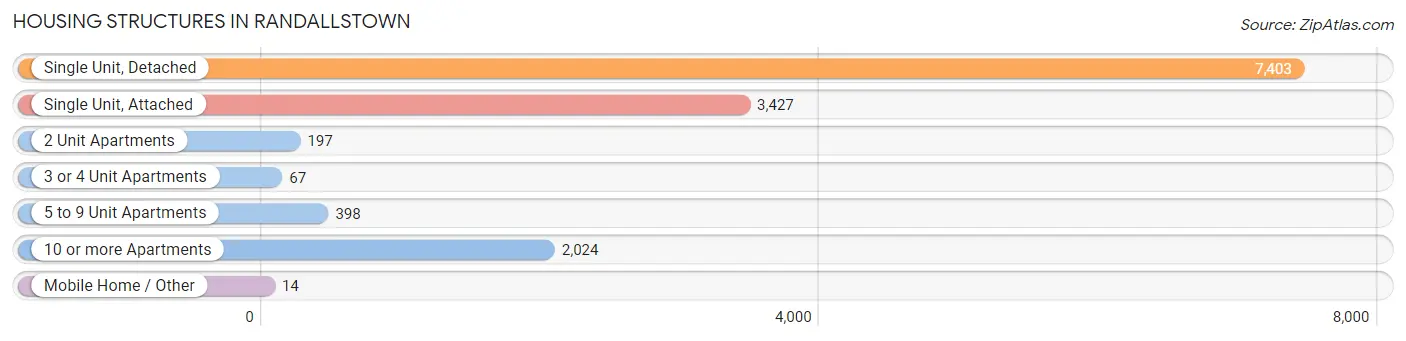
| Structure Type | # Housing Units | % Housing Units |
| Single Unit, Detached | 7,403 | 54.7% |
| Single Unit, Attached | 3,427 | 25.3% |
| 2 Unit Apartments | 197 | 1.5% |
| 3 or 4 Unit Apartments | 67 | 0.5% |
| 5 to 9 Unit Apartments | 398 | 2.9% |
| 10 or more Apartments | 2,024 | 15.0% |
| Mobile Home / Other | 14 | 0.1% |
| Total | 13,530 | 100.0% |
Housing Structures by Occupancy in Randallstown
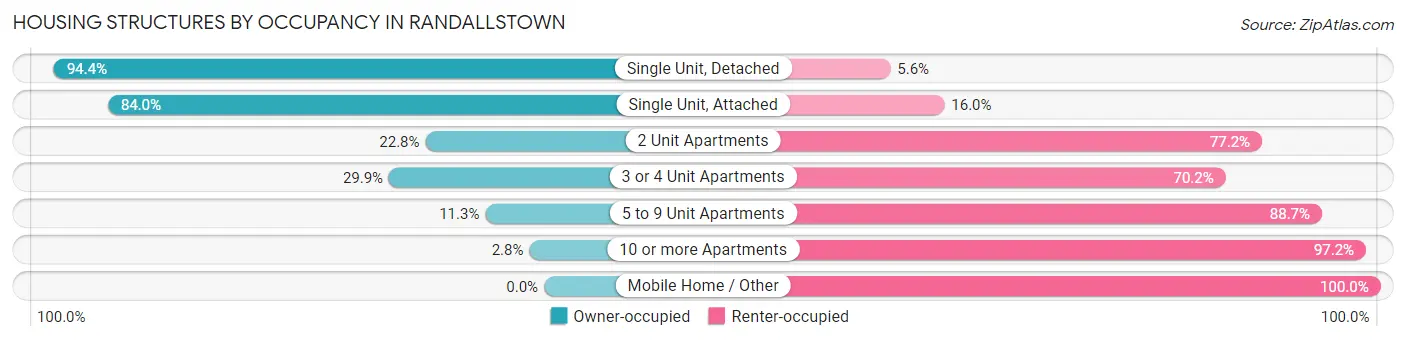
| Structure Type | Owner-occupied | Renter-occupied |
| Single Unit, Detached | 6,987 (94.4%) | 416 (5.6%) |
| Single Unit, Attached | 2,878 (84.0%) | 549 (16.0%) |
| 2 Unit Apartments | 45 (22.8%) | 152 (77.2%) |
| 3 or 4 Unit Apartments | 20 (29.8%) | 47 (70.2%) |
| 5 to 9 Unit Apartments | 45 (11.3%) | 353 (88.7%) |
| 10 or more Apartments | 57 (2.8%) | 1,967 (97.2%) |
| Mobile Home / Other | 0 (0.0%) | 14 (100.0%) |
| Total | 10,032 (74.2%) | 3,498 (25.9%) |
Housing Structures by Number of Rooms in Randallstown
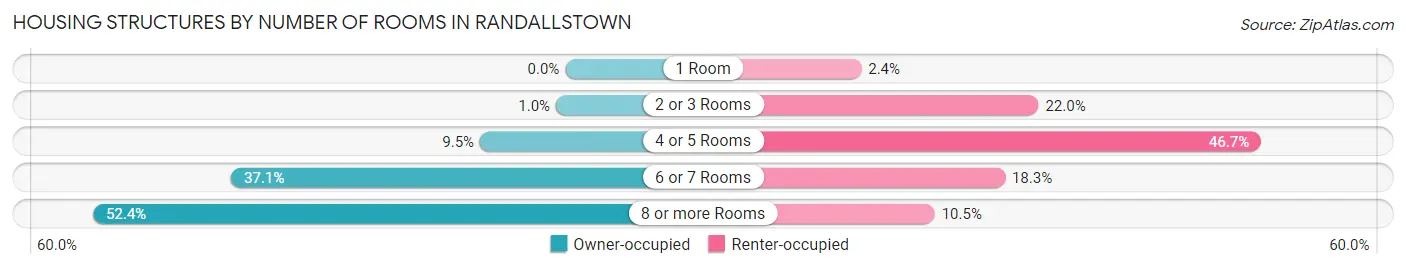
| Number of Rooms | Owner-occupied | Renter-occupied |
| 1 Room | 0 (0.0%) | 83 (2.4%) |
| 2 or 3 Rooms | 103 (1.0%) | 771 (22.0%) |
| 4 or 5 Rooms | 950 (9.5%) | 1,635 (46.7%) |
| 6 or 7 Rooms | 3,721 (37.1%) | 641 (18.3%) |
| 8 or more Rooms | 5,258 (52.4%) | 368 (10.5%) |
| Total | 10,032 (100.0%) | 3,498 (100.0%) |
Housing Structure by Heating Type in Randallstown
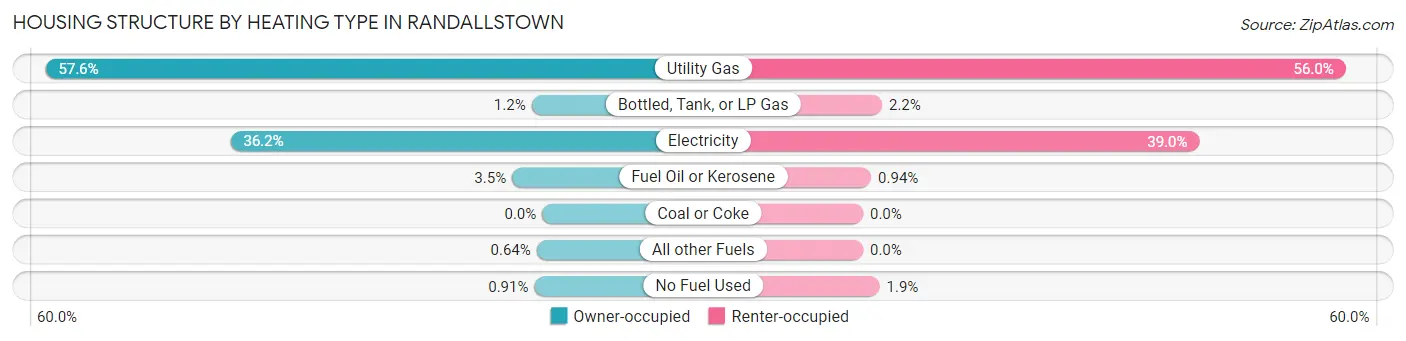
| Heating Type | Owner-occupied | Renter-occupied |
| Utility Gas | 5,777 (57.6%) | 1,957 (55.9%) |
| Bottled, Tank, or LP Gas | 123 (1.2%) | 77 (2.2%) |
| Electricity | 3,627 (36.1%) | 1,364 (39.0%) |
| Fuel Oil or Kerosene | 350 (3.5%) | 33 (0.9%) |
| Coal or Coke | 0 (0.0%) | 0 (0.0%) |
| All other Fuels | 64 (0.6%) | 0 (0.0%) |
| No Fuel Used | 91 (0.9%) | 67 (1.9%) |
| Total | 10,032 (100.0%) | 3,498 (100.0%) |
Household Vehicle Usage in Randallstown
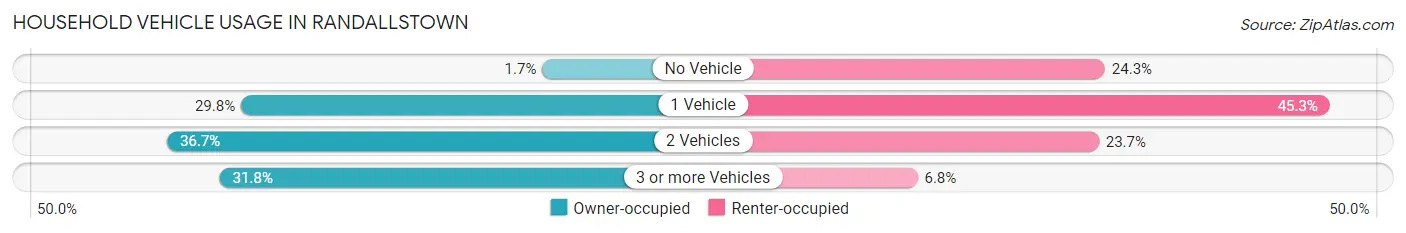
| Vehicles per Household | Owner-occupied | Renter-occupied |
| No Vehicle | 169 (1.7%) | 849 (24.3%) |
| 1 Vehicle | 2,990 (29.8%) | 1,583 (45.3%) |
| 2 Vehicles | 3,683 (36.7%) | 829 (23.7%) |
| 3 or more Vehicles | 3,190 (31.8%) | 237 (6.8%) |
| Total | 10,032 (100.0%) | 3,498 (100.0%) |
Real Estate & Mortgages in Randallstown
Real Estate and Mortgage Overview in Randallstown
| Characteristic | Without Mortgage | With Mortgage |
| Housing Units | 2,052 | 7,980 |
| Median Property Value | $273,900 | $288,600 |
| Median Household Income | $77,500 | $2,266 |
| Monthly Housing Costs | $622 | $773 |
| Real Estate Taxes | $3,308 | $548 |
Property Value by Mortgage Status in Randallstown
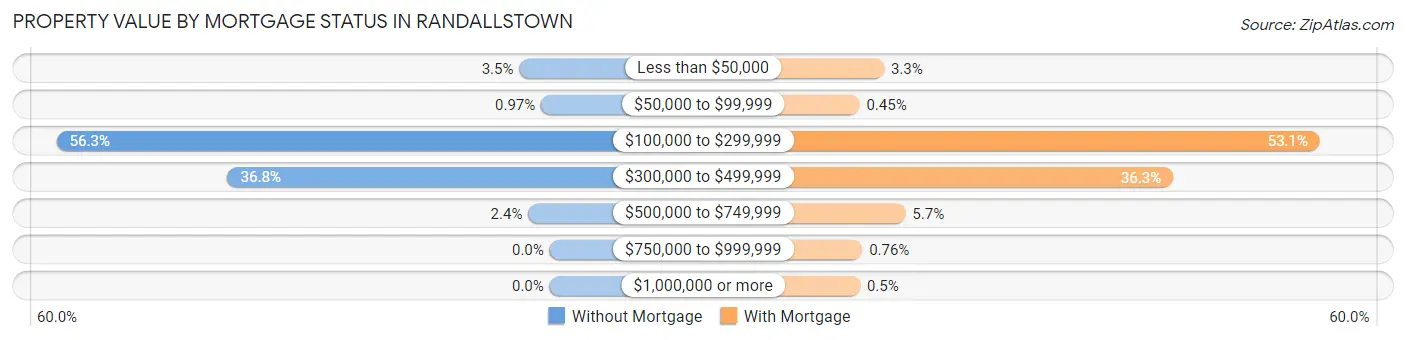
| Property Value | Without Mortgage | With Mortgage |
| Less than $50,000 | 71 (3.5%) | 259 (3.3%) |
| $50,000 to $99,999 | 20 (1.0%) | 36 (0.4%) |
| $100,000 to $299,999 | 1,156 (56.3%) | 4,233 (53.0%) |
| $300,000 to $499,999 | 755 (36.8%) | 2,896 (36.3%) |
| $500,000 to $749,999 | 50 (2.4%) | 455 (5.7%) |
| $750,000 to $999,999 | 0 (0.0%) | 61 (0.8%) |
| $1,000,000 or more | 0 (0.0%) | 40 (0.5%) |
| Total | 2,052 (100.0%) | 7,980 (100.0%) |
Household Income by Mortgage Status in Randallstown
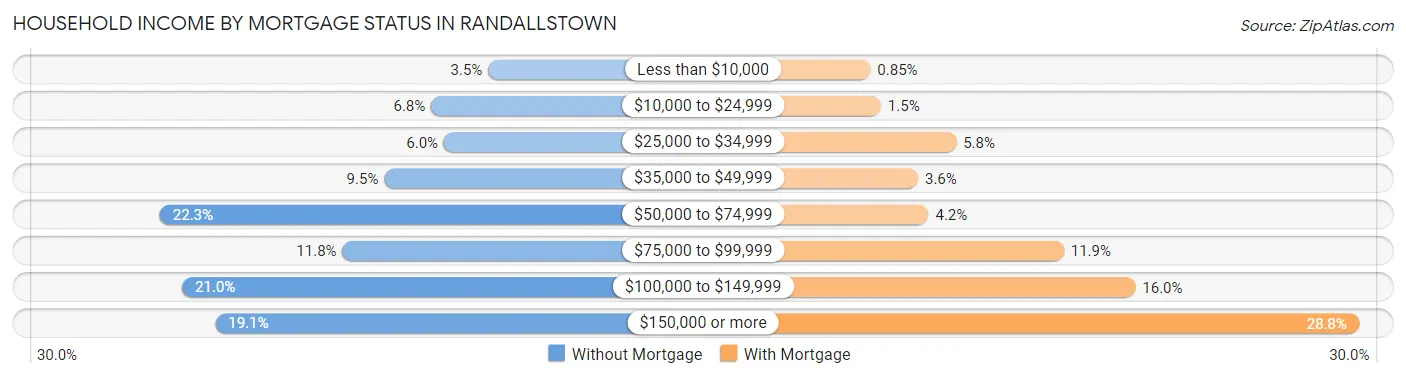
| Household Income | Without Mortgage | With Mortgage |
| Less than $10,000 | 72 (3.5%) | 68 (0.9%) |
| $10,000 to $24,999 | 139 (6.8%) | 116 (1.5%) |
| $25,000 to $34,999 | 124 (6.0%) | 459 (5.8%) |
| $35,000 to $49,999 | 194 (9.5%) | 285 (3.6%) |
| $50,000 to $74,999 | 457 (22.3%) | 333 (4.2%) |
| $75,000 to $99,999 | 243 (11.8%) | 950 (11.9%) |
| $100,000 to $149,999 | 431 (21.0%) | 1,276 (16.0%) |
| $150,000 or more | 392 (19.1%) | 2,295 (28.8%) |
| Total | 2,052 (100.0%) | 7,980 (100.0%) |
Property Value to Household Income Ratio in Randallstown
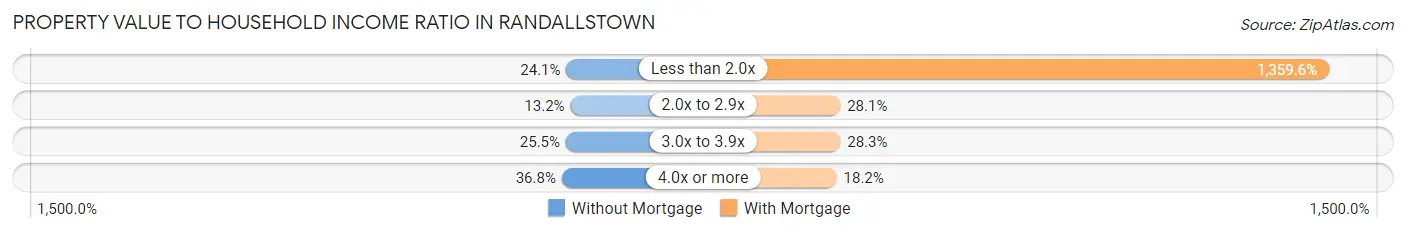
| Value-to-Income Ratio | Without Mortgage | With Mortgage |
| Less than 2.0x | 495 (24.1%) | 108,498 (1,359.6%) |
| 2.0x to 2.9x | 270 (13.2%) | 2,238 (28.1%) |
| 3.0x to 3.9x | 524 (25.5%) | 2,256 (28.3%) |
| 4.0x or more | 755 (36.8%) | 1,448 (18.1%) |
| Total | 2,052 (100.0%) | 7,980 (100.0%) |
Real Estate Taxes by Mortgage Status in Randallstown
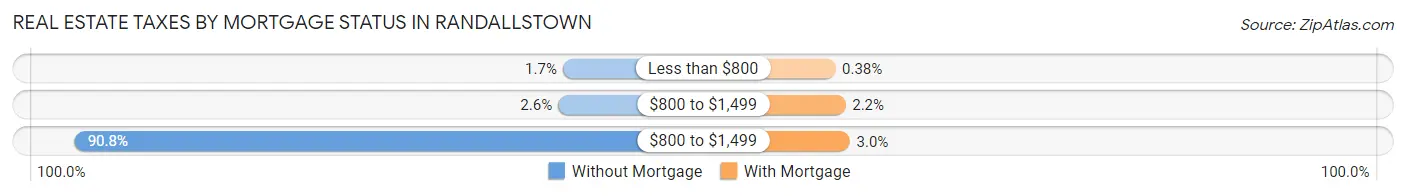
| Property Taxes | Without Mortgage | With Mortgage |
| Less than $800 | 35 (1.7%) | 30 (0.4%) |
| $800 to $1,499 | 53 (2.6%) | 179 (2.2%) |
| $800 to $1,499 | 1,864 (90.8%) | 241 (3.0%) |
| Total | 2,052 (100.0%) | 7,980 (100.0%) |
Health & Disability in Randallstown
Health Insurance Coverage by Age in Randallstown
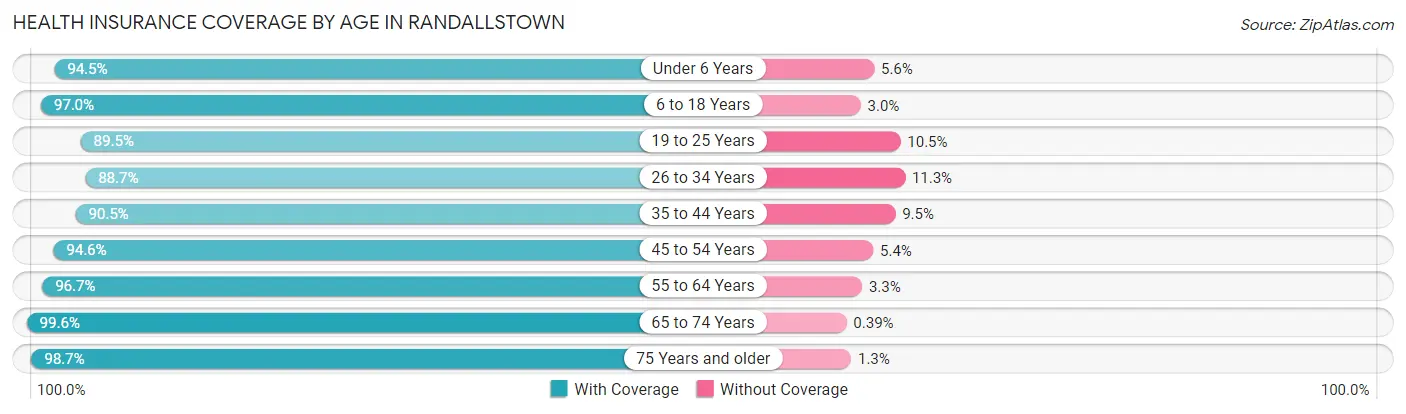
| Age Bracket | With Coverage | Without Coverage |
| Under 6 Years | 1,771 (94.5%) | 104 (5.6%) |
| 6 to 18 Years | 5,270 (97.0%) | 165 (3.0%) |
| 19 to 25 Years | 2,954 (89.5%) | 345 (10.5%) |
| 26 to 34 Years | 2,502 (88.7%) | 319 (11.3%) |
| 35 to 44 Years | 3,652 (90.5%) | 383 (9.5%) |
| 45 to 54 Years | 5,097 (94.6%) | 289 (5.4%) |
| 55 to 64 Years | 5,554 (96.7%) | 189 (3.3%) |
| 65 to 74 Years | 4,605 (99.6%) | 18 (0.4%) |
| 75 Years and older | 2,582 (98.7%) | 33 (1.3%) |
| Total | 33,987 (94.9%) | 1,845 (5.1%) |
Health Insurance Coverage by Citizenship Status in Randallstown
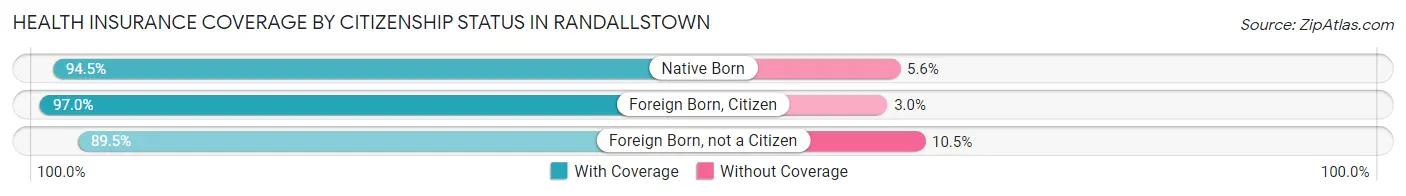
| Citizenship Status | With Coverage | Without Coverage |
| Native Born | 1,771 (94.5%) | 104 (5.6%) |
| Foreign Born, Citizen | 5,270 (97.0%) | 165 (3.0%) |
| Foreign Born, not a Citizen | 2,954 (89.5%) | 345 (10.5%) |
Health Insurance Coverage by Household Income in Randallstown
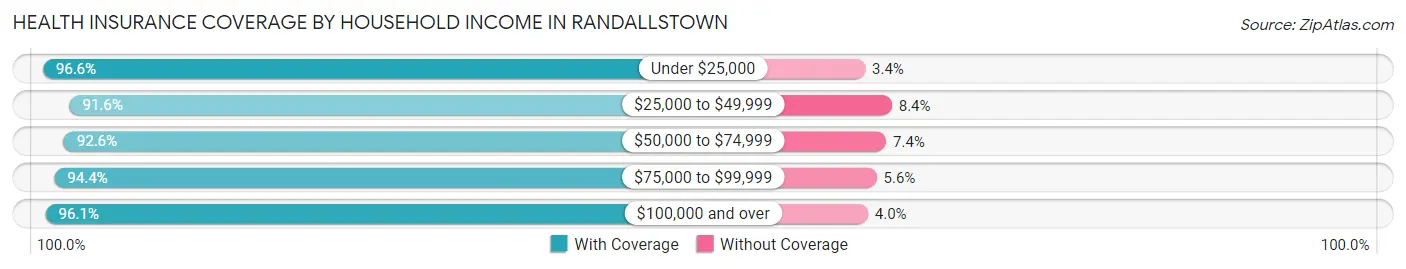
| Household Income | With Coverage | Without Coverage |
| Under $25,000 | 3,180 (96.6%) | 113 (3.4%) |
| $25,000 to $49,999 | 3,976 (91.6%) | 366 (8.4%) |
| $50,000 to $74,999 | 4,418 (92.6%) | 351 (7.4%) |
| $75,000 to $99,999 | 4,260 (94.4%) | 252 (5.6%) |
| $100,000 and over | 17,945 (96.1%) | 738 (4.0%) |
Public vs Private Health Insurance Coverage by Age in Randallstown
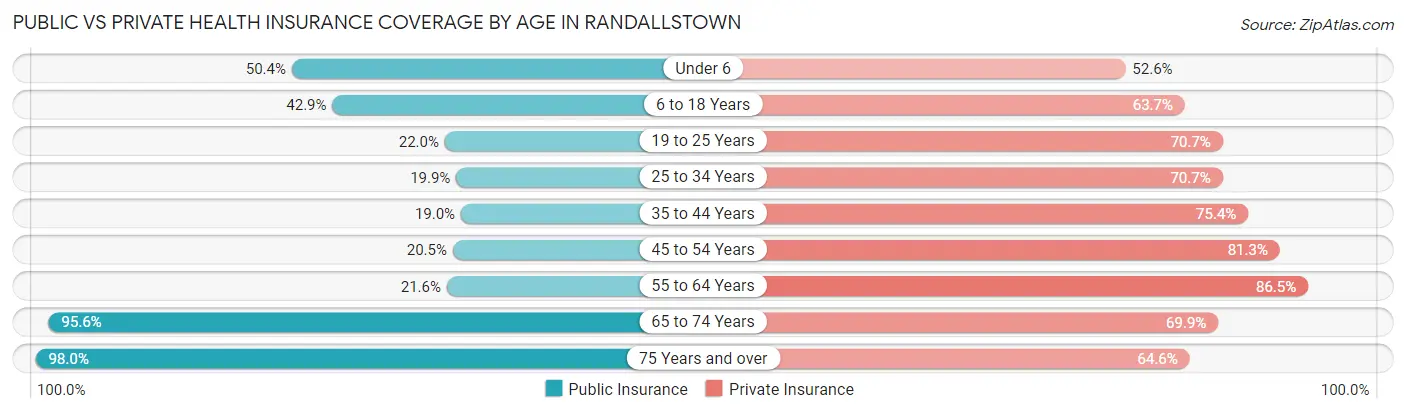
| Age Bracket | Public Insurance | Private Insurance |
| Under 6 | 945 (50.4%) | 987 (52.6%) |
| 6 to 18 Years | 2,330 (42.9%) | 3,460 (63.7%) |
| 19 to 25 Years | 726 (22.0%) | 2,332 (70.7%) |
| 25 to 34 Years | 561 (19.9%) | 1,993 (70.7%) |
| 35 to 44 Years | 767 (19.0%) | 3,043 (75.4%) |
| 45 to 54 Years | 1,105 (20.5%) | 4,378 (81.3%) |
| 55 to 64 Years | 1,243 (21.6%) | 4,970 (86.5%) |
| 65 to 74 Years | 4,418 (95.6%) | 3,229 (69.9%) |
| 75 Years and over | 2,562 (98.0%) | 1,688 (64.5%) |
| Total | 14,657 (40.9%) | 26,080 (72.8%) |
Disability Status by Sex by Age in Randallstown
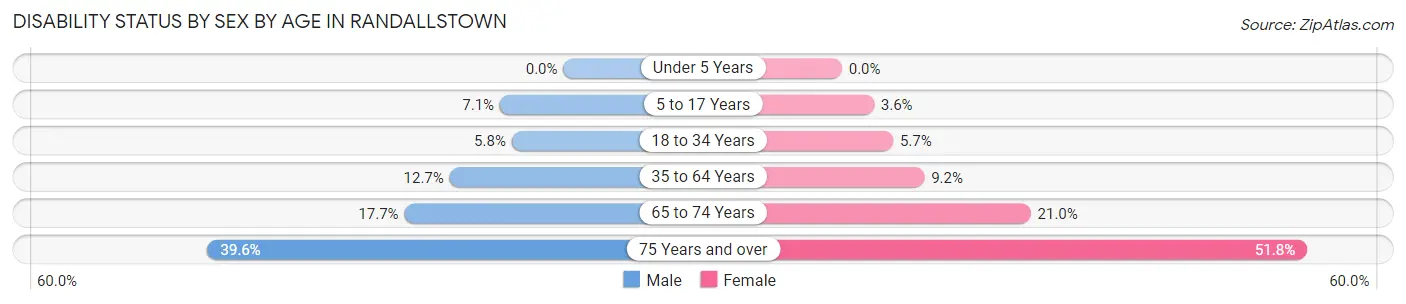
| Age Bracket | Male | Female |
| Under 5 Years | 0 (0.0%) | 0 (0.0%) |
| 5 to 17 Years | 163 (7.1%) | 105 (3.6%) |
| 18 to 34 Years | 203 (5.8%) | 179 (5.7%) |
| 35 to 64 Years | 827 (12.7%) | 793 (9.2%) |
| 65 to 74 Years | 352 (17.7%) | 554 (21.0%) |
| 75 Years and over | 400 (39.6%) | 832 (51.8%) |
Disability Class by Sex by Age in Randallstown
Disability Class: Hearing Difficulty
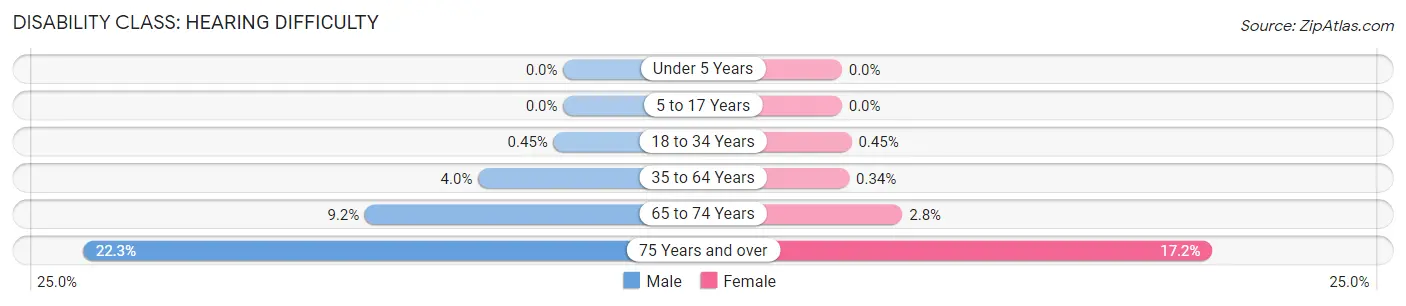
| Age Bracket | Male | Female |
| Under 5 Years | 0 (0.0%) | 0 (0.0%) |
| 5 to 17 Years | 0 (0.0%) | 0 (0.0%) |
| 18 to 34 Years | 16 (0.4%) | 14 (0.4%) |
| 35 to 64 Years | 258 (4.0%) | 29 (0.3%) |
| 65 to 74 Years | 183 (9.2%) | 74 (2.8%) |
| 75 Years and over | 225 (22.3%) | 276 (17.2%) |
Disability Class: Vision Difficulty
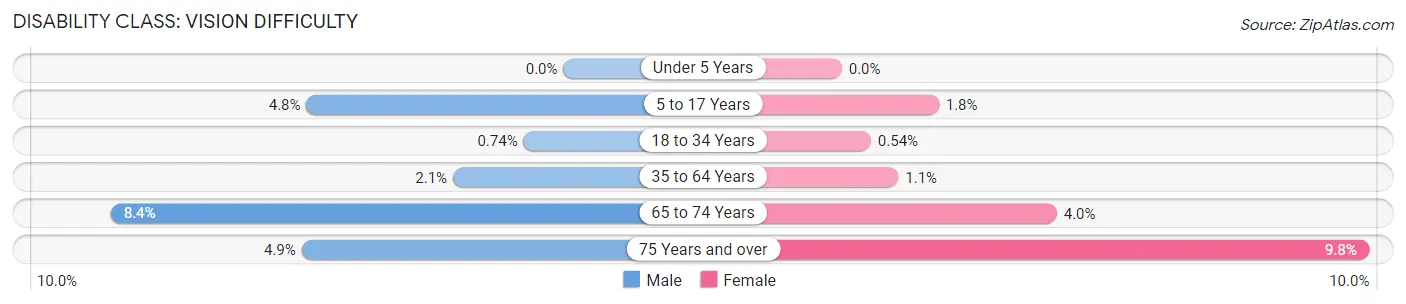
| Age Bracket | Male | Female |
| Under 5 Years | 0 (0.0%) | 0 (0.0%) |
| 5 to 17 Years | 110 (4.8%) | 53 (1.8%) |
| 18 to 34 Years | 26 (0.7%) | 17 (0.5%) |
| 35 to 64 Years | 134 (2.1%) | 91 (1.1%) |
| 65 to 74 Years | 167 (8.4%) | 105 (4.0%) |
| 75 Years and over | 49 (4.9%) | 157 (9.8%) |
Disability Class: Cognitive Difficulty
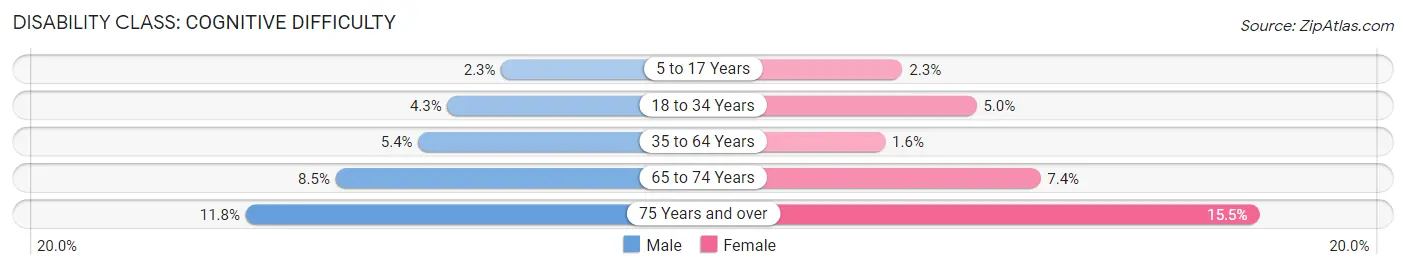
| Age Bracket | Male | Female |
| 5 to 17 Years | 53 (2.3%) | 66 (2.2%) |
| 18 to 34 Years | 152 (4.3%) | 157 (5.0%) |
| 35 to 64 Years | 351 (5.4%) | 139 (1.6%) |
| 65 to 74 Years | 168 (8.5%) | 194 (7.4%) |
| 75 Years and over | 119 (11.8%) | 249 (15.5%) |
Disability Class: Ambulatory Difficulty
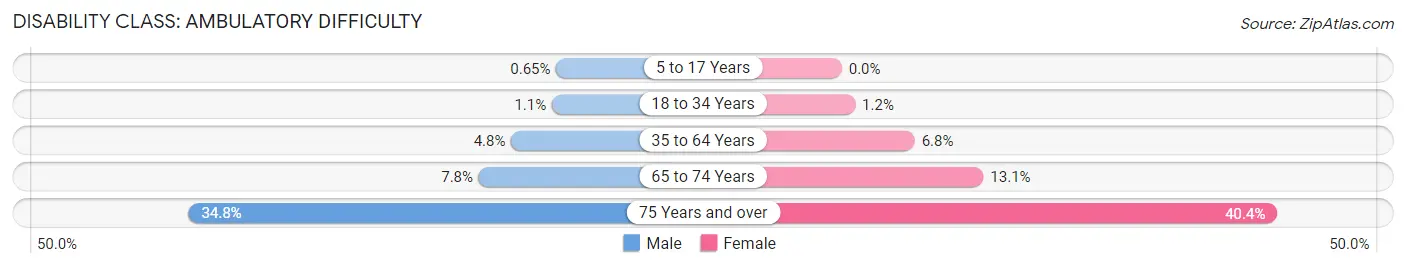
| Age Bracket | Male | Female |
| 5 to 17 Years | 15 (0.6%) | 0 (0.0%) |
| 18 to 34 Years | 37 (1.1%) | 39 (1.2%) |
| 35 to 64 Years | 315 (4.8%) | 585 (6.8%) |
| 65 to 74 Years | 156 (7.8%) | 346 (13.1%) |
| 75 Years and over | 351 (34.8%) | 649 (40.4%) |
Disability Class: Self-Care Difficulty
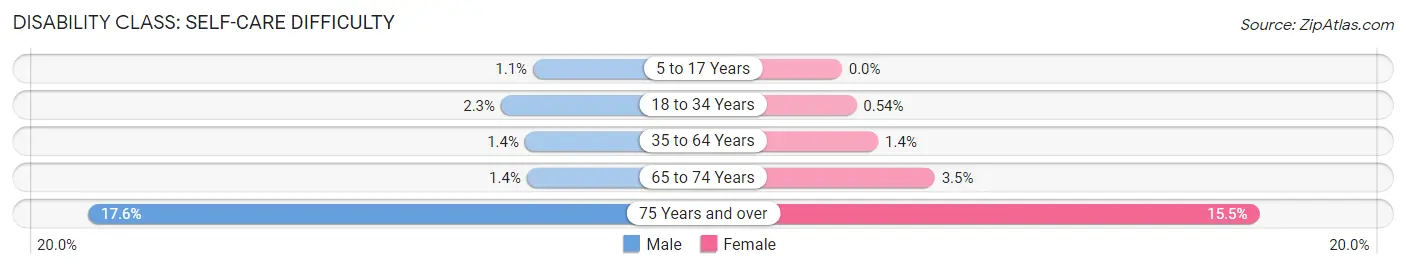
| Age Bracket | Male | Female |
| 5 to 17 Years | 26 (1.1%) | 0 (0.0%) |
| 18 to 34 Years | 82 (2.3%) | 17 (0.5%) |
| 35 to 64 Years | 93 (1.4%) | 117 (1.3%) |
| 65 to 74 Years | 27 (1.4%) | 91 (3.5%) |
| 75 Years and over | 178 (17.6%) | 249 (15.5%) |
Technology Access in Randallstown
Computing Device Access in Randallstown
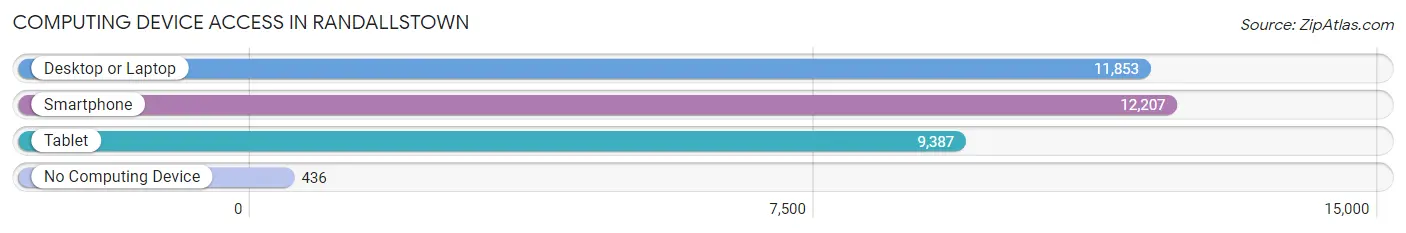
| Device Type | # Households | % Households |
| Desktop or Laptop | 11,853 | 87.6% |
| Smartphone | 12,207 | 90.2% |
| Tablet | 9,387 | 69.4% |
| No Computing Device | 436 | 3.2% |
| Total | 13,530 | 100.0% |
Internet Access in Randallstown
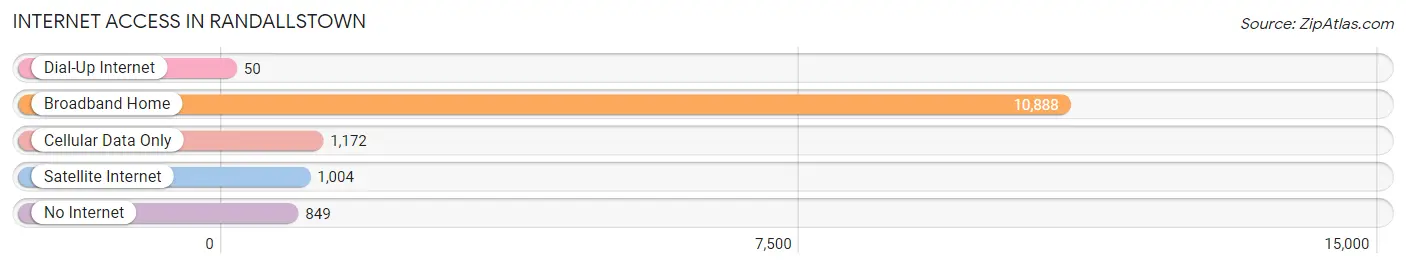
| Internet Type | # Households | % Households |
| Dial-Up Internet | 50 | 0.4% |
| Broadband Home | 10,888 | 80.5% |
| Cellular Data Only | 1,172 | 8.7% |
| Satellite Internet | 1,004 | 7.4% |
| No Internet | 849 | 6.3% |
| Total | 13,530 | 100.0% |
Randallstown Summary
Randallstown is a census-designated place (CDP) located in Baltimore County, Maryland, United States. It is located approximately 15 miles northwest of downtown Baltimore and is part of the Baltimore-Washington metropolitan area. As of the 2010 census, the population of Randallstown was 32,430.
History
The area now known as Randallstown was first settled in the late 1700s by the Randall family, who were Quakers from Pennsylvania. The family established a large farm and built a grist mill on the property. The area was known as Randallstown for many years, and the name was officially adopted in 1873 when the post office was established.
In the early 1900s, the area began to grow as a suburb of Baltimore. The population increased steadily throughout the 20th century, and by the 2000 census, the population had reached 32,430.
Geography
Randallstown is located at 39°22'45" North, 76°45'45" West (39.379167, -76.762500). According to the United States Census Bureau, the CDP has a total area of 8.3 square miles, all of it land.
Economy
Randallstown is home to a variety of businesses, including retail stores, restaurants, and professional services. The area is also home to several industrial parks, which provide employment opportunities for local residents.
Demographics
As of the 2010 census, there were 32,430 people, 11,945 households, and 8,072 families residing in the CDP. The population density was 3,902.3 people per square mile. The racial makeup of the CDP was 57.2% African American, 33.3% White, 0.3% Native American, 2.7% Asian, 0.1% Pacific Islander, 3.7% from other races, and 2.1% from two or more races. Hispanic or Latino of any race were 6.7% of the population.
The median income for a household in the CDP was $50,945, and the median income for a family was $60,945. Males had a median income of $41,945 versus $35,945 for females. The per capita income for the CDP was $23,945. About 6.7% of families and 8.7% of the population were below the poverty line, including 11.7% of those under age 18 and 6.7% of those age 65 or over.
Common Questions
What is Per Capita Income in Randallstown?
Per Capita income in Randallstown is $40,680.
What is the Median Family Income in Randallstown?
Median Family Income in Randallstown is $102,710.
What is the Median Household income in Randallstown?
Median Household Income in Randallstown is $89,484.
What is Income or Wage Gap in Randallstown?
Income or Wage Gap in Randallstown is 5.4%.
Women in Randallstown earn 94.6 cents for every dollar earned by a man.
What is Inequality or Gini Index in Randallstown?
Inequality or Gini Index in Randallstown is 0.39.
What is the Total Population of Randallstown?
Total Population of Randallstown is 36,223.
What is the Total Male Population of Randallstown?
Total Male Population of Randallstown is 16,233.
What is the Total Female Population of Randallstown?
Total Female Population of Randallstown is 19,990.
What is the Ratio of Males per 100 Females in Randallstown?
There are 81.21 Males per 100 Females in Randallstown.
What is the Ratio of Females per 100 Males in Randallstown?
There are 123.14 Females per 100 Males in Randallstown.
What is the Median Population Age in Randallstown?
Median Population Age in Randallstown is 46.1 Years.
What is the Average Family Size in Randallstown
Average Family Size in Randallstown is 3.3 People.
What is the Average Household Size in Randallstown
Average Household Size in Randallstown is 2.6 People.
How Large is the Labor Force in Randallstown?
There are 19,887 People in the Labor Forcein in Randallstown.
What is the Percentage of People in the Labor Force in Randallstown?
65.3% of People are in the Labor Force in Randallstown.
What is the Unemployment Rate in Randallstown?
Unemployment Rate in Randallstown is 6.6%.