Lancaster, PA Map & Demographics
Lancaster Map
Lancaster Overview
$28,653
PER CAPITA INCOME
$66,774
AVG FAMILY INCOME
$61,014
AVG HOUSEHOLD INCOME
18.6%
WAGE / INCOME GAP [ % ]
81.4¢/ $1
WAGE / INCOME GAP [ $ ]
$9,459
FAMILY INCOME DEFICIT
0.43
INEQUALITY / GINI INDEX
57,970
TOTAL POPULATION
27,611
MALE POPULATION
30,359
FEMALE POPULATION
90.95
MALES / 100 FEMALES
109.95
FEMALES / 100 MALES
31.8
MEDIAN AGE
3.3
AVG FAMILY SIZE
2.6
AVG HOUSEHOLD SIZE
31,588
LABOR FORCE [ PEOPLE ]
68.7%
PERCENT IN LABOR FORCE
7.4%
UNEMPLOYMENT RATE
Lancaster Area Codes
Income in Lancaster
Income Overview in Lancaster
Per Capita Income in Lancaster is $28,653, while median incomes of families and households are $66,774 and $61,014 respectively.
| Characteristic | Number | Measure |
| Per Capita Income | 57,970 | $28,653 |
| Median Family Income | 12,194 | $66,774 |
| Mean Family Income | 12,194 | $83,958 |
| Median Household Income | 21,234 | $61,014 |
| Mean Household Income | 21,234 | $76,058 |
| Income Deficit | 12,194 | $9,459 |
| Wage / Income Gap (%) | 57,970 | 18.61% |
| Wage / Income Gap ($) | 57,970 | 81.39¢ per $1 |
| Gini / Inequality Index | 57,970 | 0.43 |
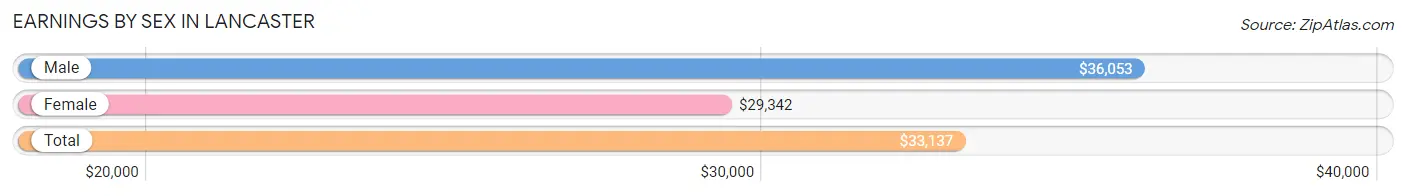
Earnings by Sex in Lancaster
Average Earnings in Lancaster are $33,137, $36,053 for men and $29,342 for women, a difference of 18.6%.
| Sex | Number | Average Earnings |
| Male | 16,454 (49.5%) | $36,053 |
| Female | 16,811 (50.5%) | $29,342 |
| Total | 33,265 (100.0%) | $33,137 |
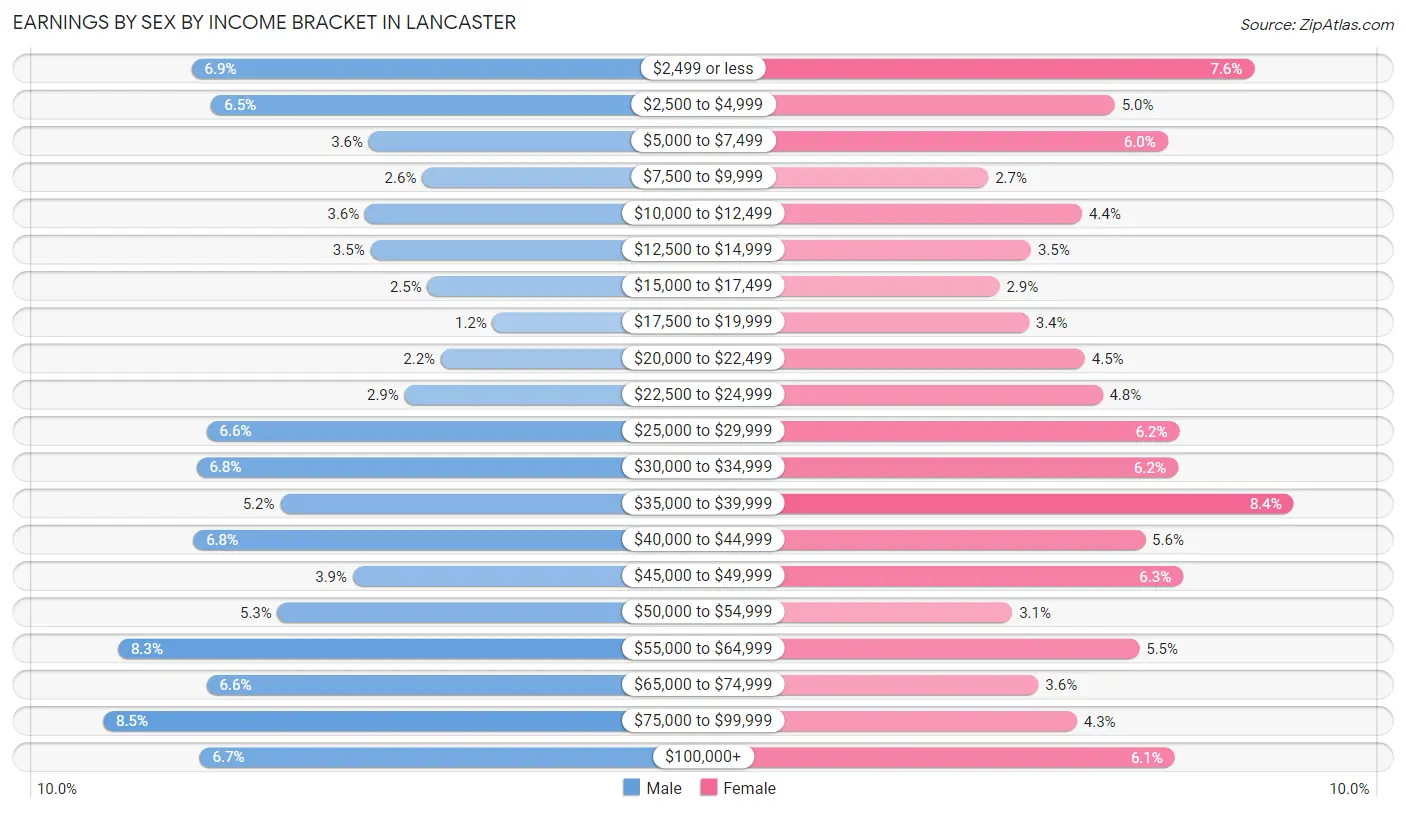
Earnings by Sex by Income Bracket in Lancaster
The most common earnings brackets in Lancaster are $75,000 to $99,999 for men (1,403 | 8.5%) and $35,000 to $39,999 for women (1,407 | 8.4%).
| Income | Male | Female |
| $2,499 or less | 1,130 (6.9%) | 1,283 (7.6%) |
| $2,500 to $4,999 | 1,069 (6.5%) | 844 (5.0%) |
| $5,000 to $7,499 | 584 (3.5%) | 1,011 (6.0%) |
| $7,500 to $9,999 | 420 (2.5%) | 445 (2.6%) |
| $10,000 to $12,499 | 596 (3.6%) | 742 (4.4%) |
| $12,500 to $14,999 | 580 (3.5%) | 580 (3.5%) |
| $15,000 to $17,499 | 403 (2.5%) | 481 (2.9%) |
| $17,500 to $19,999 | 203 (1.2%) | 573 (3.4%) |
| $20,000 to $22,499 | 362 (2.2%) | 750 (4.5%) |
| $22,500 to $24,999 | 474 (2.9%) | 805 (4.8%) |
| $25,000 to $29,999 | 1,084 (6.6%) | 1,047 (6.2%) |
| $30,000 to $34,999 | 1,116 (6.8%) | 1,043 (6.2%) |
| $35,000 to $39,999 | 857 (5.2%) | 1,407 (8.4%) |
| $40,000 to $44,999 | 1,126 (6.8%) | 939 (5.6%) |
| $45,000 to $49,999 | 634 (3.8%) | 1,059 (6.3%) |
| $50,000 to $54,999 | 866 (5.3%) | 521 (3.1%) |
| $55,000 to $64,999 | 1,357 (8.3%) | 922 (5.5%) |
| $65,000 to $74,999 | 1,084 (6.6%) | 603 (3.6%) |
| $75,000 to $99,999 | 1,403 (8.5%) | 724 (4.3%) |
| $100,000+ | 1,106 (6.7%) | 1,032 (6.1%) |
| Total | 16,454 (100.0%) | 16,811 (100.0%) |
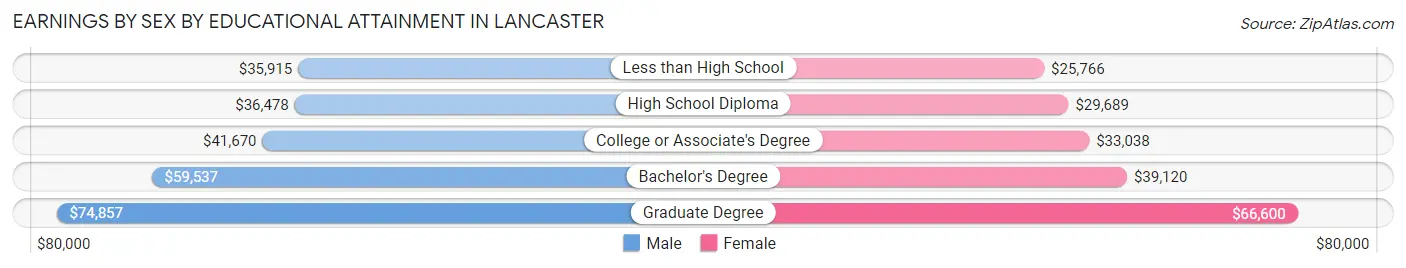
Earnings by Sex by Educational Attainment in Lancaster
Average earnings in Lancaster are $43,387 for men and $35,656 for women, a difference of 17.8%. Men with an educational attainment of graduate degree enjoy the highest average annual earnings of $74,857, while those with less than high school education earn the least with $35,915. Women with an educational attainment of graduate degree earn the most with the average annual earnings of $66,600, while those with less than high school education have the smallest earnings of $25,766.
| Educational Attainment | Male Income | Female Income |
| Less than High School | $35,915 | $25,766 |
| High School Diploma | $36,478 | $29,689 |
| College or Associate's Degree | $41,670 | $33,038 |
| Bachelor's Degree | $59,537 | $39,120 |
| Graduate Degree | $74,857 | $66,600 |
| Total | $43,387 | $35,656 |
Family Income in Lancaster
Family Income Brackets in Lancaster
According to the Lancaster family income data, there are 2,134 families falling into the $50,000 to $74,999 income range, which is the most common income bracket and makes up 17.5% of all families. Conversely, the less than $10,000 income bracket is the least frequent group with only 378 families (3.1%) belonging to this category.
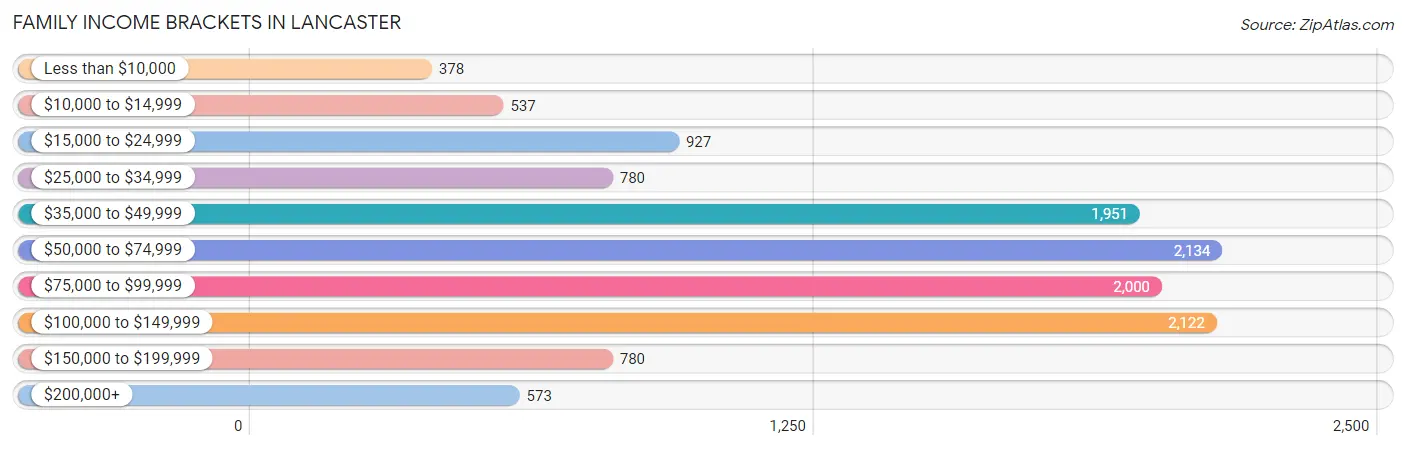
| Income Bracket | # Families | % Families |
| Less than $10,000 | 378 | 3.1% |
| $10,000 to $14,999 | 537 | 4.4% |
| $15,000 to $24,999 | 927 | 7.6% |
| $25,000 to $34,999 | 780 | 6.4% |
| $35,000 to $49,999 | 1,951 | 16.0% |
| $50,000 to $74,999 | 2,134 | 17.5% |
| $75,000 to $99,999 | 2,000 | 16.4% |
| $100,000 to $149,999 | 2,122 | 17.4% |
| $150,000 to $199,999 | 780 | 6.4% |
| $200,000+ | 573 | 4.7% |
Family Income by Famaliy Size in Lancaster
7+ person families (333 | 2.7%) account for the highest median family income in Lancaster with $93,018 per family, while 2-person families (5,005 | 41.0%) have the highest median income of $31,710 per family member.
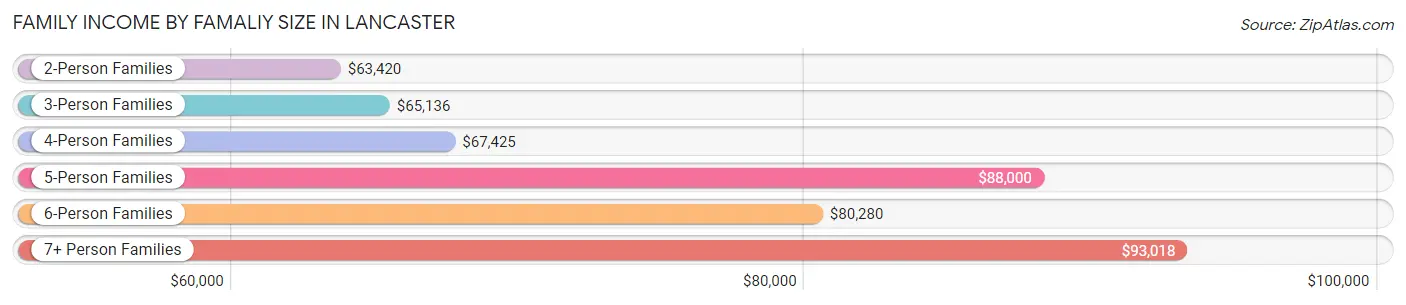
| Income Bracket | # Families | Median Income |
| 2-Person Families | 5,005 (41.0%) | $63,420 |
| 3-Person Families | 3,125 (25.6%) | $65,136 |
| 4-Person Families | 2,320 (19.0%) | $67,425 |
| 5-Person Families | 910 (7.5%) | $88,000 |
| 6-Person Families | 501 (4.1%) | $80,280 |
| 7+ Person Families | 333 (2.7%) | $93,018 |
| Total | 12,194 (100.0%) | $66,774 |
Family Income by Number of Earners in Lancaster
The median family income in Lancaster is $66,774, with families comprising 3+ earners (1,556) having the highest median family income of $112,875, while families with no earners (1,168) have the lowest median family income of $22,813, accounting for 12.8% and 9.6% of families, respectively.
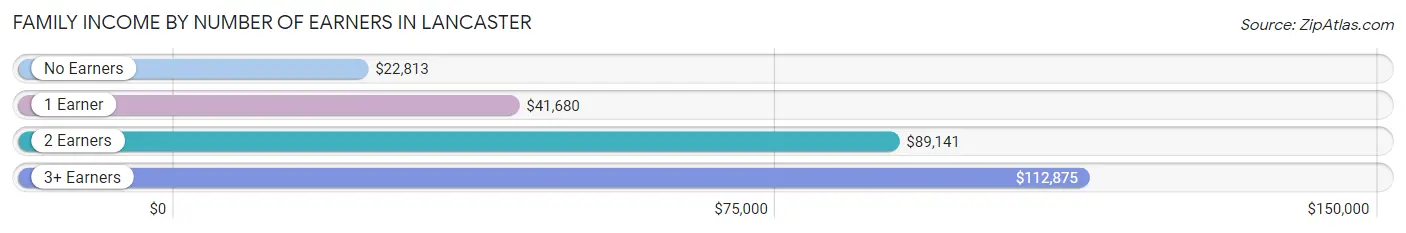
| Number of Earners | # Families | Median Income |
| No Earners | 1,168 (9.6%) | $22,813 |
| 1 Earner | 4,346 (35.6%) | $41,680 |
| 2 Earners | 5,124 (42.0%) | $89,141 |
| 3+ Earners | 1,556 (12.8%) | $112,875 |
| Total | 12,194 (100.0%) | $66,774 |
Household Income in Lancaster
Household Income Brackets in Lancaster
With 3,589 households falling in the category, the $50,000 to $74,999 income range is the most frequent in Lancaster, accounting for 16.9% of all households. In contrast, only 807 households (3.8%) fall into the $200,000+ income bracket, making it the least populous group.
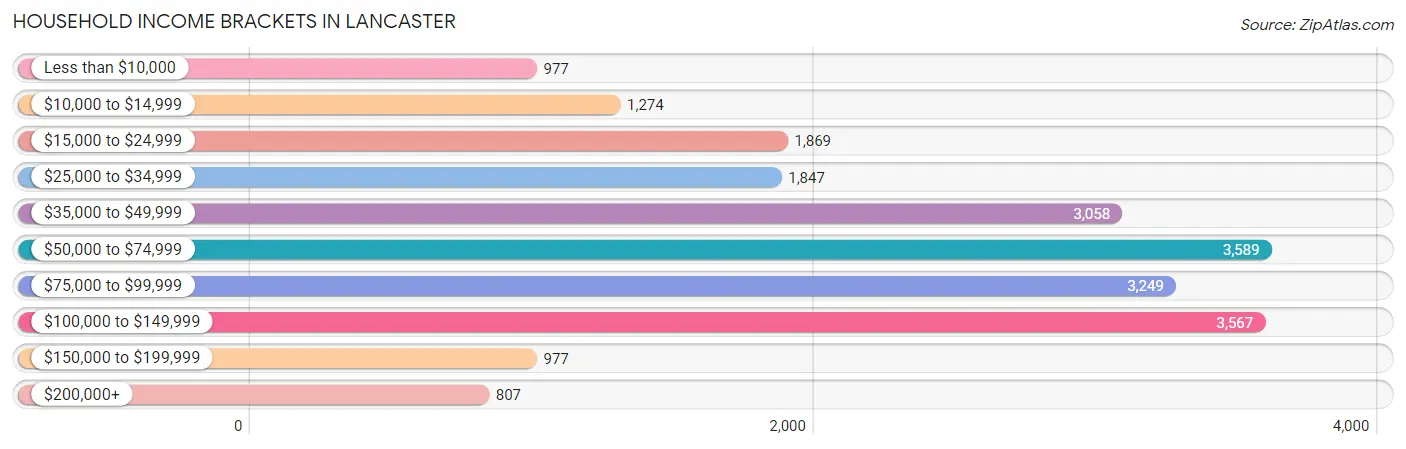
| Income Bracket | # Households | % Households |
| Less than $10,000 | 977 | 4.6% |
| $10,000 to $14,999 | 1,274 | 6.0% |
| $15,000 to $24,999 | 1,869 | 8.8% |
| $25,000 to $34,999 | 1,847 | 8.7% |
| $35,000 to $49,999 | 3,058 | 14.4% |
| $50,000 to $74,999 | 3,589 | 16.9% |
| $75,000 to $99,999 | 3,249 | 15.3% |
| $100,000 to $149,999 | 3,567 | 16.8% |
| $150,000 to $199,999 | 977 | 4.6% |
| $200,000+ | 807 | 3.8% |
Household Income by Householder Age in Lancaster
The median household income in Lancaster is $61,014, with the highest median household income of $67,663 found in the 25 to 44 years age bracket for the primary householder. A total of 9,506 households (44.8%) fall into this category. Meanwhile, the 65+ years age bracket for the primary householder has the lowest median household income of $33,385, with 3,554 households (16.7%) in this group.
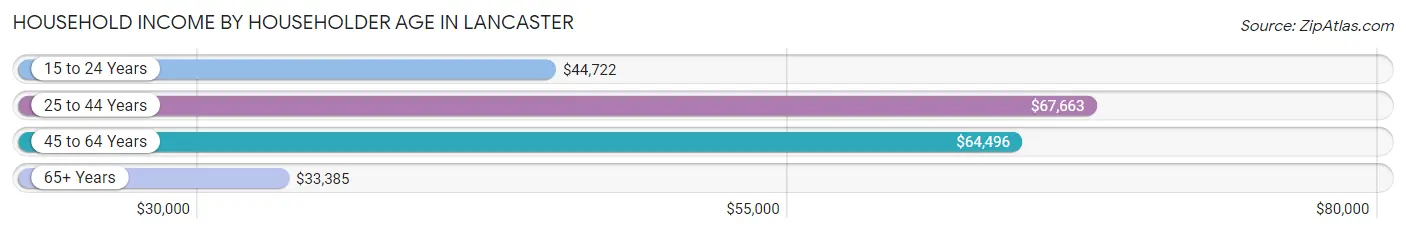
| Income Bracket | # Households | Median Income |
| 15 to 24 Years | 1,158 (5.4%) | $44,722 |
| 25 to 44 Years | 9,506 (44.8%) | $67,663 |
| 45 to 64 Years | 7,016 (33.0%) | $64,496 |
| 65+ Years | 3,554 (16.7%) | $33,385 |
| Total | 21,234 (100.0%) | $61,014 |
Poverty in Lancaster
Income Below Poverty by Sex and Age in Lancaster
With 16.0% poverty level for males and 21.1% for females among the residents of Lancaster, 6 to 11 year old males and 5 year old females are the most vulnerable to poverty, with 871 males (40.0%) and 170 females (51.8%) in their respective age groups living below the poverty level.
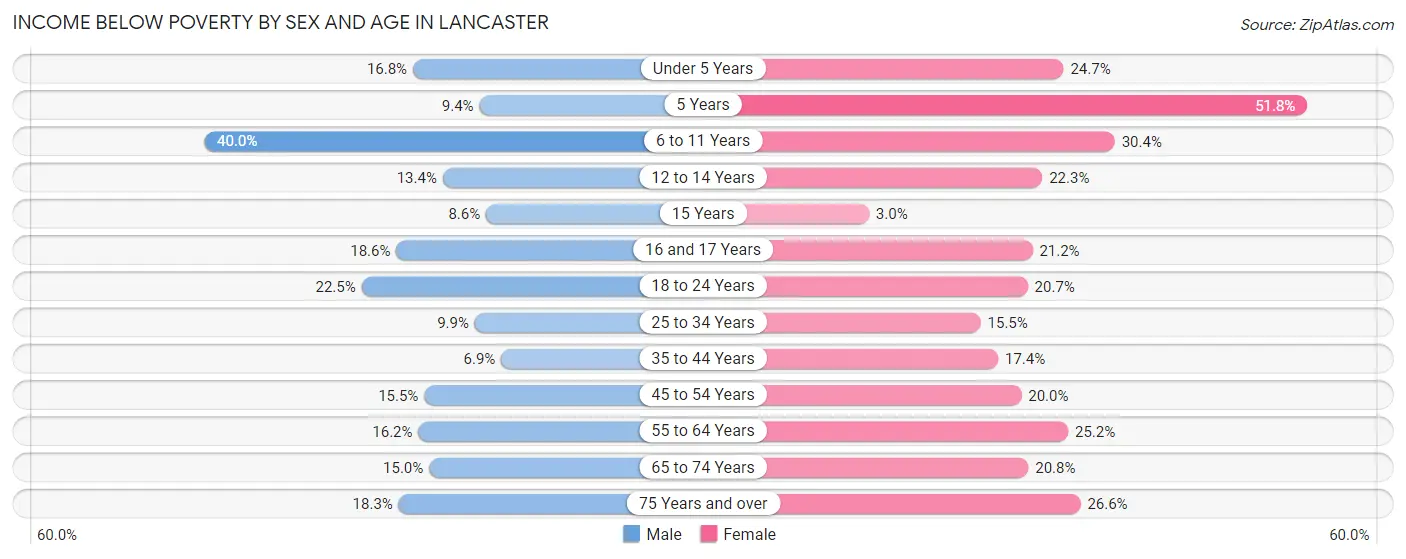
| Age Bracket | Male | Female |
| Under 5 Years | 334 (16.8%) | 463 (24.7%) |
| 5 Years | 23 (9.3%) | 170 (51.8%) |
| 6 to 11 Years | 871 (40.0%) | 719 (30.4%) |
| 12 to 14 Years | 112 (13.4%) | 292 (22.3%) |
| 15 Years | 44 (8.6%) | 7 (3.0%) |
| 16 and 17 Years | 120 (18.6%) | 159 (21.2%) |
| 18 to 24 Years | 606 (22.5%) | 579 (20.7%) |
| 25 to 34 Years | 461 (9.9%) | 910 (15.5%) |
| 35 to 44 Years | 267 (6.9%) | 727 (17.4%) |
| 45 to 54 Years | 374 (15.5%) | 669 (20.0%) |
| 55 to 64 Years | 477 (16.2%) | 775 (25.2%) |
| 65 to 74 Years | 275 (14.9%) | 347 (20.8%) |
| 75 Years and over | 113 (18.3%) | 303 (26.6%) |
| Total | 4,077 (16.0%) | 6,120 (21.1%) |
Income Above Poverty by Sex and Age in Lancaster
According to the poverty statistics in Lancaster, males aged 35 to 44 years and females aged 15 years are the age groups that are most secure financially, with 93.1% of males and 97.0% of females in these age groups living above the poverty line.
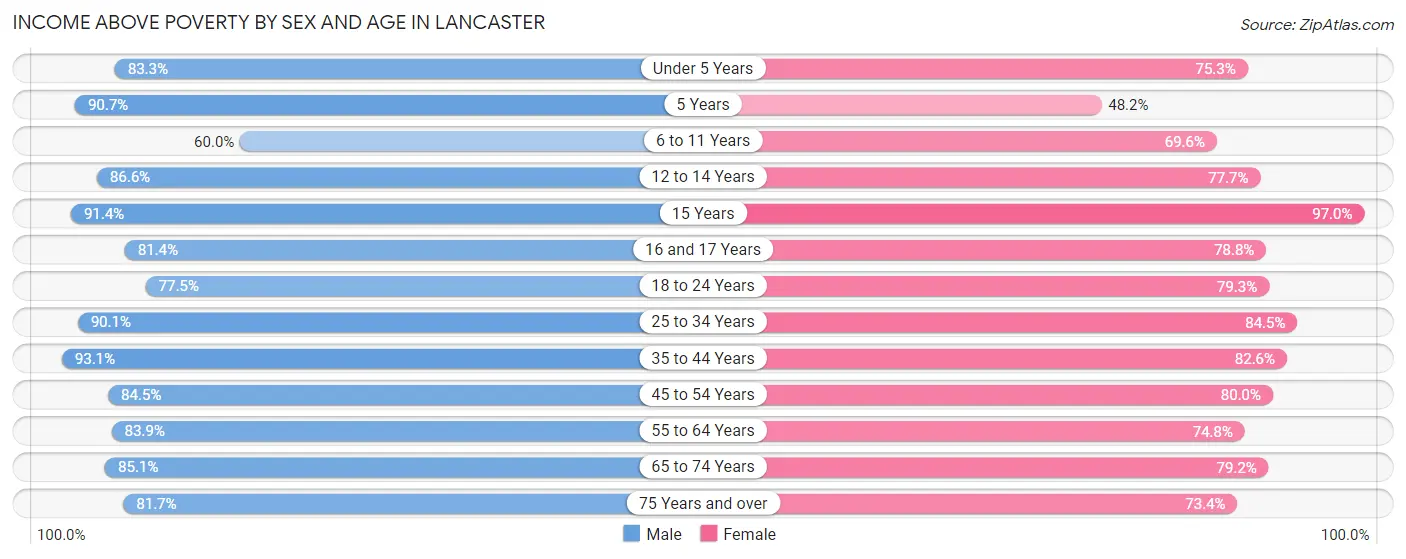
| Age Bracket | Male | Female |
| Under 5 Years | 1,660 (83.3%) | 1,412 (75.3%) |
| 5 Years | 223 (90.6%) | 158 (48.2%) |
| 6 to 11 Years | 1,306 (60.0%) | 1,646 (69.6%) |
| 12 to 14 Years | 722 (86.6%) | 1,016 (77.7%) |
| 15 Years | 467 (91.4%) | 225 (97.0%) |
| 16 and 17 Years | 525 (81.4%) | 590 (78.8%) |
| 18 to 24 Years | 2,091 (77.5%) | 2,218 (79.3%) |
| 25 to 34 Years | 4,215 (90.1%) | 4,975 (84.5%) |
| 35 to 44 Years | 3,594 (93.1%) | 3,451 (82.6%) |
| 45 to 54 Years | 2,039 (84.5%) | 2,678 (80.0%) |
| 55 to 64 Years | 2,476 (83.9%) | 2,300 (74.8%) |
| 65 to 74 Years | 1,565 (85.1%) | 1,324 (79.2%) |
| 75 Years and over | 503 (81.7%) | 837 (73.4%) |
| Total | 21,386 (84.0%) | 22,830 (78.9%) |
Income Below Poverty Among Married-Couple Families in Lancaster
The poverty statistics for married-couple families in Lancaster show that 7.1% or 504 of the total 7,049 families live below the poverty line. Families with 5 or more children have the highest poverty rate of 30.1%, comprising of 25 families. On the other hand, families with 1 or 2 children have the lowest poverty rate of 2.8%, which includes 70 families.
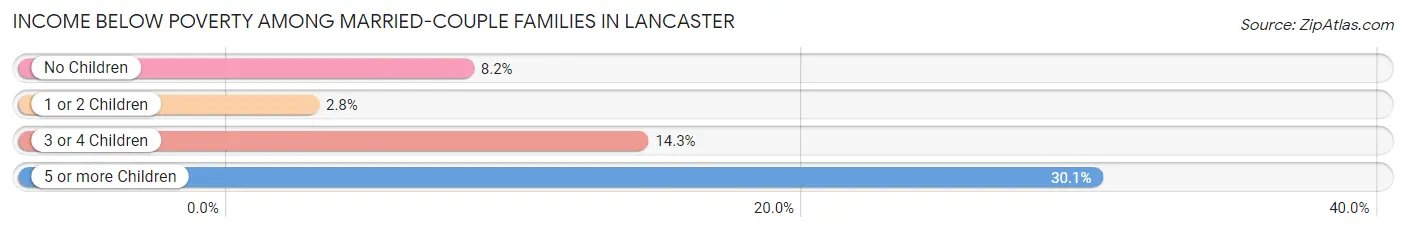
| Children | Above Poverty | Below Poverty |
| No Children | 3,499 (91.8%) | 313 (8.2%) |
| 1 or 2 Children | 2,412 (97.2%) | 70 (2.8%) |
| 3 or 4 Children | 576 (85.7%) | 96 (14.3%) |
| 5 or more Children | 58 (69.9%) | 25 (30.1%) |
| Total | 6,545 (92.8%) | 504 (7.1%) |
Income Below Poverty Among Single-Parent Households in Lancaster
According to the poverty data in Lancaster, 14.0% or 187 single-father households and 30.1% or 1,147 single-mother households are living below the poverty line. Among single-father households, those with 3 or 4 children have the highest poverty rate, with 39 households (55.7%) experiencing poverty. Likewise, among single-mother households, those with 5 or more children have the highest poverty rate, with 61 households (100.0%) falling below the poverty line.
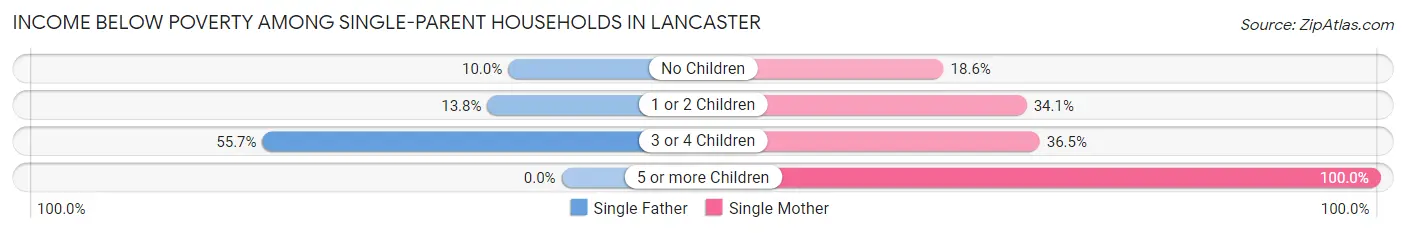
| Children | Single Father | Single Mother |
| No Children | 68 (10.0%) | 249 (18.6%) |
| 1 or 2 Children | 80 (13.8%) | 635 (34.1%) |
| 3 or 4 Children | 39 (55.7%) | 202 (36.5%) |
| 5 or more Children | 0 (0.0%) | 61 (100.0%) |
| Total | 187 (14.0%) | 1,147 (30.1%) |
Income Below Poverty Among Married-Couple vs Single-Parent Households in Lancaster
The poverty data for Lancaster shows that 504 of the married-couple family households (7.1%) and 1,334 of the single-parent households (25.9%) are living below the poverty level. Within the married-couple family households, those with 5 or more children have the highest poverty rate, with 25 households (30.1%) falling below the poverty line. Among the single-parent households, those with 5 or more children have the highest poverty rate, with 61 household (100.0%) living below poverty.
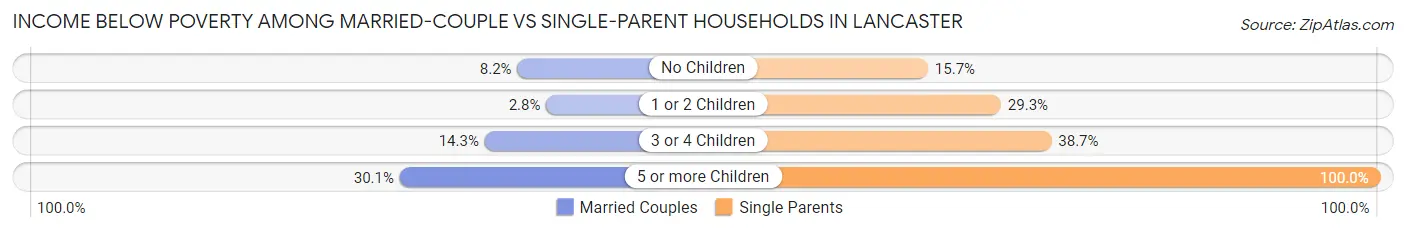
| Children | Married-Couple Families | Single-Parent Households |
| No Children | 313 (8.2%) | 317 (15.7%) |
| 1 or 2 Children | 70 (2.8%) | 715 (29.3%) |
| 3 or 4 Children | 96 (14.3%) | 241 (38.7%) |
| 5 or more Children | 25 (30.1%) | 61 (100.0%) |
| Total | 504 (7.1%) | 1,334 (25.9%) |
Race in Lancaster
The most populous races in Lancaster are White / Caucasian (29,872 | 51.5%), Hispanic or Latino (22,822 | 39.4%), and Black / African American (10,089 | 17.4%).
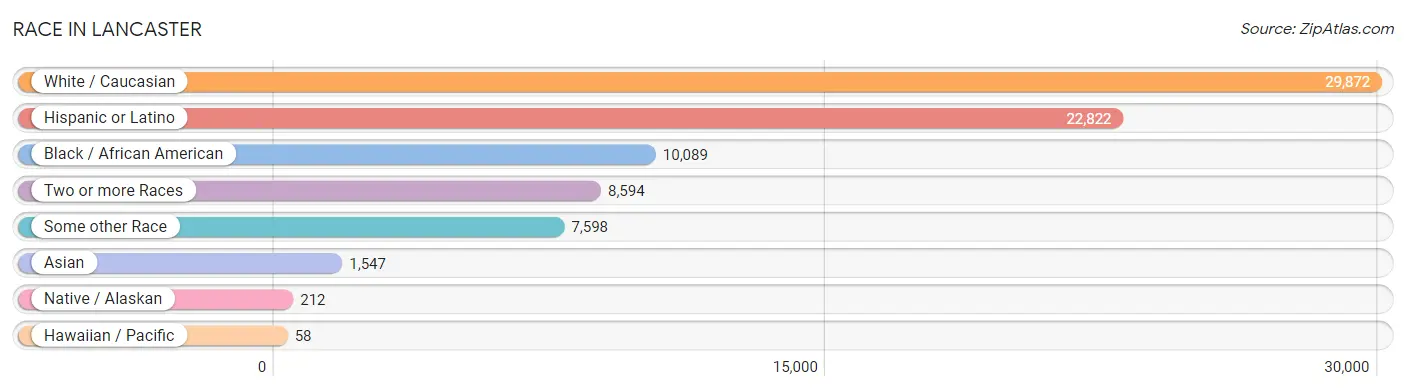
| Race | # Population | % Population |
| Asian | 1,547 | 2.7% |
| Black / African American | 10,089 | 17.4% |
| Hawaiian / Pacific | 58 | 0.1% |
| Hispanic or Latino | 22,822 | 39.4% |
| Native / Alaskan | 212 | 0.4% |
| White / Caucasian | 29,872 | 51.5% |
| Two or more Races | 8,594 | 14.8% |
| Some other Race | 7,598 | 13.1% |
| Total | 57,970 | 100.0% |
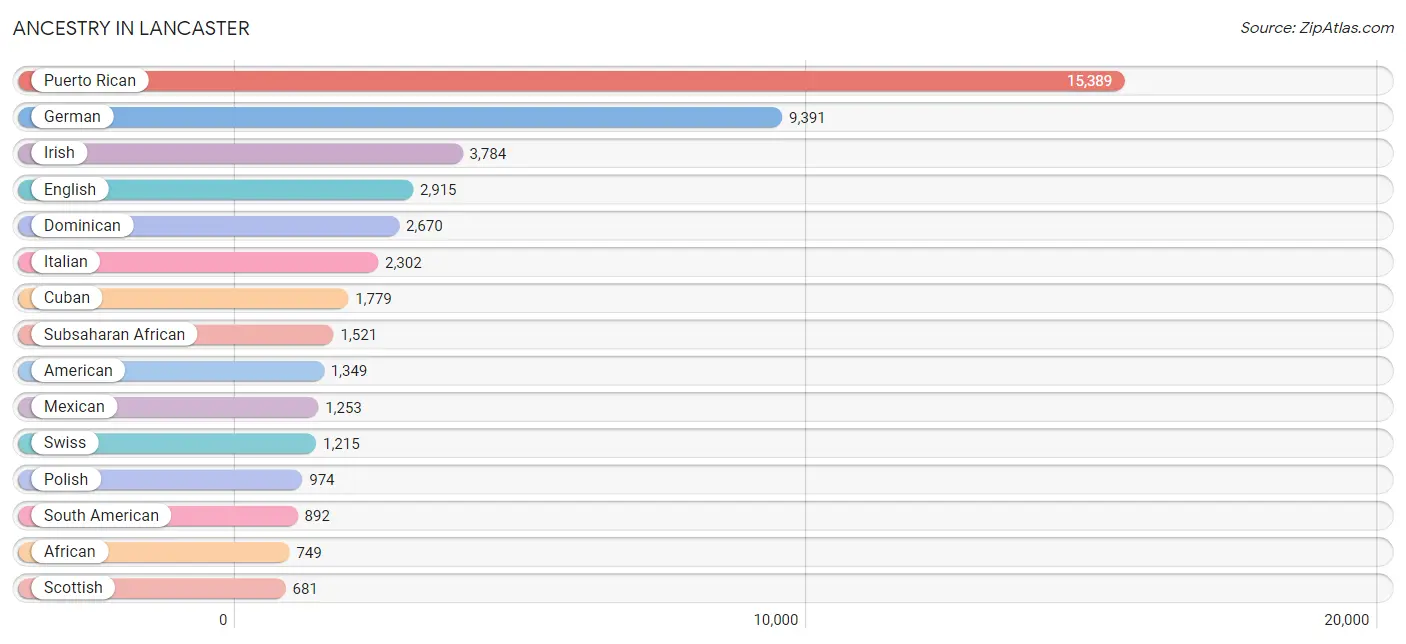
Ancestry in Lancaster
The most populous ancestries reported in Lancaster are Puerto Rican (15,389 | 26.6%), German (9,391 | 16.2%), Irish (3,784 | 6.5%), English (2,915 | 5.0%), and Dominican (2,670 | 4.6%), together accounting for 58.9% of all Lancaster residents.
| Ancestry | # Population | % Population |
| African | 749 | 1.3% |
| American | 1,349 | 2.3% |
| Apache | 89 | 0.2% |
| Arab | 136 | 0.2% |
| Armenian | 21 | 0.0% |
| Assyrian / Chaldean / Syriac | 10 | 0.0% |
| Austrian | 19 | 0.0% |
| Belgian | 18 | 0.0% |
| Bhutanese | 7 | 0.0% |
| Blackfeet | 51 | 0.1% |
| Bolivian | 9 | 0.0% |
| Brazilian | 17 | 0.0% |
| British | 257 | 0.4% |
| Burmese | 224 | 0.4% |
| Canadian | 56 | 0.1% |
| Celtic | 13 | 0.0% |
| Central American | 288 | 0.5% |
| Central American Indian | 129 | 0.2% |
| Cherokee | 218 | 0.4% |
| Chilean | 39 | 0.1% |
| Choctaw | 17 | 0.0% |
| Colombian | 526 | 0.9% |
| Costa Rican | 8 | 0.0% |
| Croatian | 19 | 0.0% |
| Cuban | 1,779 | 3.1% |
| Czech | 65 | 0.1% |
| Czechoslovakian | 60 | 0.1% |
| Danish | 20 | 0.0% |
| Dominican | 2,670 | 4.6% |
| Dutch | 284 | 0.5% |
| Dutch West Indian | 2 | 0.0% |
| Eastern European | 101 | 0.2% |
| Ecuadorian | 33 | 0.1% |
| English | 2,915 | 5.0% |
| Ethiopian | 202 | 0.4% |
| European | 462 | 0.8% |
| Finnish | 39 | 0.1% |
| French | 495 | 0.9% |
| French American Indian | 1 | 0.0% |
| French Canadian | 48 | 0.1% |
| German | 9,391 | 16.2% |
| Greek | 146 | 0.3% |
| Guatemalan | 151 | 0.3% |
| Haitian | 368 | 0.6% |
| Honduran | 44 | 0.1% |
| Hungarian | 115 | 0.2% |
| Indian (Asian) | 603 | 1.0% |
| Indonesian | 69 | 0.1% |
| Inupiat | 44 | 0.1% |
| Irish | 3,784 | 6.5% |
| Iroquois | 5 | 0.0% |
| Israeli | 10 | 0.0% |
| Italian | 2,302 | 4.0% |
| Jamaican | 316 | 0.5% |
| Japanese | 369 | 0.6% |
| Jordanian | 20 | 0.0% |
| Korean | 188 | 0.3% |
| Laotian | 7 | 0.0% |
| Latvian | 146 | 0.3% |
| Lebanese | 60 | 0.1% |
| Lithuanian | 71 | 0.1% |
| Malaysian | 13 | 0.0% |
| Mexican | 1,253 | 2.2% |
| Mexican American Indian | 47 | 0.1% |
| Native Hawaiian | 110 | 0.2% |
| Navajo | 2 | 0.0% |
| Nicaraguan | 17 | 0.0% |
| Nigerian | 84 | 0.1% |
| Northern European | 76 | 0.1% |
| Norwegian | 148 | 0.3% |
| Pakistani | 9 | 0.0% |
| Palestinian | 26 | 0.0% |
| Panamanian | 44 | 0.1% |
| Pennsylvania German | 202 | 0.4% |
| Peruvian | 236 | 0.4% |
| Polish | 974 | 1.7% |
| Portuguese | 117 | 0.2% |
| Puerto Rican | 15,389 | 26.6% |
| Romanian | 22 | 0.0% |
| Russian | 58 | 0.1% |
| Salvadoran | 24 | 0.0% |
| Samoan | 25 | 0.0% |
| Scandinavian | 37 | 0.1% |
| Scotch-Irish | 349 | 0.6% |
| Scottish | 681 | 1.2% |
| Serbian | 139 | 0.2% |
| Slavic | 27 | 0.1% |
| Slovak | 69 | 0.1% |
| South American | 892 | 1.5% |
| Spaniard | 51 | 0.1% |
| Spanish | 154 | 0.3% |
| Sri Lankan | 411 | 0.7% |
| Subsaharan African | 1,521 | 2.6% |
| Swedish | 206 | 0.4% |
| Swiss | 1,215 | 2.1% |
| Thai | 147 | 0.3% |
| Turkish | 16 | 0.0% |
| Ukrainian | 171 | 0.3% |
| Venezuelan | 49 | 0.1% |
| Welsh | 429 | 0.7% |
| West Indian | 41 | 0.1% |
| Yugoslavian | 6 | 0.0% | View All 102 Rows |
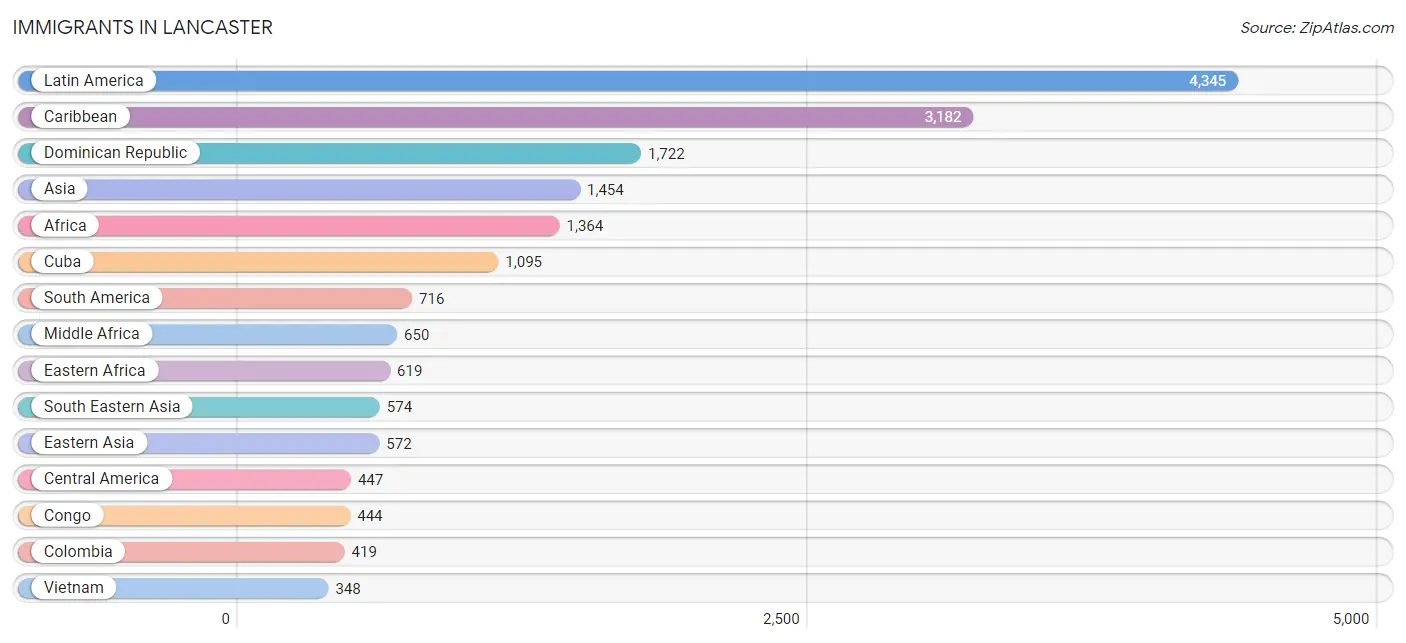
Immigrants in Lancaster
The most numerous immigrant groups reported in Lancaster came from Latin America (4,345 | 7.5%), Caribbean (3,182 | 5.5%), Dominican Republic (1,722 | 3.0%), Asia (1,454 | 2.5%), and Africa (1,364 | 2.4%), together accounting for 20.8% of all Lancaster residents.
| Immigration Origin | # Population | % Population |
| Africa | 1,364 | 2.4% |
| Asia | 1,454 | 2.5% |
| Australia | 8 | 0.0% |
| Bosnia and Herzegovina | 16 | 0.0% |
| Cambodia | 50 | 0.1% |
| Cameroon | 5 | 0.0% |
| Canada | 42 | 0.1% |
| Caribbean | 3,182 | 5.5% |
| Central America | 447 | 0.8% |
| China | 286 | 0.5% |
| Colombia | 419 | 0.7% |
| Congo | 444 | 0.8% |
| Costa Rica | 8 | 0.0% |
| Cuba | 1,095 | 1.9% |
| Dominican Republic | 1,722 | 3.0% |
| Eastern Africa | 619 | 1.1% |
| Eastern Asia | 572 | 1.0% |
| Eastern Europe | 111 | 0.2% |
| Ecuador | 8 | 0.0% |
| Egypt | 15 | 0.0% |
| El Salvador | 24 | 0.0% |
| England | 8 | 0.0% |
| Ethiopia | 229 | 0.4% |
| Europe | 194 | 0.3% |
| France | 21 | 0.0% |
| Germany | 15 | 0.0% |
| Greece | 7 | 0.0% |
| Guatemala | 135 | 0.2% |
| Haiti | 347 | 0.6% |
| Honduras | 39 | 0.1% |
| Hong Kong | 12 | 0.0% |
| Hungary | 17 | 0.0% |
| India | 14 | 0.0% |
| Indonesia | 7 | 0.0% |
| Israel | 6 | 0.0% |
| Italy | 30 | 0.1% |
| Jamaica | 9 | 0.0% |
| Japan | 7 | 0.0% |
| Jordan | 8 | 0.0% |
| Kenya | 7 | 0.0% |
| Korea | 279 | 0.5% |
| Latin America | 4,345 | 7.5% |
| Mexico | 241 | 0.4% |
| Middle Africa | 650 | 1.1% |
| Nepal | 218 | 0.4% |
| Nigeria | 31 | 0.1% |
| Northern Africa | 35 | 0.1% |
| Northern Europe | 8 | 0.0% |
| Oceania | 20 | 0.0% |
| Peru | 229 | 0.4% |
| Philippines | 51 | 0.1% |
| Romania | 16 | 0.0% |
| Russia | 14 | 0.0% |
| Somalia | 31 | 0.1% |
| South America | 716 | 1.2% |
| South Central Asia | 294 | 0.5% |
| South Eastern Asia | 574 | 1.0% |
| Southern Europe | 39 | 0.1% |
| Spain | 2 | 0.0% |
| Thailand | 50 | 0.1% |
| Trinidad and Tobago | 9 | 0.0% |
| Uganda | 117 | 0.2% |
| Ukraine | 48 | 0.1% |
| Venezuela | 60 | 0.1% |
| Vietnam | 348 | 0.6% |
| Western Africa | 40 | 0.1% |
| Western Asia | 14 | 0.0% |
| Western Europe | 36 | 0.1% |
| Zaire | 201 | 0.4% | View All 69 Rows |
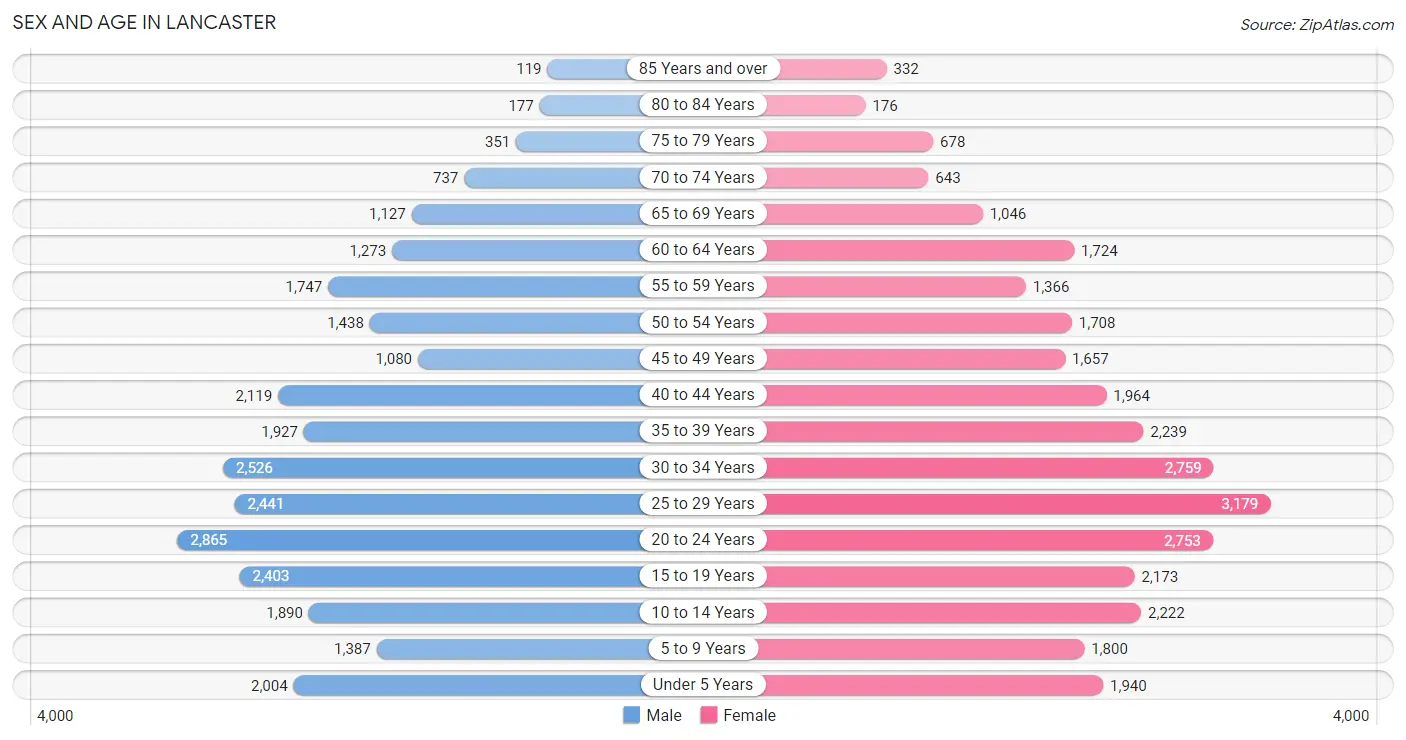
Sex and Age in Lancaster
Sex and Age in Lancaster
The most populous age groups in Lancaster are 20 to 24 Years (2,865 | 10.4%) for men and 25 to 29 Years (3,179 | 10.5%) for women.
| Age Bracket | Male | Female |
| Under 5 Years | 2,004 (7.3%) | 1,940 (6.4%) |
| 5 to 9 Years | 1,387 (5.0%) | 1,800 (5.9%) |
| 10 to 14 Years | 1,890 (6.9%) | 2,222 (7.3%) |
| 15 to 19 Years | 2,403 (8.7%) | 2,173 (7.2%) |
| 20 to 24 Years | 2,865 (10.4%) | 2,753 (9.1%) |
| 25 to 29 Years | 2,441 (8.8%) | 3,179 (10.5%) |
| 30 to 34 Years | 2,526 (9.1%) | 2,759 (9.1%) |
| 35 to 39 Years | 1,927 (7.0%) | 2,239 (7.4%) |
| 40 to 44 Years | 2,119 (7.7%) | 1,964 (6.5%) |
| 45 to 49 Years | 1,080 (3.9%) | 1,657 (5.5%) |
| 50 to 54 Years | 1,438 (5.2%) | 1,708 (5.6%) |
| 55 to 59 Years | 1,747 (6.3%) | 1,366 (4.5%) |
| 60 to 64 Years | 1,273 (4.6%) | 1,724 (5.7%) |
| 65 to 69 Years | 1,127 (4.1%) | 1,046 (3.5%) |
| 70 to 74 Years | 737 (2.7%) | 643 (2.1%) |
| 75 to 79 Years | 351 (1.3%) | 678 (2.2%) |
| 80 to 84 Years | 177 (0.6%) | 176 (0.6%) |
| 85 Years and over | 119 (0.4%) | 332 (1.1%) |
| Total | 27,611 (100.0%) | 30,359 (100.0%) |
Families and Households in Lancaster
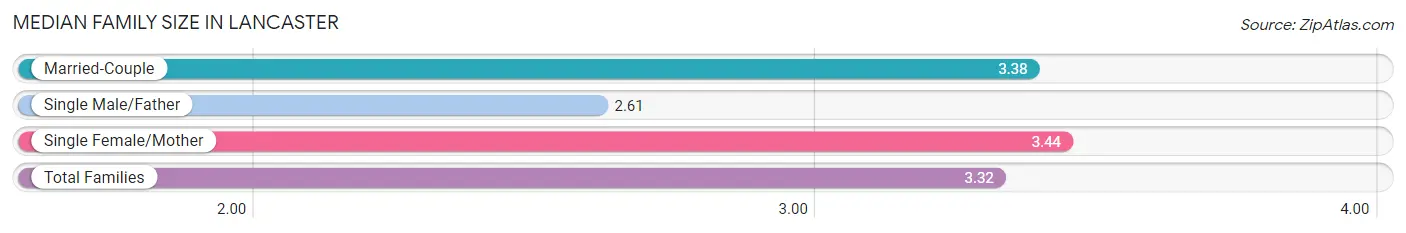
Median Family Size in Lancaster
The median family size in Lancaster is 3.32 persons per family, with single female/mother families (3,813 | 31.3%) accounting for the largest median family size of 3.44 persons per family. On the other hand, single male/father families (1,332 | 10.9%) represent the smallest median family size with 2.61 persons per family.
| Family Type | # Families | Family Size |
| Married-Couple | 7,049 (57.8%) | 3.38 |
| Single Male/Father | 1,332 (10.9%) | 2.61 |
| Single Female/Mother | 3,813 (31.3%) | 3.44 |
| Total Families | 12,194 (100.0%) | 3.32 |
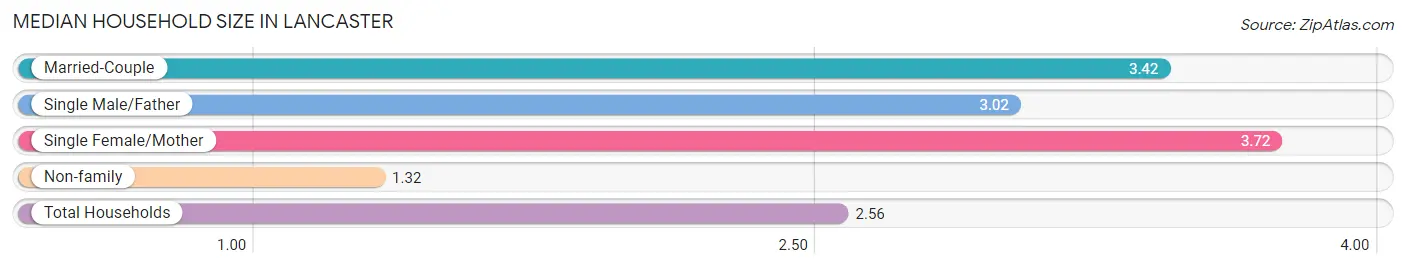
Median Household Size in Lancaster
The median household size in Lancaster is 2.56 persons per household, with single female/mother households (3,813 | 18.0%) accounting for the largest median household size of 3.72 persons per household. non-family households (9,040 | 42.6%) represent the smallest median household size with 1.32 persons per household.
| Household Type | # Households | Household Size |
| Married-Couple | 7,049 (33.2%) | 3.42 |
| Single Male/Father | 1,332 (6.3%) | 3.02 |
| Single Female/Mother | 3,813 (18.0%) | 3.72 |
| Non-family | 9,040 (42.6%) | 1.32 |
| Total Households | 21,234 (100.0%) | 2.56 |
Household Size by Marriage Status in Lancaster
Out of a total of 21,234 households in Lancaster, 12,194 (57.4%) are family households, while 9,040 (42.6%) are nonfamily households. The most numerous type of family households are 2-person households, comprising 4,370, and the most common type of nonfamily households are 1-person households, comprising 6,651.
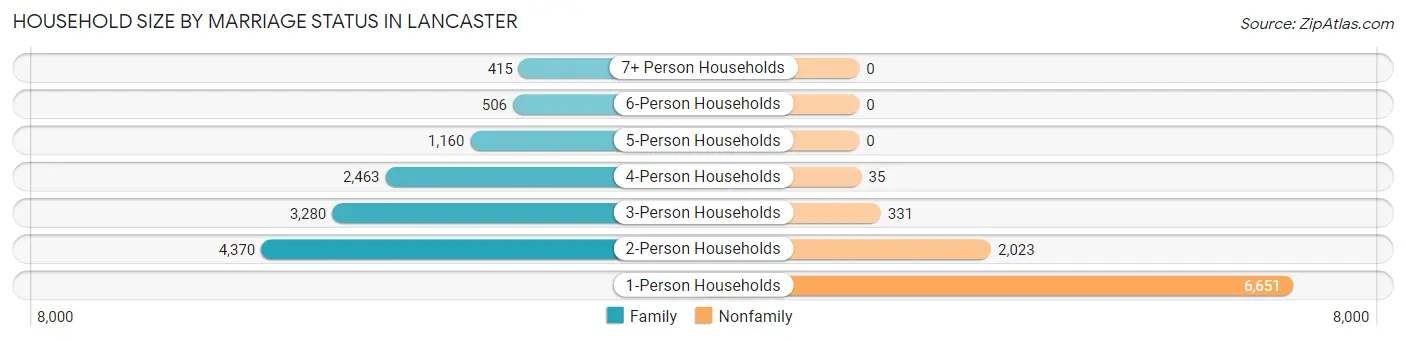
| Household Size | Family Households | Nonfamily Households |
| 1-Person Households | - | 6,651 (31.3%) |
| 2-Person Households | 4,370 (20.6%) | 2,023 (9.5%) |
| 3-Person Households | 3,280 (15.4%) | 331 (1.6%) |
| 4-Person Households | 2,463 (11.6%) | 35 (0.2%) |
| 5-Person Households | 1,160 (5.5%) | 0 (0.0%) |
| 6-Person Households | 506 (2.4%) | 0 (0.0%) |
| 7+ Person Households | 415 (1.9%) | 0 (0.0%) |
| Total | 12,194 (57.4%) | 9,040 (42.6%) |
Female Fertility in Lancaster
Fertility by Age in Lancaster
Average fertility rate in Lancaster is 63.0 births per 1,000 women. Women in the age bracket of 20 to 34 years have the highest fertility rate with 94.0 births per 1,000 women. Women in the age bracket of 20 to 34 years acount for 75.4% of all women with births.
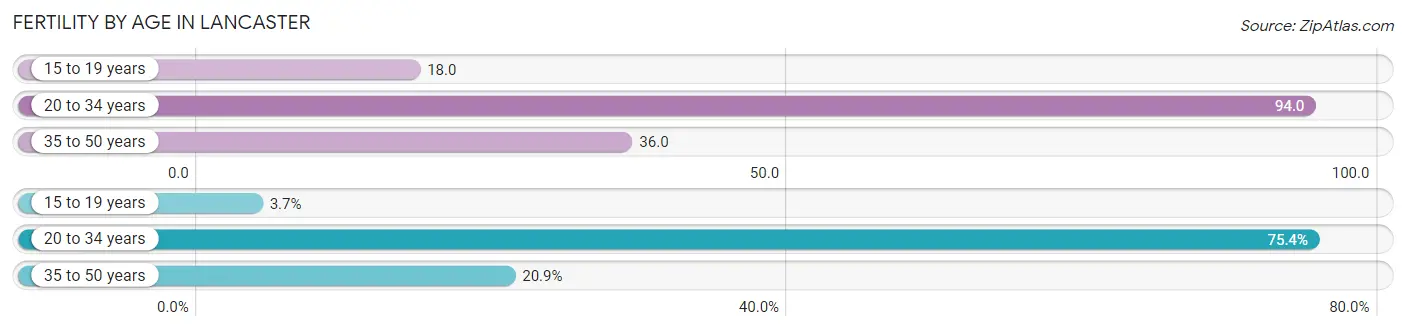
| Age Bracket | Women with Births | Births / 1,000 Women |
| 15 to 19 years | 40 (3.7%) | 18.0 |
| 20 to 34 years | 814 (75.4%) | 94.0 |
| 35 to 50 years | 225 (20.8%) | 36.0 |
| Total | 1,079 (100.0%) | 63.0 |
Fertility by Age by Marriage Status in Lancaster
61.6% of women with births (1,079) in Lancaster are married. The highest percentage of unmarried women with births falls into 15 to 19 years age bracket with 100.0% of them unmarried at the time of birth, while the lowest percentage of unmarried women with births belong to 35 to 50 years age bracket with 14.2% of them unmarried.
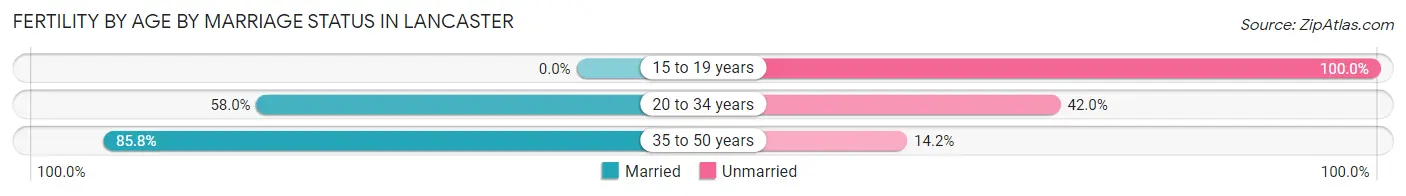
| Age Bracket | Married | Unmarried |
| 15 to 19 years | 0 (0.0%) | 40 (100.0%) |
| 20 to 34 years | 472 (58.0%) | 342 (42.0%) |
| 35 to 50 years | 193 (85.8%) | 32 (14.2%) |
| Total | 665 (61.6%) | 414 (38.4%) |
Fertility by Education in Lancaster
Average fertility rate in Lancaster is 63.0 births per 1,000 women. Women with the education attainment of bachelor's degree have the highest fertility rate of 92.0 births per 1,000 women, while women with the education attainment of less than high school have the lowest fertility at 28.0 births per 1,000 women. Women with the education attainment of college or associate's degree represent 32.2% of all women with births.
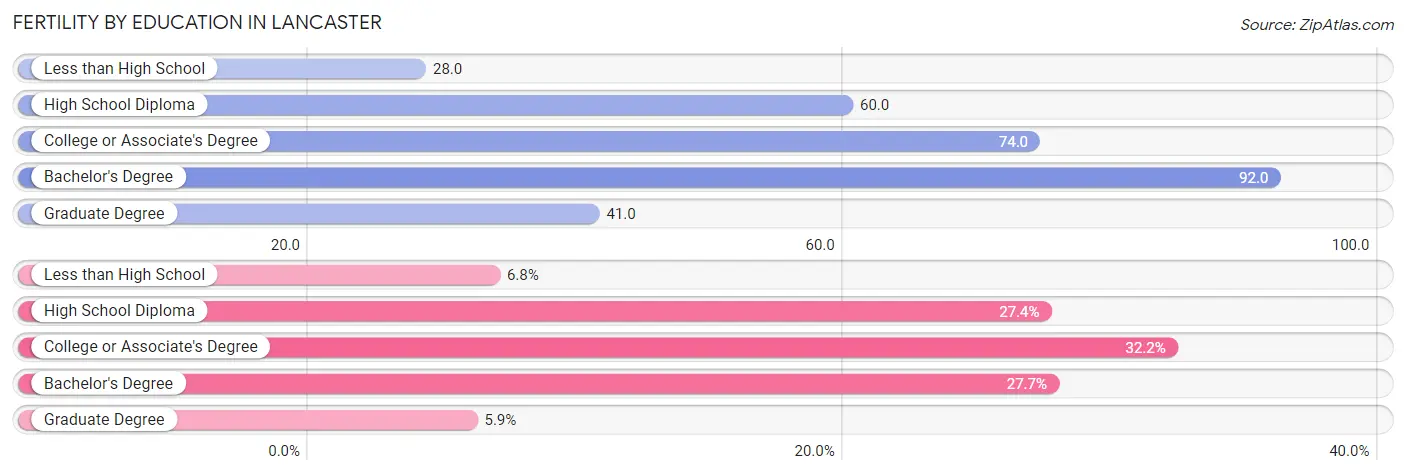
| Educational Attainment | Women with Births | Births / 1,000 Women |
| Less than High School | 73 (6.8%) | 28.0 |
| High School Diploma | 296 (27.4%) | 60.0 |
| College or Associate's Degree | 347 (32.2%) | 74.0 |
| Bachelor's Degree | 299 (27.7%) | 92.0 |
| Graduate Degree | 64 (5.9%) | 41.0 |
| Total | 1,079 (100.0%) | 63.0 |
Fertility by Education by Marriage Status in Lancaster
38.4% of women with births in Lancaster are unmarried. Women with the educational attainment of graduate degree are most likely to be married with 100.0% of them married at childbirth, while women with the educational attainment of high school diploma are least likely to be married with 73.0% of them unmarried at childbirth.
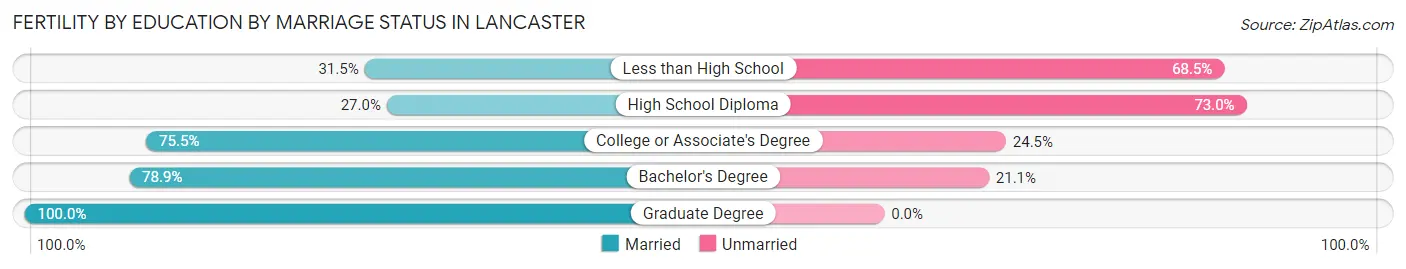
| Educational Attainment | Married | Unmarried |
| Less than High School | 23 (31.5%) | 50 (68.5%) |
| High School Diploma | 80 (27.0%) | 216 (73.0%) |
| College or Associate's Degree | 262 (75.5%) | 85 (24.5%) |
| Bachelor's Degree | 236 (78.9%) | 63 (21.1%) |
| Graduate Degree | 64 (100.0%) | 0 (0.0%) |
| Total | 665 (61.6%) | 414 (38.4%) |
Employment Characteristics in Lancaster
Employment by Class of Employer in Lancaster
Among the 28,619 employed individuals in Lancaster, private company employees (20,116 | 70.3%), not-for-profit organizations (4,390 | 15.3%), and local government employees (1,417 | 5.0%) make up the most common classes of employment.
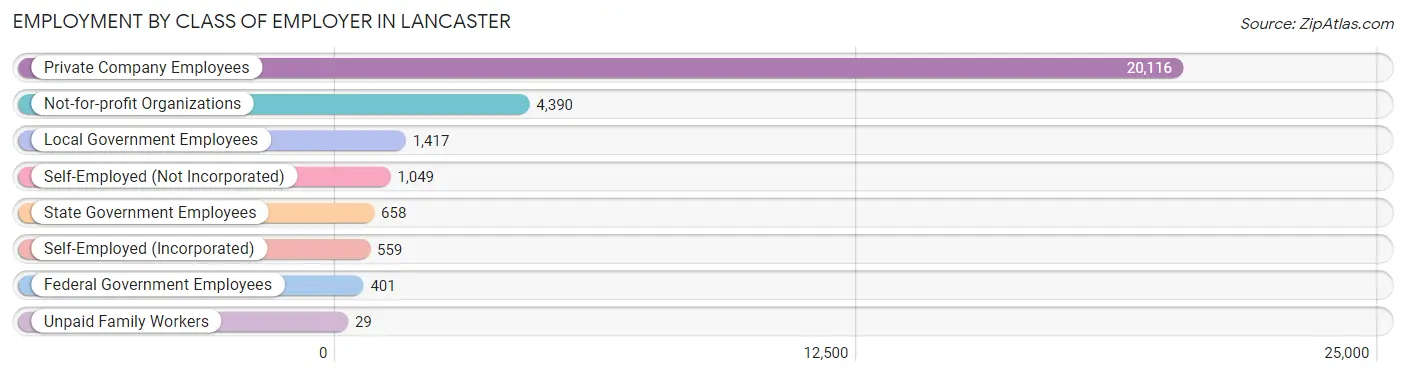
| Employer Class | # Employees | % Employees |
| Private Company Employees | 20,116 | 70.3% |
| Self-Employed (Incorporated) | 559 | 1.9% |
| Self-Employed (Not Incorporated) | 1,049 | 3.7% |
| Not-for-profit Organizations | 4,390 | 15.3% |
| Local Government Employees | 1,417 | 5.0% |
| State Government Employees | 658 | 2.3% |
| Federal Government Employees | 401 | 1.4% |
| Unpaid Family Workers | 29 | 0.1% |
| Total | 28,619 | 100.0% |
Employment Status by Age in Lancaster
According to the labor force statistics for Lancaster, out of the total population over 16 years of age (45,979), 68.7% or 31,588 individuals are in the labor force, with 7.4% or 2,338 of them unemployed. The age group with the highest labor force participation rate is 25 to 29 years, with 84.6% or 4,755 individuals in the labor force. Within the labor force, the 20 to 24 years age range has the highest percentage of unemployed individuals, with 18.2% or 748 of them being unemployed.
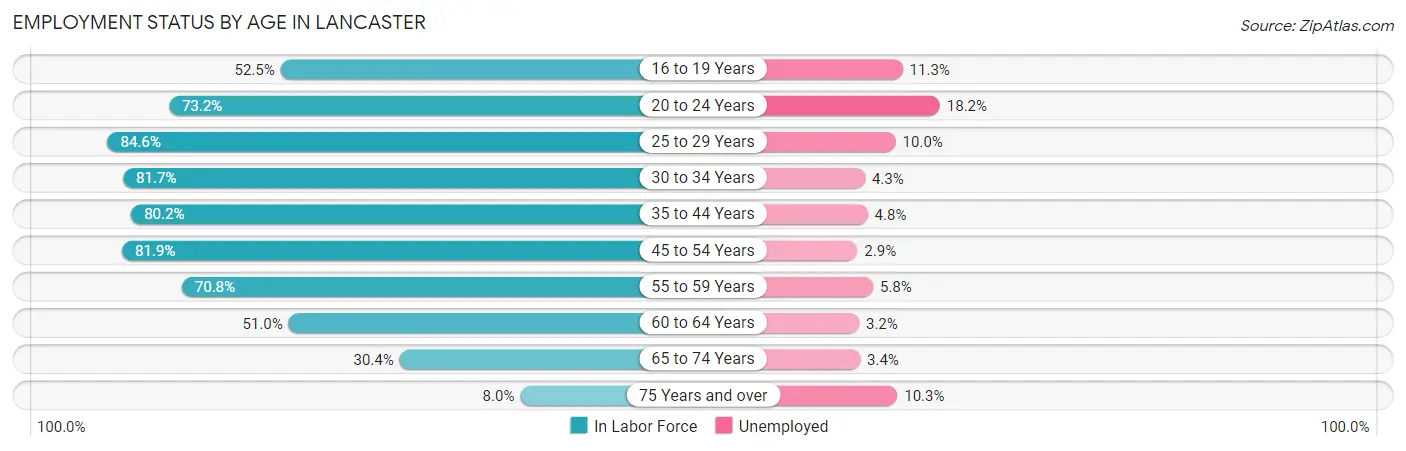
| Age Bracket | In Labor Force | Unemployed |
| 16 to 19 Years | 2,010 (52.5%) | 227 (11.3%) |
| 20 to 24 Years | 4,112 (73.2%) | 748 (18.2%) |
| 25 to 29 Years | 4,755 (84.6%) | 476 (10.0%) |
| 30 to 34 Years | 4,318 (81.7%) | 186 (4.3%) |
| 35 to 44 Years | 6,616 (80.2%) | 318 (4.8%) |
| 45 to 54 Years | 4,818 (81.9%) | 140 (2.9%) |
| 55 to 59 Years | 2,204 (70.8%) | 128 (5.8%) |
| 60 to 64 Years | 1,528 (51.0%) | 49 (3.2%) |
| 65 to 74 Years | 1,080 (30.4%) | 37 (3.4%) |
| 75 Years and over | 147 (8.0%) | 15 (10.3%) |
| Total | 31,588 (68.7%) | 2,338 (7.4%) |
Employment Status by Educational Attainment in Lancaster
According to labor force statistics for Lancaster, 77.8% of individuals (24,232) out of the total population between 25 and 64 years of age (31,147) are in the labor force, with 5.3% or 1,284 of them being unemployed. The group with the highest labor force participation rate are those with the educational attainment of bachelor's degree or higher, with 90.9% or 8,201 individuals in the labor force. Within the labor force, individuals with less than high school education have the highest percentage of unemployment, with 8.0% or 174 of them being unemployed.
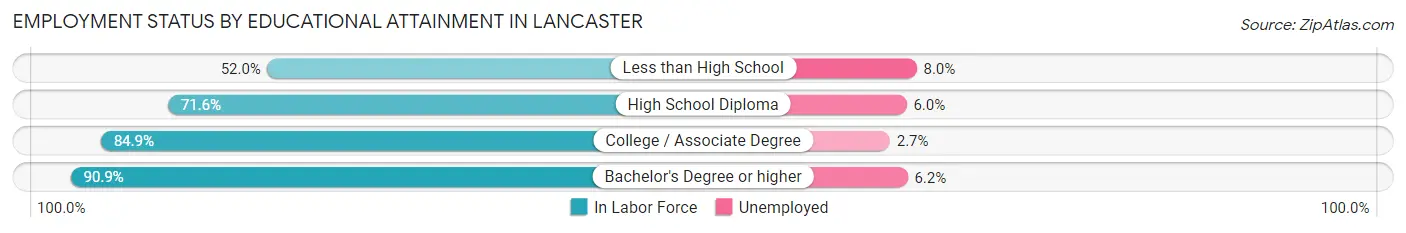
| Educational Attainment | In Labor Force | Unemployed |
| Less than High School | 2,179 (52.0%) | 335 (8.0%) |
| High School Diploma | 7,348 (71.6%) | 616 (6.0%) |
| College / Associate Degree | 6,513 (84.9%) | 207 (2.7%) |
| Bachelor's Degree or higher | 8,201 (90.9%) | 559 (6.2%) |
| Total | 24,232 (77.8%) | 1,651 (5.3%) |
Employment Occupations by Sex in Lancaster
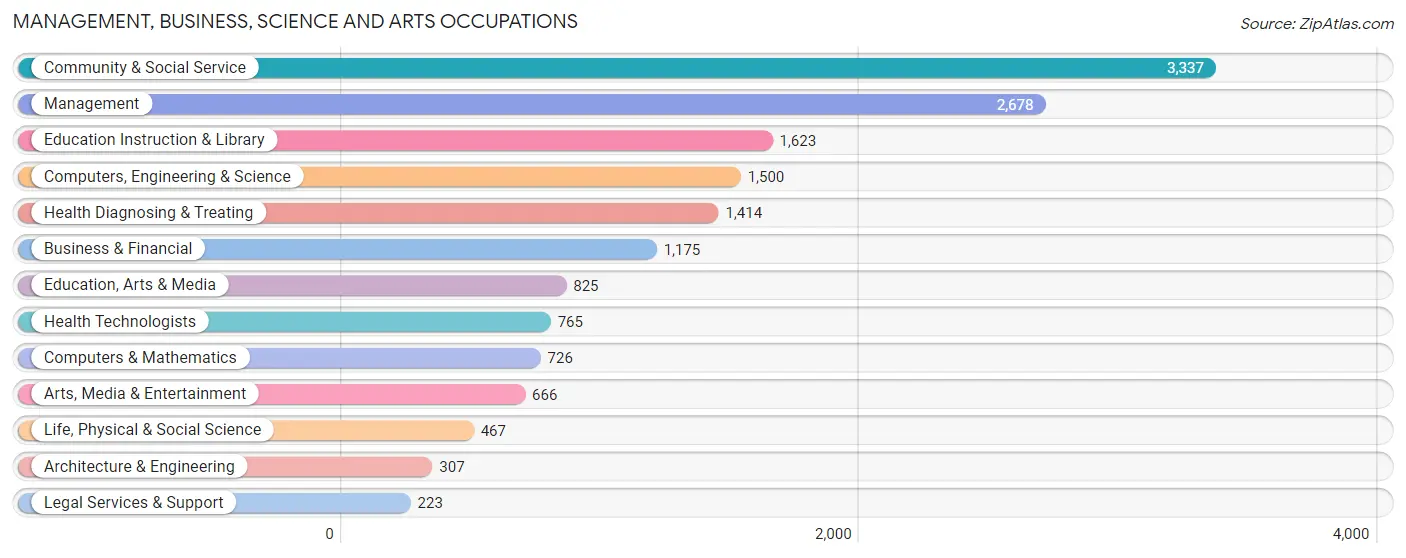
Management, Business, Science and Arts Occupations
The most common Management, Business, Science and Arts occupations in Lancaster are Community & Social Service (3,337 | 11.4%), Management (2,678 | 9.1%), Education Instruction & Library (1,623 | 5.6%), Computers, Engineering & Science (1,500 | 5.1%), and Health Diagnosing & Treating (1,414 | 4.8%).
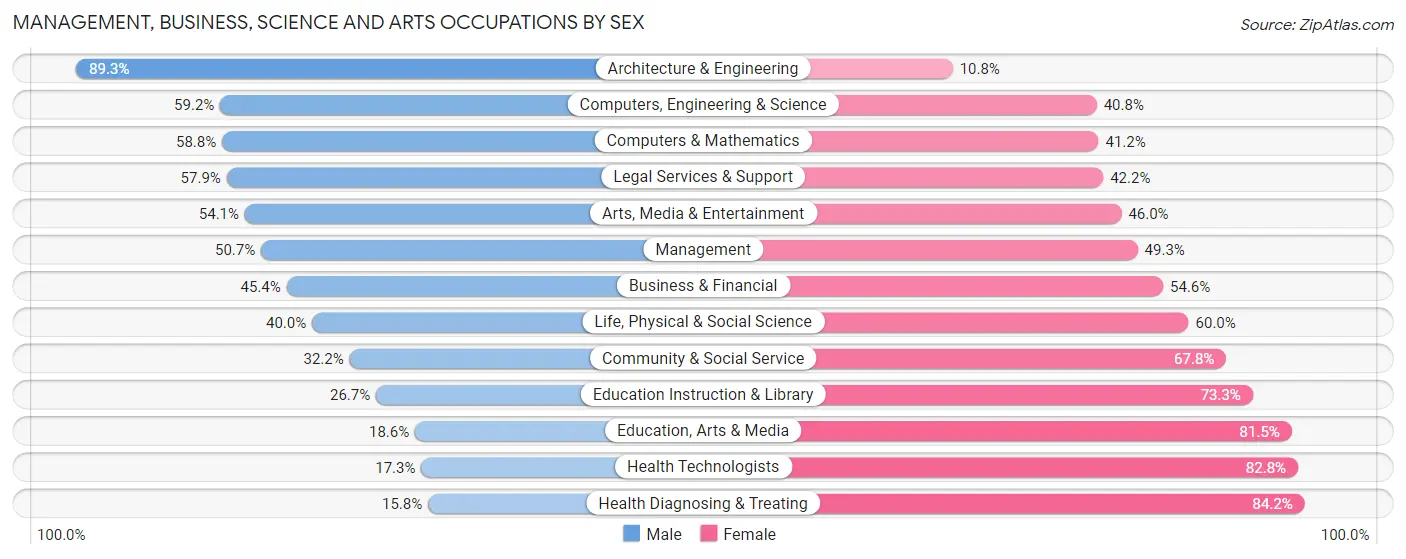
Management, Business, Science and Arts Occupations by Sex
Within the Management, Business, Science and Arts occupations in Lancaster, the most male-oriented occupations are Architecture & Engineering (89.2%), Computers, Engineering & Science (59.2%), and Computers & Mathematics (58.8%), while the most female-oriented occupations are Health Diagnosing & Treating (84.2%), Health Technologists (82.8%), and Education, Arts & Media (81.5%).
| Occupation | Male | Female |
| Management | 1,357 (50.7%) | 1,321 (49.3%) |
| Business & Financial | 533 (45.4%) | 642 (54.6%) |
| Computers, Engineering & Science | 888 (59.2%) | 612 (40.8%) |
| Computers & Mathematics | 427 (58.8%) | 299 (41.2%) |
| Architecture & Engineering | 274 (89.2%) | 33 (10.7%) |
| Life, Physical & Social Science | 187 (40.0%) | 280 (60.0%) |
| Community & Social Service | 1,075 (32.2%) | 2,262 (67.8%) |
| Education, Arts & Media | 153 (18.5%) | 672 (81.5%) |
| Legal Services & Support | 129 (57.9%) | 94 (42.1%) |
| Education Instruction & Library | 433 (26.7%) | 1,190 (73.3%) |
| Arts, Media & Entertainment | 360 (54.0%) | 306 (46.0%) |
| Health Diagnosing & Treating | 224 (15.8%) | 1,190 (84.2%) |
| Health Technologists | 132 (17.2%) | 633 (82.8%) |
| Total (Category) | 4,077 (40.4%) | 6,027 (59.7%) |
| Total (Overall) | 14,349 (49.0%) | 14,916 (51.0%) |
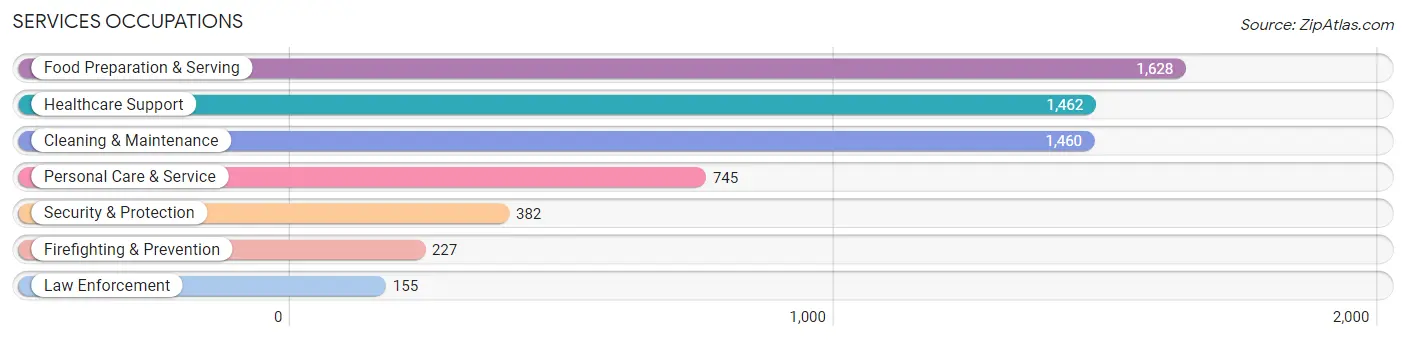
Services Occupations
The most common Services occupations in Lancaster are Food Preparation & Serving (1,628 | 5.6%), Healthcare Support (1,462 | 5.0%), Cleaning & Maintenance (1,460 | 5.0%), Personal Care & Service (745 | 2.5%), and Security & Protection (382 | 1.3%).
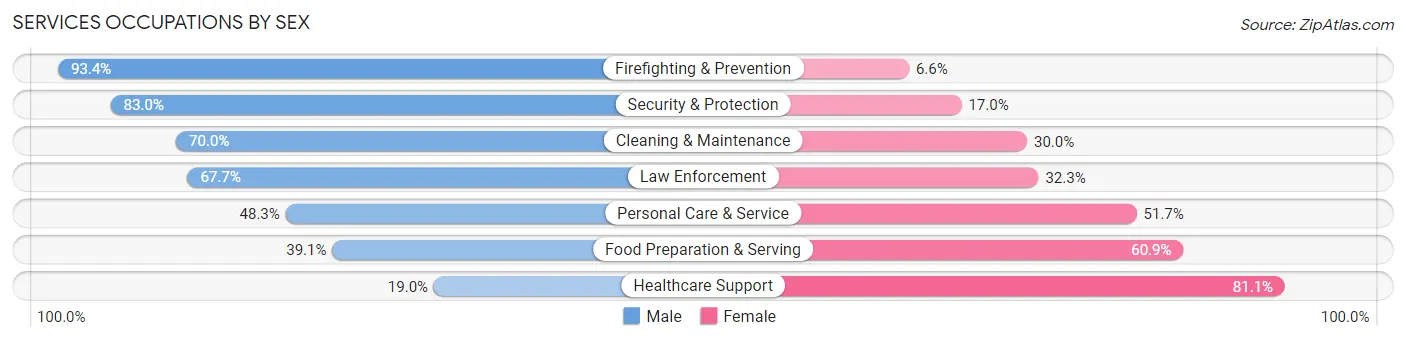
Services Occupations by Sex
Within the Services occupations in Lancaster, the most male-oriented occupations are Firefighting & Prevention (93.4%), Security & Protection (83.0%), and Cleaning & Maintenance (70.0%), while the most female-oriented occupations are Healthcare Support (81.0%), Food Preparation & Serving (60.9%), and Personal Care & Service (51.7%).
| Occupation | Male | Female |
| Healthcare Support | 277 (19.0%) | 1,185 (81.0%) |
| Security & Protection | 317 (83.0%) | 65 (17.0%) |
| Firefighting & Prevention | 212 (93.4%) | 15 (6.6%) |
| Law Enforcement | 105 (67.7%) | 50 (32.3%) |
| Food Preparation & Serving | 636 (39.1%) | 992 (60.9%) |
| Cleaning & Maintenance | 1,022 (70.0%) | 438 (30.0%) |
| Personal Care & Service | 360 (48.3%) | 385 (51.7%) |
| Total (Category) | 2,612 (46.0%) | 3,065 (54.0%) |
| Total (Overall) | 14,349 (49.0%) | 14,916 (51.0%) |
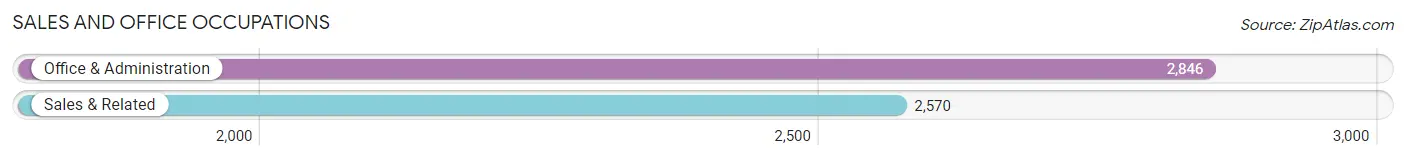
Sales and Office Occupations
The most common Sales and Office occupations in Lancaster are Office & Administration (2,846 | 9.7%), and Sales & Related (2,570 | 8.8%).
Sales and Office Occupations by Sex
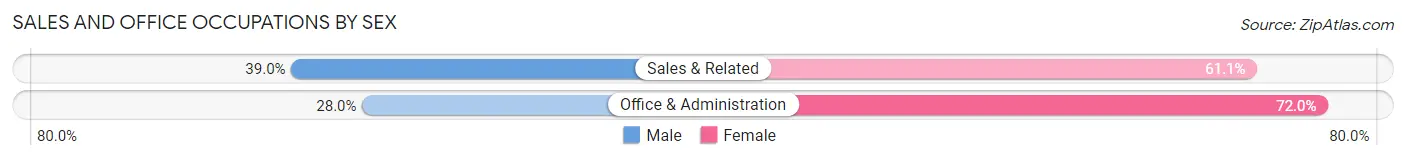
| Occupation | Male | Female |
| Sales & Related | 1,001 (39.0%) | 1,569 (61.1%) |
| Office & Administration | 798 (28.0%) | 2,048 (72.0%) |
| Total (Category) | 1,799 (33.2%) | 3,617 (66.8%) |
| Total (Overall) | 14,349 (49.0%) | 14,916 (51.0%) |
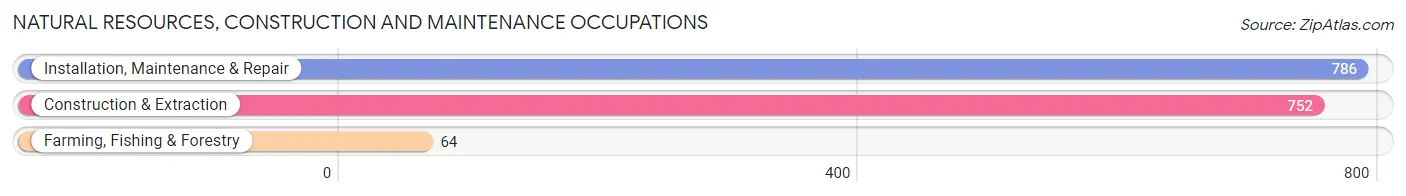
Natural Resources, Construction and Maintenance Occupations
The most common Natural Resources, Construction and Maintenance occupations in Lancaster are Installation, Maintenance & Repair (786 | 2.7%), Construction & Extraction (752 | 2.6%), and Farming, Fishing & Forestry (64 | 0.2%).
Natural Resources, Construction and Maintenance Occupations by Sex
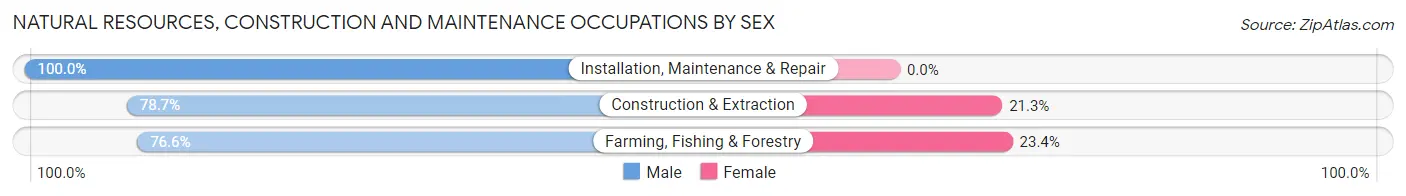
| Occupation | Male | Female |
| Farming, Fishing & Forestry | 49 (76.6%) | 15 (23.4%) |
| Construction & Extraction | 592 (78.7%) | 160 (21.3%) |
| Installation, Maintenance & Repair | 786 (100.0%) | 0 (0.0%) |
| Total (Category) | 1,427 (89.1%) | 175 (10.9%) |
| Total (Overall) | 14,349 (49.0%) | 14,916 (51.0%) |
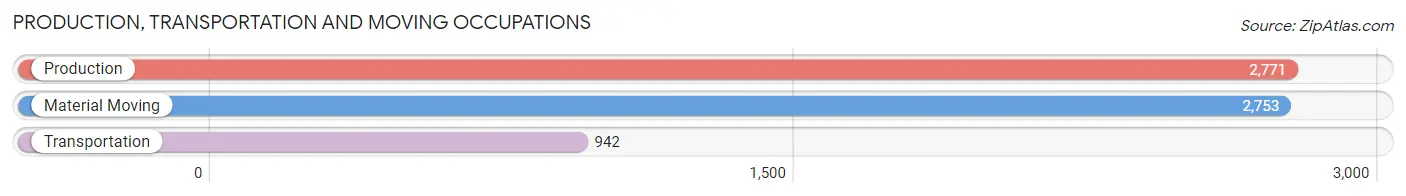
Production, Transportation and Moving Occupations
The most common Production, Transportation and Moving occupations in Lancaster are Production (2,771 | 9.5%), Material Moving (2,753 | 9.4%), and Transportation (942 | 3.2%).
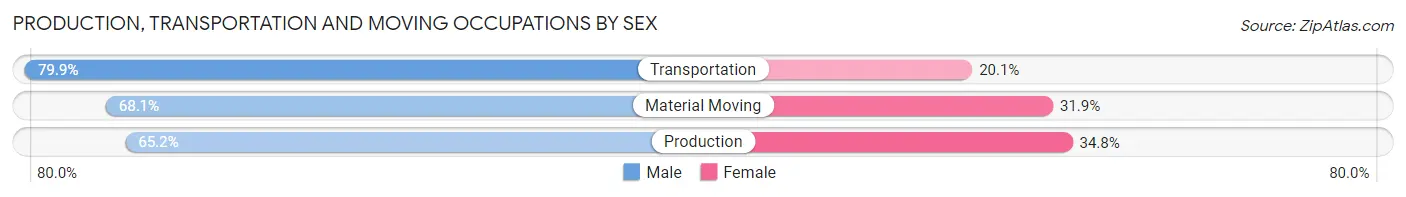
Production, Transportation and Moving Occupations by Sex
| Occupation | Male | Female |
| Production | 1,807 (65.2%) | 964 (34.8%) |
| Transportation | 753 (79.9%) | 189 (20.1%) |
| Material Moving | 1,874 (68.1%) | 879 (31.9%) |
| Total (Category) | 4,434 (68.6%) | 2,032 (31.4%) |
| Total (Overall) | 14,349 (49.0%) | 14,916 (51.0%) |
Employment Industries by Sex in Lancaster
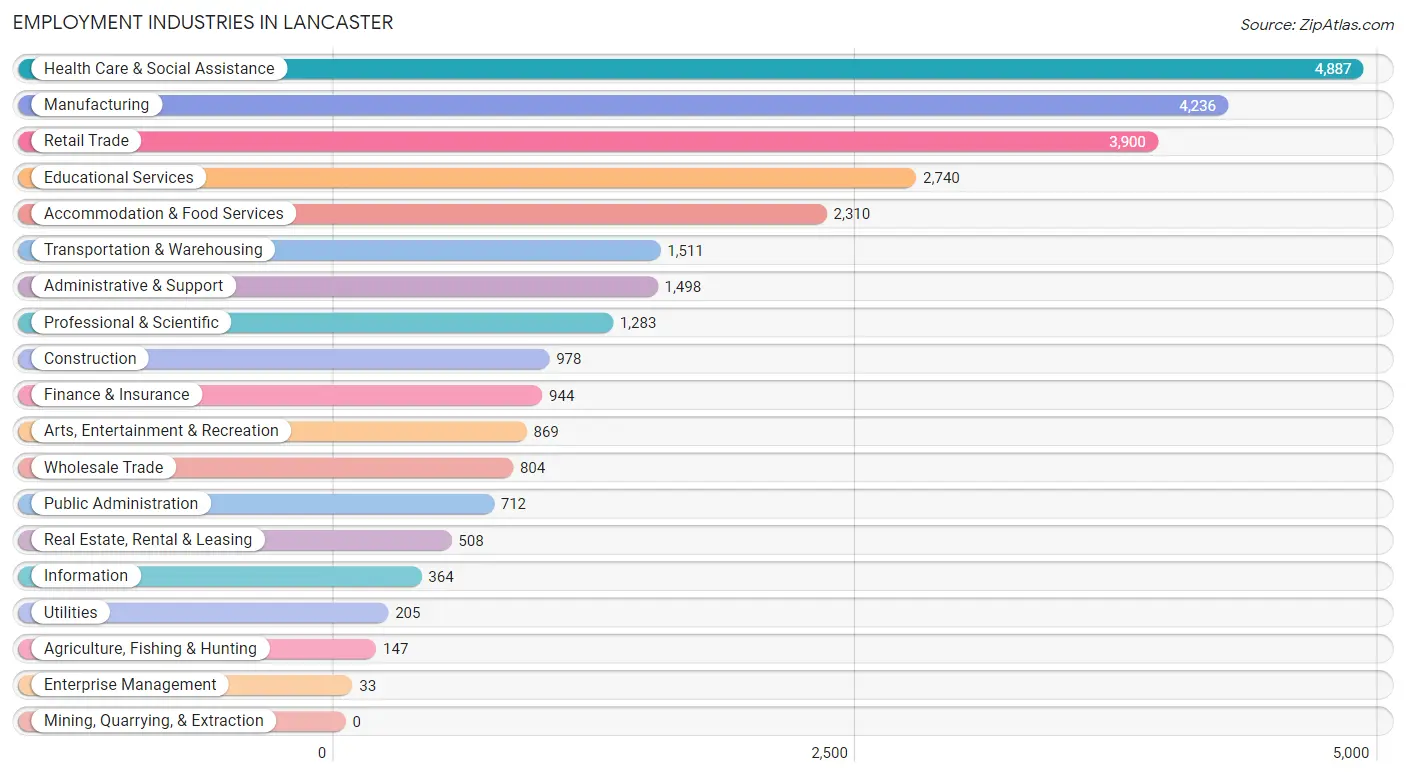
Employment Industries in Lancaster
The major employment industries in Lancaster include Health Care & Social Assistance (4,887 | 16.7%), Manufacturing (4,236 | 14.5%), Retail Trade (3,900 | 13.3%), Educational Services (2,740 | 9.4%), and Accommodation & Food Services (2,310 | 7.9%).
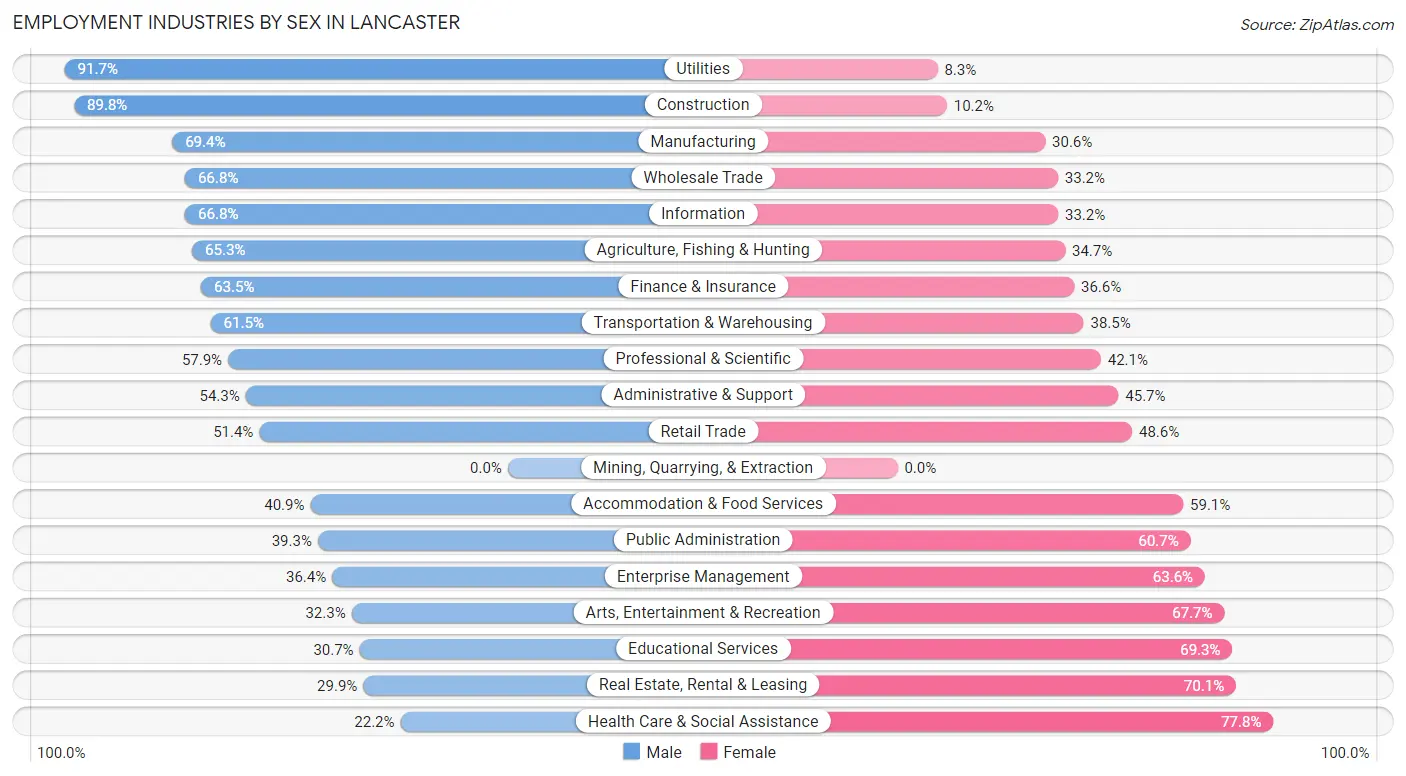
Employment Industries by Sex in Lancaster
The Lancaster industries that see more men than women are Utilities (91.7%), Construction (89.8%), and Manufacturing (69.4%), whereas the industries that tend to have a higher number of women are Health Care & Social Assistance (77.8%), Real Estate, Rental & Leasing (70.1%), and Educational Services (69.3%).
| Industry | Male | Female |
| Agriculture, Fishing & Hunting | 96 (65.3%) | 51 (34.7%) |
| Mining, Quarrying, & Extraction | 0 (0.0%) | 0 (0.0%) |
| Construction | 878 (89.8%) | 100 (10.2%) |
| Manufacturing | 2,941 (69.4%) | 1,295 (30.6%) |
| Wholesale Trade | 537 (66.8%) | 267 (33.2%) |
| Retail Trade | 2,006 (51.4%) | 1,894 (48.6%) |
| Transportation & Warehousing | 929 (61.5%) | 582 (38.5%) |
| Utilities | 188 (91.7%) | 17 (8.3%) |
| Information | 243 (66.8%) | 121 (33.2%) |
| Finance & Insurance | 599 (63.4%) | 345 (36.5%) |
| Real Estate, Rental & Leasing | 152 (29.9%) | 356 (70.1%) |
| Professional & Scientific | 743 (57.9%) | 540 (42.1%) |
| Enterprise Management | 12 (36.4%) | 21 (63.6%) |
| Administrative & Support | 813 (54.3%) | 685 (45.7%) |
| Educational Services | 841 (30.7%) | 1,899 (69.3%) |
| Health Care & Social Assistance | 1,086 (22.2%) | 3,801 (77.8%) |
| Arts, Entertainment & Recreation | 281 (32.3%) | 588 (67.7%) |
| Accommodation & Food Services | 944 (40.9%) | 1,366 (59.1%) |
| Public Administration | 280 (39.3%) | 432 (60.7%) |
| Total | 14,349 (49.0%) | 14,916 (51.0%) |
Education in Lancaster
School Enrollment in Lancaster
The most common levels of schooling among the 15,755 students in Lancaster are college / undergraduate (4,574 | 29.0%), middle school (3,500 | 22.2%), and elementary school (2,738 | 17.4%).
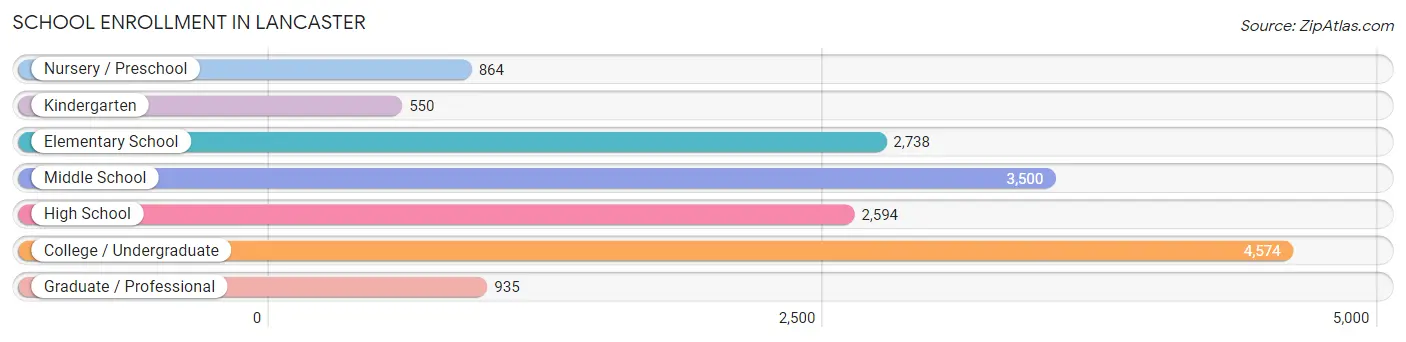
| School Level | # Students | % Students |
| Nursery / Preschool | 864 | 5.5% |
| Kindergarten | 550 | 3.5% |
| Elementary School | 2,738 | 17.4% |
| Middle School | 3,500 | 22.2% |
| High School | 2,594 | 16.5% |
| College / Undergraduate | 4,574 | 29.0% |
| Graduate / Professional | 935 | 5.9% |
| Total | 15,755 | 100.0% |
School Enrollment by Age by Funding Source in Lancaster
Out of a total of 15,755 students who are enrolled in schools in Lancaster, 4,333 (27.5%) attend a private institution, while the remaining 11,422 (72.5%) are enrolled in public schools. The age group of 20 to 24 year olds has the highest likelihood of being enrolled in private schools, with 1,340 (57.9% in the age bracket) enrolled. Conversely, the age group of 15 to 17 year olds has the lowest likelihood of being enrolled in a private school, with 1,778 (89.8% in the age bracket) attending a public institution.
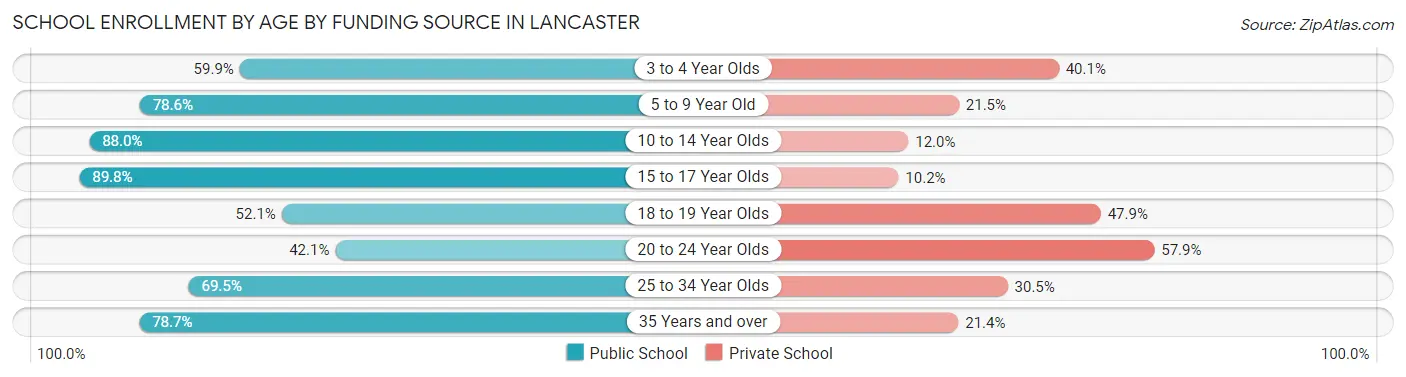
| Age Bracket | Public School | Private School |
| 3 to 4 Year Olds | 389 (59.9%) | 260 (40.1%) |
| 5 to 9 Year Old | 2,370 (78.5%) | 647 (21.4%) |
| 10 to 14 Year Olds | 3,588 (88.0%) | 491 (12.0%) |
| 15 to 17 Year Olds | 1,778 (89.8%) | 202 (10.2%) |
| 18 to 19 Year Olds | 969 (52.1%) | 890 (47.9%) |
| 20 to 24 Year Olds | 976 (42.1%) | 1,340 (57.9%) |
| 25 to 34 Year Olds | 846 (69.5%) | 372 (30.5%) |
| 35 Years and over | 501 (78.6%) | 136 (21.3%) |
| Total | 11,422 (72.5%) | 4,333 (27.5%) |
Educational Attainment by Field of Study in Lancaster
Business (2,419 | 22.1%), social sciences (1,192 | 10.9%), education (1,168 | 10.7%), visual & performing arts (942 | 8.6%), and science & technology (836 | 7.6%) are the most common fields of study among 10,946 individuals in Lancaster who have obtained a bachelor's degree or higher.
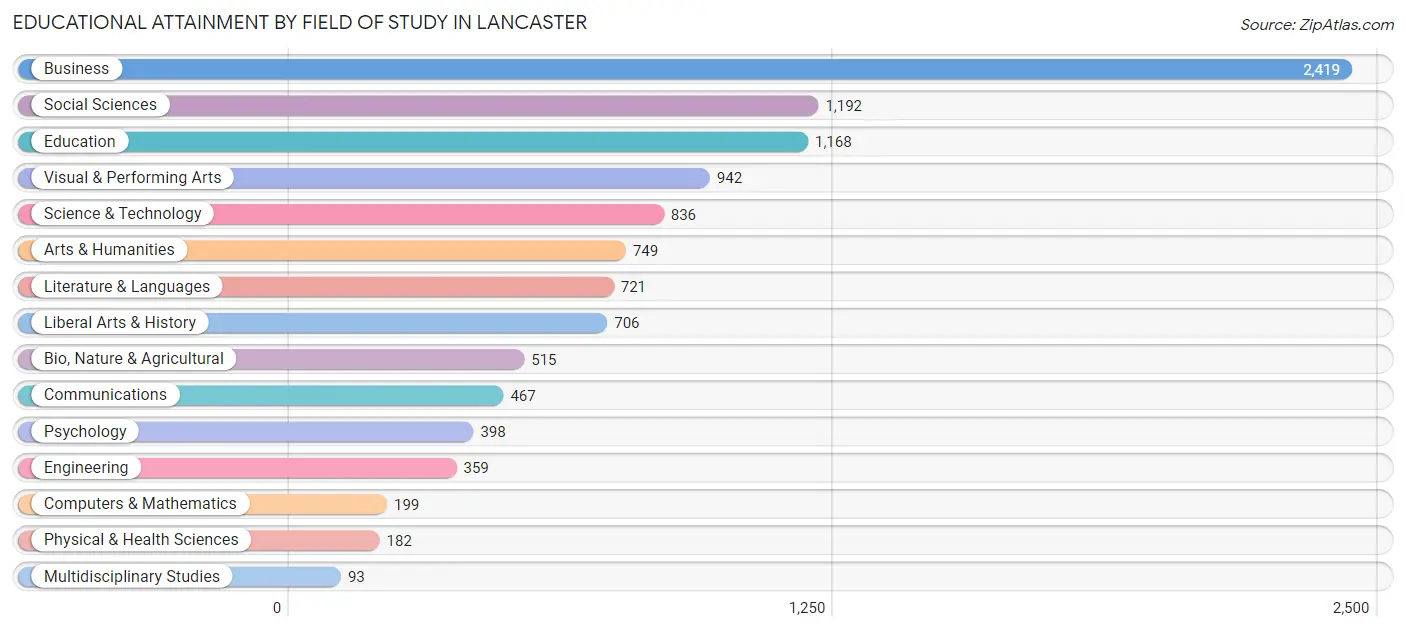
| Field of Study | # Graduates | % Graduates |
| Computers & Mathematics | 199 | 1.8% |
| Bio, Nature & Agricultural | 515 | 4.7% |
| Physical & Health Sciences | 182 | 1.7% |
| Psychology | 398 | 3.6% |
| Social Sciences | 1,192 | 10.9% |
| Engineering | 359 | 3.3% |
| Multidisciplinary Studies | 93 | 0.9% |
| Science & Technology | 836 | 7.6% |
| Business | 2,419 | 22.1% |
| Education | 1,168 | 10.7% |
| Literature & Languages | 721 | 6.6% |
| Liberal Arts & History | 706 | 6.5% |
| Visual & Performing Arts | 942 | 8.6% |
| Communications | 467 | 4.3% |
| Arts & Humanities | 749 | 6.8% |
| Total | 10,946 | 100.0% |
Transportation & Commute in Lancaster
Vehicle Availability by Sex in Lancaster
The most prevalent vehicle ownership categories in Lancaster are males with 2 vehicles (5,133, accounting for 37.7%) and females with 2 vehicles (4,769, making up 37.3%).
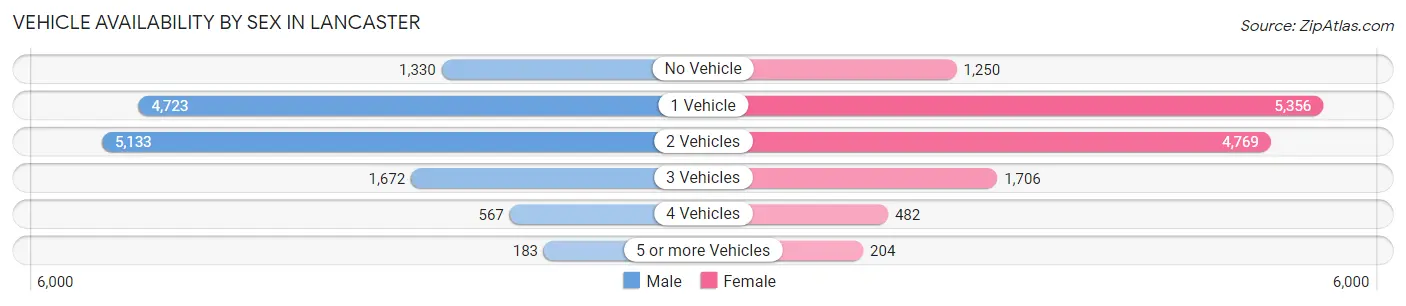
| Vehicles Available | Male | Female |
| No Vehicle | 1,330 (9.8%) | 1,250 (9.1%) |
| 1 Vehicle | 4,723 (34.7%) | 5,356 (38.9%) |
| 2 Vehicles | 5,133 (37.7%) | 4,769 (34.6%) |
| 3 Vehicles | 1,672 (12.3%) | 1,706 (12.4%) |
| 4 Vehicles | 567 (4.2%) | 482 (3.5%) |
| 5 or more Vehicles | 183 (1.3%) | 204 (1.5%) |
| Total | 13,608 (100.0%) | 13,767 (100.0%) |
Commute Time in Lancaster
The most frequently occuring commute durations in Lancaster are 15 to 19 minutes (5,085 commuters, 19.3%), 10 to 14 minutes (4,695 commuters, 17.8%), and 30 to 34 minutes (3,265 commuters, 12.4%).
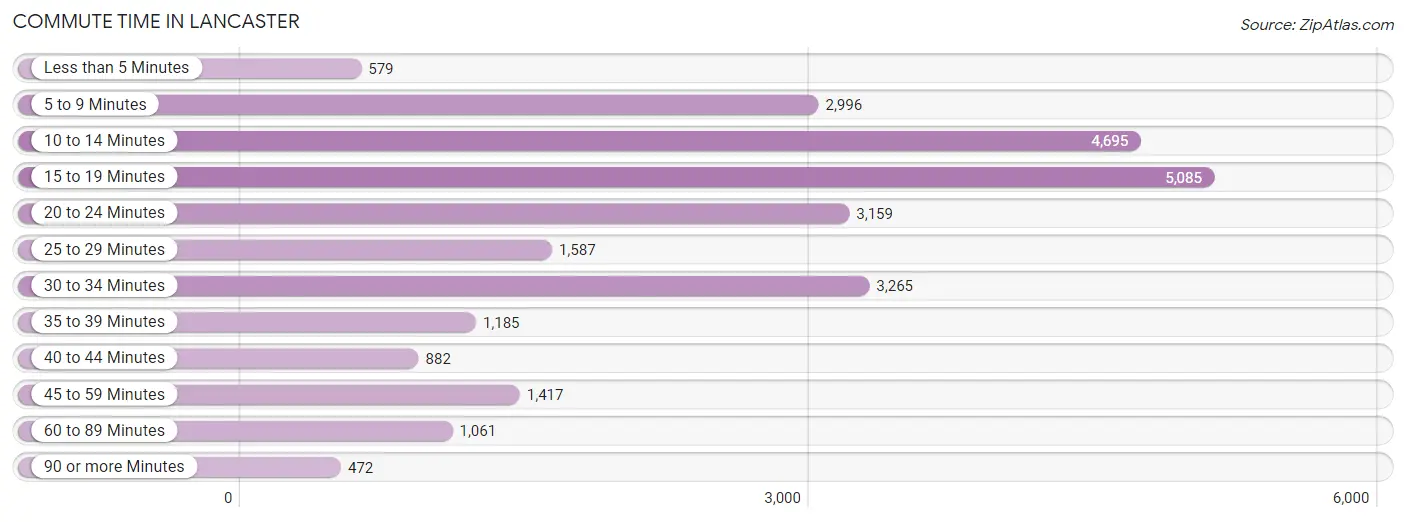
| Commute Time | # Commuters | % Commuters |
| Less than 5 Minutes | 579 | 2.2% |
| 5 to 9 Minutes | 2,996 | 11.4% |
| 10 to 14 Minutes | 4,695 | 17.8% |
| 15 to 19 Minutes | 5,085 | 19.3% |
| 20 to 24 Minutes | 3,159 | 12.0% |
| 25 to 29 Minutes | 1,587 | 6.0% |
| 30 to 34 Minutes | 3,265 | 12.4% |
| 35 to 39 Minutes | 1,185 | 4.5% |
| 40 to 44 Minutes | 882 | 3.3% |
| 45 to 59 Minutes | 1,417 | 5.4% |
| 60 to 89 Minutes | 1,061 | 4.0% |
| 90 or more Minutes | 472 | 1.8% |
Commute Time by Sex in Lancaster
The most common commute times in Lancaster are 15 to 19 minutes (2,406 commuters, 18.5%) for males and 15 to 19 minutes (2,679 commuters, 20.1%) for females.
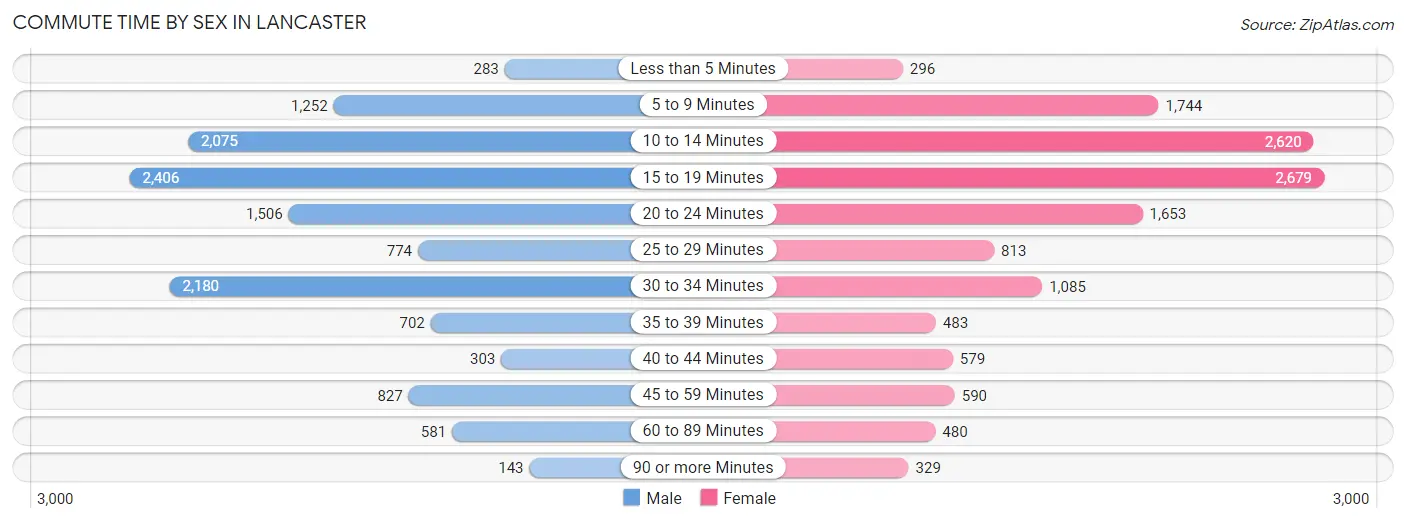
| Commute Time | Male | Female |
| Less than 5 Minutes | 283 (2.2%) | 296 (2.2%) |
| 5 to 9 Minutes | 1,252 (9.6%) | 1,744 (13.1%) |
| 10 to 14 Minutes | 2,075 (15.9%) | 2,620 (19.6%) |
| 15 to 19 Minutes | 2,406 (18.5%) | 2,679 (20.1%) |
| 20 to 24 Minutes | 1,506 (11.6%) | 1,653 (12.4%) |
| 25 to 29 Minutes | 774 (5.9%) | 813 (6.1%) |
| 30 to 34 Minutes | 2,180 (16.7%) | 1,085 (8.1%) |
| 35 to 39 Minutes | 702 (5.4%) | 483 (3.6%) |
| 40 to 44 Minutes | 303 (2.3%) | 579 (4.3%) |
| 45 to 59 Minutes | 827 (6.4%) | 590 (4.4%) |
| 60 to 89 Minutes | 581 (4.5%) | 480 (3.6%) |
| 90 or more Minutes | 143 (1.1%) | 329 (2.5%) |
Time of Departure to Work by Sex in Lancaster
The most frequent times of departure to work in Lancaster are 12:00 PM to 3:59 PM (2,027, 15.5%) for males and 8:00 AM to 8:29 AM (1,924, 14.4%) for females.
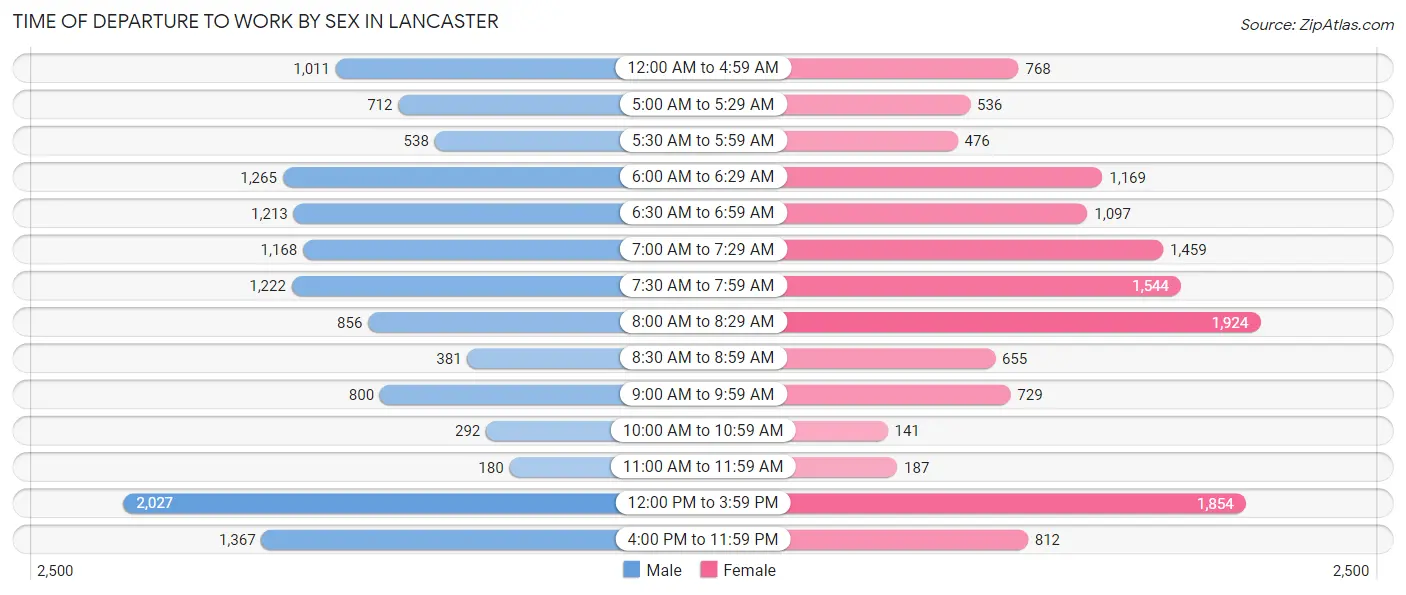
| Time of Departure | Male | Female |
| 12:00 AM to 4:59 AM | 1,011 (7.8%) | 768 (5.8%) |
| 5:00 AM to 5:29 AM | 712 (5.5%) | 536 (4.0%) |
| 5:30 AM to 5:59 AM | 538 (4.1%) | 476 (3.6%) |
| 6:00 AM to 6:29 AM | 1,265 (9.7%) | 1,169 (8.8%) |
| 6:30 AM to 6:59 AM | 1,213 (9.3%) | 1,097 (8.2%) |
| 7:00 AM to 7:29 AM | 1,168 (9.0%) | 1,459 (10.9%) |
| 7:30 AM to 7:59 AM | 1,222 (9.4%) | 1,544 (11.6%) |
| 8:00 AM to 8:29 AM | 856 (6.6%) | 1,924 (14.4%) |
| 8:30 AM to 8:59 AM | 381 (2.9%) | 655 (4.9%) |
| 9:00 AM to 9:59 AM | 800 (6.1%) | 729 (5.5%) |
| 10:00 AM to 10:59 AM | 292 (2.2%) | 141 (1.1%) |
| 11:00 AM to 11:59 AM | 180 (1.4%) | 187 (1.4%) |
| 12:00 PM to 3:59 PM | 2,027 (15.5%) | 1,854 (13.9%) |
| 4:00 PM to 11:59 PM | 1,367 (10.5%) | 812 (6.1%) |
| Total | 13,032 (100.0%) | 13,351 (100.0%) |
Housing Occupancy in Lancaster
Occupancy by Ownership in Lancaster
Of the total 21,234 dwellings in Lancaster, owner-occupied units account for 9,913 (46.7%), while renter-occupied units make up 11,321 (53.3%).
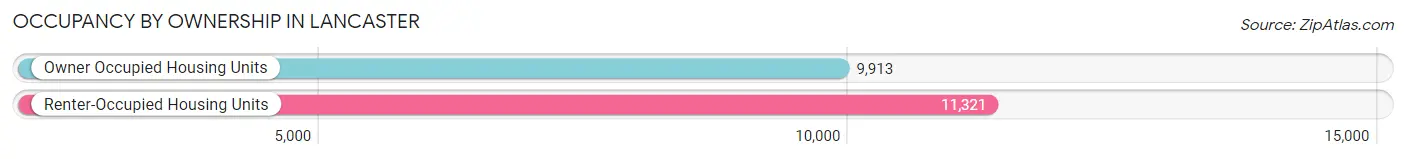
| Occupancy | # Housing Units | % Housing Units |
| Owner Occupied Housing Units | 9,913 | 46.7% |
| Renter-Occupied Housing Units | 11,321 | 53.3% |
| Total Occupied Housing Units | 21,234 | 100.0% |
Occupancy by Household Size in Lancaster
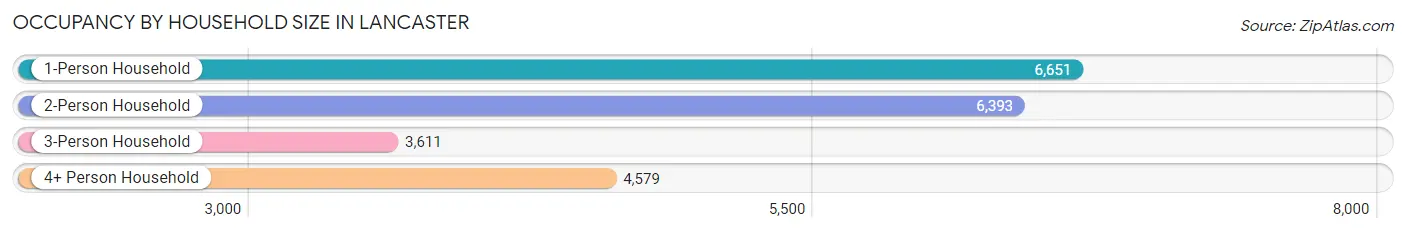
| Household Size | # Housing Units | % Housing Units |
| 1-Person Household | 6,651 | 31.3% |
| 2-Person Household | 6,393 | 30.1% |
| 3-Person Household | 3,611 | 17.0% |
| 4+ Person Household | 4,579 | 21.6% |
| Total Housing Units | 21,234 | 100.0% |
Occupancy by Ownership by Household Size in Lancaster
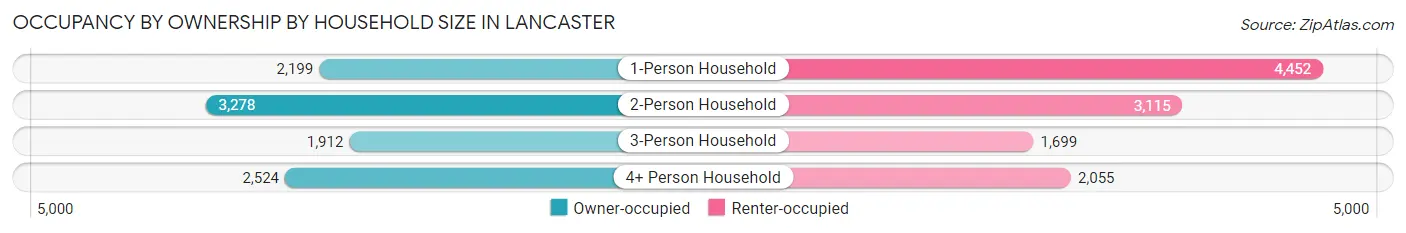
| Household Size | Owner-occupied | Renter-occupied |
| 1-Person Household | 2,199 (33.1%) | 4,452 (66.9%) |
| 2-Person Household | 3,278 (51.3%) | 3,115 (48.7%) |
| 3-Person Household | 1,912 (52.9%) | 1,699 (47.0%) |
| 4+ Person Household | 2,524 (55.1%) | 2,055 (44.9%) |
| Total Housing Units | 9,913 (46.7%) | 11,321 (53.3%) |
Occupancy by Educational Attainment in Lancaster
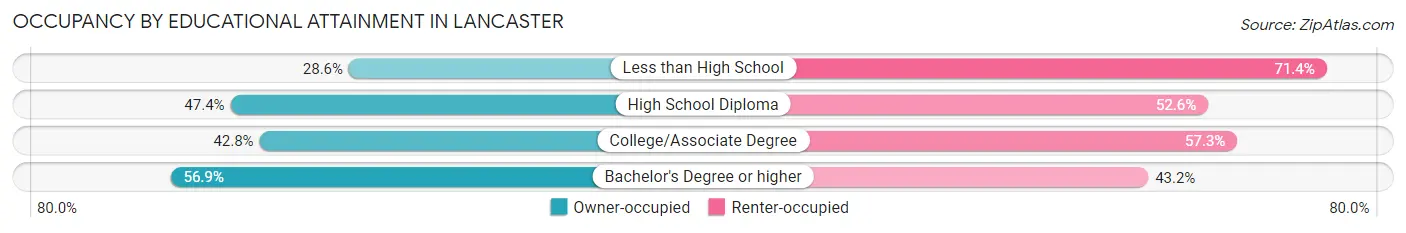
| Household Size | Owner-occupied | Renter-occupied |
| Less than High School | 807 (28.6%) | 2,018 (71.4%) |
| High School Diploma | 2,929 (47.4%) | 3,255 (52.6%) |
| College/Associate Degree | 2,344 (42.7%) | 3,139 (57.3%) |
| Bachelor's Degree or higher | 3,833 (56.9%) | 2,909 (43.1%) |
Occupancy by Age of Householder in Lancaster
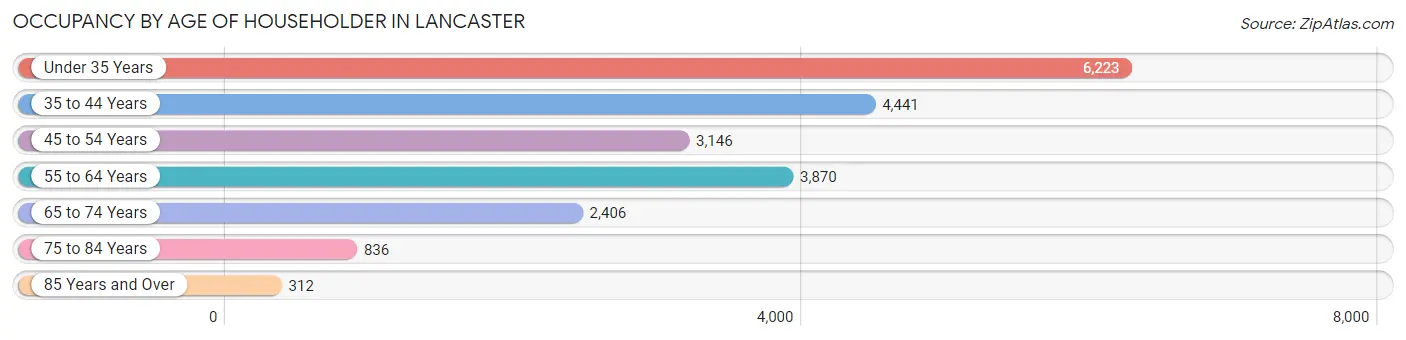
| Age Bracket | # Households | % Households |
| Under 35 Years | 6,223 | 29.3% |
| 35 to 44 Years | 4,441 | 20.9% |
| 45 to 54 Years | 3,146 | 14.8% |
| 55 to 64 Years | 3,870 | 18.2% |
| 65 to 74 Years | 2,406 | 11.3% |
| 75 to 84 Years | 836 | 3.9% |
| 85 Years and Over | 312 | 1.5% |
| Total | 21,234 | 100.0% |
Housing Finances in Lancaster
Median Income by Occupancy in Lancaster
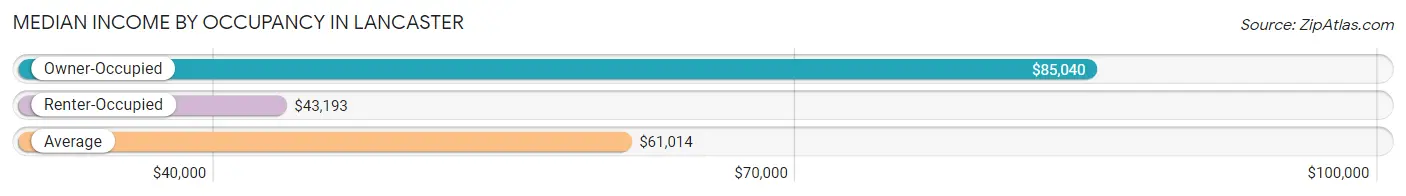
| Occupancy Type | # Households | Median Income |
| Owner-Occupied | 9,913 (46.7%) | $85,040 |
| Renter-Occupied | 11,321 (53.3%) | $43,193 |
| Average | 21,234 (100.0%) | $61,014 |
Occupancy by Householder Income Bracket in Lancaster
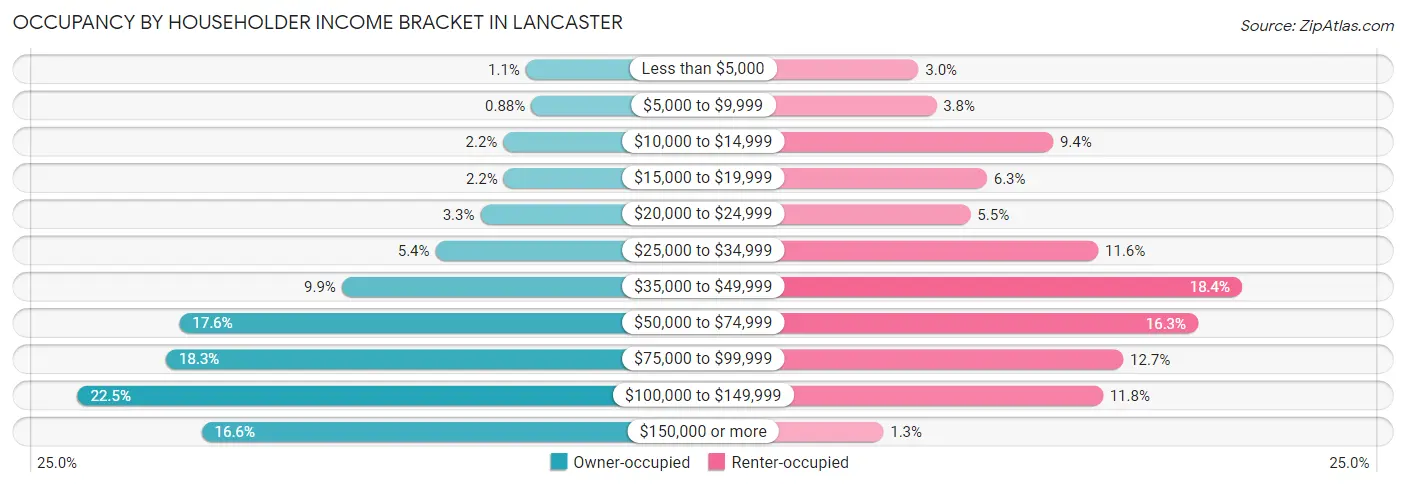
| Income Bracket | Owner-occupied | Renter-occupied |
| Less than $5,000 | 113 (1.1%) | 338 (3.0%) |
| $5,000 to $9,999 | 87 (0.9%) | 435 (3.8%) |
| $10,000 to $14,999 | 219 (2.2%) | 1,064 (9.4%) |
| $15,000 to $19,999 | 217 (2.2%) | 707 (6.2%) |
| $20,000 to $24,999 | 327 (3.3%) | 619 (5.5%) |
| $25,000 to $34,999 | 539 (5.4%) | 1,308 (11.6%) |
| $35,000 to $49,999 | 981 (9.9%) | 2,082 (18.4%) |
| $50,000 to $74,999 | 1,748 (17.6%) | 1,845 (16.3%) |
| $75,000 to $99,999 | 1,811 (18.3%) | 1,442 (12.7%) |
| $100,000 to $149,999 | 2,228 (22.5%) | 1,332 (11.8%) |
| $150,000 or more | 1,643 (16.6%) | 149 (1.3%) |
| Total | 9,913 (100.0%) | 11,321 (100.0%) |
Monthly Housing Cost Tiers in Lancaster
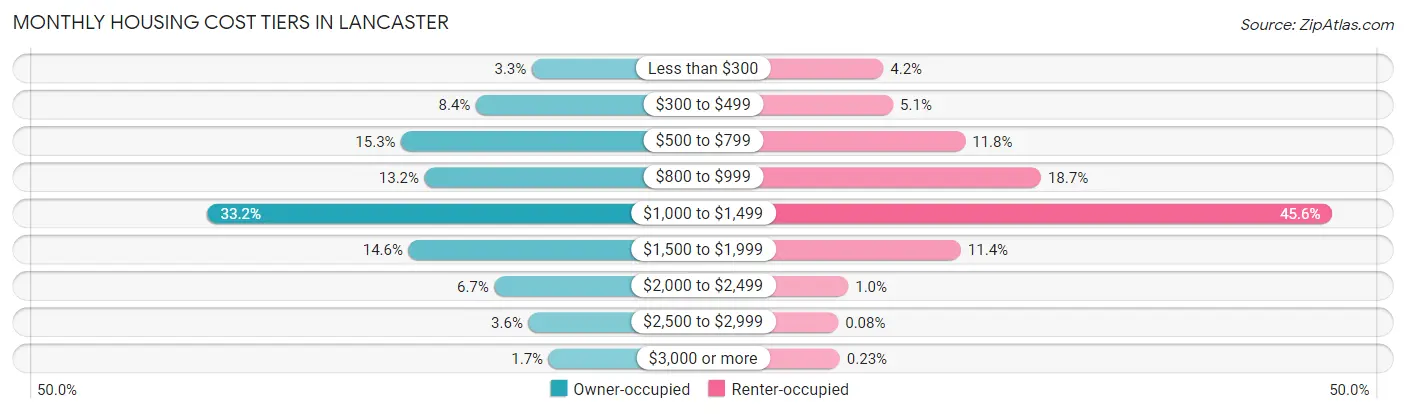
| Monthly Cost | Owner-occupied | Renter-occupied |
| Less than $300 | 325 (3.3%) | 479 (4.2%) |
| $300 to $499 | 836 (8.4%) | 581 (5.1%) |
| $500 to $799 | 1,518 (15.3%) | 1,333 (11.8%) |
| $800 to $999 | 1,304 (13.2%) | 2,121 (18.7%) |
| $1,000 to $1,499 | 3,286 (33.2%) | 5,157 (45.6%) |
| $1,500 to $1,999 | 1,450 (14.6%) | 1,287 (11.4%) |
| $2,000 to $2,499 | 667 (6.7%) | 113 (1.0%) |
| $2,500 to $2,999 | 356 (3.6%) | 9 (0.1%) |
| $3,000 or more | 171 (1.7%) | 26 (0.2%) |
| Total | 9,913 (100.0%) | 11,321 (100.0%) |
Physical Housing Characteristics in Lancaster
Housing Structures in Lancaster
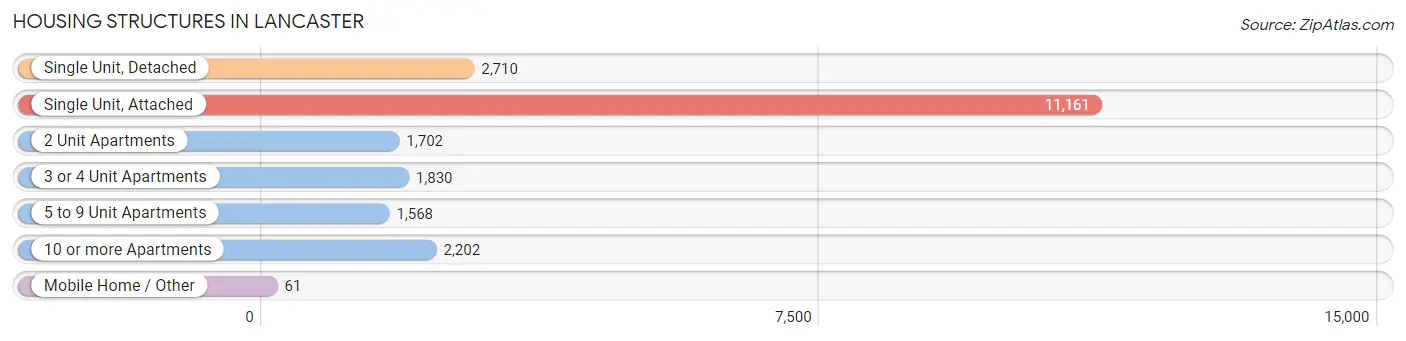
| Structure Type | # Housing Units | % Housing Units |
| Single Unit, Detached | 2,710 | 12.8% |
| Single Unit, Attached | 11,161 | 52.6% |
| 2 Unit Apartments | 1,702 | 8.0% |
| 3 or 4 Unit Apartments | 1,830 | 8.6% |
| 5 to 9 Unit Apartments | 1,568 | 7.4% |
| 10 or more Apartments | 2,202 | 10.4% |
| Mobile Home / Other | 61 | 0.3% |
| Total | 21,234 | 100.0% |
Housing Structures by Occupancy in Lancaster
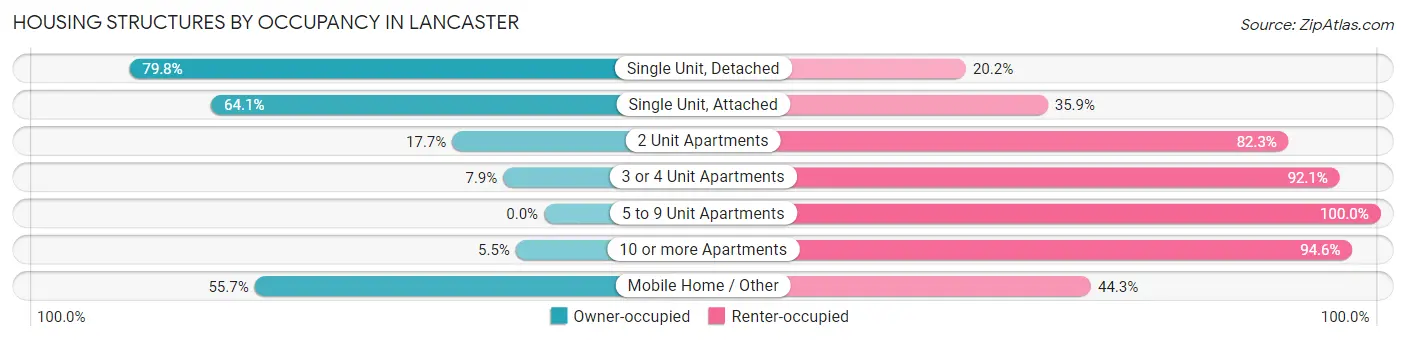
| Structure Type | Owner-occupied | Renter-occupied |
| Single Unit, Detached | 2,163 (79.8%) | 547 (20.2%) |
| Single Unit, Attached | 7,151 (64.1%) | 4,010 (35.9%) |
| 2 Unit Apartments | 301 (17.7%) | 1,401 (82.3%) |
| 3 or 4 Unit Apartments | 144 (7.9%) | 1,686 (92.1%) |
| 5 to 9 Unit Apartments | 0 (0.0%) | 1,568 (100.0%) |
| 10 or more Apartments | 120 (5.4%) | 2,082 (94.6%) |
| Mobile Home / Other | 34 (55.7%) | 27 (44.3%) |
| Total | 9,913 (46.7%) | 11,321 (53.3%) |
Housing Structures by Number of Rooms in Lancaster
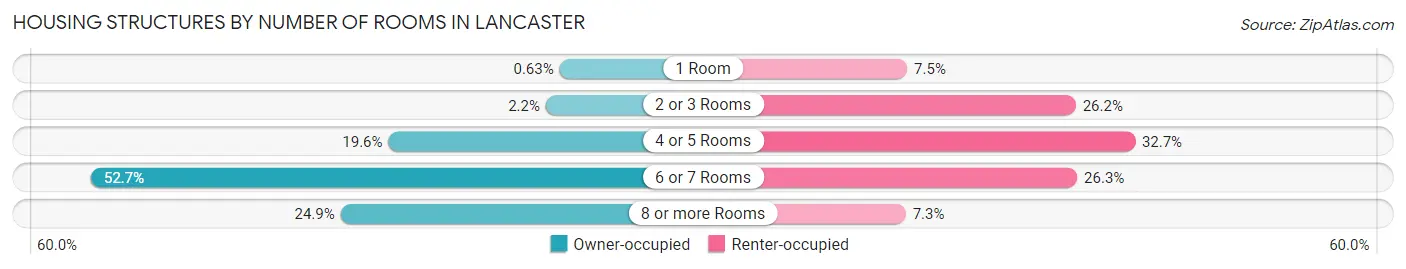
| Number of Rooms | Owner-occupied | Renter-occupied |
| 1 Room | 62 (0.6%) | 844 (7.5%) |
| 2 or 3 Rooms | 214 (2.2%) | 2,963 (26.2%) |
| 4 or 5 Rooms | 1,946 (19.6%) | 3,707 (32.7%) |
| 6 or 7 Rooms | 5,219 (52.6%) | 2,981 (26.3%) |
| 8 or more Rooms | 2,472 (24.9%) | 826 (7.3%) |
| Total | 9,913 (100.0%) | 11,321 (100.0%) |
Housing Structure by Heating Type in Lancaster
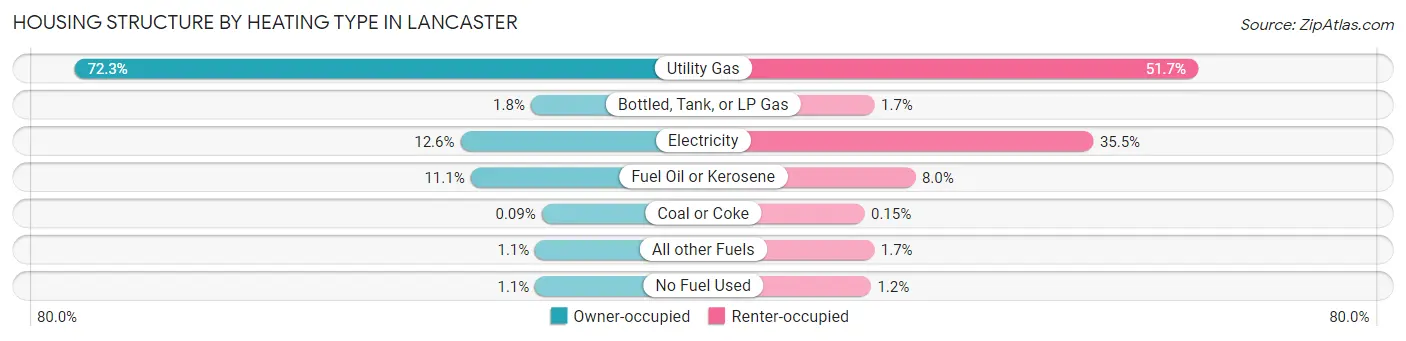
| Heating Type | Owner-occupied | Renter-occupied |
| Utility Gas | 7,166 (72.3%) | 5,858 (51.7%) |
| Bottled, Tank, or LP Gas | 174 (1.8%) | 194 (1.7%) |
| Electricity | 1,253 (12.6%) | 4,024 (35.5%) |
| Fuel Oil or Kerosene | 1,097 (11.1%) | 909 (8.0%) |
| Coal or Coke | 9 (0.1%) | 17 (0.2%) |
| All other Fuels | 107 (1.1%) | 189 (1.7%) |
| No Fuel Used | 107 (1.1%) | 130 (1.1%) |
| Total | 9,913 (100.0%) | 11,321 (100.0%) |
Household Vehicle Usage in Lancaster
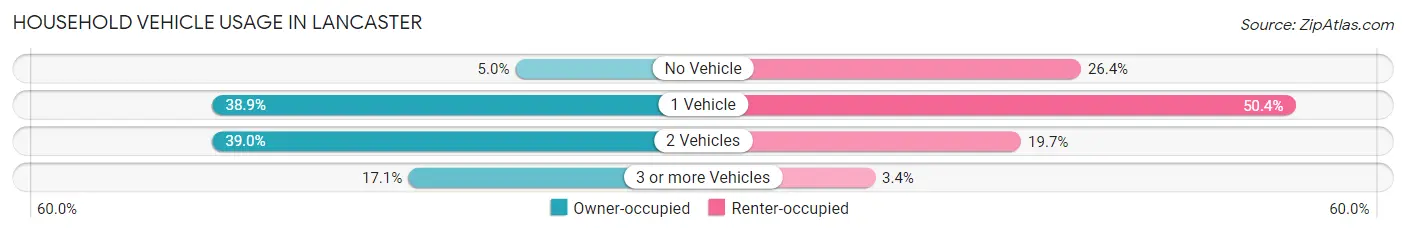
| Vehicles per Household | Owner-occupied | Renter-occupied |
| No Vehicle | 500 (5.0%) | 2,993 (26.4%) |
| 1 Vehicle | 3,860 (38.9%) | 5,710 (50.4%) |
| 2 Vehicles | 3,863 (39.0%) | 2,235 (19.7%) |
| 3 or more Vehicles | 1,690 (17.1%) | 383 (3.4%) |
| Total | 9,913 (100.0%) | 11,321 (100.0%) |
Real Estate & Mortgages in Lancaster
Real Estate and Mortgage Overview in Lancaster
| Characteristic | Without Mortgage | With Mortgage |
| Housing Units | 3,068 | 6,845 |
| Median Property Value | $175,100 | $182,600 |
| Median Household Income | $77,034 | $1,377 |
| Monthly Housing Costs | $589 | $171 |
| Real Estate Taxes | $3,268 | $38 |
Property Value by Mortgage Status in Lancaster
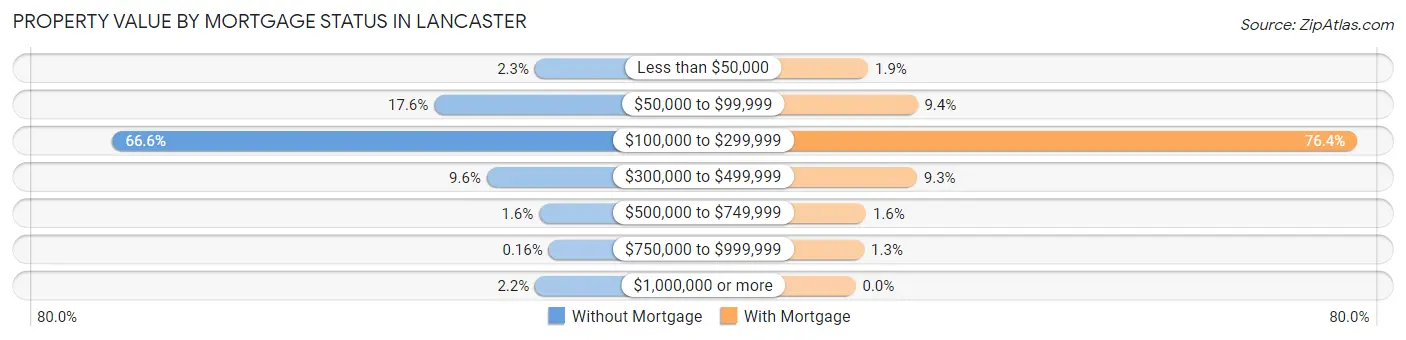
| Property Value | Without Mortgage | With Mortgage |
| Less than $50,000 | 69 (2.2%) | 131 (1.9%) |
| $50,000 to $99,999 | 540 (17.6%) | 646 (9.4%) |
| $100,000 to $299,999 | 2,043 (66.6%) | 5,230 (76.4%) |
| $300,000 to $499,999 | 294 (9.6%) | 639 (9.3%) |
| $500,000 to $749,999 | 49 (1.6%) | 109 (1.6%) |
| $750,000 to $999,999 | 5 (0.2%) | 90 (1.3%) |
| $1,000,000 or more | 68 (2.2%) | 0 (0.0%) |
| Total | 3,068 (100.0%) | 6,845 (100.0%) |
Household Income by Mortgage Status in Lancaster
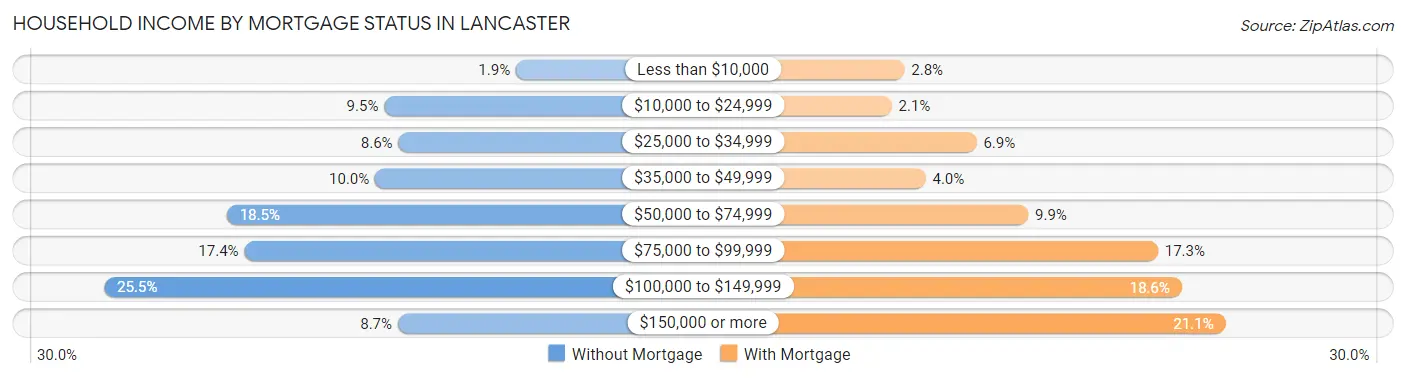
| Household Income | Without Mortgage | With Mortgage |
| Less than $10,000 | 59 (1.9%) | 191 (2.8%) |
| $10,000 to $24,999 | 290 (9.5%) | 141 (2.1%) |
| $25,000 to $34,999 | 265 (8.6%) | 473 (6.9%) |
| $35,000 to $49,999 | 306 (10.0%) | 274 (4.0%) |
| $50,000 to $74,999 | 566 (18.4%) | 675 (9.9%) |
| $75,000 to $99,999 | 535 (17.4%) | 1,182 (17.3%) |
| $100,000 to $149,999 | 781 (25.5%) | 1,276 (18.6%) |
| $150,000 or more | 266 (8.7%) | 1,447 (21.1%) |
| Total | 3,068 (100.0%) | 6,845 (100.0%) |
Property Value to Household Income Ratio in Lancaster
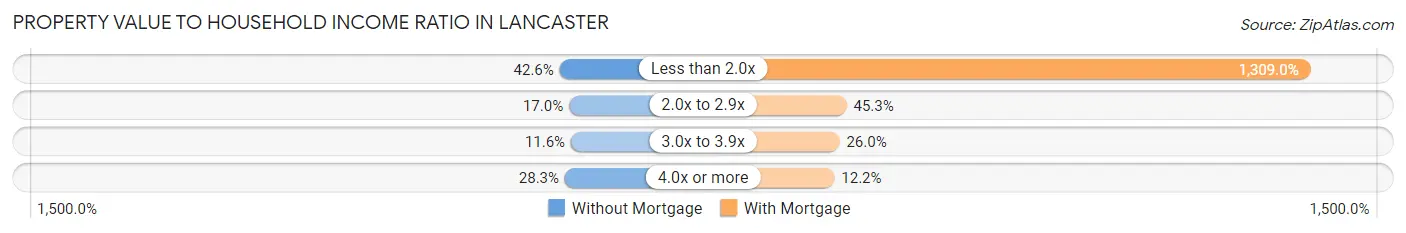
| Value-to-Income Ratio | Without Mortgage | With Mortgage |
| Less than 2.0x | 1,307 (42.6%) | 89,604 (1,309.0%) |
| 2.0x to 2.9x | 522 (17.0%) | 3,098 (45.3%) |
| 3.0x to 3.9x | 357 (11.6%) | 1,781 (26.0%) |
| 4.0x or more | 868 (28.3%) | 832 (12.1%) |
| Total | 3,068 (100.0%) | 6,845 (100.0%) |
Real Estate Taxes by Mortgage Status in Lancaster
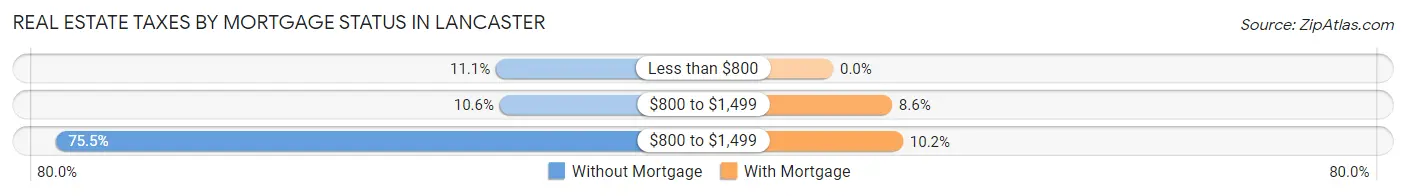
| Property Taxes | Without Mortgage | With Mortgage |
| Less than $800 | 341 (11.1%) | 0 (0.0%) |
| $800 to $1,499 | 324 (10.6%) | 589 (8.6%) |
| $800 to $1,499 | 2,317 (75.5%) | 698 (10.2%) |
| Total | 3,068 (100.0%) | 6,845 (100.0%) |
Health & Disability in Lancaster
Health Insurance Coverage by Age in Lancaster
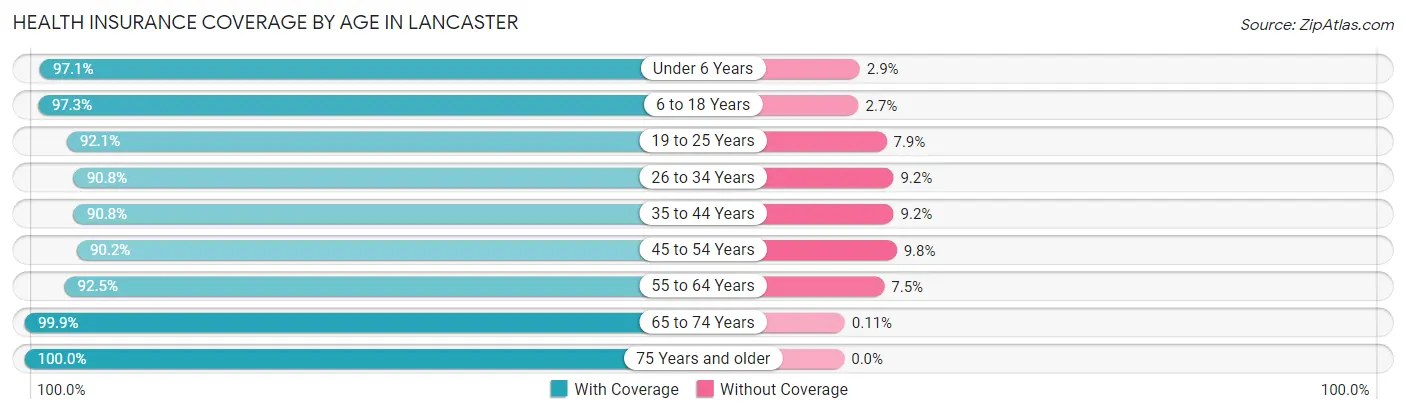
| Age Bracket | With Coverage | Without Coverage |
| Under 6 Years | 4,387 (97.1%) | 131 (2.9%) |
| 6 to 18 Years | 9,763 (97.3%) | 267 (2.7%) |
| 19 to 25 Years | 7,112 (92.1%) | 608 (7.9%) |
| 26 to 34 Years | 8,624 (90.8%) | 871 (9.2%) |
| 35 to 44 Years | 7,300 (90.8%) | 739 (9.2%) |
| 45 to 54 Years | 5,197 (90.2%) | 563 (9.8%) |
| 55 to 64 Years | 5,578 (92.5%) | 450 (7.5%) |
| 65 to 74 Years | 3,507 (99.9%) | 4 (0.1%) |
| 75 Years and older | 1,756 (100.0%) | 0 (0.0%) |
| Total | 53,224 (93.6%) | 3,633 (6.4%) |
Health Insurance Coverage by Citizenship Status in Lancaster
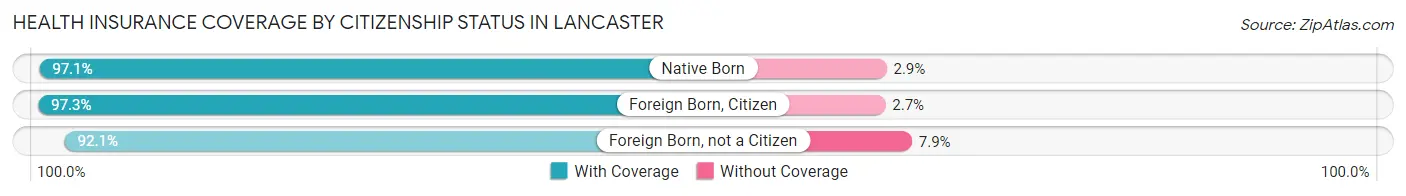
| Citizenship Status | With Coverage | Without Coverage |
| Native Born | 4,387 (97.1%) | 131 (2.9%) |
| Foreign Born, Citizen | 9,763 (97.3%) | 267 (2.7%) |
| Foreign Born, not a Citizen | 7,112 (92.1%) | 608 (7.9%) |
Health Insurance Coverage by Household Income in Lancaster
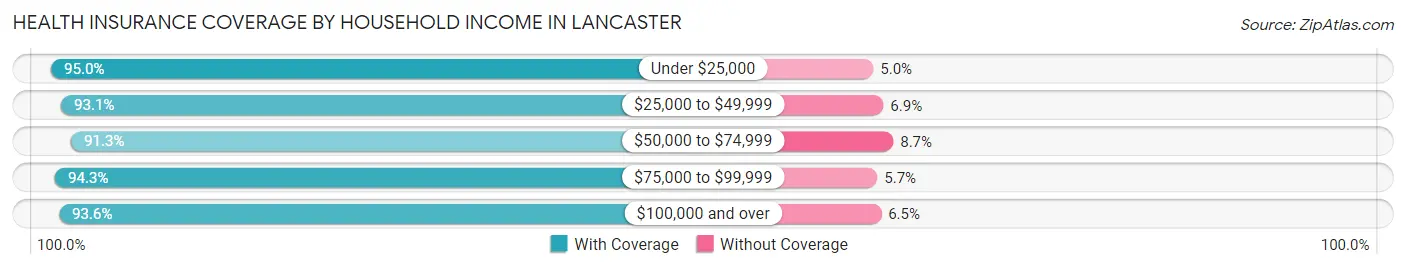
| Household Income | With Coverage | Without Coverage |
| Under $25,000 | 8,059 (95.0%) | 422 (5.0%) |
| $25,000 to $49,999 | 10,334 (93.1%) | 761 (6.9%) |
| $50,000 to $74,999 | 8,249 (91.3%) | 787 (8.7%) |
| $75,000 to $99,999 | 8,518 (94.3%) | 517 (5.7%) |
| $100,000 and over | 15,550 (93.5%) | 1,073 (6.5%) |
Public vs Private Health Insurance Coverage by Age in Lancaster
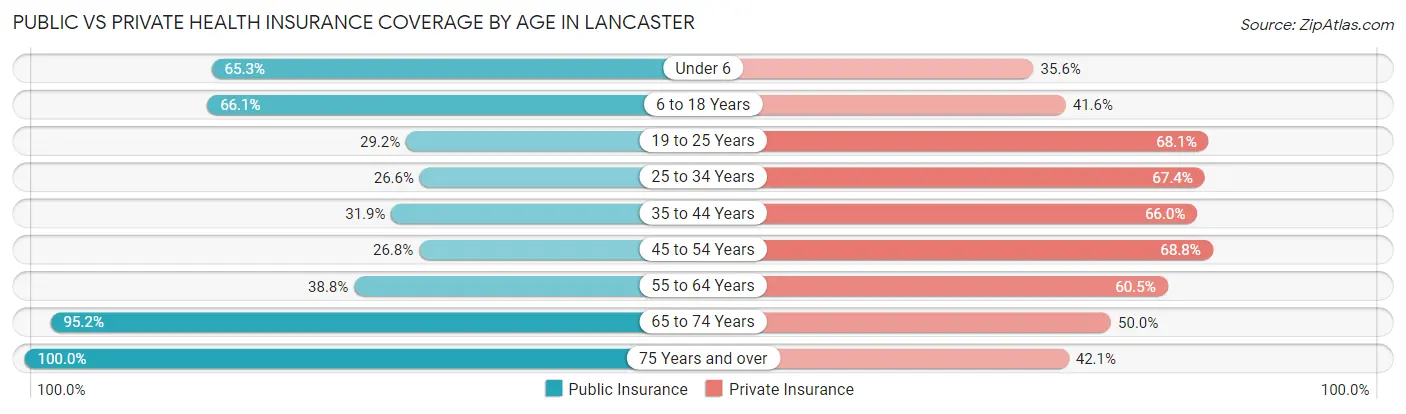
| Age Bracket | Public Insurance | Private Insurance |
| Under 6 | 2,949 (65.3%) | 1,609 (35.6%) |
| 6 to 18 Years | 6,630 (66.1%) | 4,170 (41.6%) |
| 19 to 25 Years | 2,254 (29.2%) | 5,254 (68.1%) |
| 25 to 34 Years | 2,529 (26.6%) | 6,395 (67.3%) |
| 35 to 44 Years | 2,568 (31.9%) | 5,303 (66.0%) |
| 45 to 54 Years | 1,543 (26.8%) | 3,964 (68.8%) |
| 55 to 64 Years | 2,341 (38.8%) | 3,644 (60.5%) |
| 65 to 74 Years | 3,342 (95.2%) | 1,755 (50.0%) |
| 75 Years and over | 1,756 (100.0%) | 740 (42.1%) |
| Total | 25,912 (45.6%) | 32,834 (57.8%) |
Disability Status by Sex by Age in Lancaster
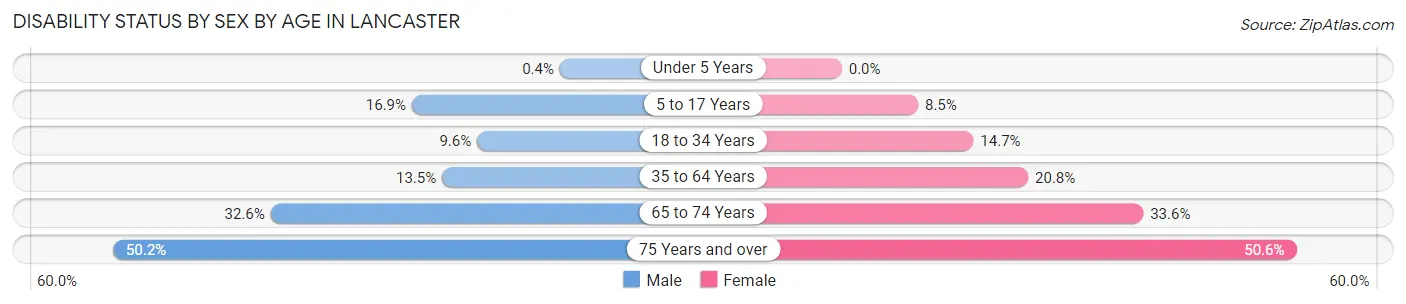
| Age Bracket | Male | Female |
| Under 5 Years | 8 (0.4%) | 0 (0.0%) |
| 5 to 17 Years | 747 (16.9%) | 425 (8.5%) |
| 18 to 34 Years | 826 (9.6%) | 1,435 (14.7%) |
| 35 to 64 Years | 1,247 (13.5%) | 2,200 (20.7%) |
| 65 to 74 Years | 600 (32.6%) | 561 (33.6%) |
| 75 Years and over | 309 (50.2%) | 577 (50.6%) |
Disability Class by Sex by Age in Lancaster
Disability Class: Hearing Difficulty
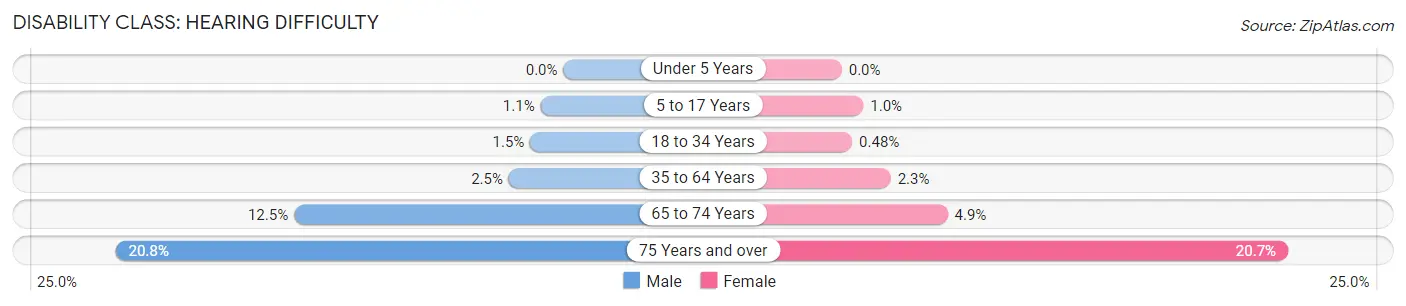
| Age Bracket | Male | Female |
| Under 5 Years | 0 (0.0%) | 0 (0.0%) |
| 5 to 17 Years | 47 (1.1%) | 50 (1.0%) |
| 18 to 34 Years | 132 (1.5%) | 47 (0.5%) |
| 35 to 64 Years | 233 (2.5%) | 241 (2.3%) |
| 65 to 74 Years | 230 (12.5%) | 82 (4.9%) |
| 75 Years and over | 128 (20.8%) | 236 (20.7%) |
Disability Class: Vision Difficulty
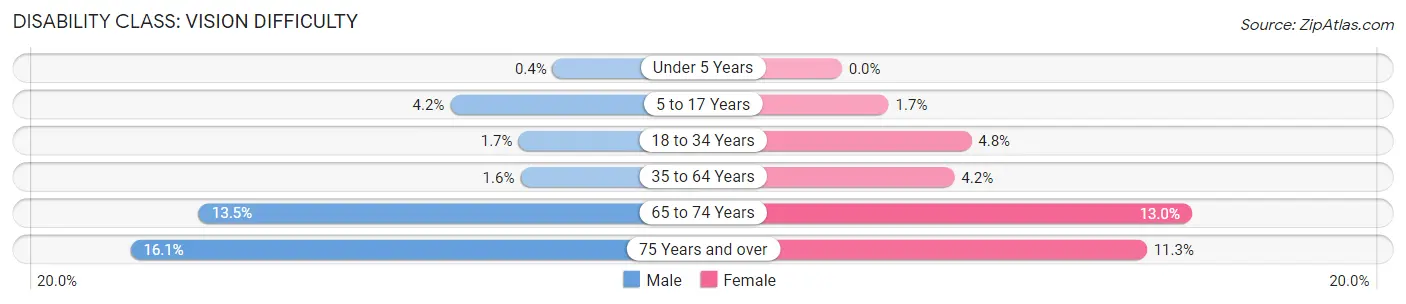
| Age Bracket | Male | Female |
| Under 5 Years | 8 (0.4%) | 0 (0.0%) |
| 5 to 17 Years | 186 (4.2%) | 87 (1.7%) |
| 18 to 34 Years | 144 (1.7%) | 471 (4.8%) |
| 35 to 64 Years | 148 (1.6%) | 443 (4.2%) |
| 65 to 74 Years | 249 (13.5%) | 217 (13.0%) |
| 75 Years and over | 99 (16.1%) | 129 (11.3%) |
Disability Class: Cognitive Difficulty
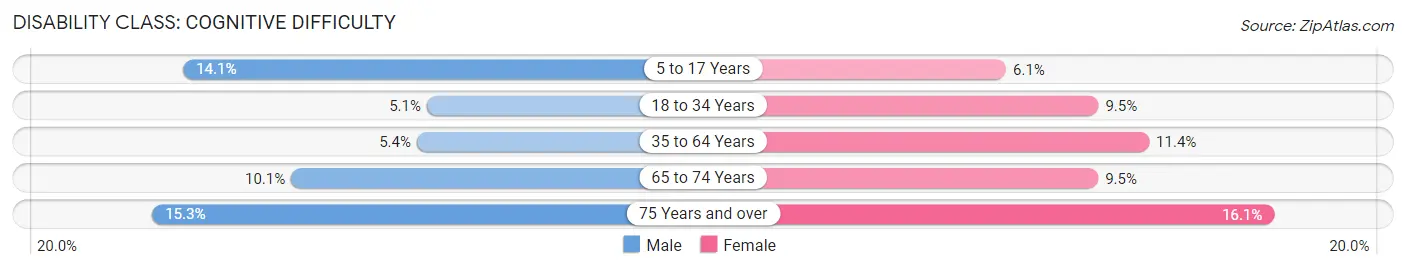
| Age Bracket | Male | Female |
| 5 to 17 Years | 625 (14.1%) | 305 (6.1%) |
| 18 to 34 Years | 436 (5.1%) | 933 (9.5%) |
| 35 to 64 Years | 502 (5.4%) | 1,209 (11.4%) |
| 65 to 74 Years | 186 (10.1%) | 159 (9.5%) |
| 75 Years and over | 94 (15.3%) | 183 (16.1%) |
Disability Class: Ambulatory Difficulty
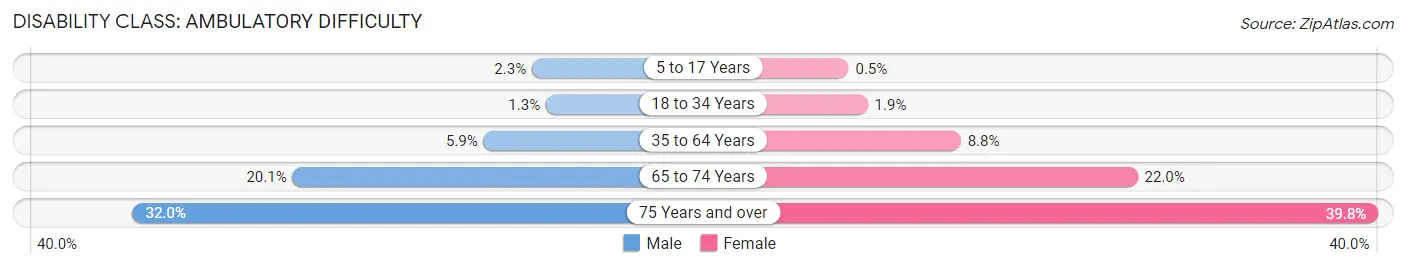
| Age Bracket | Male | Female |
| 5 to 17 Years | 103 (2.3%) | 25 (0.5%) |
| 18 to 34 Years | 111 (1.3%) | 188 (1.9%) |
| 35 to 64 Years | 546 (5.9%) | 936 (8.8%) |
| 65 to 74 Years | 370 (20.1%) | 367 (22.0%) |
| 75 Years and over | 197 (32.0%) | 454 (39.8%) |
Disability Class: Self-Care Difficulty
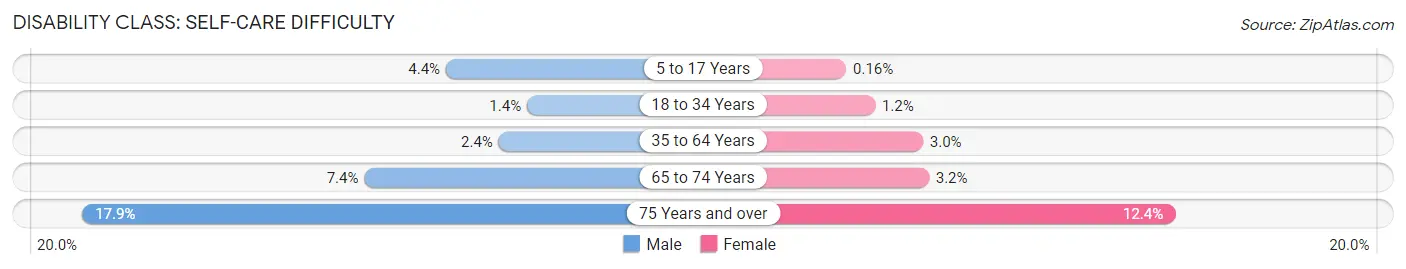
| Age Bracket | Male | Female |
| 5 to 17 Years | 193 (4.4%) | 8 (0.2%) |
| 18 to 34 Years | 116 (1.3%) | 120 (1.2%) |
| 35 to 64 Years | 221 (2.4%) | 319 (3.0%) |
| 65 to 74 Years | 136 (7.4%) | 54 (3.2%) |
| 75 Years and over | 110 (17.9%) | 141 (12.4%) |
Technology Access in Lancaster
Computing Device Access in Lancaster
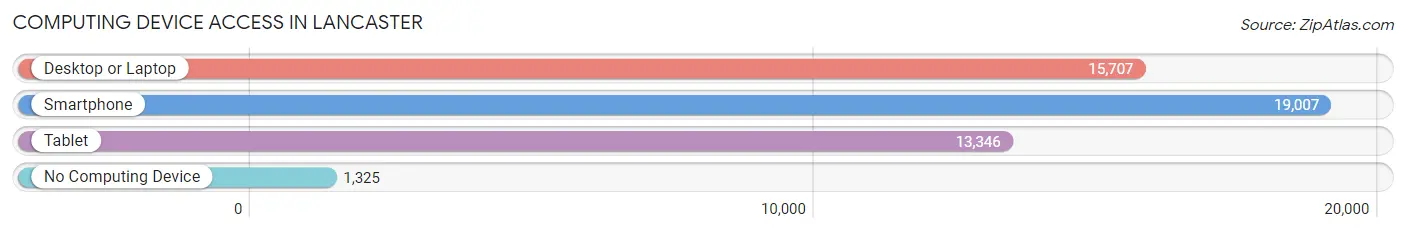
| Device Type | # Households | % Households |
| Desktop or Laptop | 15,707 | 74.0% |
| Smartphone | 19,007 | 89.5% |
| Tablet | 13,346 | 62.8% |
| No Computing Device | 1,325 | 6.2% |
| Total | 21,234 | 100.0% |
Internet Access in Lancaster
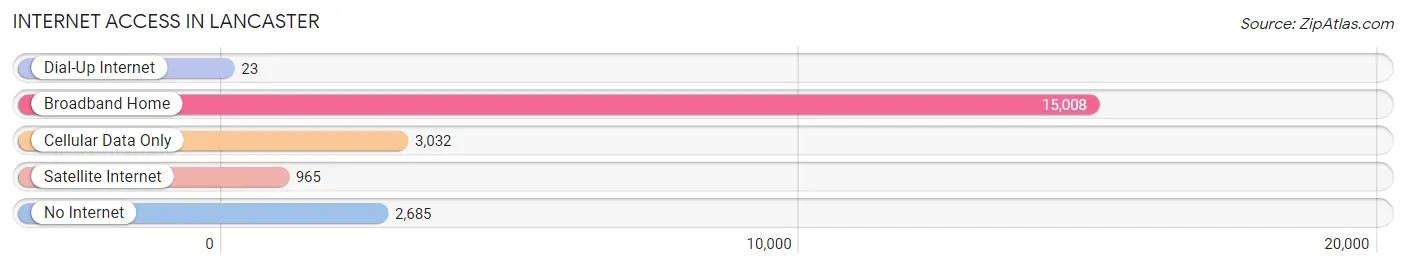
| Internet Type | # Households | % Households |
| Dial-Up Internet | 23 | 0.1% |
| Broadband Home | 15,008 | 70.7% |
| Cellular Data Only | 3,032 | 14.3% |
| Satellite Internet | 965 | 4.5% |
| No Internet | 2,685 | 12.6% |
| Total | 21,234 | 100.0% |
Lancaster Summary
Lancaster, Pennsylvania is a city located in the southeastern part of the state, in Lancaster County. It is the county seat and the largest city in the county. The city is situated in the Susquehanna Valley, which is part of the larger Chesapeake Bay watershed. Lancaster is located approximately 70 miles west of Philadelphia and 90 miles east of Harrisburg, the state capital. The city has a population of 59,322, according to the 2010 census, making it the eighth largest city in Pennsylvania.
History
Lancaster was founded in 1730 by settlers from Philadelphia. The city was named after the English city of Lancaster, and was the first inland city in the United States. The city was an important center of the Revolutionary War, and was the site of the signing of the Declaration of Independence in 1777.
In the 19th century, Lancaster was an important center of the Pennsylvania Dutch culture. The city was also an important center of the abolitionist movement, and was the site of the first public reading of the Emancipation Proclamation in 1863.
Geography
Lancaster is located in the southeastern part of Pennsylvania, in Lancaster County. The city is situated in the Susquehanna Valley, which is part of the larger Chesapeake Bay watershed. The city is located approximately 70 miles west of Philadelphia and 90 miles east of Harrisburg, the state capital.
The city has a total area of 10.3 square miles, of which 10.2 square miles is land and 0.1 square miles is water. The city is located in a humid continental climate zone, with hot, humid summers and cold, snowy winters.
Economy
Lancaster has a diverse economy, with a mix of manufacturing, retail, and service industries. The city is home to several large employers, including Armstrong World Industries, Fulton Financial Corporation, and Lancaster General Health. The city is also home to several colleges and universities, including Franklin & Marshall College, Millersville University, and Lancaster Bible College.
The city is also home to several tourist attractions, including the Lancaster Central Market, the Lancaster County Historical Society, and the Lancaster Science Factory.
Demographics
As of the 2010 census, the population of Lancaster was 59,322. The racial makeup of the city was 79.2% White, 11.3% African American, 0.4% Native American, 2.2% Asian, 0.1% Pacific Islander, 4.2% from other races, and 2.6% from two or more races. Hispanic or Latino of any race were 8.3% of the population.
The median income for a household in the city was $41,945, and the median income for a family was $51,919. The per capita income for the city was $22,945. About 11.3% of families and 15.2% of the population were below the poverty line, including 22.2% of those under age 18 and 8.2% of those age 65 or over.
Common Questions
What is Per Capita Income in Lancaster?
Per Capita income in Lancaster is $28,653.
What is the Median Family Income in Lancaster?
Median Family Income in Lancaster is $66,774.
What is the Median Household income in Lancaster?
Median Household Income in Lancaster is $61,014.
What is Income or Wage Gap in Lancaster?
Income or Wage Gap in Lancaster is 18.6%.
Women in Lancaster earn 81.4 cents for every dollar earned by a man.
What is Family Income Deficit in Lancaster?
Family Income Deficit in Lancaster is $9,459.
Families that are below poverty line in Lancaster earn $9,459 less on average than the poverty threshold level.
What is Inequality or Gini Index in Lancaster?
Inequality or Gini Index in Lancaster is 0.43.
What is the Total Population of Lancaster?
Total Population of Lancaster is 57,970.
What is the Total Male Population of Lancaster?
Total Male Population of Lancaster is 27,611.
What is the Total Female Population of Lancaster?
Total Female Population of Lancaster is 30,359.
What is the Ratio of Males per 100 Females in Lancaster?
There are 90.95 Males per 100 Females in Lancaster.
What is the Ratio of Females per 100 Males in Lancaster?
There are 109.95 Females per 100 Males in Lancaster.
What is the Median Population Age in Lancaster?
Median Population Age in Lancaster is 31.8 Years.
What is the Average Family Size in Lancaster
Average Family Size in Lancaster is 3.3 People.
What is the Average Household Size in Lancaster
Average Household Size in Lancaster is 2.6 People.
How Large is the Labor Force in Lancaster?
There are 31,588 People in the Labor Forcein in Lancaster.
What is the Percentage of People in the Labor Force in Lancaster?
68.7% of People are in the Labor Force in Lancaster.
What is the Unemployment Rate in Lancaster?
Unemployment Rate in Lancaster is 7.4%.