Meridian, ID Map & Demographics
Meridian Map
Meridian Overview
$44,540
PER CAPITA INCOME
$107,635
AVG FAMILY INCOME
$93,296
AVG HOUSEHOLD INCOME
34.1%
WAGE / INCOME GAP [ % ]
65.9¢/ $1
WAGE / INCOME GAP [ $ ]
$10,455
FAMILY INCOME DEFICIT
0.42
INEQUALITY / GINI INDEX
119,872
TOTAL POPULATION
59,361
MALE POPULATION
60,511
FEMALE POPULATION
98.10
MALES / 100 FEMALES
101.94
FEMALES / 100 MALES
37.1
MEDIAN AGE
3.2
AVG FAMILY SIZE
2.8
AVG HOUSEHOLD SIZE
63,815
LABOR FORCE [ PEOPLE ]
70.4%
PERCENT IN LABOR FORCE
2.7%
UNEMPLOYMENT RATE
Meridian Area Codes
Income in Meridian
Income Overview in Meridian
Per Capita Income in Meridian is $44,540, while median incomes of families and households are $107,635 and $93,296 respectively.
| Characteristic | Number | Measure |
| Per Capita Income | 119,872 | $44,540 |
| Median Family Income | 32,089 | $107,635 |
| Mean Family Income | 32,089 | $135,280 |
| Median Household Income | 42,843 | $93,296 |
| Mean Household Income | 42,843 | $120,303 |
| Income Deficit | 32,089 | $10,455 |
| Wage / Income Gap (%) | 119,872 | 34.12% |
| Wage / Income Gap ($) | 119,872 | 65.88¢ per $1 |
| Gini / Inequality Index | 119,872 | 0.42 |
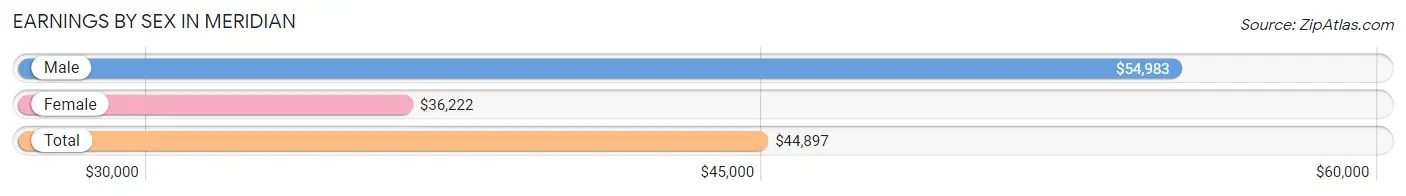
Earnings by Sex in Meridian
Average Earnings in Meridian are $44,897, $54,983 for men and $36,222 for women, a difference of 34.1%.
| Sex | Number | Average Earnings |
| Male | 35,317 (53.2%) | $54,983 |
| Female | 31,033 (46.8%) | $36,222 |
| Total | 66,350 (100.0%) | $44,897 |
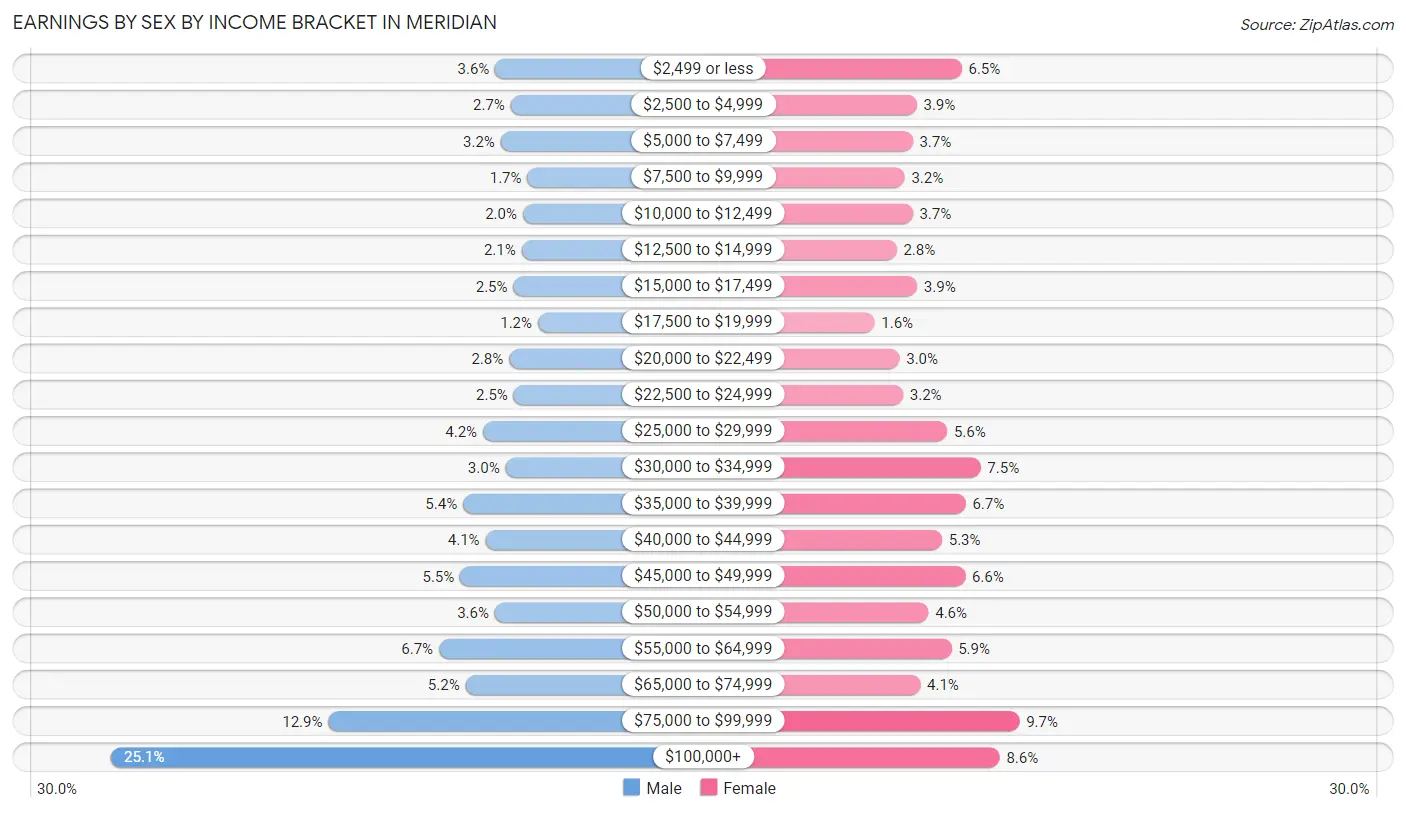
Earnings by Sex by Income Bracket in Meridian
The most common earnings brackets in Meridian are $100,000+ for men (8,878 | 25.1%) and $75,000 to $99,999 for women (3,008 | 9.7%).
| Income | Male | Female |
| $2,499 or less | 1,255 (3.5%) | 2,002 (6.5%) |
| $2,500 to $4,999 | 948 (2.7%) | 1,218 (3.9%) |
| $5,000 to $7,499 | 1,145 (3.2%) | 1,144 (3.7%) |
| $7,500 to $9,999 | 616 (1.7%) | 1,006 (3.2%) |
| $10,000 to $12,499 | 705 (2.0%) | 1,144 (3.7%) |
| $12,500 to $14,999 | 730 (2.1%) | 865 (2.8%) |
| $15,000 to $17,499 | 892 (2.5%) | 1,223 (3.9%) |
| $17,500 to $19,999 | 406 (1.1%) | 480 (1.5%) |
| $20,000 to $22,499 | 978 (2.8%) | 917 (2.9%) |
| $22,500 to $24,999 | 888 (2.5%) | 976 (3.2%) |
| $25,000 to $29,999 | 1,498 (4.2%) | 1,747 (5.6%) |
| $30,000 to $34,999 | 1,049 (3.0%) | 2,332 (7.5%) |
| $35,000 to $39,999 | 1,892 (5.4%) | 2,069 (6.7%) |
| $40,000 to $44,999 | 1,447 (4.1%) | 1,657 (5.3%) |
| $45,000 to $49,999 | 1,951 (5.5%) | 2,061 (6.6%) |
| $50,000 to $54,999 | 1,262 (3.6%) | 1,422 (4.6%) |
| $55,000 to $64,999 | 2,369 (6.7%) | 1,822 (5.9%) |
| $65,000 to $74,999 | 1,843 (5.2%) | 1,278 (4.1%) |
| $75,000 to $99,999 | 4,565 (12.9%) | 3,008 (9.7%) |
| $100,000+ | 8,878 (25.1%) | 2,662 (8.6%) |
| Total | 35,317 (100.0%) | 31,033 (100.0%) |
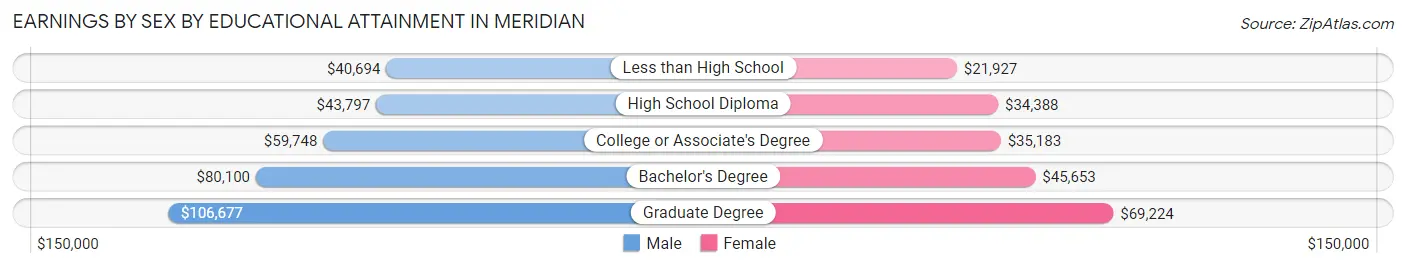
Earnings by Sex by Educational Attainment in Meridian
Average earnings in Meridian are $65,583 for men and $40,001 for women, a difference of 39.0%. Men with an educational attainment of graduate degree enjoy the highest average annual earnings of $106,677, while those with less than high school education earn the least with $40,694. Women with an educational attainment of graduate degree earn the most with the average annual earnings of $69,224, while those with less than high school education have the smallest earnings of $21,927.
| Educational Attainment | Male Income | Female Income |
| Less than High School | $40,694 | $21,927 |
| High School Diploma | $43,797 | $34,388 |
| College or Associate's Degree | $59,748 | $35,183 |
| Bachelor's Degree | $80,100 | $45,653 |
| Graduate Degree | $106,677 | $69,224 |
| Total | $65,583 | $40,001 |
Family Income in Meridian
Family Income Brackets in Meridian
According to the Meridian family income data, there are 8,343 families falling into the $100,000 to $149,999 income range, which is the most common income bracket and makes up 26.0% of all families. Conversely, the less than $10,000 income bracket is the least frequent group with only 353 families (1.1%) belonging to this category.
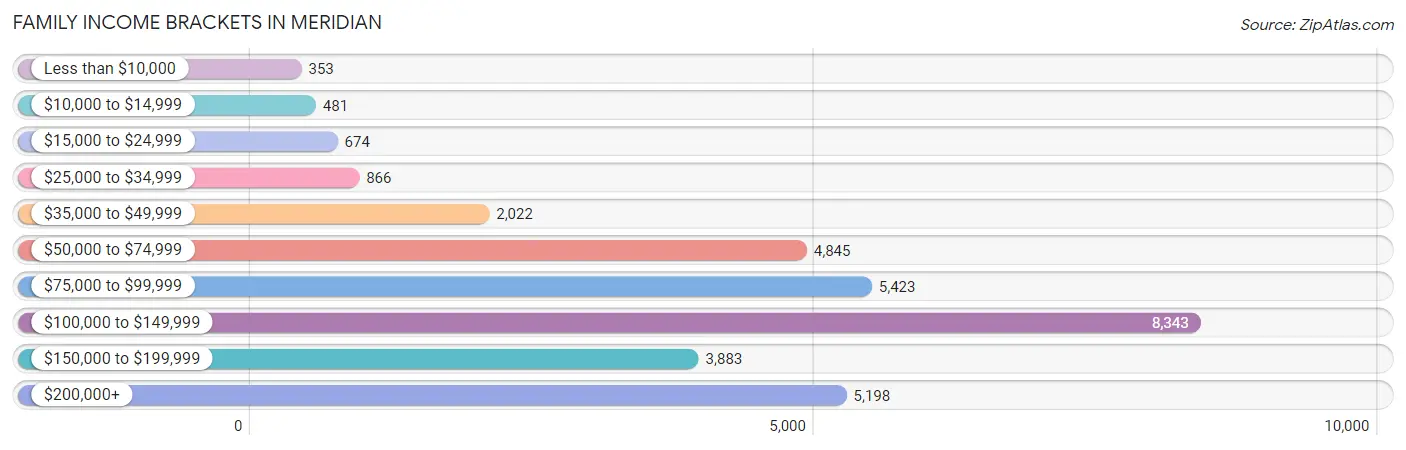
| Income Bracket | # Families | % Families |
| Less than $10,000 | 353 | 1.1% |
| $10,000 to $14,999 | 481 | 1.5% |
| $15,000 to $24,999 | 674 | 2.1% |
| $25,000 to $34,999 | 866 | 2.7% |
| $35,000 to $49,999 | 2,022 | 6.3% |
| $50,000 to $74,999 | 4,845 | 15.1% |
| $75,000 to $99,999 | 5,423 | 16.9% |
| $100,000 to $149,999 | 8,343 | 26.0% |
| $150,000 to $199,999 | 3,883 | 12.1% |
| $200,000+ | 5,198 | 16.2% |
Family Income by Famaliy Size in Meridian
7+ person families (561 | 1.8%) account for the highest median family income in Meridian with $164,844 per family, while 2-person families (14,413 | 44.9%) have the highest median income of $46,614 per family member.
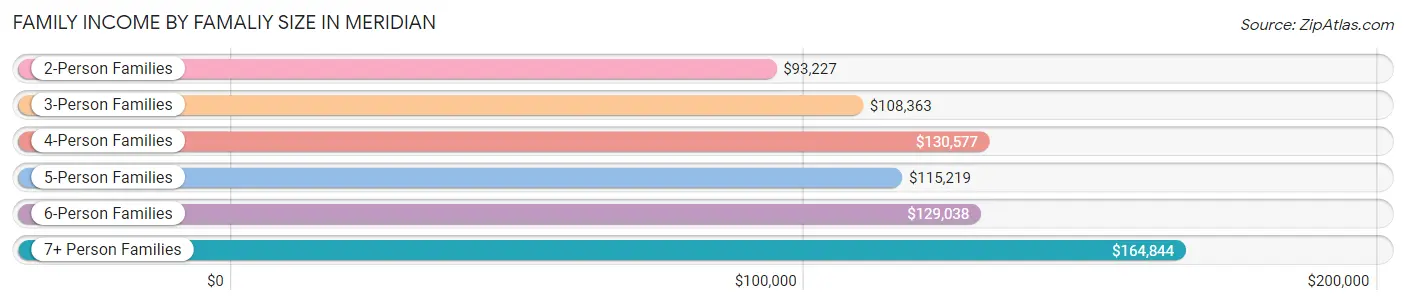
| Income Bracket | # Families | Median Income |
| 2-Person Families | 14,413 (44.9%) | $93,227 |
| 3-Person Families | 6,385 (19.9%) | $108,363 |
| 4-Person Families | 6,124 (19.1%) | $130,577 |
| 5-Person Families | 2,908 (9.1%) | $115,219 |
| 6-Person Families | 1,698 (5.3%) | $129,038 |
| 7+ Person Families | 561 (1.8%) | $164,844 |
| Total | 32,089 (100.0%) | $107,635 |
Family Income by Number of Earners in Meridian
The median family income in Meridian is $107,635, with families comprising 3+ earners (4,012) having the highest median family income of $137,454, while families with no earners (3,446) have the lowest median family income of $75,735, accounting for 12.5% and 10.7% of families, respectively.
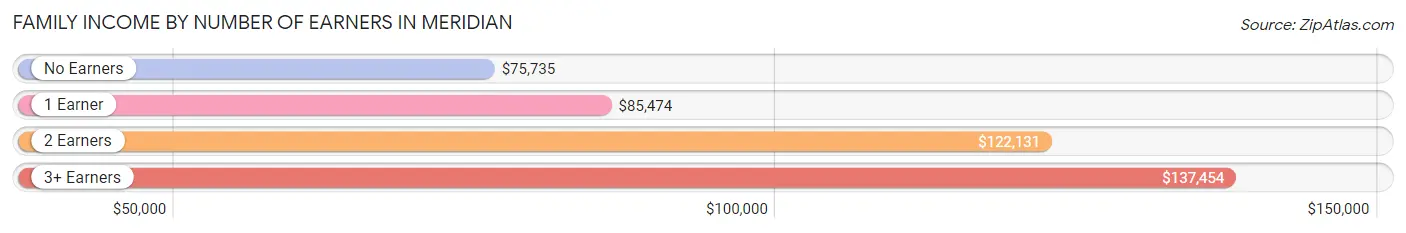
| Number of Earners | # Families | Median Income |
| No Earners | 3,446 (10.7%) | $75,735 |
| 1 Earner | 8,786 (27.4%) | $85,474 |
| 2 Earners | 15,845 (49.4%) | $122,131 |
| 3+ Earners | 4,012 (12.5%) | $137,454 |
| Total | 32,089 (100.0%) | $107,635 |
Household Income in Meridian
Household Income Brackets in Meridian
With 9,854 households falling in the category, the $100,000 to $149,999 income range is the most frequent in Meridian, accounting for 23.0% of all households. In contrast, only 728 households (1.7%) fall into the $10,000 to $14,999 income bracket, making it the least populous group.
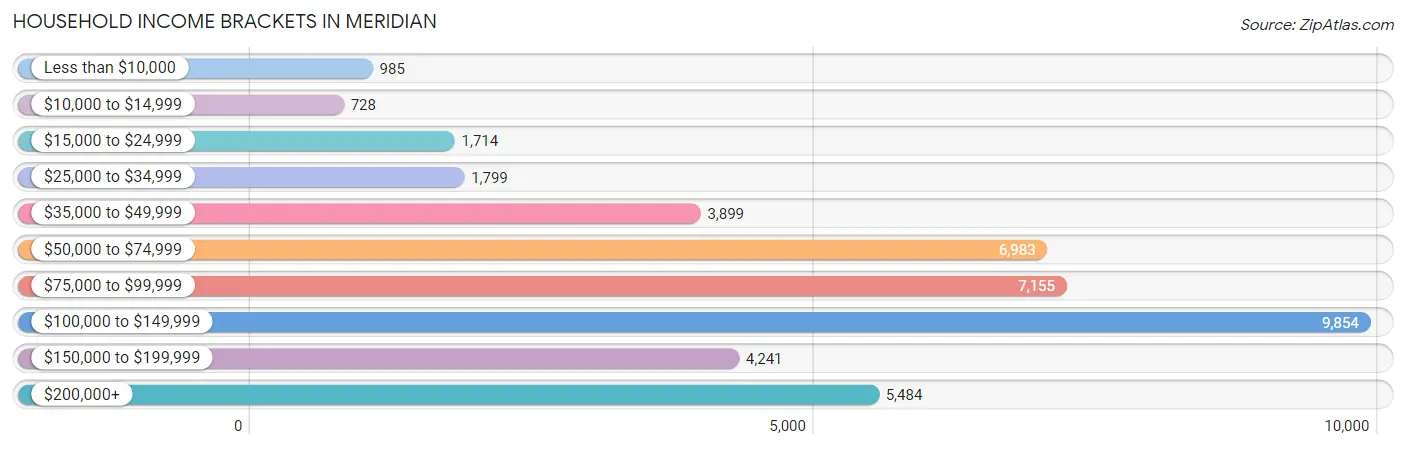
| Income Bracket | # Households | % Households |
| Less than $10,000 | 985 | 2.3% |
| $10,000 to $14,999 | 728 | 1.7% |
| $15,000 to $24,999 | 1,714 | 4.0% |
| $25,000 to $34,999 | 1,799 | 4.2% |
| $35,000 to $49,999 | 3,899 | 9.1% |
| $50,000 to $74,999 | 6,983 | 16.3% |
| $75,000 to $99,999 | 7,155 | 16.7% |
| $100,000 to $149,999 | 9,854 | 23.0% |
| $150,000 to $199,999 | 4,241 | 9.9% |
| $200,000+ | 5,484 | 12.8% |
Household Income by Householder Age in Meridian
The median household income in Meridian is $93,296, with the highest median household income of $113,045 found in the 45 to 64 years age bracket for the primary householder. A total of 15,860 households (37.0%) fall into this category. Meanwhile, the 15 to 24 years age bracket for the primary householder has the lowest median household income of $60,379, with 1,381 households (3.2%) in this group.
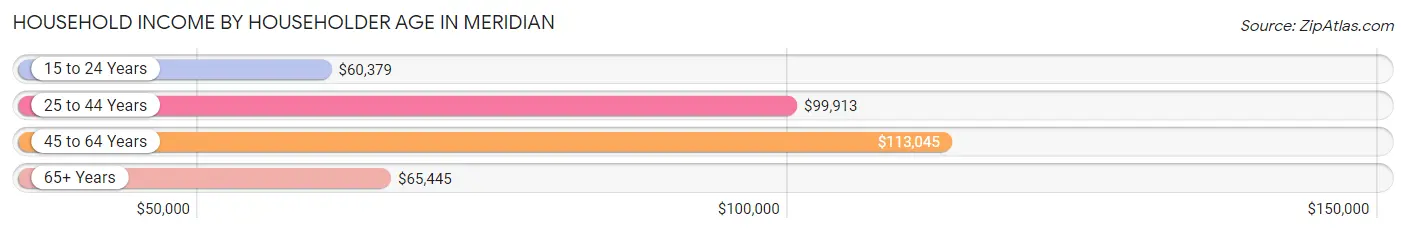
| Income Bracket | # Households | Median Income |
| 15 to 24 Years | 1,381 (3.2%) | $60,379 |
| 25 to 44 Years | 16,251 (37.9%) | $99,913 |
| 45 to 64 Years | 15,860 (37.0%) | $113,045 |
| 65+ Years | 9,351 (21.8%) | $65,445 |
| Total | 42,843 (100.0%) | $93,296 |
Poverty in Meridian
Income Below Poverty by Sex and Age in Meridian
With 5.6% poverty level for males and 7.2% for females among the residents of Meridian, 18 to 24 year old males and 18 to 24 year old females are the most vulnerable to poverty, with 648 males (13.0%) and 710 females (15.9%) in their respective age groups living below the poverty level.
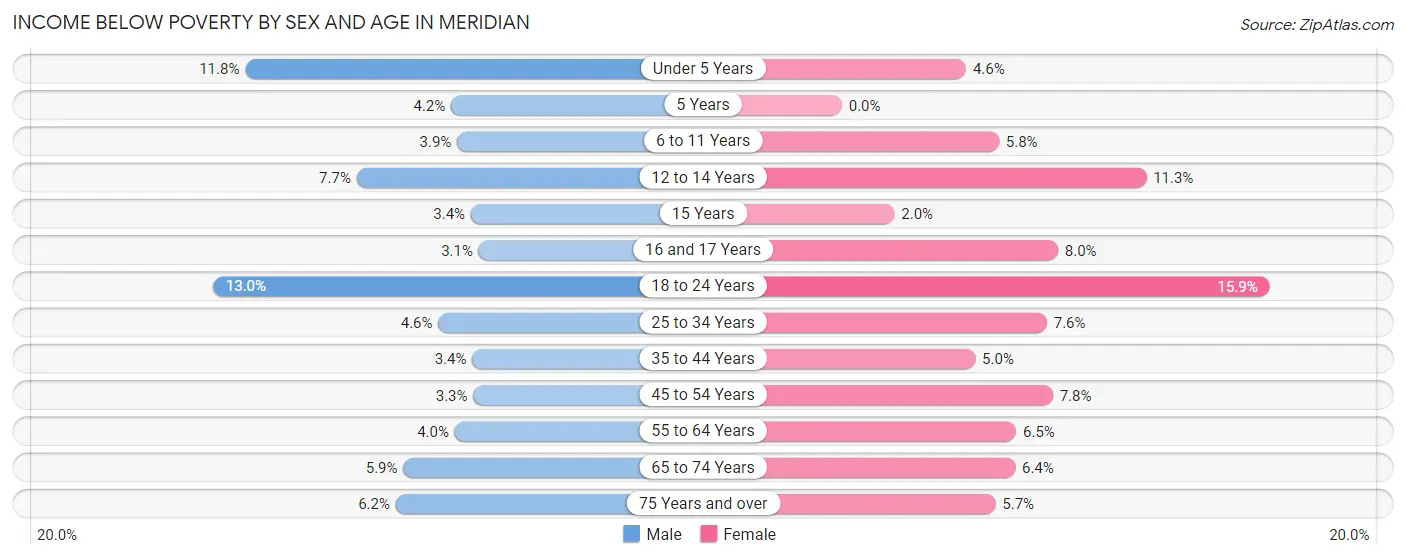
| Age Bracket | Male | Female |
| Under 5 Years | 464 (11.8%) | 144 (4.6%) |
| 5 Years | 29 (4.2%) | 0 (0.0%) |
| 6 to 11 Years | 227 (3.9%) | 352 (5.8%) |
| 12 to 14 Years | 255 (7.7%) | 343 (11.3%) |
| 15 Years | 44 (3.4%) | 19 (1.9%) |
| 16 and 17 Years | 46 (3.1%) | 140 (8.0%) |
| 18 to 24 Years | 648 (13.0%) | 710 (15.9%) |
| 25 to 34 Years | 324 (4.6%) | 585 (7.6%) |
| 35 to 44 Years | 312 (3.4%) | 464 (5.0%) |
| 45 to 54 Years | 288 (3.3%) | 600 (7.8%) |
| 55 to 64 Years | 227 (4.0%) | 432 (6.5%) |
| 65 to 74 Years | 262 (5.9%) | 337 (6.4%) |
| 75 Years and over | 160 (6.2%) | 201 (5.7%) |
| Total | 3,286 (5.6%) | 4,327 (7.2%) |
Income Above Poverty by Sex and Age in Meridian
According to the poverty statistics in Meridian, males aged 16 and 17 years and females aged 5 years are the age groups that are most secure financially, with 96.9% of males and 100.0% of females in these age groups living above the poverty line.
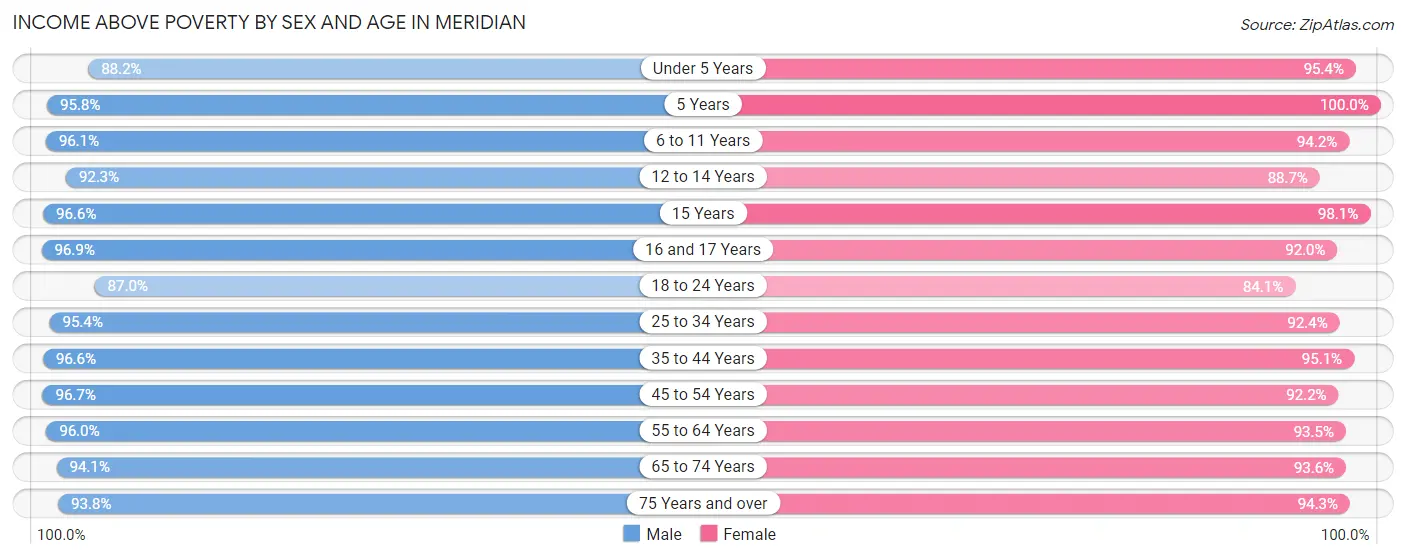
| Age Bracket | Male | Female |
| Under 5 Years | 3,465 (88.2%) | 2,977 (95.4%) |
| 5 Years | 666 (95.8%) | 686 (100.0%) |
| 6 to 11 Years | 5,533 (96.1%) | 5,686 (94.2%) |
| 12 to 14 Years | 3,070 (92.3%) | 2,693 (88.7%) |
| 15 Years | 1,239 (96.6%) | 957 (98.1%) |
| 16 and 17 Years | 1,417 (96.9%) | 1,605 (92.0%) |
| 18 to 24 Years | 4,331 (87.0%) | 3,762 (84.1%) |
| 25 to 34 Years | 6,656 (95.4%) | 7,101 (92.4%) |
| 35 to 44 Years | 8,926 (96.6%) | 8,910 (95.1%) |
| 45 to 54 Years | 8,334 (96.7%) | 7,060 (92.2%) |
| 55 to 64 Years | 5,400 (96.0%) | 6,243 (93.5%) |
| 65 to 74 Years | 4,148 (94.1%) | 4,905 (93.6%) |
| 75 Years and over | 2,411 (93.8%) | 3,323 (94.3%) |
| Total | 55,596 (94.4%) | 55,908 (92.8%) |
Income Below Poverty Among Married-Couple Families in Meridian
The poverty statistics for married-couple families in Meridian show that 2.1% or 567 of the total 26,459 families live below the poverty line. Families with 1 or 2 children have the highest poverty rate of 2.5%, comprising of 217 families. On the other hand, families with 5 or more children have the lowest poverty rate of 0.0%, which includes 0 families.
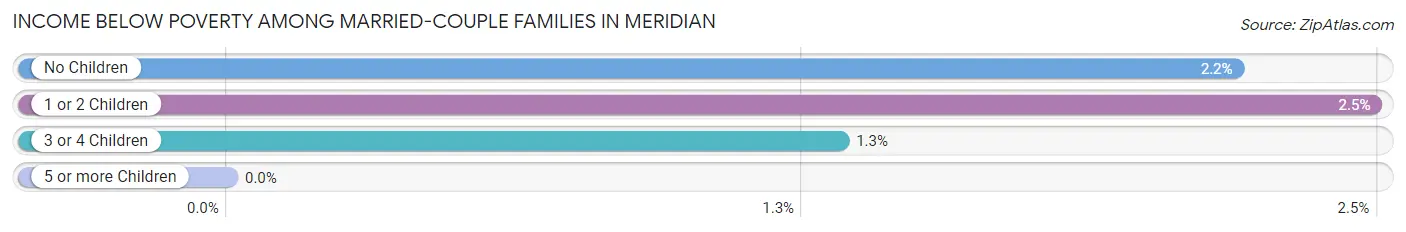
| Children | Above Poverty | Below Poverty |
| No Children | 13,696 (97.8%) | 306 (2.2%) |
| 1 or 2 Children | 8,486 (97.5%) | 217 (2.5%) |
| 3 or 4 Children | 3,252 (98.7%) | 44 (1.3%) |
| 5 or more Children | 458 (100.0%) | 0 (0.0%) |
| Total | 25,892 (97.9%) | 567 (2.1%) |
Income Below Poverty Among Single-Parent Households in Meridian
According to the poverty data in Meridian, 14.4% or 303 single-father households and 15.3% or 540 single-mother households are living below the poverty line. Among single-father households, those with 3 or 4 children have the highest poverty rate, with 85 households (61.6%) experiencing poverty. Likewise, among single-mother households, those with 3 or 4 children have the highest poverty rate, with 94 households (36.4%) falling below the poverty line.
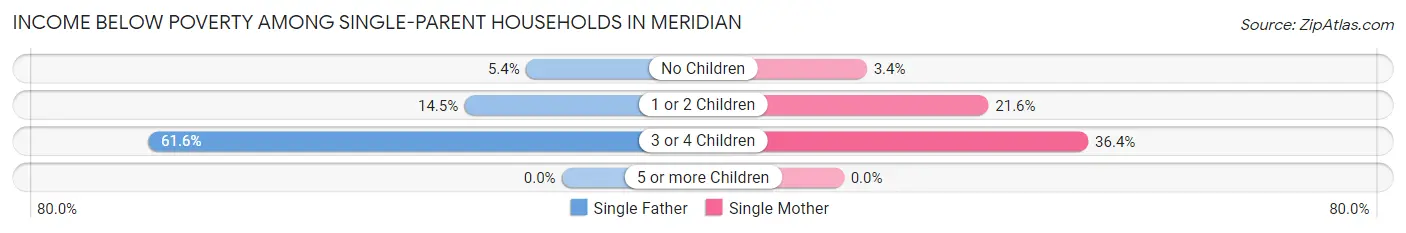
| Children | Single Father | Single Mother |
| No Children | 39 (5.3%) | 49 (3.4%) |
| 1 or 2 Children | 179 (14.5%) | 397 (21.6%) |
| 3 or 4 Children | 85 (61.6%) | 94 (36.4%) |
| 5 or more Children | 0 (0.0%) | 0 (0.0%) |
| Total | 303 (14.4%) | 540 (15.3%) |
Income Below Poverty Among Married-Couple vs Single-Parent Households in Meridian
The poverty data for Meridian shows that 567 of the married-couple family households (2.1%) and 843 of the single-parent households (15.0%) are living below the poverty level. Within the married-couple family households, those with 1 or 2 children have the highest poverty rate, with 217 households (2.5%) falling below the poverty line. Among the single-parent households, those with 3 or 4 children have the highest poverty rate, with 179 household (45.2%) living below poverty.
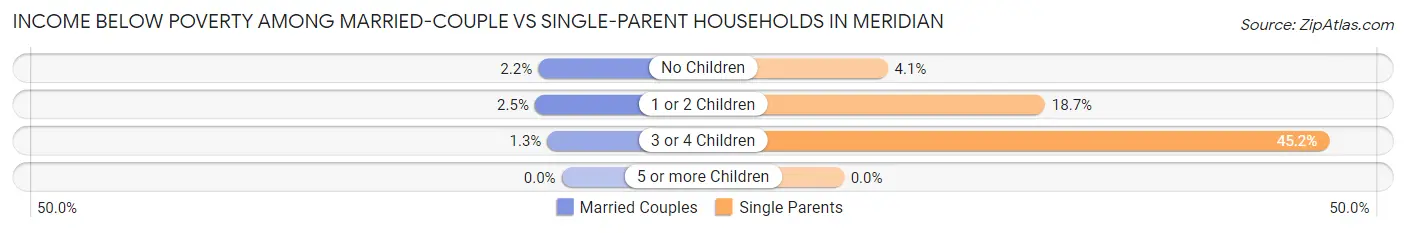
| Children | Married-Couple Families | Single-Parent Households |
| No Children | 306 (2.2%) | 88 (4.1%) |
| 1 or 2 Children | 217 (2.5%) | 576 (18.7%) |
| 3 or 4 Children | 44 (1.3%) | 179 (45.2%) |
| 5 or more Children | 0 (0.0%) | 0 (0.0%) |
| Total | 567 (2.1%) | 843 (15.0%) |
Race in Meridian
The most populous races in Meridian are White / Caucasian (102,210 | 85.3%), Hispanic or Latino (10,739 | 9.0%), and Two or more Races (9,667 | 8.1%).
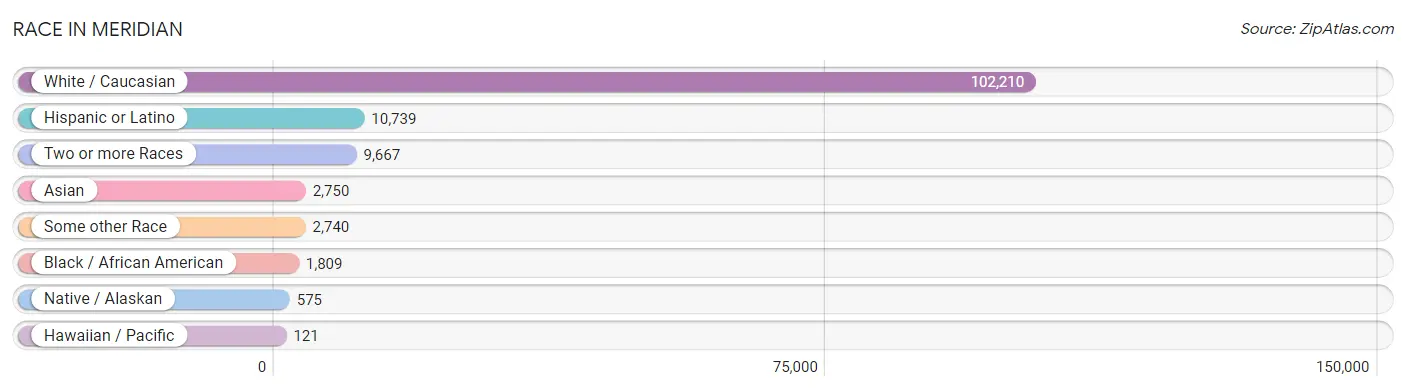
| Race | # Population | % Population |
| Asian | 2,750 | 2.3% |
| Black / African American | 1,809 | 1.5% |
| Hawaiian / Pacific | 121 | 0.1% |
| Hispanic or Latino | 10,739 | 9.0% |
| Native / Alaskan | 575 | 0.5% |
| White / Caucasian | 102,210 | 85.3% |
| Two or more Races | 9,667 | 8.1% |
| Some other Race | 2,740 | 2.3% |
| Total | 119,872 | 100.0% |
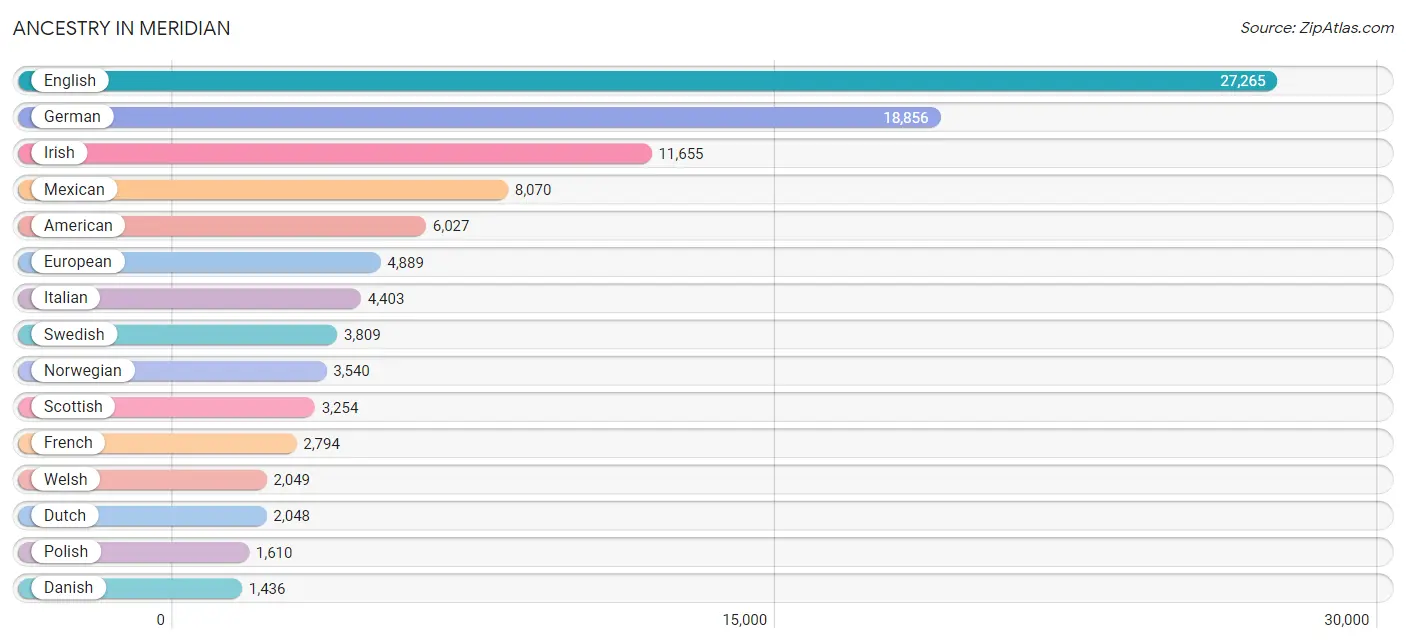
Ancestry in Meridian
The most populous ancestries reported in Meridian are English (27,265 | 22.8%), German (18,856 | 15.7%), Irish (11,655 | 9.7%), Mexican (8,070 | 6.7%), and American (6,027 | 5.0%), together accounting for 60.0% of all Meridian residents.
| Ancestry | # Population | % Population |
| African | 201 | 0.2% |
| Aleut | 8 | 0.0% |
| American | 6,027 | 5.0% |
| Arab | 282 | 0.2% |
| Argentinean | 75 | 0.1% |
| Armenian | 27 | 0.0% |
| Austrian | 90 | 0.1% |
| Basque | 667 | 0.6% |
| Belgian | 98 | 0.1% |
| Bhutanese | 1,151 | 1.0% |
| Blackfeet | 9 | 0.0% |
| British | 1,051 | 0.9% |
| Bulgarian | 15 | 0.0% |
| Burmese | 667 | 0.6% |
| Cajun | 35 | 0.0% |
| Canadian | 475 | 0.4% |
| Central American | 279 | 0.2% |
| Central American Indian | 21 | 0.0% |
| Cherokee | 77 | 0.1% |
| Cheyenne | 12 | 0.0% |
| Chickasaw | 101 | 0.1% |
| Chilean | 15 | 0.0% |
| Chinese | 24 | 0.0% |
| Chippewa | 32 | 0.0% |
| Choctaw | 27 | 0.0% |
| Colombian | 248 | 0.2% |
| Costa Rican | 39 | 0.0% |
| Croatian | 110 | 0.1% |
| Cuban | 125 | 0.1% |
| Czech | 404 | 0.3% |
| Czechoslovakian | 314 | 0.3% |
| Danish | 1,436 | 1.2% |
| Dutch | 2,048 | 1.7% |
| Eastern European | 232 | 0.2% |
| Ecuadorian | 67 | 0.1% |
| Egyptian | 11 | 0.0% |
| English | 27,265 | 22.8% |
| European | 4,889 | 4.1% |
| Finnish | 350 | 0.3% |
| French | 2,794 | 2.3% |
| French Canadian | 428 | 0.4% |
| German | 18,856 | 15.7% |
| German Russian | 98 | 0.1% |
| Greek | 390 | 0.3% |
| Guamanian / Chamorro | 75 | 0.1% |
| Guatemalan | 131 | 0.1% |
| Haitian | 193 | 0.2% |
| Honduran | 83 | 0.1% |
| Hungarian | 229 | 0.2% |
| Icelander | 91 | 0.1% |
| Indian (Asian) | 1,016 | 0.9% |
| Iranian | 155 | 0.1% |
| Irish | 11,655 | 9.7% |
| Israeli | 190 | 0.2% |
| Italian | 4,403 | 3.7% |
| Jamaican | 40 | 0.0% |
| Korean | 1,237 | 1.0% |
| Laotian | 70 | 0.1% |
| Lebanese | 56 | 0.1% |
| Lithuanian | 117 | 0.1% |
| Malaysian | 398 | 0.3% |
| Maltese | 16 | 0.0% |
| Mexican | 8,070 | 6.7% |
| Mexican American Indian | 101 | 0.1% |
| Native Hawaiian | 122 | 0.1% |
| Navajo | 34 | 0.0% |
| Northern European | 269 | 0.2% |
| Norwegian | 3,540 | 2.9% |
| Osage | 4 | 0.0% |
| Pakistani | 444 | 0.4% |
| Paraguayan | 15 | 0.0% |
| Pennsylvania German | 62 | 0.1% |
| Peruvian | 443 | 0.4% |
| Polish | 1,610 | 1.3% |
| Portuguese | 762 | 0.6% |
| Pueblo | 7 | 0.0% |
| Puerto Rican | 557 | 0.5% |
| Puget Sound Salish | 24 | 0.0% |
| Romanian | 249 | 0.2% |
| Russian | 556 | 0.5% |
| Salvadoran | 15 | 0.0% |
| Scandinavian | 1,364 | 1.1% |
| Scotch-Irish | 1,200 | 1.0% |
| Scottish | 3,254 | 2.7% |
| Sioux | 363 | 0.3% |
| Slavic | 19 | 0.0% |
| Slovak | 72 | 0.1% |
| Somali | 11 | 0.0% |
| South African | 12 | 0.0% |
| South American | 875 | 0.7% |
| Spaniard | 369 | 0.3% |
| Spanish | 266 | 0.2% |
| Sri Lankan | 455 | 0.4% |
| Subsaharan African | 224 | 0.2% |
| Swedish | 3,809 | 3.2% |
| Swiss | 470 | 0.4% |
| Thai | 153 | 0.1% |
| Tlingit-Haida | 5 | 0.0% |
| Tongan | 22 | 0.0% |
| Ukrainian | 373 | 0.3% |
| Venezuelan | 12 | 0.0% |
| Welsh | 2,049 | 1.7% |
| Yaqui | 185 | 0.2% |
| Yugoslavian | 345 | 0.3% | View All 104 Rows |
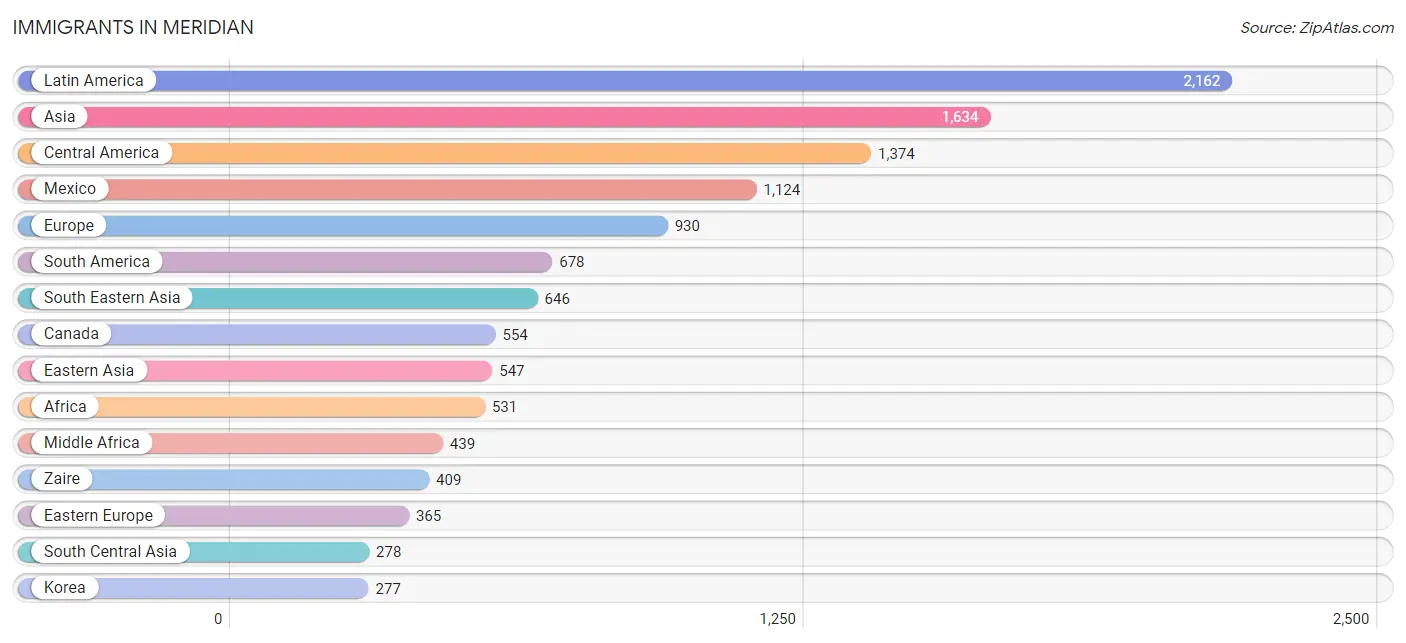
Immigrants in Meridian
The most numerous immigrant groups reported in Meridian came from Latin America (2,162 | 1.8%), Asia (1,634 | 1.4%), Central America (1,374 | 1.1%), Mexico (1,124 | 0.9%), and Europe (930 | 0.8%), together accounting for 6.0% of all Meridian residents.
| Immigration Origin | # Population | % Population |
| Africa | 531 | 0.4% |
| Argentina | 213 | 0.2% |
| Asia | 1,634 | 1.4% |
| Azores | 12 | 0.0% |
| Bosnia and Herzegovina | 118 | 0.1% |
| Canada | 554 | 0.5% |
| Caribbean | 110 | 0.1% |
| Central America | 1,374 | 1.1% |
| Chile | 5 | 0.0% |
| China | 205 | 0.2% |
| Colombia | 196 | 0.2% |
| Congo | 30 | 0.0% |
| Costa Rica | 54 | 0.1% |
| Cuba | 27 | 0.0% |
| Eastern Africa | 92 | 0.1% |
| Eastern Asia | 547 | 0.5% |
| Eastern Europe | 365 | 0.3% |
| Ecuador | 34 | 0.0% |
| El Salvador | 15 | 0.0% |
| England | 7 | 0.0% |
| Europe | 930 | 0.8% |
| France | 7 | 0.0% |
| Germany | 253 | 0.2% |
| Greece | 80 | 0.1% |
| Guatemala | 46 | 0.0% |
| Haiti | 43 | 0.0% |
| Honduras | 135 | 0.1% |
| Hong Kong | 27 | 0.0% |
| India | 102 | 0.1% |
| Indonesia | 65 | 0.1% |
| Iran | 116 | 0.1% |
| Iraq | 44 | 0.0% |
| Israel | 85 | 0.1% |
| Italy | 51 | 0.0% |
| Jamaica | 40 | 0.0% |
| Japan | 65 | 0.1% |
| Kazakhstan | 22 | 0.0% |
| Kenya | 25 | 0.0% |
| Korea | 277 | 0.2% |
| Laos | 223 | 0.2% |
| Latin America | 2,162 | 1.8% |
| Lebanon | 34 | 0.0% |
| Mexico | 1,124 | 0.9% |
| Middle Africa | 439 | 0.4% |
| Moldova | 30 | 0.0% |
| Nepal | 38 | 0.0% |
| Northern Europe | 162 | 0.1% |
| Peru | 58 | 0.1% |
| Philippines | 139 | 0.1% |
| Poland | 39 | 0.0% |
| Portugal | 12 | 0.0% |
| Romania | 15 | 0.0% |
| Russia | 13 | 0.0% |
| Somalia | 11 | 0.0% |
| South America | 678 | 0.6% |
| South Central Asia | 278 | 0.2% |
| South Eastern Asia | 646 | 0.5% |
| Southern Europe | 143 | 0.1% |
| Taiwan | 32 | 0.0% |
| Thailand | 24 | 0.0% |
| Ukraine | 150 | 0.1% |
| Venezuela | 12 | 0.0% |
| Vietnam | 195 | 0.2% |
| Western Asia | 163 | 0.1% |
| Western Europe | 260 | 0.2% |
| Zaire | 409 | 0.3% | View All 66 Rows |
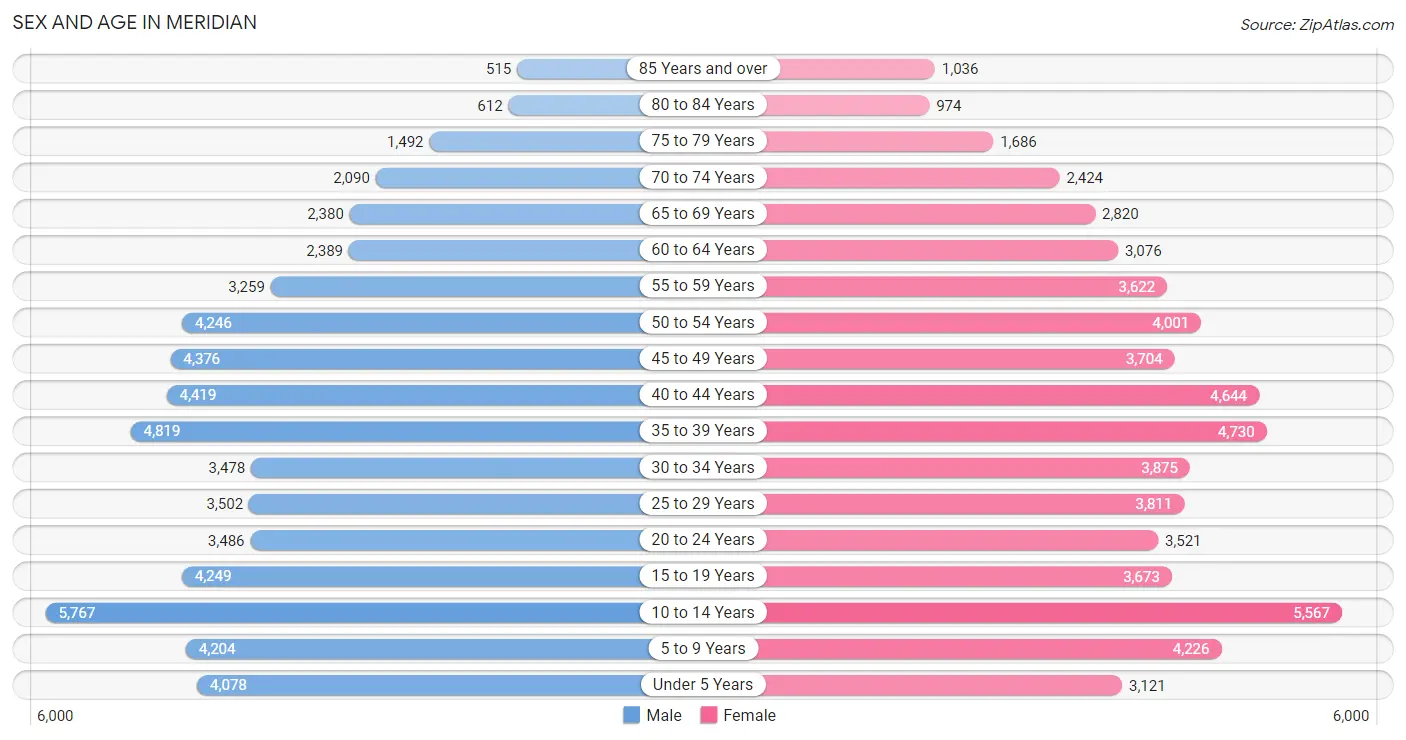
Sex and Age in Meridian
Sex and Age in Meridian
The most populous age groups in Meridian are 10 to 14 Years (5,767 | 9.7%) for men and 10 to 14 Years (5,567 | 9.2%) for women.
| Age Bracket | Male | Female |
| Under 5 Years | 4,078 (6.9%) | 3,121 (5.2%) |
| 5 to 9 Years | 4,204 (7.1%) | 4,226 (7.0%) |
| 10 to 14 Years | 5,767 (9.7%) | 5,567 (9.2%) |
| 15 to 19 Years | 4,249 (7.2%) | 3,673 (6.1%) |
| 20 to 24 Years | 3,486 (5.9%) | 3,521 (5.8%) |
| 25 to 29 Years | 3,502 (5.9%) | 3,811 (6.3%) |
| 30 to 34 Years | 3,478 (5.9%) | 3,875 (6.4%) |
| 35 to 39 Years | 4,819 (8.1%) | 4,730 (7.8%) |
| 40 to 44 Years | 4,419 (7.4%) | 4,644 (7.7%) |
| 45 to 49 Years | 4,376 (7.4%) | 3,704 (6.1%) |
| 50 to 54 Years | 4,246 (7.1%) | 4,001 (6.6%) |
| 55 to 59 Years | 3,259 (5.5%) | 3,622 (6.0%) |
| 60 to 64 Years | 2,389 (4.0%) | 3,076 (5.1%) |
| 65 to 69 Years | 2,380 (4.0%) | 2,820 (4.7%) |
| 70 to 74 Years | 2,090 (3.5%) | 2,424 (4.0%) |
| 75 to 79 Years | 1,492 (2.5%) | 1,686 (2.8%) |
| 80 to 84 Years | 612 (1.0%) | 974 (1.6%) |
| 85 Years and over | 515 (0.9%) | 1,036 (1.7%) |
| Total | 59,361 (100.0%) | 60,511 (100.0%) |
Families and Households in Meridian
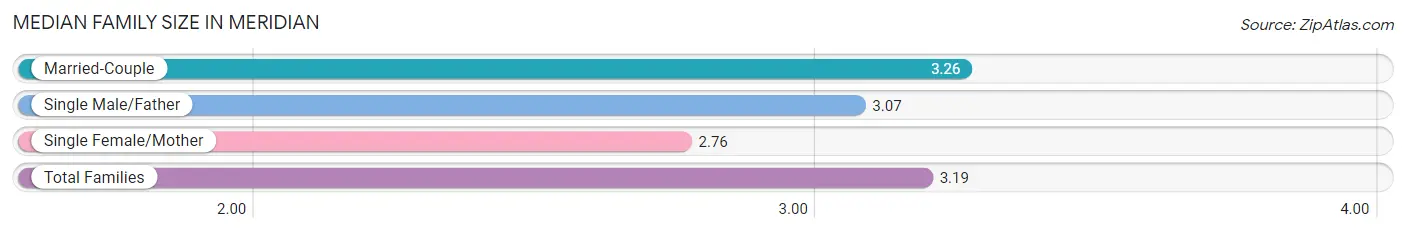
Median Family Size in Meridian
The median family size in Meridian is 3.19 persons per family, with married-couple families (26,459 | 82.5%) accounting for the largest median family size of 3.26 persons per family. On the other hand, single female/mother families (3,530 | 11.0%) represent the smallest median family size with 2.76 persons per family.
| Family Type | # Families | Family Size |
| Married-Couple | 26,459 (82.5%) | 3.26 |
| Single Male/Father | 2,100 (6.5%) | 3.07 |
| Single Female/Mother | 3,530 (11.0%) | 2.76 |
| Total Families | 32,089 (100.0%) | 3.19 |
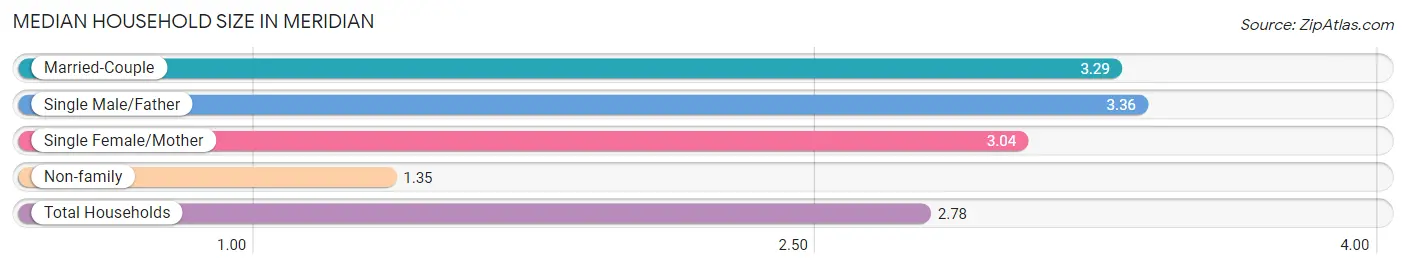
Median Household Size in Meridian
The median household size in Meridian is 2.78 persons per household, with single male/father households (2,100 | 4.9%) accounting for the largest median household size of 3.36 persons per household. non-family households (10,754 | 25.1%) represent the smallest median household size with 1.35 persons per household.
| Household Type | # Households | Household Size |
| Married-Couple | 26,459 (61.8%) | 3.29 |
| Single Male/Father | 2,100 (4.9%) | 3.36 |
| Single Female/Mother | 3,530 (8.2%) | 3.04 |
| Non-family | 10,754 (25.1%) | 1.35 |
| Total Households | 42,843 (100.0%) | 2.78 |
Household Size by Marriage Status in Meridian
Out of a total of 42,843 households in Meridian, 32,089 (74.9%) are family households, while 10,754 (25.1%) are nonfamily households. The most numerous type of family households are 2-person households, comprising 13,641, and the most common type of nonfamily households are 1-person households, comprising 8,048.
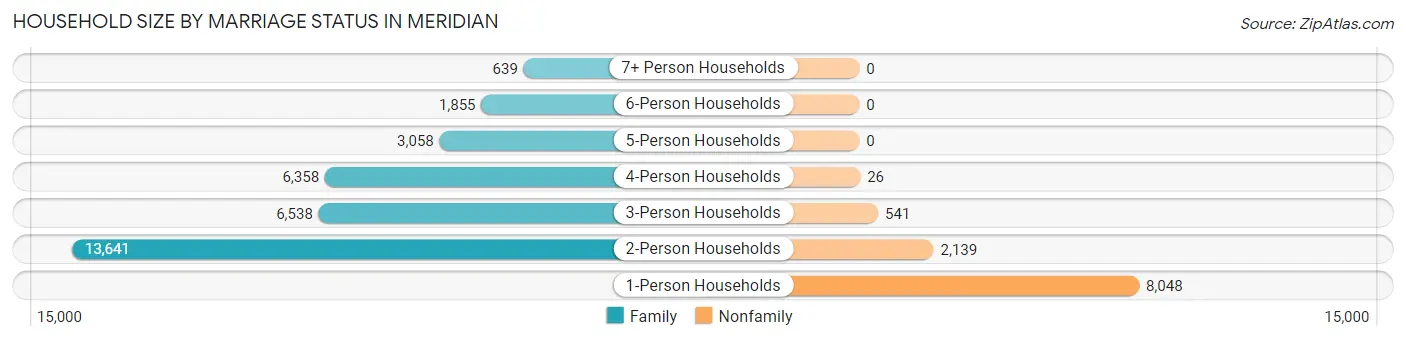
| Household Size | Family Households | Nonfamily Households |
| 1-Person Households | - | 8,048 (18.8%) |
| 2-Person Households | 13,641 (31.8%) | 2,139 (5.0%) |
| 3-Person Households | 6,538 (15.3%) | 541 (1.3%) |
| 4-Person Households | 6,358 (14.8%) | 26 (0.1%) |
| 5-Person Households | 3,058 (7.1%) | 0 (0.0%) |
| 6-Person Households | 1,855 (4.3%) | 0 (0.0%) |
| 7+ Person Households | 639 (1.5%) | 0 (0.0%) |
| Total | 32,089 (74.9%) | 10,754 (25.1%) |
Female Fertility in Meridian
Fertility by Age in Meridian
Average fertility rate in Meridian is 55.0 births per 1,000 women. Women in the age bracket of 20 to 34 years have the highest fertility rate with 95.0 births per 1,000 women. Women in the age bracket of 20 to 34 years acount for 66.2% of all women with births.
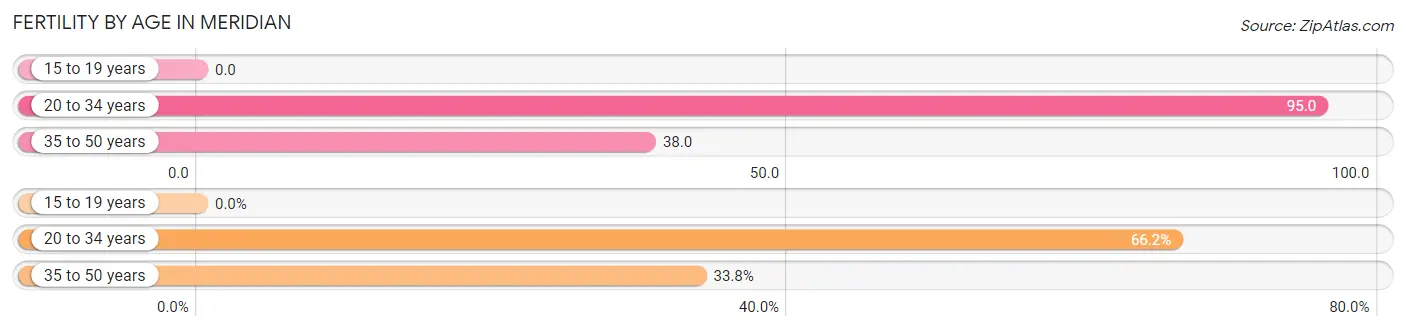
| Age Bracket | Women with Births | Births / 1,000 Women |
| 15 to 19 years | 0 (0.0%) | 0.0 |
| 20 to 34 years | 1,060 (66.2%) | 95.0 |
| 35 to 50 years | 542 (33.8%) | 38.0 |
| Total | 1,602 (100.0%) | 55.0 |
Fertility by Age by Marriage Status in Meridian
90.1% of women with births (1,602) in Meridian are married. The highest percentage of unmarried women with births falls into 20 to 34 years age bracket with 14.9% of them unmarried at the time of birth, while the lowest percentage of unmarried women with births belong to 35 to 50 years age bracket with 0.0% of them unmarried.
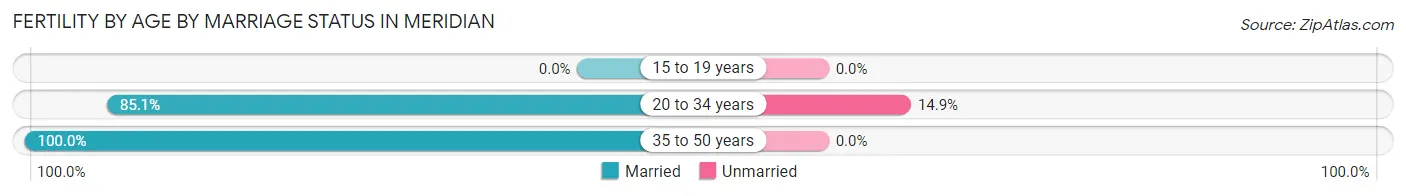
| Age Bracket | Married | Unmarried |
| 15 to 19 years | 0 (0.0%) | 0 (0.0%) |
| 20 to 34 years | 902 (85.1%) | 158 (14.9%) |
| 35 to 50 years | 542 (100.0%) | 0 (0.0%) |
| Total | 1,443 (90.1%) | 159 (9.9%) |
Fertility by Education in Meridian
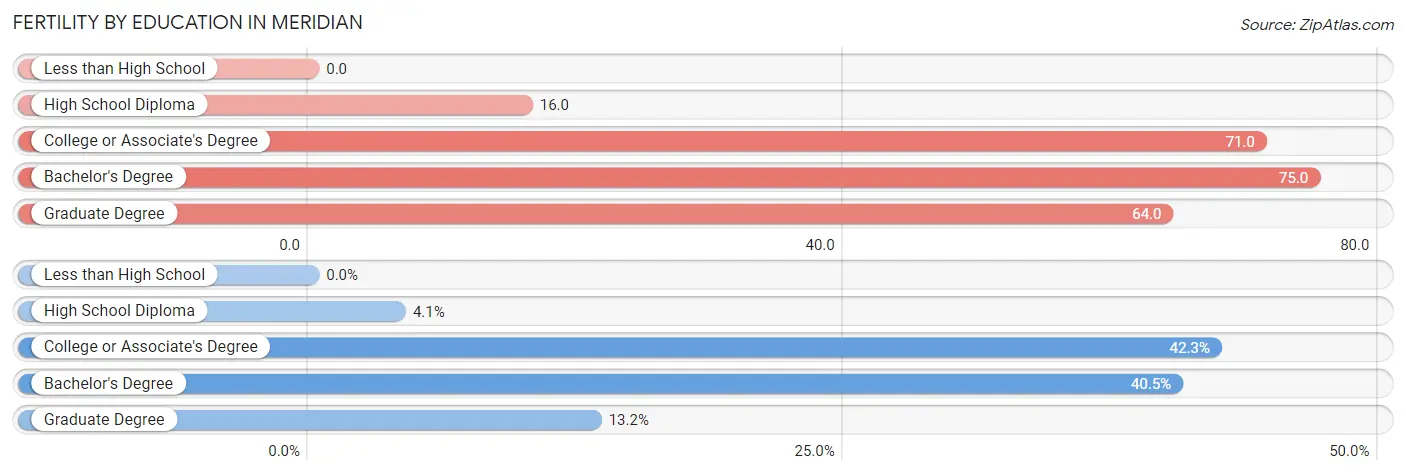
| Educational Attainment | Women with Births | Births / 1,000 Women |
| Less than High School | 0 (0.0%) | 0.0 |
| High School Diploma | 65 (4.1%) | 16.0 |
| College or Associate's Degree | 677 (42.3%) | 71.0 |
| Bachelor's Degree | 648 (40.5%) | 75.0 |
| Graduate Degree | 212 (13.2%) | 64.0 |
| Total | 1,602 (100.0%) | 55.0 |
Fertility by Education by Marriage Status in Meridian
9.9% of women with births in Meridian are unmarried. Women with the educational attainment of bachelor's degree are most likely to be married with 100.0% of them married at childbirth, while women with the educational attainment of high school diploma are least likely to be married with 20.0% of them unmarried at childbirth.
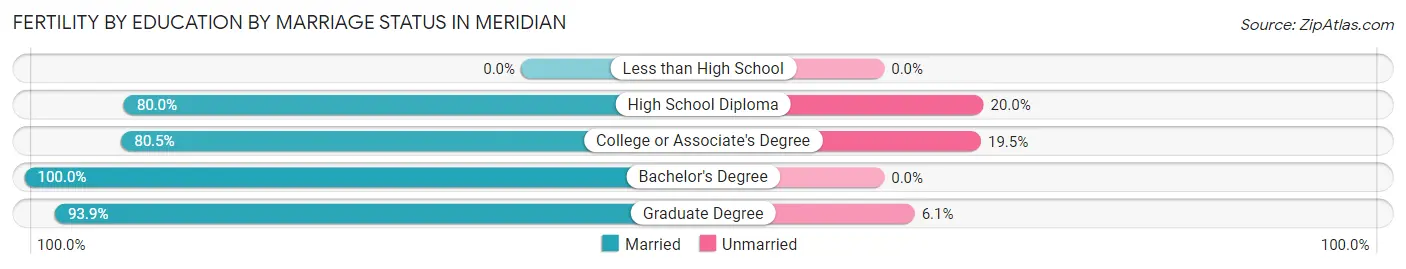
| Educational Attainment | Married | Unmarried |
| Less than High School | 0 (0.0%) | 0 (0.0%) |
| High School Diploma | 52 (80.0%) | 13 (20.0%) |
| College or Associate's Degree | 545 (80.5%) | 132 (19.5%) |
| Bachelor's Degree | 648 (100.0%) | 0 (0.0%) |
| Graduate Degree | 199 (93.9%) | 13 (6.1%) |
| Total | 1,443 (90.1%) | 159 (9.9%) |
Employment Characteristics in Meridian
Employment by Class of Employer in Meridian
Among the 61,287 employed individuals in Meridian, private company employees (41,086 | 67.0%), not-for-profit organizations (5,024 | 8.2%), and self-employed (not incorporated) (4,215 | 6.9%) make up the most common classes of employment.
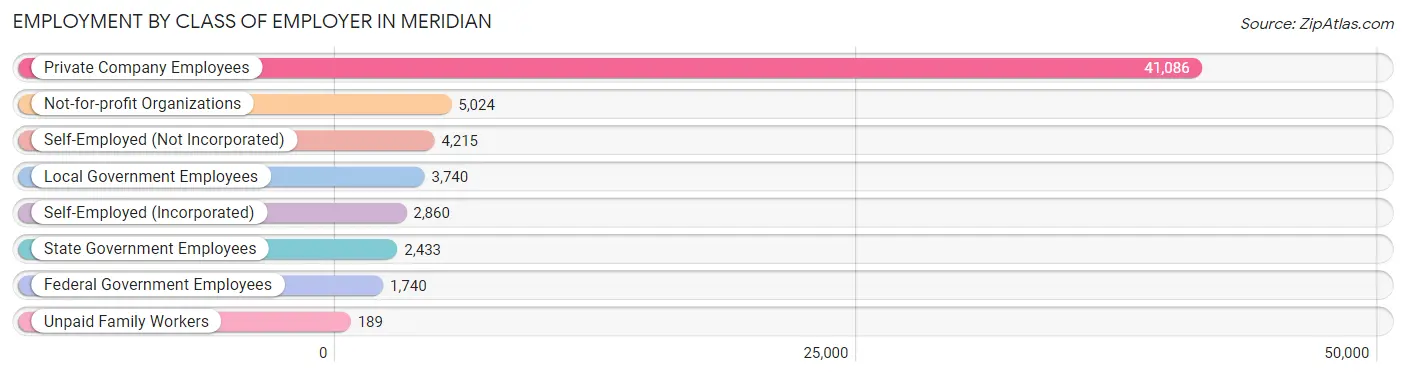
| Employer Class | # Employees | % Employees |
| Private Company Employees | 41,086 | 67.0% |
| Self-Employed (Incorporated) | 2,860 | 4.7% |
| Self-Employed (Not Incorporated) | 4,215 | 6.9% |
| Not-for-profit Organizations | 5,024 | 8.2% |
| Local Government Employees | 3,740 | 6.1% |
| State Government Employees | 2,433 | 4.0% |
| Federal Government Employees | 1,740 | 2.8% |
| Unpaid Family Workers | 189 | 0.3% |
| Total | 61,287 | 100.0% |
Employment Status by Age in Meridian
According to the labor force statistics for Meridian, out of the total population over 16 years of age (90,646), 70.4% or 63,815 individuals are in the labor force, with 2.7% or 1,723 of them unemployed. The age group with the highest labor force participation rate is 45 to 54 years, with 89.6% or 14,629 individuals in the labor force. Within the labor force, the 16 to 19 years age range has the highest percentage of unemployed individuals, with 8.4% or 210 of them being unemployed.
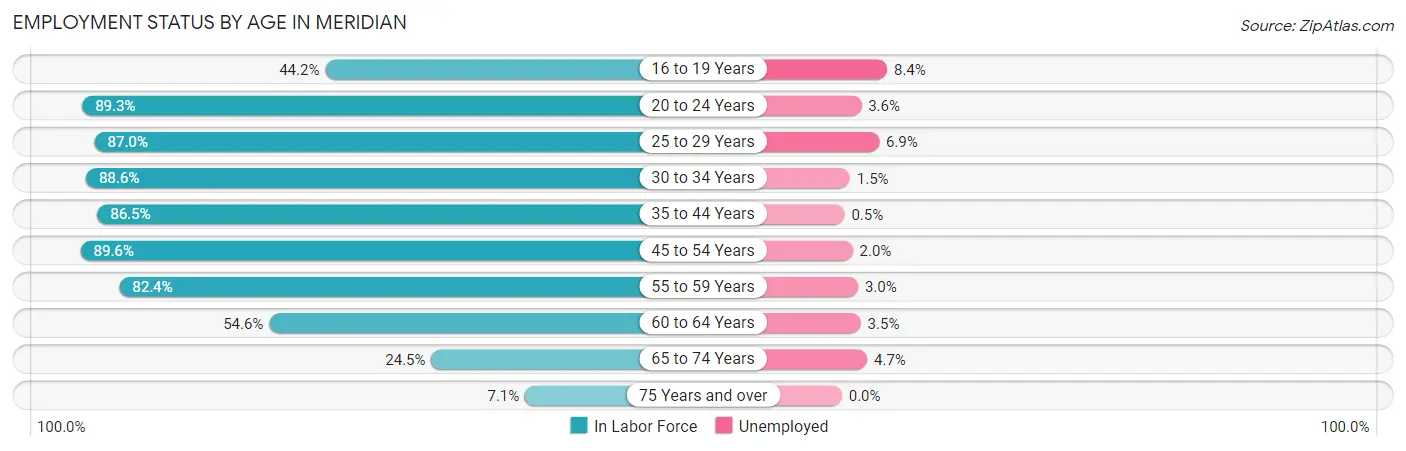
| Age Bracket | In Labor Force | Unemployed |
| 16 to 19 Years | 2,501 (44.2%) | 210 (8.4%) |
| 20 to 24 Years | 6,257 (89.3%) | 225 (3.6%) |
| 25 to 29 Years | 6,362 (87.0%) | 439 (6.9%) |
| 30 to 34 Years | 6,515 (88.6%) | 98 (1.5%) |
| 35 to 44 Years | 16,099 (86.5%) | 80 (0.5%) |
| 45 to 54 Years | 14,629 (89.6%) | 293 (2.0%) |
| 55 to 59 Years | 5,670 (82.4%) | 170 (3.0%) |
| 60 to 64 Years | 2,984 (54.6%) | 104 (3.5%) |
| 65 to 74 Years | 2,380 (24.5%) | 112 (4.7%) |
| 75 Years and over | 448 (7.1%) | 0 (0.0%) |
| Total | 63,815 (70.4%) | 1,723 (2.7%) |
Employment Status by Educational Attainment in Meridian
According to labor force statistics for Meridian, 84.4% of individuals (52,287) out of the total population between 25 and 64 years of age (61,951) are in the labor force, with 2.3% or 1,203 of them being unemployed. The group with the highest labor force participation rate are those with the educational attainment of bachelor's degree or higher, with 88.9% or 25,425 individuals in the labor force. Within the labor force, individuals with less than high school education have the highest percentage of unemployment, with 4.1% or 68 of them being unemployed.
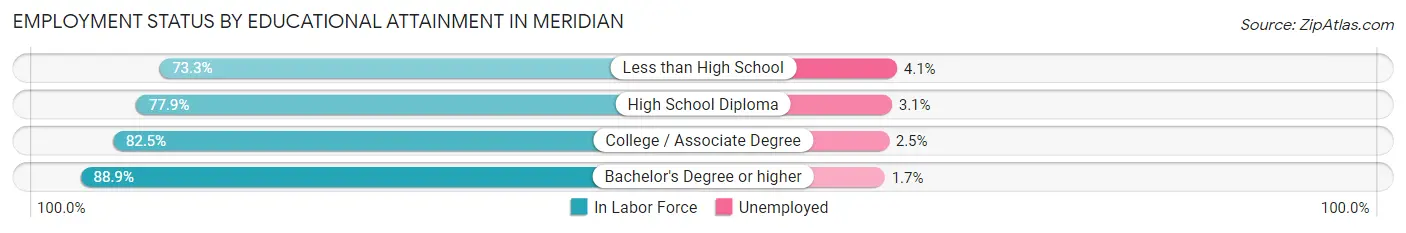
| Educational Attainment | In Labor Force | Unemployed |
| Less than High School | 1,664 (73.3%) | 93 (4.1%) |
| High School Diploma | 7,950 (77.9%) | 316 (3.1%) |
| College / Associate Degree | 17,222 (82.5%) | 522 (2.5%) |
| Bachelor's Degree or higher | 25,425 (88.9%) | 486 (1.7%) |
| Total | 52,287 (84.4%) | 1,425 (2.3%) |
Employment Occupations by Sex in Meridian
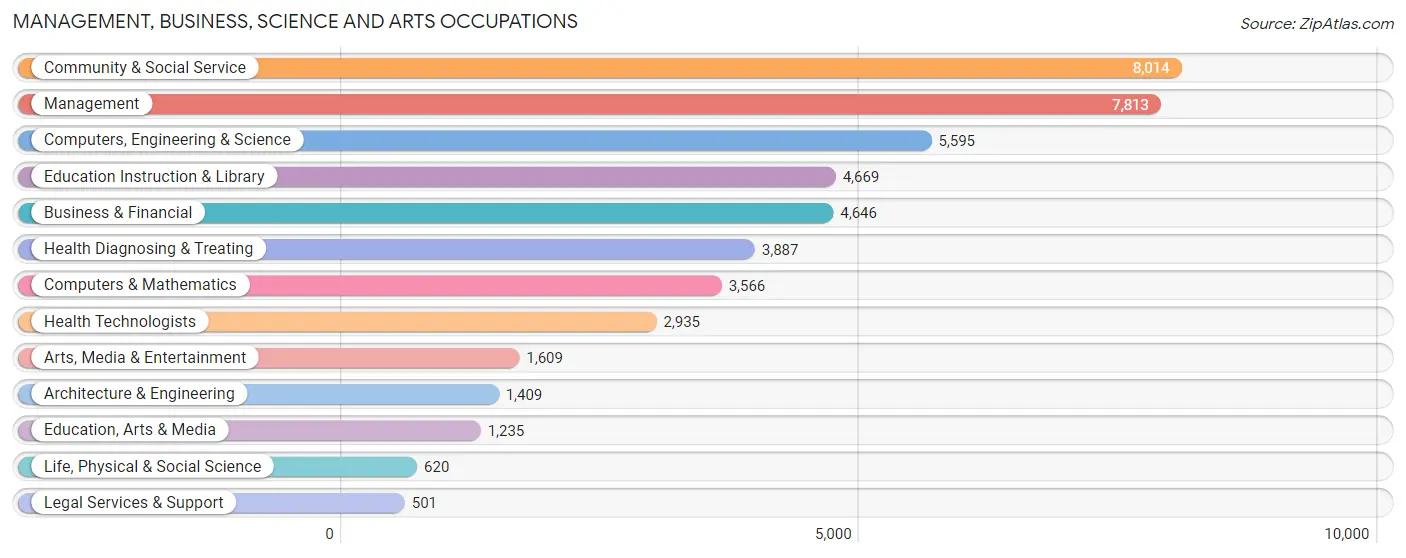
Management, Business, Science and Arts Occupations
The most common Management, Business, Science and Arts occupations in Meridian are Community & Social Service (8,014 | 13.0%), Management (7,813 | 12.6%), Computers, Engineering & Science (5,595 | 9.0%), Education Instruction & Library (4,669 | 7.5%), and Business & Financial (4,646 | 7.5%).
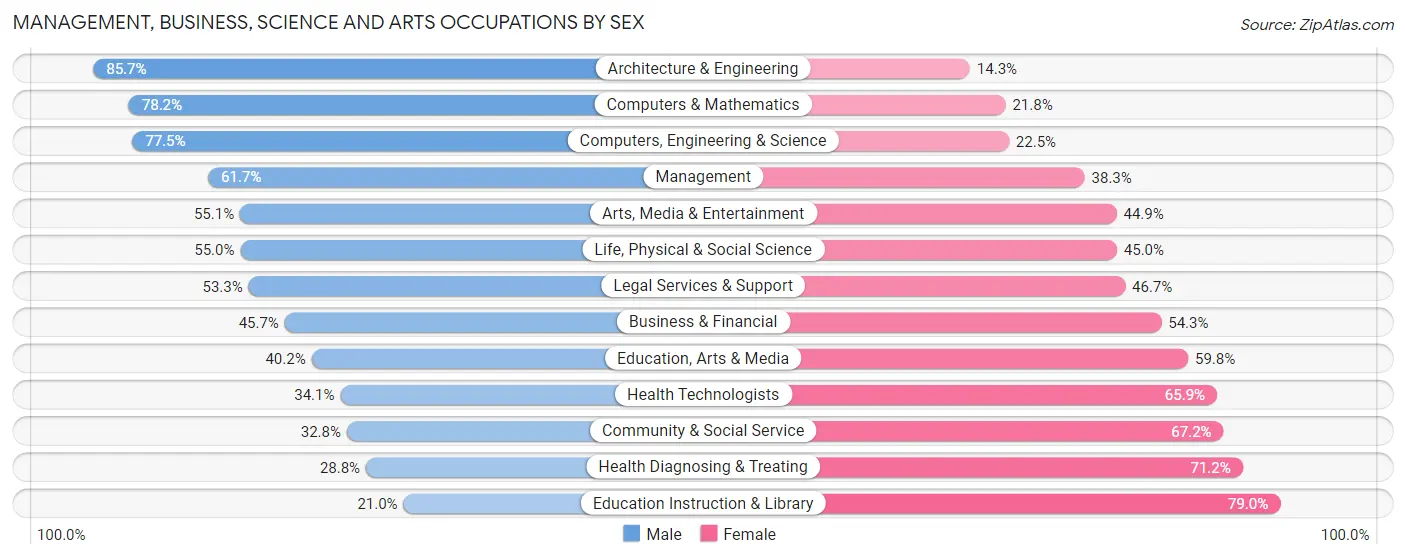
Management, Business, Science and Arts Occupations by Sex
Within the Management, Business, Science and Arts occupations in Meridian, the most male-oriented occupations are Architecture & Engineering (85.7%), Computers & Mathematics (78.2%), and Computers, Engineering & Science (77.5%), while the most female-oriented occupations are Education Instruction & Library (79.0%), Health Diagnosing & Treating (71.2%), and Community & Social Service (67.2%).
| Occupation | Male | Female |
| Management | 4,823 (61.7%) | 2,990 (38.3%) |
| Business & Financial | 2,125 (45.7%) | 2,521 (54.3%) |
| Computers, Engineering & Science | 4,338 (77.5%) | 1,257 (22.5%) |
| Computers & Mathematics | 2,790 (78.2%) | 776 (21.8%) |
| Architecture & Engineering | 1,207 (85.7%) | 202 (14.3%) |
| Life, Physical & Social Science | 341 (55.0%) | 279 (45.0%) |
| Community & Social Service | 2,628 (32.8%) | 5,386 (67.2%) |
| Education, Arts & Media | 496 (40.2%) | 739 (59.8%) |
| Legal Services & Support | 267 (53.3%) | 234 (46.7%) |
| Education Instruction & Library | 979 (21.0%) | 3,690 (79.0%) |
| Arts, Media & Entertainment | 886 (55.1%) | 723 (44.9%) |
| Health Diagnosing & Treating | 1,119 (28.8%) | 2,768 (71.2%) |
| Health Technologists | 1,002 (34.1%) | 1,933 (65.9%) |
| Total (Category) | 15,033 (50.2%) | 14,922 (49.8%) |
| Total (Overall) | 32,946 (53.3%) | 28,875 (46.7%) |
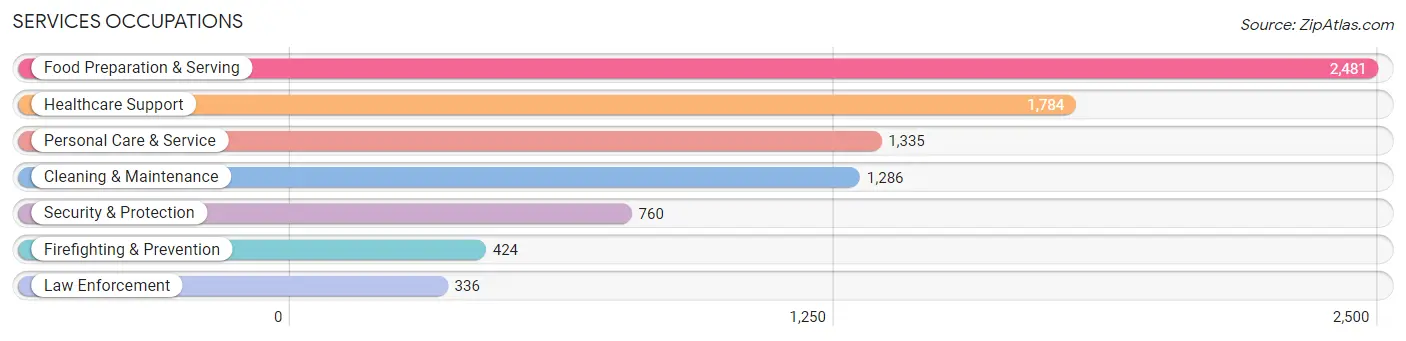
Services Occupations
The most common Services occupations in Meridian are Food Preparation & Serving (2,481 | 4.0%), Healthcare Support (1,784 | 2.9%), Personal Care & Service (1,335 | 2.2%), Cleaning & Maintenance (1,286 | 2.1%), and Security & Protection (760 | 1.2%).
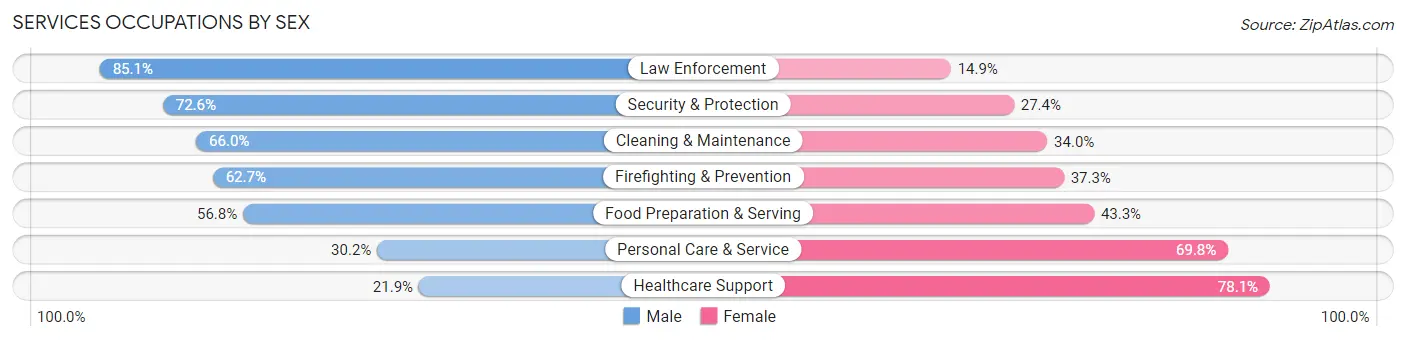
Services Occupations by Sex
Within the Services occupations in Meridian, the most male-oriented occupations are Law Enforcement (85.1%), Security & Protection (72.6%), and Cleaning & Maintenance (66.0%), while the most female-oriented occupations are Healthcare Support (78.1%), Personal Care & Service (69.8%), and Food Preparation & Serving (43.2%).
| Occupation | Male | Female |
| Healthcare Support | 391 (21.9%) | 1,393 (78.1%) |
| Security & Protection | 552 (72.6%) | 208 (27.4%) |
| Firefighting & Prevention | 266 (62.7%) | 158 (37.3%) |
| Law Enforcement | 286 (85.1%) | 50 (14.9%) |
| Food Preparation & Serving | 1,408 (56.8%) | 1,073 (43.2%) |
| Cleaning & Maintenance | 849 (66.0%) | 437 (34.0%) |
| Personal Care & Service | 403 (30.2%) | 932 (69.8%) |
| Total (Category) | 3,603 (47.1%) | 4,043 (52.9%) |
| Total (Overall) | 32,946 (53.3%) | 28,875 (46.7%) |
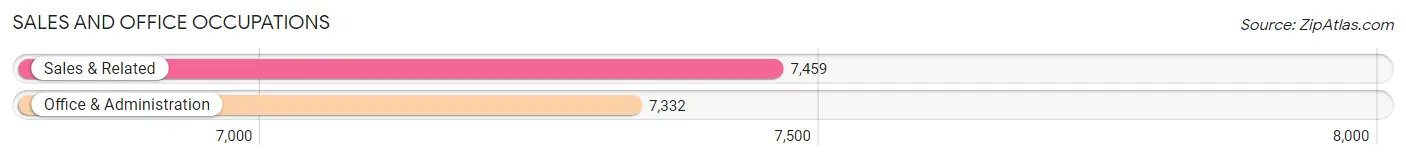
Sales and Office Occupations
The most common Sales and Office occupations in Meridian are Sales & Related (7,459 | 12.1%), and Office & Administration (7,332 | 11.9%).
Sales and Office Occupations by Sex
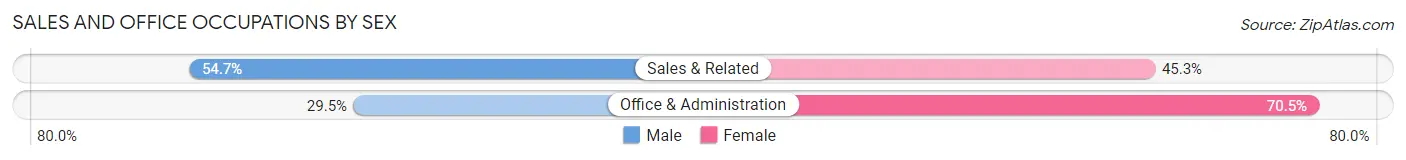
| Occupation | Male | Female |
| Sales & Related | 4,081 (54.7%) | 3,378 (45.3%) |
| Office & Administration | 2,162 (29.5%) | 5,170 (70.5%) |
| Total (Category) | 6,243 (42.2%) | 8,548 (57.8%) |
| Total (Overall) | 32,946 (53.3%) | 28,875 (46.7%) |
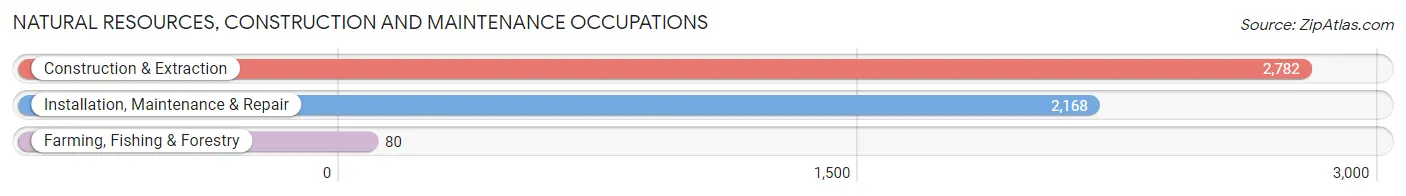
Natural Resources, Construction and Maintenance Occupations
The most common Natural Resources, Construction and Maintenance occupations in Meridian are Construction & Extraction (2,782 | 4.5%), Installation, Maintenance & Repair (2,168 | 3.5%), and Farming, Fishing & Forestry (80 | 0.1%).
Natural Resources, Construction and Maintenance Occupations by Sex
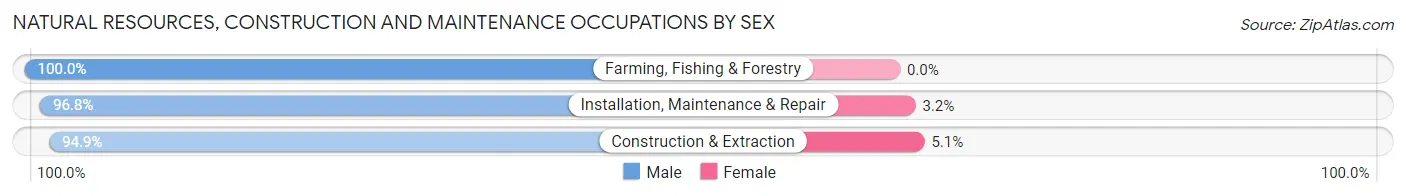
| Occupation | Male | Female |
| Farming, Fishing & Forestry | 80 (100.0%) | 0 (0.0%) |
| Construction & Extraction | 2,640 (94.9%) | 142 (5.1%) |
| Installation, Maintenance & Repair | 2,098 (96.8%) | 70 (3.2%) |
| Total (Category) | 4,818 (95.8%) | 212 (4.2%) |
| Total (Overall) | 32,946 (53.3%) | 28,875 (46.7%) |
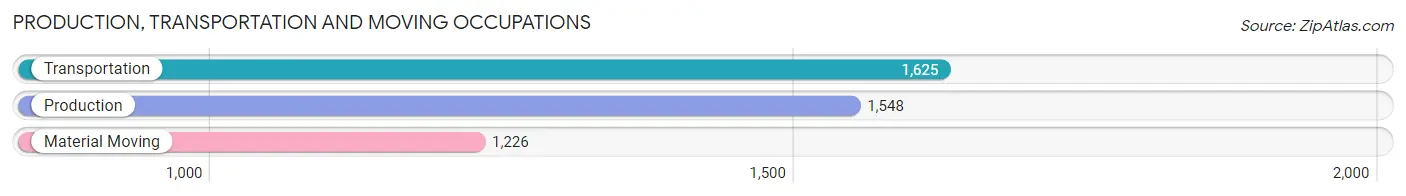
Production, Transportation and Moving Occupations
The most common Production, Transportation and Moving occupations in Meridian are Transportation (1,625 | 2.6%), Production (1,548 | 2.5%), and Material Moving (1,226 | 2.0%).
Production, Transportation and Moving Occupations by Sex
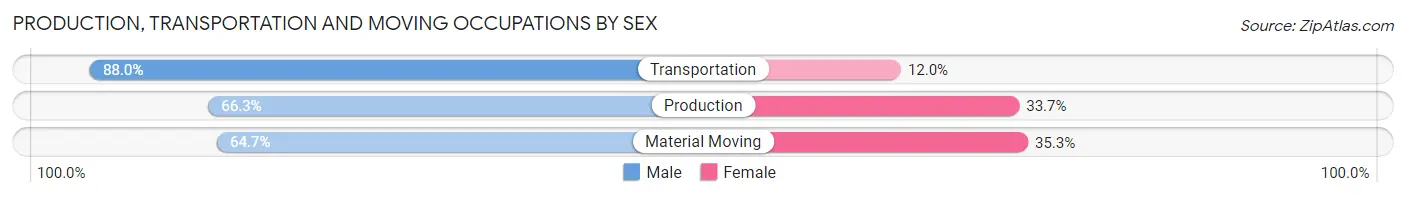
| Occupation | Male | Female |
| Production | 1,026 (66.3%) | 522 (33.7%) |
| Transportation | 1,430 (88.0%) | 195 (12.0%) |
| Material Moving | 793 (64.7%) | 433 (35.3%) |
| Total (Category) | 3,249 (73.9%) | 1,150 (26.1%) |
| Total (Overall) | 32,946 (53.3%) | 28,875 (46.7%) |
Employment Industries by Sex in Meridian
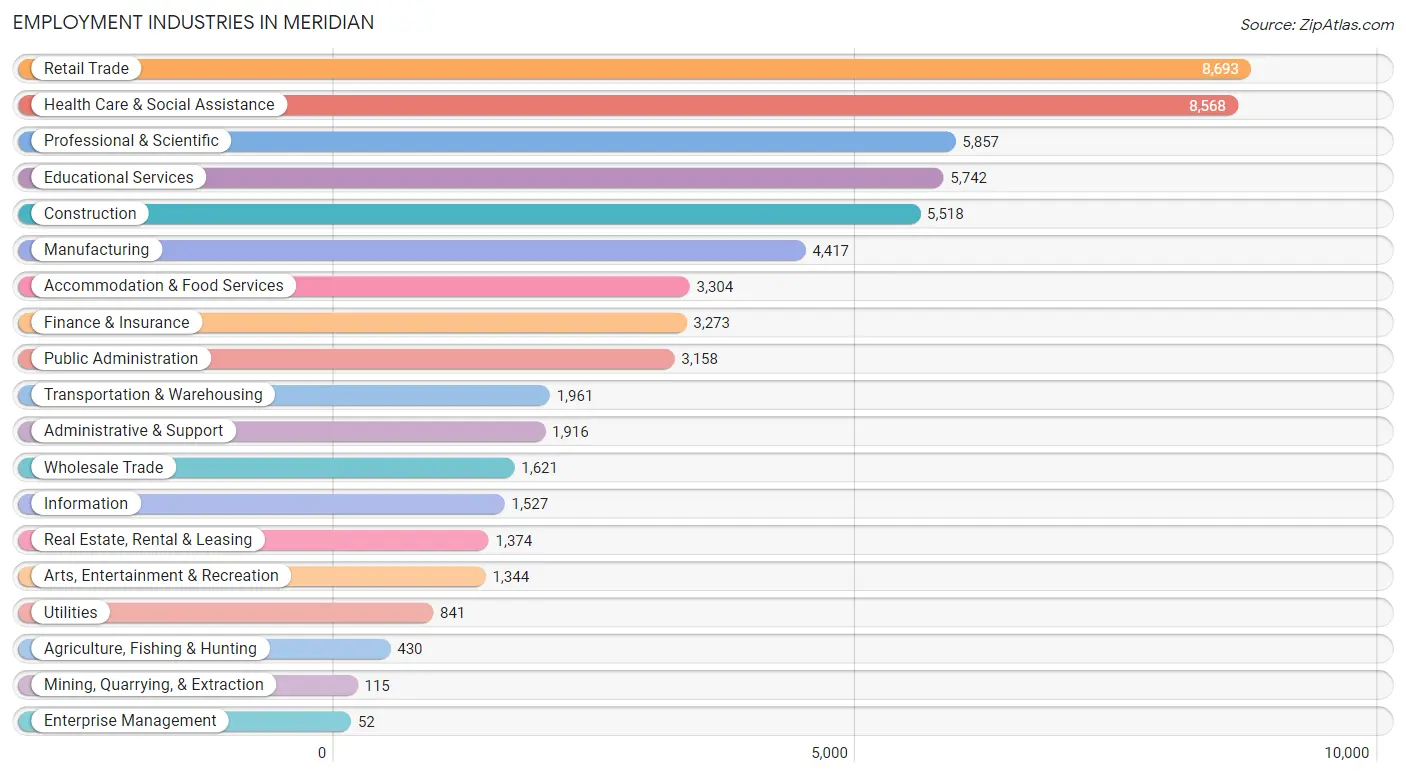
Employment Industries in Meridian
The major employment industries in Meridian include Retail Trade (8,693 | 14.1%), Health Care & Social Assistance (8,568 | 13.9%), Professional & Scientific (5,857 | 9.5%), Educational Services (5,742 | 9.3%), and Construction (5,518 | 8.9%).
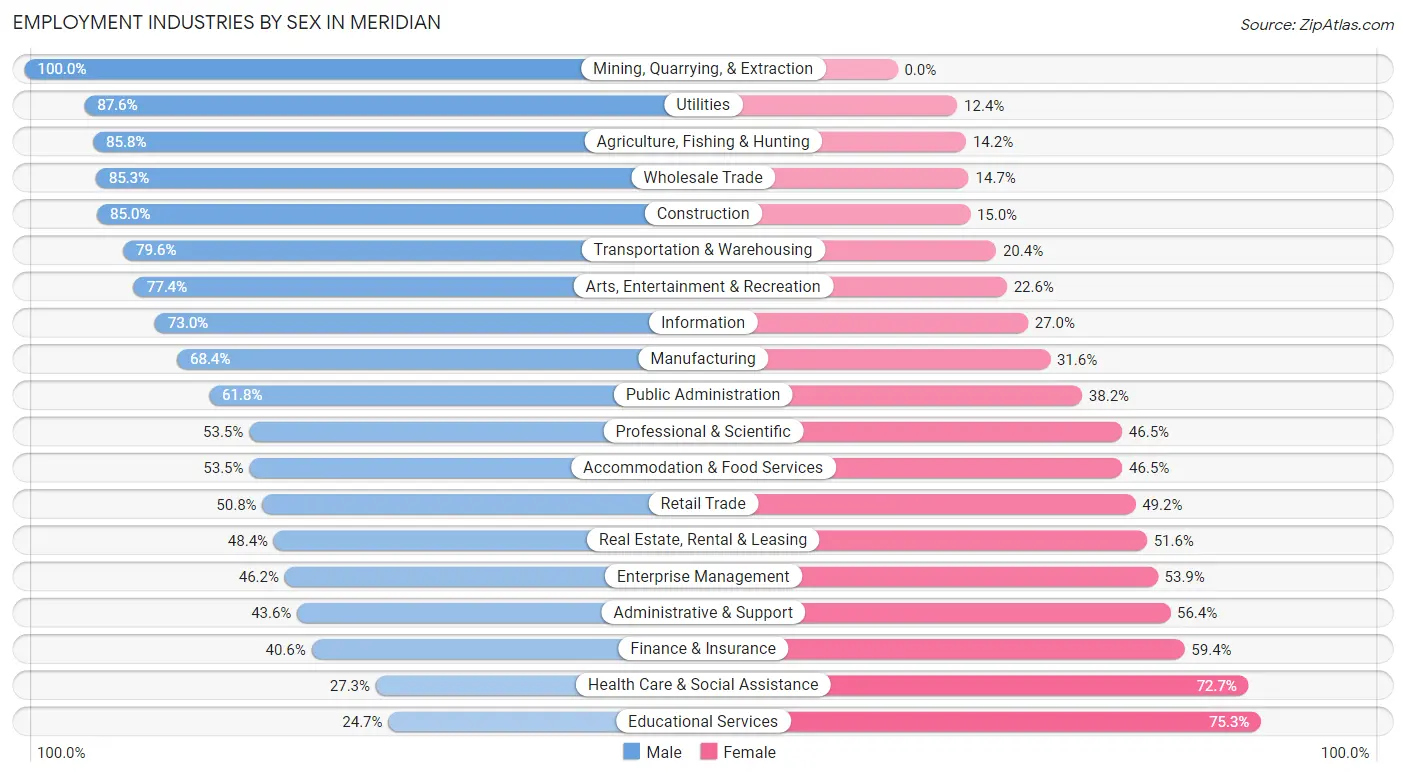
Employment Industries by Sex in Meridian
The Meridian industries that see more men than women are Mining, Quarrying, & Extraction (100.0%), Utilities (87.6%), and Agriculture, Fishing & Hunting (85.8%), whereas the industries that tend to have a higher number of women are Educational Services (75.3%), Health Care & Social Assistance (72.7%), and Finance & Insurance (59.4%).
| Industry | Male | Female |
| Agriculture, Fishing & Hunting | 369 (85.8%) | 61 (14.2%) |
| Mining, Quarrying, & Extraction | 115 (100.0%) | 0 (0.0%) |
| Construction | 4,690 (85.0%) | 828 (15.0%) |
| Manufacturing | 3,022 (68.4%) | 1,395 (31.6%) |
| Wholesale Trade | 1,382 (85.3%) | 239 (14.7%) |
| Retail Trade | 4,414 (50.8%) | 4,279 (49.2%) |
| Transportation & Warehousing | 1,561 (79.6%) | 400 (20.4%) |
| Utilities | 737 (87.6%) | 104 (12.4%) |
| Information | 1,115 (73.0%) | 412 (27.0%) |
| Finance & Insurance | 1,329 (40.6%) | 1,944 (59.4%) |
| Real Estate, Rental & Leasing | 665 (48.4%) | 709 (51.6%) |
| Professional & Scientific | 3,135 (53.5%) | 2,722 (46.5%) |
| Enterprise Management | 24 (46.2%) | 28 (53.8%) |
| Administrative & Support | 835 (43.6%) | 1,081 (56.4%) |
| Educational Services | 1,419 (24.7%) | 4,323 (75.3%) |
| Health Care & Social Assistance | 2,339 (27.3%) | 6,229 (72.7%) |
| Arts, Entertainment & Recreation | 1,040 (77.4%) | 304 (22.6%) |
| Accommodation & Food Services | 1,767 (53.5%) | 1,537 (46.5%) |
| Public Administration | 1,952 (61.8%) | 1,206 (38.2%) |
| Total | 32,946 (53.3%) | 28,875 (46.7%) |
Education in Meridian
School Enrollment in Meridian
The most common levels of schooling among the 33,538 students in Meridian are middle school (8,949 | 26.7%), elementary school (7,471 | 22.3%), and high school (7,343 | 21.9%).
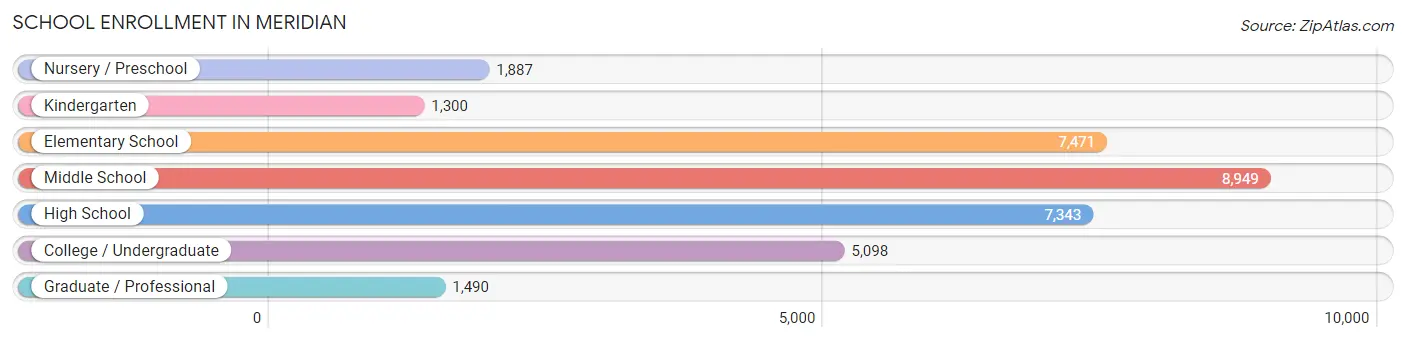
| School Level | # Students | % Students |
| Nursery / Preschool | 1,887 | 5.6% |
| Kindergarten | 1,300 | 3.9% |
| Elementary School | 7,471 | 22.3% |
| Middle School | 8,949 | 26.7% |
| High School | 7,343 | 21.9% |
| College / Undergraduate | 5,098 | 15.2% |
| Graduate / Professional | 1,490 | 4.4% |
| Total | 33,538 | 100.0% |
School Enrollment by Age by Funding Source in Meridian
Out of a total of 33,538 students who are enrolled in schools in Meridian, 5,701 (17.0%) attend a private institution, while the remaining 27,837 (83.0%) are enrolled in public schools. The age group of 3 to 4 year olds has the highest likelihood of being enrolled in private schools, with 933 (64.8% in the age bracket) enrolled. Conversely, the age group of 15 to 17 year olds has the lowest likelihood of being enrolled in a private school, with 4,938 (91.1% in the age bracket) attending a public institution.
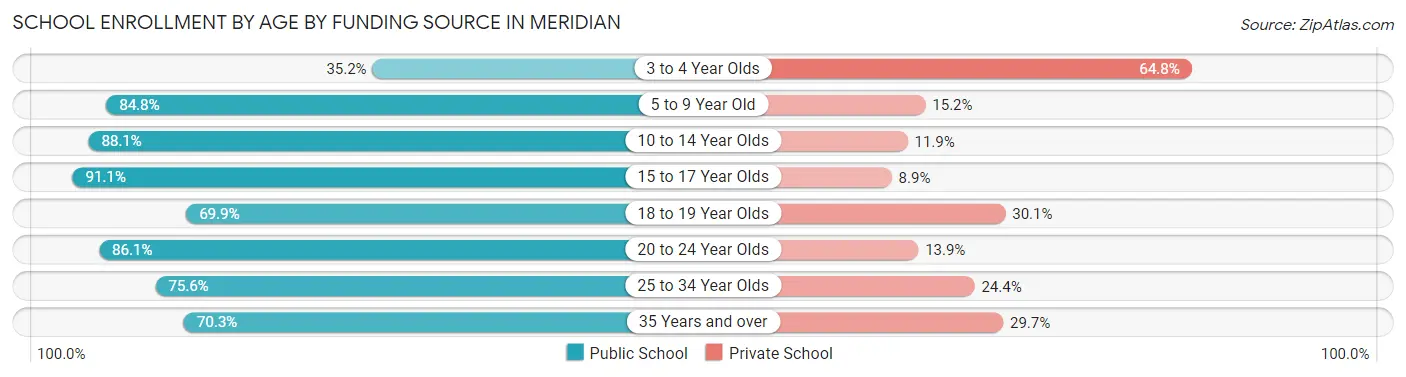
| Age Bracket | Public School | Private School |
| 3 to 4 Year Olds | 507 (35.2%) | 933 (64.8%) |
| 5 to 9 Year Old | 6,826 (84.8%) | 1,225 (15.2%) |
| 10 to 14 Year Olds | 9,931 (88.1%) | 1,342 (11.9%) |
| 15 to 17 Year Olds | 4,938 (91.1%) | 485 (8.9%) |
| 18 to 19 Year Olds | 1,061 (69.9%) | 457 (30.1%) |
| 20 to 24 Year Olds | 2,035 (86.1%) | 328 (13.9%) |
| 25 to 34 Year Olds | 1,266 (75.6%) | 408 (24.4%) |
| 35 Years and over | 1,263 (70.3%) | 533 (29.7%) |
| Total | 27,837 (83.0%) | 5,701 (17.0%) |
Educational Attainment by Field of Study in Meridian
Business (8,429 | 23.0%), science & technology (4,390 | 12.0%), education (3,782 | 10.3%), engineering (2,351 | 6.4%), and arts & humanities (2,253 | 6.1%) are the most common fields of study among 36,711 individuals in Meridian who have obtained a bachelor's degree or higher.
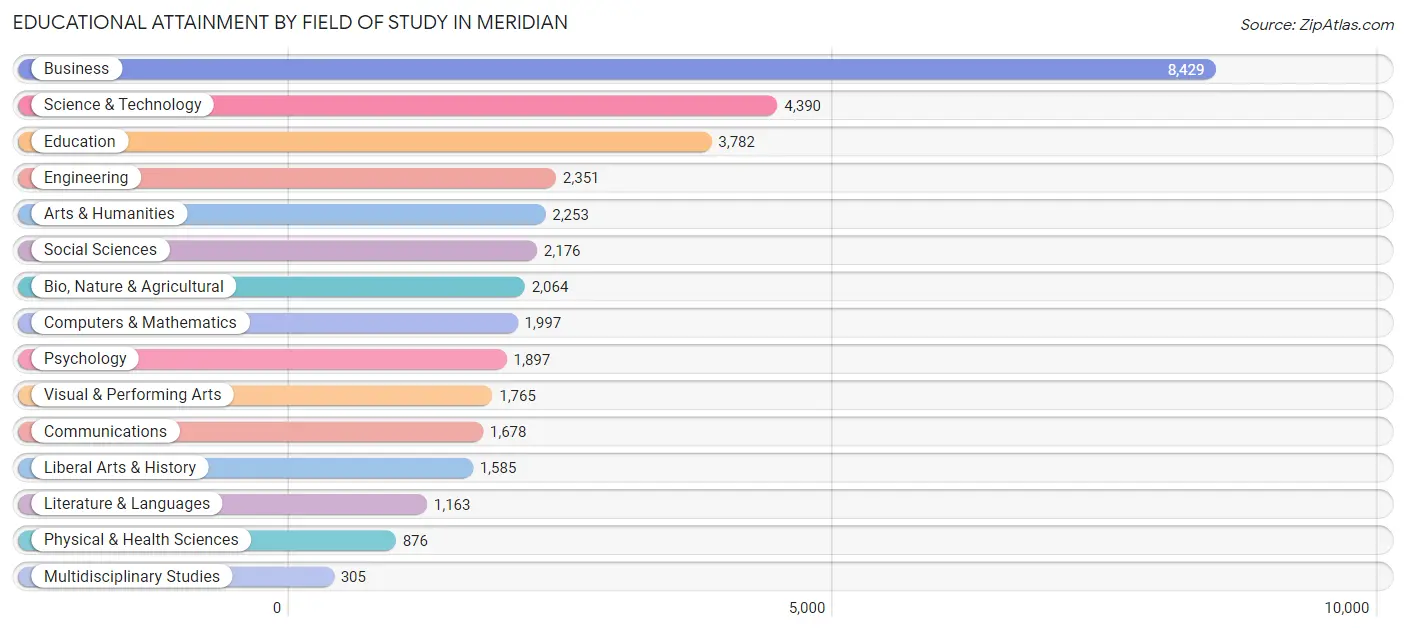
| Field of Study | # Graduates | % Graduates |
| Computers & Mathematics | 1,997 | 5.4% |
| Bio, Nature & Agricultural | 2,064 | 5.6% |
| Physical & Health Sciences | 876 | 2.4% |
| Psychology | 1,897 | 5.2% |
| Social Sciences | 2,176 | 5.9% |
| Engineering | 2,351 | 6.4% |
| Multidisciplinary Studies | 305 | 0.8% |
| Science & Technology | 4,390 | 12.0% |
| Business | 8,429 | 23.0% |
| Education | 3,782 | 10.3% |
| Literature & Languages | 1,163 | 3.2% |
| Liberal Arts & History | 1,585 | 4.3% |
| Visual & Performing Arts | 1,765 | 4.8% |
| Communications | 1,678 | 4.6% |
| Arts & Humanities | 2,253 | 6.1% |
| Total | 36,711 | 100.0% |
Transportation & Commute in Meridian
Vehicle Availability by Sex in Meridian
The most prevalent vehicle ownership categories in Meridian are males with 2 vehicles (15,761, accounting for 48.2%) and females with 2 vehicles (13,800, making up 55.3%).
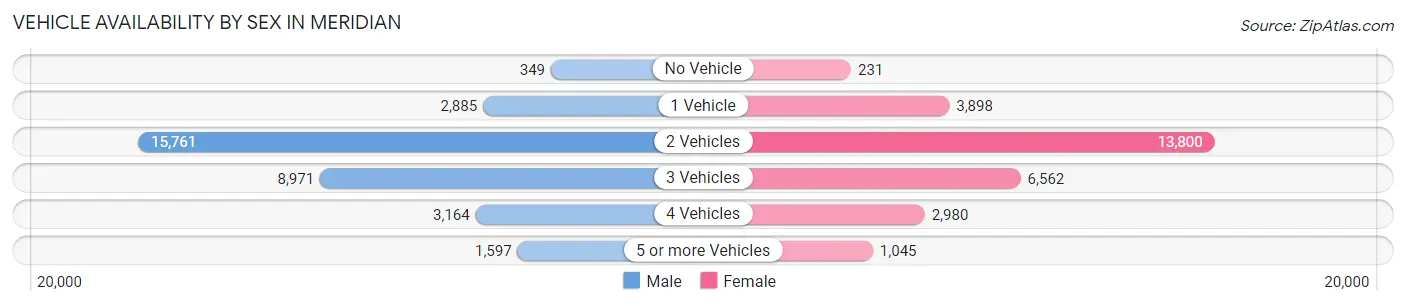
| Vehicles Available | Male | Female |
| No Vehicle | 349 (1.1%) | 231 (0.8%) |
| 1 Vehicle | 2,885 (8.8%) | 3,898 (13.7%) |
| 2 Vehicles | 15,761 (48.2%) | 13,800 (48.4%) |
| 3 Vehicles | 8,971 (27.4%) | 6,562 (23.0%) |
| 4 Vehicles | 3,164 (9.7%) | 2,980 (10.4%) |
| 5 or more Vehicles | 1,597 (4.9%) | 1,045 (3.7%) |
| Total | 32,727 (100.0%) | 28,516 (100.0%) |
Commute Time in Meridian
The most frequently occuring commute durations in Meridian are 20 to 24 minutes (10,723 commuters, 20.5%), 15 to 19 minutes (9,736 commuters, 18.6%), and 30 to 34 minutes (8,153 commuters, 15.6%).
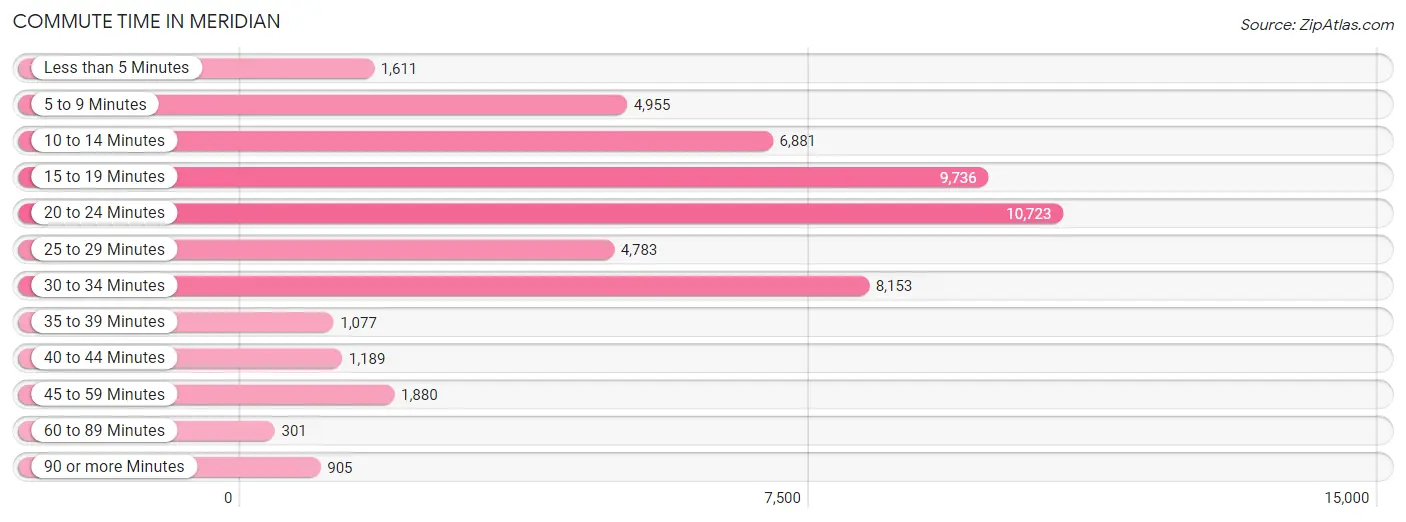
| Commute Time | # Commuters | % Commuters |
| Less than 5 Minutes | 1,611 | 3.1% |
| 5 to 9 Minutes | 4,955 | 9.5% |
| 10 to 14 Minutes | 6,881 | 13.2% |
| 15 to 19 Minutes | 9,736 | 18.6% |
| 20 to 24 Minutes | 10,723 | 20.5% |
| 25 to 29 Minutes | 4,783 | 9.2% |
| 30 to 34 Minutes | 8,153 | 15.6% |
| 35 to 39 Minutes | 1,077 | 2.1% |
| 40 to 44 Minutes | 1,189 | 2.3% |
| 45 to 59 Minutes | 1,880 | 3.6% |
| 60 to 89 Minutes | 301 | 0.6% |
| 90 or more Minutes | 905 | 1.7% |
Commute Time by Sex in Meridian
The most common commute times in Meridian are 20 to 24 minutes (6,411 commuters, 23.1%) for males and 20 to 24 minutes (4,312 commuters, 17.6%) for females.
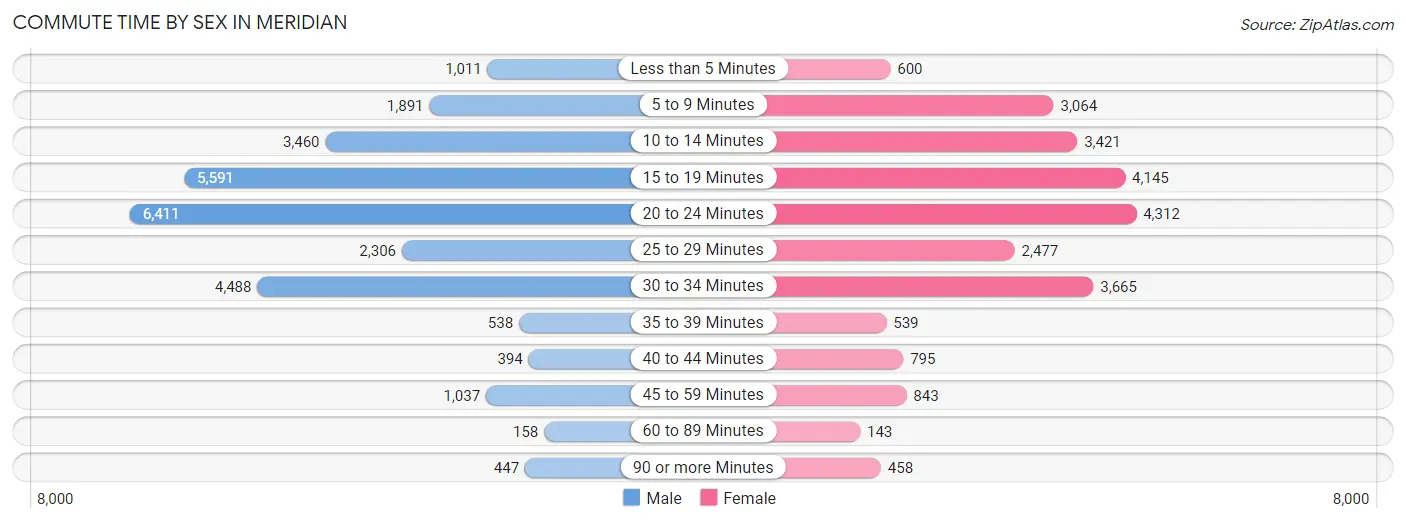
| Commute Time | Male | Female |
| Less than 5 Minutes | 1,011 (3.6%) | 600 (2.5%) |
| 5 to 9 Minutes | 1,891 (6.8%) | 3,064 (12.5%) |
| 10 to 14 Minutes | 3,460 (12.5%) | 3,421 (14.0%) |
| 15 to 19 Minutes | 5,591 (20.2%) | 4,145 (16.9%) |
| 20 to 24 Minutes | 6,411 (23.1%) | 4,312 (17.6%) |
| 25 to 29 Minutes | 2,306 (8.3%) | 2,477 (10.1%) |
| 30 to 34 Minutes | 4,488 (16.2%) | 3,665 (15.0%) |
| 35 to 39 Minutes | 538 (1.9%) | 539 (2.2%) |
| 40 to 44 Minutes | 394 (1.4%) | 795 (3.3%) |
| 45 to 59 Minutes | 1,037 (3.7%) | 843 (3.5%) |
| 60 to 89 Minutes | 158 (0.6%) | 143 (0.6%) |
| 90 or more Minutes | 447 (1.6%) | 458 (1.9%) |
Time of Departure to Work by Sex in Meridian
The most frequent times of departure to work in Meridian are 7:00 AM to 7:29 AM (4,435, 16.0%) for males and 7:00 AM to 7:29 AM (4,814, 19.7%) for females.
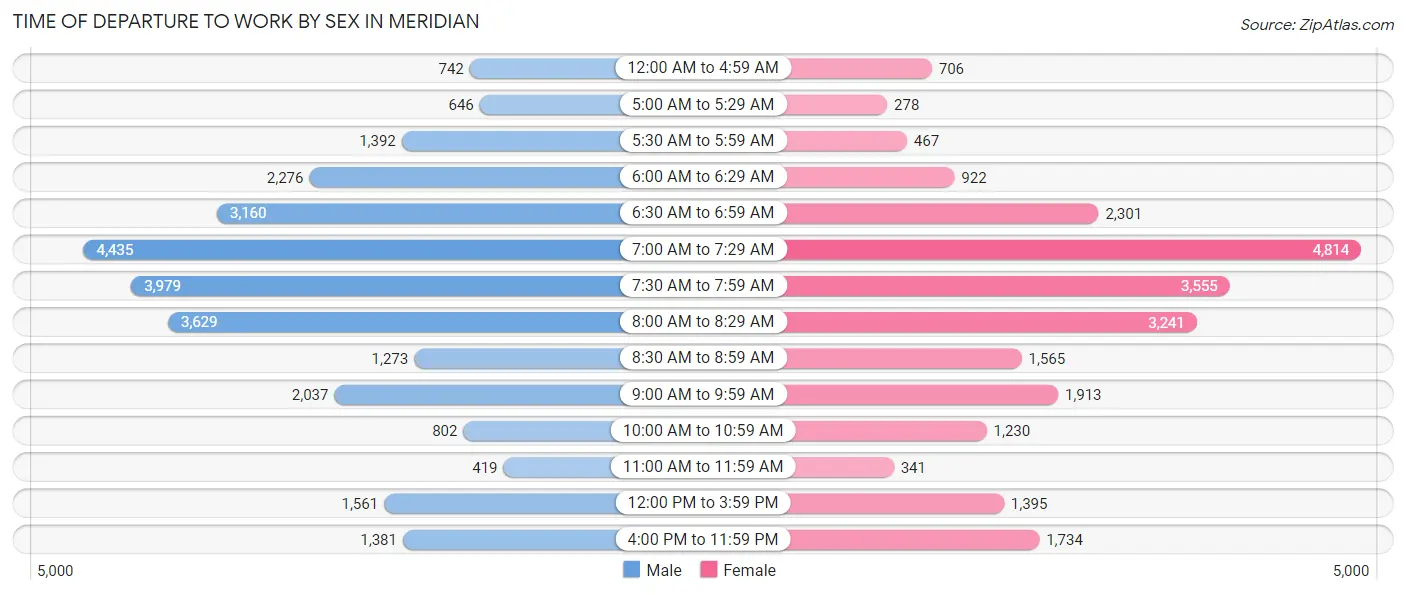
| Time of Departure | Male | Female |
| 12:00 AM to 4:59 AM | 742 (2.7%) | 706 (2.9%) |
| 5:00 AM to 5:29 AM | 646 (2.3%) | 278 (1.1%) |
| 5:30 AM to 5:59 AM | 1,392 (5.0%) | 467 (1.9%) |
| 6:00 AM to 6:29 AM | 2,276 (8.2%) | 922 (3.8%) |
| 6:30 AM to 6:59 AM | 3,160 (11.4%) | 2,301 (9.4%) |
| 7:00 AM to 7:29 AM | 4,435 (16.0%) | 4,814 (19.7%) |
| 7:30 AM to 7:59 AM | 3,979 (14.3%) | 3,555 (14.5%) |
| 8:00 AM to 8:29 AM | 3,629 (13.1%) | 3,241 (13.3%) |
| 8:30 AM to 8:59 AM | 1,273 (4.6%) | 1,565 (6.4%) |
| 9:00 AM to 9:59 AM | 2,037 (7.3%) | 1,913 (7.8%) |
| 10:00 AM to 10:59 AM | 802 (2.9%) | 1,230 (5.0%) |
| 11:00 AM to 11:59 AM | 419 (1.5%) | 341 (1.4%) |
| 12:00 PM to 3:59 PM | 1,561 (5.6%) | 1,395 (5.7%) |
| 4:00 PM to 11:59 PM | 1,381 (5.0%) | 1,734 (7.1%) |
| Total | 27,732 (100.0%) | 24,462 (100.0%) |
Housing Occupancy in Meridian
Occupancy by Ownership in Meridian
Of the total 42,843 dwellings in Meridian, owner-occupied units account for 32,706 (76.3%), while renter-occupied units make up 10,137 (23.7%).
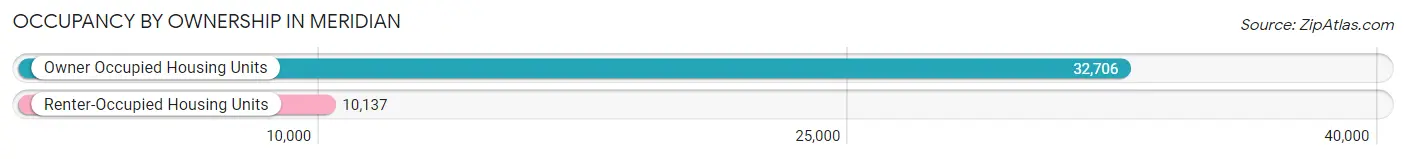
| Occupancy | # Housing Units | % Housing Units |
| Owner Occupied Housing Units | 32,706 | 76.3% |
| Renter-Occupied Housing Units | 10,137 | 23.7% |
| Total Occupied Housing Units | 42,843 | 100.0% |
Occupancy by Household Size in Meridian
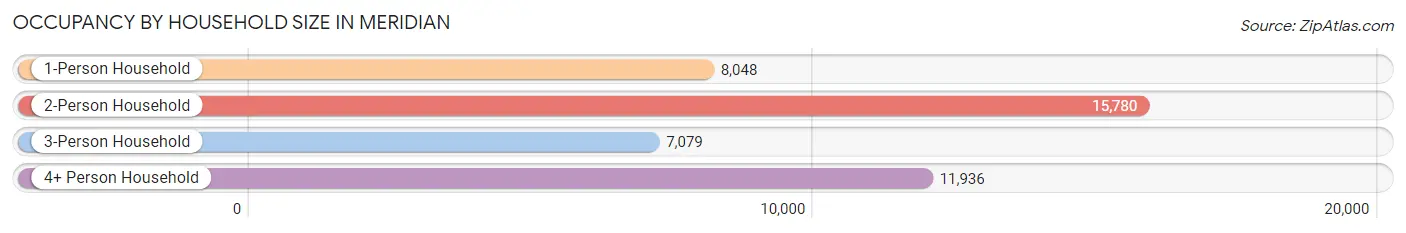
| Household Size | # Housing Units | % Housing Units |
| 1-Person Household | 8,048 | 18.8% |
| 2-Person Household | 15,780 | 36.8% |
| 3-Person Household | 7,079 | 16.5% |
| 4+ Person Household | 11,936 | 27.9% |
| Total Housing Units | 42,843 | 100.0% |
Occupancy by Ownership by Household Size in Meridian
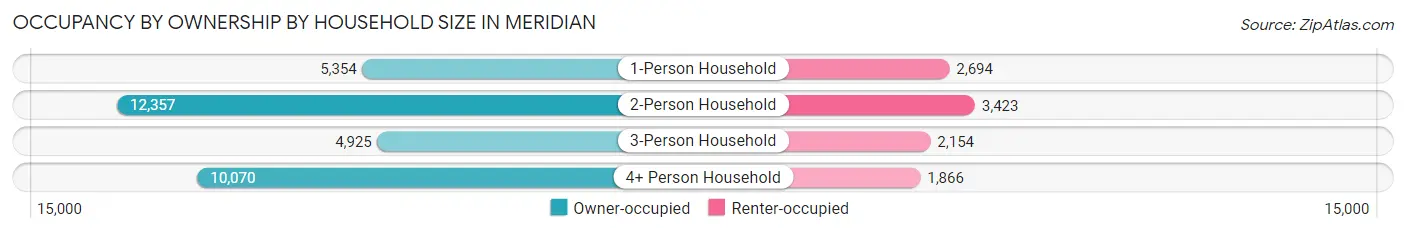
| Household Size | Owner-occupied | Renter-occupied |
| 1-Person Household | 5,354 (66.5%) | 2,694 (33.5%) |
| 2-Person Household | 12,357 (78.3%) | 3,423 (21.7%) |
| 3-Person Household | 4,925 (69.6%) | 2,154 (30.4%) |
| 4+ Person Household | 10,070 (84.4%) | 1,866 (15.6%) |
| Total Housing Units | 32,706 (76.3%) | 10,137 (23.7%) |
Occupancy by Educational Attainment in Meridian
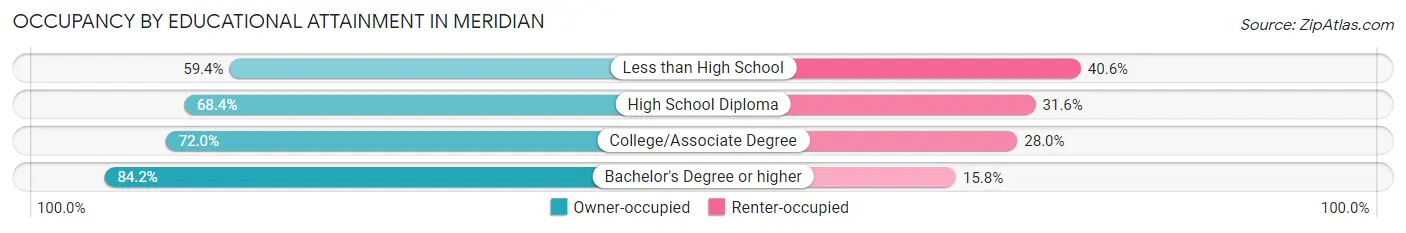
| Household Size | Owner-occupied | Renter-occupied |
| Less than High School | 726 (59.4%) | 496 (40.6%) |
| High School Diploma | 4,513 (68.4%) | 2,086 (31.6%) |
| College/Associate Degree | 11,899 (72.0%) | 4,624 (28.0%) |
| Bachelor's Degree or higher | 15,568 (84.2%) | 2,931 (15.8%) |
Occupancy by Age of Householder in Meridian
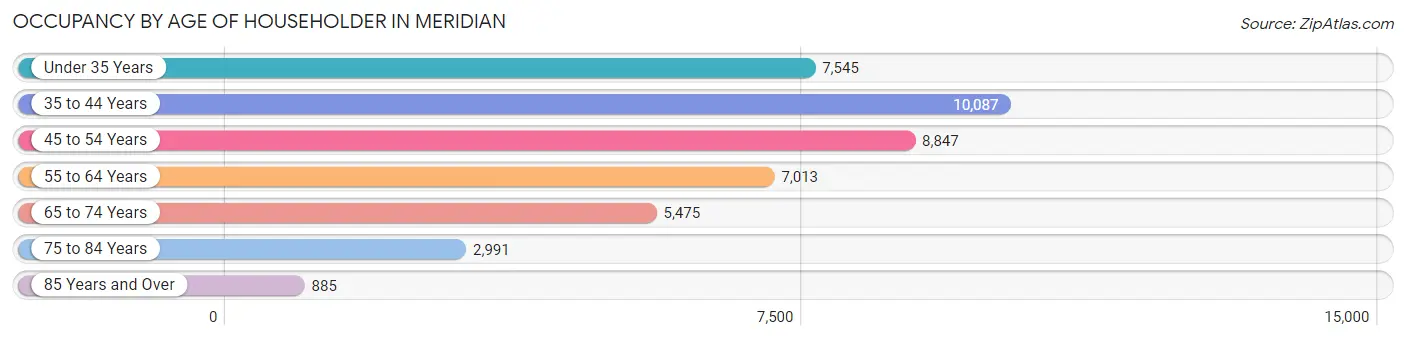
| Age Bracket | # Households | % Households |
| Under 35 Years | 7,545 | 17.6% |
| 35 to 44 Years | 10,087 | 23.5% |
| 45 to 54 Years | 8,847 | 20.6% |
| 55 to 64 Years | 7,013 | 16.4% |
| 65 to 74 Years | 5,475 | 12.8% |
| 75 to 84 Years | 2,991 | 7.0% |
| 85 Years and Over | 885 | 2.1% |
| Total | 42,843 | 100.0% |
Housing Finances in Meridian
Median Income by Occupancy in Meridian
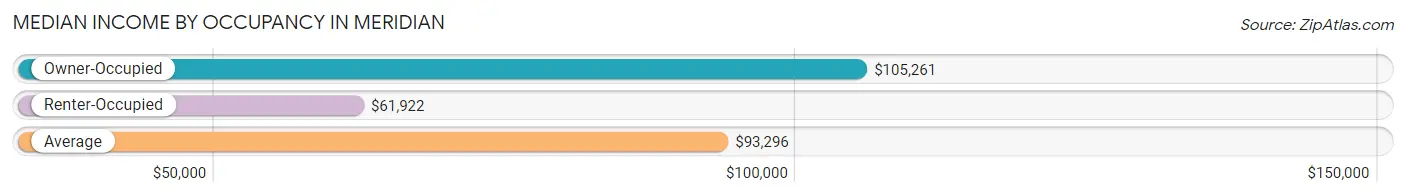
| Occupancy Type | # Households | Median Income |
| Owner-Occupied | 32,706 (76.3%) | $105,261 |
| Renter-Occupied | 10,137 (23.7%) | $61,922 |
| Average | 42,843 (100.0%) | $93,296 |
Occupancy by Householder Income Bracket in Meridian
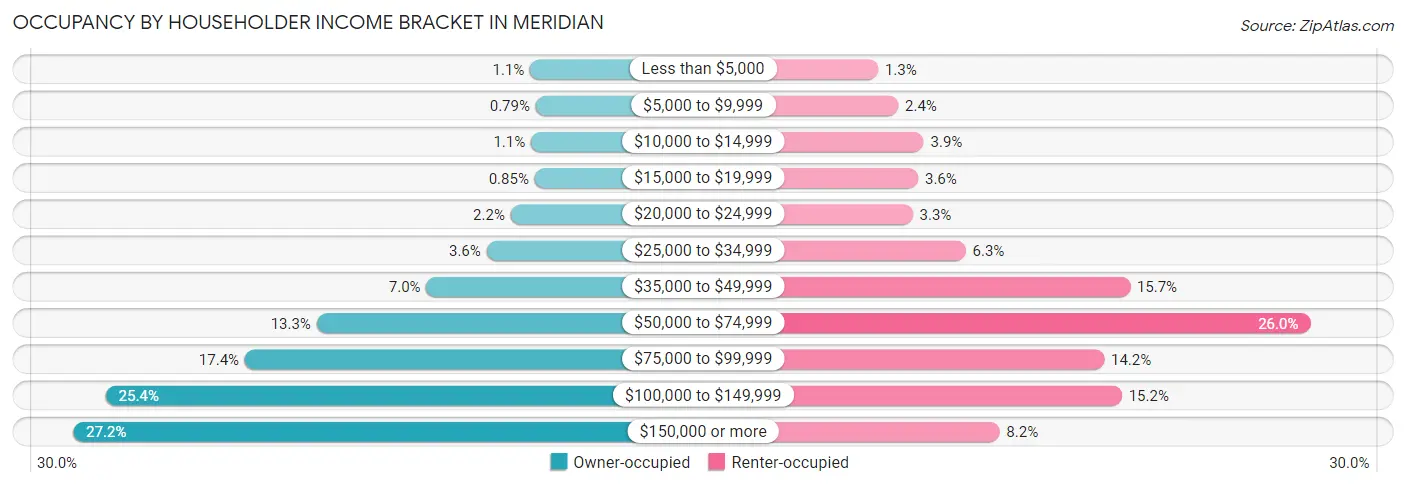
| Income Bracket | Owner-occupied | Renter-occupied |
| Less than $5,000 | 362 (1.1%) | 130 (1.3%) |
| $5,000 to $9,999 | 259 (0.8%) | 246 (2.4%) |
| $10,000 to $14,999 | 346 (1.1%) | 394 (3.9%) |
| $15,000 to $19,999 | 278 (0.9%) | 362 (3.6%) |
| $20,000 to $24,999 | 727 (2.2%) | 330 (3.3%) |
| $25,000 to $34,999 | 1,178 (3.6%) | 638 (6.3%) |
| $35,000 to $49,999 | 2,304 (7.0%) | 1,589 (15.7%) |
| $50,000 to $74,999 | 4,352 (13.3%) | 2,634 (26.0%) |
| $75,000 to $99,999 | 5,695 (17.4%) | 1,439 (14.2%) |
| $100,000 to $149,999 | 8,299 (25.4%) | 1,542 (15.2%) |
| $150,000 or more | 8,906 (27.2%) | 833 (8.2%) |
| Total | 32,706 (100.0%) | 10,137 (100.0%) |
Monthly Housing Cost Tiers in Meridian
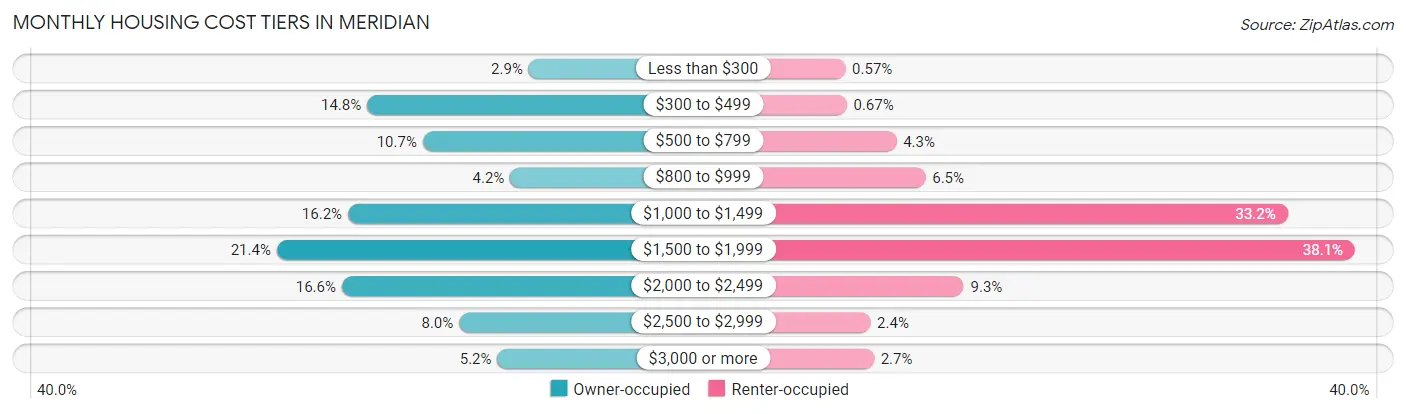
| Monthly Cost | Owner-occupied | Renter-occupied |
| Less than $300 | 939 (2.9%) | 58 (0.6%) |
| $300 to $499 | 4,833 (14.8%) | 68 (0.7%) |
| $500 to $799 | 3,493 (10.7%) | 439 (4.3%) |
| $800 to $999 | 1,386 (4.2%) | 656 (6.5%) |
| $1,000 to $1,499 | 5,294 (16.2%) | 3,360 (33.2%) |
| $1,500 to $1,999 | 7,009 (21.4%) | 3,863 (38.1%) |
| $2,000 to $2,499 | 5,443 (16.6%) | 942 (9.3%) |
| $2,500 to $2,999 | 2,616 (8.0%) | 244 (2.4%) |
| $3,000 or more | 1,693 (5.2%) | 271 (2.7%) |
| Total | 32,706 (100.0%) | 10,137 (100.0%) |
Physical Housing Characteristics in Meridian
Housing Structures in Meridian
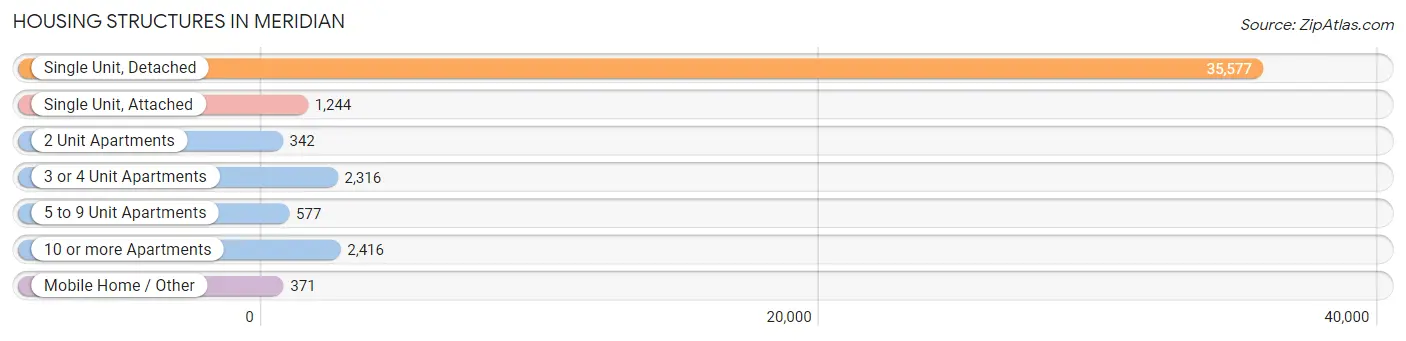
| Structure Type | # Housing Units | % Housing Units |
| Single Unit, Detached | 35,577 | 83.0% |
| Single Unit, Attached | 1,244 | 2.9% |
| 2 Unit Apartments | 342 | 0.8% |
| 3 or 4 Unit Apartments | 2,316 | 5.4% |
| 5 to 9 Unit Apartments | 577 | 1.3% |
| 10 or more Apartments | 2,416 | 5.6% |
| Mobile Home / Other | 371 | 0.9% |
| Total | 42,843 | 100.0% |
Housing Structures by Occupancy in Meridian
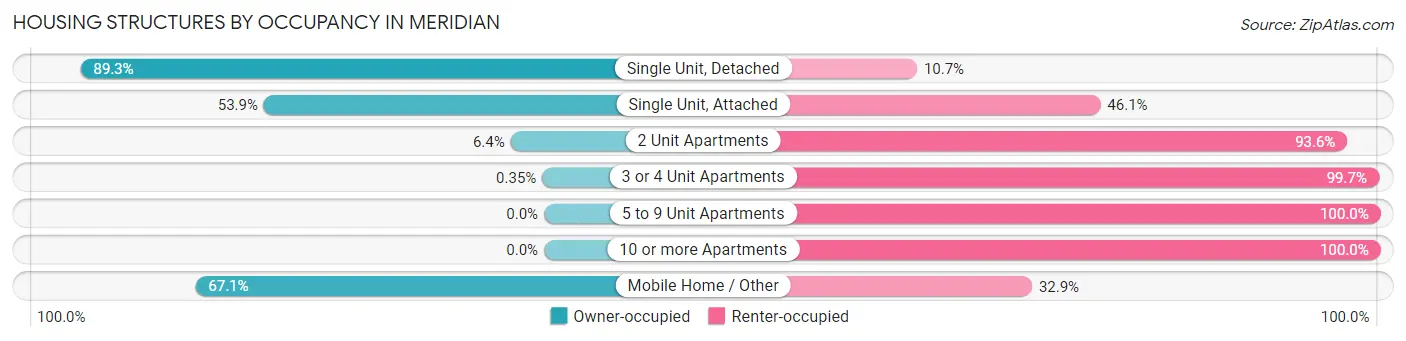
| Structure Type | Owner-occupied | Renter-occupied |
| Single Unit, Detached | 31,756 (89.3%) | 3,821 (10.7%) |
| Single Unit, Attached | 671 (53.9%) | 573 (46.1%) |
| 2 Unit Apartments | 22 (6.4%) | 320 (93.6%) |
| 3 or 4 Unit Apartments | 8 (0.4%) | 2,308 (99.7%) |
| 5 to 9 Unit Apartments | 0 (0.0%) | 577 (100.0%) |
| 10 or more Apartments | 0 (0.0%) | 2,416 (100.0%) |
| Mobile Home / Other | 249 (67.1%) | 122 (32.9%) |
| Total | 32,706 (76.3%) | 10,137 (23.7%) |
Housing Structures by Number of Rooms in Meridian
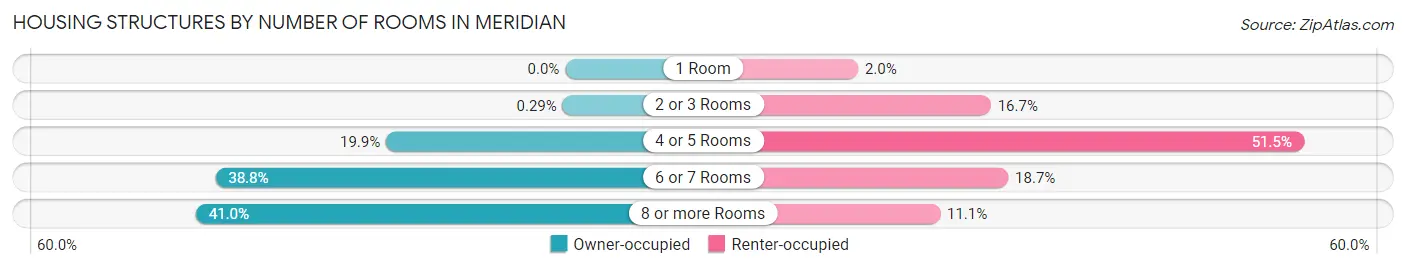
| Number of Rooms | Owner-occupied | Renter-occupied |
| 1 Room | 0 (0.0%) | 203 (2.0%) |
| 2 or 3 Rooms | 94 (0.3%) | 1,697 (16.7%) |
| 4 or 5 Rooms | 6,504 (19.9%) | 5,218 (51.5%) |
| 6 or 7 Rooms | 12,700 (38.8%) | 1,893 (18.7%) |
| 8 or more Rooms | 13,408 (41.0%) | 1,126 (11.1%) |
| Total | 32,706 (100.0%) | 10,137 (100.0%) |
Housing Structure by Heating Type in Meridian
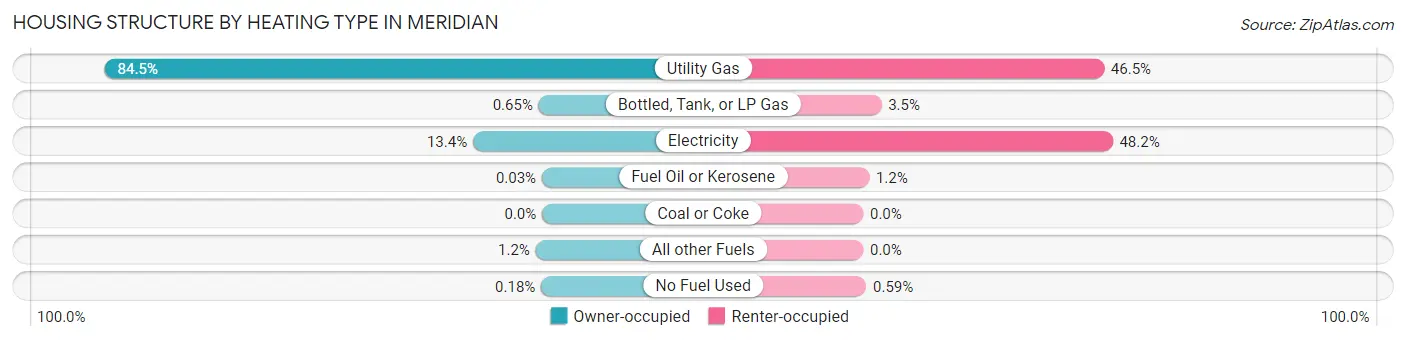
| Heating Type | Owner-occupied | Renter-occupied |
| Utility Gas | 27,648 (84.5%) | 4,718 (46.5%) |
| Bottled, Tank, or LP Gas | 212 (0.6%) | 356 (3.5%) |
| Electricity | 4,371 (13.4%) | 4,886 (48.2%) |
| Fuel Oil or Kerosene | 11 (0.0%) | 117 (1.1%) |
| Coal or Coke | 0 (0.0%) | 0 (0.0%) |
| All other Fuels | 405 (1.2%) | 0 (0.0%) |
| No Fuel Used | 59 (0.2%) | 60 (0.6%) |
| Total | 32,706 (100.0%) | 10,137 (100.0%) |
Household Vehicle Usage in Meridian
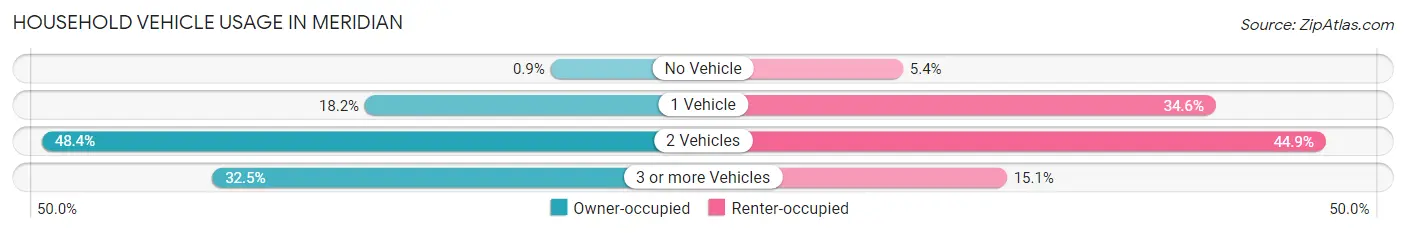
| Vehicles per Household | Owner-occupied | Renter-occupied |
| No Vehicle | 295 (0.9%) | 548 (5.4%) |
| 1 Vehicle | 5,962 (18.2%) | 3,509 (34.6%) |
| 2 Vehicles | 15,826 (48.4%) | 4,549 (44.9%) |
| 3 or more Vehicles | 10,623 (32.5%) | 1,531 (15.1%) |
| Total | 32,706 (100.0%) | 10,137 (100.0%) |
Real Estate & Mortgages in Meridian
Real Estate and Mortgage Overview in Meridian
| Characteristic | Without Mortgage | With Mortgage |
| Housing Units | 8,551 | 24,155 |
| Median Property Value | $406,600 | $433,000 |
| Median Household Income | $82,199 | $7,454 |
| Monthly Housing Costs | $449 | $1,693 |
| Real Estate Taxes | $2,324 | $498 |
Property Value by Mortgage Status in Meridian
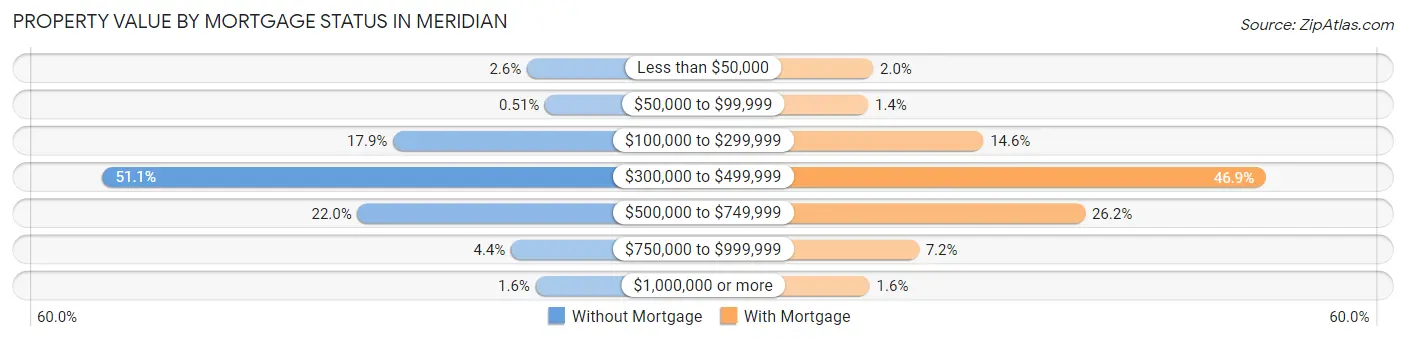
| Property Value | Without Mortgage | With Mortgage |
| Less than $50,000 | 221 (2.6%) | 486 (2.0%) |
| $50,000 to $99,999 | 44 (0.5%) | 346 (1.4%) |
| $100,000 to $299,999 | 1,529 (17.9%) | 3,525 (14.6%) |
| $300,000 to $499,999 | 4,368 (51.1%) | 11,332 (46.9%) |
| $500,000 to $749,999 | 1,877 (22.0%) | 6,334 (26.2%) |
| $750,000 to $999,999 | 376 (4.4%) | 1,744 (7.2%) |
| $1,000,000 or more | 136 (1.6%) | 388 (1.6%) |
| Total | 8,551 (100.0%) | 24,155 (100.0%) |
Household Income by Mortgage Status in Meridian
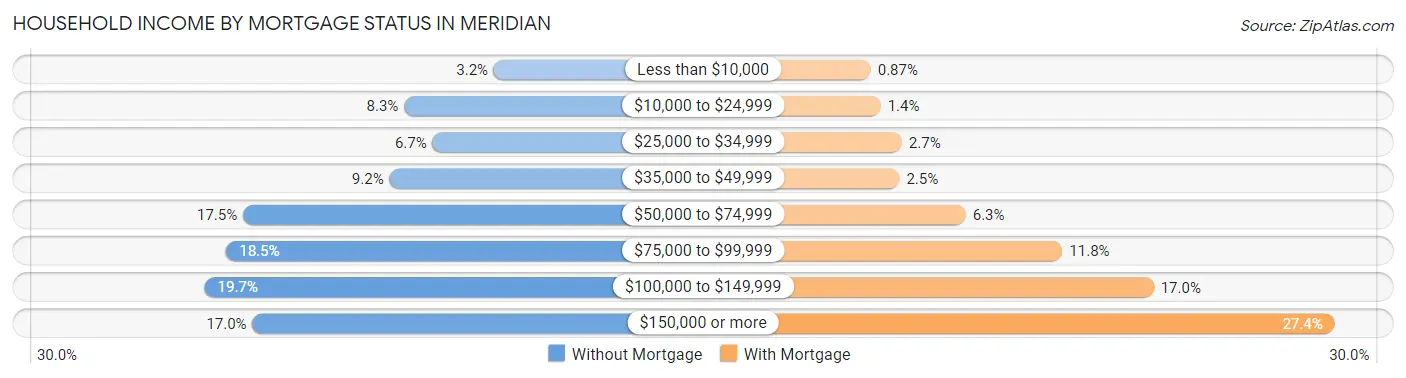
| Household Income | Without Mortgage | With Mortgage |
| Less than $10,000 | 272 (3.2%) | 210 (0.9%) |
| $10,000 to $24,999 | 711 (8.3%) | 349 (1.4%) |
| $25,000 to $34,999 | 572 (6.7%) | 640 (2.6%) |
| $35,000 to $49,999 | 782 (9.1%) | 606 (2.5%) |
| $50,000 to $74,999 | 1,498 (17.5%) | 1,522 (6.3%) |
| $75,000 to $99,999 | 1,579 (18.5%) | 2,854 (11.8%) |
| $100,000 to $149,999 | 1,685 (19.7%) | 4,116 (17.0%) |
| $150,000 or more | 1,452 (17.0%) | 6,614 (27.4%) |
| Total | 8,551 (100.0%) | 24,155 (100.0%) |
Property Value to Household Income Ratio in Meridian
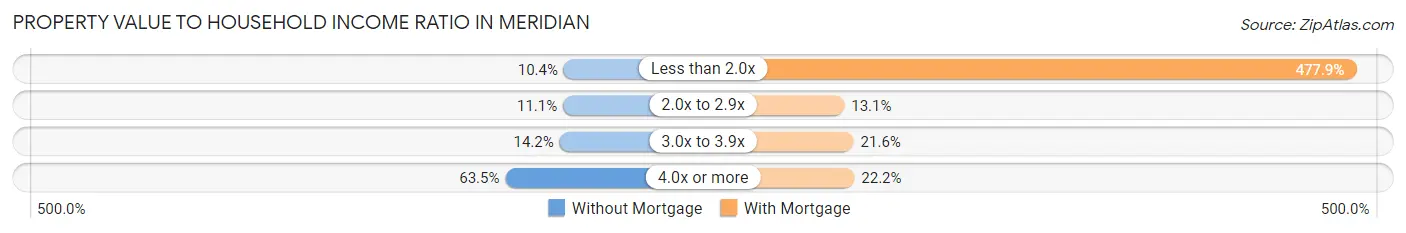
| Value-to-Income Ratio | Without Mortgage | With Mortgage |
| Less than 2.0x | 888 (10.4%) | 115,430 (477.9%) |
| 2.0x to 2.9x | 947 (11.1%) | 3,160 (13.1%) |
| 3.0x to 3.9x | 1,216 (14.2%) | 5,207 (21.6%) |
| 4.0x or more | 5,431 (63.5%) | 5,354 (22.2%) |
| Total | 8,551 (100.0%) | 24,155 (100.0%) |
Real Estate Taxes by Mortgage Status in Meridian
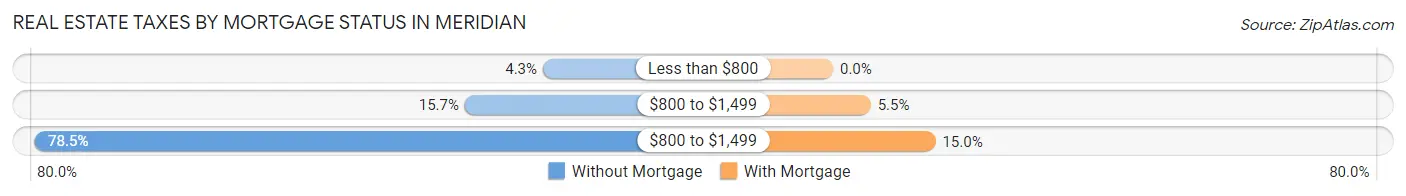
| Property Taxes | Without Mortgage | With Mortgage |
| Less than $800 | 365 (4.3%) | 0 (0.0%) |
| $800 to $1,499 | 1,341 (15.7%) | 1,332 (5.5%) |
| $800 to $1,499 | 6,709 (78.5%) | 3,615 (15.0%) |
| Total | 8,551 (100.0%) | 24,155 (100.0%) |
Health & Disability in Meridian
Health Insurance Coverage by Age in Meridian
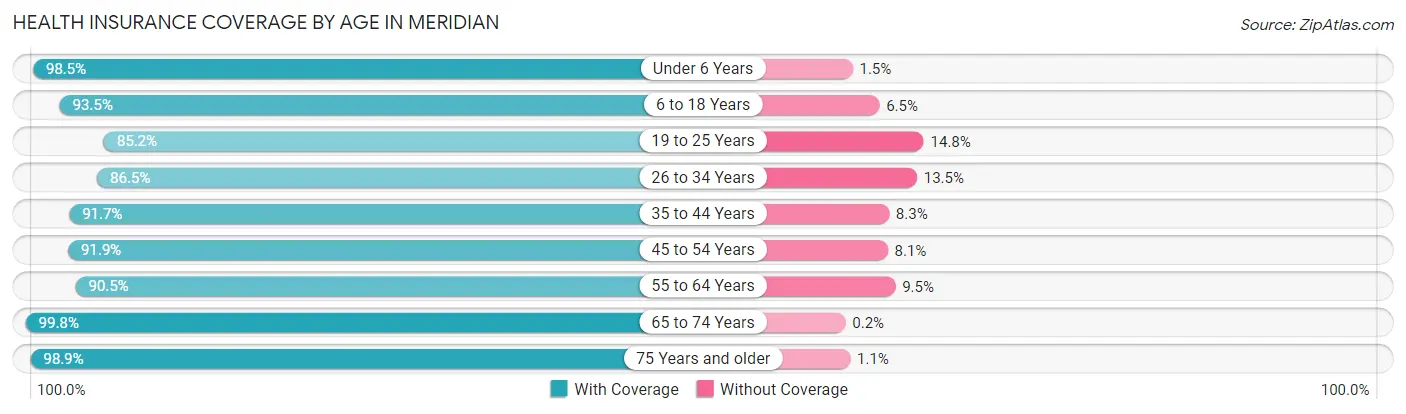
| Age Bracket | With Coverage | Without Coverage |
| Under 6 Years | 8,449 (98.5%) | 131 (1.5%) |
| 6 to 18 Years | 23,431 (93.5%) | 1,631 (6.5%) |
| 19 to 25 Years | 8,077 (85.2%) | 1,402 (14.8%) |
| 26 to 34 Years | 11,484 (86.5%) | 1,796 (13.5%) |
| 35 to 44 Years | 16,921 (91.7%) | 1,536 (8.3%) |
| 45 to 54 Years | 14,967 (91.9%) | 1,315 (8.1%) |
| 55 to 64 Years | 11,135 (90.5%) | 1,167 (9.5%) |
| 65 to 74 Years | 9,633 (99.8%) | 19 (0.2%) |
| 75 Years and older | 6,029 (98.9%) | 66 (1.1%) |
| Total | 110,126 (92.4%) | 9,063 (7.6%) |
Health Insurance Coverage by Citizenship Status in Meridian
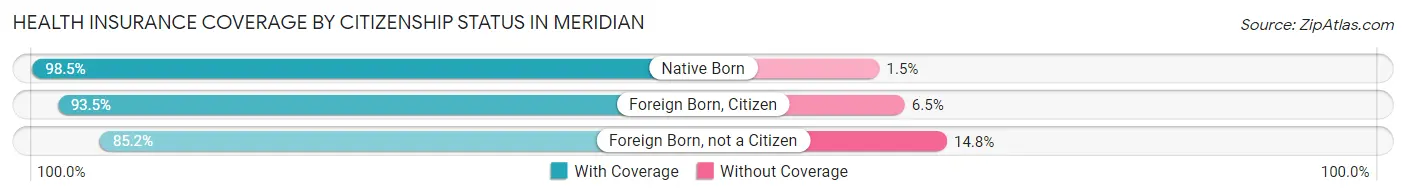
| Citizenship Status | With Coverage | Without Coverage |
| Native Born | 8,449 (98.5%) | 131 (1.5%) |
| Foreign Born, Citizen | 23,431 (93.5%) | 1,631 (6.5%) |
| Foreign Born, not a Citizen | 8,077 (85.2%) | 1,402 (14.8%) |
Health Insurance Coverage by Household Income in Meridian
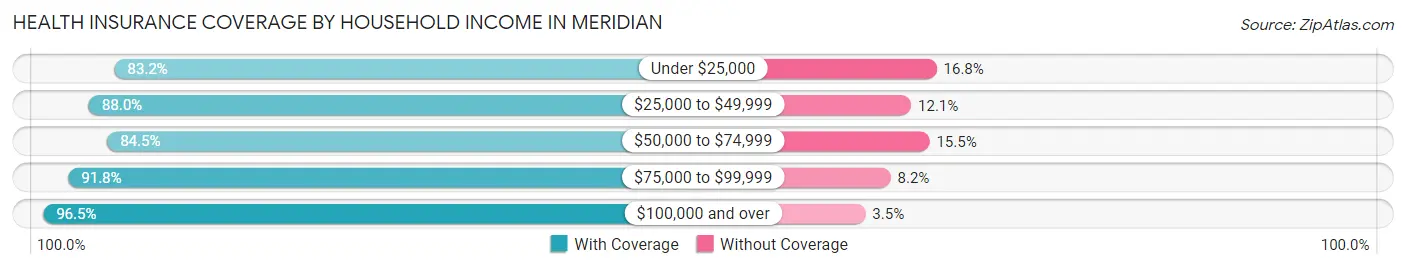
| Household Income | With Coverage | Without Coverage |
| Under $25,000 | 5,373 (83.2%) | 1,087 (16.8%) |
| $25,000 to $49,999 | 9,771 (87.9%) | 1,339 (12.0%) |
| $50,000 to $74,999 | 15,498 (84.5%) | 2,840 (15.5%) |
| $75,000 to $99,999 | 17,254 (91.8%) | 1,543 (8.2%) |
| $100,000 and over | 62,072 (96.5%) | 2,245 (3.5%) |
Public vs Private Health Insurance Coverage by Age in Meridian
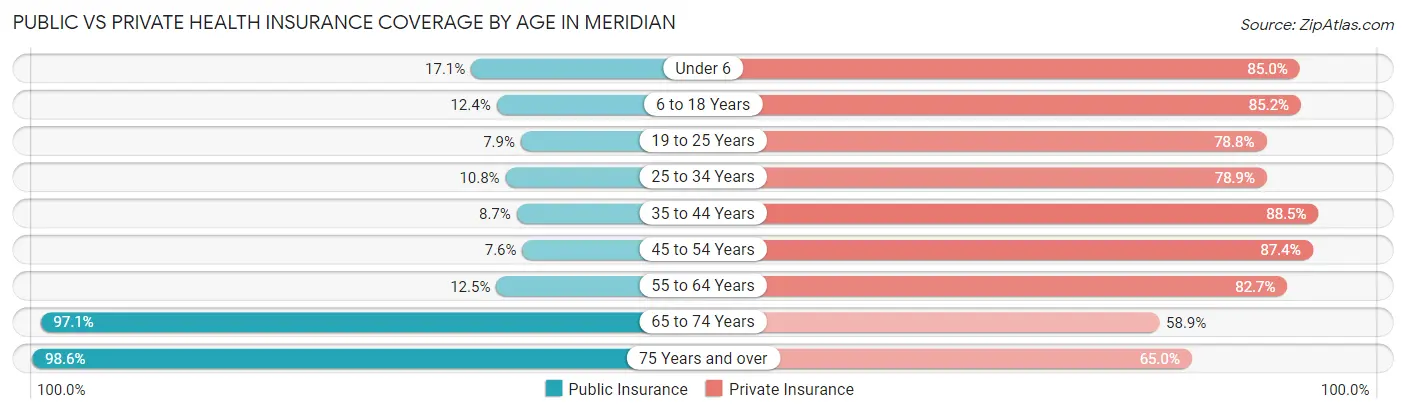
| Age Bracket | Public Insurance | Private Insurance |
| Under 6 | 1,469 (17.1%) | 7,291 (85.0%) |
| 6 to 18 Years | 3,109 (12.4%) | 21,356 (85.2%) |
| 19 to 25 Years | 749 (7.9%) | 7,468 (78.8%) |
| 25 to 34 Years | 1,427 (10.7%) | 10,475 (78.9%) |
| 35 to 44 Years | 1,601 (8.7%) | 16,326 (88.4%) |
| 45 to 54 Years | 1,239 (7.6%) | 14,228 (87.4%) |
| 55 to 64 Years | 1,533 (12.5%) | 10,171 (82.7%) |
| 65 to 74 Years | 9,368 (97.1%) | 5,685 (58.9%) |
| 75 Years and over | 6,009 (98.6%) | 3,959 (64.9%) |
| Total | 26,504 (22.2%) | 96,959 (81.4%) |
Disability Status by Sex by Age in Meridian
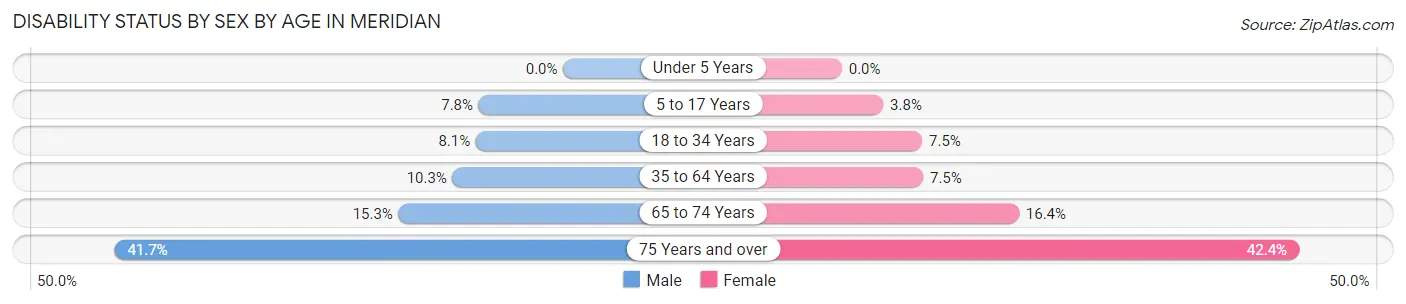
| Age Bracket | Male | Female |
| Under 5 Years | 0 (0.0%) | 0 (0.0%) |
| 5 to 17 Years | 997 (7.8%) | 481 (3.8%) |
| 18 to 34 Years | 957 (8.1%) | 906 (7.4%) |
| 35 to 64 Years | 2,396 (10.3%) | 1,788 (7.5%) |
| 65 to 74 Years | 674 (15.3%) | 861 (16.4%) |
| 75 Years and over | 1,071 (41.7%) | 1,495 (42.4%) |
Disability Class by Sex by Age in Meridian
Disability Class: Hearing Difficulty
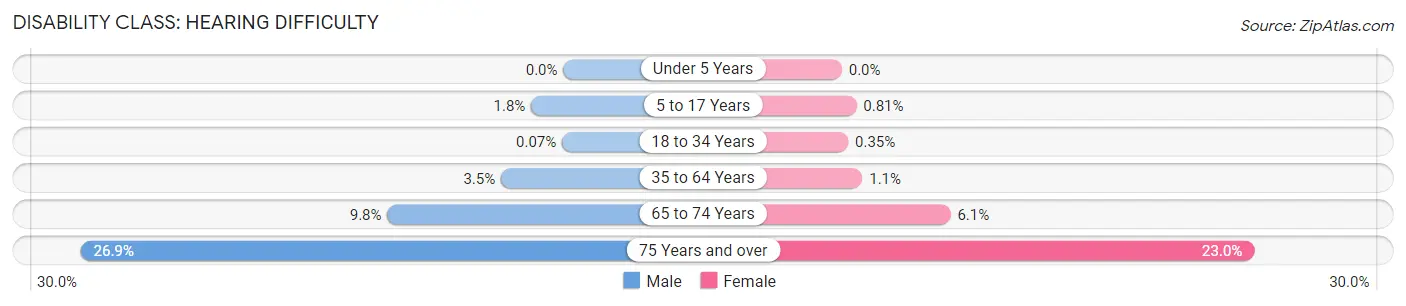
| Age Bracket | Male | Female |
| Under 5 Years | 0 (0.0%) | 0 (0.0%) |
| 5 to 17 Years | 228 (1.8%) | 101 (0.8%) |
| 18 to 34 Years | 8 (0.1%) | 43 (0.4%) |
| 35 to 64 Years | 809 (3.5%) | 270 (1.1%) |
| 65 to 74 Years | 432 (9.8%) | 317 (6.0%) |
| 75 Years and over | 691 (26.9%) | 809 (23.0%) |
Disability Class: Vision Difficulty
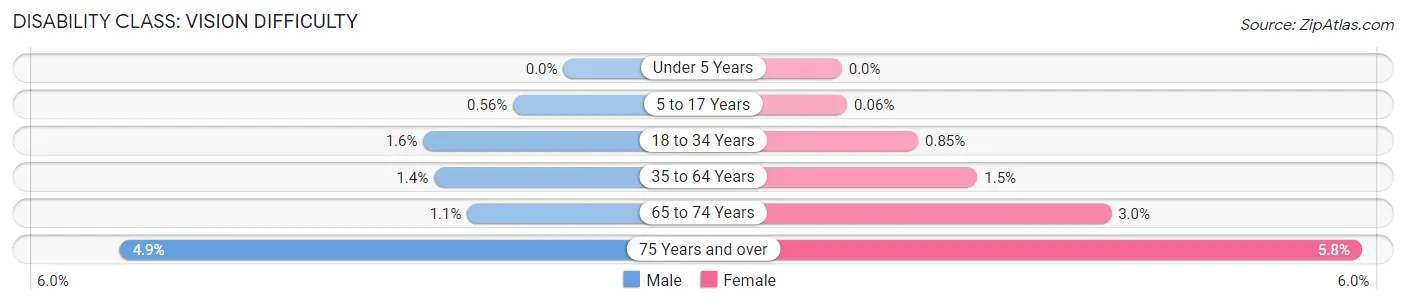
| Age Bracket | Male | Female |
| Under 5 Years | 0 (0.0%) | 0 (0.0%) |
| 5 to 17 Years | 71 (0.6%) | 7 (0.1%) |
| 18 to 34 Years | 184 (1.6%) | 103 (0.9%) |
| 35 to 64 Years | 337 (1.4%) | 358 (1.5%) |
| 65 to 74 Years | 47 (1.1%) | 157 (3.0%) |
| 75 Years and over | 127 (4.9%) | 204 (5.8%) |
Disability Class: Cognitive Difficulty
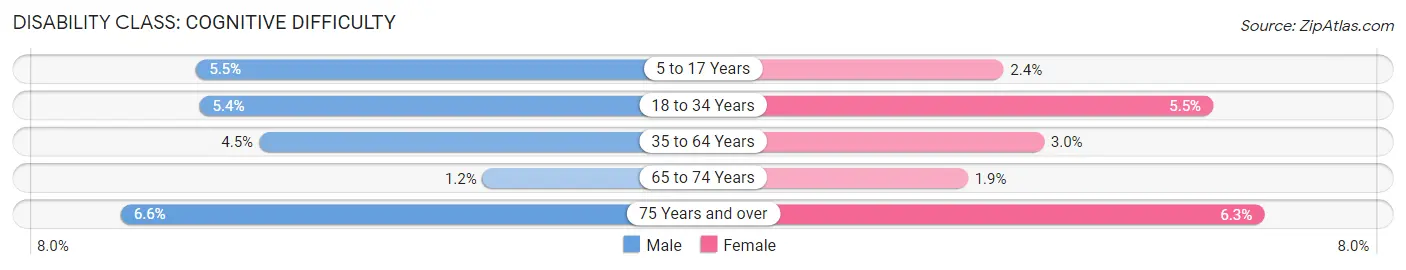
| Age Bracket | Male | Female |
| 5 to 17 Years | 693 (5.4%) | 300 (2.4%) |
| 18 to 34 Years | 638 (5.4%) | 670 (5.5%) |
| 35 to 64 Years | 1,055 (4.5%) | 711 (3.0%) |
| 65 to 74 Years | 53 (1.2%) | 98 (1.9%) |
| 75 Years and over | 169 (6.6%) | 221 (6.3%) |
Disability Class: Ambulatory Difficulty
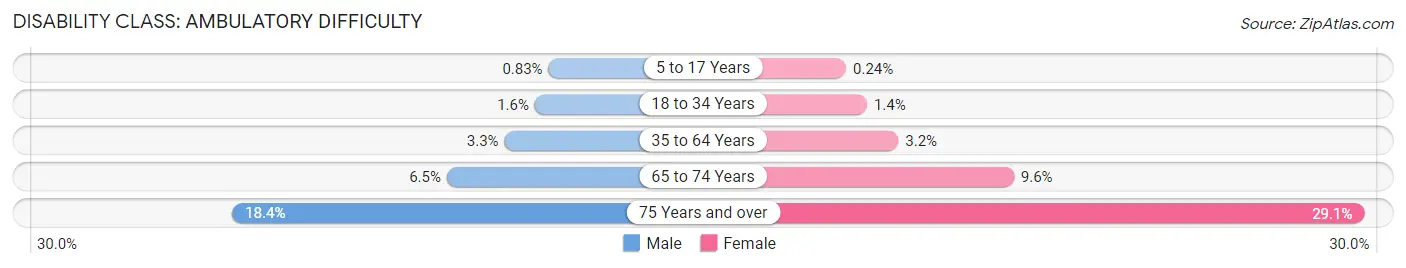
| Age Bracket | Male | Female |
| 5 to 17 Years | 105 (0.8%) | 30 (0.2%) |
| 18 to 34 Years | 188 (1.6%) | 170 (1.4%) |
| 35 to 64 Years | 766 (3.3%) | 747 (3.2%) |
| 65 to 74 Years | 286 (6.5%) | 502 (9.6%) |
| 75 Years and over | 474 (18.4%) | 1,025 (29.1%) |
Disability Class: Self-Care Difficulty
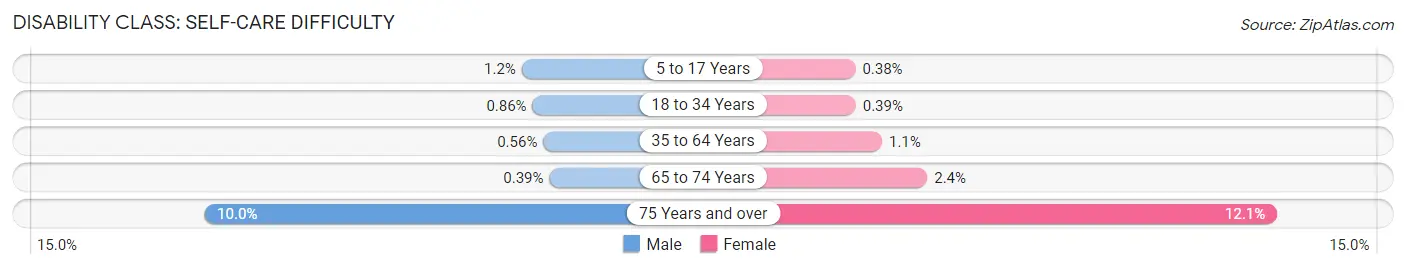
| Age Bracket | Male | Female |
| 5 to 17 Years | 148 (1.2%) | 47 (0.4%) |
| 18 to 34 Years | 102 (0.9%) | 48 (0.4%) |
| 35 to 64 Years | 131 (0.6%) | 266 (1.1%) |
| 65 to 74 Years | 17 (0.4%) | 125 (2.4%) |
| 75 Years and over | 257 (10.0%) | 427 (12.1%) |
Technology Access in Meridian
Computing Device Access in Meridian
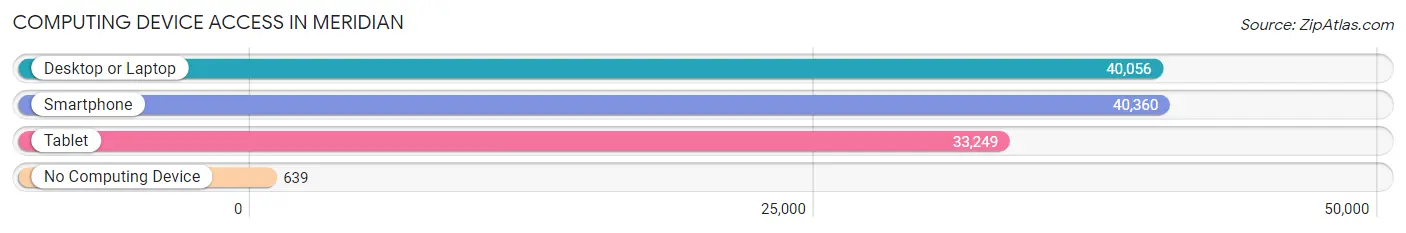
| Device Type | # Households | % Households |
| Desktop or Laptop | 40,056 | 93.5% |
| Smartphone | 40,360 | 94.2% |
| Tablet | 33,249 | 77.6% |
| No Computing Device | 639 | 1.5% |
| Total | 42,843 | 100.0% |
Internet Access in Meridian
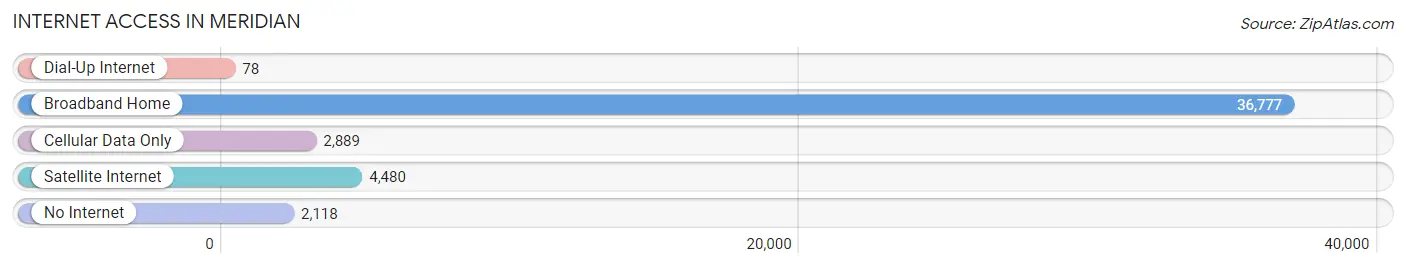
| Internet Type | # Households | % Households |
| Dial-Up Internet | 78 | 0.2% |
| Broadband Home | 36,777 | 85.8% |
| Cellular Data Only | 2,889 | 6.7% |
| Satellite Internet | 4,480 | 10.5% |
| No Internet | 2,118 | 4.9% |
| Total | 42,843 | 100.0% |
Meridian Summary
Meridian, Idaho is a city located in Ada County, Idaho, United States. It is the third largest city in the state, with a population of approximately 94,000 people as of 2019. The city is located just west of Boise, the state capital, and is part of the Boise metropolitan area.
History
Meridian was founded in 1891 by settlers from the Oregon Trail. The city was originally named Hunter, after one of the settlers, but was later changed to Meridian in 1902. The name was chosen to reflect the city’s location on the Boise Meridian, which is the line of longitude that runs through the city.
The city was incorporated in 1903 and has since grown to become the third largest city in Idaho. In the early 1900s, Meridian was a small farming community, but it has since grown to become a major commercial and residential center.
Geography
Meridian is located in the Treasure Valley region of Idaho, which is part of the Snake River Plain. The city is situated on the Boise Meridian, which is the line of longitude that runs through the city. The city is located at an elevation of 2,845 feet (867 m) above sea level.
The city is bordered by the cities of Boise, Nampa, and Eagle. The Boise River runs through the city, and the city is located near several lakes, including Lake Lowell and Lake Walcott.
Economy
Meridian’s economy is largely based on the service industry, with many businesses providing services to the surrounding area. The city is home to several large employers, including St. Luke’s Health System, Hewlett Packard, and Micron Technology.
The city is also home to several shopping centers, including The Village at Meridian and Meridian Town Center. The city is also home to several parks, including Julius M. Kleiner Memorial Park and Settlers Park.
Demographics
As of 2019, the population of Meridian was estimated to be 94,000 people. The city has a diverse population, with the largest ethnic groups being White (77.3%), Hispanic or Latino (14.2%), and Asian (3.7%).
The median household income in Meridian is $63,845, and the median home value is $246,400. The city has a low unemployment rate of 3.2%, and the poverty rate is 8.3%.
Conclusion
Meridian, Idaho is a city located in Ada County, Idaho, United States. It is the third largest city in the state, with a population of approximately 94,000 people as of 2019. The city is located just west of Boise, the state capital, and is part of the Boise metropolitan area. The city was founded in 1891 and has since grown to become a major commercial and residential center. The city’s economy is largely based on the service industry, and the city is home to several large employers. The city has a diverse population, with the largest ethnic groups being White (77.3%), Hispanic or Latino (14.2%), and Asian (3.7%). The median household income in Meridian is $63,845, and the median home value is $246,400.
Common Questions
What is Per Capita Income in Meridian?
Per Capita income in Meridian is $44,540.
What is the Median Family Income in Meridian?
Median Family Income in Meridian is $107,635.
What is the Median Household income in Meridian?
Median Household Income in Meridian is $93,296.
What is Income or Wage Gap in Meridian?
Income or Wage Gap in Meridian is 34.1%.
Women in Meridian earn 65.9 cents for every dollar earned by a man.
What is Family Income Deficit in Meridian?
Family Income Deficit in Meridian is $10,455.
Families that are below poverty line in Meridian earn $10,455 less on average than the poverty threshold level.
What is Inequality or Gini Index in Meridian?
Inequality or Gini Index in Meridian is 0.42.
What is the Total Population of Meridian?
Total Population of Meridian is 119,872.
What is the Total Male Population of Meridian?
Total Male Population of Meridian is 59,361.
What is the Total Female Population of Meridian?
Total Female Population of Meridian is 60,511.
What is the Ratio of Males per 100 Females in Meridian?
There are 98.10 Males per 100 Females in Meridian.
What is the Ratio of Females per 100 Males in Meridian?
There are 101.94 Females per 100 Males in Meridian.
What is the Median Population Age in Meridian?
Median Population Age in Meridian is 37.1 Years.
What is the Average Family Size in Meridian
Average Family Size in Meridian is 3.2 People.
What is the Average Household Size in Meridian
Average Household Size in Meridian is 2.8 People.
How Large is the Labor Force in Meridian?
There are 63,815 People in the Labor Forcein in Meridian.
What is the Percentage of People in the Labor Force in Meridian?
70.4% of People are in the Labor Force in Meridian.
What is the Unemployment Rate in Meridian?
Unemployment Rate in Meridian is 2.7%.