Portland, ME Map & Demographics
Portland Map
Portland Overview
$48,806
PER CAPITA INCOME
$110,206
AVG FAMILY INCOME
$71,498
AVG HOUSEHOLD INCOME
7.9%
WAGE / INCOME GAP [ % ]
92.1¢/ $1
WAGE / INCOME GAP [ $ ]
$13,362
FAMILY INCOME DEFICIT
0.49
INEQUALITY / GINI INDEX
68,280
TOTAL POPULATION
33,055
MALE POPULATION
35,225
FEMALE POPULATION
93.84
MALES / 100 FEMALES
106.56
FEMALES / 100 MALES
37.6
MEDIAN AGE
2.9
AVG FAMILY SIZE
2.0
AVG HOUSEHOLD SIZE
41,278
LABOR FORCE [ PEOPLE ]
69.7%
PERCENT IN LABOR FORCE
4.0%
UNEMPLOYMENT RATE
Portland Area Codes
Income in Portland
Income Overview in Portland
Per Capita Income in Portland is $48,806, while median incomes of families and households are $110,206 and $71,498 respectively.
| Characteristic | Number | Measure |
| Per Capita Income | 68,280 | $48,806 |
| Median Family Income | 13,688 | $110,206 |
| Mean Family Income | 13,688 | $142,950 |
| Median Household Income | 32,253 | $71,498 |
| Mean Household Income | 32,253 | $100,521 |
| Income Deficit | 13,688 | $13,362 |
| Wage / Income Gap (%) | 68,280 | 7.89% |
| Wage / Income Gap ($) | 68,280 | 92.11¢ per $1 |
| Gini / Inequality Index | 68,280 | 0.49 |
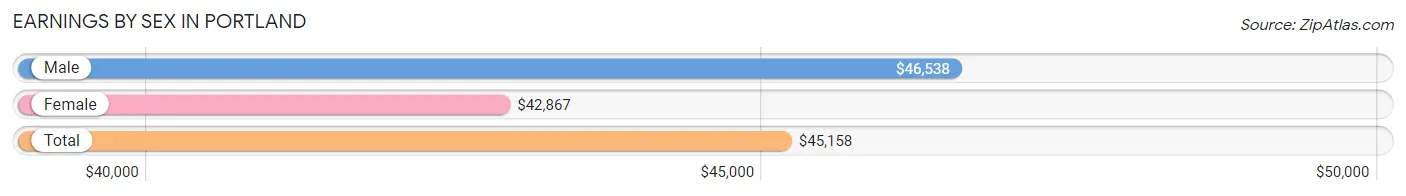
Earnings by Sex in Portland
Average Earnings in Portland are $45,158, $46,538 for men and $42,867 for women, a difference of 7.9%.
| Sex | Number | Average Earnings |
| Male | 21,541 (49.3%) | $46,538 |
| Female | 22,132 (50.7%) | $42,867 |
| Total | 43,673 (100.0%) | $45,158 |
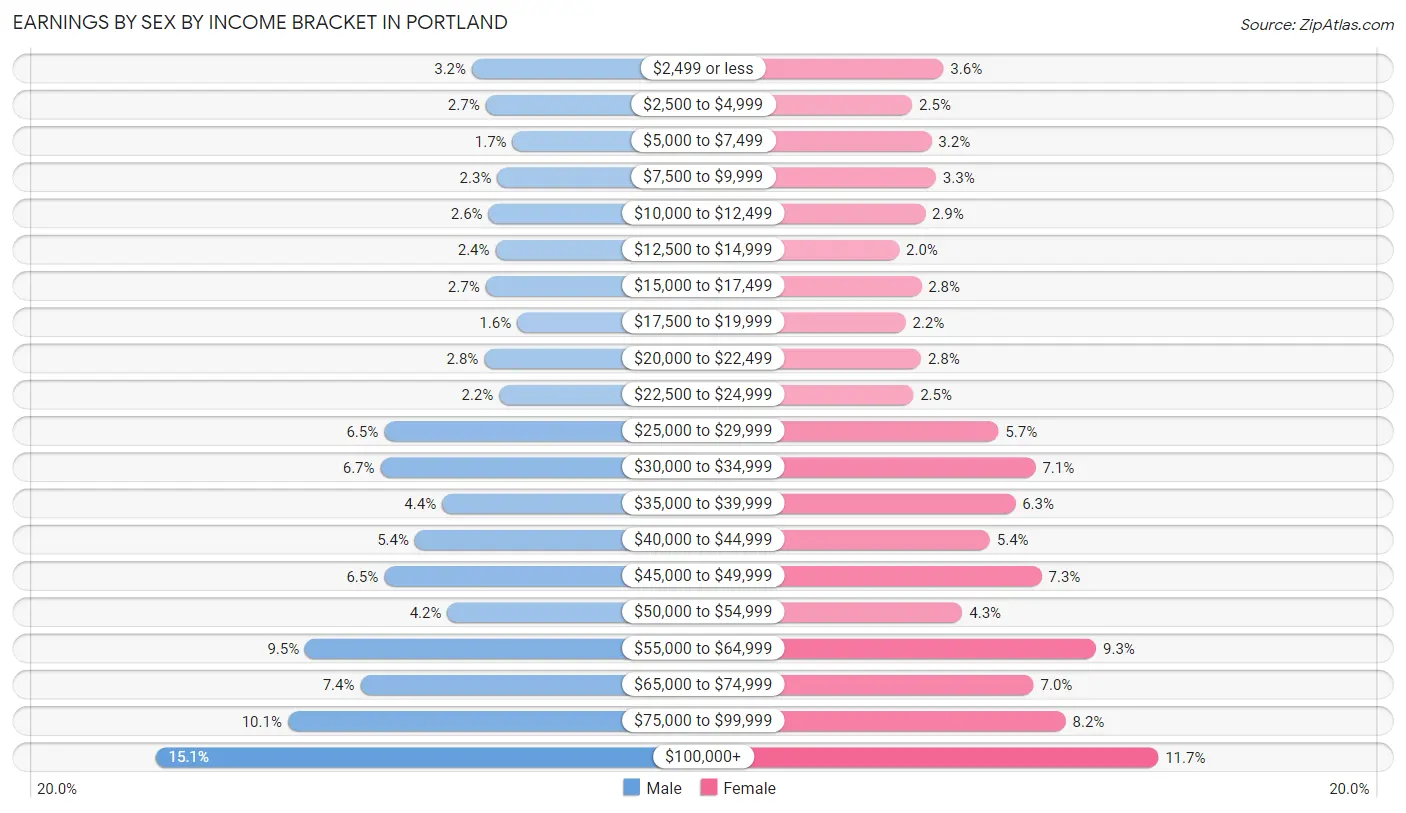
Earnings by Sex by Income Bracket in Portland
The most common earnings brackets in Portland are $100,000+ for men (3,250 | 15.1%) and $100,000+ for women (2,583 | 11.7%).
| Income | Male | Female |
| $2,499 or less | 698 (3.2%) | 802 (3.6%) |
| $2,500 to $4,999 | 587 (2.7%) | 542 (2.5%) |
| $5,000 to $7,499 | 371 (1.7%) | 702 (3.2%) |
| $7,500 to $9,999 | 494 (2.3%) | 739 (3.3%) |
| $10,000 to $12,499 | 565 (2.6%) | 649 (2.9%) |
| $12,500 to $14,999 | 508 (2.4%) | 434 (2.0%) |
| $15,000 to $17,499 | 587 (2.7%) | 617 (2.8%) |
| $17,500 to $19,999 | 334 (1.5%) | 487 (2.2%) |
| $20,000 to $22,499 | 598 (2.8%) | 615 (2.8%) |
| $22,500 to $24,999 | 478 (2.2%) | 550 (2.5%) |
| $25,000 to $29,999 | 1,406 (6.5%) | 1,257 (5.7%) |
| $30,000 to $34,999 | 1,437 (6.7%) | 1,564 (7.1%) |
| $35,000 to $39,999 | 940 (4.4%) | 1,397 (6.3%) |
| $40,000 to $44,999 | 1,158 (5.4%) | 1,187 (5.4%) |
| $45,000 to $49,999 | 1,407 (6.5%) | 1,615 (7.3%) |
| $50,000 to $54,999 | 896 (4.2%) | 959 (4.3%) |
| $55,000 to $64,999 | 2,044 (9.5%) | 2,068 (9.3%) |
| $65,000 to $74,999 | 1,599 (7.4%) | 1,550 (7.0%) |
| $75,000 to $99,999 | 2,184 (10.1%) | 1,815 (8.2%) |
| $100,000+ | 3,250 (15.1%) | 2,583 (11.7%) |
| Total | 21,541 (100.0%) | 22,132 (100.0%) |
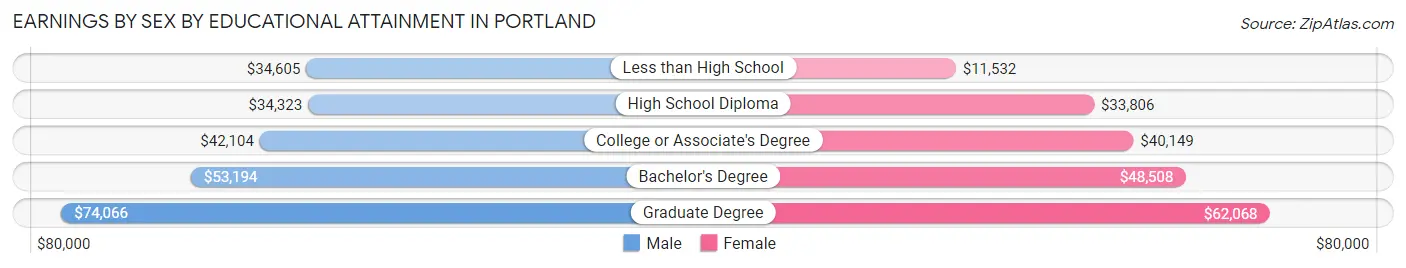
Earnings by Sex by Educational Attainment in Portland
Average earnings in Portland are $51,234 for men and $47,053 for women, a difference of 8.2%. Men with an educational attainment of graduate degree enjoy the highest average annual earnings of $74,066, while those with high school diploma education earn the least with $34,323. Women with an educational attainment of graduate degree earn the most with the average annual earnings of $62,068, while those with less than high school education have the smallest earnings of $11,532.
| Educational Attainment | Male Income | Female Income |
| Less than High School | $34,605 | $11,532 |
| High School Diploma | $34,323 | $33,806 |
| College or Associate's Degree | $42,104 | $40,149 |
| Bachelor's Degree | $53,194 | $48,508 |
| Graduate Degree | $74,066 | $62,068 |
| Total | $51,234 | $47,053 |
Family Income in Portland
Family Income Brackets in Portland
According to the Portland family income data, there are 2,984 families falling into the $100,000 to $149,999 income range, which is the most common income bracket and makes up 21.8% of all families. Conversely, the $10,000 to $14,999 income bracket is the least frequent group with only 151 families (1.1%) belonging to this category.
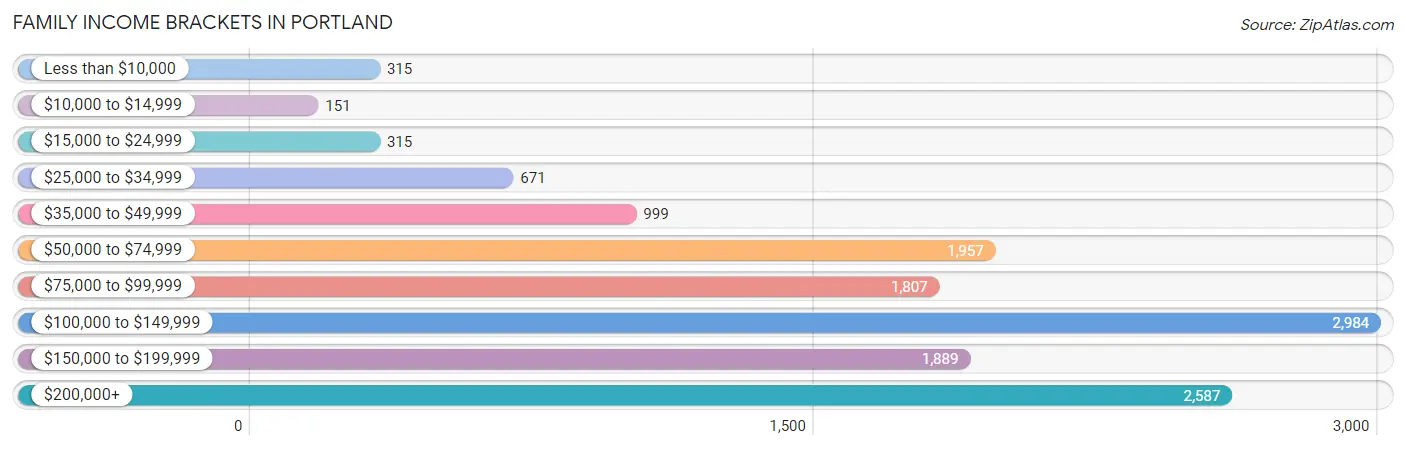
| Income Bracket | # Families | % Families |
| Less than $10,000 | 315 | 2.3% |
| $10,000 to $14,999 | 151 | 1.1% |
| $15,000 to $24,999 | 315 | 2.3% |
| $25,000 to $34,999 | 671 | 4.9% |
| $35,000 to $49,999 | 999 | 7.3% |
| $50,000 to $74,999 | 1,957 | 14.3% |
| $75,000 to $99,999 | 1,807 | 13.2% |
| $100,000 to $149,999 | 2,984 | 21.8% |
| $150,000 to $199,999 | 1,889 | 13.8% |
| $200,000+ | 2,587 | 18.9% |
Family Income by Famaliy Size in Portland
4-person families (2,086 | 15.2%) account for the highest median family income in Portland with $148,443 per family, while 2-person families (7,760 | 56.7%) have the highest median income of $50,267 per family member.
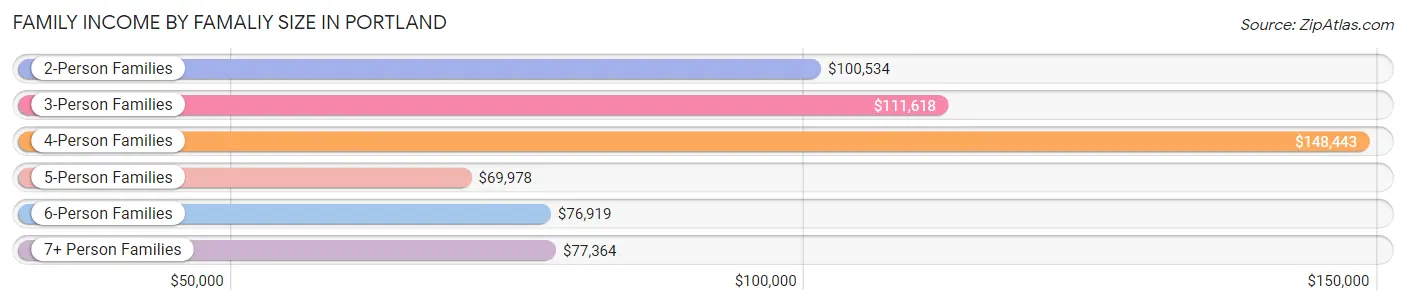
| Income Bracket | # Families | Median Income |
| 2-Person Families | 7,760 (56.7%) | $100,534 |
| 3-Person Families | 2,686 (19.6%) | $111,618 |
| 4-Person Families | 2,086 (15.2%) | $148,443 |
| 5-Person Families | 805 (5.9%) | $69,978 |
| 6-Person Families | 224 (1.6%) | $76,919 |
| 7+ Person Families | 127 (0.9%) | $77,364 |
| Total | 13,688 (100.0%) | $110,206 |
Family Income by Number of Earners in Portland
The median family income in Portland is $110,206, with families comprising 3+ earners (1,313) having the highest median family income of $150,568, while families with no earners (1,613) have the lowest median family income of $56,289, accounting for 9.6% and 11.8% of families, respectively.
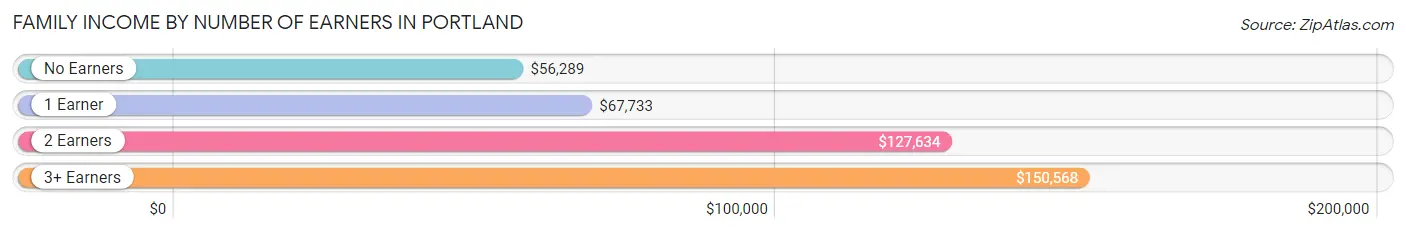
| Number of Earners | # Families | Median Income |
| No Earners | 1,613 (11.8%) | $56,289 |
| 1 Earner | 3,494 (25.5%) | $67,733 |
| 2 Earners | 7,268 (53.1%) | $127,634 |
| 3+ Earners | 1,313 (9.6%) | $150,568 |
| Total | 13,688 (100.0%) | $110,206 |
Household Income in Portland
Household Income Brackets in Portland
With 5,515 households falling in the category, the $100,000 to $149,999 income range is the most frequent in Portland, accounting for 17.1% of all households. In contrast, only 1,709 households (5.3%) fall into the $10,000 to $14,999 income bracket, making it the least populous group.
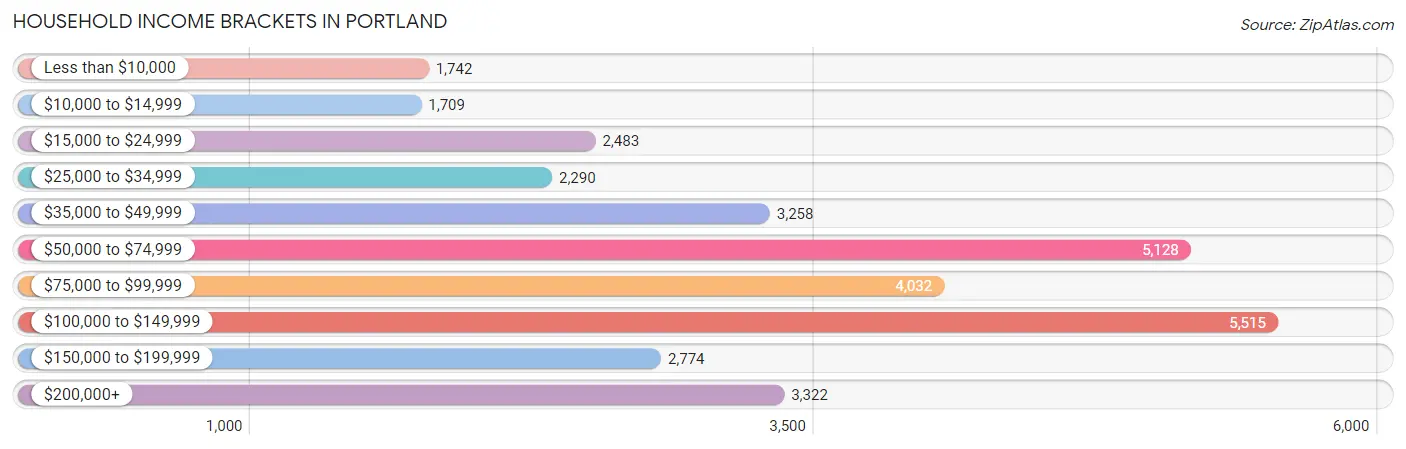
| Income Bracket | # Households | % Households |
| Less than $10,000 | 1,742 | 5.4% |
| $10,000 to $14,999 | 1,709 | 5.3% |
| $15,000 to $24,999 | 2,483 | 7.7% |
| $25,000 to $34,999 | 2,290 | 7.1% |
| $35,000 to $49,999 | 3,258 | 10.1% |
| $50,000 to $74,999 | 5,128 | 15.9% |
| $75,000 to $99,999 | 4,032 | 12.5% |
| $100,000 to $149,999 | 5,515 | 17.1% |
| $150,000 to $199,999 | 2,774 | 8.6% |
| $200,000+ | 3,322 | 10.3% |
Household Income by Householder Age in Portland
The median household income in Portland is $71,498, with the highest median household income of $84,827 found in the 45 to 64 years age bracket for the primary householder. A total of 10,157 households (31.5%) fall into this category. Meanwhile, the 65+ years age bracket for the primary householder has the lowest median household income of $50,067, with 7,330 households (22.7%) in this group.
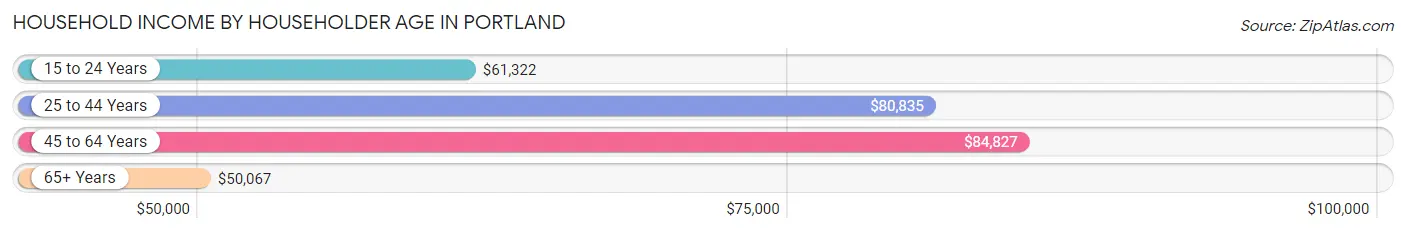
| Income Bracket | # Households | Median Income |
| 15 to 24 Years | 1,761 (5.5%) | $61,322 |
| 25 to 44 Years | 13,005 (40.3%) | $80,835 |
| 45 to 64 Years | 10,157 (31.5%) | $84,827 |
| 65+ Years | 7,330 (22.7%) | $50,067 |
| Total | 32,253 (100.0%) | $71,498 |
Poverty in Portland
Income Below Poverty by Sex and Age in Portland
With 11.6% poverty level for males and 11.9% for females among the residents of Portland, 16 and 17 year old males and 15 year old females are the most vulnerable to poverty, with 196 males (32.1%) and 77 females (30.7%) in their respective age groups living below the poverty level.
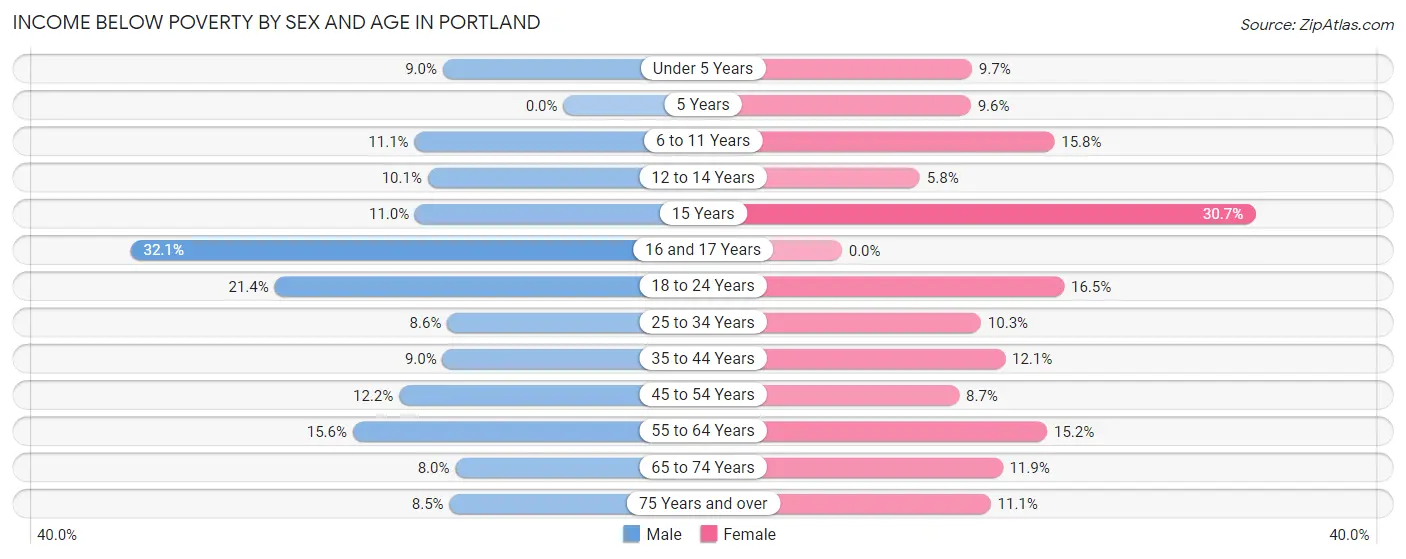
| Age Bracket | Male | Female |
| Under 5 Years | 137 (8.9%) | 125 (9.7%) |
| 5 Years | 0 (0.0%) | 33 (9.6%) |
| 6 to 11 Years | 163 (11.1%) | 267 (15.8%) |
| 12 to 14 Years | 88 (10.1%) | 52 (5.8%) |
| 15 Years | 25 (11.0%) | 77 (30.7%) |
| 16 and 17 Years | 196 (32.1%) | 0 (0.0%) |
| 18 to 24 Years | 606 (21.4%) | 516 (16.5%) |
| 25 to 34 Years | 608 (8.6%) | 760 (10.3%) |
| 35 to 44 Years | 428 (9.0%) | 557 (12.1%) |
| 45 to 54 Years | 472 (12.2%) | 338 (8.7%) |
| 55 to 64 Years | 622 (15.6%) | 693 (15.2%) |
| 65 to 74 Years | 253 (8.0%) | 376 (11.9%) |
| 75 Years and over | 127 (8.5%) | 340 (11.1%) |
| Total | 3,725 (11.6%) | 4,134 (11.9%) |
Income Above Poverty by Sex and Age in Portland
According to the poverty statistics in Portland, males aged 5 years and females aged 16 and 17 years are the age groups that are most secure financially, with 100.0% of males and 100.0% of females in these age groups living above the poverty line.
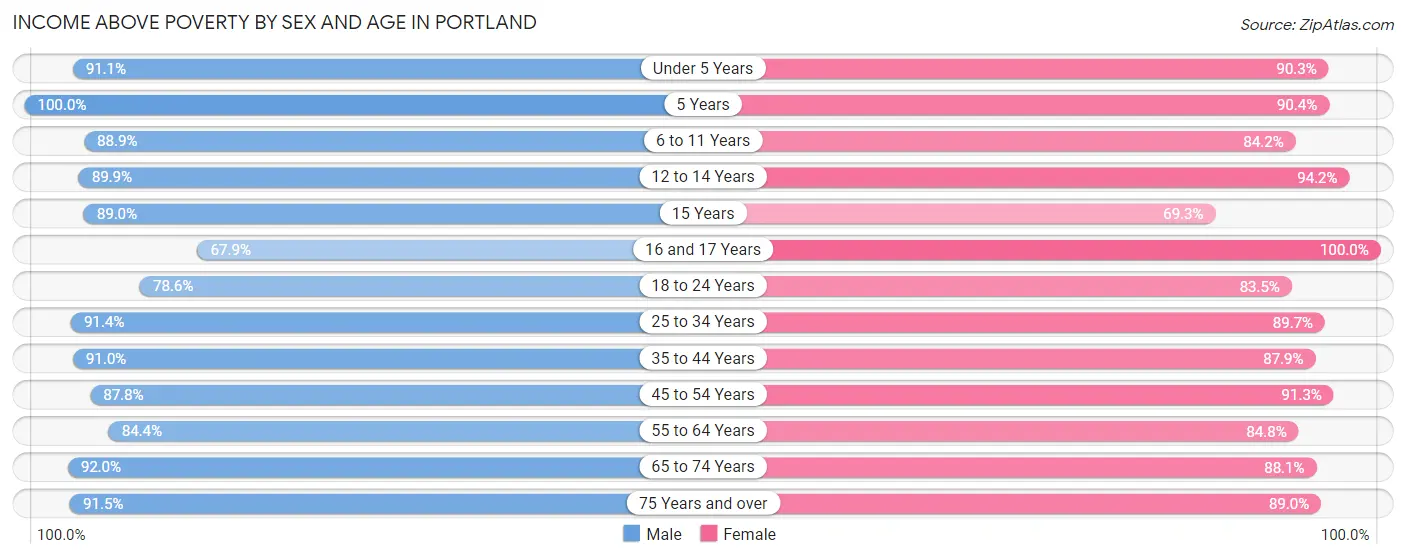
| Age Bracket | Male | Female |
| Under 5 Years | 1,394 (91.0%) | 1,169 (90.3%) |
| 5 Years | 270 (100.0%) | 312 (90.4%) |
| 6 to 11 Years | 1,311 (88.9%) | 1,425 (84.2%) |
| 12 to 14 Years | 786 (89.9%) | 845 (94.2%) |
| 15 Years | 202 (89.0%) | 174 (69.3%) |
| 16 and 17 Years | 414 (67.9%) | 490 (100.0%) |
| 18 to 24 Years | 2,221 (78.6%) | 2,612 (83.5%) |
| 25 to 34 Years | 6,447 (91.4%) | 6,598 (89.7%) |
| 35 to 44 Years | 4,342 (91.0%) | 4,038 (87.9%) |
| 45 to 54 Years | 3,396 (87.8%) | 3,541 (91.3%) |
| 55 to 64 Years | 3,358 (84.4%) | 3,853 (84.8%) |
| 65 to 74 Years | 2,902 (92.0%) | 2,777 (88.1%) |
| 75 Years and over | 1,375 (91.5%) | 2,737 (88.9%) |
| Total | 28,418 (88.4%) | 30,571 (88.1%) |
Income Below Poverty Among Married-Couple Families in Portland
The poverty statistics for married-couple families in Portland show that 2.7% or 281 of the total 10,516 families live below the poverty line. Families with 5 or more children have the highest poverty rate of 18.3%, comprising of 13 families. On the other hand, families with no children have the lowest poverty rate of 2.0%, which includes 138 families.
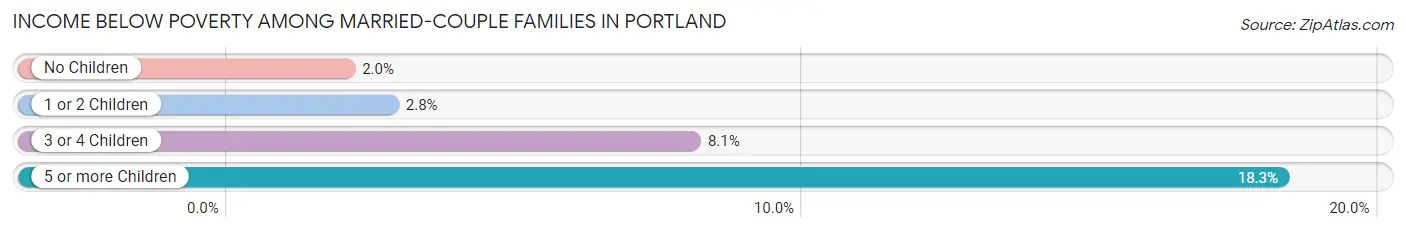
| Children | Above Poverty | Below Poverty |
| No Children | 6,643 (98.0%) | 138 (2.0%) |
| 1 or 2 Children | 3,055 (97.2%) | 88 (2.8%) |
| 3 or 4 Children | 479 (91.9%) | 42 (8.1%) |
| 5 or more Children | 58 (81.7%) | 13 (18.3%) |
| Total | 10,235 (97.3%) | 281 (2.7%) |
Income Below Poverty Among Single-Parent Households in Portland
According to the poverty data in Portland, 10.6% or 85 single-father households and 13.1% or 309 single-mother households are living below the poverty line. Among single-father households, those with no children have the highest poverty rate, with 63 households (15.8%) experiencing poverty. Likewise, among single-mother households, those with 3 or 4 children have the highest poverty rate, with 55 households (55.6%) falling below the poverty line.
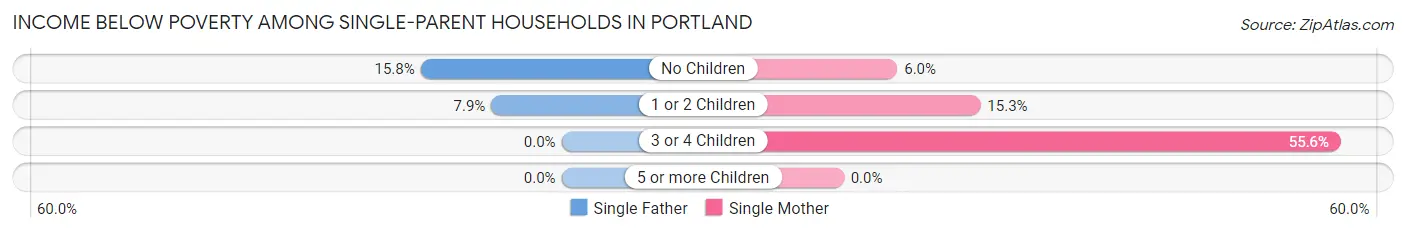
| Children | Single Father | Single Mother |
| No Children | 63 (15.8%) | 59 (6.0%) |
| 1 or 2 Children | 22 (7.9%) | 195 (15.3%) |
| 3 or 4 Children | 0 (0.0%) | 55 (55.6%) |
| 5 or more Children | 0 (0.0%) | 0 (0.0%) |
| Total | 85 (10.6%) | 309 (13.1%) |
Income Below Poverty Among Married-Couple vs Single-Parent Households in Portland
The poverty data for Portland shows that 281 of the married-couple family households (2.7%) and 394 of the single-parent households (12.4%) are living below the poverty level. Within the married-couple family households, those with 5 or more children have the highest poverty rate, with 13 households (18.3%) falling below the poverty line. Among the single-parent households, those with 3 or 4 children have the highest poverty rate, with 55 household (24.5%) living below poverty.
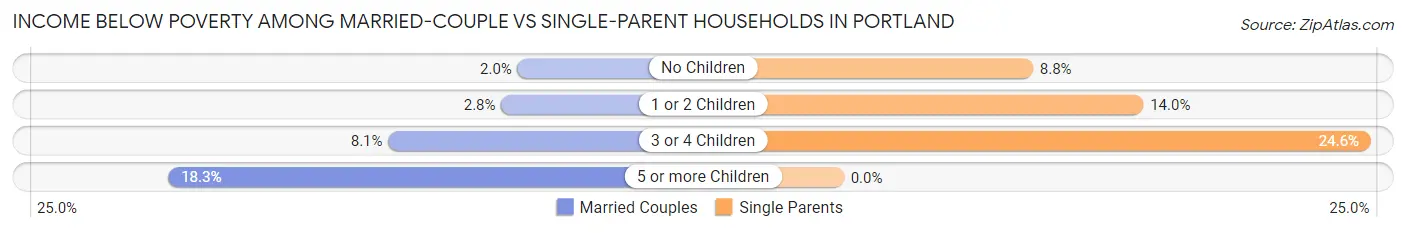
| Children | Married-Couple Families | Single-Parent Households |
| No Children | 138 (2.0%) | 122 (8.8%) |
| 1 or 2 Children | 88 (2.8%) | 217 (14.0%) |
| 3 or 4 Children | 42 (8.1%) | 55 (24.5%) |
| 5 or more Children | 13 (18.3%) | 0 (0.0%) |
| Total | 281 (2.7%) | 394 (12.4%) |
Race in Portland
The most populous races in Portland are White / Caucasian (56,347 | 82.5%), Black / African American (5,888 | 8.6%), and Two or more Races (2,794 | 4.1%).
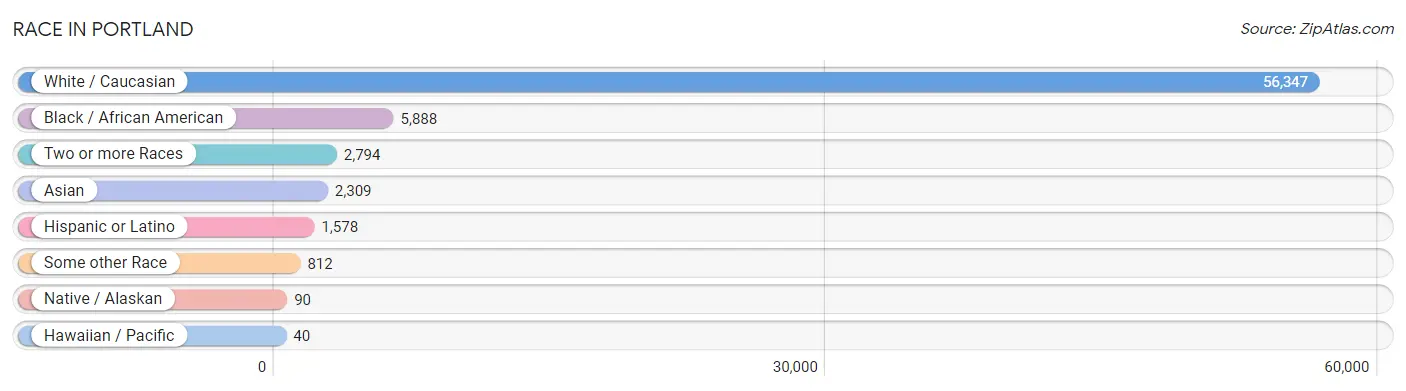
| Race | # Population | % Population |
| Asian | 2,309 | 3.4% |
| Black / African American | 5,888 | 8.6% |
| Hawaiian / Pacific | 40 | 0.1% |
| Hispanic or Latino | 1,578 | 2.3% |
| Native / Alaskan | 90 | 0.1% |
| White / Caucasian | 56,347 | 82.5% |
| Two or more Races | 2,794 | 4.1% |
| Some other Race | 812 | 1.2% |
| Total | 68,280 | 100.0% |
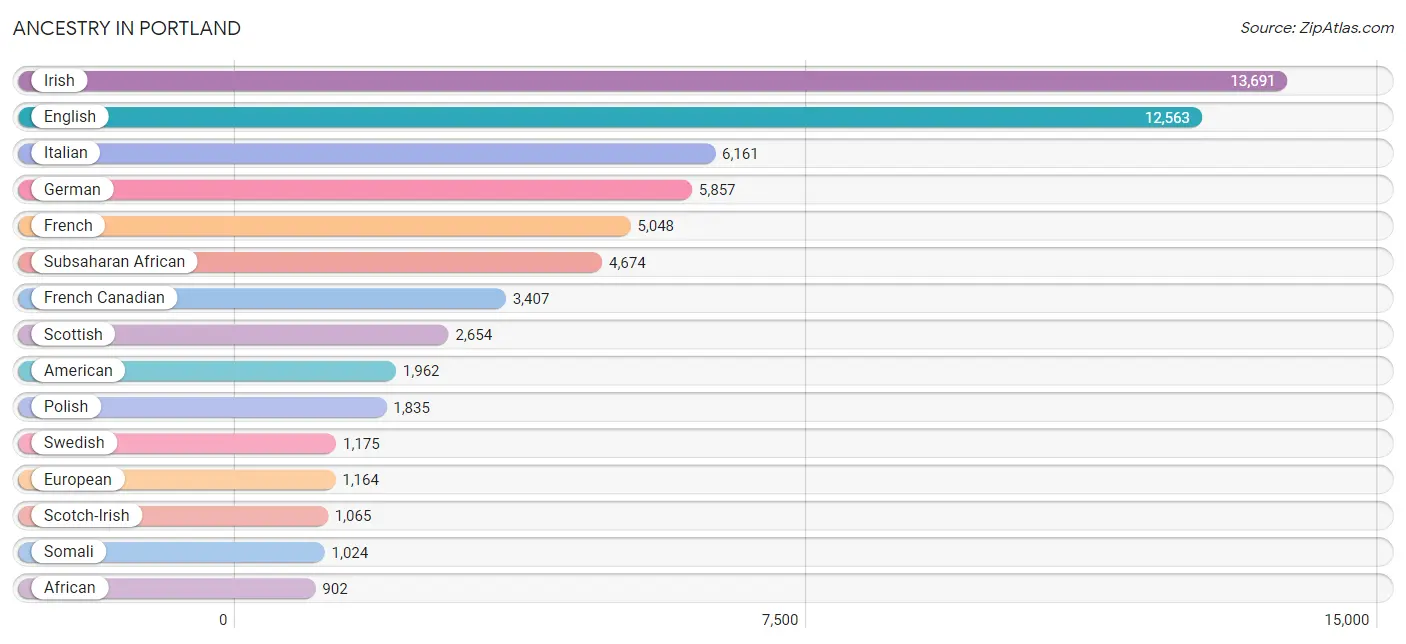
Ancestry in Portland
The most populous ancestries reported in Portland are Irish (13,691 | 20.1%), English (12,563 | 18.4%), Italian (6,161 | 9.0%), German (5,857 | 8.6%), and French (5,048 | 7.4%), together accounting for 63.4% of all Portland residents.
| Ancestry | # Population | % Population |
| African | 902 | 1.3% |
| Alaska Native | 3 | 0.0% |
| Albanian | 84 | 0.1% |
| Alsatian | 17 | 0.0% |
| American | 1,962 | 2.9% |
| Arab | 608 | 0.9% |
| Argentinean | 9 | 0.0% |
| Armenian | 75 | 0.1% |
| Australian | 96 | 0.1% |
| Austrian | 355 | 0.5% |
| Belgian | 96 | 0.1% |
| Bermudan | 32 | 0.1% |
| Bhutanese | 250 | 0.4% |
| Blackfeet | 11 | 0.0% |
| Brazilian | 104 | 0.2% |
| British | 565 | 0.8% |
| Bulgarian | 11 | 0.0% |
| Burmese | 127 | 0.2% |
| Cajun | 20 | 0.0% |
| Canadian | 400 | 0.6% |
| Cape Verdean | 12 | 0.0% |
| Carpatho Rusyn | 12 | 0.0% |
| Celtic | 33 | 0.1% |
| Central American | 273 | 0.4% |
| Central American Indian | 55 | 0.1% |
| Cherokee | 90 | 0.1% |
| Chippewa | 10 | 0.0% |
| Colombian | 69 | 0.1% |
| Cuban | 42 | 0.1% |
| Czech | 221 | 0.3% |
| Czechoslovakian | 10 | 0.0% |
| Danish | 334 | 0.5% |
| Dominican | 39 | 0.1% |
| Dutch | 417 | 0.6% |
| Eastern European | 435 | 0.6% |
| Ecuadorian | 25 | 0.0% |
| Egyptian | 16 | 0.0% |
| English | 12,563 | 18.4% |
| Estonian | 28 | 0.0% |
| Ethiopian | 163 | 0.2% |
| European | 1,164 | 1.7% |
| Filipino | 14 | 0.0% |
| Finnish | 172 | 0.3% |
| French | 5,048 | 7.4% |
| French American Indian | 44 | 0.1% |
| French Canadian | 3,407 | 5.0% |
| German | 5,857 | 8.6% |
| Greek | 519 | 0.8% |
| Guamanian / Chamorro | 14 | 0.0% |
| Guatemalan | 202 | 0.3% |
| Haitian | 89 | 0.1% |
| Honduran | 10 | 0.0% |
| Hungarian | 270 | 0.4% |
| Indian (Asian) | 718 | 1.1% |
| Inupiat | 23 | 0.0% |
| Iranian | 150 | 0.2% |
| Iraqi | 113 | 0.2% |
| Irish | 13,691 | 20.1% |
| Iroquois | 28 | 0.0% |
| Israeli | 19 | 0.0% |
| Italian | 6,161 | 9.0% |
| Jamaican | 56 | 0.1% |
| Japanese | 285 | 0.4% |
| Korean | 558 | 0.8% |
| Lebanese | 342 | 0.5% |
| Lithuanian | 438 | 0.6% |
| Luxembourger | 1 | 0.0% |
| Mexican | 310 | 0.4% |
| Mexican American Indian | 18 | 0.0% |
| Native Hawaiian | 33 | 0.1% |
| Nigerian | 23 | 0.0% |
| Northern European | 202 | 0.3% |
| Norwegian | 778 | 1.1% |
| Pakistani | 85 | 0.1% |
| Palestinian | 7 | 0.0% |
| Panamanian | 2 | 0.0% |
| Paraguayan | 4 | 0.0% |
| Pennsylvania German | 13 | 0.0% |
| Peruvian | 28 | 0.0% |
| Polish | 1,835 | 2.7% |
| Portuguese | 290 | 0.4% |
| Puerto Rican | 305 | 0.4% |
| Romanian | 155 | 0.2% |
| Russian | 825 | 1.2% |
| Salvadoran | 29 | 0.0% |
| Samoan | 8 | 0.0% |
| Scandinavian | 356 | 0.5% |
| Scotch-Irish | 1,065 | 1.6% |
| Scottish | 2,654 | 3.9% |
| Serbian | 24 | 0.0% |
| Slovak | 198 | 0.3% |
| Slovene | 14 | 0.0% |
| Somali | 1,024 | 1.5% |
| South African | 62 | 0.1% |
| South American | 170 | 0.3% |
| Spaniard | 233 | 0.3% |
| Spanish | 56 | 0.1% |
| Sri Lankan | 501 | 0.7% |
| Subsaharan African | 4,674 | 6.9% |
| Sudanese | 207 | 0.3% |
| Swedish | 1,175 | 1.7% |
| Swiss | 217 | 0.3% |
| Syrian | 107 | 0.2% |
| Thai | 299 | 0.4% |
| Trinidadian and Tobagonian | 20 | 0.0% |
| Turkish | 27 | 0.0% |
| U.S. Virgin Islander | 11 | 0.0% |
| Ugandan | 19 | 0.0% |
| Ukrainian | 340 | 0.5% |
| Venezuelan | 24 | 0.0% |
| Welsh | 577 | 0.9% |
| West Indian | 17 | 0.0% |
| Yugoslavian | 48 | 0.1% | View All 113 Rows |
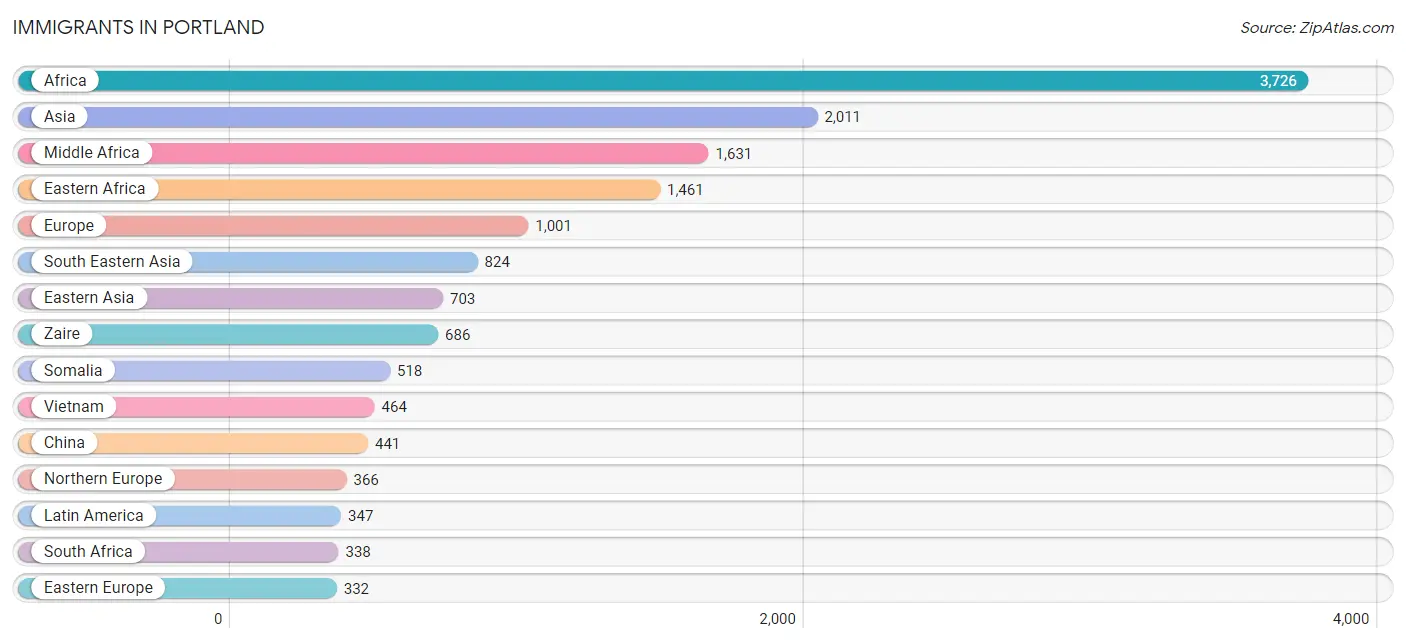
Immigrants in Portland
The most numerous immigrant groups reported in Portland came from Africa (3,726 | 5.5%), Asia (2,011 | 2.9%), Middle Africa (1,631 | 2.4%), Eastern Africa (1,461 | 2.1%), and Europe (1,001 | 1.5%), together accounting for 14.4% of all Portland residents.
| Immigration Origin | # Population | % Population |
| Africa | 3,726 | 5.5% |
| Albania | 59 | 0.1% |
| Argentina | 22 | 0.0% |
| Asia | 2,011 | 2.9% |
| Australia | 14 | 0.0% |
| Bangladesh | 11 | 0.0% |
| Bosnia and Herzegovina | 58 | 0.1% |
| Brazil | 62 | 0.1% |
| Bulgaria | 11 | 0.0% |
| Cabo Verde | 12 | 0.0% |
| Cambodia | 196 | 0.3% |
| Canada | 284 | 0.4% |
| Caribbean | 53 | 0.1% |
| Central America | 131 | 0.2% |
| Chile | 10 | 0.0% |
| China | 441 | 0.6% |
| Colombia | 13 | 0.0% |
| Congo | 240 | 0.4% |
| Denmark | 9 | 0.0% |
| Dominican Republic | 2 | 0.0% |
| Eastern Africa | 1,461 | 2.1% |
| Eastern Asia | 703 | 1.0% |
| Eastern Europe | 332 | 0.5% |
| Ecuador | 13 | 0.0% |
| El Salvador | 10 | 0.0% |
| England | 30 | 0.0% |
| Ethiopia | 35 | 0.1% |
| Europe | 1,001 | 1.5% |
| France | 49 | 0.1% |
| Germany | 89 | 0.1% |
| Guatemala | 21 | 0.0% |
| Haiti | 17 | 0.0% |
| Honduras | 34 | 0.1% |
| Hong Kong | 12 | 0.0% |
| India | 75 | 0.1% |
| Iran | 100 | 0.2% |
| Iraq | 104 | 0.2% |
| Ireland | 40 | 0.1% |
| Israel | 11 | 0.0% |
| Italy | 15 | 0.0% |
| Jamaica | 31 | 0.1% |
| Japan | 92 | 0.1% |
| Jordan | 1 | 0.0% |
| Kenya | 108 | 0.2% |
| Korea | 170 | 0.3% |
| Latin America | 347 | 0.5% |
| Lithuania | 11 | 0.0% |
| Mexico | 17 | 0.0% |
| Middle Africa | 1,631 | 2.4% |
| Morocco | 23 | 0.0% |
| Nepal | 34 | 0.1% |
| Netherlands | 26 | 0.0% |
| Nicaragua | 49 | 0.1% |
| Nigeria | 71 | 0.1% |
| Northern Africa | 138 | 0.2% |
| Northern Europe | 366 | 0.5% |
| Norway | 11 | 0.0% |
| Oceania | 45 | 0.1% |
| Pakistan | 12 | 0.0% |
| Peru | 43 | 0.1% |
| Philippines | 134 | 0.2% |
| Poland | 25 | 0.0% |
| Romania | 98 | 0.1% |
| Russia | 25 | 0.0% |
| Scotland | 63 | 0.1% |
| Singapore | 12 | 0.0% |
| Somalia | 518 | 0.8% |
| South Africa | 338 | 0.5% |
| South America | 163 | 0.2% |
| South Central Asia | 242 | 0.4% |
| South Eastern Asia | 824 | 1.2% |
| Southern Europe | 136 | 0.2% |
| Spain | 121 | 0.2% |
| Sudan | 115 | 0.2% |
| Switzerland | 3 | 0.0% |
| Syria | 84 | 0.1% |
| Taiwan | 10 | 0.0% |
| Thailand | 18 | 0.0% |
| Trinidad and Tobago | 3 | 0.0% |
| Turkey | 35 | 0.1% |
| Uganda | 19 | 0.0% |
| Ukraine | 31 | 0.1% |
| Vietnam | 464 | 0.7% |
| Western Africa | 158 | 0.2% |
| Western Asia | 235 | 0.3% |
| Western Europe | 167 | 0.2% |
| Zaire | 686 | 1.0% | View All 87 Rows |
Sex and Age in Portland
Sex and Age in Portland
The most populous age groups in Portland are 25 to 29 Years (3,961 | 12.0%) for men and 25 to 29 Years (3,980 | 11.3%) for women.

| Age Bracket | Male | Female |
| Under 5 Years | 1,548 (4.7%) | 1,310 (3.7%) |
| 5 to 9 Years | 1,371 (4.2%) | 1,490 (4.2%) |
| 10 to 14 Years | 1,351 (4.1%) | 1,507 (4.3%) |
| 15 to 19 Years | 1,316 (4.0%) | 1,100 (3.1%) |
| 20 to 24 Years | 2,547 (7.7%) | 2,842 (8.1%) |
| 25 to 29 Years | 3,961 (12.0%) | 3,980 (11.3%) |
| 30 to 34 Years | 3,164 (9.6%) | 3,394 (9.6%) |
| 35 to 39 Years | 2,971 (9.0%) | 2,901 (8.2%) |
| 40 to 44 Years | 1,894 (5.7%) | 1,711 (4.9%) |
| 45 to 49 Years | 2,021 (6.1%) | 2,038 (5.8%) |
| 50 to 54 Years | 1,942 (5.9%) | 1,861 (5.3%) |
| 55 to 59 Years | 2,208 (6.7%) | 2,433 (6.9%) |
| 60 to 64 Years | 1,802 (5.4%) | 2,113 (6.0%) |
| 65 to 69 Years | 1,913 (5.8%) | 1,931 (5.5%) |
| 70 to 74 Years | 1,308 (4.0%) | 1,264 (3.6%) |
| 75 to 79 Years | 739 (2.2%) | 1,318 (3.7%) |
| 80 to 84 Years | 456 (1.4%) | 662 (1.9%) |
| 85 Years and over | 543 (1.6%) | 1,370 (3.9%) |
| Total | 33,055 (100.0%) | 35,225 (100.0%) |
Families and Households in Portland
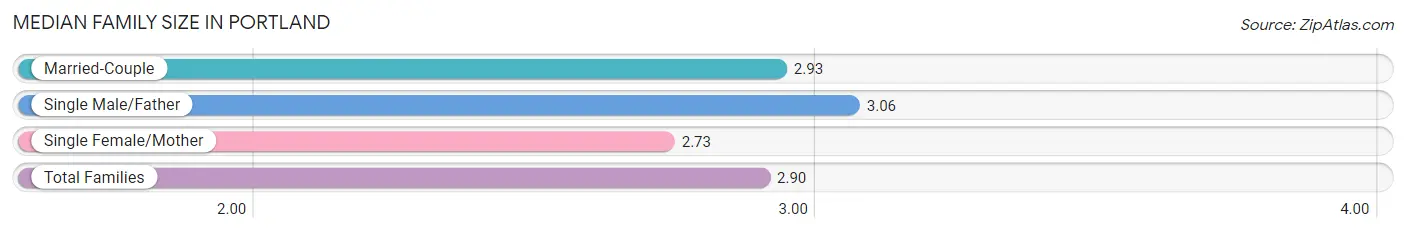
Median Family Size in Portland
The median family size in Portland is 2.90 persons per family, with single male/father families (805 | 5.9%) accounting for the largest median family size of 3.06 persons per family. On the other hand, single female/mother families (2,367 | 17.3%) represent the smallest median family size with 2.73 persons per family.
| Family Type | # Families | Family Size |
| Married-Couple | 10,516 (76.8%) | 2.93 |
| Single Male/Father | 805 (5.9%) | 3.06 |
| Single Female/Mother | 2,367 (17.3%) | 2.73 |
| Total Families | 13,688 (100.0%) | 2.90 |
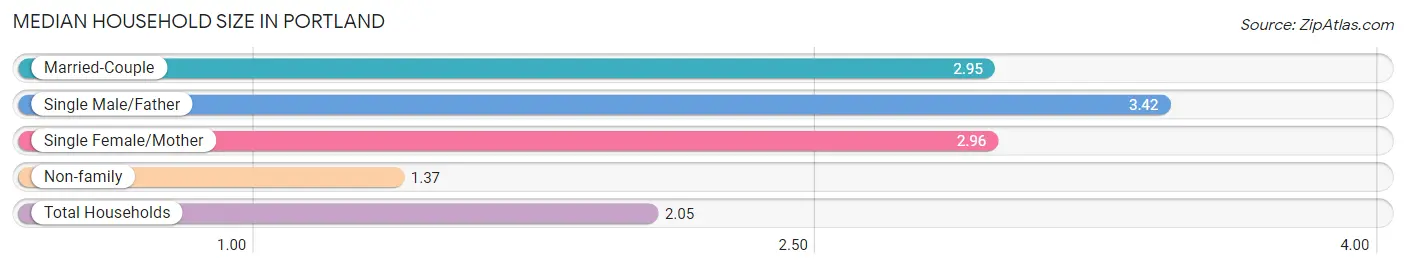
Median Household Size in Portland
The median household size in Portland is 2.05 persons per household, with single male/father households (805 | 2.5%) accounting for the largest median household size of 3.42 persons per household. non-family households (18,565 | 57.6%) represent the smallest median household size with 1.37 persons per household.
| Household Type | # Households | Household Size |
| Married-Couple | 10,516 (32.6%) | 2.95 |
| Single Male/Father | 805 (2.5%) | 3.42 |
| Single Female/Mother | 2,367 (7.3%) | 2.96 |
| Non-family | 18,565 (57.6%) | 1.37 |
| Total Households | 32,253 (100.0%) | 2.05 |
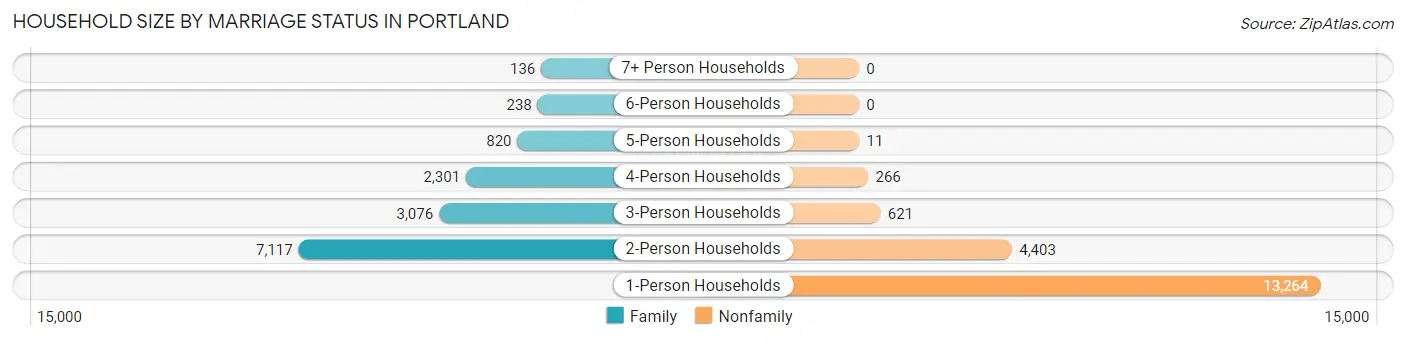
Household Size by Marriage Status in Portland
Out of a total of 32,253 households in Portland, 13,688 (42.4%) are family households, while 18,565 (57.6%) are nonfamily households. The most numerous type of family households are 2-person households, comprising 7,117, and the most common type of nonfamily households are 1-person households, comprising 13,264.
| Household Size | Family Households | Nonfamily Households |
| 1-Person Households | - | 13,264 (41.1%) |
| 2-Person Households | 7,117 (22.1%) | 4,403 (13.7%) |
| 3-Person Households | 3,076 (9.5%) | 621 (1.9%) |
| 4-Person Households | 2,301 (7.1%) | 266 (0.8%) |
| 5-Person Households | 820 (2.5%) | 11 (0.0%) |
| 6-Person Households | 238 (0.7%) | 0 (0.0%) |
| 7+ Person Households | 136 (0.4%) | 0 (0.0%) |
| Total | 13,688 (42.4%) | 18,565 (57.6%) |
Female Fertility in Portland
Fertility by Age in Portland
Average fertility rate in Portland is 43.0 births per 1,000 women. Women in the age bracket of 20 to 34 years have the highest fertility rate with 56.0 births per 1,000 women. Women in the age bracket of 20 to 34 years acount for 72.3% of all women with births.
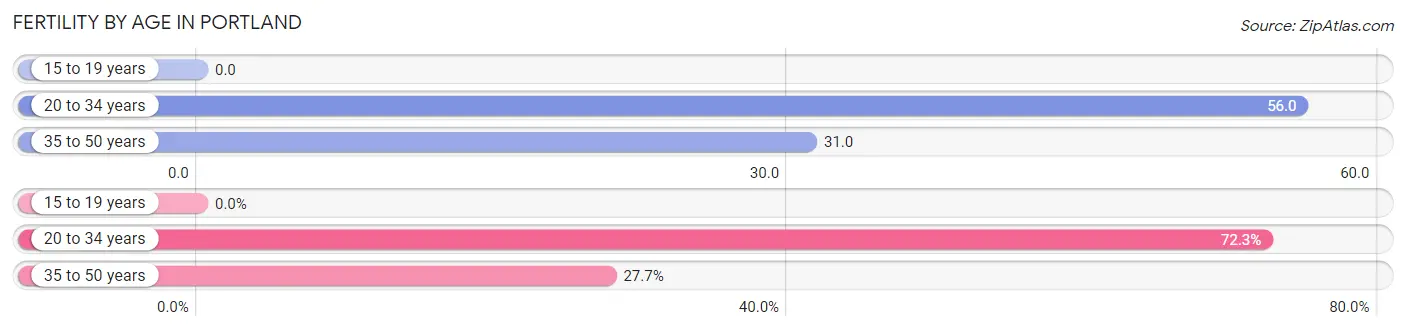
| Age Bracket | Women with Births | Births / 1,000 Women |
| 15 to 19 years | 0 (0.0%) | 0.0 |
| 20 to 34 years | 571 (72.3%) | 56.0 |
| 35 to 50 years | 219 (27.7%) | 31.0 |
| Total | 790 (100.0%) | 43.0 |
Fertility by Age by Marriage Status in Portland
74.4% of women with births (790) in Portland are married. The highest percentage of unmarried women with births falls into 35 to 50 years age bracket with 29.2% of them unmarried at the time of birth, while the lowest percentage of unmarried women with births belong to 20 to 34 years age bracket with 24.2% of them unmarried.
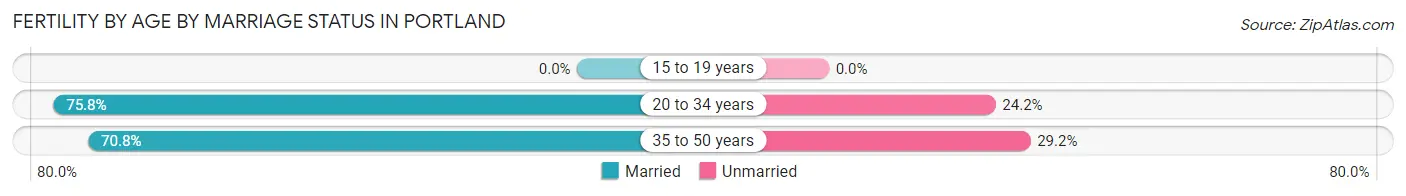
| Age Bracket | Married | Unmarried |
| 15 to 19 years | 0 (0.0%) | 0 (0.0%) |
| 20 to 34 years | 433 (75.8%) | 138 (24.2%) |
| 35 to 50 years | 155 (70.8%) | 64 (29.2%) |
| Total | 588 (74.4%) | 202 (25.6%) |
Fertility by Education in Portland
Average fertility rate in Portland is 43.0 births per 1,000 women. Women with the education attainment of high school diploma have the highest fertility rate of 71.0 births per 1,000 women, while women with the education attainment of less than high school have the lowest fertility at 13.0 births per 1,000 women. Women with the education attainment of bachelor's degree represent 41.1% of all women with births.
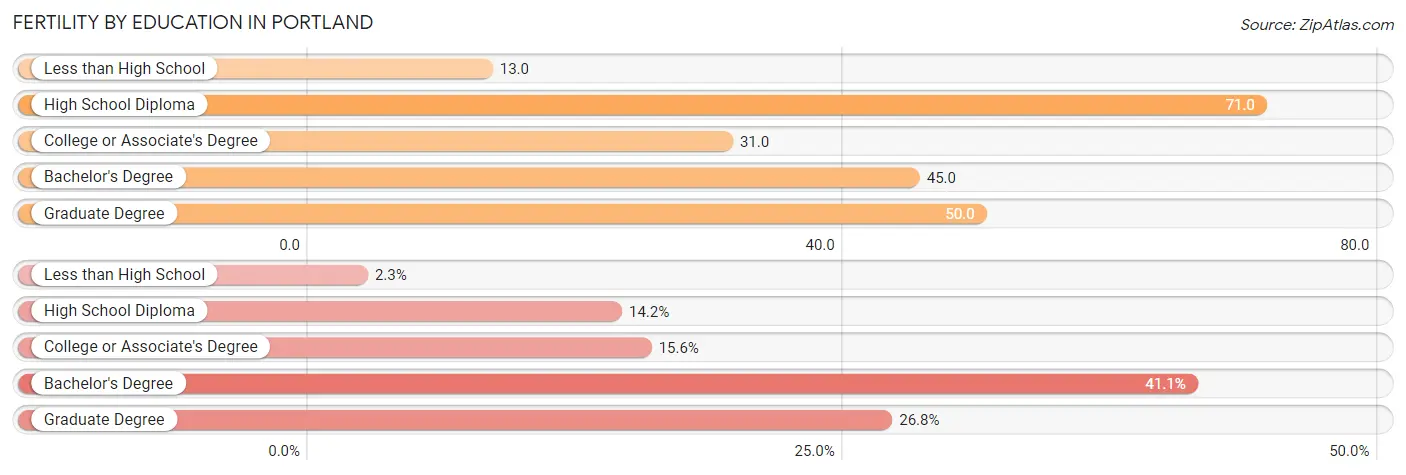
| Educational Attainment | Women with Births | Births / 1,000 Women |
| Less than High School | 18 (2.3%) | 13.0 |
| High School Diploma | 112 (14.2%) | 71.0 |
| College or Associate's Degree | 123 (15.6%) | 31.0 |
| Bachelor's Degree | 325 (41.1%) | 45.0 |
| Graduate Degree | 212 (26.8%) | 50.0 |
| Total | 790 (100.0%) | 43.0 |
Fertility by Education by Marriage Status in Portland
25.6% of women with births in Portland are unmarried. Women with the educational attainment of graduate degree are most likely to be married with 95.8% of them married at childbirth, while women with the educational attainment of less than high school are least likely to be married with 55.6% of them unmarried at childbirth.
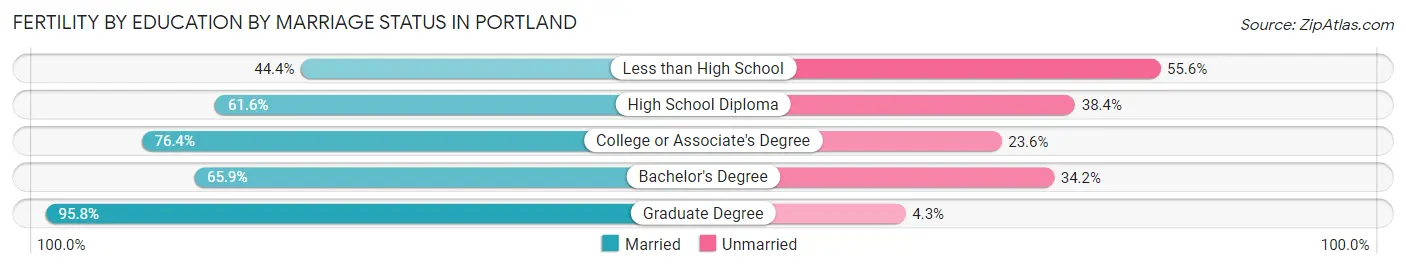
| Educational Attainment | Married | Unmarried |
| Less than High School | 8 (44.4%) | 10 (55.6%) |
| High School Diploma | 69 (61.6%) | 43 (38.4%) |
| College or Associate's Degree | 94 (76.4%) | 29 (23.6%) |
| Bachelor's Degree | 214 (65.8%) | 111 (34.2%) |
| Graduate Degree | 203 (95.8%) | 9 (4.3%) |
| Total | 588 (74.4%) | 202 (25.6%) |
Employment Characteristics in Portland
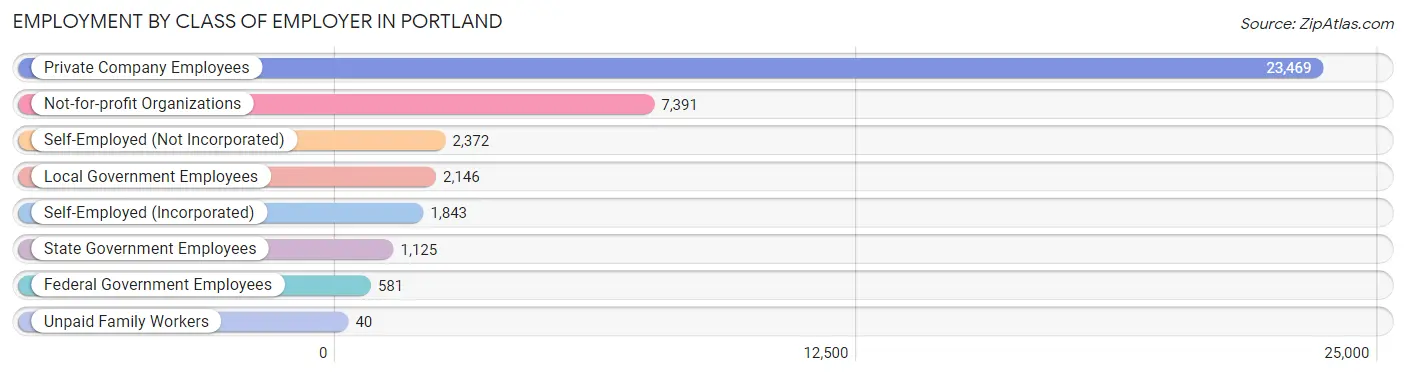
Employment by Class of Employer in Portland
Among the 38,967 employed individuals in Portland, private company employees (23,469 | 60.2%), not-for-profit organizations (7,391 | 19.0%), and self-employed (not incorporated) (2,372 | 6.1%) make up the most common classes of employment.
| Employer Class | # Employees | % Employees |
| Private Company Employees | 23,469 | 60.2% |
| Self-Employed (Incorporated) | 1,843 | 4.7% |
| Self-Employed (Not Incorporated) | 2,372 | 6.1% |
| Not-for-profit Organizations | 7,391 | 19.0% |
| Local Government Employees | 2,146 | 5.5% |
| State Government Employees | 1,125 | 2.9% |
| Federal Government Employees | 581 | 1.5% |
| Unpaid Family Workers | 40 | 0.1% |
| Total | 38,967 | 100.0% |
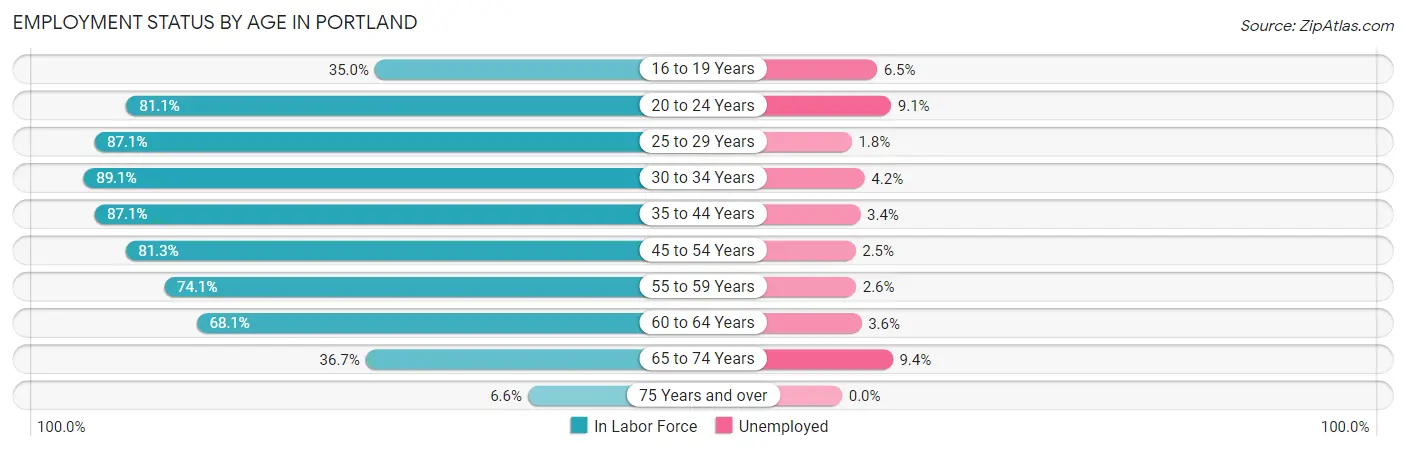
Employment Status by Age in Portland
According to the labor force statistics for Portland, out of the total population over 16 years of age (59,223), 69.7% or 41,278 individuals are in the labor force, with 4.0% or 1,651 of them unemployed. The age group with the highest labor force participation rate is 30 to 34 years, with 89.1% or 5,843 individuals in the labor force. Within the labor force, the 65 to 74 years age range has the highest percentage of unemployed individuals, with 9.4% or 221 of them being unemployed.
| Age Bracket | In Labor Force | Unemployed |
| 16 to 19 Years | 678 (35.0%) | 44 (6.5%) |
| 20 to 24 Years | 4,370 (81.1%) | 398 (9.1%) |
| 25 to 29 Years | 6,917 (87.1%) | 125 (1.8%) |
| 30 to 34 Years | 5,843 (89.1%) | 245 (4.2%) |
| 35 to 44 Years | 8,254 (87.1%) | 281 (3.4%) |
| 45 to 54 Years | 6,392 (81.3%) | 160 (2.5%) |
| 55 to 59 Years | 3,439 (74.1%) | 89 (2.6%) |
| 60 to 64 Years | 2,666 (68.1%) | 96 (3.6%) |
| 65 to 74 Years | 2,355 (36.7%) | 221 (9.4%) |
| 75 Years and over | 336 (6.6%) | 0 (0.0%) |
| Total | 41,278 (69.7%) | 1,651 (4.0%) |
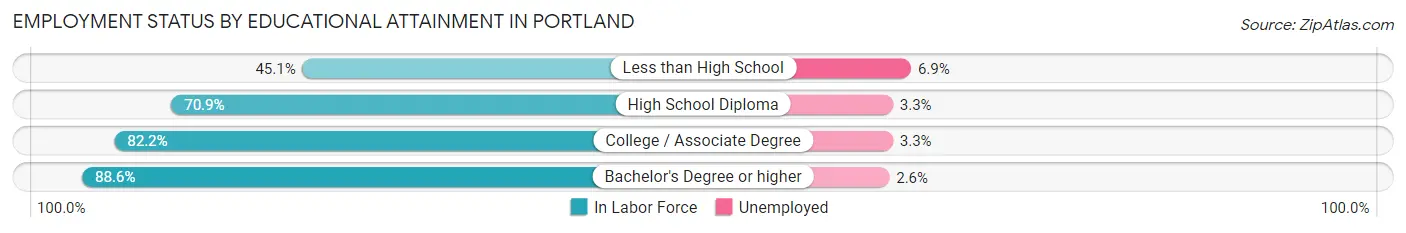
Employment Status by Educational Attainment in Portland
According to labor force statistics for Portland, 83.0% of individuals (33,527) out of the total population between 25 and 64 years of age (40,394) are in the labor force, with 3.0% or 1,006 of them being unemployed. The group with the highest labor force participation rate are those with the educational attainment of bachelor's degree or higher, with 88.6% or 21,637 individuals in the labor force. Within the labor force, individuals with less than high school education have the highest percentage of unemployment, with 6.9% or 56 of them being unemployed.
| Educational Attainment | In Labor Force | Unemployed |
| Less than High School | 812 (45.1%) | 124 (6.9%) |
| High School Diploma | 3,656 (70.9%) | 170 (3.3%) |
| College / Associate Degree | 7,410 (82.2%) | 297 (3.3%) |
| Bachelor's Degree or higher | 21,637 (88.6%) | 635 (2.6%) |
| Total | 33,527 (83.0%) | 1,212 (3.0%) |
Employment Occupations by Sex in Portland
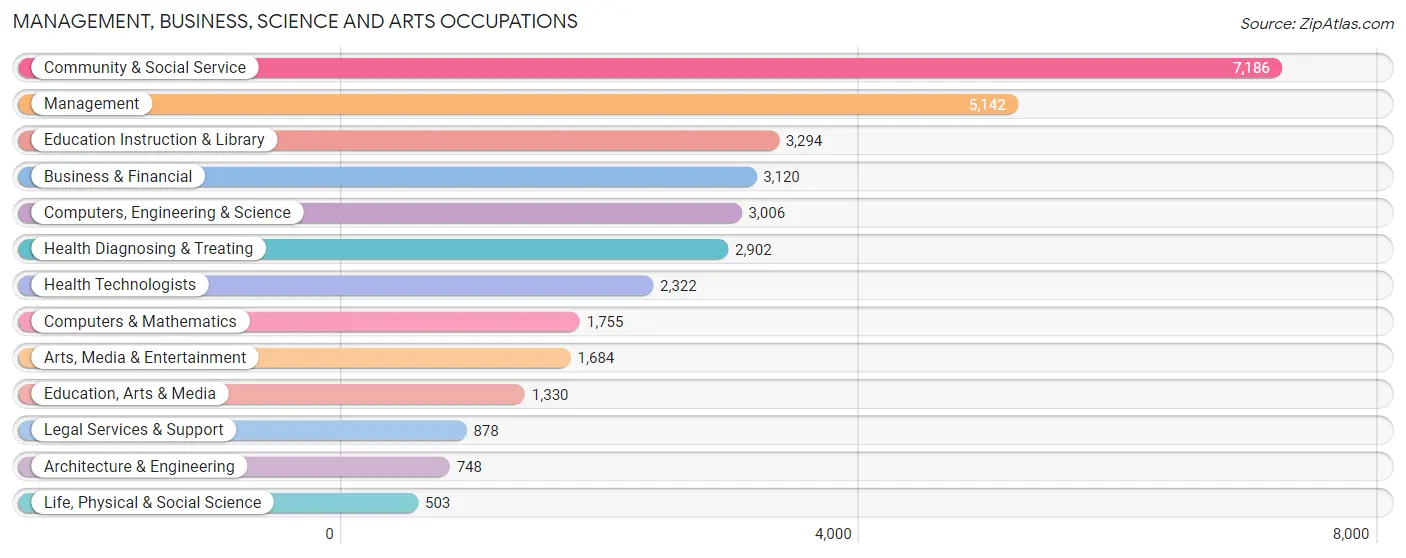
Management, Business, Science and Arts Occupations
The most common Management, Business, Science and Arts occupations in Portland are Community & Social Service (7,186 | 18.2%), Management (5,142 | 13.0%), Education Instruction & Library (3,294 | 8.3%), Business & Financial (3,120 | 7.9%), and Computers, Engineering & Science (3,006 | 7.6%).
Management, Business, Science and Arts Occupations by Sex
Within the Management, Business, Science and Arts occupations in Portland, the most male-oriented occupations are Computers & Mathematics (78.2%), Architecture & Engineering (73.1%), and Computers, Engineering & Science (70.0%), while the most female-oriented occupations are Health Diagnosing & Treating (72.1%), Health Technologists (70.8%), and Education Instruction & Library (68.3%).
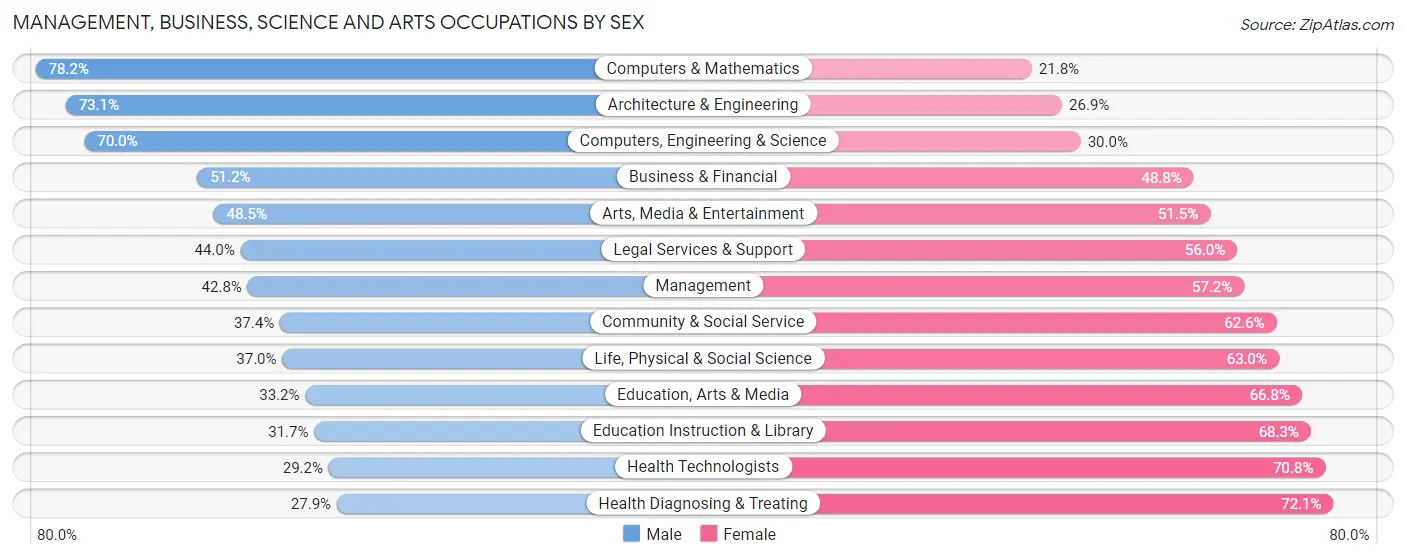
| Occupation | Male | Female |
| Management | 2,200 (42.8%) | 2,942 (57.2%) |
| Business & Financial | 1,597 (51.2%) | 1,523 (48.8%) |
| Computers, Engineering & Science | 2,105 (70.0%) | 901 (30.0%) |
| Computers & Mathematics | 1,372 (78.2%) | 383 (21.8%) |
| Architecture & Engineering | 547 (73.1%) | 201 (26.9%) |
| Life, Physical & Social Science | 186 (37.0%) | 317 (63.0%) |
| Community & Social Service | 2,686 (37.4%) | 4,500 (62.6%) |
| Education, Arts & Media | 441 (33.2%) | 889 (66.8%) |
| Legal Services & Support | 386 (44.0%) | 492 (56.0%) |
| Education Instruction & Library | 1,043 (31.7%) | 2,251 (68.3%) |
| Arts, Media & Entertainment | 816 (48.5%) | 868 (51.5%) |
| Health Diagnosing & Treating | 809 (27.9%) | 2,093 (72.1%) |
| Health Technologists | 679 (29.2%) | 1,643 (70.8%) |
| Total (Category) | 9,397 (44.0%) | 11,959 (56.0%) |
| Total (Overall) | 19,214 (48.6%) | 20,288 (51.4%) |
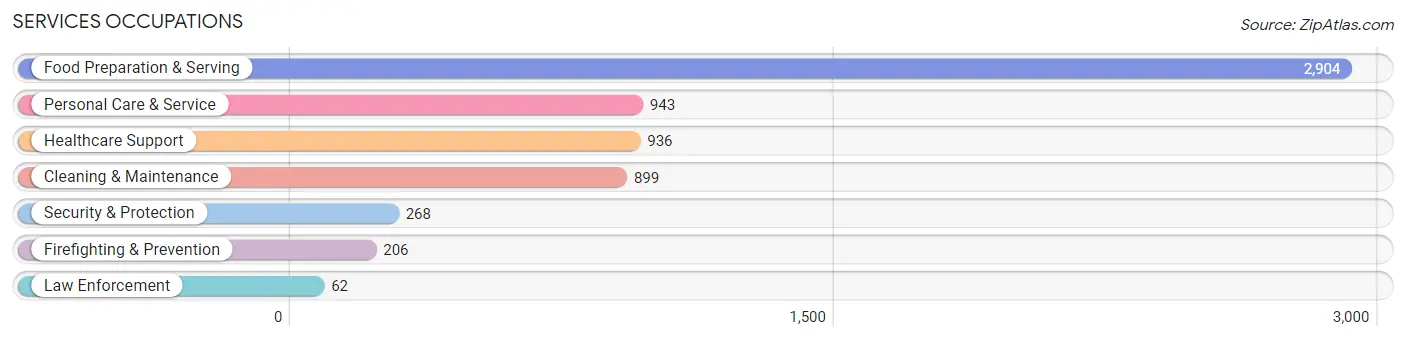
Services Occupations
The most common Services occupations in Portland are Food Preparation & Serving (2,904 | 7.3%), Personal Care & Service (943 | 2.4%), Healthcare Support (936 | 2.4%), Cleaning & Maintenance (899 | 2.3%), and Security & Protection (268 | 0.7%).
Services Occupations by Sex
Within the Services occupations in Portland, the most male-oriented occupations are Law Enforcement (85.5%), Security & Protection (85.5%), and Firefighting & Prevention (85.4%), while the most female-oriented occupations are Healthcare Support (76.9%), Personal Care & Service (71.4%), and Cleaning & Maintenance (70.5%).
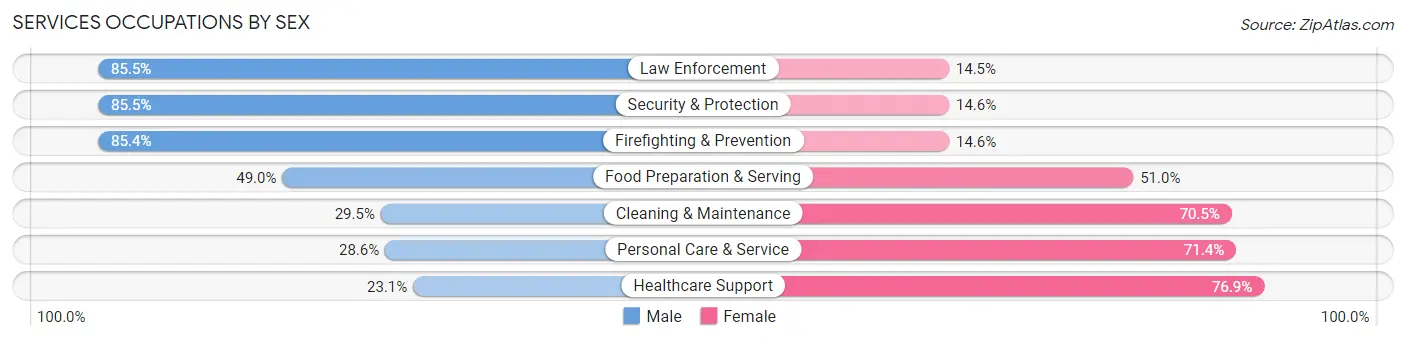
| Occupation | Male | Female |
| Healthcare Support | 216 (23.1%) | 720 (76.9%) |
| Security & Protection | 229 (85.5%) | 39 (14.5%) |
| Firefighting & Prevention | 176 (85.4%) | 30 (14.6%) |
| Law Enforcement | 53 (85.5%) | 9 (14.5%) |
| Food Preparation & Serving | 1,422 (49.0%) | 1,482 (51.0%) |
| Cleaning & Maintenance | 265 (29.5%) | 634 (70.5%) |
| Personal Care & Service | 270 (28.6%) | 673 (71.4%) |
| Total (Category) | 2,402 (40.4%) | 3,548 (59.6%) |
| Total (Overall) | 19,214 (48.6%) | 20,288 (51.4%) |
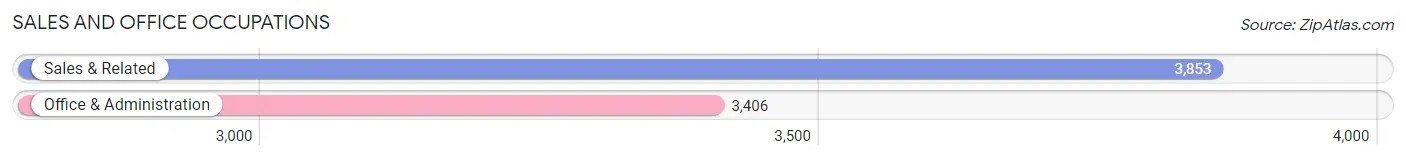
Sales and Office Occupations
The most common Sales and Office occupations in Portland are Sales & Related (3,853 | 9.8%), and Office & Administration (3,406 | 8.6%).
Sales and Office Occupations by Sex
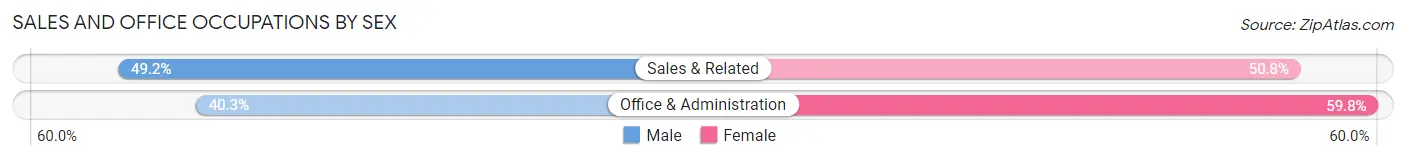
| Occupation | Male | Female |
| Sales & Related | 1,896 (49.2%) | 1,957 (50.8%) |
| Office & Administration | 1,371 (40.3%) | 2,035 (59.8%) |
| Total (Category) | 3,267 (45.0%) | 3,992 (55.0%) |
| Total (Overall) | 19,214 (48.6%) | 20,288 (51.4%) |
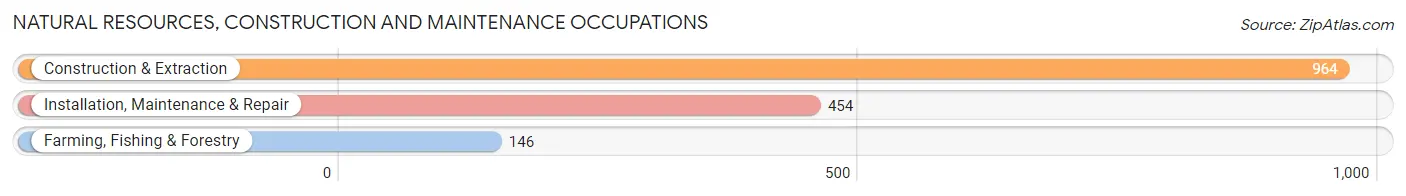
Natural Resources, Construction and Maintenance Occupations
The most common Natural Resources, Construction and Maintenance occupations in Portland are Construction & Extraction (964 | 2.4%), Installation, Maintenance & Repair (454 | 1.1%), and Farming, Fishing & Forestry (146 | 0.4%).
Natural Resources, Construction and Maintenance Occupations by Sex
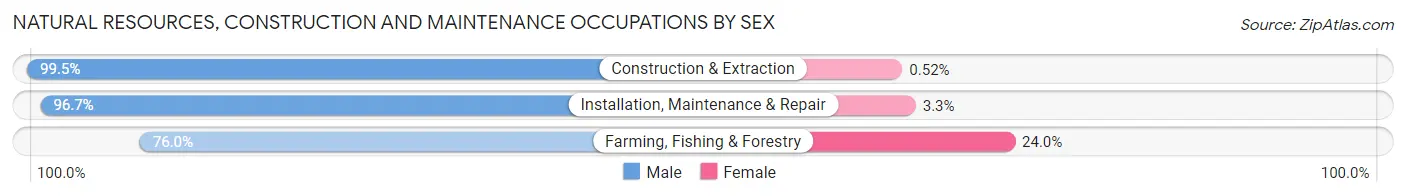
| Occupation | Male | Female |
| Farming, Fishing & Forestry | 111 (76.0%) | 35 (24.0%) |
| Construction & Extraction | 959 (99.5%) | 5 (0.5%) |
| Installation, Maintenance & Repair | 439 (96.7%) | 15 (3.3%) |
| Total (Category) | 1,509 (96.5%) | 55 (3.5%) |
| Total (Overall) | 19,214 (48.6%) | 20,288 (51.4%) |
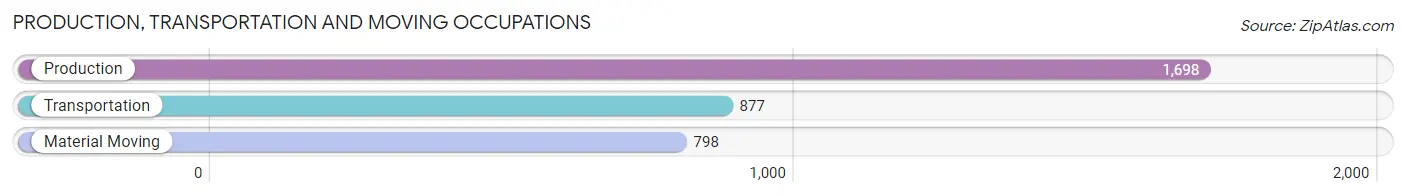
Production, Transportation and Moving Occupations
The most common Production, Transportation and Moving occupations in Portland are Production (1,698 | 4.3%), Transportation (877 | 2.2%), and Material Moving (798 | 2.0%).
Production, Transportation and Moving Occupations by Sex
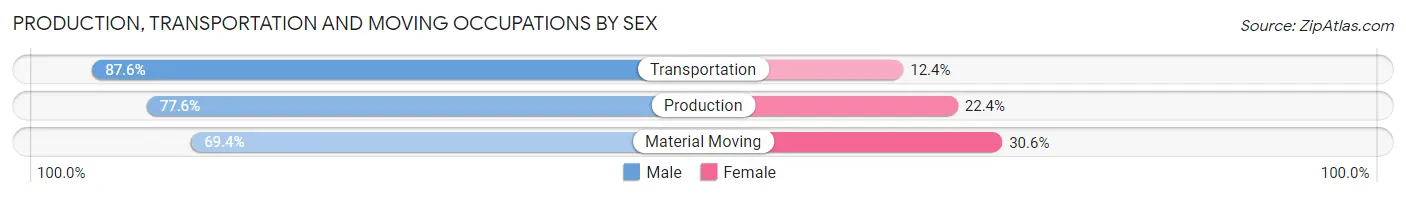
| Occupation | Male | Female |
| Production | 1,317 (77.6%) | 381 (22.4%) |
| Transportation | 768 (87.6%) | 109 (12.4%) |
| Material Moving | 554 (69.4%) | 244 (30.6%) |
| Total (Category) | 2,639 (78.2%) | 734 (21.8%) |
| Total (Overall) | 19,214 (48.6%) | 20,288 (51.4%) |
Employment Industries by Sex in Portland
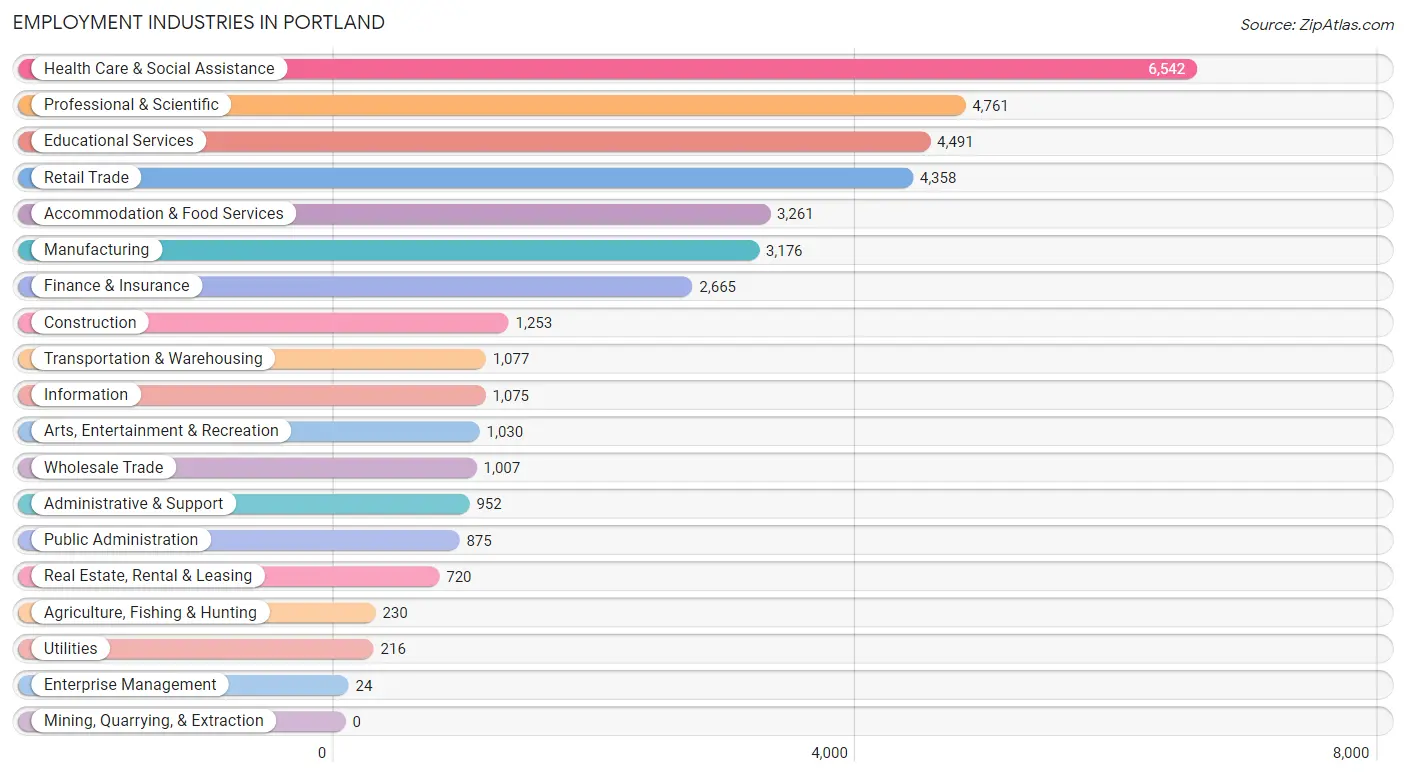
Employment Industries in Portland
The major employment industries in Portland include Health Care & Social Assistance (6,542 | 16.6%), Professional & Scientific (4,761 | 12.0%), Educational Services (4,491 | 11.4%), Retail Trade (4,358 | 11.0%), and Accommodation & Food Services (3,261 | 8.3%).
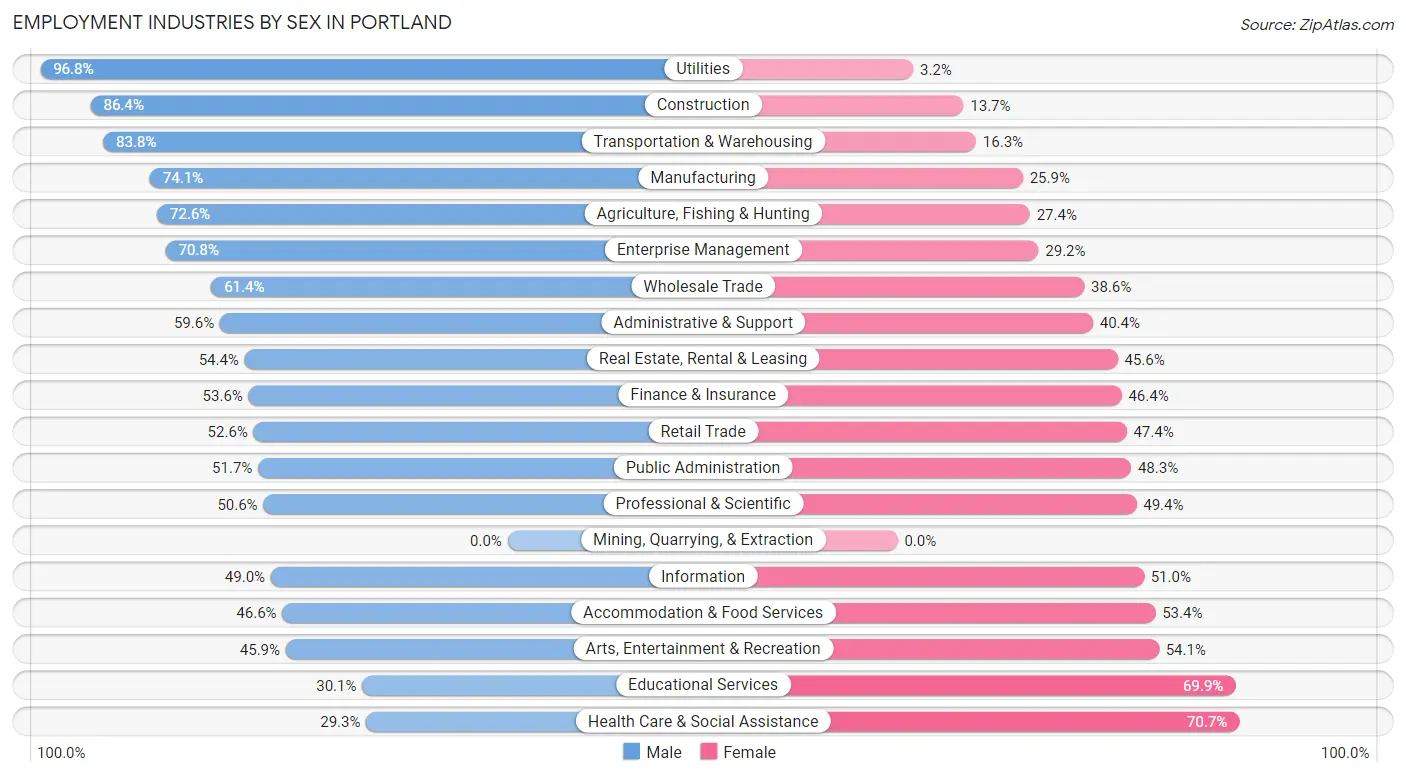
Employment Industries by Sex in Portland
The Portland industries that see more men than women are Utilities (96.8%), Construction (86.4%), and Transportation & Warehousing (83.8%), whereas the industries that tend to have a higher number of women are Health Care & Social Assistance (70.7%), Educational Services (69.9%), and Arts, Entertainment & Recreation (54.1%).
| Industry | Male | Female |
| Agriculture, Fishing & Hunting | 167 (72.6%) | 63 (27.4%) |
| Mining, Quarrying, & Extraction | 0 (0.0%) | 0 (0.0%) |
| Construction | 1,082 (86.4%) | 171 (13.7%) |
| Manufacturing | 2,352 (74.1%) | 824 (25.9%) |
| Wholesale Trade | 618 (61.4%) | 389 (38.6%) |
| Retail Trade | 2,292 (52.6%) | 2,066 (47.4%) |
| Transportation & Warehousing | 902 (83.8%) | 175 (16.3%) |
| Utilities | 209 (96.8%) | 7 (3.2%) |
| Information | 527 (49.0%) | 548 (51.0%) |
| Finance & Insurance | 1,429 (53.6%) | 1,236 (46.4%) |
| Real Estate, Rental & Leasing | 392 (54.4%) | 328 (45.6%) |
| Professional & Scientific | 2,407 (50.6%) | 2,354 (49.4%) |
| Enterprise Management | 17 (70.8%) | 7 (29.2%) |
| Administrative & Support | 567 (59.6%) | 385 (40.4%) |
| Educational Services | 1,352 (30.1%) | 3,139 (69.9%) |
| Health Care & Social Assistance | 1,915 (29.3%) | 4,627 (70.7%) |
| Arts, Entertainment & Recreation | 473 (45.9%) | 557 (54.1%) |
| Accommodation & Food Services | 1,521 (46.6%) | 1,740 (53.4%) |
| Public Administration | 452 (51.7%) | 423 (48.3%) |
| Total | 19,214 (48.6%) | 20,288 (51.4%) |
Education in Portland
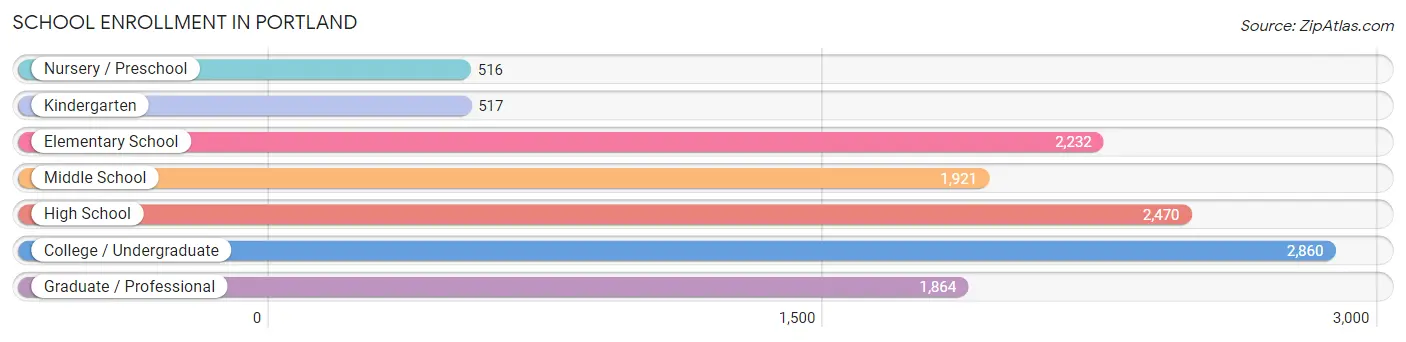
School Enrollment in Portland
The most common levels of schooling among the 12,380 students in Portland are college / undergraduate (2,860 | 23.1%), high school (2,470 | 20.0%), and elementary school (2,232 | 18.0%).
| School Level | # Students | % Students |
| Nursery / Preschool | 516 | 4.2% |
| Kindergarten | 517 | 4.2% |
| Elementary School | 2,232 | 18.0% |
| Middle School | 1,921 | 15.5% |
| High School | 2,470 | 20.0% |
| College / Undergraduate | 2,860 | 23.1% |
| Graduate / Professional | 1,864 | 15.1% |
| Total | 12,380 | 100.0% |
School Enrollment by Age by Funding Source in Portland
Out of a total of 12,380 students who are enrolled in schools in Portland, 2,922 (23.6%) attend a private institution, while the remaining 9,458 (76.4%) are enrolled in public schools. The age group of 3 to 4 year olds has the highest likelihood of being enrolled in private schools, with 226 (50.1% in the age bracket) enrolled. Conversely, the age group of 5 to 9 year old has the lowest likelihood of being enrolled in a private school, with 2,343 (90.7% in the age bracket) attending a public institution.
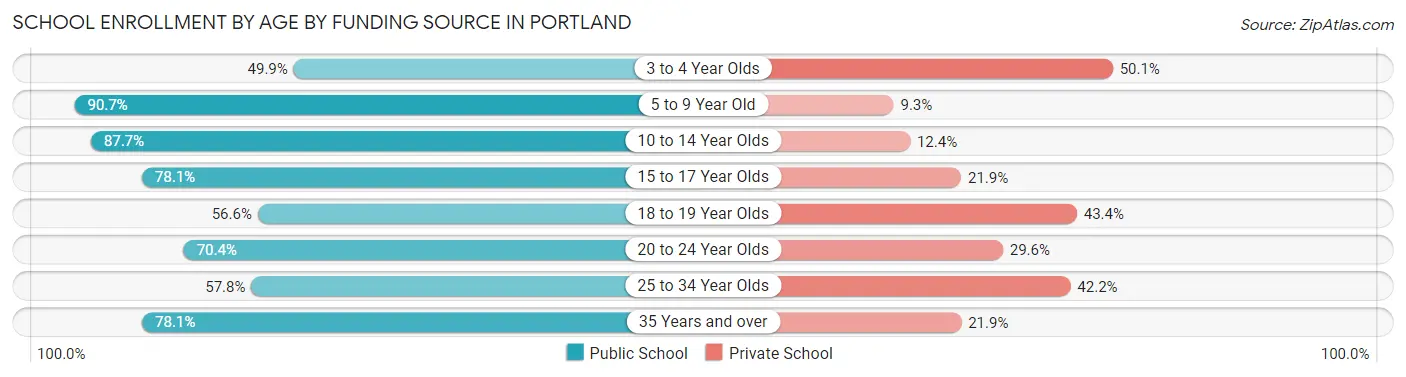
| Age Bracket | Public School | Private School |
| 3 to 4 Year Olds | 225 (49.9%) | 226 (50.1%) |
| 5 to 9 Year Old | 2,343 (90.7%) | 240 (9.3%) |
| 10 to 14 Year Olds | 2,405 (87.6%) | 339 (12.3%) |
| 15 to 17 Year Olds | 1,051 (78.1%) | 294 (21.9%) |
| 18 to 19 Year Olds | 400 (56.6%) | 307 (43.4%) |
| 20 to 24 Year Olds | 1,244 (70.4%) | 524 (29.6%) |
| 25 to 34 Year Olds | 1,085 (57.8%) | 793 (42.2%) |
| 35 Years and over | 706 (78.1%) | 198 (21.9%) |
| Total | 9,458 (76.4%) | 2,922 (23.6%) |
Educational Attainment by Field of Study in Portland
Social sciences (4,371 | 13.4%), business (3,655 | 11.2%), literature & languages (3,324 | 10.2%), visual & performing arts (2,933 | 9.0%), and liberal arts & history (2,641 | 8.1%) are the most common fields of study among 32,688 individuals in Portland who have obtained a bachelor's degree or higher.
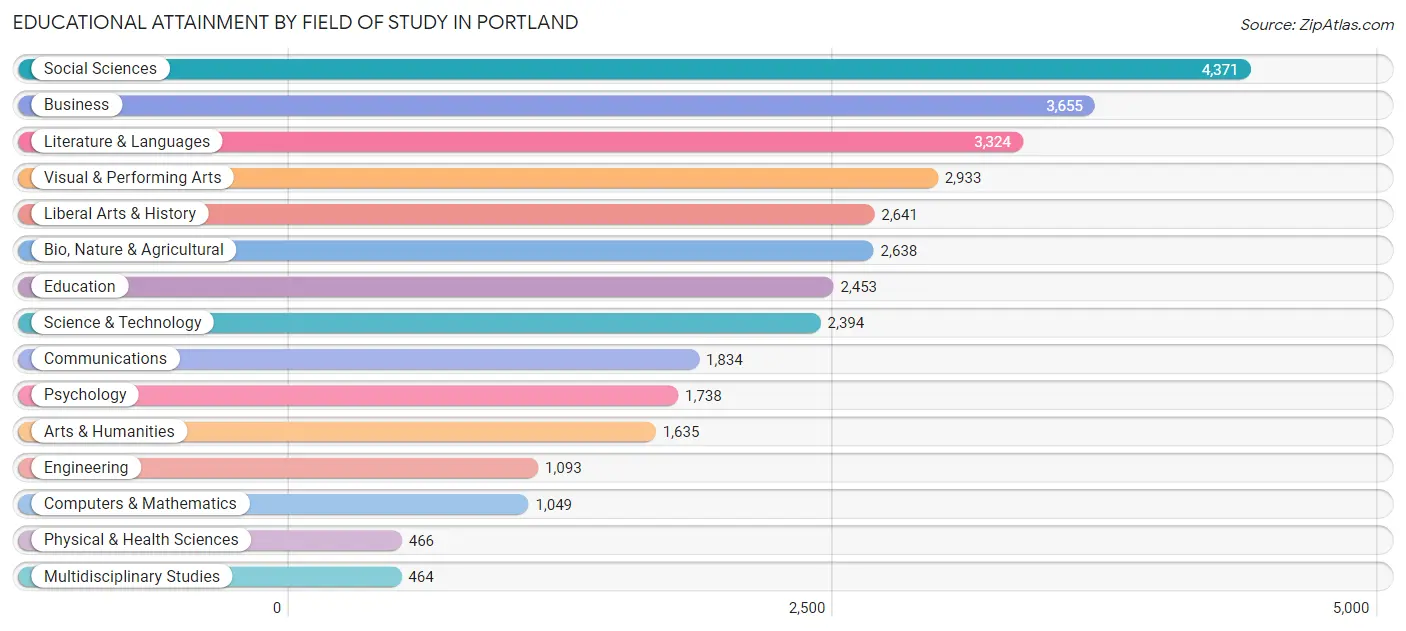
| Field of Study | # Graduates | % Graduates |
| Computers & Mathematics | 1,049 | 3.2% |
| Bio, Nature & Agricultural | 2,638 | 8.1% |
| Physical & Health Sciences | 466 | 1.4% |
| Psychology | 1,738 | 5.3% |
| Social Sciences | 4,371 | 13.4% |
| Engineering | 1,093 | 3.3% |
| Multidisciplinary Studies | 464 | 1.4% |
| Science & Technology | 2,394 | 7.3% |
| Business | 3,655 | 11.2% |
| Education | 2,453 | 7.5% |
| Literature & Languages | 3,324 | 10.2% |
| Liberal Arts & History | 2,641 | 8.1% |
| Visual & Performing Arts | 2,933 | 9.0% |
| Communications | 1,834 | 5.6% |
| Arts & Humanities | 1,635 | 5.0% |
| Total | 32,688 | 100.0% |
Transportation & Commute in Portland
Vehicle Availability by Sex in Portland
The most prevalent vehicle ownership categories in Portland are males with 2 vehicles (8,962, accounting for 47.3%) and females with 2 vehicles (8,087, making up 45.3%).
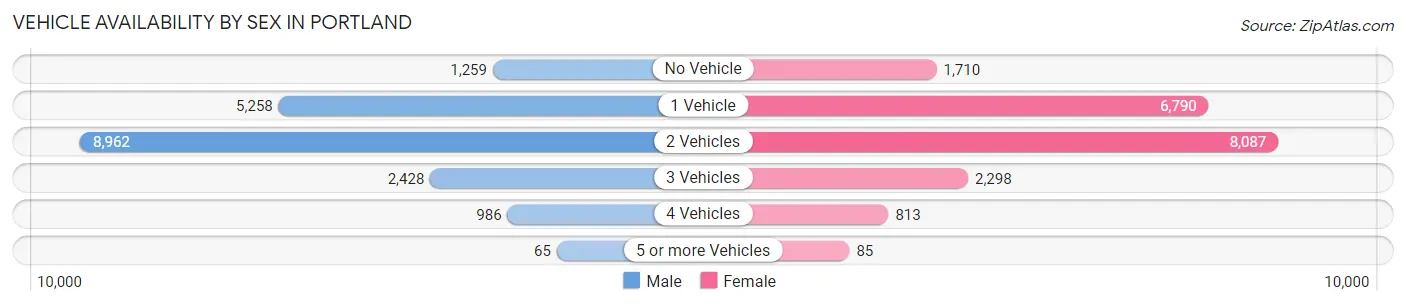
| Vehicles Available | Male | Female |
| No Vehicle | 1,259 (6.6%) | 1,710 (8.6%) |
| 1 Vehicle | 5,258 (27.7%) | 6,790 (34.3%) |
| 2 Vehicles | 8,962 (47.3%) | 8,087 (40.9%) |
| 3 Vehicles | 2,428 (12.8%) | 2,298 (11.6%) |
| 4 Vehicles | 986 (5.2%) | 813 (4.1%) |
| 5 or more Vehicles | 65 (0.3%) | 85 (0.4%) |
| Total | 18,958 (100.0%) | 19,783 (100.0%) |
Commute Time in Portland
The most frequently occuring commute durations in Portland are 10 to 14 minutes (7,579 commuters, 23.8%), 15 to 19 minutes (7,116 commuters, 22.4%), and 20 to 24 minutes (4,497 commuters, 14.1%).
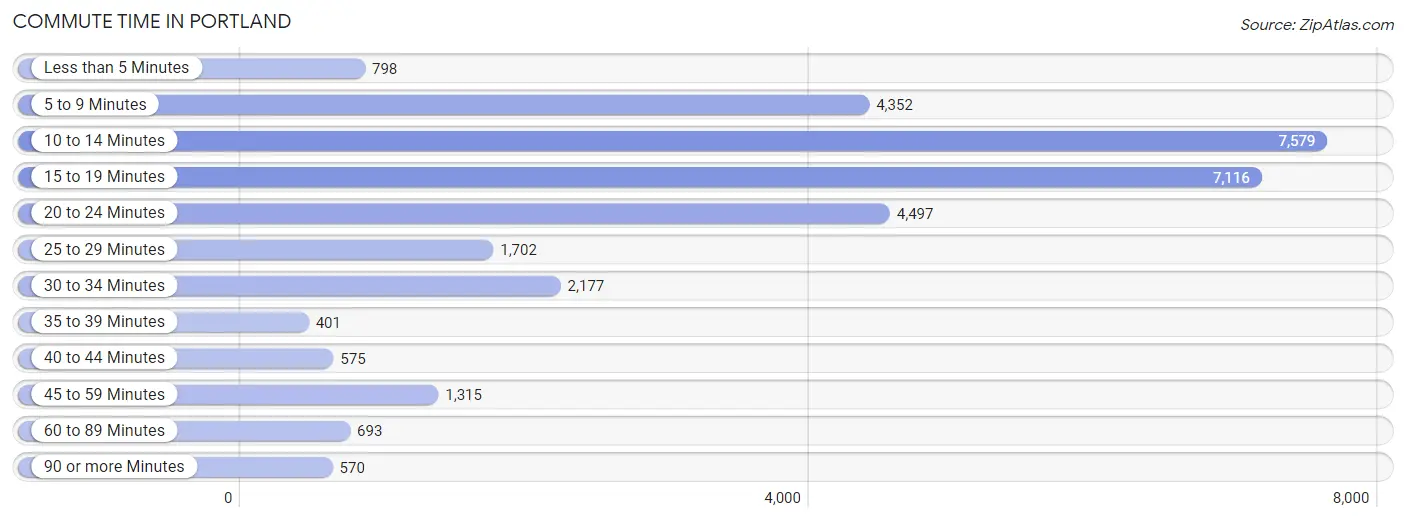
| Commute Time | # Commuters | % Commuters |
| Less than 5 Minutes | 798 | 2.5% |
| 5 to 9 Minutes | 4,352 | 13.7% |
| 10 to 14 Minutes | 7,579 | 23.8% |
| 15 to 19 Minutes | 7,116 | 22.4% |
| 20 to 24 Minutes | 4,497 | 14.1% |
| 25 to 29 Minutes | 1,702 | 5.4% |
| 30 to 34 Minutes | 2,177 | 6.9% |
| 35 to 39 Minutes | 401 | 1.3% |
| 40 to 44 Minutes | 575 | 1.8% |
| 45 to 59 Minutes | 1,315 | 4.1% |
| 60 to 89 Minutes | 693 | 2.2% |
| 90 or more Minutes | 570 | 1.8% |
Commute Time by Sex in Portland
The most common commute times in Portland are 10 to 14 minutes (3,546 commuters, 22.6%) for males and 10 to 14 minutes (4,033 commuters, 25.1%) for females.
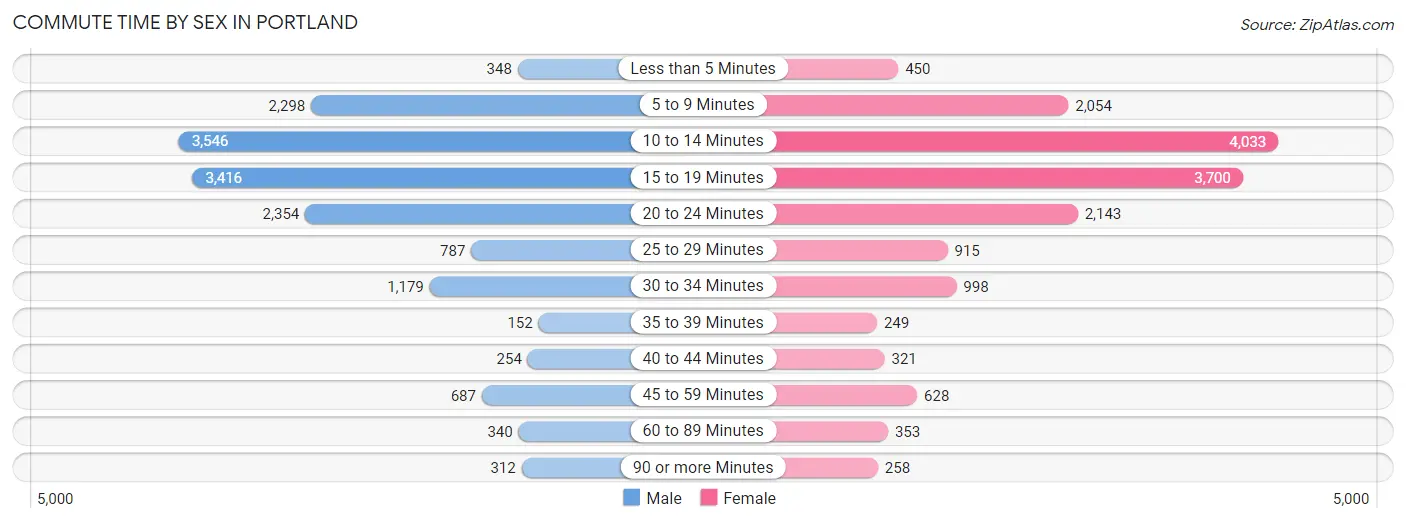
| Commute Time | Male | Female |
| Less than 5 Minutes | 348 (2.2%) | 450 (2.8%) |
| 5 to 9 Minutes | 2,298 (14.7%) | 2,054 (12.8%) |
| 10 to 14 Minutes | 3,546 (22.6%) | 4,033 (25.1%) |
| 15 to 19 Minutes | 3,416 (21.8%) | 3,700 (23.0%) |
| 20 to 24 Minutes | 2,354 (15.0%) | 2,143 (13.3%) |
| 25 to 29 Minutes | 787 (5.0%) | 915 (5.7%) |
| 30 to 34 Minutes | 1,179 (7.5%) | 998 (6.2%) |
| 35 to 39 Minutes | 152 (1.0%) | 249 (1.5%) |
| 40 to 44 Minutes | 254 (1.6%) | 321 (2.0%) |
| 45 to 59 Minutes | 687 (4.4%) | 628 (3.9%) |
| 60 to 89 Minutes | 340 (2.2%) | 353 (2.2%) |
| 90 or more Minutes | 312 (2.0%) | 258 (1.6%) |
Time of Departure to Work by Sex in Portland
The most frequent times of departure to work in Portland are 8:00 AM to 8:29 AM (2,164, 13.8%) for males and 7:30 AM to 7:59 AM (2,950, 18.3%) for females.
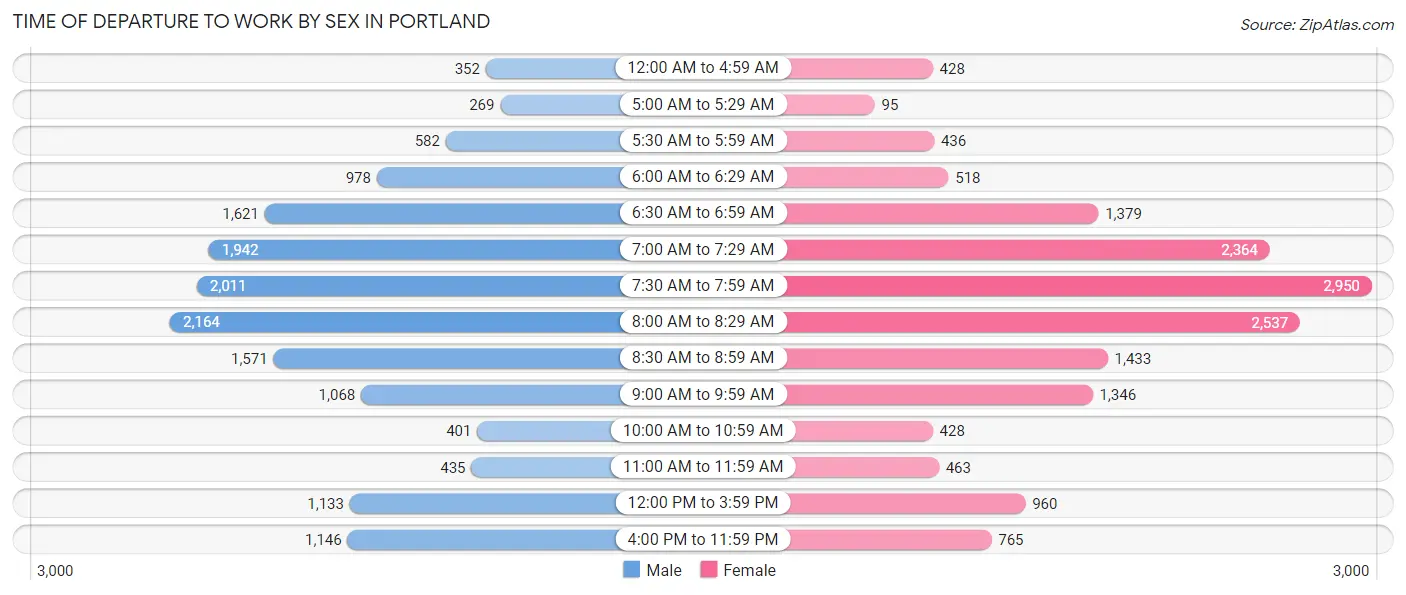
| Time of Departure | Male | Female |
| 12:00 AM to 4:59 AM | 352 (2.2%) | 428 (2.7%) |
| 5:00 AM to 5:29 AM | 269 (1.7%) | 95 (0.6%) |
| 5:30 AM to 5:59 AM | 582 (3.7%) | 436 (2.7%) |
| 6:00 AM to 6:29 AM | 978 (6.2%) | 518 (3.2%) |
| 6:30 AM to 6:59 AM | 1,621 (10.3%) | 1,379 (8.6%) |
| 7:00 AM to 7:29 AM | 1,942 (12.4%) | 2,364 (14.7%) |
| 7:30 AM to 7:59 AM | 2,011 (12.8%) | 2,950 (18.3%) |
| 8:00 AM to 8:29 AM | 2,164 (13.8%) | 2,537 (15.8%) |
| 8:30 AM to 8:59 AM | 1,571 (10.0%) | 1,433 (8.9%) |
| 9:00 AM to 9:59 AM | 1,068 (6.8%) | 1,346 (8.4%) |
| 10:00 AM to 10:59 AM | 401 (2.6%) | 428 (2.7%) |
| 11:00 AM to 11:59 AM | 435 (2.8%) | 463 (2.9%) |
| 12:00 PM to 3:59 PM | 1,133 (7.2%) | 960 (6.0%) |
| 4:00 PM to 11:59 PM | 1,146 (7.3%) | 765 (4.8%) |
| Total | 15,673 (100.0%) | 16,102 (100.0%) |
Housing Occupancy in Portland
Occupancy by Ownership in Portland
Of the total 32,253 dwellings in Portland, owner-occupied units account for 14,722 (45.7%), while renter-occupied units make up 17,531 (54.3%).
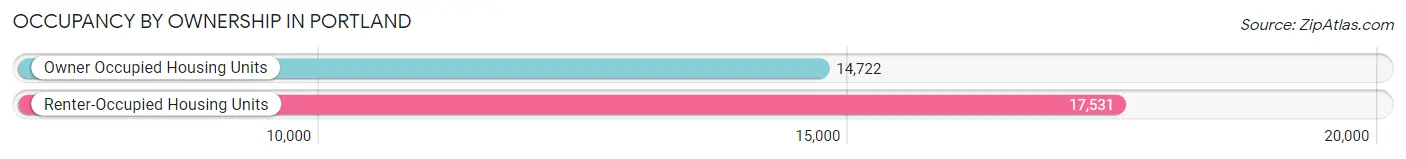
| Occupancy | # Housing Units | % Housing Units |
| Owner Occupied Housing Units | 14,722 | 45.7% |
| Renter-Occupied Housing Units | 17,531 | 54.3% |
| Total Occupied Housing Units | 32,253 | 100.0% |
Occupancy by Household Size in Portland
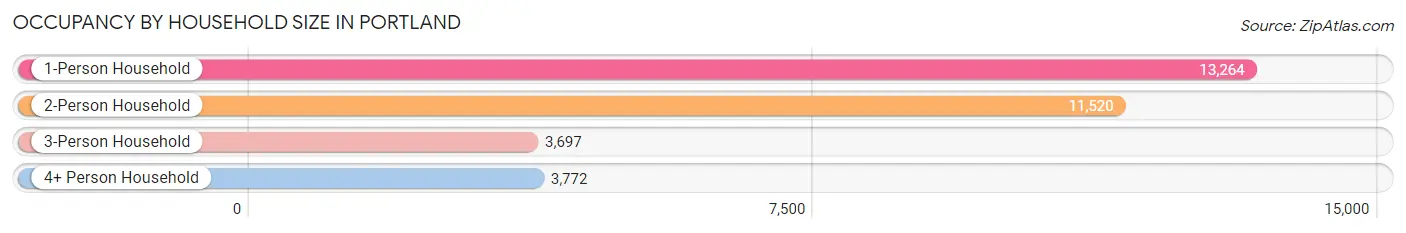
| Household Size | # Housing Units | % Housing Units |
| 1-Person Household | 13,264 | 41.1% |
| 2-Person Household | 11,520 | 35.7% |
| 3-Person Household | 3,697 | 11.5% |
| 4+ Person Household | 3,772 | 11.7% |
| Total Housing Units | 32,253 | 100.0% |
Occupancy by Ownership by Household Size in Portland
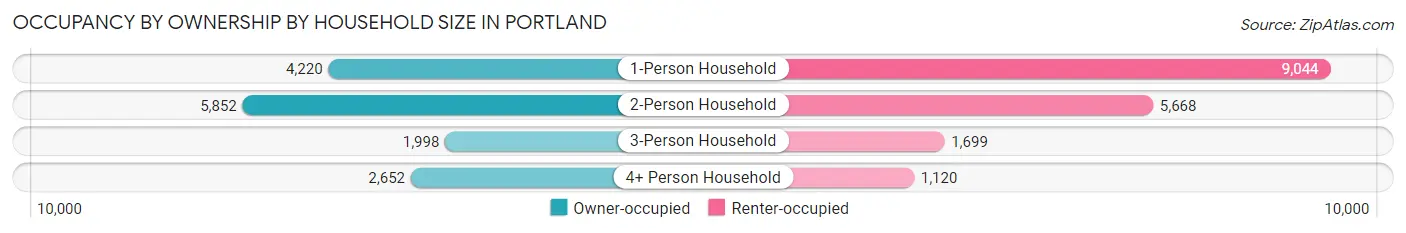
| Household Size | Owner-occupied | Renter-occupied |
| 1-Person Household | 4,220 (31.8%) | 9,044 (68.2%) |
| 2-Person Household | 5,852 (50.8%) | 5,668 (49.2%) |
| 3-Person Household | 1,998 (54.0%) | 1,699 (46.0%) |
| 4+ Person Household | 2,652 (70.3%) | 1,120 (29.7%) |
| Total Housing Units | 14,722 (45.7%) | 17,531 (54.3%) |
Occupancy by Educational Attainment in Portland
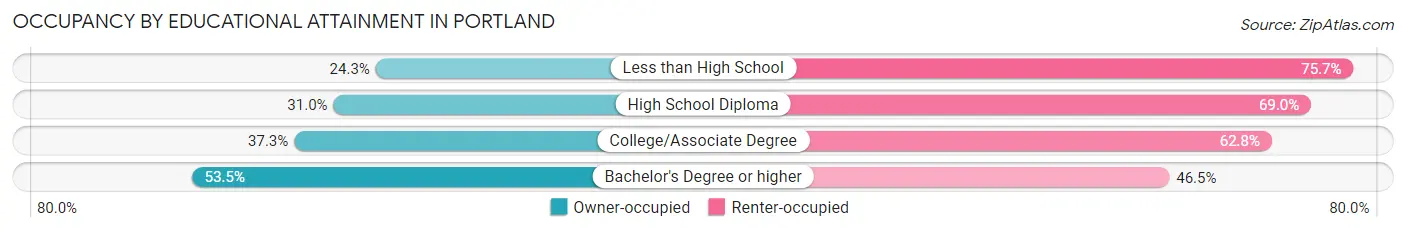
| Household Size | Owner-occupied | Renter-occupied |
| Less than High School | 285 (24.3%) | 887 (75.7%) |
| High School Diploma | 1,306 (31.0%) | 2,904 (69.0%) |
| College/Associate Degree | 2,858 (37.2%) | 4,814 (62.7%) |
| Bachelor's Degree or higher | 10,273 (53.5%) | 8,926 (46.5%) |
Occupancy by Age of Householder in Portland
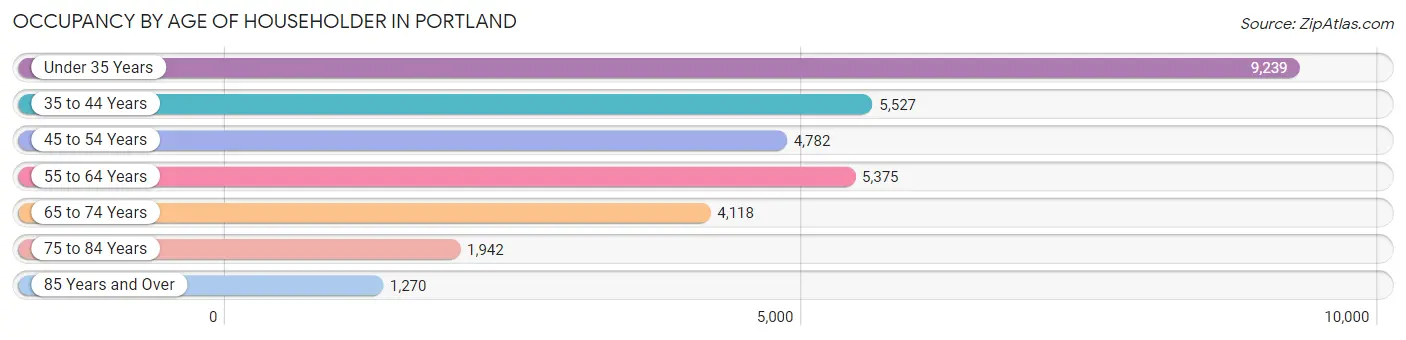
| Age Bracket | # Households | % Households |
| Under 35 Years | 9,239 | 28.6% |
| 35 to 44 Years | 5,527 | 17.1% |
| 45 to 54 Years | 4,782 | 14.8% |
| 55 to 64 Years | 5,375 | 16.7% |
| 65 to 74 Years | 4,118 | 12.8% |
| 75 to 84 Years | 1,942 | 6.0% |
| 85 Years and Over | 1,270 | 3.9% |
| Total | 32,253 | 100.0% |
Housing Finances in Portland
Median Income by Occupancy in Portland
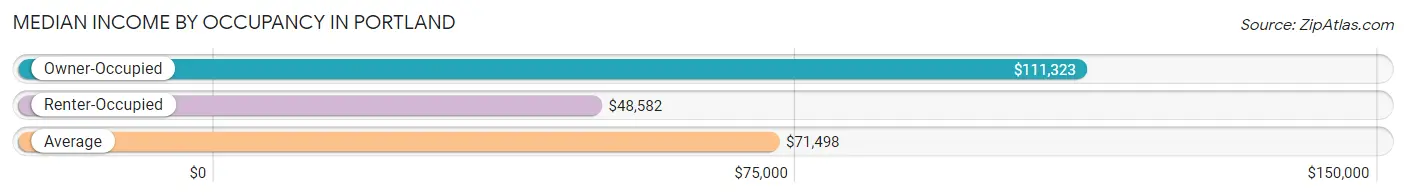
| Occupancy Type | # Households | Median Income |
| Owner-Occupied | 14,722 (45.7%) | $111,323 |
| Renter-Occupied | 17,531 (54.3%) | $48,582 |
| Average | 32,253 (100.0%) | $71,498 |
Occupancy by Householder Income Bracket in Portland
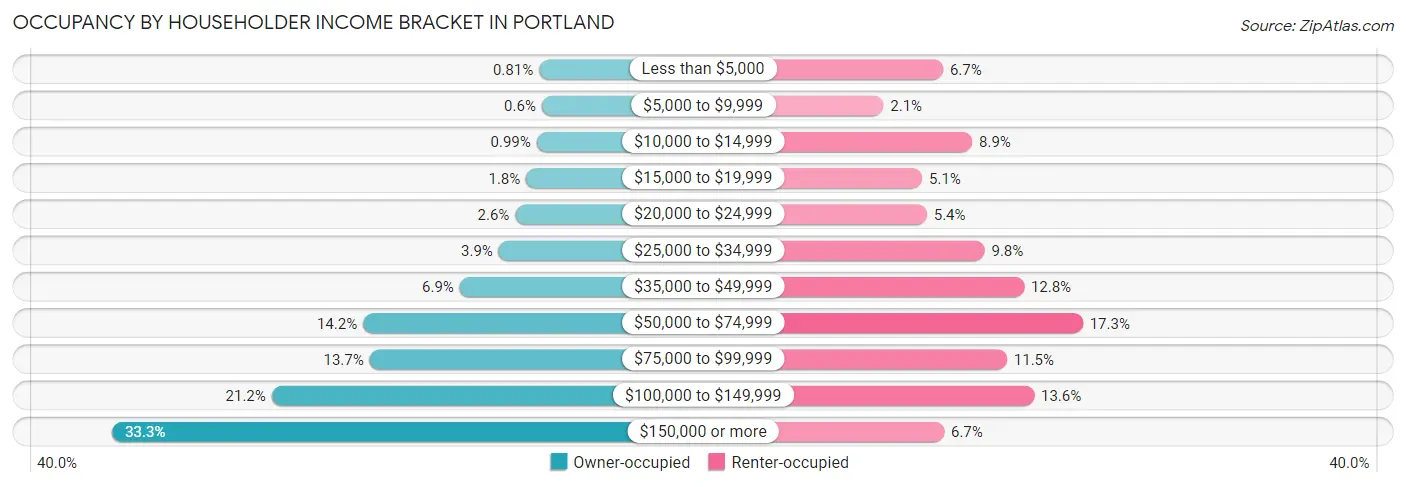
| Income Bracket | Owner-occupied | Renter-occupied |
| Less than $5,000 | 119 (0.8%) | 1,168 (6.7%) |
| $5,000 to $9,999 | 89 (0.6%) | 371 (2.1%) |
| $10,000 to $14,999 | 146 (1.0%) | 1,557 (8.9%) |
| $15,000 to $19,999 | 263 (1.8%) | 888 (5.1%) |
| $20,000 to $24,999 | 386 (2.6%) | 952 (5.4%) |
| $25,000 to $34,999 | 571 (3.9%) | 1,724 (9.8%) |
| $35,000 to $49,999 | 1,009 (6.9%) | 2,249 (12.8%) |
| $50,000 to $74,999 | 2,093 (14.2%) | 3,034 (17.3%) |
| $75,000 to $99,999 | 2,020 (13.7%) | 2,022 (11.5%) |
| $100,000 to $149,999 | 3,118 (21.2%) | 2,385 (13.6%) |
| $150,000 or more | 4,908 (33.3%) | 1,181 (6.7%) |
| Total | 14,722 (100.0%) | 17,531 (100.0%) |
Monthly Housing Cost Tiers in Portland
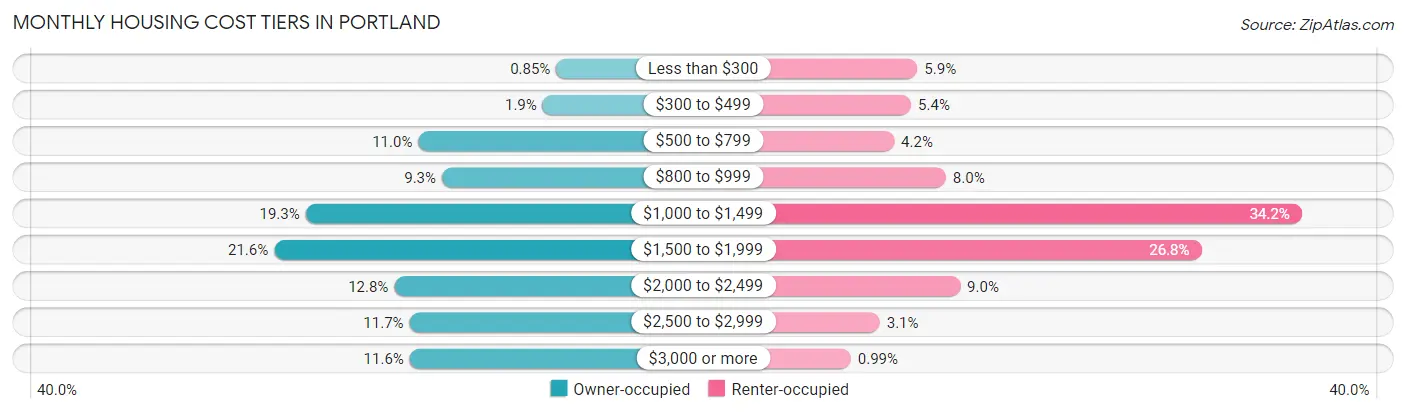
| Monthly Cost | Owner-occupied | Renter-occupied |
| Less than $300 | 125 (0.9%) | 1,033 (5.9%) |
| $300 to $499 | 272 (1.8%) | 952 (5.4%) |
| $500 to $799 | 1,621 (11.0%) | 732 (4.2%) |
| $800 to $999 | 1,365 (9.3%) | 1,401 (8.0%) |
| $1,000 to $1,499 | 2,843 (19.3%) | 5,994 (34.2%) |
| $1,500 to $1,999 | 3,184 (21.6%) | 4,698 (26.8%) |
| $2,000 to $2,499 | 1,882 (12.8%) | 1,584 (9.0%) |
| $2,500 to $2,999 | 1,716 (11.7%) | 547 (3.1%) |
| $3,000 or more | 1,714 (11.6%) | 173 (1.0%) |
| Total | 14,722 (100.0%) | 17,531 (100.0%) |
Physical Housing Characteristics in Portland
Housing Structures in Portland
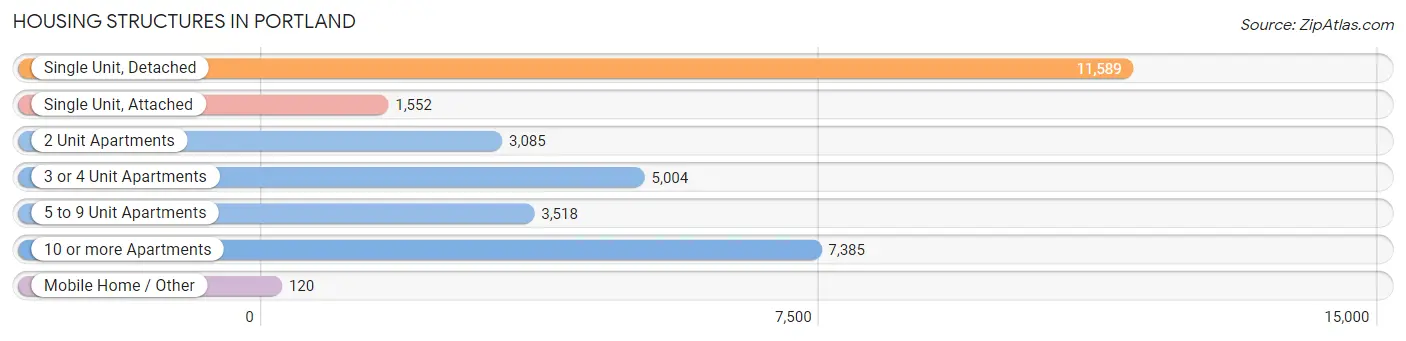
| Structure Type | # Housing Units | % Housing Units |
| Single Unit, Detached | 11,589 | 35.9% |
| Single Unit, Attached | 1,552 | 4.8% |
| 2 Unit Apartments | 3,085 | 9.6% |
| 3 or 4 Unit Apartments | 5,004 | 15.5% |
| 5 to 9 Unit Apartments | 3,518 | 10.9% |
| 10 or more Apartments | 7,385 | 22.9% |
| Mobile Home / Other | 120 | 0.4% |
| Total | 32,253 | 100.0% |
Housing Structures by Occupancy in Portland
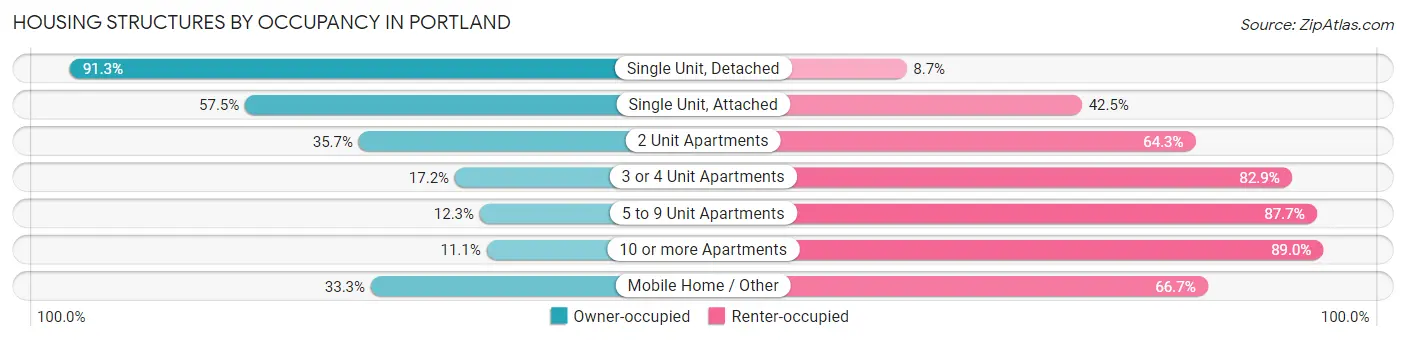
| Structure Type | Owner-occupied | Renter-occupied |
| Single Unit, Detached | 10,581 (91.3%) | 1,008 (8.7%) |
| Single Unit, Attached | 893 (57.5%) | 659 (42.5%) |
| 2 Unit Apartments | 1,100 (35.7%) | 1,985 (64.3%) |
| 3 or 4 Unit Apartments | 858 (17.2%) | 4,146 (82.9%) |
| 5 to 9 Unit Apartments | 434 (12.3%) | 3,084 (87.7%) |
| 10 or more Apartments | 816 (11.1%) | 6,569 (88.9%) |
| Mobile Home / Other | 40 (33.3%) | 80 (66.7%) |
| Total | 14,722 (45.7%) | 17,531 (54.3%) |
Housing Structures by Number of Rooms in Portland
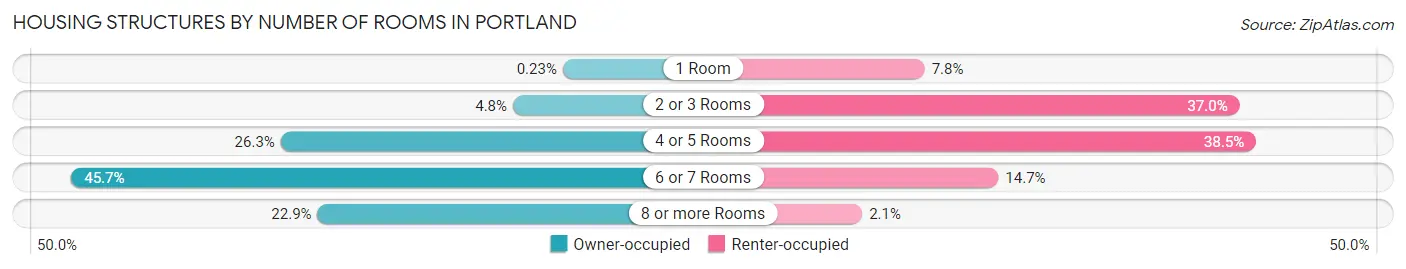
| Number of Rooms | Owner-occupied | Renter-occupied |
| 1 Room | 34 (0.2%) | 1,374 (7.8%) |
| 2 or 3 Rooms | 713 (4.8%) | 6,477 (36.9%) |
| 4 or 5 Rooms | 3,875 (26.3%) | 6,748 (38.5%) |
| 6 or 7 Rooms | 6,725 (45.7%) | 2,570 (14.7%) |
| 8 or more Rooms | 3,375 (22.9%) | 362 (2.1%) |
| Total | 14,722 (100.0%) | 17,531 (100.0%) |
Housing Structure by Heating Type in Portland
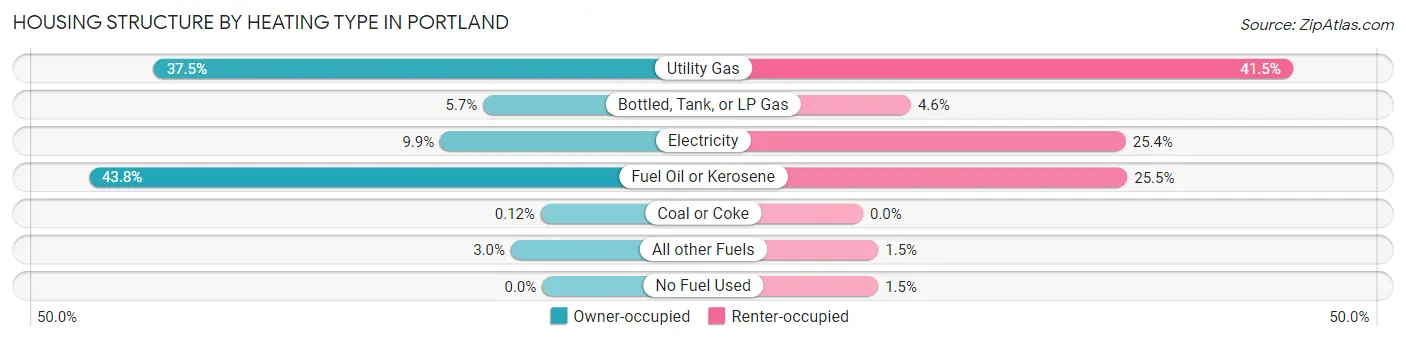
| Heating Type | Owner-occupied | Renter-occupied |
| Utility Gas | 5,523 (37.5%) | 7,276 (41.5%) |
| Bottled, Tank, or LP Gas | 839 (5.7%) | 811 (4.6%) |
| Electricity | 1,452 (9.9%) | 4,451 (25.4%) |
| Fuel Oil or Kerosene | 6,445 (43.8%) | 4,476 (25.5%) |
| Coal or Coke | 18 (0.1%) | 0 (0.0%) |
| All other Fuels | 445 (3.0%) | 259 (1.5%) |
| No Fuel Used | 0 (0.0%) | 258 (1.5%) |
| Total | 14,722 (100.0%) | 17,531 (100.0%) |
Household Vehicle Usage in Portland
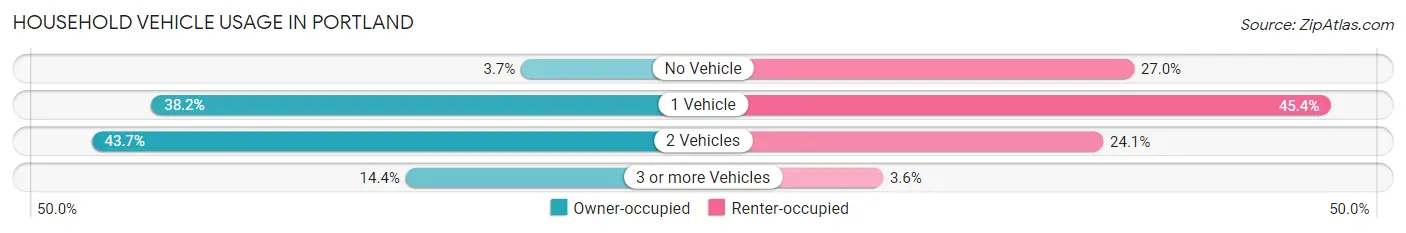
| Vehicles per Household | Owner-occupied | Renter-occupied |
| No Vehicle | 538 (3.6%) | 4,730 (27.0%) |
| 1 Vehicle | 5,620 (38.2%) | 7,953 (45.4%) |
| 2 Vehicles | 6,439 (43.7%) | 4,225 (24.1%) |
| 3 or more Vehicles | 2,125 (14.4%) | 623 (3.5%) |
| Total | 14,722 (100.0%) | 17,531 (100.0%) |
Real Estate & Mortgages in Portland
Real Estate and Mortgage Overview in Portland
| Characteristic | Without Mortgage | With Mortgage |
| Housing Units | 4,919 | 9,803 |
| Median Property Value | $412,500 | $411,200 |
| Median Household Income | $81,062 | $3,634 |
| Monthly Housing Costs | $914 | $1,696 |
| Real Estate Taxes | $5,512 | $25 |
Property Value by Mortgage Status in Portland
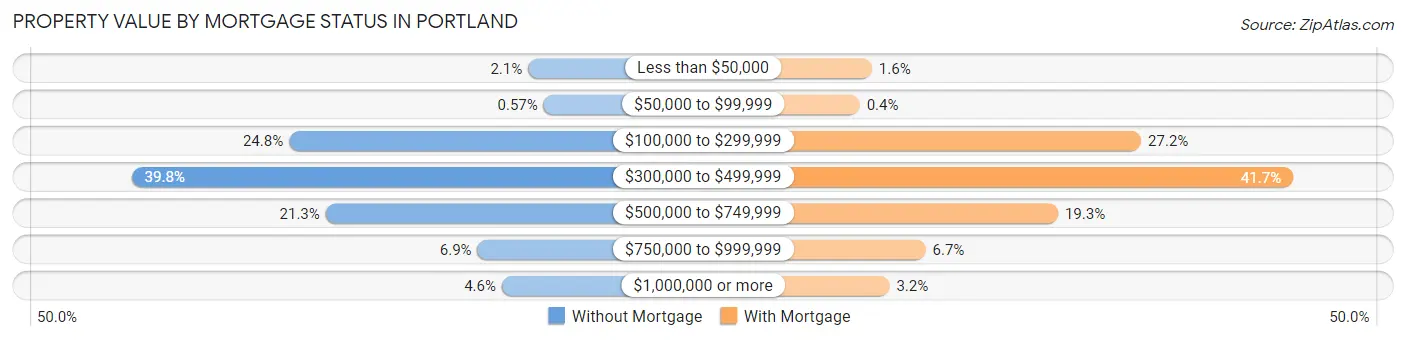
| Property Value | Without Mortgage | With Mortgage |
| Less than $50,000 | 101 (2.1%) | 153 (1.6%) |
| $50,000 to $99,999 | 28 (0.6%) | 39 (0.4%) |
| $100,000 to $299,999 | 1,221 (24.8%) | 2,666 (27.2%) |
| $300,000 to $499,999 | 1,958 (39.8%) | 4,084 (41.7%) |
| $500,000 to $749,999 | 1,049 (21.3%) | 1,890 (19.3%) |
| $750,000 to $999,999 | 338 (6.9%) | 654 (6.7%) |
| $1,000,000 or more | 224 (4.5%) | 317 (3.2%) |
| Total | 4,919 (100.0%) | 9,803 (100.0%) |
Household Income by Mortgage Status in Portland
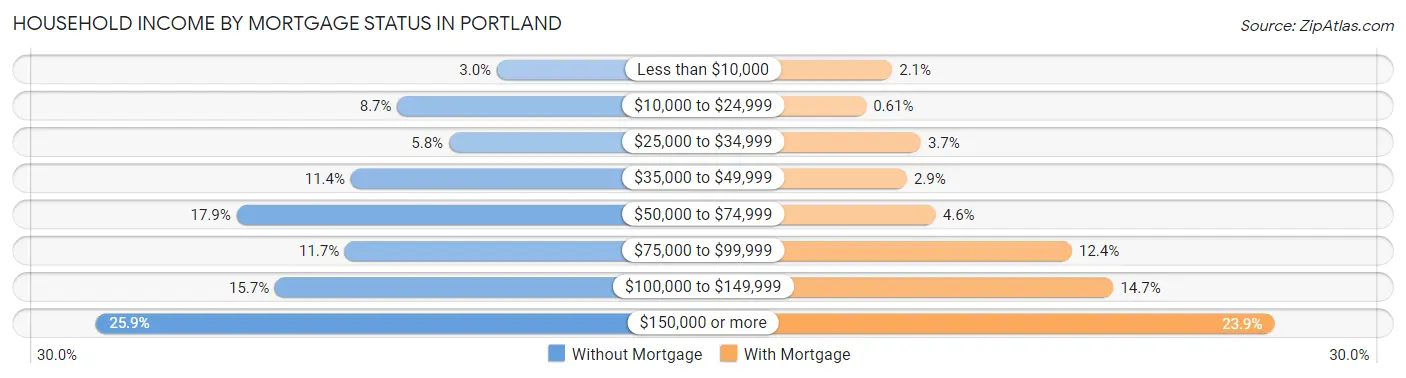
| Household Income | Without Mortgage | With Mortgage |
| Less than $10,000 | 148 (3.0%) | 206 (2.1%) |
| $10,000 to $24,999 | 428 (8.7%) | 60 (0.6%) |
| $25,000 to $34,999 | 283 (5.8%) | 367 (3.7%) |
| $35,000 to $49,999 | 559 (11.4%) | 288 (2.9%) |
| $50,000 to $74,999 | 880 (17.9%) | 450 (4.6%) |
| $75,000 to $99,999 | 575 (11.7%) | 1,213 (12.4%) |
| $100,000 to $149,999 | 772 (15.7%) | 1,445 (14.7%) |
| $150,000 or more | 1,274 (25.9%) | 2,346 (23.9%) |
| Total | 4,919 (100.0%) | 9,803 (100.0%) |
Property Value to Household Income Ratio in Portland
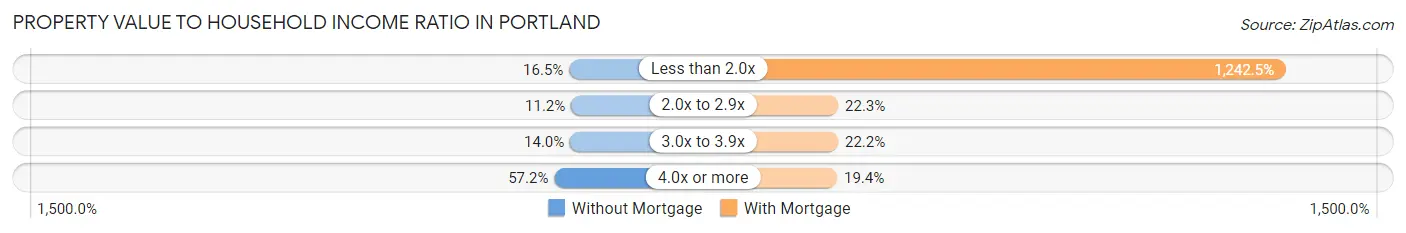
| Value-to-Income Ratio | Without Mortgage | With Mortgage |
| Less than 2.0x | 813 (16.5%) | 121,806 (1,242.5%) |
| 2.0x to 2.9x | 552 (11.2%) | 2,189 (22.3%) |
| 3.0x to 3.9x | 687 (14.0%) | 2,176 (22.2%) |
| 4.0x or more | 2,811 (57.2%) | 1,902 (19.4%) |
| Total | 4,919 (100.0%) | 9,803 (100.0%) |
Real Estate Taxes by Mortgage Status in Portland
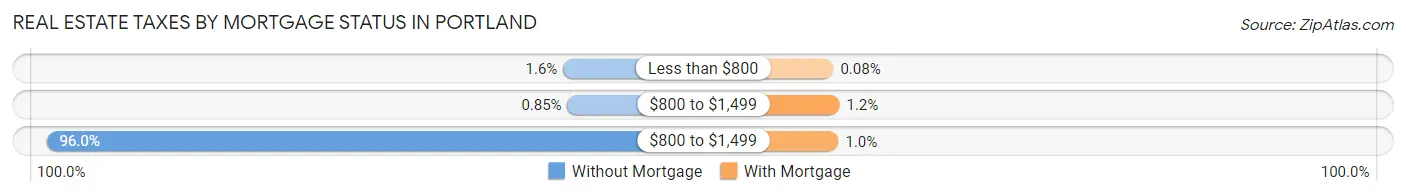
| Property Taxes | Without Mortgage | With Mortgage |
| Less than $800 | 80 (1.6%) | 8 (0.1%) |
| $800 to $1,499 | 42 (0.9%) | 117 (1.2%) |
| $800 to $1,499 | 4,722 (96.0%) | 98 (1.0%) |
| Total | 4,919 (100.0%) | 9,803 (100.0%) |
Health & Disability in Portland
Health Insurance Coverage by Age in Portland
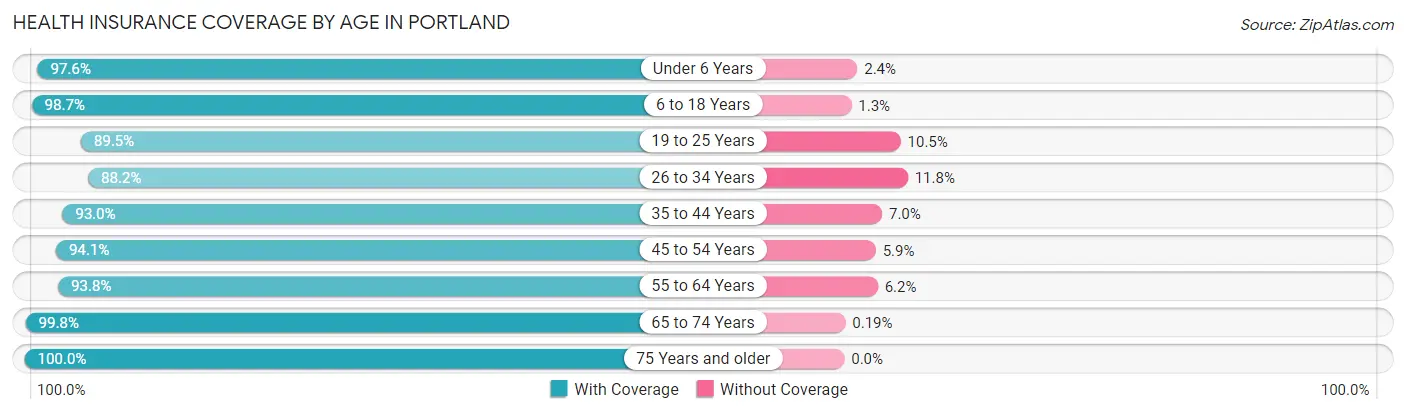
| Age Bracket | With Coverage | Without Coverage |
| Under 6 Years | 3,389 (97.6%) | 84 (2.4%) |
| 6 to 18 Years | 7,083 (98.7%) | 95 (1.3%) |
| 19 to 25 Years | 6,291 (89.5%) | 738 (10.5%) |
| 26 to 34 Years | 11,433 (88.2%) | 1,534 (11.8%) |
| 35 to 44 Years | 8,670 (93.0%) | 657 (7.0%) |
| 45 to 54 Years | 7,293 (94.1%) | 454 (5.9%) |
| 55 to 64 Years | 7,995 (93.8%) | 531 (6.2%) |
| 65 to 74 Years | 6,296 (99.8%) | 12 (0.2%) |
| 75 Years and older | 4,579 (100.0%) | 0 (0.0%) |
| Total | 63,029 (93.9%) | 4,105 (6.1%) |
Health Insurance Coverage by Citizenship Status in Portland
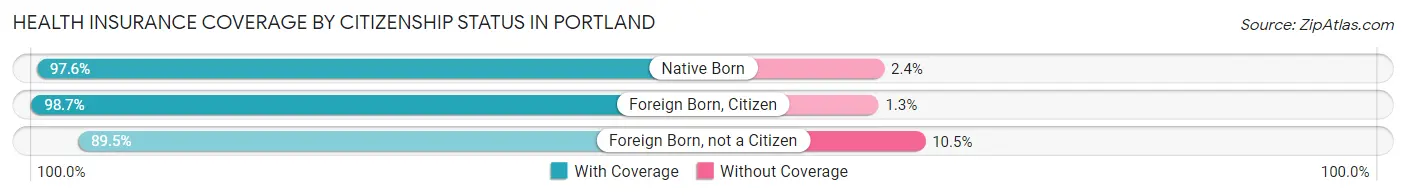
| Citizenship Status | With Coverage | Without Coverage |
| Native Born | 3,389 (97.6%) | 84 (2.4%) |
| Foreign Born, Citizen | 7,083 (98.7%) | 95 (1.3%) |
| Foreign Born, not a Citizen | 6,291 (89.5%) | 738 (10.5%) |
Health Insurance Coverage by Household Income in Portland
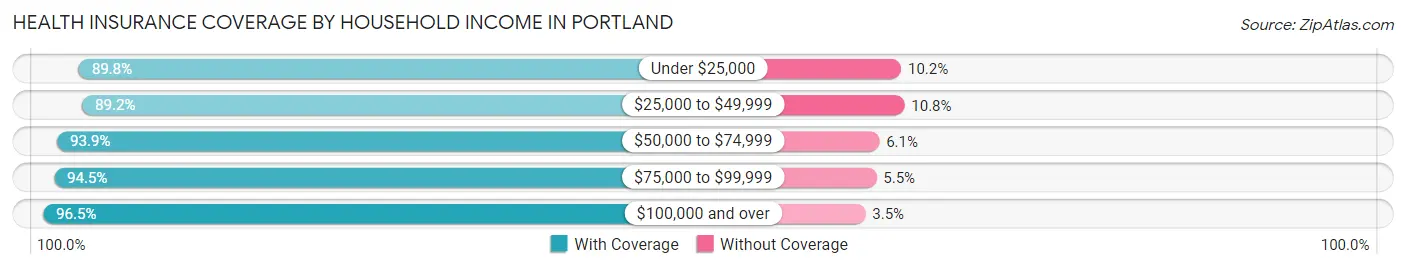
| Household Income | With Coverage | Without Coverage |
| Under $25,000 | 7,271 (89.8%) | 822 (10.2%) |
| $25,000 to $49,999 | 8,184 (89.2%) | 990 (10.8%) |
| $50,000 to $74,999 | 8,852 (93.9%) | 573 (6.1%) |
| $75,000 to $99,999 | 8,568 (94.5%) | 502 (5.5%) |
| $100,000 and over | 29,340 (96.5%) | 1,059 (3.5%) |
Public vs Private Health Insurance Coverage by Age in Portland
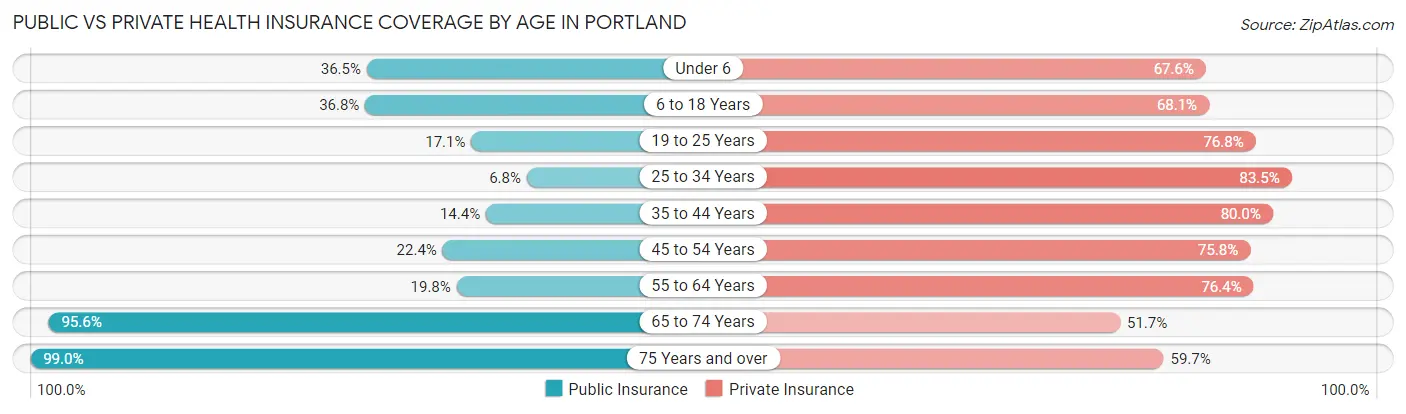
| Age Bracket | Public Insurance | Private Insurance |
| Under 6 | 1,267 (36.5%) | 2,346 (67.5%) |
| 6 to 18 Years | 2,640 (36.8%) | 4,891 (68.1%) |
| 19 to 25 Years | 1,201 (17.1%) | 5,397 (76.8%) |
| 25 to 34 Years | 879 (6.8%) | 10,823 (83.5%) |
| 35 to 44 Years | 1,339 (14.4%) | 7,460 (80.0%) |
| 45 to 54 Years | 1,735 (22.4%) | 5,870 (75.8%) |
| 55 to 64 Years | 1,689 (19.8%) | 6,515 (76.4%) |
| 65 to 74 Years | 6,028 (95.6%) | 3,258 (51.6%) |
| 75 Years and over | 4,531 (99.0%) | 2,735 (59.7%) |
| Total | 21,309 (31.7%) | 49,295 (73.4%) |
Disability Status by Sex by Age in Portland
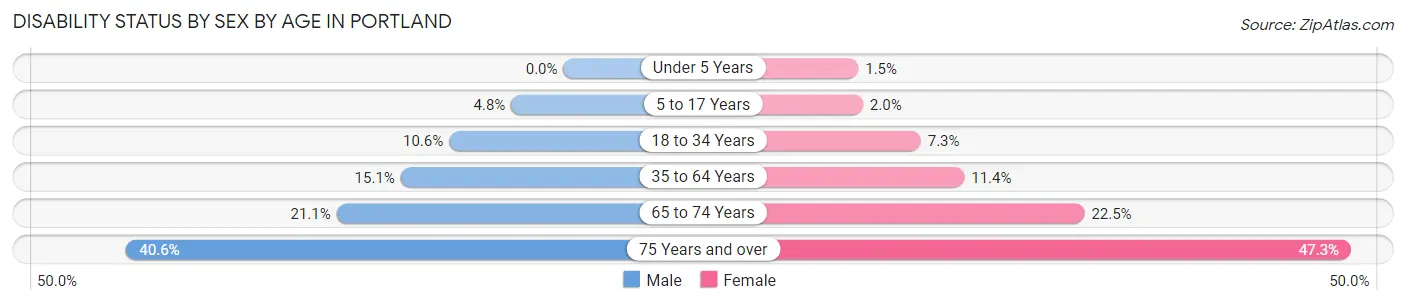
| Age Bracket | Male | Female |
| Under 5 Years | 0 (0.0%) | 20 (1.5%) |
| 5 to 17 Years | 172 (4.8%) | 73 (2.0%) |
| 18 to 34 Years | 1,055 (10.6%) | 774 (7.3%) |
| 35 to 64 Years | 1,900 (15.1%) | 1,481 (11.4%) |
| 65 to 74 Years | 664 (21.0%) | 710 (22.5%) |
| 75 Years and over | 609 (40.6%) | 1,454 (47.2%) |
Disability Class by Sex by Age in Portland
Disability Class: Hearing Difficulty
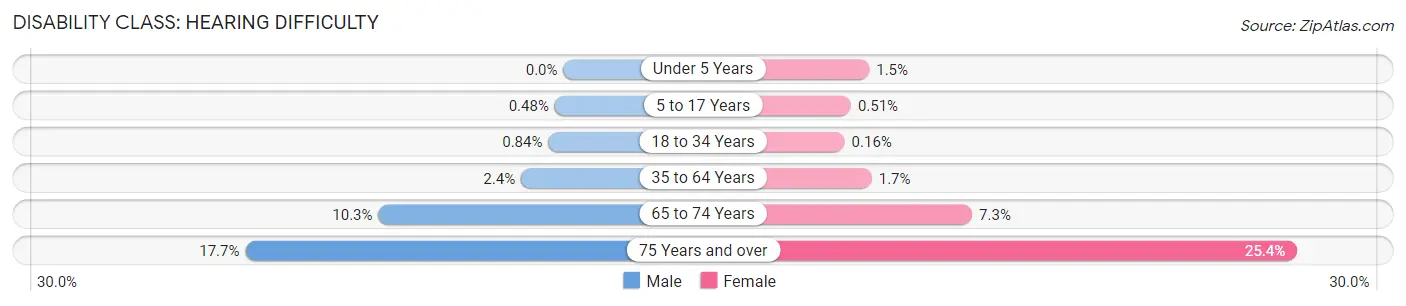
| Age Bracket | Male | Female |
| Under 5 Years | 0 (0.0%) | 20 (1.5%) |
| 5 to 17 Years | 17 (0.5%) | 19 (0.5%) |
| 18 to 34 Years | 84 (0.8%) | 17 (0.2%) |
| 35 to 64 Years | 297 (2.4%) | 218 (1.7%) |
| 65 to 74 Years | 325 (10.3%) | 229 (7.3%) |
| 75 Years and over | 266 (17.7%) | 780 (25.4%) |
Disability Class: Vision Difficulty
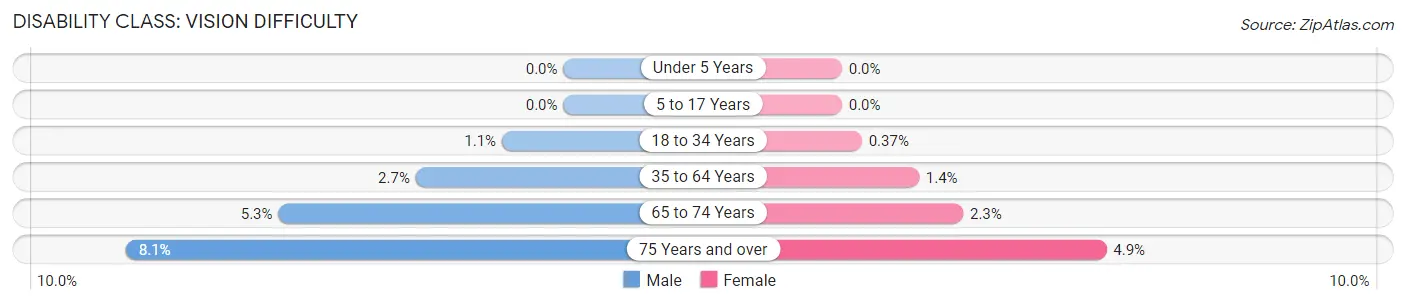
| Age Bracket | Male | Female |
| Under 5 Years | 0 (0.0%) | 0 (0.0%) |
| 5 to 17 Years | 0 (0.0%) | 0 (0.0%) |
| 18 to 34 Years | 113 (1.1%) | 39 (0.4%) |
| 35 to 64 Years | 345 (2.7%) | 186 (1.4%) |
| 65 to 74 Years | 167 (5.3%) | 71 (2.2%) |
| 75 Years and over | 122 (8.1%) | 151 (4.9%) |
Disability Class: Cognitive Difficulty
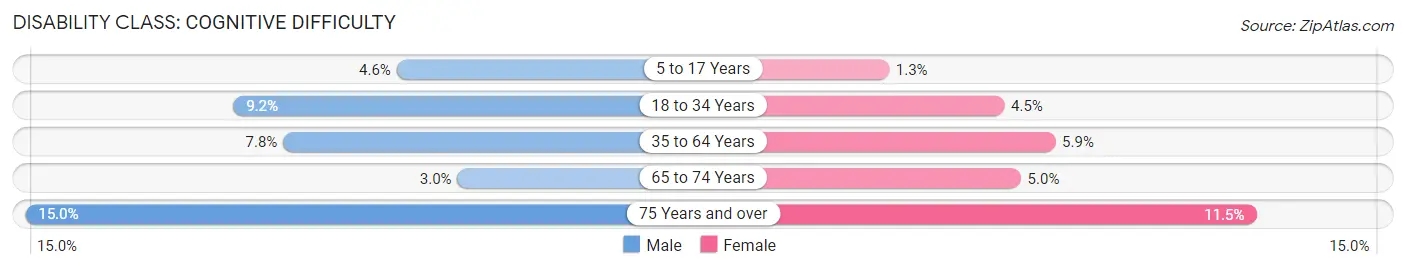
| Age Bracket | Male | Female |
| 5 to 17 Years | 165 (4.6%) | 49 (1.3%) |
| 18 to 34 Years | 914 (9.2%) | 477 (4.5%) |
| 35 to 64 Years | 981 (7.8%) | 774 (5.9%) |
| 65 to 74 Years | 93 (2.9%) | 157 (5.0%) |
| 75 Years and over | 225 (15.0%) | 355 (11.5%) |
Disability Class: Ambulatory Difficulty
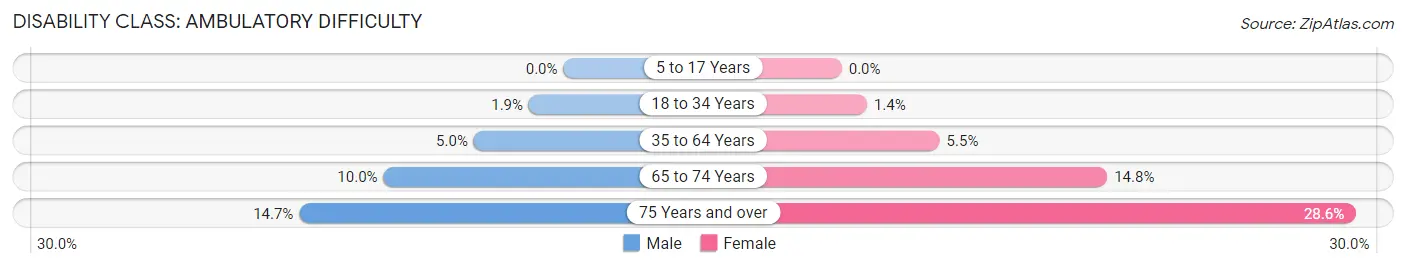
| Age Bracket | Male | Female |
| 5 to 17 Years | 0 (0.0%) | 0 (0.0%) |
| 18 to 34 Years | 191 (1.9%) | 148 (1.4%) |
| 35 to 64 Years | 628 (5.0%) | 709 (5.4%) |
| 65 to 74 Years | 316 (10.0%) | 466 (14.8%) |
| 75 Years and over | 221 (14.7%) | 881 (28.6%) |
Disability Class: Self-Care Difficulty
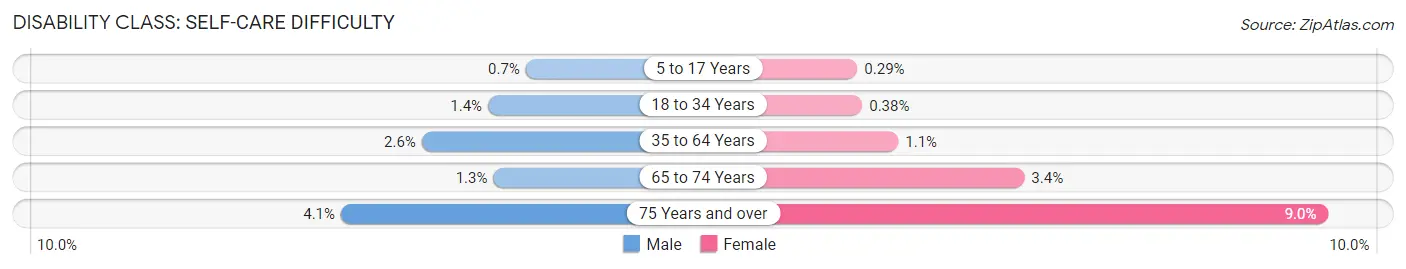
| Age Bracket | Male | Female |
| 5 to 17 Years | 25 (0.7%) | 11 (0.3%) |
| 18 to 34 Years | 139 (1.4%) | 40 (0.4%) |
| 35 to 64 Years | 331 (2.6%) | 137 (1.1%) |
| 65 to 74 Years | 41 (1.3%) | 107 (3.4%) |
| 75 Years and over | 62 (4.1%) | 278 (9.0%) |
Technology Access in Portland
Computing Device Access in Portland
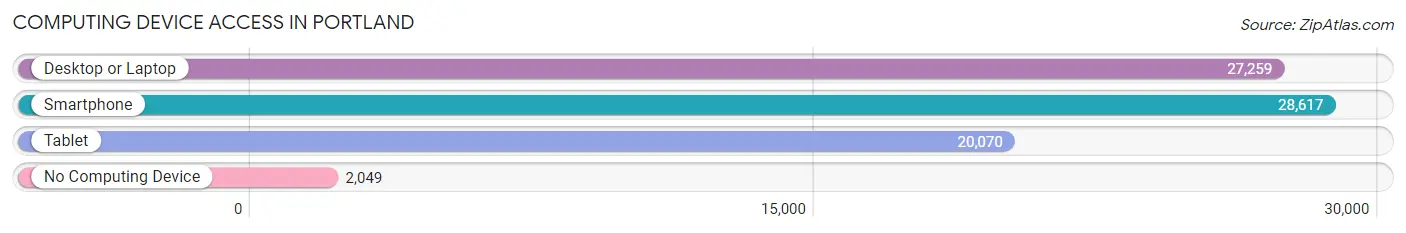
| Device Type | # Households | % Households |
| Desktop or Laptop | 27,259 | 84.5% |
| Smartphone | 28,617 | 88.7% |
| Tablet | 20,070 | 62.2% |
| No Computing Device | 2,049 | 6.4% |
| Total | 32,253 | 100.0% |
Internet Access in Portland
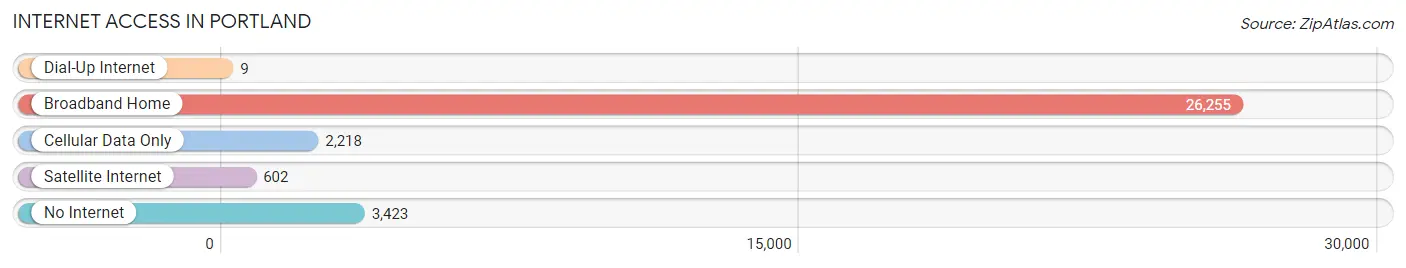
| Internet Type | # Households | % Households |
| Dial-Up Internet | 9 | 0.0% |
| Broadband Home | 26,255 | 81.4% |
| Cellular Data Only | 2,218 | 6.9% |
| Satellite Internet | 602 | 1.9% |
| No Internet | 3,423 | 10.6% |
| Total | 32,253 | 100.0% |
Portland Summary
Portland, Maine is a city located in Cumberland County, Maine, United States. It is the most populous city in the state, with a population of 66,215 as of 2019. Portland is the economic and cultural hub of Maine, and is known for its vibrant arts and culture scene, its historic architecture, and its picturesque waterfront.
History
Portland was first settled in 1632 by English settlers, and was incorporated as a city in 1786. It was named after the English city of Portland, and was the first incorporated city in Maine. Portland quickly became an important port city, and was a major trading center for the region. It was also an important shipbuilding center, and was home to the first shipyard in the United States.
In the 19th century, Portland became an important industrial center, and was home to several large factories. It was also a major center for the lumber industry, and was home to several large sawmills. Portland was also an important center for the textile industry, and was home to several large textile mills.
Geography
Portland is located in the southern part of Maine, on the Atlantic coast. It is situated at the mouth of the Fore River, and is bordered by the cities of South Portland and Westbrook. The city is located on a peninsula, and is surrounded by Casco Bay and the Fore River. The city has a total area of 69.6 square miles, of which 64.2 square miles is land and 5.4 square miles is water.
Economy
Portland is the economic and cultural hub of Maine, and is home to a diverse economy. The city is home to several large companies, including WEX, Unum, and IDEXX Laboratories. The city is also home to several large hospitals, including Maine Medical Center and Mercy Hospital.
The city is also home to several large universities, including the University of Southern Maine, the Maine College of Art, and the Maine Maritime Academy. The city is also home to several large museums, including the Portland Museum of Art and the Portland Children's Museum.
Demographics
As of 2019, Portland had a population of 66,215. The city has a population density of 945 people per square mile. The median age in Portland is 38.7 years, and the median household income is $54,845. The city is majority white, with a population that is 79.2% white, 8.2% black, 5.3% Asian, and 4.3% Hispanic or Latino.
Conclusion
Portland, Maine is a vibrant city with a rich history and a diverse economy. It is the economic and cultural hub of Maine, and is home to several large companies, universities, and museums. The city has a population of 66,215, and is majority white, with a median age of 38.7 years and a median household income of $54,845. Portland is a great place to live, work, and visit, and is sure to provide a unique and enjoyable experience for all who visit.
Common Questions
What is Per Capita Income in Portland?
Per Capita income in Portland is $48,806.
What is the Median Family Income in Portland?
Median Family Income in Portland is $110,206.
What is the Median Household income in Portland?
Median Household Income in Portland is $71,498.
What is Income or Wage Gap in Portland?
Income or Wage Gap in Portland is 7.9%.
Women in Portland earn 92.1 cents for every dollar earned by a man.
What is Family Income Deficit in Portland?
Family Income Deficit in Portland is $13,362.
Families that are below poverty line in Portland earn $13,362 less on average than the poverty threshold level.
What is Inequality or Gini Index in Portland?
Inequality or Gini Index in Portland is 0.49.
What is the Total Population of Portland?
Total Population of Portland is 68,280.
What is the Total Male Population of Portland?
Total Male Population of Portland is 33,055.
What is the Total Female Population of Portland?
Total Female Population of Portland is 35,225.
What is the Ratio of Males per 100 Females in Portland?
There are 93.84 Males per 100 Females in Portland.
What is the Ratio of Females per 100 Males in Portland?
There are 106.56 Females per 100 Males in Portland.
What is the Median Population Age in Portland?
Median Population Age in Portland is 37.6 Years.
What is the Average Family Size in Portland
Average Family Size in Portland is 2.9 People.
What is the Average Household Size in Portland
Average Household Size in Portland is 2.0 People.
How Large is the Labor Force in Portland?
There are 41,278 People in the Labor Forcein in Portland.
What is the Percentage of People in the Labor Force in Portland?
69.7% of People are in the Labor Force in Portland.
What is the Unemployment Rate in Portland?
Unemployment Rate in Portland is 4.0%.