Kirksville, MO Map & Demographics
Kirksville Map
Kirksville Overview
$27,841
PER CAPITA INCOME
$68,045
AVG FAMILY INCOME
$41,089
AVG HOUSEHOLD INCOME
36.6%
WAGE / INCOME GAP [ % ]
63.4¢/ $1
WAGE / INCOME GAP [ $ ]
$11,988
FAMILY INCOME DEFICIT
0.63
INEQUALITY / GINI INDEX
17,533
TOTAL POPULATION
8,311
MALE POPULATION
9,222
FEMALE POPULATION
90.12
MALES / 100 FEMALES
110.96
FEMALES / 100 MALES
23.8
MEDIAN AGE
3.2
AVG FAMILY SIZE
2.5
AVG HOUSEHOLD SIZE
6,914
LABOR FORCE [ PEOPLE ]
46.6%
PERCENT IN LABOR FORCE
5.8%
UNEMPLOYMENT RATE
Kirksville Zip Codes
Kirksville Area Codes
Income in Kirksville
Income Overview in Kirksville
Per Capita Income in Kirksville is $27,841, while median incomes of families and households are $68,045 and $41,089 respectively.
| Characteristic | Number | Measure |
| Per Capita Income | 17,533 | $27,841 |
| Median Family Income | 2,748 | $68,045 |
| Mean Family Income | 2,748 | $119,491 |
| Median Household Income | 5,951 | $41,089 |
| Mean Household Income | 5,951 | $78,303 |
| Income Deficit | 2,748 | $11,988 |
| Wage / Income Gap (%) | 17,533 | 36.61% |
| Wage / Income Gap ($) | 17,533 | 63.39¢ per $1 |
| Gini / Inequality Index | 17,533 | 0.63 |
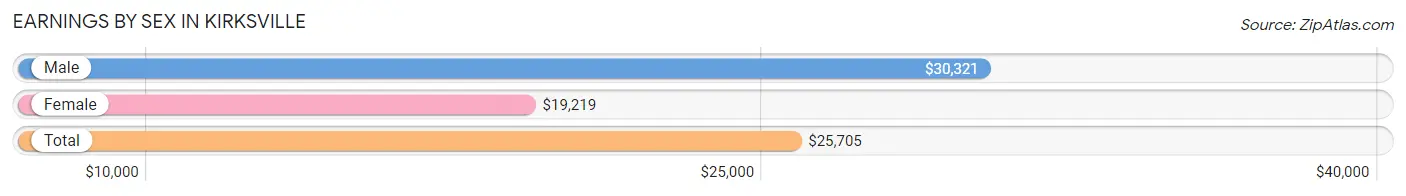
Earnings by Sex in Kirksville
Average Earnings in Kirksville are $25,705, $30,321 for men and $19,219 for women, a difference of 36.6%.
| Sex | Number | Average Earnings |
| Male | 4,189 (50.2%) | $30,321 |
| Female | 4,149 (49.8%) | $19,219 |
| Total | 8,338 (100.0%) | $25,705 |
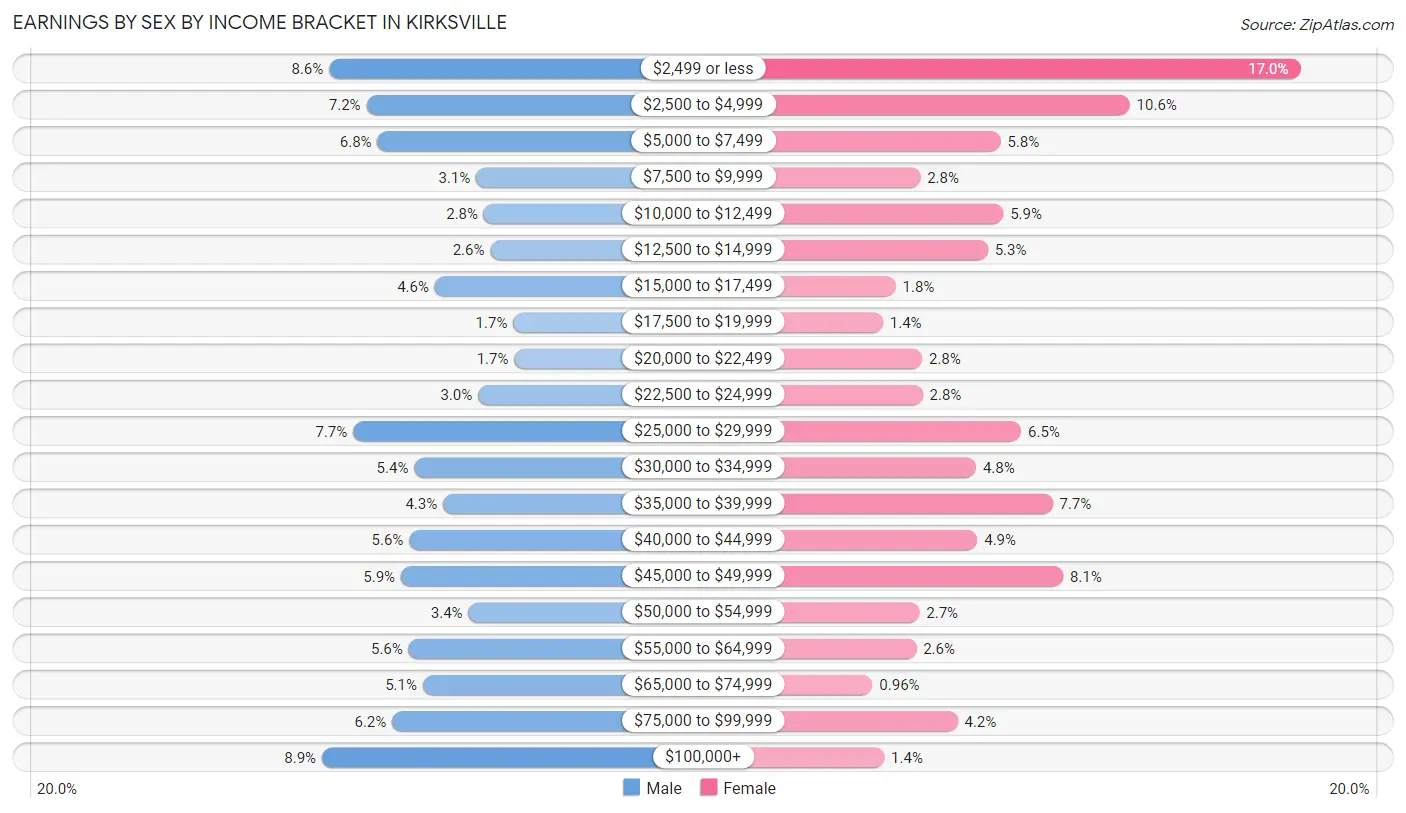
Earnings by Sex by Income Bracket in Kirksville
The most common earnings brackets in Kirksville are $100,000+ for men (371 | 8.9%) and $2,499 or less for women (705 | 17.0%).
| Income | Male | Female |
| $2,499 or less | 360 (8.6%) | 705 (17.0%) |
| $2,500 to $4,999 | 301 (7.2%) | 440 (10.6%) |
| $5,000 to $7,499 | 284 (6.8%) | 239 (5.8%) |
| $7,500 to $9,999 | 129 (3.1%) | 114 (2.8%) |
| $10,000 to $12,499 | 117 (2.8%) | 243 (5.9%) |
| $12,500 to $14,999 | 107 (2.5%) | 219 (5.3%) |
| $15,000 to $17,499 | 194 (4.6%) | 76 (1.8%) |
| $17,500 to $19,999 | 71 (1.7%) | 56 (1.3%) |
| $20,000 to $22,499 | 69 (1.7%) | 117 (2.8%) |
| $22,500 to $24,999 | 126 (3.0%) | 118 (2.8%) |
| $25,000 to $29,999 | 322 (7.7%) | 271 (6.5%) |
| $30,000 to $34,999 | 226 (5.4%) | 201 (4.8%) |
| $35,000 to $39,999 | 181 (4.3%) | 320 (7.7%) |
| $40,000 to $44,999 | 234 (5.6%) | 203 (4.9%) |
| $45,000 to $49,999 | 247 (5.9%) | 336 (8.1%) |
| $50,000 to $54,999 | 141 (3.4%) | 113 (2.7%) |
| $55,000 to $64,999 | 235 (5.6%) | 108 (2.6%) |
| $65,000 to $74,999 | 213 (5.1%) | 40 (1.0%) |
| $75,000 to $99,999 | 261 (6.2%) | 172 (4.2%) |
| $100,000+ | 371 (8.9%) | 58 (1.4%) |
| Total | 4,189 (100.0%) | 4,149 (100.0%) |
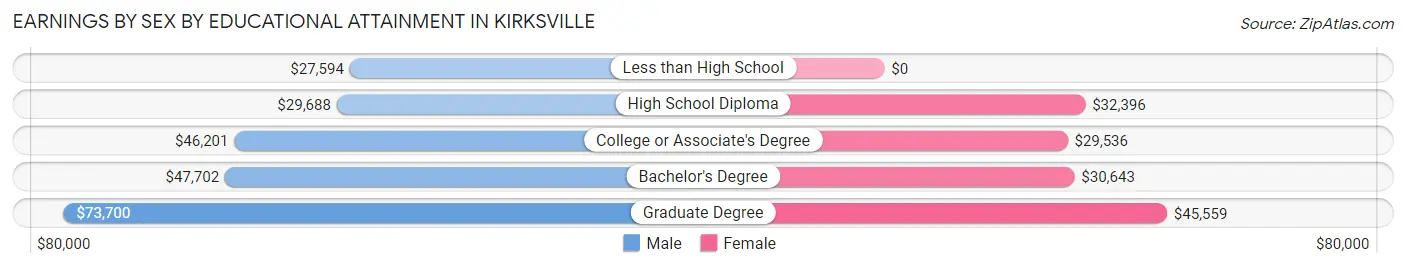
Earnings by Sex by Educational Attainment in Kirksville
Average earnings in Kirksville are $45,160 for men and $35,508 for women, a difference of 21.4%. Men with an educational attainment of graduate degree enjoy the highest average annual earnings of $73,700, while those with less than high school education earn the least with $27,594. Women with an educational attainment of graduate degree earn the most with the average annual earnings of $45,559, while those with college or associate's degree education have the smallest earnings of $29,536.
| Educational Attainment | Male Income | Female Income |
| Less than High School | $27,594 | $0 |
| High School Diploma | $29,688 | $32,396 |
| College or Associate's Degree | $46,201 | $29,536 |
| Bachelor's Degree | $47,702 | $30,643 |
| Graduate Degree | $73,700 | $45,559 |
| Total | $45,160 | $35,508 |
Family Income in Kirksville
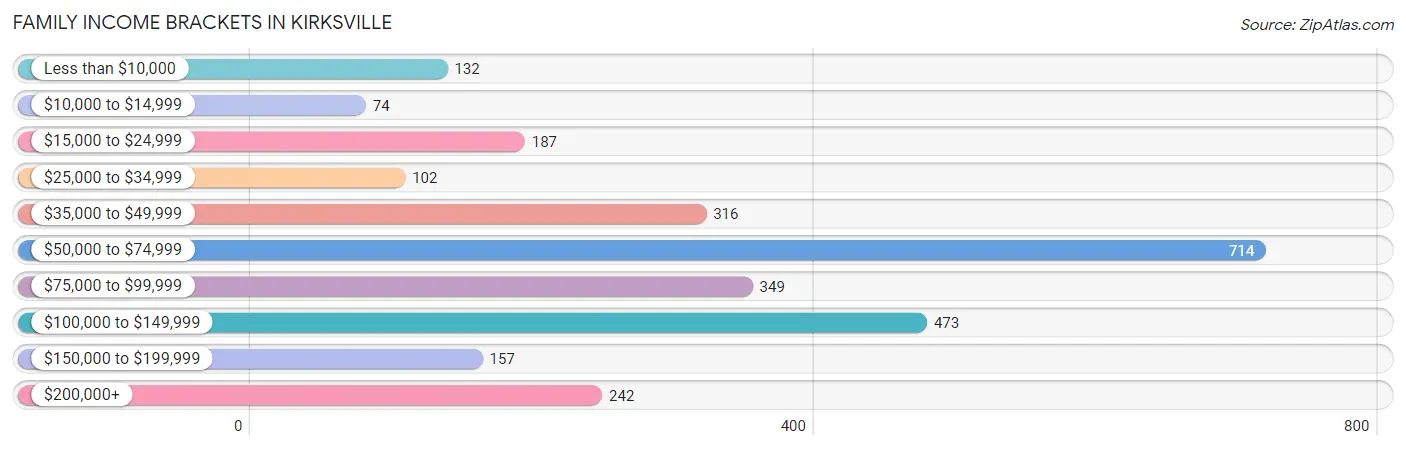
Family Income Brackets in Kirksville
According to the Kirksville family income data, there are 714 families falling into the $50,000 to $74,999 income range, which is the most common income bracket and makes up 26.0% of all families. Conversely, the $10,000 to $14,999 income bracket is the least frequent group with only 74 families (2.7%) belonging to this category.
| Income Bracket | # Families | % Families |
| Less than $10,000 | 132 | 4.8% |
| $10,000 to $14,999 | 74 | 2.7% |
| $15,000 to $24,999 | 187 | 6.8% |
| $25,000 to $34,999 | 102 | 3.7% |
| $35,000 to $49,999 | 316 | 11.5% |
| $50,000 to $74,999 | 714 | 26.0% |
| $75,000 to $99,999 | 349 | 12.7% |
| $100,000 to $149,999 | 473 | 17.2% |
| $150,000 to $199,999 | 157 | 5.7% |
| $200,000+ | 242 | 8.8% |
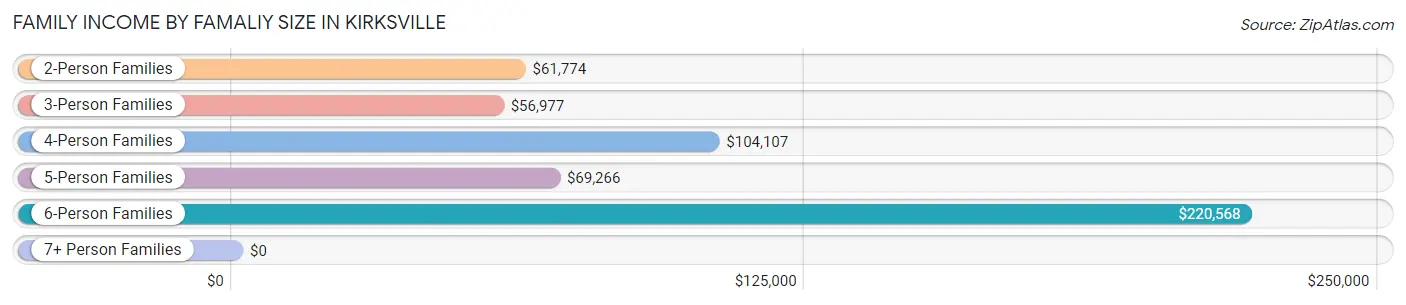
Family Income by Famaliy Size in Kirksville
6-person families (51 | 1.9%) account for the highest median family income in Kirksville with $220,568 per family, while 6-person families (51 | 1.9%) have the highest median income of $36,761 per family member.
| Income Bracket | # Families | Median Income |
| 2-Person Families | 1,417 (51.6%) | $61,774 |
| 3-Person Families | 559 (20.3%) | $56,977 |
| 4-Person Families | 516 (18.8%) | $104,107 |
| 5-Person Families | 205 (7.5%) | $69,266 |
| 6-Person Families | 51 (1.9%) | $220,568 |
| 7+ Person Families | 0 (0.0%) | $0 |
| Total | 2,748 (100.0%) | $68,045 |
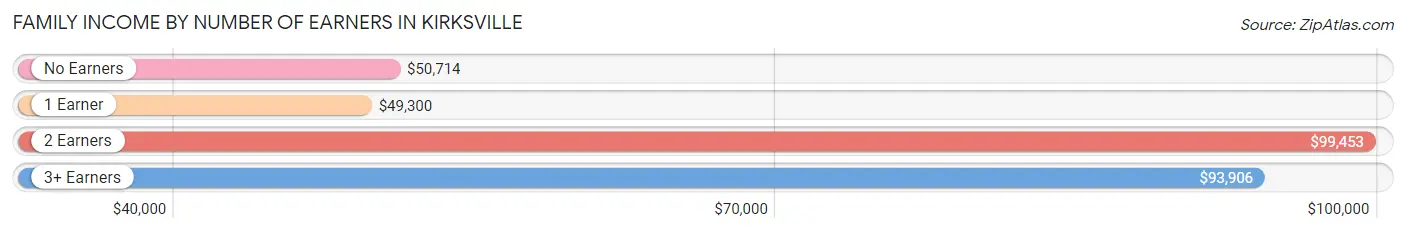
Family Income by Number of Earners in Kirksville
The median family income in Kirksville is $68,045, with families comprising 2 earners (1,173) having the highest median family income of $99,453, while families with 1 earner (962) have the lowest median family income of $49,300, accounting for 42.7% and 35.0% of families, respectively.
| Number of Earners | # Families | Median Income |
| No Earners | 404 (14.7%) | $50,714 |
| 1 Earner | 962 (35.0%) | $49,300 |
| 2 Earners | 1,173 (42.7%) | $99,453 |
| 3+ Earners | 209 (7.6%) | $93,906 |
| Total | 2,748 (100.0%) | $68,045 |
Household Income in Kirksville
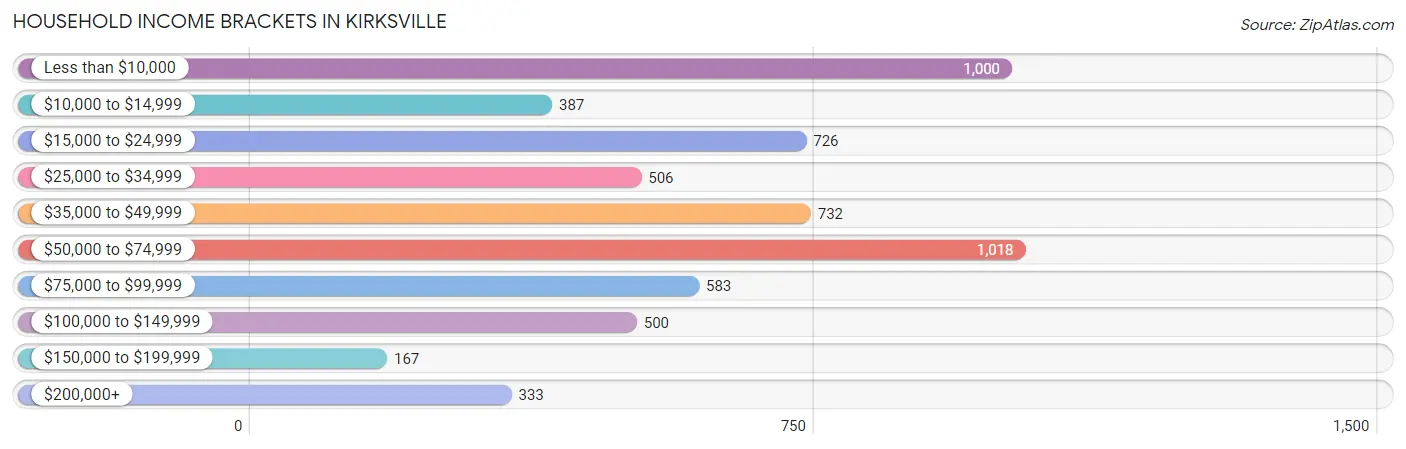
Household Income Brackets in Kirksville
With 1,018 households falling in the category, the $50,000 to $74,999 income range is the most frequent in Kirksville, accounting for 17.1% of all households. In contrast, only 167 households (2.8%) fall into the $150,000 to $199,999 income bracket, making it the least populous group.
| Income Bracket | # Households | % Households |
| Less than $10,000 | 1,000 | 16.8% |
| $10,000 to $14,999 | 387 | 6.5% |
| $15,000 to $24,999 | 726 | 12.2% |
| $25,000 to $34,999 | 506 | 8.5% |
| $35,000 to $49,999 | 732 | 12.3% |
| $50,000 to $74,999 | 1,018 | 17.1% |
| $75,000 to $99,999 | 583 | 9.8% |
| $100,000 to $149,999 | 500 | 8.4% |
| $150,000 to $199,999 | 167 | 2.8% |
| $200,000+ | 333 | 5.6% |
Household Income by Householder Age in Kirksville
The median household income in Kirksville is $41,089, with the highest median household income of $61,713 found in the 45 to 64 years age bracket for the primary householder. A total of 1,747 households (29.4%) fall into this category. Meanwhile, the 15 to 24 years age bracket for the primary householder has the lowest median household income of $0, with 1,063 households (17.9%) in this group.
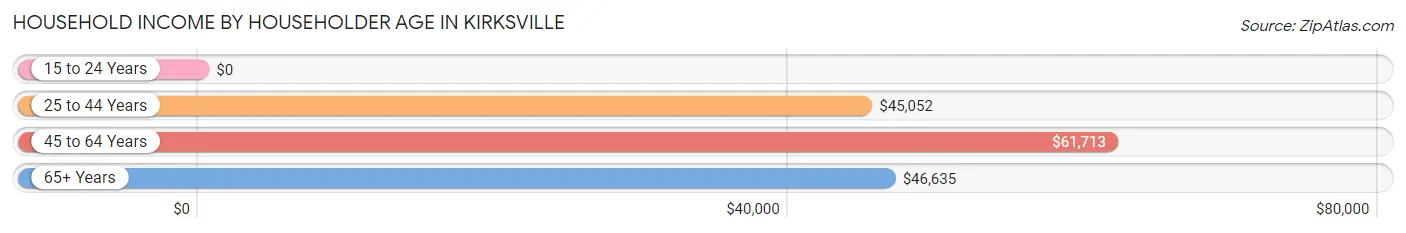
| Income Bracket | # Households | Median Income |
| 15 to 24 Years | 1,063 (17.9%) | $0 |
| 25 to 44 Years | 1,830 (30.7%) | $45,052 |
| 45 to 64 Years | 1,747 (29.4%) | $61,713 |
| 65+ Years | 1,311 (22.0%) | $46,635 |
| Total | 5,951 (100.0%) | $41,089 |
Poverty in Kirksville
Income Below Poverty by Sex and Age in Kirksville
With 25.0% poverty level for males and 34.3% for females among the residents of Kirksville, 18 to 24 year old males and 18 to 24 year old females are the most vulnerable to poverty, with 1,163 males (61.2%) and 1,760 females (79.2%) in their respective age groups living below the poverty level.
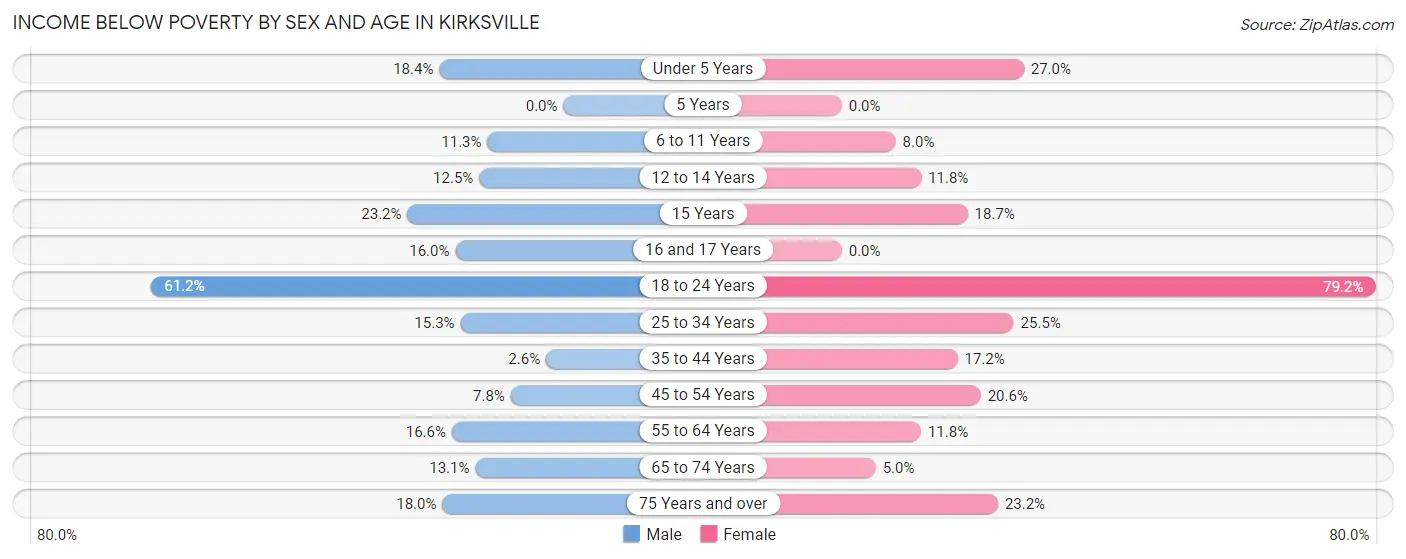
| Age Bracket | Male | Female |
| Under 5 Years | 80 (18.4%) | 110 (27.0%) |
| 5 Years | 0 (0.0%) | 0 (0.0%) |
| 6 to 11 Years | 68 (11.3%) | 36 (8.0%) |
| 12 to 14 Years | 28 (12.5%) | 27 (11.8%) |
| 15 Years | 22 (23.2%) | 20 (18.7%) |
| 16 and 17 Years | 17 (16.0%) | 0 (0.0%) |
| 18 to 24 Years | 1,163 (61.2%) | 1,760 (79.2%) |
| 25 to 34 Years | 135 (15.3%) | 233 (25.5%) |
| 35 to 44 Years | 19 (2.6%) | 128 (17.2%) |
| 45 to 54 Years | 56 (7.8%) | 164 (20.6%) |
| 55 to 64 Years | 118 (16.6%) | 83 (11.8%) |
| 65 to 74 Years | 62 (13.1%) | 30 (5.0%) |
| 75 Years and over | 66 (18.0%) | 141 (23.2%) |
| Total | 1,834 (25.0%) | 2,732 (34.3%) |
Income Above Poverty by Sex and Age in Kirksville
According to the poverty statistics in Kirksville, males aged 5 years and females aged 5 years are the age groups that are most secure financially, with 100.0% of males and 100.0% of females in these age groups living above the poverty line.
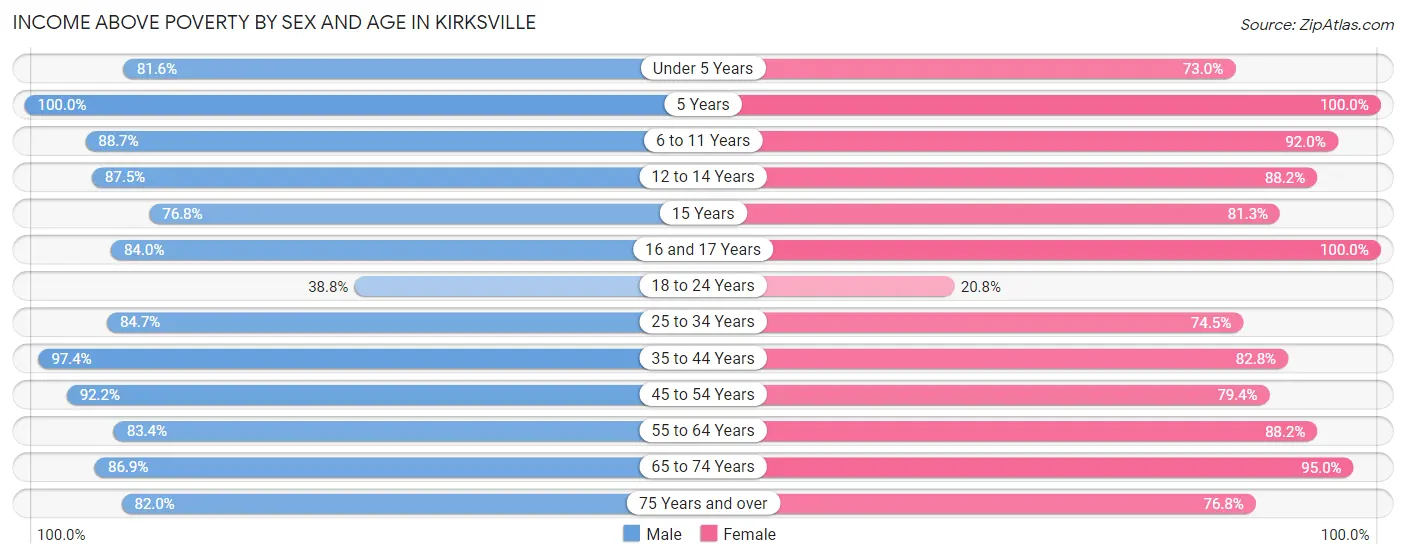
| Age Bracket | Male | Female |
| Under 5 Years | 354 (81.6%) | 297 (73.0%) |
| 5 Years | 76 (100.0%) | 52 (100.0%) |
| 6 to 11 Years | 535 (88.7%) | 414 (92.0%) |
| 12 to 14 Years | 196 (87.5%) | 202 (88.2%) |
| 15 Years | 73 (76.8%) | 87 (81.3%) |
| 16 and 17 Years | 89 (84.0%) | 135 (100.0%) |
| 18 to 24 Years | 738 (38.8%) | 462 (20.8%) |
| 25 to 34 Years | 748 (84.7%) | 680 (74.5%) |
| 35 to 44 Years | 718 (97.4%) | 616 (82.8%) |
| 45 to 54 Years | 660 (92.2%) | 631 (79.4%) |
| 55 to 64 Years | 594 (83.4%) | 623 (88.2%) |
| 65 to 74 Years | 412 (86.9%) | 565 (95.0%) |
| 75 Years and over | 301 (82.0%) | 467 (76.8%) |
| Total | 5,494 (75.0%) | 5,231 (65.7%) |
Income Below Poverty Among Married-Couple Families in Kirksville
The poverty statistics for married-couple families in Kirksville show that 3.6% or 75 of the total 2,062 families live below the poverty line. Families with no children have the highest poverty rate of 4.1%, comprising of 47 families. On the other hand, families with 3 or 4 children have the lowest poverty rate of 0.0%, which includes 0 families.
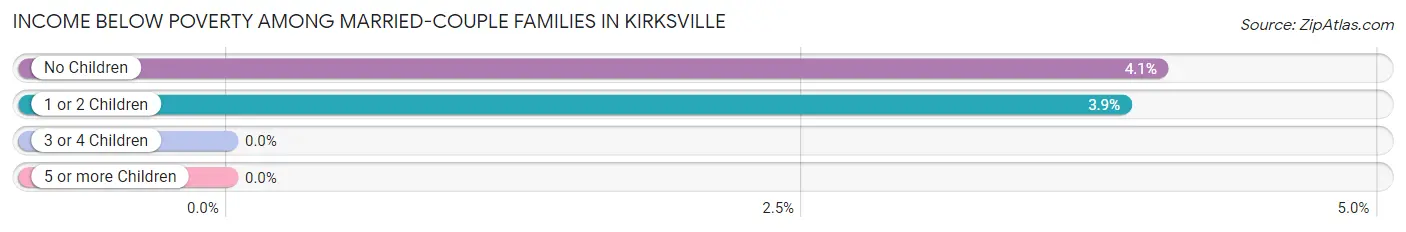
| Children | Above Poverty | Below Poverty |
| No Children | 1,114 (96.0%) | 47 (4.1%) |
| 1 or 2 Children | 692 (96.1%) | 28 (3.9%) |
| 3 or 4 Children | 181 (100.0%) | 0 (0.0%) |
| 5 or more Children | 0 (0.0%) | 0 (0.0%) |
| Total | 1,987 (96.4%) | 75 (3.6%) |
Income Below Poverty Among Single-Parent Households in Kirksville
According to the poverty data in Kirksville, 20.0% or 28 single-father households and 32.1% or 175 single-mother households are living below the poverty line. Among single-father households, those with 1 or 2 children have the highest poverty rate, with 28 households (42.4%) experiencing poverty. Likewise, among single-mother households, those with 3 or 4 children have the highest poverty rate, with 32 households (62.7%) falling below the poverty line.
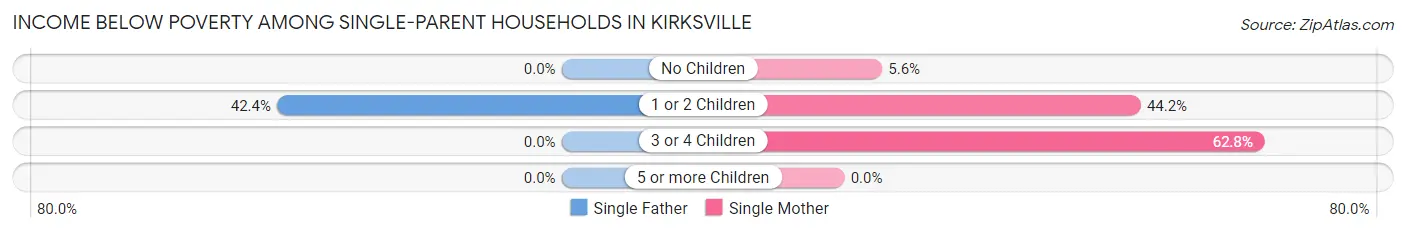
| Children | Single Father | Single Mother |
| No Children | 0 (0.0%) | 11 (5.6%) |
| 1 or 2 Children | 28 (42.4%) | 132 (44.2%) |
| 3 or 4 Children | 0 (0.0%) | 32 (62.7%) |
| 5 or more Children | 0 (0.0%) | 0 (0.0%) |
| Total | 28 (20.0%) | 175 (32.1%) |
Income Below Poverty Among Married-Couple vs Single-Parent Households in Kirksville
The poverty data for Kirksville shows that 75 of the married-couple family households (3.6%) and 203 of the single-parent households (29.6%) are living below the poverty level. Within the married-couple family households, those with no children have the highest poverty rate, with 47 households (4.1%) falling below the poverty line. Among the single-parent households, those with 3 or 4 children have the highest poverty rate, with 32 household (58.2%) living below poverty.
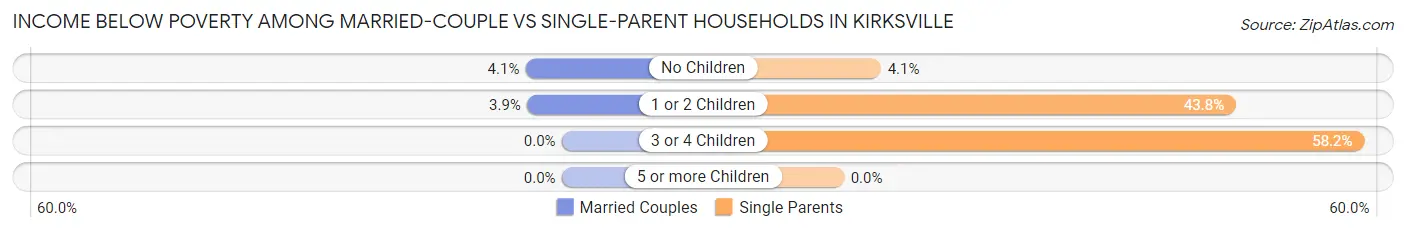
| Children | Married-Couple Families | Single-Parent Households |
| No Children | 47 (4.1%) | 11 (4.1%) |
| 1 or 2 Children | 28 (3.9%) | 160 (43.8%) |
| 3 or 4 Children | 0 (0.0%) | 32 (58.2%) |
| 5 or more Children | 0 (0.0%) | 0 (0.0%) |
| Total | 75 (3.6%) | 203 (29.6%) |
Race in Kirksville
The most populous races in Kirksville are White / Caucasian (15,285 | 87.2%), Black / African American (1,031 | 5.9%), and Two or more Races (548 | 3.1%).
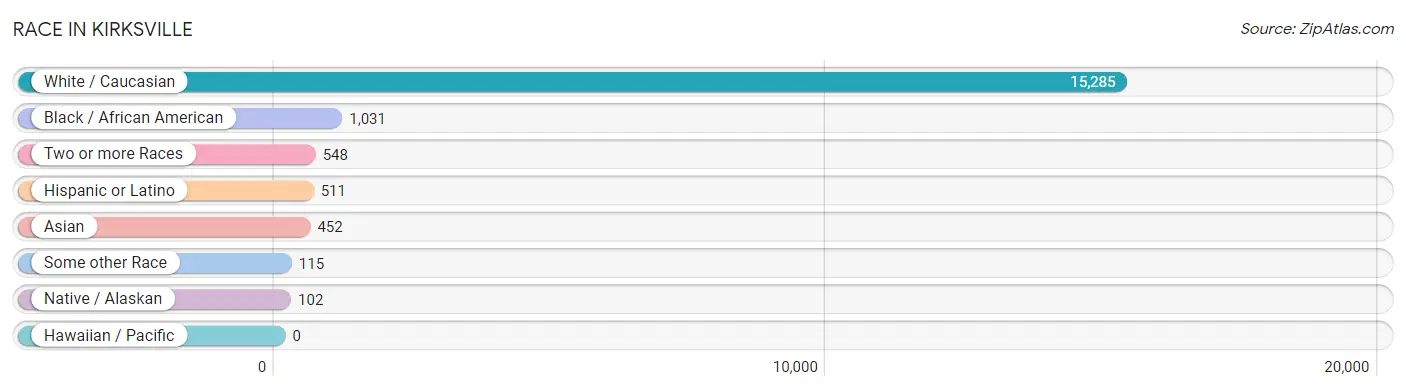
| Race | # Population | % Population |
| Asian | 452 | 2.6% |
| Black / African American | 1,031 | 5.9% |
| Hawaiian / Pacific | 0 | 0.0% |
| Hispanic or Latino | 511 | 2.9% |
| Native / Alaskan | 102 | 0.6% |
| White / Caucasian | 15,285 | 87.2% |
| Two or more Races | 548 | 3.1% |
| Some other Race | 115 | 0.7% |
| Total | 17,533 | 100.0% |
Ancestry in Kirksville
The most populous ancestries reported in Kirksville are German (3,612 | 20.6%), Irish (2,239 | 12.8%), English (1,624 | 9.3%), American (672 | 3.8%), and Subsaharan African (628 | 3.6%), together accounting for 50.0% of all Kirksville residents.
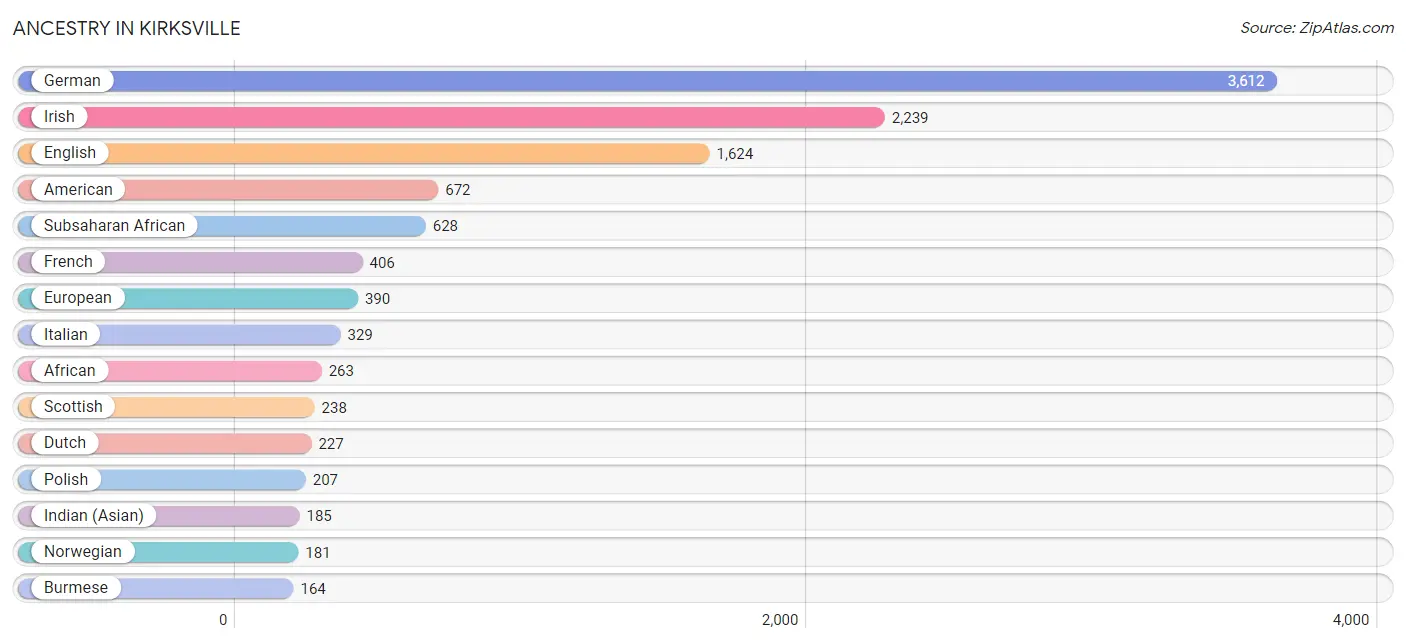
| Ancestry | # Population | % Population |
| African | 263 | 1.5% |
| American | 672 | 3.8% |
| Arab | 13 | 0.1% |
| Arapaho | 17 | 0.1% |
| Argentinean | 24 | 0.1% |
| Australian | 40 | 0.2% |
| Austrian | 9 | 0.1% |
| Belgian | 74 | 0.4% |
| Bhutanese | 46 | 0.3% |
| Bolivian | 10 | 0.1% |
| Brazilian | 1 | 0.0% |
| British | 27 | 0.2% |
| Burmese | 164 | 0.9% |
| Canadian | 10 | 0.1% |
| Central American | 114 | 0.6% |
| Central American Indian | 28 | 0.2% |
| Cherokee | 41 | 0.2% |
| Cheyenne | 13 | 0.1% |
| Chickasaw | 25 | 0.1% |
| Colombian | 116 | 0.7% |
| Croatian | 35 | 0.2% |
| Czech | 100 | 0.6% |
| Danish | 23 | 0.1% |
| Dutch | 227 | 1.3% |
| English | 1,624 | 9.3% |
| European | 390 | 2.2% |
| Finnish | 32 | 0.2% |
| French | 406 | 2.3% |
| French Canadian | 15 | 0.1% |
| German | 3,612 | 20.6% |
| Greek | 21 | 0.1% |
| Honduran | 84 | 0.5% |
| Hungarian | 46 | 0.3% |
| Indian (Asian) | 185 | 1.1% |
| Irish | 2,239 | 12.8% |
| Italian | 329 | 1.9% |
| Korean | 45 | 0.3% |
| Lumbee | 16 | 0.1% |
| Mexican | 141 | 0.8% |
| Native Hawaiian | 16 | 0.1% |
| Nicaraguan | 30 | 0.2% |
| Northern European | 81 | 0.5% |
| Norwegian | 181 | 1.0% |
| Polish | 207 | 1.2% |
| Portuguese | 29 | 0.2% |
| Pueblo | 4 | 0.0% |
| Puerto Rican | 69 | 0.4% |
| Russian | 9 | 0.1% |
| Scandinavian | 4 | 0.0% |
| Scotch-Irish | 156 | 0.9% |
| Scottish | 238 | 1.4% |
| Sioux | 21 | 0.1% |
| South American | 150 | 0.9% |
| Sri Lankan | 92 | 0.5% |
| Subsaharan African | 628 | 3.6% |
| Swedish | 117 | 0.7% |
| Swiss | 60 | 0.3% |
| Thai | 73 | 0.4% |
| Turkish | 28 | 0.2% |
| Ukrainian | 4 | 0.0% |
| Welsh | 108 | 0.6% | View All 61 Rows |
Immigrants in Kirksville
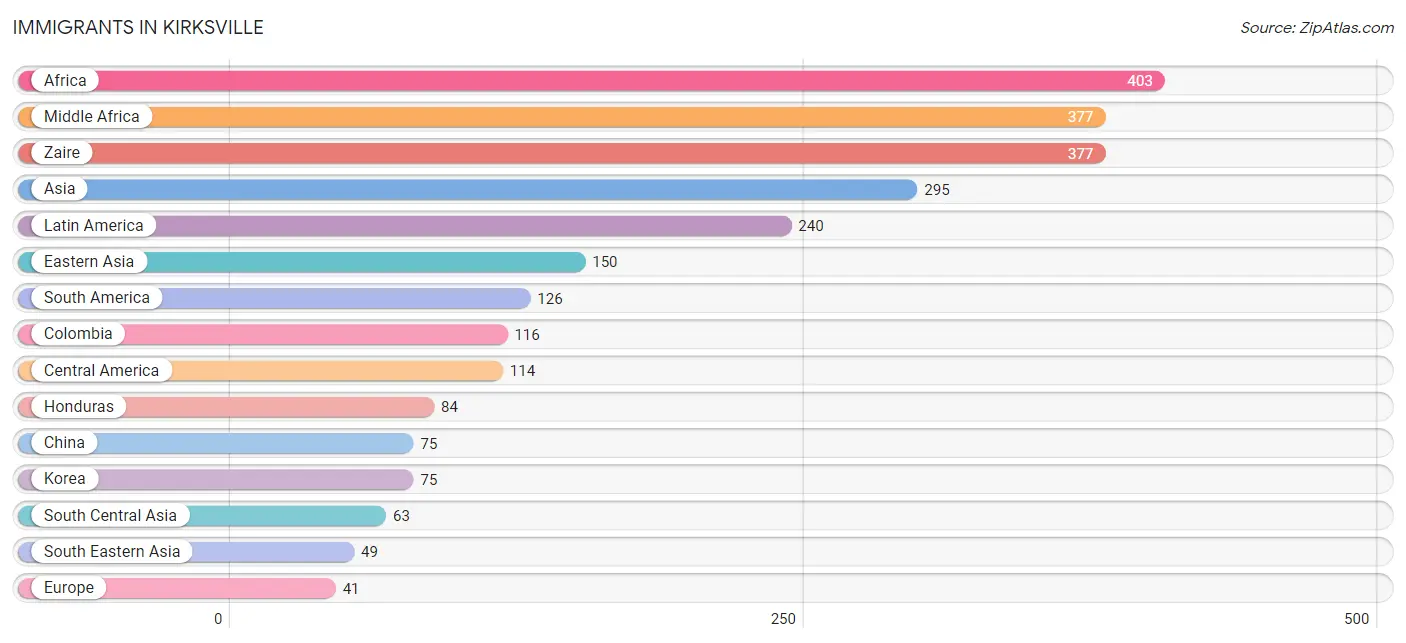
The most numerous immigrant groups reported in Kirksville came from Africa (403 | 2.3%), Middle Africa (377 | 2.1%), Zaire (377 | 2.1%), Asia (295 | 1.7%), and Latin America (240 | 1.4%), together accounting for 9.7% of all Kirksville residents.
| Immigration Origin | # Population | % Population |
| Africa | 403 | 2.3% |
| Asia | 295 | 1.7% |
| Australia | 11 | 0.1% |
| Austria | 7 | 0.0% |
| Bolivia | 10 | 0.1% |
| Central America | 114 | 0.6% |
| China | 75 | 0.4% |
| Colombia | 116 | 0.7% |
| Eastern Africa | 26 | 0.2% |
| Eastern Asia | 150 | 0.9% |
| Eastern Europe | 13 | 0.1% |
| Eritrea | 26 | 0.2% |
| Europe | 41 | 0.2% |
| Germany | 16 | 0.1% |
| Honduras | 84 | 0.5% |
| India | 17 | 0.1% |
| Korea | 75 | 0.4% |
| Latin America | 240 | 1.4% |
| Malaysia | 34 | 0.2% |
| Middle Africa | 377 | 2.1% |
| Nepal | 20 | 0.1% |
| Netherlands | 5 | 0.0% |
| Nicaragua | 30 | 0.2% |
| Oceania | 14 | 0.1% |
| Pakistan | 21 | 0.1% |
| Philippines | 15 | 0.1% |
| Russia | 9 | 0.1% |
| South America | 126 | 0.7% |
| South Central Asia | 63 | 0.4% |
| South Eastern Asia | 49 | 0.3% |
| Turkey | 15 | 0.1% |
| Ukraine | 4 | 0.0% |
| Uzbekistan | 5 | 0.0% |
| Western Asia | 15 | 0.1% |
| Western Europe | 28 | 0.2% |
| Zaire | 377 | 2.1% | View All 36 Rows |
Sex and Age in Kirksville
Sex and Age in Kirksville
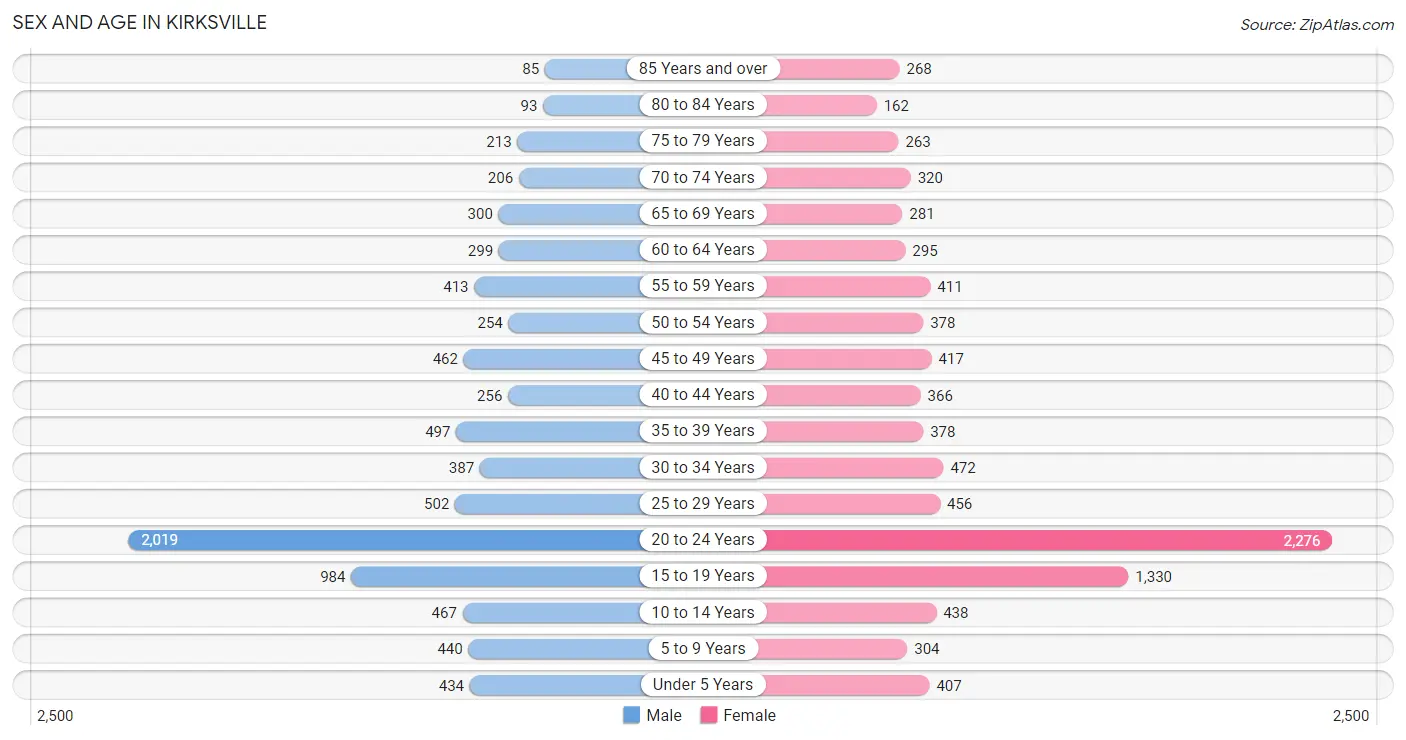
The most populous age groups in Kirksville are 20 to 24 Years (2,019 | 24.3%) for men and 20 to 24 Years (2,276 | 24.7%) for women.
| Age Bracket | Male | Female |
| Under 5 Years | 434 (5.2%) | 407 (4.4%) |
| 5 to 9 Years | 440 (5.3%) | 304 (3.3%) |
| 10 to 14 Years | 467 (5.6%) | 438 (4.8%) |
| 15 to 19 Years | 984 (11.8%) | 1,330 (14.4%) |
| 20 to 24 Years | 2,019 (24.3%) | 2,276 (24.7%) |
| 25 to 29 Years | 502 (6.0%) | 456 (4.9%) |
| 30 to 34 Years | 387 (4.7%) | 472 (5.1%) |
| 35 to 39 Years | 497 (6.0%) | 378 (4.1%) |
| 40 to 44 Years | 256 (3.1%) | 366 (4.0%) |
| 45 to 49 Years | 462 (5.6%) | 417 (4.5%) |
| 50 to 54 Years | 254 (3.1%) | 378 (4.1%) |
| 55 to 59 Years | 413 (5.0%) | 411 (4.5%) |
| 60 to 64 Years | 299 (3.6%) | 295 (3.2%) |
| 65 to 69 Years | 300 (3.6%) | 281 (3.0%) |
| 70 to 74 Years | 206 (2.5%) | 320 (3.5%) |
| 75 to 79 Years | 213 (2.6%) | 263 (2.9%) |
| 80 to 84 Years | 93 (1.1%) | 162 (1.8%) |
| 85 Years and over | 85 (1.0%) | 268 (2.9%) |
| Total | 8,311 (100.0%) | 9,222 (100.0%) |
Families and Households in Kirksville
Median Family Size in Kirksville
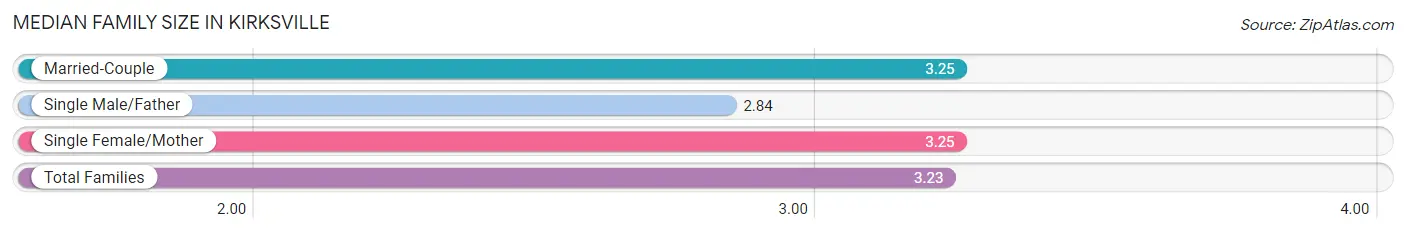
The median family size in Kirksville is 3.23 persons per family, with married-couple families (2,062 | 75.0%) accounting for the largest median family size of 3.25 persons per family. On the other hand, single male/father families (140 | 5.1%) represent the smallest median family size with 2.84 persons per family.
| Family Type | # Families | Family Size |
| Married-Couple | 2,062 (75.0%) | 3.25 |
| Single Male/Father | 140 (5.1%) | 2.84 |
| Single Female/Mother | 546 (19.9%) | 3.25 |
| Total Families | 2,748 (100.0%) | 3.23 |
Median Household Size in Kirksville
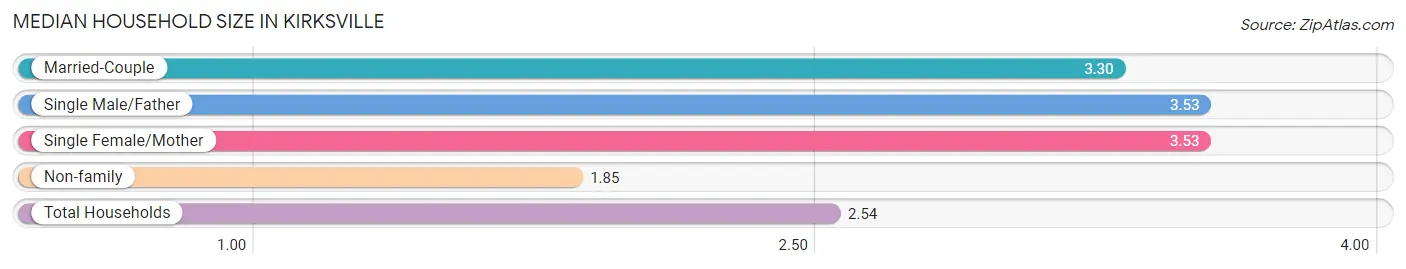
The median household size in Kirksville is 2.54 persons per household, with single male/father households (140 | 2.4%) accounting for the largest median household size of 3.53 persons per household. non-family households (3,203 | 53.8%) represent the smallest median household size with 1.85 persons per household.
| Household Type | # Households | Household Size |
| Married-Couple | 2,062 (34.6%) | 3.30 |
| Single Male/Father | 140 (2.4%) | 3.53 |
| Single Female/Mother | 546 (9.2%) | 3.53 |
| Non-family | 3,203 (53.8%) | 1.85 |
| Total Households | 5,951 (100.0%) | 2.54 |
Household Size by Marriage Status in Kirksville
Out of a total of 5,951 households in Kirksville, 2,748 (46.2%) are family households, while 3,203 (53.8%) are nonfamily households. The most numerous type of family households are 2-person households, comprising 1,314, and the most common type of nonfamily households are 1-person households, comprising 2,351.
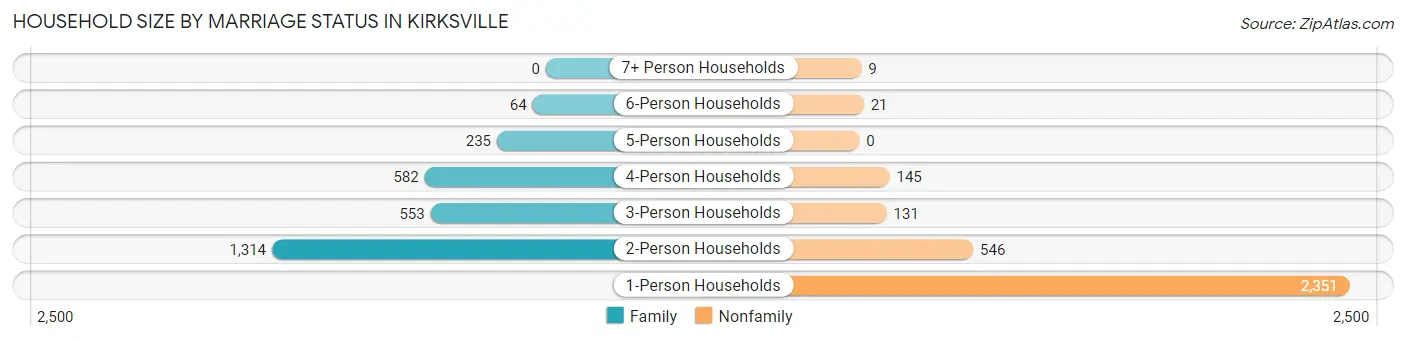
| Household Size | Family Households | Nonfamily Households |
| 1-Person Households | - | 2,351 (39.5%) |
| 2-Person Households | 1,314 (22.1%) | 546 (9.2%) |
| 3-Person Households | 553 (9.3%) | 131 (2.2%) |
| 4-Person Households | 582 (9.8%) | 145 (2.4%) |
| 5-Person Households | 235 (4.0%) | 0 (0.0%) |
| 6-Person Households | 64 (1.1%) | 21 (0.4%) |
| 7+ Person Households | 0 (0.0%) | 9 (0.2%) |
| Total | 2,748 (46.2%) | 3,203 (53.8%) |
Female Fertility in Kirksville
Fertility by Age in Kirksville
Average fertility rate in Kirksville is 48.0 births per 1,000 women. Women in the age bracket of 20 to 34 years have the highest fertility rate with 64.0 births per 1,000 women. Women in the age bracket of 20 to 34 years acount for 73.7% of all women with births.
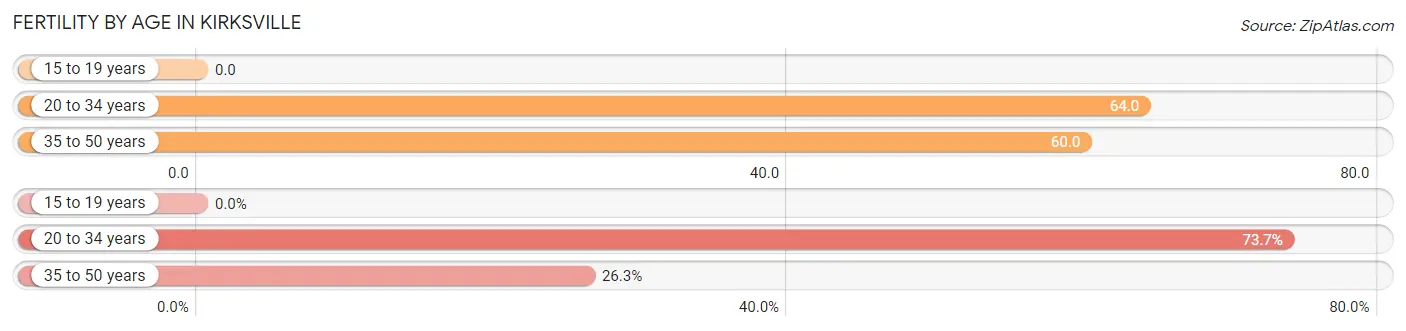
| Age Bracket | Women with Births | Births / 1,000 Women |
| 15 to 19 years | 0 (0.0%) | 0.0 |
| 20 to 34 years | 205 (73.7%) | 64.0 |
| 35 to 50 years | 73 (26.3%) | 60.0 |
| Total | 278 (100.0%) | 48.0 |
Fertility by Age by Marriage Status in Kirksville
84.5% of women with births (278) in Kirksville are married. The highest percentage of unmarried women with births falls into 20 to 34 years age bracket with 21.0% of them unmarried at the time of birth, while the lowest percentage of unmarried women with births belong to 35 to 50 years age bracket with 0.0% of them unmarried.
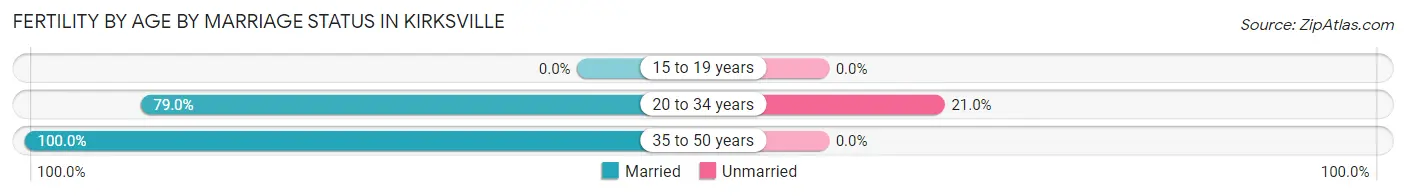
| Age Bracket | Married | Unmarried |
| 15 to 19 years | 0 (0.0%) | 0 (0.0%) |
| 20 to 34 years | 162 (79.0%) | 43 (21.0%) |
| 35 to 50 years | 73 (100.0%) | 0 (0.0%) |
| Total | 235 (84.5%) | 43 (15.5%) |
Fertility by Education in Kirksville
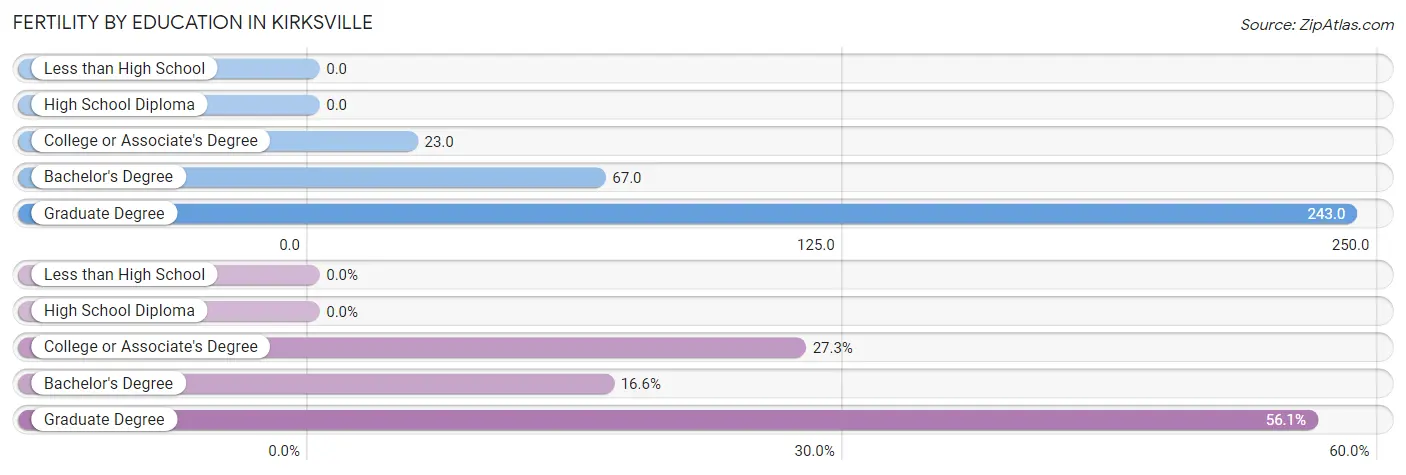
| Educational Attainment | Women with Births | Births / 1,000 Women |
| Less than High School | 0 (0.0%) | 0.0 |
| High School Diploma | 0 (0.0%) | 0.0 |
| College or Associate's Degree | 76 (27.3%) | 23.0 |
| Bachelor's Degree | 46 (16.6%) | 67.0 |
| Graduate Degree | 156 (56.1%) | 243.0 |
| Total | 278 (100.0%) | 48.0 |
Fertility by Education by Marriage Status in Kirksville
15.5% of women with births in Kirksville are unmarried. Women with the educational attainment of graduate degree are most likely to be married with 100.0% of them married at childbirth, while women with the educational attainment of bachelor's degree are least likely to be married with 54.3% of them unmarried at childbirth.
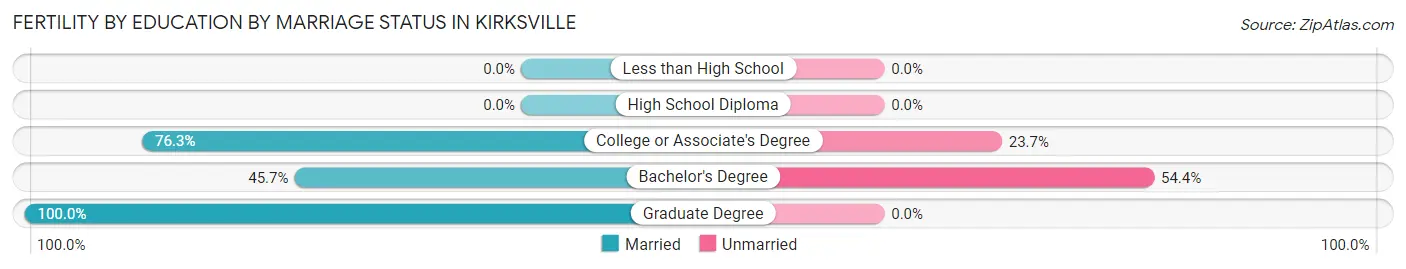
| Educational Attainment | Married | Unmarried |
| Less than High School | 0 (0.0%) | 0 (0.0%) |
| High School Diploma | 0 (0.0%) | 0 (0.0%) |
| College or Associate's Degree | 58 (76.3%) | 18 (23.7%) |
| Bachelor's Degree | 21 (45.7%) | 25 (54.3%) |
| Graduate Degree | 156 (100.0%) | 0 (0.0%) |
| Total | 235 (84.5%) | 43 (15.5%) |
Employment Characteristics in Kirksville
Employment by Class of Employer in Kirksville
Among the 6,402 employed individuals in Kirksville, private company employees (4,002 | 62.5%), not-for-profit organizations (890 | 13.9%), and state government employees (706 | 11.0%) make up the most common classes of employment.
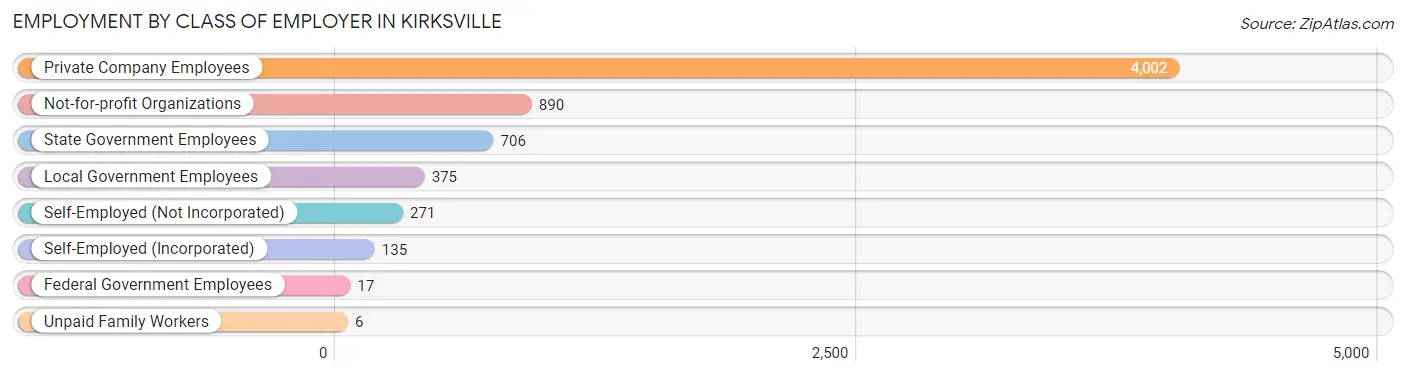
| Employer Class | # Employees | % Employees |
| Private Company Employees | 4,002 | 62.5% |
| Self-Employed (Incorporated) | 135 | 2.1% |
| Self-Employed (Not Incorporated) | 271 | 4.2% |
| Not-for-profit Organizations | 890 | 13.9% |
| Local Government Employees | 375 | 5.9% |
| State Government Employees | 706 | 11.0% |
| Federal Government Employees | 17 | 0.3% |
| Unpaid Family Workers | 6 | 0.1% |
| Total | 6,402 | 100.0% |
Employment Status by Age in Kirksville
According to the labor force statistics for Kirksville, out of the total population over 16 years of age (14,836), 46.6% or 6,914 individuals are in the labor force, with 5.8% or 401 of them unemployed. The age group with the highest labor force participation rate is 35 to 44 years, with 87.4% or 1,308 individuals in the labor force. Within the labor force, the 20 to 24 years age range has the highest percentage of unemployed individuals, with 12.2% or 177 of them being unemployed.
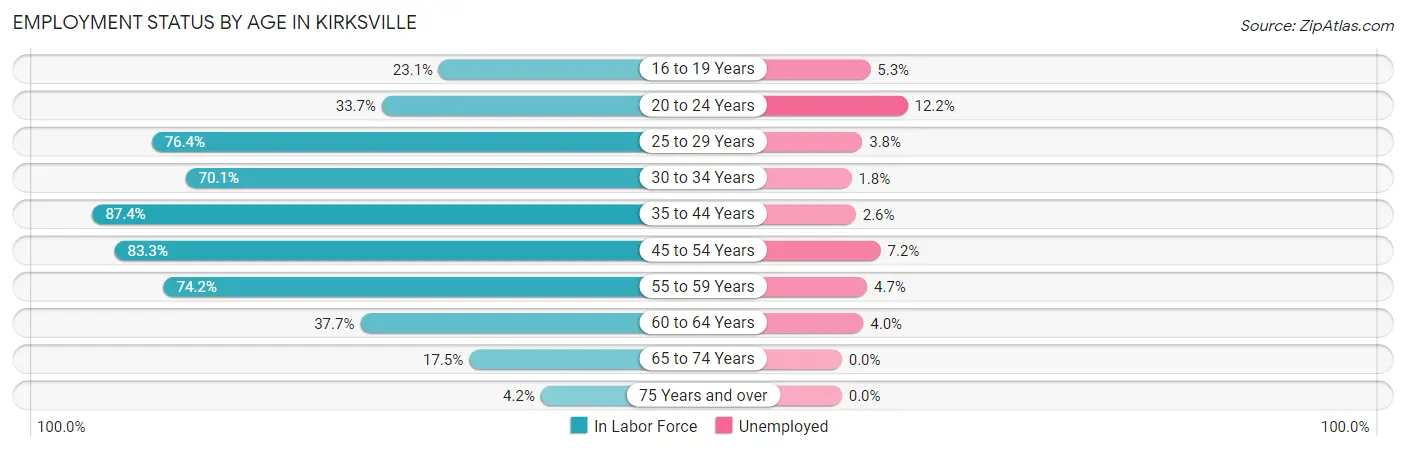
| Age Bracket | In Labor Force | Unemployed |
| 16 to 19 Years | 487 (23.1%) | 26 (5.3%) |
| 20 to 24 Years | 1,447 (33.7%) | 177 (12.2%) |
| 25 to 29 Years | 732 (76.4%) | 28 (3.8%) |
| 30 to 34 Years | 602 (70.1%) | 11 (1.8%) |
| 35 to 44 Years | 1,308 (87.4%) | 34 (2.6%) |
| 45 to 54 Years | 1,259 (83.3%) | 91 (7.2%) |
| 55 to 59 Years | 611 (74.2%) | 29 (4.7%) |
| 60 to 64 Years | 224 (37.7%) | 9 (4.0%) |
| 65 to 74 Years | 194 (17.5%) | 0 (0.0%) |
| 75 Years and over | 46 (4.2%) | 0 (0.0%) |
| Total | 6,914 (46.6%) | 401 (5.8%) |
Employment Status by Educational Attainment in Kirksville
According to labor force statistics for Kirksville, 75.8% of individuals (4,732) out of the total population between 25 and 64 years of age (6,243) are in the labor force, with 4.3% or 203 of them being unemployed. The group with the highest labor force participation rate are those with the educational attainment of high school diploma, with 80.1% or 1,304 individuals in the labor force. Within the labor force, individuals with college / associate degree education have the highest percentage of unemployment, with 8.5% or 105 of them being unemployed.
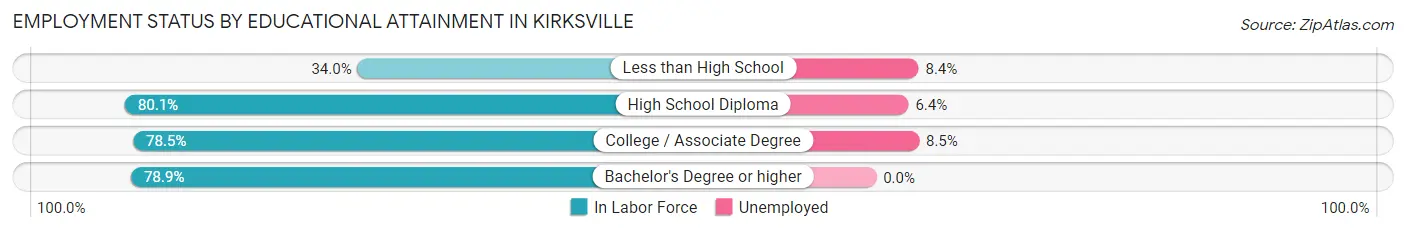
| Educational Attainment | In Labor Force | Unemployed |
| Less than High School | 155 (34.0%) | 38 (8.4%) |
| High School Diploma | 1,304 (80.1%) | 104 (6.4%) |
| College / Associate Degree | 1,236 (78.5%) | 134 (8.5%) |
| Bachelor's Degree or higher | 2,039 (78.9%) | 0 (0.0%) |
| Total | 4,732 (75.8%) | 268 (4.3%) |
Employment Occupations by Sex in Kirksville
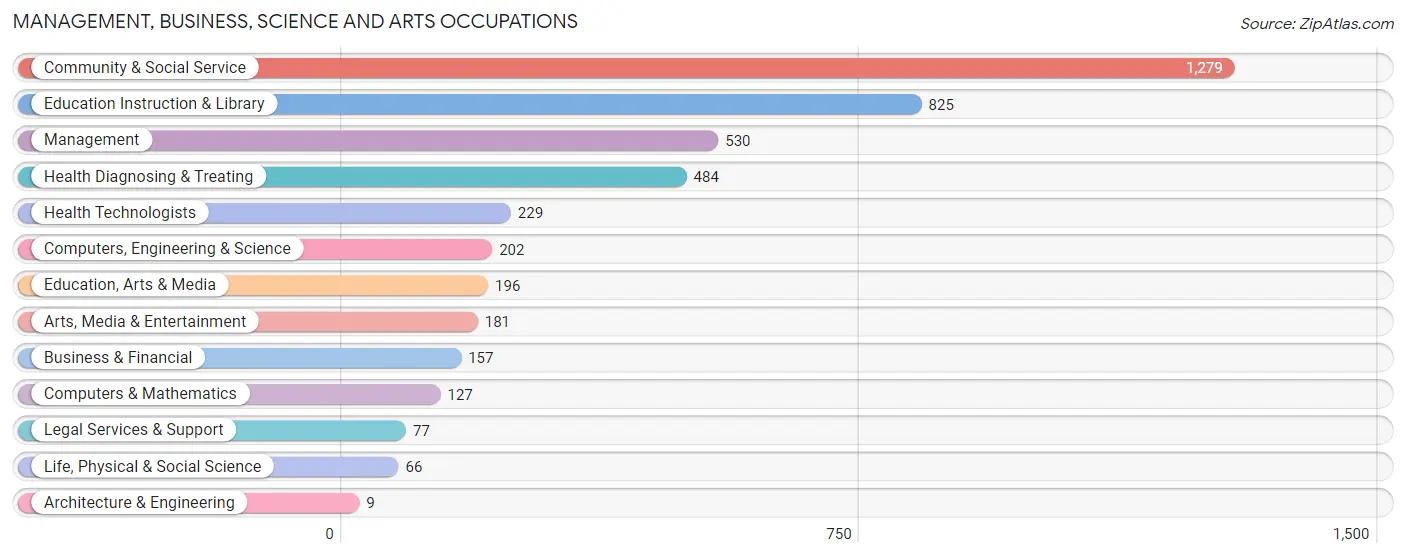
Management, Business, Science and Arts Occupations
The most common Management, Business, Science and Arts occupations in Kirksville are Community & Social Service (1,279 | 19.7%), Education Instruction & Library (825 | 12.7%), Management (530 | 8.2%), Health Diagnosing & Treating (484 | 7.4%), and Health Technologists (229 | 3.5%).
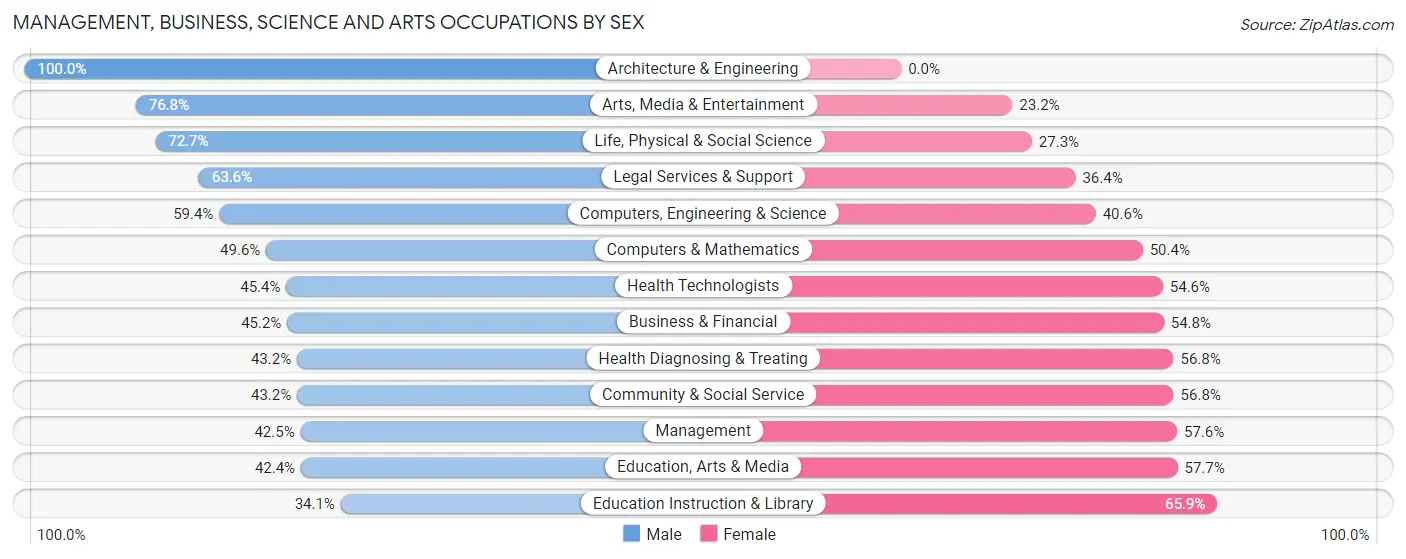
Management, Business, Science and Arts Occupations by Sex
Within the Management, Business, Science and Arts occupations in Kirksville, the most male-oriented occupations are Architecture & Engineering (100.0%), Arts, Media & Entertainment (76.8%), and Life, Physical & Social Science (72.7%), while the most female-oriented occupations are Education Instruction & Library (65.9%), Education, Arts & Media (57.7%), and Management (57.6%).
| Occupation | Male | Female |
| Management | 225 (42.4%) | 305 (57.6%) |
| Business & Financial | 71 (45.2%) | 86 (54.8%) |
| Computers, Engineering & Science | 120 (59.4%) | 82 (40.6%) |
| Computers & Mathematics | 63 (49.6%) | 64 (50.4%) |
| Architecture & Engineering | 9 (100.0%) | 0 (0.0%) |
| Life, Physical & Social Science | 48 (72.7%) | 18 (27.3%) |
| Community & Social Service | 552 (43.2%) | 727 (56.8%) |
| Education, Arts & Media | 83 (42.3%) | 113 (57.7%) |
| Legal Services & Support | 49 (63.6%) | 28 (36.4%) |
| Education Instruction & Library | 281 (34.1%) | 544 (65.9%) |
| Arts, Media & Entertainment | 139 (76.8%) | 42 (23.2%) |
| Health Diagnosing & Treating | 209 (43.2%) | 275 (56.8%) |
| Health Technologists | 104 (45.4%) | 125 (54.6%) |
| Total (Category) | 1,177 (44.4%) | 1,475 (55.6%) |
| Total (Overall) | 3,455 (53.1%) | 3,050 (46.9%) |
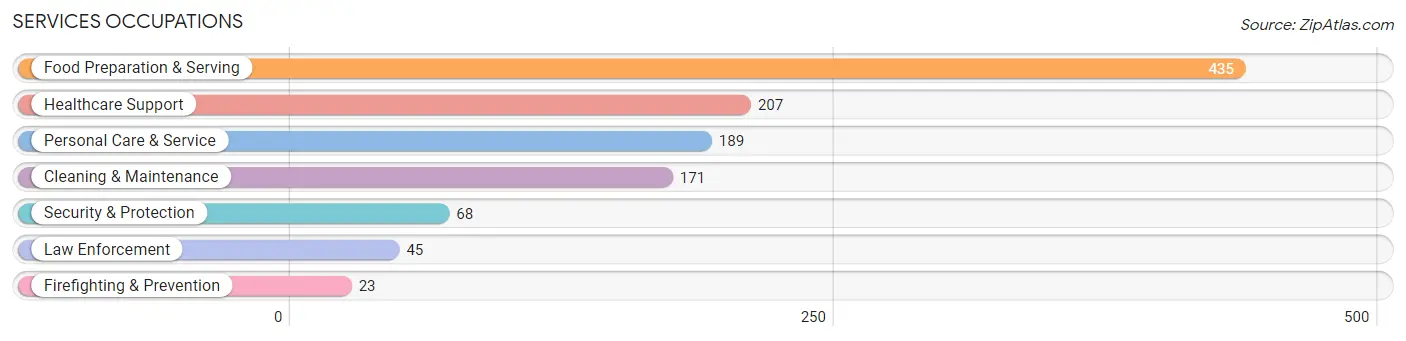
Services Occupations
The most common Services occupations in Kirksville are Food Preparation & Serving (435 | 6.7%), Healthcare Support (207 | 3.2%), Personal Care & Service (189 | 2.9%), Cleaning & Maintenance (171 | 2.6%), and Security & Protection (68 | 1.1%).
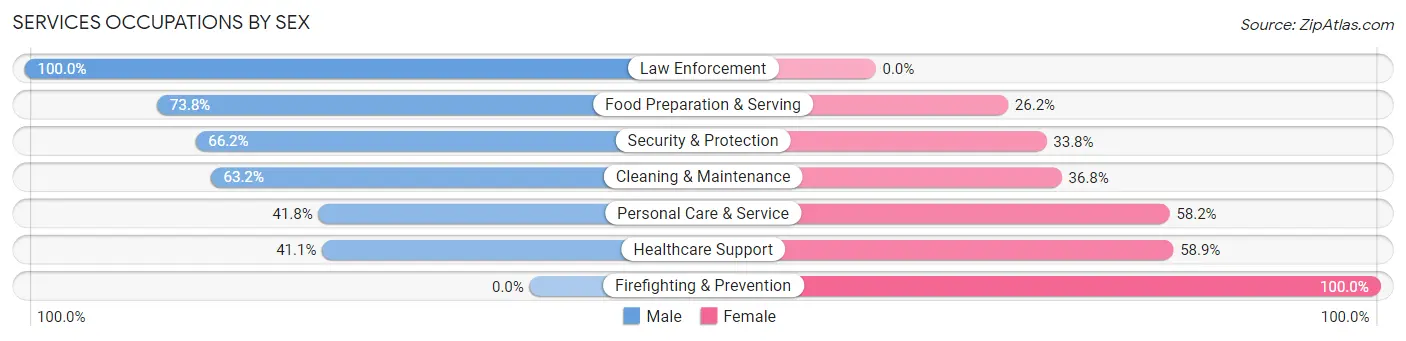
Services Occupations by Sex
Within the Services occupations in Kirksville, the most male-oriented occupations are Law Enforcement (100.0%), Food Preparation & Serving (73.8%), and Security & Protection (66.2%), while the most female-oriented occupations are Firefighting & Prevention (100.0%), Healthcare Support (58.9%), and Personal Care & Service (58.2%).
| Occupation | Male | Female |
| Healthcare Support | 85 (41.1%) | 122 (58.9%) |
| Security & Protection | 45 (66.2%) | 23 (33.8%) |
| Firefighting & Prevention | 0 (0.0%) | 23 (100.0%) |
| Law Enforcement | 45 (100.0%) | 0 (0.0%) |
| Food Preparation & Serving | 321 (73.8%) | 114 (26.2%) |
| Cleaning & Maintenance | 108 (63.2%) | 63 (36.8%) |
| Personal Care & Service | 79 (41.8%) | 110 (58.2%) |
| Total (Category) | 638 (59.6%) | 432 (40.4%) |
| Total (Overall) | 3,455 (53.1%) | 3,050 (46.9%) |
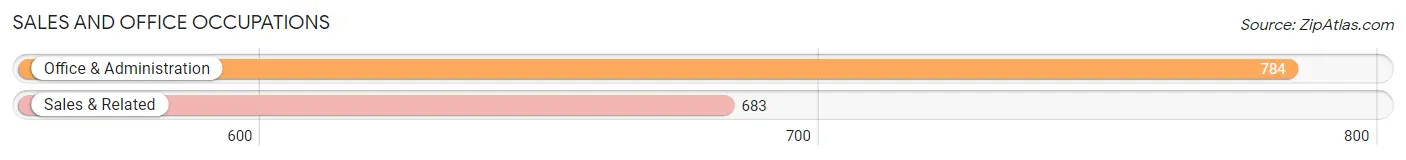
Sales and Office Occupations
The most common Sales and Office occupations in Kirksville are Office & Administration (784 | 12.0%), and Sales & Related (683 | 10.5%).
Sales and Office Occupations by Sex
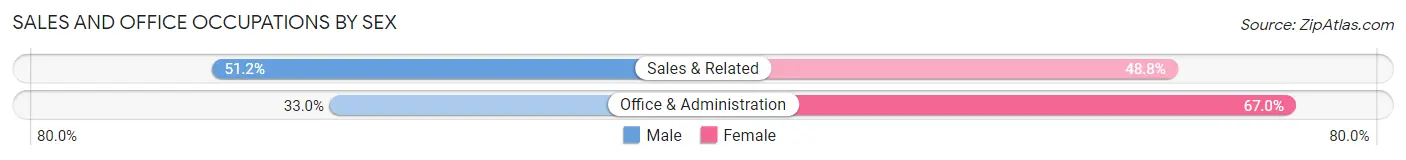
| Occupation | Male | Female |
| Sales & Related | 350 (51.2%) | 333 (48.8%) |
| Office & Administration | 259 (33.0%) | 525 (67.0%) |
| Total (Category) | 609 (41.5%) | 858 (58.5%) |
| Total (Overall) | 3,455 (53.1%) | 3,050 (46.9%) |
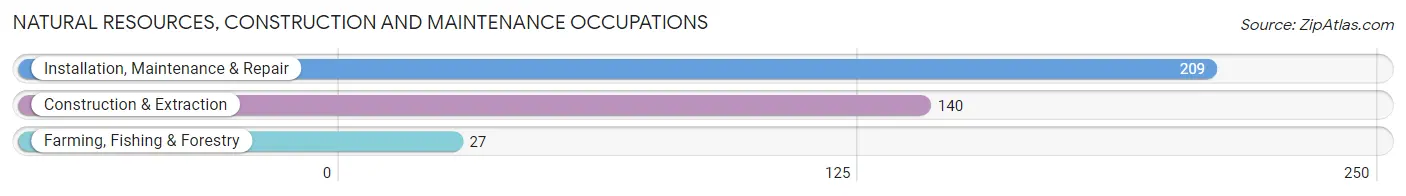
Natural Resources, Construction and Maintenance Occupations
The most common Natural Resources, Construction and Maintenance occupations in Kirksville are Installation, Maintenance & Repair (209 | 3.2%), Construction & Extraction (140 | 2.1%), and Farming, Fishing & Forestry (27 | 0.4%).
Natural Resources, Construction and Maintenance Occupations by Sex
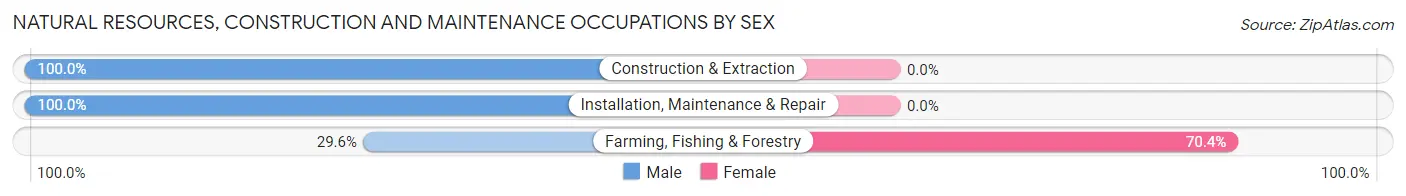
| Occupation | Male | Female |
| Farming, Fishing & Forestry | 8 (29.6%) | 19 (70.4%) |
| Construction & Extraction | 140 (100.0%) | 0 (0.0%) |
| Installation, Maintenance & Repair | 209 (100.0%) | 0 (0.0%) |
| Total (Category) | 357 (95.0%) | 19 (5.1%) |
| Total (Overall) | 3,455 (53.1%) | 3,050 (46.9%) |
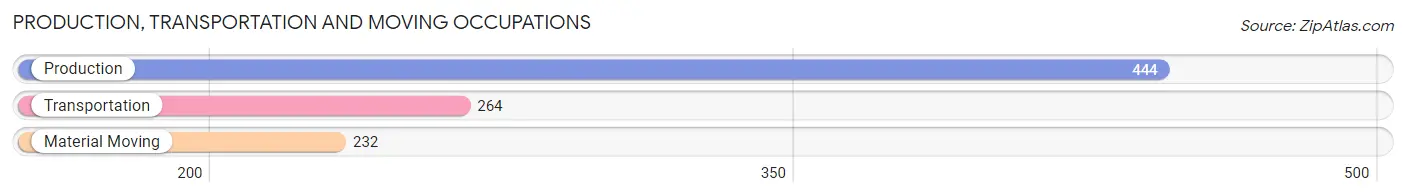
Production, Transportation and Moving Occupations
The most common Production, Transportation and Moving occupations in Kirksville are Production (444 | 6.8%), Transportation (264 | 4.1%), and Material Moving (232 | 3.6%).
Production, Transportation and Moving Occupations by Sex
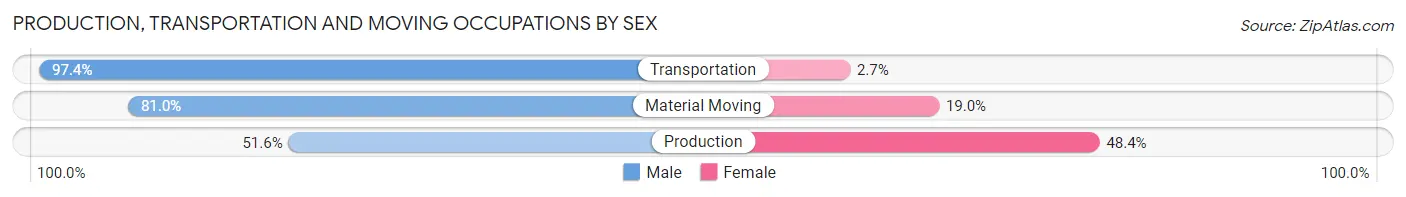
| Occupation | Male | Female |
| Production | 229 (51.6%) | 215 (48.4%) |
| Transportation | 257 (97.4%) | 7 (2.6%) |
| Material Moving | 188 (81.0%) | 44 (19.0%) |
| Total (Category) | 674 (71.7%) | 266 (28.3%) |
| Total (Overall) | 3,455 (53.1%) | 3,050 (46.9%) |
Employment Industries by Sex in Kirksville
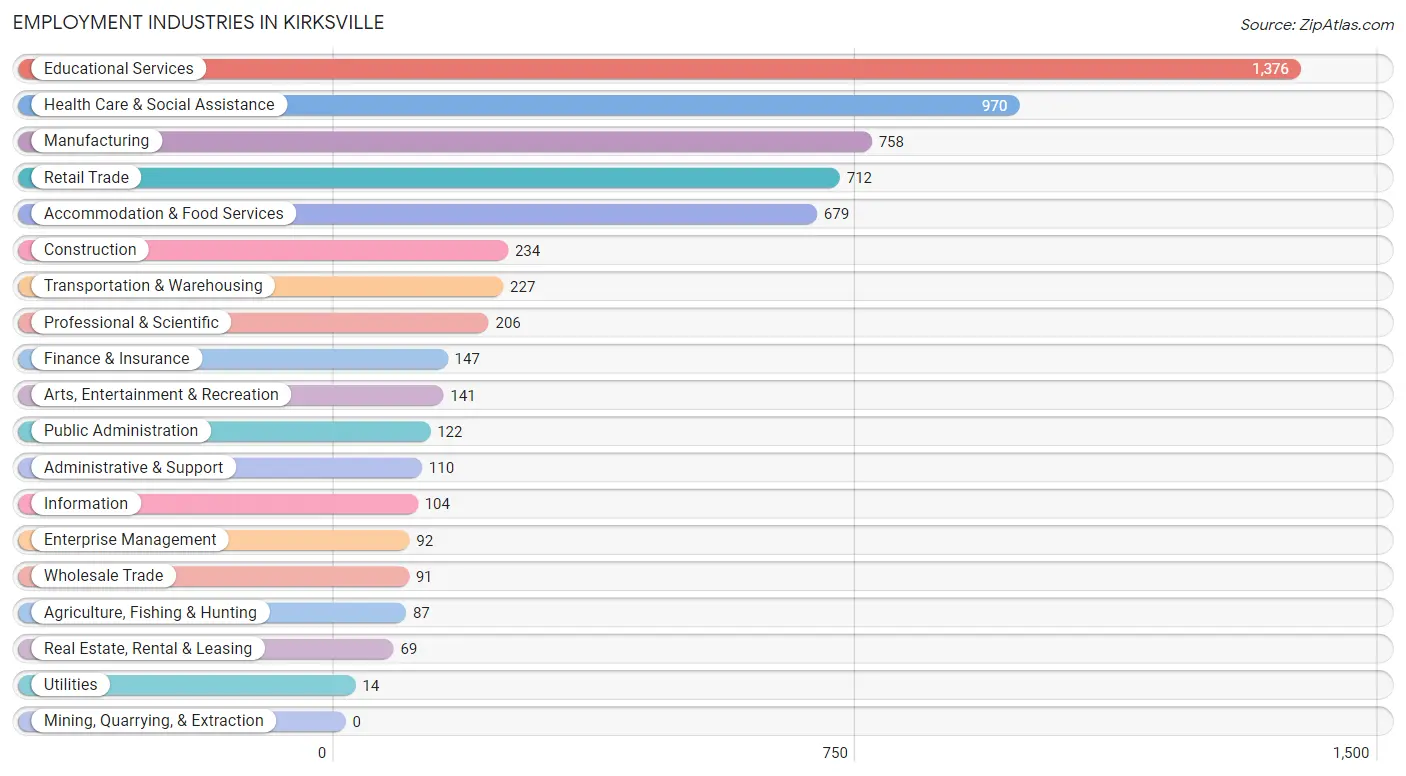
Employment Industries in Kirksville
The major employment industries in Kirksville include Educational Services (1,376 | 21.1%), Health Care & Social Assistance (970 | 14.9%), Manufacturing (758 | 11.7%), Retail Trade (712 | 11.0%), and Accommodation & Food Services (679 | 10.4%).
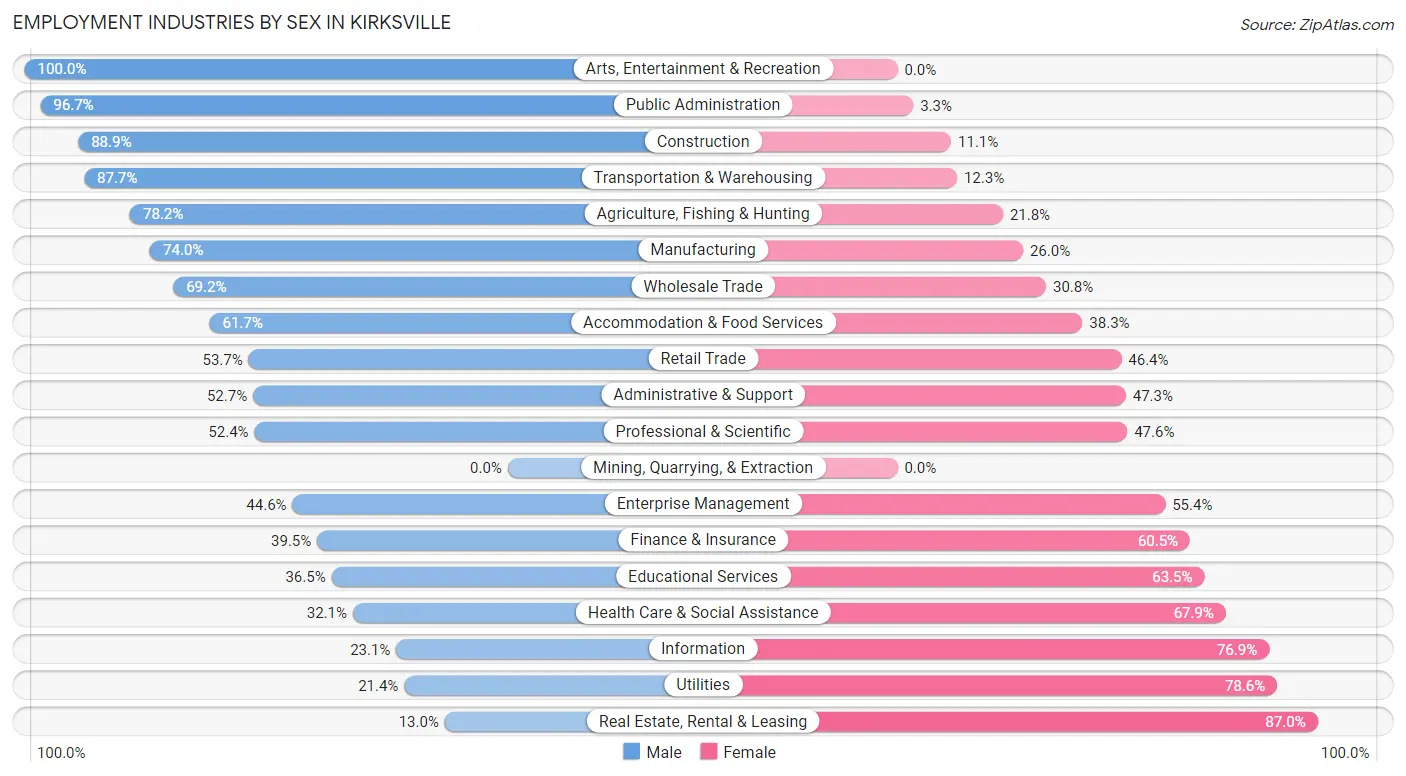
Employment Industries by Sex in Kirksville
The Kirksville industries that see more men than women are Arts, Entertainment & Recreation (100.0%), Public Administration (96.7%), and Construction (88.9%), whereas the industries that tend to have a higher number of women are Real Estate, Rental & Leasing (87.0%), Utilities (78.6%), and Information (76.9%).
| Industry | Male | Female |
| Agriculture, Fishing & Hunting | 68 (78.2%) | 19 (21.8%) |
| Mining, Quarrying, & Extraction | 0 (0.0%) | 0 (0.0%) |
| Construction | 208 (88.9%) | 26 (11.1%) |
| Manufacturing | 561 (74.0%) | 197 (26.0%) |
| Wholesale Trade | 63 (69.2%) | 28 (30.8%) |
| Retail Trade | 382 (53.6%) | 330 (46.4%) |
| Transportation & Warehousing | 199 (87.7%) | 28 (12.3%) |
| Utilities | 3 (21.4%) | 11 (78.6%) |
| Information | 24 (23.1%) | 80 (76.9%) |
| Finance & Insurance | 58 (39.5%) | 89 (60.5%) |
| Real Estate, Rental & Leasing | 9 (13.0%) | 60 (87.0%) |
| Professional & Scientific | 108 (52.4%) | 98 (47.6%) |
| Enterprise Management | 41 (44.6%) | 51 (55.4%) |
| Administrative & Support | 58 (52.7%) | 52 (47.3%) |
| Educational Services | 502 (36.5%) | 874 (63.5%) |
| Health Care & Social Assistance | 311 (32.1%) | 659 (67.9%) |
| Arts, Entertainment & Recreation | 141 (100.0%) | 0 (0.0%) |
| Accommodation & Food Services | 419 (61.7%) | 260 (38.3%) |
| Public Administration | 118 (96.7%) | 4 (3.3%) |
| Total | 3,455 (53.1%) | 3,050 (46.9%) |
Education in Kirksville
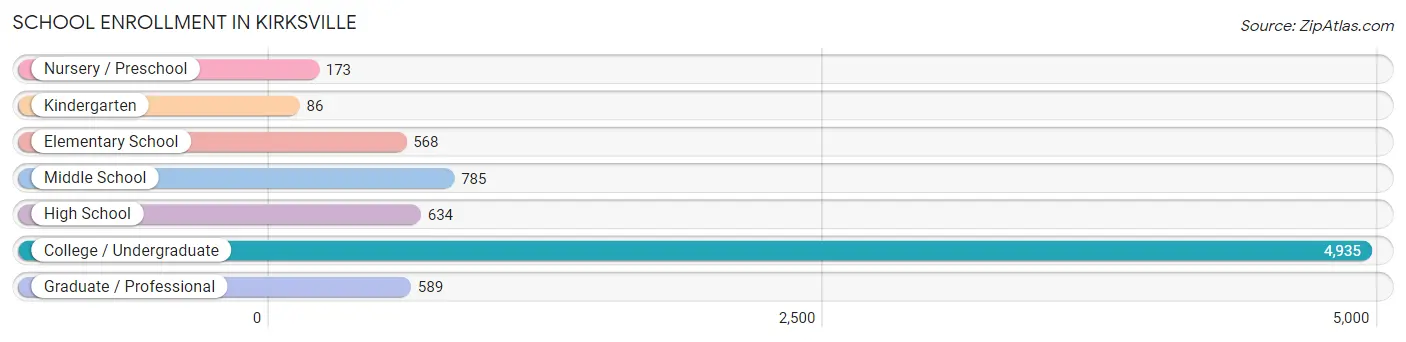
School Enrollment in Kirksville
The most common levels of schooling among the 7,770 students in Kirksville are college / undergraduate (4,935 | 63.5%), middle school (785 | 10.1%), and high school (634 | 8.2%).
| School Level | # Students | % Students |
| Nursery / Preschool | 173 | 2.2% |
| Kindergarten | 86 | 1.1% |
| Elementary School | 568 | 7.3% |
| Middle School | 785 | 10.1% |
| High School | 634 | 8.2% |
| College / Undergraduate | 4,935 | 63.5% |
| Graduate / Professional | 589 | 7.6% |
| Total | 7,770 | 100.0% |
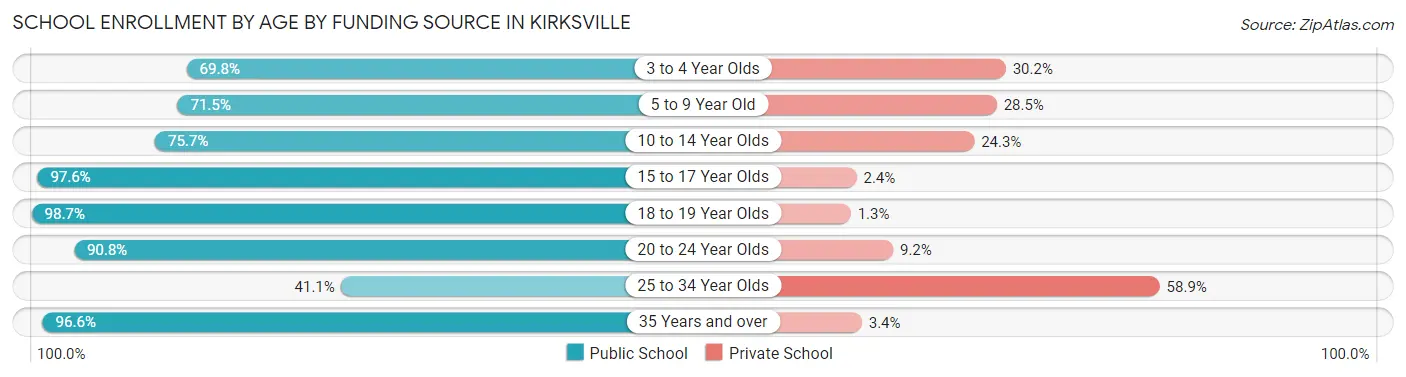
School Enrollment by Age by Funding Source in Kirksville
Out of a total of 7,770 students who are enrolled in schools in Kirksville, 971 (12.5%) attend a private institution, while the remaining 6,799 (87.5%) are enrolled in public schools. The age group of 25 to 34 year olds has the highest likelihood of being enrolled in private schools, with 186 (58.9% in the age bracket) enrolled. Conversely, the age group of 18 to 19 year olds has the lowest likelihood of being enrolled in a private school, with 1,727 (98.7% in the age bracket) attending a public institution.
| Age Bracket | Public School | Private School |
| 3 to 4 Year Olds | 74 (69.8%) | 32 (30.2%) |
| 5 to 9 Year Old | 459 (71.5%) | 183 (28.5%) |
| 10 to 14 Year Olds | 685 (75.7%) | 220 (24.3%) |
| 15 to 17 Year Olds | 448 (97.6%) | 11 (2.4%) |
| 18 to 19 Year Olds | 1,727 (98.7%) | 23 (1.3%) |
| 20 to 24 Year Olds | 3,100 (90.8%) | 314 (9.2%) |
| 25 to 34 Year Olds | 130 (41.1%) | 186 (58.9%) |
| 35 Years and over | 172 (96.6%) | 6 (3.4%) |
| Total | 6,799 (87.5%) | 971 (12.5%) |
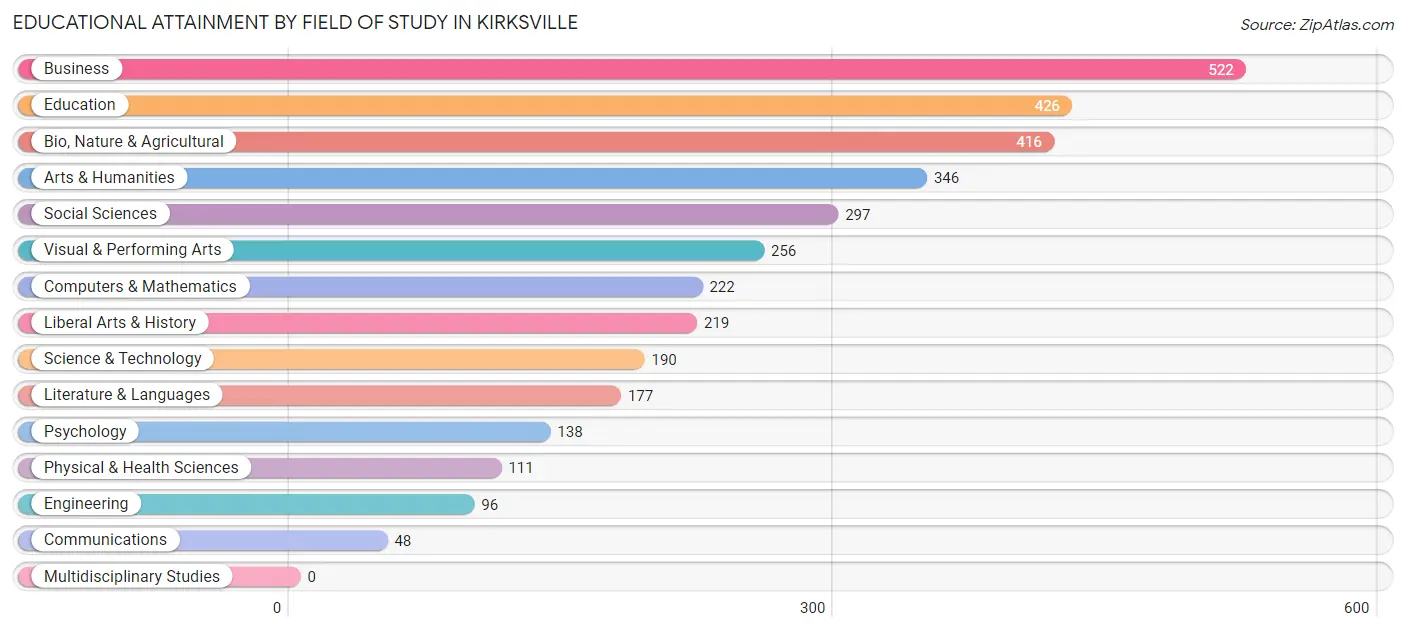
Educational Attainment by Field of Study in Kirksville
Business (522 | 15.1%), education (426 | 12.3%), bio, nature & agricultural (416 | 12.0%), arts & humanities (346 | 10.0%), and social sciences (297 | 8.6%) are the most common fields of study among 3,464 individuals in Kirksville who have obtained a bachelor's degree or higher.
| Field of Study | # Graduates | % Graduates |
| Computers & Mathematics | 222 | 6.4% |
| Bio, Nature & Agricultural | 416 | 12.0% |
| Physical & Health Sciences | 111 | 3.2% |
| Psychology | 138 | 4.0% |
| Social Sciences | 297 | 8.6% |
| Engineering | 96 | 2.8% |
| Multidisciplinary Studies | 0 | 0.0% |
| Science & Technology | 190 | 5.5% |
| Business | 522 | 15.1% |
| Education | 426 | 12.3% |
| Literature & Languages | 177 | 5.1% |
| Liberal Arts & History | 219 | 6.3% |
| Visual & Performing Arts | 256 | 7.4% |
| Communications | 48 | 1.4% |
| Arts & Humanities | 346 | 10.0% |
| Total | 3,464 | 100.0% |
Transportation & Commute in Kirksville
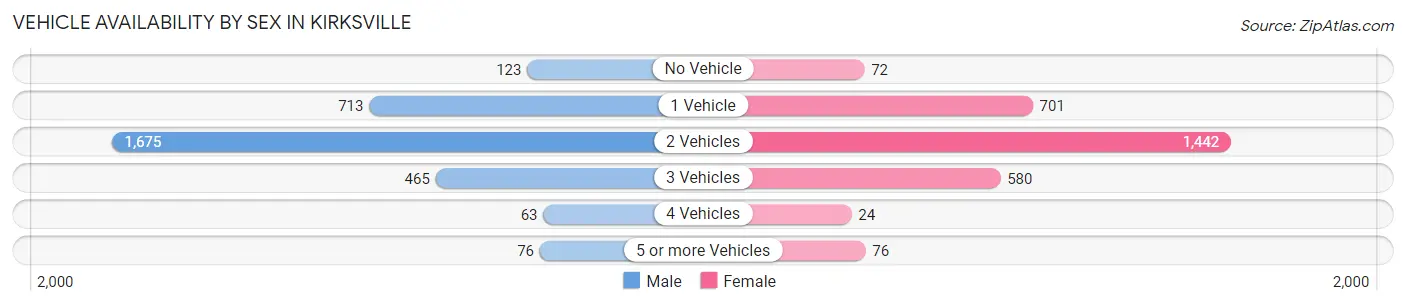
Vehicle Availability by Sex in Kirksville
The most prevalent vehicle ownership categories in Kirksville are males with 2 vehicles (1,675, accounting for 53.8%) and females with 2 vehicles (1,442, making up 57.9%).
| Vehicles Available | Male | Female |
| No Vehicle | 123 (4.0%) | 72 (2.5%) |
| 1 Vehicle | 713 (22.9%) | 701 (24.2%) |
| 2 Vehicles | 1,675 (53.8%) | 1,442 (49.8%) |
| 3 Vehicles | 465 (14.9%) | 580 (20.0%) |
| 4 Vehicles | 63 (2.0%) | 24 (0.8%) |
| 5 or more Vehicles | 76 (2.4%) | 76 (2.6%) |
| Total | 3,115 (100.0%) | 2,895 (100.0%) |
Commute Time in Kirksville
The most frequently occuring commute durations in Kirksville are 5 to 9 minutes (2,229 commuters, 36.7%), 10 to 14 minutes (1,545 commuters, 25.5%), and 15 to 19 minutes (594 commuters, 9.8%).
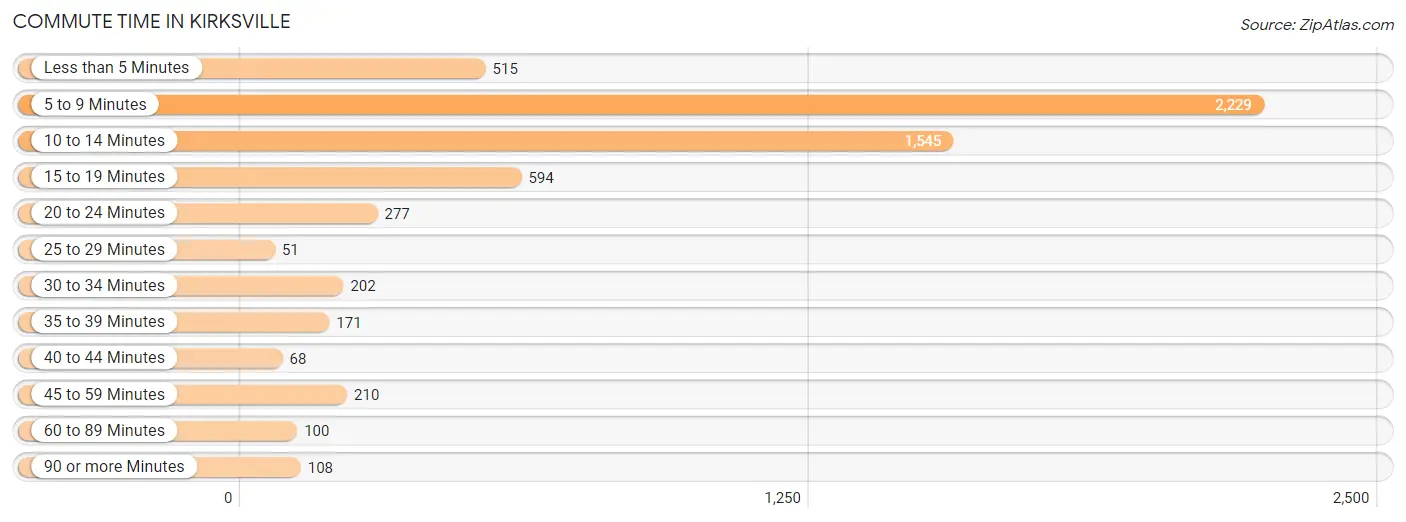
| Commute Time | # Commuters | % Commuters |
| Less than 5 Minutes | 515 | 8.5% |
| 5 to 9 Minutes | 2,229 | 36.7% |
| 10 to 14 Minutes | 1,545 | 25.5% |
| 15 to 19 Minutes | 594 | 9.8% |
| 20 to 24 Minutes | 277 | 4.6% |
| 25 to 29 Minutes | 51 | 0.8% |
| 30 to 34 Minutes | 202 | 3.3% |
| 35 to 39 Minutes | 171 | 2.8% |
| 40 to 44 Minutes | 68 | 1.1% |
| 45 to 59 Minutes | 210 | 3.5% |
| 60 to 89 Minutes | 100 | 1.7% |
| 90 or more Minutes | 108 | 1.8% |
Commute Time by Sex in Kirksville
The most common commute times in Kirksville are 5 to 9 minutes (1,152 commuters, 35.8%) for males and 5 to 9 minutes (1,077 commuters, 37.8%) for females.
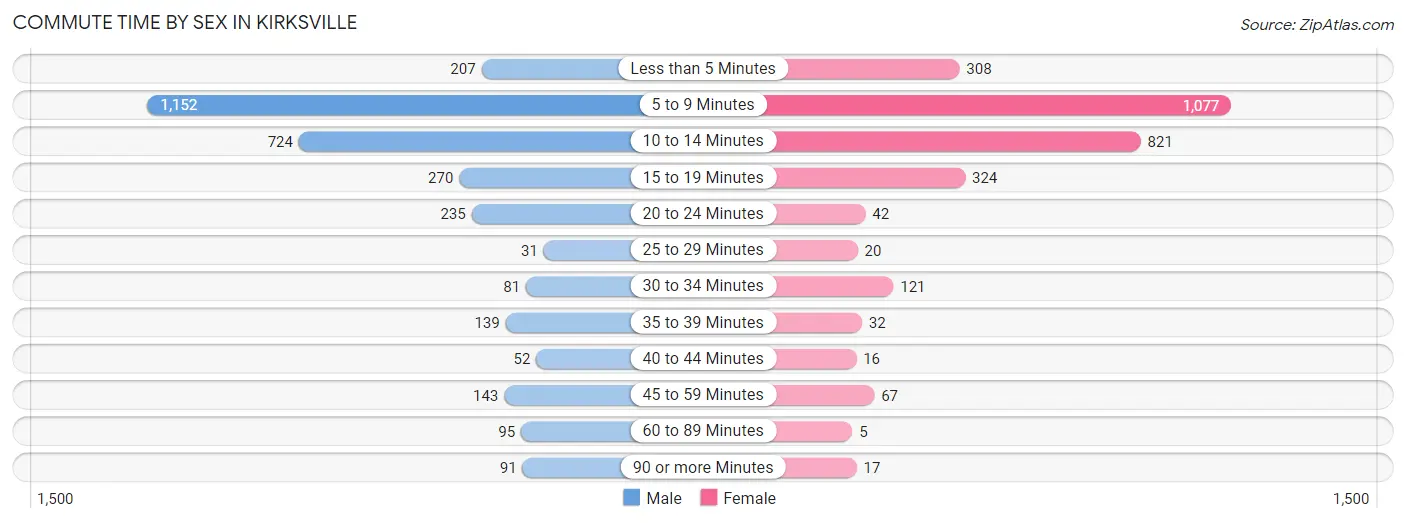
| Commute Time | Male | Female |
| Less than 5 Minutes | 207 (6.4%) | 308 (10.8%) |
| 5 to 9 Minutes | 1,152 (35.8%) | 1,077 (37.8%) |
| 10 to 14 Minutes | 724 (22.5%) | 821 (28.8%) |
| 15 to 19 Minutes | 270 (8.4%) | 324 (11.4%) |
| 20 to 24 Minutes | 235 (7.3%) | 42 (1.5%) |
| 25 to 29 Minutes | 31 (1.0%) | 20 (0.7%) |
| 30 to 34 Minutes | 81 (2.5%) | 121 (4.3%) |
| 35 to 39 Minutes | 139 (4.3%) | 32 (1.1%) |
| 40 to 44 Minutes | 52 (1.6%) | 16 (0.6%) |
| 45 to 59 Minutes | 143 (4.4%) | 67 (2.4%) |
| 60 to 89 Minutes | 95 (2.9%) | 5 (0.2%) |
| 90 or more Minutes | 91 (2.8%) | 17 (0.6%) |
Time of Departure to Work by Sex in Kirksville
The most frequent times of departure to work in Kirksville are 12:00 PM to 3:59 PM (444, 13.8%) for males and 7:30 AM to 7:59 AM (682, 23.9%) for females.
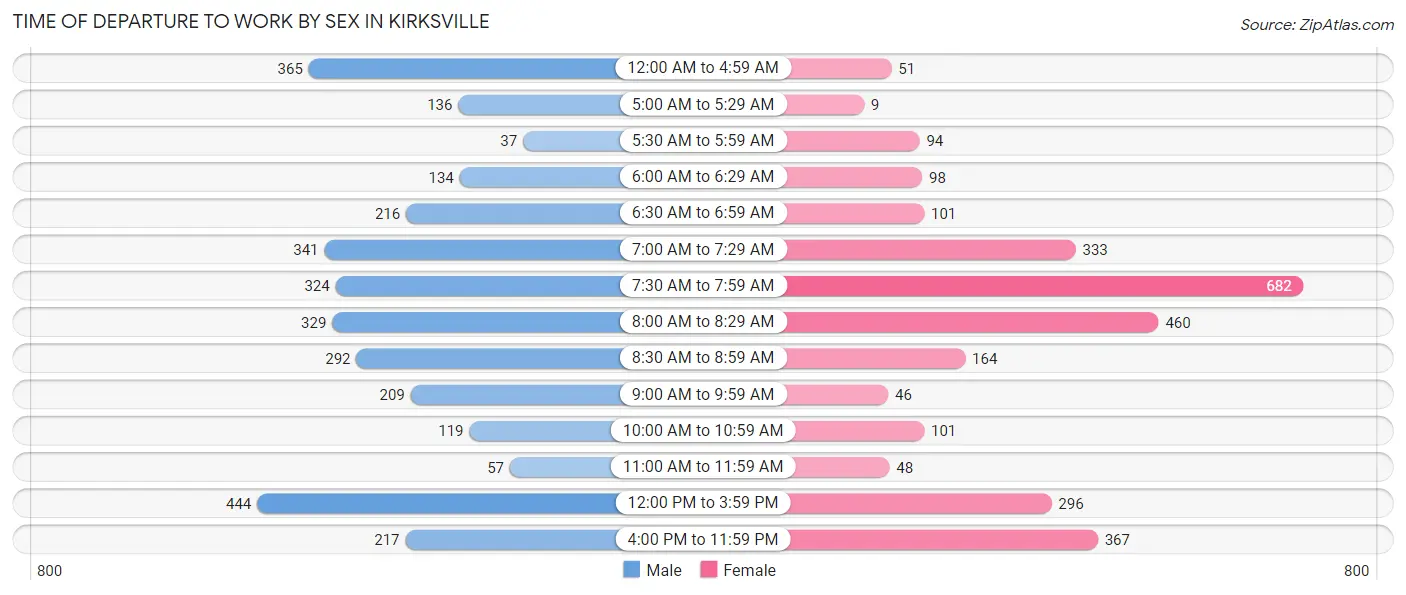
| Time of Departure | Male | Female |
| 12:00 AM to 4:59 AM | 365 (11.3%) | 51 (1.8%) |
| 5:00 AM to 5:29 AM | 136 (4.2%) | 9 (0.3%) |
| 5:30 AM to 5:59 AM | 37 (1.1%) | 94 (3.3%) |
| 6:00 AM to 6:29 AM | 134 (4.2%) | 98 (3.4%) |
| 6:30 AM to 6:59 AM | 216 (6.7%) | 101 (3.5%) |
| 7:00 AM to 7:29 AM | 341 (10.6%) | 333 (11.7%) |
| 7:30 AM to 7:59 AM | 324 (10.1%) | 682 (23.9%) |
| 8:00 AM to 8:29 AM | 329 (10.2%) | 460 (16.1%) |
| 8:30 AM to 8:59 AM | 292 (9.1%) | 164 (5.8%) |
| 9:00 AM to 9:59 AM | 209 (6.5%) | 46 (1.6%) |
| 10:00 AM to 10:59 AM | 119 (3.7%) | 101 (3.5%) |
| 11:00 AM to 11:59 AM | 57 (1.8%) | 48 (1.7%) |
| 12:00 PM to 3:59 PM | 444 (13.8%) | 296 (10.4%) |
| 4:00 PM to 11:59 PM | 217 (6.7%) | 367 (12.9%) |
| Total | 3,220 (100.0%) | 2,850 (100.0%) |
Housing Occupancy in Kirksville
Occupancy by Ownership in Kirksville
Of the total 5,951 dwellings in Kirksville, owner-occupied units account for 2,927 (49.2%), while renter-occupied units make up 3,024 (50.8%).
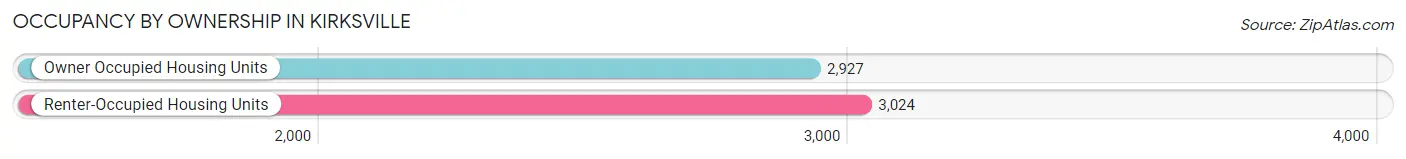
| Occupancy | # Housing Units | % Housing Units |
| Owner Occupied Housing Units | 2,927 | 49.2% |
| Renter-Occupied Housing Units | 3,024 | 50.8% |
| Total Occupied Housing Units | 5,951 | 100.0% |
Occupancy by Household Size in Kirksville
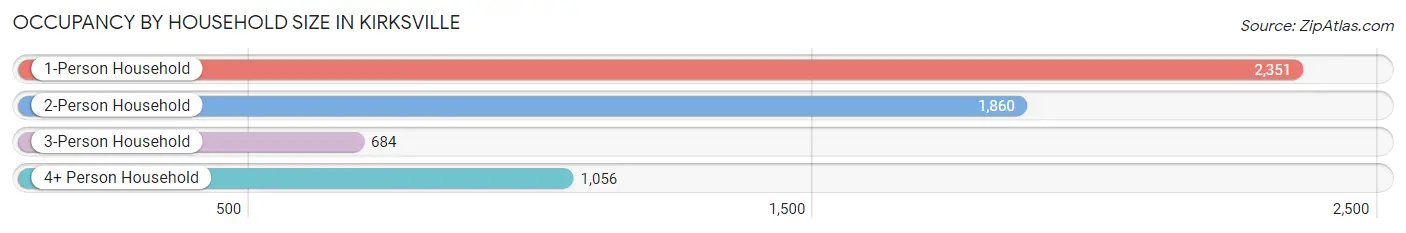
| Household Size | # Housing Units | % Housing Units |
| 1-Person Household | 2,351 | 39.5% |
| 2-Person Household | 1,860 | 31.3% |
| 3-Person Household | 684 | 11.5% |
| 4+ Person Household | 1,056 | 17.7% |
| Total Housing Units | 5,951 | 100.0% |
Occupancy by Ownership by Household Size in Kirksville
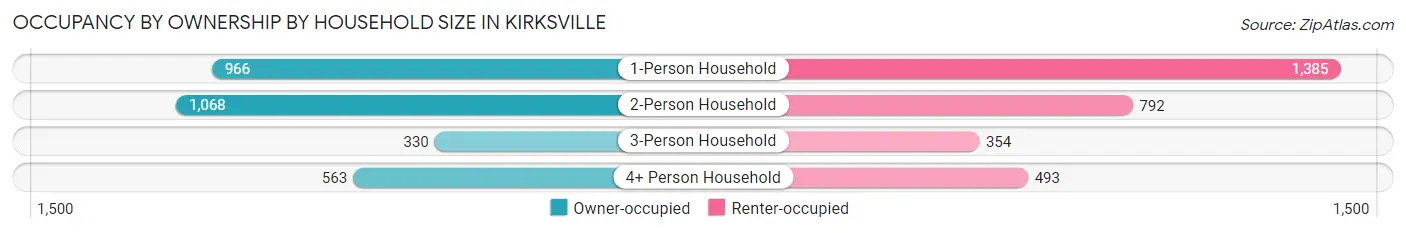
| Household Size | Owner-occupied | Renter-occupied |
| 1-Person Household | 966 (41.1%) | 1,385 (58.9%) |
| 2-Person Household | 1,068 (57.4%) | 792 (42.6%) |
| 3-Person Household | 330 (48.2%) | 354 (51.7%) |
| 4+ Person Household | 563 (53.3%) | 493 (46.7%) |
| Total Housing Units | 2,927 (49.2%) | 3,024 (50.8%) |
Occupancy by Educational Attainment in Kirksville
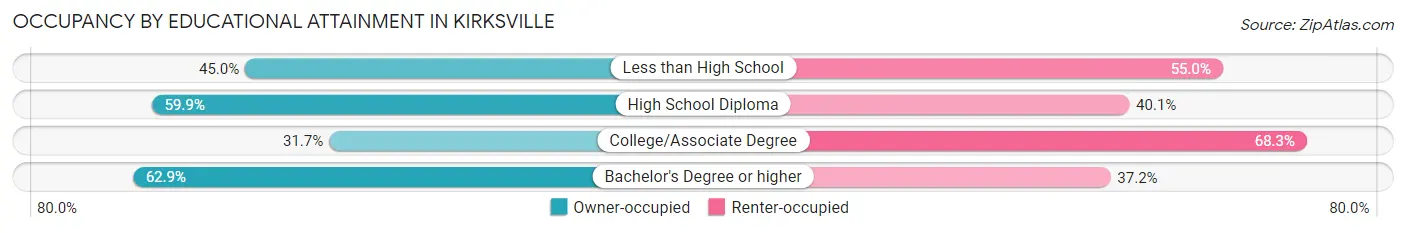
| Household Size | Owner-occupied | Renter-occupied |
| Less than High School | 127 (45.0%) | 155 (55.0%) |
| High School Diploma | 722 (59.9%) | 484 (40.1%) |
| College/Associate Degree | 740 (31.7%) | 1,594 (68.3%) |
| Bachelor's Degree or higher | 1,338 (62.8%) | 791 (37.1%) |
Occupancy by Age of Householder in Kirksville
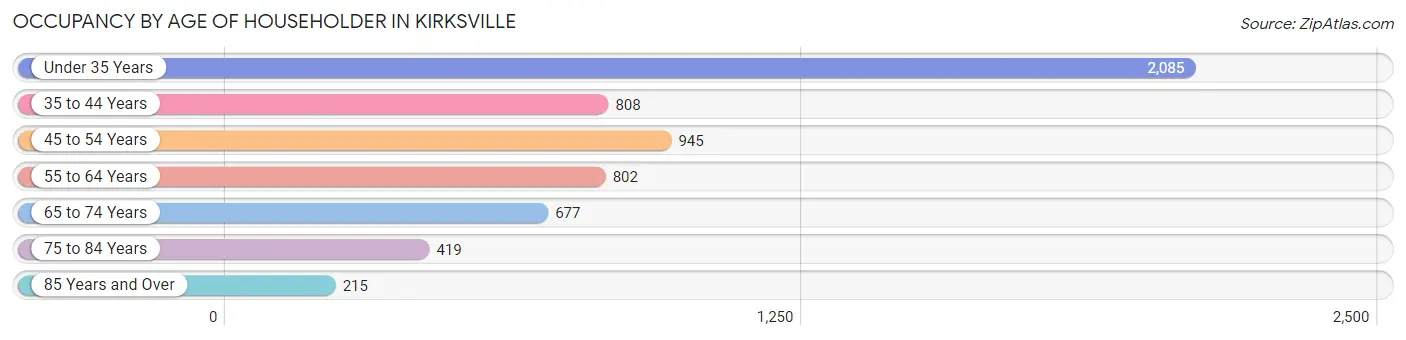
| Age Bracket | # Households | % Households |
| Under 35 Years | 2,085 | 35.0% |
| 35 to 44 Years | 808 | 13.6% |
| 45 to 54 Years | 945 | 15.9% |
| 55 to 64 Years | 802 | 13.5% |
| 65 to 74 Years | 677 | 11.4% |
| 75 to 84 Years | 419 | 7.0% |
| 85 Years and Over | 215 | 3.6% |
| Total | 5,951 | 100.0% |
Housing Finances in Kirksville
Median Income by Occupancy in Kirksville
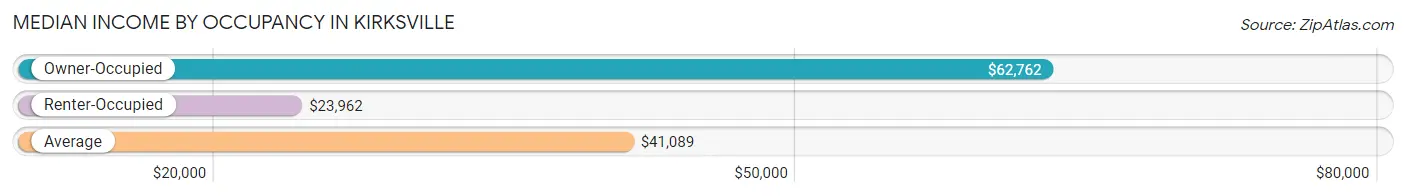
| Occupancy Type | # Households | Median Income |
| Owner-Occupied | 2,927 (49.2%) | $62,762 |
| Renter-Occupied | 3,024 (50.8%) | $23,962 |
| Average | 5,951 (100.0%) | $41,089 |
Occupancy by Householder Income Bracket in Kirksville
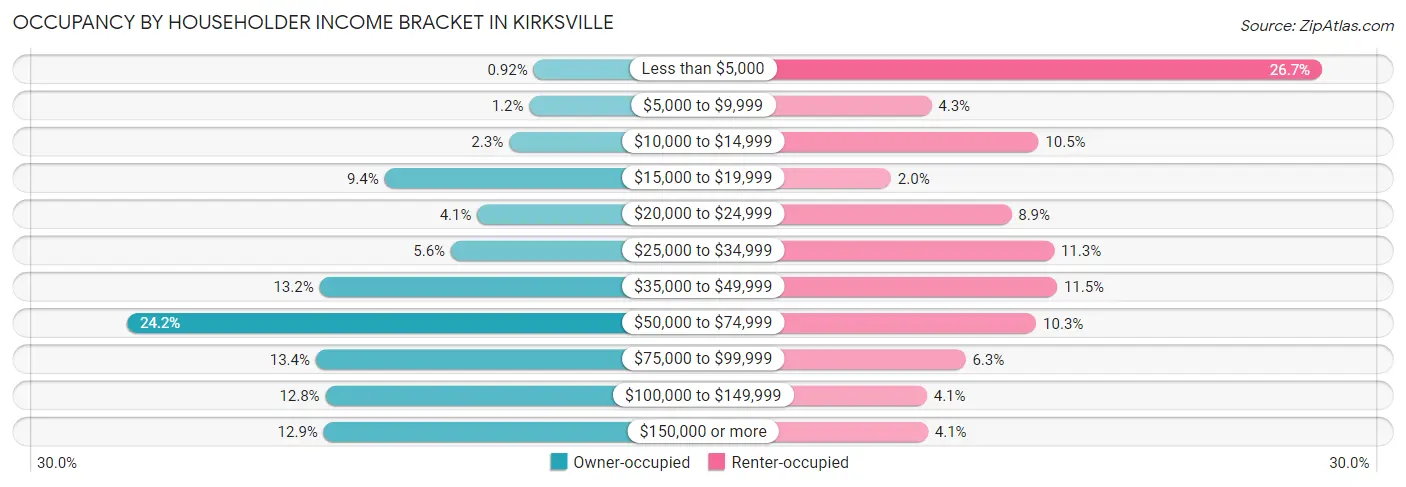
| Income Bracket | Owner-occupied | Renter-occupied |
| Less than $5,000 | 27 (0.9%) | 806 (26.7%) |
| $5,000 to $9,999 | 34 (1.2%) | 131 (4.3%) |
| $10,000 to $14,999 | 68 (2.3%) | 316 (10.4%) |
| $15,000 to $19,999 | 276 (9.4%) | 61 (2.0%) |
| $20,000 to $24,999 | 121 (4.1%) | 269 (8.9%) |
| $25,000 to $34,999 | 165 (5.6%) | 343 (11.3%) |
| $35,000 to $49,999 | 385 (13.2%) | 348 (11.5%) |
| $50,000 to $74,999 | 707 (24.1%) | 312 (10.3%) |
| $75,000 to $99,999 | 391 (13.4%) | 190 (6.3%) |
| $100,000 to $149,999 | 375 (12.8%) | 123 (4.1%) |
| $150,000 or more | 378 (12.9%) | 125 (4.1%) |
| Total | 2,927 (100.0%) | 3,024 (100.0%) |
Monthly Housing Cost Tiers in Kirksville
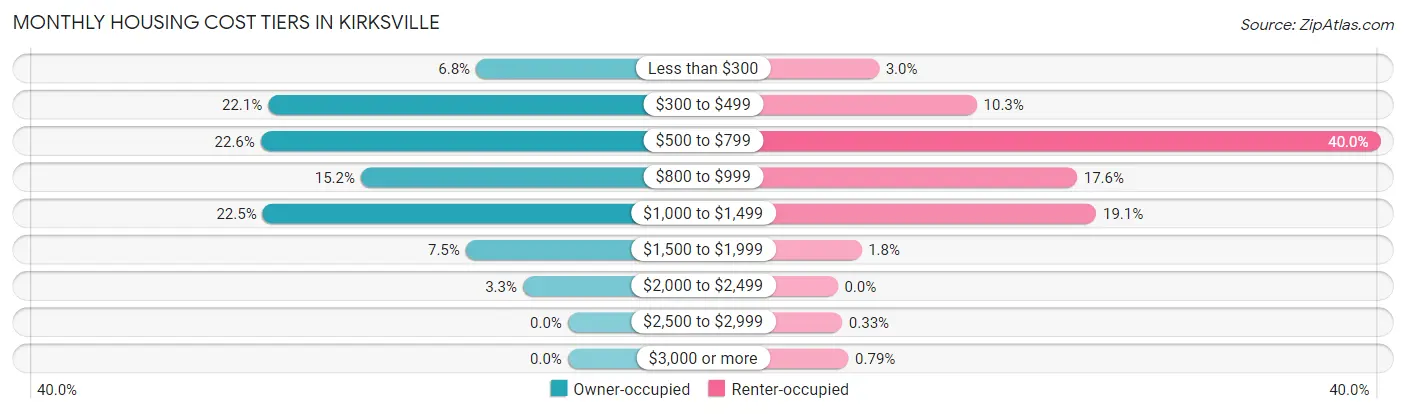
| Monthly Cost | Owner-occupied | Renter-occupied |
| Less than $300 | 198 (6.8%) | 92 (3.0%) |
| $300 to $499 | 646 (22.1%) | 310 (10.2%) |
| $500 to $799 | 662 (22.6%) | 1,209 (40.0%) |
| $800 to $999 | 446 (15.2%) | 533 (17.6%) |
| $1,000 to $1,499 | 658 (22.5%) | 576 (19.1%) |
| $1,500 to $1,999 | 220 (7.5%) | 53 (1.8%) |
| $2,000 to $2,499 | 97 (3.3%) | 0 (0.0%) |
| $2,500 to $2,999 | 0 (0.0%) | 10 (0.3%) |
| $3,000 or more | 0 (0.0%) | 24 (0.8%) |
| Total | 2,927 (100.0%) | 3,024 (100.0%) |
Physical Housing Characteristics in Kirksville
Housing Structures in Kirksville
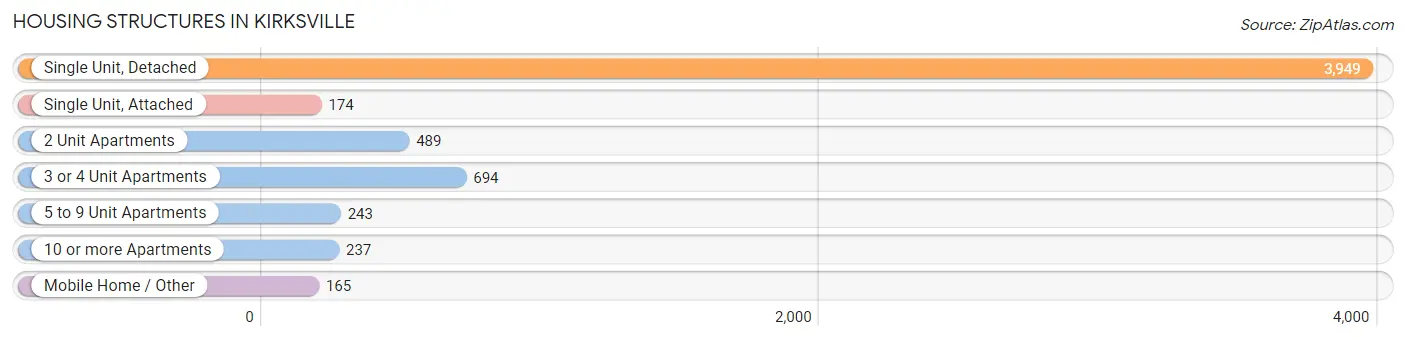
| Structure Type | # Housing Units | % Housing Units |
| Single Unit, Detached | 3,949 | 66.4% |
| Single Unit, Attached | 174 | 2.9% |
| 2 Unit Apartments | 489 | 8.2% |
| 3 or 4 Unit Apartments | 694 | 11.7% |
| 5 to 9 Unit Apartments | 243 | 4.1% |
| 10 or more Apartments | 237 | 4.0% |
| Mobile Home / Other | 165 | 2.8% |
| Total | 5,951 | 100.0% |
Housing Structures by Occupancy in Kirksville
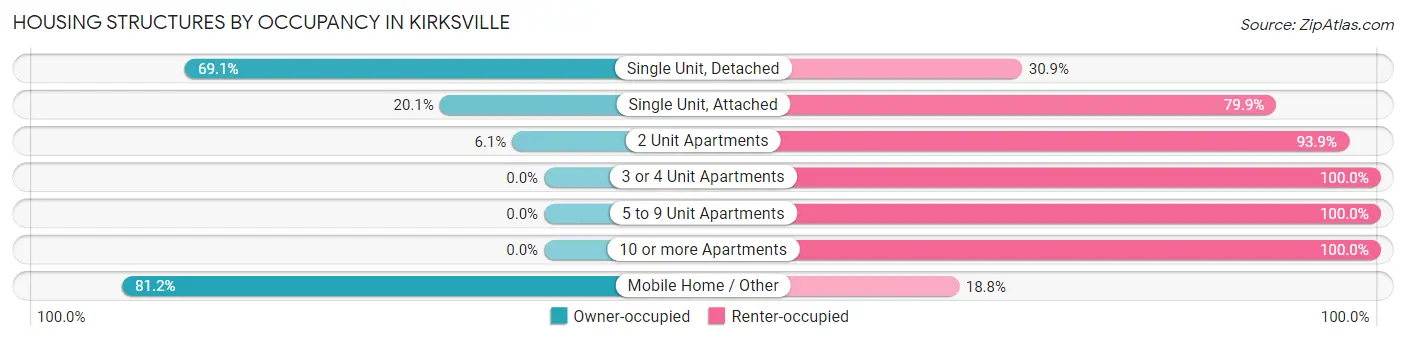
| Structure Type | Owner-occupied | Renter-occupied |
| Single Unit, Detached | 2,728 (69.1%) | 1,221 (30.9%) |
| Single Unit, Attached | 35 (20.1%) | 139 (79.9%) |
| 2 Unit Apartments | 30 (6.1%) | 459 (93.9%) |
| 3 or 4 Unit Apartments | 0 (0.0%) | 694 (100.0%) |
| 5 to 9 Unit Apartments | 0 (0.0%) | 243 (100.0%) |
| 10 or more Apartments | 0 (0.0%) | 237 (100.0%) |
| Mobile Home / Other | 134 (81.2%) | 31 (18.8%) |
| Total | 2,927 (49.2%) | 3,024 (50.8%) |
Housing Structures by Number of Rooms in Kirksville
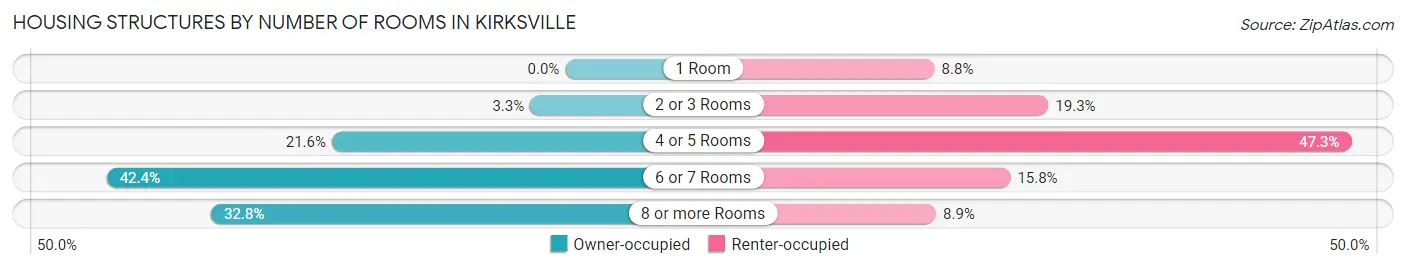
| Number of Rooms | Owner-occupied | Renter-occupied |
| 1 Room | 0 (0.0%) | 265 (8.8%) |
| 2 or 3 Rooms | 95 (3.3%) | 583 (19.3%) |
| 4 or 5 Rooms | 632 (21.6%) | 1,430 (47.3%) |
| 6 or 7 Rooms | 1,241 (42.4%) | 477 (15.8%) |
| 8 or more Rooms | 959 (32.8%) | 269 (8.9%) |
| Total | 2,927 (100.0%) | 3,024 (100.0%) |
Housing Structure by Heating Type in Kirksville
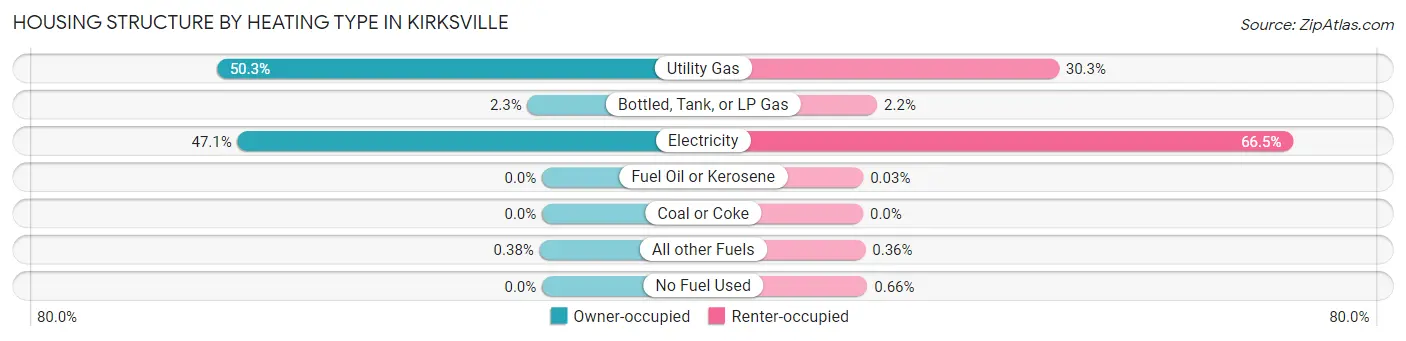
| Heating Type | Owner-occupied | Renter-occupied |
| Utility Gas | 1,472 (50.3%) | 915 (30.3%) |
| Bottled, Tank, or LP Gas | 66 (2.2%) | 66 (2.2%) |
| Electricity | 1,378 (47.1%) | 2,011 (66.5%) |
| Fuel Oil or Kerosene | 0 (0.0%) | 1 (0.0%) |
| Coal or Coke | 0 (0.0%) | 0 (0.0%) |
| All other Fuels | 11 (0.4%) | 11 (0.4%) |
| No Fuel Used | 0 (0.0%) | 20 (0.7%) |
| Total | 2,927 (100.0%) | 3,024 (100.0%) |
Household Vehicle Usage in Kirksville
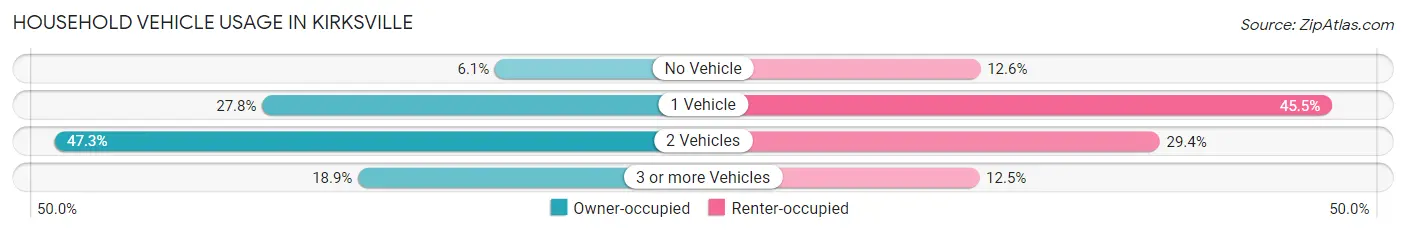
| Vehicles per Household | Owner-occupied | Renter-occupied |
| No Vehicle | 178 (6.1%) | 382 (12.6%) |
| 1 Vehicle | 814 (27.8%) | 1,375 (45.5%) |
| 2 Vehicles | 1,383 (47.2%) | 888 (29.4%) |
| 3 or more Vehicles | 552 (18.9%) | 379 (12.5%) |
| Total | 2,927 (100.0%) | 3,024 (100.0%) |
Real Estate & Mortgages in Kirksville
Real Estate and Mortgage Overview in Kirksville
| Characteristic | Without Mortgage | With Mortgage |
| Housing Units | 1,188 | 1,739 |
| Median Property Value | $123,900 | $138,200 |
| Median Household Income | $51,510 | $285 |
| Monthly Housing Costs | $421 | $0 |
| Real Estate Taxes | $1,050 | $43 |
Property Value by Mortgage Status in Kirksville
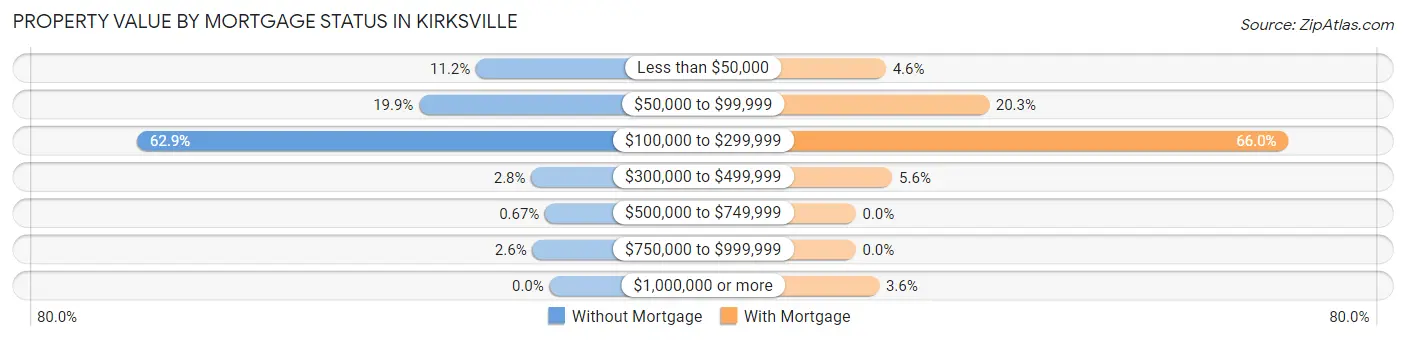
| Property Value | Without Mortgage | With Mortgage |
| Less than $50,000 | 133 (11.2%) | 80 (4.6%) |
| $50,000 to $99,999 | 236 (19.9%) | 353 (20.3%) |
| $100,000 to $299,999 | 747 (62.9%) | 1,147 (66.0%) |
| $300,000 to $499,999 | 33 (2.8%) | 97 (5.6%) |
| $500,000 to $749,999 | 8 (0.7%) | 0 (0.0%) |
| $750,000 to $999,999 | 31 (2.6%) | 0 (0.0%) |
| $1,000,000 or more | 0 (0.0%) | 62 (3.6%) |
| Total | 1,188 (100.0%) | 1,739 (100.0%) |
Household Income by Mortgage Status in Kirksville
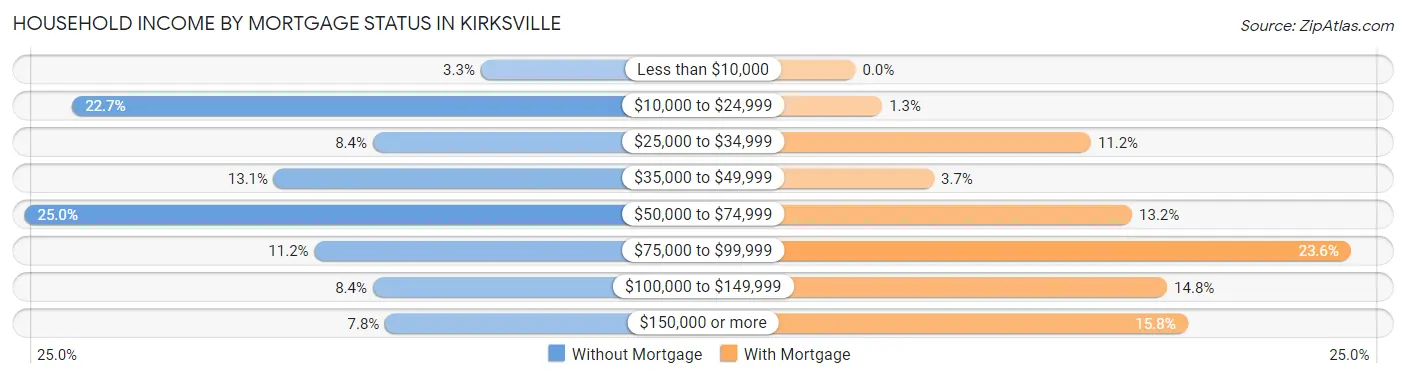
| Household Income | Without Mortgage | With Mortgage |
| Less than $10,000 | 39 (3.3%) | 0 (0.0%) |
| $10,000 to $24,999 | 270 (22.7%) | 22 (1.3%) |
| $25,000 to $34,999 | 100 (8.4%) | 195 (11.2%) |
| $35,000 to $49,999 | 156 (13.1%) | 65 (3.7%) |
| $50,000 to $74,999 | 297 (25.0%) | 229 (13.2%) |
| $75,000 to $99,999 | 133 (11.2%) | 410 (23.6%) |
| $100,000 to $149,999 | 100 (8.4%) | 258 (14.8%) |
| $150,000 or more | 93 (7.8%) | 275 (15.8%) |
| Total | 1,188 (100.0%) | 1,739 (100.0%) |
Property Value to Household Income Ratio in Kirksville
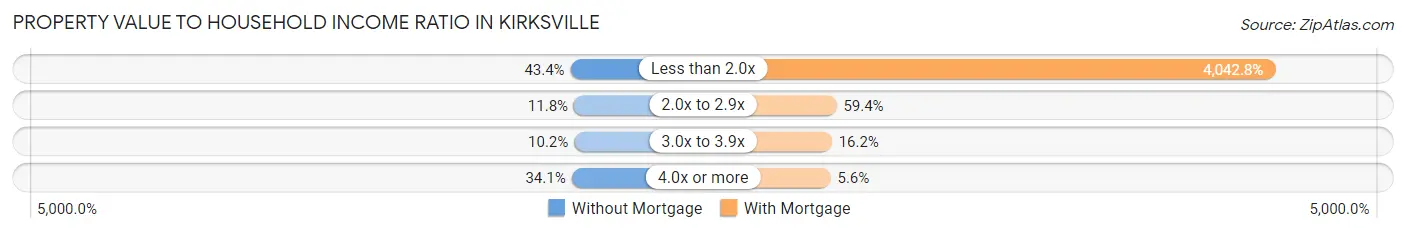
| Value-to-Income Ratio | Without Mortgage | With Mortgage |
| Less than 2.0x | 515 (43.3%) | 70,304 (4,042.8%) |
| 2.0x to 2.9x | 140 (11.8%) | 1,033 (59.4%) |
| 3.0x to 3.9x | 121 (10.2%) | 282 (16.2%) |
| 4.0x or more | 405 (34.1%) | 97 (5.6%) |
| Total | 1,188 (100.0%) | 1,739 (100.0%) |
Real Estate Taxes by Mortgage Status in Kirksville
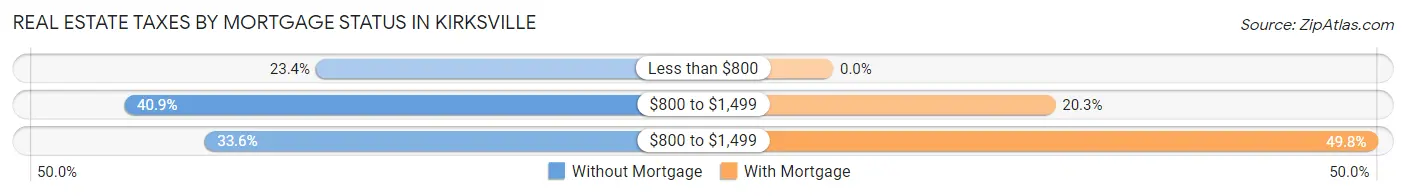
| Property Taxes | Without Mortgage | With Mortgage |
| Less than $800 | 278 (23.4%) | 0 (0.0%) |
| $800 to $1,499 | 486 (40.9%) | 353 (20.3%) |
| $800 to $1,499 | 399 (33.6%) | 866 (49.8%) |
| Total | 1,188 (100.0%) | 1,739 (100.0%) |
Health & Disability in Kirksville
Health Insurance Coverage by Age in Kirksville
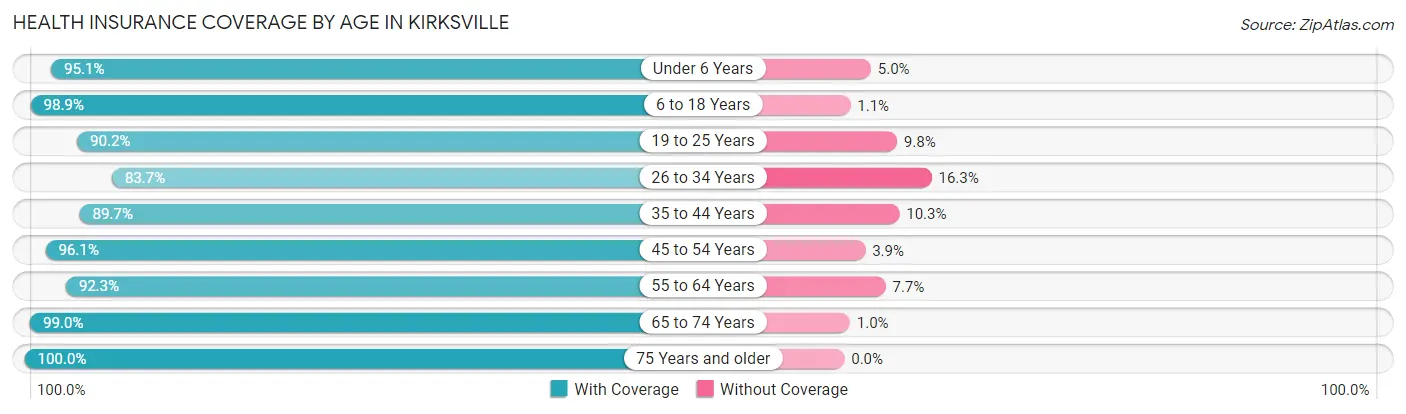
| Age Bracket | With Coverage | Without Coverage |
| Under 6 Years | 921 (95.1%) | 48 (5.0%) |
| 6 to 18 Years | 2,799 (98.9%) | 32 (1.1%) |
| 19 to 25 Years | 4,946 (90.2%) | 538 (9.8%) |
| 26 to 34 Years | 1,323 (83.7%) | 257 (16.3%) |
| 35 to 44 Years | 1,329 (89.7%) | 152 (10.3%) |
| 45 to 54 Years | 1,452 (96.1%) | 59 (3.9%) |
| 55 to 64 Years | 1,309 (92.3%) | 109 (7.7%) |
| 65 to 74 Years | 1,058 (99.0%) | 11 (1.0%) |
| 75 Years and older | 975 (100.0%) | 0 (0.0%) |
| Total | 16,112 (93.0%) | 1,206 (7.0%) |
Health Insurance Coverage by Citizenship Status in Kirksville
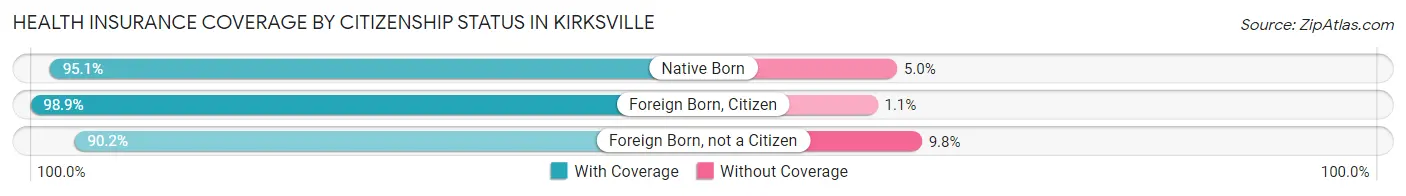
| Citizenship Status | With Coverage | Without Coverage |
| Native Born | 921 (95.1%) | 48 (5.0%) |
| Foreign Born, Citizen | 2,799 (98.9%) | 32 (1.1%) |
| Foreign Born, not a Citizen | 4,946 (90.2%) | 538 (9.8%) |
Health Insurance Coverage by Household Income in Kirksville
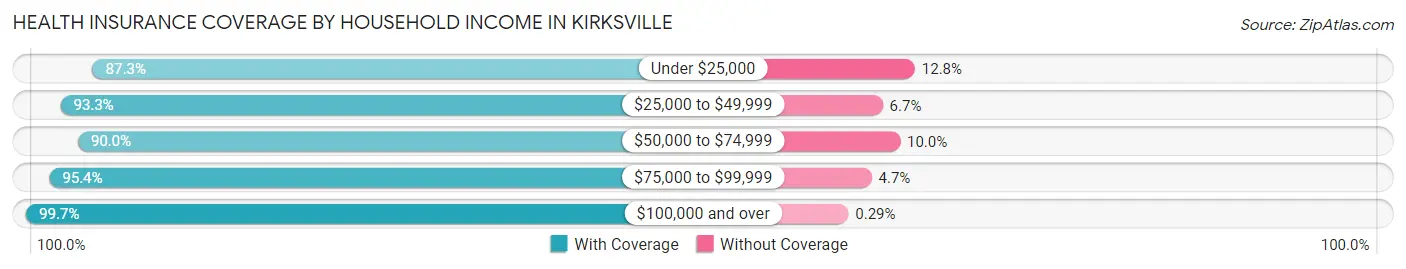
| Household Income | With Coverage | Without Coverage |
| Under $25,000 | 3,779 (87.3%) | 552 (12.8%) |
| $25,000 to $49,999 | 2,305 (93.3%) | 166 (6.7%) |
| $50,000 to $74,999 | 2,691 (90.0%) | 298 (10.0%) |
| $75,000 to $99,999 | 1,457 (95.4%) | 71 (4.6%) |
| $100,000 and over | 3,813 (99.7%) | 11 (0.3%) |
Public vs Private Health Insurance Coverage by Age in Kirksville
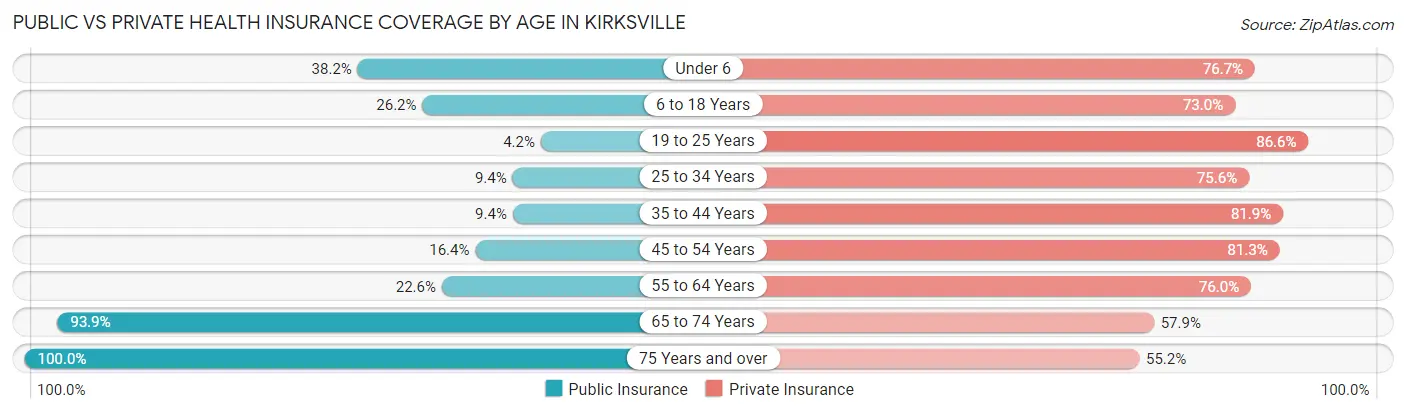
| Age Bracket | Public Insurance | Private Insurance |
| Under 6 | 370 (38.2%) | 743 (76.7%) |
| 6 to 18 Years | 741 (26.2%) | 2,066 (73.0%) |
| 19 to 25 Years | 230 (4.2%) | 4,748 (86.6%) |
| 25 to 34 Years | 149 (9.4%) | 1,194 (75.6%) |
| 35 to 44 Years | 139 (9.4%) | 1,213 (81.9%) |
| 45 to 54 Years | 247 (16.4%) | 1,228 (81.3%) |
| 55 to 64 Years | 320 (22.6%) | 1,077 (75.9%) |
| 65 to 74 Years | 1,004 (93.9%) | 619 (57.9%) |
| 75 Years and over | 975 (100.0%) | 538 (55.2%) |
| Total | 4,175 (24.1%) | 13,426 (77.5%) |
Disability Status by Sex by Age in Kirksville
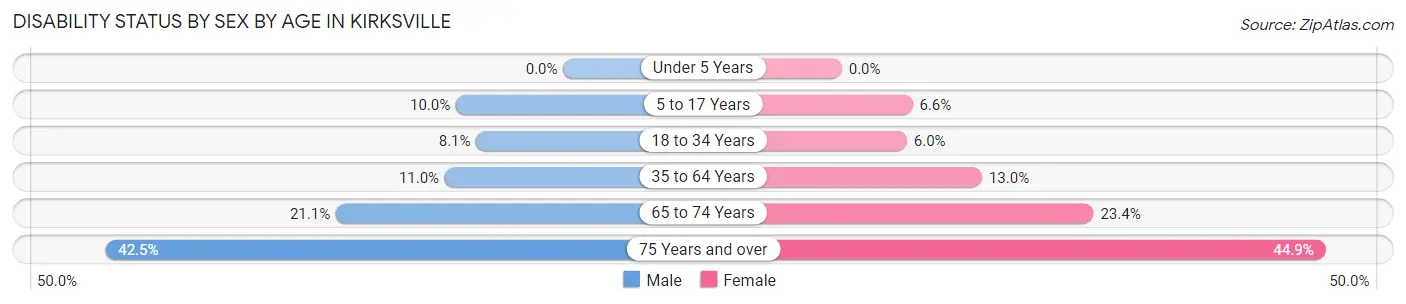
| Age Bracket | Male | Female |
| Under 5 Years | 0 (0.0%) | 0 (0.0%) |
| 5 to 17 Years | 110 (10.0%) | 65 (6.6%) |
| 18 to 34 Years | 295 (8.1%) | 258 (6.0%) |
| 35 to 64 Years | 238 (11.0%) | 292 (13.0%) |
| 65 to 74 Years | 100 (21.1%) | 139 (23.4%) |
| 75 Years and over | 156 (42.5%) | 273 (44.9%) |
Disability Class by Sex by Age in Kirksville
Disability Class: Hearing Difficulty
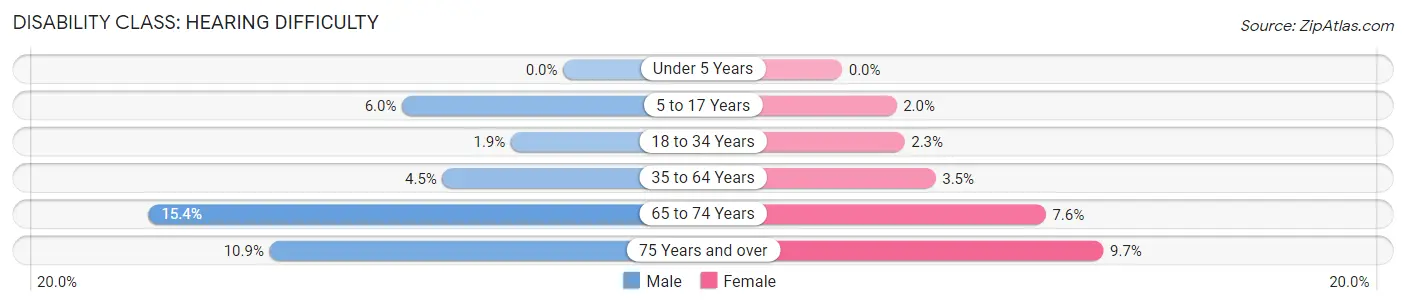
| Age Bracket | Male | Female |
| Under 5 Years | 0 (0.0%) | 0 (0.0%) |
| 5 to 17 Years | 66 (6.0%) | 20 (2.0%) |
| 18 to 34 Years | 71 (1.9%) | 99 (2.3%) |
| 35 to 64 Years | 97 (4.5%) | 78 (3.5%) |
| 65 to 74 Years | 73 (15.4%) | 45 (7.6%) |
| 75 Years and over | 40 (10.9%) | 59 (9.7%) |
Disability Class: Vision Difficulty
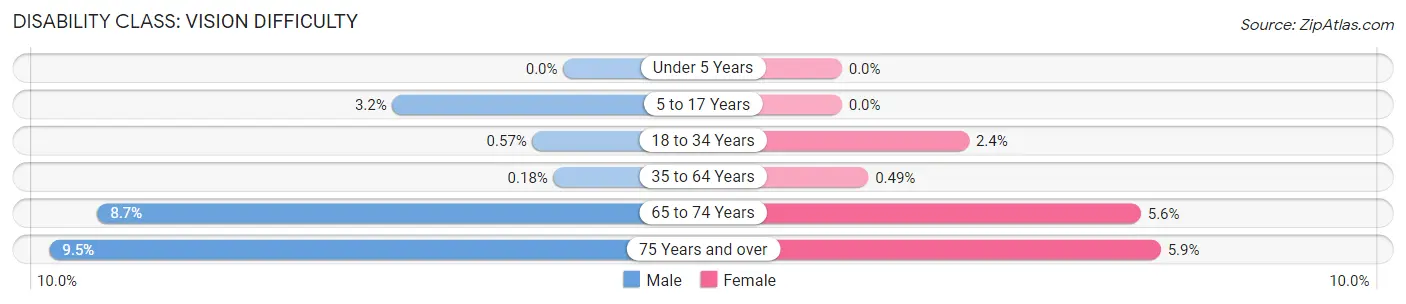
| Age Bracket | Male | Female |
| Under 5 Years | 0 (0.0%) | 0 (0.0%) |
| 5 to 17 Years | 35 (3.2%) | 0 (0.0%) |
| 18 to 34 Years | 21 (0.6%) | 101 (2.4%) |
| 35 to 64 Years | 4 (0.2%) | 11 (0.5%) |
| 65 to 74 Years | 41 (8.6%) | 33 (5.6%) |
| 75 Years and over | 35 (9.5%) | 36 (5.9%) |
Disability Class: Cognitive Difficulty
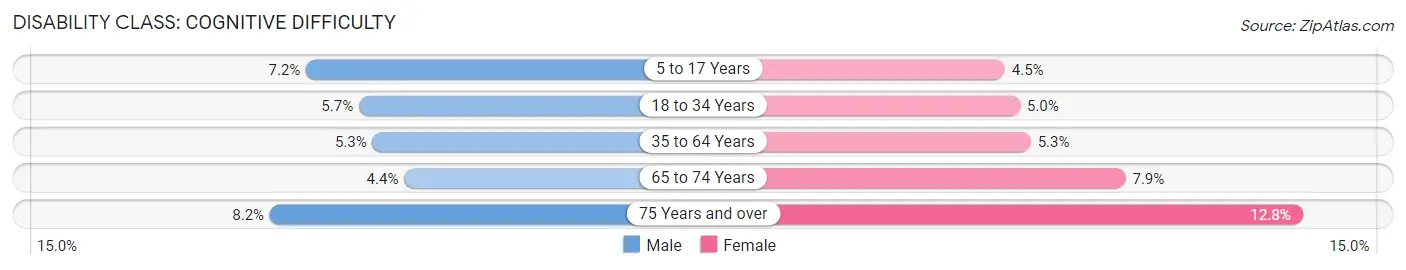
| Age Bracket | Male | Female |
| 5 to 17 Years | 79 (7.2%) | 45 (4.5%) |
| 18 to 34 Years | 208 (5.7%) | 212 (5.0%) |
| 35 to 64 Years | 115 (5.3%) | 118 (5.3%) |
| 65 to 74 Years | 21 (4.4%) | 47 (7.9%) |
| 75 Years and over | 30 (8.2%) | 78 (12.8%) |
Disability Class: Ambulatory Difficulty
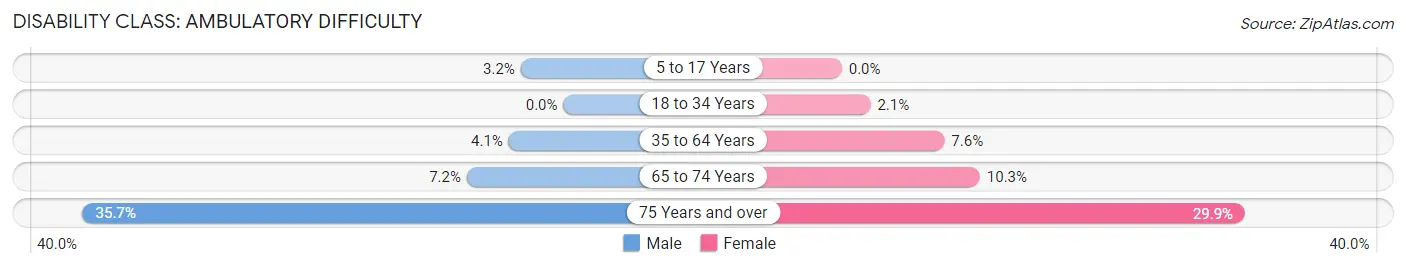
| Age Bracket | Male | Female |
| 5 to 17 Years | 35 (3.2%) | 0 (0.0%) |
| 18 to 34 Years | 0 (0.0%) | 91 (2.1%) |
| 35 to 64 Years | 88 (4.1%) | 171 (7.6%) |
| 65 to 74 Years | 34 (7.2%) | 61 (10.2%) |
| 75 Years and over | 131 (35.7%) | 182 (29.9%) |
Disability Class: Self-Care Difficulty
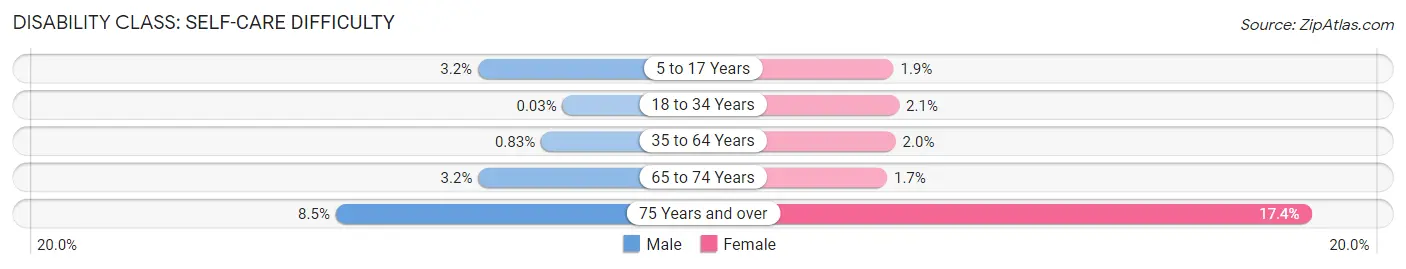
| Age Bracket | Male | Female |
| 5 to 17 Years | 35 (3.2%) | 19 (1.9%) |
| 18 to 34 Years | 1 (0.0%) | 91 (2.1%) |
| 35 to 64 Years | 18 (0.8%) | 45 (2.0%) |
| 65 to 74 Years | 15 (3.2%) | 10 (1.7%) |
| 75 Years and over | 31 (8.5%) | 106 (17.4%) |
Technology Access in Kirksville
Computing Device Access in Kirksville
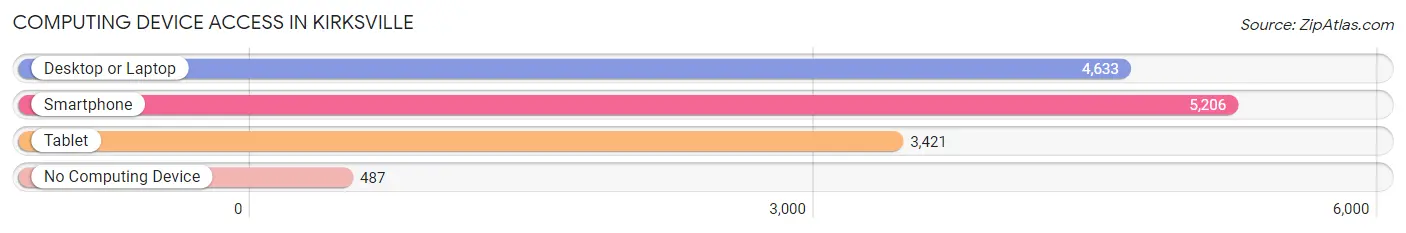
| Device Type | # Households | % Households |
| Desktop or Laptop | 4,633 | 77.8% |
| Smartphone | 5,206 | 87.5% |
| Tablet | 3,421 | 57.5% |
| No Computing Device | 487 | 8.2% |
| Total | 5,951 | 100.0% |
Internet Access in Kirksville
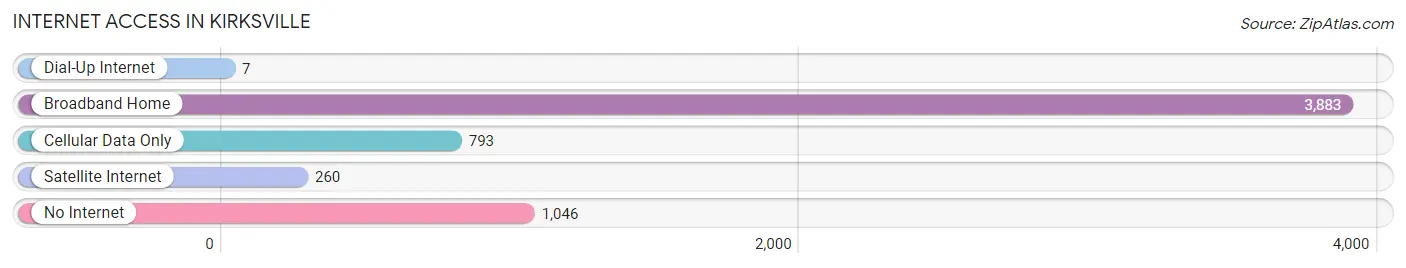
| Internet Type | # Households | % Households |
| Dial-Up Internet | 7 | 0.1% |
| Broadband Home | 3,883 | 65.2% |
| Cellular Data Only | 793 | 13.3% |
| Satellite Internet | 260 | 4.4% |
| No Internet | 1,046 | 17.6% |
| Total | 5,951 | 100.0% |
Kirksville Summary
Kirksville, Missouri is a small city located in the northeast corner of the state, in Adair County. It is the county seat and the largest city in the county. The city is home to Truman State University, a public liberal arts university, and A.T. Still University, a private medical school. The city has a population of 17,505 as of the 2020 census, and is the principal city of the Kirksville Micropolitan Statistical Area, which has a population of 36,945.
History
Kirksville was founded in 1841 by Jesse Kirk, a settler from Kentucky. The city was named after him, and was incorporated in 1857. The city was a major stop on the Hannibal and St. Joseph Railroad, which connected the city to St. Louis and Kansas City. The railroad was a major factor in the city's growth, and it was the first city in the state to have electric streetcars.
Kirksville was a major center of the Civil War, and was the site of several battles. The city was also the site of the Battle of Kirksville, which was fought in 1862. After the war, the city continued to grow, and by the early 20th century, it had become a major center of commerce and industry.
Geography
Kirksville is located in the northeast corner of Missouri, in Adair County. The city is situated on the Chariton River, and is surrounded by rolling hills and farmland. The city is located about 100 miles northeast of Kansas City, and about 150 miles northwest of St. Louis.
The city has a total area of 8.3 square miles, of which 8.2 square miles is land and 0.1 square miles is water. The city has a humid continental climate, with hot, humid summers and cold, snowy winters.
Economy
Kirksville's economy is largely based on education, healthcare, and manufacturing. The city is home to Truman State University, A.T. Still University, and several other educational institutions. The city is also home to several healthcare facilities, including the Kirksville Regional Medical Center.
Manufacturing is also an important part of the city's economy. The city is home to several manufacturing companies, including a paper mill, a plastics plant, and a metal fabrication plant.
Demographics
As of the 2020 census, Kirksville had a population of 17,505. The city has a median age of 24.7 years, and a median household income of $37,945. The city is majority white (86.2%), with small percentages of African American (5.2%), Hispanic (3.7%), and Asian (2.2%) populations.
Kirksville is a small city with a rich history and a diverse economy. The city is home to several educational institutions, healthcare facilities, and manufacturing companies, and is a great place to live and work.
Common Questions
What is Per Capita Income in Kirksville?
Per Capita income in Kirksville is $27,841.
What is the Median Family Income in Kirksville?
Median Family Income in Kirksville is $68,045.
What is the Median Household income in Kirksville?
Median Household Income in Kirksville is $41,089.
What is Income or Wage Gap in Kirksville?
Income or Wage Gap in Kirksville is 36.6%.
Women in Kirksville earn 63.4 cents for every dollar earned by a man.
What is Family Income Deficit in Kirksville?
Family Income Deficit in Kirksville is $11,988.
Families that are below poverty line in Kirksville earn $11,988 less on average than the poverty threshold level.
What is Inequality or Gini Index in Kirksville?
Inequality or Gini Index in Kirksville is 0.63.
What is the Total Population of Kirksville?
Total Population of Kirksville is 17,533.
What is the Total Male Population of Kirksville?
Total Male Population of Kirksville is 8,311.
What is the Total Female Population of Kirksville?
Total Female Population of Kirksville is 9,222.
What is the Ratio of Males per 100 Females in Kirksville?
There are 90.12 Males per 100 Females in Kirksville.
What is the Ratio of Females per 100 Males in Kirksville?
There are 110.96 Females per 100 Males in Kirksville.
What is the Median Population Age in Kirksville?
Median Population Age in Kirksville is 23.8 Years.
What is the Average Family Size in Kirksville
Average Family Size in Kirksville is 3.2 People.
What is the Average Household Size in Kirksville
Average Household Size in Kirksville is 2.5 People.
How Large is the Labor Force in Kirksville?
There are 6,914 People in the Labor Forcein in Kirksville.
What is the Percentage of People in the Labor Force in Kirksville?
46.6% of People are in the Labor Force in Kirksville.
What is the Unemployment Rate in Kirksville?
Unemployment Rate in Kirksville is 5.8%.