Fulton, MS Map & Demographics
Fulton Map
Fulton Overview
$20,200
PER CAPITA INCOME
$66,346
AVG FAMILY INCOME
$46,875
AVG HOUSEHOLD INCOME
11.1%
WAGE / INCOME GAP [ % ]
88.9¢/ $1
WAGE / INCOME GAP [ $ ]
0.40
INEQUALITY / GINI INDEX
4,494
TOTAL POPULATION
2,263
MALE POPULATION
2,231
FEMALE POPULATION
101.43
MALES / 100 FEMALES
98.59
FEMALES / 100 MALES
32.2
MEDIAN AGE
3.3
AVG FAMILY SIZE
2.7
AVG HOUSEHOLD SIZE
1,701
LABOR FORCE [ PEOPLE ]
43.6%
PERCENT IN LABOR FORCE
5.8%
UNEMPLOYMENT RATE
Fulton Zip Codes
Fulton Area Codes
Income in Fulton
Income Overview in Fulton
Per Capita Income in Fulton is $20,200, while median incomes of families and households are $66,346 and $46,875 respectively.
| Characteristic | Number | Measure |
| Per Capita Income | 4,494 | $20,200 |
| Median Family Income | 850 | $66,346 |
| Mean Family Income | 850 | $78,096 |
| Median Household Income | 1,252 | $46,875 |
| Mean Household Income | 1,252 | $64,512 |
| Income Deficit | 850 | $0 |
| Wage / Income Gap (%) | 4,494 | 11.10% |
| Wage / Income Gap ($) | 4,494 | 88.90¢ per $1 |
| Gini / Inequality Index | 4,494 | 0.40 |
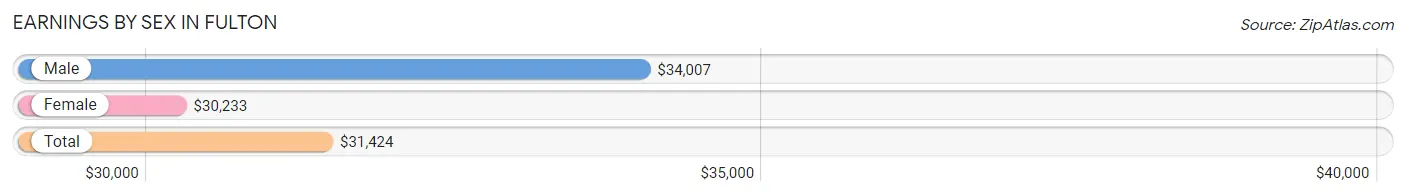
Earnings by Sex in Fulton
Average Earnings in Fulton are $31,424, $34,007 for men and $30,233 for women, a difference of 11.1%.
| Sex | Number | Average Earnings |
| Male | 943 (53.5%) | $34,007 |
| Female | 818 (46.5%) | $30,233 |
| Total | 1,761 (100.0%) | $31,424 |
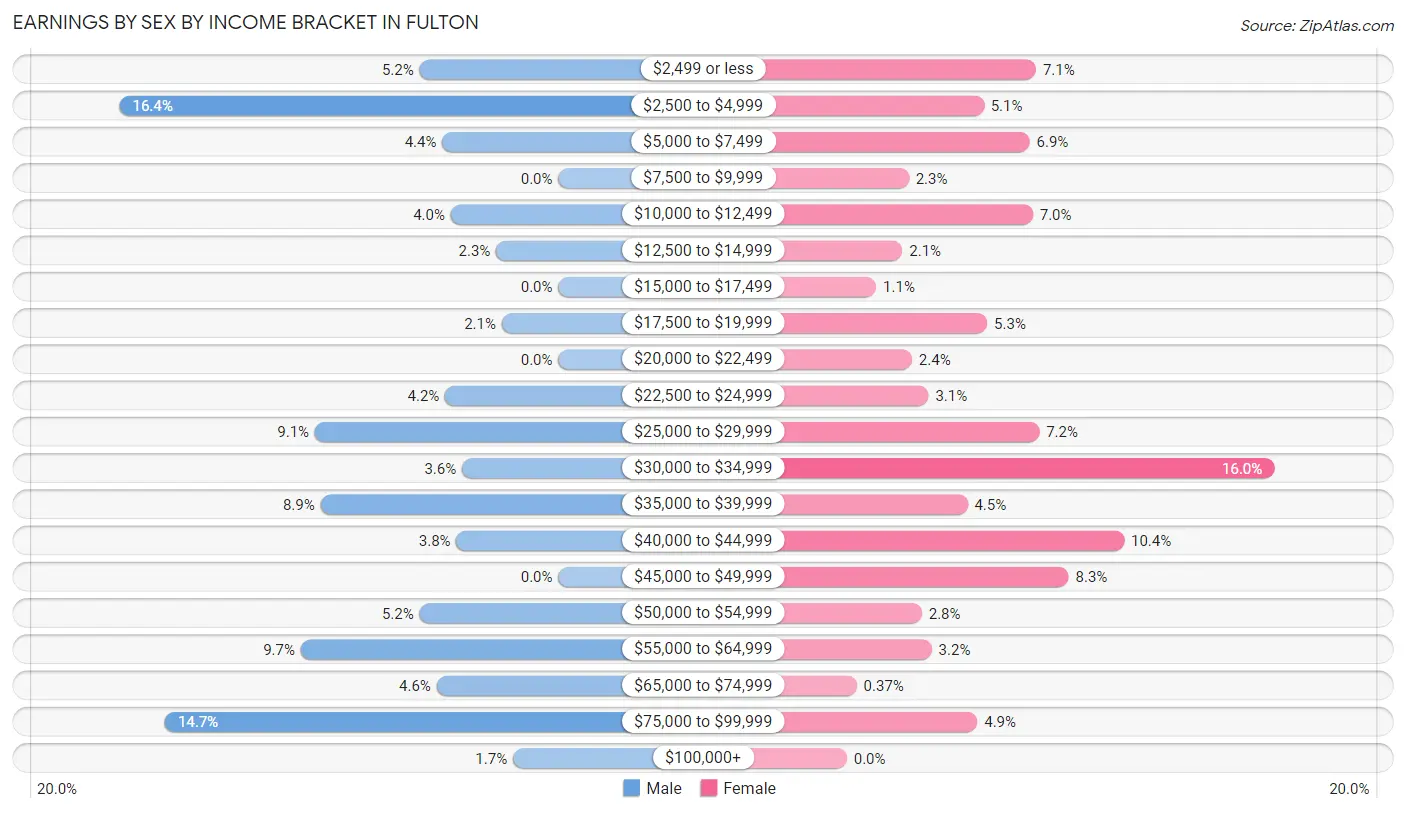
Earnings by Sex by Income Bracket in Fulton
The most common earnings brackets in Fulton are $2,500 to $4,999 for men (155 | 16.4%) and $30,000 to $34,999 for women (131 | 16.0%).
| Income | Male | Female |
| $2,499 or less | 49 (5.2%) | 58 (7.1%) |
| $2,500 to $4,999 | 155 (16.4%) | 42 (5.1%) |
| $5,000 to $7,499 | 41 (4.3%) | 56 (6.9%) |
| $7,500 to $9,999 | 0 (0.0%) | 19 (2.3%) |
| $10,000 to $12,499 | 38 (4.0%) | 57 (7.0%) |
| $12,500 to $14,999 | 22 (2.3%) | 17 (2.1%) |
| $15,000 to $17,499 | 0 (0.0%) | 9 (1.1%) |
| $17,500 to $19,999 | 20 (2.1%) | 43 (5.3%) |
| $20,000 to $22,499 | 0 (0.0%) | 20 (2.4%) |
| $22,500 to $24,999 | 40 (4.2%) | 25 (3.1%) |
| $25,000 to $29,999 | 86 (9.1%) | 59 (7.2%) |
| $30,000 to $34,999 | 34 (3.6%) | 131 (16.0%) |
| $35,000 to $39,999 | 84 (8.9%) | 37 (4.5%) |
| $40,000 to $44,999 | 36 (3.8%) | 85 (10.4%) |
| $45,000 to $49,999 | 0 (0.0%) | 68 (8.3%) |
| $50,000 to $54,999 | 49 (5.2%) | 23 (2.8%) |
| $55,000 to $64,999 | 91 (9.7%) | 26 (3.2%) |
| $65,000 to $74,999 | 43 (4.6%) | 3 (0.4%) |
| $75,000 to $99,999 | 139 (14.7%) | 40 (4.9%) |
| $100,000+ | 16 (1.7%) | 0 (0.0%) |
| Total | 943 (100.0%) | 818 (100.0%) |
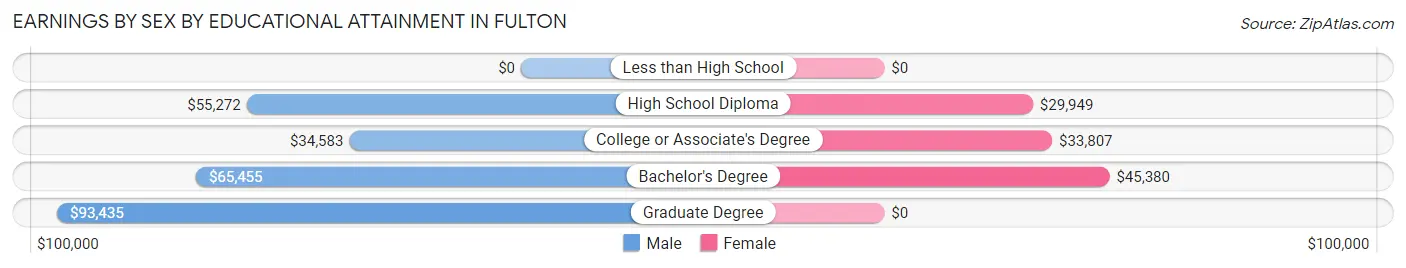
Earnings by Sex by Educational Attainment in Fulton
Average earnings in Fulton are $51,046 for men and $34,176 for women, a difference of 33.1%. Men with an educational attainment of graduate degree enjoy the highest average annual earnings of $93,435, while those with college or associate's degree education earn the least with $34,583. Women with an educational attainment of bachelor's degree earn the most with the average annual earnings of $45,380, while those with high school diploma education have the smallest earnings of $29,949.
| Educational Attainment | Male Income | Female Income |
| Less than High School | - | - |
| High School Diploma | $55,272 | $29,949 |
| College or Associate's Degree | $34,583 | $33,807 |
| Bachelor's Degree | $65,455 | $45,380 |
| Graduate Degree | $93,435 | $0 |
| Total | $51,046 | $34,176 |
Family Income in Fulton
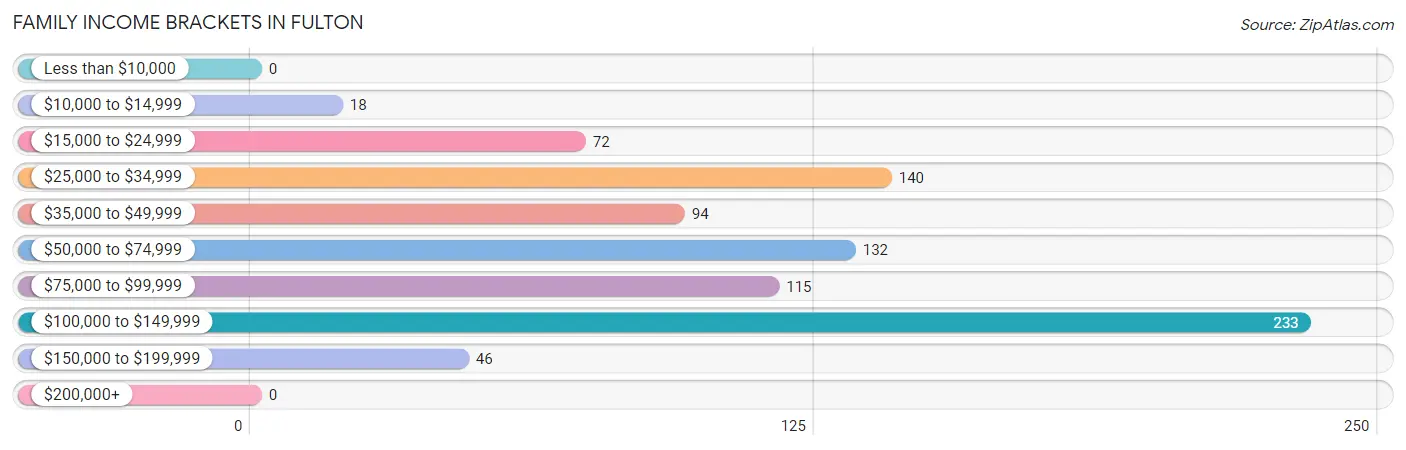
Family Income Brackets in Fulton
According to the Fulton family income data, there are 233 families falling into the $100,000 to $149,999 income range, which is the most common income bracket and makes up 27.4% of all families.
| Income Bracket | # Families | % Families |
| Less than $10,000 | 0 | 0.0% |
| $10,000 to $14,999 | 18 | 2.1% |
| $15,000 to $24,999 | 72 | 8.5% |
| $25,000 to $34,999 | 140 | 16.5% |
| $35,000 to $49,999 | 94 | 11.1% |
| $50,000 to $74,999 | 132 | 15.5% |
| $75,000 to $99,999 | 115 | 13.5% |
| $100,000 to $149,999 | 233 | 27.4% |
| $150,000 to $199,999 | 46 | 5.4% |
| $200,000+ | 0 | 0.0% |
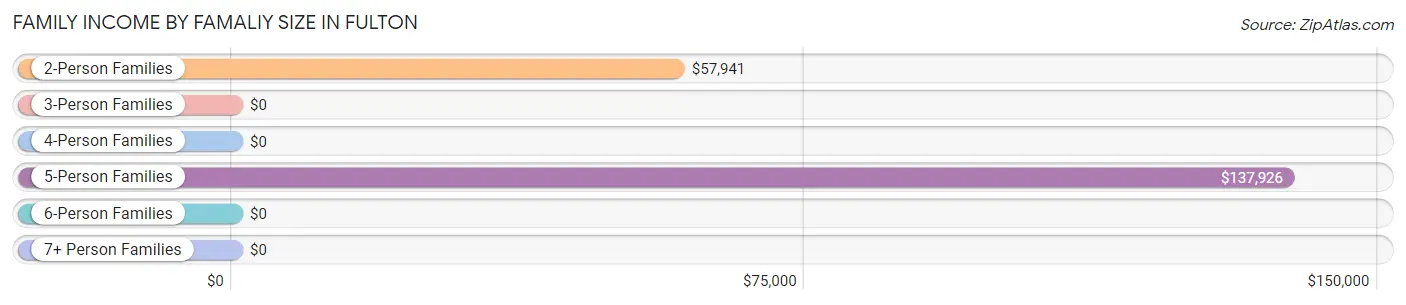
Family Income by Famaliy Size in Fulton
5-person families (100 | 11.8%) account for the highest median family income in Fulton with $137,926 per family, while 2-person families (416 | 48.9%) have the highest median income of $28,970 per family member.
| Income Bracket | # Families | Median Income |
| 2-Person Families | 416 (48.9%) | $57,941 |
| 3-Person Families | 123 (14.5%) | $0 |
| 4-Person Families | 202 (23.8%) | $0 |
| 5-Person Families | 100 (11.8%) | $137,926 |
| 6-Person Families | 9 (1.1%) | $0 |
| 7+ Person Families | 0 (0.0%) | $0 |
| Total | 850 (100.0%) | $66,346 |
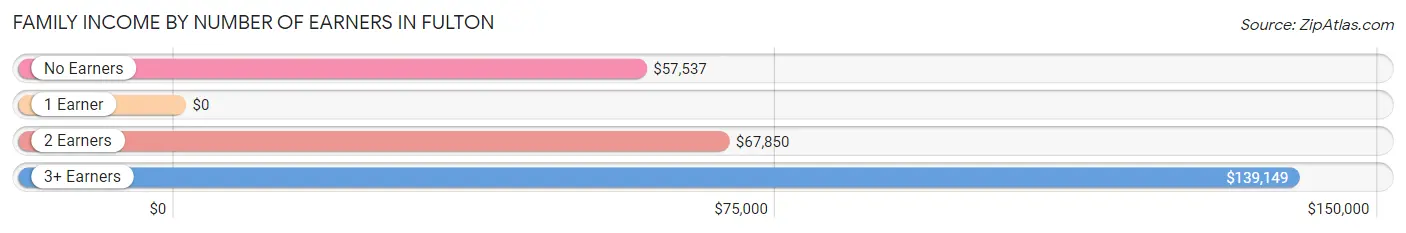
Family Income by Number of Earners in Fulton
| Number of Earners | # Families | Median Income |
| No Earners | 105 (12.3%) | $57,537 |
| 1 Earner | 382 (44.9%) | $0 |
| 2 Earners | 239 (28.1%) | $67,850 |
| 3+ Earners | 124 (14.6%) | $139,149 |
| Total | 850 (100.0%) | $66,346 |
Household Income in Fulton
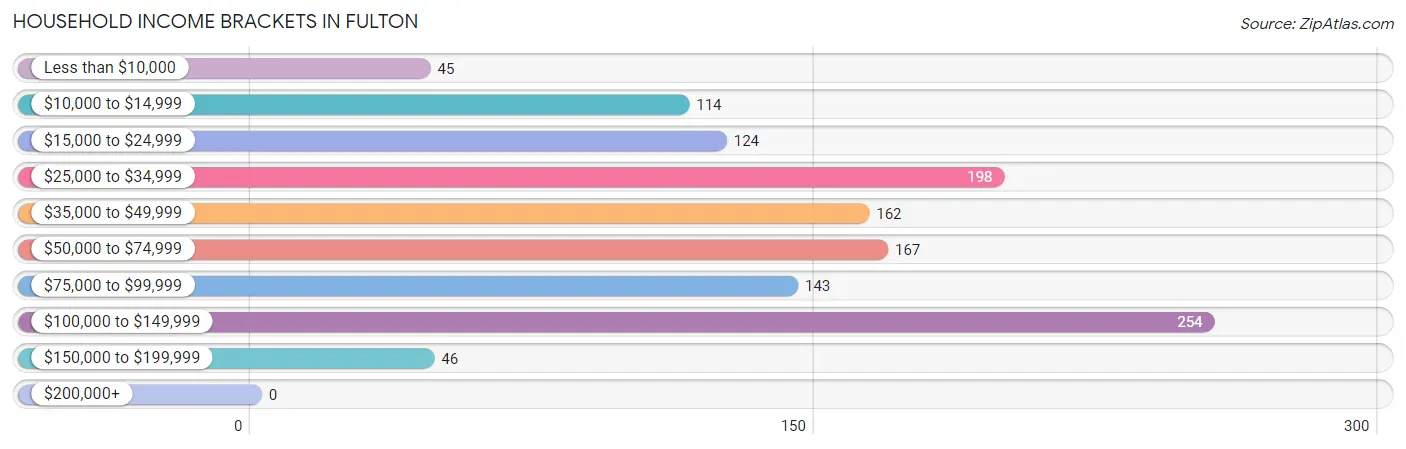
Household Income Brackets in Fulton
With 254 households falling in the category, the $100,000 to $149,999 income range is the most frequent in Fulton, accounting for 20.3% of all households.
| Income Bracket | # Households | % Households |
| Less than $10,000 | 45 | 3.6% |
| $10,000 to $14,999 | 114 | 9.1% |
| $15,000 to $24,999 | 124 | 9.9% |
| $25,000 to $34,999 | 198 | 15.8% |
| $35,000 to $49,999 | 162 | 12.9% |
| $50,000 to $74,999 | 167 | 13.3% |
| $75,000 to $99,999 | 143 | 11.4% |
| $100,000 to $149,999 | 254 | 20.3% |
| $150,000 to $199,999 | 46 | 3.7% |
| $200,000+ | 0 | 0.0% |
Household Income by Householder Age in Fulton
The median household income in Fulton is $46,875, with the highest median household income of $59,081 found in the 65+ years age bracket for the primary householder. A total of 419 households (33.5%) fall into this category. Meanwhile, the 15 to 24 years age bracket for the primary householder has the lowest median household income of $16,563, with 77 households (6.1%) in this group.
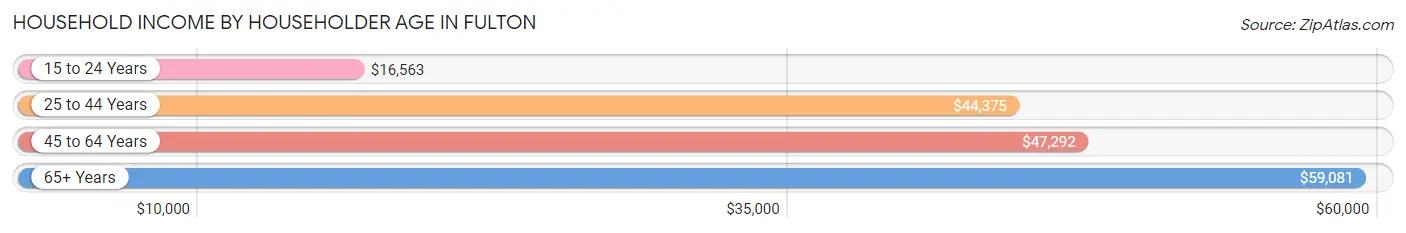
| Income Bracket | # Households | Median Income |
| 15 to 24 Years | 77 (6.1%) | $16,563 |
| 25 to 44 Years | 314 (25.1%) | $44,375 |
| 45 to 64 Years | 442 (35.3%) | $47,292 |
| 65+ Years | 419 (33.5%) | $59,081 |
| Total | 1,252 (100.0%) | $46,875 |
Poverty in Fulton
Income Below Poverty by Sex and Age in Fulton
With 4.8% poverty level for males and 13.5% for females among the residents of Fulton, 25 to 34 year old males and 18 to 24 year old females are the most vulnerable to poverty, with 25 males (18.9%) and 92 females (52.3%) in their respective age groups living below the poverty level.
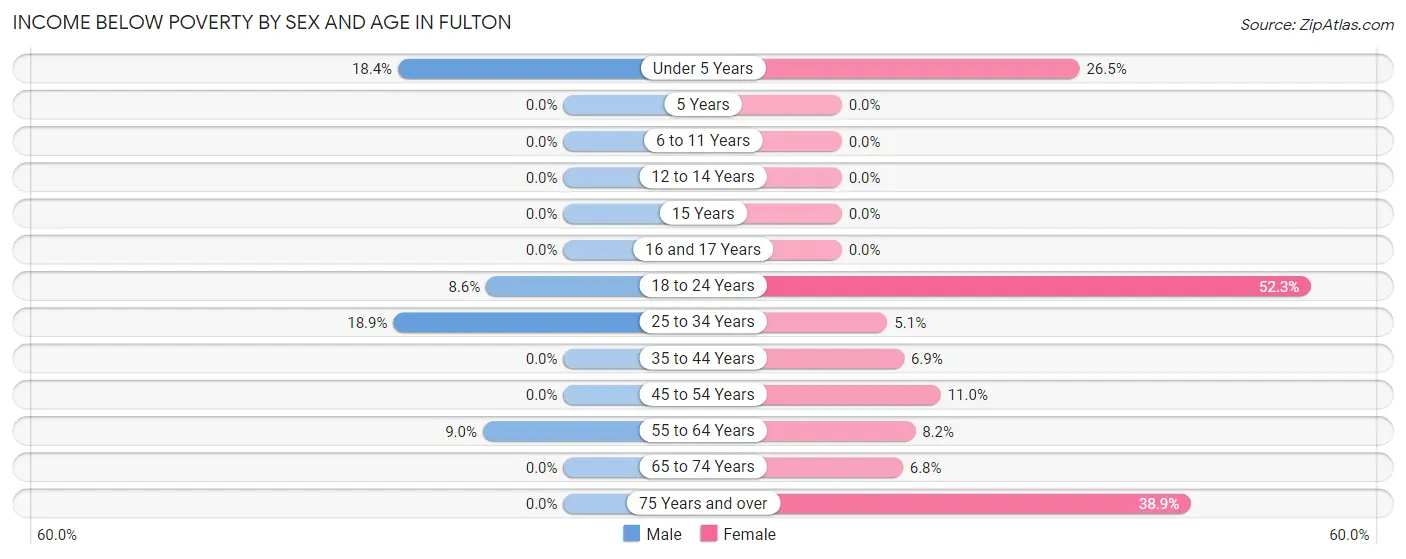
| Age Bracket | Male | Female |
| Under 5 Years | 7 (18.4%) | 9 (26.5%) |
| 5 Years | 0 (0.0%) | 0 (0.0%) |
| 6 to 11 Years | 0 (0.0%) | 0 (0.0%) |
| 12 to 14 Years | 0 (0.0%) | 0 (0.0%) |
| 15 Years | 0 (0.0%) | 0 (0.0%) |
| 16 and 17 Years | 0 (0.0%) | 0 (0.0%) |
| 18 to 24 Years | 32 (8.6%) | 92 (52.3%) |
| 25 to 34 Years | 25 (18.9%) | 13 (5.1%) |
| 35 to 44 Years | 0 (0.0%) | 11 (6.9%) |
| 45 to 54 Years | 0 (0.0%) | 28 (11.0%) |
| 55 to 64 Years | 13 (9.0%) | 27 (8.2%) |
| 65 to 74 Years | 0 (0.0%) | 18 (6.8%) |
| 75 Years and over | 0 (0.0%) | 42 (38.9%) |
| Total | 77 (4.8%) | 240 (13.5%) |
Income Above Poverty by Sex and Age in Fulton
According to the poverty statistics in Fulton, males aged 5 years and females aged 5 years are the age groups that are most secure financially, with 100.0% of males and 100.0% of females in these age groups living above the poverty line.
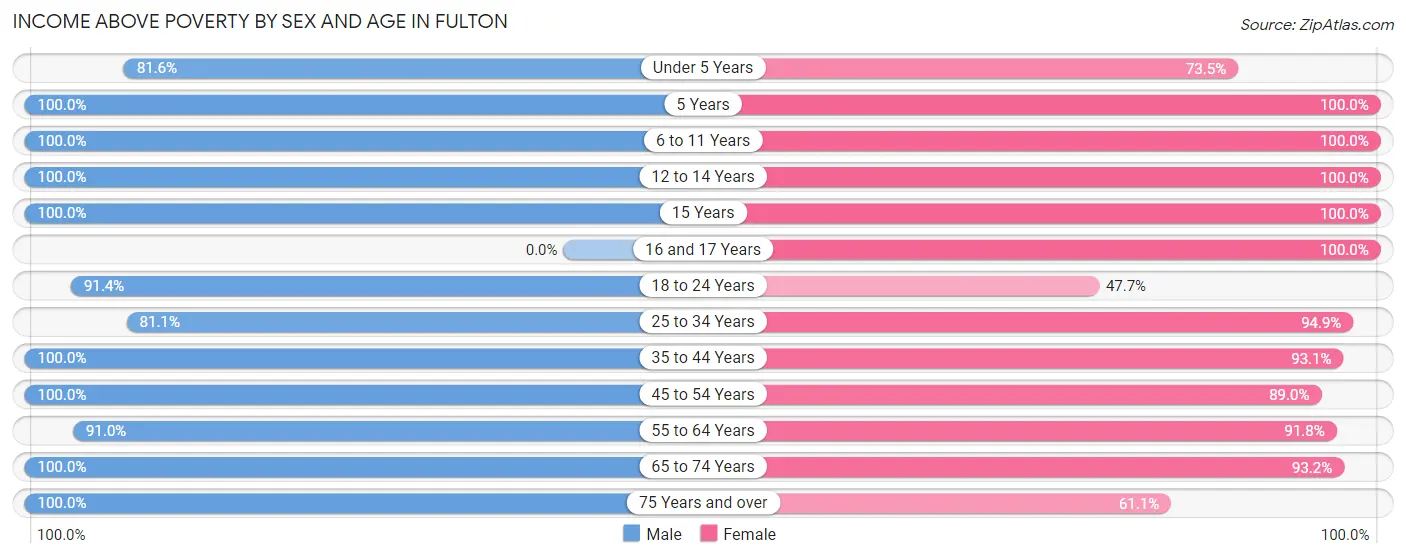
| Age Bracket | Male | Female |
| Under 5 Years | 31 (81.6%) | 25 (73.5%) |
| 5 Years | 36 (100.0%) | 53 (100.0%) |
| 6 to 11 Years | 105 (100.0%) | 31 (100.0%) |
| 12 to 14 Years | 115 (100.0%) | 50 (100.0%) |
| 15 Years | 76 (100.0%) | 31 (100.0%) |
| 16 and 17 Years | 0 (0.0%) | 25 (100.0%) |
| 18 to 24 Years | 340 (91.4%) | 84 (47.7%) |
| 25 to 34 Years | 107 (81.1%) | 243 (94.9%) |
| 35 to 44 Years | 152 (100.0%) | 148 (93.1%) |
| 45 to 54 Years | 164 (100.0%) | 226 (89.0%) |
| 55 to 64 Years | 132 (91.0%) | 303 (91.8%) |
| 65 to 74 Years | 184 (100.0%) | 247 (93.2%) |
| 75 Years and over | 73 (100.0%) | 66 (61.1%) |
| Total | 1,515 (95.2%) | 1,532 (86.5%) |
Income Below Poverty Among Married-Couple Families in Fulton
The poverty statistics for married-couple families in Fulton show that 2.0% or 11 of the total 551 families live below the poverty line. Families with 1 or 2 children have the highest poverty rate of 6.4%, comprising of 11 families. On the other hand, families with no children have the lowest poverty rate of 0.0%, which includes 0 families.
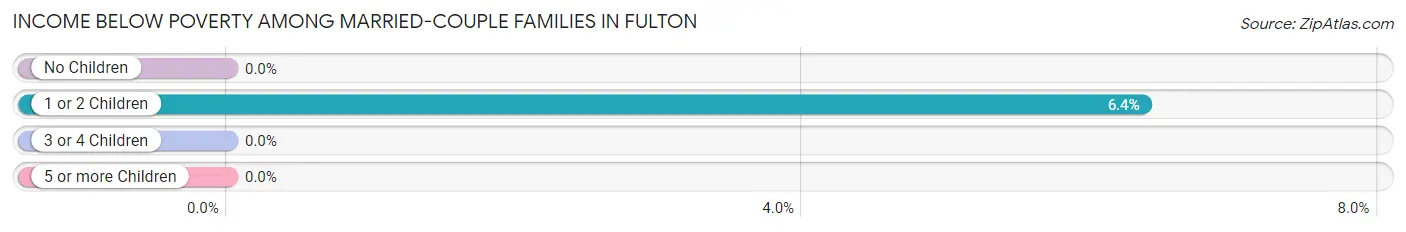
| Children | Above Poverty | Below Poverty |
| No Children | 349 (100.0%) | 0 (0.0%) |
| 1 or 2 Children | 162 (93.6%) | 11 (6.4%) |
| 3 or 4 Children | 29 (100.0%) | 0 (0.0%) |
| 5 or more Children | 0 (0.0%) | 0 (0.0%) |
| Total | 540 (98.0%) | 11 (2.0%) |
Income Below Poverty Among Single-Parent Households in Fulton
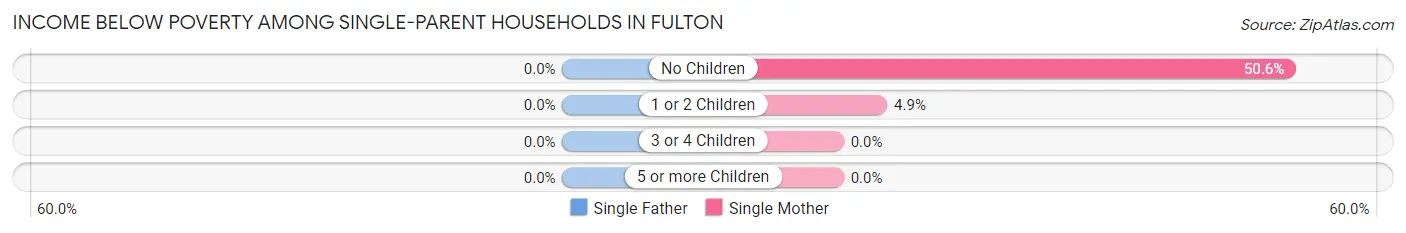
| Children | Single Father | Single Mother |
| No Children | 0 (0.0%) | 45 (50.6%) |
| 1 or 2 Children | 0 (0.0%) | 9 (4.9%) |
| 3 or 4 Children | 0 (0.0%) | 0 (0.0%) |
| 5 or more Children | 0 (0.0%) | 0 (0.0%) |
| Total | 0 (0.0%) | 54 (19.7%) |
Income Below Poverty Among Married-Couple vs Single-Parent Households in Fulton
The poverty data for Fulton shows that 11 of the married-couple family households (2.0%) and 54 of the single-parent households (18.1%) are living below the poverty level. Within the married-couple family households, those with 1 or 2 children have the highest poverty rate, with 11 households (6.4%) falling below the poverty line. Among the single-parent households, those with no children have the highest poverty rate, with 45 household (42.9%) living below poverty.
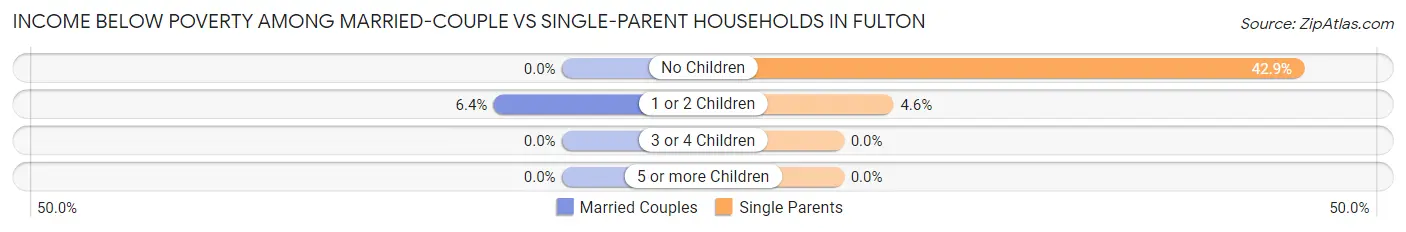
| Children | Married-Couple Families | Single-Parent Households |
| No Children | 0 (0.0%) | 45 (42.9%) |
| 1 or 2 Children | 11 (6.4%) | 9 (4.6%) |
| 3 or 4 Children | 0 (0.0%) | 0 (0.0%) |
| 5 or more Children | 0 (0.0%) | 0 (0.0%) |
| Total | 11 (2.0%) | 54 (18.1%) |
Race in Fulton
The most populous races in Fulton are White / Caucasian (3,509 | 78.1%), Black / African American (722 | 16.1%), and Two or more Races (207 | 4.6%).
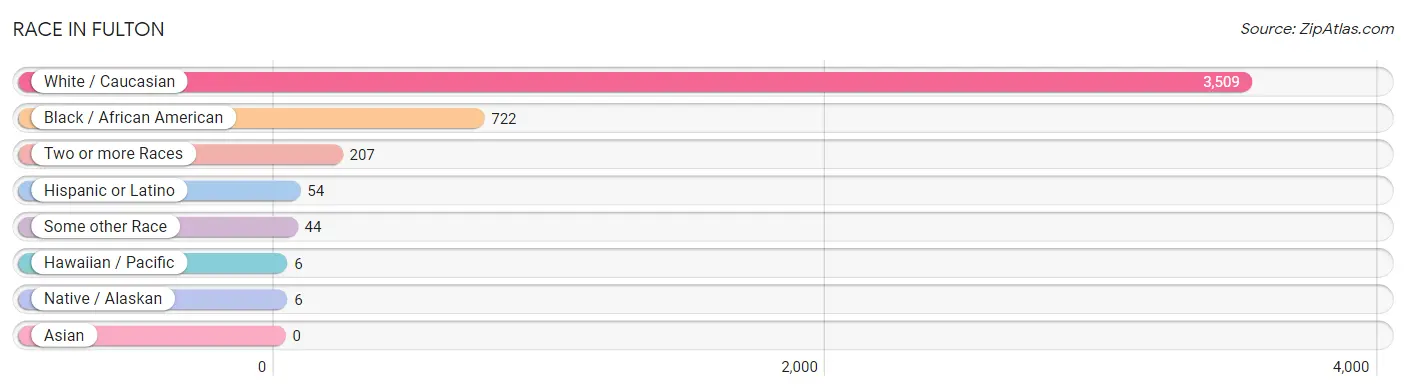
| Race | # Population | % Population |
| Asian | 0 | 0.0% |
| Black / African American | 722 | 16.1% |
| Hawaiian / Pacific | 6 | 0.1% |
| Hispanic or Latino | 54 | 1.2% |
| Native / Alaskan | 6 | 0.1% |
| White / Caucasian | 3,509 | 78.1% |
| Two or more Races | 207 | 4.6% |
| Some other Race | 44 | 1.0% |
| Total | 4,494 | 100.0% |
Ancestry in Fulton
The most populous ancestries reported in Fulton are Irish (379 | 8.4%), American (267 | 5.9%), English (264 | 5.9%), German (207 | 4.6%), and Italian (182 | 4.1%), together accounting for 28.9% of all Fulton residents.
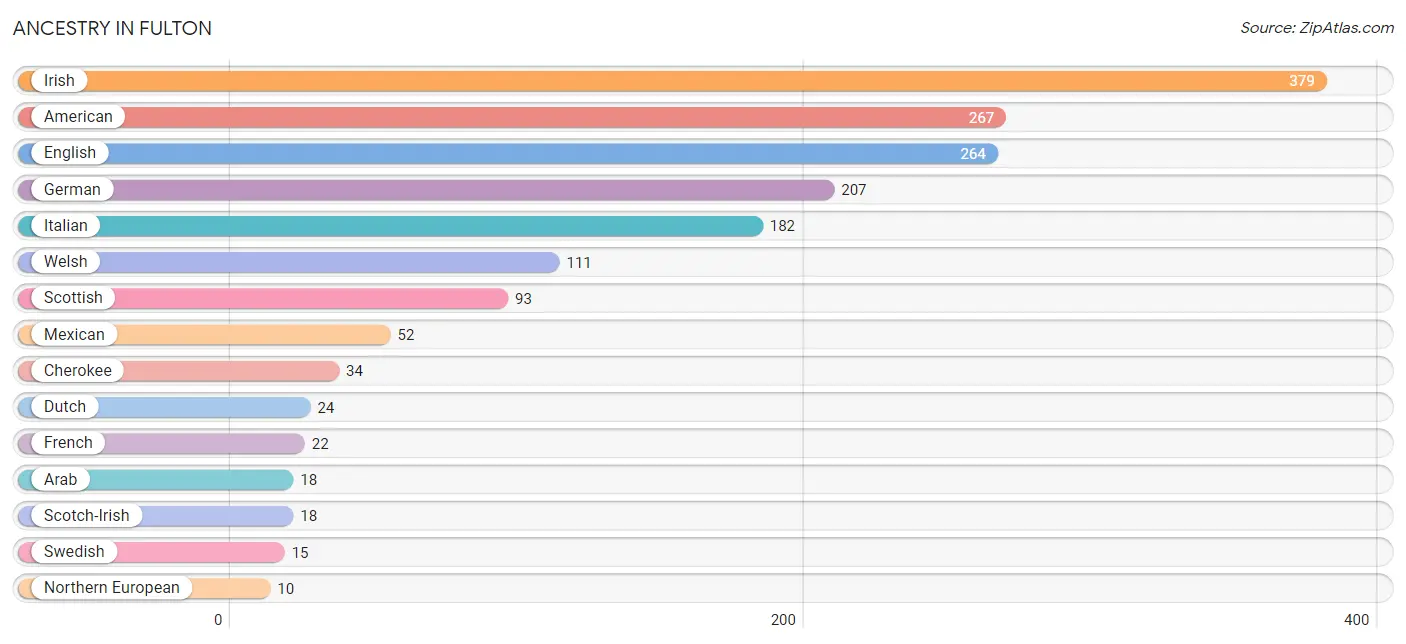
| Ancestry | # Population | % Population |
| African | 8 | 0.2% |
| American | 267 | 5.9% |
| Arab | 18 | 0.4% |
| Cherokee | 34 | 0.8% |
| Danish | 6 | 0.1% |
| Dutch | 24 | 0.5% |
| English | 264 | 5.9% |
| European | 9 | 0.2% |
| French | 22 | 0.5% |
| German | 207 | 4.6% |
| Irish | 379 | 8.4% |
| Italian | 182 | 4.1% |
| Mexican | 52 | 1.2% |
| Northern European | 10 | 0.2% |
| Puerto Rican | 1 | 0.0% |
| Scotch-Irish | 18 | 0.4% |
| Scottish | 93 | 2.1% |
| Spaniard | 1 | 0.0% |
| Subsaharan African | 8 | 0.2% |
| Swedish | 15 | 0.3% |
| Welsh | 111 | 2.5% | View All 21 Rows |
Immigrants in Fulton
The most numerous immigrant groups reported in Fulton came from Latin America (10 | 0.2%), Central America (8 | 0.2%), Mexico (8 | 0.2%), Oceania (6 | 0.1%), and Brazil (2 | 0.0%), together accounting for 0.7% of all Fulton residents.
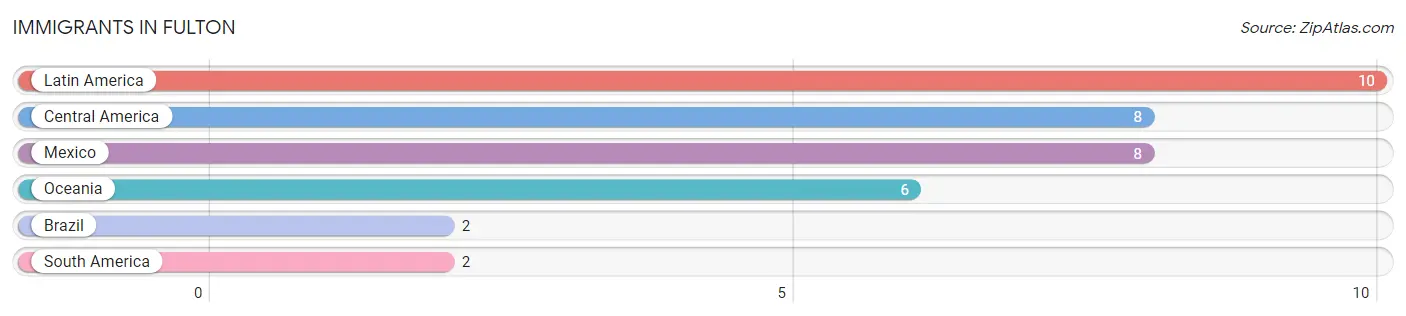
| Immigration Origin | # Population | % Population |
| Brazil | 2 | 0.0% |
| Central America | 8 | 0.2% |
| Latin America | 10 | 0.2% |
| Mexico | 8 | 0.2% |
| Oceania | 6 | 0.1% |
| South America | 2 | 0.0% | View All 6 Rows |
Sex and Age in Fulton
Sex and Age in Fulton
The most populous age groups in Fulton are 15 to 19 Years (671 | 29.6%) for men and 15 to 19 Years (338 | 15.1%) for women.
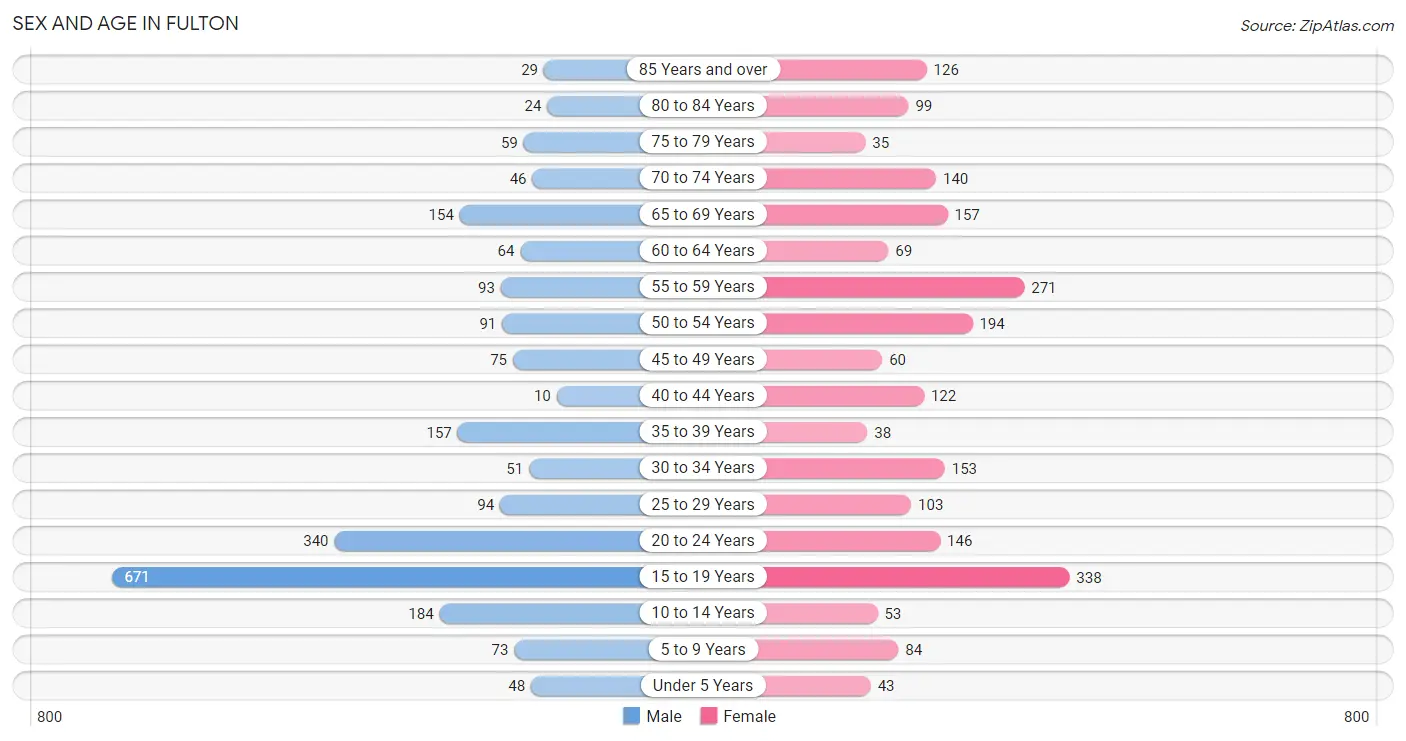
| Age Bracket | Male | Female |
| Under 5 Years | 48 (2.1%) | 43 (1.9%) |
| 5 to 9 Years | 73 (3.2%) | 84 (3.8%) |
| 10 to 14 Years | 184 (8.1%) | 53 (2.4%) |
| 15 to 19 Years | 671 (29.6%) | 338 (15.1%) |
| 20 to 24 Years | 340 (15.0%) | 146 (6.5%) |
| 25 to 29 Years | 94 (4.2%) | 103 (4.6%) |
| 30 to 34 Years | 51 (2.2%) | 153 (6.9%) |
| 35 to 39 Years | 157 (6.9%) | 38 (1.7%) |
| 40 to 44 Years | 10 (0.4%) | 122 (5.5%) |
| 45 to 49 Years | 75 (3.3%) | 60 (2.7%) |
| 50 to 54 Years | 91 (4.0%) | 194 (8.7%) |
| 55 to 59 Years | 93 (4.1%) | 271 (12.1%) |
| 60 to 64 Years | 64 (2.8%) | 69 (3.1%) |
| 65 to 69 Years | 154 (6.8%) | 157 (7.0%) |
| 70 to 74 Years | 46 (2.0%) | 140 (6.3%) |
| 75 to 79 Years | 59 (2.6%) | 35 (1.6%) |
| 80 to 84 Years | 24 (1.1%) | 99 (4.4%) |
| 85 Years and over | 29 (1.3%) | 126 (5.7%) |
| Total | 2,263 (100.0%) | 2,231 (100.0%) |
Families and Households in Fulton
Median Family Size in Fulton
The median family size in Fulton is 3.32 persons per family, with married-couple families (551 | 64.8%) accounting for the largest median family size of 3.64 persons per family. On the other hand, single male/father families (25 | 2.9%) represent the smallest median family size with 2.56 persons per family.
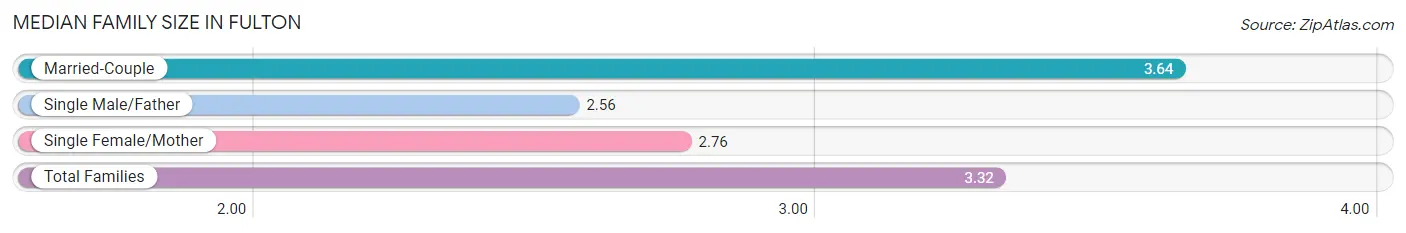
| Family Type | # Families | Family Size |
| Married-Couple | 551 (64.8%) | 3.64 |
| Single Male/Father | 25 (2.9%) | 2.56 |
| Single Female/Mother | 274 (32.2%) | 2.76 |
| Total Families | 850 (100.0%) | 3.32 |
Median Household Size in Fulton
The median household size in Fulton is 2.69 persons per household, with married-couple households (551 | 44.0%) accounting for the largest median household size of 3.7 persons per household. non-family households (402 | 32.1%) represent the smallest median household size with 1.16 persons per household.
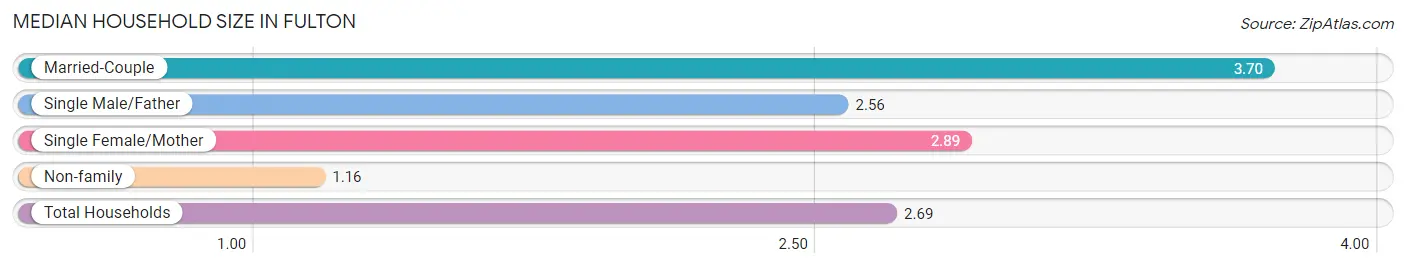
| Household Type | # Households | Household Size |
| Married-Couple | 551 (44.0%) | 3.70 |
| Single Male/Father | 25 (2.0%) | 2.56 |
| Single Female/Mother | 274 (21.9%) | 2.89 |
| Non-family | 402 (32.1%) | 1.16 |
| Total Households | 1,252 (100.0%) | 2.69 |
Household Size by Marriage Status in Fulton
Out of a total of 1,252 households in Fulton, 850 (67.9%) are family households, while 402 (32.1%) are nonfamily households. The most numerous type of family households are 2-person households, comprising 370, and the most common type of nonfamily households are 1-person households, comprising 358.
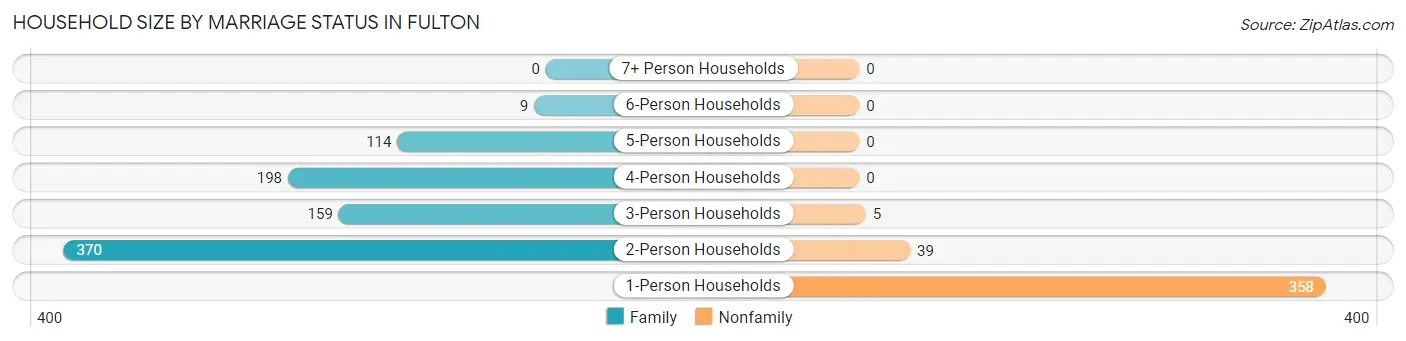
| Household Size | Family Households | Nonfamily Households |
| 1-Person Households | - | 358 (28.6%) |
| 2-Person Households | 370 (29.5%) | 39 (3.1%) |
| 3-Person Households | 159 (12.7%) | 5 (0.4%) |
| 4-Person Households | 198 (15.8%) | 0 (0.0%) |
| 5-Person Households | 114 (9.1%) | 0 (0.0%) |
| 6-Person Households | 9 (0.7%) | 0 (0.0%) |
| 7+ Person Households | 0 (0.0%) | 0 (0.0%) |
| Total | 850 (67.9%) | 402 (32.1%) |
Female Fertility in Fulton
Fertility by Age in Fulton
Average fertility rate in Fulton is 9.0 births per 1,000 women. Women in the age bracket of 35 to 50 years have the highest fertility rate with 20.0 births per 1,000 women. Women in the age bracket of 35 to 50 years acount for 70.0% of all women with births.
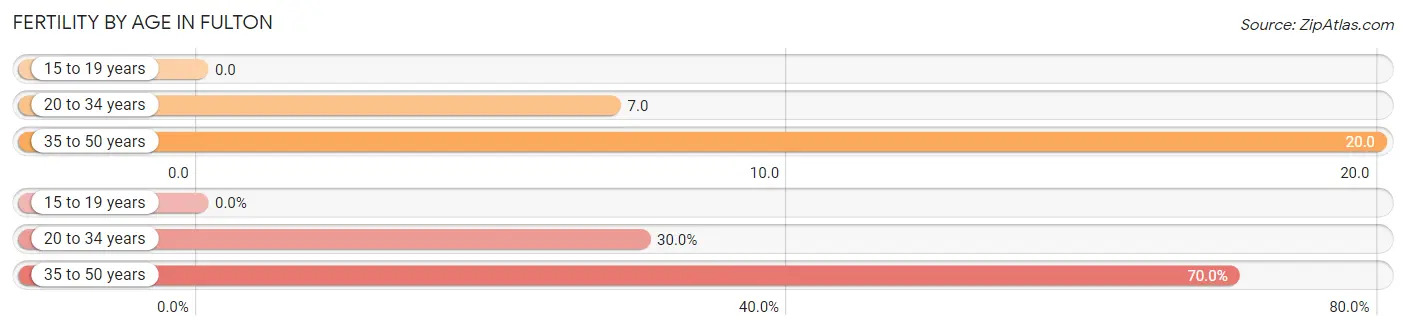
| Age Bracket | Women with Births | Births / 1,000 Women |
| 15 to 19 years | 0 (0.0%) | 0.0 |
| 20 to 34 years | 3 (30.0%) | 7.0 |
| 35 to 50 years | 7 (70.0%) | 20.0 |
| Total | 10 (100.0%) | 9.0 |
Fertility by Age by Marriage Status in Fulton
70.0% of women with births (10) in Fulton are married. The highest percentage of unmarried women with births falls into 20 to 34 years age bracket with 100.0% of them unmarried at the time of birth, while the lowest percentage of unmarried women with births belong to 35 to 50 years age bracket with 0.0% of them unmarried.
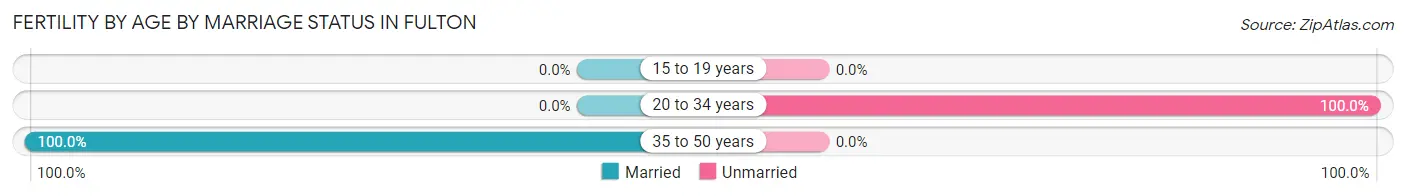
| Age Bracket | Married | Unmarried |
| 15 to 19 years | 0 (0.0%) | 0 (0.0%) |
| 20 to 34 years | 0 (0.0%) | 3 (100.0%) |
| 35 to 50 years | 7 (100.0%) | 0 (0.0%) |
| Total | 7 (70.0%) | 3 (30.0%) |
Fertility by Education in Fulton
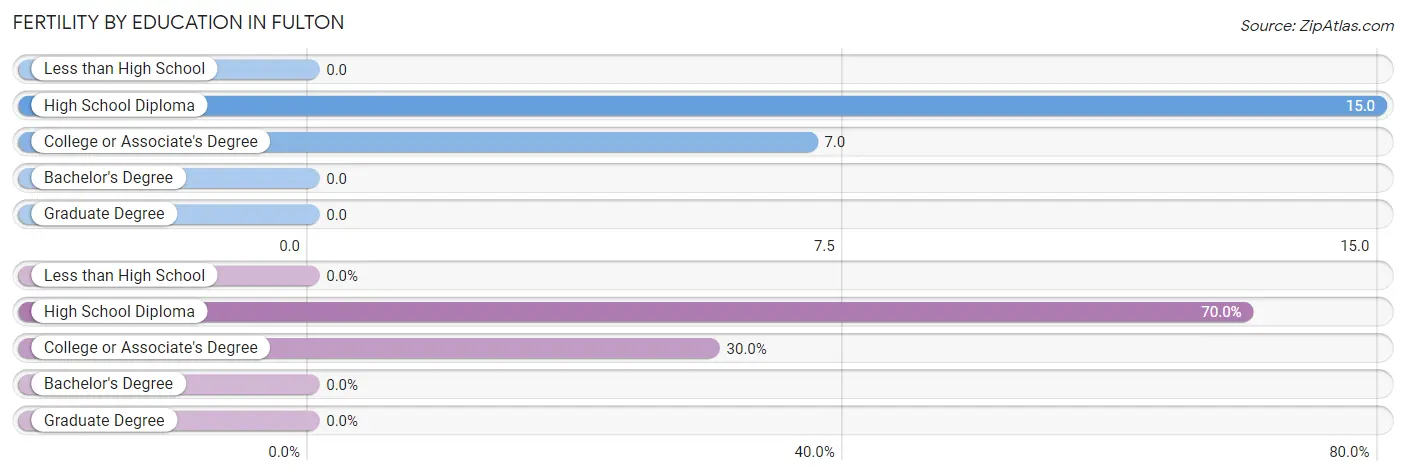
| Educational Attainment | Women with Births | Births / 1,000 Women |
| Less than High School | 0 (0.0%) | 0.0 |
| High School Diploma | 7 (70.0%) | 15.0 |
| College or Associate's Degree | 3 (30.0%) | 7.0 |
| Bachelor's Degree | 0 (0.0%) | 0.0 |
| Graduate Degree | 0 (0.0%) | 0.0 |
| Total | 10 (100.0%) | 9.0 |
Fertility by Education by Marriage Status in Fulton
30.0% of women with births in Fulton are unmarried. Women with the educational attainment of high school diploma are most likely to be married with 100.0% of them married at childbirth, while women with the educational attainment of college or associate's degree are least likely to be married with 100.0% of them unmarried at childbirth.
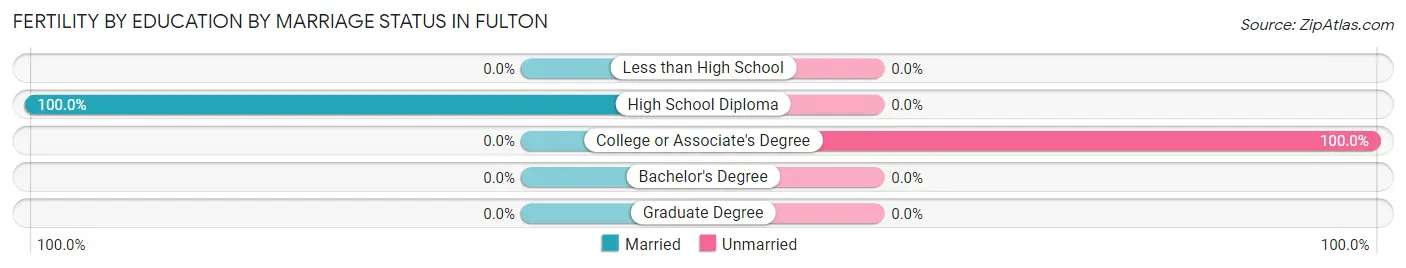
| Educational Attainment | Married | Unmarried |
| Less than High School | 0 (0.0%) | 0 (0.0%) |
| High School Diploma | 7 (100.0%) | 0 (0.0%) |
| College or Associate's Degree | 0 (0.0%) | 3 (100.0%) |
| Bachelor's Degree | 0 (0.0%) | 0 (0.0%) |
| Graduate Degree | 0 (0.0%) | 0 (0.0%) |
| Total | 7 (70.0%) | 3 (30.0%) |
Employment Characteristics in Fulton
Employment by Class of Employer in Fulton
Among the 1,587 employed individuals in Fulton, private company employees (1,097 | 69.1%), state government employees (266 | 16.8%), and self-employed (not incorporated) (59 | 3.7%) make up the most common classes of employment.
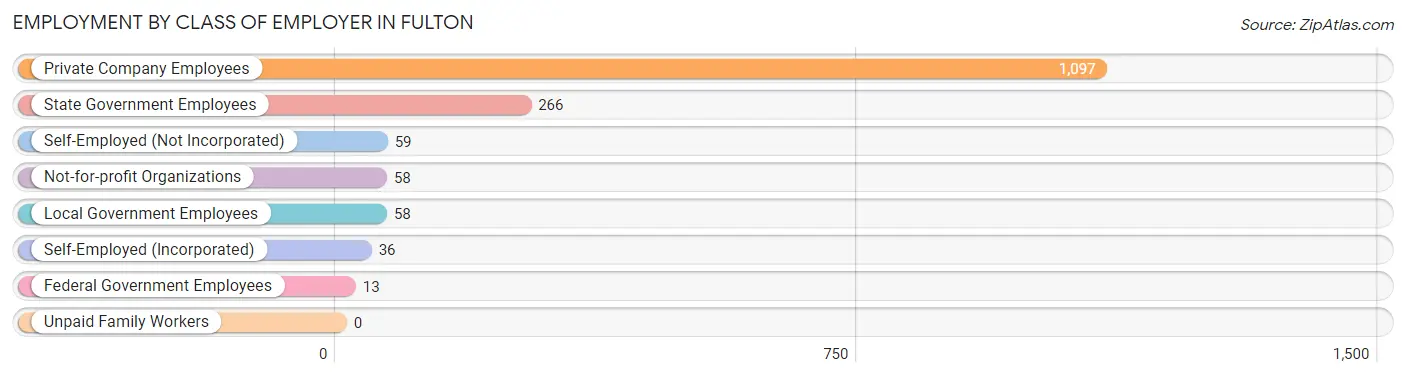
| Employer Class | # Employees | % Employees |
| Private Company Employees | 1,097 | 69.1% |
| Self-Employed (Incorporated) | 36 | 2.3% |
| Self-Employed (Not Incorporated) | 59 | 3.7% |
| Not-for-profit Organizations | 58 | 3.6% |
| Local Government Employees | 58 | 3.6% |
| State Government Employees | 266 | 16.8% |
| Federal Government Employees | 13 | 0.8% |
| Unpaid Family Workers | 0 | 0.0% |
| Total | 1,587 | 100.0% |
Employment Status by Age in Fulton
According to the labor force statistics for Fulton, out of the total population over 16 years of age (3,902), 43.6% or 1,701 individuals are in the labor force, with 5.8% or 99 of them unemployed. The age group with the highest labor force participation rate is 45 to 54 years, with 87.1% or 366 individuals in the labor force. Within the labor force, the 16 to 19 years age range has the highest percentage of unemployed individuals, with 28.2% or 55 of them being unemployed.
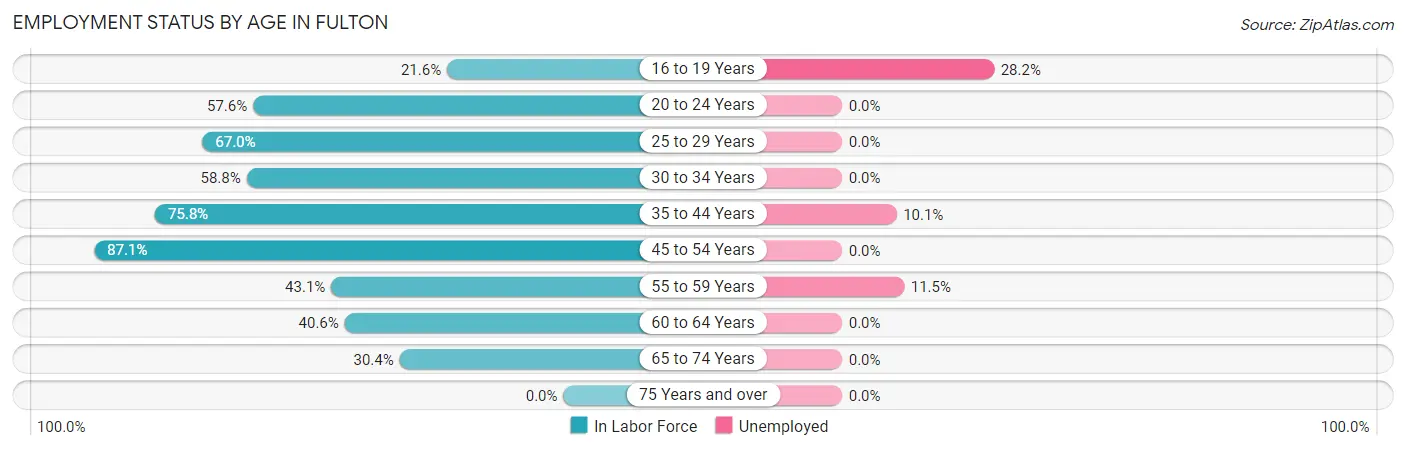
| Age Bracket | In Labor Force | Unemployed |
| 16 to 19 Years | 195 (21.6%) | 55 (28.2%) |
| 20 to 24 Years | 280 (57.6%) | 0 (0.0%) |
| 25 to 29 Years | 132 (67.0%) | 0 (0.0%) |
| 30 to 34 Years | 120 (58.8%) | 0 (0.0%) |
| 35 to 44 Years | 248 (75.8%) | 25 (10.1%) |
| 45 to 54 Years | 366 (87.1%) | 0 (0.0%) |
| 55 to 59 Years | 157 (43.1%) | 18 (11.5%) |
| 60 to 64 Years | 54 (40.6%) | 0 (0.0%) |
| 65 to 74 Years | 151 (30.4%) | 0 (0.0%) |
| 75 Years and over | 0 (0.0%) | 0 (0.0%) |
| Total | 1,701 (43.6%) | 99 (5.8%) |
Employment Status by Educational Attainment in Fulton
According to labor force statistics for Fulton, 65.5% of individuals (1,077) out of the total population between 25 and 64 years of age (1,645) are in the labor force, with 4.0% or 43 of them being unemployed. The group with the highest labor force participation rate are those with the educational attainment of bachelor's degree or higher, with 85.5% or 183 individuals in the labor force. Within the labor force, individuals with less than high school education have the highest percentage of unemployment, with 19.4% or 13 of them being unemployed.
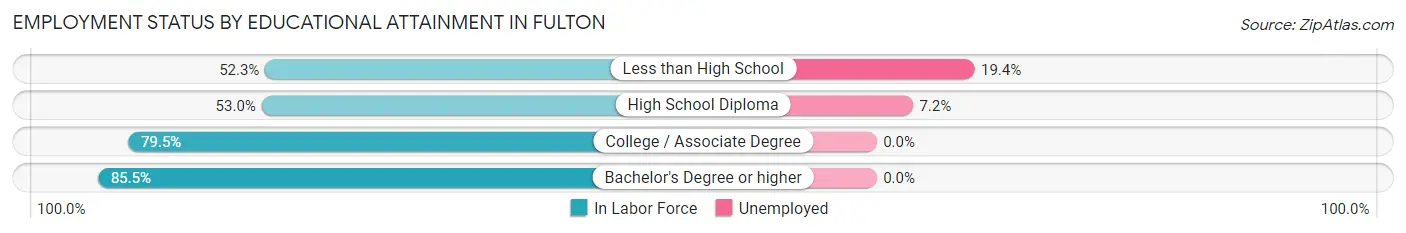
| Educational Attainment | In Labor Force | Unemployed |
| Less than High School | 67 (52.3%) | 25 (19.4%) |
| High School Diploma | 419 (53.0%) | 57 (7.2%) |
| College / Associate Degree | 408 (79.5%) | 0 (0.0%) |
| Bachelor's Degree or higher | 183 (85.5%) | 0 (0.0%) |
| Total | 1,077 (65.5%) | 66 (4.0%) |
Employment Occupations by Sex in Fulton
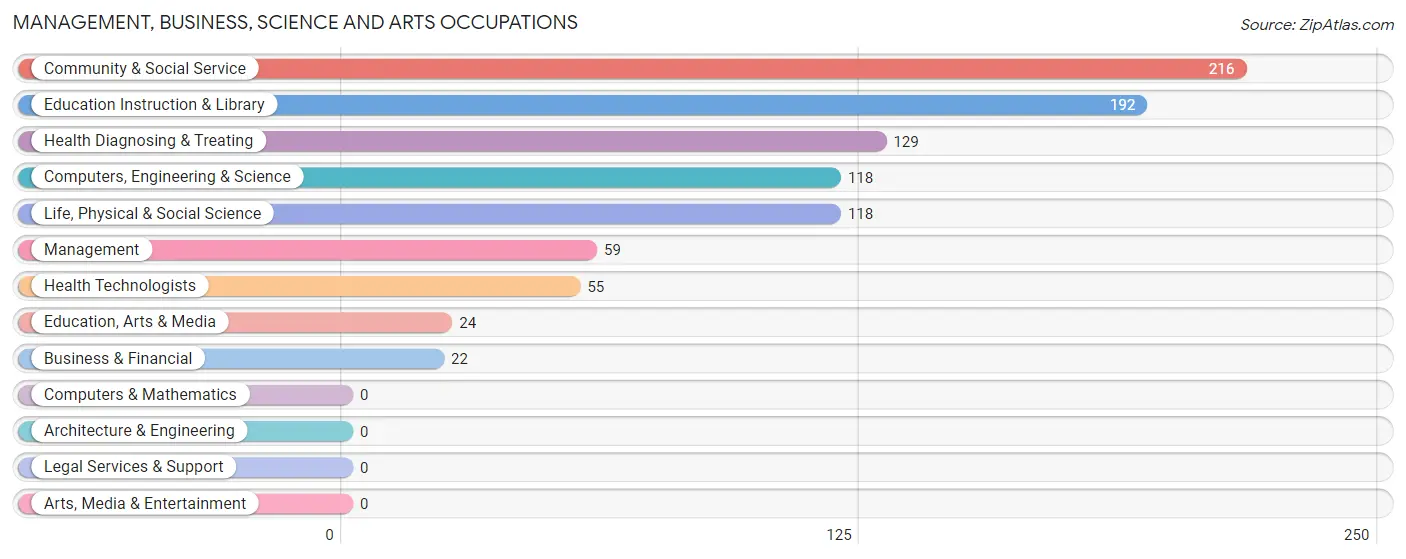
Management, Business, Science and Arts Occupations
The most common Management, Business, Science and Arts occupations in Fulton are Community & Social Service (216 | 13.5%), Education Instruction & Library (192 | 12.0%), Health Diagnosing & Treating (129 | 8.0%), Computers, Engineering & Science (118 | 7.3%), and Life, Physical & Social Science (118 | 7.3%).
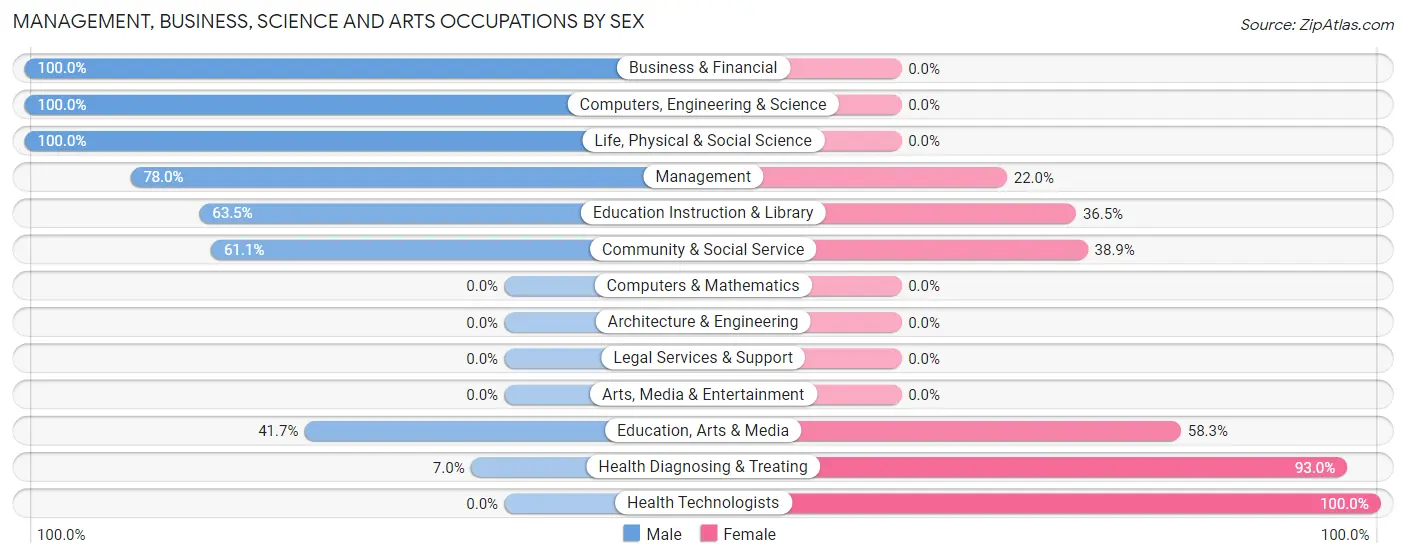
Management, Business, Science and Arts Occupations by Sex
Within the Management, Business, Science and Arts occupations in Fulton, the most male-oriented occupations are Business & Financial (100.0%), Computers, Engineering & Science (100.0%), and Life, Physical & Social Science (100.0%), while the most female-oriented occupations are Health Technologists (100.0%), Health Diagnosing & Treating (93.0%), and Education, Arts & Media (58.3%).
| Occupation | Male | Female |
| Management | 46 (78.0%) | 13 (22.0%) |
| Business & Financial | 22 (100.0%) | 0 (0.0%) |
| Computers, Engineering & Science | 118 (100.0%) | 0 (0.0%) |
| Computers & Mathematics | 0 (0.0%) | 0 (0.0%) |
| Architecture & Engineering | 0 (0.0%) | 0 (0.0%) |
| Life, Physical & Social Science | 118 (100.0%) | 0 (0.0%) |
| Community & Social Service | 132 (61.1%) | 84 (38.9%) |
| Education, Arts & Media | 10 (41.7%) | 14 (58.3%) |
| Legal Services & Support | 0 (0.0%) | 0 (0.0%) |
| Education Instruction & Library | 122 (63.5%) | 70 (36.5%) |
| Arts, Media & Entertainment | 0 (0.0%) | 0 (0.0%) |
| Health Diagnosing & Treating | 9 (7.0%) | 120 (93.0%) |
| Health Technologists | 0 (0.0%) | 55 (100.0%) |
| Total (Category) | 327 (60.1%) | 217 (39.9%) |
| Total (Overall) | 851 (53.0%) | 754 (47.0%) |
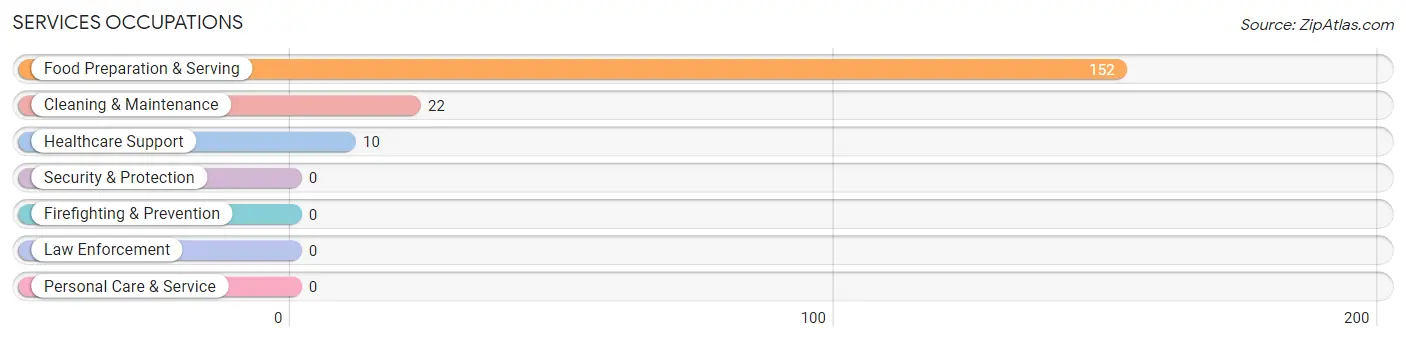
Services Occupations
The most common Services occupations in Fulton are Food Preparation & Serving (152 | 9.5%), Cleaning & Maintenance (22 | 1.4%), and Healthcare Support (10 | 0.6%).
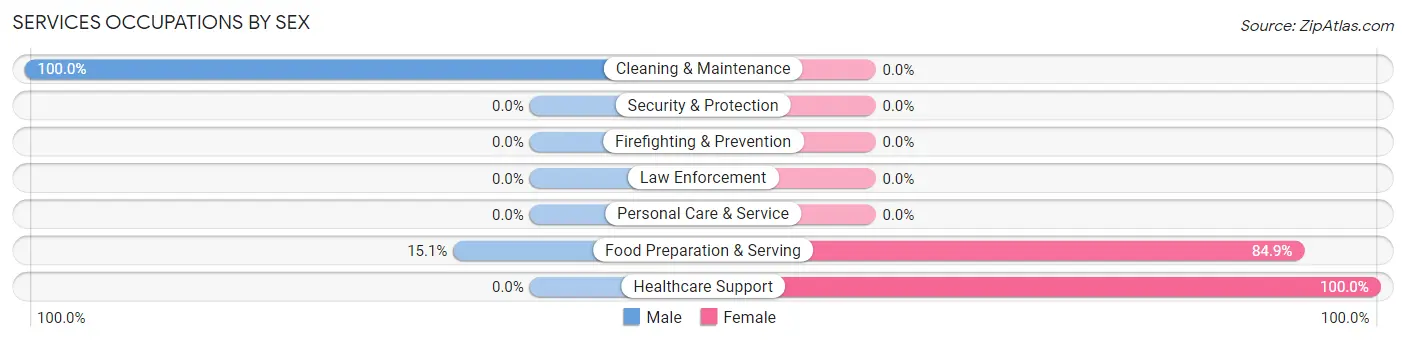
Services Occupations by Sex
Within the Services occupations in Fulton, the most male-oriented occupations are Cleaning & Maintenance (100.0%), and Food Preparation & Serving (15.1%), while the most female-oriented occupations are Healthcare Support (100.0%), and Food Preparation & Serving (84.9%).
| Occupation | Male | Female |
| Healthcare Support | 0 (0.0%) | 10 (100.0%) |
| Security & Protection | 0 (0.0%) | 0 (0.0%) |
| Firefighting & Prevention | 0 (0.0%) | 0 (0.0%) |
| Law Enforcement | 0 (0.0%) | 0 (0.0%) |
| Food Preparation & Serving | 23 (15.1%) | 129 (84.9%) |
| Cleaning & Maintenance | 22 (100.0%) | 0 (0.0%) |
| Personal Care & Service | 0 (0.0%) | 0 (0.0%) |
| Total (Category) | 45 (24.5%) | 139 (75.5%) |
| Total (Overall) | 851 (53.0%) | 754 (47.0%) |
Sales and Office Occupations
The most common Sales and Office occupations in Fulton are Sales & Related (226 | 14.1%), and Office & Administration (155 | 9.7%).
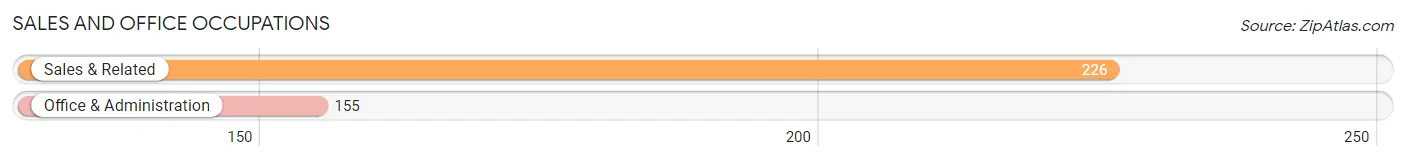
Sales and Office Occupations by Sex

| Occupation | Male | Female |
| Sales & Related | 40 (17.7%) | 186 (82.3%) |
| Office & Administration | 33 (21.3%) | 122 (78.7%) |
| Total (Category) | 73 (19.2%) | 308 (80.8%) |
| Total (Overall) | 851 (53.0%) | 754 (47.0%) |
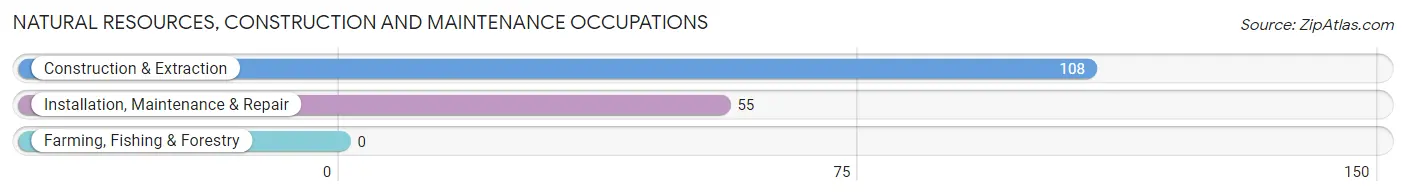
Natural Resources, Construction and Maintenance Occupations
The most common Natural Resources, Construction and Maintenance occupations in Fulton are Construction & Extraction (108 | 6.7%), and Installation, Maintenance & Repair (55 | 3.4%).
Natural Resources, Construction and Maintenance Occupations by Sex
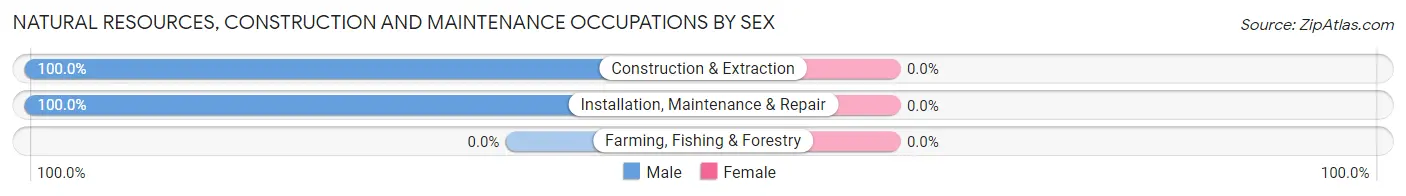
| Occupation | Male | Female |
| Farming, Fishing & Forestry | 0 (0.0%) | 0 (0.0%) |
| Construction & Extraction | 108 (100.0%) | 0 (0.0%) |
| Installation, Maintenance & Repair | 55 (100.0%) | 0 (0.0%) |
| Total (Category) | 163 (100.0%) | 0 (0.0%) |
| Total (Overall) | 851 (53.0%) | 754 (47.0%) |
Production, Transportation and Moving Occupations
The most common Production, Transportation and Moving occupations in Fulton are Production (170 | 10.6%), Transportation (113 | 7.0%), and Material Moving (50 | 3.1%).
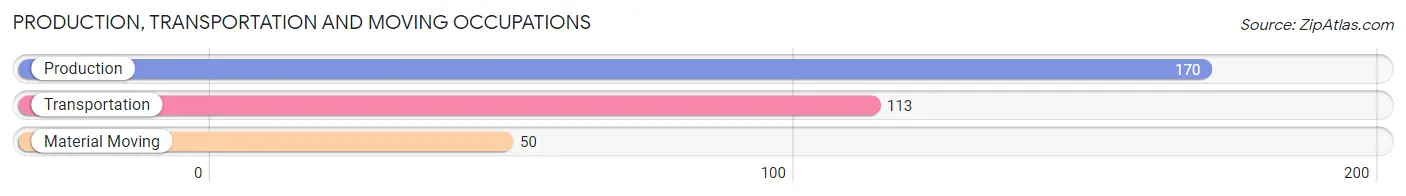
Production, Transportation and Moving Occupations by Sex
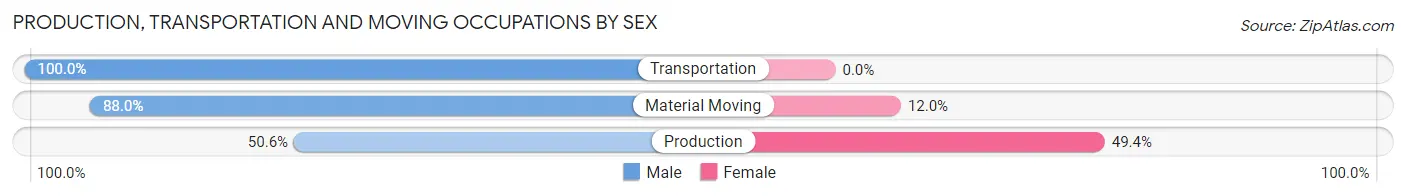
| Occupation | Male | Female |
| Production | 86 (50.6%) | 84 (49.4%) |
| Transportation | 113 (100.0%) | 0 (0.0%) |
| Material Moving | 44 (88.0%) | 6 (12.0%) |
| Total (Category) | 243 (73.0%) | 90 (27.0%) |
| Total (Overall) | 851 (53.0%) | 754 (47.0%) |
Employment Industries by Sex in Fulton
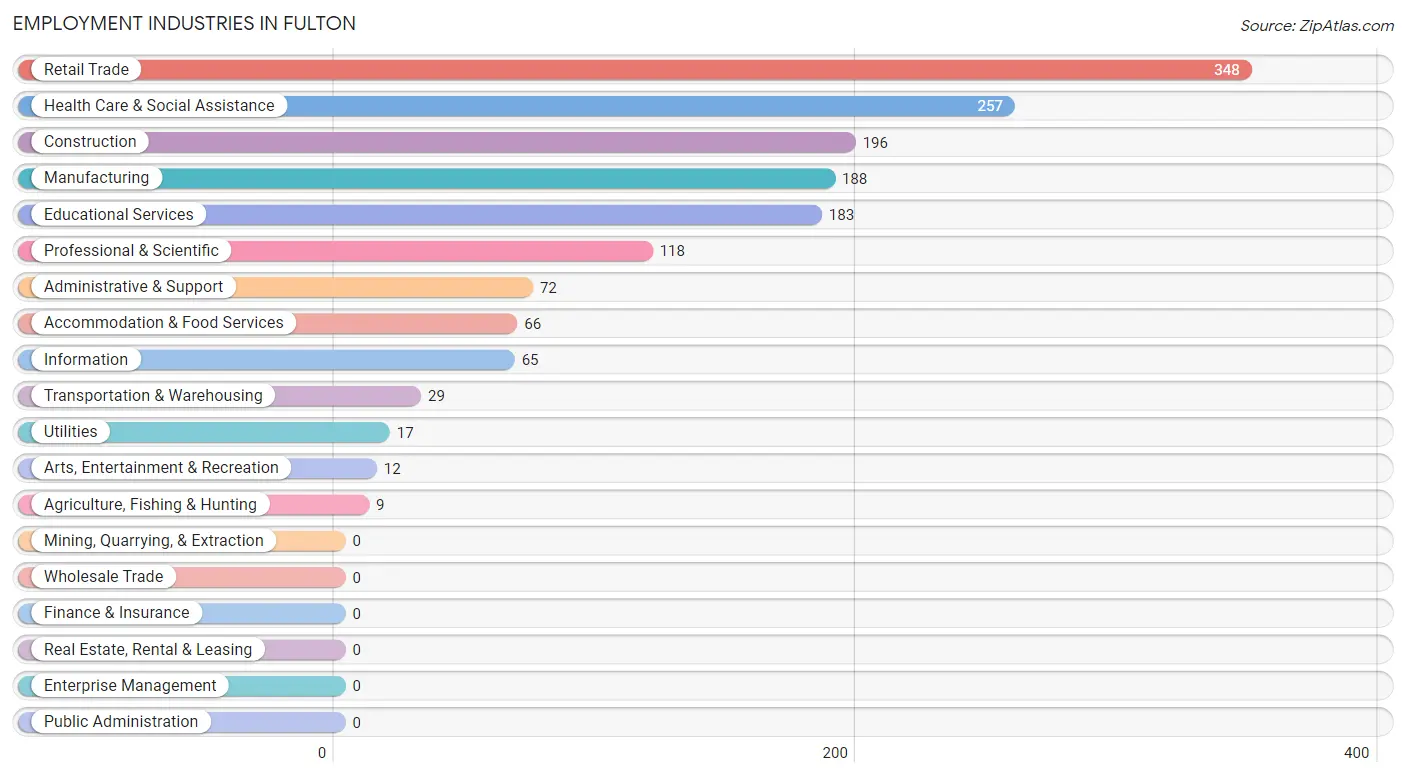
Employment Industries in Fulton
The major employment industries in Fulton include Retail Trade (348 | 21.7%), Health Care & Social Assistance (257 | 16.0%), Construction (196 | 12.2%), Manufacturing (188 | 11.7%), and Educational Services (183 | 11.4%).
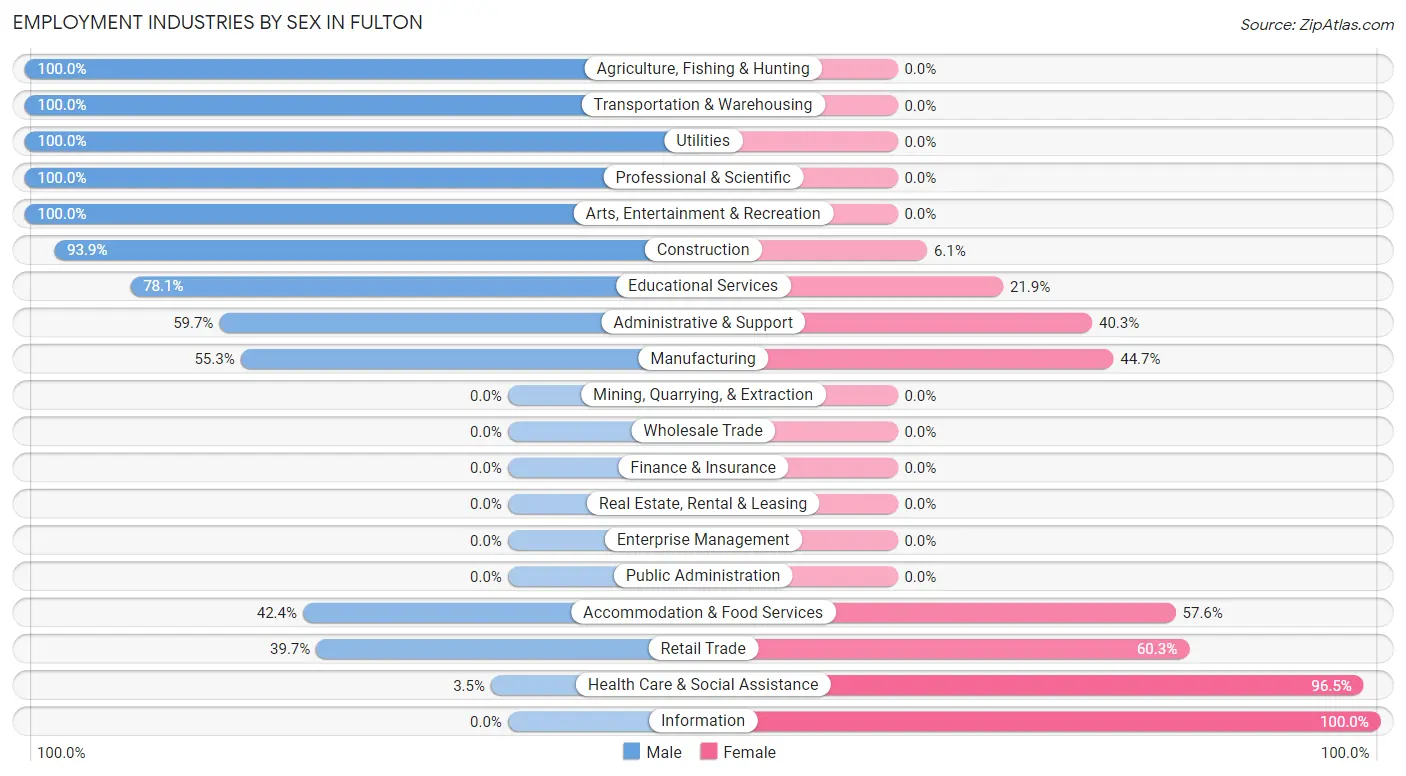
Employment Industries by Sex in Fulton
The Fulton industries that see more men than women are Agriculture, Fishing & Hunting (100.0%), Transportation & Warehousing (100.0%), and Utilities (100.0%), whereas the industries that tend to have a higher number of women are Information (100.0%), Health Care & Social Assistance (96.5%), and Retail Trade (60.3%).
| Industry | Male | Female |
| Agriculture, Fishing & Hunting | 9 (100.0%) | 0 (0.0%) |
| Mining, Quarrying, & Extraction | 0 (0.0%) | 0 (0.0%) |
| Construction | 184 (93.9%) | 12 (6.1%) |
| Manufacturing | 104 (55.3%) | 84 (44.7%) |
| Wholesale Trade | 0 (0.0%) | 0 (0.0%) |
| Retail Trade | 138 (39.7%) | 210 (60.3%) |
| Transportation & Warehousing | 29 (100.0%) | 0 (0.0%) |
| Utilities | 17 (100.0%) | 0 (0.0%) |
| Information | 0 (0.0%) | 65 (100.0%) |
| Finance & Insurance | 0 (0.0%) | 0 (0.0%) |
| Real Estate, Rental & Leasing | 0 (0.0%) | 0 (0.0%) |
| Professional & Scientific | 118 (100.0%) | 0 (0.0%) |
| Enterprise Management | 0 (0.0%) | 0 (0.0%) |
| Administrative & Support | 43 (59.7%) | 29 (40.3%) |
| Educational Services | 143 (78.1%) | 40 (21.9%) |
| Health Care & Social Assistance | 9 (3.5%) | 248 (96.5%) |
| Arts, Entertainment & Recreation | 12 (100.0%) | 0 (0.0%) |
| Accommodation & Food Services | 28 (42.4%) | 38 (57.6%) |
| Public Administration | 0 (0.0%) | 0 (0.0%) |
| Total | 851 (53.0%) | 754 (47.0%) |
Education in Fulton
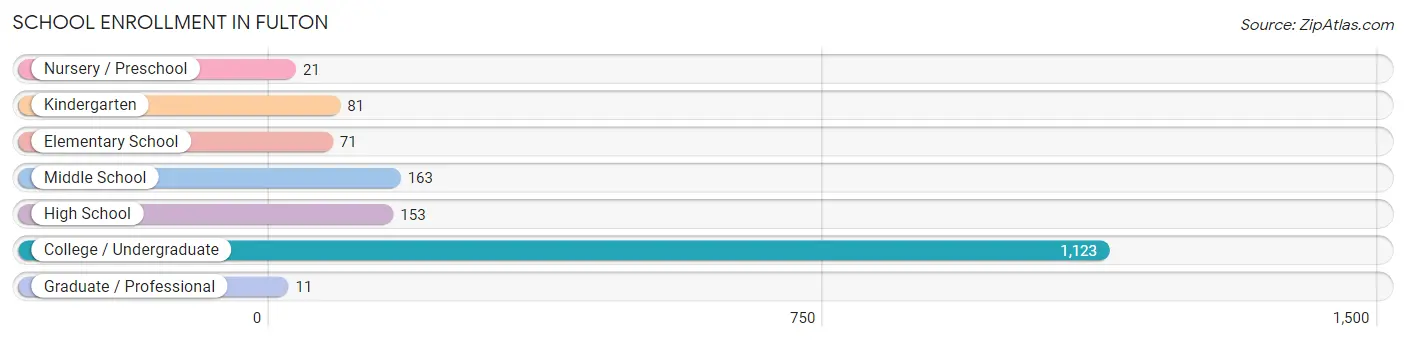
School Enrollment in Fulton
The most common levels of schooling among the 1,623 students in Fulton are college / undergraduate (1,123 | 69.2%), middle school (163 | 10.0%), and high school (153 | 9.4%).
| School Level | # Students | % Students |
| Nursery / Preschool | 21 | 1.3% |
| Kindergarten | 81 | 5.0% |
| Elementary School | 71 | 4.4% |
| Middle School | 163 | 10.0% |
| High School | 153 | 9.4% |
| College / Undergraduate | 1,123 | 69.2% |
| Graduate / Professional | 11 | 0.7% |
| Total | 1,623 | 100.0% |
School Enrollment by Age by Funding Source in Fulton
Out of a total of 1,623 students who are enrolled in schools in Fulton, 286 (17.6%) attend a private institution, while the remaining 1,337 (82.4%) are enrolled in public schools. The age group of 10 to 14 year olds has the highest likelihood of being enrolled in private schools, with 136 (63.8% in the age bracket) enrolled. Conversely, the age group of 3 to 4 year olds has the lowest likelihood of being enrolled in a private school, with 14 (100.0% in the age bracket) attending a public institution.
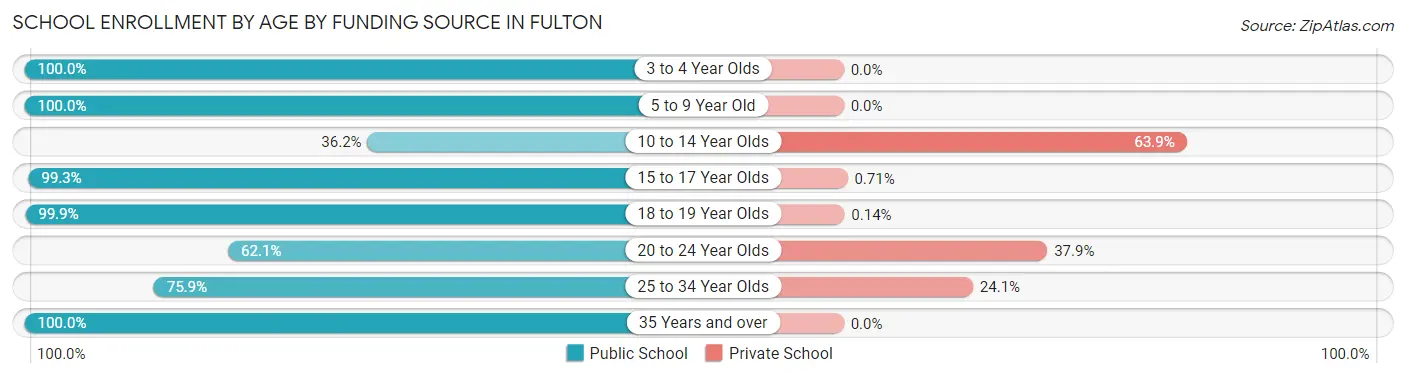
| Age Bracket | Public School | Private School |
| 3 to 4 Year Olds | 14 (100.0%) | 0 (0.0%) |
| 5 to 9 Year Old | 119 (100.0%) | 0 (0.0%) |
| 10 to 14 Year Olds | 77 (36.1%) | 136 (63.8%) |
| 15 to 17 Year Olds | 139 (99.3%) | 1 (0.7%) |
| 18 to 19 Year Olds | 719 (99.9%) | 1 (0.1%) |
| 20 to 24 Year Olds | 221 (62.1%) | 135 (37.9%) |
| 25 to 34 Year Olds | 41 (75.9%) | 13 (24.1%) |
| 35 Years and over | 7 (100.0%) | 0 (0.0%) |
| Total | 1,337 (82.4%) | 286 (17.6%) |
Educational Attainment by Field of Study in Fulton
Education (171 | 33.8%), liberal arts & history (111 | 21.9%), business (61 | 12.1%), science & technology (54 | 10.7%), and arts & humanities (22 | 4.3%) are the most common fields of study among 506 individuals in Fulton who have obtained a bachelor's degree or higher.
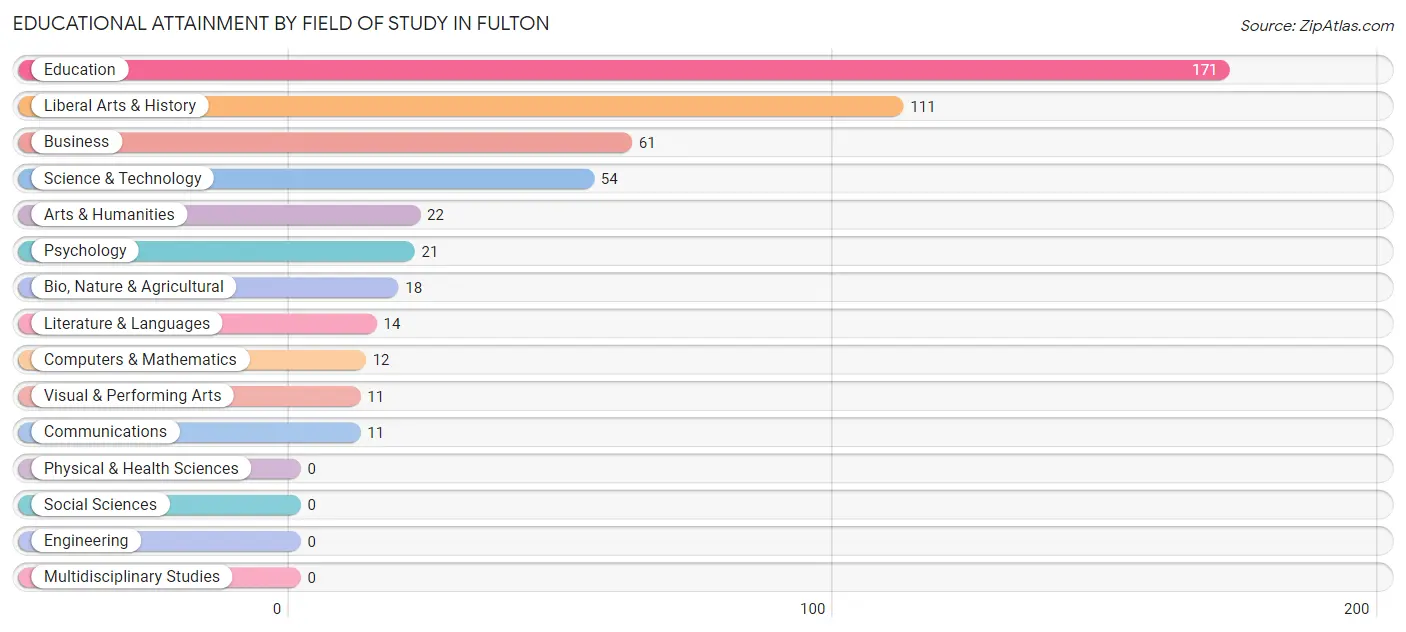
| Field of Study | # Graduates | % Graduates |
| Computers & Mathematics | 12 | 2.4% |
| Bio, Nature & Agricultural | 18 | 3.6% |
| Physical & Health Sciences | 0 | 0.0% |
| Psychology | 21 | 4.2% |
| Social Sciences | 0 | 0.0% |
| Engineering | 0 | 0.0% |
| Multidisciplinary Studies | 0 | 0.0% |
| Science & Technology | 54 | 10.7% |
| Business | 61 | 12.1% |
| Education | 171 | 33.8% |
| Literature & Languages | 14 | 2.8% |
| Liberal Arts & History | 111 | 21.9% |
| Visual & Performing Arts | 11 | 2.2% |
| Communications | 11 | 2.2% |
| Arts & Humanities | 22 | 4.3% |
| Total | 506 | 100.0% |
Transportation & Commute in Fulton
Vehicle Availability by Sex in Fulton
The most prevalent vehicle ownership categories in Fulton are males with 2 vehicles (484, accounting for 59.2%) and females with 2 vehicles (198, making up 67.0%).
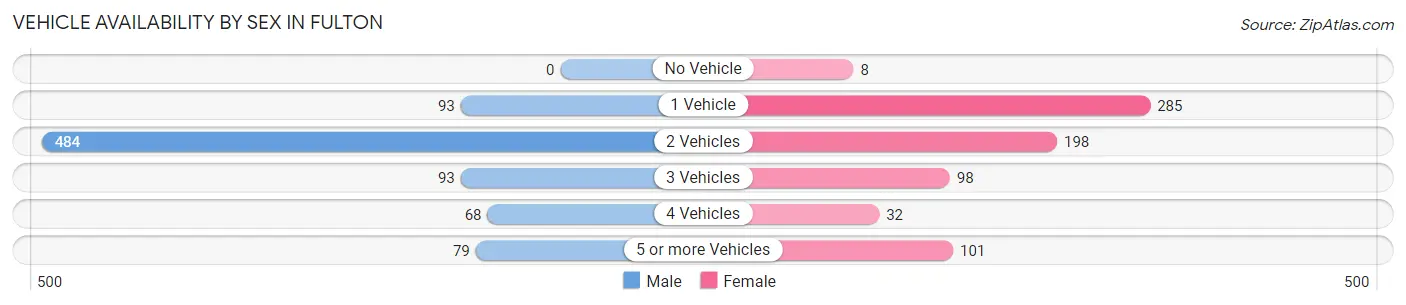
| Vehicles Available | Male | Female |
| No Vehicle | 0 (0.0%) | 8 (1.1%) |
| 1 Vehicle | 93 (11.4%) | 285 (39.5%) |
| 2 Vehicles | 484 (59.2%) | 198 (27.4%) |
| 3 Vehicles | 93 (11.4%) | 98 (13.6%) |
| 4 Vehicles | 68 (8.3%) | 32 (4.4%) |
| 5 or more Vehicles | 79 (9.7%) | 101 (14.0%) |
| Total | 817 (100.0%) | 722 (100.0%) |
Commute Time in Fulton
The most frequently occuring commute durations in Fulton are 5 to 9 minutes (416 commuters, 27.9%), 30 to 34 minutes (278 commuters, 18.6%), and 10 to 14 minutes (231 commuters, 15.5%).
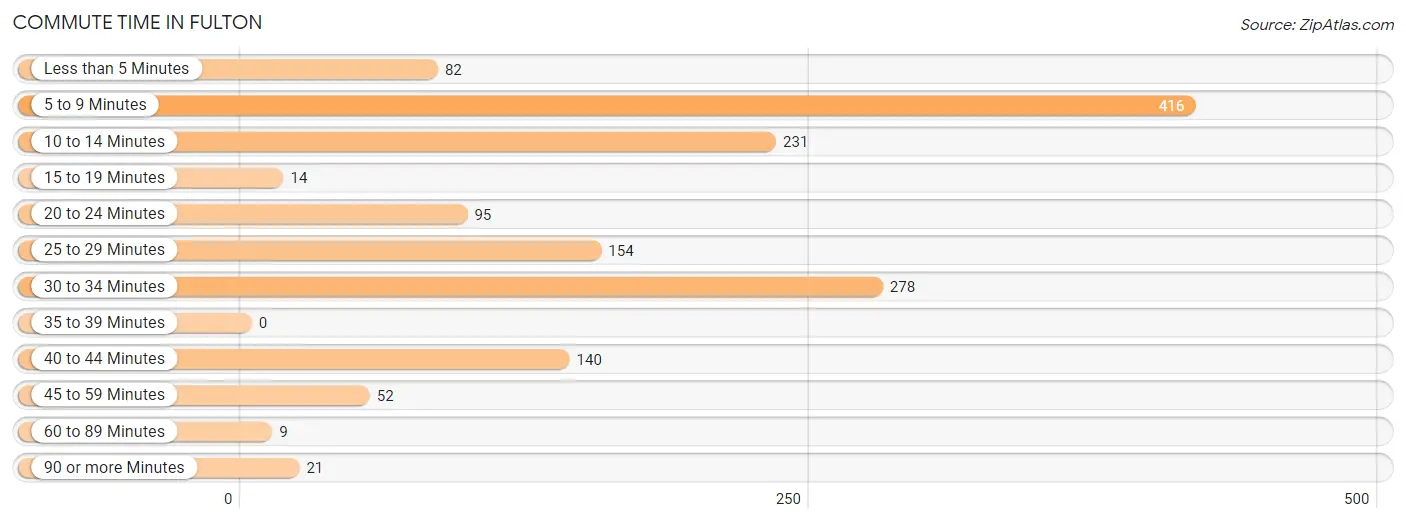
| Commute Time | # Commuters | % Commuters |
| Less than 5 Minutes | 82 | 5.5% |
| 5 to 9 Minutes | 416 | 27.9% |
| 10 to 14 Minutes | 231 | 15.5% |
| 15 to 19 Minutes | 14 | 0.9% |
| 20 to 24 Minutes | 95 | 6.4% |
| 25 to 29 Minutes | 154 | 10.3% |
| 30 to 34 Minutes | 278 | 18.6% |
| 35 to 39 Minutes | 0 | 0.0% |
| 40 to 44 Minutes | 140 | 9.4% |
| 45 to 59 Minutes | 52 | 3.5% |
| 60 to 89 Minutes | 9 | 0.6% |
| 90 or more Minutes | 21 | 1.4% |
Commute Time by Sex in Fulton
The most common commute times in Fulton are 5 to 9 minutes (159 commuters, 20.7%) for males and 5 to 9 minutes (257 commuters, 35.5%) for females.
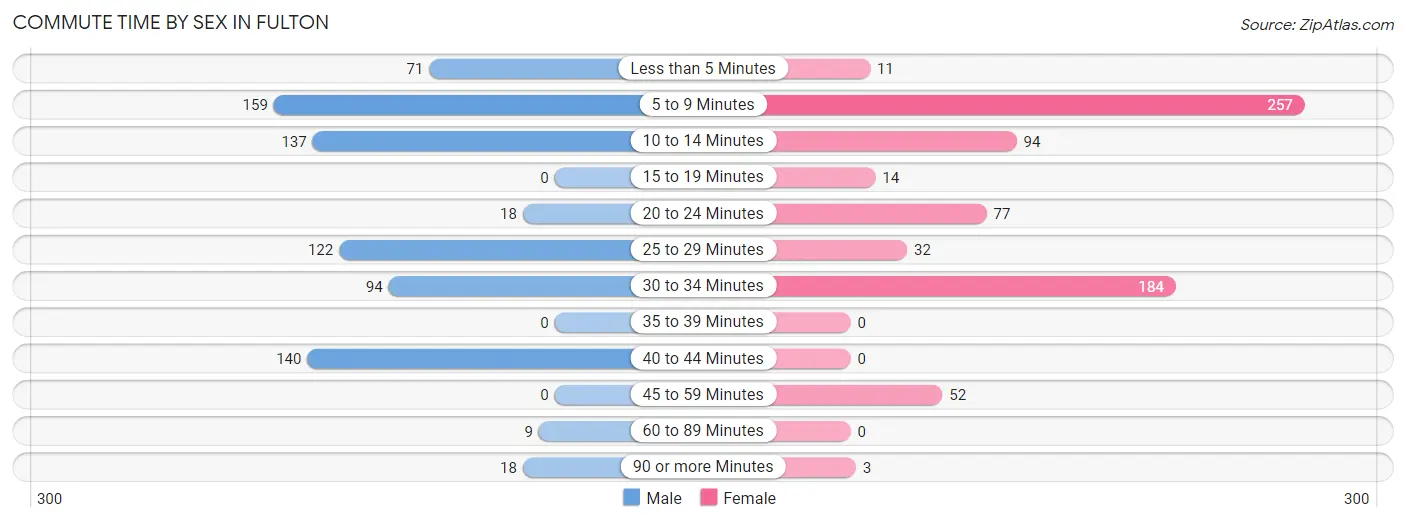
| Commute Time | Male | Female |
| Less than 5 Minutes | 71 (9.2%) | 11 (1.5%) |
| 5 to 9 Minutes | 159 (20.7%) | 257 (35.5%) |
| 10 to 14 Minutes | 137 (17.8%) | 94 (13.0%) |
| 15 to 19 Minutes | 0 (0.0%) | 14 (1.9%) |
| 20 to 24 Minutes | 18 (2.3%) | 77 (10.6%) |
| 25 to 29 Minutes | 122 (15.9%) | 32 (4.4%) |
| 30 to 34 Minutes | 94 (12.2%) | 184 (25.4%) |
| 35 to 39 Minutes | 0 (0.0%) | 0 (0.0%) |
| 40 to 44 Minutes | 140 (18.2%) | 0 (0.0%) |
| 45 to 59 Minutes | 0 (0.0%) | 52 (7.2%) |
| 60 to 89 Minutes | 9 (1.2%) | 0 (0.0%) |
| 90 or more Minutes | 18 (2.3%) | 3 (0.4%) |
Time of Departure to Work by Sex in Fulton
The most frequent times of departure to work in Fulton are 6:00 AM to 6:29 AM (303, 39.5%) for males and 4:00 PM to 11:59 PM (163, 22.5%) for females.
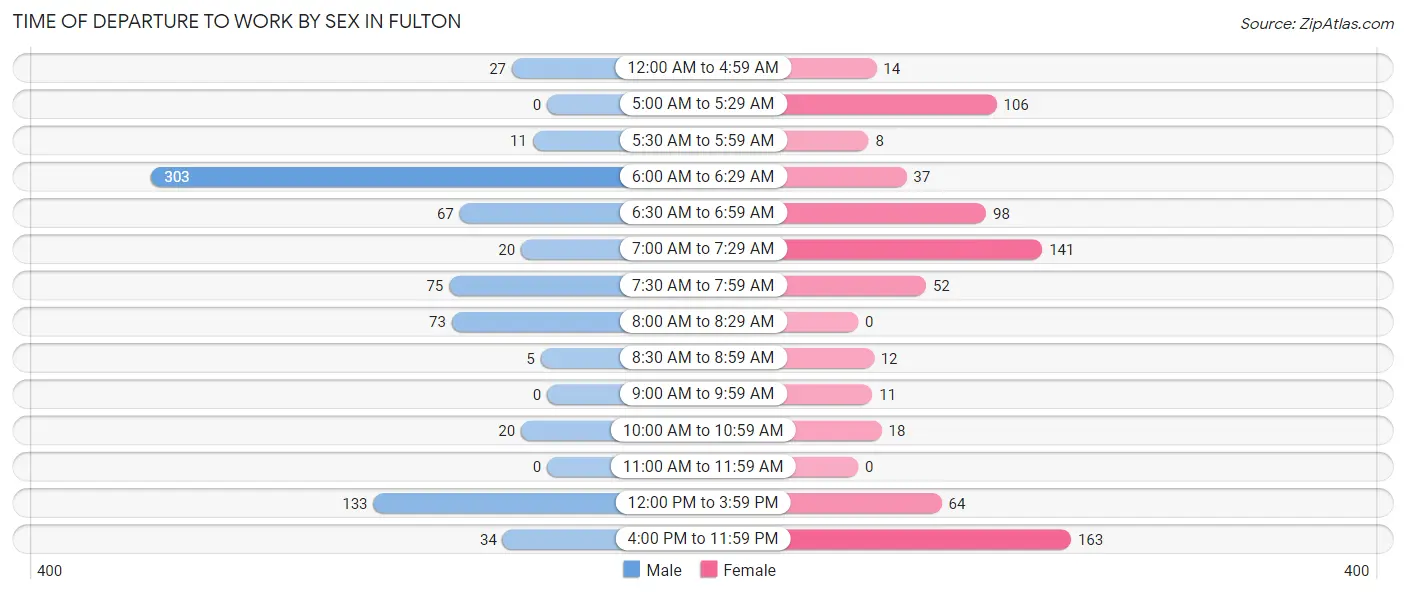
| Time of Departure | Male | Female |
| 12:00 AM to 4:59 AM | 27 (3.5%) | 14 (1.9%) |
| 5:00 AM to 5:29 AM | 0 (0.0%) | 106 (14.6%) |
| 5:30 AM to 5:59 AM | 11 (1.4%) | 8 (1.1%) |
| 6:00 AM to 6:29 AM | 303 (39.5%) | 37 (5.1%) |
| 6:30 AM to 6:59 AM | 67 (8.7%) | 98 (13.5%) |
| 7:00 AM to 7:29 AM | 20 (2.6%) | 141 (19.5%) |
| 7:30 AM to 7:59 AM | 75 (9.8%) | 52 (7.2%) |
| 8:00 AM to 8:29 AM | 73 (9.5%) | 0 (0.0%) |
| 8:30 AM to 8:59 AM | 5 (0.6%) | 12 (1.7%) |
| 9:00 AM to 9:59 AM | 0 (0.0%) | 11 (1.5%) |
| 10:00 AM to 10:59 AM | 20 (2.6%) | 18 (2.5%) |
| 11:00 AM to 11:59 AM | 0 (0.0%) | 0 (0.0%) |
| 12:00 PM to 3:59 PM | 133 (17.3%) | 64 (8.8%) |
| 4:00 PM to 11:59 PM | 34 (4.4%) | 163 (22.5%) |
| Total | 768 (100.0%) | 724 (100.0%) |
Housing Occupancy in Fulton
Occupancy by Ownership in Fulton
Of the total 1,252 dwellings in Fulton, owner-occupied units account for 902 (72.0%), while renter-occupied units make up 350 (28.0%).
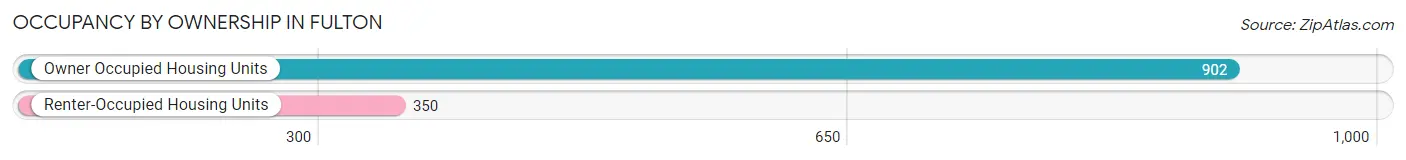
| Occupancy | # Housing Units | % Housing Units |
| Owner Occupied Housing Units | 902 | 72.0% |
| Renter-Occupied Housing Units | 350 | 28.0% |
| Total Occupied Housing Units | 1,252 | 100.0% |
Occupancy by Household Size in Fulton
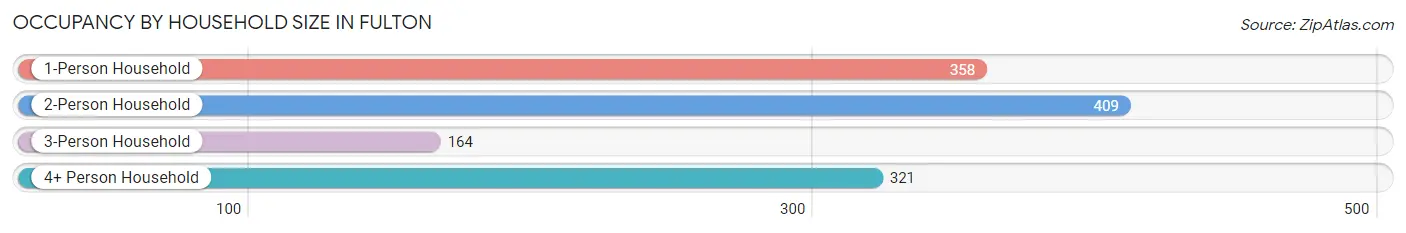
| Household Size | # Housing Units | % Housing Units |
| 1-Person Household | 358 | 28.6% |
| 2-Person Household | 409 | 32.7% |
| 3-Person Household | 164 | 13.1% |
| 4+ Person Household | 321 | 25.6% |
| Total Housing Units | 1,252 | 100.0% |
Occupancy by Ownership by Household Size in Fulton
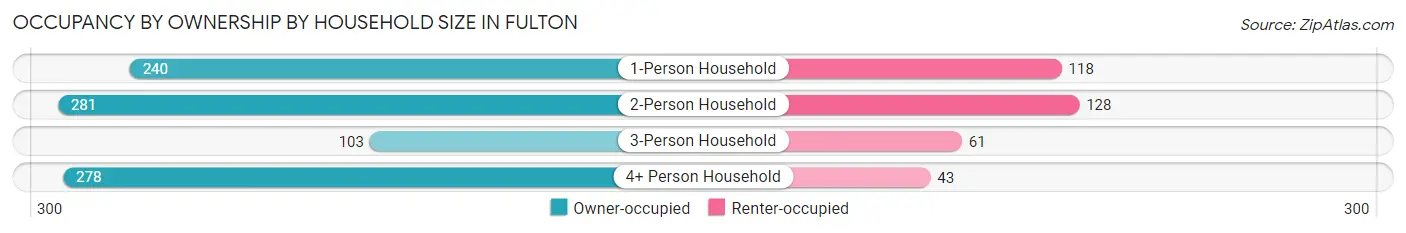
| Household Size | Owner-occupied | Renter-occupied |
| 1-Person Household | 240 (67.0%) | 118 (33.0%) |
| 2-Person Household | 281 (68.7%) | 128 (31.3%) |
| 3-Person Household | 103 (62.8%) | 61 (37.2%) |
| 4+ Person Household | 278 (86.6%) | 43 (13.4%) |
| Total Housing Units | 902 (72.0%) | 350 (28.0%) |
Occupancy by Educational Attainment in Fulton
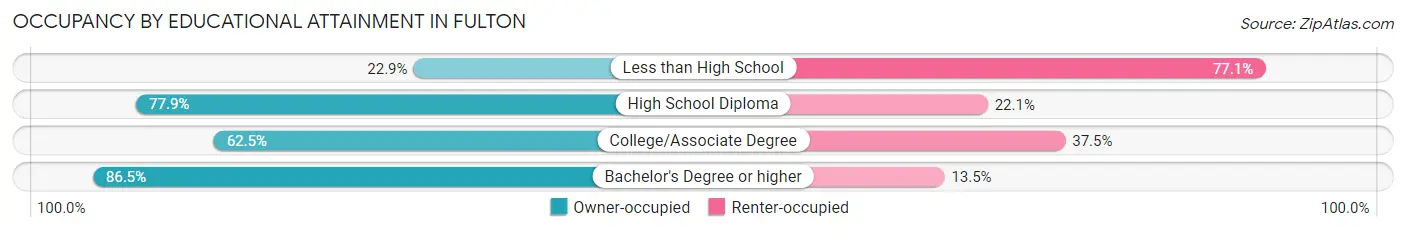
| Household Size | Owner-occupied | Renter-occupied |
| Less than High School | 11 (22.9%) | 37 (77.1%) |
| High School Diploma | 352 (77.9%) | 100 (22.1%) |
| College/Associate Degree | 290 (62.5%) | 174 (37.5%) |
| Bachelor's Degree or higher | 249 (86.5%) | 39 (13.5%) |
Occupancy by Age of Householder in Fulton
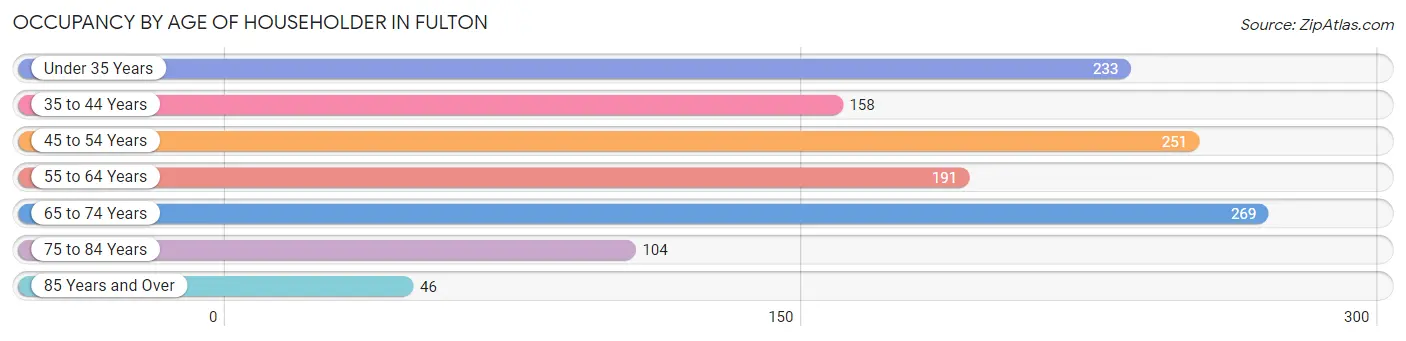
| Age Bracket | # Households | % Households |
| Under 35 Years | 233 | 18.6% |
| 35 to 44 Years | 158 | 12.6% |
| 45 to 54 Years | 251 | 20.1% |
| 55 to 64 Years | 191 | 15.3% |
| 65 to 74 Years | 269 | 21.5% |
| 75 to 84 Years | 104 | 8.3% |
| 85 Years and Over | 46 | 3.7% |
| Total | 1,252 | 100.0% |
Housing Finances in Fulton
Median Income by Occupancy in Fulton
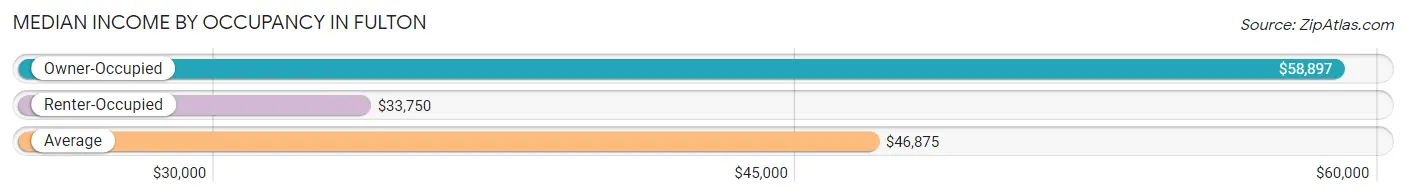
| Occupancy Type | # Households | Median Income |
| Owner-Occupied | 902 (72.0%) | $58,897 |
| Renter-Occupied | 350 (28.0%) | $33,750 |
| Average | 1,252 (100.0%) | $46,875 |
Occupancy by Householder Income Bracket in Fulton
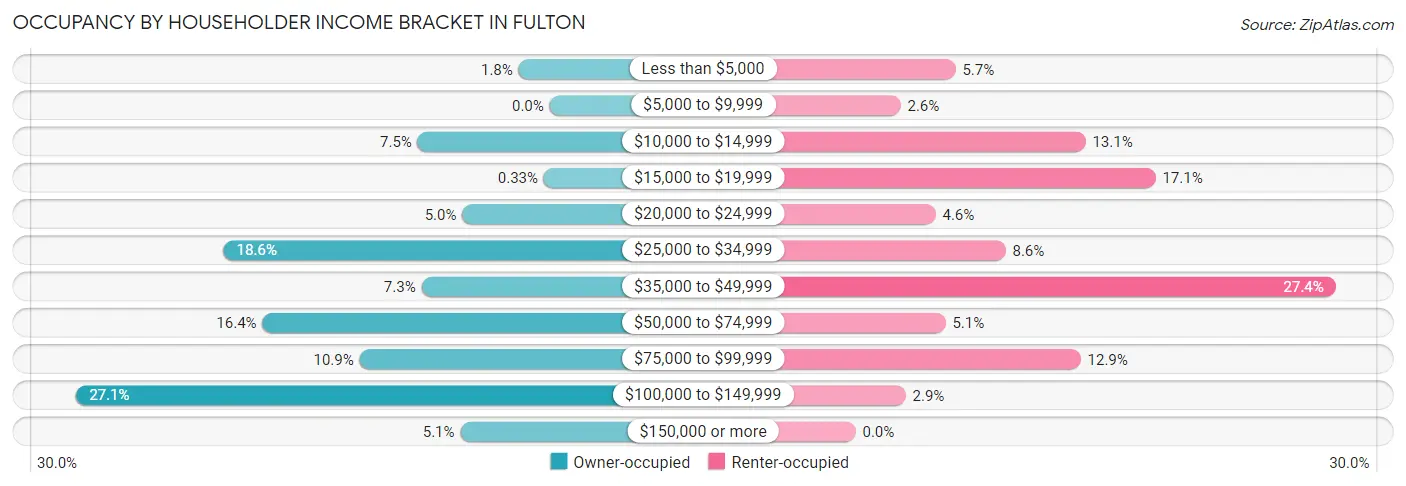
| Income Bracket | Owner-occupied | Renter-occupied |
| Less than $5,000 | 16 (1.8%) | 20 (5.7%) |
| $5,000 to $9,999 | 0 (0.0%) | 9 (2.6%) |
| $10,000 to $14,999 | 68 (7.5%) | 46 (13.1%) |
| $15,000 to $19,999 | 3 (0.3%) | 60 (17.1%) |
| $20,000 to $24,999 | 45 (5.0%) | 16 (4.6%) |
| $25,000 to $34,999 | 168 (18.6%) | 30 (8.6%) |
| $35,000 to $49,999 | 66 (7.3%) | 96 (27.4%) |
| $50,000 to $74,999 | 148 (16.4%) | 18 (5.1%) |
| $75,000 to $99,999 | 98 (10.9%) | 45 (12.9%) |
| $100,000 to $149,999 | 244 (27.1%) | 10 (2.9%) |
| $150,000 or more | 46 (5.1%) | 0 (0.0%) |
| Total | 902 (100.0%) | 350 (100.0%) |
Monthly Housing Cost Tiers in Fulton
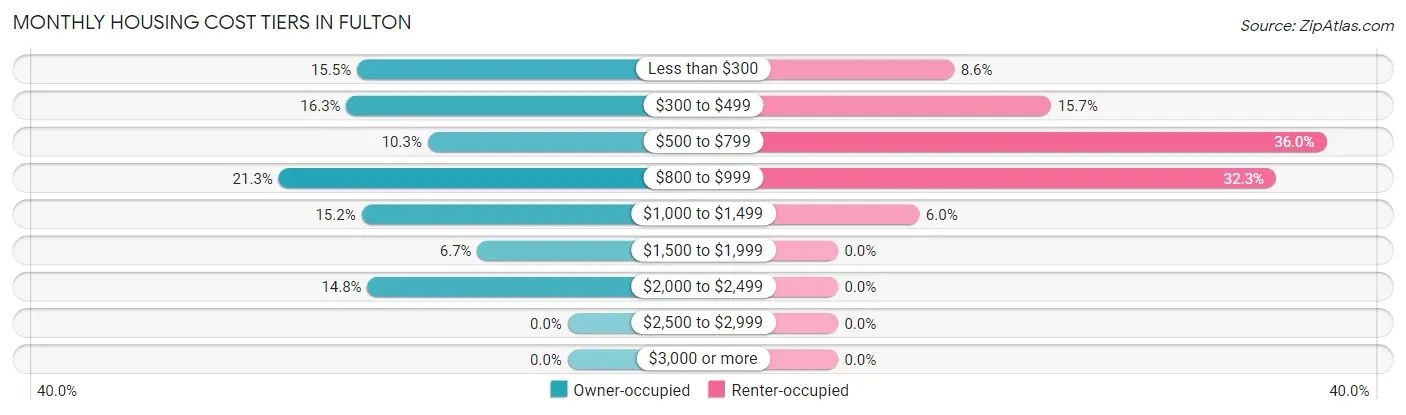
| Monthly Cost | Owner-occupied | Renter-occupied |
| Less than $300 | 140 (15.5%) | 30 (8.6%) |
| $300 to $499 | 147 (16.3%) | 55 (15.7%) |
| $500 to $799 | 93 (10.3%) | 126 (36.0%) |
| $800 to $999 | 192 (21.3%) | 113 (32.3%) |
| $1,000 to $1,499 | 137 (15.2%) | 21 (6.0%) |
| $1,500 to $1,999 | 60 (6.7%) | 0 (0.0%) |
| $2,000 to $2,499 | 133 (14.7%) | 0 (0.0%) |
| $2,500 to $2,999 | 0 (0.0%) | 0 (0.0%) |
| $3,000 or more | 0 (0.0%) | 0 (0.0%) |
| Total | 902 (100.0%) | 350 (100.0%) |
Physical Housing Characteristics in Fulton
Housing Structures in Fulton
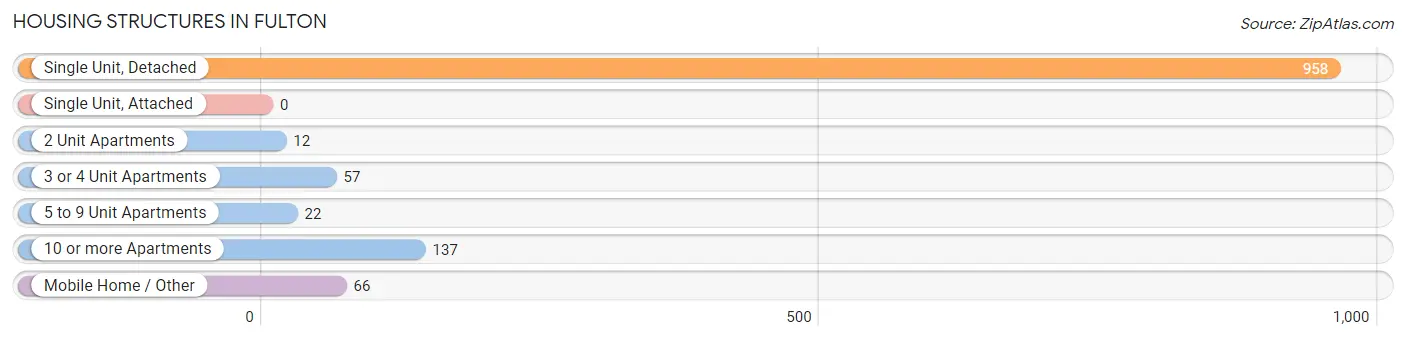
| Structure Type | # Housing Units | % Housing Units |
| Single Unit, Detached | 958 | 76.5% |
| Single Unit, Attached | 0 | 0.0% |
| 2 Unit Apartments | 12 | 1.0% |
| 3 or 4 Unit Apartments | 57 | 4.5% |
| 5 to 9 Unit Apartments | 22 | 1.8% |
| 10 or more Apartments | 137 | 10.9% |
| Mobile Home / Other | 66 | 5.3% |
| Total | 1,252 | 100.0% |
Housing Structures by Occupancy in Fulton
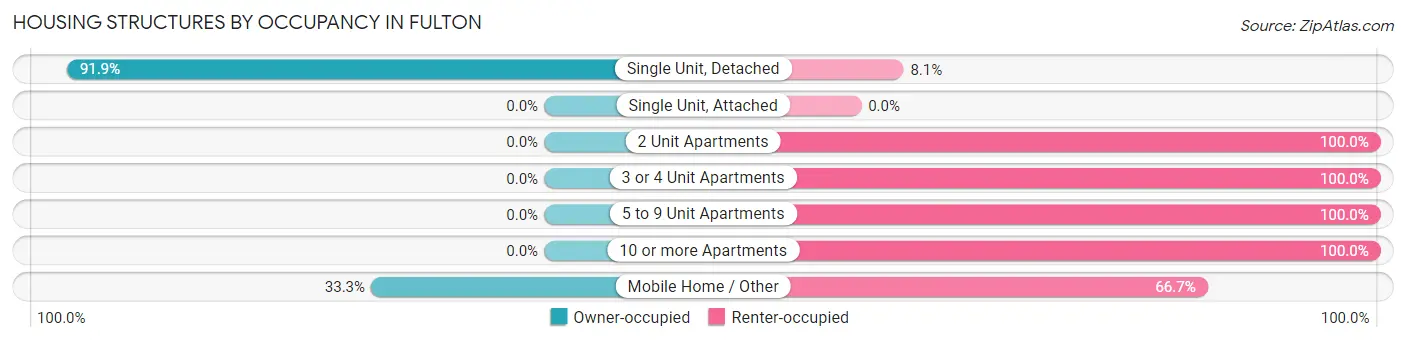
| Structure Type | Owner-occupied | Renter-occupied |
| Single Unit, Detached | 880 (91.9%) | 78 (8.1%) |
| Single Unit, Attached | 0 (0.0%) | 0 (0.0%) |
| 2 Unit Apartments | 0 (0.0%) | 12 (100.0%) |
| 3 or 4 Unit Apartments | 0 (0.0%) | 57 (100.0%) |
| 5 to 9 Unit Apartments | 0 (0.0%) | 22 (100.0%) |
| 10 or more Apartments | 0 (0.0%) | 137 (100.0%) |
| Mobile Home / Other | 22 (33.3%) | 44 (66.7%) |
| Total | 902 (72.0%) | 350 (28.0%) |
Housing Structures by Number of Rooms in Fulton
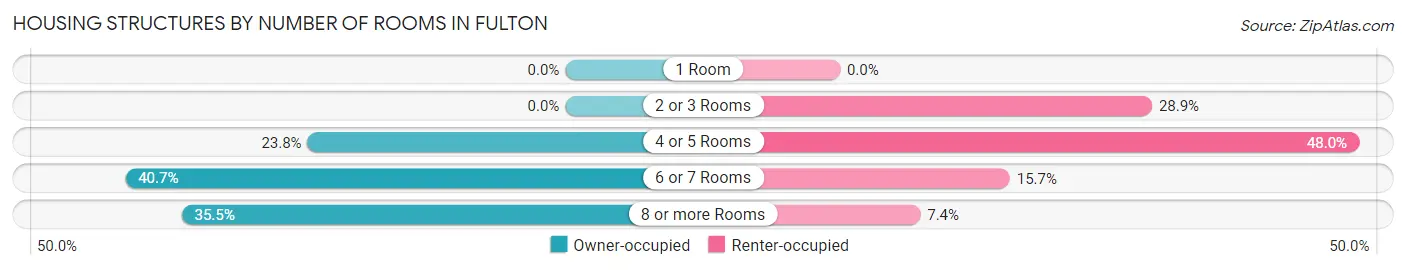
| Number of Rooms | Owner-occupied | Renter-occupied |
| 1 Room | 0 (0.0%) | 0 (0.0%) |
| 2 or 3 Rooms | 0 (0.0%) | 101 (28.9%) |
| 4 or 5 Rooms | 215 (23.8%) | 168 (48.0%) |
| 6 or 7 Rooms | 367 (40.7%) | 55 (15.7%) |
| 8 or more Rooms | 320 (35.5%) | 26 (7.4%) |
| Total | 902 (100.0%) | 350 (100.0%) |
Housing Structure by Heating Type in Fulton
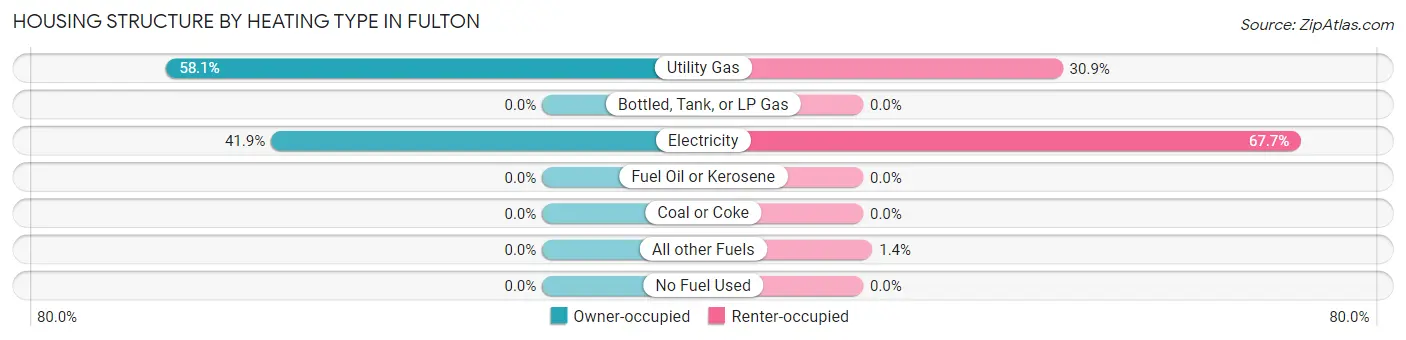
| Heating Type | Owner-occupied | Renter-occupied |
| Utility Gas | 524 (58.1%) | 108 (30.9%) |
| Bottled, Tank, or LP Gas | 0 (0.0%) | 0 (0.0%) |
| Electricity | 378 (41.9%) | 237 (67.7%) |
| Fuel Oil or Kerosene | 0 (0.0%) | 0 (0.0%) |
| Coal or Coke | 0 (0.0%) | 0 (0.0%) |
| All other Fuels | 0 (0.0%) | 5 (1.4%) |
| No Fuel Used | 0 (0.0%) | 0 (0.0%) |
| Total | 902 (100.0%) | 350 (100.0%) |
Household Vehicle Usage in Fulton
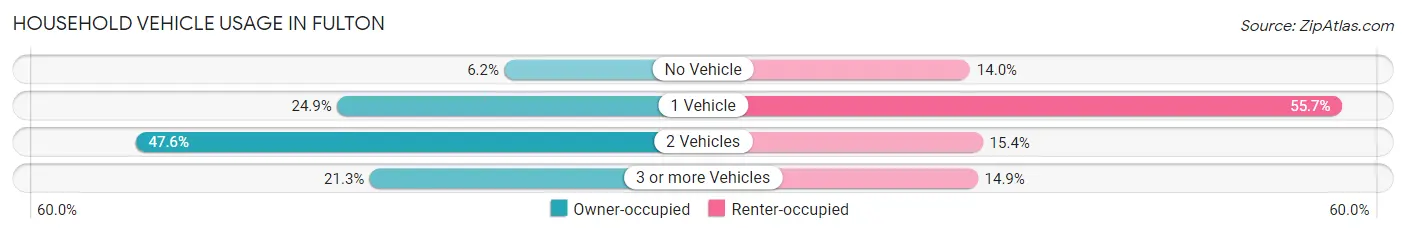
| Vehicles per Household | Owner-occupied | Renter-occupied |
| No Vehicle | 56 (6.2%) | 49 (14.0%) |
| 1 Vehicle | 225 (24.9%) | 195 (55.7%) |
| 2 Vehicles | 429 (47.6%) | 54 (15.4%) |
| 3 or more Vehicles | 192 (21.3%) | 52 (14.9%) |
| Total | 902 (100.0%) | 350 (100.0%) |
Real Estate & Mortgages in Fulton
Real Estate and Mortgage Overview in Fulton
| Characteristic | Without Mortgage | With Mortgage |
| Housing Units | 266 | 636 |
| Median Property Value | $95,300 | $142,500 |
| Median Household Income | $49,821 | $30 |
| Monthly Housing Costs | $291 | $0 |
| Real Estate Taxes | $534 | $116 |
Property Value by Mortgage Status in Fulton
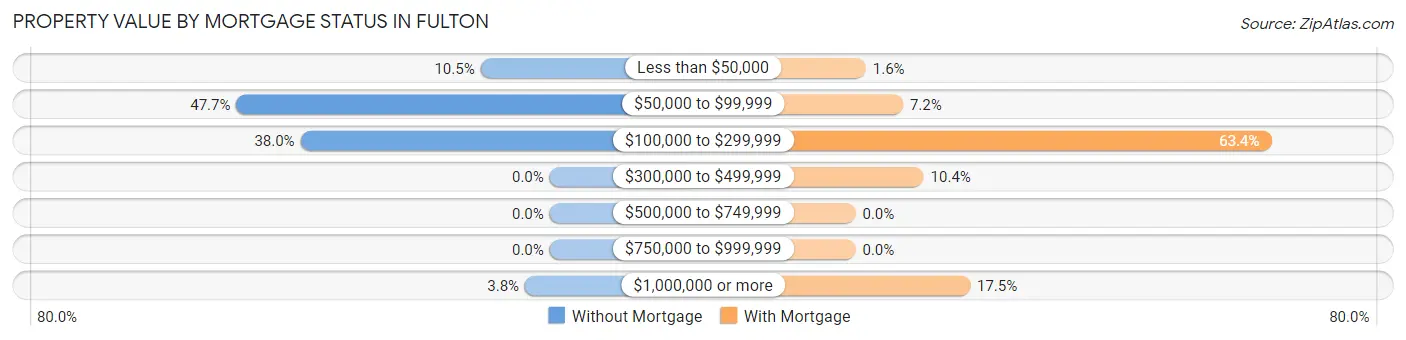
| Property Value | Without Mortgage | With Mortgage |
| Less than $50,000 | 28 (10.5%) | 10 (1.6%) |
| $50,000 to $99,999 | 127 (47.7%) | 46 (7.2%) |
| $100,000 to $299,999 | 101 (38.0%) | 403 (63.4%) |
| $300,000 to $499,999 | 0 (0.0%) | 66 (10.4%) |
| $500,000 to $749,999 | 0 (0.0%) | 0 (0.0%) |
| $750,000 to $999,999 | 0 (0.0%) | 0 (0.0%) |
| $1,000,000 or more | 10 (3.8%) | 111 (17.4%) |
| Total | 266 (100.0%) | 636 (100.0%) |
Household Income by Mortgage Status in Fulton
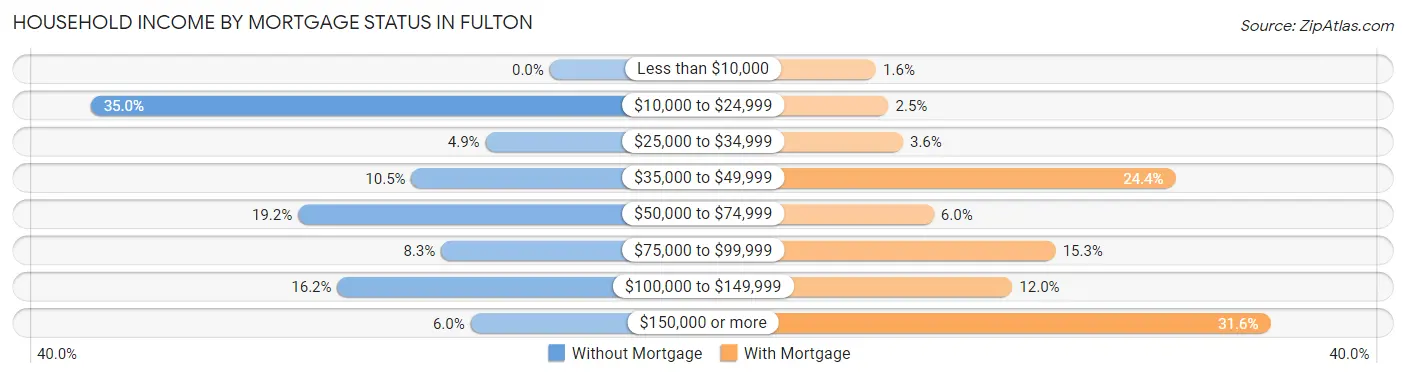
| Household Income | Without Mortgage | With Mortgage |
| Less than $10,000 | 0 (0.0%) | 10 (1.6%) |
| $10,000 to $24,999 | 93 (35.0%) | 16 (2.5%) |
| $25,000 to $34,999 | 13 (4.9%) | 23 (3.6%) |
| $35,000 to $49,999 | 28 (10.5%) | 155 (24.4%) |
| $50,000 to $74,999 | 51 (19.2%) | 38 (6.0%) |
| $75,000 to $99,999 | 22 (8.3%) | 97 (15.2%) |
| $100,000 to $149,999 | 43 (16.2%) | 76 (11.9%) |
| $150,000 or more | 16 (6.0%) | 201 (31.6%) |
| Total | 266 (100.0%) | 636 (100.0%) |
Property Value to Household Income Ratio in Fulton
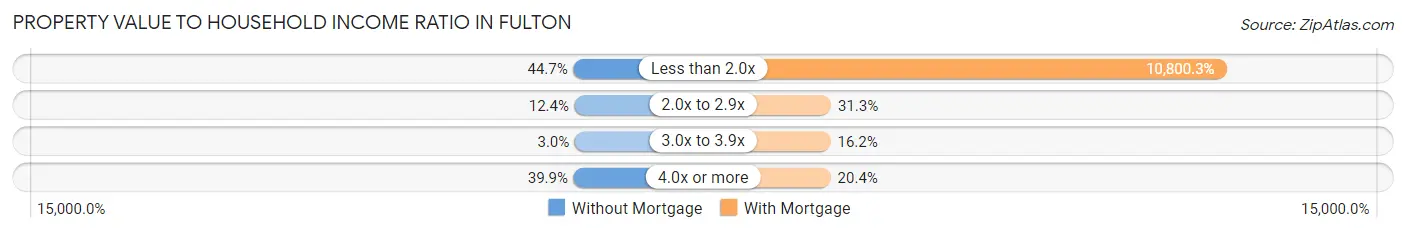
| Value-to-Income Ratio | Without Mortgage | With Mortgage |
| Less than 2.0x | 119 (44.7%) | 68,690 (10,800.3%) |
| 2.0x to 2.9x | 33 (12.4%) | 199 (31.3%) |
| 3.0x to 3.9x | 8 (3.0%) | 103 (16.2%) |
| 4.0x or more | 106 (39.9%) | 130 (20.4%) |
| Total | 266 (100.0%) | 636 (100.0%) |
Real Estate Taxes by Mortgage Status in Fulton
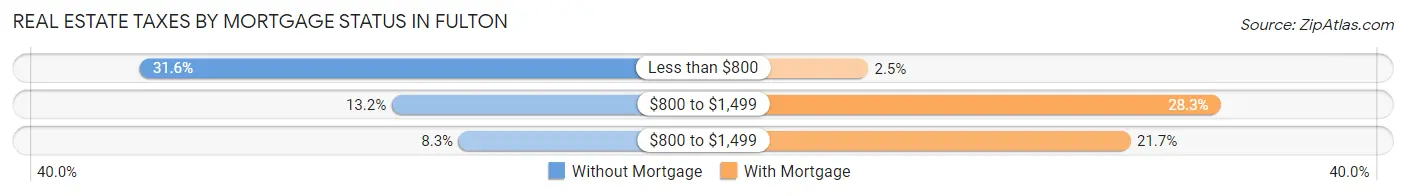
| Property Taxes | Without Mortgage | With Mortgage |
| Less than $800 | 84 (31.6%) | 16 (2.5%) |
| $800 to $1,499 | 35 (13.2%) | 180 (28.3%) |
| $800 to $1,499 | 22 (8.3%) | 138 (21.7%) |
| Total | 266 (100.0%) | 636 (100.0%) |
Health & Disability in Fulton
Health Insurance Coverage by Age in Fulton
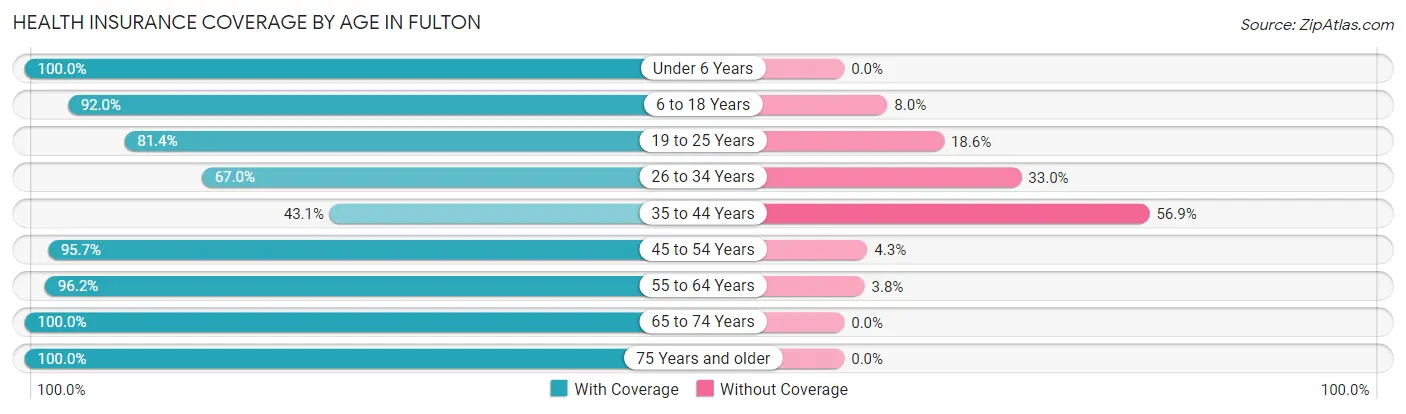
| Age Bracket | With Coverage | Without Coverage |
| Under 6 Years | 180 (100.0%) | 0 (0.0%) |
| 6 to 18 Years | 823 (92.0%) | 72 (8.0%) |
| 19 to 25 Years | 775 (81.4%) | 177 (18.6%) |
| 26 to 34 Years | 221 (67.0%) | 109 (33.0%) |
| 35 to 44 Years | 134 (43.1%) | 177 (56.9%) |
| 45 to 54 Years | 400 (95.7%) | 18 (4.3%) |
| 55 to 64 Years | 457 (96.2%) | 18 (3.8%) |
| 65 to 74 Years | 449 (100.0%) | 0 (0.0%) |
| 75 Years and older | 181 (100.0%) | 0 (0.0%) |
| Total | 3,620 (86.4%) | 571 (13.6%) |
Health Insurance Coverage by Citizenship Status in Fulton
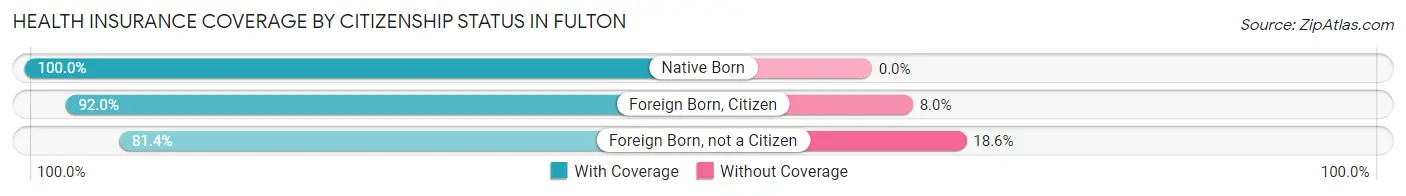
| Citizenship Status | With Coverage | Without Coverage |
| Native Born | 180 (100.0%) | 0 (0.0%) |
| Foreign Born, Citizen | 823 (92.0%) | 72 (8.0%) |
| Foreign Born, not a Citizen | 775 (81.4%) | 177 (18.6%) |
Health Insurance Coverage by Household Income in Fulton
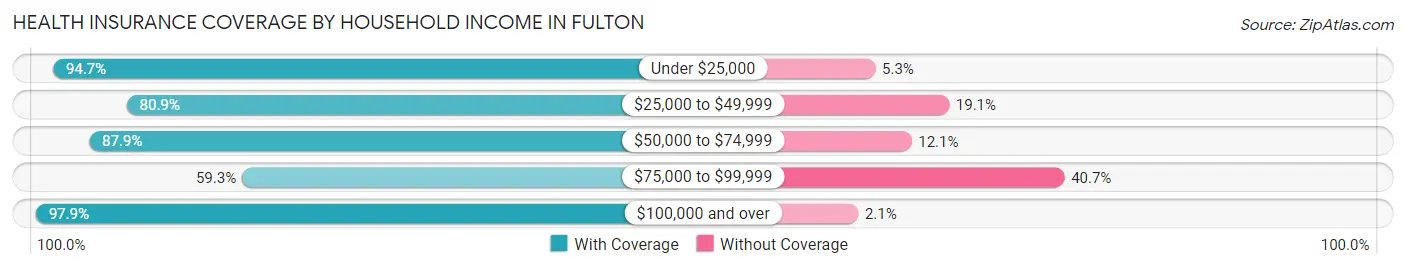
| Household Income | With Coverage | Without Coverage |
| Under $25,000 | 393 (94.7%) | 22 (5.3%) |
| $25,000 to $49,999 | 702 (80.9%) | 166 (19.1%) |
| $50,000 to $74,999 | 364 (87.9%) | 50 (12.1%) |
| $75,000 to $99,999 | 422 (59.3%) | 290 (40.7%) |
| $100,000 and over | 935 (97.9%) | 20 (2.1%) |
Public vs Private Health Insurance Coverage by Age in Fulton
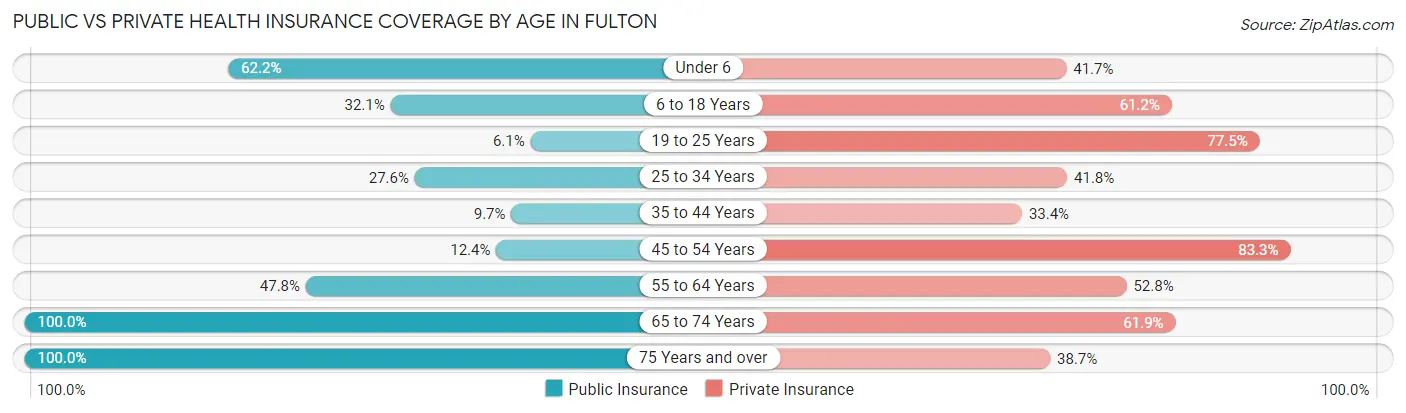
| Age Bracket | Public Insurance | Private Insurance |
| Under 6 | 112 (62.2%) | 75 (41.7%) |
| 6 to 18 Years | 287 (32.1%) | 548 (61.2%) |
| 19 to 25 Years | 58 (6.1%) | 738 (77.5%) |
| 25 to 34 Years | 91 (27.6%) | 138 (41.8%) |
| 35 to 44 Years | 30 (9.7%) | 104 (33.4%) |
| 45 to 54 Years | 52 (12.4%) | 348 (83.3%) |
| 55 to 64 Years | 227 (47.8%) | 251 (52.8%) |
| 65 to 74 Years | 449 (100.0%) | 278 (61.9%) |
| 75 Years and over | 181 (100.0%) | 70 (38.7%) |
| Total | 1,487 (35.5%) | 2,550 (60.8%) |
Disability Status by Sex by Age in Fulton
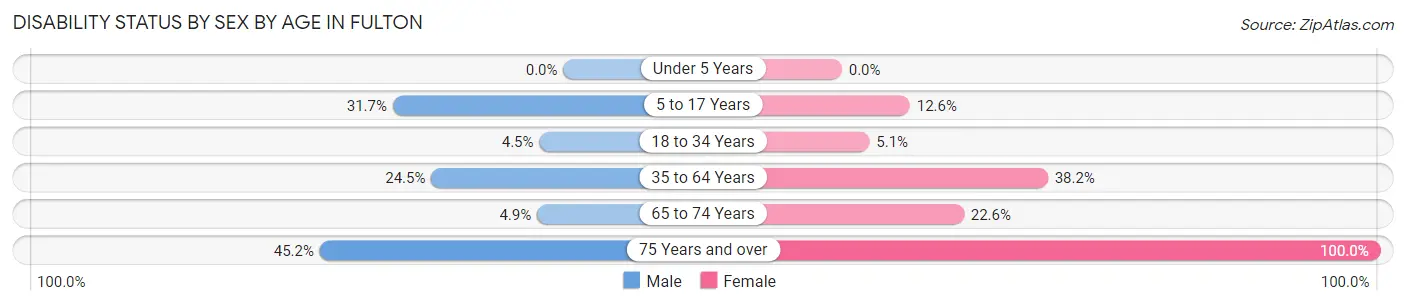
| Age Bracket | Male | Female |
| Under 5 Years | 0 (0.0%) | 0 (0.0%) |
| 5 to 17 Years | 107 (31.7%) | 24 (12.6%) |
| 18 to 34 Years | 47 (4.4%) | 35 (5.1%) |
| 35 to 64 Years | 113 (24.5%) | 284 (38.2%) |
| 65 to 74 Years | 9 (4.9%) | 60 (22.6%) |
| 75 Years and over | 33 (45.2%) | 108 (100.0%) |
Disability Class by Sex by Age in Fulton
Disability Class: Hearing Difficulty
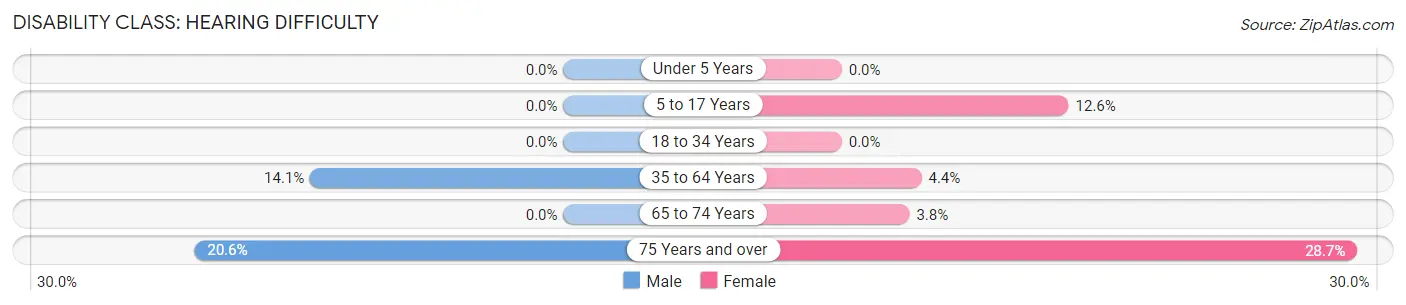
| Age Bracket | Male | Female |
| Under 5 Years | 0 (0.0%) | 0 (0.0%) |
| 5 to 17 Years | 0 (0.0%) | 24 (12.6%) |
| 18 to 34 Years | 0 (0.0%) | 0 (0.0%) |
| 35 to 64 Years | 65 (14.1%) | 33 (4.4%) |
| 65 to 74 Years | 0 (0.0%) | 10 (3.8%) |
| 75 Years and over | 15 (20.5%) | 31 (28.7%) |
Disability Class: Vision Difficulty
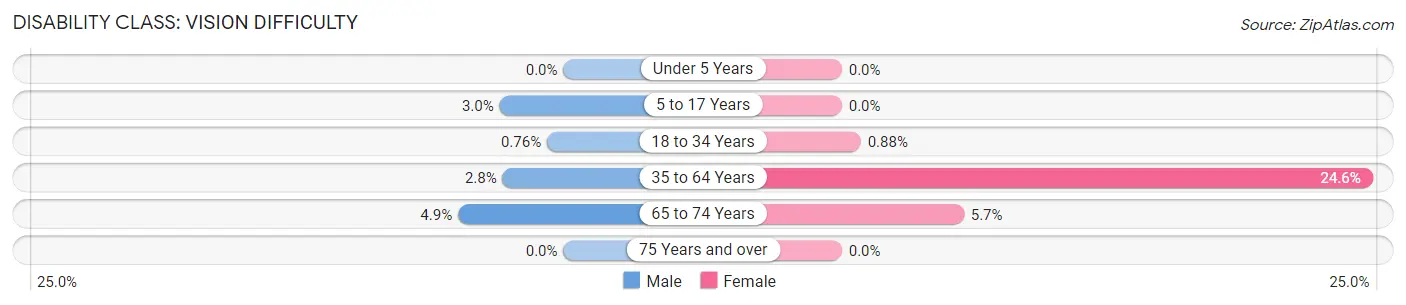
| Age Bracket | Male | Female |
| Under 5 Years | 0 (0.0%) | 0 (0.0%) |
| 5 to 17 Years | 10 (3.0%) | 0 (0.0%) |
| 18 to 34 Years | 8 (0.8%) | 6 (0.9%) |
| 35 to 64 Years | 13 (2.8%) | 183 (24.6%) |
| 65 to 74 Years | 9 (4.9%) | 15 (5.7%) |
| 75 Years and over | 0 (0.0%) | 0 (0.0%) |
Disability Class: Cognitive Difficulty
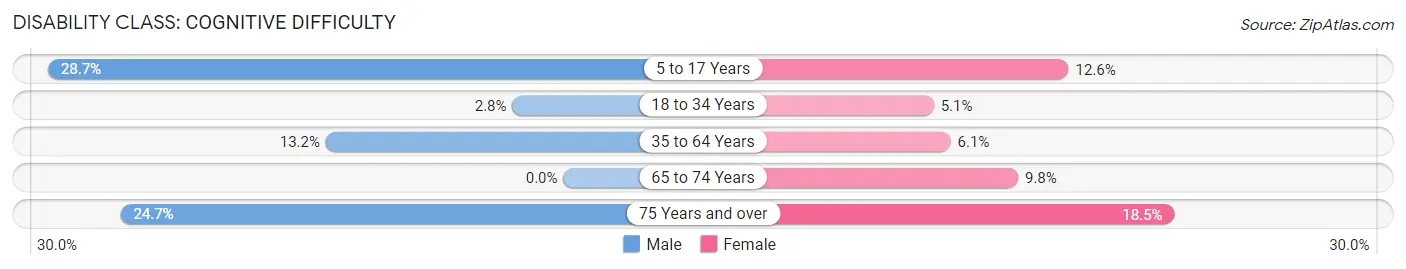
| Age Bracket | Male | Female |
| 5 to 17 Years | 97 (28.7%) | 24 (12.6%) |
| 18 to 34 Years | 30 (2.8%) | 35 (5.1%) |
| 35 to 64 Years | 61 (13.2%) | 45 (6.1%) |
| 65 to 74 Years | 0 (0.0%) | 26 (9.8%) |
| 75 Years and over | 18 (24.7%) | 20 (18.5%) |
Disability Class: Ambulatory Difficulty
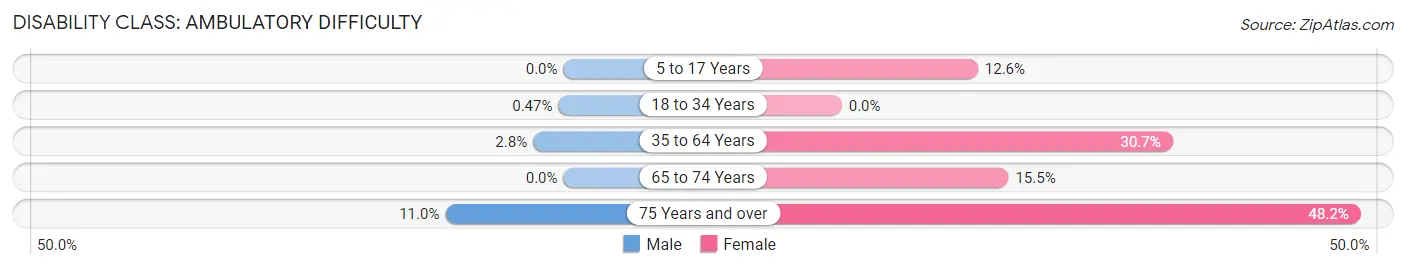
| Age Bracket | Male | Female |
| 5 to 17 Years | 0 (0.0%) | 24 (12.6%) |
| 18 to 34 Years | 5 (0.5%) | 0 (0.0%) |
| 35 to 64 Years | 13 (2.8%) | 228 (30.7%) |
| 65 to 74 Years | 0 (0.0%) | 41 (15.5%) |
| 75 Years and over | 8 (11.0%) | 52 (48.1%) |
Disability Class: Self-Care Difficulty
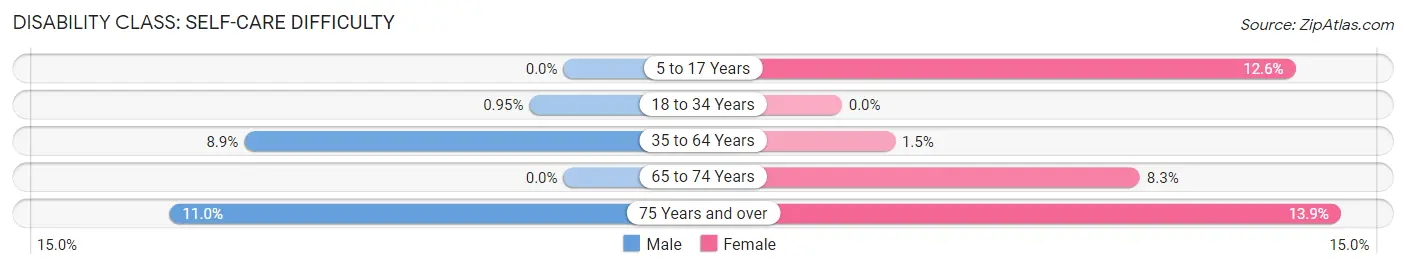
| Age Bracket | Male | Female |
| 5 to 17 Years | 0 (0.0%) | 24 (12.6%) |
| 18 to 34 Years | 10 (0.9%) | 0 (0.0%) |
| 35 to 64 Years | 41 (8.9%) | 11 (1.5%) |
| 65 to 74 Years | 0 (0.0%) | 22 (8.3%) |
| 75 Years and over | 8 (11.0%) | 15 (13.9%) |
Technology Access in Fulton
Computing Device Access in Fulton
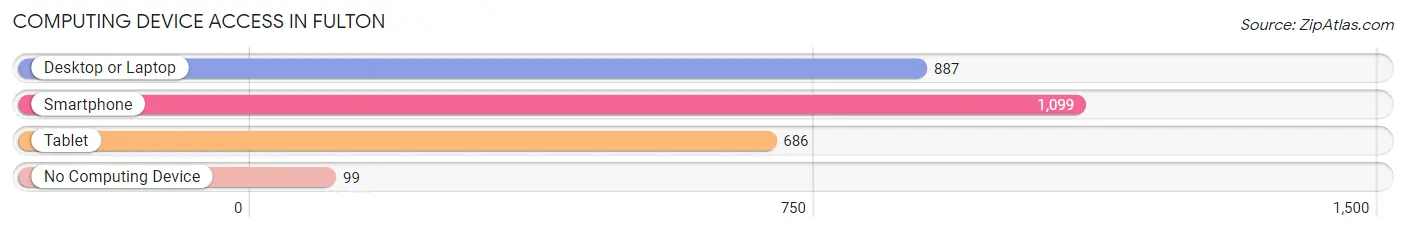
| Device Type | # Households | % Households |
| Desktop or Laptop | 887 | 70.9% |
| Smartphone | 1,099 | 87.8% |
| Tablet | 686 | 54.8% |
| No Computing Device | 99 | 7.9% |
| Total | 1,252 | 100.0% |
Internet Access in Fulton
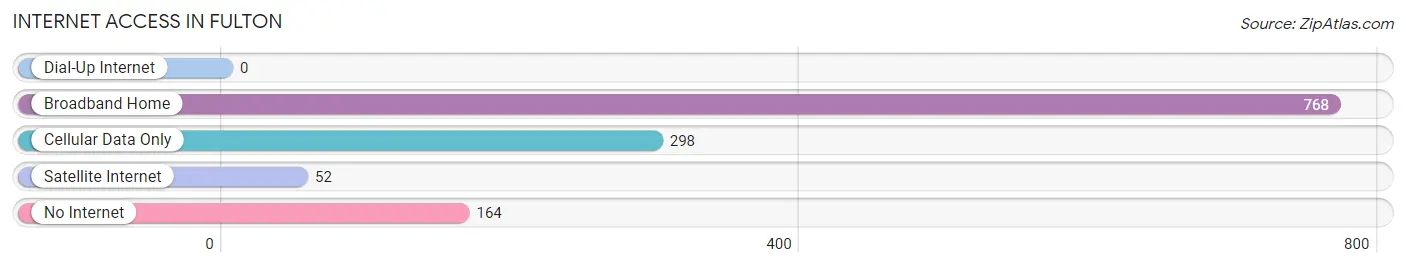
| Internet Type | # Households | % Households |
| Dial-Up Internet | 0 | 0.0% |
| Broadband Home | 768 | 61.3% |
| Cellular Data Only | 298 | 23.8% |
| Satellite Internet | 52 | 4.2% |
| No Internet | 164 | 13.1% |
| Total | 1,252 | 100.0% |
Fulton Summary
Fulton, Mississippi is a small town located in Itawamba County in the northeastern part of the state. It is situated on the banks of the Tombigbee River, and is home to a population of approximately 2,000 people. The town was founded in 1837 and has a rich history that is deeply rooted in the culture of the area.
Geography
Fulton is located in the foothills of the Appalachian Mountains, and is surrounded by rolling hills and lush forests. The town is situated on the banks of the Tombigbee River, which is a major tributary of the Mississippi River. The town is located approximately 30 miles south of Tupelo, Mississippi, and is approximately 90 miles north of Birmingham, Alabama.
Economy
Fulton’s economy is largely based on agriculture and manufacturing. The town is home to several large farms, which produce a variety of crops, including cotton, corn, soybeans, and wheat. The town is also home to several manufacturing plants, which produce a variety of products, including furniture, textiles, and automotive parts.
Demographics
As of the 2010 census, the population of Fulton was 2,039. The racial makeup of the town was 79.2% White, 18.3% African American, 0.3% Native American, 0.2% Asian, 0.1% Pacific Islander, 0.7% from other races, and 1.4% from two or more races. Hispanic or Latino of any race were 1.7% of the population.
The median income for a household in Fulton was $30,938, and the median income for a family was $37,917. The per capita income for the town was $15,945. About 17.2% of families and 20.2% of the population were below the poverty line, including 28.2% of those under age 18 and 16.2% of those age 65 or over.
Education
Fulton is served by the Itawamba County School District, which includes two elementary schools, one middle school, and one high school. The town is also home to Itawamba Community College, which offers a variety of associate degree programs.
Conclusion
Fulton, Mississippi is a small town located in Itawamba County in the northeastern part of the state. It is situated on the banks of the Tombigbee River, and is home to a population of approximately 2,000 people. The town’s economy is largely based on agriculture and manufacturing, and the town is served by the Itawamba County School District. Fulton is a small town with a rich history and culture, and is a great place to live and work.
Common Questions
What is Per Capita Income in Fulton?
Per Capita income in Fulton is $20,200.
What is the Median Family Income in Fulton?
Median Family Income in Fulton is $66,346.
What is the Median Household income in Fulton?
Median Household Income in Fulton is $46,875.
What is Income or Wage Gap in Fulton?
Income or Wage Gap in Fulton is 11.1%.
Women in Fulton earn 88.9 cents for every dollar earned by a man.
What is Inequality or Gini Index in Fulton?
Inequality or Gini Index in Fulton is 0.40.
What is the Total Population of Fulton?
Total Population of Fulton is 4,494.
What is the Total Male Population of Fulton?
Total Male Population of Fulton is 2,263.
What is the Total Female Population of Fulton?
Total Female Population of Fulton is 2,231.
What is the Ratio of Males per 100 Females in Fulton?
There are 101.43 Males per 100 Females in Fulton.
What is the Ratio of Females per 100 Males in Fulton?
There are 98.59 Females per 100 Males in Fulton.
What is the Median Population Age in Fulton?
Median Population Age in Fulton is 32.2 Years.
What is the Average Family Size in Fulton
Average Family Size in Fulton is 3.3 People.
What is the Average Household Size in Fulton
Average Household Size in Fulton is 2.7 People.
How Large is the Labor Force in Fulton?
There are 1,701 People in the Labor Forcein in Fulton.
What is the Percentage of People in the Labor Force in Fulton?
43.6% of People are in the Labor Force in Fulton.
What is the Unemployment Rate in Fulton?
Unemployment Rate in Fulton is 5.8%.