Kane borough, PA Map & Demographics
Kane borough Overview
$22,428
PER CAPITA INCOME
$61,477
AVG FAMILY INCOME
$45,481
AVG HOUSEHOLD INCOME
22.2%
WAGE / INCOME GAP [ % ]
77.8¢/ $1
WAGE / INCOME GAP [ $ ]
$7,735
FAMILY INCOME DEFICIT
0.40
INEQUALITY / GINI INDEX
3,605
TOTAL POPULATION
1,714
MALE POPULATION
1,891
FEMALE POPULATION
90.64
MALES / 100 FEMALES
110.33
FEMALES / 100 MALES
41.0
MEDIAN AGE
3.2
AVG FAMILY SIZE
2.4
AVG HOUSEHOLD SIZE
1,681
LABOR FORCE [ PEOPLE ]
58.1%
PERCENT IN LABOR FORCE
7.9%
UNEMPLOYMENT RATE
Income in Kane borough
Income Overview in Kane borough
Per Capita Income in Kane borough is $22,428, while median incomes of families and households are $61,477 and $45,481 respectively.
| Characteristic | Number | Measure |
| Per Capita Income | 3,605 | $22,428 |
| Median Family Income | 830 | $61,477 |
| Mean Family Income | 830 | $67,970 |
| Median Household Income | 1,452 | $45,481 |
| Mean Household Income | 1,452 | $54,368 |
| Income Deficit | 830 | $7,735 |
| Wage / Income Gap (%) | 3,605 | 22.19% |
| Wage / Income Gap ($) | 3,605 | 77.81¢ per $1 |
| Gini / Inequality Index | 3,605 | 0.40 |
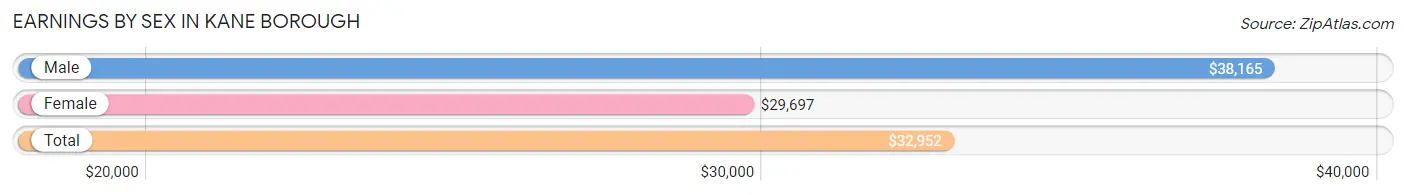
Earnings by Sex in Kane borough
Average Earnings in Kane borough are $32,952, $38,165 for men and $29,697 for women, a difference of 22.2%.
| Sex | Number | Average Earnings |
| Male | 807 (47.9%) | $38,165 |
| Female | 879 (52.1%) | $29,697 |
| Total | 1,686 (100.0%) | $32,952 |
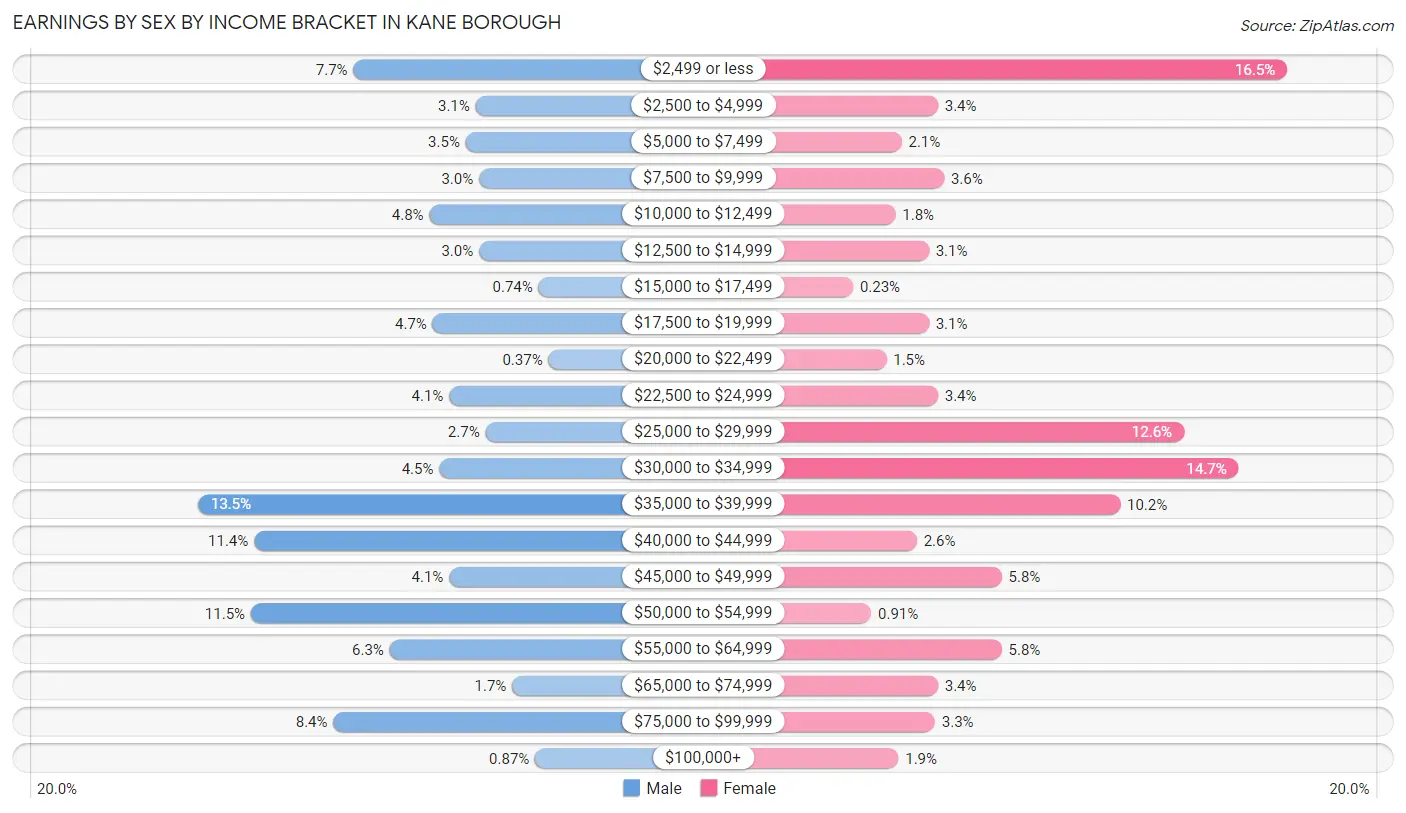
Earnings by Sex by Income Bracket in Kane borough
The most common earnings brackets in Kane borough are $35,000 to $39,999 for men (109 | 13.5%) and $2,499 or less for women (145 | 16.5%).
| Income | Male | Female |
| $2,499 or less | 62 (7.7%) | 145 (16.5%) |
| $2,500 to $4,999 | 25 (3.1%) | 30 (3.4%) |
| $5,000 to $7,499 | 28 (3.5%) | 18 (2.1%) |
| $7,500 to $9,999 | 24 (3.0%) | 32 (3.6%) |
| $10,000 to $12,499 | 39 (4.8%) | 16 (1.8%) |
| $12,500 to $14,999 | 24 (3.0%) | 27 (3.1%) |
| $15,000 to $17,499 | 6 (0.7%) | 2 (0.2%) |
| $17,500 to $19,999 | 38 (4.7%) | 27 (3.1%) |
| $20,000 to $22,499 | 3 (0.4%) | 13 (1.5%) |
| $22,500 to $24,999 | 33 (4.1%) | 30 (3.4%) |
| $25,000 to $29,999 | 22 (2.7%) | 111 (12.6%) |
| $30,000 to $34,999 | 36 (4.5%) | 129 (14.7%) |
| $35,000 to $39,999 | 109 (13.5%) | 90 (10.2%) |
| $40,000 to $44,999 | 92 (11.4%) | 23 (2.6%) |
| $45,000 to $49,999 | 33 (4.1%) | 51 (5.8%) |
| $50,000 to $54,999 | 93 (11.5%) | 8 (0.9%) |
| $55,000 to $64,999 | 51 (6.3%) | 51 (5.8%) |
| $65,000 to $74,999 | 14 (1.7%) | 30 (3.4%) |
| $75,000 to $99,999 | 68 (8.4%) | 29 (3.3%) |
| $100,000+ | 7 (0.9%) | 17 (1.9%) |
| Total | 807 (100.0%) | 879 (100.0%) |
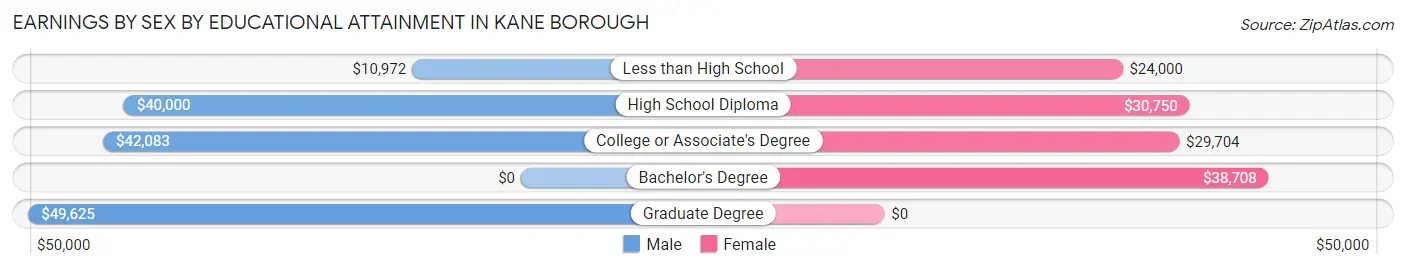
Earnings by Sex by Educational Attainment in Kane borough
Average earnings in Kane borough are $39,657 for men and $32,964 for women, a difference of 16.9%. Men with an educational attainment of graduate degree enjoy the highest average annual earnings of $49,625, while those with less than high school education earn the least with $10,972. Women with an educational attainment of bachelor's degree earn the most with the average annual earnings of $38,708, while those with less than high school education have the smallest earnings of $24,000.
| Educational Attainment | Male Income | Female Income |
| Less than High School | $10,972 | $24,000 |
| High School Diploma | $40,000 | $30,750 |
| College or Associate's Degree | $42,083 | $29,704 |
| Bachelor's Degree | - | - |
| Graduate Degree | $49,625 | $0 |
| Total | $39,657 | $32,964 |
Family Income in Kane borough
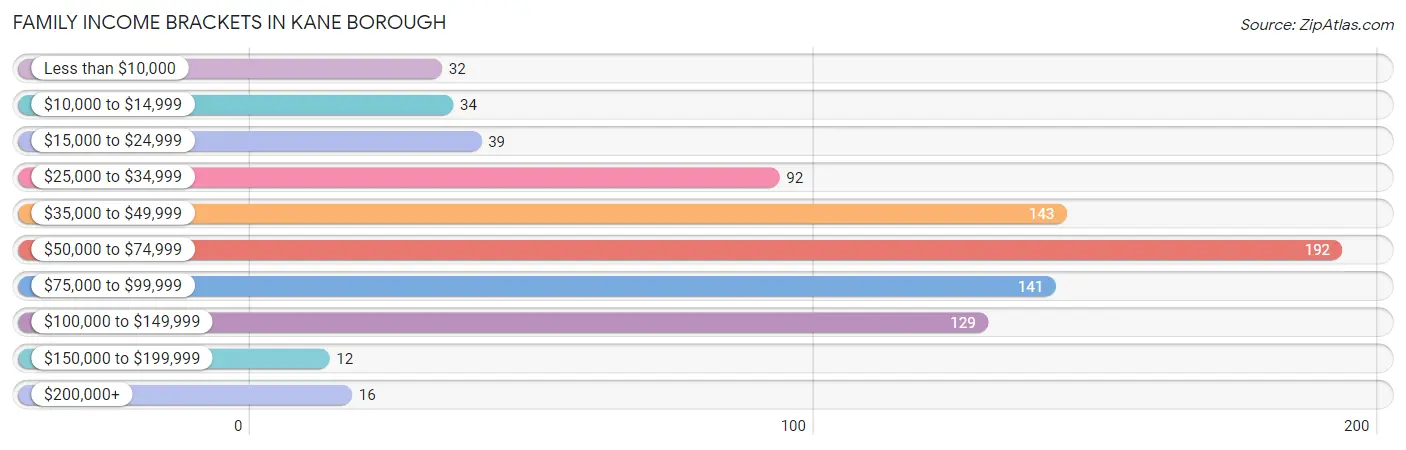
Family Income Brackets in Kane borough
According to the Kane borough family income data, there are 192 families falling into the $50,000 to $74,999 income range, which is the most common income bracket and makes up 23.1% of all families. Conversely, the $150,000 to $199,999 income bracket is the least frequent group with only 12 families (1.5%) belonging to this category.
| Income Bracket | # Families | % Families |
| Less than $10,000 | 32 | 3.9% |
| $10,000 to $14,999 | 34 | 4.1% |
| $15,000 to $24,999 | 39 | 4.7% |
| $25,000 to $34,999 | 92 | 11.1% |
| $35,000 to $49,999 | 143 | 17.2% |
| $50,000 to $74,999 | 192 | 23.1% |
| $75,000 to $99,999 | 141 | 17.0% |
| $100,000 to $149,999 | 129 | 15.5% |
| $150,000 to $199,999 | 12 | 1.4% |
| $200,000+ | 16 | 1.9% |
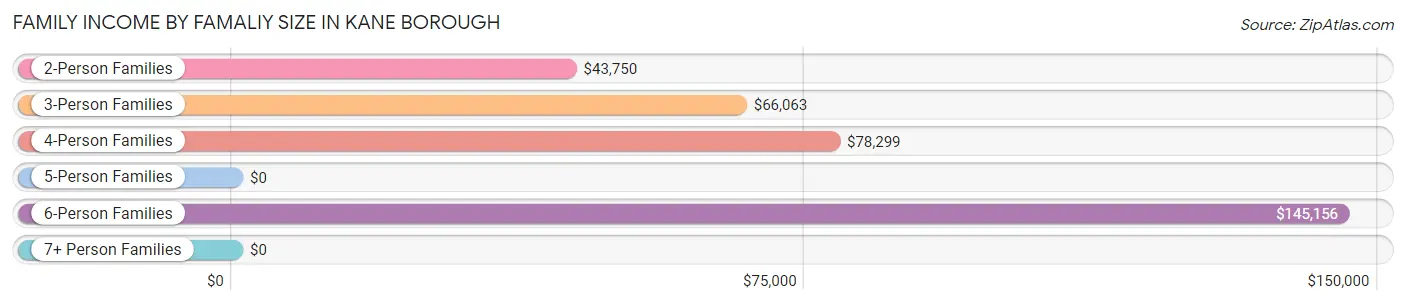
Family Income by Famaliy Size in Kane borough
6-person families (30 | 3.6%) account for the highest median family income in Kane borough with $145,156 per family, while 6-person families (30 | 3.6%) have the highest median income of $24,193 per family member.
| Income Bracket | # Families | Median Income |
| 2-Person Families | 370 (44.6%) | $43,750 |
| 3-Person Families | 183 (22.1%) | $66,063 |
| 4-Person Families | 143 (17.2%) | $78,299 |
| 5-Person Families | 104 (12.5%) | $0 |
| 6-Person Families | 30 (3.6%) | $145,156 |
| 7+ Person Families | 0 (0.0%) | $0 |
| Total | 830 (100.0%) | $61,477 |
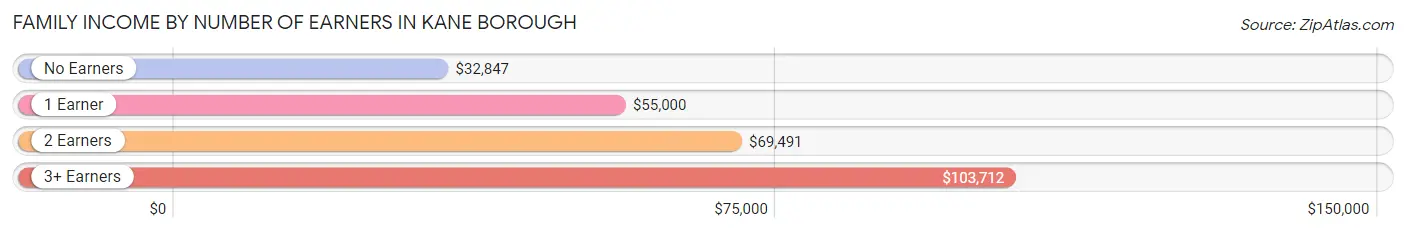
Family Income by Number of Earners in Kane borough
The median family income in Kane borough is $61,477, with families comprising 3+ earners (158) having the highest median family income of $103,712, while families with no earners (199) have the lowest median family income of $32,847, accounting for 19.0% and 24.0% of families, respectively.
| Number of Earners | # Families | Median Income |
| No Earners | 199 (24.0%) | $32,847 |
| 1 Earner | 210 (25.3%) | $55,000 |
| 2 Earners | 263 (31.7%) | $69,491 |
| 3+ Earners | 158 (19.0%) | $103,712 |
| Total | 830 (100.0%) | $61,477 |
Household Income in Kane borough
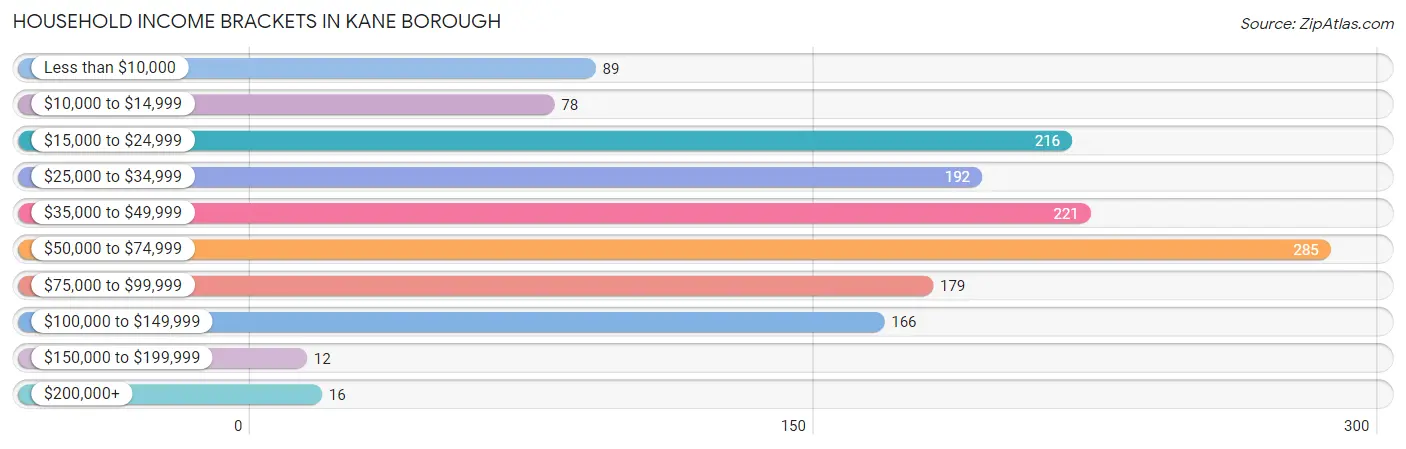
Household Income Brackets in Kane borough
With 285 households falling in the category, the $50,000 to $74,999 income range is the most frequent in Kane borough, accounting for 19.6% of all households. In contrast, only 12 households (0.8%) fall into the $150,000 to $199,999 income bracket, making it the least populous group.
| Income Bracket | # Households | % Households |
| Less than $10,000 | 89 | 6.1% |
| $10,000 to $14,999 | 78 | 5.4% |
| $15,000 to $24,999 | 216 | 14.9% |
| $25,000 to $34,999 | 192 | 13.2% |
| $35,000 to $49,999 | 221 | 15.2% |
| $50,000 to $74,999 | 285 | 19.6% |
| $75,000 to $99,999 | 179 | 12.3% |
| $100,000 to $149,999 | 166 | 11.4% |
| $150,000 to $199,999 | 12 | 0.8% |
| $200,000+ | 16 | 1.1% |
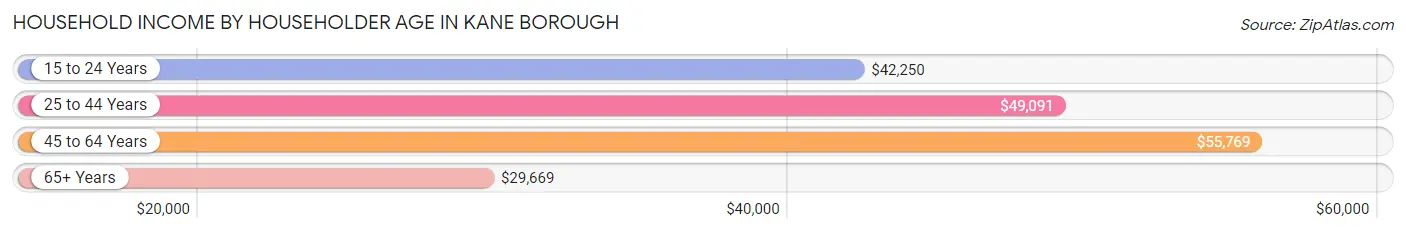
Household Income by Householder Age in Kane borough
The median household income in Kane borough is $45,481, with the highest median household income of $55,769 found in the 45 to 64 years age bracket for the primary householder. A total of 526 households (36.2%) fall into this category. Meanwhile, the 65+ years age bracket for the primary householder has the lowest median household income of $29,669, with 481 households (33.1%) in this group.
| Income Bracket | # Households | Median Income |
| 15 to 24 Years | 63 (4.3%) | $42,250 |
| 25 to 44 Years | 382 (26.3%) | $49,091 |
| 45 to 64 Years | 526 (36.2%) | $55,769 |
| 65+ Years | 481 (33.1%) | $29,669 |
| Total | 1,452 (100.0%) | $45,481 |
Poverty in Kane borough
Income Below Poverty by Sex and Age in Kane borough
With 10.5% poverty level for males and 10.0% for females among the residents of Kane borough, 12 to 14 year old males and 35 to 44 year old females are the most vulnerable to poverty, with 10 males (33.3%) and 65 females (24.0%) in their respective age groups living below the poverty level.
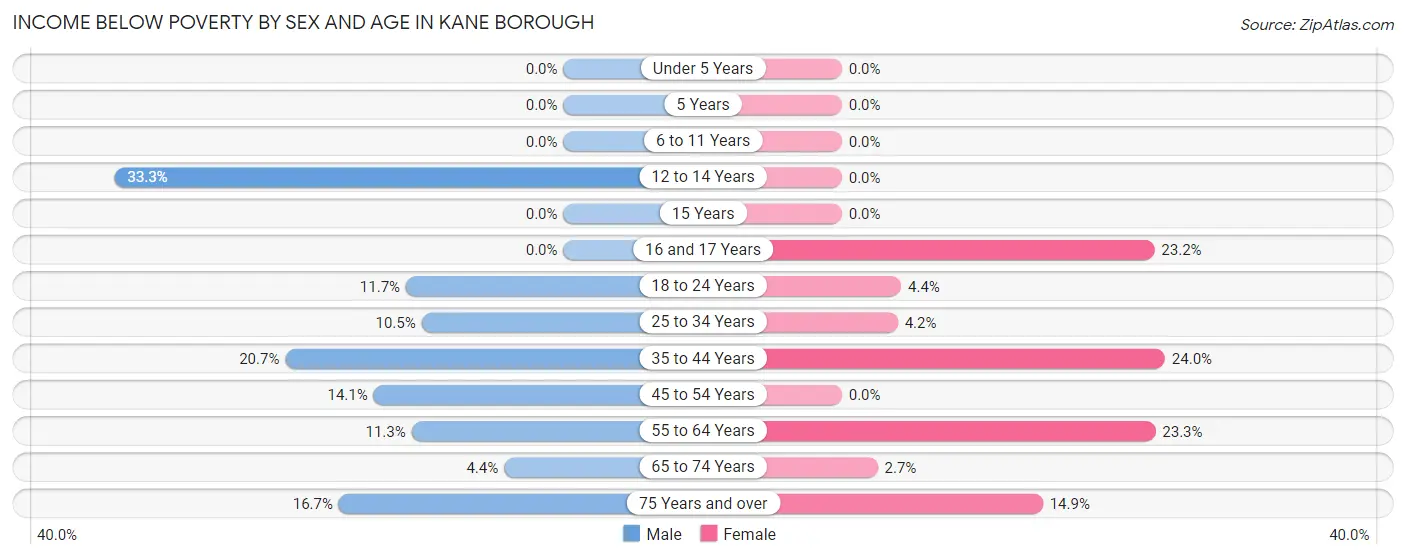
| Age Bracket | Male | Female |
| Under 5 Years | 0 (0.0%) | 0 (0.0%) |
| 5 Years | 0 (0.0%) | 0 (0.0%) |
| 6 to 11 Years | 0 (0.0%) | 0 (0.0%) |
| 12 to 14 Years | 10 (33.3%) | 0 (0.0%) |
| 15 Years | 0 (0.0%) | 0 (0.0%) |
| 16 and 17 Years | 0 (0.0%) | 13 (23.2%) |
| 18 to 24 Years | 18 (11.7%) | 8 (4.4%) |
| 25 to 34 Years | 20 (10.5%) | 8 (4.2%) |
| 35 to 44 Years | 38 (20.6%) | 65 (24.0%) |
| 45 to 54 Years | 31 (14.1%) | 0 (0.0%) |
| 55 to 64 Years | 24 (11.3%) | 54 (23.3%) |
| 65 to 74 Years | 8 (4.4%) | 5 (2.7%) |
| 75 Years and over | 22 (16.7%) | 27 (14.9%) |
| Total | 171 (10.5%) | 180 (10.0%) |
Income Above Poverty by Sex and Age in Kane borough
According to the poverty statistics in Kane borough, males aged under 5 years and females aged under 5 years are the age groups that are most secure financially, with 100.0% of males and 100.0% of females in these age groups living above the poverty line.
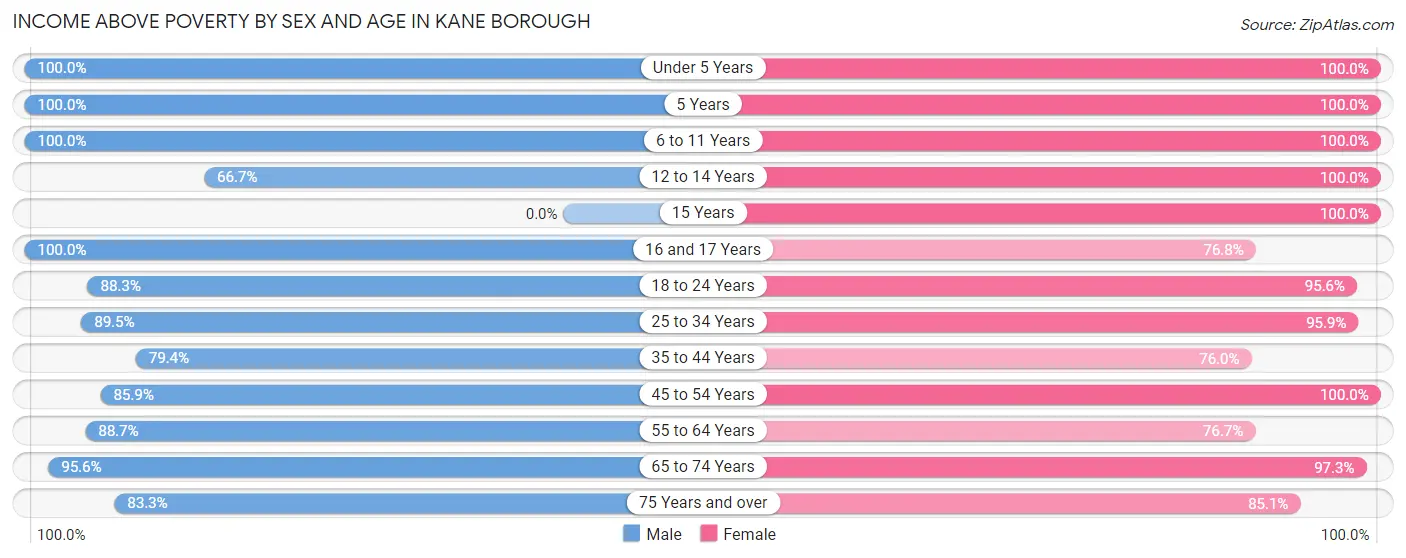
| Age Bracket | Male | Female |
| Under 5 Years | 95 (100.0%) | 118 (100.0%) |
| 5 Years | 84 (100.0%) | 21 (100.0%) |
| 6 to 11 Years | 122 (100.0%) | 141 (100.0%) |
| 12 to 14 Years | 20 (66.7%) | 50 (100.0%) |
| 15 Years | 0 (0.0%) | 10 (100.0%) |
| 16 and 17 Years | 27 (100.0%) | 43 (76.8%) |
| 18 to 24 Years | 136 (88.3%) | 174 (95.6%) |
| 25 to 34 Years | 170 (89.5%) | 185 (95.9%) |
| 35 to 44 Years | 146 (79.3%) | 206 (76.0%) |
| 45 to 54 Years | 189 (85.9%) | 165 (100.0%) |
| 55 to 64 Years | 189 (88.7%) | 178 (76.7%) |
| 65 to 74 Years | 174 (95.6%) | 183 (97.3%) |
| 75 Years and over | 110 (83.3%) | 154 (85.1%) |
| Total | 1,462 (89.5%) | 1,628 (90.0%) |
Income Below Poverty Among Married-Couple Families in Kane borough
The poverty statistics for married-couple families in Kane borough show that 3.6% or 24 of the total 665 families live below the poverty line. Families with no children have the highest poverty rate of 6.2%, comprising of 24 families. On the other hand, families with 1 or 2 children have the lowest poverty rate of 0.0%, which includes 0 families.
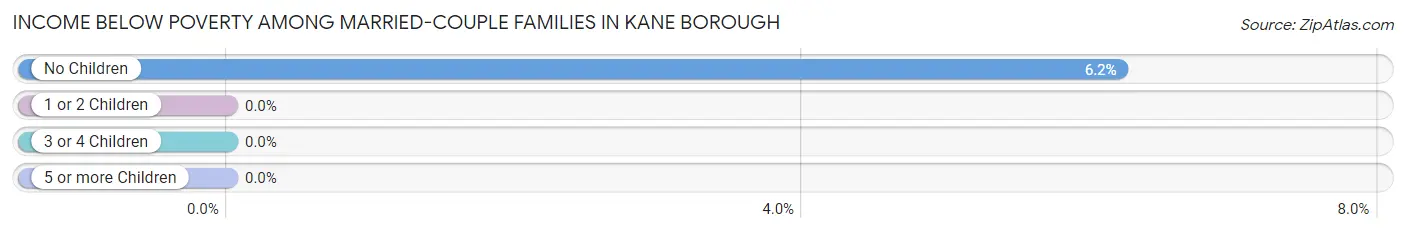
| Children | Above Poverty | Below Poverty |
| No Children | 363 (93.8%) | 24 (6.2%) |
| 1 or 2 Children | 169 (100.0%) | 0 (0.0%) |
| 3 or 4 Children | 109 (100.0%) | 0 (0.0%) |
| 5 or more Children | 0 (0.0%) | 0 (0.0%) |
| Total | 641 (96.4%) | 24 (3.6%) |
Income Below Poverty Among Single-Parent Households in Kane borough
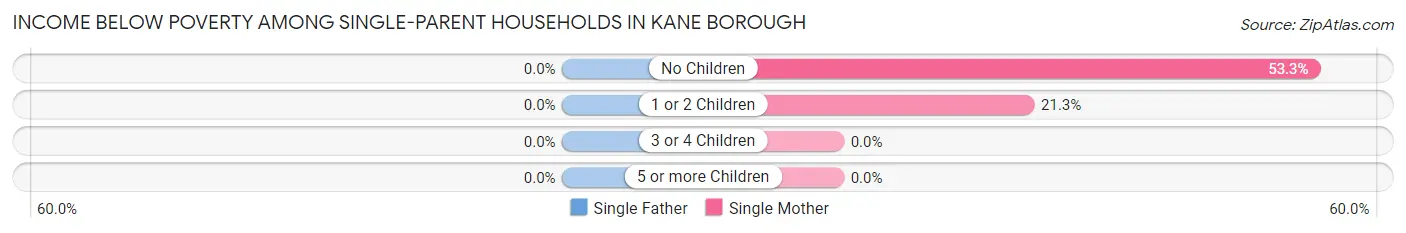
| Children | Single Father | Single Mother |
| No Children | 0 (0.0%) | 49 (53.3%) |
| 1 or 2 Children | 0 (0.0%) | 10 (21.3%) |
| 3 or 4 Children | 0 (0.0%) | 0 (0.0%) |
| 5 or more Children | 0 (0.0%) | 0 (0.0%) |
| Total | 0 (0.0%) | 59 (41.5%) |
Income Below Poverty Among Married-Couple vs Single-Parent Households in Kane borough
The poverty data for Kane borough shows that 24 of the married-couple family households (3.6%) and 59 of the single-parent households (35.8%) are living below the poverty level. Within the married-couple family households, those with no children have the highest poverty rate, with 24 households (6.2%) falling below the poverty line. Among the single-parent households, those with no children have the highest poverty rate, with 49 household (48.5%) living below poverty.
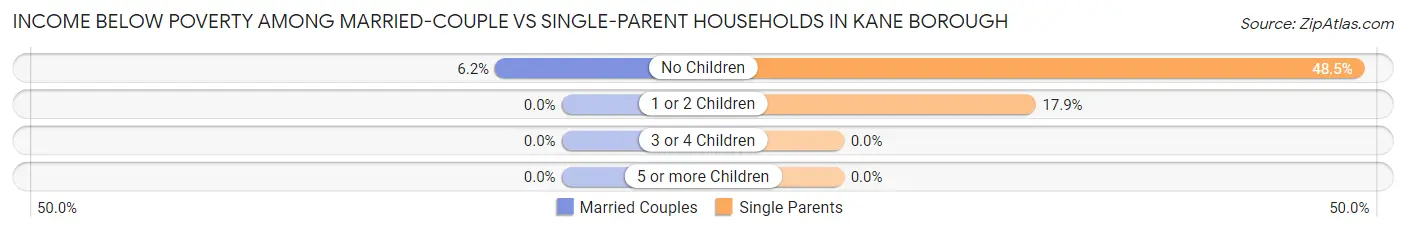
| Children | Married-Couple Families | Single-Parent Households |
| No Children | 24 (6.2%) | 49 (48.5%) |
| 1 or 2 Children | 0 (0.0%) | 10 (17.9%) |
| 3 or 4 Children | 0 (0.0%) | 0 (0.0%) |
| 5 or more Children | 0 (0.0%) | 0 (0.0%) |
| Total | 24 (3.6%) | 59 (35.8%) |
Race in Kane borough
The most populous races in Kane borough are White / Caucasian (3,462 | 96.0%), Two or more Races (86 | 2.4%), and Hispanic or Latino (78 | 2.2%).
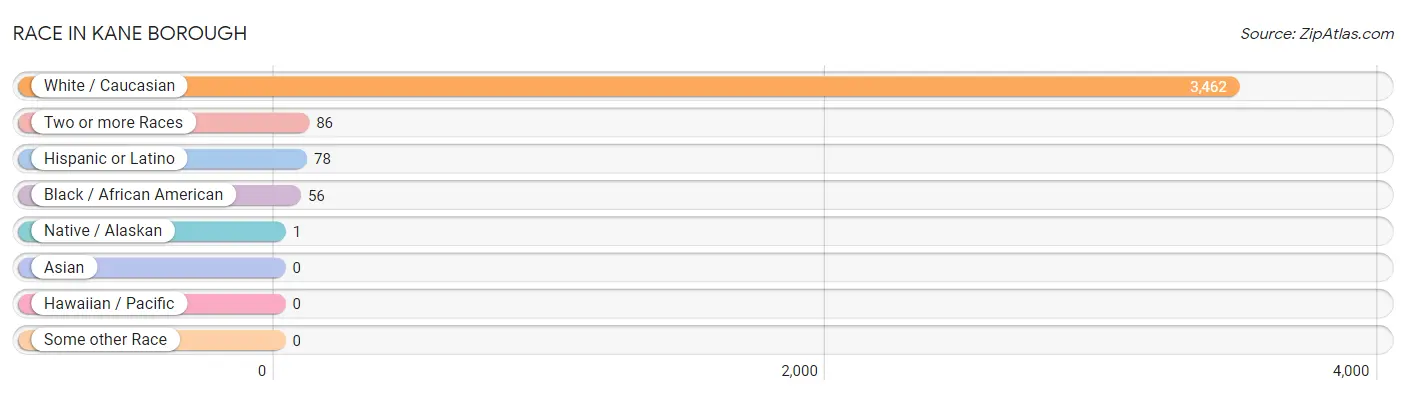
| Race | # Population | % Population |
| Asian | 0 | 0.0% |
| Black / African American | 56 | 1.5% |
| Hawaiian / Pacific | 0 | 0.0% |
| Hispanic or Latino | 78 | 2.2% |
| Native / Alaskan | 1 | 0.0% |
| White / Caucasian | 3,462 | 96.0% |
| Two or more Races | 86 | 2.4% |
| Some other Race | 0 | 0.0% |
| Total | 3,605 | 100.0% |
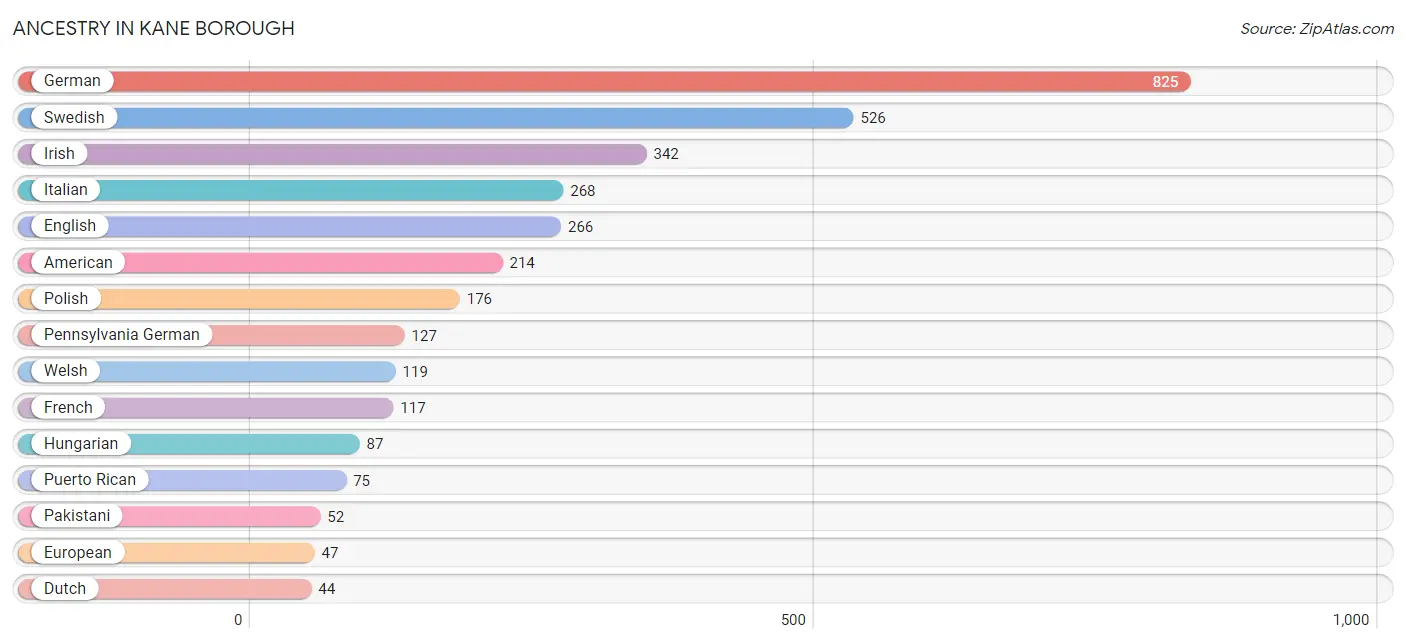
Ancestry in Kane borough
The most populous ancestries reported in Kane borough are German (825 | 22.9%), Swedish (526 | 14.6%), Irish (342 | 9.5%), Italian (268 | 7.4%), and English (266 | 7.4%), together accounting for 61.8% of all Kane borough residents.
| Ancestry | # Population | % Population |
| American | 214 | 5.9% |
| Armenian | 7 | 0.2% |
| Belgian | 17 | 0.5% |
| British | 20 | 0.5% |
| Cherokee | 1 | 0.0% |
| Czech | 5 | 0.1% |
| Czechoslovakian | 10 | 0.3% |
| Danish | 4 | 0.1% |
| Dutch | 44 | 1.2% |
| English | 266 | 7.4% |
| European | 47 | 1.3% |
| French | 117 | 3.3% |
| German | 825 | 22.9% |
| Hungarian | 87 | 2.4% |
| Irish | 342 | 9.5% |
| Iroquois | 5 | 0.1% |
| Italian | 268 | 7.4% |
| Norwegian | 4 | 0.1% |
| Pakistani | 52 | 1.4% |
| Pennsylvania German | 127 | 3.5% |
| Polish | 176 | 4.9% |
| Puerto Rican | 75 | 2.1% |
| Russian | 17 | 0.5% |
| Scotch-Irish | 24 | 0.7% |
| Scottish | 44 | 1.2% |
| Slovak | 18 | 0.5% |
| Slovene | 7 | 0.2% |
| Swedish | 526 | 14.6% |
| Swiss | 19 | 0.5% |
| Ukrainian | 23 | 0.6% |
| Welsh | 119 | 3.3% |
| Yugoslavian | 10 | 0.3% | View All 32 Rows |
Immigrants in Kane borough
The most numerous immigrant groups reported in Kane borough came from Canada (5 | 0.1%), Africa (3 | 0.1%), Sierra Leone (3 | 0.1%), and Western Africa (3 | 0.1%), together accounting for 0.4% of all Kane borough residents.
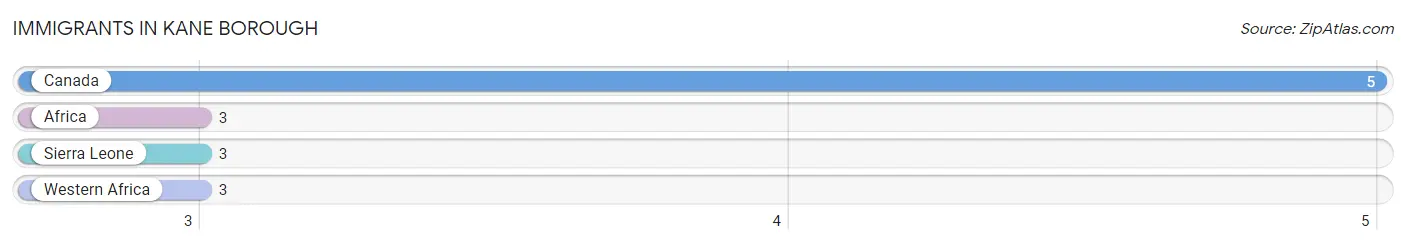
| Immigration Origin | # Population | % Population |
| Africa | 3 | 0.1% |
| Canada | 5 | 0.1% |
| Sierra Leone | 3 | 0.1% |
| Western Africa | 3 | 0.1% | View All 4 Rows |
Sex and Age in Kane borough
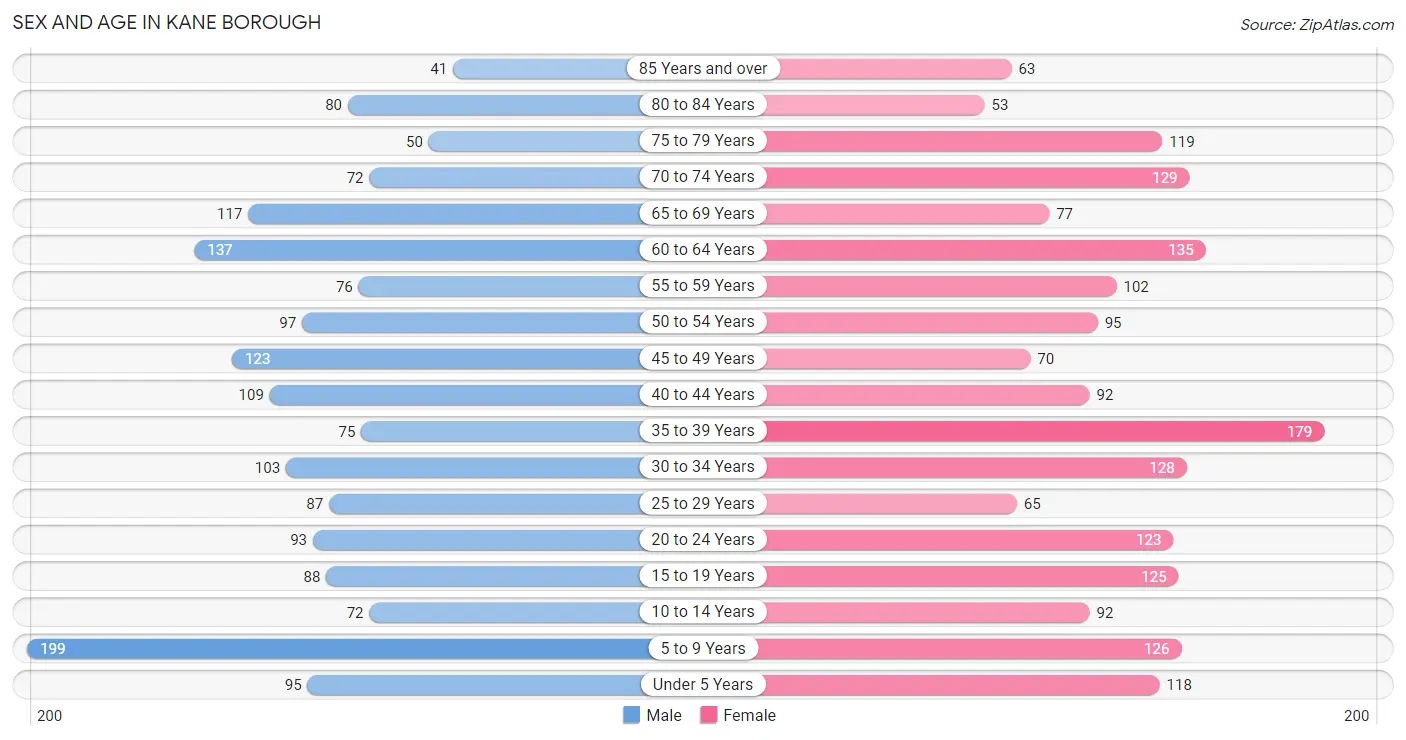
Sex and Age in Kane borough
The most populous age groups in Kane borough are 5 to 9 Years (199 | 11.6%) for men and 35 to 39 Years (179 | 9.5%) for women.
| Age Bracket | Male | Female |
| Under 5 Years | 95 (5.5%) | 118 (6.2%) |
| 5 to 9 Years | 199 (11.6%) | 126 (6.7%) |
| 10 to 14 Years | 72 (4.2%) | 92 (4.9%) |
| 15 to 19 Years | 88 (5.1%) | 125 (6.6%) |
| 20 to 24 Years | 93 (5.4%) | 123 (6.5%) |
| 25 to 29 Years | 87 (5.1%) | 65 (3.4%) |
| 30 to 34 Years | 103 (6.0%) | 128 (6.8%) |
| 35 to 39 Years | 75 (4.4%) | 179 (9.5%) |
| 40 to 44 Years | 109 (6.4%) | 92 (4.9%) |
| 45 to 49 Years | 123 (7.2%) | 70 (3.7%) |
| 50 to 54 Years | 97 (5.7%) | 95 (5.0%) |
| 55 to 59 Years | 76 (4.4%) | 102 (5.4%) |
| 60 to 64 Years | 137 (8.0%) | 135 (7.1%) |
| 65 to 69 Years | 117 (6.8%) | 77 (4.1%) |
| 70 to 74 Years | 72 (4.2%) | 129 (6.8%) |
| 75 to 79 Years | 50 (2.9%) | 119 (6.3%) |
| 80 to 84 Years | 80 (4.7%) | 53 (2.8%) |
| 85 Years and over | 41 (2.4%) | 63 (3.3%) |
| Total | 1,714 (100.0%) | 1,891 (100.0%) |
Families and Households in Kane borough
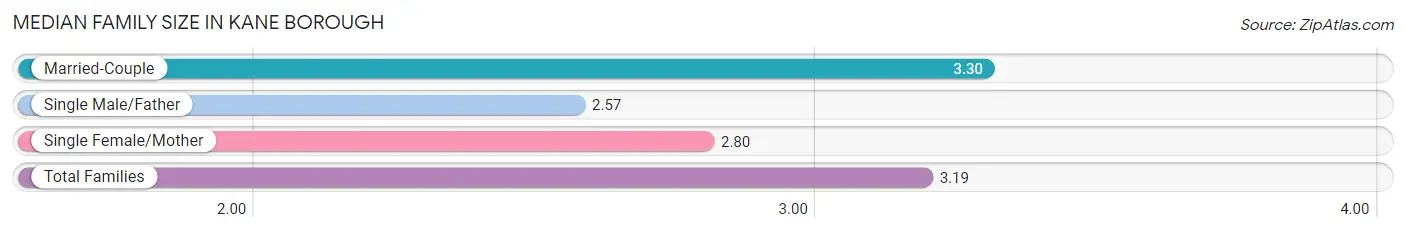
Median Family Size in Kane borough
The median family size in Kane borough is 3.19 persons per family, with married-couple families (665 | 80.1%) accounting for the largest median family size of 3.3 persons per family. On the other hand, single male/father families (23 | 2.8%) represent the smallest median family size with 2.57 persons per family.
| Family Type | # Families | Family Size |
| Married-Couple | 665 (80.1%) | 3.30 |
| Single Male/Father | 23 (2.8%) | 2.57 |
| Single Female/Mother | 142 (17.1%) | 2.80 |
| Total Families | 830 (100.0%) | 3.19 |
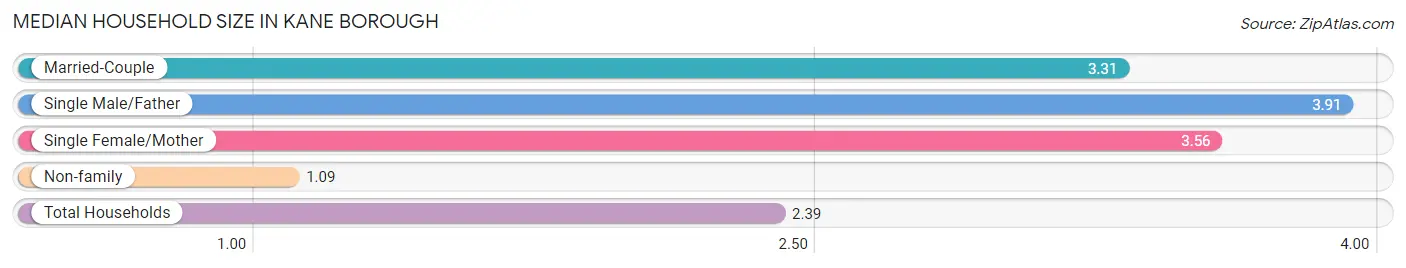
Median Household Size in Kane borough
The median household size in Kane borough is 2.39 persons per household, with single male/father households (23 | 1.6%) accounting for the largest median household size of 3.91 persons per household. non-family households (622 | 42.8%) represent the smallest median household size with 1.09 persons per household.
| Household Type | # Households | Household Size |
| Married-Couple | 665 (45.8%) | 3.31 |
| Single Male/Father | 23 (1.6%) | 3.91 |
| Single Female/Mother | 142 (9.8%) | 3.56 |
| Non-family | 622 (42.8%) | 1.09 |
| Total Households | 1,452 (100.0%) | 2.39 |
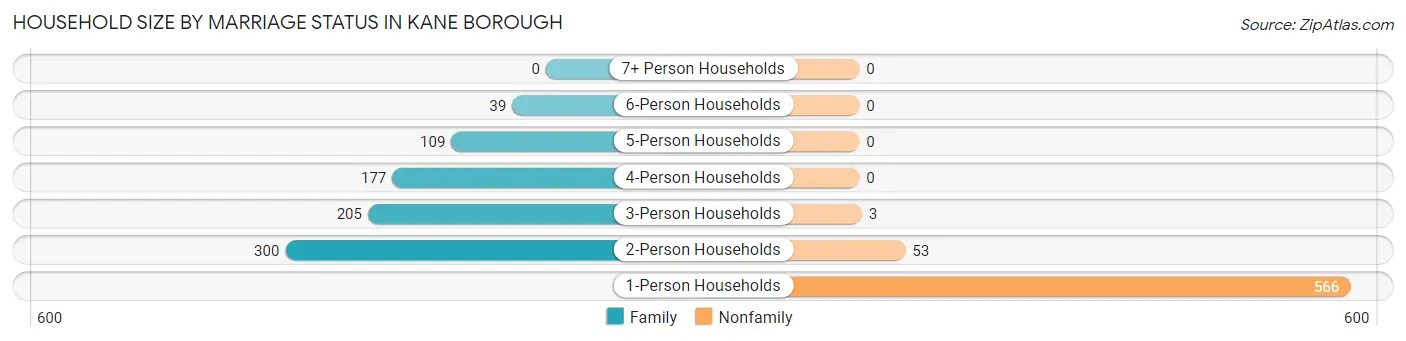
Household Size by Marriage Status in Kane borough
Out of a total of 1,452 households in Kane borough, 830 (57.2%) are family households, while 622 (42.8%) are nonfamily households. The most numerous type of family households are 2-person households, comprising 300, and the most common type of nonfamily households are 1-person households, comprising 566.
| Household Size | Family Households | Nonfamily Households |
| 1-Person Households | - | 566 (39.0%) |
| 2-Person Households | 300 (20.7%) | 53 (3.6%) |
| 3-Person Households | 205 (14.1%) | 3 (0.2%) |
| 4-Person Households | 177 (12.2%) | 0 (0.0%) |
| 5-Person Households | 109 (7.5%) | 0 (0.0%) |
| 6-Person Households | 39 (2.7%) | 0 (0.0%) |
| 7+ Person Households | 0 (0.0%) | 0 (0.0%) |
| Total | 830 (57.2%) | 622 (42.8%) |
Female Fertility in Kane borough
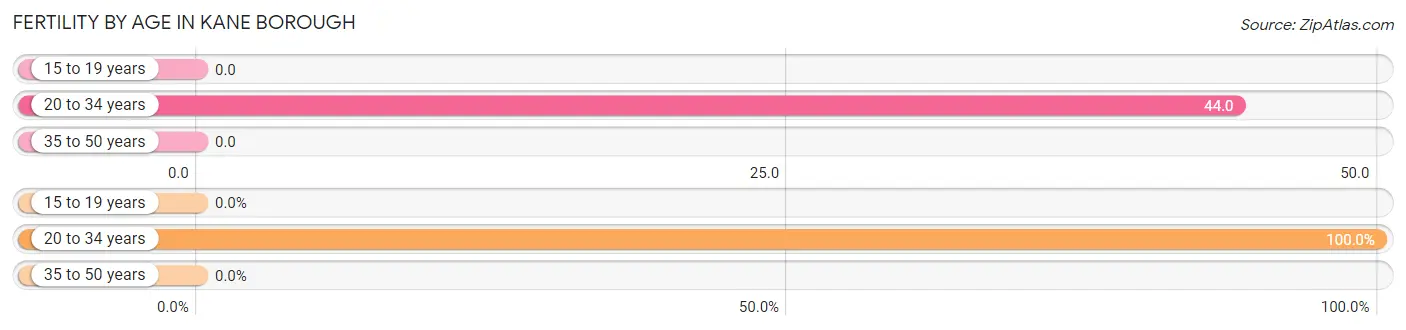
Fertility by Age in Kane borough
Average fertility rate in Kane borough is 18.0 births per 1,000 women. Women in the age bracket of 20 to 34 years have the highest fertility rate with 44.0 births per 1,000 women. Women in the age bracket of 20 to 34 years acount for 100.0% of all women with births.
| Age Bracket | Women with Births | Births / 1,000 Women |
| 15 to 19 years | 0 (0.0%) | 0.0 |
| 20 to 34 years | 14 (100.0%) | 44.0 |
| 35 to 50 years | 0 (0.0%) | 0.0 |
| Total | 14 (100.0%) | 18.0 |
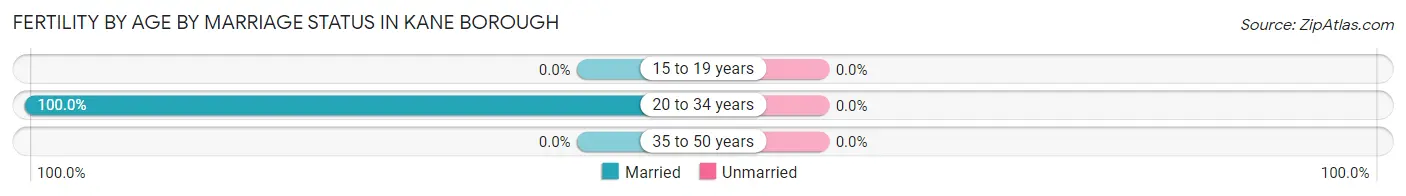
Fertility by Age by Marriage Status in Kane borough
| Age Bracket | Married | Unmarried |
| 15 to 19 years | 0 (0.0%) | 0 (0.0%) |
| 20 to 34 years | 14 (100.0%) | 0 (0.0%) |
| 35 to 50 years | 0 (0.0%) | 0 (0.0%) |
| Total | 14 (100.0%) | 0 (0.0%) |
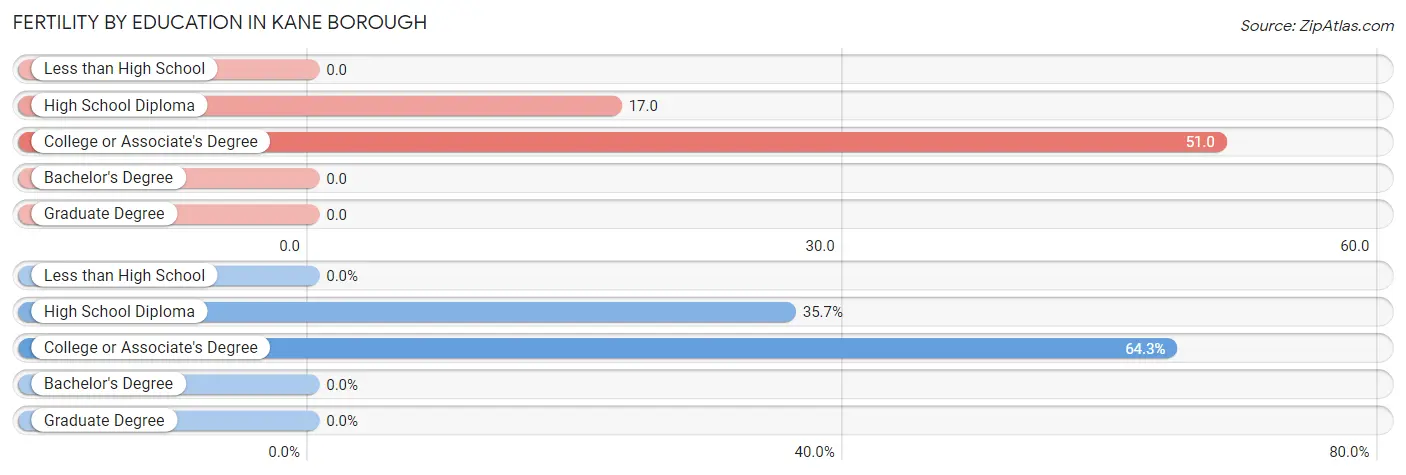
Fertility by Education in Kane borough
| Educational Attainment | Women with Births | Births / 1,000 Women |
| Less than High School | 0 (0.0%) | 0.0 |
| High School Diploma | 5 (35.7%) | 17.0 |
| College or Associate's Degree | 9 (64.3%) | 51.0 |
| Bachelor's Degree | 0 (0.0%) | 0.0 |
| Graduate Degree | 0 (0.0%) | 0.0 |
| Total | 14 (100.0%) | 18.0 |
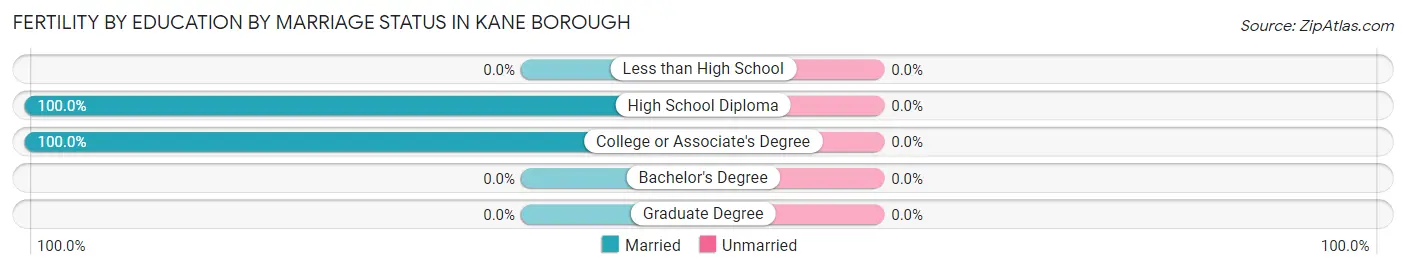
Fertility by Education by Marriage Status in Kane borough
| Educational Attainment | Married | Unmarried |
| Less than High School | 0 (0.0%) | 0 (0.0%) |
| High School Diploma | 5 (100.0%) | 0 (0.0%) |
| College or Associate's Degree | 9 (100.0%) | 0 (0.0%) |
| Bachelor's Degree | 0 (0.0%) | 0 (0.0%) |
| Graduate Degree | 0 (0.0%) | 0 (0.0%) |
| Total | 14 (100.0%) | 0 (0.0%) |
Employment Characteristics in Kane borough
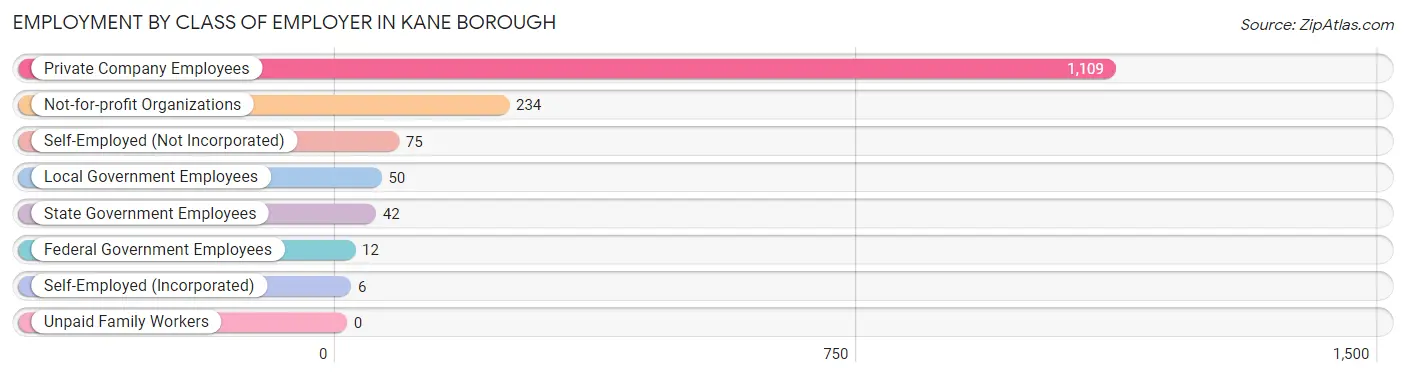
Employment by Class of Employer in Kane borough
Among the 1,528 employed individuals in Kane borough, private company employees (1,109 | 72.6%), not-for-profit organizations (234 | 15.3%), and self-employed (not incorporated) (75 | 4.9%) make up the most common classes of employment.
| Employer Class | # Employees | % Employees |
| Private Company Employees | 1,109 | 72.6% |
| Self-Employed (Incorporated) | 6 | 0.4% |
| Self-Employed (Not Incorporated) | 75 | 4.9% |
| Not-for-profit Organizations | 234 | 15.3% |
| Local Government Employees | 50 | 3.3% |
| State Government Employees | 42 | 2.8% |
| Federal Government Employees | 12 | 0.8% |
| Unpaid Family Workers | 0 | 0.0% |
| Total | 1,528 | 100.0% |
Employment Status by Age in Kane borough
According to the labor force statistics for Kane borough, out of the total population over 16 years of age (2,893), 58.1% or 1,681 individuals are in the labor force, with 7.9% or 133 of them unemployed. The age group with the highest labor force participation rate is 20 to 24 years, with 94.0% or 203 individuals in the labor force. Within the labor force, the 35 to 44 years age range has the highest percentage of unemployed individuals, with 12.6% or 43 of them being unemployed.
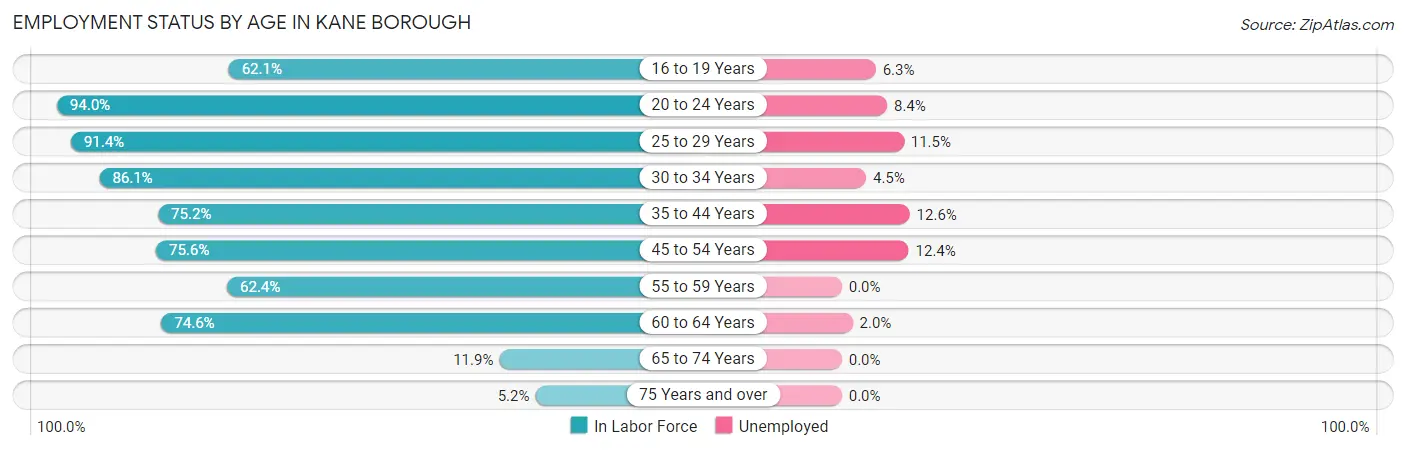
| Age Bracket | In Labor Force | Unemployed |
| 16 to 19 Years | 126 (62.1%) | 8 (6.3%) |
| 20 to 24 Years | 203 (94.0%) | 17 (8.4%) |
| 25 to 29 Years | 139 (91.4%) | 16 (11.5%) |
| 30 to 34 Years | 199 (86.1%) | 9 (4.5%) |
| 35 to 44 Years | 342 (75.2%) | 43 (12.6%) |
| 45 to 54 Years | 291 (75.6%) | 36 (12.4%) |
| 55 to 59 Years | 111 (62.4%) | 0 (0.0%) |
| 60 to 64 Years | 203 (74.6%) | 4 (2.0%) |
| 65 to 74 Years | 47 (11.9%) | 0 (0.0%) |
| 75 Years and over | 21 (5.2%) | 0 (0.0%) |
| Total | 1,681 (58.1%) | 133 (7.9%) |
Employment Status by Educational Attainment in Kane borough
According to labor force statistics for Kane borough, 76.8% of individuals (1,285) out of the total population between 25 and 64 years of age (1,673) are in the labor force, with 8.4% or 108 of them being unemployed. The group with the highest labor force participation rate are those with the educational attainment of bachelor's degree or higher, with 92.8% or 320 individuals in the labor force. Within the labor force, individuals with less than high school education have the highest percentage of unemployment, with 29.3% or 17 of them being unemployed.
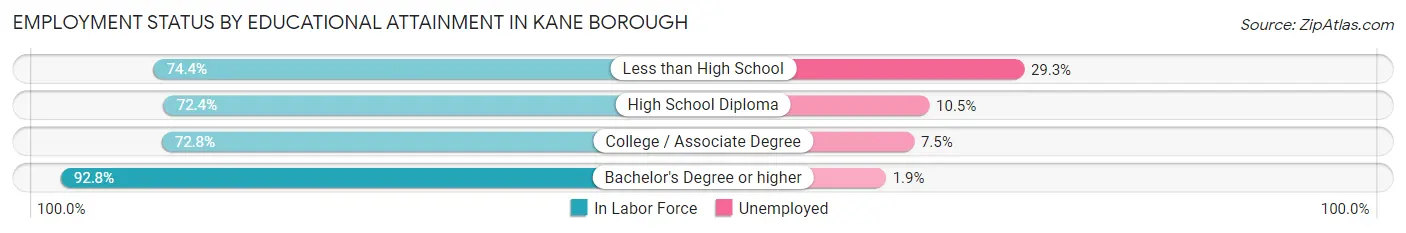
| Educational Attainment | In Labor Force | Unemployed |
| Less than High School | 58 (74.4%) | 23 (29.3%) |
| High School Diploma | 562 (72.4%) | 81 (10.5%) |
| College / Associate Degree | 345 (72.8%) | 36 (7.5%) |
| Bachelor's Degree or higher | 320 (92.8%) | 7 (1.9%) |
| Total | 1,285 (76.8%) | 141 (8.4%) |
Employment Occupations by Sex in Kane borough
Management, Business, Science and Arts Occupations
The most common Management, Business, Science and Arts occupations in Kane borough are Community & Social Service (213 | 13.8%), Education Instruction & Library (119 | 7.7%), Education, Arts & Media (91 | 5.9%), Health Diagnosing & Treating (78 | 5.0%), and Management (57 | 3.7%).
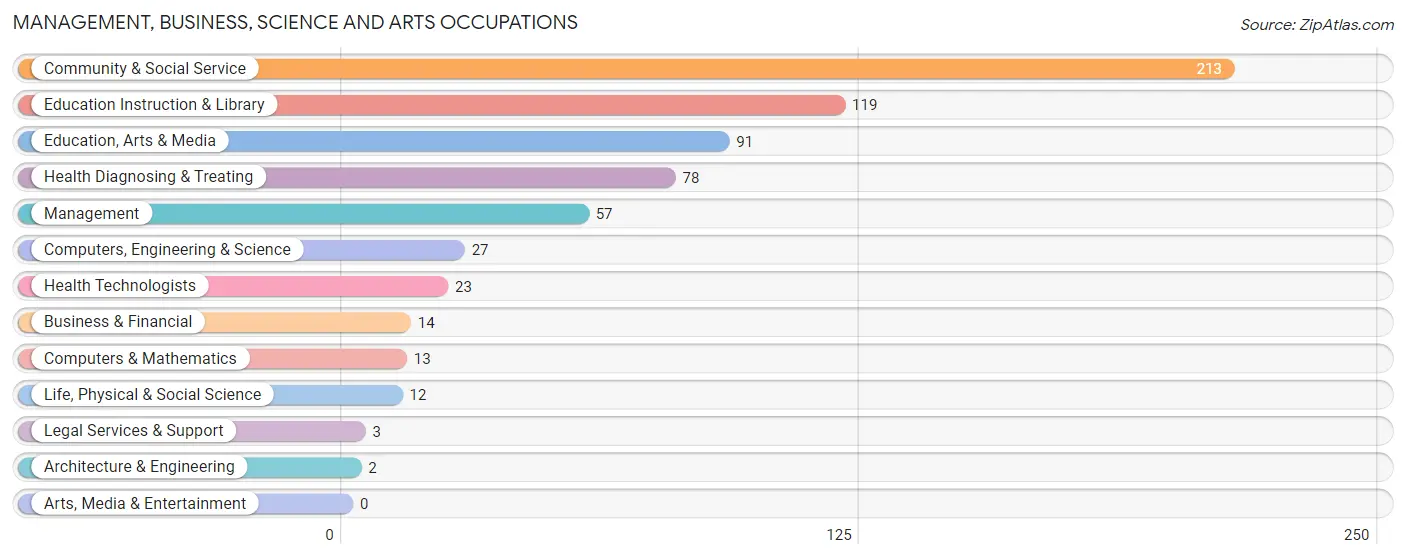
Management, Business, Science and Arts Occupations by Sex
Within the Management, Business, Science and Arts occupations in Kane borough, the most male-oriented occupations are Computers, Engineering & Science (100.0%), Computers & Mathematics (100.0%), and Architecture & Engineering (100.0%), while the most female-oriented occupations are Business & Financial (100.0%), Legal Services & Support (100.0%), and Health Technologists (100.0%).
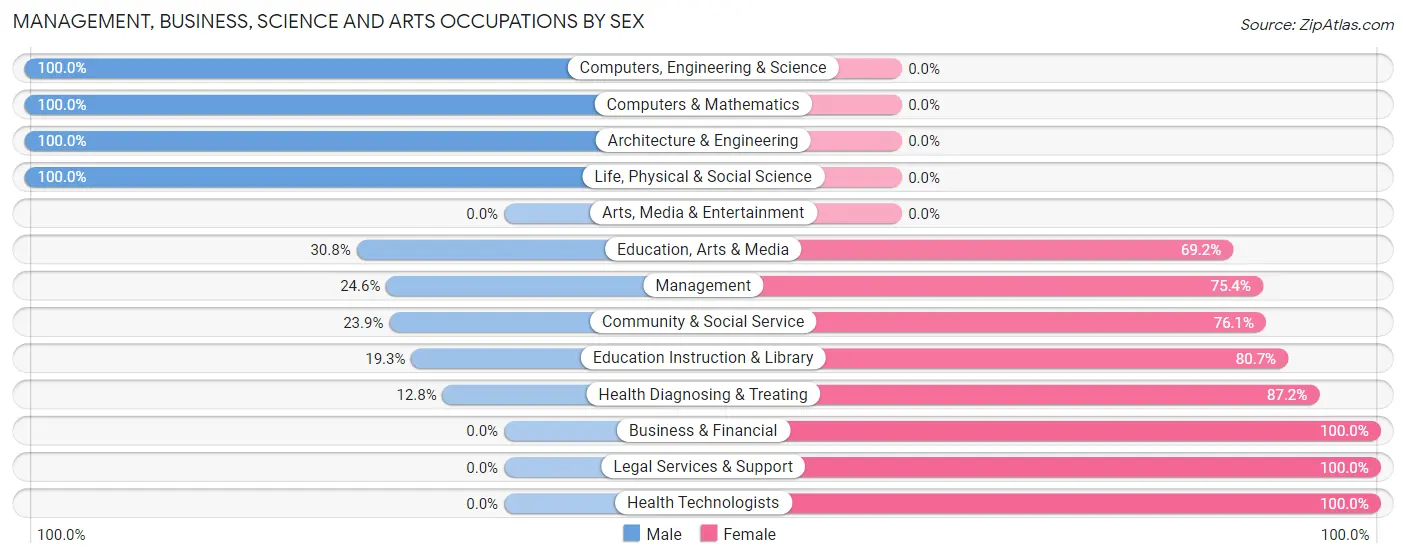
| Occupation | Male | Female |
| Management | 14 (24.6%) | 43 (75.4%) |
| Business & Financial | 0 (0.0%) | 14 (100.0%) |
| Computers, Engineering & Science | 27 (100.0%) | 0 (0.0%) |
| Computers & Mathematics | 13 (100.0%) | 0 (0.0%) |
| Architecture & Engineering | 2 (100.0%) | 0 (0.0%) |
| Life, Physical & Social Science | 12 (100.0%) | 0 (0.0%) |
| Community & Social Service | 51 (23.9%) | 162 (76.1%) |
| Education, Arts & Media | 28 (30.8%) | 63 (69.2%) |
| Legal Services & Support | 0 (0.0%) | 3 (100.0%) |
| Education Instruction & Library | 23 (19.3%) | 96 (80.7%) |
| Arts, Media & Entertainment | 0 (0.0%) | 0 (0.0%) |
| Health Diagnosing & Treating | 10 (12.8%) | 68 (87.2%) |
| Health Technologists | 0 (0.0%) | 23 (100.0%) |
| Total (Category) | 102 (26.2%) | 287 (73.8%) |
| Total (Overall) | 754 (48.7%) | 795 (51.3%) |
Services Occupations
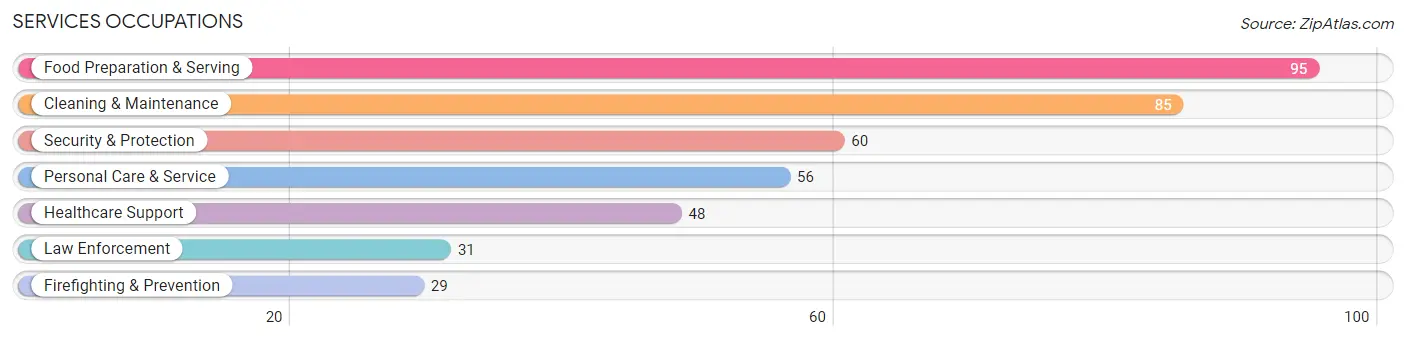
The most common Services occupations in Kane borough are Food Preparation & Serving (95 | 6.1%), Cleaning & Maintenance (85 | 5.5%), Security & Protection (60 | 3.9%), Personal Care & Service (56 | 3.6%), and Healthcare Support (48 | 3.1%).
Services Occupations by Sex
Within the Services occupations in Kane borough, the most male-oriented occupations are Law Enforcement (54.8%), Food Preparation & Serving (29.5%), and Security & Protection (28.3%), while the most female-oriented occupations are Firefighting & Prevention (100.0%), Personal Care & Service (80.4%), and Cleaning & Maintenance (80.0%).
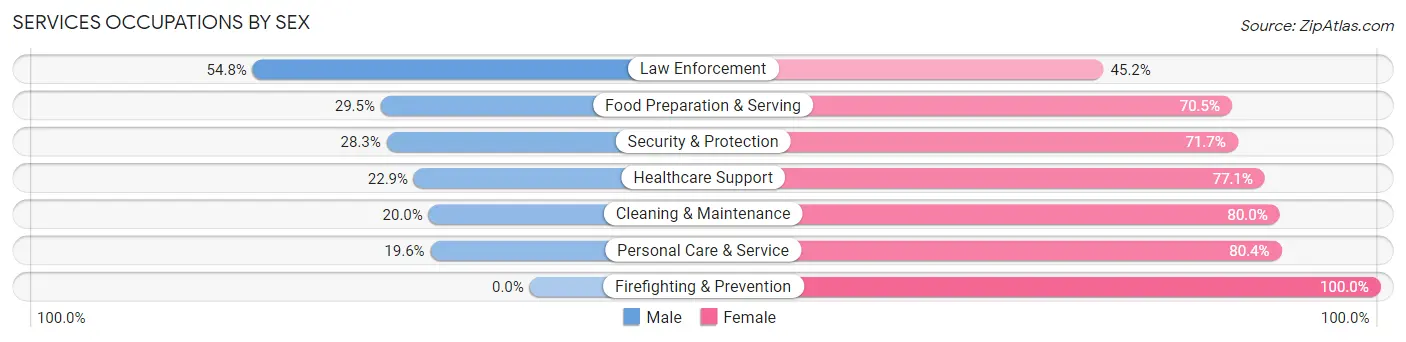
| Occupation | Male | Female |
| Healthcare Support | 11 (22.9%) | 37 (77.1%) |
| Security & Protection | 17 (28.3%) | 43 (71.7%) |
| Firefighting & Prevention | 0 (0.0%) | 29 (100.0%) |
| Law Enforcement | 17 (54.8%) | 14 (45.2%) |
| Food Preparation & Serving | 28 (29.5%) | 67 (70.5%) |
| Cleaning & Maintenance | 17 (20.0%) | 68 (80.0%) |
| Personal Care & Service | 11 (19.6%) | 45 (80.4%) |
| Total (Category) | 84 (24.4%) | 260 (75.6%) |
| Total (Overall) | 754 (48.7%) | 795 (51.3%) |
Sales and Office Occupations
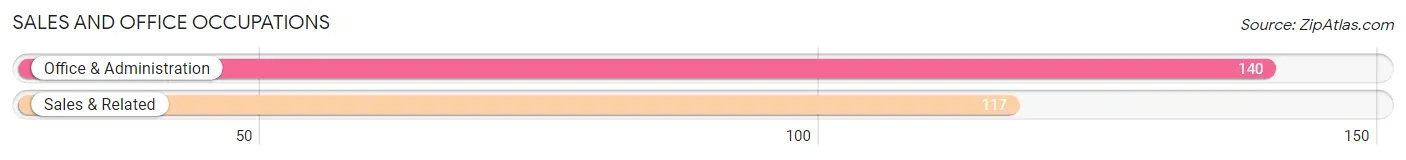
The most common Sales and Office occupations in Kane borough are Office & Administration (140 | 9.0%), and Sales & Related (117 | 7.5%).
Sales and Office Occupations by Sex
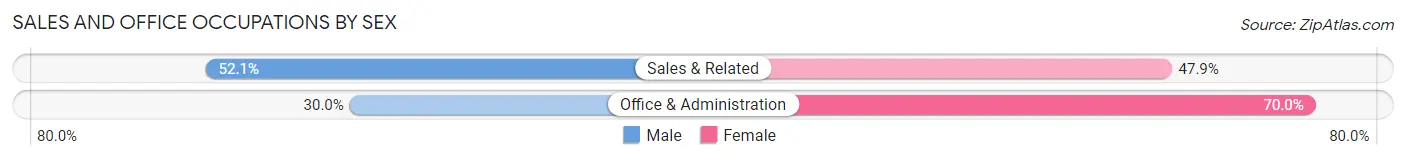
| Occupation | Male | Female |
| Sales & Related | 61 (52.1%) | 56 (47.9%) |
| Office & Administration | 42 (30.0%) | 98 (70.0%) |
| Total (Category) | 103 (40.1%) | 154 (59.9%) |
| Total (Overall) | 754 (48.7%) | 795 (51.3%) |
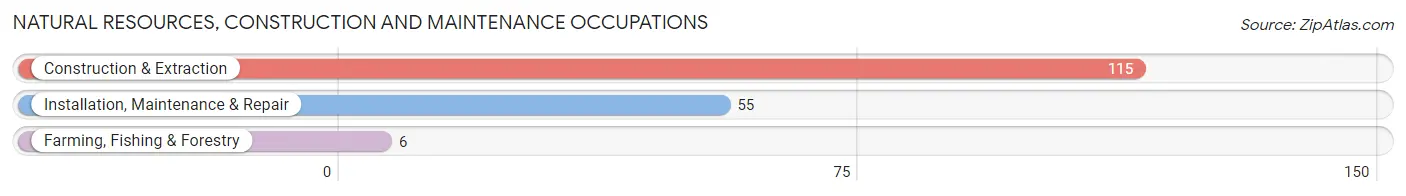
Natural Resources, Construction and Maintenance Occupations
The most common Natural Resources, Construction and Maintenance occupations in Kane borough are Construction & Extraction (115 | 7.4%), Installation, Maintenance & Repair (55 | 3.5%), and Farming, Fishing & Forestry (6 | 0.4%).
Natural Resources, Construction and Maintenance Occupations by Sex
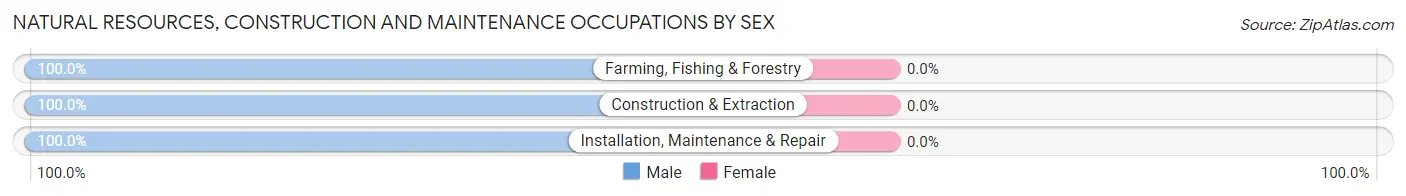
| Occupation | Male | Female |
| Farming, Fishing & Forestry | 6 (100.0%) | 0 (0.0%) |
| Construction & Extraction | 115 (100.0%) | 0 (0.0%) |
| Installation, Maintenance & Repair | 55 (100.0%) | 0 (0.0%) |
| Total (Category) | 176 (100.0%) | 0 (0.0%) |
| Total (Overall) | 754 (48.7%) | 795 (51.3%) |
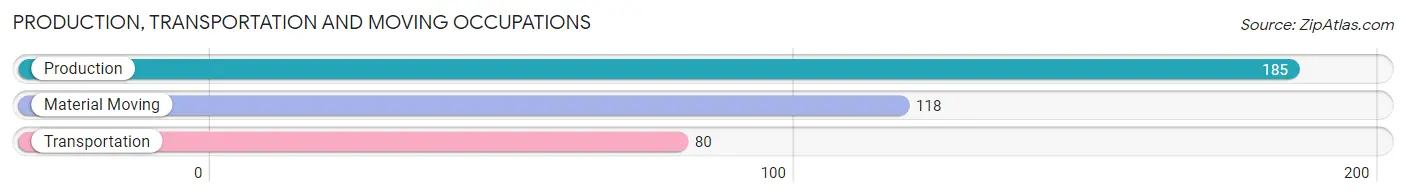
Production, Transportation and Moving Occupations
The most common Production, Transportation and Moving occupations in Kane borough are Production (185 | 11.9%), Material Moving (118 | 7.6%), and Transportation (80 | 5.2%).
Production, Transportation and Moving Occupations by Sex
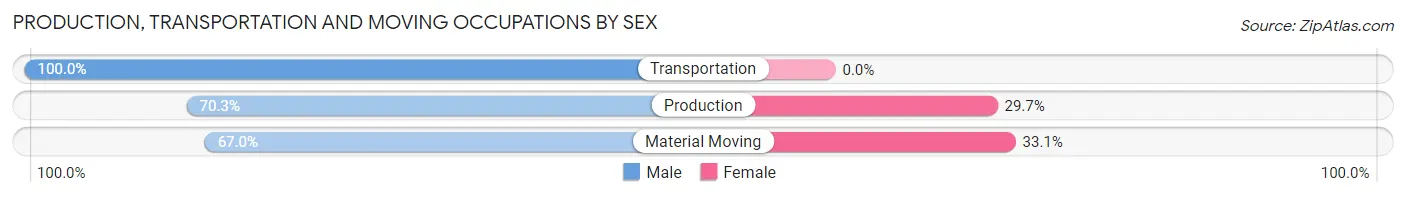
| Occupation | Male | Female |
| Production | 130 (70.3%) | 55 (29.7%) |
| Transportation | 80 (100.0%) | 0 (0.0%) |
| Material Moving | 79 (66.9%) | 39 (33.1%) |
| Total (Category) | 289 (75.5%) | 94 (24.5%) |
| Total (Overall) | 754 (48.7%) | 795 (51.3%) |
Employment Industries by Sex in Kane borough
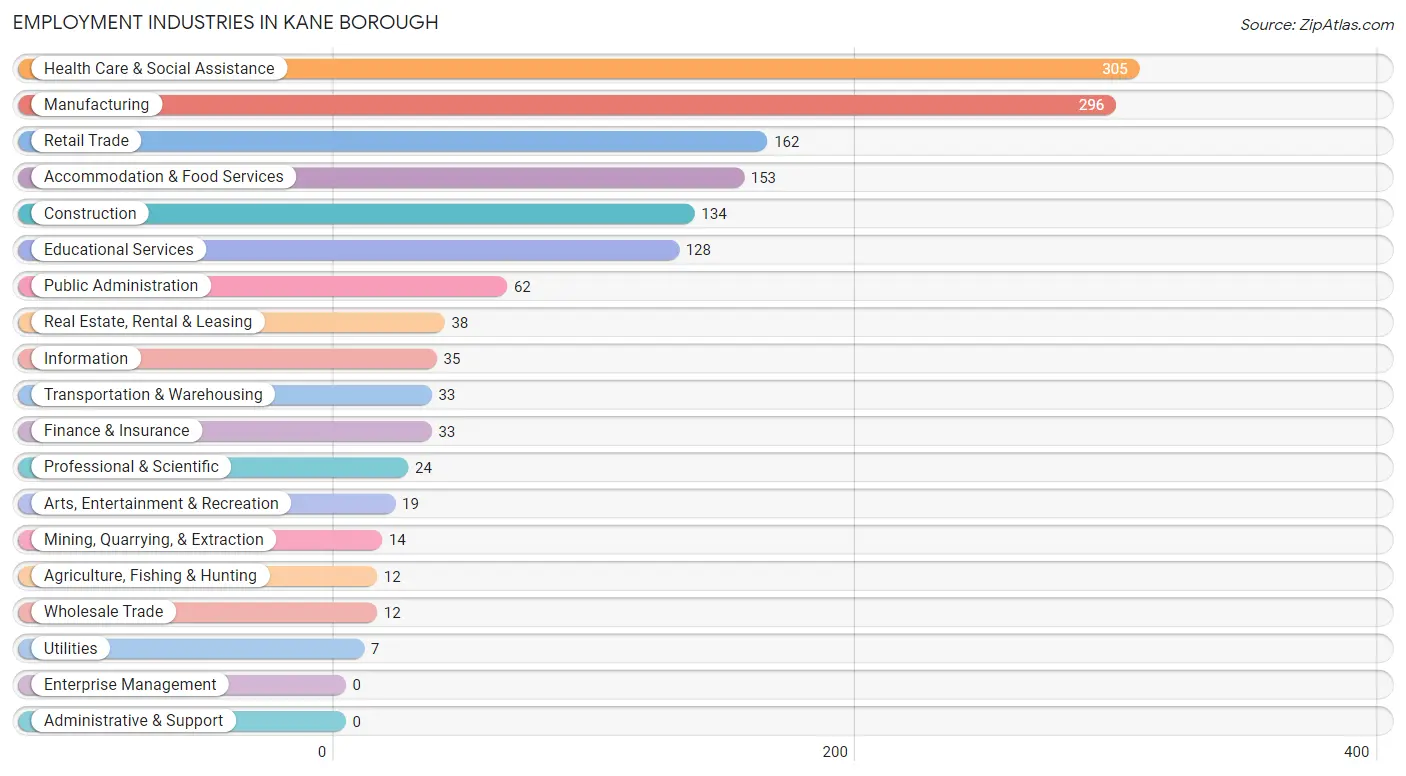
Employment Industries in Kane borough
The major employment industries in Kane borough include Health Care & Social Assistance (305 | 19.7%), Manufacturing (296 | 19.1%), Retail Trade (162 | 10.5%), Accommodation & Food Services (153 | 9.9%), and Construction (134 | 8.6%).
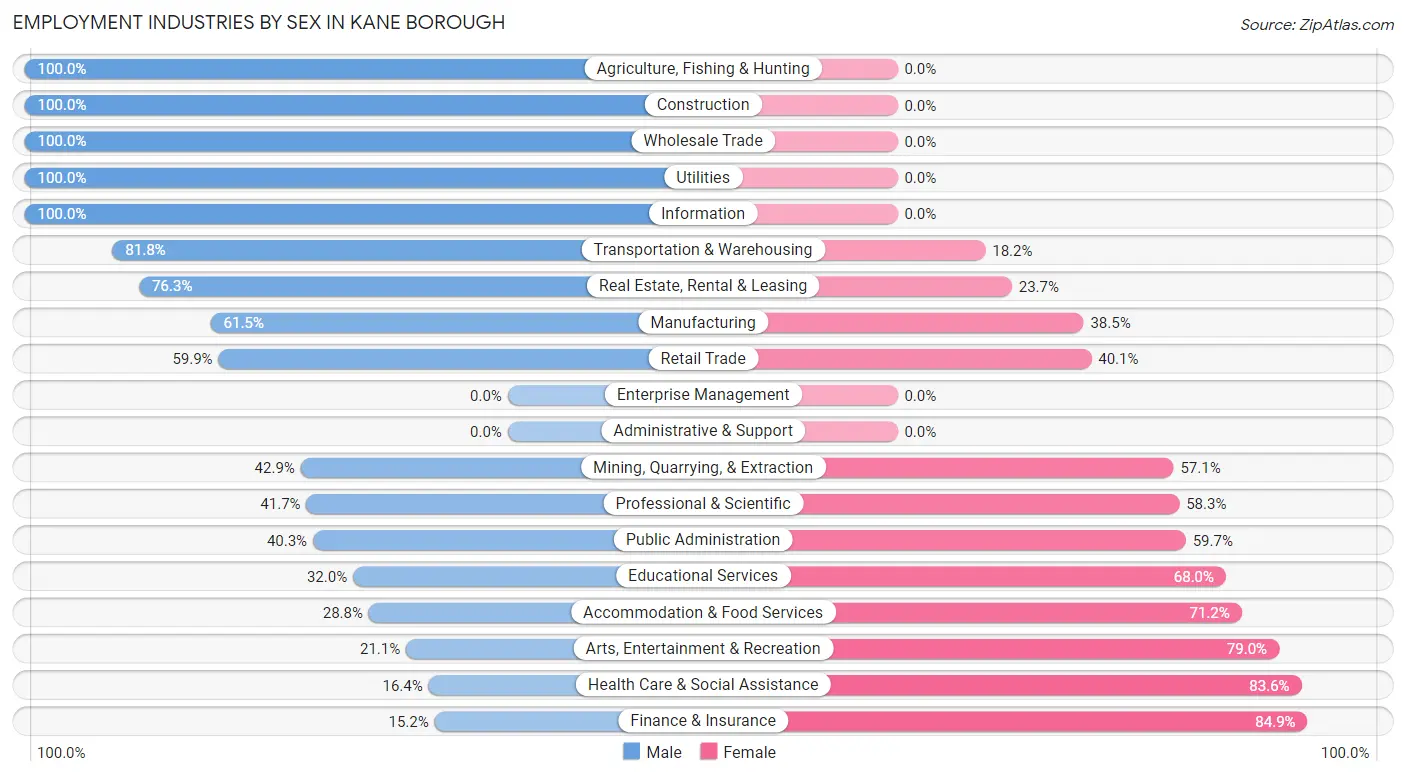
Employment Industries by Sex in Kane borough
The Kane borough industries that see more men than women are Agriculture, Fishing & Hunting (100.0%), Construction (100.0%), and Wholesale Trade (100.0%), whereas the industries that tend to have a higher number of women are Finance & Insurance (84.9%), Health Care & Social Assistance (83.6%), and Arts, Entertainment & Recreation (78.9%).
| Industry | Male | Female |
| Agriculture, Fishing & Hunting | 12 (100.0%) | 0 (0.0%) |
| Mining, Quarrying, & Extraction | 6 (42.9%) | 8 (57.1%) |
| Construction | 134 (100.0%) | 0 (0.0%) |
| Manufacturing | 182 (61.5%) | 114 (38.5%) |
| Wholesale Trade | 12 (100.0%) | 0 (0.0%) |
| Retail Trade | 97 (59.9%) | 65 (40.1%) |
| Transportation & Warehousing | 27 (81.8%) | 6 (18.2%) |
| Utilities | 7 (100.0%) | 0 (0.0%) |
| Information | 35 (100.0%) | 0 (0.0%) |
| Finance & Insurance | 5 (15.1%) | 28 (84.9%) |
| Real Estate, Rental & Leasing | 29 (76.3%) | 9 (23.7%) |
| Professional & Scientific | 10 (41.7%) | 14 (58.3%) |
| Enterprise Management | 0 (0.0%) | 0 (0.0%) |
| Administrative & Support | 0 (0.0%) | 0 (0.0%) |
| Educational Services | 41 (32.0%) | 87 (68.0%) |
| Health Care & Social Assistance | 50 (16.4%) | 255 (83.6%) |
| Arts, Entertainment & Recreation | 4 (21.0%) | 15 (78.9%) |
| Accommodation & Food Services | 44 (28.8%) | 109 (71.2%) |
| Public Administration | 25 (40.3%) | 37 (59.7%) |
| Total | 754 (48.7%) | 795 (51.3%) |
Education in Kane borough
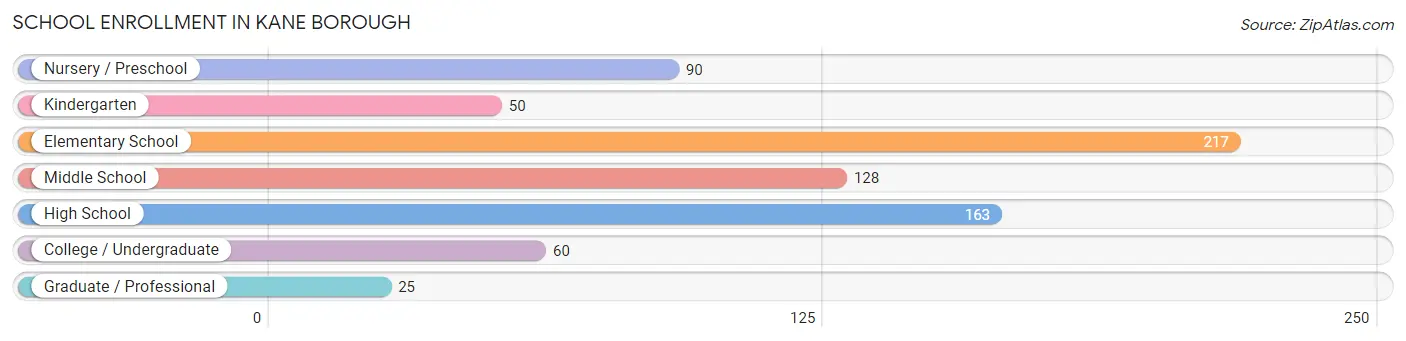
School Enrollment in Kane borough
The most common levels of schooling among the 733 students in Kane borough are elementary school (217 | 29.6%), high school (163 | 22.2%), and middle school (128 | 17.5%).
| School Level | # Students | % Students |
| Nursery / Preschool | 90 | 12.3% |
| Kindergarten | 50 | 6.8% |
| Elementary School | 217 | 29.6% |
| Middle School | 128 | 17.5% |
| High School | 163 | 22.2% |
| College / Undergraduate | 60 | 8.2% |
| Graduate / Professional | 25 | 3.4% |
| Total | 733 | 100.0% |
School Enrollment by Age by Funding Source in Kane borough
Out of a total of 733 students who are enrolled in schools in Kane borough, 59 (8.0%) attend a private institution, while the remaining 674 (92.0%) are enrolled in public schools. The age group of 25 to 34 year olds has the highest likelihood of being enrolled in private schools, with 14 (73.7% in the age bracket) enrolled. Conversely, the age group of 5 to 9 year old has the lowest likelihood of being enrolled in a private school, with 291 (100.0% in the age bracket) attending a public institution.
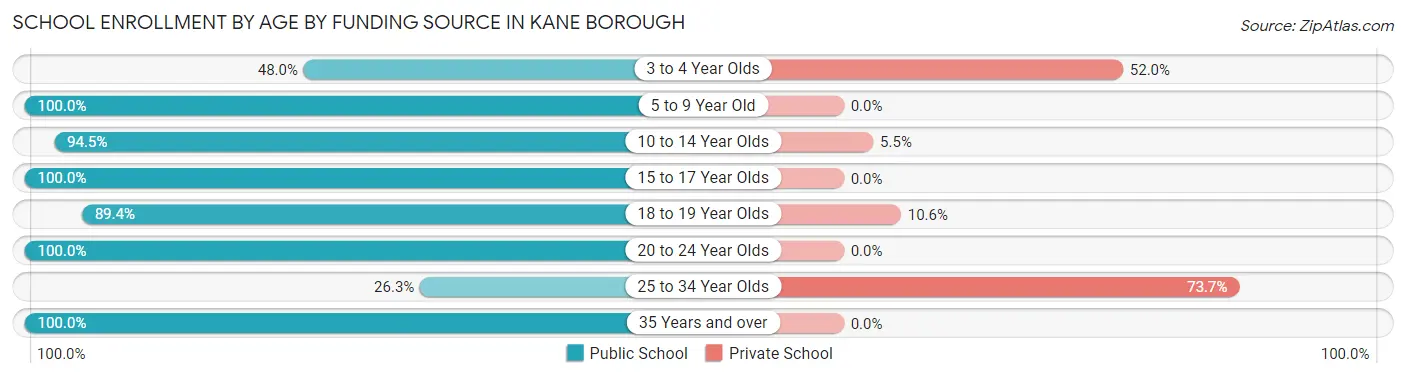
| Age Bracket | Public School | Private School |
| 3 to 4 Year Olds | 24 (48.0%) | 26 (52.0%) |
| 5 to 9 Year Old | 291 (100.0%) | 0 (0.0%) |
| 10 to 14 Year Olds | 155 (94.5%) | 9 (5.5%) |
| 15 to 17 Year Olds | 93 (100.0%) | 0 (0.0%) |
| 18 to 19 Year Olds | 84 (89.4%) | 10 (10.6%) |
| 20 to 24 Year Olds | 9 (100.0%) | 0 (0.0%) |
| 25 to 34 Year Olds | 5 (26.3%) | 14 (73.7%) |
| 35 Years and over | 13 (100.0%) | 0 (0.0%) |
| Total | 674 (92.0%) | 59 (8.0%) |
Educational Attainment by Field of Study in Kane borough
Education (139 | 29.3%), arts & humanities (75 | 15.8%), bio, nature & agricultural (55 | 11.6%), psychology (46 | 9.7%), and science & technology (39 | 8.2%) are the most common fields of study among 475 individuals in Kane borough who have obtained a bachelor's degree or higher.
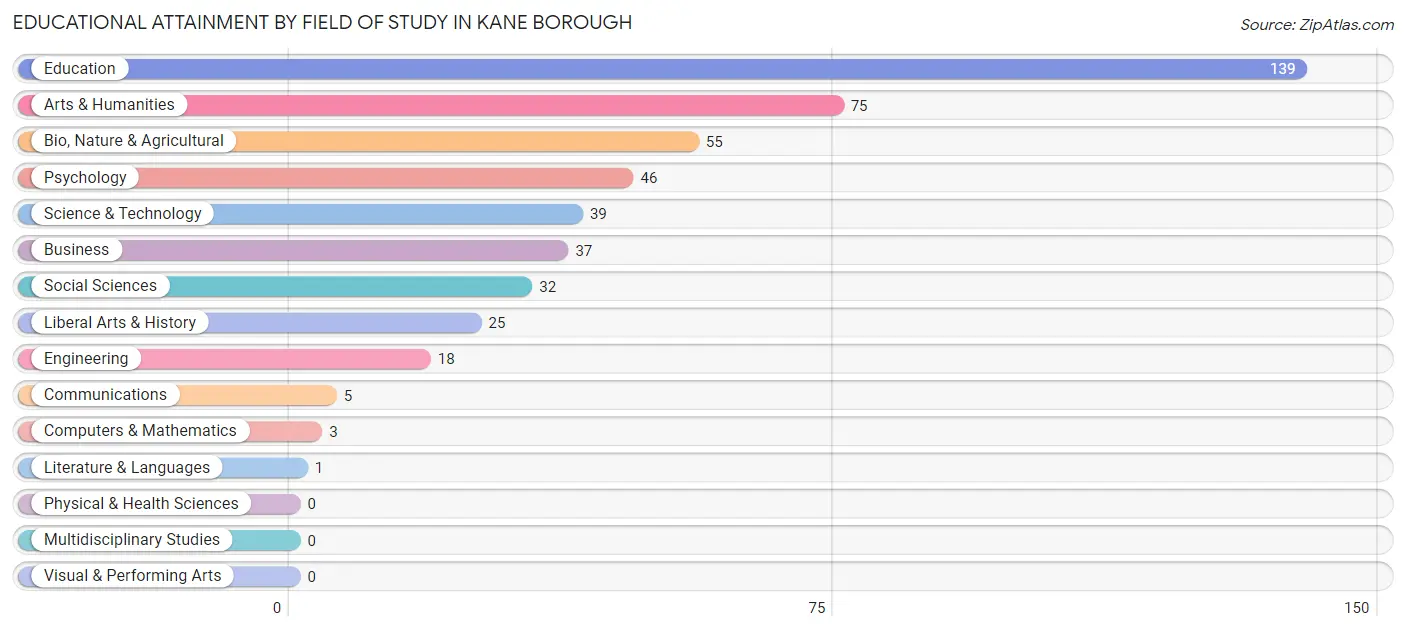
| Field of Study | # Graduates | % Graduates |
| Computers & Mathematics | 3 | 0.6% |
| Bio, Nature & Agricultural | 55 | 11.6% |
| Physical & Health Sciences | 0 | 0.0% |
| Psychology | 46 | 9.7% |
| Social Sciences | 32 | 6.7% |
| Engineering | 18 | 3.8% |
| Multidisciplinary Studies | 0 | 0.0% |
| Science & Technology | 39 | 8.2% |
| Business | 37 | 7.8% |
| Education | 139 | 29.3% |
| Literature & Languages | 1 | 0.2% |
| Liberal Arts & History | 25 | 5.3% |
| Visual & Performing Arts | 0 | 0.0% |
| Communications | 5 | 1.1% |
| Arts & Humanities | 75 | 15.8% |
| Total | 475 | 100.0% |
Transportation & Commute in Kane borough
Vehicle Availability by Sex in Kane borough
The most prevalent vehicle ownership categories in Kane borough are males with 2 vehicles (286, accounting for 38.0%) and females with 2 vehicles (284, making up 36.9%).
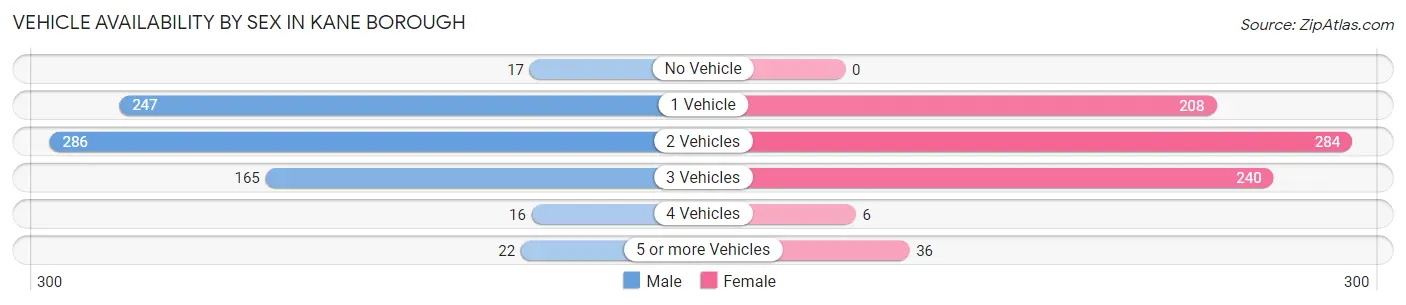
| Vehicles Available | Male | Female |
| No Vehicle | 17 (2.3%) | 0 (0.0%) |
| 1 Vehicle | 247 (32.8%) | 208 (26.9%) |
| 2 Vehicles | 286 (38.0%) | 284 (36.7%) |
| 3 Vehicles | 165 (21.9%) | 240 (31.0%) |
| 4 Vehicles | 16 (2.1%) | 6 (0.8%) |
| 5 or more Vehicles | 22 (2.9%) | 36 (4.6%) |
| Total | 753 (100.0%) | 774 (100.0%) |
Commute Time in Kane borough
The most frequently occuring commute durations in Kane borough are 5 to 9 minutes (384 commuters, 27.1%), 40 to 44 minutes (196 commuters, 13.9%), and 45 to 59 minutes (190 commuters, 13.4%).
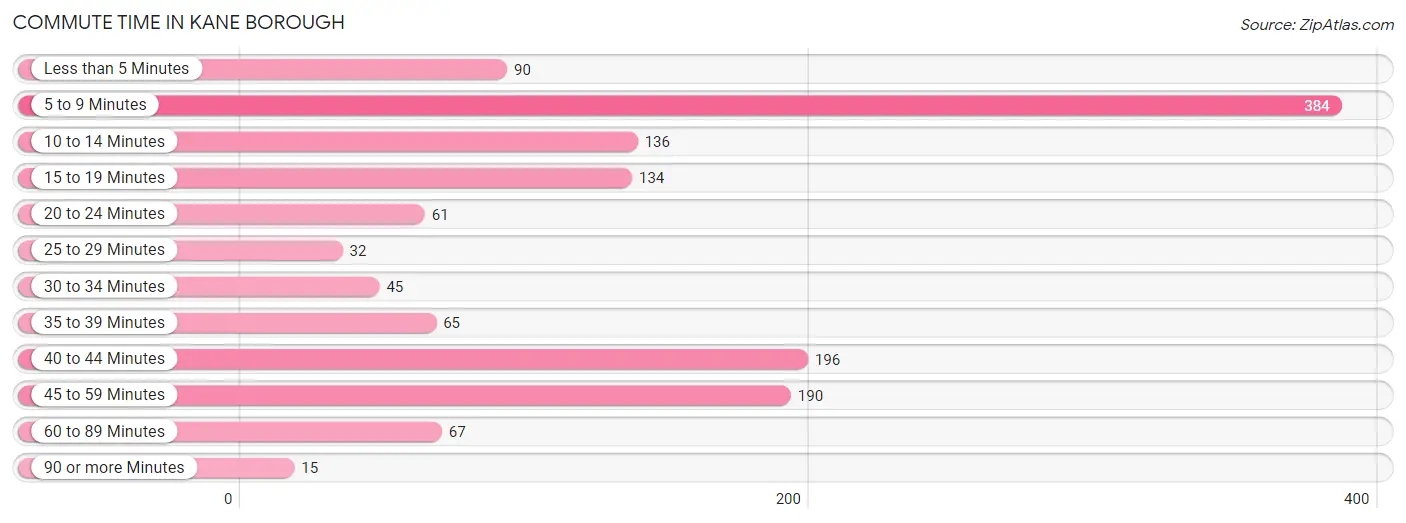
| Commute Time | # Commuters | % Commuters |
| Less than 5 Minutes | 90 | 6.4% |
| 5 to 9 Minutes | 384 | 27.1% |
| 10 to 14 Minutes | 136 | 9.6% |
| 15 to 19 Minutes | 134 | 9.5% |
| 20 to 24 Minutes | 61 | 4.3% |
| 25 to 29 Minutes | 32 | 2.3% |
| 30 to 34 Minutes | 45 | 3.2% |
| 35 to 39 Minutes | 65 | 4.6% |
| 40 to 44 Minutes | 196 | 13.9% |
| 45 to 59 Minutes | 190 | 13.4% |
| 60 to 89 Minutes | 67 | 4.7% |
| 90 or more Minutes | 15 | 1.1% |
Commute Time by Sex in Kane borough
The most common commute times in Kane borough are 5 to 9 minutes (209 commuters, 28.6%) for males and 5 to 9 minutes (175 commuters, 25.6%) for females.
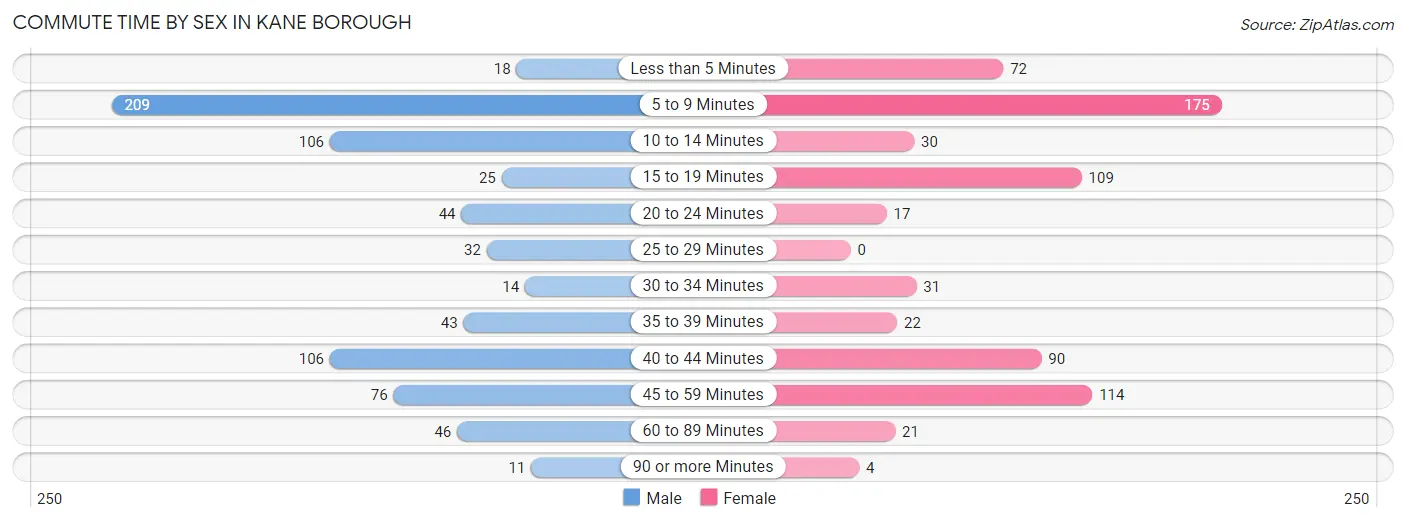
| Commute Time | Male | Female |
| Less than 5 Minutes | 18 (2.5%) | 72 (10.5%) |
| 5 to 9 Minutes | 209 (28.6%) | 175 (25.6%) |
| 10 to 14 Minutes | 106 (14.5%) | 30 (4.4%) |
| 15 to 19 Minutes | 25 (3.4%) | 109 (15.9%) |
| 20 to 24 Minutes | 44 (6.0%) | 17 (2.5%) |
| 25 to 29 Minutes | 32 (4.4%) | 0 (0.0%) |
| 30 to 34 Minutes | 14 (1.9%) | 31 (4.5%) |
| 35 to 39 Minutes | 43 (5.9%) | 22 (3.2%) |
| 40 to 44 Minutes | 106 (14.5%) | 90 (13.1%) |
| 45 to 59 Minutes | 76 (10.4%) | 114 (16.6%) |
| 60 to 89 Minutes | 46 (6.3%) | 21 (3.1%) |
| 90 or more Minutes | 11 (1.5%) | 4 (0.6%) |
Time of Departure to Work by Sex in Kane borough
The most frequent times of departure to work in Kane borough are 5:00 AM to 5:29 AM (139, 19.0%) for males and 7:00 AM to 7:29 AM (158, 23.1%) for females.
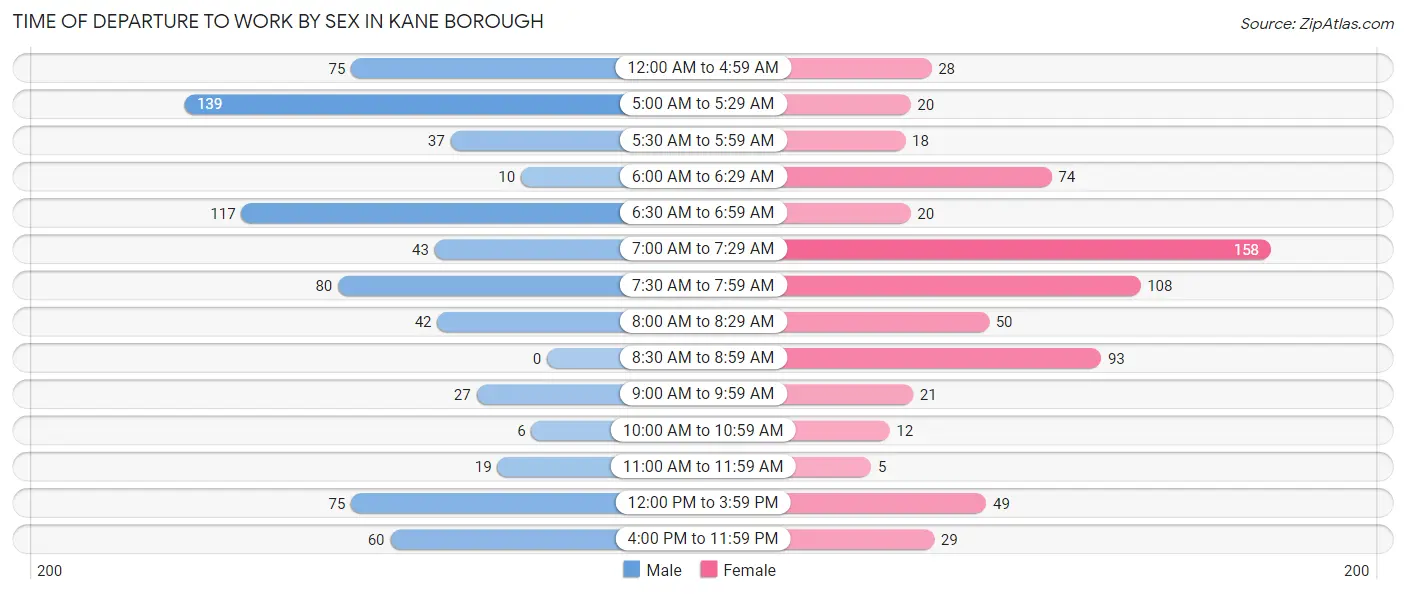
| Time of Departure | Male | Female |
| 12:00 AM to 4:59 AM | 75 (10.3%) | 28 (4.1%) |
| 5:00 AM to 5:29 AM | 139 (19.0%) | 20 (2.9%) |
| 5:30 AM to 5:59 AM | 37 (5.1%) | 18 (2.6%) |
| 6:00 AM to 6:29 AM | 10 (1.4%) | 74 (10.8%) |
| 6:30 AM to 6:59 AM | 117 (16.0%) | 20 (2.9%) |
| 7:00 AM to 7:29 AM | 43 (5.9%) | 158 (23.1%) |
| 7:30 AM to 7:59 AM | 80 (11.0%) | 108 (15.8%) |
| 8:00 AM to 8:29 AM | 42 (5.8%) | 50 (7.3%) |
| 8:30 AM to 8:59 AM | 0 (0.0%) | 93 (13.6%) |
| 9:00 AM to 9:59 AM | 27 (3.7%) | 21 (3.1%) |
| 10:00 AM to 10:59 AM | 6 (0.8%) | 12 (1.8%) |
| 11:00 AM to 11:59 AM | 19 (2.6%) | 5 (0.7%) |
| 12:00 PM to 3:59 PM | 75 (10.3%) | 49 (7.1%) |
| 4:00 PM to 11:59 PM | 60 (8.2%) | 29 (4.2%) |
| Total | 730 (100.0%) | 685 (100.0%) |
Housing Occupancy in Kane borough
Occupancy by Ownership in Kane borough
Of the total 1,452 dwellings in Kane borough, owner-occupied units account for 939 (64.7%), while renter-occupied units make up 513 (35.3%).
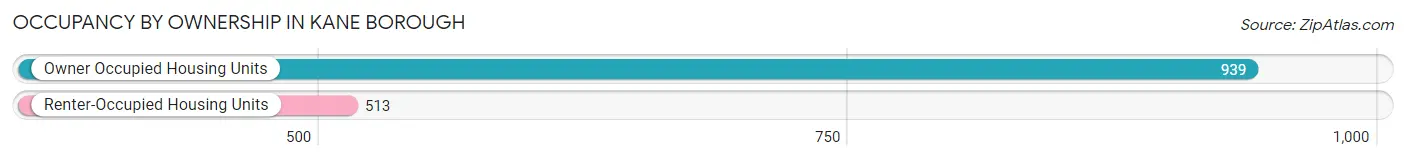
| Occupancy | # Housing Units | % Housing Units |
| Owner Occupied Housing Units | 939 | 64.7% |
| Renter-Occupied Housing Units | 513 | 35.3% |
| Total Occupied Housing Units | 1,452 | 100.0% |
Occupancy by Household Size in Kane borough
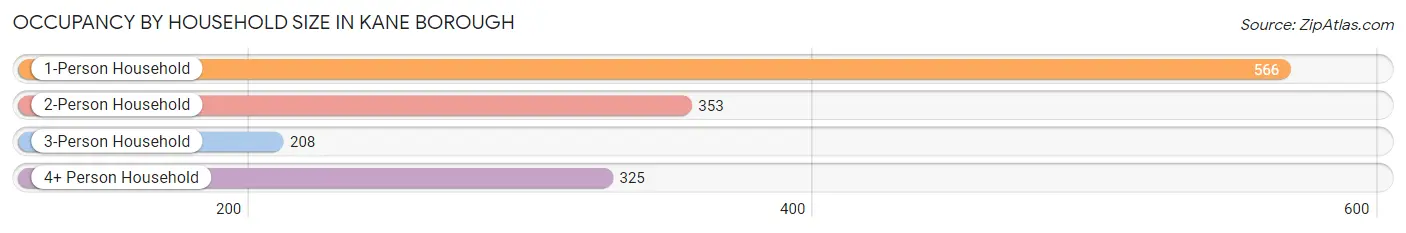
| Household Size | # Housing Units | % Housing Units |
| 1-Person Household | 566 | 39.0% |
| 2-Person Household | 353 | 24.3% |
| 3-Person Household | 208 | 14.3% |
| 4+ Person Household | 325 | 22.4% |
| Total Housing Units | 1,452 | 100.0% |
Occupancy by Ownership by Household Size in Kane borough
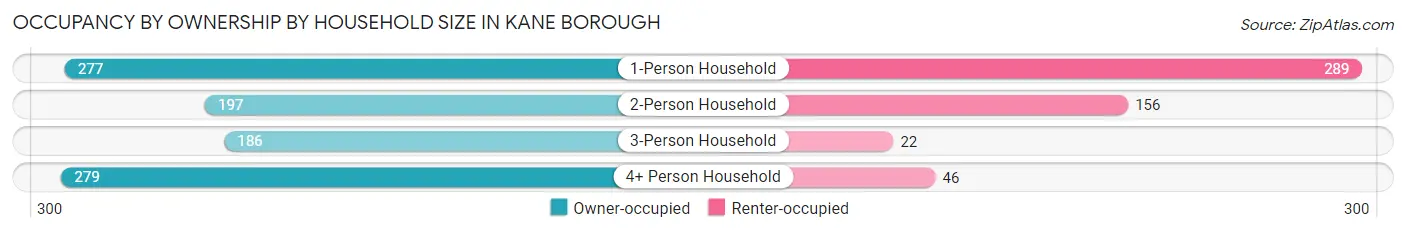
| Household Size | Owner-occupied | Renter-occupied |
| 1-Person Household | 277 (48.9%) | 289 (51.1%) |
| 2-Person Household | 197 (55.8%) | 156 (44.2%) |
| 3-Person Household | 186 (89.4%) | 22 (10.6%) |
| 4+ Person Household | 279 (85.9%) | 46 (14.1%) |
| Total Housing Units | 939 (64.7%) | 513 (35.3%) |
Occupancy by Educational Attainment in Kane borough
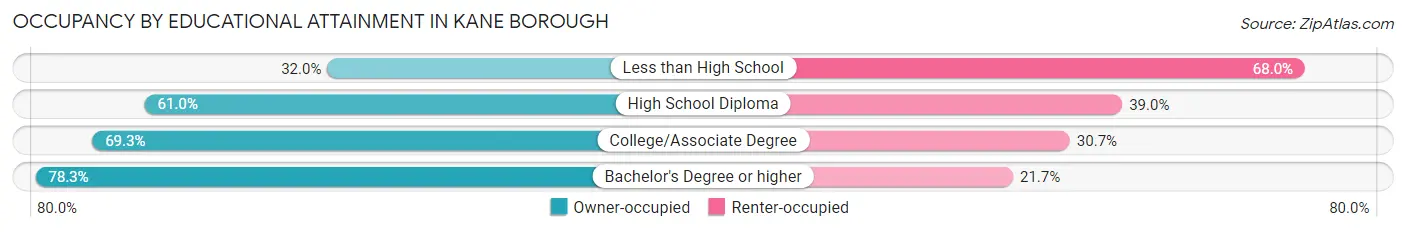
| Household Size | Owner-occupied | Renter-occupied |
| Less than High School | 32 (32.0%) | 68 (68.0%) |
| High School Diploma | 403 (61.0%) | 258 (39.0%) |
| College/Associate Degree | 284 (69.3%) | 126 (30.7%) |
| Bachelor's Degree or higher | 220 (78.3%) | 61 (21.7%) |
Occupancy by Age of Householder in Kane borough
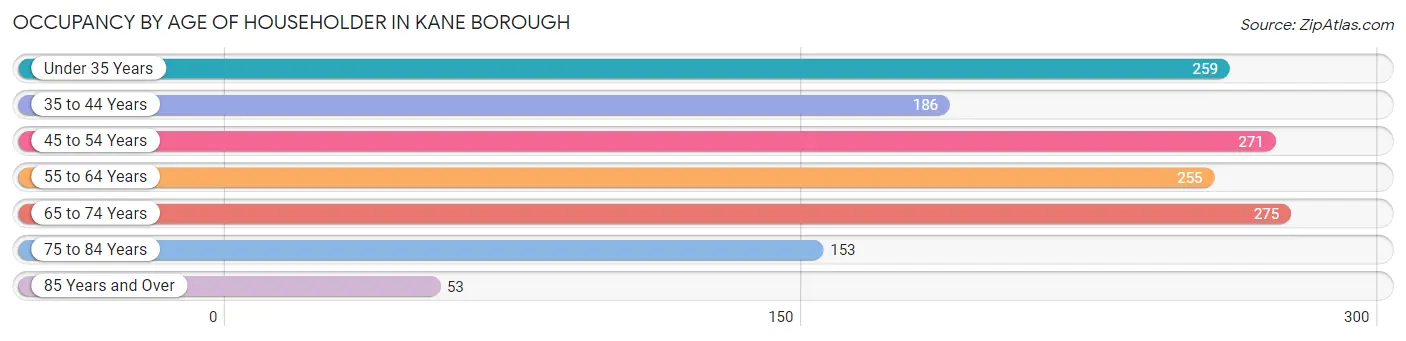
| Age Bracket | # Households | % Households |
| Under 35 Years | 259 | 17.8% |
| 35 to 44 Years | 186 | 12.8% |
| 45 to 54 Years | 271 | 18.7% |
| 55 to 64 Years | 255 | 17.6% |
| 65 to 74 Years | 275 | 18.9% |
| 75 to 84 Years | 153 | 10.5% |
| 85 Years and Over | 53 | 3.6% |
| Total | 1,452 | 100.0% |
Housing Finances in Kane borough
Median Income by Occupancy in Kane borough
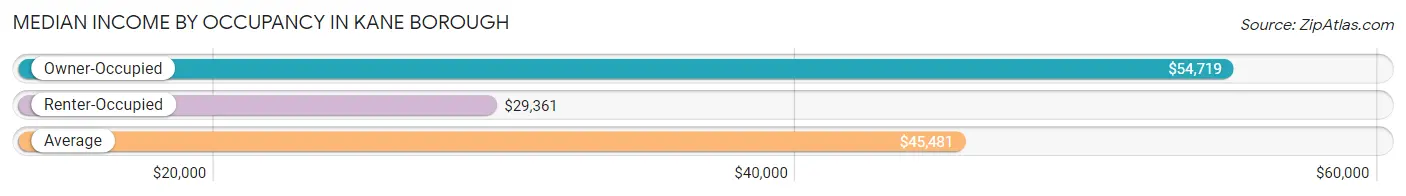
| Occupancy Type | # Households | Median Income |
| Owner-Occupied | 939 (64.7%) | $54,719 |
| Renter-Occupied | 513 (35.3%) | $29,361 |
| Average | 1,452 (100.0%) | $45,481 |
Occupancy by Householder Income Bracket in Kane borough
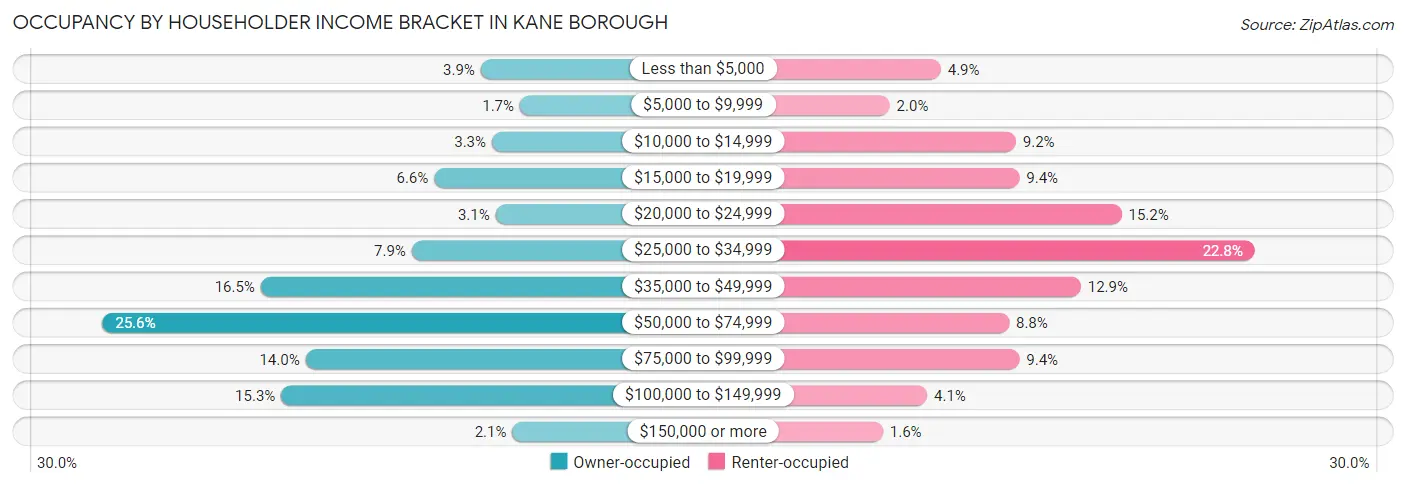
| Income Bracket | Owner-occupied | Renter-occupied |
| Less than $5,000 | 37 (3.9%) | 25 (4.9%) |
| $5,000 to $9,999 | 16 (1.7%) | 10 (1.9%) |
| $10,000 to $14,999 | 31 (3.3%) | 47 (9.2%) |
| $15,000 to $19,999 | 62 (6.6%) | 48 (9.4%) |
| $20,000 to $24,999 | 29 (3.1%) | 78 (15.2%) |
| $25,000 to $34,999 | 74 (7.9%) | 117 (22.8%) |
| $35,000 to $49,999 | 155 (16.5%) | 66 (12.9%) |
| $50,000 to $74,999 | 240 (25.6%) | 45 (8.8%) |
| $75,000 to $99,999 | 131 (14.0%) | 48 (9.4%) |
| $100,000 to $149,999 | 144 (15.3%) | 21 (4.1%) |
| $150,000 or more | 20 (2.1%) | 8 (1.6%) |
| Total | 939 (100.0%) | 513 (100.0%) |
Monthly Housing Cost Tiers in Kane borough
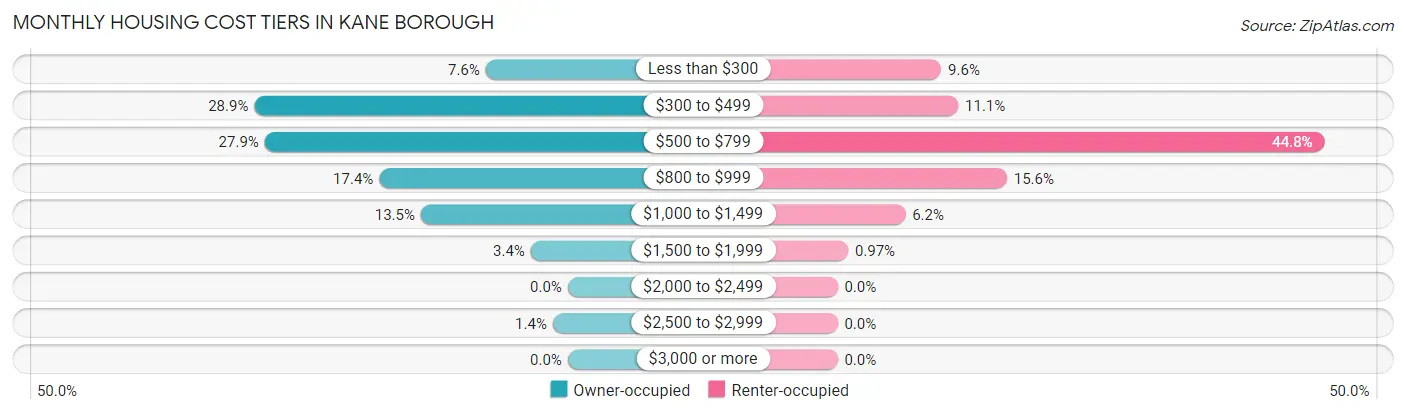
| Monthly Cost | Owner-occupied | Renter-occupied |
| Less than $300 | 71 (7.6%) | 49 (9.6%) |
| $300 to $499 | 271 (28.9%) | 57 (11.1%) |
| $500 to $799 | 262 (27.9%) | 230 (44.8%) |
| $800 to $999 | 163 (17.4%) | 80 (15.6%) |
| $1,000 to $1,499 | 127 (13.5%) | 32 (6.2%) |
| $1,500 to $1,999 | 32 (3.4%) | 5 (1.0%) |
| $2,000 to $2,499 | 0 (0.0%) | 0 (0.0%) |
| $2,500 to $2,999 | 13 (1.4%) | 0 (0.0%) |
| $3,000 or more | 0 (0.0%) | 0 (0.0%) |
| Total | 939 (100.0%) | 513 (100.0%) |
Physical Housing Characteristics in Kane borough
Housing Structures in Kane borough
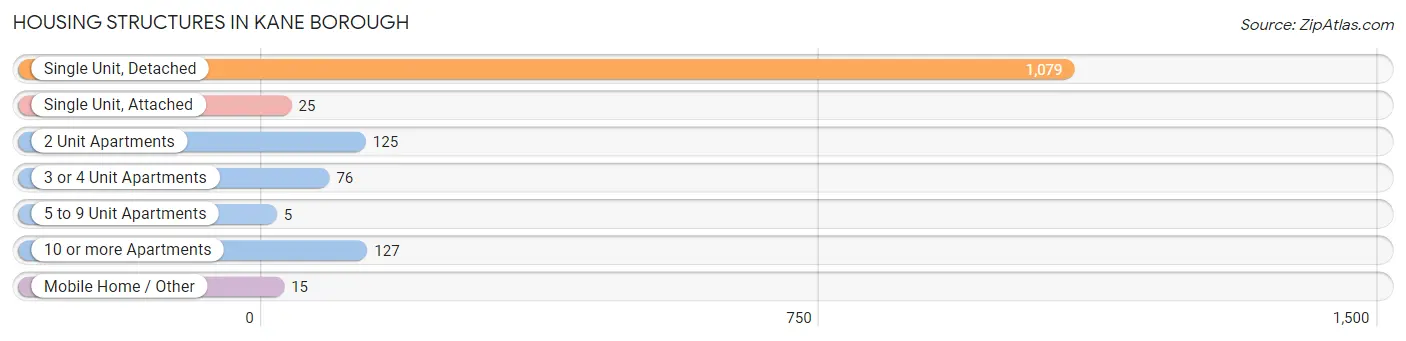
| Structure Type | # Housing Units | % Housing Units |
| Single Unit, Detached | 1,079 | 74.3% |
| Single Unit, Attached | 25 | 1.7% |
| 2 Unit Apartments | 125 | 8.6% |
| 3 or 4 Unit Apartments | 76 | 5.2% |
| 5 to 9 Unit Apartments | 5 | 0.3% |
| 10 or more Apartments | 127 | 8.7% |
| Mobile Home / Other | 15 | 1.0% |
| Total | 1,452 | 100.0% |
Housing Structures by Occupancy in Kane borough
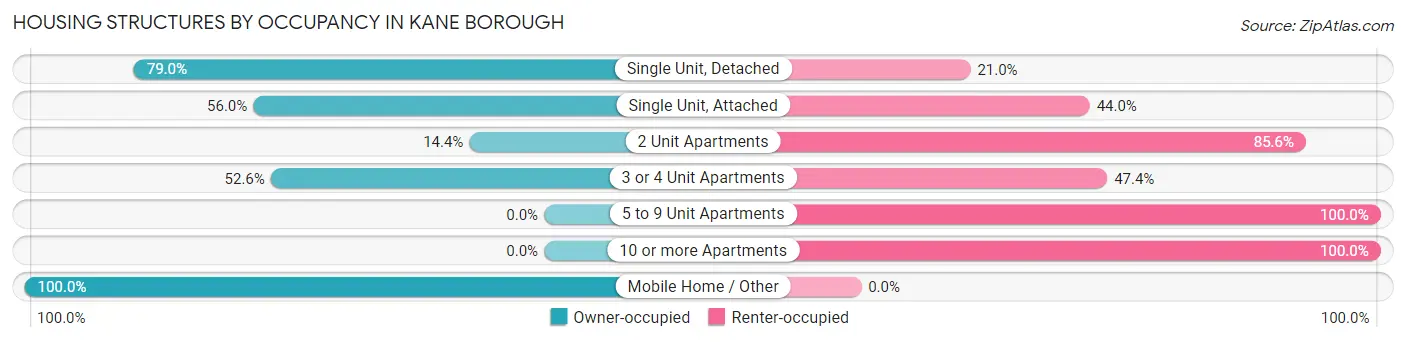
| Structure Type | Owner-occupied | Renter-occupied |
| Single Unit, Detached | 852 (79.0%) | 227 (21.0%) |
| Single Unit, Attached | 14 (56.0%) | 11 (44.0%) |
| 2 Unit Apartments | 18 (14.4%) | 107 (85.6%) |
| 3 or 4 Unit Apartments | 40 (52.6%) | 36 (47.4%) |
| 5 to 9 Unit Apartments | 0 (0.0%) | 5 (100.0%) |
| 10 or more Apartments | 0 (0.0%) | 127 (100.0%) |
| Mobile Home / Other | 15 (100.0%) | 0 (0.0%) |
| Total | 939 (64.7%) | 513 (35.3%) |
Housing Structures by Number of Rooms in Kane borough
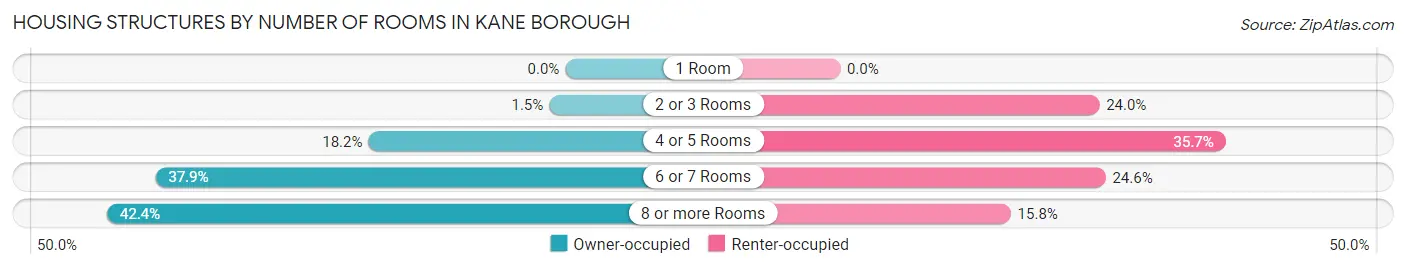
| Number of Rooms | Owner-occupied | Renter-occupied |
| 1 Room | 0 (0.0%) | 0 (0.0%) |
| 2 or 3 Rooms | 14 (1.5%) | 123 (24.0%) |
| 4 or 5 Rooms | 171 (18.2%) | 183 (35.7%) |
| 6 or 7 Rooms | 356 (37.9%) | 126 (24.6%) |
| 8 or more Rooms | 398 (42.4%) | 81 (15.8%) |
| Total | 939 (100.0%) | 513 (100.0%) |
Housing Structure by Heating Type in Kane borough
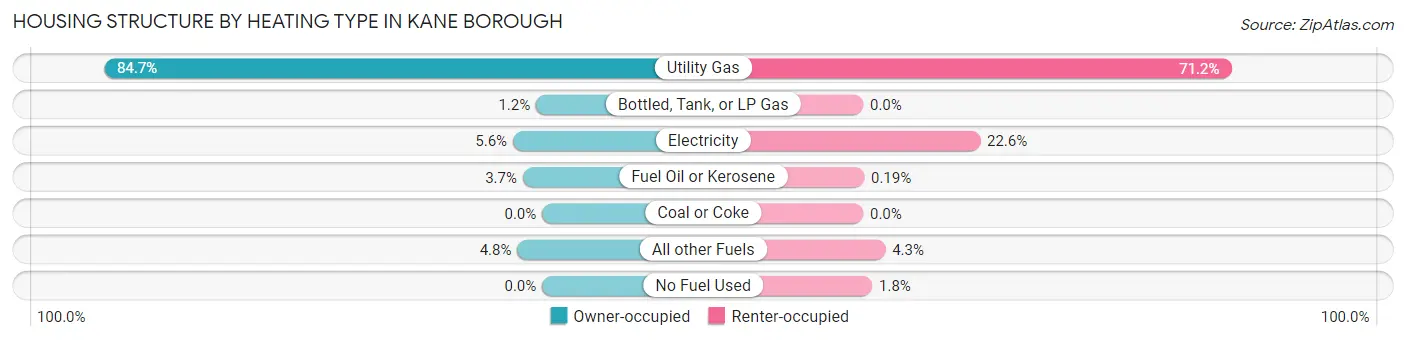
| Heating Type | Owner-occupied | Renter-occupied |
| Utility Gas | 795 (84.7%) | 365 (71.2%) |
| Bottled, Tank, or LP Gas | 11 (1.2%) | 0 (0.0%) |
| Electricity | 53 (5.6%) | 116 (22.6%) |
| Fuel Oil or Kerosene | 35 (3.7%) | 1 (0.2%) |
| Coal or Coke | 0 (0.0%) | 0 (0.0%) |
| All other Fuels | 45 (4.8%) | 22 (4.3%) |
| No Fuel Used | 0 (0.0%) | 9 (1.8%) |
| Total | 939 (100.0%) | 513 (100.0%) |
Household Vehicle Usage in Kane borough
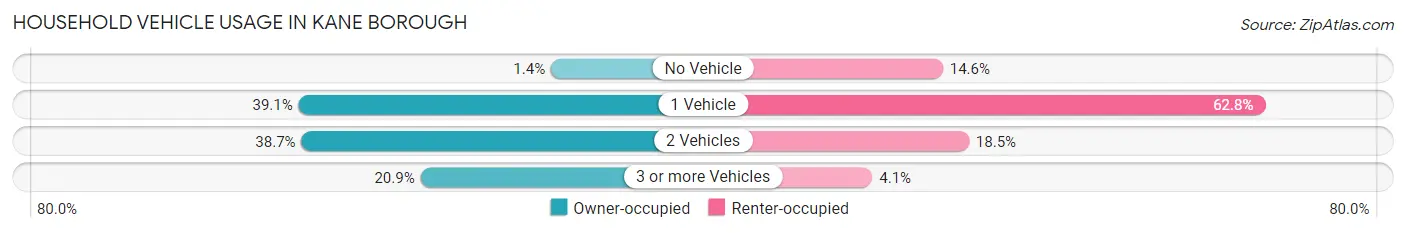
| Vehicles per Household | Owner-occupied | Renter-occupied |
| No Vehicle | 13 (1.4%) | 75 (14.6%) |
| 1 Vehicle | 367 (39.1%) | 322 (62.8%) |
| 2 Vehicles | 363 (38.7%) | 95 (18.5%) |
| 3 or more Vehicles | 196 (20.9%) | 21 (4.1%) |
| Total | 939 (100.0%) | 513 (100.0%) |
Real Estate & Mortgages in Kane borough
Real Estate and Mortgage Overview in Kane borough
| Characteristic | Without Mortgage | With Mortgage |
| Housing Units | 508 | 431 |
| Median Property Value | $64,100 | $59,900 |
| Median Household Income | $52,965 | $20 |
| Monthly Housing Costs | $457 | $0 |
| Real Estate Taxes | $1,339 | $35 |
Property Value by Mortgage Status in Kane borough
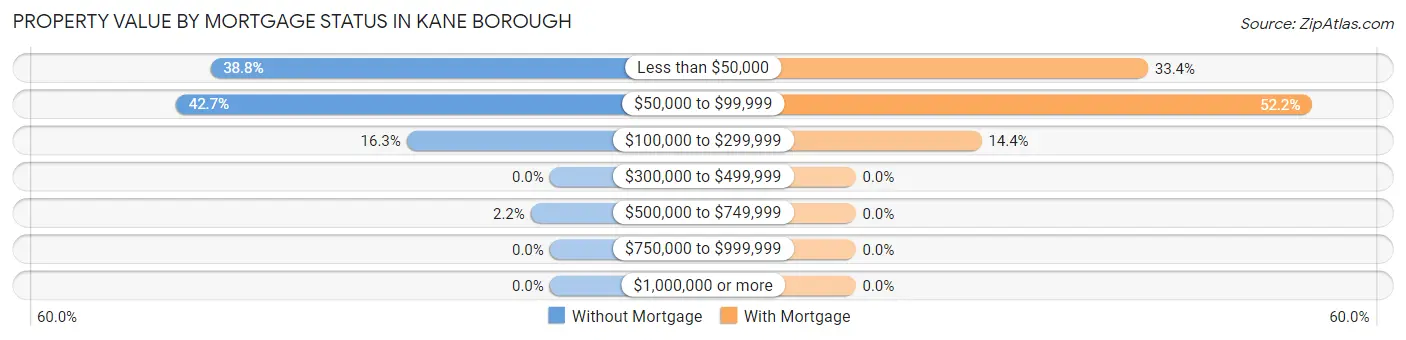
| Property Value | Without Mortgage | With Mortgage |
| Less than $50,000 | 197 (38.8%) | 144 (33.4%) |
| $50,000 to $99,999 | 217 (42.7%) | 225 (52.2%) |
| $100,000 to $299,999 | 83 (16.3%) | 62 (14.4%) |
| $300,000 to $499,999 | 0 (0.0%) | 0 (0.0%) |
| $500,000 to $749,999 | 11 (2.2%) | 0 (0.0%) |
| $750,000 to $999,999 | 0 (0.0%) | 0 (0.0%) |
| $1,000,000 or more | 0 (0.0%) | 0 (0.0%) |
| Total | 508 (100.0%) | 431 (100.0%) |
Household Income by Mortgage Status in Kane borough
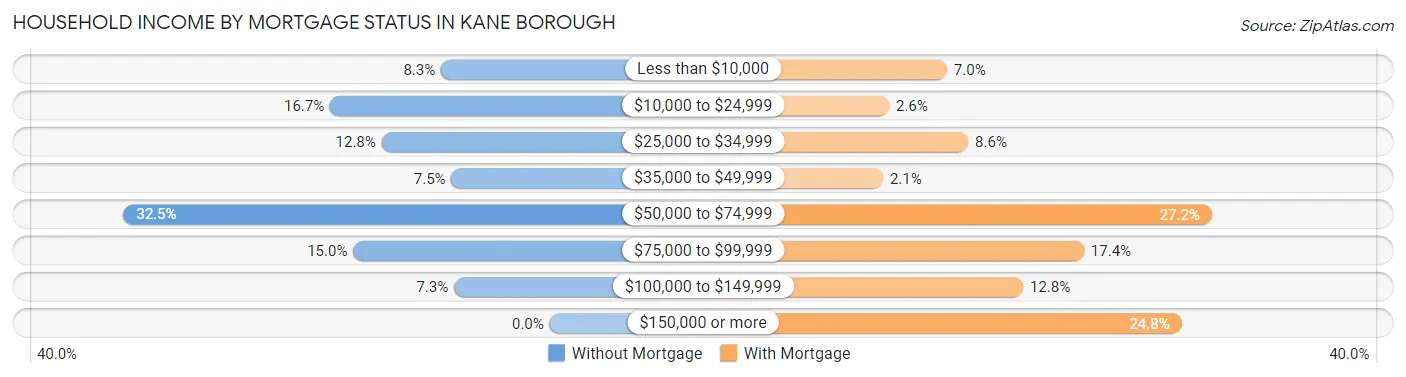
| Household Income | Without Mortgage | With Mortgage |
| Less than $10,000 | 42 (8.3%) | 30 (7.0%) |
| $10,000 to $24,999 | 85 (16.7%) | 11 (2.5%) |
| $25,000 to $34,999 | 65 (12.8%) | 37 (8.6%) |
| $35,000 to $49,999 | 38 (7.5%) | 9 (2.1%) |
| $50,000 to $74,999 | 165 (32.5%) | 117 (27.2%) |
| $75,000 to $99,999 | 76 (15.0%) | 75 (17.4%) |
| $100,000 to $149,999 | 37 (7.3%) | 55 (12.8%) |
| $150,000 or more | 0 (0.0%) | 107 (24.8%) |
| Total | 508 (100.0%) | 431 (100.0%) |
Property Value to Household Income Ratio in Kane borough
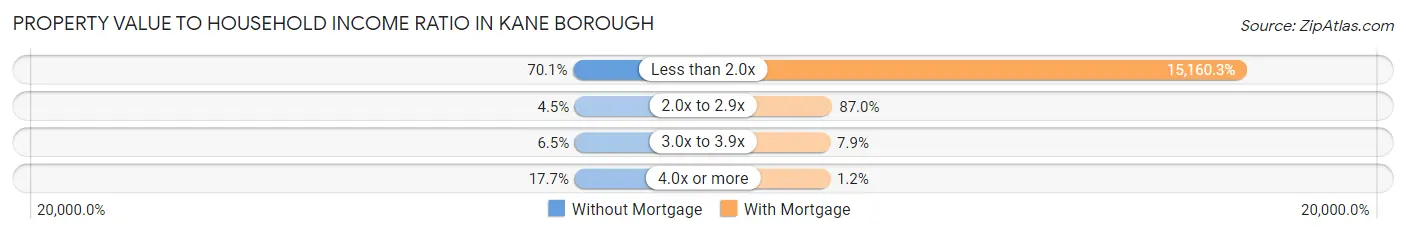
| Value-to-Income Ratio | Without Mortgage | With Mortgage |
| Less than 2.0x | 356 (70.1%) | 65,341 (15,160.3%) |
| 2.0x to 2.9x | 23 (4.5%) | 375 (87.0%) |
| 3.0x to 3.9x | 33 (6.5%) | 34 (7.9%) |
| 4.0x or more | 90 (17.7%) | 5 (1.2%) |
| Total | 508 (100.0%) | 431 (100.0%) |
Real Estate Taxes by Mortgage Status in Kane borough
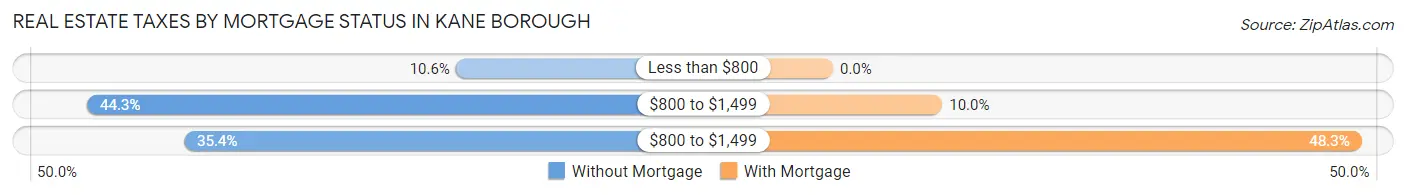
| Property Taxes | Without Mortgage | With Mortgage |
| Less than $800 | 54 (10.6%) | 0 (0.0%) |
| $800 to $1,499 | 225 (44.3%) | 43 (10.0%) |
| $800 to $1,499 | 180 (35.4%) | 208 (48.3%) |
| Total | 508 (100.0%) | 431 (100.0%) |
Health & Disability in Kane borough
Health Insurance Coverage by Age in Kane borough
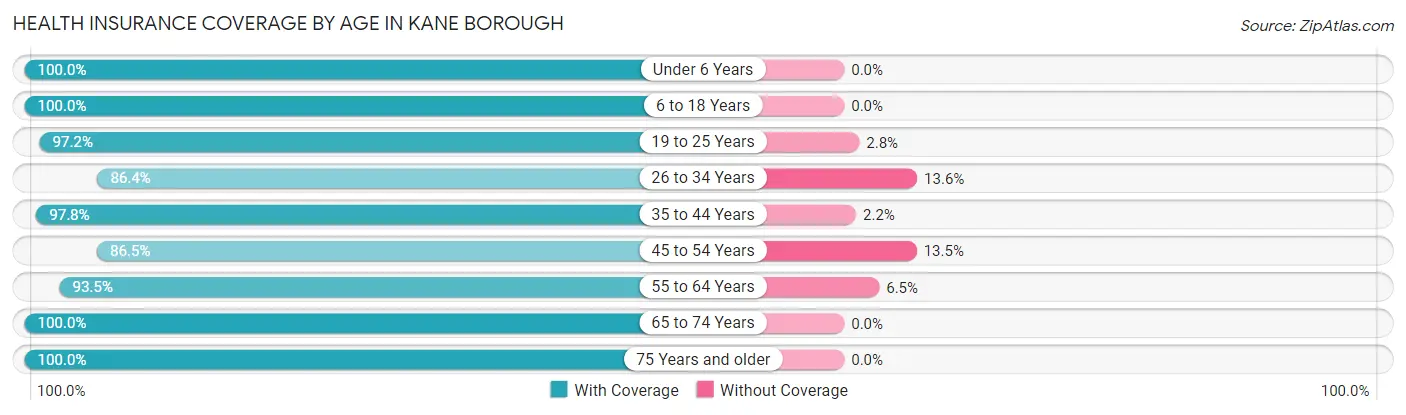
| Age Bracket | With Coverage | Without Coverage |
| Under 6 Years | 318 (100.0%) | 0 (0.0%) |
| 6 to 18 Years | 543 (100.0%) | 0 (0.0%) |
| 19 to 25 Years | 277 (97.2%) | 8 (2.8%) |
| 26 to 34 Years | 318 (86.4%) | 50 (13.6%) |
| 35 to 44 Years | 445 (97.8%) | 10 (2.2%) |
| 45 to 54 Years | 333 (86.5%) | 52 (13.5%) |
| 55 to 64 Years | 416 (93.5%) | 29 (6.5%) |
| 65 to 74 Years | 370 (100.0%) | 0 (0.0%) |
| 75 Years and older | 313 (100.0%) | 0 (0.0%) |
| Total | 3,333 (95.7%) | 149 (4.3%) |
Health Insurance Coverage by Citizenship Status in Kane borough
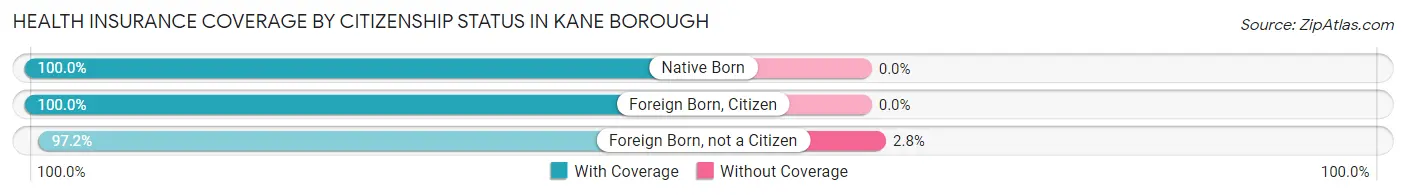
| Citizenship Status | With Coverage | Without Coverage |
| Native Born | 318 (100.0%) | 0 (0.0%) |
| Foreign Born, Citizen | 543 (100.0%) | 0 (0.0%) |
| Foreign Born, not a Citizen | 277 (97.2%) | 8 (2.8%) |
Health Insurance Coverage by Household Income in Kane borough
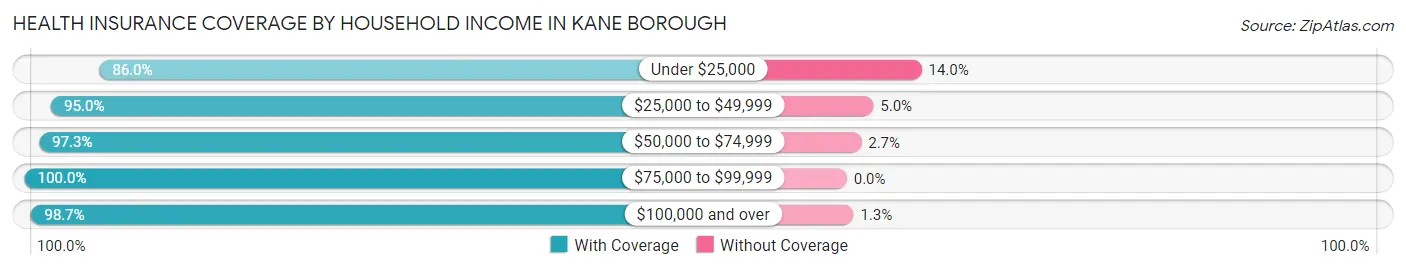
| Household Income | With Coverage | Without Coverage |
| Under $25,000 | 436 (86.0%) | 71 (14.0%) |
| $25,000 to $49,999 | 880 (95.0%) | 46 (5.0%) |
| $50,000 to $74,999 | 790 (97.3%) | 22 (2.7%) |
| $75,000 to $99,999 | 516 (100.0%) | 0 (0.0%) |
| $100,000 and over | 707 (98.7%) | 9 (1.3%) |
Public vs Private Health Insurance Coverage by Age in Kane borough
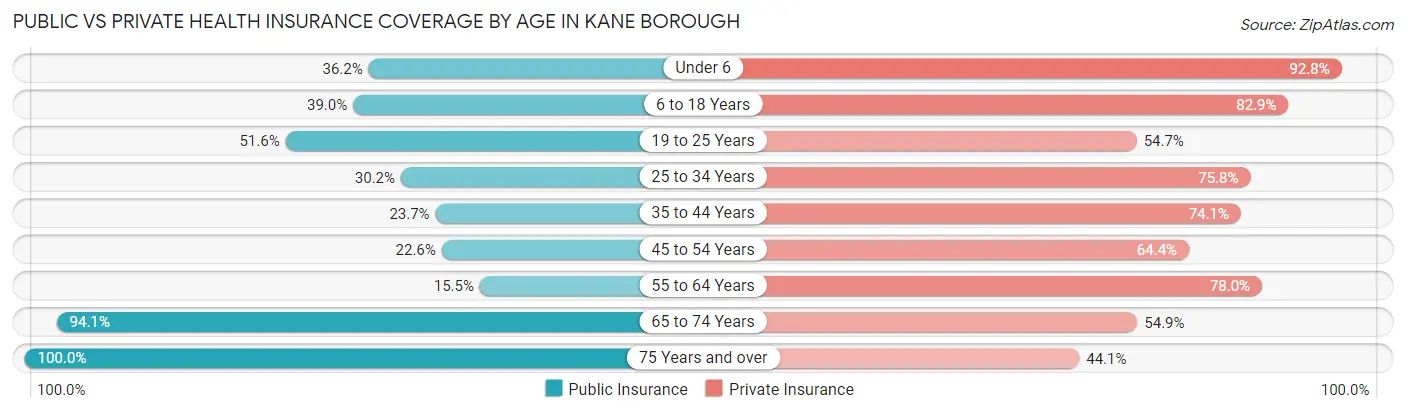
| Age Bracket | Public Insurance | Private Insurance |
| Under 6 | 115 (36.2%) | 295 (92.8%) |
| 6 to 18 Years | 212 (39.0%) | 450 (82.9%) |
| 19 to 25 Years | 147 (51.6%) | 156 (54.7%) |
| 25 to 34 Years | 111 (30.2%) | 279 (75.8%) |
| 35 to 44 Years | 108 (23.7%) | 337 (74.1%) |
| 45 to 54 Years | 87 (22.6%) | 248 (64.4%) |
| 55 to 64 Years | 69 (15.5%) | 347 (78.0%) |
| 65 to 74 Years | 348 (94.1%) | 203 (54.9%) |
| 75 Years and over | 313 (100.0%) | 138 (44.1%) |
| Total | 1,510 (43.4%) | 2,453 (70.5%) |
Disability Status by Sex by Age in Kane borough
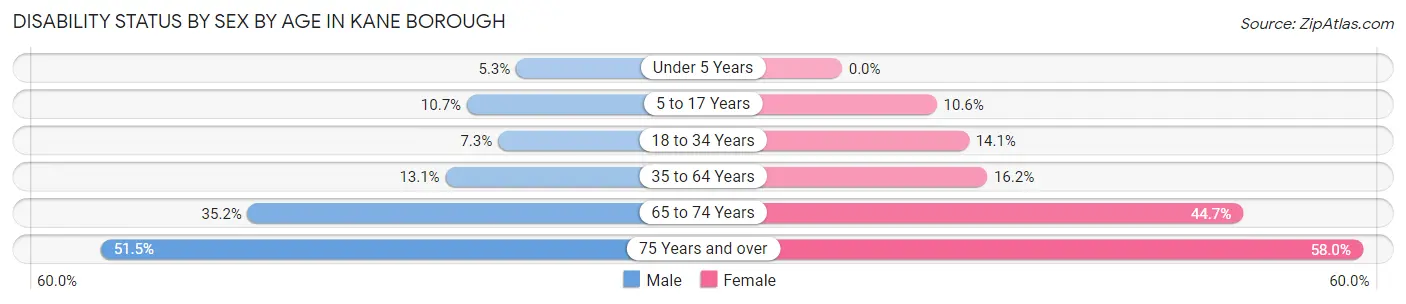
| Age Bracket | Male | Female |
| Under 5 Years | 5 (5.3%) | 0 (0.0%) |
| 5 to 17 Years | 32 (10.7%) | 30 (10.6%) |
| 18 to 34 Years | 25 (7.3%) | 53 (14.1%) |
| 35 to 64 Years | 81 (13.1%) | 108 (16.2%) |
| 65 to 74 Years | 64 (35.2%) | 84 (44.7%) |
| 75 Years and over | 68 (51.5%) | 105 (58.0%) |
Disability Class by Sex by Age in Kane borough
Disability Class: Hearing Difficulty
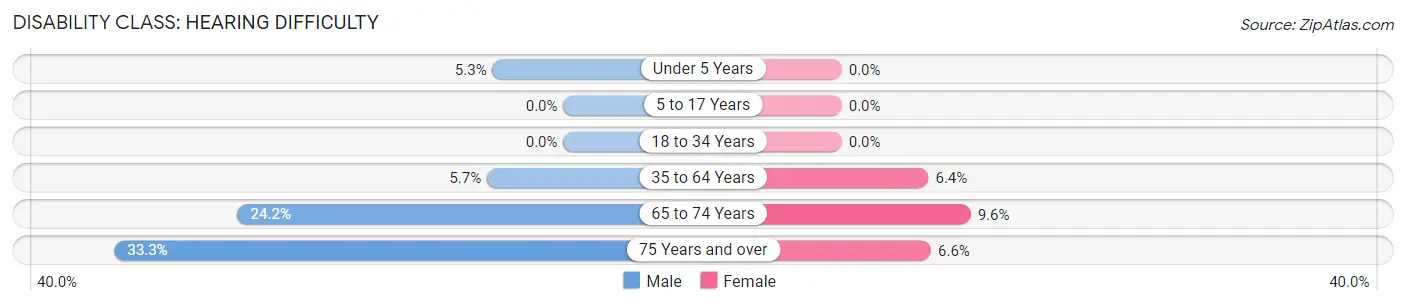
| Age Bracket | Male | Female |
| Under 5 Years | 5 (5.3%) | 0 (0.0%) |
| 5 to 17 Years | 0 (0.0%) | 0 (0.0%) |
| 18 to 34 Years | 0 (0.0%) | 0 (0.0%) |
| 35 to 64 Years | 35 (5.7%) | 43 (6.4%) |
| 65 to 74 Years | 44 (24.2%) | 18 (9.6%) |
| 75 Years and over | 44 (33.3%) | 12 (6.6%) |
Disability Class: Vision Difficulty
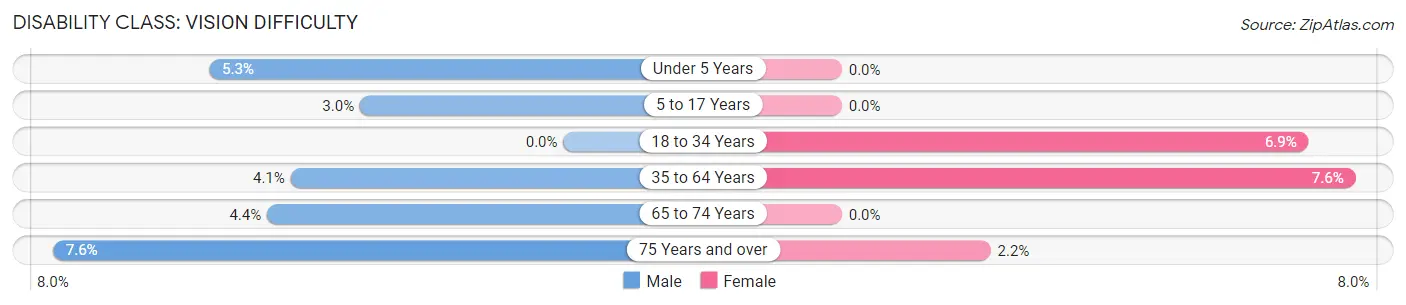
| Age Bracket | Male | Female |
| Under 5 Years | 5 (5.3%) | 0 (0.0%) |
| 5 to 17 Years | 9 (3.0%) | 0 (0.0%) |
| 18 to 34 Years | 0 (0.0%) | 26 (6.9%) |
| 35 to 64 Years | 25 (4.1%) | 51 (7.6%) |
| 65 to 74 Years | 8 (4.4%) | 0 (0.0%) |
| 75 Years and over | 10 (7.6%) | 4 (2.2%) |
Disability Class: Cognitive Difficulty
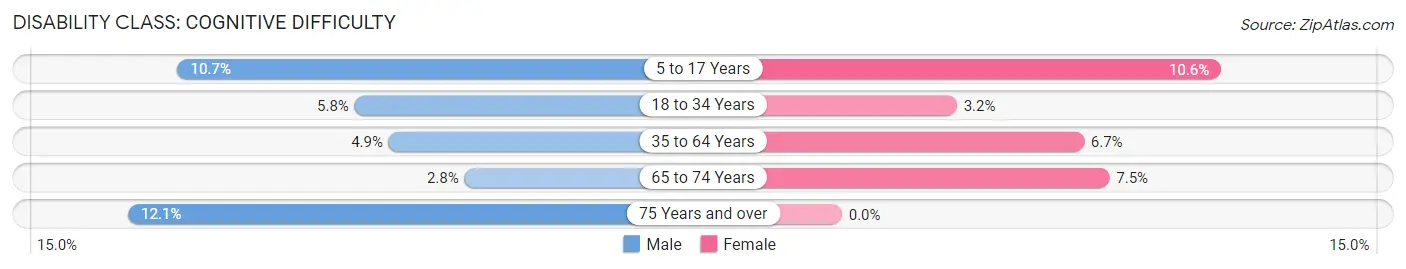
| Age Bracket | Male | Female |
| 5 to 17 Years | 32 (10.7%) | 30 (10.6%) |
| 18 to 34 Years | 20 (5.8%) | 12 (3.2%) |
| 35 to 64 Years | 30 (4.9%) | 45 (6.7%) |
| 65 to 74 Years | 5 (2.8%) | 14 (7.4%) |
| 75 Years and over | 16 (12.1%) | 0 (0.0%) |
Disability Class: Ambulatory Difficulty
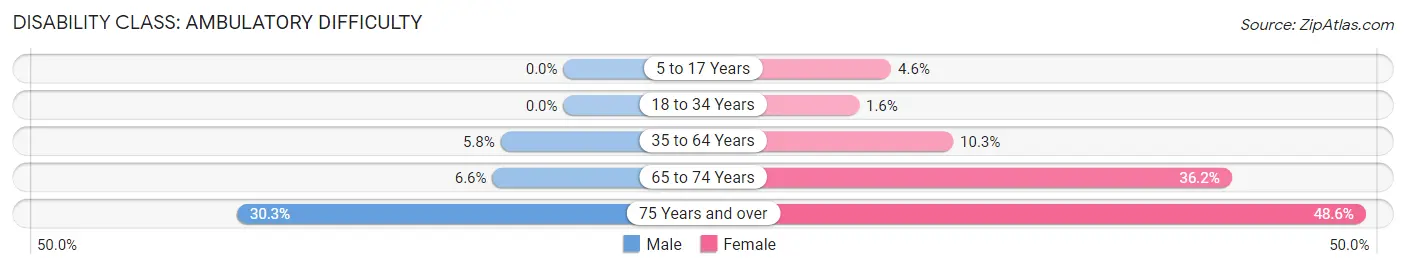
| Age Bracket | Male | Female |
| 5 to 17 Years | 0 (0.0%) | 13 (4.6%) |
| 18 to 34 Years | 0 (0.0%) | 6 (1.6%) |
| 35 to 64 Years | 36 (5.8%) | 69 (10.3%) |
| 65 to 74 Years | 12 (6.6%) | 68 (36.2%) |
| 75 Years and over | 40 (30.3%) | 88 (48.6%) |
Disability Class: Self-Care Difficulty
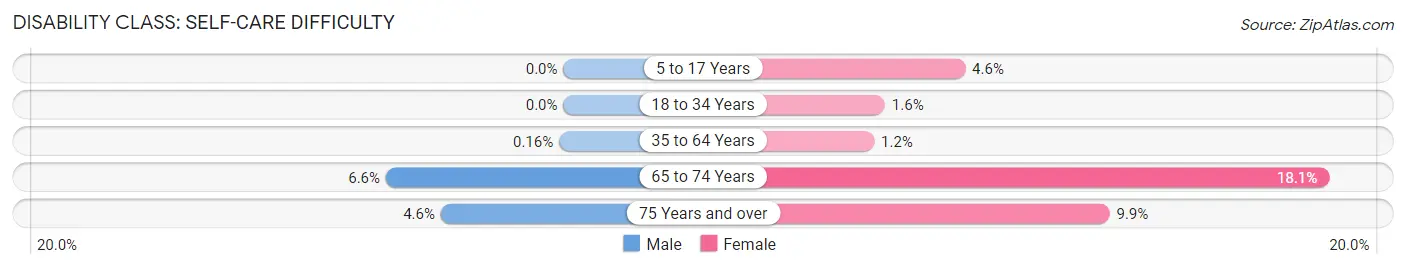
| Age Bracket | Male | Female |
| 5 to 17 Years | 0 (0.0%) | 13 (4.6%) |
| 18 to 34 Years | 0 (0.0%) | 6 (1.6%) |
| 35 to 64 Years | 1 (0.2%) | 8 (1.2%) |
| 65 to 74 Years | 12 (6.6%) | 34 (18.1%) |
| 75 Years and over | 6 (4.5%) | 18 (9.9%) |
Technology Access in Kane borough
Computing Device Access in Kane borough
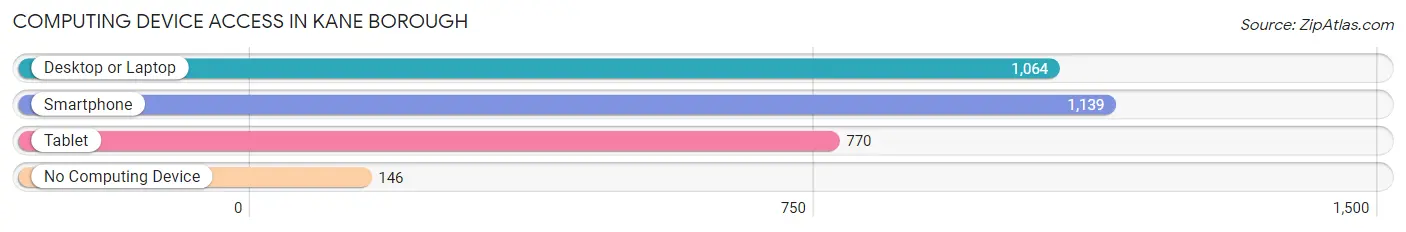
| Device Type | # Households | % Households |
| Desktop or Laptop | 1,064 | 73.3% |
| Smartphone | 1,139 | 78.4% |
| Tablet | 770 | 53.0% |
| No Computing Device | 146 | 10.1% |
| Total | 1,452 | 100.0% |
Internet Access in Kane borough
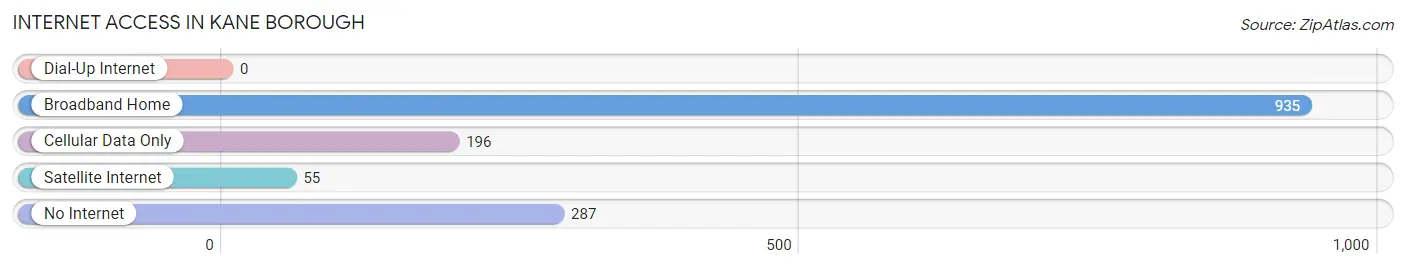
| Internet Type | # Households | % Households |
| Dial-Up Internet | 0 | 0.0% |
| Broadband Home | 935 | 64.4% |
| Cellular Data Only | 196 | 13.5% |
| Satellite Internet | 55 | 3.8% |
| No Internet | 287 | 19.8% |
| Total | 1,452 | 100.0% |
Kane borough Summary
Kane Borough is a borough located in McKean County, Pennsylvania. It is situated in the Allegheny Plateau region of the state, and is bordered by the townships of Wetmore, Norwich, and Hamlin. The population of Kane Borough was 1,845 at the 2010 census.
History
Kane Borough was founded in 1876, and was named after the Kane family, who were early settlers in the area. The borough was incorporated in 1877, and was the first borough in McKean County. The first mayor of Kane Borough was John Kane, who served from 1877 to 1879.
The borough was originally a farming community, and the main industry was lumbering. In the late 19th century, the lumber industry began to decline, and the borough began to focus on other industries, such as coal mining and manufacturing.
Geography
Kane Borough is located at 41°37'N 78°45'W (41.6167, -78.7500). It has a total area of 1.2 square miles, all of which is land. The borough is located in the Allegheny Plateau region of Pennsylvania, and is bordered by the townships of Wetmore, Norwich, and Hamlin.
The borough is located in the Allegheny River Valley, and is surrounded by hills and mountains. The highest point in Kane Borough is 1,890 feet above sea level.
Economy
Kane Borough's economy is largely based on manufacturing and services. The borough is home to several manufacturing companies, including a paper mill, a plastics factory, and a metal fabrication plant. The borough also has a number of retail stores, restaurants, and other businesses.
The borough is also home to a number of government offices, including the McKean County Courthouse, the Kane Borough Police Department, and the Kane Borough Public Library.
Demographics
As of the 2010 census, the population of Kane Borough was 1,845. The racial makeup of the borough was 97.2% White, 0.7% African American, 0.2% Native American, 0.3% Asian, 0.1% from other races, and 1.5% from two or more races. Hispanic or Latino of any race were 0.7% of the population.
The median income for a household in Kane Borough was $37,917, and the median income for a family was $45,000. The per capita income for the borough was $19,845. About 11.2% of families and 14.2% of the population were below the poverty line, including 19.2% of those under age 18 and 8.3% of those age 65 or over.
Common Questions
What is Per Capita Income in Kane borough?
Per Capita income in Kane borough is $22,428.
What is the Median Family Income in Kane borough?
Median Family Income in Kane borough is $61,477.
What is the Median Household income in Kane borough?
Median Household Income in Kane borough is $45,481.
What is Income or Wage Gap in Kane borough?
Income or Wage Gap in Kane borough is 22.2%.
Women in Kane borough earn 77.8 cents for every dollar earned by a man.
What is Family Income Deficit in Kane borough?
Family Income Deficit in Kane borough is $7,735.
Families that are below poverty line in Kane borough earn $7,735 less on average than the poverty threshold level.
What is Inequality or Gini Index in Kane borough?
Inequality or Gini Index in Kane borough is 0.40.
What is the Total Population of Kane borough?
Total Population of Kane borough is 3,605.
What is the Total Male Population of Kane borough?
Total Male Population of Kane borough is 1,714.
What is the Total Female Population of Kane borough?
Total Female Population of Kane borough is 1,891.
What is the Ratio of Males per 100 Females in Kane borough?
There are 90.64 Males per 100 Females in Kane borough.
What is the Ratio of Females per 100 Males in Kane borough?
There are 110.33 Females per 100 Males in Kane borough.
What is the Median Population Age in Kane borough?
Median Population Age in Kane borough is 41.0 Years.
What is the Average Family Size in Kane borough
Average Family Size in Kane borough is 3.2 People.
What is the Average Household Size in Kane borough
Average Household Size in Kane borough is 2.4 People.
How Large is the Labor Force in Kane borough?
There are 1,681 People in the Labor Forcein in Kane borough.
What is the Percentage of People in the Labor Force in Kane borough?
58.1% of People are in the Labor Force in Kane borough.
What is the Unemployment Rate in Kane borough?
Unemployment Rate in Kane borough is 7.9%.