Minden, LA Map & Demographics
Minden Map
Minden Overview
$24,949
PER CAPITA INCOME
$38,250
AVG FAMILY INCOME
$28,233
AVG HOUSEHOLD INCOME
29.1%
WAGE / INCOME GAP [ % ]
70.9¢/ $1
WAGE / INCOME GAP [ $ ]
$9,774
FAMILY INCOME DEFICIT
0.59
INEQUALITY / GINI INDEX
11,789
TOTAL POPULATION
5,542
MALE POPULATION
6,247
FEMALE POPULATION
88.71
MALES / 100 FEMALES
112.72
FEMALES / 100 MALES
39.5
MEDIAN AGE
3.2
AVG FAMILY SIZE
2.4
AVG HOUSEHOLD SIZE
4,364
LABOR FORCE [ PEOPLE ]
46.5%
PERCENT IN LABOR FORCE
3.4%
UNEMPLOYMENT RATE
Minden Zip Codes
Minden Area Codes
Income in Minden
Income Overview in Minden
Per Capita Income in Minden is $24,949, while median incomes of families and households are $38,250 and $28,233 respectively.
| Characteristic | Number | Measure |
| Per Capita Income | 11,789 | $24,949 |
| Median Family Income | 2,922 | $38,250 |
| Mean Family Income | 2,922 | $80,299 |
| Median Household Income | 4,870 | $28,233 |
| Mean Household Income | 4,870 | $57,352 |
| Income Deficit | 2,922 | $9,774 |
| Wage / Income Gap (%) | 11,789 | 29.10% |
| Wage / Income Gap ($) | 11,789 | 70.90¢ per $1 |
| Gini / Inequality Index | 11,789 | 0.59 |
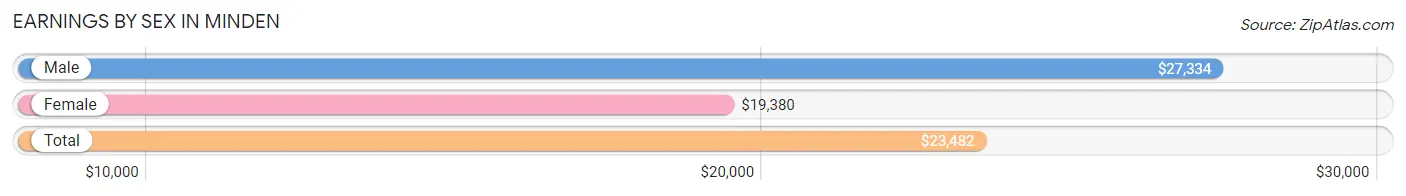
Earnings by Sex in Minden
Average Earnings in Minden are $23,482, $27,334 for men and $19,380 for women, a difference of 29.1%.
| Sex | Number | Average Earnings |
| Male | 2,155 (48.8%) | $27,334 |
| Female | 2,265 (51.2%) | $19,380 |
| Total | 4,420 (100.0%) | $23,482 |
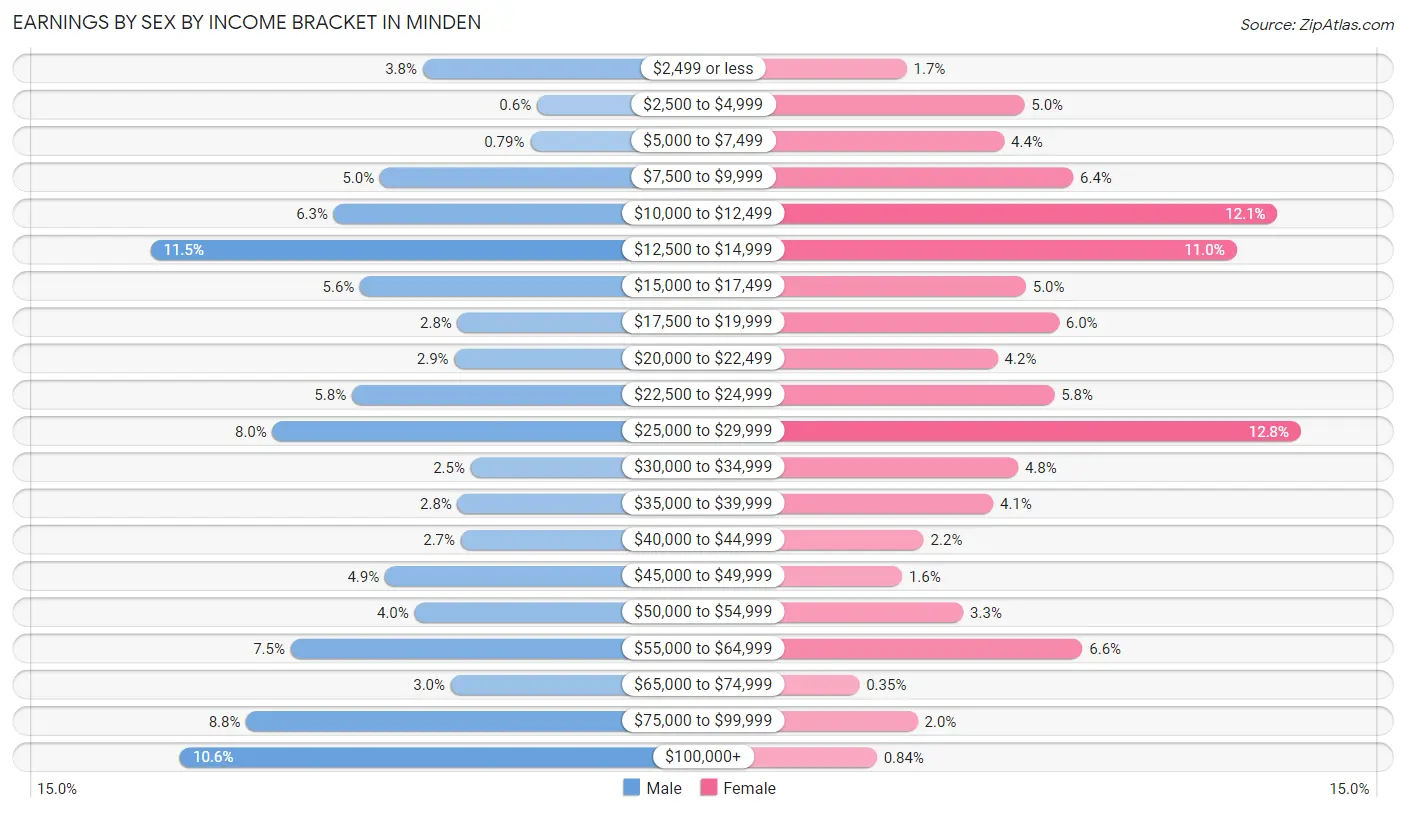
Earnings by Sex by Income Bracket in Minden
The most common earnings brackets in Minden are $12,500 to $14,999 for men (247 | 11.5%) and $25,000 to $29,999 for women (289 | 12.8%).
| Income | Male | Female |
| $2,499 or less | 82 (3.8%) | 38 (1.7%) |
| $2,500 to $4,999 | 13 (0.6%) | 113 (5.0%) |
| $5,000 to $7,499 | 17 (0.8%) | 100 (4.4%) |
| $7,500 to $9,999 | 108 (5.0%) | 144 (6.4%) |
| $10,000 to $12,499 | 136 (6.3%) | 274 (12.1%) |
| $12,500 to $14,999 | 247 (11.5%) | 248 (11.0%) |
| $15,000 to $17,499 | 120 (5.6%) | 114 (5.0%) |
| $17,500 to $19,999 | 61 (2.8%) | 135 (6.0%) |
| $20,000 to $22,499 | 63 (2.9%) | 96 (4.2%) |
| $22,500 to $24,999 | 125 (5.8%) | 132 (5.8%) |
| $25,000 to $29,999 | 173 (8.0%) | 289 (12.8%) |
| $30,000 to $34,999 | 53 (2.5%) | 109 (4.8%) |
| $35,000 to $39,999 | 61 (2.8%) | 93 (4.1%) |
| $40,000 to $44,999 | 59 (2.7%) | 49 (2.2%) |
| $45,000 to $49,999 | 105 (4.9%) | 35 (1.5%) |
| $50,000 to $54,999 | 87 (4.0%) | 74 (3.3%) |
| $55,000 to $64,999 | 162 (7.5%) | 150 (6.6%) |
| $65,000 to $74,999 | 65 (3.0%) | 8 (0.4%) |
| $75,000 to $99,999 | 189 (8.8%) | 45 (2.0%) |
| $100,000+ | 229 (10.6%) | 19 (0.8%) |
| Total | 2,155 (100.0%) | 2,265 (100.0%) |
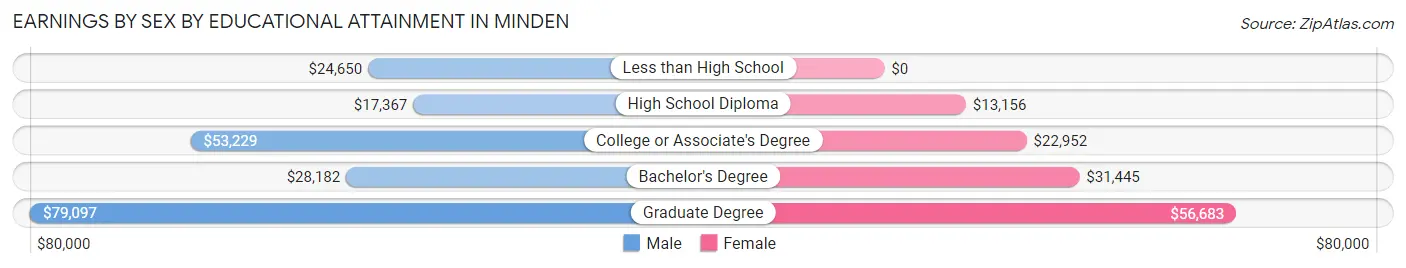
Earnings by Sex by Educational Attainment in Minden
Average earnings in Minden are $28,417 for men and $21,762 for women, a difference of 23.4%. Men with an educational attainment of graduate degree enjoy the highest average annual earnings of $79,097, while those with high school diploma education earn the least with $17,367. Women with an educational attainment of graduate degree earn the most with the average annual earnings of $56,683, while those with high school diploma education have the smallest earnings of $13,156.
| Educational Attainment | Male Income | Female Income |
| Less than High School | $24,650 | $0 |
| High School Diploma | $17,367 | $13,156 |
| College or Associate's Degree | $53,229 | $22,952 |
| Bachelor's Degree | $28,182 | $31,445 |
| Graduate Degree | $79,097 | $56,683 |
| Total | $28,417 | $21,762 |
Family Income in Minden
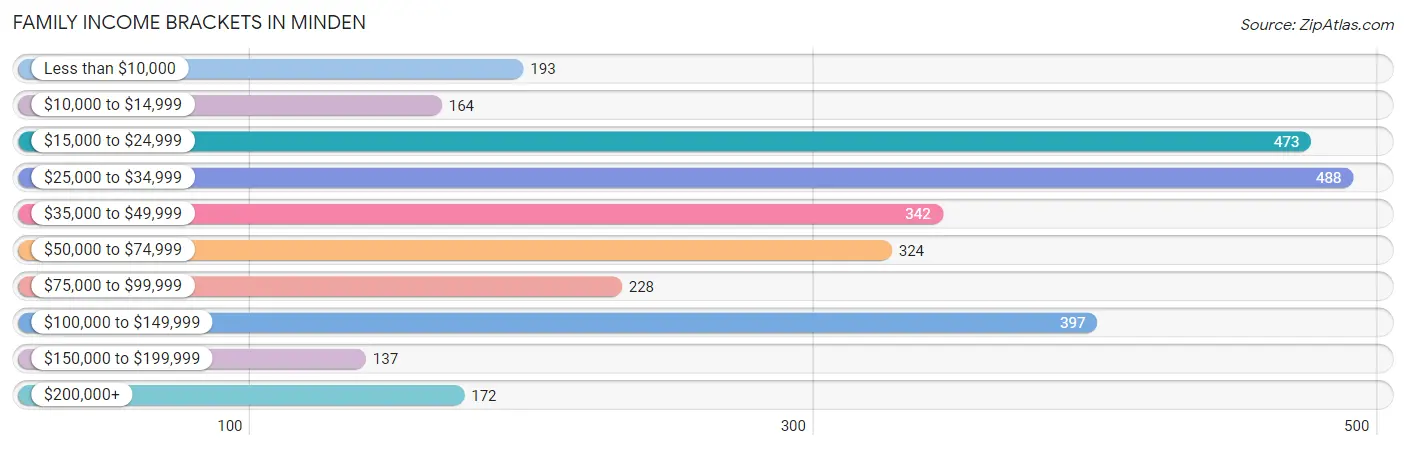
Family Income Brackets in Minden
According to the Minden family income data, there are 488 families falling into the $25,000 to $34,999 income range, which is the most common income bracket and makes up 16.7% of all families. Conversely, the $150,000 to $199,999 income bracket is the least frequent group with only 137 families (4.7%) belonging to this category.
| Income Bracket | # Families | % Families |
| Less than $10,000 | 193 | 6.6% |
| $10,000 to $14,999 | 164 | 5.6% |
| $15,000 to $24,999 | 473 | 16.2% |
| $25,000 to $34,999 | 488 | 16.7% |
| $35,000 to $49,999 | 342 | 11.7% |
| $50,000 to $74,999 | 324 | 11.1% |
| $75,000 to $99,999 | 228 | 7.8% |
| $100,000 to $149,999 | 397 | 13.6% |
| $150,000 to $199,999 | 137 | 4.7% |
| $200,000+ | 172 | 5.9% |
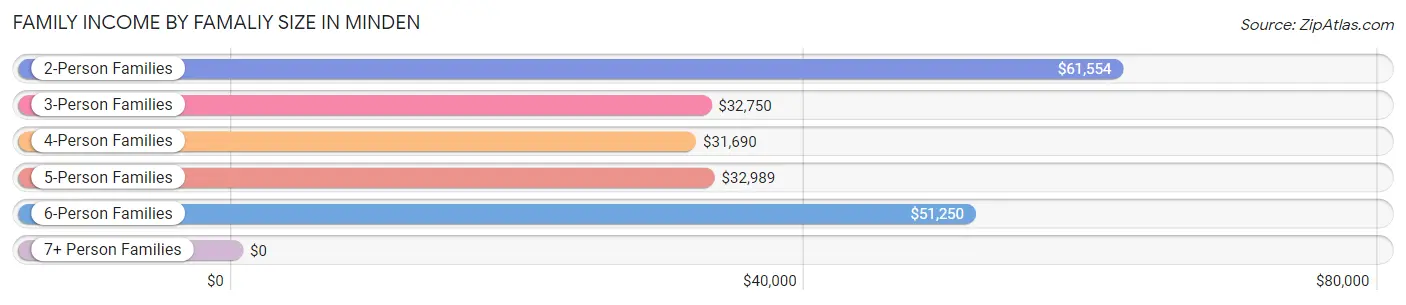
Family Income by Famaliy Size in Minden
2-person families (1,170 | 40.0%) account for the highest median family income in Minden with $61,554 per family, while 2-person families (1,170 | 40.0%) have the highest median income of $30,777 per family member.
| Income Bracket | # Families | Median Income |
| 2-Person Families | 1,170 (40.0%) | $61,554 |
| 3-Person Families | 864 (29.6%) | $32,750 |
| 4-Person Families | 538 (18.4%) | $31,690 |
| 5-Person Families | 282 (9.7%) | $32,989 |
| 6-Person Families | 50 (1.7%) | $51,250 |
| 7+ Person Families | 18 (0.6%) | $0 |
| Total | 2,922 (100.0%) | $38,250 |
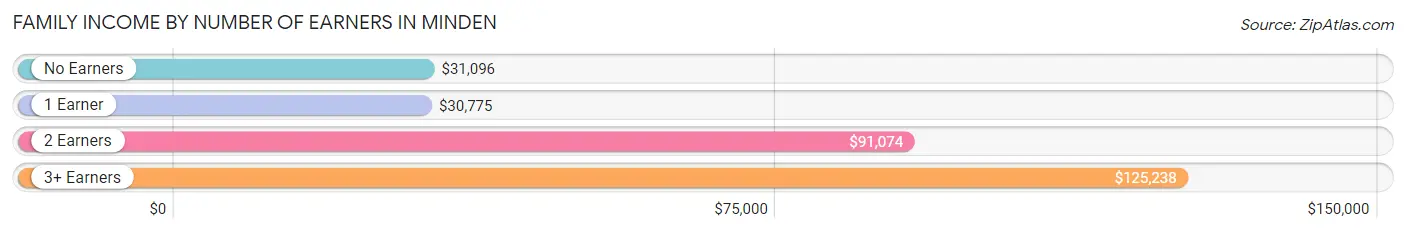
Family Income by Number of Earners in Minden
The median family income in Minden is $38,250, with families comprising 3+ earners (128) having the highest median family income of $125,238, while families with 1 earner (1,115) have the lowest median family income of $30,775, accounting for 4.4% and 38.2% of families, respectively.
| Number of Earners | # Families | Median Income |
| No Earners | 864 (29.6%) | $31,096 |
| 1 Earner | 1,115 (38.2%) | $30,775 |
| 2 Earners | 815 (27.9%) | $91,074 |
| 3+ Earners | 128 (4.4%) | $125,238 |
| Total | 2,922 (100.0%) | $38,250 |
Household Income in Minden
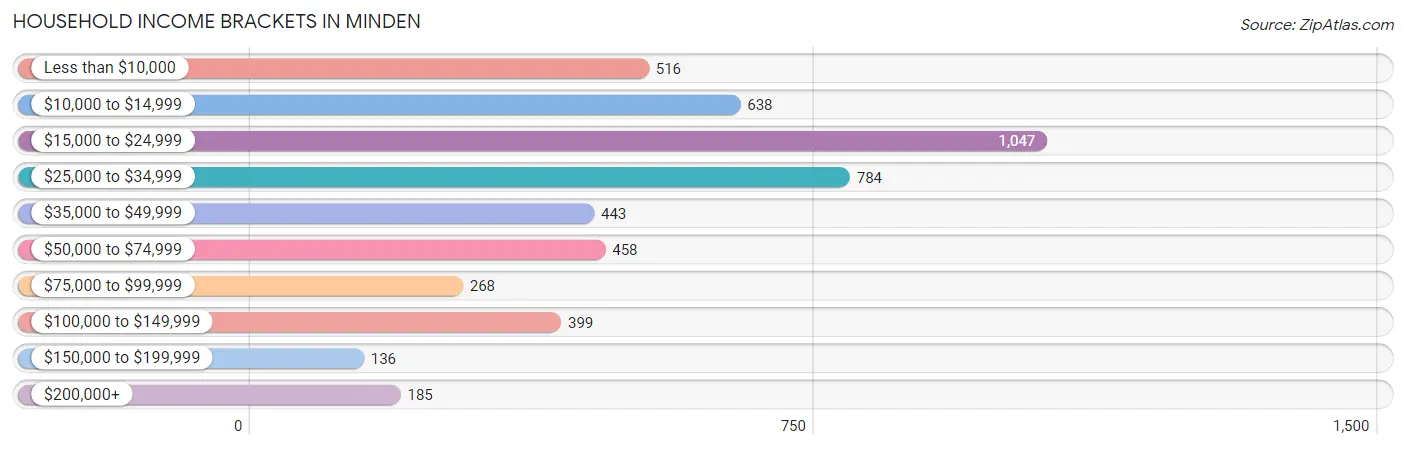
Household Income Brackets in Minden
With 1,047 households falling in the category, the $15,000 to $24,999 income range is the most frequent in Minden, accounting for 21.5% of all households. In contrast, only 136 households (2.8%) fall into the $150,000 to $199,999 income bracket, making it the least populous group.
| Income Bracket | # Households | % Households |
| Less than $10,000 | 516 | 10.6% |
| $10,000 to $14,999 | 638 | 13.1% |
| $15,000 to $24,999 | 1,047 | 21.5% |
| $25,000 to $34,999 | 784 | 16.1% |
| $35,000 to $49,999 | 443 | 9.1% |
| $50,000 to $74,999 | 458 | 9.4% |
| $75,000 to $99,999 | 268 | 5.5% |
| $100,000 to $149,999 | 399 | 8.2% |
| $150,000 to $199,999 | 136 | 2.8% |
| $200,000+ | 185 | 3.8% |
Household Income by Householder Age in Minden
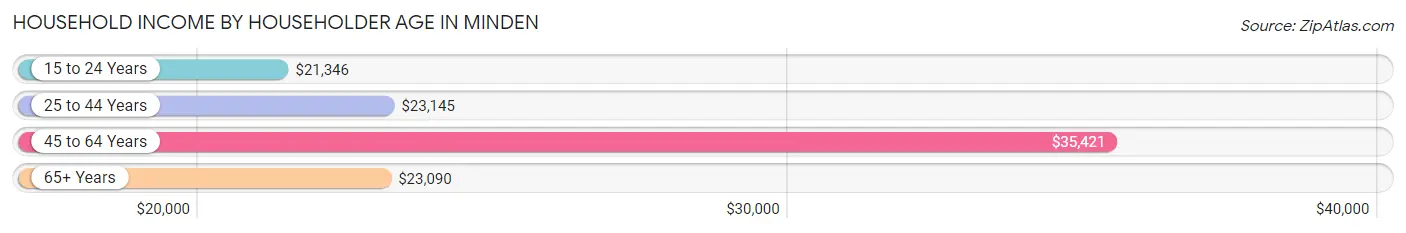
The median household income in Minden is $28,233, with the highest median household income of $35,421 found in the 45 to 64 years age bracket for the primary householder. A total of 1,722 households (35.4%) fall into this category. Meanwhile, the 15 to 24 years age bracket for the primary householder has the lowest median household income of $21,346, with 150 households (3.1%) in this group.
| Income Bracket | # Households | Median Income |
| 15 to 24 Years | 150 (3.1%) | $21,346 |
| 25 to 44 Years | 1,551 (31.9%) | $23,145 |
| 45 to 64 Years | 1,722 (35.4%) | $35,421 |
| 65+ Years | 1,447 (29.7%) | $23,090 |
| Total | 4,870 (100.0%) | $28,233 |
Poverty in Minden
Income Below Poverty by Sex and Age in Minden
With 32.7% poverty level for males and 36.0% for females among the residents of Minden, under 5 year old males and 12 to 14 year old females are the most vulnerable to poverty, with 241 males (71.5%) and 149 females (90.8%) in their respective age groups living below the poverty level.
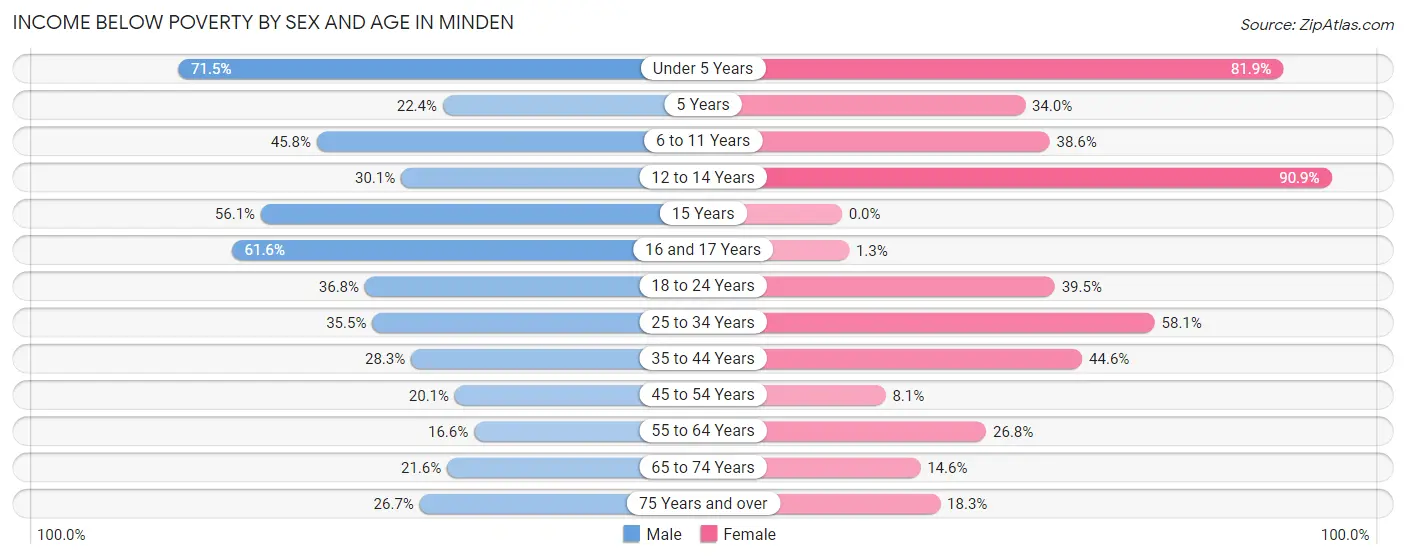
| Age Bracket | Male | Female |
| Under 5 Years | 241 (71.5%) | 344 (81.9%) |
| 5 Years | 17 (22.4%) | 17 (34.0%) |
| 6 to 11 Years | 173 (45.8%) | 194 (38.6%) |
| 12 to 14 Years | 116 (30.1%) | 149 (90.8%) |
| 15 Years | 32 (56.1%) | 0 (0.0%) |
| 16 and 17 Years | 149 (61.6%) | 2 (1.3%) |
| 18 to 24 Years | 224 (36.8%) | 181 (39.5%) |
| 25 to 34 Years | 205 (35.5%) | 450 (58.1%) |
| 35 to 44 Years | 203 (28.3%) | 360 (44.6%) |
| 45 to 54 Years | 114 (20.1%) | 53 (8.1%) |
| 55 to 64 Years | 116 (16.6%) | 243 (26.8%) |
| 65 to 74 Years | 98 (21.6%) | 69 (14.6%) |
| 75 Years and over | 92 (26.7%) | 132 (18.3%) |
| Total | 1,780 (32.7%) | 2,194 (36.0%) |
Income Above Poverty by Sex and Age in Minden
According to the poverty statistics in Minden, males aged 55 to 64 years and females aged 15 years are the age groups that are most secure financially, with 83.4% of males and 100.0% of females in these age groups living above the poverty line.
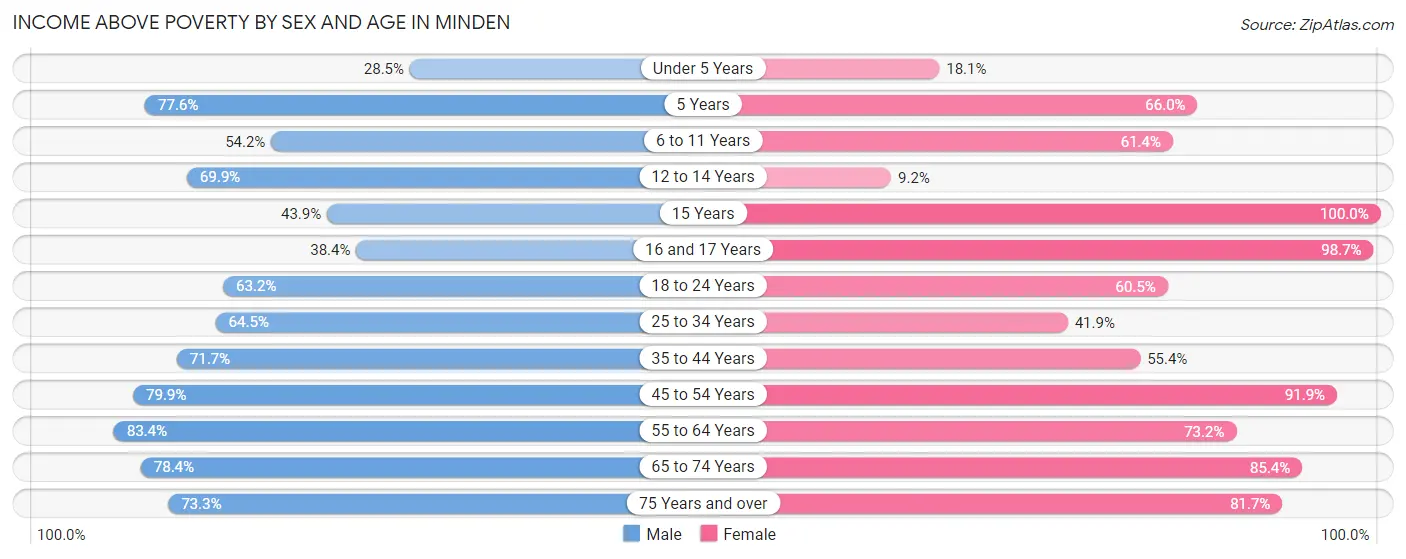
| Age Bracket | Male | Female |
| Under 5 Years | 96 (28.5%) | 76 (18.1%) |
| 5 Years | 59 (77.6%) | 33 (66.0%) |
| 6 to 11 Years | 205 (54.2%) | 309 (61.4%) |
| 12 to 14 Years | 269 (69.9%) | 15 (9.1%) |
| 15 Years | 25 (43.9%) | 12 (100.0%) |
| 16 and 17 Years | 93 (38.4%) | 148 (98.7%) |
| 18 to 24 Years | 384 (63.2%) | 277 (60.5%) |
| 25 to 34 Years | 373 (64.5%) | 325 (41.9%) |
| 35 to 44 Years | 515 (71.7%) | 447 (55.4%) |
| 45 to 54 Years | 452 (79.9%) | 601 (91.9%) |
| 55 to 64 Years | 584 (83.4%) | 664 (73.2%) |
| 65 to 74 Years | 356 (78.4%) | 405 (85.4%) |
| 75 Years and over | 253 (73.3%) | 591 (81.7%) |
| Total | 3,664 (67.3%) | 3,903 (64.0%) |
Income Below Poverty Among Married-Couple Families in Minden
The poverty statistics for married-couple families in Minden show that 11.0% or 198 of the total 1,801 families live below the poverty line. Families with 3 or 4 children have the highest poverty rate of 51.1%, comprising of 72 families. On the other hand, families with no children have the lowest poverty rate of 3.7%, which includes 41 families.
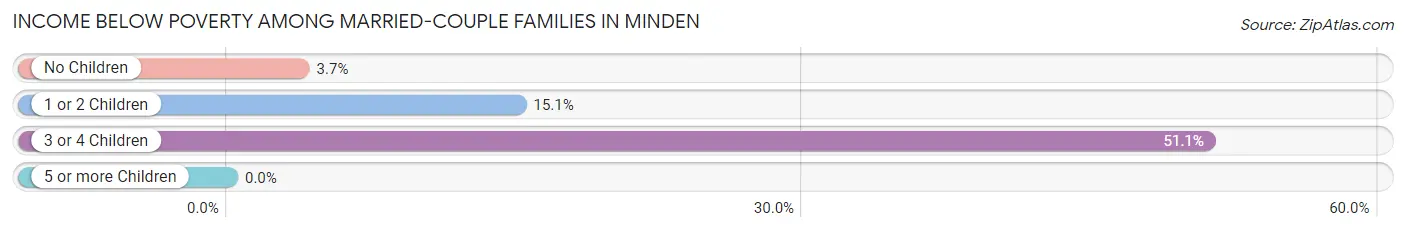
| Children | Above Poverty | Below Poverty |
| No Children | 1,055 (96.3%) | 41 (3.7%) |
| 1 or 2 Children | 479 (84.9%) | 85 (15.1%) |
| 3 or 4 Children | 69 (48.9%) | 72 (51.1%) |
| 5 or more Children | 0 (0.0%) | 0 (0.0%) |
| Total | 1,603 (89.0%) | 198 (11.0%) |
Income Below Poverty Among Single-Parent Households in Minden
According to the poverty data in Minden, 46.3% or 100 single-father households and 57.6% or 521 single-mother households are living below the poverty line. Among single-father households, those with 3 or 4 children have the highest poverty rate, with 60 households (100.0%) experiencing poverty. Likewise, among single-mother households, those with 5 or more children have the highest poverty rate, with 8 households (100.0%) falling below the poverty line.
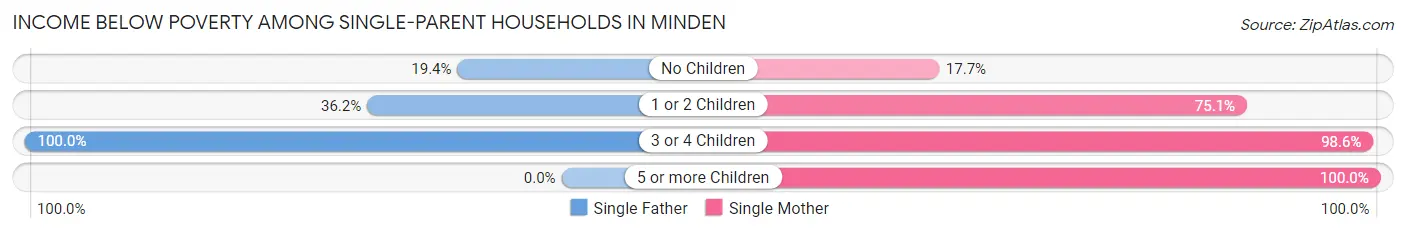
| Children | Single Father | Single Mother |
| No Children | 19 (19.4%) | 55 (17.7%) |
| 1 or 2 Children | 21 (36.2%) | 386 (75.1%) |
| 3 or 4 Children | 60 (100.0%) | 72 (98.6%) |
| 5 or more Children | 0 (0.0%) | 8 (100.0%) |
| Total | 100 (46.3%) | 521 (57.6%) |
Income Below Poverty Among Married-Couple vs Single-Parent Households in Minden
The poverty data for Minden shows that 198 of the married-couple family households (11.0%) and 621 of the single-parent households (55.4%) are living below the poverty level. Within the married-couple family households, those with 3 or 4 children have the highest poverty rate, with 72 households (51.1%) falling below the poverty line. Among the single-parent households, those with 5 or more children have the highest poverty rate, with 8 household (100.0%) living below poverty.
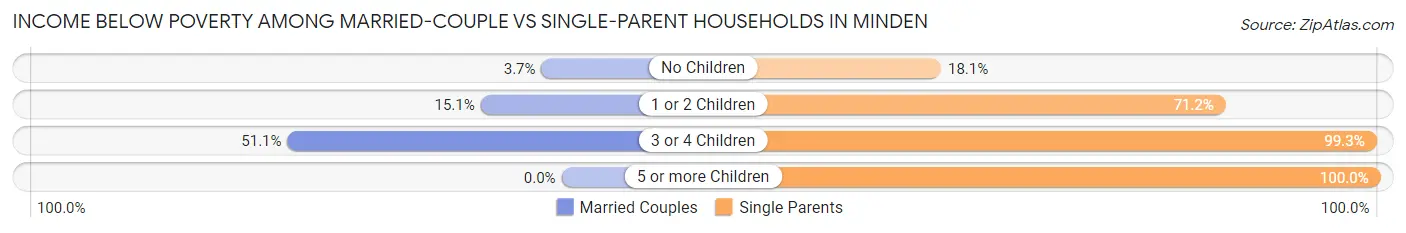
| Children | Married-Couple Families | Single-Parent Households |
| No Children | 41 (3.7%) | 74 (18.1%) |
| 1 or 2 Children | 85 (15.1%) | 407 (71.2%) |
| 3 or 4 Children | 72 (51.1%) | 132 (99.3%) |
| 5 or more Children | 0 (0.0%) | 8 (100.0%) |
| Total | 198 (11.0%) | 621 (55.4%) |
Race in Minden
The most populous races in Minden are Black / African American (5,813 | 49.3%), White / Caucasian (5,490 | 46.6%), and Two or more Races (436 | 3.7%).
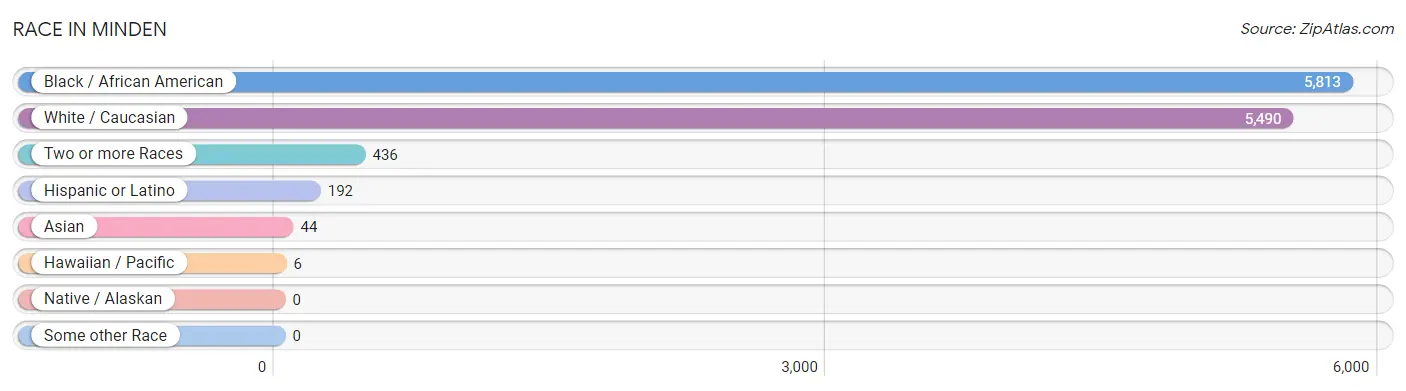
| Race | # Population | % Population |
| Asian | 44 | 0.4% |
| Black / African American | 5,813 | 49.3% |
| Hawaiian / Pacific | 6 | 0.1% |
| Hispanic or Latino | 192 | 1.6% |
| Native / Alaskan | 0 | 0.0% |
| White / Caucasian | 5,490 | 46.6% |
| Two or more Races | 436 | 3.7% |
| Some other Race | 0 | 0.0% |
| Total | 11,789 | 100.0% |
Ancestry in Minden
The most populous ancestries reported in Minden are American (3,383 | 28.7%), English (755 | 6.4%), Irish (620 | 5.3%), German (503 | 4.3%), and African (306 | 2.6%), together accounting for 47.2% of all Minden residents.
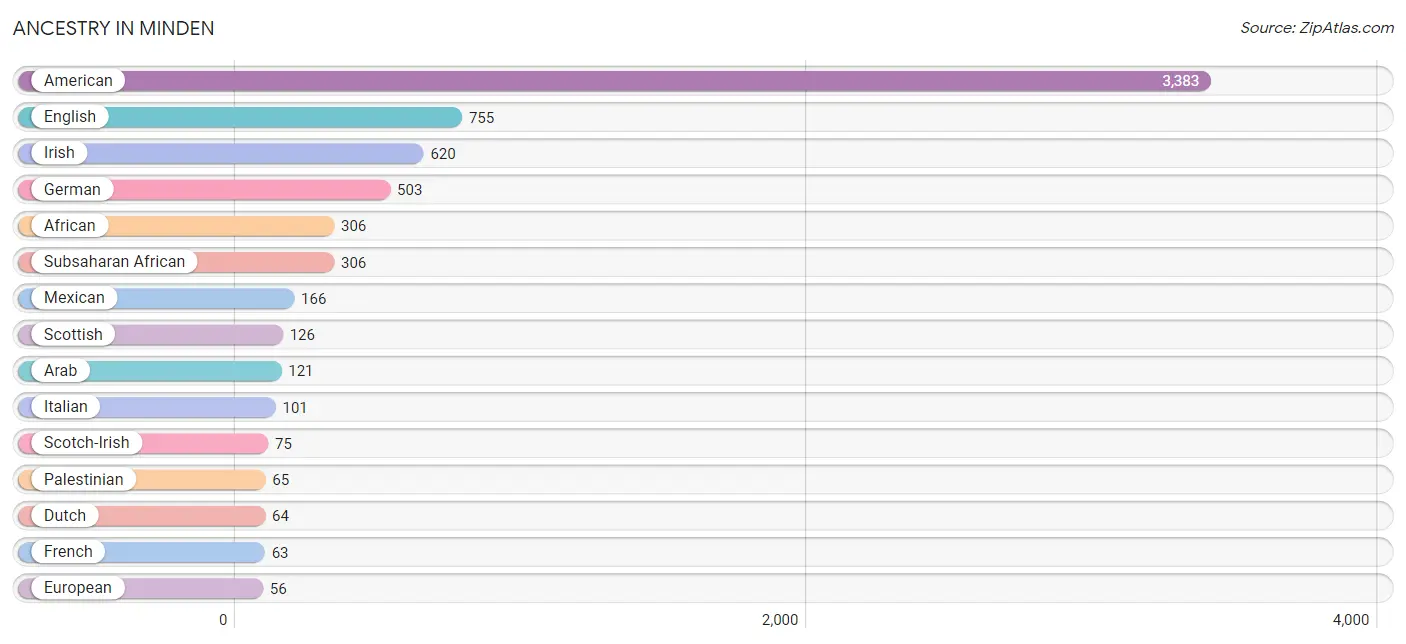
| Ancestry | # Population | % Population |
| African | 306 | 2.6% |
| American | 3,383 | 28.7% |
| Arab | 121 | 1.0% |
| Brazilian | 17 | 0.1% |
| British | 31 | 0.3% |
| Central American | 2 | 0.0% |
| Choctaw | 1 | 0.0% |
| Cuban | 9 | 0.1% |
| Dutch | 64 | 0.5% |
| English | 755 | 6.4% |
| European | 56 | 0.5% |
| French | 63 | 0.5% |
| French Canadian | 8 | 0.1% |
| German | 503 | 4.3% |
| Haitian | 16 | 0.1% |
| Honduran | 2 | 0.0% |
| Irish | 620 | 5.3% |
| Italian | 101 | 0.9% |
| Jamaican | 43 | 0.4% |
| Korean | 21 | 0.2% |
| Lebanese | 49 | 0.4% |
| Mexican | 166 | 1.4% |
| Native Hawaiian | 6 | 0.1% |
| Northern European | 27 | 0.2% |
| Norwegian | 24 | 0.2% |
| Pakistani | 32 | 0.3% |
| Palestinian | 65 | 0.5% |
| Polish | 12 | 0.1% |
| Puerto Rican | 5 | 0.0% |
| Russian | 19 | 0.2% |
| Scotch-Irish | 75 | 0.6% |
| Scottish | 126 | 1.1% |
| Spanish | 10 | 0.1% |
| Sri Lankan | 1 | 0.0% |
| Subsaharan African | 306 | 2.6% |
| Swedish | 12 | 0.1% |
| Syrian | 7 | 0.1% |
| Thai | 15 | 0.1% |
| Ukrainian | 19 | 0.2% |
| Welsh | 27 | 0.2% |
| Yugoslavian | 13 | 0.1% | View All 41 Rows |
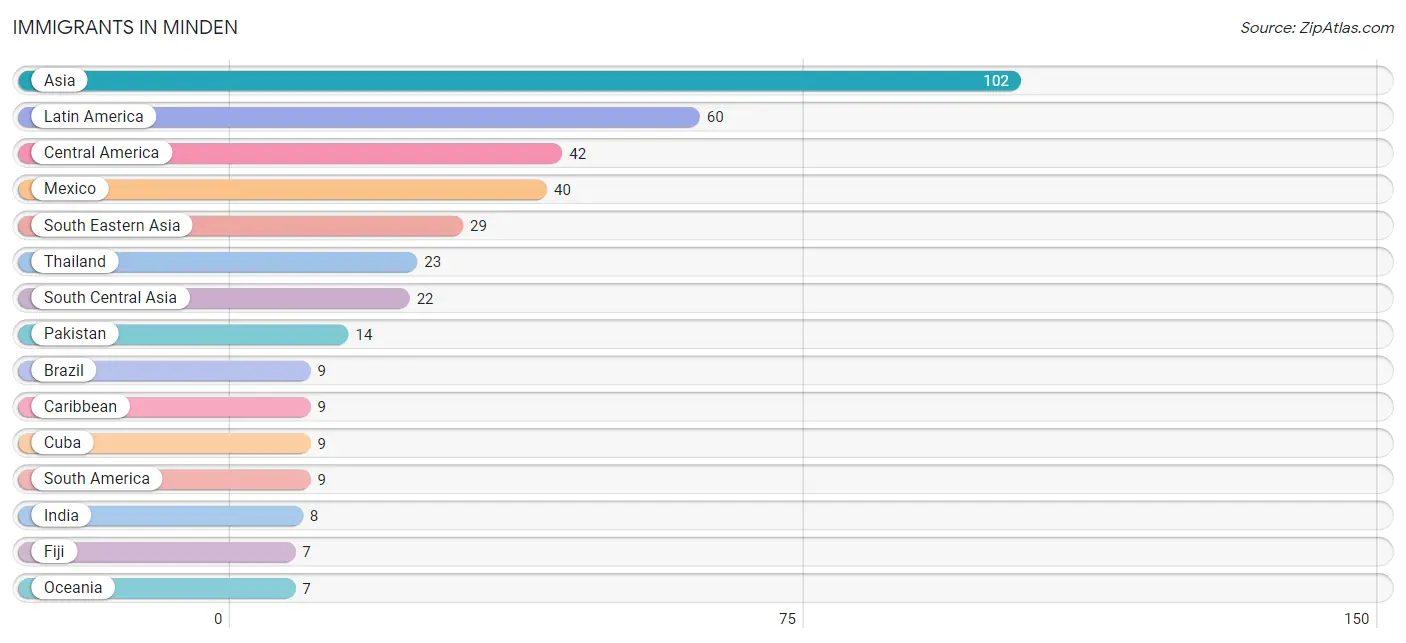
Immigrants in Minden
The most numerous immigrant groups reported in Minden came from Asia (102 | 0.9%), Latin America (60 | 0.5%), Central America (42 | 0.4%), Mexico (40 | 0.3%), and South Eastern Asia (29 | 0.3%), together accounting for 2.3% of all Minden residents.
| Immigration Origin | # Population | % Population |
| Asia | 102 | 0.9% |
| Brazil | 9 | 0.1% |
| Caribbean | 9 | 0.1% |
| Central America | 42 | 0.4% |
| Cuba | 9 | 0.1% |
| Fiji | 7 | 0.1% |
| Honduras | 2 | 0.0% |
| India | 8 | 0.1% |
| Latin America | 60 | 0.5% |
| Mexico | 40 | 0.3% |
| Oceania | 7 | 0.1% |
| Pakistan | 14 | 0.1% |
| Philippines | 5 | 0.0% |
| South America | 9 | 0.1% |
| South Central Asia | 22 | 0.2% |
| South Eastern Asia | 29 | 0.3% |
| Thailand | 23 | 0.2% |
| Vietnam | 1 | 0.0% | View All 18 Rows |
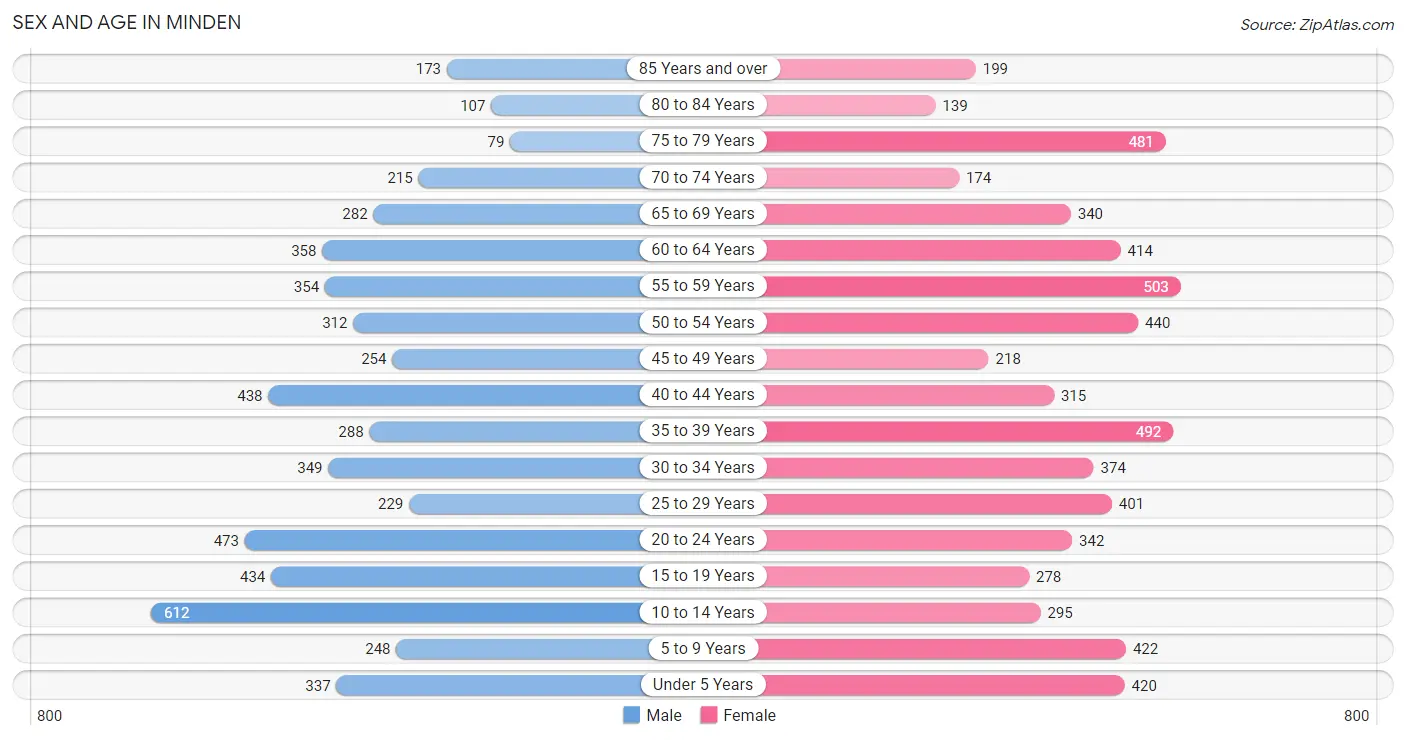
Sex and Age in Minden
Sex and Age in Minden
The most populous age groups in Minden are 10 to 14 Years (612 | 11.0%) for men and 55 to 59 Years (503 | 8.1%) for women.
| Age Bracket | Male | Female |
| Under 5 Years | 337 (6.1%) | 420 (6.7%) |
| 5 to 9 Years | 248 (4.5%) | 422 (6.8%) |
| 10 to 14 Years | 612 (11.0%) | 295 (4.7%) |
| 15 to 19 Years | 434 (7.8%) | 278 (4.4%) |
| 20 to 24 Years | 473 (8.5%) | 342 (5.5%) |
| 25 to 29 Years | 229 (4.1%) | 401 (6.4%) |
| 30 to 34 Years | 349 (6.3%) | 374 (6.0%) |
| 35 to 39 Years | 288 (5.2%) | 492 (7.9%) |
| 40 to 44 Years | 438 (7.9%) | 315 (5.0%) |
| 45 to 49 Years | 254 (4.6%) | 218 (3.5%) |
| 50 to 54 Years | 312 (5.6%) | 440 (7.0%) |
| 55 to 59 Years | 354 (6.4%) | 503 (8.1%) |
| 60 to 64 Years | 358 (6.5%) | 414 (6.6%) |
| 65 to 69 Years | 282 (5.1%) | 340 (5.4%) |
| 70 to 74 Years | 215 (3.9%) | 174 (2.8%) |
| 75 to 79 Years | 79 (1.4%) | 481 (7.7%) |
| 80 to 84 Years | 107 (1.9%) | 139 (2.2%) |
| 85 Years and over | 173 (3.1%) | 199 (3.2%) |
| Total | 5,542 (100.0%) | 6,247 (100.0%) |
Families and Households in Minden
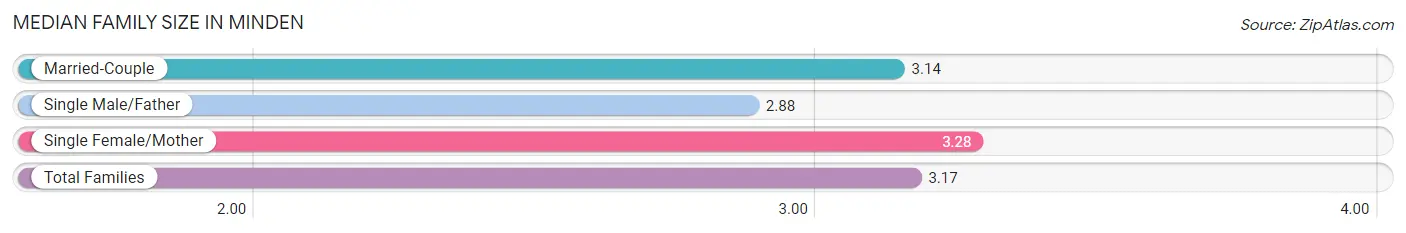
Median Family Size in Minden
The median family size in Minden is 3.17 persons per family, with single female/mother families (905 | 31.0%) accounting for the largest median family size of 3.28 persons per family. On the other hand, single male/father families (216 | 7.4%) represent the smallest median family size with 2.88 persons per family.
| Family Type | # Families | Family Size |
| Married-Couple | 1,801 (61.6%) | 3.14 |
| Single Male/Father | 216 (7.4%) | 2.88 |
| Single Female/Mother | 905 (31.0%) | 3.28 |
| Total Families | 2,922 (100.0%) | 3.17 |
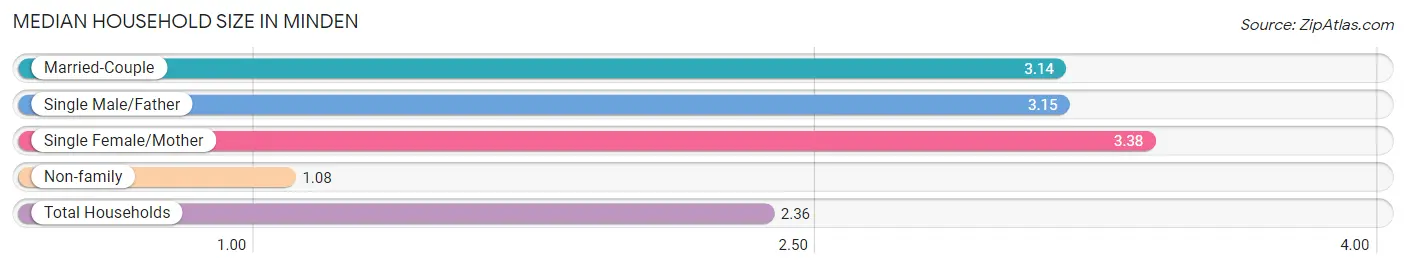
Median Household Size in Minden
The median household size in Minden is 2.36 persons per household, with single female/mother households (905 | 18.6%) accounting for the largest median household size of 3.38 persons per household. non-family households (1,948 | 40.0%) represent the smallest median household size with 1.08 persons per household.
| Household Type | # Households | Household Size |
| Married-Couple | 1,801 (37.0%) | 3.14 |
| Single Male/Father | 216 (4.4%) | 3.15 |
| Single Female/Mother | 905 (18.6%) | 3.38 |
| Non-family | 1,948 (40.0%) | 1.08 |
| Total Households | 4,870 (100.0%) | 2.36 |
Household Size by Marriage Status in Minden
Out of a total of 4,870 households in Minden, 2,922 (60.0%) are family households, while 1,948 (40.0%) are nonfamily households. The most numerous type of family households are 2-person households, comprising 1,145, and the most common type of nonfamily households are 1-person households, comprising 1,825.
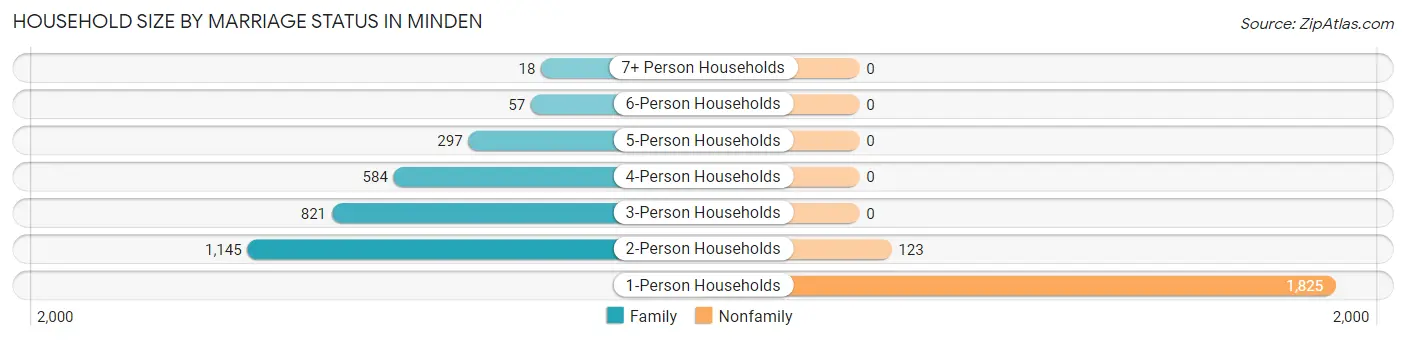
| Household Size | Family Households | Nonfamily Households |
| 1-Person Households | - | 1,825 (37.5%) |
| 2-Person Households | 1,145 (23.5%) | 123 (2.5%) |
| 3-Person Households | 821 (16.9%) | 0 (0.0%) |
| 4-Person Households | 584 (12.0%) | 0 (0.0%) |
| 5-Person Households | 297 (6.1%) | 0 (0.0%) |
| 6-Person Households | 57 (1.2%) | 0 (0.0%) |
| 7+ Person Households | 18 (0.4%) | 0 (0.0%) |
| Total | 2,922 (60.0%) | 1,948 (40.0%) |
Female Fertility in Minden
Fertility by Age in Minden
Average fertility rate in Minden is 36.0 births per 1,000 women. Women in the age bracket of 20 to 34 years have the highest fertility rate with 79.0 births per 1,000 women. Women in the age bracket of 20 to 34 years acount for 98.9% of all women with births.
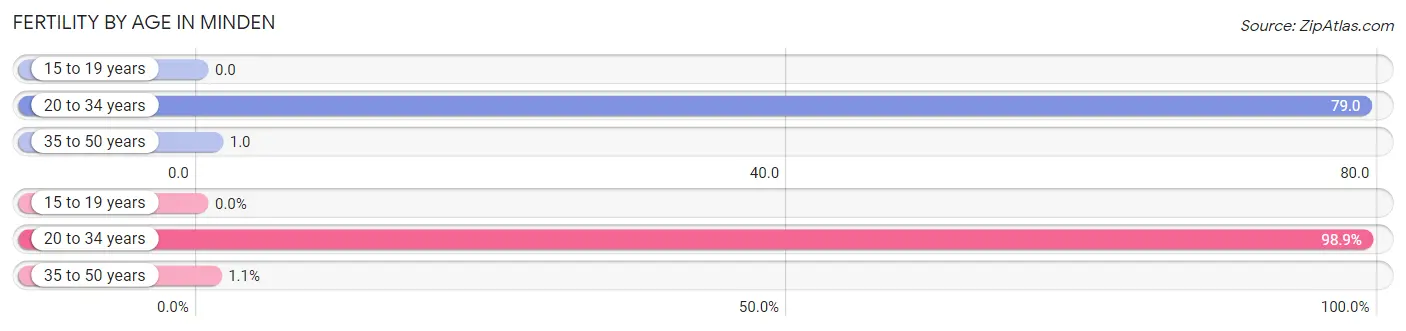
| Age Bracket | Women with Births | Births / 1,000 Women |
| 15 to 19 years | 0 (0.0%) | 0.0 |
| 20 to 34 years | 88 (98.9%) | 79.0 |
| 35 to 50 years | 1 (1.1%) | 1.0 |
| Total | 89 (100.0%) | 36.0 |
Fertility by Age by Marriage Status in Minden
55.1% of women with births (89) in Minden are married. The highest percentage of unmarried women with births falls into 20 to 34 years age bracket with 45.5% of them unmarried at the time of birth, while the lowest percentage of unmarried women with births belong to 35 to 50 years age bracket with 0.0% of them unmarried.
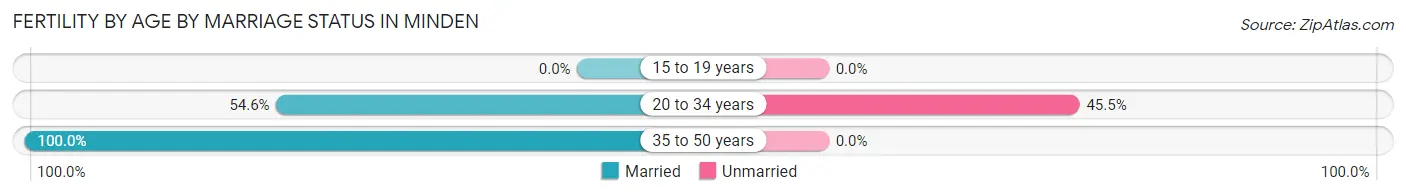
| Age Bracket | Married | Unmarried |
| 15 to 19 years | 0 (0.0%) | 0 (0.0%) |
| 20 to 34 years | 48 (54.5%) | 40 (45.5%) |
| 35 to 50 years | 1 (100.0%) | 0 (0.0%) |
| Total | 49 (55.1%) | 40 (44.9%) |
Fertility by Education in Minden
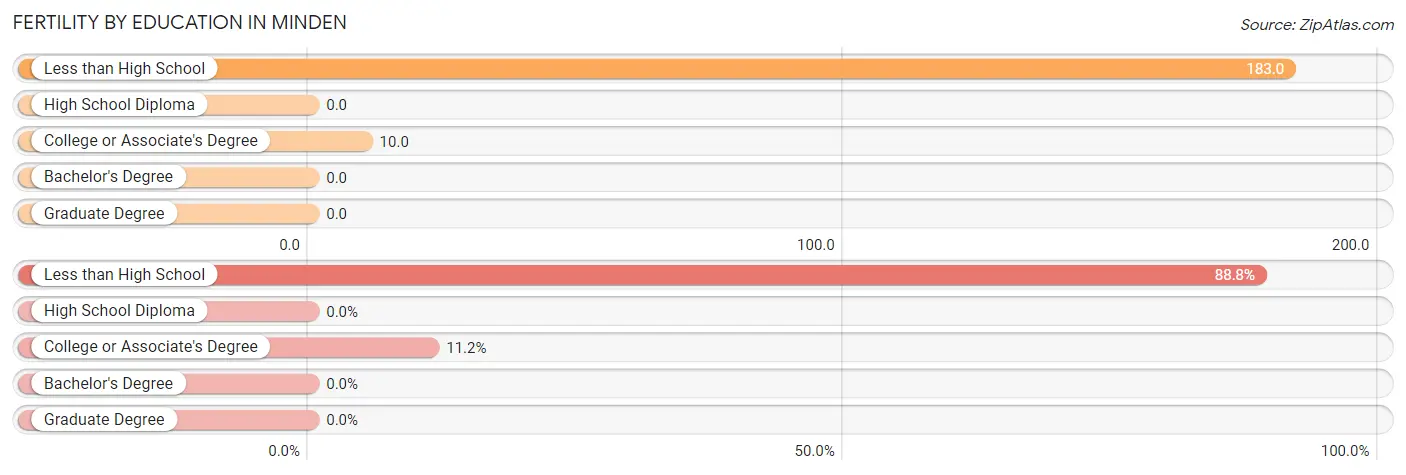
| Educational Attainment | Women with Births | Births / 1,000 Women |
| Less than High School | 79 (88.8%) | 183.0 |
| High School Diploma | 0 (0.0%) | 0.0 |
| College or Associate's Degree | 10 (11.2%) | 10.0 |
| Bachelor's Degree | 0 (0.0%) | 0.0 |
| Graduate Degree | 0 (0.0%) | 0.0 |
| Total | 89 (100.0%) | 36.0 |
Fertility by Education by Marriage Status in Minden
44.9% of women with births in Minden are unmarried. Women with the educational attainment of college or associate's degree are most likely to be married with 100.0% of them married at childbirth, while women with the educational attainment of less than high school are least likely to be married with 50.6% of them unmarried at childbirth.
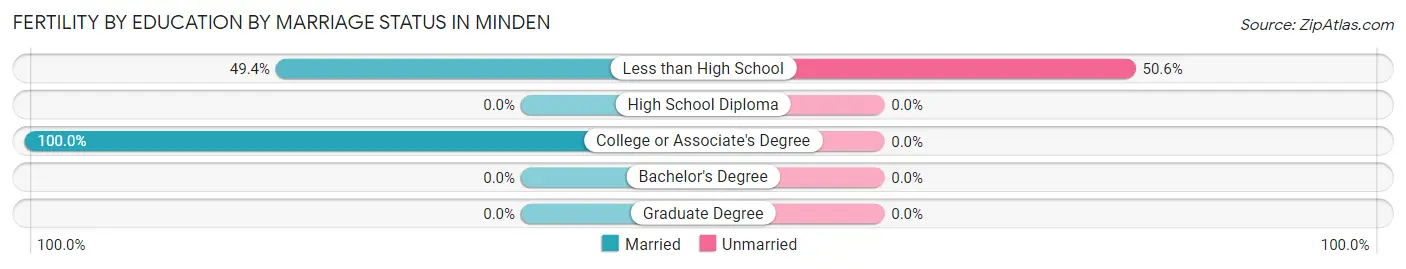
| Educational Attainment | Married | Unmarried |
| Less than High School | 39 (49.4%) | 40 (50.6%) |
| High School Diploma | 0 (0.0%) | 0 (0.0%) |
| College or Associate's Degree | 10 (100.0%) | 0 (0.0%) |
| Bachelor's Degree | 0 (0.0%) | 0 (0.0%) |
| Graduate Degree | 0 (0.0%) | 0 (0.0%) |
| Total | 49 (55.1%) | 40 (44.9%) |
Employment Characteristics in Minden
Employment by Class of Employer in Minden
Among the 4,186 employed individuals in Minden, private company employees (2,925 | 69.9%), local government employees (332 | 7.9%), and state government employees (304 | 7.3%) make up the most common classes of employment.
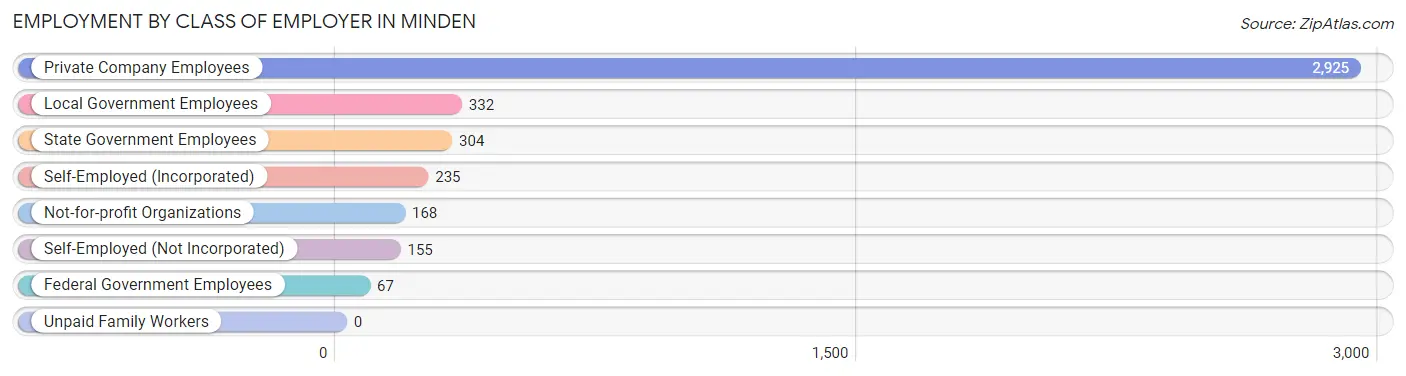
| Employer Class | # Employees | % Employees |
| Private Company Employees | 2,925 | 69.9% |
| Self-Employed (Incorporated) | 235 | 5.6% |
| Self-Employed (Not Incorporated) | 155 | 3.7% |
| Not-for-profit Organizations | 168 | 4.0% |
| Local Government Employees | 332 | 7.9% |
| State Government Employees | 304 | 7.3% |
| Federal Government Employees | 67 | 1.6% |
| Unpaid Family Workers | 0 | 0.0% |
| Total | 4,186 | 100.0% |
Employment Status by Age in Minden
According to the labor force statistics for Minden, out of the total population over 16 years of age (9,386), 46.5% or 4,364 individuals are in the labor force, with 3.4% or 148 of them unemployed. The age group with the highest labor force participation rate is 35 to 44 years, with 73.2% or 1,122 individuals in the labor force. Within the labor force, the 30 to 34 years age range has the highest percentage of unemployed individuals, with 15.2% or 63 of them being unemployed.
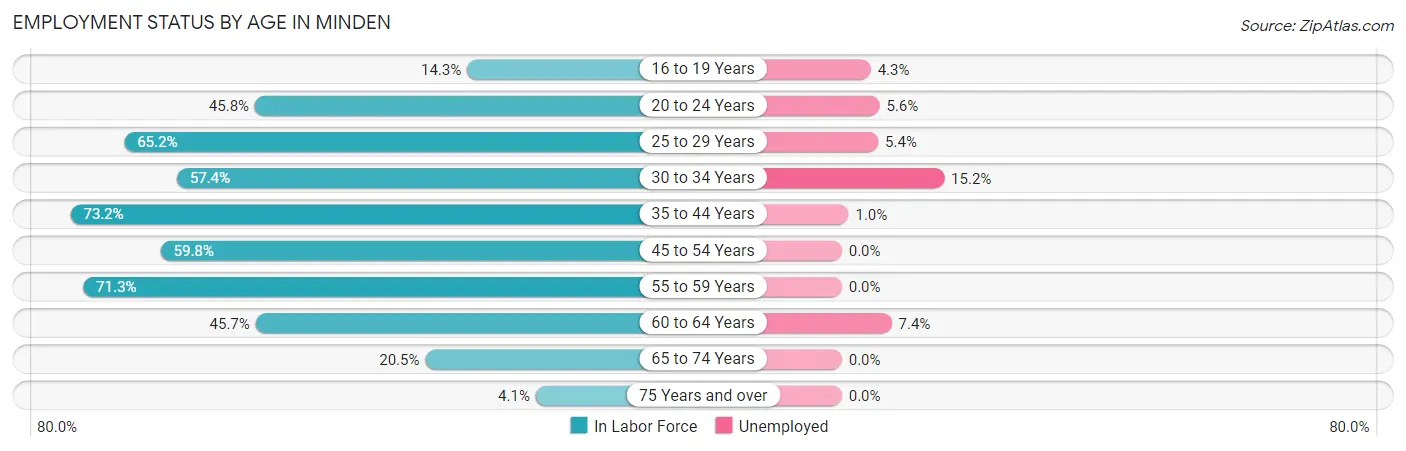
| Age Bracket | In Labor Force | Unemployed |
| 16 to 19 Years | 92 (14.3%) | 4 (4.3%) |
| 20 to 24 Years | 373 (45.8%) | 21 (5.6%) |
| 25 to 29 Years | 411 (65.2%) | 22 (5.4%) |
| 30 to 34 Years | 415 (57.4%) | 63 (15.2%) |
| 35 to 44 Years | 1,122 (73.2%) | 11 (1.0%) |
| 45 to 54 Years | 732 (59.8%) | 0 (0.0%) |
| 55 to 59 Years | 611 (71.3%) | 0 (0.0%) |
| 60 to 64 Years | 353 (45.7%) | 26 (7.4%) |
| 65 to 74 Years | 207 (20.5%) | 0 (0.0%) |
| 75 Years and over | 48 (4.1%) | 0 (0.0%) |
| Total | 4,364 (46.5%) | 148 (3.4%) |
Employment Status by Educational Attainment in Minden
According to labor force statistics for Minden, 63.5% of individuals (3,644) out of the total population between 25 and 64 years of age (5,739) are in the labor force, with 3.3% or 120 of them being unemployed. The group with the highest labor force participation rate are those with the educational attainment of college / associate degree, with 75.6% or 1,472 individuals in the labor force. Within the labor force, individuals with less than high school education have the highest percentage of unemployment, with 9.8% or 15 of them being unemployed.
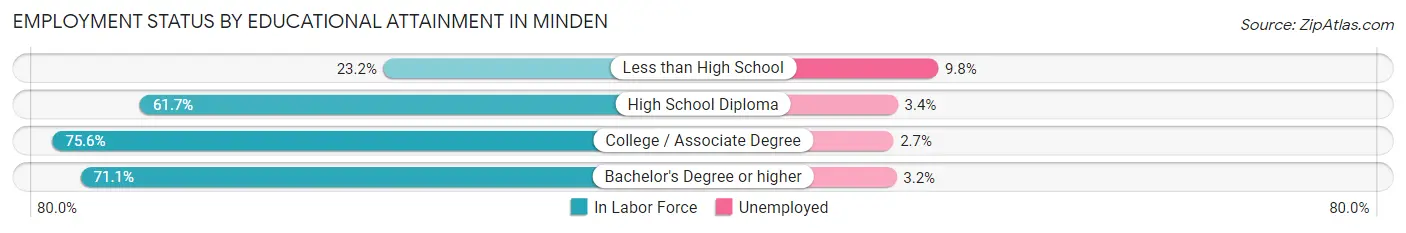
| Educational Attainment | In Labor Force | Unemployed |
| Less than High School | 153 (23.2%) | 65 (9.8%) |
| High School Diploma | 1,357 (61.7%) | 75 (3.4%) |
| College / Associate Degree | 1,472 (75.6%) | 53 (2.7%) |
| Bachelor's Degree or higher | 663 (71.1%) | 30 (3.2%) |
| Total | 3,644 (63.5%) | 189 (3.3%) |
Employment Occupations by Sex in Minden
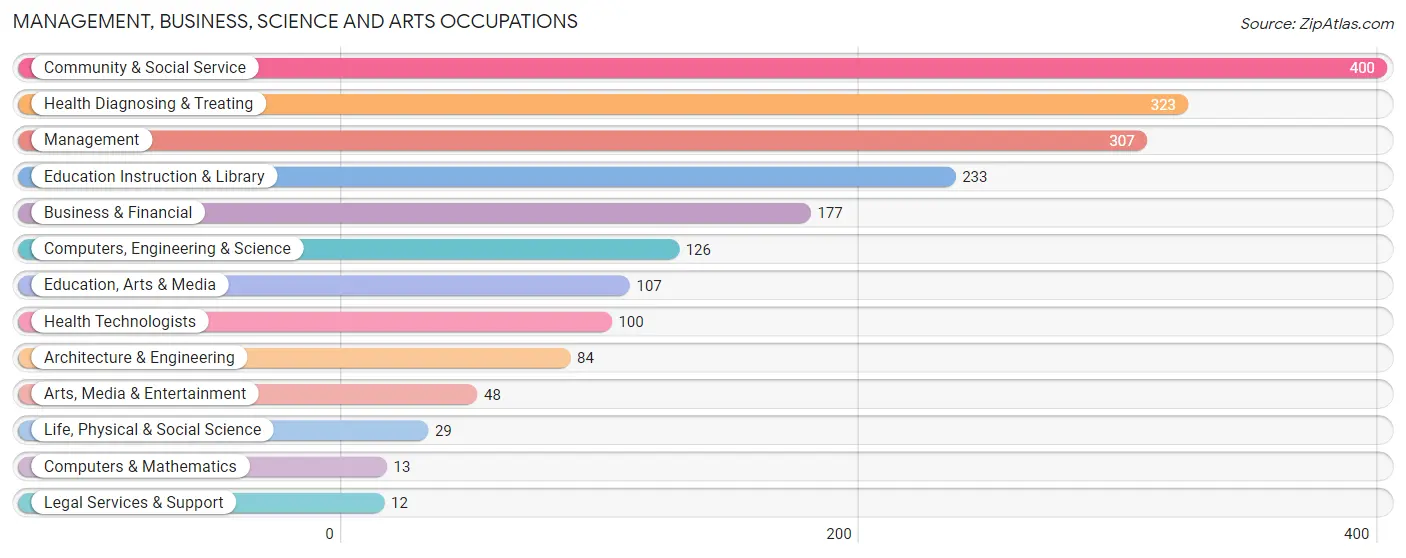
Management, Business, Science and Arts Occupations
The most common Management, Business, Science and Arts occupations in Minden are Community & Social Service (400 | 9.5%), Health Diagnosing & Treating (323 | 7.7%), Management (307 | 7.3%), Education Instruction & Library (233 | 5.5%), and Business & Financial (177 | 4.2%).
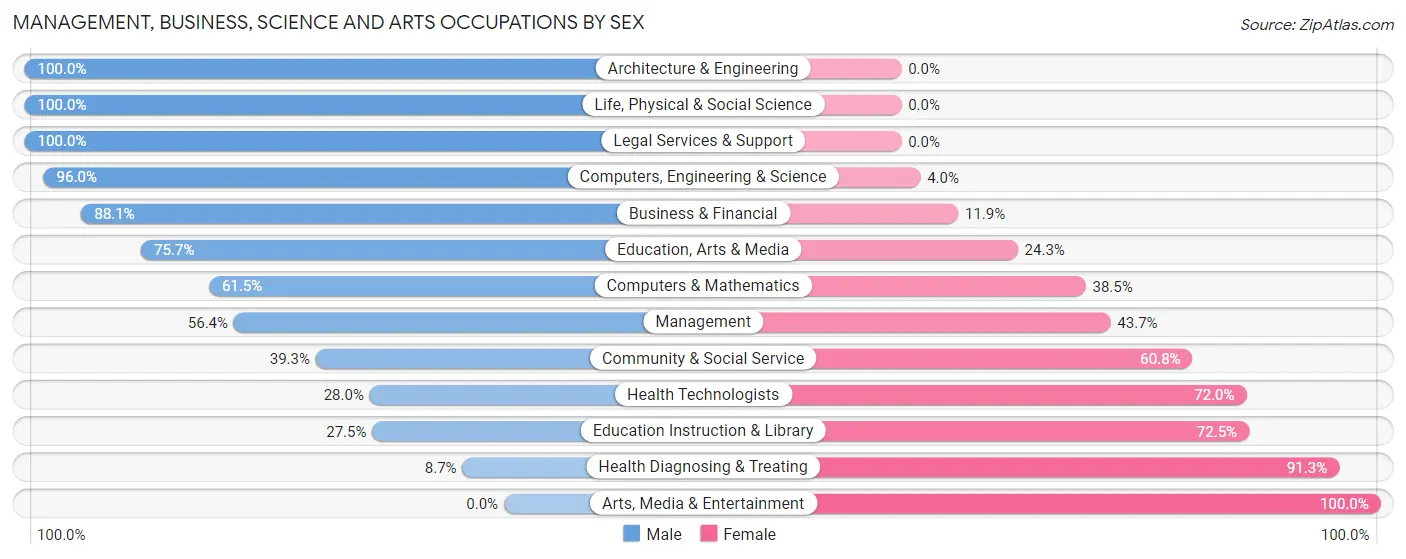
Management, Business, Science and Arts Occupations by Sex
Within the Management, Business, Science and Arts occupations in Minden, the most male-oriented occupations are Architecture & Engineering (100.0%), Life, Physical & Social Science (100.0%), and Legal Services & Support (100.0%), while the most female-oriented occupations are Arts, Media & Entertainment (100.0%), Health Diagnosing & Treating (91.3%), and Education Instruction & Library (72.5%).
| Occupation | Male | Female |
| Management | 173 (56.4%) | 134 (43.6%) |
| Business & Financial | 156 (88.1%) | 21 (11.9%) |
| Computers, Engineering & Science | 121 (96.0%) | 5 (4.0%) |
| Computers & Mathematics | 8 (61.5%) | 5 (38.5%) |
| Architecture & Engineering | 84 (100.0%) | 0 (0.0%) |
| Life, Physical & Social Science | 29 (100.0%) | 0 (0.0%) |
| Community & Social Service | 157 (39.3%) | 243 (60.8%) |
| Education, Arts & Media | 81 (75.7%) | 26 (24.3%) |
| Legal Services & Support | 12 (100.0%) | 0 (0.0%) |
| Education Instruction & Library | 64 (27.5%) | 169 (72.5%) |
| Arts, Media & Entertainment | 0 (0.0%) | 48 (100.0%) |
| Health Diagnosing & Treating | 28 (8.7%) | 295 (91.3%) |
| Health Technologists | 28 (28.0%) | 72 (72.0%) |
| Total (Category) | 635 (47.6%) | 698 (52.4%) |
| Total (Overall) | 2,068 (49.0%) | 2,149 (51.0%) |
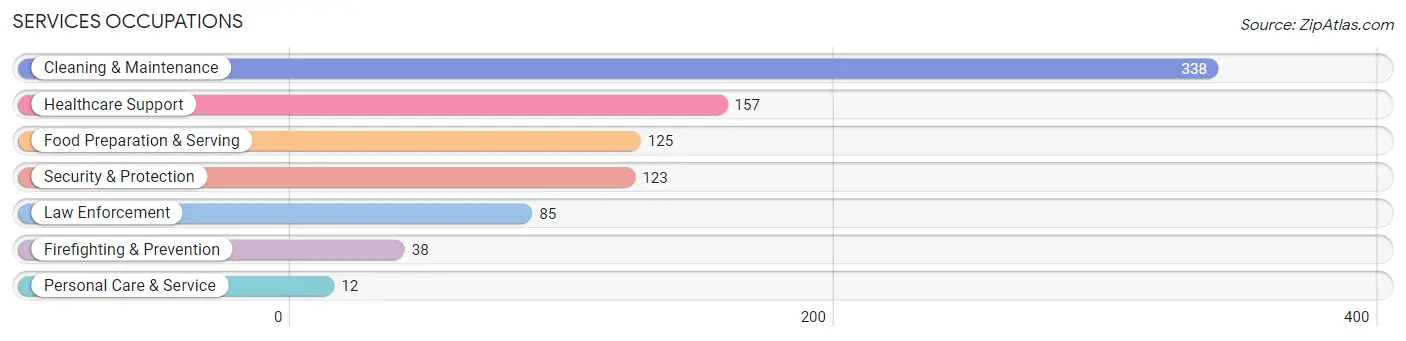
Services Occupations
The most common Services occupations in Minden are Cleaning & Maintenance (338 | 8.0%), Healthcare Support (157 | 3.7%), Food Preparation & Serving (125 | 3.0%), Security & Protection (123 | 2.9%), and Law Enforcement (85 | 2.0%).
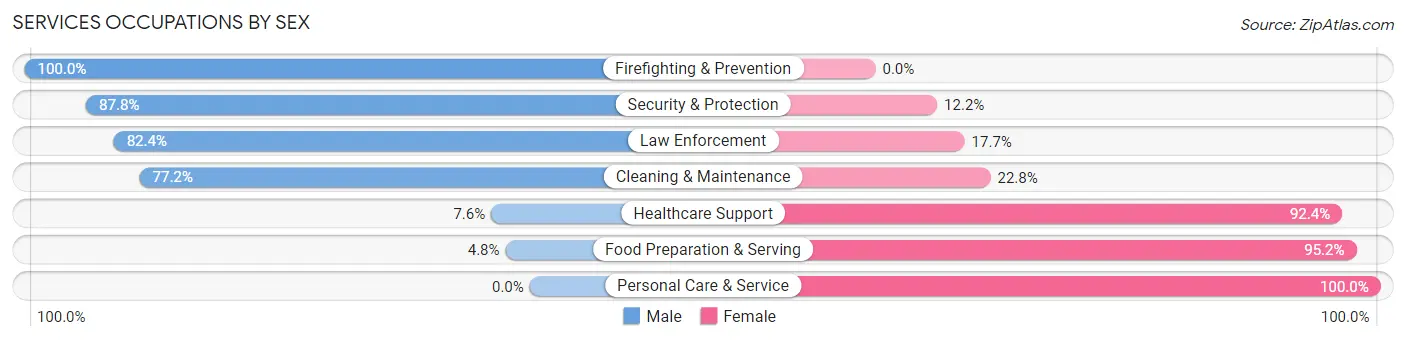
Services Occupations by Sex
Within the Services occupations in Minden, the most male-oriented occupations are Firefighting & Prevention (100.0%), Security & Protection (87.8%), and Law Enforcement (82.4%), while the most female-oriented occupations are Personal Care & Service (100.0%), Food Preparation & Serving (95.2%), and Healthcare Support (92.4%).
| Occupation | Male | Female |
| Healthcare Support | 12 (7.6%) | 145 (92.4%) |
| Security & Protection | 108 (87.8%) | 15 (12.2%) |
| Firefighting & Prevention | 38 (100.0%) | 0 (0.0%) |
| Law Enforcement | 70 (82.4%) | 15 (17.6%) |
| Food Preparation & Serving | 6 (4.8%) | 119 (95.2%) |
| Cleaning & Maintenance | 261 (77.2%) | 77 (22.8%) |
| Personal Care & Service | 0 (0.0%) | 12 (100.0%) |
| Total (Category) | 387 (51.3%) | 368 (48.7%) |
| Total (Overall) | 2,068 (49.0%) | 2,149 (51.0%) |
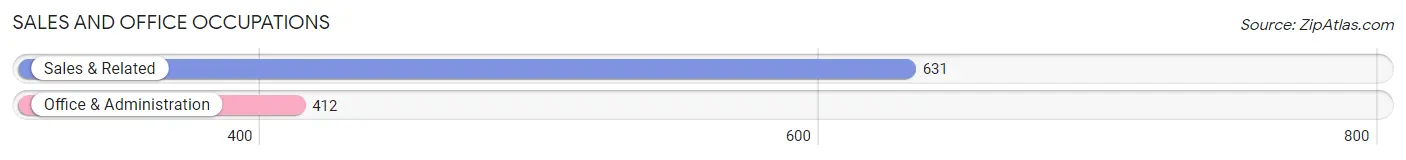
Sales and Office Occupations
The most common Sales and Office occupations in Minden are Sales & Related (631 | 15.0%), and Office & Administration (412 | 9.8%).
Sales and Office Occupations by Sex
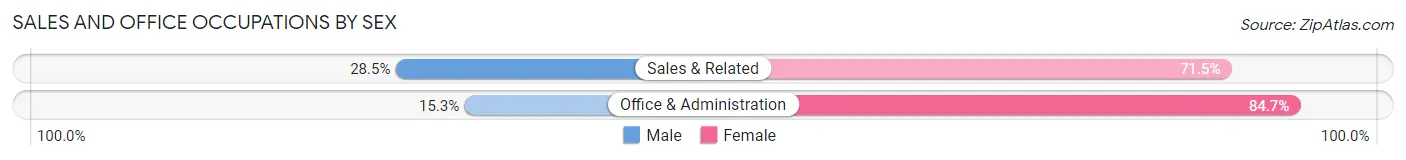
| Occupation | Male | Female |
| Sales & Related | 180 (28.5%) | 451 (71.5%) |
| Office & Administration | 63 (15.3%) | 349 (84.7%) |
| Total (Category) | 243 (23.3%) | 800 (76.7%) |
| Total (Overall) | 2,068 (49.0%) | 2,149 (51.0%) |
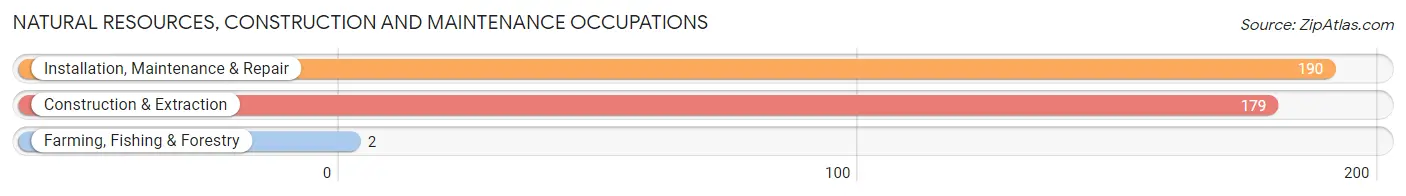
Natural Resources, Construction and Maintenance Occupations
The most common Natural Resources, Construction and Maintenance occupations in Minden are Installation, Maintenance & Repair (190 | 4.5%), Construction & Extraction (179 | 4.2%), and Farming, Fishing & Forestry (2 | 0.1%).
Natural Resources, Construction and Maintenance Occupations by Sex
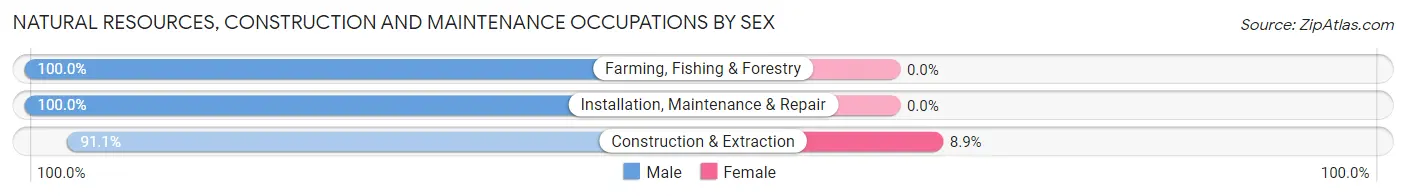
| Occupation | Male | Female |
| Farming, Fishing & Forestry | 2 (100.0%) | 0 (0.0%) |
| Construction & Extraction | 163 (91.1%) | 16 (8.9%) |
| Installation, Maintenance & Repair | 190 (100.0%) | 0 (0.0%) |
| Total (Category) | 355 (95.7%) | 16 (4.3%) |
| Total (Overall) | 2,068 (49.0%) | 2,149 (51.0%) |
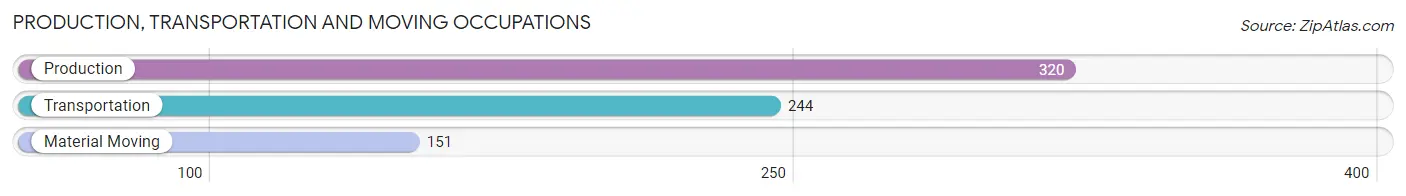
Production, Transportation and Moving Occupations
The most common Production, Transportation and Moving occupations in Minden are Production (320 | 7.6%), Transportation (244 | 5.8%), and Material Moving (151 | 3.6%).
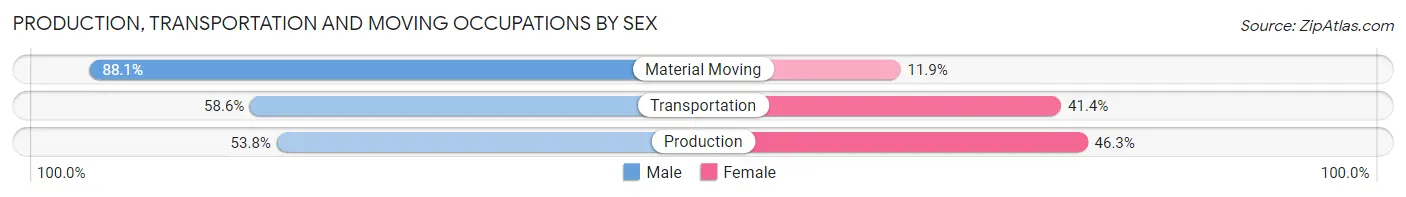
Production, Transportation and Moving Occupations by Sex
| Occupation | Male | Female |
| Production | 172 (53.7%) | 148 (46.3%) |
| Transportation | 143 (58.6%) | 101 (41.4%) |
| Material Moving | 133 (88.1%) | 18 (11.9%) |
| Total (Category) | 448 (62.7%) | 267 (37.3%) |
| Total (Overall) | 2,068 (49.0%) | 2,149 (51.0%) |
Employment Industries by Sex in Minden
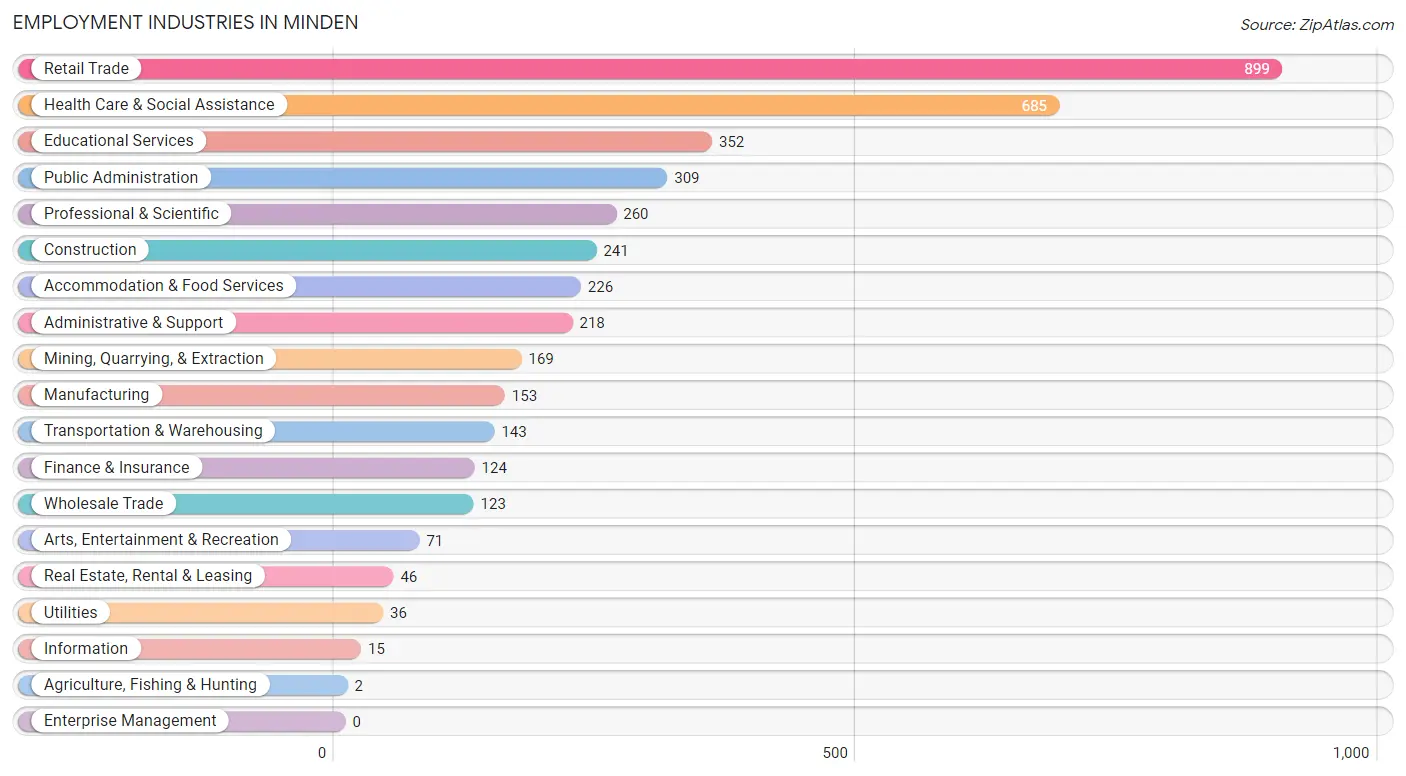
Employment Industries in Minden
The major employment industries in Minden include Retail Trade (899 | 21.3%), Health Care & Social Assistance (685 | 16.2%), Educational Services (352 | 8.4%), Public Administration (309 | 7.3%), and Professional & Scientific (260 | 6.2%).
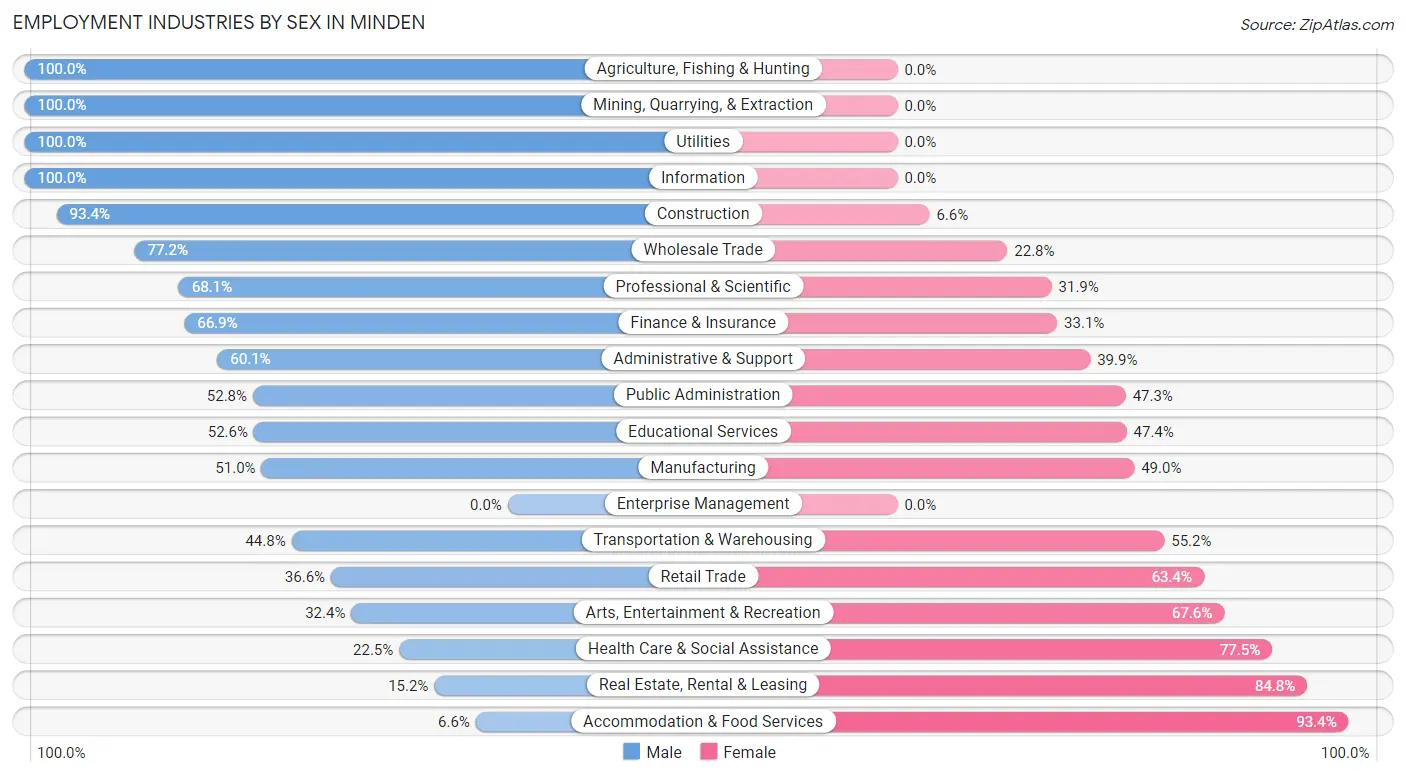
Employment Industries by Sex in Minden
The Minden industries that see more men than women are Agriculture, Fishing & Hunting (100.0%), Mining, Quarrying, & Extraction (100.0%), and Utilities (100.0%), whereas the industries that tend to have a higher number of women are Accommodation & Food Services (93.4%), Real Estate, Rental & Leasing (84.8%), and Health Care & Social Assistance (77.5%).
| Industry | Male | Female |
| Agriculture, Fishing & Hunting | 2 (100.0%) | 0 (0.0%) |
| Mining, Quarrying, & Extraction | 169 (100.0%) | 0 (0.0%) |
| Construction | 225 (93.4%) | 16 (6.6%) |
| Manufacturing | 78 (51.0%) | 75 (49.0%) |
| Wholesale Trade | 95 (77.2%) | 28 (22.8%) |
| Retail Trade | 329 (36.6%) | 570 (63.4%) |
| Transportation & Warehousing | 64 (44.8%) | 79 (55.2%) |
| Utilities | 36 (100.0%) | 0 (0.0%) |
| Information | 15 (100.0%) | 0 (0.0%) |
| Finance & Insurance | 83 (66.9%) | 41 (33.1%) |
| Real Estate, Rental & Leasing | 7 (15.2%) | 39 (84.8%) |
| Professional & Scientific | 177 (68.1%) | 83 (31.9%) |
| Enterprise Management | 0 (0.0%) | 0 (0.0%) |
| Administrative & Support | 131 (60.1%) | 87 (39.9%) |
| Educational Services | 185 (52.6%) | 167 (47.4%) |
| Health Care & Social Assistance | 154 (22.5%) | 531 (77.5%) |
| Arts, Entertainment & Recreation | 23 (32.4%) | 48 (67.6%) |
| Accommodation & Food Services | 15 (6.6%) | 211 (93.4%) |
| Public Administration | 163 (52.7%) | 146 (47.2%) |
| Total | 2,068 (49.0%) | 2,149 (51.0%) |
Education in Minden
School Enrollment in Minden
The most common levels of schooling among the 2,734 students in Minden are middle school (868 | 31.8%), high school (643 | 23.5%), and elementary school (563 | 20.6%).
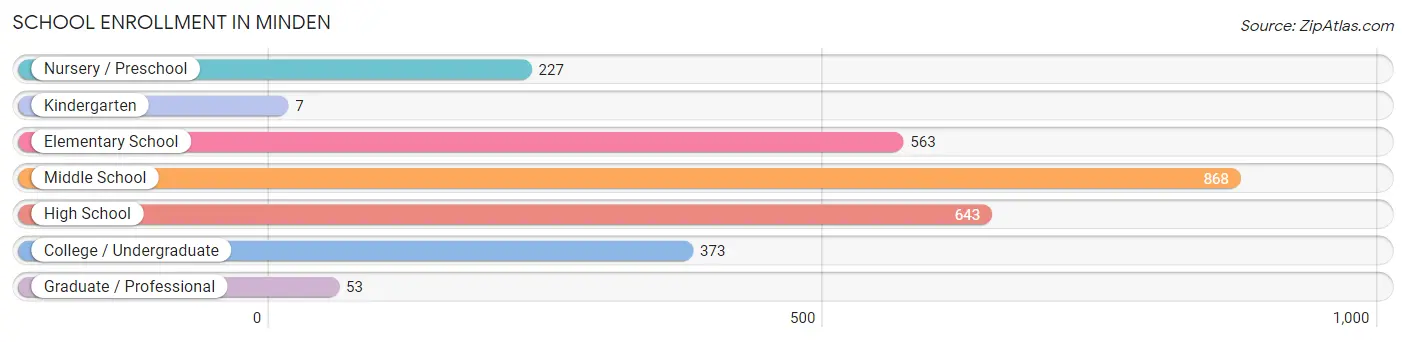
| School Level | # Students | % Students |
| Nursery / Preschool | 227 | 8.3% |
| Kindergarten | 7 | 0.3% |
| Elementary School | 563 | 20.6% |
| Middle School | 868 | 31.8% |
| High School | 643 | 23.5% |
| College / Undergraduate | 373 | 13.6% |
| Graduate / Professional | 53 | 1.9% |
| Total | 2,734 | 100.0% |
School Enrollment by Age by Funding Source in Minden
Out of a total of 2,734 students who are enrolled in schools in Minden, 342 (12.5%) attend a private institution, while the remaining 2,392 (87.5%) are enrolled in public schools. The age group of 35 years and over has the highest likelihood of being enrolled in private schools, with 46 (34.8% in the age bracket) enrolled. Conversely, the age group of 25 to 34 year olds has the lowest likelihood of being enrolled in a private school, with 37 (100.0% in the age bracket) attending a public institution.
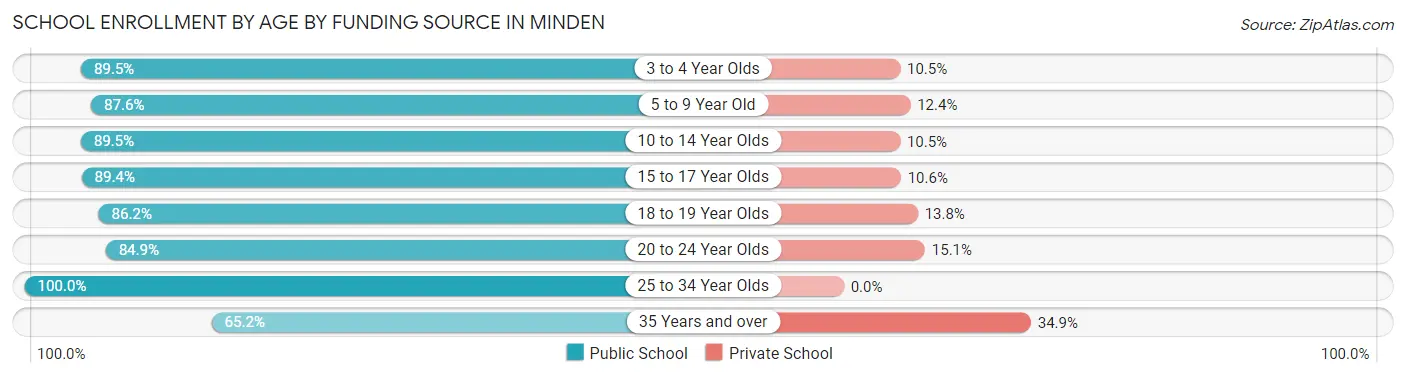
| Age Bracket | Public School | Private School |
| 3 to 4 Year Olds | 179 (89.5%) | 21 (10.5%) |
| 5 to 9 Year Old | 537 (87.6%) | 76 (12.4%) |
| 10 to 14 Year Olds | 794 (89.5%) | 93 (10.5%) |
| 15 to 17 Year Olds | 412 (89.4%) | 49 (10.6%) |
| 18 to 19 Year Olds | 200 (86.2%) | 32 (13.8%) |
| 20 to 24 Year Olds | 146 (84.9%) | 26 (15.1%) |
| 25 to 34 Year Olds | 37 (100.0%) | 0 (0.0%) |
| 35 Years and over | 86 (65.1%) | 46 (34.8%) |
| Total | 2,392 (87.5%) | 342 (12.5%) |
Educational Attainment by Field of Study in Minden
Education (397 | 27.3%), business (237 | 16.3%), liberal arts & history (199 | 13.7%), science & technology (149 | 10.2%), and arts & humanities (137 | 9.4%) are the most common fields of study among 1,457 individuals in Minden who have obtained a bachelor's degree or higher.
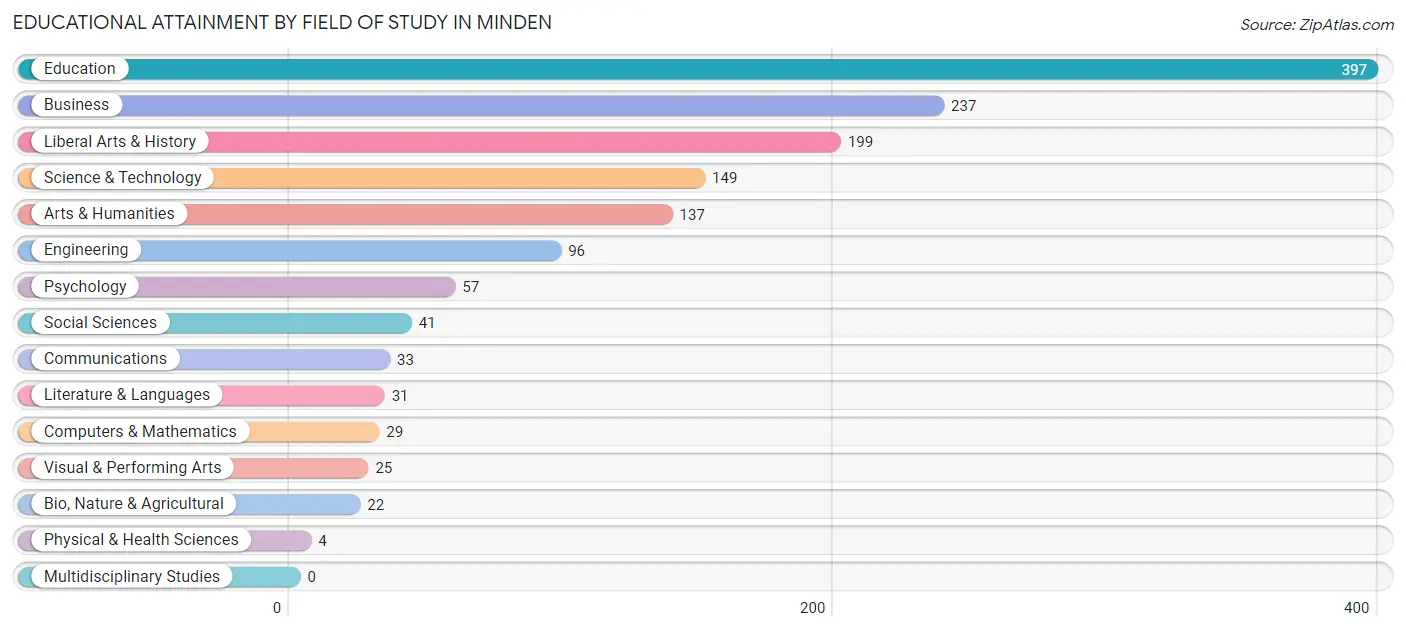
| Field of Study | # Graduates | % Graduates |
| Computers & Mathematics | 29 | 2.0% |
| Bio, Nature & Agricultural | 22 | 1.5% |
| Physical & Health Sciences | 4 | 0.3% |
| Psychology | 57 | 3.9% |
| Social Sciences | 41 | 2.8% |
| Engineering | 96 | 6.6% |
| Multidisciplinary Studies | 0 | 0.0% |
| Science & Technology | 149 | 10.2% |
| Business | 237 | 16.3% |
| Education | 397 | 27.3% |
| Literature & Languages | 31 | 2.1% |
| Liberal Arts & History | 199 | 13.7% |
| Visual & Performing Arts | 25 | 1.7% |
| Communications | 33 | 2.3% |
| Arts & Humanities | 137 | 9.4% |
| Total | 1,457 | 100.0% |
Transportation & Commute in Minden
Vehicle Availability by Sex in Minden
The most prevalent vehicle ownership categories in Minden are males with 2 vehicles (869, accounting for 42.9%) and females with 2 vehicles (854, making up 40.6%).
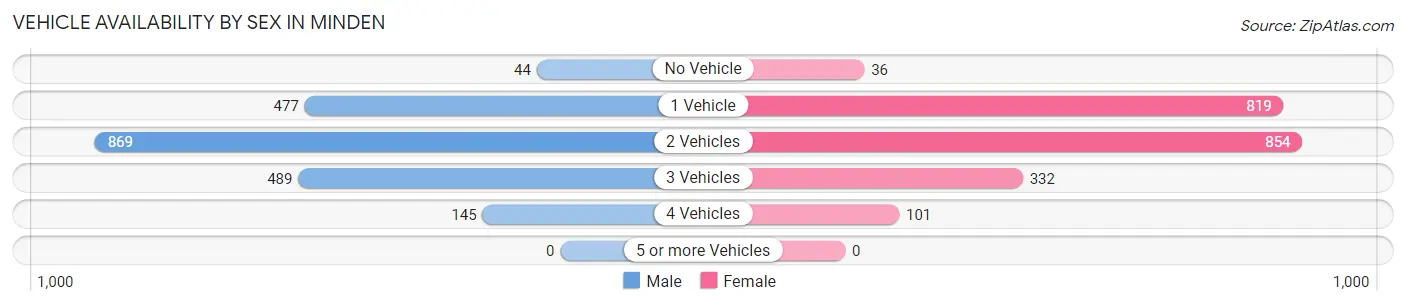
| Vehicles Available | Male | Female |
| No Vehicle | 44 (2.2%) | 36 (1.7%) |
| 1 Vehicle | 477 (23.6%) | 819 (38.2%) |
| 2 Vehicles | 869 (42.9%) | 854 (39.9%) |
| 3 Vehicles | 489 (24.2%) | 332 (15.5%) |
| 4 Vehicles | 145 (7.2%) | 101 (4.7%) |
| 5 or more Vehicles | 0 (0.0%) | 0 (0.0%) |
| Total | 2,024 (100.0%) | 2,142 (100.0%) |
Commute Time in Minden
The most frequently occuring commute durations in Minden are 10 to 14 minutes (1,541 commuters, 39.7%), 5 to 9 minutes (513 commuters, 13.2%), and 15 to 19 minutes (417 commuters, 10.7%).
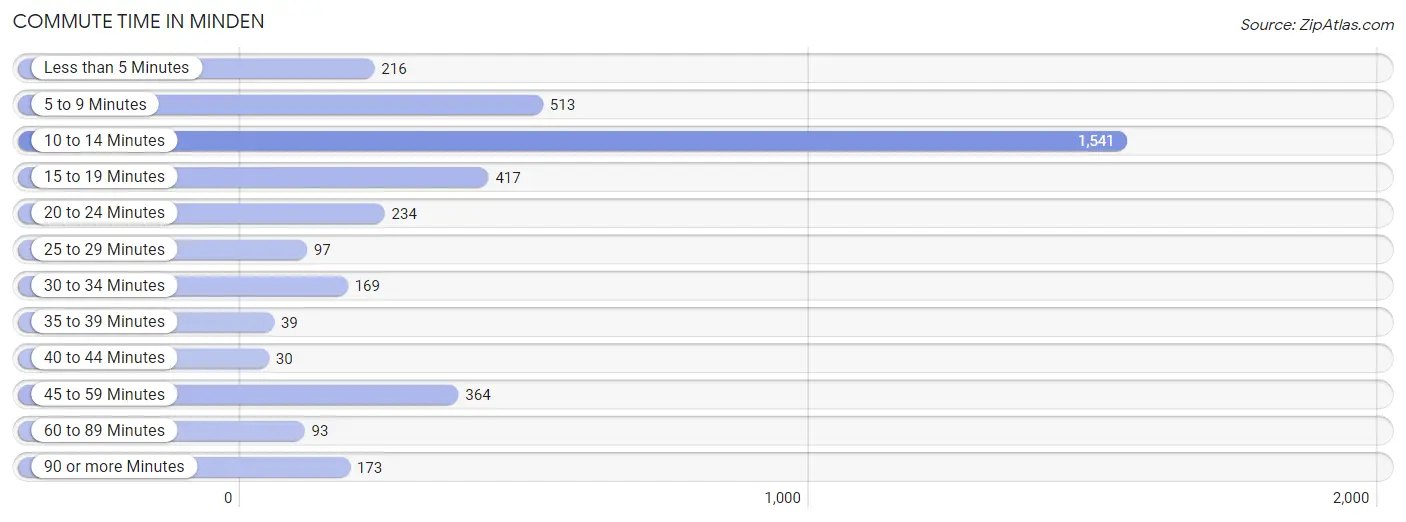
| Commute Time | # Commuters | % Commuters |
| Less than 5 Minutes | 216 | 5.6% |
| 5 to 9 Minutes | 513 | 13.2% |
| 10 to 14 Minutes | 1,541 | 39.7% |
| 15 to 19 Minutes | 417 | 10.7% |
| 20 to 24 Minutes | 234 | 6.0% |
| 25 to 29 Minutes | 97 | 2.5% |
| 30 to 34 Minutes | 169 | 4.3% |
| 35 to 39 Minutes | 39 | 1.0% |
| 40 to 44 Minutes | 30 | 0.8% |
| 45 to 59 Minutes | 364 | 9.4% |
| 60 to 89 Minutes | 93 | 2.4% |
| 90 or more Minutes | 173 | 4.4% |
Commute Time by Sex in Minden
The most common commute times in Minden are 10 to 14 minutes (730 commuters, 37.1%) for males and 10 to 14 minutes (811 commuters, 42.3%) for females.
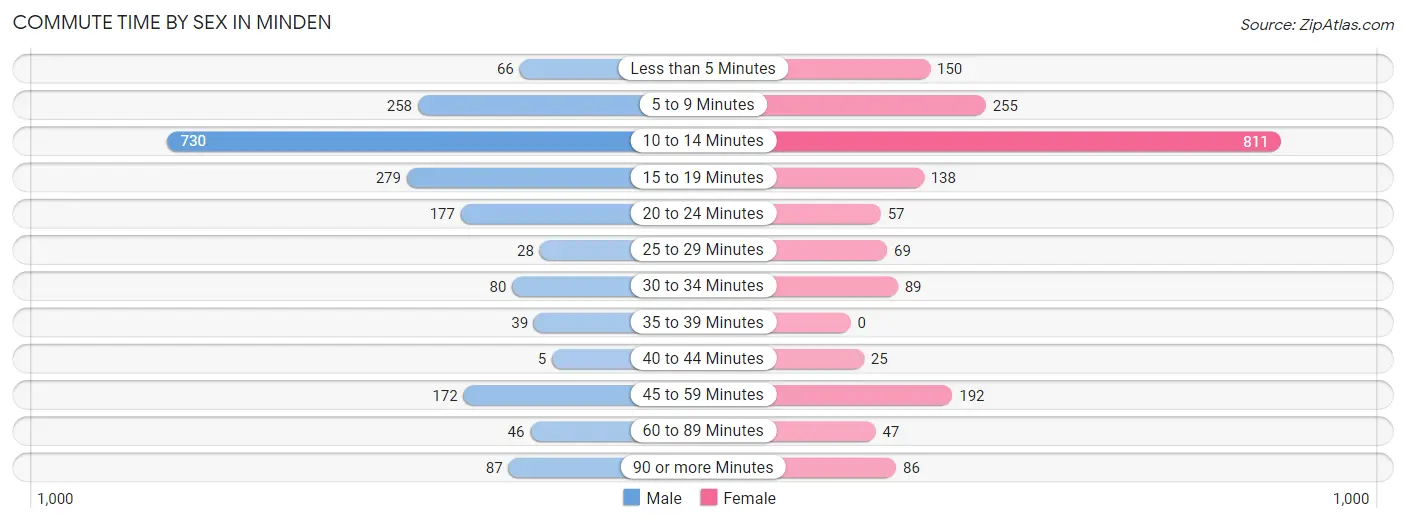
| Commute Time | Male | Female |
| Less than 5 Minutes | 66 (3.4%) | 150 (7.8%) |
| 5 to 9 Minutes | 258 (13.1%) | 255 (13.3%) |
| 10 to 14 Minutes | 730 (37.1%) | 811 (42.3%) |
| 15 to 19 Minutes | 279 (14.2%) | 138 (7.2%) |
| 20 to 24 Minutes | 177 (9.0%) | 57 (3.0%) |
| 25 to 29 Minutes | 28 (1.4%) | 69 (3.6%) |
| 30 to 34 Minutes | 80 (4.1%) | 89 (4.6%) |
| 35 to 39 Minutes | 39 (2.0%) | 0 (0.0%) |
| 40 to 44 Minutes | 5 (0.3%) | 25 (1.3%) |
| 45 to 59 Minutes | 172 (8.7%) | 192 (10.0%) |
| 60 to 89 Minutes | 46 (2.3%) | 47 (2.5%) |
| 90 or more Minutes | 87 (4.4%) | 86 (4.5%) |
Time of Departure to Work by Sex in Minden
The most frequent times of departure to work in Minden are 7:00 AM to 7:29 AM (479, 24.3%) for males and 8:00 AM to 8:29 AM (343, 17.9%) for females.
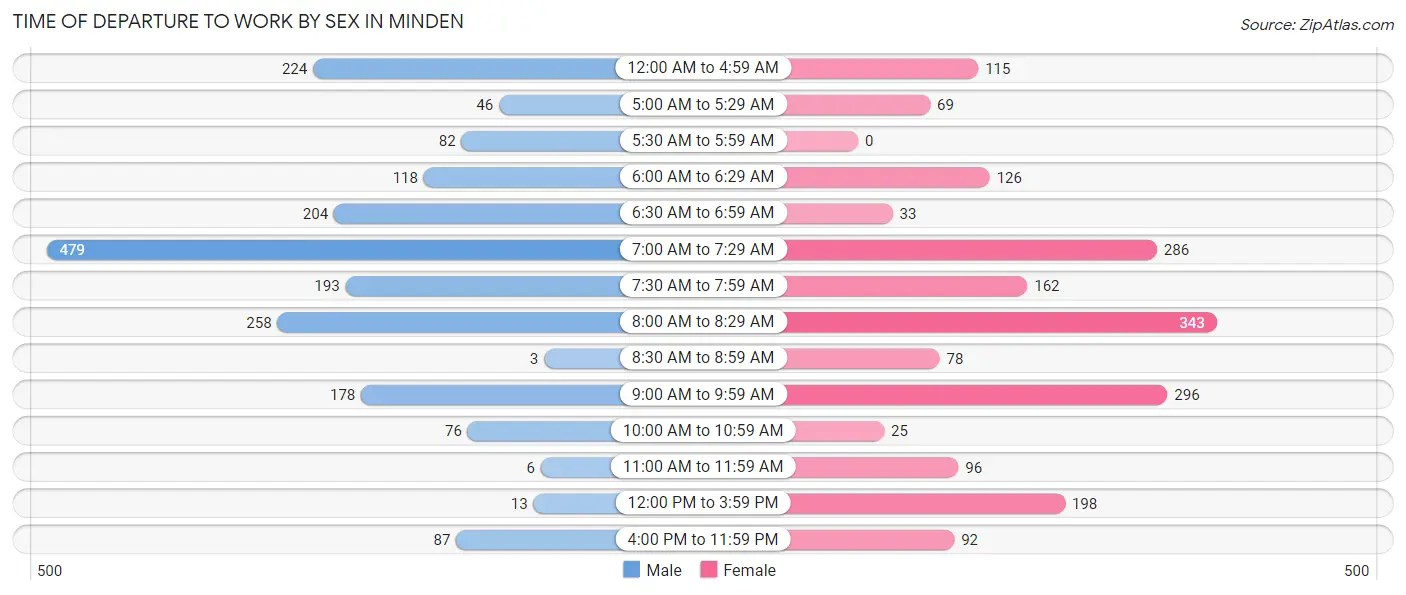
| Time of Departure | Male | Female |
| 12:00 AM to 4:59 AM | 224 (11.4%) | 115 (6.0%) |
| 5:00 AM to 5:29 AM | 46 (2.3%) | 69 (3.6%) |
| 5:30 AM to 5:59 AM | 82 (4.2%) | 0 (0.0%) |
| 6:00 AM to 6:29 AM | 118 (6.0%) | 126 (6.6%) |
| 6:30 AM to 6:59 AM | 204 (10.4%) | 33 (1.7%) |
| 7:00 AM to 7:29 AM | 479 (24.3%) | 286 (14.9%) |
| 7:30 AM to 7:59 AM | 193 (9.8%) | 162 (8.4%) |
| 8:00 AM to 8:29 AM | 258 (13.1%) | 343 (17.9%) |
| 8:30 AM to 8:59 AM | 3 (0.2%) | 78 (4.1%) |
| 9:00 AM to 9:59 AM | 178 (9.0%) | 296 (15.4%) |
| 10:00 AM to 10:59 AM | 76 (3.9%) | 25 (1.3%) |
| 11:00 AM to 11:59 AM | 6 (0.3%) | 96 (5.0%) |
| 12:00 PM to 3:59 PM | 13 (0.7%) | 198 (10.3%) |
| 4:00 PM to 11:59 PM | 87 (4.4%) | 92 (4.8%) |
| Total | 1,967 (100.0%) | 1,919 (100.0%) |
Housing Occupancy in Minden
Occupancy by Ownership in Minden
Of the total 4,870 dwellings in Minden, owner-occupied units account for 2,546 (52.3%), while renter-occupied units make up 2,324 (47.7%).
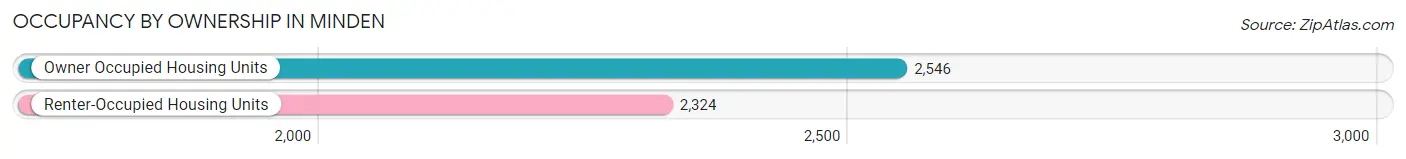
| Occupancy | # Housing Units | % Housing Units |
| Owner Occupied Housing Units | 2,546 | 52.3% |
| Renter-Occupied Housing Units | 2,324 | 47.7% |
| Total Occupied Housing Units | 4,870 | 100.0% |
Occupancy by Household Size in Minden
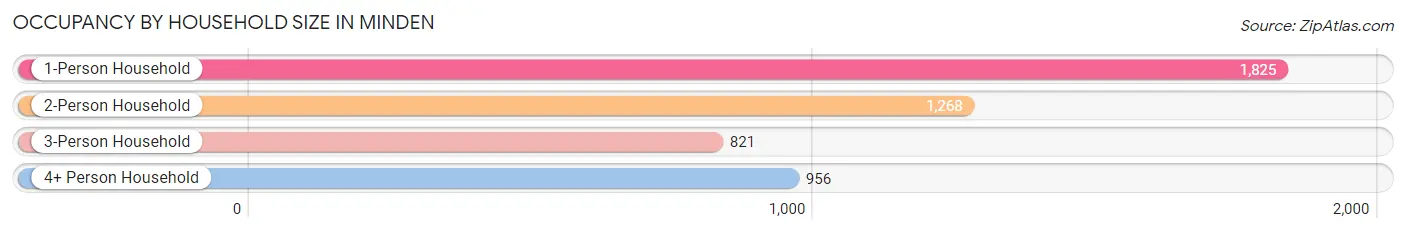
| Household Size | # Housing Units | % Housing Units |
| 1-Person Household | 1,825 | 37.5% |
| 2-Person Household | 1,268 | 26.0% |
| 3-Person Household | 821 | 16.9% |
| 4+ Person Household | 956 | 19.6% |
| Total Housing Units | 4,870 | 100.0% |
Occupancy by Ownership by Household Size in Minden
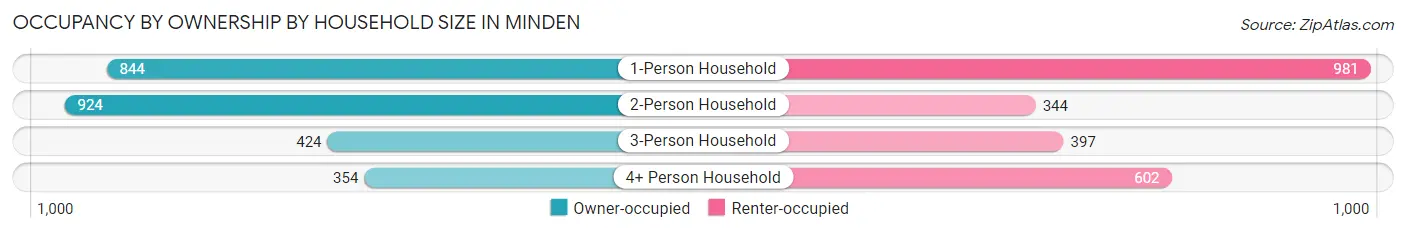
| Household Size | Owner-occupied | Renter-occupied |
| 1-Person Household | 844 (46.3%) | 981 (53.7%) |
| 2-Person Household | 924 (72.9%) | 344 (27.1%) |
| 3-Person Household | 424 (51.6%) | 397 (48.4%) |
| 4+ Person Household | 354 (37.0%) | 602 (63.0%) |
| Total Housing Units | 2,546 (52.3%) | 2,324 (47.7%) |
Occupancy by Educational Attainment in Minden
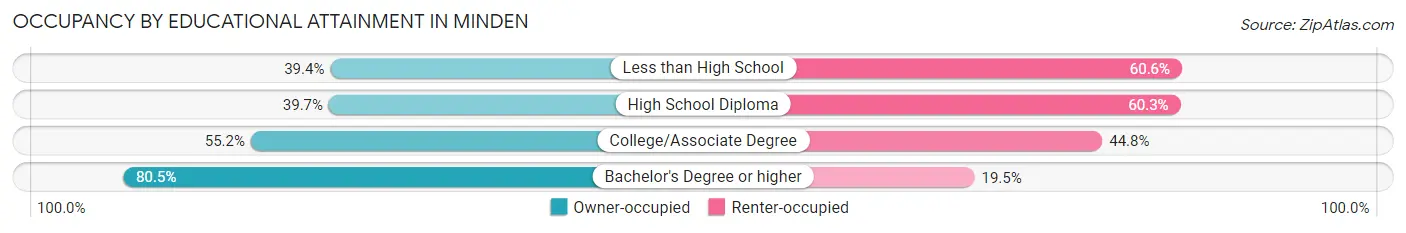
| Household Size | Owner-occupied | Renter-occupied |
| Less than High School | 223 (39.4%) | 343 (60.6%) |
| High School Diploma | 713 (39.7%) | 1,084 (60.3%) |
| College/Associate Degree | 888 (55.2%) | 722 (44.8%) |
| Bachelor's Degree or higher | 722 (80.5%) | 175 (19.5%) |
Occupancy by Age of Householder in Minden
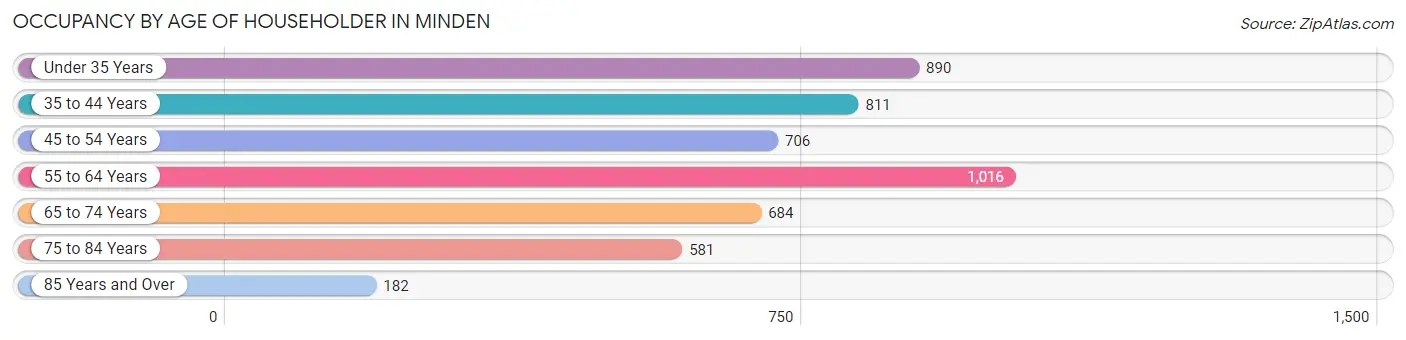
| Age Bracket | # Households | % Households |
| Under 35 Years | 890 | 18.3% |
| 35 to 44 Years | 811 | 16.7% |
| 45 to 54 Years | 706 | 14.5% |
| 55 to 64 Years | 1,016 | 20.9% |
| 65 to 74 Years | 684 | 14.1% |
| 75 to 84 Years | 581 | 11.9% |
| 85 Years and Over | 182 | 3.7% |
| Total | 4,870 | 100.0% |
Housing Finances in Minden
Median Income by Occupancy in Minden
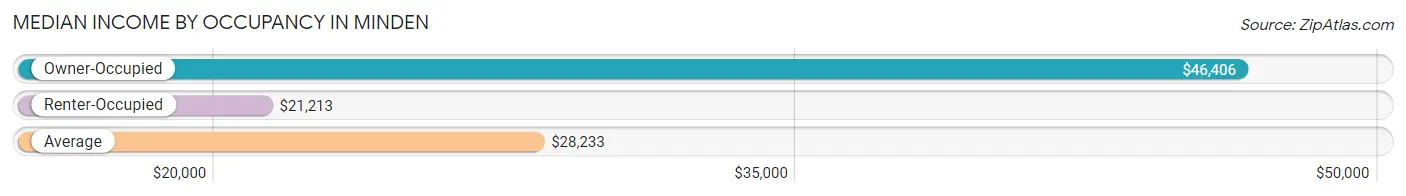
| Occupancy Type | # Households | Median Income |
| Owner-Occupied | 2,546 (52.3%) | $46,406 |
| Renter-Occupied | 2,324 (47.7%) | $21,213 |
| Average | 4,870 (100.0%) | $28,233 |
Occupancy by Householder Income Bracket in Minden
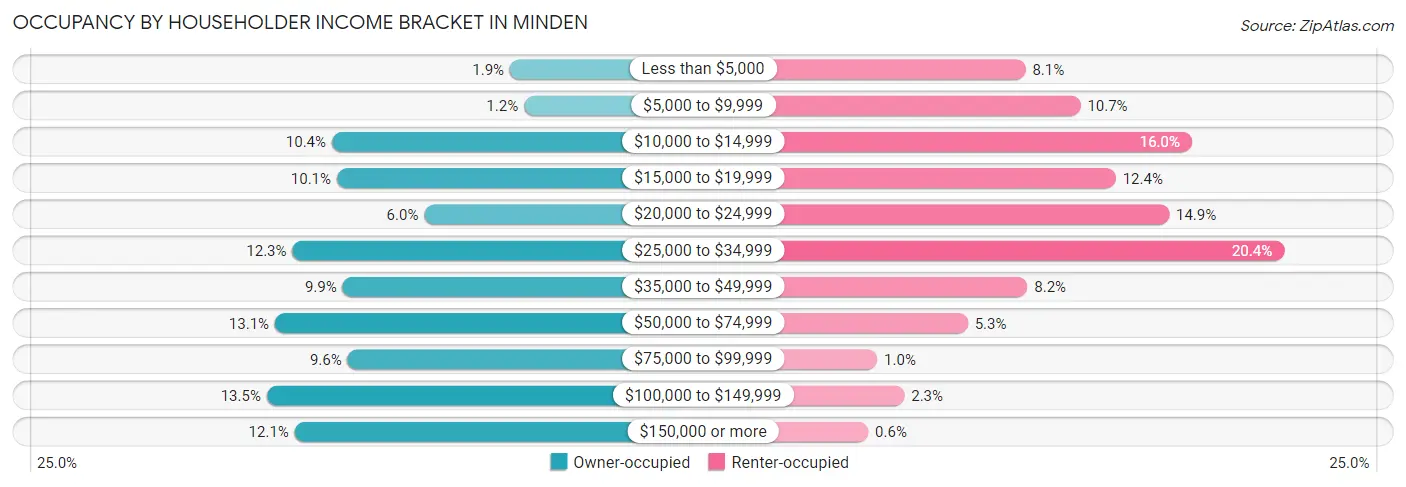
| Income Bracket | Owner-occupied | Renter-occupied |
| Less than $5,000 | 48 (1.9%) | 188 (8.1%) |
| $5,000 to $9,999 | 31 (1.2%) | 249 (10.7%) |
| $10,000 to $14,999 | 264 (10.4%) | 372 (16.0%) |
| $15,000 to $19,999 | 258 (10.1%) | 288 (12.4%) |
| $20,000 to $24,999 | 152 (6.0%) | 347 (14.9%) |
| $25,000 to $34,999 | 312 (12.2%) | 474 (20.4%) |
| $35,000 to $49,999 | 251 (9.9%) | 190 (8.2%) |
| $50,000 to $74,999 | 333 (13.1%) | 124 (5.3%) |
| $75,000 to $99,999 | 245 (9.6%) | 24 (1.0%) |
| $100,000 to $149,999 | 343 (13.5%) | 54 (2.3%) |
| $150,000 or more | 309 (12.1%) | 14 (0.6%) |
| Total | 2,546 (100.0%) | 2,324 (100.0%) |
Monthly Housing Cost Tiers in Minden
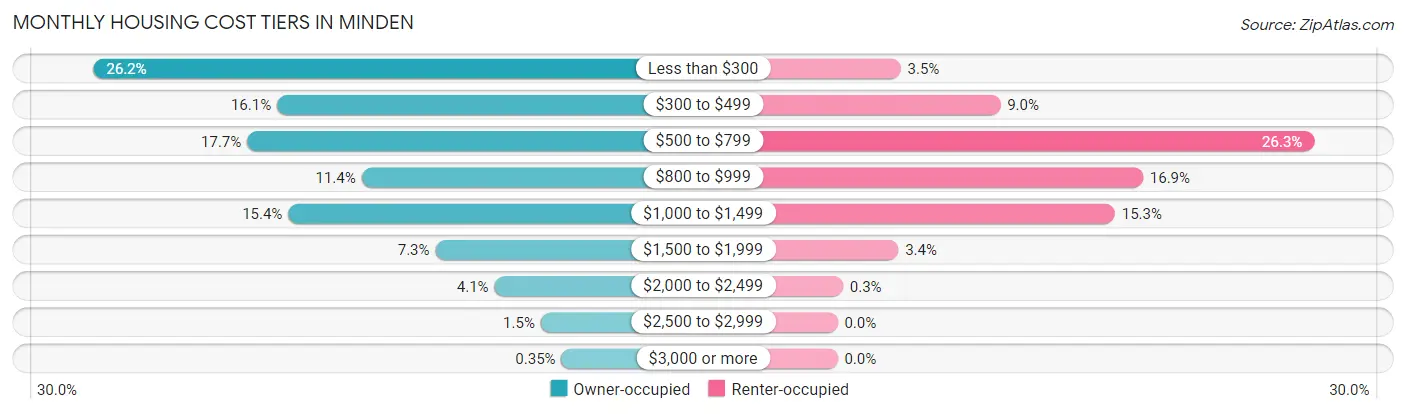
| Monthly Cost | Owner-occupied | Renter-occupied |
| Less than $300 | 667 (26.2%) | 81 (3.5%) |
| $300 to $499 | 409 (16.1%) | 209 (9.0%) |
| $500 to $799 | 451 (17.7%) | 612 (26.3%) |
| $800 to $999 | 290 (11.4%) | 392 (16.9%) |
| $1,000 to $1,499 | 393 (15.4%) | 356 (15.3%) |
| $1,500 to $1,999 | 186 (7.3%) | 78 (3.4%) |
| $2,000 to $2,499 | 103 (4.1%) | 7 (0.3%) |
| $2,500 to $2,999 | 38 (1.5%) | 0 (0.0%) |
| $3,000 or more | 9 (0.4%) | 0 (0.0%) |
| Total | 2,546 (100.0%) | 2,324 (100.0%) |
Physical Housing Characteristics in Minden
Housing Structures in Minden
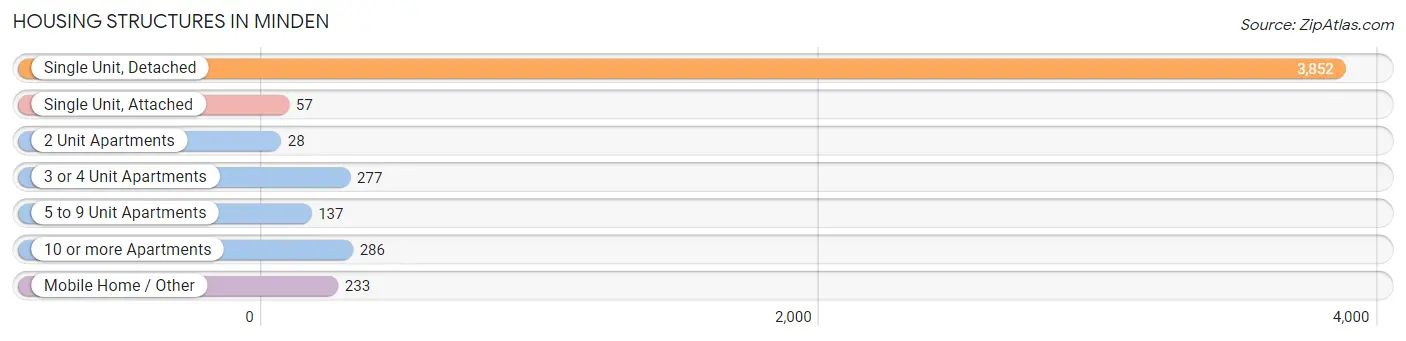
| Structure Type | # Housing Units | % Housing Units |
| Single Unit, Detached | 3,852 | 79.1% |
| Single Unit, Attached | 57 | 1.2% |
| 2 Unit Apartments | 28 | 0.6% |
| 3 or 4 Unit Apartments | 277 | 5.7% |
| 5 to 9 Unit Apartments | 137 | 2.8% |
| 10 or more Apartments | 286 | 5.9% |
| Mobile Home / Other | 233 | 4.8% |
| Total | 4,870 | 100.0% |
Housing Structures by Occupancy in Minden
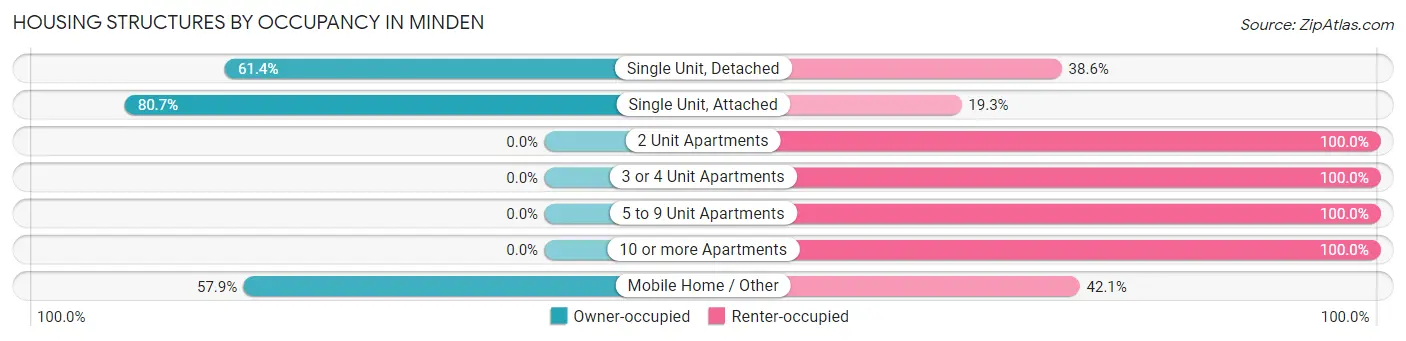
| Structure Type | Owner-occupied | Renter-occupied |
| Single Unit, Detached | 2,365 (61.4%) | 1,487 (38.6%) |
| Single Unit, Attached | 46 (80.7%) | 11 (19.3%) |
| 2 Unit Apartments | 0 (0.0%) | 28 (100.0%) |
| 3 or 4 Unit Apartments | 0 (0.0%) | 277 (100.0%) |
| 5 to 9 Unit Apartments | 0 (0.0%) | 137 (100.0%) |
| 10 or more Apartments | 0 (0.0%) | 286 (100.0%) |
| Mobile Home / Other | 135 (57.9%) | 98 (42.1%) |
| Total | 2,546 (52.3%) | 2,324 (47.7%) |
Housing Structures by Number of Rooms in Minden
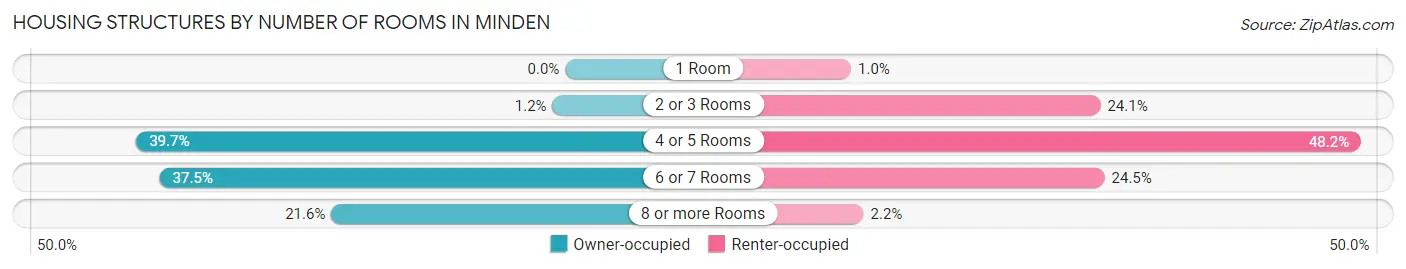
| Number of Rooms | Owner-occupied | Renter-occupied |
| 1 Room | 0 (0.0%) | 24 (1.0%) |
| 2 or 3 Rooms | 30 (1.2%) | 560 (24.1%) |
| 4 or 5 Rooms | 1,010 (39.7%) | 1,120 (48.2%) |
| 6 or 7 Rooms | 955 (37.5%) | 569 (24.5%) |
| 8 or more Rooms | 551 (21.6%) | 51 (2.2%) |
| Total | 2,546 (100.0%) | 2,324 (100.0%) |
Housing Structure by Heating Type in Minden
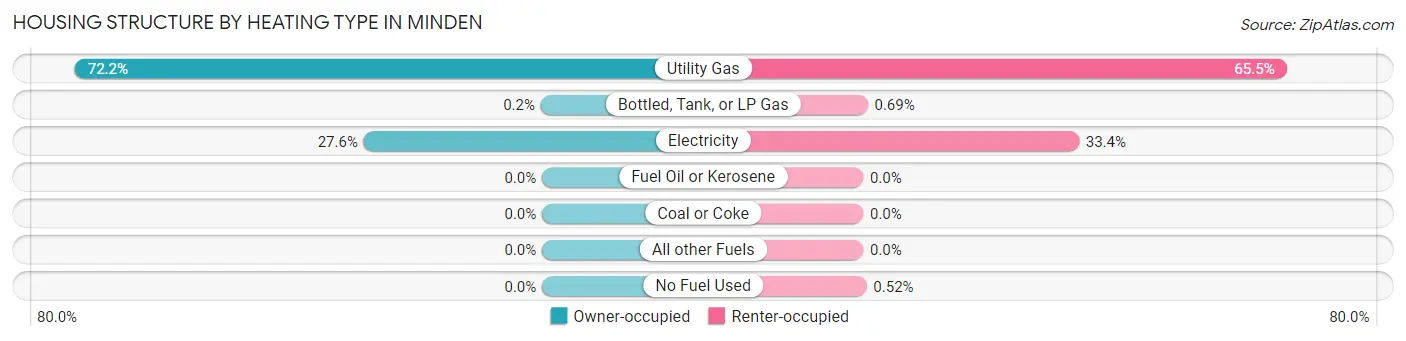
| Heating Type | Owner-occupied | Renter-occupied |
| Utility Gas | 1,839 (72.2%) | 1,521 (65.4%) |
| Bottled, Tank, or LP Gas | 5 (0.2%) | 16 (0.7%) |
| Electricity | 702 (27.6%) | 775 (33.4%) |
| Fuel Oil or Kerosene | 0 (0.0%) | 0 (0.0%) |
| Coal or Coke | 0 (0.0%) | 0 (0.0%) |
| All other Fuels | 0 (0.0%) | 0 (0.0%) |
| No Fuel Used | 0 (0.0%) | 12 (0.5%) |
| Total | 2,546 (100.0%) | 2,324 (100.0%) |
Household Vehicle Usage in Minden
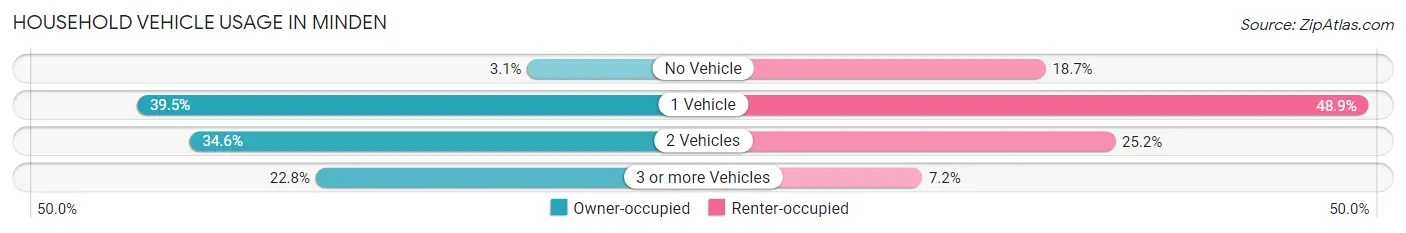
| Vehicles per Household | Owner-occupied | Renter-occupied |
| No Vehicle | 78 (3.1%) | 435 (18.7%) |
| 1 Vehicle | 1,006 (39.5%) | 1,136 (48.9%) |
| 2 Vehicles | 881 (34.6%) | 586 (25.2%) |
| 3 or more Vehicles | 581 (22.8%) | 167 (7.2%) |
| Total | 2,546 (100.0%) | 2,324 (100.0%) |
Real Estate & Mortgages in Minden
Real Estate and Mortgage Overview in Minden
| Characteristic | Without Mortgage | With Mortgage |
| Housing Units | 1,406 | 1,140 |
| Median Property Value | $88,100 | $151,500 |
| Median Household Income | $43,015 | $160 |
| Monthly Housing Costs | $322 | $9 |
| Real Estate Taxes | $292 | $231 |
Property Value by Mortgage Status in Minden
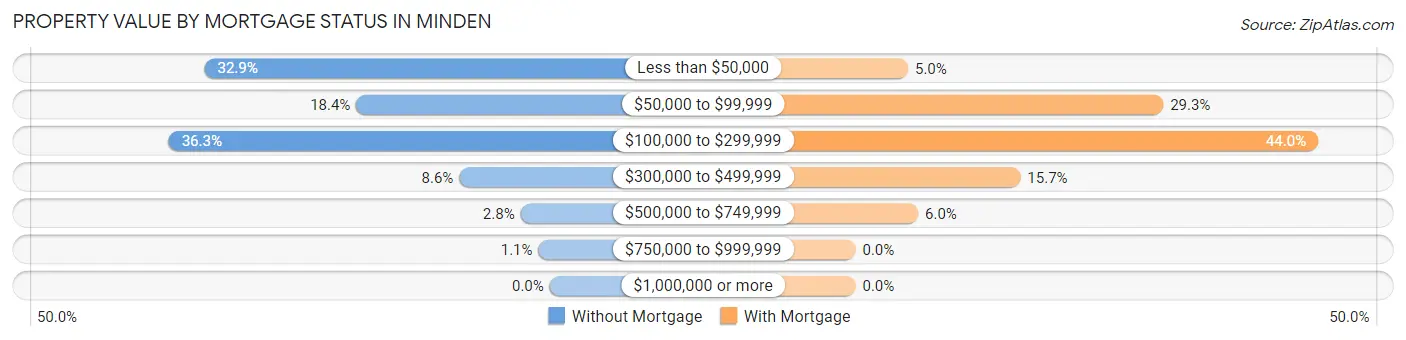
| Property Value | Without Mortgage | With Mortgage |
| Less than $50,000 | 462 (32.9%) | 57 (5.0%) |
| $50,000 to $99,999 | 259 (18.4%) | 334 (29.3%) |
| $100,000 to $299,999 | 510 (36.3%) | 502 (44.0%) |
| $300,000 to $499,999 | 121 (8.6%) | 179 (15.7%) |
| $500,000 to $749,999 | 39 (2.8%) | 68 (6.0%) |
| $750,000 to $999,999 | 15 (1.1%) | 0 (0.0%) |
| $1,000,000 or more | 0 (0.0%) | 0 (0.0%) |
| Total | 1,406 (100.0%) | 1,140 (100.0%) |
Household Income by Mortgage Status in Minden
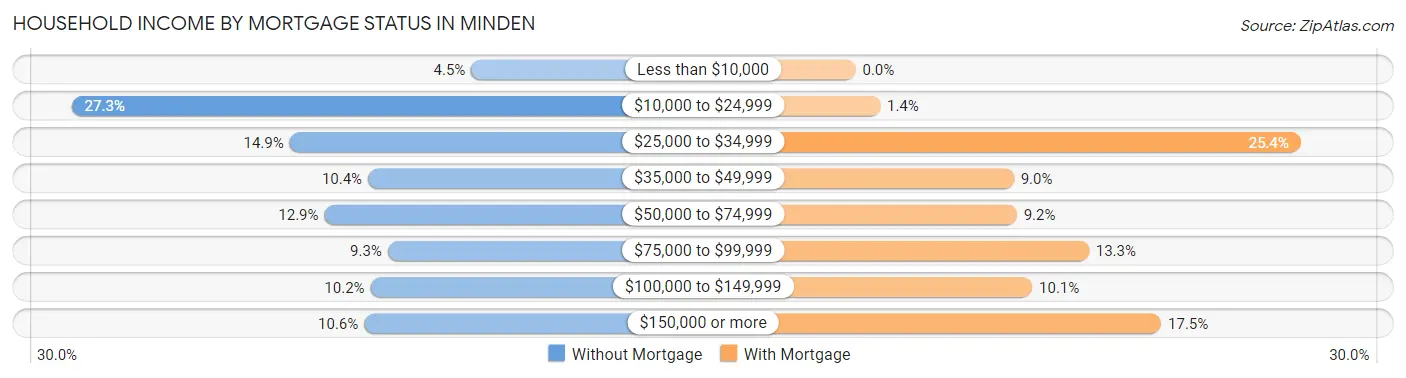
| Household Income | Without Mortgage | With Mortgage |
| Less than $10,000 | 63 (4.5%) | 0 (0.0%) |
| $10,000 to $24,999 | 384 (27.3%) | 16 (1.4%) |
| $25,000 to $34,999 | 209 (14.9%) | 290 (25.4%) |
| $35,000 to $49,999 | 146 (10.4%) | 103 (9.0%) |
| $50,000 to $74,999 | 181 (12.9%) | 105 (9.2%) |
| $75,000 to $99,999 | 130 (9.2%) | 152 (13.3%) |
| $100,000 to $149,999 | 144 (10.2%) | 115 (10.1%) |
| $150,000 or more | 149 (10.6%) | 199 (17.5%) |
| Total | 1,406 (100.0%) | 1,140 (100.0%) |
Property Value to Household Income Ratio in Minden
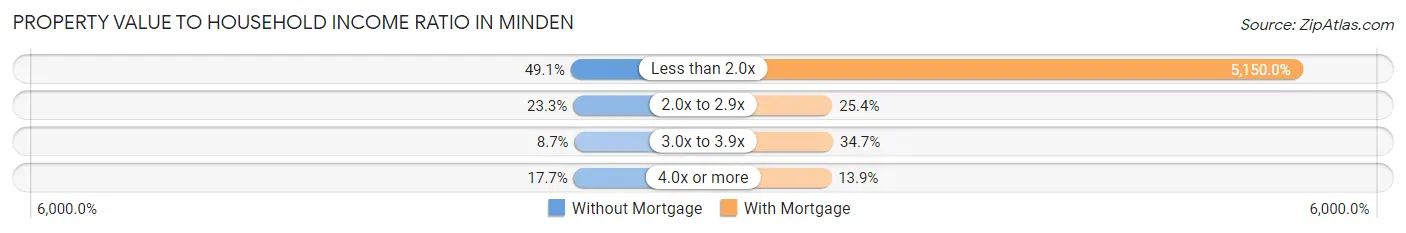
| Value-to-Income Ratio | Without Mortgage | With Mortgage |
| Less than 2.0x | 690 (49.1%) | 58,710 (5,150.0%) |
| 2.0x to 2.9x | 327 (23.3%) | 289 (25.4%) |
| 3.0x to 3.9x | 122 (8.7%) | 395 (34.6%) |
| 4.0x or more | 249 (17.7%) | 158 (13.9%) |
| Total | 1,406 (100.0%) | 1,140 (100.0%) |
Real Estate Taxes by Mortgage Status in Minden
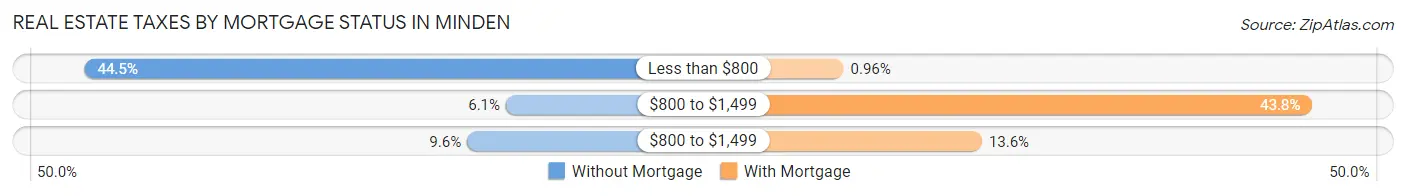
| Property Taxes | Without Mortgage | With Mortgage |
| Less than $800 | 626 (44.5%) | 11 (1.0%) |
| $800 to $1,499 | 85 (6.0%) | 499 (43.8%) |
| $800 to $1,499 | 135 (9.6%) | 155 (13.6%) |
| Total | 1,406 (100.0%) | 1,140 (100.0%) |
Health & Disability in Minden
Health Insurance Coverage by Age in Minden
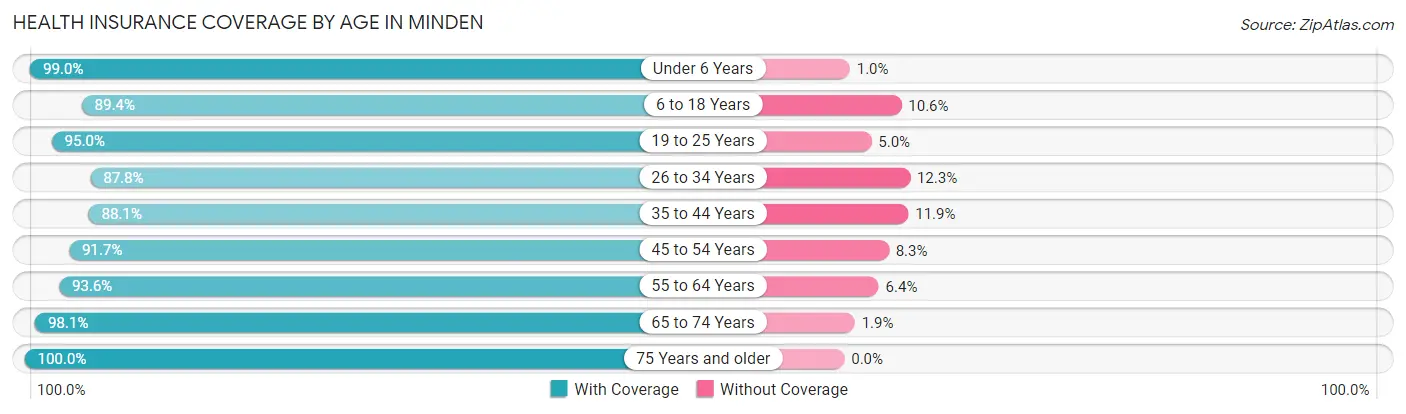
| Age Bracket | With Coverage | Without Coverage |
| Under 6 Years | 874 (99.0%) | 9 (1.0%) |
| 6 to 18 Years | 1,772 (89.4%) | 211 (10.6%) |
| 19 to 25 Years | 1,036 (95.0%) | 55 (5.0%) |
| 26 to 34 Years | 1,103 (87.7%) | 154 (12.2%) |
| 35 to 44 Years | 1,343 (88.1%) | 182 (11.9%) |
| 45 to 54 Years | 1,119 (91.7%) | 101 (8.3%) |
| 55 to 64 Years | 1,504 (93.6%) | 103 (6.4%) |
| 65 to 74 Years | 910 (98.1%) | 18 (1.9%) |
| 75 Years and older | 1,068 (100.0%) | 0 (0.0%) |
| Total | 10,729 (92.8%) | 833 (7.2%) |
Health Insurance Coverage by Citizenship Status in Minden
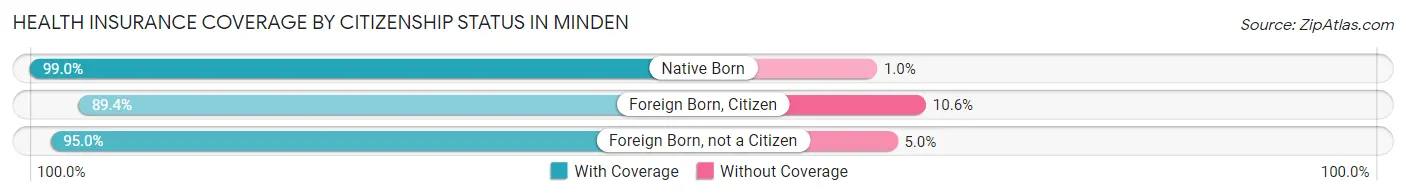
| Citizenship Status | With Coverage | Without Coverage |
| Native Born | 874 (99.0%) | 9 (1.0%) |
| Foreign Born, Citizen | 1,772 (89.4%) | 211 (10.6%) |
| Foreign Born, not a Citizen | 1,036 (95.0%) | 55 (5.0%) |
Health Insurance Coverage by Household Income in Minden
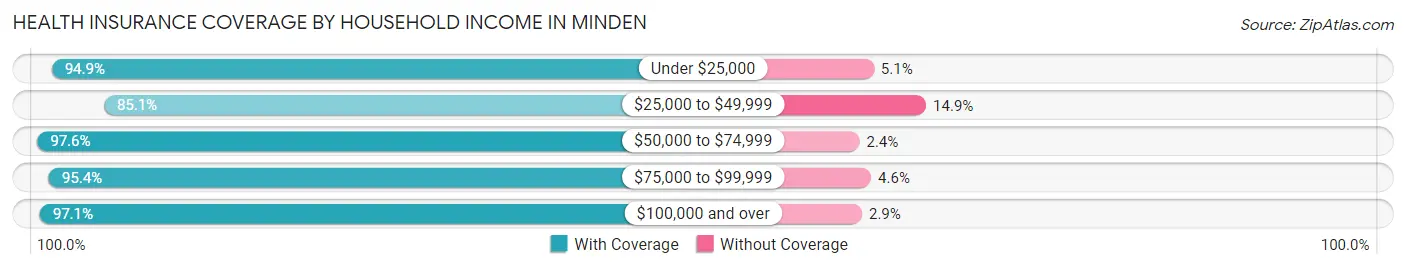
| Household Income | With Coverage | Without Coverage |
| Under $25,000 | 3,797 (94.9%) | 203 (5.1%) |
| $25,000 to $49,999 | 2,822 (85.1%) | 493 (14.9%) |
| $50,000 to $74,999 | 1,306 (97.6%) | 32 (2.4%) |
| $75,000 to $99,999 | 859 (95.4%) | 41 (4.6%) |
| $100,000 and over | 1,901 (97.1%) | 56 (2.9%) |
Public vs Private Health Insurance Coverage by Age in Minden
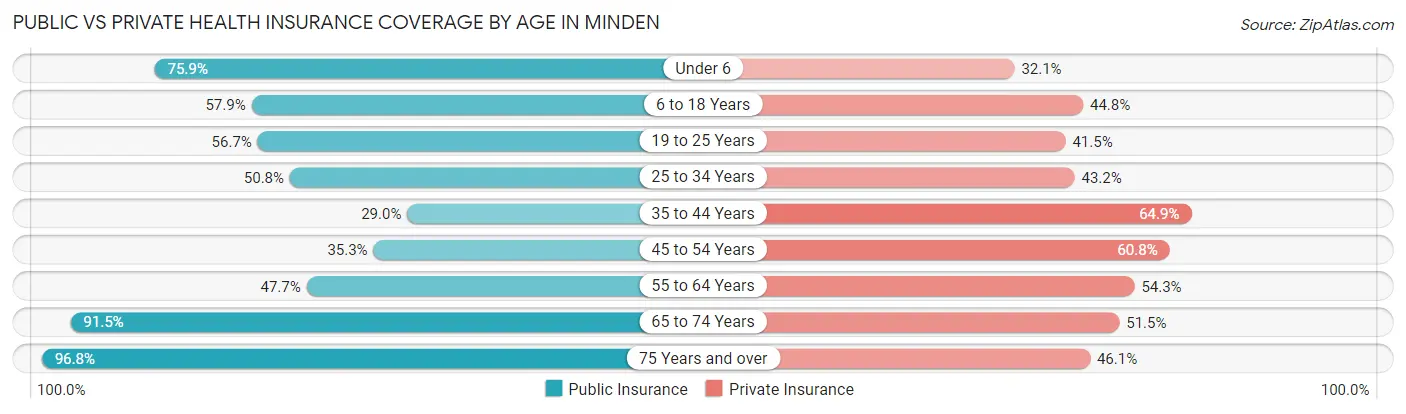
| Age Bracket | Public Insurance | Private Insurance |
| Under 6 | 670 (75.9%) | 283 (32.1%) |
| 6 to 18 Years | 1,148 (57.9%) | 888 (44.8%) |
| 19 to 25 Years | 619 (56.7%) | 453 (41.5%) |
| 25 to 34 Years | 638 (50.8%) | 543 (43.2%) |
| 35 to 44 Years | 442 (29.0%) | 989 (64.8%) |
| 45 to 54 Years | 430 (35.2%) | 742 (60.8%) |
| 55 to 64 Years | 766 (47.7%) | 873 (54.3%) |
| 65 to 74 Years | 849 (91.5%) | 478 (51.5%) |
| 75 Years and over | 1,034 (96.8%) | 492 (46.1%) |
| Total | 6,596 (57.1%) | 5,741 (49.6%) |
Disability Status by Sex by Age in Minden
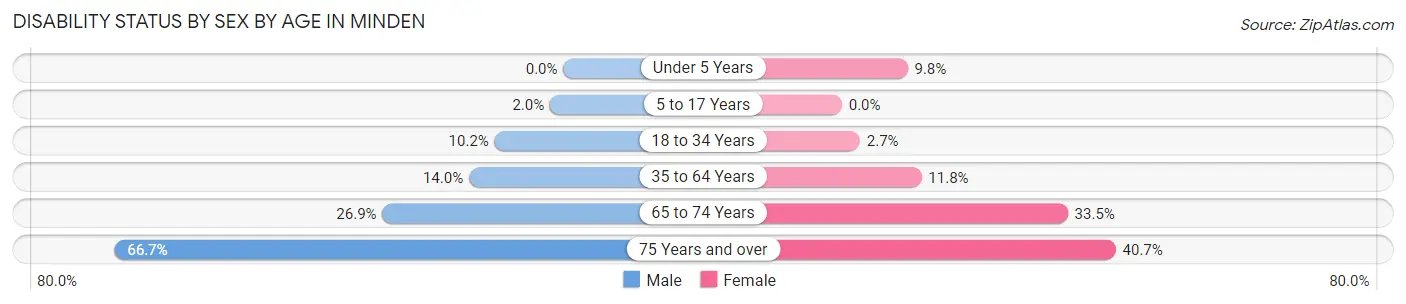
| Age Bracket | Male | Female |
| Under 5 Years | 0 (0.0%) | 41 (9.8%) |
| 5 to 17 Years | 23 (2.0%) | 0 (0.0%) |
| 18 to 34 Years | 121 (10.2%) | 33 (2.7%) |
| 35 to 64 Years | 278 (14.0%) | 280 (11.8%) |
| 65 to 74 Years | 122 (26.9%) | 159 (33.5%) |
| 75 Years and over | 230 (66.7%) | 294 (40.7%) |
Disability Class by Sex by Age in Minden
Disability Class: Hearing Difficulty
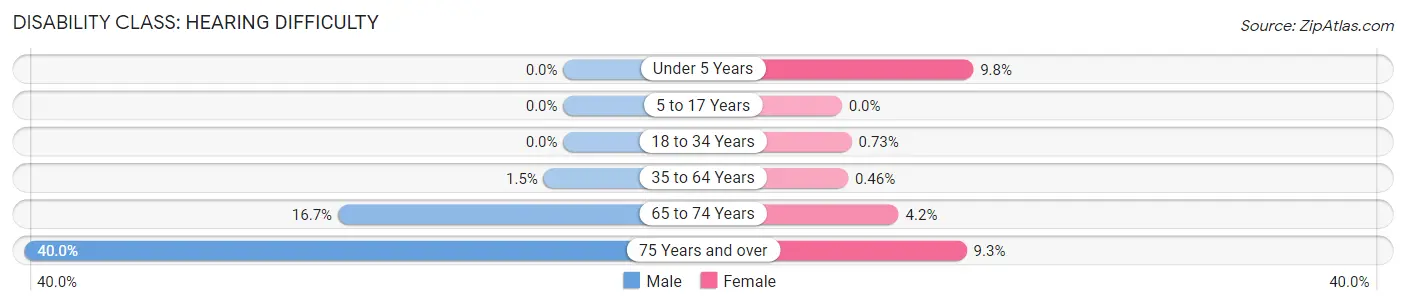
| Age Bracket | Male | Female |
| Under 5 Years | 0 (0.0%) | 41 (9.8%) |
| 5 to 17 Years | 0 (0.0%) | 0 (0.0%) |
| 18 to 34 Years | 0 (0.0%) | 9 (0.7%) |
| 35 to 64 Years | 29 (1.5%) | 11 (0.5%) |
| 65 to 74 Years | 76 (16.7%) | 20 (4.2%) |
| 75 Years and over | 138 (40.0%) | 67 (9.3%) |
Disability Class: Vision Difficulty
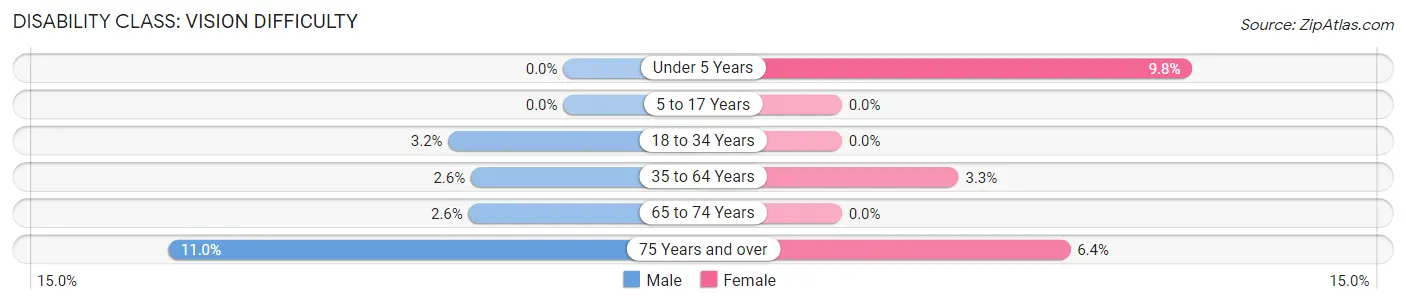
| Age Bracket | Male | Female |
| Under 5 Years | 0 (0.0%) | 41 (9.8%) |
| 5 to 17 Years | 0 (0.0%) | 0 (0.0%) |
| 18 to 34 Years | 38 (3.2%) | 0 (0.0%) |
| 35 to 64 Years | 51 (2.6%) | 77 (3.3%) |
| 65 to 74 Years | 12 (2.6%) | 0 (0.0%) |
| 75 Years and over | 38 (11.0%) | 46 (6.4%) |
Disability Class: Cognitive Difficulty
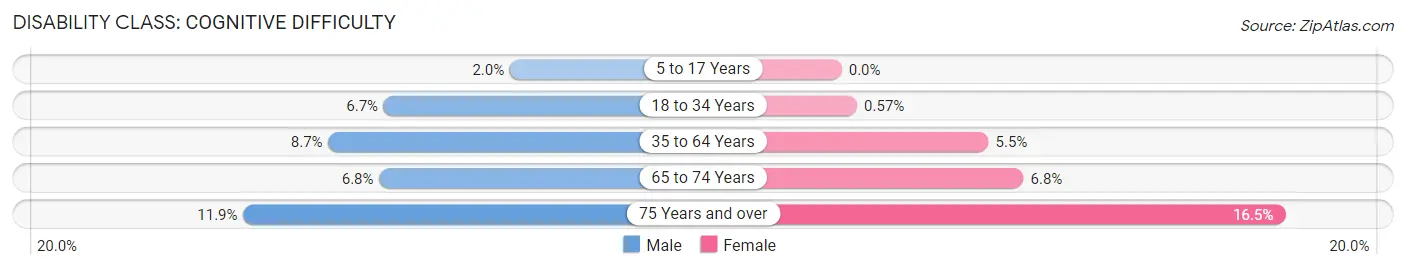
| Age Bracket | Male | Female |
| 5 to 17 Years | 23 (2.0%) | 0 (0.0%) |
| 18 to 34 Years | 79 (6.7%) | 7 (0.6%) |
| 35 to 64 Years | 173 (8.7%) | 129 (5.4%) |
| 65 to 74 Years | 31 (6.8%) | 32 (6.8%) |
| 75 Years and over | 41 (11.9%) | 119 (16.5%) |
Disability Class: Ambulatory Difficulty
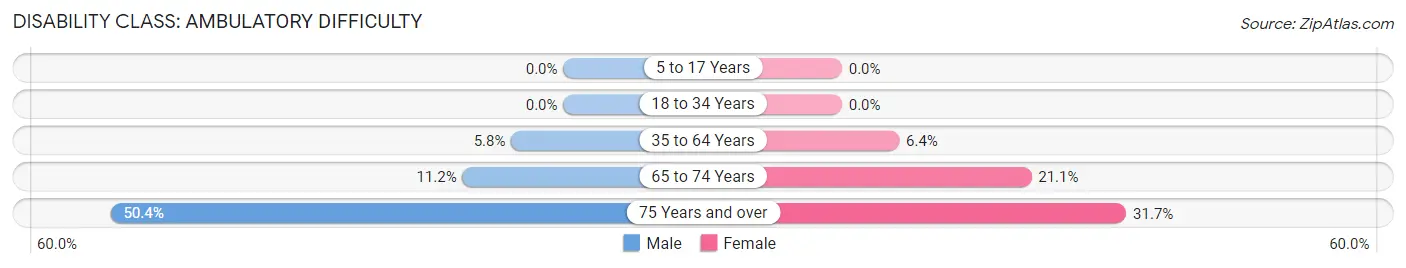
| Age Bracket | Male | Female |
| 5 to 17 Years | 0 (0.0%) | 0 (0.0%) |
| 18 to 34 Years | 0 (0.0%) | 0 (0.0%) |
| 35 to 64 Years | 115 (5.8%) | 151 (6.4%) |
| 65 to 74 Years | 51 (11.2%) | 100 (21.1%) |
| 75 Years and over | 174 (50.4%) | 229 (31.7%) |
Disability Class: Self-Care Difficulty
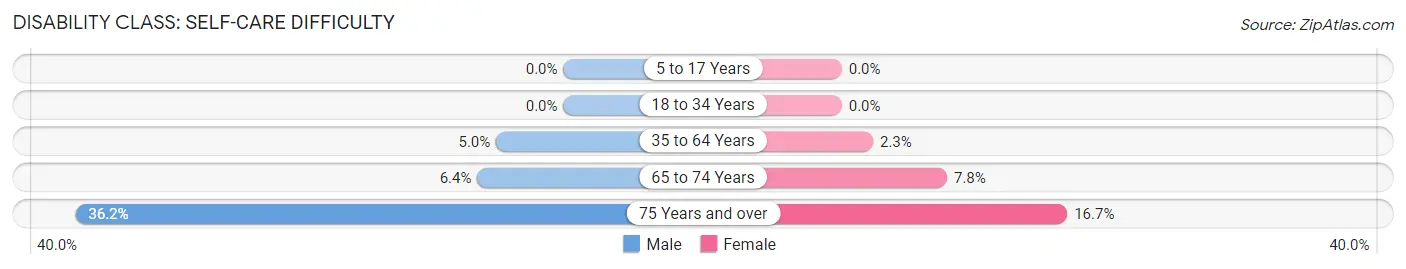
| Age Bracket | Male | Female |
| 5 to 17 Years | 0 (0.0%) | 0 (0.0%) |
| 18 to 34 Years | 0 (0.0%) | 0 (0.0%) |
| 35 to 64 Years | 99 (5.0%) | 55 (2.3%) |
| 65 to 74 Years | 29 (6.4%) | 37 (7.8%) |
| 75 Years and over | 125 (36.2%) | 121 (16.7%) |
Technology Access in Minden
Computing Device Access in Minden
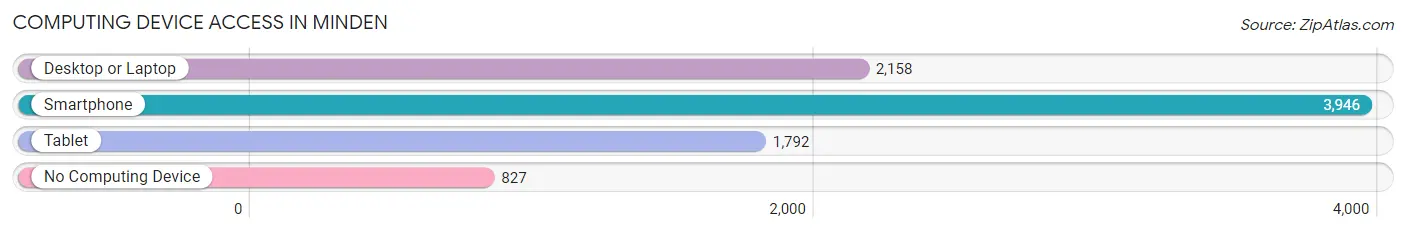
| Device Type | # Households | % Households |
| Desktop or Laptop | 2,158 | 44.3% |
| Smartphone | 3,946 | 81.0% |
| Tablet | 1,792 | 36.8% |
| No Computing Device | 827 | 17.0% |
| Total | 4,870 | 100.0% |
Internet Access in Minden
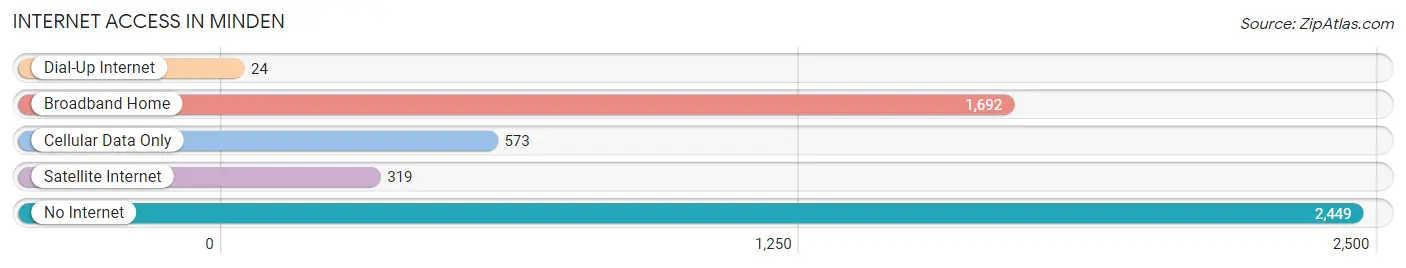
| Internet Type | # Households | % Households |
| Dial-Up Internet | 24 | 0.5% |
| Broadband Home | 1,692 | 34.7% |
| Cellular Data Only | 573 | 11.8% |
| Satellite Internet | 319 | 6.6% |
| No Internet | 2,449 | 50.3% |
| Total | 4,870 | 100.0% |
Minden Summary
History
The city of Minden, Louisiana is located in the northwest corner of the state, in Webster Parish. It was founded in 1836 by Charles H. Veeder, a former surveyor from New York. Veeder named the city after the town of Minden in Germany, where he had served in the military. The city was incorporated in 1839 and has since grown to become the parish seat of Webster Parish.
The city of Minden has a rich history that dates back to the early 1800s. During the Civil War, the city was occupied by Union forces and served as a major supply depot for the Union army. After the war, the city experienced a period of growth and prosperity, becoming a major center for the timber and railroad industries.
In the early 1900s, the city was home to a thriving African-American community, which included a number of churches, businesses, and schools. The city was also home to a number of prominent African-American leaders, including Dr. John B. Coleman, who served as the first African-American mayor of Minden.
Geography
Minden is located in the northwest corner of Louisiana, in Webster Parish. It is situated on the banks of the Red River, which forms the border between Louisiana and Texas. The city is located approximately 30 miles east of Shreveport and approximately 100 miles south of Little Rock, Arkansas.
The city of Minden covers an area of approximately 8.5 square miles and has an elevation of approximately 300 feet. The city is located in a humid subtropical climate zone, with hot, humid summers and mild winters.
Economy
The economy of Minden is largely based on the timber and railroad industries. The city is home to a number of timber-related businesses, including sawmills, lumber yards, and wood-processing plants. The city is also home to a number of railroad-related businesses, including a major rail yard and a number of freight and passenger rail lines.
In addition to the timber and railroad industries, the city is also home to a number of other businesses, including manufacturing, retail, and healthcare. The city is also home to a number of educational institutions, including a community college and a technical school.
Demographics
As of the 2010 census, the city of Minden had a population of 13,082. The racial makeup of the city was 73.3% White, 22.2% African American, 0.5% Native American, 0.7% Asian, 0.1% Pacific Islander, and 2.2% from other races. Hispanic or Latino of any race were 3.2% of the population.
The median household income in Minden was $31,945, and the median family income was $41,945. The per capita income for the city was $17,845. Approximately 17.2% of the population was below the poverty line.
Common Questions
What is Per Capita Income in Minden?
Per Capita income in Minden is $24,949.
What is the Median Family Income in Minden?
Median Family Income in Minden is $38,250.
What is the Median Household income in Minden?
Median Household Income in Minden is $28,233.
What is Income or Wage Gap in Minden?
Income or Wage Gap in Minden is 29.1%.
Women in Minden earn 70.9 cents for every dollar earned by a man.
What is Family Income Deficit in Minden?
Family Income Deficit in Minden is $9,774.
Families that are below poverty line in Minden earn $9,774 less on average than the poverty threshold level.
What is Inequality or Gini Index in Minden?
Inequality or Gini Index in Minden is 0.59.
What is the Total Population of Minden?
Total Population of Minden is 11,789.
What is the Total Male Population of Minden?
Total Male Population of Minden is 5,542.
What is the Total Female Population of Minden?
Total Female Population of Minden is 6,247.
What is the Ratio of Males per 100 Females in Minden?
There are 88.71 Males per 100 Females in Minden.
What is the Ratio of Females per 100 Males in Minden?
There are 112.72 Females per 100 Males in Minden.
What is the Median Population Age in Minden?
Median Population Age in Minden is 39.5 Years.
What is the Average Family Size in Minden
Average Family Size in Minden is 3.2 People.
What is the Average Household Size in Minden
Average Household Size in Minden is 2.4 People.
How Large is the Labor Force in Minden?
There are 4,364 People in the Labor Forcein in Minden.
What is the Percentage of People in the Labor Force in Minden?
46.5% of People are in the Labor Force in Minden.
What is the Unemployment Rate in Minden?
Unemployment Rate in Minden is 3.4%.