Glen Cove, NY Map & Demographics
Glen Cove Map
Glen Cove Overview
$47,676
PER CAPITA INCOME
$110,598
AVG FAMILY INCOME
$91,372
AVG HOUSEHOLD INCOME
24.0%
WAGE / INCOME GAP [ % ]
76.0¢/ $1
WAGE / INCOME GAP [ $ ]
$13,892
FAMILY INCOME DEFICIT
0.50
INEQUALITY / GINI INDEX
28,132
TOTAL POPULATION
13,418
MALE POPULATION
14,714
FEMALE POPULATION
91.19
MALES / 100 FEMALES
109.66
FEMALES / 100 MALES
43.4
MEDIAN AGE
3.1
AVG FAMILY SIZE
2.6
AVG HOUSEHOLD SIZE
14,455
LABOR FORCE [ PEOPLE ]
61.0%
PERCENT IN LABOR FORCE
3.6%
UNEMPLOYMENT RATE
Glen Cove Zip Codes
Glen Cove Area Codes
Income in Glen Cove
Income Overview in Glen Cove
Per Capita Income in Glen Cove is $47,676, while median incomes of families and households are $110,598 and $91,372 respectively.
| Characteristic | Number | Measure |
| Per Capita Income | 28,132 | $47,676 |
| Median Family Income | 7,083 | $110,598 |
| Mean Family Income | 7,083 | $143,728 |
| Median Household Income | 10,691 | $91,372 |
| Mean Household Income | 10,691 | $122,304 |
| Income Deficit | 7,083 | $13,892 |
| Wage / Income Gap (%) | 28,132 | 24.01% |
| Wage / Income Gap ($) | 28,132 | 75.99¢ per $1 |
| Gini / Inequality Index | 28,132 | 0.50 |
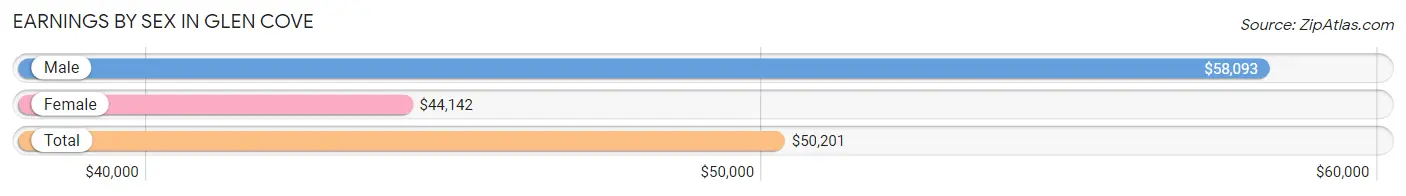
Earnings by Sex in Glen Cove
Average Earnings in Glen Cove are $50,201, $58,093 for men and $44,142 for women, a difference of 24.0%.
| Sex | Number | Average Earnings |
| Male | 7,858 (51.7%) | $58,093 |
| Female | 7,326 (48.2%) | $44,142 |
| Total | 15,184 (100.0%) | $50,201 |
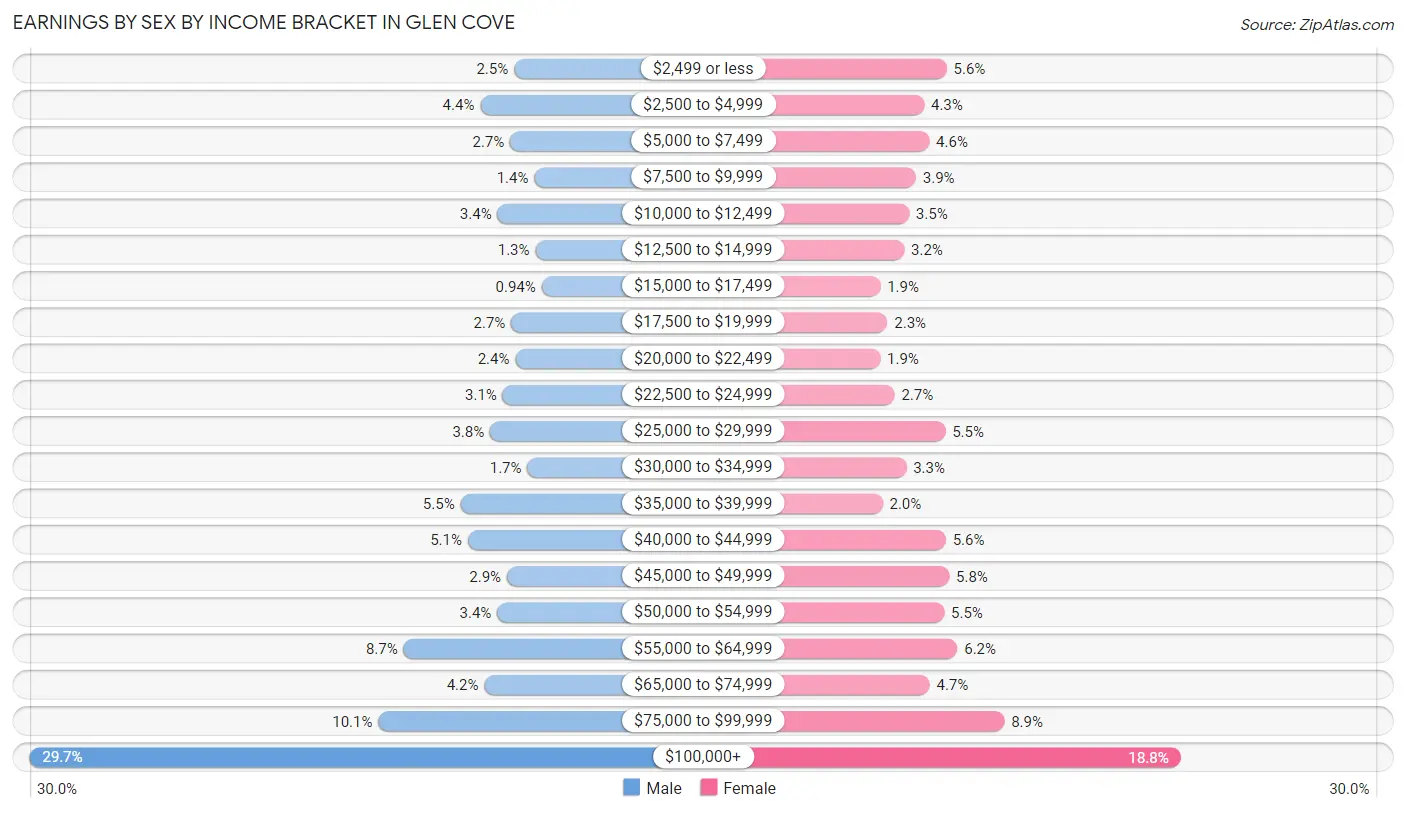
Earnings by Sex by Income Bracket in Glen Cove
The most common earnings brackets in Glen Cove are $100,000+ for men (2,336 | 29.7%) and $100,000+ for women (1,374 | 18.8%).
| Income | Male | Female |
| $2,499 or less | 196 (2.5%) | 411 (5.6%) |
| $2,500 to $4,999 | 345 (4.4%) | 318 (4.3%) |
| $5,000 to $7,499 | 213 (2.7%) | 339 (4.6%) |
| $7,500 to $9,999 | 106 (1.3%) | 284 (3.9%) |
| $10,000 to $12,499 | 269 (3.4%) | 256 (3.5%) |
| $12,500 to $14,999 | 101 (1.3%) | 236 (3.2%) |
| $15,000 to $17,499 | 74 (0.9%) | 138 (1.9%) |
| $17,500 to $19,999 | 208 (2.6%) | 167 (2.3%) |
| $20,000 to $22,499 | 190 (2.4%) | 137 (1.9%) |
| $22,500 to $24,999 | 246 (3.1%) | 196 (2.7%) |
| $25,000 to $29,999 | 302 (3.8%) | 405 (5.5%) |
| $30,000 to $34,999 | 137 (1.7%) | 245 (3.3%) |
| $35,000 to $39,999 | 432 (5.5%) | 147 (2.0%) |
| $40,000 to $44,999 | 400 (5.1%) | 407 (5.6%) |
| $45,000 to $49,999 | 227 (2.9%) | 421 (5.8%) |
| $50,000 to $54,999 | 270 (3.4%) | 401 (5.5%) |
| $55,000 to $64,999 | 684 (8.7%) | 455 (6.2%) |
| $65,000 to $74,999 | 327 (4.2%) | 341 (4.6%) |
| $75,000 to $99,999 | 795 (10.1%) | 648 (8.8%) |
| $100,000+ | 2,336 (29.7%) | 1,374 (18.8%) |
| Total | 7,858 (100.0%) | 7,326 (100.0%) |
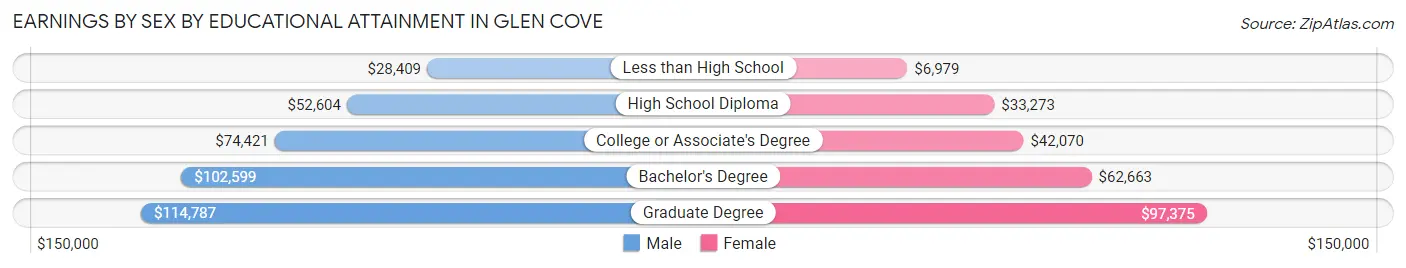
Earnings by Sex by Educational Attainment in Glen Cove
Average earnings in Glen Cove are $65,674 for men and $47,057 for women, a difference of 28.3%. Men with an educational attainment of graduate degree enjoy the highest average annual earnings of $114,787, while those with less than high school education earn the least with $28,409. Women with an educational attainment of graduate degree earn the most with the average annual earnings of $97,375, while those with less than high school education have the smallest earnings of $6,979.
| Educational Attainment | Male Income | Female Income |
| Less than High School | $28,409 | $6,979 |
| High School Diploma | $52,604 | $33,273 |
| College or Associate's Degree | $74,421 | $42,070 |
| Bachelor's Degree | $102,599 | $62,663 |
| Graduate Degree | $114,787 | $97,375 |
| Total | $65,674 | $47,057 |
Family Income in Glen Cove
Family Income Brackets in Glen Cove
According to the Glen Cove family income data, there are 1,742 families falling into the $200,000+ income range, which is the most common income bracket and makes up 24.6% of all families. Conversely, the $10,000 to $14,999 income bracket is the least frequent group with only 191 families (2.7%) belonging to this category.
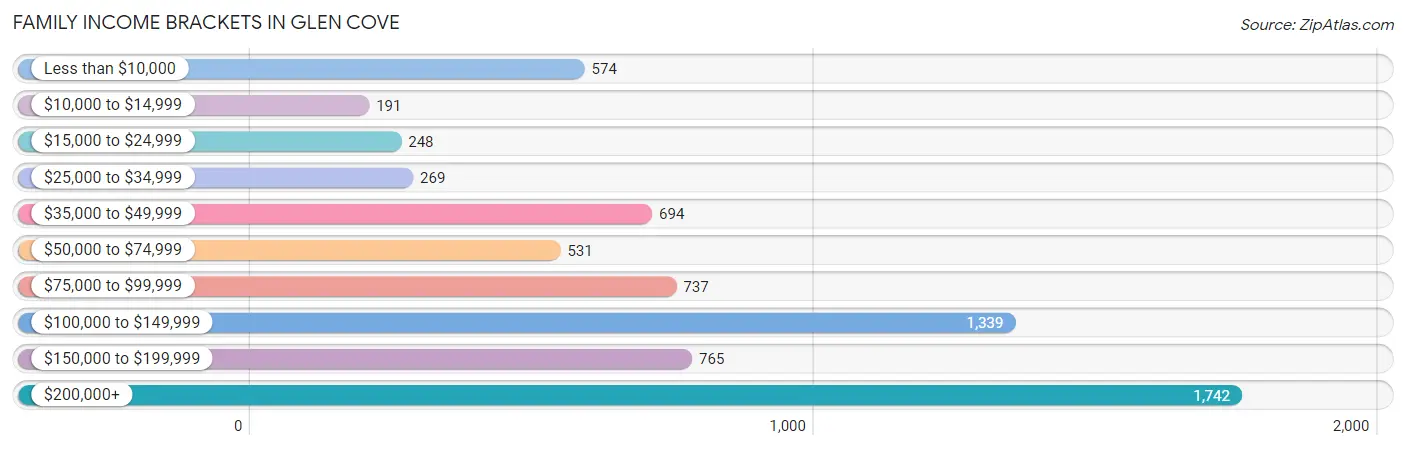
| Income Bracket | # Families | % Families |
| Less than $10,000 | 574 | 8.1% |
| $10,000 to $14,999 | 191 | 2.7% |
| $15,000 to $24,999 | 248 | 3.5% |
| $25,000 to $34,999 | 269 | 3.8% |
| $35,000 to $49,999 | 694 | 9.8% |
| $50,000 to $74,999 | 531 | 7.5% |
| $75,000 to $99,999 | 737 | 10.4% |
| $100,000 to $149,999 | 1,339 | 18.9% |
| $150,000 to $199,999 | 765 | 10.8% |
| $200,000+ | 1,742 | 24.6% |
Family Income by Famaliy Size in Glen Cove
6-person families (132 | 1.9%) account for the highest median family income in Glen Cove with $201,711 per family, while 2-person families (2,906 | 41.0%) have the highest median income of $47,604 per family member.
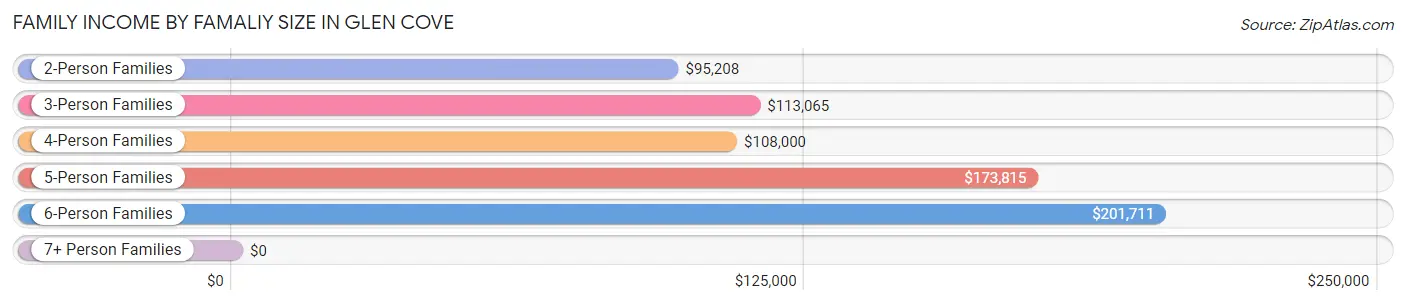
| Income Bracket | # Families | Median Income |
| 2-Person Families | 2,906 (41.0%) | $95,208 |
| 3-Person Families | 1,548 (21.9%) | $113,065 |
| 4-Person Families | 1,892 (26.7%) | $108,000 |
| 5-Person Families | 583 (8.2%) | $173,815 |
| 6-Person Families | 132 (1.9%) | $201,711 |
| 7+ Person Families | 22 (0.3%) | $0 |
| Total | 7,083 (100.0%) | $110,598 |
Family Income by Number of Earners in Glen Cove
The median family income in Glen Cove is $110,598, with families comprising 3+ earners (1,106) having the highest median family income of $211,381, while families with no earners (774) have the lowest median family income of $39,491, accounting for 15.6% and 10.9% of families, respectively.
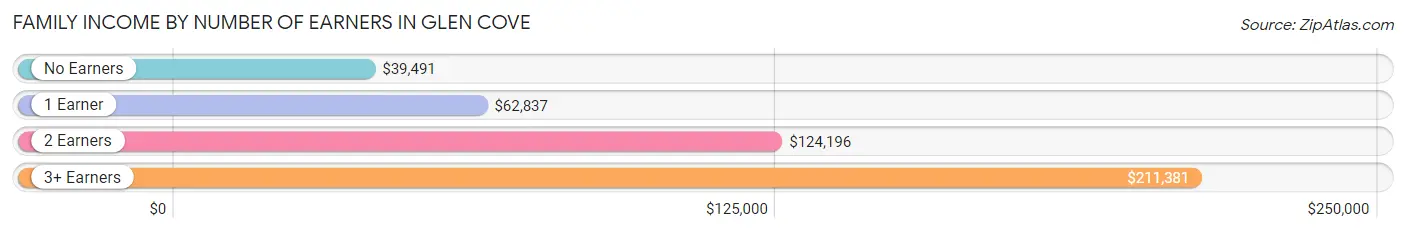
| Number of Earners | # Families | Median Income |
| No Earners | 774 (10.9%) | $39,491 |
| 1 Earner | 2,824 (39.9%) | $62,837 |
| 2 Earners | 2,379 (33.6%) | $124,196 |
| 3+ Earners | 1,106 (15.6%) | $211,381 |
| Total | 7,083 (100.0%) | $110,598 |
Household Income in Glen Cove
Household Income Brackets in Glen Cove
With 1,978 households falling in the category, the $200,000+ income range is the most frequent in Glen Cove, accounting for 18.5% of all households. In contrast, only 460 households (4.3%) fall into the $25,000 to $34,999 income bracket, making it the least populous group.
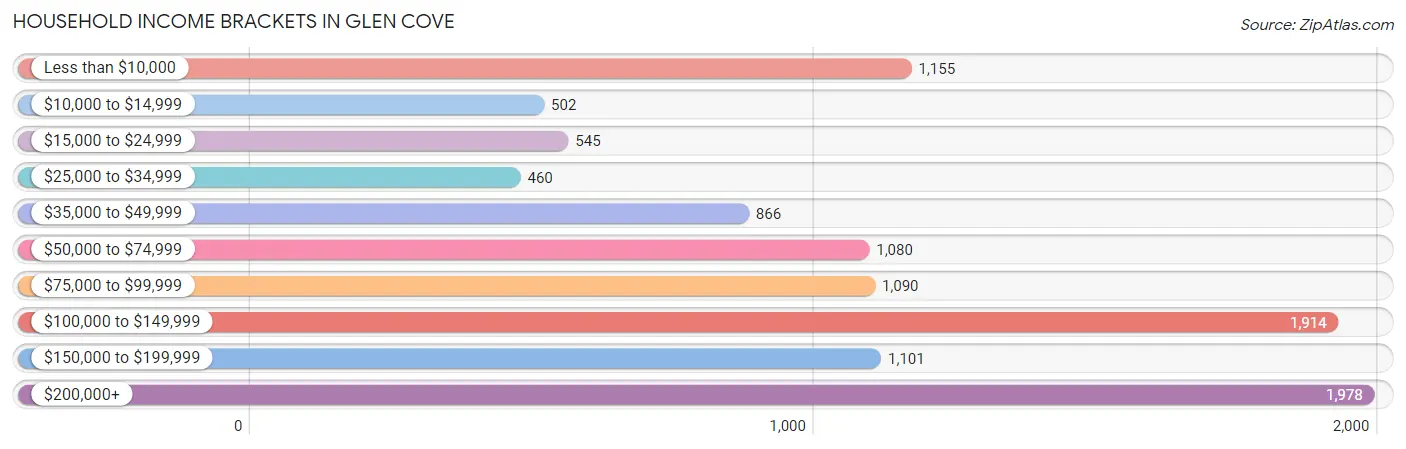
| Income Bracket | # Households | % Households |
| Less than $10,000 | 1,155 | 10.8% |
| $10,000 to $14,999 | 502 | 4.7% |
| $15,000 to $24,999 | 545 | 5.1% |
| $25,000 to $34,999 | 460 | 4.3% |
| $35,000 to $49,999 | 866 | 8.1% |
| $50,000 to $74,999 | 1,080 | 10.1% |
| $75,000 to $99,999 | 1,090 | 10.2% |
| $100,000 to $149,999 | 1,914 | 17.9% |
| $150,000 to $199,999 | 1,101 | 10.3% |
| $200,000+ | 1,978 | 18.5% |
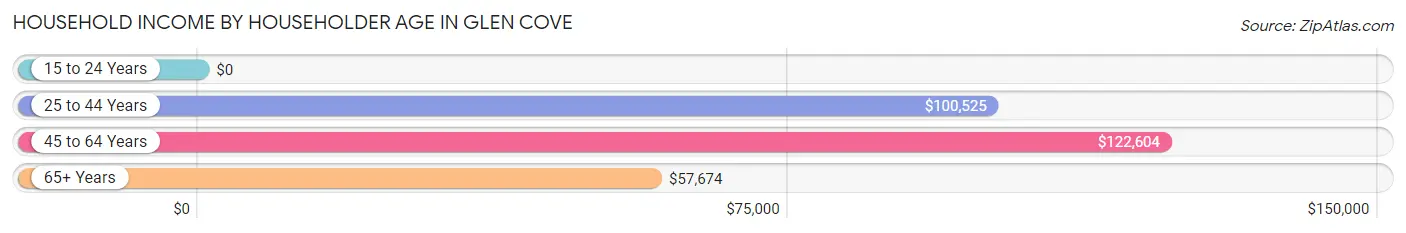
Household Income by Householder Age in Glen Cove
The median household income in Glen Cove is $91,372, with the highest median household income of $122,604 found in the 45 to 64 years age bracket for the primary householder. A total of 4,074 households (38.1%) fall into this category. Meanwhile, the 15 to 24 years age bracket for the primary householder has the lowest median household income of $0, with 611 households (5.7%) in this group.
| Income Bracket | # Households | Median Income |
| 15 to 24 Years | 611 (5.7%) | $0 |
| 25 to 44 Years | 2,806 (26.3%) | $100,525 |
| 45 to 64 Years | 4,074 (38.1%) | $122,604 |
| 65+ Years | 3,200 (29.9%) | $57,674 |
| Total | 10,691 (100.0%) | $91,372 |
Poverty in Glen Cove
Income Below Poverty by Sex and Age in Glen Cove
With 14.2% poverty level for males and 16.2% for females among the residents of Glen Cove, 18 to 24 year old males and 16 and 17 year old females are the most vulnerable to poverty, with 673 males (39.2%) and 184 females (40.4%) in their respective age groups living below the poverty level.
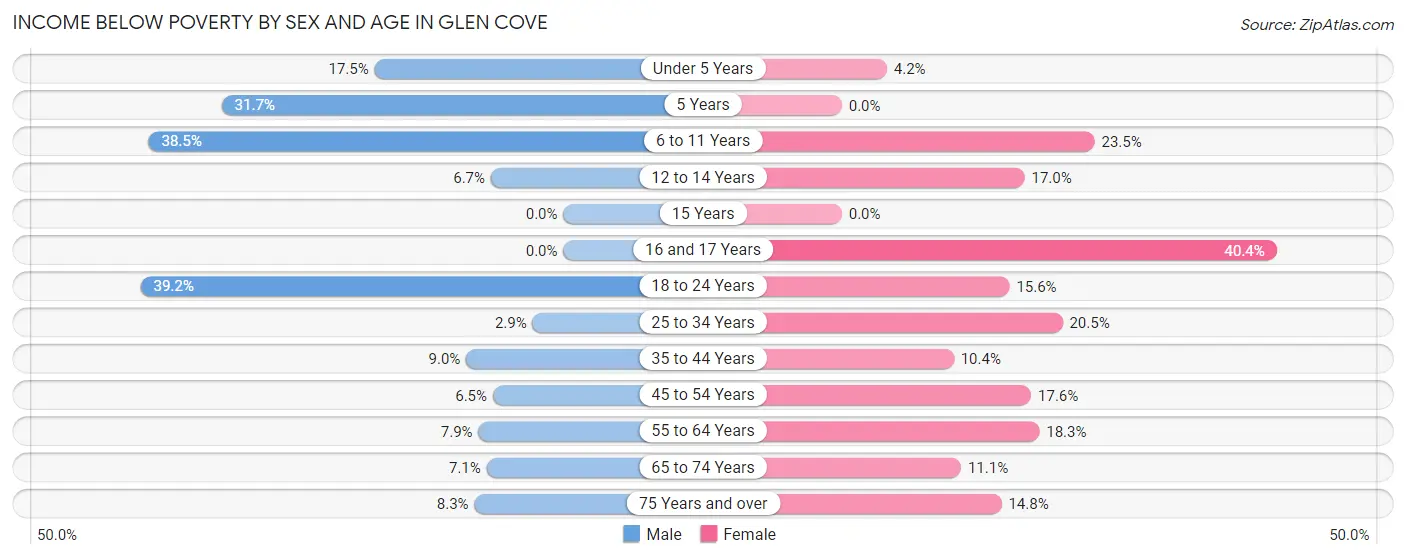
| Age Bracket | Male | Female |
| Under 5 Years | 103 (17.5%) | 28 (4.2%) |
| 5 Years | 26 (31.7%) | 0 (0.0%) |
| 6 to 11 Years | 437 (38.5%) | 191 (23.5%) |
| 12 to 14 Years | 27 (6.7%) | 57 (17.0%) |
| 15 Years | 0 (0.0%) | 0 (0.0%) |
| 16 and 17 Years | 0 (0.0%) | 184 (40.4%) |
| 18 to 24 Years | 673 (39.2%) | 145 (15.6%) |
| 25 to 34 Years | 43 (2.9%) | 407 (20.5%) |
| 35 to 44 Years | 138 (9.0%) | 175 (10.4%) |
| 45 to 54 Years | 117 (6.5%) | 359 (17.6%) |
| 55 to 64 Years | 130 (7.9%) | 388 (18.3%) |
| 65 to 74 Years | 108 (7.1%) | 176 (11.1%) |
| 75 Years and over | 74 (8.3%) | 219 (14.8%) |
| Total | 1,876 (14.2%) | 2,329 (16.2%) |
Income Above Poverty by Sex and Age in Glen Cove
According to the poverty statistics in Glen Cove, males aged 15 years and females aged 5 years are the age groups that are most secure financially, with 100.0% of males and 100.0% of females in these age groups living above the poverty line.
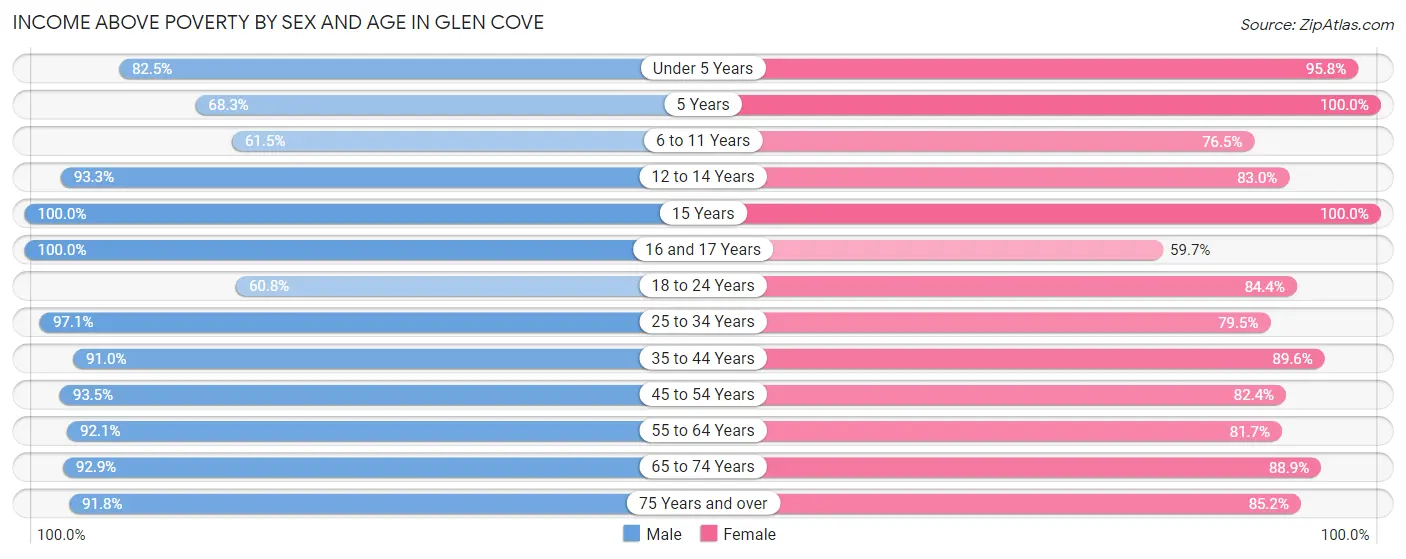
| Age Bracket | Male | Female |
| Under 5 Years | 485 (82.5%) | 642 (95.8%) |
| 5 Years | 56 (68.3%) | 113 (100.0%) |
| 6 to 11 Years | 698 (61.5%) | 623 (76.5%) |
| 12 to 14 Years | 374 (93.3%) | 279 (83.0%) |
| 15 Years | 102 (100.0%) | 139 (100.0%) |
| 16 and 17 Years | 262 (100.0%) | 272 (59.7%) |
| 18 to 24 Years | 1,042 (60.8%) | 787 (84.4%) |
| 25 to 34 Years | 1,462 (97.1%) | 1,580 (79.5%) |
| 35 to 44 Years | 1,392 (91.0%) | 1,510 (89.6%) |
| 45 to 54 Years | 1,672 (93.5%) | 1,684 (82.4%) |
| 55 to 64 Years | 1,520 (92.1%) | 1,729 (81.7%) |
| 65 to 74 Years | 1,409 (92.9%) | 1,415 (88.9%) |
| 75 Years and over | 823 (91.7%) | 1,259 (85.2%) |
| Total | 11,297 (85.8%) | 12,032 (83.8%) |
Income Below Poverty Among Married-Couple Families in Glen Cove
The poverty statistics for married-couple families in Glen Cove show that 4.6% or 222 of the total 4,818 families live below the poverty line. Families with 1 or 2 children have the highest poverty rate of 6.7%, comprising of 102 families. On the other hand, families with 3 or 4 children have the lowest poverty rate of 0.0%, which includes 0 families.
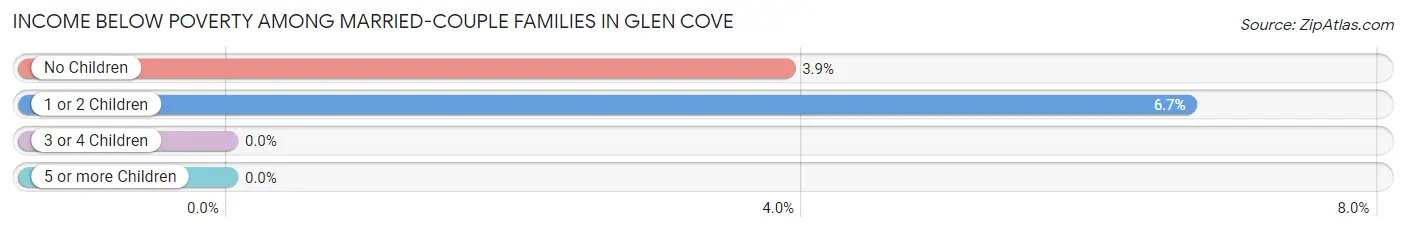
| Children | Above Poverty | Below Poverty |
| No Children | 2,976 (96.1%) | 120 (3.9%) |
| 1 or 2 Children | 1,426 (93.3%) | 102 (6.7%) |
| 3 or 4 Children | 194 (100.0%) | 0 (0.0%) |
| 5 or more Children | 0 (0.0%) | 0 (0.0%) |
| Total | 4,596 (95.4%) | 222 (4.6%) |
Income Below Poverty Among Single-Parent Households in Glen Cove
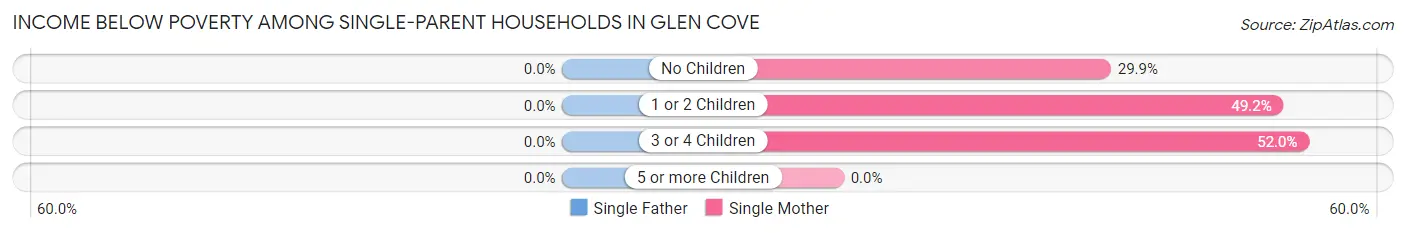
| Children | Single Father | Single Mother |
| No Children | 0 (0.0%) | 200 (29.8%) |
| 1 or 2 Children | 0 (0.0%) | 410 (49.2%) |
| 3 or 4 Children | 0 (0.0%) | 64 (52.0%) |
| 5 or more Children | 0 (0.0%) | 0 (0.0%) |
| Total | 0 (0.0%) | 674 (41.4%) |
Income Below Poverty Among Married-Couple vs Single-Parent Households in Glen Cove
The poverty data for Glen Cove shows that 222 of the married-couple family households (4.6%) and 674 of the single-parent households (29.8%) are living below the poverty level. Within the married-couple family households, those with 1 or 2 children have the highest poverty rate, with 102 households (6.7%) falling below the poverty line. Among the single-parent households, those with 3 or 4 children have the highest poverty rate, with 64 household (39.0%) living below poverty.
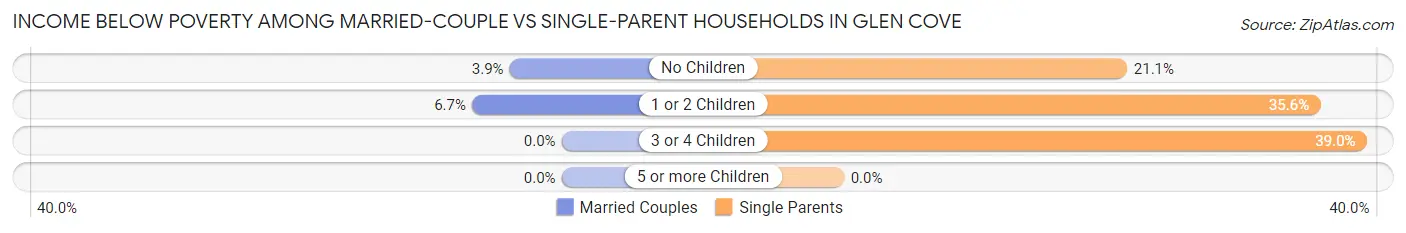
| Children | Married-Couple Families | Single-Parent Households |
| No Children | 120 (3.9%) | 200 (21.1%) |
| 1 or 2 Children | 102 (6.7%) | 410 (35.6%) |
| 3 or 4 Children | 0 (0.0%) | 64 (39.0%) |
| 5 or more Children | 0 (0.0%) | 0 (0.0%) |
| Total | 222 (4.6%) | 674 (29.8%) |
Race in Glen Cove
The most populous races in Glen Cove are White / Caucasian (18,877 | 67.1%), Hispanic or Latino (8,173 | 29.0%), and Two or more Races (2,898 | 10.3%).
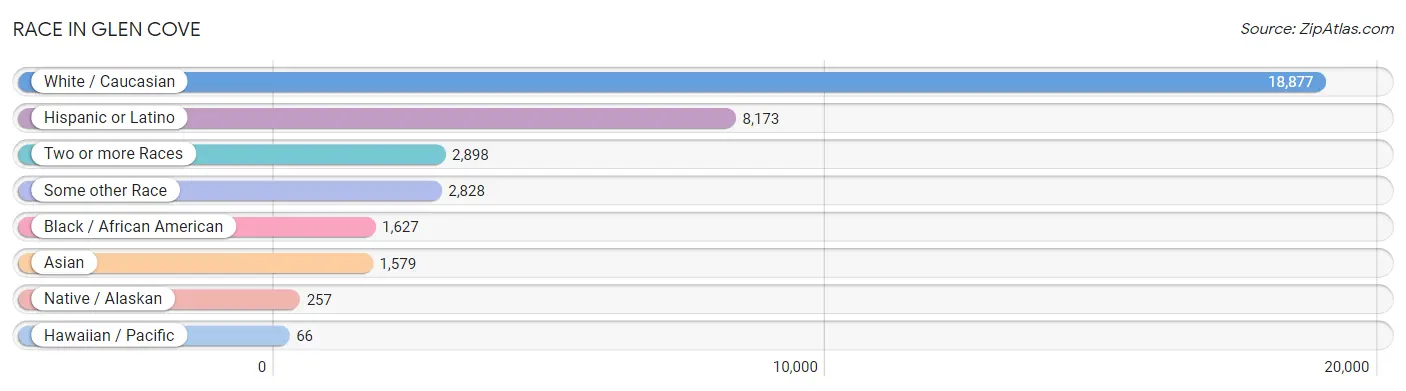
| Race | # Population | % Population |
| Asian | 1,579 | 5.6% |
| Black / African American | 1,627 | 5.8% |
| Hawaiian / Pacific | 66 | 0.2% |
| Hispanic or Latino | 8,173 | 29.0% |
| Native / Alaskan | 257 | 0.9% |
| White / Caucasian | 18,877 | 67.1% |
| Two or more Races | 2,898 | 10.3% |
| Some other Race | 2,828 | 10.1% |
| Total | 28,132 | 100.0% |
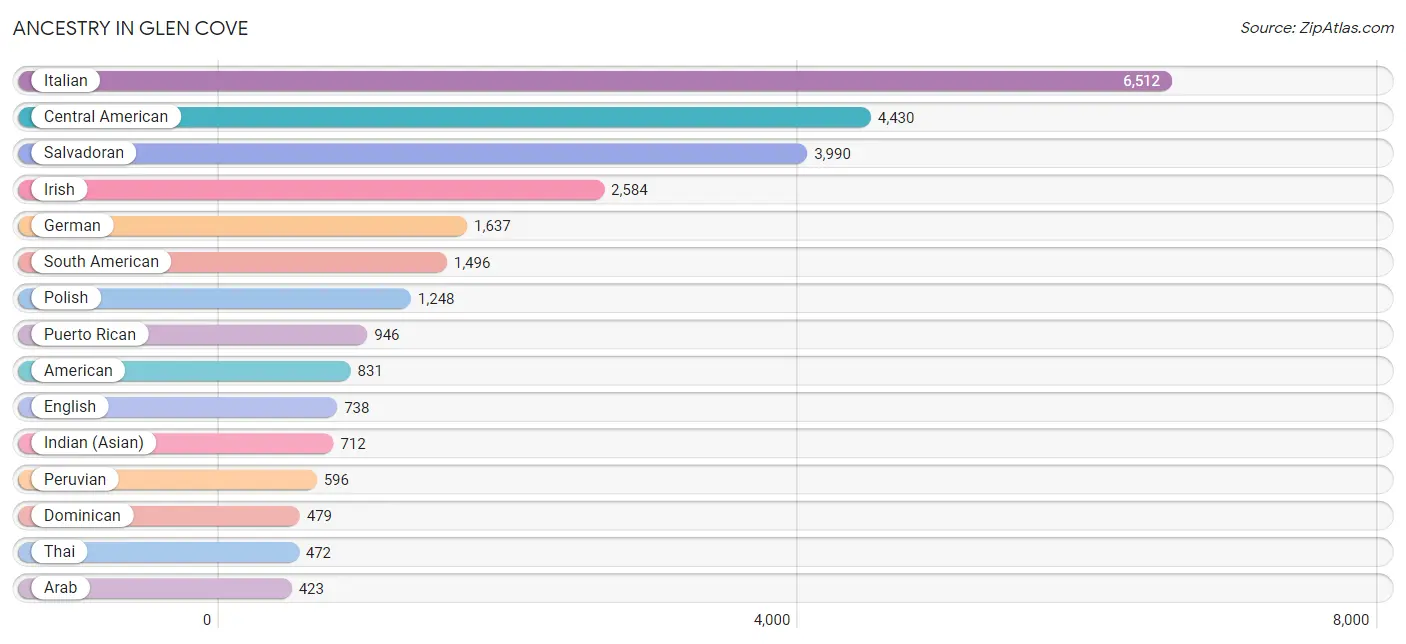
Ancestry in Glen Cove
The most populous ancestries reported in Glen Cove are Italian (6,512 | 23.2%), Central American (4,430 | 15.8%), Salvadoran (3,990 | 14.2%), Irish (2,584 | 9.2%), and German (1,637 | 5.8%), together accounting for 68.1% of all Glen Cove residents.
| Ancestry | # Population | % Population |
| Afghan | 193 | 0.7% |
| African | 49 | 0.2% |
| American | 831 | 2.9% |
| Arab | 423 | 1.5% |
| Argentinean | 125 | 0.4% |
| Armenian | 70 | 0.3% |
| Austrian | 79 | 0.3% |
| Barbadian | 6 | 0.0% |
| Bhutanese | 19 | 0.1% |
| Blackfeet | 27 | 0.1% |
| British | 15 | 0.1% |
| Bulgarian | 67 | 0.2% |
| Burmese | 128 | 0.4% |
| Canadian | 57 | 0.2% |
| Central American | 4,430 | 15.8% |
| Central American Indian | 216 | 0.8% |
| Cherokee | 19 | 0.1% |
| Chilean | 158 | 0.6% |
| Colombian | 334 | 1.2% |
| Costa Rican | 22 | 0.1% |
| Croatian | 23 | 0.1% |
| Cuban | 95 | 0.3% |
| Cypriot | 11 | 0.0% |
| Czech | 64 | 0.2% |
| Czechoslovakian | 56 | 0.2% |
| Danish | 55 | 0.2% |
| Delaware | 16 | 0.1% |
| Dominican | 479 | 1.7% |
| Dutch | 122 | 0.4% |
| Eastern European | 266 | 0.9% |
| Ecuadorian | 276 | 1.0% |
| Egyptian | 329 | 1.2% |
| English | 738 | 2.6% |
| European | 321 | 1.1% |
| Filipino | 19 | 0.1% |
| Finnish | 271 | 1.0% |
| French | 120 | 0.4% |
| French Canadian | 67 | 0.2% |
| German | 1,637 | 5.8% |
| Ghanaian | 19 | 0.1% |
| Greek | 350 | 1.2% |
| Guatemalan | 216 | 0.8% |
| Guyanese | 238 | 0.9% |
| Haitian | 15 | 0.1% |
| Honduran | 105 | 0.4% |
| Hungarian | 54 | 0.2% |
| Indian (Asian) | 712 | 2.5% |
| Iranian | 18 | 0.1% |
| Iraqi | 9 | 0.0% |
| Irish | 2,584 | 9.2% |
| Iroquois | 10 | 0.0% |
| Israeli | 12 | 0.0% |
| Italian | 6,512 | 23.2% |
| Jamaican | 34 | 0.1% |
| Jordanian | 11 | 0.0% |
| Korean | 70 | 0.3% |
| Lebanese | 7 | 0.0% |
| Lithuanian | 43 | 0.2% |
| Macedonian | 6 | 0.0% |
| Mexican | 395 | 1.4% |
| Mexican American Indian | 15 | 0.1% |
| Native Hawaiian | 66 | 0.2% |
| Nicaraguan | 77 | 0.3% |
| Nigerian | 32 | 0.1% |
| Northern European | 30 | 0.1% |
| Norwegian | 91 | 0.3% |
| Pakistani | 11 | 0.0% |
| Palestinian | 11 | 0.0% |
| Panamanian | 20 | 0.1% |
| Peruvian | 596 | 2.1% |
| Polish | 1,248 | 4.4% |
| Portuguese | 130 | 0.5% |
| Puerto Rican | 946 | 3.4% |
| Romanian | 27 | 0.1% |
| Russian | 396 | 1.4% |
| Salvadoran | 3,990 | 14.2% |
| Scandinavian | 14 | 0.1% |
| Scotch-Irish | 32 | 0.1% |
| Scottish | 340 | 1.2% |
| Serbian | 12 | 0.0% |
| Slovak | 47 | 0.2% |
| South American | 1,496 | 5.3% |
| Spaniard | 66 | 0.2% |
| Subsaharan African | 100 | 0.4% |
| Swedish | 393 | 1.4% |
| Swiss | 61 | 0.2% |
| Syrian | 14 | 0.1% |
| Thai | 472 | 1.7% |
| Trinidadian and Tobagonian | 32 | 0.1% |
| Ukrainian | 24 | 0.1% |
| Venezuelan | 7 | 0.0% |
| Welsh | 92 | 0.3% |
| West Indian | 143 | 0.5% | View All 93 Rows |
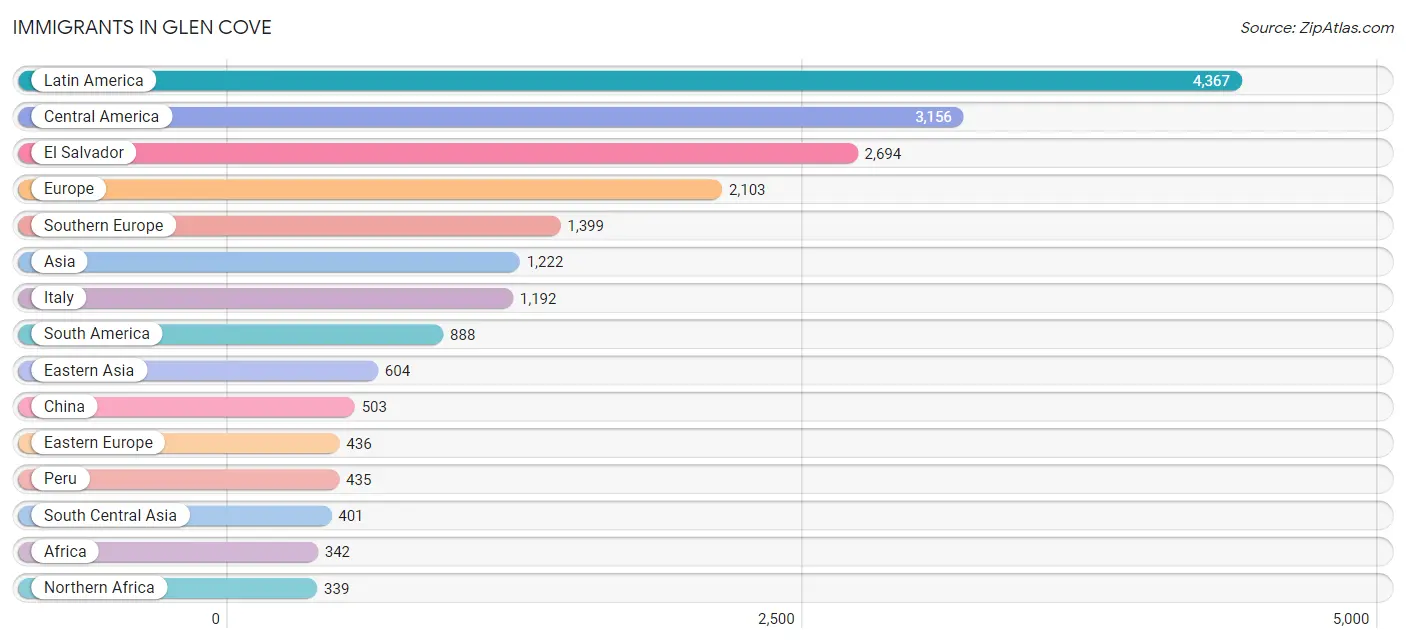
Immigrants in Glen Cove
The most numerous immigrant groups reported in Glen Cove came from Latin America (4,367 | 15.5%), Central America (3,156 | 11.2%), El Salvador (2,694 | 9.6%), Europe (2,103 | 7.5%), and Southern Europe (1,399 | 5.0%), together accounting for 48.8% of all Glen Cove residents.
| Immigration Origin | # Population | % Population |
| Afghanistan | 59 | 0.2% |
| Africa | 342 | 1.2% |
| Asia | 1,222 | 4.3% |
| Austria | 12 | 0.0% |
| Bangladesh | 52 | 0.2% |
| Bulgaria | 67 | 0.2% |
| Canada | 59 | 0.2% |
| Caribbean | 323 | 1.1% |
| Central America | 3,156 | 11.2% |
| Chile | 47 | 0.2% |
| China | 503 | 1.8% |
| Colombia | 88 | 0.3% |
| Costa Rica | 22 | 0.1% |
| Cuba | 59 | 0.2% |
| Czechoslovakia | 44 | 0.2% |
| Dominican Republic | 204 | 0.7% |
| Eastern Asia | 604 | 2.1% |
| Eastern Europe | 436 | 1.5% |
| Ecuador | 35 | 0.1% |
| Egypt | 315 | 1.1% |
| El Salvador | 2,694 | 9.6% |
| England | 16 | 0.1% |
| Europe | 2,103 | 7.5% |
| France | 16 | 0.1% |
| Germany | 81 | 0.3% |
| Greece | 168 | 0.6% |
| Guatemala | 199 | 0.7% |
| Guyana | 234 | 0.8% |
| Haiti | 5 | 0.0% |
| Honduras | 91 | 0.3% |
| Hong Kong | 86 | 0.3% |
| Hungary | 11 | 0.0% |
| India | 130 | 0.5% |
| Iran | 51 | 0.2% |
| Ireland | 54 | 0.2% |
| Israel | 28 | 0.1% |
| Italy | 1,192 | 4.2% |
| Jamaica | 32 | 0.1% |
| Japan | 25 | 0.1% |
| Korea | 76 | 0.3% |
| Latin America | 4,367 | 15.5% |
| Lebanon | 30 | 0.1% |
| Lithuania | 12 | 0.0% |
| Mexico | 106 | 0.4% |
| Morocco | 24 | 0.1% |
| Nepal | 29 | 0.1% |
| Nicaragua | 44 | 0.2% |
| Nigeria | 3 | 0.0% |
| Northern Africa | 339 | 1.2% |
| Northern Europe | 159 | 0.6% |
| Norway | 9 | 0.0% |
| Pakistan | 80 | 0.3% |
| Peru | 435 | 1.5% |
| Philippines | 78 | 0.3% |
| Poland | 209 | 0.7% |
| Portugal | 12 | 0.0% |
| Romania | 29 | 0.1% |
| Russia | 22 | 0.1% |
| Saudi Arabia | 40 | 0.1% |
| South America | 888 | 3.2% |
| South Central Asia | 401 | 1.4% |
| South Eastern Asia | 114 | 0.4% |
| Southern Europe | 1,399 | 5.0% |
| Spain | 27 | 0.1% |
| St. Vincent and the Grenadines | 1 | 0.0% |
| Taiwan | 25 | 0.1% |
| Trinidad and Tobago | 7 | 0.0% |
| Turkey | 5 | 0.0% |
| Ukraine | 42 | 0.2% |
| Venezuela | 49 | 0.2% |
| Western Africa | 3 | 0.0% |
| Western Asia | 103 | 0.4% |
| Western Europe | 109 | 0.4% | View All 73 Rows |
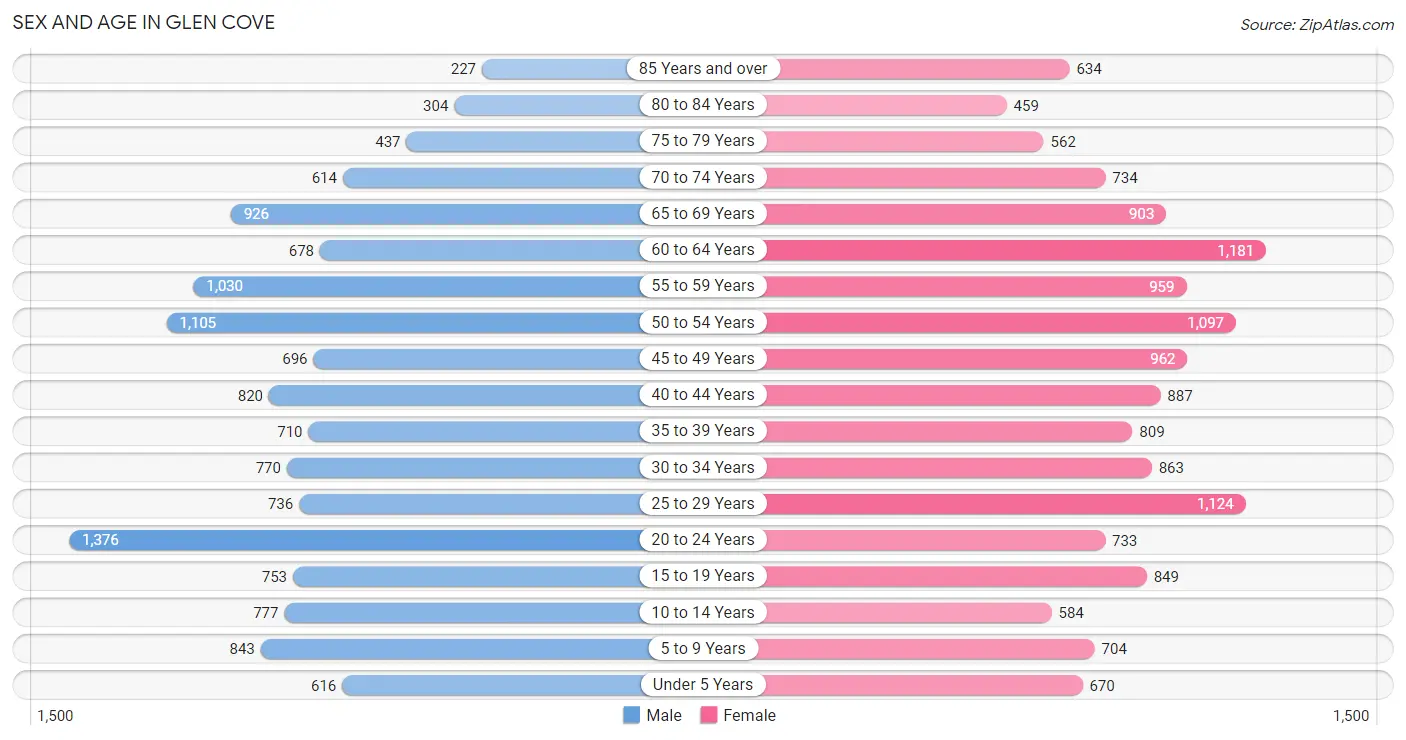
Sex and Age in Glen Cove
Sex and Age in Glen Cove
The most populous age groups in Glen Cove are 20 to 24 Years (1,376 | 10.2%) for men and 60 to 64 Years (1,181 | 8.0%) for women.
| Age Bracket | Male | Female |
| Under 5 Years | 616 (4.6%) | 670 (4.5%) |
| 5 to 9 Years | 843 (6.3%) | 704 (4.8%) |
| 10 to 14 Years | 777 (5.8%) | 584 (4.0%) |
| 15 to 19 Years | 753 (5.6%) | 849 (5.8%) |
| 20 to 24 Years | 1,376 (10.2%) | 733 (5.0%) |
| 25 to 29 Years | 736 (5.5%) | 1,124 (7.6%) |
| 30 to 34 Years | 770 (5.7%) | 863 (5.9%) |
| 35 to 39 Years | 710 (5.3%) | 809 (5.5%) |
| 40 to 44 Years | 820 (6.1%) | 887 (6.0%) |
| 45 to 49 Years | 696 (5.2%) | 962 (6.5%) |
| 50 to 54 Years | 1,105 (8.2%) | 1,097 (7.5%) |
| 55 to 59 Years | 1,030 (7.7%) | 959 (6.5%) |
| 60 to 64 Years | 678 (5.1%) | 1,181 (8.0%) |
| 65 to 69 Years | 926 (6.9%) | 903 (6.1%) |
| 70 to 74 Years | 614 (4.6%) | 734 (5.0%) |
| 75 to 79 Years | 437 (3.3%) | 562 (3.8%) |
| 80 to 84 Years | 304 (2.3%) | 459 (3.1%) |
| 85 Years and over | 227 (1.7%) | 634 (4.3%) |
| Total | 13,418 (100.0%) | 14,714 (100.0%) |
Families and Households in Glen Cove
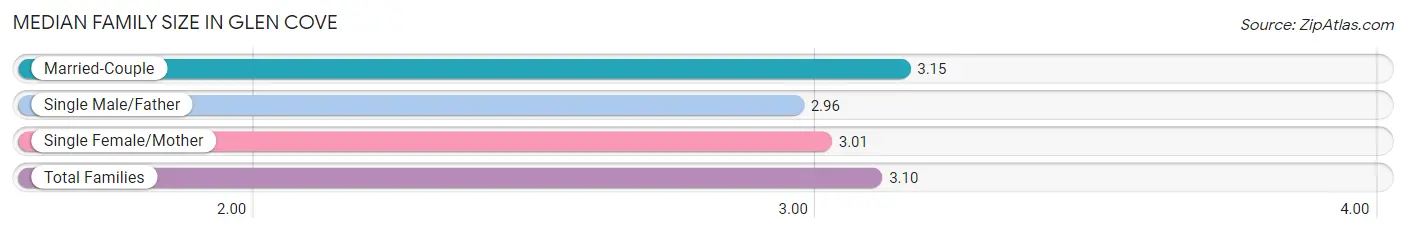
Median Family Size in Glen Cove
The median family size in Glen Cove is 3.10 persons per family, with married-couple families (4,818 | 68.0%) accounting for the largest median family size of 3.15 persons per family. On the other hand, single male/father families (638 | 9.0%) represent the smallest median family size with 2.96 persons per family.
| Family Type | # Families | Family Size |
| Married-Couple | 4,818 (68.0%) | 3.15 |
| Single Male/Father | 638 (9.0%) | 2.96 |
| Single Female/Mother | 1,627 (23.0%) | 3.01 |
| Total Families | 7,083 (100.0%) | 3.10 |
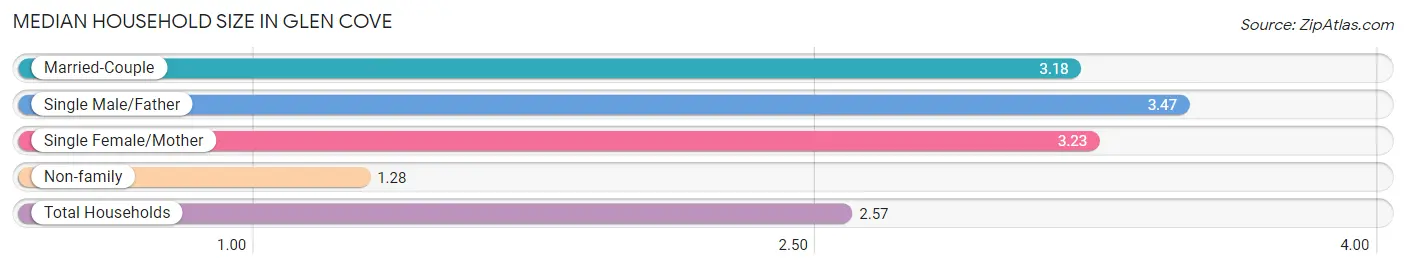
Median Household Size in Glen Cove
The median household size in Glen Cove is 2.57 persons per household, with single male/father households (638 | 6.0%) accounting for the largest median household size of 3.47 persons per household. non-family households (3,608 | 33.8%) represent the smallest median household size with 1.28 persons per household.
| Household Type | # Households | Household Size |
| Married-Couple | 4,818 (45.1%) | 3.18 |
| Single Male/Father | 638 (6.0%) | 3.47 |
| Single Female/Mother | 1,627 (15.2%) | 3.23 |
| Non-family | 3,608 (33.8%) | 1.28 |
| Total Households | 10,691 (100.0%) | 2.57 |
Household Size by Marriage Status in Glen Cove
Out of a total of 10,691 households in Glen Cove, 7,083 (66.2%) are family households, while 3,608 (33.8%) are nonfamily households. The most numerous type of family households are 2-person households, comprising 2,706, and the most common type of nonfamily households are 1-person households, comprising 2,853.
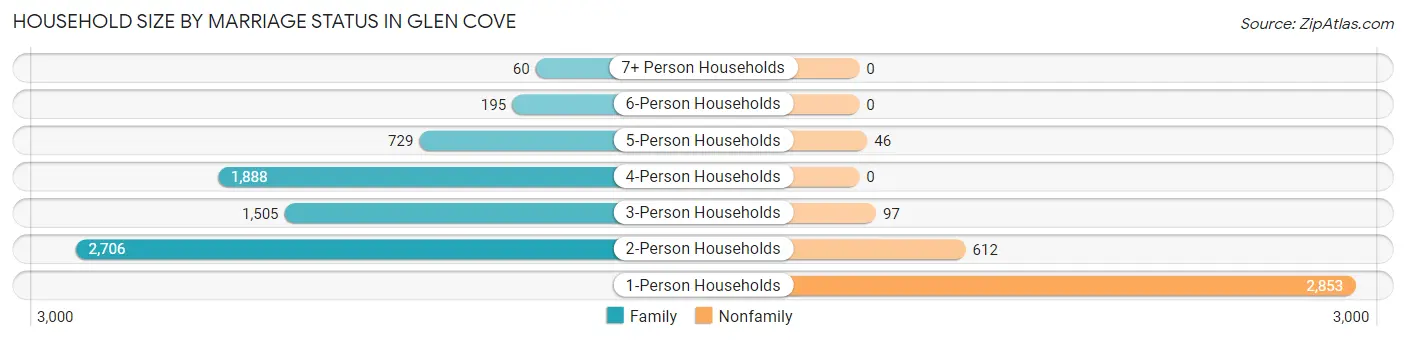
| Household Size | Family Households | Nonfamily Households |
| 1-Person Households | - | 2,853 (26.7%) |
| 2-Person Households | 2,706 (25.3%) | 612 (5.7%) |
| 3-Person Households | 1,505 (14.1%) | 97 (0.9%) |
| 4-Person Households | 1,888 (17.7%) | 0 (0.0%) |
| 5-Person Households | 729 (6.8%) | 46 (0.4%) |
| 6-Person Households | 195 (1.8%) | 0 (0.0%) |
| 7+ Person Households | 60 (0.6%) | 0 (0.0%) |
| Total | 7,083 (66.2%) | 3,608 (33.8%) |
Female Fertility in Glen Cove
Fertility by Age in Glen Cove
Average fertility rate in Glen Cove is 10.0 births per 1,000 women. Women in the age bracket of 20 to 34 years have the highest fertility rate with 12.0 births per 1,000 women. Women in the age bracket of 20 to 34 years acount for 52.4% of all women with births.
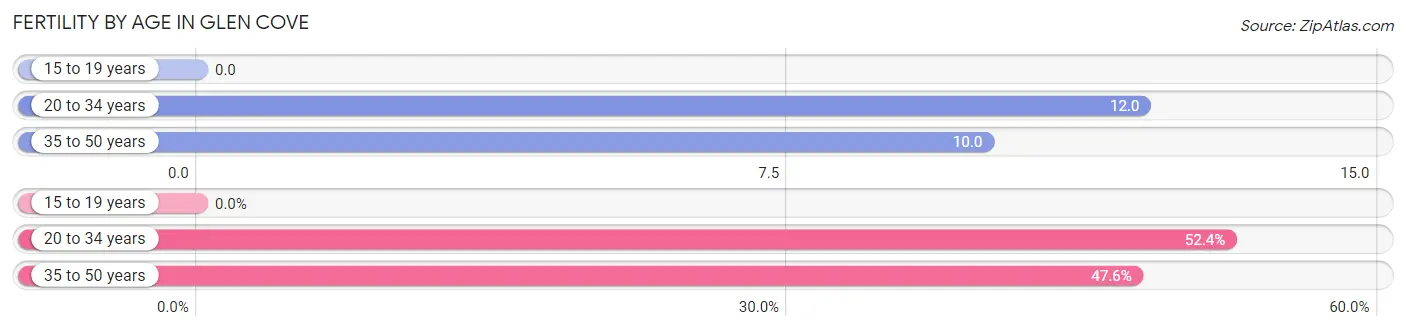
| Age Bracket | Women with Births | Births / 1,000 Women |
| 15 to 19 years | 0 (0.0%) | 0.0 |
| 20 to 34 years | 33 (52.4%) | 12.0 |
| 35 to 50 years | 30 (47.6%) | 10.0 |
| Total | 63 (100.0%) | 10.0 |
Fertility by Age by Marriage Status in Glen Cove
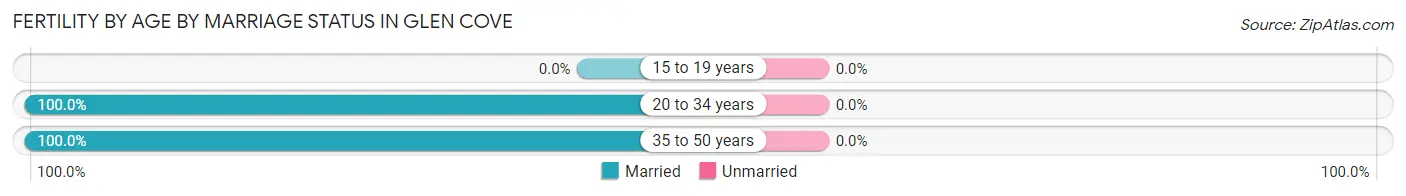
| Age Bracket | Married | Unmarried |
| 15 to 19 years | 0 (0.0%) | 0 (0.0%) |
| 20 to 34 years | 33 (100.0%) | 0 (0.0%) |
| 35 to 50 years | 30 (100.0%) | 0 (0.0%) |
| Total | 63 (100.0%) | 0 (0.0%) |
Fertility by Education in Glen Cove
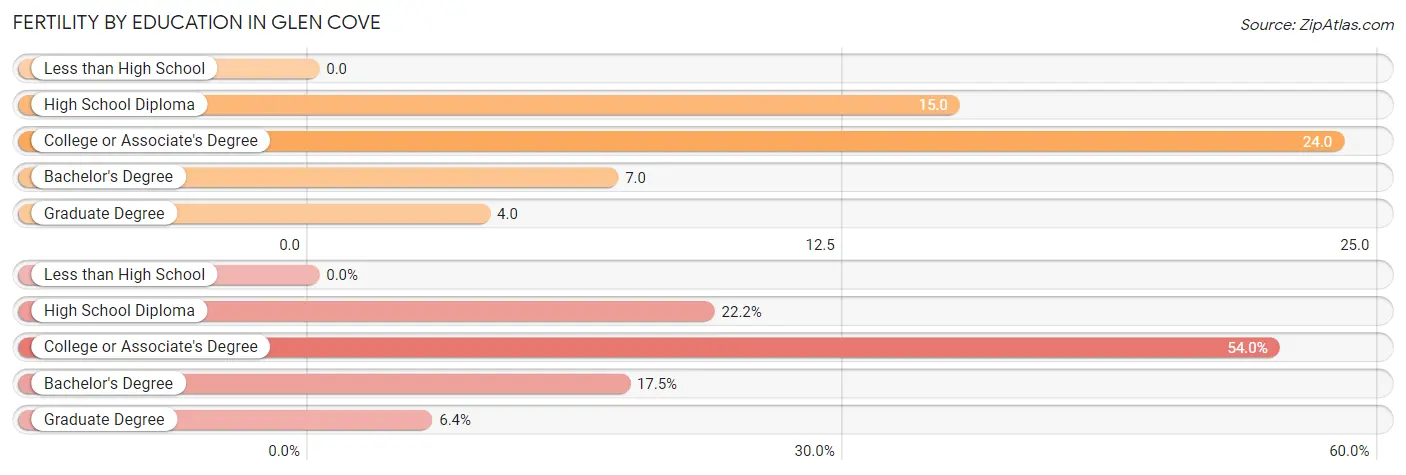
| Educational Attainment | Women with Births | Births / 1,000 Women |
| Less than High School | 0 (0.0%) | 0.0 |
| High School Diploma | 14 (22.2%) | 15.0 |
| College or Associate's Degree | 34 (54.0%) | 24.0 |
| Bachelor's Degree | 11 (17.5%) | 7.0 |
| Graduate Degree | 4 (6.4%) | 4.0 |
| Total | 63 (100.0%) | 10.0 |
Fertility by Education by Marriage Status in Glen Cove
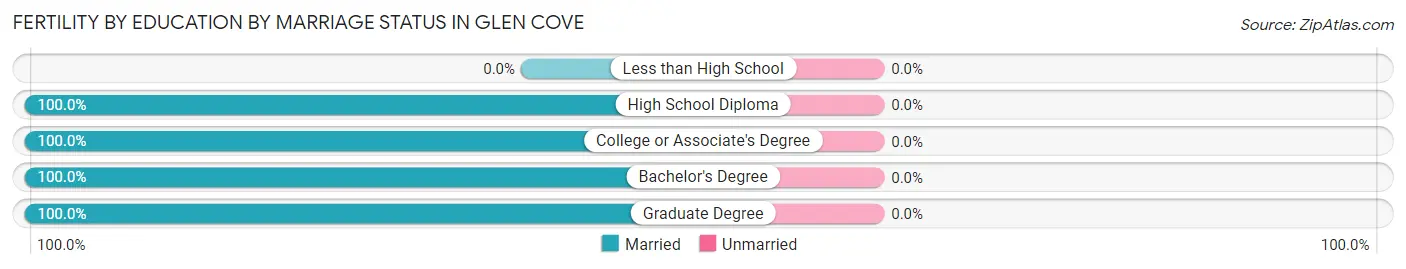
| Educational Attainment | Married | Unmarried |
| Less than High School | 0 (0.0%) | 0 (0.0%) |
| High School Diploma | 14 (100.0%) | 0 (0.0%) |
| College or Associate's Degree | 34 (100.0%) | 0 (0.0%) |
| Bachelor's Degree | 11 (100.0%) | 0 (0.0%) |
| Graduate Degree | 4 (100.0%) | 0 (0.0%) |
| Total | 63 (100.0%) | 0 (0.0%) |
Employment Characteristics in Glen Cove
Employment by Class of Employer in Glen Cove
Among the 13,537 employed individuals in Glen Cove, private company employees (8,980 | 66.3%), local government employees (1,400 | 10.3%), and not-for-profit organizations (1,314 | 9.7%) make up the most common classes of employment.
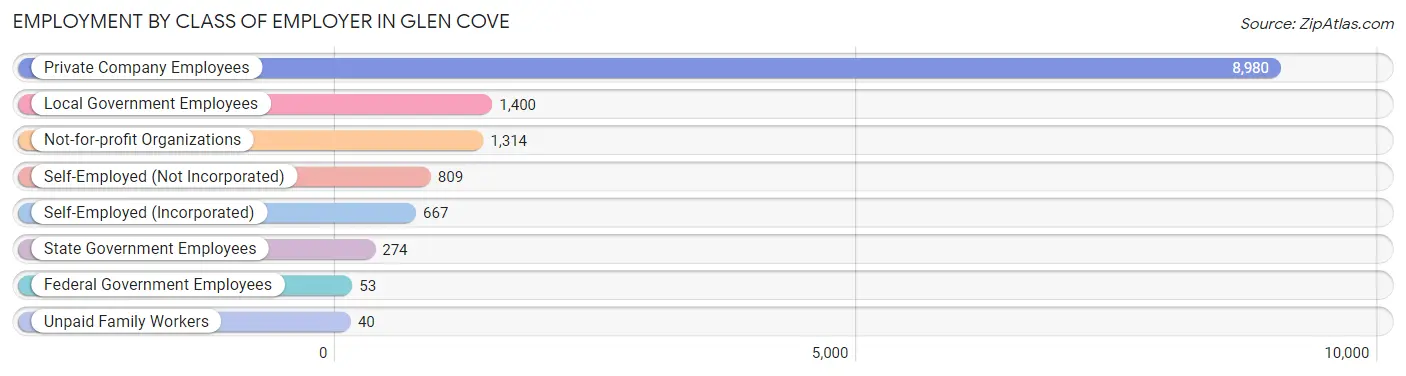
| Employer Class | # Employees | % Employees |
| Private Company Employees | 8,980 | 66.3% |
| Self-Employed (Incorporated) | 667 | 4.9% |
| Self-Employed (Not Incorporated) | 809 | 6.0% |
| Not-for-profit Organizations | 1,314 | 9.7% |
| Local Government Employees | 1,400 | 10.3% |
| State Government Employees | 274 | 2.0% |
| Federal Government Employees | 53 | 0.4% |
| Unpaid Family Workers | 40 | 0.3% |
| Total | 13,537 | 100.0% |
Employment Status by Age in Glen Cove
According to the labor force statistics for Glen Cove, out of the total population over 16 years of age (23,696), 61.0% or 14,455 individuals are in the labor force, with 3.6% or 520 of them unemployed. The age group with the highest labor force participation rate is 30 to 34 years, with 88.4% or 1,444 individuals in the labor force. Within the labor force, the 55 to 59 years age range has the highest percentage of unemployed individuals, with 7.5% or 110 of them being unemployed.
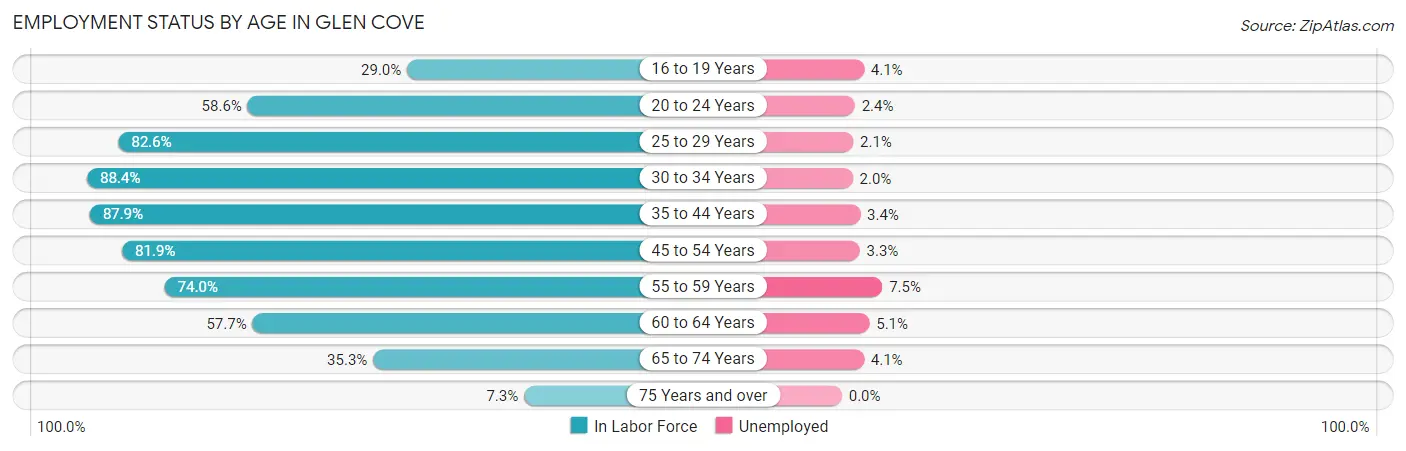
| Age Bracket | In Labor Force | Unemployed |
| 16 to 19 Years | 394 (29.0%) | 16 (4.1%) |
| 20 to 24 Years | 1,236 (58.6%) | 30 (2.4%) |
| 25 to 29 Years | 1,536 (82.6%) | 32 (2.1%) |
| 30 to 34 Years | 1,444 (88.4%) | 29 (2.0%) |
| 35 to 44 Years | 2,836 (87.9%) | 96 (3.4%) |
| 45 to 54 Years | 3,161 (81.9%) | 104 (3.3%) |
| 55 to 59 Years | 1,472 (74.0%) | 110 (7.5%) |
| 60 to 64 Years | 1,073 (57.7%) | 55 (5.1%) |
| 65 to 74 Years | 1,121 (35.3%) | 46 (4.1%) |
| 75 Years and over | 191 (7.3%) | 0 (0.0%) |
| Total | 14,455 (61.0%) | 520 (3.6%) |
Employment Status by Educational Attainment in Glen Cove
According to labor force statistics for Glen Cove, 79.9% of individuals (11,527) out of the total population between 25 and 64 years of age (14,427) are in the labor force, with 3.7% or 426 of them being unemployed. The group with the highest labor force participation rate are those with the educational attainment of bachelor's degree or higher, with 83.5% or 5,358 individuals in the labor force. Within the labor force, individuals with high school diploma education have the highest percentage of unemployment, with 7.4% or 189 of them being unemployed.
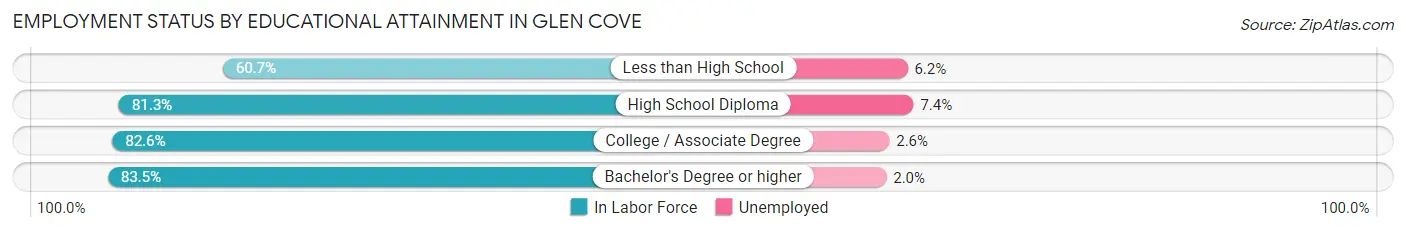
| Educational Attainment | In Labor Force | Unemployed |
| Less than High School | 1,147 (60.7%) | 117 (6.2%) |
| High School Diploma | 2,555 (81.3%) | 233 (7.4%) |
| College / Associate Degree | 2,460 (82.6%) | 77 (2.6%) |
| Bachelor's Degree or higher | 5,358 (83.5%) | 128 (2.0%) |
| Total | 11,527 (79.9%) | 534 (3.7%) |
Employment Occupations by Sex in Glen Cove
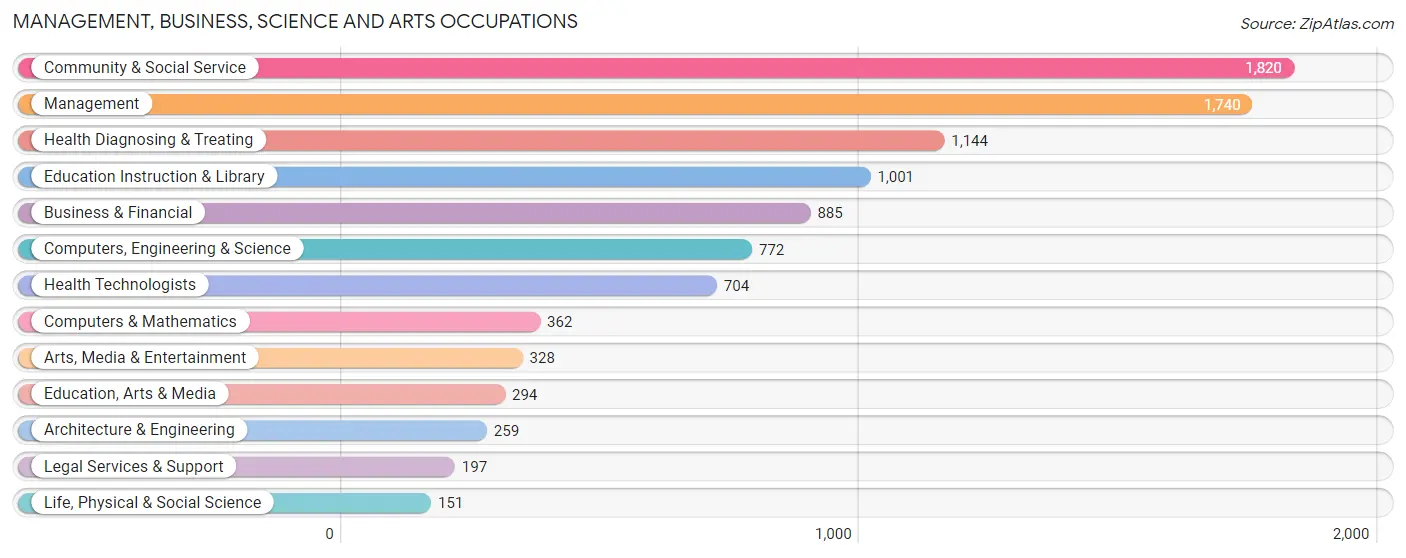
Management, Business, Science and Arts Occupations
The most common Management, Business, Science and Arts occupations in Glen Cove are Community & Social Service (1,820 | 13.1%), Management (1,740 | 12.5%), Health Diagnosing & Treating (1,144 | 8.2%), Education Instruction & Library (1,001 | 7.2%), and Business & Financial (885 | 6.4%).
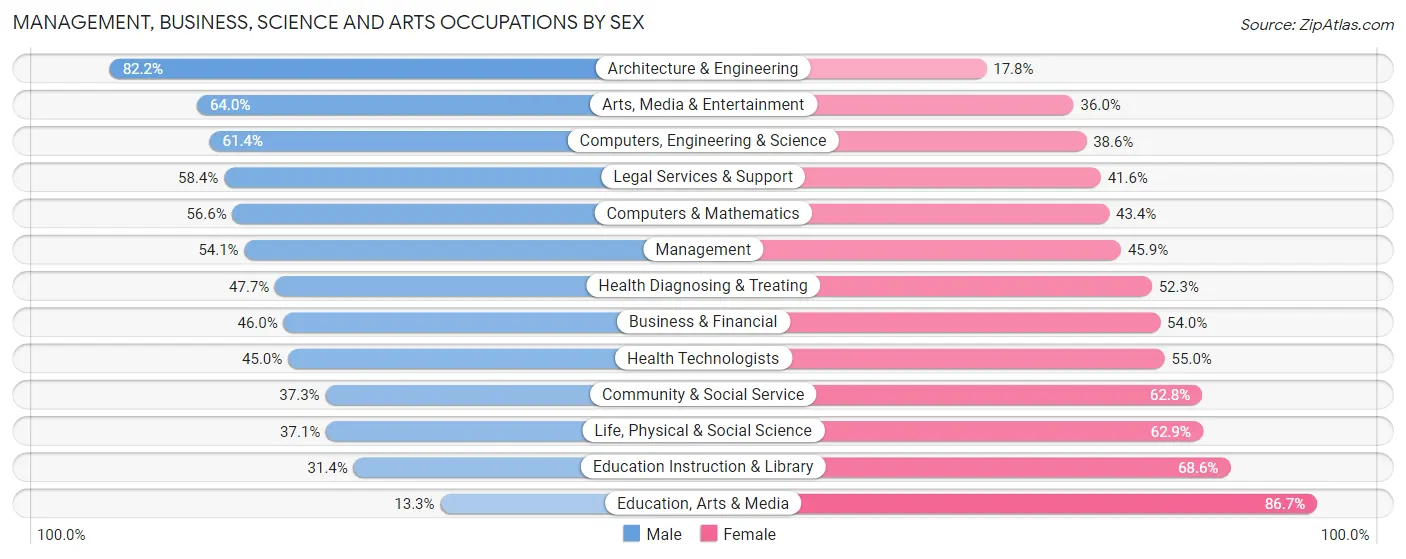
Management, Business, Science and Arts Occupations by Sex
Within the Management, Business, Science and Arts occupations in Glen Cove, the most male-oriented occupations are Architecture & Engineering (82.2%), Arts, Media & Entertainment (64.0%), and Computers, Engineering & Science (61.4%), while the most female-oriented occupations are Education, Arts & Media (86.7%), Education Instruction & Library (68.6%), and Life, Physical & Social Science (62.9%).
| Occupation | Male | Female |
| Management | 942 (54.1%) | 798 (45.9%) |
| Business & Financial | 407 (46.0%) | 478 (54.0%) |
| Computers, Engineering & Science | 474 (61.4%) | 298 (38.6%) |
| Computers & Mathematics | 205 (56.6%) | 157 (43.4%) |
| Architecture & Engineering | 213 (82.2%) | 46 (17.8%) |
| Life, Physical & Social Science | 56 (37.1%) | 95 (62.9%) |
| Community & Social Service | 678 (37.2%) | 1,142 (62.7%) |
| Education, Arts & Media | 39 (13.3%) | 255 (86.7%) |
| Legal Services & Support | 115 (58.4%) | 82 (41.6%) |
| Education Instruction & Library | 314 (31.4%) | 687 (68.6%) |
| Arts, Media & Entertainment | 210 (64.0%) | 118 (36.0%) |
| Health Diagnosing & Treating | 546 (47.7%) | 598 (52.3%) |
| Health Technologists | 317 (45.0%) | 387 (55.0%) |
| Total (Category) | 3,047 (47.9%) | 3,314 (52.1%) |
| Total (Overall) | 7,194 (51.6%) | 6,750 (48.4%) |
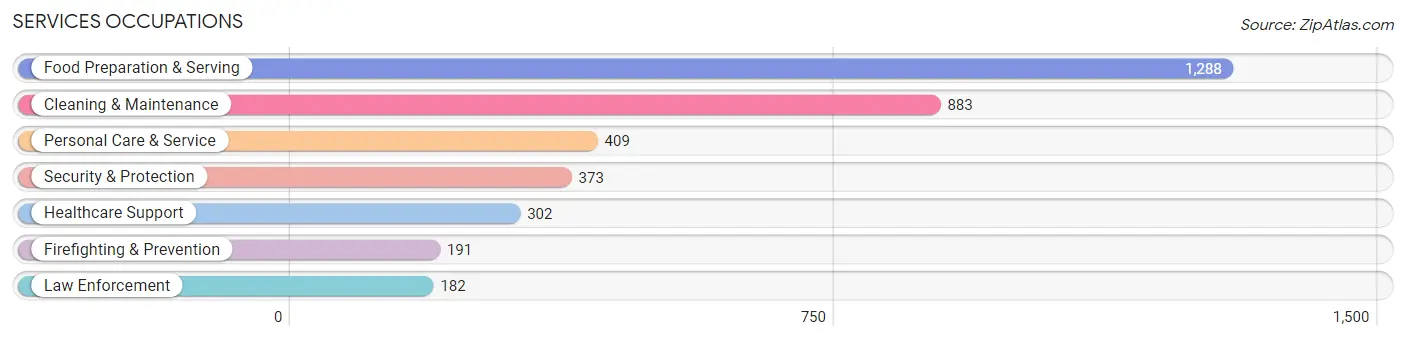
Services Occupations
The most common Services occupations in Glen Cove are Food Preparation & Serving (1,288 | 9.2%), Cleaning & Maintenance (883 | 6.3%), Personal Care & Service (409 | 2.9%), Security & Protection (373 | 2.7%), and Healthcare Support (302 | 2.2%).
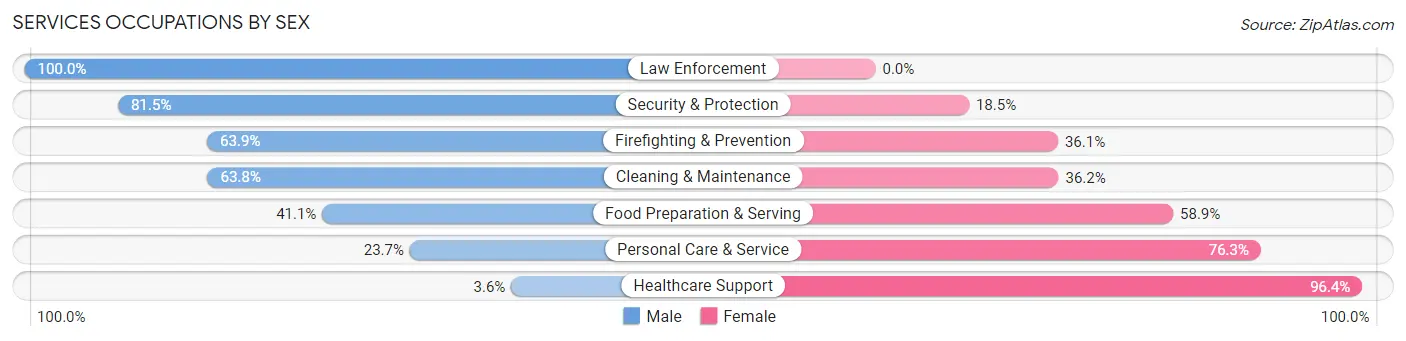
Services Occupations by Sex
Within the Services occupations in Glen Cove, the most male-oriented occupations are Law Enforcement (100.0%), Security & Protection (81.5%), and Firefighting & Prevention (63.9%), while the most female-oriented occupations are Healthcare Support (96.4%), Personal Care & Service (76.3%), and Food Preparation & Serving (58.9%).
| Occupation | Male | Female |
| Healthcare Support | 11 (3.6%) | 291 (96.4%) |
| Security & Protection | 304 (81.5%) | 69 (18.5%) |
| Firefighting & Prevention | 122 (63.9%) | 69 (36.1%) |
| Law Enforcement | 182 (100.0%) | 0 (0.0%) |
| Food Preparation & Serving | 529 (41.1%) | 759 (58.9%) |
| Cleaning & Maintenance | 563 (63.8%) | 320 (36.2%) |
| Personal Care & Service | 97 (23.7%) | 312 (76.3%) |
| Total (Category) | 1,504 (46.2%) | 1,751 (53.8%) |
| Total (Overall) | 7,194 (51.6%) | 6,750 (48.4%) |
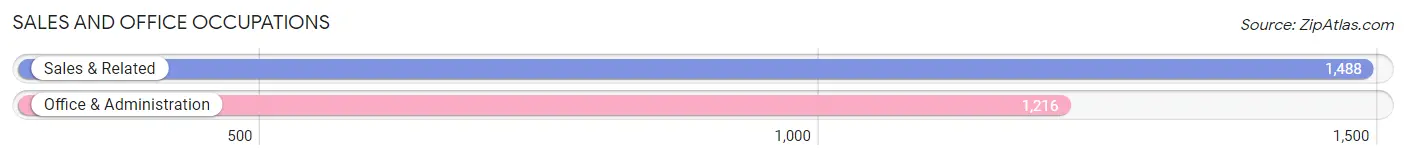
Sales and Office Occupations
The most common Sales and Office occupations in Glen Cove are Sales & Related (1,488 | 10.7%), and Office & Administration (1,216 | 8.7%).
Sales and Office Occupations by Sex
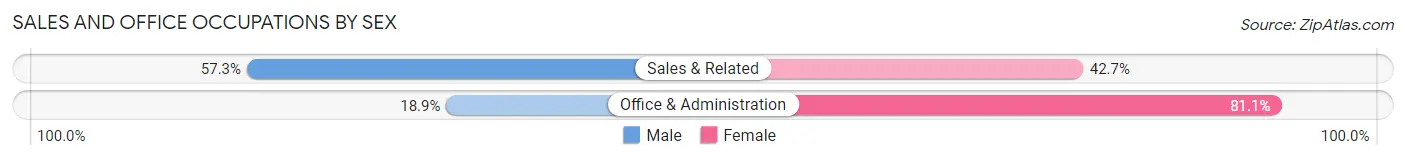
| Occupation | Male | Female |
| Sales & Related | 852 (57.3%) | 636 (42.7%) |
| Office & Administration | 230 (18.9%) | 986 (81.1%) |
| Total (Category) | 1,082 (40.0%) | 1,622 (60.0%) |
| Total (Overall) | 7,194 (51.6%) | 6,750 (48.4%) |
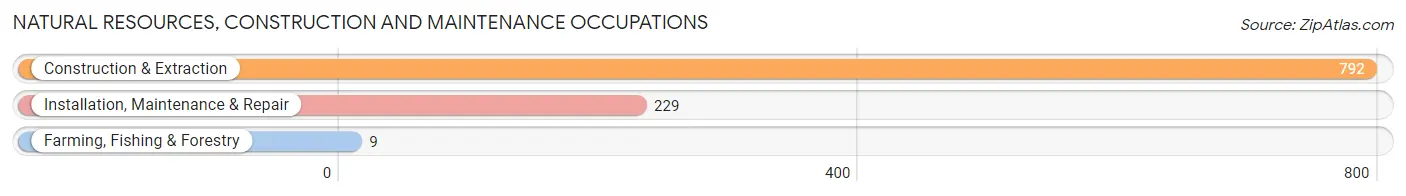
Natural Resources, Construction and Maintenance Occupations
The most common Natural Resources, Construction and Maintenance occupations in Glen Cove are Construction & Extraction (792 | 5.7%), Installation, Maintenance & Repair (229 | 1.6%), and Farming, Fishing & Forestry (9 | 0.1%).
Natural Resources, Construction and Maintenance Occupations by Sex
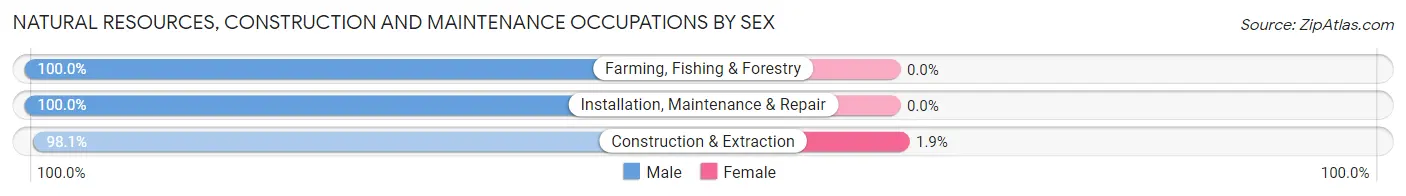
| Occupation | Male | Female |
| Farming, Fishing & Forestry | 9 (100.0%) | 0 (0.0%) |
| Construction & Extraction | 777 (98.1%) | 15 (1.9%) |
| Installation, Maintenance & Repair | 229 (100.0%) | 0 (0.0%) |
| Total (Category) | 1,015 (98.5%) | 15 (1.5%) |
| Total (Overall) | 7,194 (51.6%) | 6,750 (48.4%) |
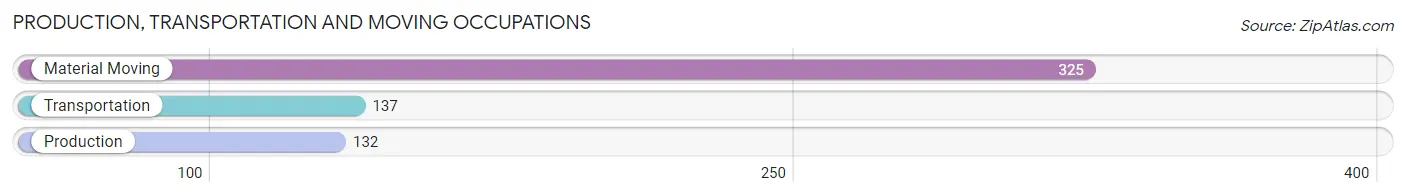
Production, Transportation and Moving Occupations
The most common Production, Transportation and Moving occupations in Glen Cove are Material Moving (325 | 2.3%), Transportation (137 | 1.0%), and Production (132 | 0.9%).
Production, Transportation and Moving Occupations by Sex
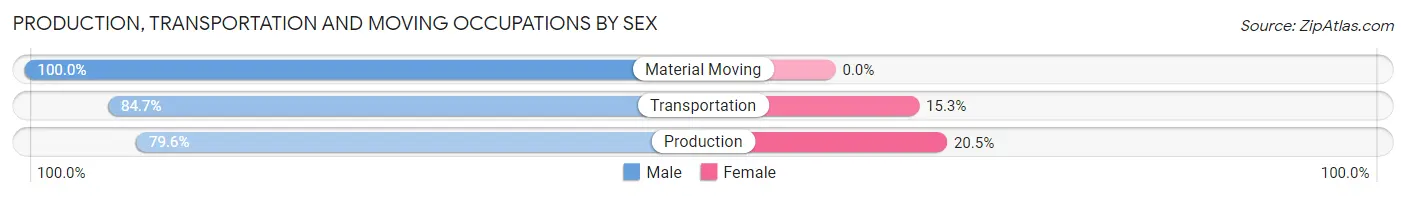
| Occupation | Male | Female |
| Production | 105 (79.5%) | 27 (20.4%) |
| Transportation | 116 (84.7%) | 21 (15.3%) |
| Material Moving | 325 (100.0%) | 0 (0.0%) |
| Total (Category) | 546 (91.9%) | 48 (8.1%) |
| Total (Overall) | 7,194 (51.6%) | 6,750 (48.4%) |
Employment Industries by Sex in Glen Cove
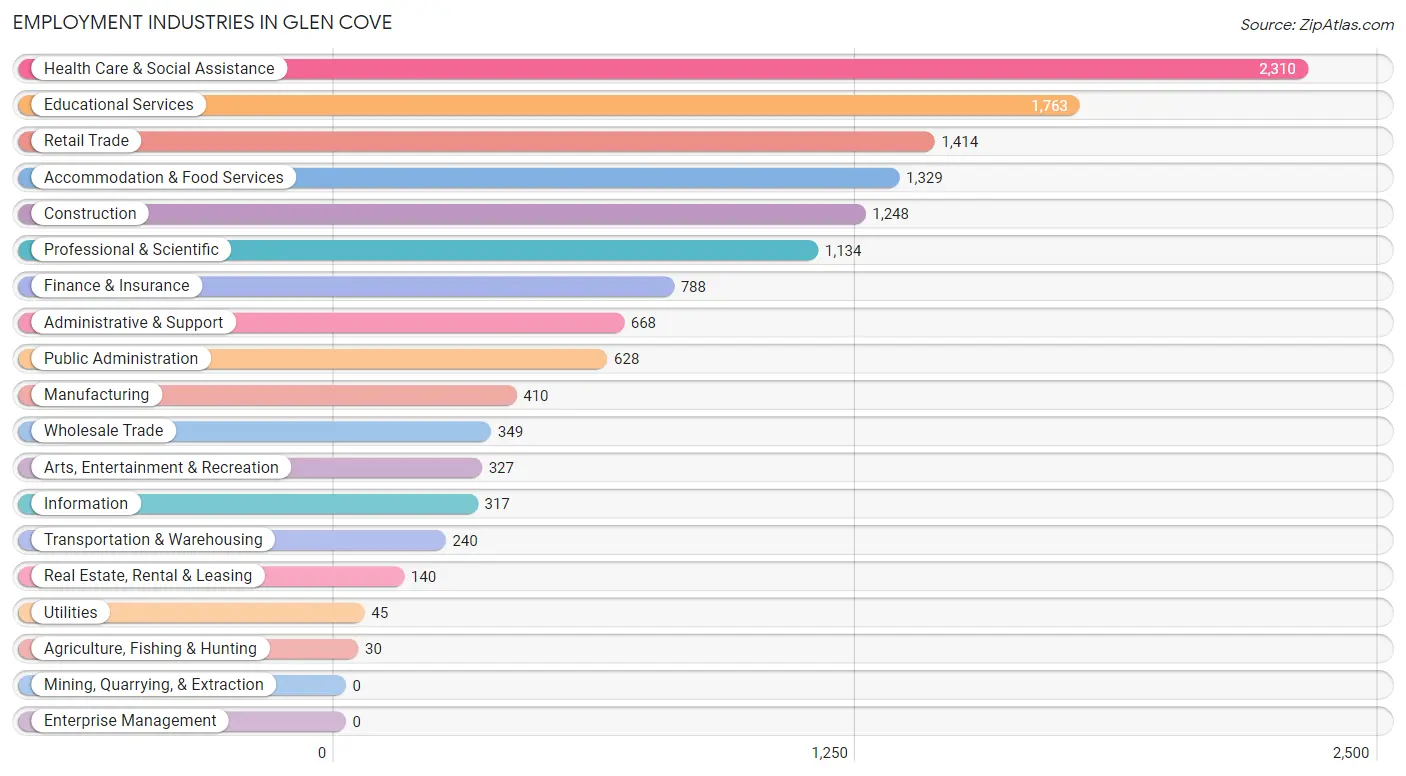
Employment Industries in Glen Cove
The major employment industries in Glen Cove include Health Care & Social Assistance (2,310 | 16.6%), Educational Services (1,763 | 12.6%), Retail Trade (1,414 | 10.1%), Accommodation & Food Services (1,329 | 9.5%), and Construction (1,248 | 8.9%).
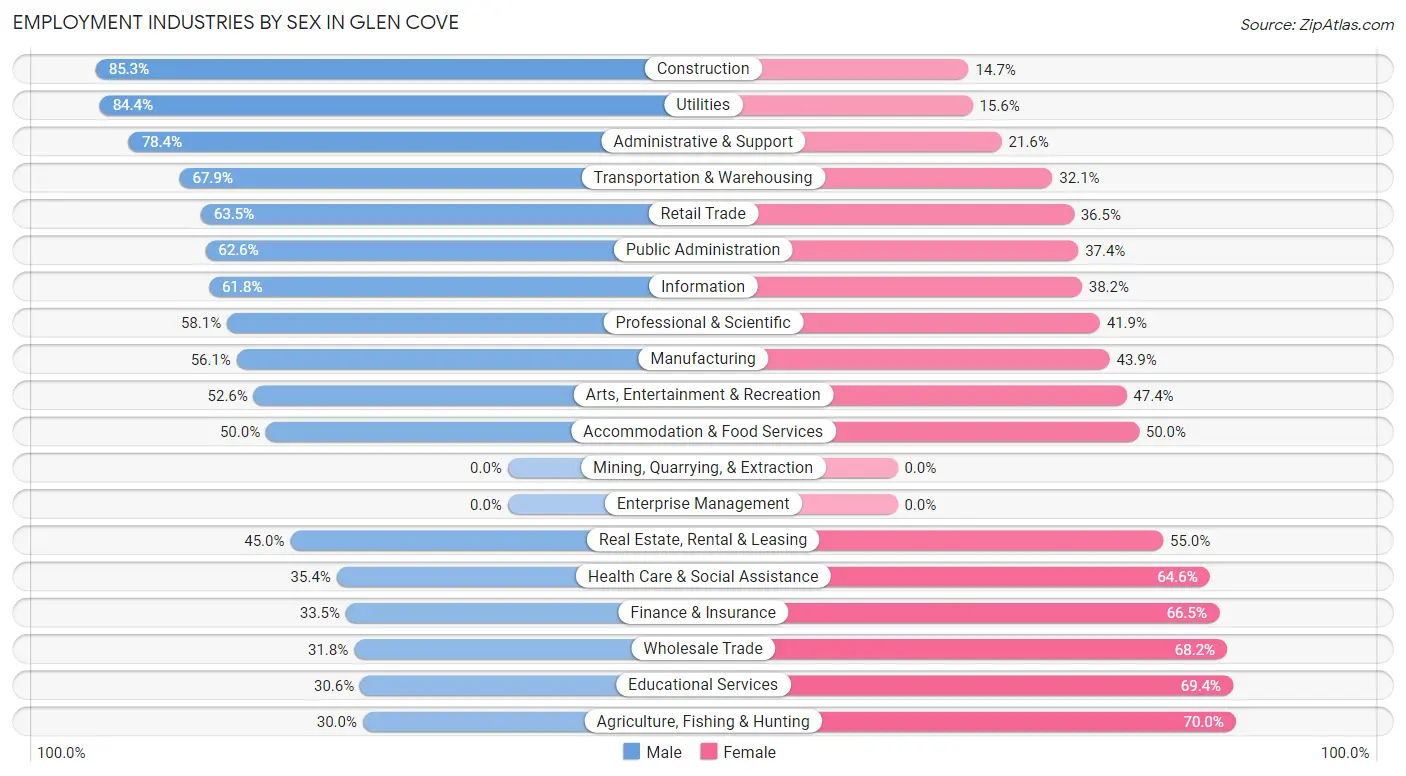
Employment Industries by Sex in Glen Cove
The Glen Cove industries that see more men than women are Construction (85.3%), Utilities (84.4%), and Administrative & Support (78.4%), whereas the industries that tend to have a higher number of women are Agriculture, Fishing & Hunting (70.0%), Educational Services (69.4%), and Wholesale Trade (68.2%).
| Industry | Male | Female |
| Agriculture, Fishing & Hunting | 9 (30.0%) | 21 (70.0%) |
| Mining, Quarrying, & Extraction | 0 (0.0%) | 0 (0.0%) |
| Construction | 1,064 (85.3%) | 184 (14.7%) |
| Manufacturing | 230 (56.1%) | 180 (43.9%) |
| Wholesale Trade | 111 (31.8%) | 238 (68.2%) |
| Retail Trade | 898 (63.5%) | 516 (36.5%) |
| Transportation & Warehousing | 163 (67.9%) | 77 (32.1%) |
| Utilities | 38 (84.4%) | 7 (15.6%) |
| Information | 196 (61.8%) | 121 (38.2%) |
| Finance & Insurance | 264 (33.5%) | 524 (66.5%) |
| Real Estate, Rental & Leasing | 63 (45.0%) | 77 (55.0%) |
| Professional & Scientific | 659 (58.1%) | 475 (41.9%) |
| Enterprise Management | 0 (0.0%) | 0 (0.0%) |
| Administrative & Support | 524 (78.4%) | 144 (21.6%) |
| Educational Services | 539 (30.6%) | 1,224 (69.4%) |
| Health Care & Social Assistance | 818 (35.4%) | 1,492 (64.6%) |
| Arts, Entertainment & Recreation | 172 (52.6%) | 155 (47.4%) |
| Accommodation & Food Services | 665 (50.0%) | 664 (50.0%) |
| Public Administration | 393 (62.6%) | 235 (37.4%) |
| Total | 7,194 (51.6%) | 6,750 (48.4%) |
Education in Glen Cove
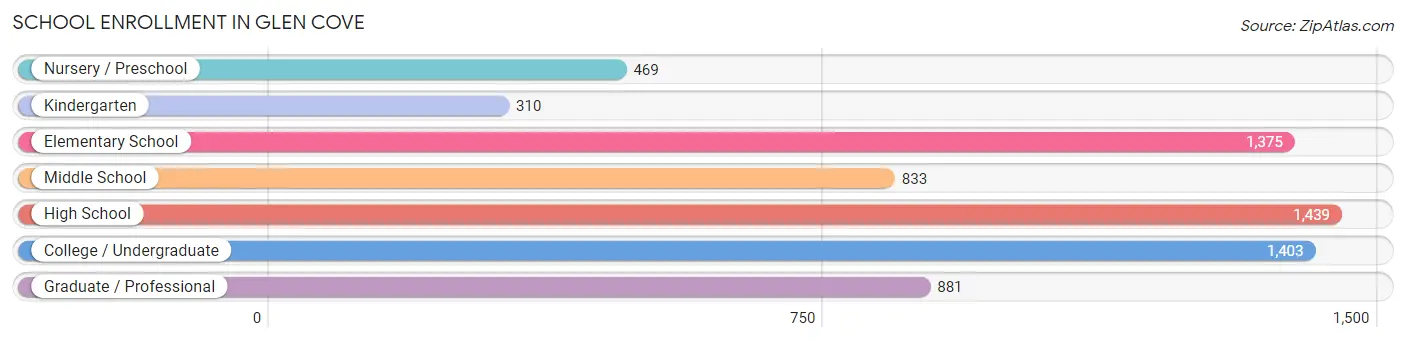
School Enrollment in Glen Cove
The most common levels of schooling among the 6,710 students in Glen Cove are high school (1,439 | 21.4%), college / undergraduate (1,403 | 20.9%), and elementary school (1,375 | 20.5%).
| School Level | # Students | % Students |
| Nursery / Preschool | 469 | 7.0% |
| Kindergarten | 310 | 4.6% |
| Elementary School | 1,375 | 20.5% |
| Middle School | 833 | 12.4% |
| High School | 1,439 | 21.4% |
| College / Undergraduate | 1,403 | 20.9% |
| Graduate / Professional | 881 | 13.1% |
| Total | 6,710 | 100.0% |
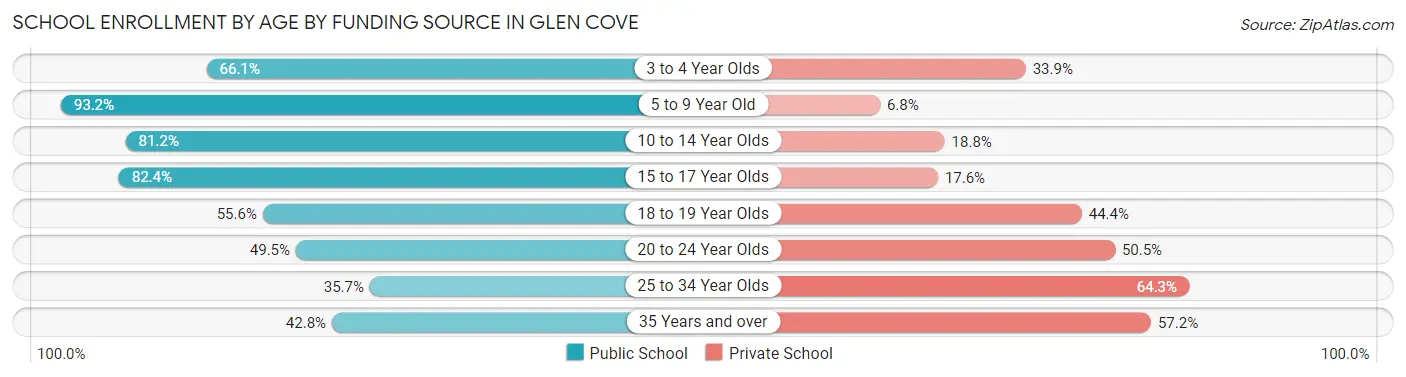
School Enrollment by Age by Funding Source in Glen Cove
Out of a total of 6,710 students who are enrolled in schools in Glen Cove, 1,919 (28.6%) attend a private institution, while the remaining 4,791 (71.4%) are enrolled in public schools. The age group of 25 to 34 year olds has the highest likelihood of being enrolled in private schools, with 63 (64.3% in the age bracket) enrolled. Conversely, the age group of 5 to 9 year old has the lowest likelihood of being enrolled in a private school, with 1,435 (93.2% in the age bracket) attending a public institution.
| Age Bracket | Public School | Private School |
| 3 to 4 Year Olds | 267 (66.1%) | 137 (33.9%) |
| 5 to 9 Year Old | 1,435 (93.2%) | 104 (6.8%) |
| 10 to 14 Year Olds | 1,105 (81.2%) | 256 (18.8%) |
| 15 to 17 Year Olds | 765 (82.4%) | 163 (17.6%) |
| 18 to 19 Year Olds | 301 (55.6%) | 240 (44.4%) |
| 20 to 24 Year Olds | 698 (49.5%) | 713 (50.5%) |
| 25 to 34 Year Olds | 35 (35.7%) | 63 (64.3%) |
| 35 Years and over | 183 (42.8%) | 245 (57.2%) |
| Total | 4,791 (71.4%) | 1,919 (28.6%) |
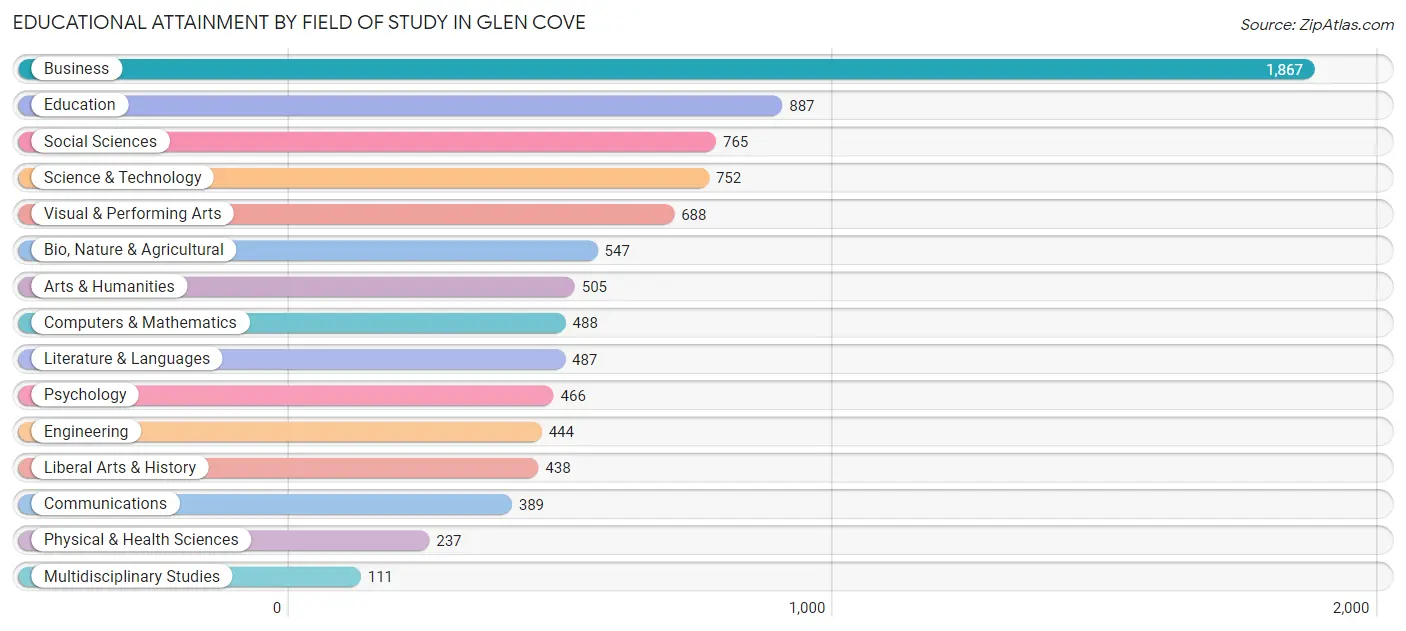
Educational Attainment by Field of Study in Glen Cove
Business (1,867 | 20.6%), education (887 | 9.8%), social sciences (765 | 8.4%), science & technology (752 | 8.3%), and visual & performing arts (688 | 7.6%) are the most common fields of study among 9,071 individuals in Glen Cove who have obtained a bachelor's degree or higher.
| Field of Study | # Graduates | % Graduates |
| Computers & Mathematics | 488 | 5.4% |
| Bio, Nature & Agricultural | 547 | 6.0% |
| Physical & Health Sciences | 237 | 2.6% |
| Psychology | 466 | 5.1% |
| Social Sciences | 765 | 8.4% |
| Engineering | 444 | 4.9% |
| Multidisciplinary Studies | 111 | 1.2% |
| Science & Technology | 752 | 8.3% |
| Business | 1,867 | 20.6% |
| Education | 887 | 9.8% |
| Literature & Languages | 487 | 5.4% |
| Liberal Arts & History | 438 | 4.8% |
| Visual & Performing Arts | 688 | 7.6% |
| Communications | 389 | 4.3% |
| Arts & Humanities | 505 | 5.6% |
| Total | 9,071 | 100.0% |
Transportation & Commute in Glen Cove
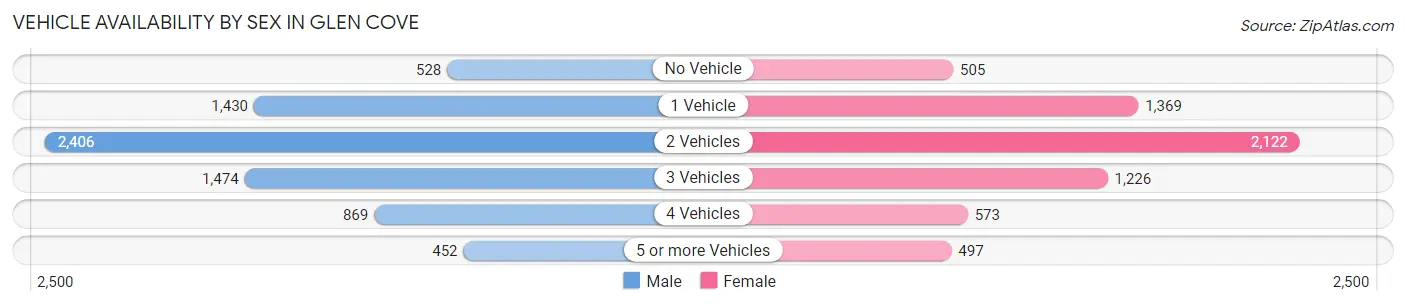
Vehicle Availability by Sex in Glen Cove
The most prevalent vehicle ownership categories in Glen Cove are males with 2 vehicles (2,406, accounting for 33.6%) and females with 2 vehicles (2,122, making up 38.2%).
| Vehicles Available | Male | Female |
| No Vehicle | 528 (7.4%) | 505 (8.0%) |
| 1 Vehicle | 1,430 (20.0%) | 1,369 (21.8%) |
| 2 Vehicles | 2,406 (33.6%) | 2,122 (33.7%) |
| 3 Vehicles | 1,474 (20.6%) | 1,226 (19.5%) |
| 4 Vehicles | 869 (12.1%) | 573 (9.1%) |
| 5 or more Vehicles | 452 (6.3%) | 497 (7.9%) |
| Total | 7,159 (100.0%) | 6,292 (100.0%) |
Commute Time in Glen Cove
The most frequently occuring commute durations in Glen Cove are 5 to 9 minutes (1,951 commuters, 15.8%), 10 to 14 minutes (1,607 commuters, 13.0%), and 20 to 24 minutes (1,437 commuters, 11.6%).
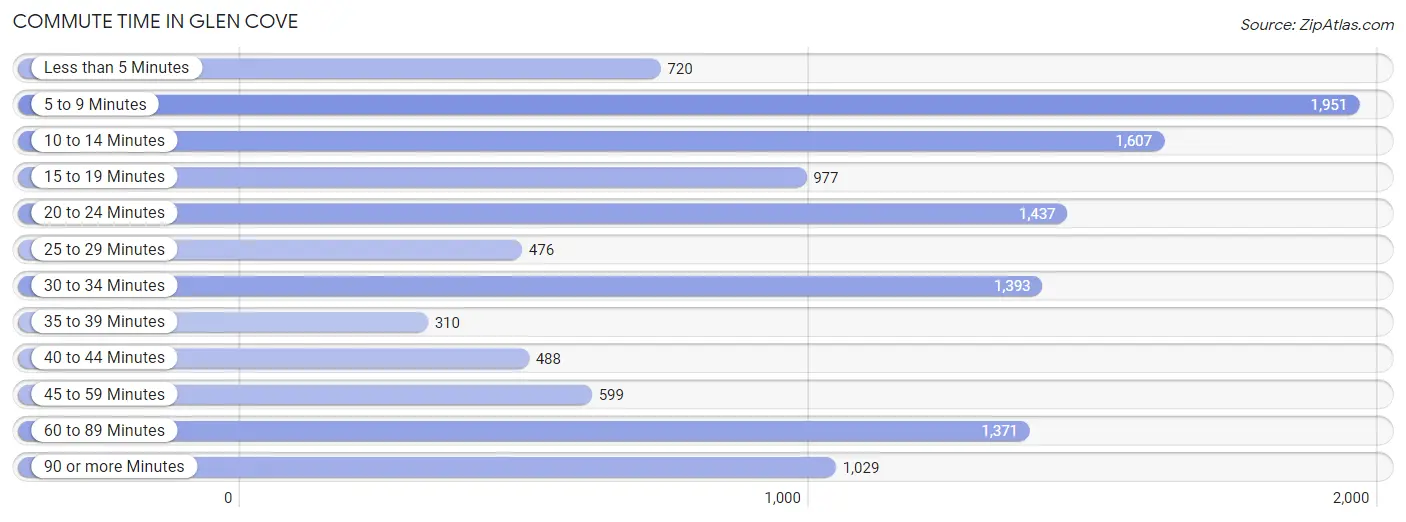
| Commute Time | # Commuters | % Commuters |
| Less than 5 Minutes | 720 | 5.8% |
| 5 to 9 Minutes | 1,951 | 15.8% |
| 10 to 14 Minutes | 1,607 | 13.0% |
| 15 to 19 Minutes | 977 | 7.9% |
| 20 to 24 Minutes | 1,437 | 11.6% |
| 25 to 29 Minutes | 476 | 3.8% |
| 30 to 34 Minutes | 1,393 | 11.3% |
| 35 to 39 Minutes | 310 | 2.5% |
| 40 to 44 Minutes | 488 | 4.0% |
| 45 to 59 Minutes | 599 | 4.9% |
| 60 to 89 Minutes | 1,371 | 11.1% |
| 90 or more Minutes | 1,029 | 8.3% |
Commute Time by Sex in Glen Cove
The most common commute times in Glen Cove are 30 to 34 minutes (885 commuters, 13.2%) for males and 5 to 9 minutes (1,184 commuters, 20.9%) for females.
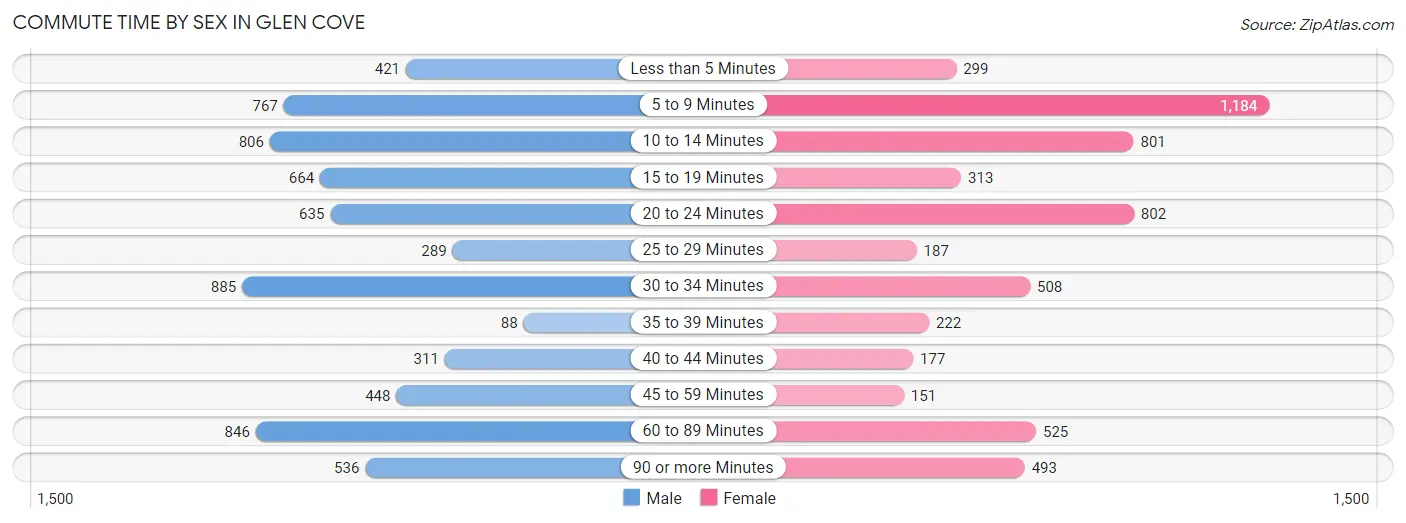
| Commute Time | Male | Female |
| Less than 5 Minutes | 421 (6.3%) | 299 (5.3%) |
| 5 to 9 Minutes | 767 (11.5%) | 1,184 (20.9%) |
| 10 to 14 Minutes | 806 (12.0%) | 801 (14.1%) |
| 15 to 19 Minutes | 664 (9.9%) | 313 (5.5%) |
| 20 to 24 Minutes | 635 (9.5%) | 802 (14.2%) |
| 25 to 29 Minutes | 289 (4.3%) | 187 (3.3%) |
| 30 to 34 Minutes | 885 (13.2%) | 508 (9.0%) |
| 35 to 39 Minutes | 88 (1.3%) | 222 (3.9%) |
| 40 to 44 Minutes | 311 (4.6%) | 177 (3.1%) |
| 45 to 59 Minutes | 448 (6.7%) | 151 (2.7%) |
| 60 to 89 Minutes | 846 (12.6%) | 525 (9.3%) |
| 90 or more Minutes | 536 (8.0%) | 493 (8.7%) |
Time of Departure to Work by Sex in Glen Cove
The most frequent times of departure to work in Glen Cove are 8:00 AM to 8:29 AM (1,020, 15.2%) for males and 7:30 AM to 7:59 AM (1,123, 19.8%) for females.
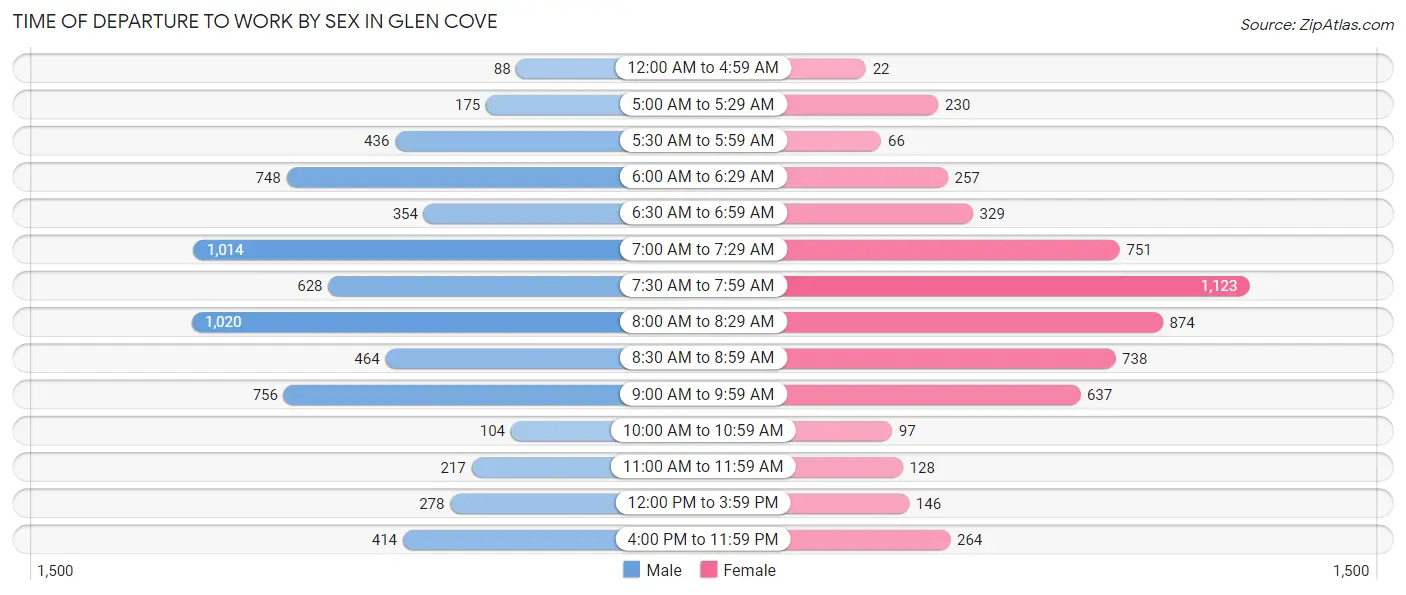
| Time of Departure | Male | Female |
| 12:00 AM to 4:59 AM | 88 (1.3%) | 22 (0.4%) |
| 5:00 AM to 5:29 AM | 175 (2.6%) | 230 (4.1%) |
| 5:30 AM to 5:59 AM | 436 (6.5%) | 66 (1.2%) |
| 6:00 AM to 6:29 AM | 748 (11.2%) | 257 (4.5%) |
| 6:30 AM to 6:59 AM | 354 (5.3%) | 329 (5.8%) |
| 7:00 AM to 7:29 AM | 1,014 (15.1%) | 751 (13.3%) |
| 7:30 AM to 7:59 AM | 628 (9.4%) | 1,123 (19.8%) |
| 8:00 AM to 8:29 AM | 1,020 (15.2%) | 874 (15.4%) |
| 8:30 AM to 8:59 AM | 464 (6.9%) | 738 (13.0%) |
| 9:00 AM to 9:59 AM | 756 (11.3%) | 637 (11.3%) |
| 10:00 AM to 10:59 AM | 104 (1.5%) | 97 (1.7%) |
| 11:00 AM to 11:59 AM | 217 (3.2%) | 128 (2.3%) |
| 12:00 PM to 3:59 PM | 278 (4.2%) | 146 (2.6%) |
| 4:00 PM to 11:59 PM | 414 (6.2%) | 264 (4.7%) |
| Total | 6,696 (100.0%) | 5,662 (100.0%) |
Housing Occupancy in Glen Cove
Occupancy by Ownership in Glen Cove
Of the total 10,691 dwellings in Glen Cove, owner-occupied units account for 6,050 (56.6%), while renter-occupied units make up 4,641 (43.4%).
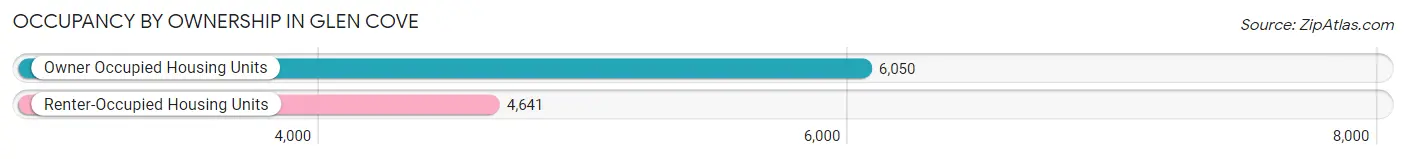
| Occupancy | # Housing Units | % Housing Units |
| Owner Occupied Housing Units | 6,050 | 56.6% |
| Renter-Occupied Housing Units | 4,641 | 43.4% |
| Total Occupied Housing Units | 10,691 | 100.0% |
Occupancy by Household Size in Glen Cove
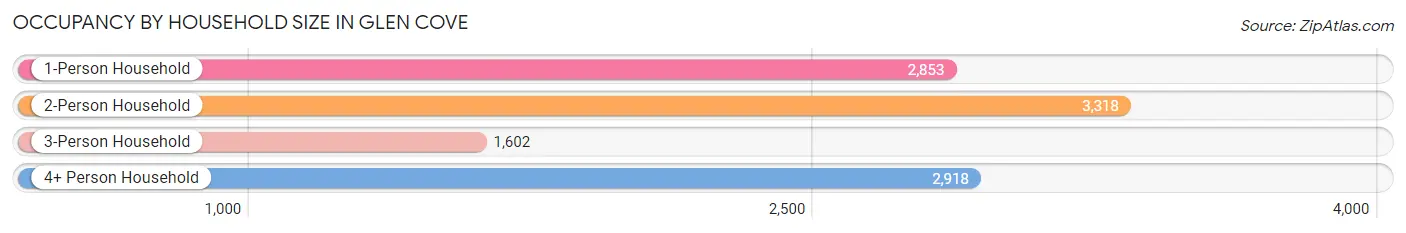
| Household Size | # Housing Units | % Housing Units |
| 1-Person Household | 2,853 | 26.7% |
| 2-Person Household | 3,318 | 31.0% |
| 3-Person Household | 1,602 | 15.0% |
| 4+ Person Household | 2,918 | 27.3% |
| Total Housing Units | 10,691 | 100.0% |
Occupancy by Ownership by Household Size in Glen Cove
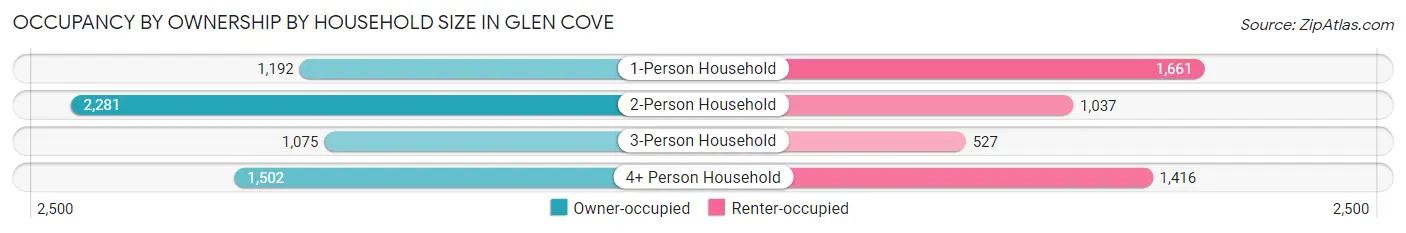
| Household Size | Owner-occupied | Renter-occupied |
| 1-Person Household | 1,192 (41.8%) | 1,661 (58.2%) |
| 2-Person Household | 2,281 (68.8%) | 1,037 (31.2%) |
| 3-Person Household | 1,075 (67.1%) | 527 (32.9%) |
| 4+ Person Household | 1,502 (51.5%) | 1,416 (48.5%) |
| Total Housing Units | 6,050 (56.6%) | 4,641 (43.4%) |
Occupancy by Educational Attainment in Glen Cove
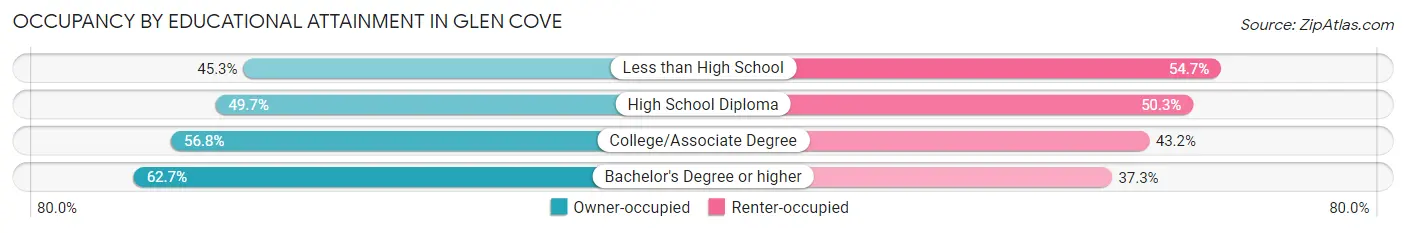
| Household Size | Owner-occupied | Renter-occupied |
| Less than High School | 535 (45.3%) | 646 (54.7%) |
| High School Diploma | 1,155 (49.7%) | 1,168 (50.3%) |
| College/Associate Degree | 1,386 (56.8%) | 1,056 (43.2%) |
| Bachelor's Degree or higher | 2,974 (62.7%) | 1,771 (37.3%) |
Occupancy by Age of Householder in Glen Cove
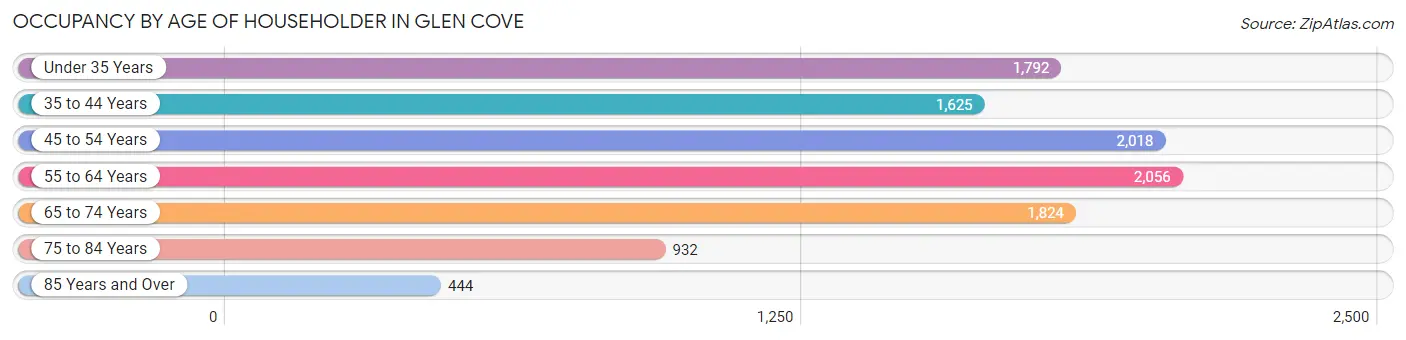
| Age Bracket | # Households | % Households |
| Under 35 Years | 1,792 | 16.8% |
| 35 to 44 Years | 1,625 | 15.2% |
| 45 to 54 Years | 2,018 | 18.9% |
| 55 to 64 Years | 2,056 | 19.2% |
| 65 to 74 Years | 1,824 | 17.1% |
| 75 to 84 Years | 932 | 8.7% |
| 85 Years and Over | 444 | 4.2% |
| Total | 10,691 | 100.0% |
Housing Finances in Glen Cove
Median Income by Occupancy in Glen Cove
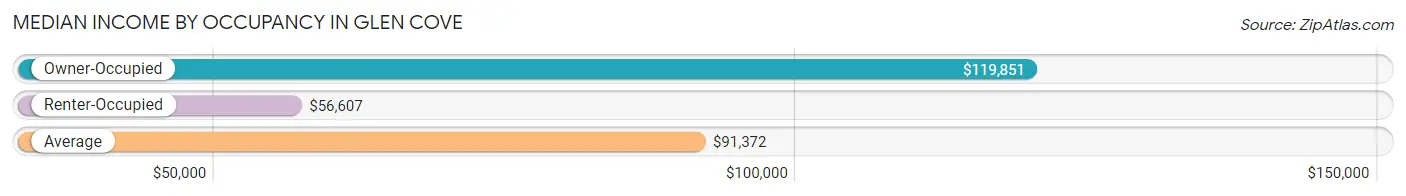
| Occupancy Type | # Households | Median Income |
| Owner-Occupied | 6,050 (56.6%) | $119,851 |
| Renter-Occupied | 4,641 (43.4%) | $56,607 |
| Average | 10,691 (100.0%) | $91,372 |
Occupancy by Householder Income Bracket in Glen Cove
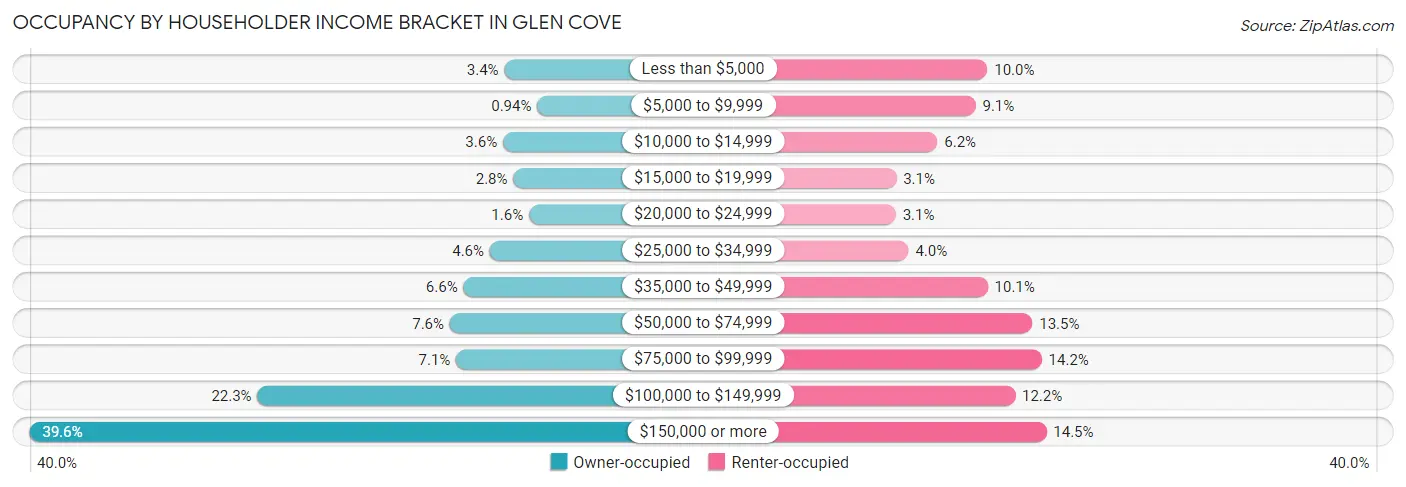
| Income Bracket | Owner-occupied | Renter-occupied |
| Less than $5,000 | 208 (3.4%) | 466 (10.0%) |
| $5,000 to $9,999 | 57 (0.9%) | 424 (9.1%) |
| $10,000 to $14,999 | 215 (3.5%) | 289 (6.2%) |
| $15,000 to $19,999 | 167 (2.8%) | 144 (3.1%) |
| $20,000 to $24,999 | 95 (1.6%) | 142 (3.1%) |
| $25,000 to $34,999 | 275 (4.5%) | 187 (4.0%) |
| $35,000 to $49,999 | 397 (6.6%) | 467 (10.1%) |
| $50,000 to $74,999 | 460 (7.6%) | 625 (13.5%) |
| $75,000 to $99,999 | 431 (7.1%) | 658 (14.2%) |
| $100,000 to $149,999 | 1,347 (22.3%) | 564 (12.1%) |
| $150,000 or more | 2,398 (39.6%) | 675 (14.5%) |
| Total | 6,050 (100.0%) | 4,641 (100.0%) |
Monthly Housing Cost Tiers in Glen Cove
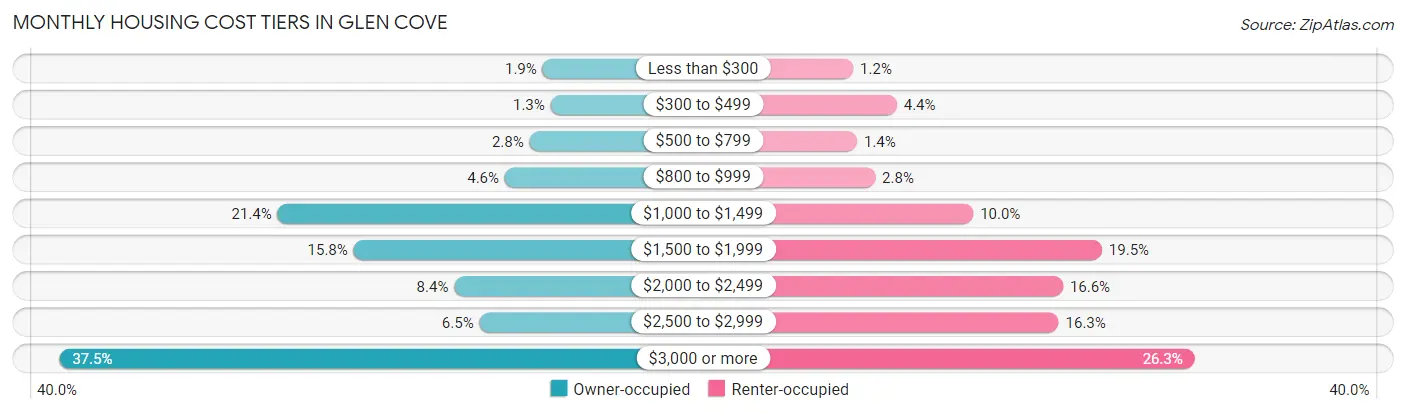
| Monthly Cost | Owner-occupied | Renter-occupied |
| Less than $300 | 112 (1.8%) | 54 (1.2%) |
| $300 to $499 | 76 (1.3%) | 203 (4.4%) |
| $500 to $799 | 170 (2.8%) | 67 (1.4%) |
| $800 to $999 | 280 (4.6%) | 129 (2.8%) |
| $1,000 to $1,499 | 1,293 (21.4%) | 464 (10.0%) |
| $1,500 to $1,999 | 954 (15.8%) | 904 (19.5%) |
| $2,000 to $2,499 | 506 (8.4%) | 771 (16.6%) |
| $2,500 to $2,999 | 393 (6.5%) | 756 (16.3%) |
| $3,000 or more | 2,266 (37.4%) | 1,221 (26.3%) |
| Total | 6,050 (100.0%) | 4,641 (100.0%) |
Physical Housing Characteristics in Glen Cove
Housing Structures in Glen Cove
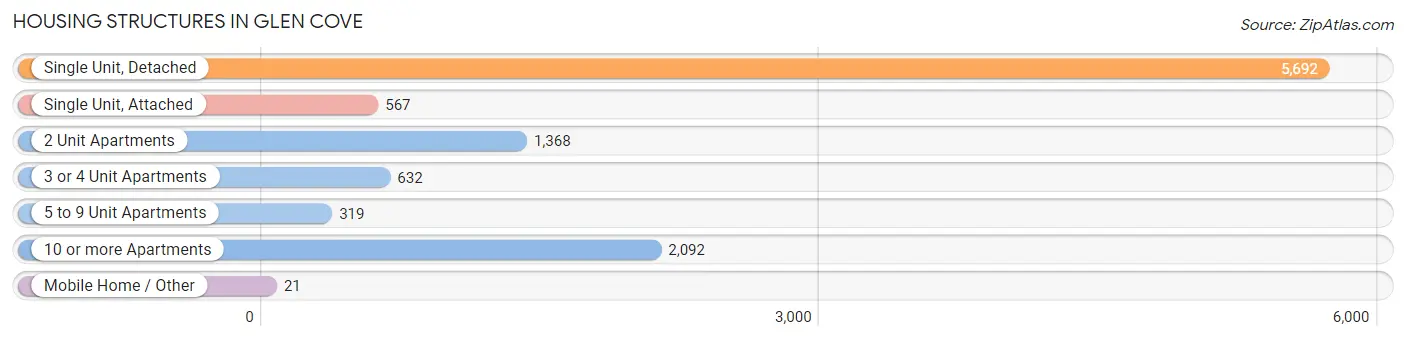
| Structure Type | # Housing Units | % Housing Units |
| Single Unit, Detached | 5,692 | 53.2% |
| Single Unit, Attached | 567 | 5.3% |
| 2 Unit Apartments | 1,368 | 12.8% |
| 3 or 4 Unit Apartments | 632 | 5.9% |
| 5 to 9 Unit Apartments | 319 | 3.0% |
| 10 or more Apartments | 2,092 | 19.6% |
| Mobile Home / Other | 21 | 0.2% |
| Total | 10,691 | 100.0% |
Housing Structures by Occupancy in Glen Cove
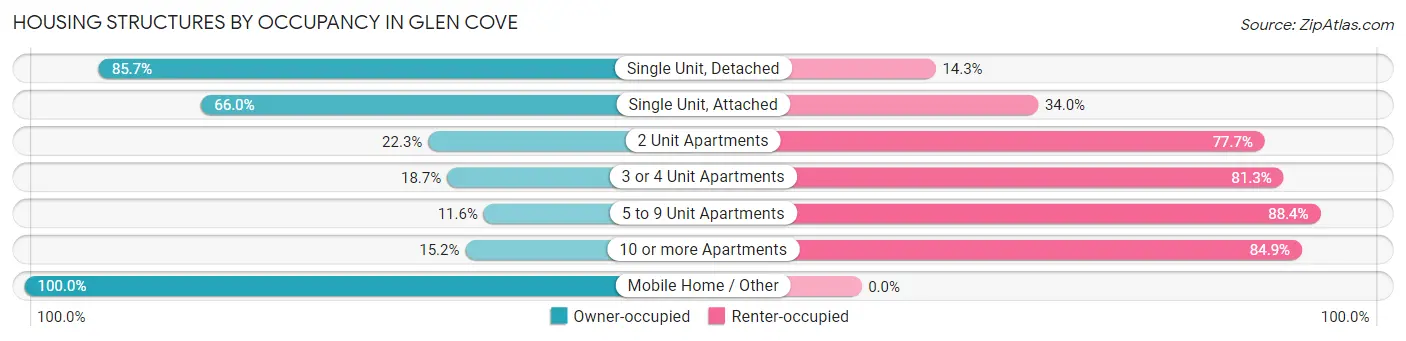
| Structure Type | Owner-occupied | Renter-occupied |
| Single Unit, Detached | 4,878 (85.7%) | 814 (14.3%) |
| Single Unit, Attached | 374 (66.0%) | 193 (34.0%) |
| 2 Unit Apartments | 305 (22.3%) | 1,063 (77.7%) |
| 3 or 4 Unit Apartments | 118 (18.7%) | 514 (81.3%) |
| 5 to 9 Unit Apartments | 37 (11.6%) | 282 (88.4%) |
| 10 or more Apartments | 317 (15.1%) | 1,775 (84.9%) |
| Mobile Home / Other | 21 (100.0%) | 0 (0.0%) |
| Total | 6,050 (56.6%) | 4,641 (43.4%) |
Housing Structures by Number of Rooms in Glen Cove
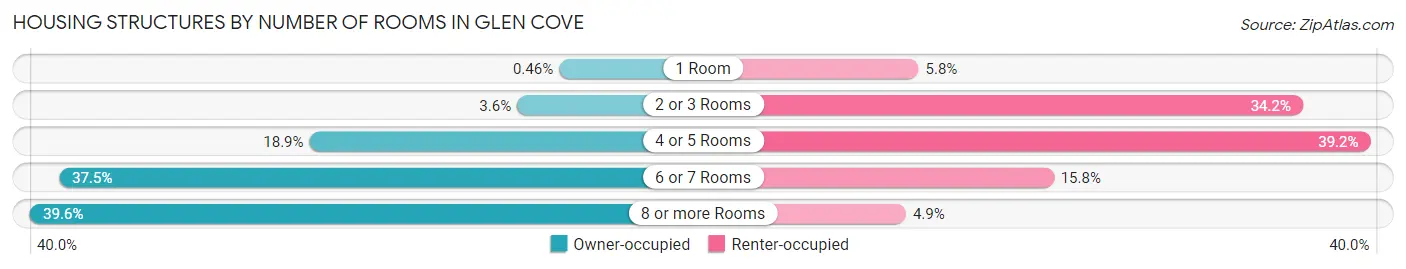
| Number of Rooms | Owner-occupied | Renter-occupied |
| 1 Room | 28 (0.5%) | 270 (5.8%) |
| 2 or 3 Rooms | 216 (3.6%) | 1,589 (34.2%) |
| 4 or 5 Rooms | 1,145 (18.9%) | 1,821 (39.2%) |
| 6 or 7 Rooms | 2,266 (37.4%) | 734 (15.8%) |
| 8 or more Rooms | 2,395 (39.6%) | 227 (4.9%) |
| Total | 6,050 (100.0%) | 4,641 (100.0%) |
Housing Structure by Heating Type in Glen Cove
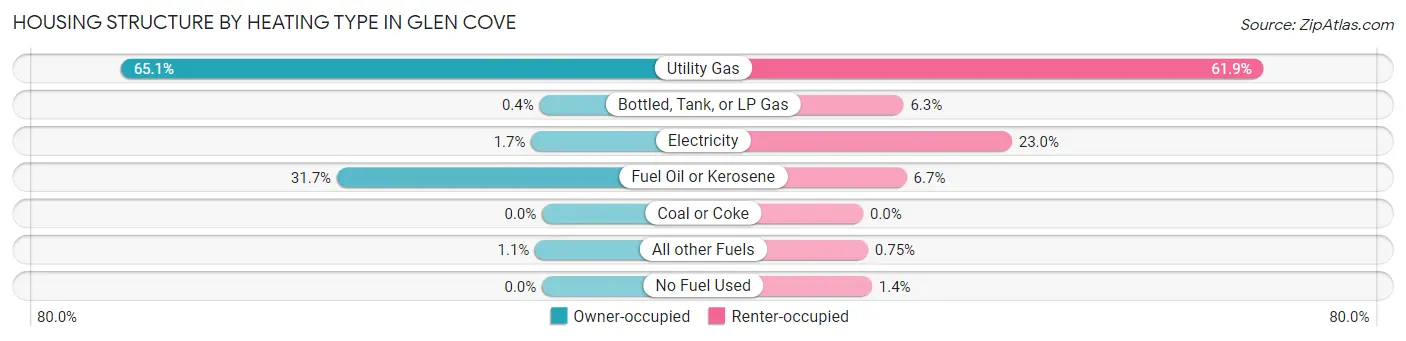
| Heating Type | Owner-occupied | Renter-occupied |
| Utility Gas | 3,941 (65.1%) | 2,873 (61.9%) |
| Bottled, Tank, or LP Gas | 24 (0.4%) | 290 (6.2%) |
| Electricity | 101 (1.7%) | 1,067 (23.0%) |
| Fuel Oil or Kerosene | 1,919 (31.7%) | 313 (6.7%) |
| Coal or Coke | 0 (0.0%) | 0 (0.0%) |
| All other Fuels | 65 (1.1%) | 35 (0.7%) |
| No Fuel Used | 0 (0.0%) | 63 (1.4%) |
| Total | 6,050 (100.0%) | 4,641 (100.0%) |
Household Vehicle Usage in Glen Cove
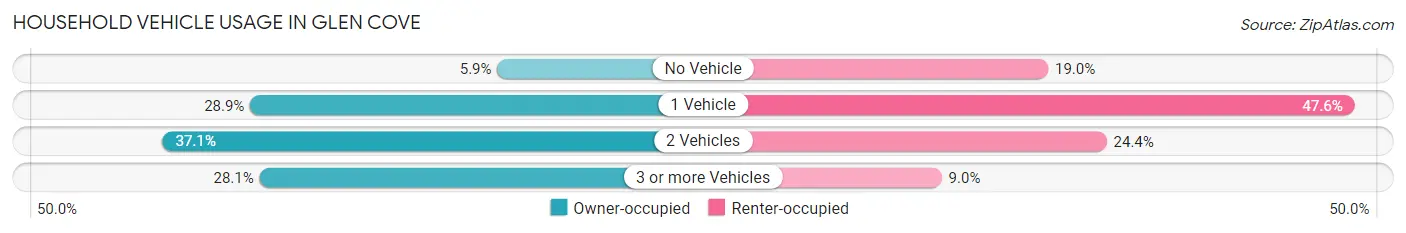
| Vehicles per Household | Owner-occupied | Renter-occupied |
| No Vehicle | 355 (5.9%) | 880 (19.0%) |
| 1 Vehicle | 1,751 (28.9%) | 2,208 (47.6%) |
| 2 Vehicles | 2,246 (37.1%) | 1,134 (24.4%) |
| 3 or more Vehicles | 1,698 (28.1%) | 419 (9.0%) |
| Total | 6,050 (100.0%) | 4,641 (100.0%) |
Real Estate & Mortgages in Glen Cove
Real Estate and Mortgage Overview in Glen Cove
| Characteristic | Without Mortgage | With Mortgage |
| Housing Units | 2,780 | 3,270 |
| Median Property Value | $580,300 | $677,900 |
| Median Household Income | $80,667 | $1,620 |
| Monthly Housing Costs | $1,368 | $2,185 |
| Real Estate Taxes | $10,001 | $114 |
Property Value by Mortgage Status in Glen Cove
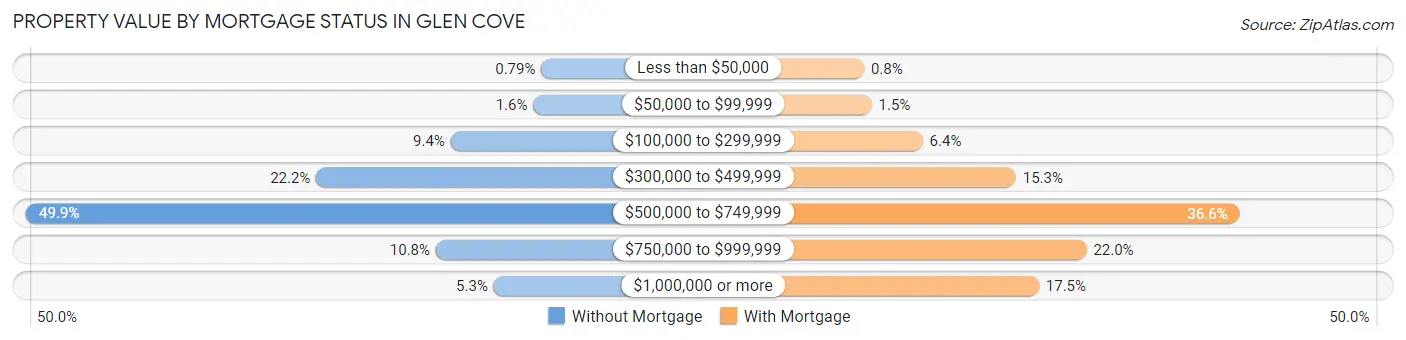
| Property Value | Without Mortgage | With Mortgage |
| Less than $50,000 | 22 (0.8%) | 26 (0.8%) |
| $50,000 to $99,999 | 43 (1.5%) | 50 (1.5%) |
| $100,000 to $299,999 | 262 (9.4%) | 209 (6.4%) |
| $300,000 to $499,999 | 618 (22.2%) | 499 (15.3%) |
| $500,000 to $749,999 | 1,386 (49.9%) | 1,196 (36.6%) |
| $750,000 to $999,999 | 301 (10.8%) | 719 (22.0%) |
| $1,000,000 or more | 148 (5.3%) | 571 (17.5%) |
| Total | 2,780 (100.0%) | 3,270 (100.0%) |
Household Income by Mortgage Status in Glen Cove
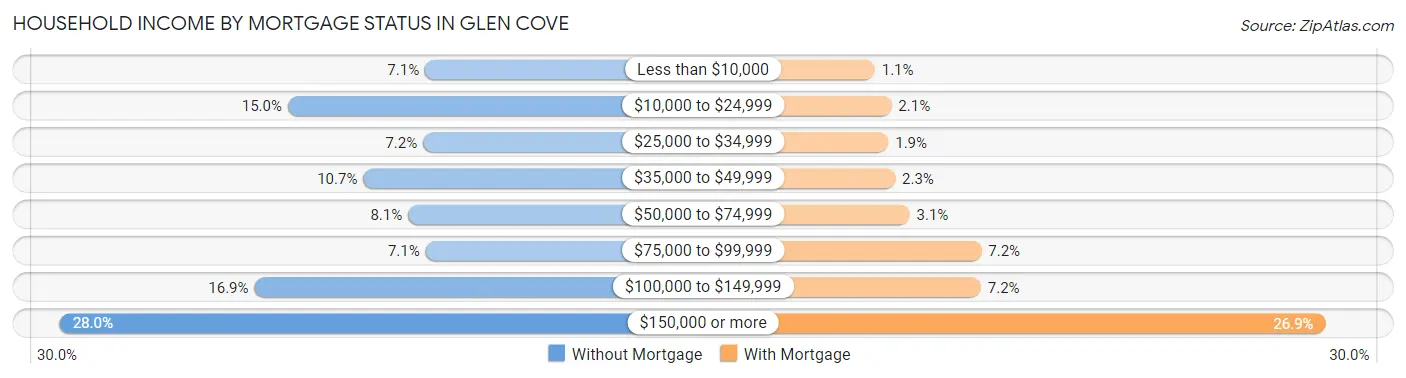
| Household Income | Without Mortgage | With Mortgage |
| Less than $10,000 | 198 (7.1%) | 36 (1.1%) |
| $10,000 to $24,999 | 416 (15.0%) | 67 (2.1%) |
| $25,000 to $34,999 | 201 (7.2%) | 61 (1.9%) |
| $35,000 to $49,999 | 296 (10.6%) | 74 (2.3%) |
| $50,000 to $74,999 | 225 (8.1%) | 101 (3.1%) |
| $75,000 to $99,999 | 197 (7.1%) | 235 (7.2%) |
| $100,000 to $149,999 | 469 (16.9%) | 234 (7.2%) |
| $150,000 or more | 778 (28.0%) | 878 (26.9%) |
| Total | 2,780 (100.0%) | 3,270 (100.0%) |
Property Value to Household Income Ratio in Glen Cove
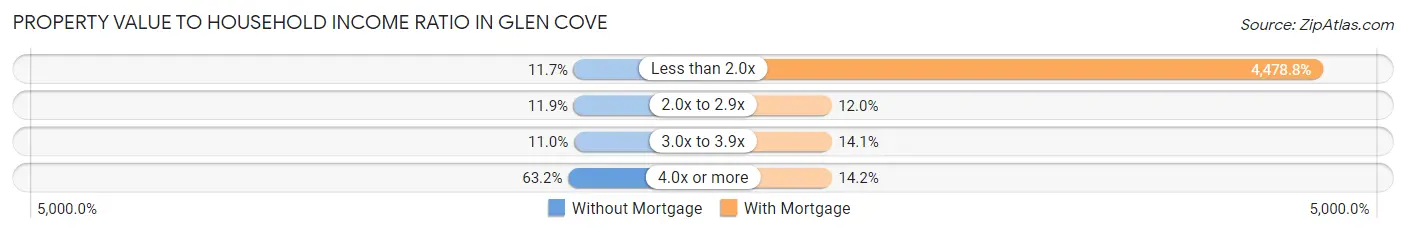
| Value-to-Income Ratio | Without Mortgage | With Mortgage |
| Less than 2.0x | 324 (11.7%) | 146,458 (4,478.8%) |
| 2.0x to 2.9x | 330 (11.9%) | 391 (12.0%) |
| 3.0x to 3.9x | 305 (11.0%) | 461 (14.1%) |
| 4.0x or more | 1,756 (63.2%) | 463 (14.2%) |
| Total | 2,780 (100.0%) | 3,270 (100.0%) |
Real Estate Taxes by Mortgage Status in Glen Cove
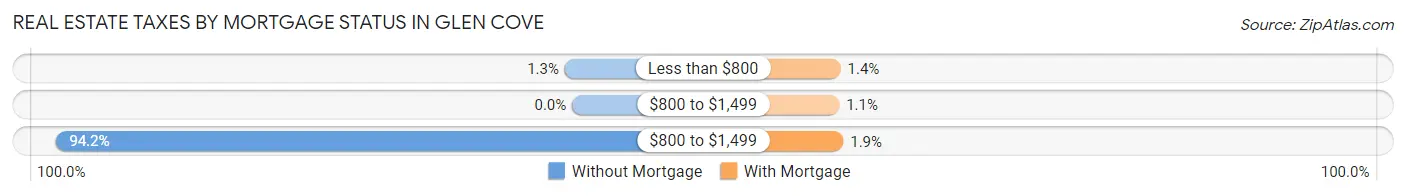
| Property Taxes | Without Mortgage | With Mortgage |
| Less than $800 | 37 (1.3%) | 45 (1.4%) |
| $800 to $1,499 | 0 (0.0%) | 37 (1.1%) |
| $800 to $1,499 | 2,619 (94.2%) | 61 (1.9%) |
| Total | 2,780 (100.0%) | 3,270 (100.0%) |
Health & Disability in Glen Cove
Health Insurance Coverage by Age in Glen Cove
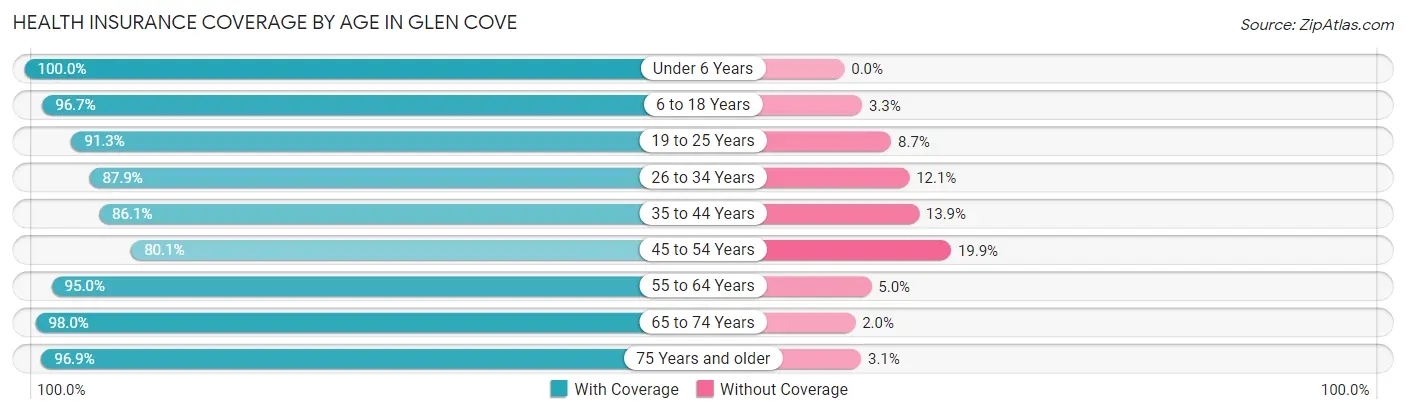
| Age Bracket | With Coverage | Without Coverage |
| Under 6 Years | 1,502 (100.0%) | 0 (0.0%) |
| 6 to 18 Years | 3,870 (96.7%) | 132 (3.3%) |
| 19 to 25 Years | 2,477 (91.3%) | 237 (8.7%) |
| 26 to 34 Years | 2,789 (87.9%) | 384 (12.1%) |
| 35 to 44 Years | 2,768 (86.1%) | 447 (13.9%) |
| 45 to 54 Years | 3,070 (80.1%) | 762 (19.9%) |
| 55 to 64 Years | 3,577 (95.0%) | 190 (5.0%) |
| 65 to 74 Years | 3,045 (98.0%) | 63 (2.0%) |
| 75 Years and older | 2,301 (96.9%) | 74 (3.1%) |
| Total | 25,399 (91.7%) | 2,289 (8.3%) |
Health Insurance Coverage by Citizenship Status in Glen Cove
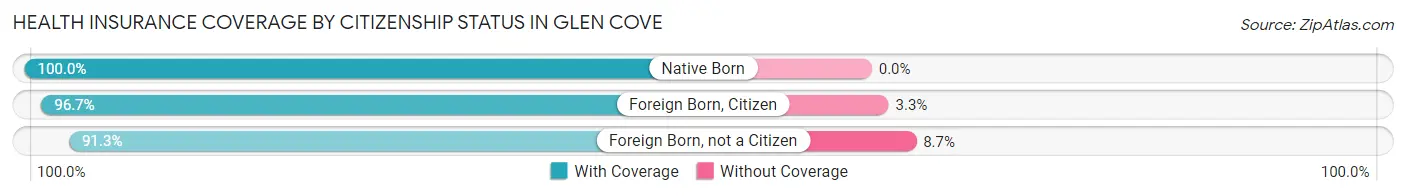
| Citizenship Status | With Coverage | Without Coverage |
| Native Born | 1,502 (100.0%) | 0 (0.0%) |
| Foreign Born, Citizen | 3,870 (96.7%) | 132 (3.3%) |
| Foreign Born, not a Citizen | 2,477 (91.3%) | 237 (8.7%) |
Health Insurance Coverage by Household Income in Glen Cove
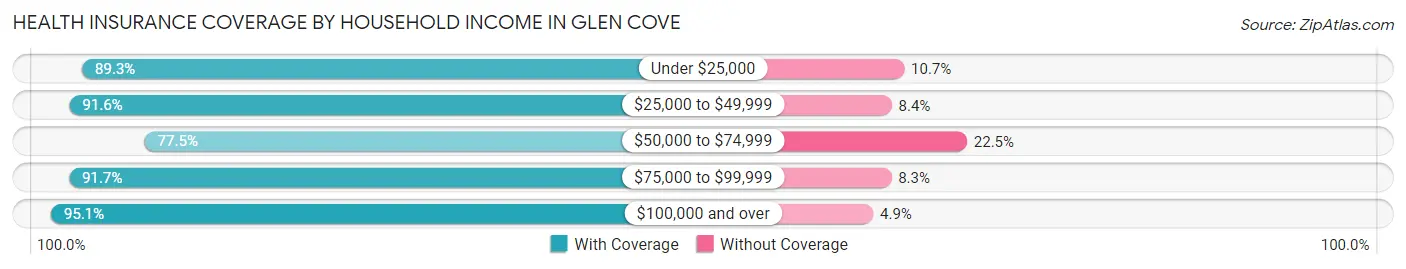
| Household Income | With Coverage | Without Coverage |
| Under $25,000 | 3,607 (89.3%) | 434 (10.7%) |
| $25,000 to $49,999 | 2,421 (91.6%) | 222 (8.4%) |
| $50,000 to $74,999 | 2,025 (77.5%) | 588 (22.5%) |
| $75,000 to $99,999 | 2,710 (91.7%) | 246 (8.3%) |
| $100,000 and over | 14,429 (95.1%) | 749 (4.9%) |
Public vs Private Health Insurance Coverage by Age in Glen Cove
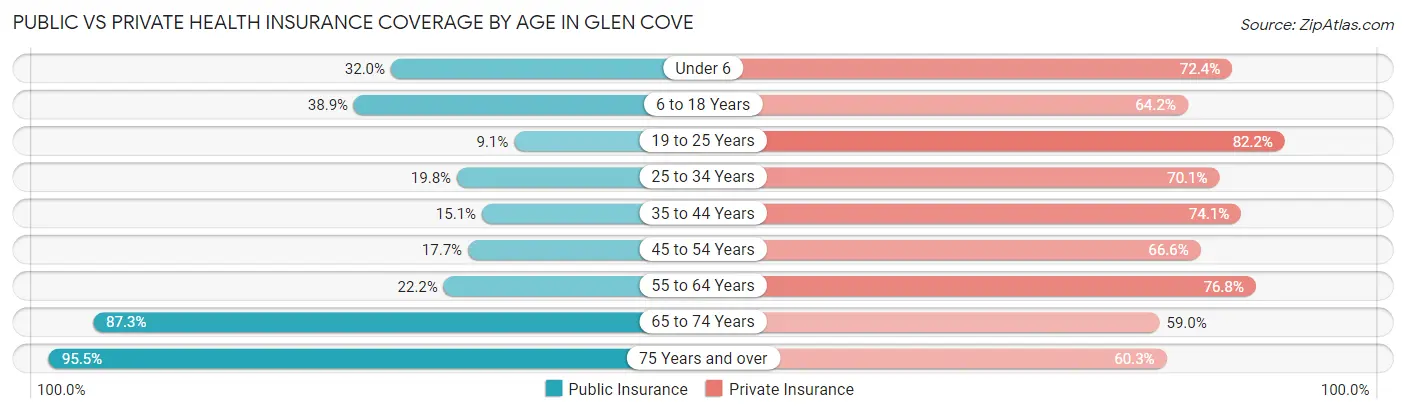
| Age Bracket | Public Insurance | Private Insurance |
| Under 6 | 481 (32.0%) | 1,088 (72.4%) |
| 6 to 18 Years | 1,556 (38.9%) | 2,569 (64.2%) |
| 19 to 25 Years | 248 (9.1%) | 2,231 (82.2%) |
| 25 to 34 Years | 627 (19.8%) | 2,223 (70.1%) |
| 35 to 44 Years | 486 (15.1%) | 2,383 (74.1%) |
| 45 to 54 Years | 679 (17.7%) | 2,552 (66.6%) |
| 55 to 64 Years | 837 (22.2%) | 2,894 (76.8%) |
| 65 to 74 Years | 2,713 (87.3%) | 1,833 (59.0%) |
| 75 Years and over | 2,268 (95.5%) | 1,431 (60.3%) |
| Total | 9,895 (35.7%) | 19,204 (69.4%) |
Disability Status by Sex by Age in Glen Cove
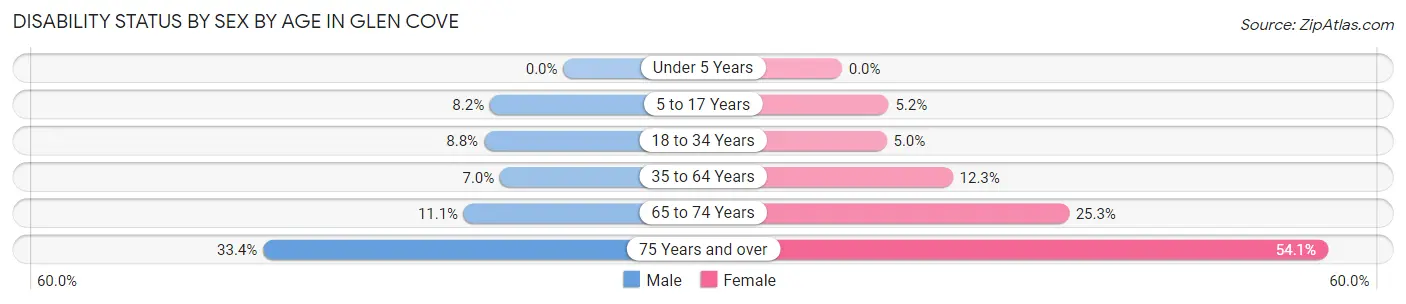
| Age Bracket | Male | Female |
| Under 5 Years | 0 (0.0%) | 0 (0.0%) |
| 5 to 17 Years | 162 (8.2%) | 98 (5.2%) |
| 18 to 34 Years | 289 (8.8%) | 148 (5.0%) |
| 35 to 64 Years | 350 (7.0%) | 721 (12.3%) |
| 65 to 74 Years | 168 (11.1%) | 402 (25.3%) |
| 75 Years and over | 300 (33.4%) | 800 (54.1%) |
Disability Class by Sex by Age in Glen Cove
Disability Class: Hearing Difficulty
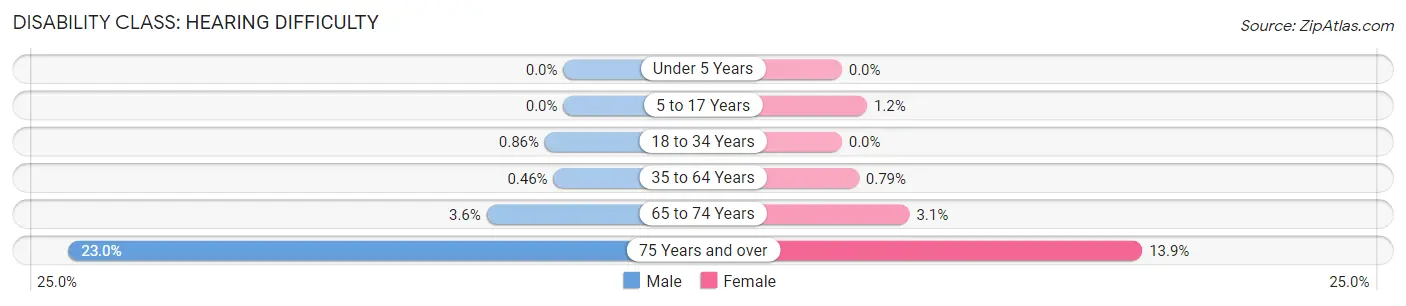
| Age Bracket | Male | Female |
| Under 5 Years | 0 (0.0%) | 0 (0.0%) |
| 5 to 17 Years | 0 (0.0%) | 22 (1.2%) |
| 18 to 34 Years | 28 (0.9%) | 0 (0.0%) |
| 35 to 64 Years | 23 (0.5%) | 46 (0.8%) |
| 65 to 74 Years | 54 (3.6%) | 50 (3.1%) |
| 75 Years and over | 206 (23.0%) | 206 (13.9%) |
Disability Class: Vision Difficulty
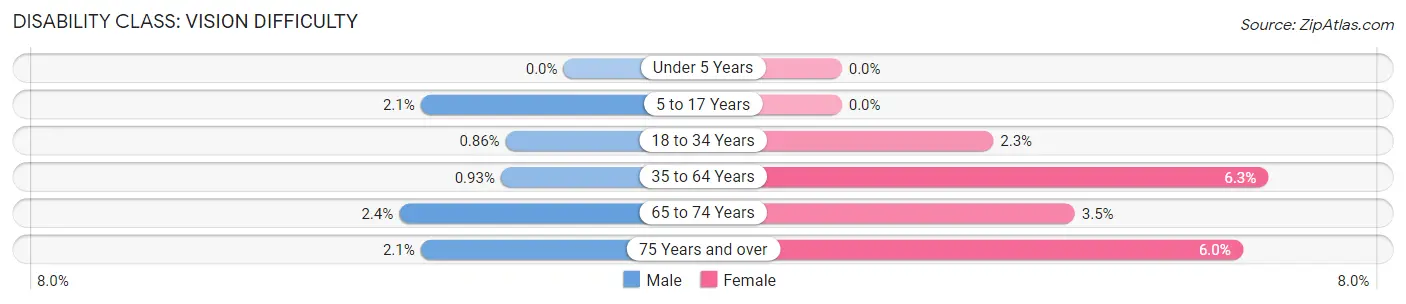
| Age Bracket | Male | Female |
| Under 5 Years | 0 (0.0%) | 0 (0.0%) |
| 5 to 17 Years | 42 (2.1%) | 0 (0.0%) |
| 18 to 34 Years | 28 (0.9%) | 67 (2.2%) |
| 35 to 64 Years | 46 (0.9%) | 370 (6.3%) |
| 65 to 74 Years | 37 (2.4%) | 55 (3.5%) |
| 75 Years and over | 19 (2.1%) | 88 (5.9%) |
Disability Class: Cognitive Difficulty
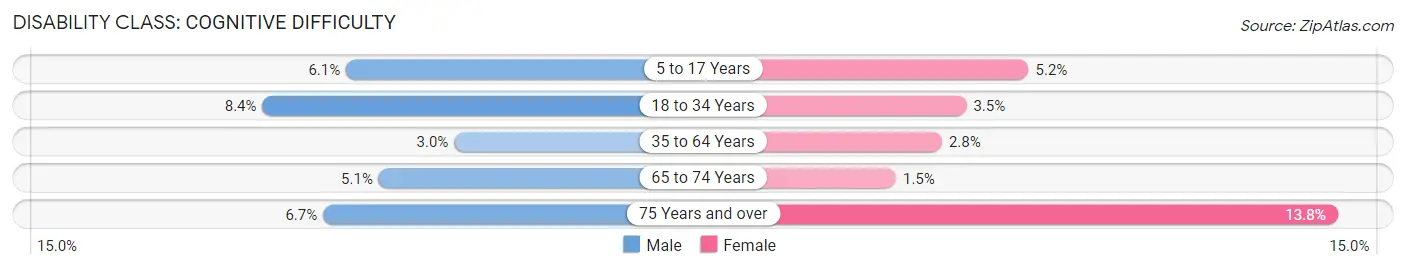
| Age Bracket | Male | Female |
| 5 to 17 Years | 120 (6.0%) | 98 (5.2%) |
| 18 to 34 Years | 274 (8.4%) | 103 (3.5%) |
| 35 to 64 Years | 151 (3.0%) | 163 (2.8%) |
| 65 to 74 Years | 78 (5.1%) | 24 (1.5%) |
| 75 Years and over | 60 (6.7%) | 204 (13.8%) |
Disability Class: Ambulatory Difficulty
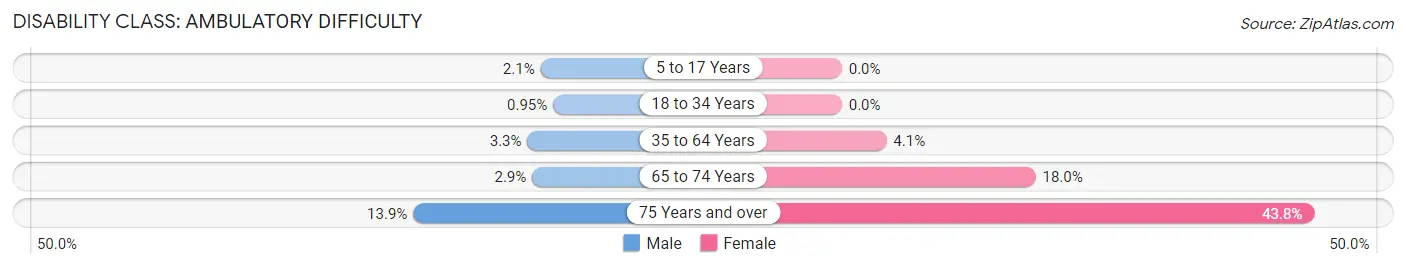
| Age Bracket | Male | Female |
| 5 to 17 Years | 42 (2.1%) | 0 (0.0%) |
| 18 to 34 Years | 31 (0.9%) | 0 (0.0%) |
| 35 to 64 Years | 166 (3.3%) | 242 (4.1%) |
| 65 to 74 Years | 44 (2.9%) | 286 (18.0%) |
| 75 Years and over | 125 (13.9%) | 648 (43.8%) |
Disability Class: Self-Care Difficulty
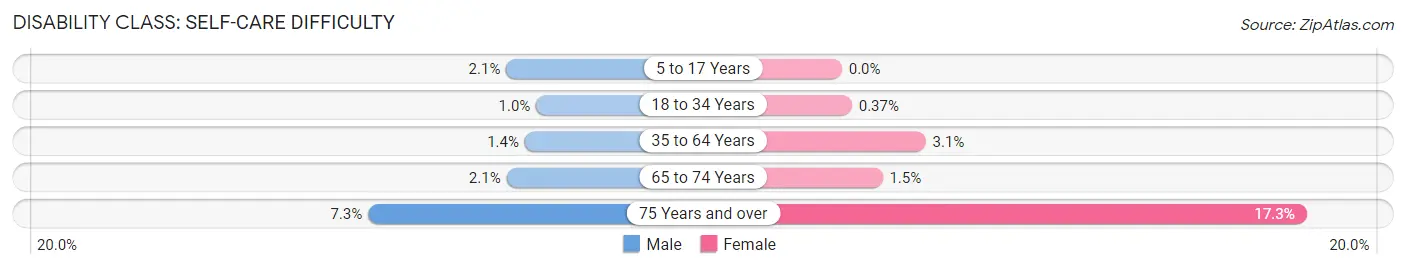
| Age Bracket | Male | Female |
| 5 to 17 Years | 42 (2.1%) | 0 (0.0%) |
| 18 to 34 Years | 33 (1.0%) | 11 (0.4%) |
| 35 to 64 Years | 71 (1.4%) | 182 (3.1%) |
| 65 to 74 Years | 32 (2.1%) | 24 (1.5%) |
| 75 Years and over | 65 (7.2%) | 255 (17.2%) |
Technology Access in Glen Cove
Computing Device Access in Glen Cove
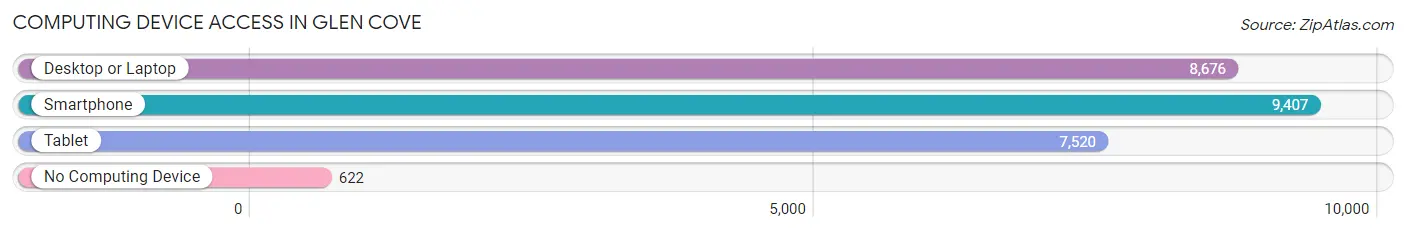
| Device Type | # Households | % Households |
| Desktop or Laptop | 8,676 | 81.1% |
| Smartphone | 9,407 | 88.0% |
| Tablet | 7,520 | 70.3% |
| No Computing Device | 622 | 5.8% |
| Total | 10,691 | 100.0% |
Internet Access in Glen Cove
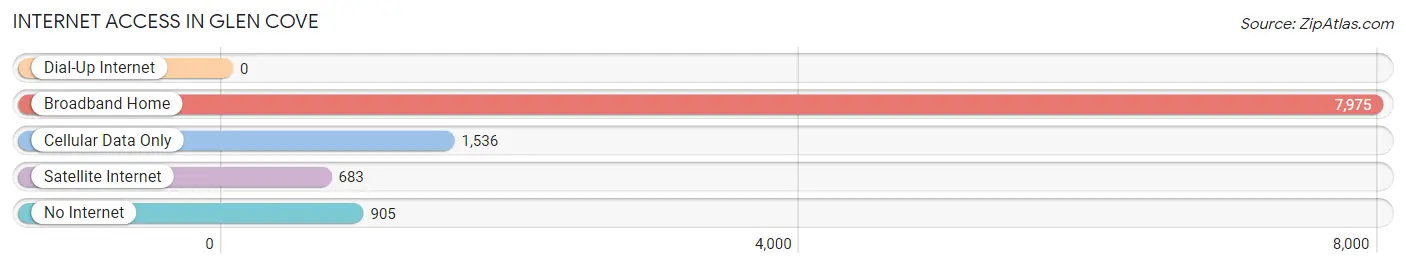
| Internet Type | # Households | % Households |
| Dial-Up Internet | 0 | 0.0% |
| Broadband Home | 7,975 | 74.6% |
| Cellular Data Only | 1,536 | 14.4% |
| Satellite Internet | 683 | 6.4% |
| No Internet | 905 | 8.5% |
| Total | 10,691 | 100.0% |
Glen Cove Summary
Glen Cove is a city located in Nassau County, New York, United States, on the North Shore of Long Island. As of the 2010 United States Census, the city population was 26,964.
History
The area now known as Glen Cove was originally inhabited by the Matinecock Native American tribe. The first European settlers arrived in the area in the 1650s, and the area was officially settled in 1668. The area was originally known as Musketa Cove, and was renamed Glen Cove in 1834.
The city was incorporated in 1918, and was originally a resort town. It was a popular destination for wealthy New Yorkers, who built large summer homes in the area. The city was also home to several large estates, including the Hempstead House, which was built in 1843.
Geography
Glen Cove is located at 40°51'17" North, 73°37'12" West (40.854722, -73.620000). According to the United States Census Bureau, the city has a total area of 8.2 square miles (21.2 km2), of which, 7.7 square miles (19.9 km2) of it is land and 0.5 square miles (1.3 km2) of it (6.17%) is water.
The city is located on the North Shore of Long Island, and is bordered by the towns of Oyster Bay and Huntington. It is also bordered by the Long Island Sound to the north, and Hempstead Harbor to the south.
Economy
Glen Cove is a major economic center in Nassau County. The city is home to several large corporations, including Northwell Health, a healthcare provider, and the North Shore-LIJ Health System. The city is also home to several financial institutions, including the Bank of New York Mellon, and the Glen Cove Savings Bank.
The city is also home to several large retail stores, including Target, Walmart, and Best Buy. The city is also home to several restaurants, including the popular Italian restaurant, La Famiglia.
Demographics
As of the 2010 United States Census, there were 26,964 people, 9,945 households, and 6,845 families residing in the city. The population density was 3,521.3 people per square mile (1,362.2/km2). There were 10,541 housing units at an average density of 1,364.2 per square mile (526.3/km2). The racial makeup of the city was 68.2% White, 16.3% African American, 0.3% Native American, 8.2% Asian, 0.1% Pacific Islander, 4.2% from other races, and 2.8% from two or more races. Hispanic or Latino of any race were 12.7% of the population.
There were 9,945 households, out of which 33.2% had children under the age of 18 living with them, 51.2% were married couples living together, 13.3% had a female householder with no husband present, and 30.7% were non-families. 24.7% of all households were made up of individuals, and 10.2% had someone living alone who was 65 years of age or older. The average household size was 2.70 and the average family size was 3.24.
In the city, the population was spread out, with 24.2% under the age of 18, 7.2% from 18 to 24, 30.2% from 25 to 44, 23.7% from 45 to 64, and 14.7% who were 65 years of age or older. The median age was 38 years. For every 100 females, there were 93.2 males. For every 100 females age 18 and over, there were 89.7 males.
The median income for a household in the city was $68,837, and the median income for a family was $81,837. Males had a median income of $51,945 versus $41,837 for females. The per capita income for the city was $31,945. About 4.2% of families and 6.2% of the population were below the poverty line, including 8.2% of those under age 18 and 5.2% of those age 65 or over.
Common Questions
What is Per Capita Income in Glen Cove?
Per Capita income in Glen Cove is $47,676.
What is the Median Family Income in Glen Cove?
Median Family Income in Glen Cove is $110,598.
What is the Median Household income in Glen Cove?
Median Household Income in Glen Cove is $91,372.
What is Income or Wage Gap in Glen Cove?
Income or Wage Gap in Glen Cove is 24.0%.
Women in Glen Cove earn 76.0 cents for every dollar earned by a man.
What is Family Income Deficit in Glen Cove?
Family Income Deficit in Glen Cove is $13,892.
Families that are below poverty line in Glen Cove earn $13,892 less on average than the poverty threshold level.
What is Inequality or Gini Index in Glen Cove?
Inequality or Gini Index in Glen Cove is 0.50.
What is the Total Population of Glen Cove?
Total Population of Glen Cove is 28,132.
What is the Total Male Population of Glen Cove?
Total Male Population of Glen Cove is 13,418.
What is the Total Female Population of Glen Cove?
Total Female Population of Glen Cove is 14,714.
What is the Ratio of Males per 100 Females in Glen Cove?
There are 91.19 Males per 100 Females in Glen Cove.
What is the Ratio of Females per 100 Males in Glen Cove?
There are 109.66 Females per 100 Males in Glen Cove.
What is the Median Population Age in Glen Cove?
Median Population Age in Glen Cove is 43.4 Years.
What is the Average Family Size in Glen Cove
Average Family Size in Glen Cove is 3.1 People.
What is the Average Household Size in Glen Cove
Average Household Size in Glen Cove is 2.6 People.
How Large is the Labor Force in Glen Cove?
There are 14,455 People in the Labor Forcein in Glen Cove.
What is the Percentage of People in the Labor Force in Glen Cove?
61.0% of People are in the Labor Force in Glen Cove.
What is the Unemployment Rate in Glen Cove?
Unemployment Rate in Glen Cove is 3.6%.