East Flat Rock, NC Map & Demographics
East Flat Rock Map
East Flat Rock Overview
$26,292
PER CAPITA INCOME
$62,529
AVG FAMILY INCOME
$54,605
AVG HOUSEHOLD INCOME
11.6%
WAGE / INCOME GAP [ % ]
88.4¢/ $1
WAGE / INCOME GAP [ $ ]
0.43
INEQUALITY / GINI INDEX
5,934
TOTAL POPULATION
2,488
MALE POPULATION
3,446
FEMALE POPULATION
72.20
MALES / 100 FEMALES
138.50
FEMALES / 100 MALES
35.2
MEDIAN AGE
3.2
AVG FAMILY SIZE
2.8
AVG HOUSEHOLD SIZE
3,268
LABOR FORCE [ PEOPLE ]
70.0%
PERCENT IN LABOR FORCE
4.2%
UNEMPLOYMENT RATE
East Flat Rock Zip Codes
East Flat Rock Area Codes
Income in East Flat Rock
Income Overview in East Flat Rock
Per Capita Income in East Flat Rock is $26,292, while median incomes of families and households are $62,529 and $54,605 respectively.
| Characteristic | Number | Measure |
| Per Capita Income | 5,934 | $26,292 |
| Median Family Income | 1,544 | $62,529 |
| Mean Family Income | 1,544 | $79,716 |
| Median Household Income | 2,060 | $54,605 |
| Mean Household Income | 2,060 | $69,652 |
| Income Deficit | 1,544 | $0 |
| Wage / Income Gap (%) | 5,934 | 11.65% |
| Wage / Income Gap ($) | 5,934 | 88.35¢ per $1 |
| Gini / Inequality Index | 5,934 | 0.43 |
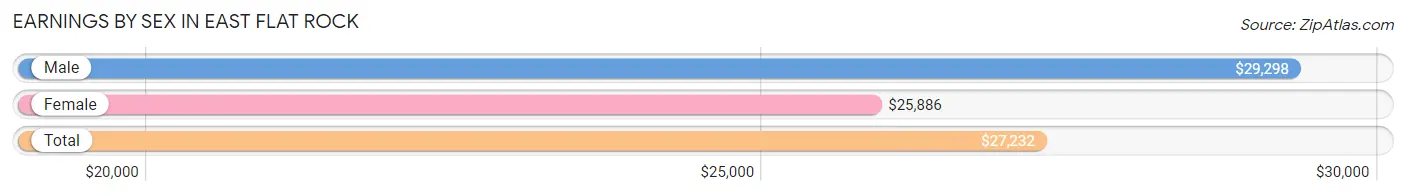
Earnings by Sex in East Flat Rock
Average Earnings in East Flat Rock are $27,232, $29,298 for men and $25,886 for women, a difference of 11.7%.
| Sex | Number | Average Earnings |
| Male | 1,528 (47.4%) | $29,298 |
| Female | 1,697 (52.6%) | $25,886 |
| Total | 3,225 (100.0%) | $27,232 |
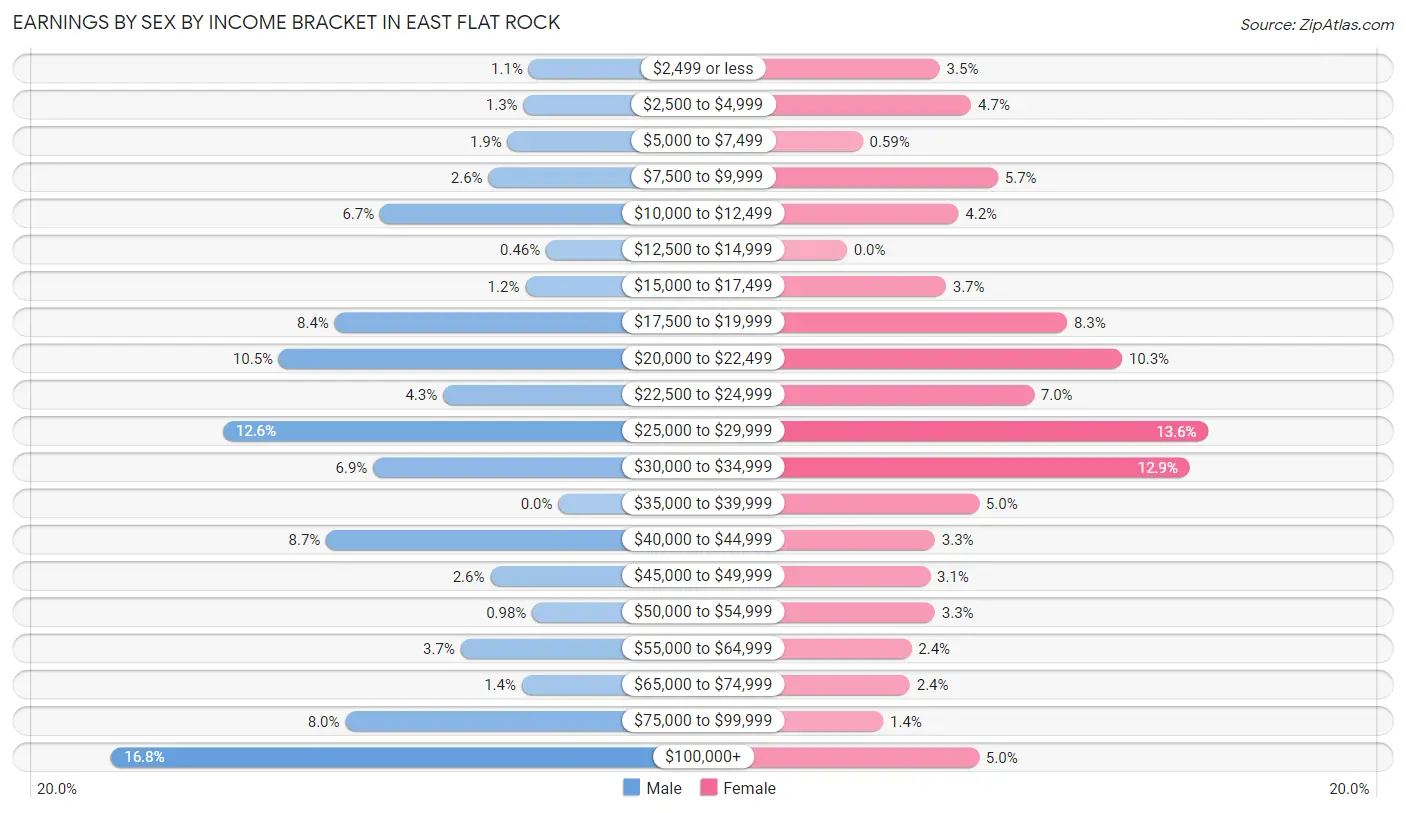
Earnings by Sex by Income Bracket in East Flat Rock
The most common earnings brackets in East Flat Rock are $100,000+ for men (256 | 16.8%) and $25,000 to $29,999 for women (230 | 13.6%).
| Income | Male | Female |
| $2,499 or less | 17 (1.1%) | 59 (3.5%) |
| $2,500 to $4,999 | 20 (1.3%) | 79 (4.7%) |
| $5,000 to $7,499 | 29 (1.9%) | 10 (0.6%) |
| $7,500 to $9,999 | 40 (2.6%) | 96 (5.7%) |
| $10,000 to $12,499 | 102 (6.7%) | 71 (4.2%) |
| $12,500 to $14,999 | 7 (0.5%) | 0 (0.0%) |
| $15,000 to $17,499 | 19 (1.2%) | 63 (3.7%) |
| $17,500 to $19,999 | 128 (8.4%) | 140 (8.3%) |
| $20,000 to $22,499 | 160 (10.5%) | 175 (10.3%) |
| $22,500 to $24,999 | 66 (4.3%) | 119 (7.0%) |
| $25,000 to $29,999 | 192 (12.6%) | 230 (13.6%) |
| $30,000 to $34,999 | 106 (6.9%) | 218 (12.9%) |
| $35,000 to $39,999 | 0 (0.0%) | 84 (5.0%) |
| $40,000 to $44,999 | 133 (8.7%) | 56 (3.3%) |
| $45,000 to $49,999 | 39 (2.5%) | 53 (3.1%) |
| $50,000 to $54,999 | 15 (1.0%) | 56 (3.3%) |
| $55,000 to $64,999 | 56 (3.7%) | 41 (2.4%) |
| $65,000 to $74,999 | 21 (1.4%) | 40 (2.4%) |
| $75,000 to $99,999 | 122 (8.0%) | 23 (1.4%) |
| $100,000+ | 256 (16.8%) | 84 (5.0%) |
| Total | 1,528 (100.0%) | 1,697 (100.0%) |
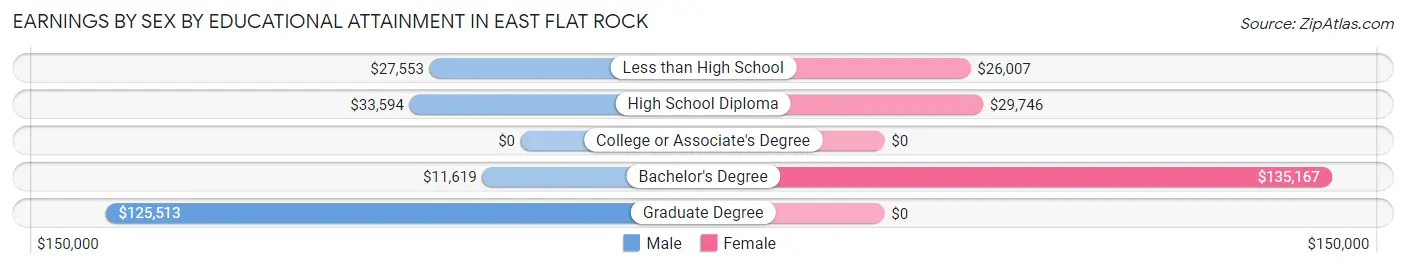
Earnings by Sex by Educational Attainment in East Flat Rock
Average earnings in East Flat Rock are $41,132 for men and $29,242 for women, a difference of 28.9%. Men with an educational attainment of graduate degree enjoy the highest average annual earnings of $125,513, while those with bachelor's degree education earn the least with $11,619. Women with an educational attainment of bachelor's degree earn the most with the average annual earnings of $135,167, while those with less than high school education have the smallest earnings of $26,007.
| Educational Attainment | Male Income | Female Income |
| Less than High School | $27,553 | $26,007 |
| High School Diploma | $33,594 | $29,746 |
| College or Associate's Degree | - | - |
| Bachelor's Degree | $11,619 | $135,167 |
| Graduate Degree | $125,513 | $0 |
| Total | $41,132 | $29,242 |
Family Income in East Flat Rock
Family Income Brackets in East Flat Rock
According to the East Flat Rock family income data, there are 547 families falling into the $50,000 to $74,999 income range, which is the most common income bracket and makes up 35.4% of all families. Conversely, the less than $10,000 income bracket is the least frequent group with only 46 families (3.0%) belonging to this category.
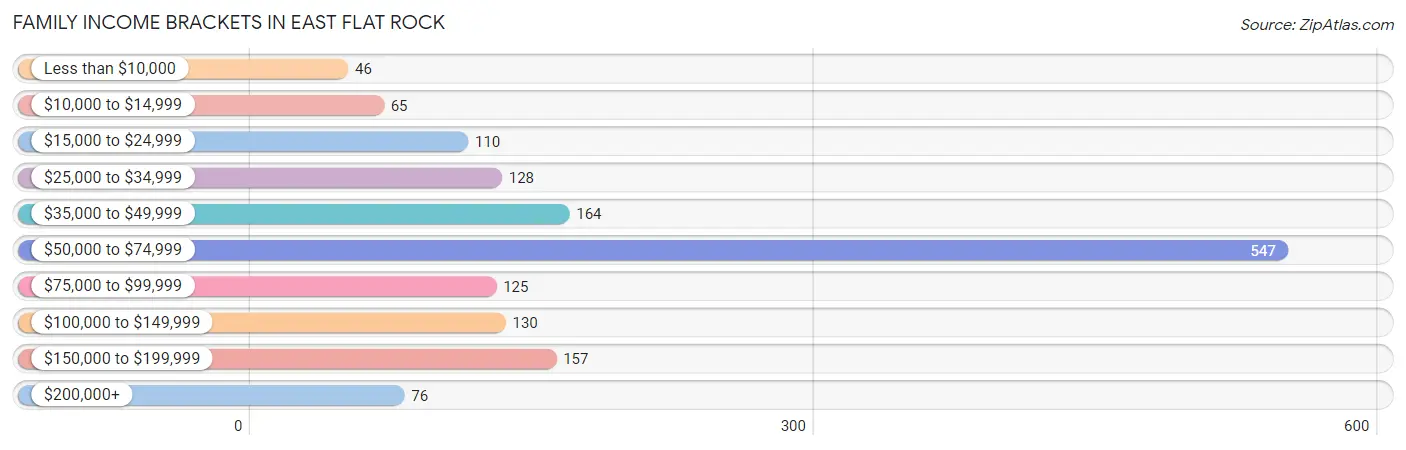
| Income Bracket | # Families | % Families |
| Less than $10,000 | 46 | 3.0% |
| $10,000 to $14,999 | 65 | 4.2% |
| $15,000 to $24,999 | 110 | 7.1% |
| $25,000 to $34,999 | 128 | 8.3% |
| $35,000 to $49,999 | 164 | 10.6% |
| $50,000 to $74,999 | 547 | 35.4% |
| $75,000 to $99,999 | 125 | 8.1% |
| $100,000 to $149,999 | 130 | 8.4% |
| $150,000 to $199,999 | 157 | 10.2% |
| $200,000+ | 76 | 4.9% |
Family Income by Famaliy Size in East Flat Rock
4-person families (243 | 15.7%) account for the highest median family income in East Flat Rock with $64,411 per family, while 2-person families (592 | 38.3%) have the highest median income of $28,958 per family member.
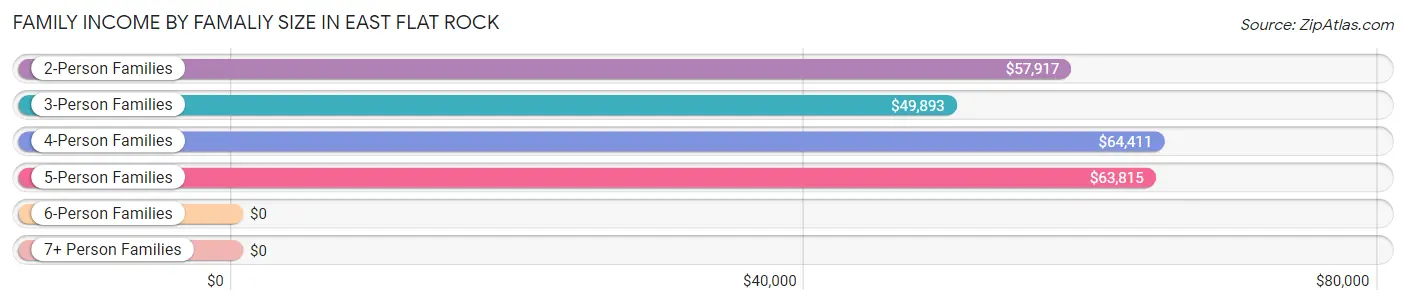
| Income Bracket | # Families | Median Income |
| 2-Person Families | 592 (38.3%) | $57,917 |
| 3-Person Families | 555 (35.9%) | $49,893 |
| 4-Person Families | 243 (15.7%) | $64,411 |
| 5-Person Families | 117 (7.6%) | $63,815 |
| 6-Person Families | 0 (0.0%) | $0 |
| 7+ Person Families | 37 (2.4%) | $0 |
| Total | 1,544 (100.0%) | $62,529 |
Family Income by Number of Earners in East Flat Rock
The median family income in East Flat Rock is $62,529, with families comprising 3+ earners (143) having the highest median family income of $117,125, while families with no earners (198) have the lowest median family income of $23,571, accounting for 9.3% and 12.8% of families, respectively.
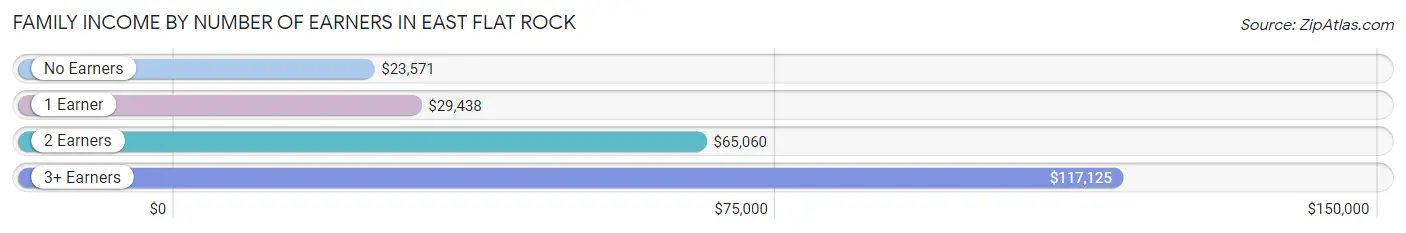
| Number of Earners | # Families | Median Income |
| No Earners | 198 (12.8%) | $23,571 |
| 1 Earner | 375 (24.3%) | $29,438 |
| 2 Earners | 828 (53.6%) | $65,060 |
| 3+ Earners | 143 (9.3%) | $117,125 |
| Total | 1,544 (100.0%) | $62,529 |
Household Income in East Flat Rock
Household Income Brackets in East Flat Rock
With 556 households falling in the category, the $50,000 to $74,999 income range is the most frequent in East Flat Rock, accounting for 27.0% of all households. In contrast, only 74 households (3.6%) fall into the $200,000+ income bracket, making it the least populous group.
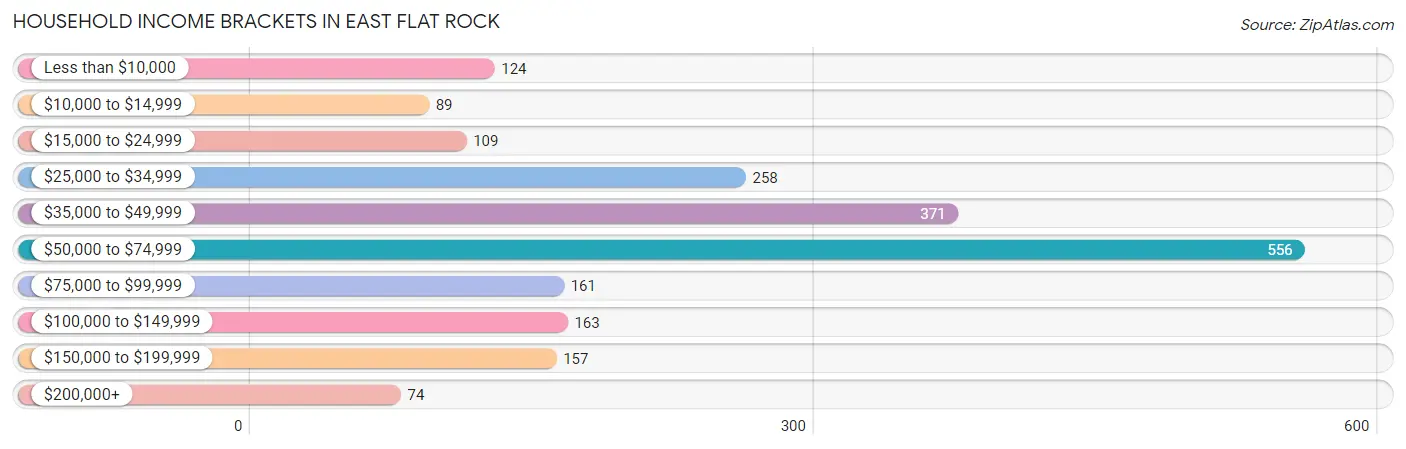
| Income Bracket | # Households | % Households |
| Less than $10,000 | 124 | 6.0% |
| $10,000 to $14,999 | 89 | 4.3% |
| $15,000 to $24,999 | 109 | 5.3% |
| $25,000 to $34,999 | 258 | 12.5% |
| $35,000 to $49,999 | 371 | 18.0% |
| $50,000 to $74,999 | 556 | 27.0% |
| $75,000 to $99,999 | 161 | 7.8% |
| $100,000 to $149,999 | 163 | 7.9% |
| $150,000 to $199,999 | 157 | 7.6% |
| $200,000+ | 74 | 3.6% |
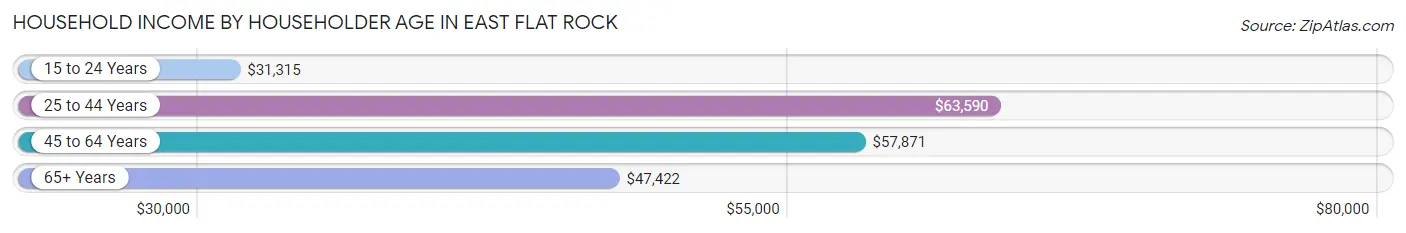
Household Income by Householder Age in East Flat Rock
The median household income in East Flat Rock is $54,605, with the highest median household income of $63,590 found in the 25 to 44 years age bracket for the primary householder. A total of 829 households (40.2%) fall into this category. Meanwhile, the 15 to 24 years age bracket for the primary householder has the lowest median household income of $31,315, with 153 households (7.4%) in this group.
| Income Bracket | # Households | Median Income |
| 15 to 24 Years | 153 (7.4%) | $31,315 |
| 25 to 44 Years | 829 (40.2%) | $63,590 |
| 45 to 64 Years | 607 (29.5%) | $57,871 |
| 65+ Years | 471 (22.9%) | $47,422 |
| Total | 2,060 (100.0%) | $54,605 |
Poverty in East Flat Rock
Income Below Poverty by Sex and Age in East Flat Rock
With 11.5% poverty level for males and 12.3% for females among the residents of East Flat Rock, 6 to 11 year old males and 75 year old and over females are the most vulnerable to poverty, with 48 males (33.3%) and 50 females (37.9%) in their respective age groups living below the poverty level.
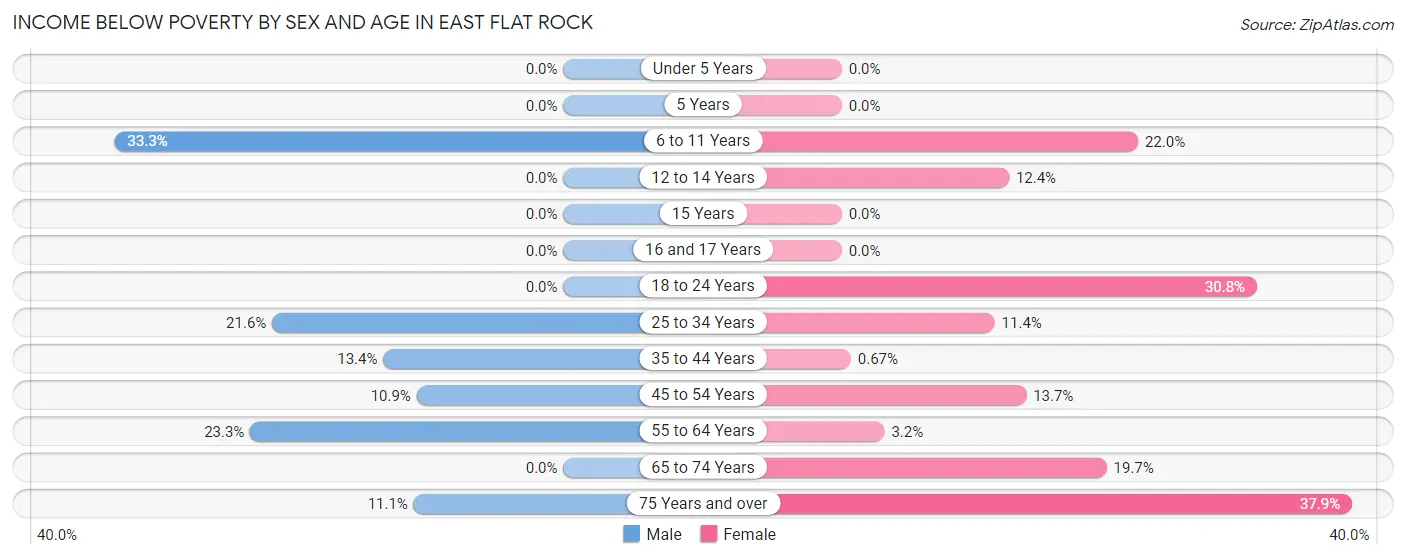
| Age Bracket | Male | Female |
| Under 5 Years | 0 (0.0%) | 0 (0.0%) |
| 5 Years | 0 (0.0%) | 0 (0.0%) |
| 6 to 11 Years | 48 (33.3%) | 75 (22.0%) |
| 12 to 14 Years | 0 (0.0%) | 35 (12.4%) |
| 15 Years | 0 (0.0%) | 0 (0.0%) |
| 16 and 17 Years | 0 (0.0%) | 0 (0.0%) |
| 18 to 24 Years | 0 (0.0%) | 102 (30.8%) |
| 25 to 34 Years | 72 (21.6%) | 42 (11.4%) |
| 35 to 44 Years | 48 (13.4%) | 4 (0.7%) |
| 45 to 54 Years | 38 (10.9%) | 43 (13.7%) |
| 55 to 64 Years | 53 (23.3%) | 12 (3.2%) |
| 65 to 74 Years | 0 (0.0%) | 58 (19.7%) |
| 75 Years and over | 14 (11.1%) | 50 (37.9%) |
| Total | 273 (11.5%) | 421 (12.3%) |
Income Above Poverty by Sex and Age in East Flat Rock
According to the poverty statistics in East Flat Rock, males aged under 5 years and females aged under 5 years are the age groups that are most secure financially, with 100.0% of males and 100.0% of females in these age groups living above the poverty line.
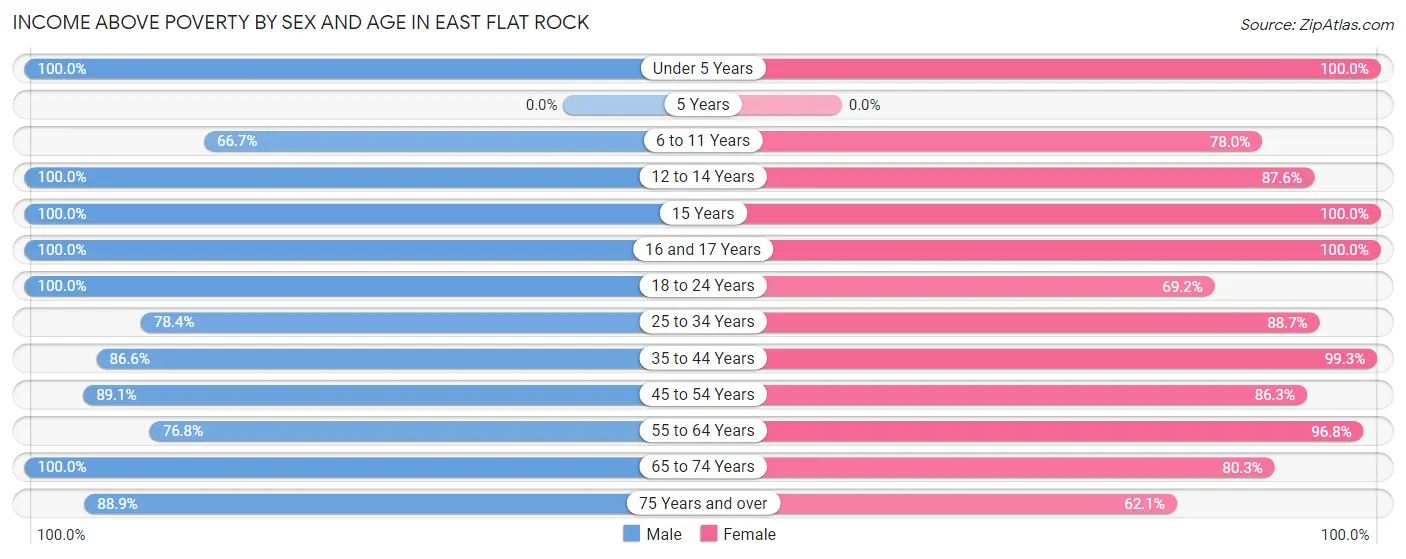
| Age Bracket | Male | Female |
| Under 5 Years | 97 (100.0%) | 128 (100.0%) |
| 5 Years | 0 (0.0%) | 0 (0.0%) |
| 6 to 11 Years | 96 (66.7%) | 266 (78.0%) |
| 12 to 14 Years | 122 (100.0%) | 247 (87.6%) |
| 15 Years | 5 (100.0%) | 53 (100.0%) |
| 16 and 17 Years | 52 (100.0%) | 210 (100.0%) |
| 18 to 24 Years | 360 (100.0%) | 229 (69.2%) |
| 25 to 34 Years | 261 (78.4%) | 328 (88.6%) |
| 35 to 44 Years | 311 (86.6%) | 591 (99.3%) |
| 45 to 54 Years | 311 (89.1%) | 271 (86.3%) |
| 55 to 64 Years | 175 (76.7%) | 366 (96.8%) |
| 65 to 74 Years | 208 (100.0%) | 237 (80.3%) |
| 75 Years and over | 112 (88.9%) | 82 (62.1%) |
| Total | 2,110 (88.5%) | 3,008 (87.7%) |
Income Below Poverty Among Married-Couple Families in East Flat Rock
The poverty statistics for married-couple families in East Flat Rock show that 1.6% or 14 of the total 861 families live below the poverty line. Families with no children have the highest poverty rate of 3.0%, comprising of 14 families. On the other hand, families with 1 or 2 children have the lowest poverty rate of 0.0%, which includes 0 families.
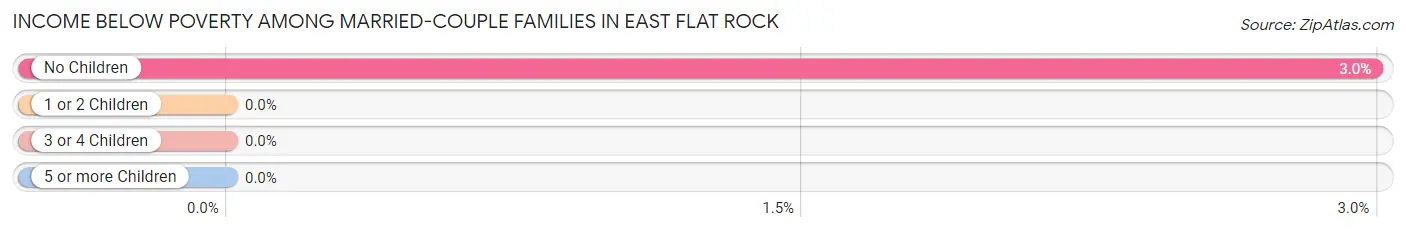
| Children | Above Poverty | Below Poverty |
| No Children | 454 (97.0%) | 14 (3.0%) |
| 1 or 2 Children | 338 (100.0%) | 0 (0.0%) |
| 3 or 4 Children | 55 (100.0%) | 0 (0.0%) |
| 5 or more Children | 0 (0.0%) | 0 (0.0%) |
| Total | 847 (98.4%) | 14 (1.6%) |
Income Below Poverty Among Single-Parent Households in East Flat Rock
According to the poverty data in East Flat Rock, 50.7% or 34 single-father households and 18.0% or 111 single-mother households are living below the poverty line. Among single-father households, those with 1 or 2 children have the highest poverty rate, with 34 households (100.0%) experiencing poverty. Likewise, among single-mother households, those with no children have the highest poverty rate, with 73 households (26.0%) falling below the poverty line.
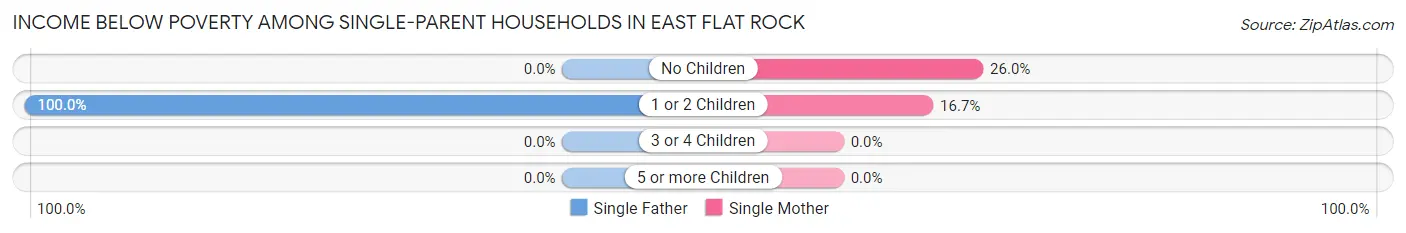
| Children | Single Father | Single Mother |
| No Children | 0 (0.0%) | 73 (26.0%) |
| 1 or 2 Children | 34 (100.0%) | 38 (16.7%) |
| 3 or 4 Children | 0 (0.0%) | 0 (0.0%) |
| 5 or more Children | 0 (0.0%) | 0 (0.0%) |
| Total | 34 (50.7%) | 111 (18.0%) |
Income Below Poverty Among Married-Couple vs Single-Parent Households in East Flat Rock
The poverty data for East Flat Rock shows that 14 of the married-couple family households (1.6%) and 145 of the single-parent households (21.2%) are living below the poverty level. Within the married-couple family households, those with no children have the highest poverty rate, with 14 households (3.0%) falling below the poverty line. Among the single-parent households, those with 1 or 2 children have the highest poverty rate, with 72 household (27.5%) living below poverty.
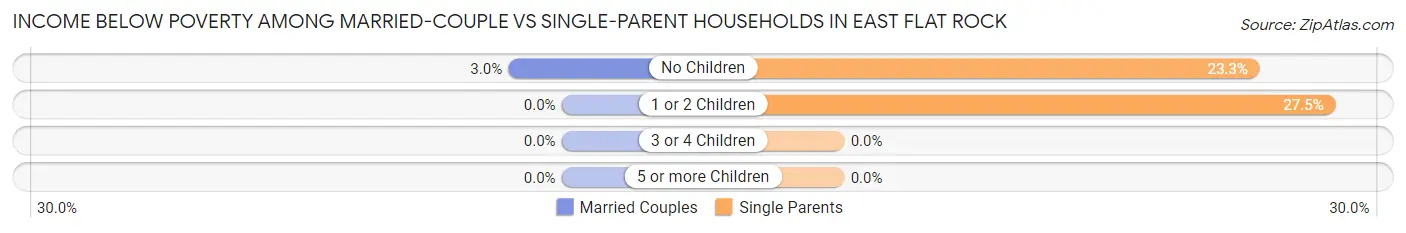
| Children | Married-Couple Families | Single-Parent Households |
| No Children | 14 (3.0%) | 73 (23.3%) |
| 1 or 2 Children | 0 (0.0%) | 72 (27.5%) |
| 3 or 4 Children | 0 (0.0%) | 0 (0.0%) |
| 5 or more Children | 0 (0.0%) | 0 (0.0%) |
| Total | 14 (1.6%) | 145 (21.2%) |
Race in East Flat Rock
The most populous races in East Flat Rock are White / Caucasian (4,651 | 78.4%), Hispanic or Latino (1,646 | 27.7%), and Some other Race (529 | 8.9%).
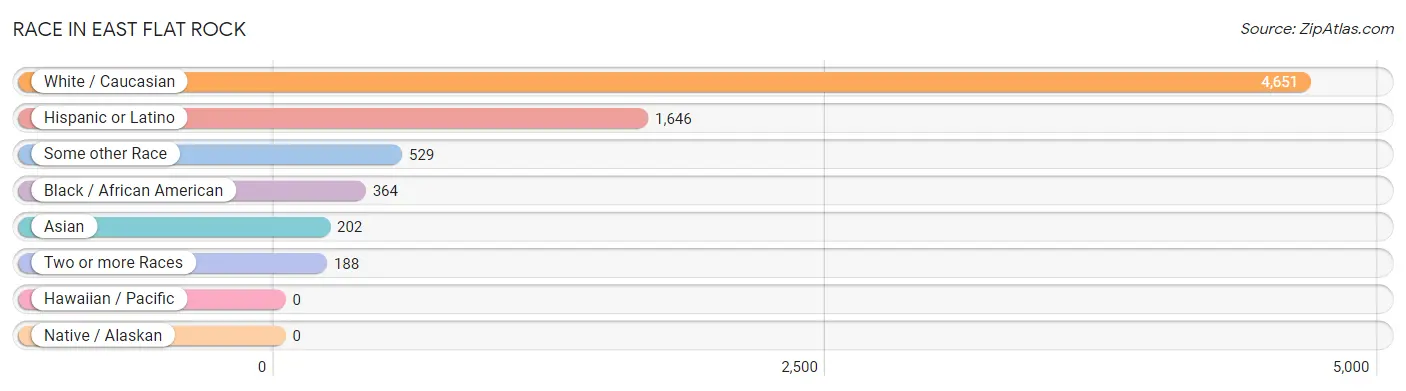
| Race | # Population | % Population |
| Asian | 202 | 3.4% |
| Black / African American | 364 | 6.1% |
| Hawaiian / Pacific | 0 | 0.0% |
| Hispanic or Latino | 1,646 | 27.7% |
| Native / Alaskan | 0 | 0.0% |
| White / Caucasian | 4,651 | 78.4% |
| Two or more Races | 188 | 3.2% |
| Some other Race | 529 | 8.9% |
| Total | 5,934 | 100.0% |
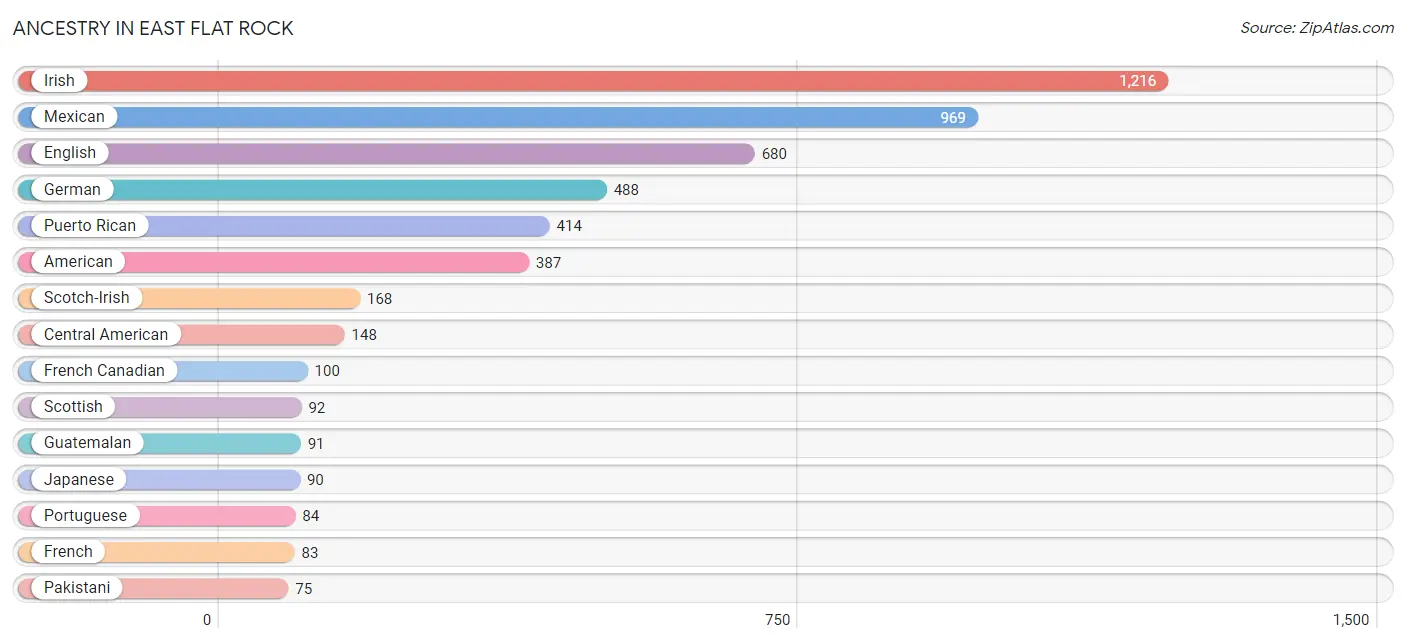
Ancestry in East Flat Rock
The most populous ancestries reported in East Flat Rock are Irish (1,216 | 20.5%), Mexican (969 | 16.3%), English (680 | 11.5%), German (488 | 8.2%), and Puerto Rican (414 | 7.0%), together accounting for 63.5% of all East Flat Rock residents.
| Ancestry | # Population | % Population |
| African | 25 | 0.4% |
| Albanian | 16 | 0.3% |
| American | 387 | 6.5% |
| Burmese | 4 | 0.1% |
| Canadian | 58 | 1.0% |
| Central American | 148 | 2.5% |
| Cherokee | 14 | 0.2% |
| Colombian | 71 | 1.2% |
| Czech | 9 | 0.2% |
| Danish | 21 | 0.4% |
| Dutch | 62 | 1.0% |
| English | 680 | 11.5% |
| European | 52 | 0.9% |
| French | 83 | 1.4% |
| French Canadian | 100 | 1.7% |
| German | 488 | 8.2% |
| Greek | 25 | 0.4% |
| Guatemalan | 91 | 1.5% |
| Honduran | 57 | 1.0% |
| Indian (Asian) | 11 | 0.2% |
| Irish | 1,216 | 20.5% |
| Italian | 62 | 1.0% |
| Japanese | 90 | 1.5% |
| Mexican | 969 | 16.3% |
| Nigerian | 9 | 0.2% |
| Pakistani | 75 | 1.3% |
| Polish | 12 | 0.2% |
| Portuguese | 84 | 1.4% |
| Puerto Rican | 414 | 7.0% |
| Scotch-Irish | 168 | 2.8% |
| Scottish | 92 | 1.5% |
| South American | 71 | 1.2% |
| Spaniard | 44 | 0.7% |
| Sri Lankan | 22 | 0.4% |
| Subsaharan African | 34 | 0.6% |
| Swiss | 9 | 0.2% |
| Ukrainian | 17 | 0.3% |
| Welsh | 8 | 0.1% | View All 38 Rows |
Immigrants in East Flat Rock
The most numerous immigrant groups reported in East Flat Rock came from Central America (712 | 12.0%), Latin America (712 | 12.0%), Mexico (564 | 9.5%), Asia (149 | 2.5%), and South Eastern Asia (149 | 2.5%), together accounting for 38.5% of all East Flat Rock residents.
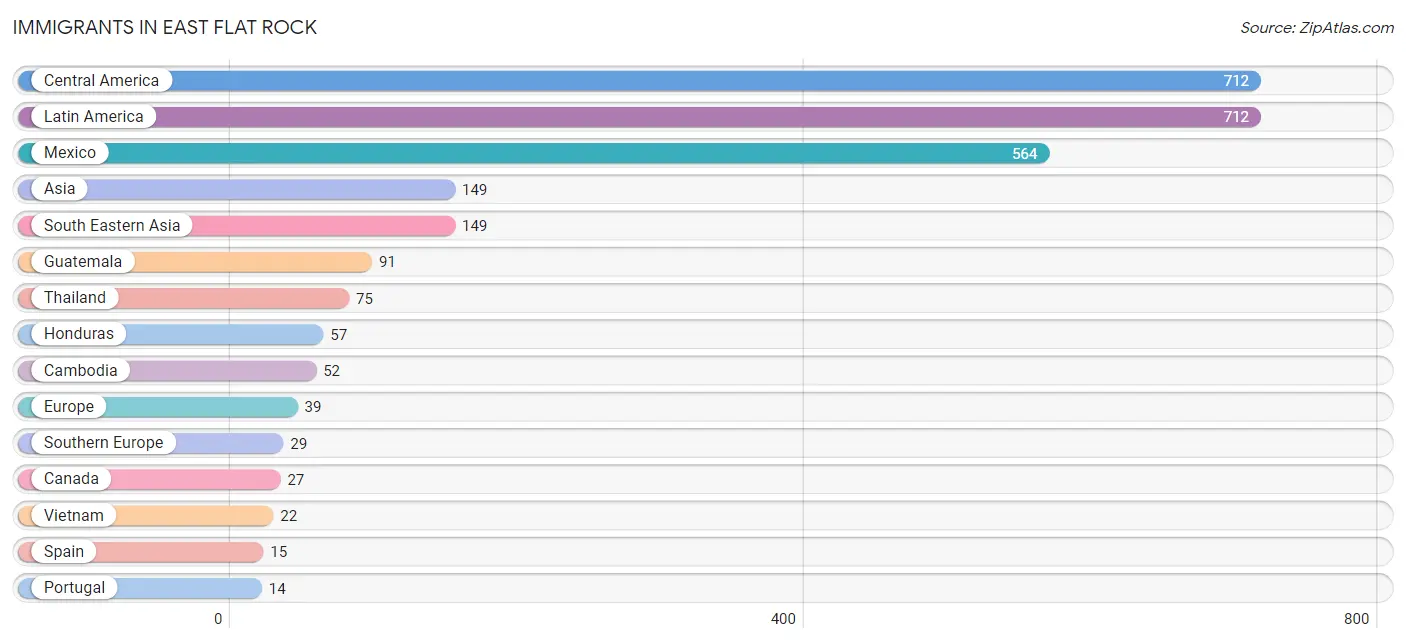
| Immigration Origin | # Population | % Population |
| Africa | 9 | 0.2% |
| Asia | 149 | 2.5% |
| Cambodia | 52 | 0.9% |
| Canada | 27 | 0.5% |
| Central America | 712 | 12.0% |
| Europe | 39 | 0.7% |
| France | 10 | 0.2% |
| Guatemala | 91 | 1.5% |
| Honduras | 57 | 1.0% |
| Latin America | 712 | 12.0% |
| Mexico | 564 | 9.5% |
| Nigeria | 9 | 0.2% |
| Portugal | 14 | 0.2% |
| South Eastern Asia | 149 | 2.5% |
| Southern Europe | 29 | 0.5% |
| Spain | 15 | 0.3% |
| Thailand | 75 | 1.3% |
| Vietnam | 22 | 0.4% |
| Western Africa | 9 | 0.2% |
| Western Europe | 10 | 0.2% | View All 20 Rows |
Sex and Age in East Flat Rock
Sex and Age in East Flat Rock
The most populous age groups in East Flat Rock are 20 to 24 Years (331 | 13.3%) for men and 15 to 19 Years (439 | 12.7%) for women.
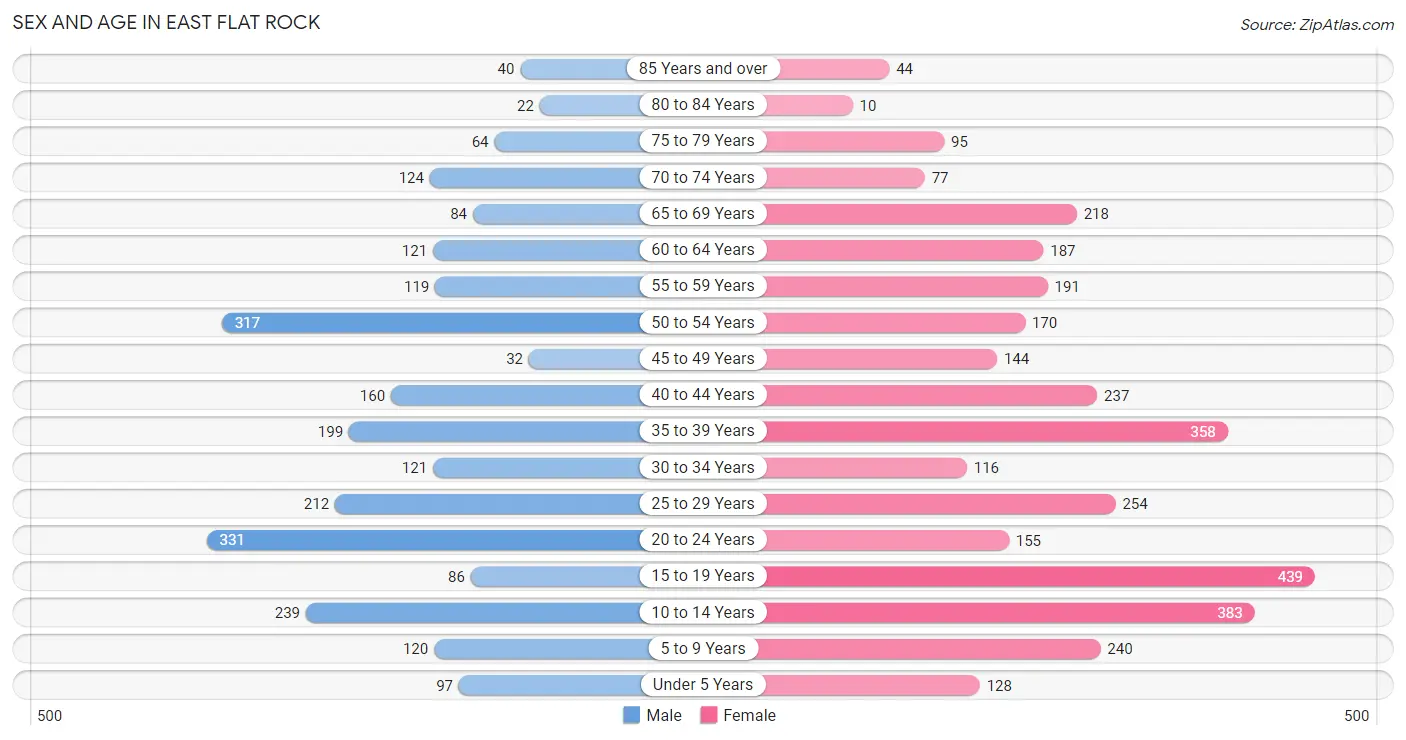
| Age Bracket | Male | Female |
| Under 5 Years | 97 (3.9%) | 128 (3.7%) |
| 5 to 9 Years | 120 (4.8%) | 240 (7.0%) |
| 10 to 14 Years | 239 (9.6%) | 383 (11.1%) |
| 15 to 19 Years | 86 (3.5%) | 439 (12.7%) |
| 20 to 24 Years | 331 (13.3%) | 155 (4.5%) |
| 25 to 29 Years | 212 (8.5%) | 254 (7.4%) |
| 30 to 34 Years | 121 (4.9%) | 116 (3.4%) |
| 35 to 39 Years | 199 (8.0%) | 358 (10.4%) |
| 40 to 44 Years | 160 (6.4%) | 237 (6.9%) |
| 45 to 49 Years | 32 (1.3%) | 144 (4.2%) |
| 50 to 54 Years | 317 (12.7%) | 170 (4.9%) |
| 55 to 59 Years | 119 (4.8%) | 191 (5.5%) |
| 60 to 64 Years | 121 (4.9%) | 187 (5.4%) |
| 65 to 69 Years | 84 (3.4%) | 218 (6.3%) |
| 70 to 74 Years | 124 (5.0%) | 77 (2.2%) |
| 75 to 79 Years | 64 (2.6%) | 95 (2.8%) |
| 80 to 84 Years | 22 (0.9%) | 10 (0.3%) |
| 85 Years and over | 40 (1.6%) | 44 (1.3%) |
| Total | 2,488 (100.0%) | 3,446 (100.0%) |
Families and Households in East Flat Rock
Median Family Size in East Flat Rock
The median family size in East Flat Rock is 3.22 persons per family, with married-couple families (861 | 55.8%) accounting for the largest median family size of 3.36 persons per family. On the other hand, single male/father families (67 | 4.3%) represent the smallest median family size with 2.84 persons per family.

| Family Type | # Families | Family Size |
| Married-Couple | 861 (55.8%) | 3.36 |
| Single Male/Father | 67 (4.3%) | 2.84 |
| Single Female/Mother | 616 (39.9%) | 3.06 |
| Total Families | 1,544 (100.0%) | 3.22 |
Median Household Size in East Flat Rock
The median household size in East Flat Rock is 2.82 persons per household, with married-couple households (861 | 41.8%) accounting for the largest median household size of 3.36 persons per household. non-family households (516 | 25.1%) represent the smallest median household size with 1.49 persons per household.
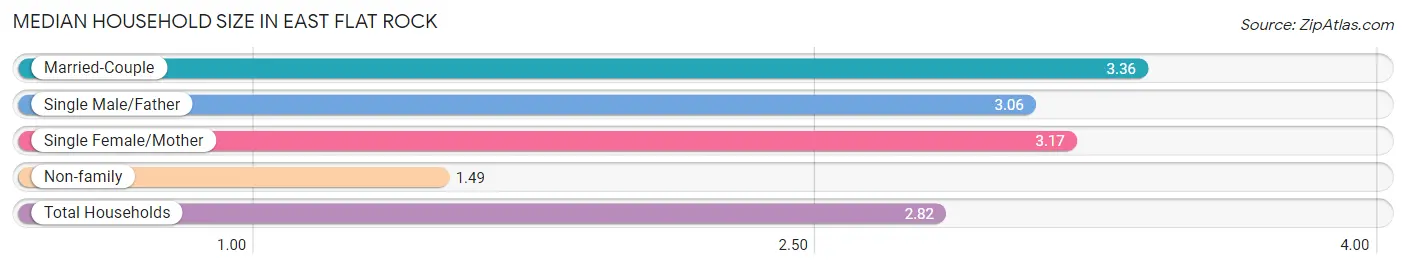
| Household Type | # Households | Household Size |
| Married-Couple | 861 (41.8%) | 3.36 |
| Single Male/Father | 67 (3.3%) | 3.06 |
| Single Female/Mother | 616 (29.9%) | 3.17 |
| Non-family | 516 (25.1%) | 1.49 |
| Total Households | 2,060 (100.0%) | 2.82 |
Household Size by Marriage Status in East Flat Rock
Out of a total of 2,060 households in East Flat Rock, 1,544 (75.0%) are family households, while 516 (25.1%) are nonfamily households. The most numerous type of family households are 2-person households, comprising 545, and the most common type of nonfamily households are 1-person households, comprising 365.
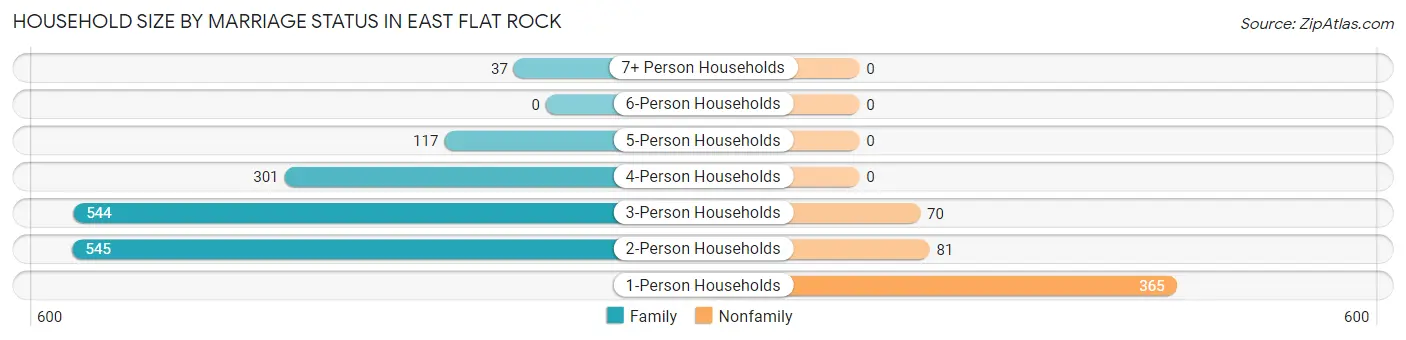
| Household Size | Family Households | Nonfamily Households |
| 1-Person Households | - | 365 (17.7%) |
| 2-Person Households | 545 (26.5%) | 81 (3.9%) |
| 3-Person Households | 544 (26.4%) | 70 (3.4%) |
| 4-Person Households | 301 (14.6%) | 0 (0.0%) |
| 5-Person Households | 117 (5.7%) | 0 (0.0%) |
| 6-Person Households | 0 (0.0%) | 0 (0.0%) |
| 7+ Person Households | 37 (1.8%) | 0 (0.0%) |
| Total | 1,544 (75.0%) | 516 (25.1%) |
Female Fertility in East Flat Rock
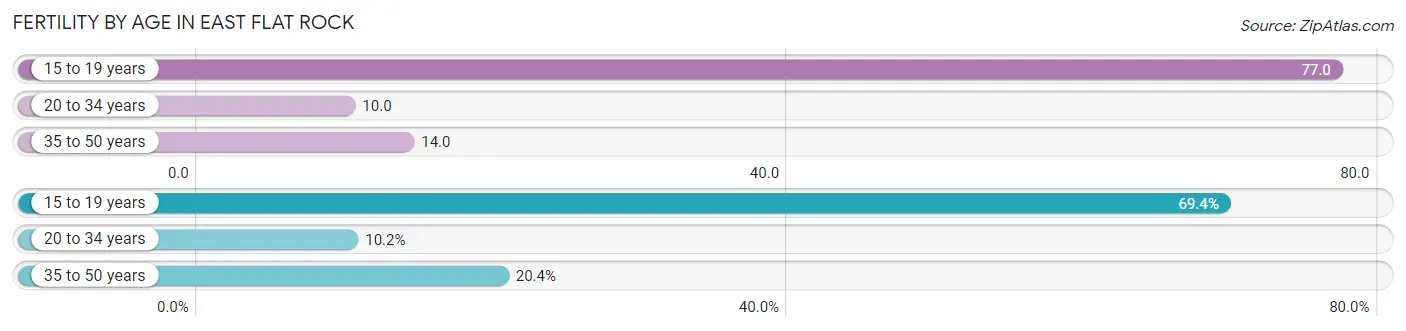
Fertility by Age in East Flat Rock
Average fertility rate in East Flat Rock is 29.0 births per 1,000 women. Women in the age bracket of 15 to 19 years have the highest fertility rate with 77.0 births per 1,000 women. Women in the age bracket of 15 to 19 years acount for 69.4% of all women with births.
| Age Bracket | Women with Births | Births / 1,000 Women |
| 15 to 19 years | 34 (69.4%) | 77.0 |
| 20 to 34 years | 5 (10.2%) | 10.0 |
| 35 to 50 years | 10 (20.4%) | 14.0 |
| Total | 49 (100.0%) | 29.0 |
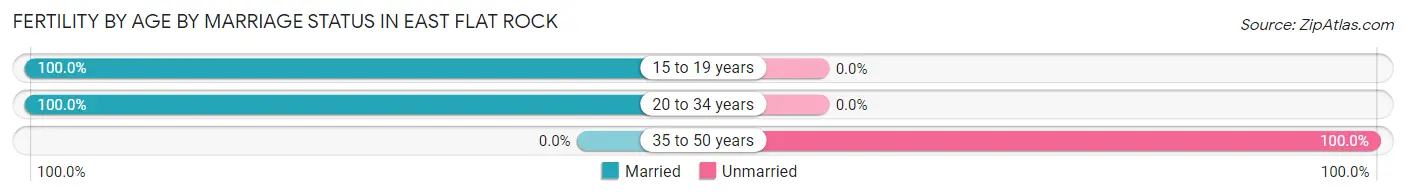
Fertility by Age by Marriage Status in East Flat Rock
79.6% of women with births (49) in East Flat Rock are married. The highest percentage of unmarried women with births falls into 35 to 50 years age bracket with 100.0% of them unmarried at the time of birth, while the lowest percentage of unmarried women with births belong to 15 to 19 years age bracket with 0.0% of them unmarried.
| Age Bracket | Married | Unmarried |
| 15 to 19 years | 34 (100.0%) | 0 (0.0%) |
| 20 to 34 years | 5 (100.0%) | 0 (0.0%) |
| 35 to 50 years | 0 (0.0%) | 10 (100.0%) |
| Total | 39 (79.6%) | 10 (20.4%) |
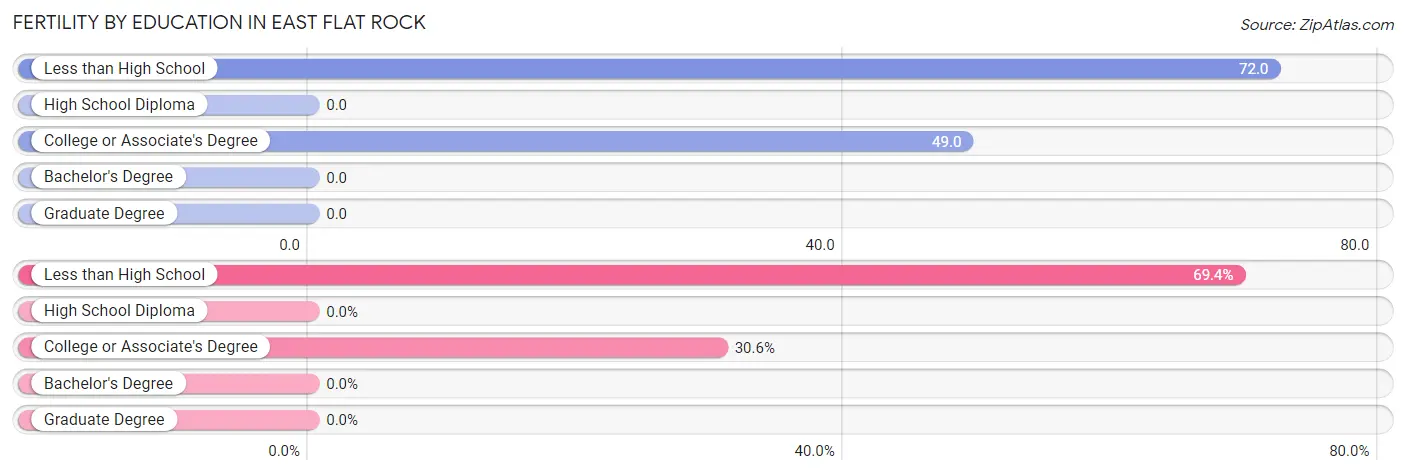
Fertility by Education in East Flat Rock
| Educational Attainment | Women with Births | Births / 1,000 Women |
| Less than High School | 34 (69.4%) | 72.0 |
| High School Diploma | 0 (0.0%) | 0.0 |
| College or Associate's Degree | 15 (30.6%) | 49.0 |
| Bachelor's Degree | 0 (0.0%) | 0.0 |
| Graduate Degree | 0 (0.0%) | 0.0 |
| Total | 49 (100.0%) | 29.0 |
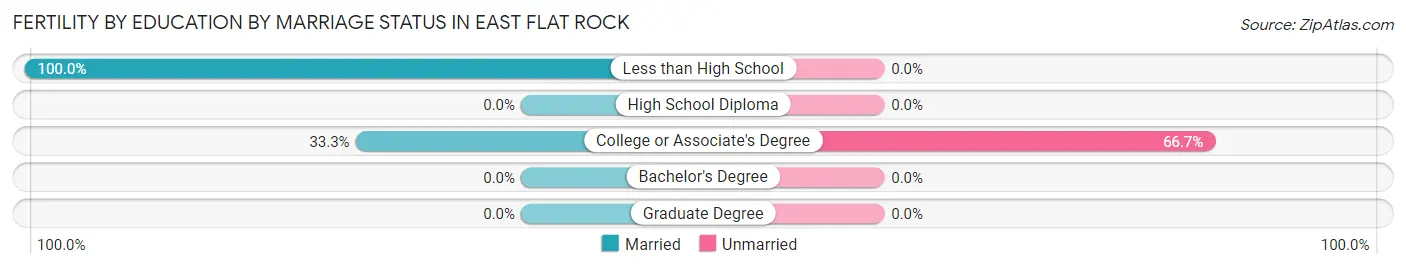
Fertility by Education by Marriage Status in East Flat Rock
20.4% of women with births in East Flat Rock are unmarried. Women with the educational attainment of less than high school are most likely to be married with 100.0% of them married at childbirth, while women with the educational attainment of college or associate's degree are least likely to be married with 66.7% of them unmarried at childbirth.
| Educational Attainment | Married | Unmarried |
| Less than High School | 34 (100.0%) | 0 (0.0%) |
| High School Diploma | 0 (0.0%) | 0 (0.0%) |
| College or Associate's Degree | 5 (33.3%) | 10 (66.7%) |
| Bachelor's Degree | 0 (0.0%) | 0 (0.0%) |
| Graduate Degree | 0 (0.0%) | 0 (0.0%) |
| Total | 39 (79.6%) | 10 (20.4%) |
Employment Characteristics in East Flat Rock
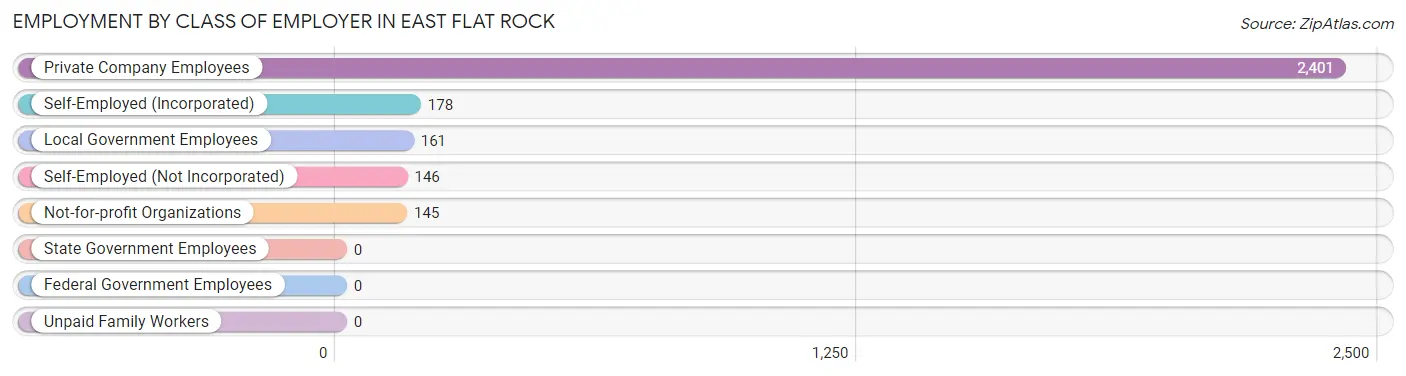
Employment by Class of Employer in East Flat Rock
Among the 3,031 employed individuals in East Flat Rock, private company employees (2,401 | 79.2%), self-employed (incorporated) (178 | 5.9%), and local government employees (161 | 5.3%) make up the most common classes of employment.
| Employer Class | # Employees | % Employees |
| Private Company Employees | 2,401 | 79.2% |
| Self-Employed (Incorporated) | 178 | 5.9% |
| Self-Employed (Not Incorporated) | 146 | 4.8% |
| Not-for-profit Organizations | 145 | 4.8% |
| Local Government Employees | 161 | 5.3% |
| State Government Employees | 0 | 0.0% |
| Federal Government Employees | 0 | 0.0% |
| Unpaid Family Workers | 0 | 0.0% |
| Total | 3,031 | 100.0% |
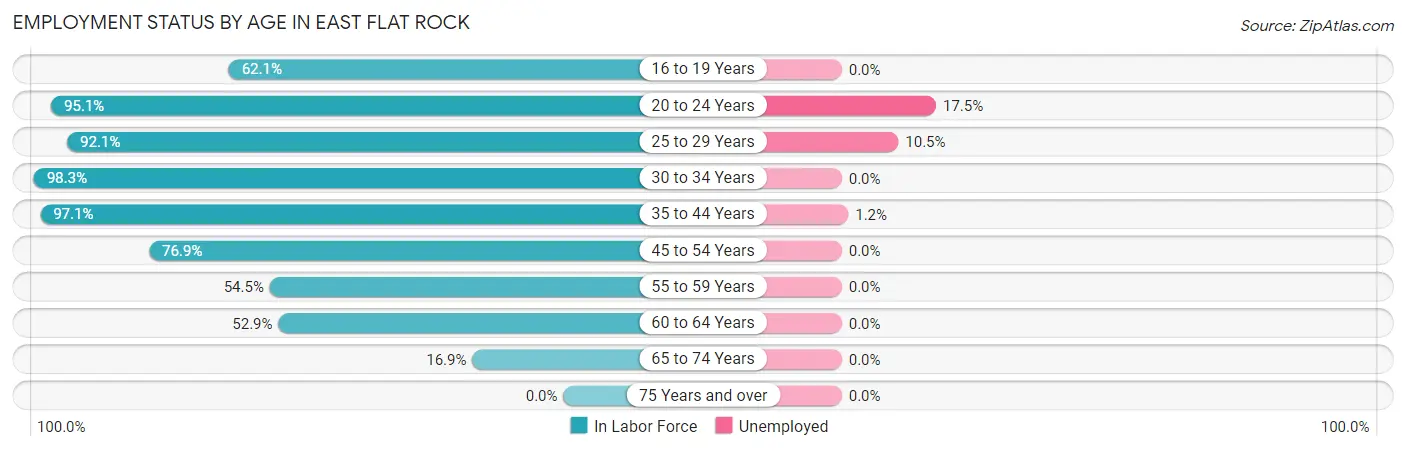
Employment Status by Age in East Flat Rock
According to the labor force statistics for East Flat Rock, out of the total population over 16 years of age (4,669), 70.0% or 3,268 individuals are in the labor force, with 4.2% or 137 of them unemployed. The age group with the highest labor force participation rate is 30 to 34 years, with 98.3% or 233 individuals in the labor force. Within the labor force, the 20 to 24 years age range has the highest percentage of unemployed individuals, with 17.5% or 81 of them being unemployed.
| Age Bracket | In Labor Force | Unemployed |
| 16 to 19 Years | 290 (62.1%) | 0 (0.0%) |
| 20 to 24 Years | 462 (95.1%) | 81 (17.5%) |
| 25 to 29 Years | 429 (92.1%) | 45 (10.5%) |
| 30 to 34 Years | 233 (98.3%) | 0 (0.0%) |
| 35 to 44 Years | 926 (97.1%) | 11 (1.2%) |
| 45 to 54 Years | 510 (76.9%) | 0 (0.0%) |
| 55 to 59 Years | 169 (54.5%) | 0 (0.0%) |
| 60 to 64 Years | 163 (52.9%) | 0 (0.0%) |
| 65 to 74 Years | 85 (16.9%) | 0 (0.0%) |
| 75 Years and over | 0 (0.0%) | 0 (0.0%) |
| Total | 3,268 (70.0%) | 137 (4.2%) |
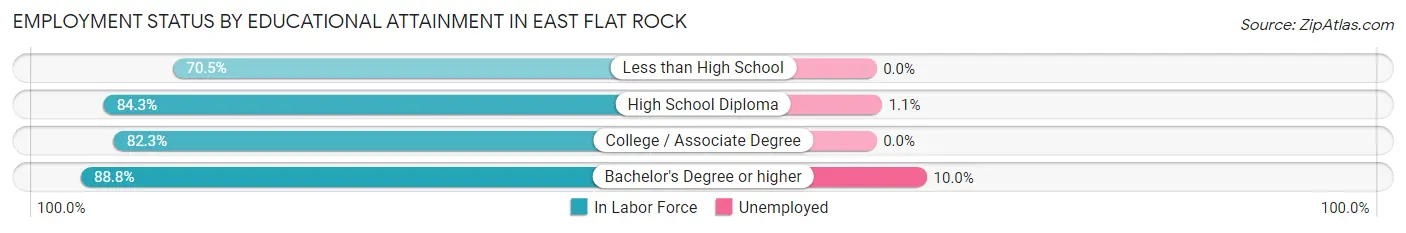
Employment Status by Educational Attainment in East Flat Rock
According to labor force statistics for East Flat Rock, 82.7% of individuals (2,430) out of the total population between 25 and 64 years of age (2,938) are in the labor force, with 2.3% or 56 of them being unemployed. The group with the highest labor force participation rate are those with the educational attainment of bachelor's degree or higher, with 88.8% or 451 individuals in the labor force. Within the labor force, individuals with bachelor's degree or higher education have the highest percentage of unemployment, with 10.0% or 45 of them being unemployed.
| Educational Attainment | In Labor Force | Unemployed |
| Less than High School | 265 (70.5%) | 0 (0.0%) |
| High School Diploma | 985 (84.3%) | 13 (1.1%) |
| College / Associate Degree | 729 (82.3%) | 0 (0.0%) |
| Bachelor's Degree or higher | 451 (88.8%) | 51 (10.0%) |
| Total | 2,430 (82.7%) | 68 (2.3%) |
Employment Occupations by Sex in East Flat Rock
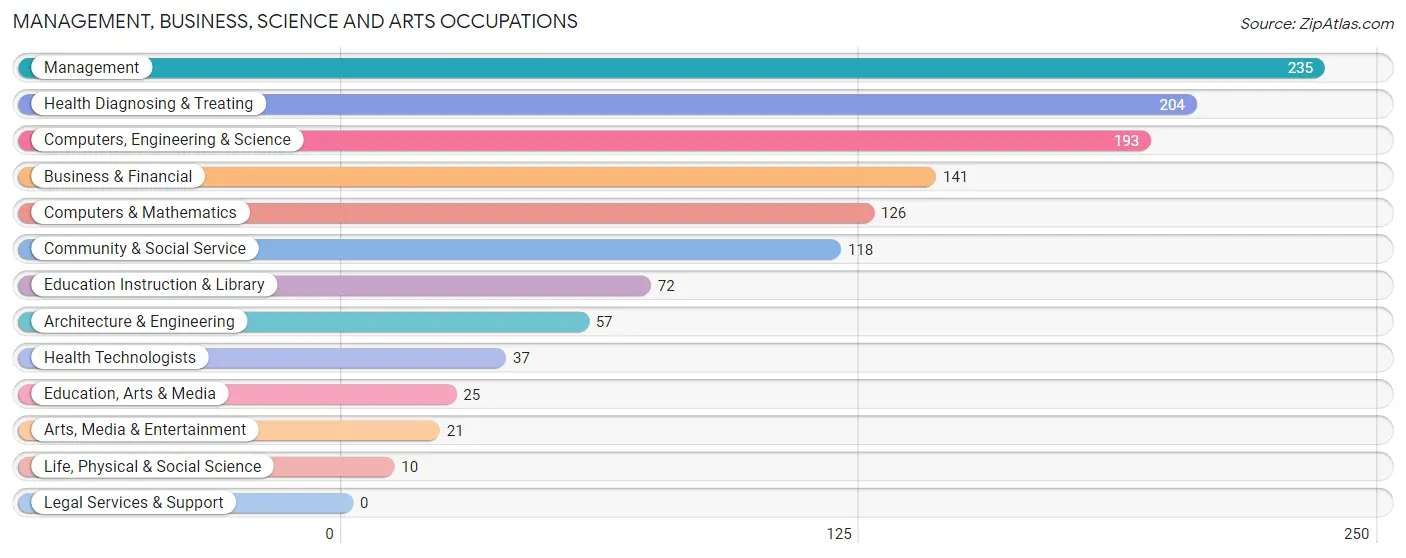
Management, Business, Science and Arts Occupations
The most common Management, Business, Science and Arts occupations in East Flat Rock are Management (235 | 7.5%), Health Diagnosing & Treating (204 | 6.5%), Computers, Engineering & Science (193 | 6.2%), Business & Financial (141 | 4.5%), and Computers & Mathematics (126 | 4.0%).
Management, Business, Science and Arts Occupations by Sex
Within the Management, Business, Science and Arts occupations in East Flat Rock, the most male-oriented occupations are Computers & Mathematics (100.0%), Life, Physical & Social Science (100.0%), and Business & Financial (92.9%), while the most female-oriented occupations are Architecture & Engineering (100.0%), Education, Arts & Media (100.0%), and Education Instruction & Library (100.0%).
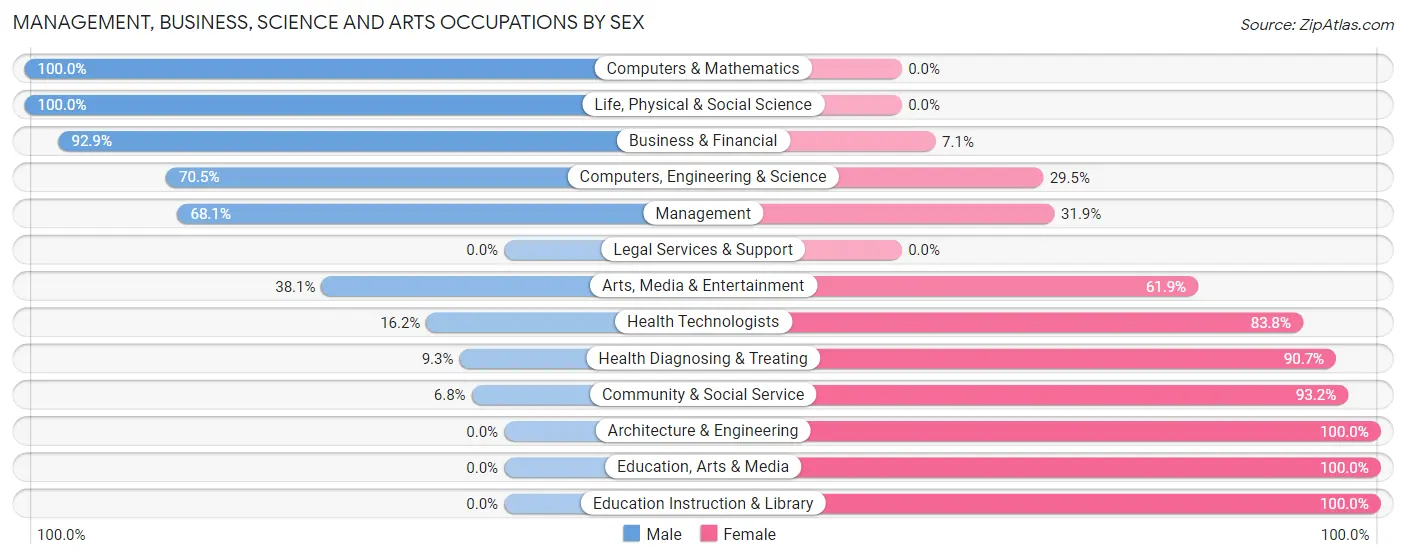
| Occupation | Male | Female |
| Management | 160 (68.1%) | 75 (31.9%) |
| Business & Financial | 131 (92.9%) | 10 (7.1%) |
| Computers, Engineering & Science | 136 (70.5%) | 57 (29.5%) |
| Computers & Mathematics | 126 (100.0%) | 0 (0.0%) |
| Architecture & Engineering | 0 (0.0%) | 57 (100.0%) |
| Life, Physical & Social Science | 10 (100.0%) | 0 (0.0%) |
| Community & Social Service | 8 (6.8%) | 110 (93.2%) |
| Education, Arts & Media | 0 (0.0%) | 25 (100.0%) |
| Legal Services & Support | 0 (0.0%) | 0 (0.0%) |
| Education Instruction & Library | 0 (0.0%) | 72 (100.0%) |
| Arts, Media & Entertainment | 8 (38.1%) | 13 (61.9%) |
| Health Diagnosing & Treating | 19 (9.3%) | 185 (90.7%) |
| Health Technologists | 6 (16.2%) | 31 (83.8%) |
| Total (Category) | 454 (50.9%) | 437 (49.0%) |
| Total (Overall) | 1,478 (47.2%) | 1,652 (52.8%) |
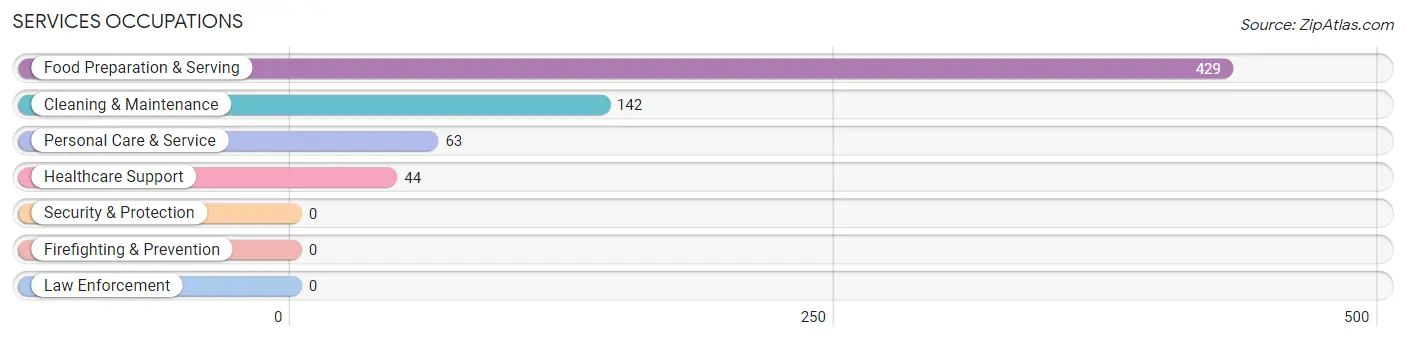
Services Occupations
The most common Services occupations in East Flat Rock are Food Preparation & Serving (429 | 13.7%), Cleaning & Maintenance (142 | 4.5%), Personal Care & Service (63 | 2.0%), and Healthcare Support (44 | 1.4%).
Services Occupations by Sex
Within the Services occupations in East Flat Rock, the most male-oriented occupations are Cleaning & Maintenance (52.8%), Food Preparation & Serving (29.6%), and Healthcare Support (18.2%), while the most female-oriented occupations are Personal Care & Service (100.0%), Healthcare Support (81.8%), and Food Preparation & Serving (70.4%).
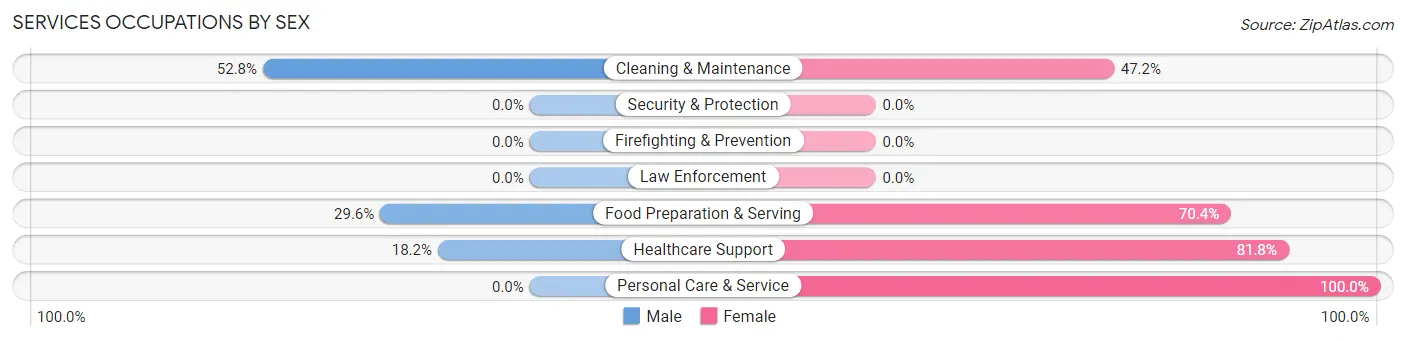
| Occupation | Male | Female |
| Healthcare Support | 8 (18.2%) | 36 (81.8%) |
| Security & Protection | 0 (0.0%) | 0 (0.0%) |
| Firefighting & Prevention | 0 (0.0%) | 0 (0.0%) |
| Law Enforcement | 0 (0.0%) | 0 (0.0%) |
| Food Preparation & Serving | 127 (29.6%) | 302 (70.4%) |
| Cleaning & Maintenance | 75 (52.8%) | 67 (47.2%) |
| Personal Care & Service | 0 (0.0%) | 63 (100.0%) |
| Total (Category) | 210 (31.0%) | 468 (69.0%) |
| Total (Overall) | 1,478 (47.2%) | 1,652 (52.8%) |
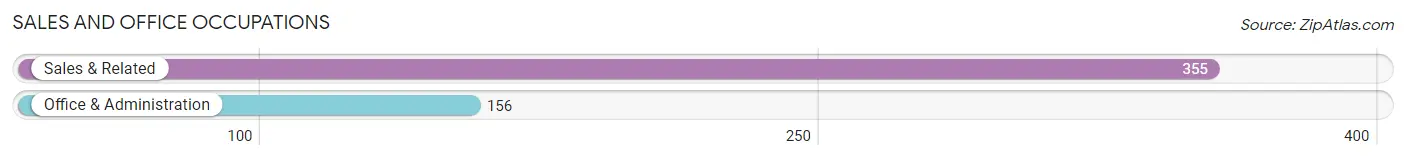
Sales and Office Occupations
The most common Sales and Office occupations in East Flat Rock are Sales & Related (355 | 11.3%), and Office & Administration (156 | 5.0%).
Sales and Office Occupations by Sex
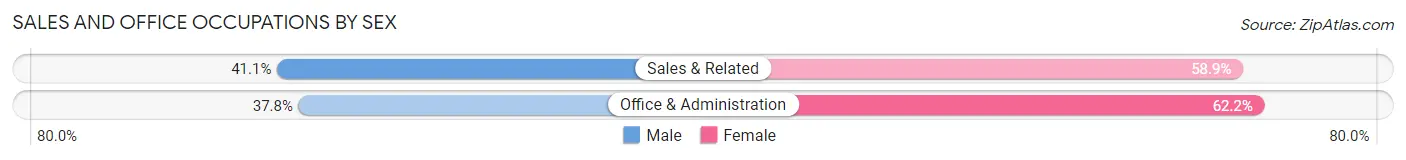
| Occupation | Male | Female |
| Sales & Related | 146 (41.1%) | 209 (58.9%) |
| Office & Administration | 59 (37.8%) | 97 (62.2%) |
| Total (Category) | 205 (40.1%) | 306 (59.9%) |
| Total (Overall) | 1,478 (47.2%) | 1,652 (52.8%) |
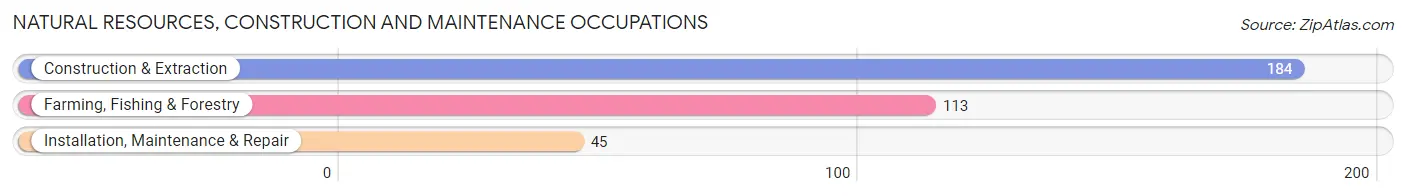
Natural Resources, Construction and Maintenance Occupations
The most common Natural Resources, Construction and Maintenance occupations in East Flat Rock are Construction & Extraction (184 | 5.9%), Farming, Fishing & Forestry (113 | 3.6%), and Installation, Maintenance & Repair (45 | 1.4%).
Natural Resources, Construction and Maintenance Occupations by Sex
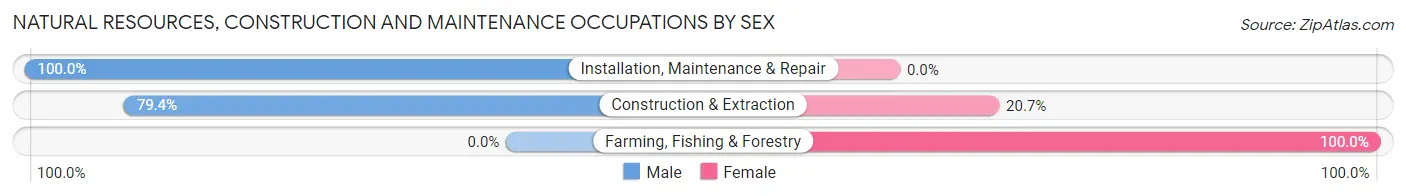
| Occupation | Male | Female |
| Farming, Fishing & Forestry | 0 (0.0%) | 113 (100.0%) |
| Construction & Extraction | 146 (79.3%) | 38 (20.6%) |
| Installation, Maintenance & Repair | 45 (100.0%) | 0 (0.0%) |
| Total (Category) | 191 (55.8%) | 151 (44.2%) |
| Total (Overall) | 1,478 (47.2%) | 1,652 (52.8%) |
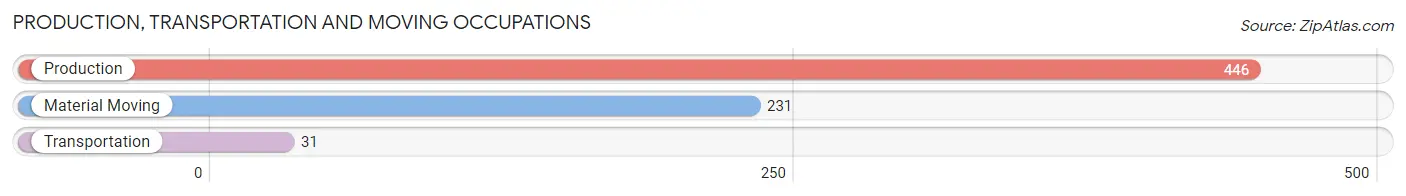
Production, Transportation and Moving Occupations
The most common Production, Transportation and Moving occupations in East Flat Rock are Production (446 | 14.2%), Material Moving (231 | 7.4%), and Transportation (31 | 1.0%).
Production, Transportation and Moving Occupations by Sex
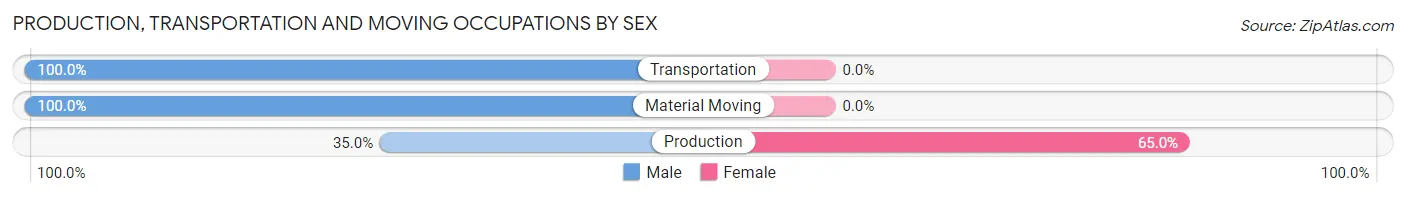
| Occupation | Male | Female |
| Production | 156 (35.0%) | 290 (65.0%) |
| Transportation | 31 (100.0%) | 0 (0.0%) |
| Material Moving | 231 (100.0%) | 0 (0.0%) |
| Total (Category) | 418 (59.0%) | 290 (41.0%) |
| Total (Overall) | 1,478 (47.2%) | 1,652 (52.8%) |
Employment Industries by Sex in East Flat Rock
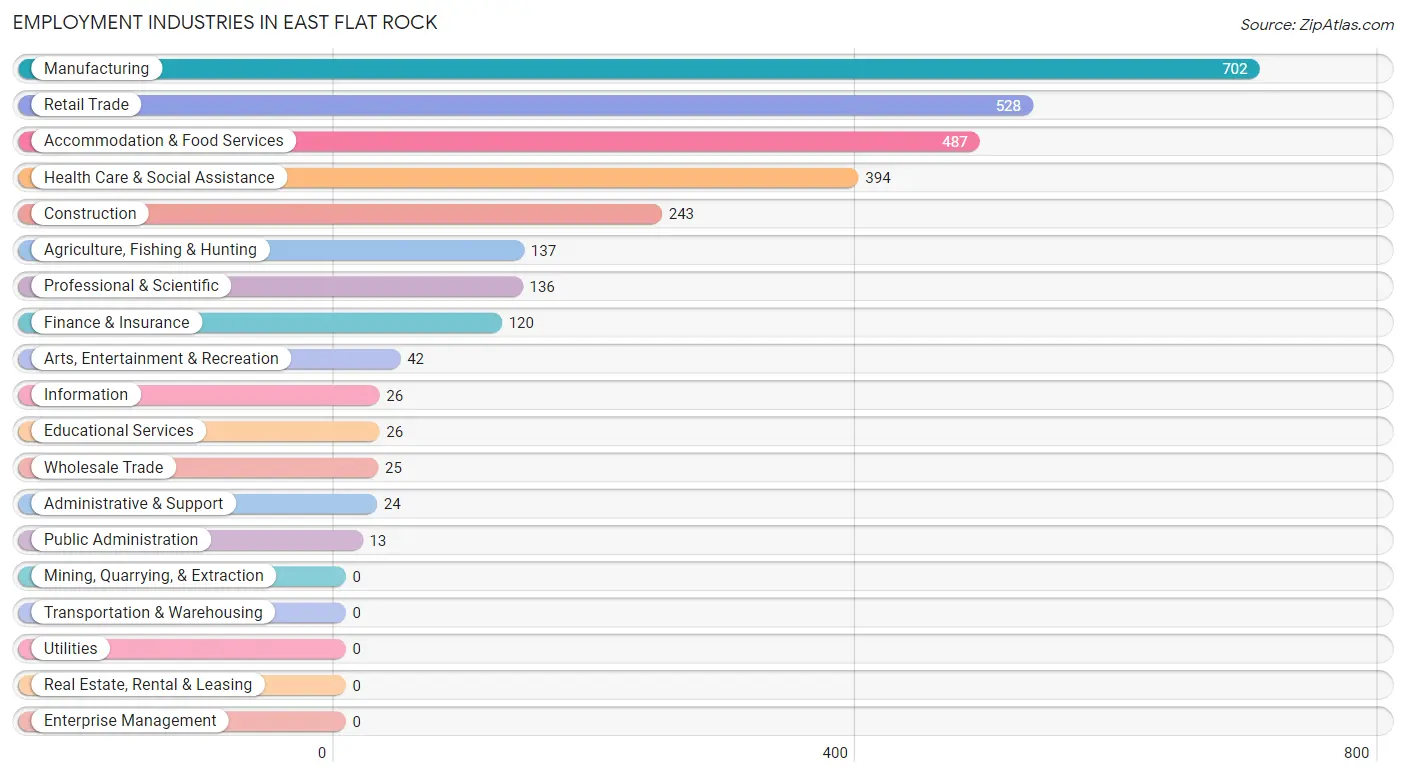
Employment Industries in East Flat Rock
The major employment industries in East Flat Rock include Manufacturing (702 | 22.4%), Retail Trade (528 | 16.9%), Accommodation & Food Services (487 | 15.6%), Health Care & Social Assistance (394 | 12.6%), and Construction (243 | 7.8%).
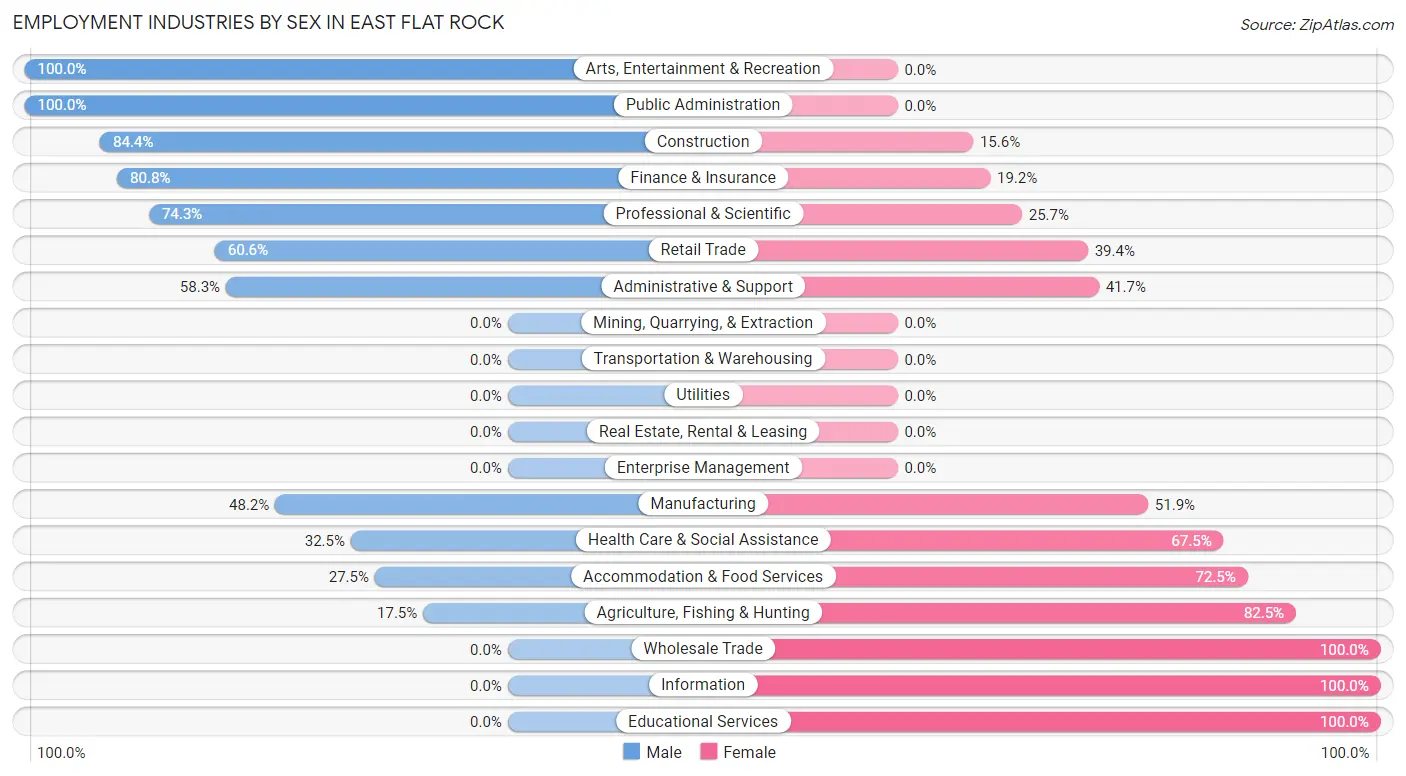
Employment Industries by Sex in East Flat Rock
The East Flat Rock industries that see more men than women are Arts, Entertainment & Recreation (100.0%), Public Administration (100.0%), and Construction (84.4%), whereas the industries that tend to have a higher number of women are Wholesale Trade (100.0%), Information (100.0%), and Educational Services (100.0%).
| Industry | Male | Female |
| Agriculture, Fishing & Hunting | 24 (17.5%) | 113 (82.5%) |
| Mining, Quarrying, & Extraction | 0 (0.0%) | 0 (0.0%) |
| Construction | 205 (84.4%) | 38 (15.6%) |
| Manufacturing | 338 (48.1%) | 364 (51.8%) |
| Wholesale Trade | 0 (0.0%) | 25 (100.0%) |
| Retail Trade | 320 (60.6%) | 208 (39.4%) |
| Transportation & Warehousing | 0 (0.0%) | 0 (0.0%) |
| Utilities | 0 (0.0%) | 0 (0.0%) |
| Information | 0 (0.0%) | 26 (100.0%) |
| Finance & Insurance | 97 (80.8%) | 23 (19.2%) |
| Real Estate, Rental & Leasing | 0 (0.0%) | 0 (0.0%) |
| Professional & Scientific | 101 (74.3%) | 35 (25.7%) |
| Enterprise Management | 0 (0.0%) | 0 (0.0%) |
| Administrative & Support | 14 (58.3%) | 10 (41.7%) |
| Educational Services | 0 (0.0%) | 26 (100.0%) |
| Health Care & Social Assistance | 128 (32.5%) | 266 (67.5%) |
| Arts, Entertainment & Recreation | 42 (100.0%) | 0 (0.0%) |
| Accommodation & Food Services | 134 (27.5%) | 353 (72.5%) |
| Public Administration | 13 (100.0%) | 0 (0.0%) |
| Total | 1,478 (47.2%) | 1,652 (52.8%) |
Education in East Flat Rock
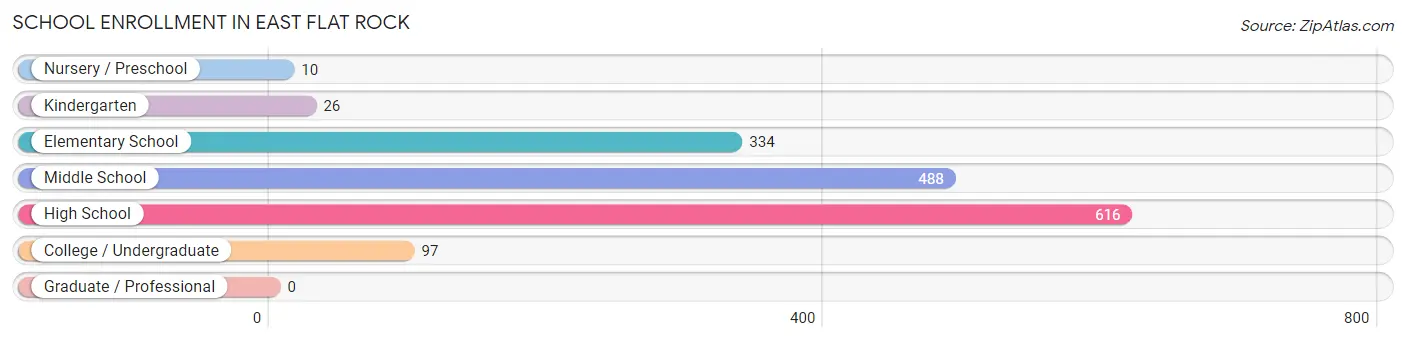
School Enrollment in East Flat Rock
The most common levels of schooling among the 1,571 students in East Flat Rock are high school (616 | 39.2%), middle school (488 | 31.1%), and elementary school (334 | 21.3%).
| School Level | # Students | % Students |
| Nursery / Preschool | 10 | 0.6% |
| Kindergarten | 26 | 1.7% |
| Elementary School | 334 | 21.3% |
| Middle School | 488 | 31.1% |
| High School | 616 | 39.2% |
| College / Undergraduate | 97 | 6.2% |
| Graduate / Professional | 0 | 0.0% |
| Total | 1,571 | 100.0% |
School Enrollment by Age by Funding Source in East Flat Rock
Out of a total of 1,571 students who are enrolled in schools in East Flat Rock, 162 (10.3%) attend a private institution, while the remaining 1,409 (89.7%) are enrolled in public schools. The age group of 3 to 4 year olds has the highest likelihood of being enrolled in private schools, with 10 (100.0% in the age bracket) enrolled. Conversely, the age group of 18 to 19 year olds has the lowest likelihood of being enrolled in a private school, with 96 (100.0% in the age bracket) attending a public institution.
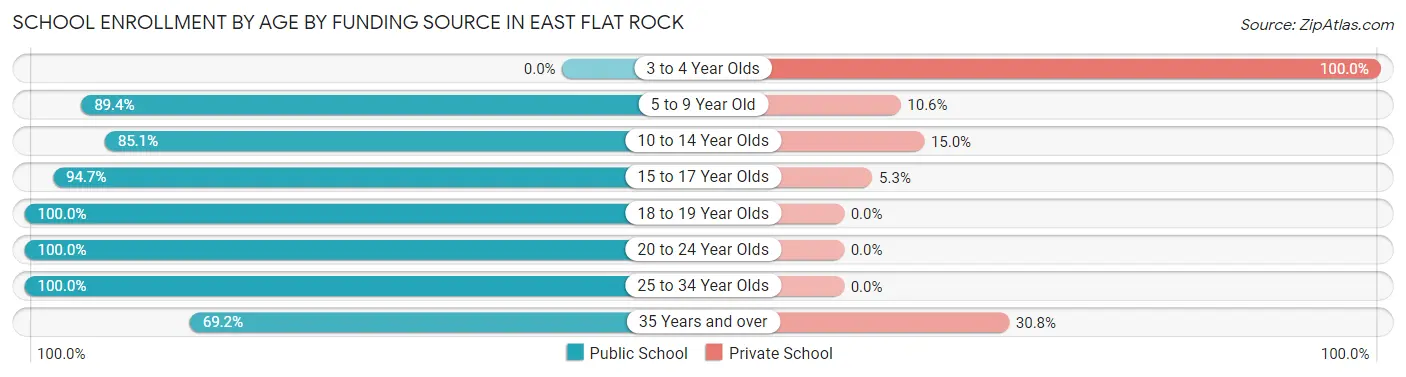
| Age Bracket | Public School | Private School |
| 3 to 4 Year Olds | 0 (0.0%) | 10 (100.0%) |
| 5 to 9 Year Old | 322 (89.4%) | 38 (10.6%) |
| 10 to 14 Year Olds | 529 (85.1%) | 93 (14.9%) |
| 15 to 17 Year Olds | 303 (94.7%) | 17 (5.3%) |
| 18 to 19 Year Olds | 96 (100.0%) | 0 (0.0%) |
| 20 to 24 Year Olds | 89 (100.0%) | 0 (0.0%) |
| 25 to 34 Year Olds | 61 (100.0%) | 0 (0.0%) |
| 35 Years and over | 9 (69.2%) | 4 (30.8%) |
| Total | 1,409 (89.7%) | 162 (10.3%) |
Educational Attainment by Field of Study in East Flat Rock
Education (162 | 25.5%), business (140 | 22.1%), science & technology (84 | 13.2%), communications (57 | 9.0%), and arts & humanities (46 | 7.2%) are the most common fields of study among 635 individuals in East Flat Rock who have obtained a bachelor's degree or higher.
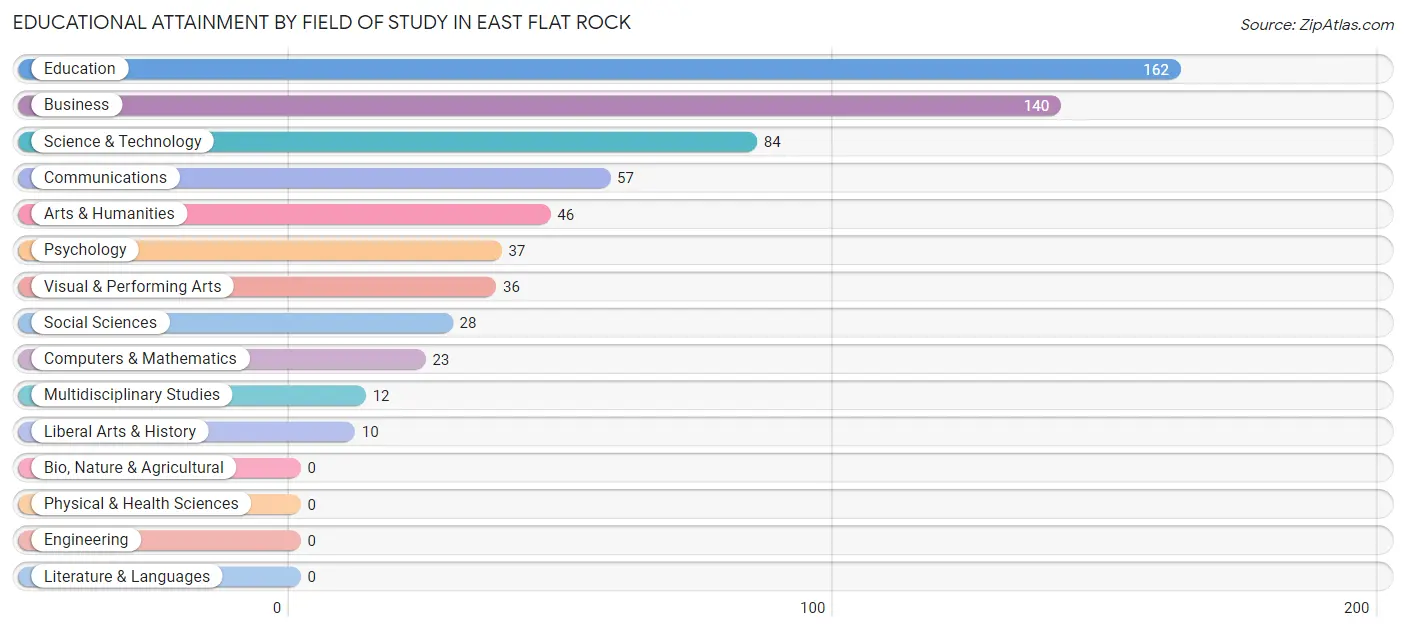
| Field of Study | # Graduates | % Graduates |
| Computers & Mathematics | 23 | 3.6% |
| Bio, Nature & Agricultural | 0 | 0.0% |
| Physical & Health Sciences | 0 | 0.0% |
| Psychology | 37 | 5.8% |
| Social Sciences | 28 | 4.4% |
| Engineering | 0 | 0.0% |
| Multidisciplinary Studies | 12 | 1.9% |
| Science & Technology | 84 | 13.2% |
| Business | 140 | 22.1% |
| Education | 162 | 25.5% |
| Literature & Languages | 0 | 0.0% |
| Liberal Arts & History | 10 | 1.6% |
| Visual & Performing Arts | 36 | 5.7% |
| Communications | 57 | 9.0% |
| Arts & Humanities | 46 | 7.2% |
| Total | 635 | 100.0% |
Transportation & Commute in East Flat Rock
Vehicle Availability by Sex in East Flat Rock
The most prevalent vehicle ownership categories in East Flat Rock are males with 2 vehicles (490, accounting for 34.2%) and females with 2 vehicles (716, making up 30.7%).
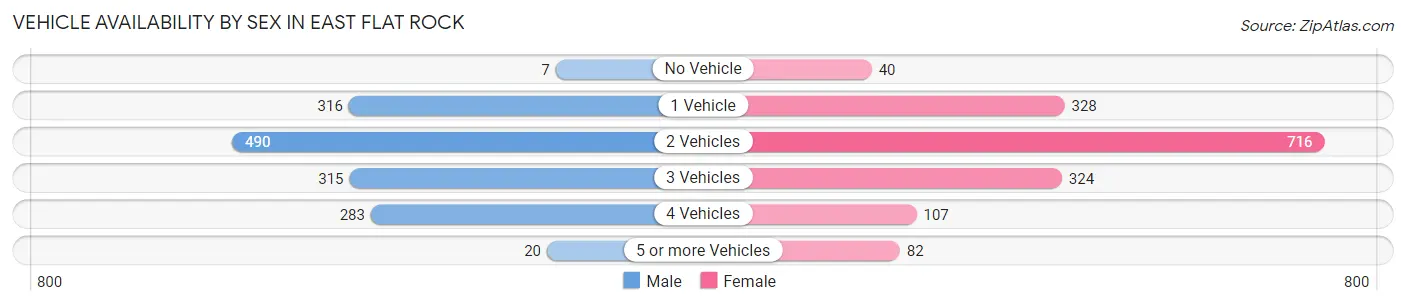
| Vehicles Available | Male | Female |
| No Vehicle | 7 (0.5%) | 40 (2.5%) |
| 1 Vehicle | 316 (22.1%) | 328 (20.5%) |
| 2 Vehicles | 490 (34.2%) | 716 (44.8%) |
| 3 Vehicles | 315 (22.0%) | 324 (20.3%) |
| 4 Vehicles | 283 (19.8%) | 107 (6.7%) |
| 5 or more Vehicles | 20 (1.4%) | 82 (5.1%) |
| Total | 1,431 (100.0%) | 1,597 (100.0%) |
Commute Time in East Flat Rock
The most frequently occuring commute durations in East Flat Rock are 5 to 9 minutes (1,103 commuters, 36.5%), 20 to 24 minutes (535 commuters, 17.7%), and 10 to 14 minutes (383 commuters, 12.7%).
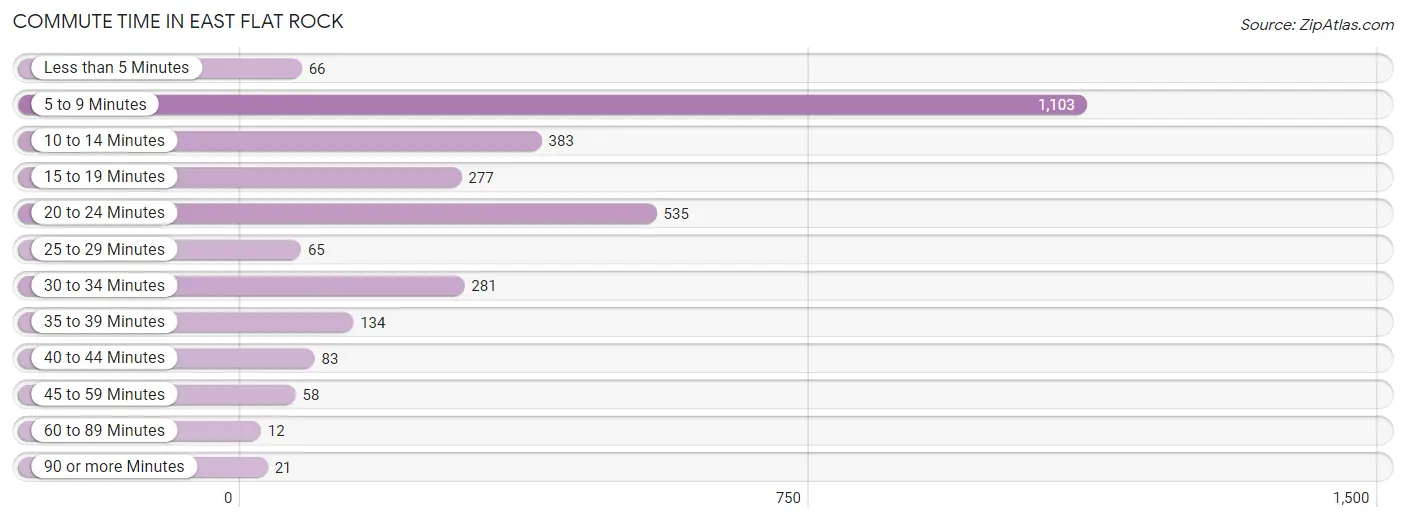
| Commute Time | # Commuters | % Commuters |
| Less than 5 Minutes | 66 | 2.2% |
| 5 to 9 Minutes | 1,103 | 36.5% |
| 10 to 14 Minutes | 383 | 12.7% |
| 15 to 19 Minutes | 277 | 9.2% |
| 20 to 24 Minutes | 535 | 17.7% |
| 25 to 29 Minutes | 65 | 2.1% |
| 30 to 34 Minutes | 281 | 9.3% |
| 35 to 39 Minutes | 134 | 4.4% |
| 40 to 44 Minutes | 83 | 2.8% |
| 45 to 59 Minutes | 58 | 1.9% |
| 60 to 89 Minutes | 12 | 0.4% |
| 90 or more Minutes | 21 | 0.7% |
Commute Time by Sex in East Flat Rock
The most common commute times in East Flat Rock are 5 to 9 minutes (545 commuters, 38.2%) for males and 5 to 9 minutes (558 commuters, 35.0%) for females.
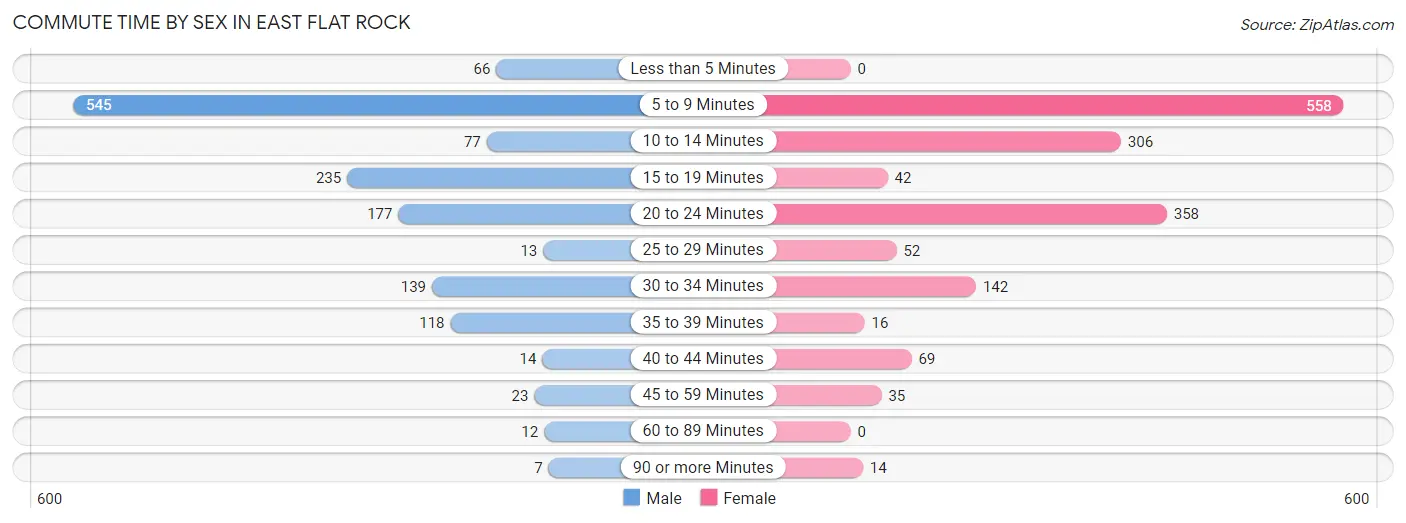
| Commute Time | Male | Female |
| Less than 5 Minutes | 66 (4.6%) | 0 (0.0%) |
| 5 to 9 Minutes | 545 (38.2%) | 558 (35.0%) |
| 10 to 14 Minutes | 77 (5.4%) | 306 (19.2%) |
| 15 to 19 Minutes | 235 (16.5%) | 42 (2.6%) |
| 20 to 24 Minutes | 177 (12.4%) | 358 (22.5%) |
| 25 to 29 Minutes | 13 (0.9%) | 52 (3.3%) |
| 30 to 34 Minutes | 139 (9.8%) | 142 (8.9%) |
| 35 to 39 Minutes | 118 (8.3%) | 16 (1.0%) |
| 40 to 44 Minutes | 14 (1.0%) | 69 (4.3%) |
| 45 to 59 Minutes | 23 (1.6%) | 35 (2.2%) |
| 60 to 89 Minutes | 12 (0.8%) | 0 (0.0%) |
| 90 or more Minutes | 7 (0.5%) | 14 (0.9%) |
Time of Departure to Work by Sex in East Flat Rock
The most frequent times of departure to work in East Flat Rock are 6:30 AM to 6:59 AM (367, 25.7%) for males and 7:00 AM to 7:29 AM (447, 28.1%) for females.
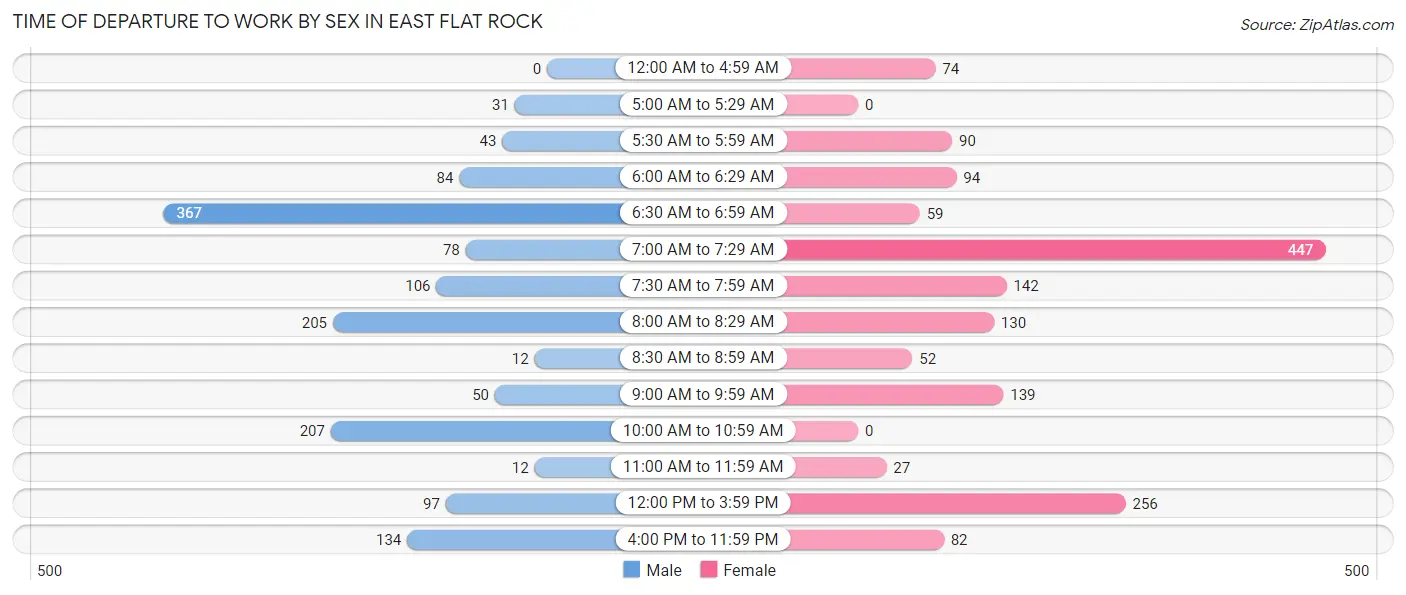
| Time of Departure | Male | Female |
| 12:00 AM to 4:59 AM | 0 (0.0%) | 74 (4.6%) |
| 5:00 AM to 5:29 AM | 31 (2.2%) | 0 (0.0%) |
| 5:30 AM to 5:59 AM | 43 (3.0%) | 90 (5.7%) |
| 6:00 AM to 6:29 AM | 84 (5.9%) | 94 (5.9%) |
| 6:30 AM to 6:59 AM | 367 (25.7%) | 59 (3.7%) |
| 7:00 AM to 7:29 AM | 78 (5.5%) | 447 (28.1%) |
| 7:30 AM to 7:59 AM | 106 (7.4%) | 142 (8.9%) |
| 8:00 AM to 8:29 AM | 205 (14.4%) | 130 (8.2%) |
| 8:30 AM to 8:59 AM | 12 (0.8%) | 52 (3.3%) |
| 9:00 AM to 9:59 AM | 50 (3.5%) | 139 (8.7%) |
| 10:00 AM to 10:59 AM | 207 (14.5%) | 0 (0.0%) |
| 11:00 AM to 11:59 AM | 12 (0.8%) | 27 (1.7%) |
| 12:00 PM to 3:59 PM | 97 (6.8%) | 256 (16.1%) |
| 4:00 PM to 11:59 PM | 134 (9.4%) | 82 (5.1%) |
| Total | 1,426 (100.0%) | 1,592 (100.0%) |
Housing Occupancy in East Flat Rock
Occupancy by Ownership in East Flat Rock
Of the total 2,060 dwellings in East Flat Rock, owner-occupied units account for 1,238 (60.1%), while renter-occupied units make up 822 (39.9%).
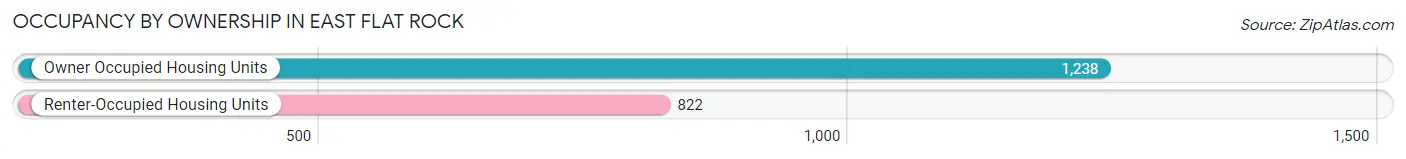
| Occupancy | # Housing Units | % Housing Units |
| Owner Occupied Housing Units | 1,238 | 60.1% |
| Renter-Occupied Housing Units | 822 | 39.9% |
| Total Occupied Housing Units | 2,060 | 100.0% |
Occupancy by Household Size in East Flat Rock
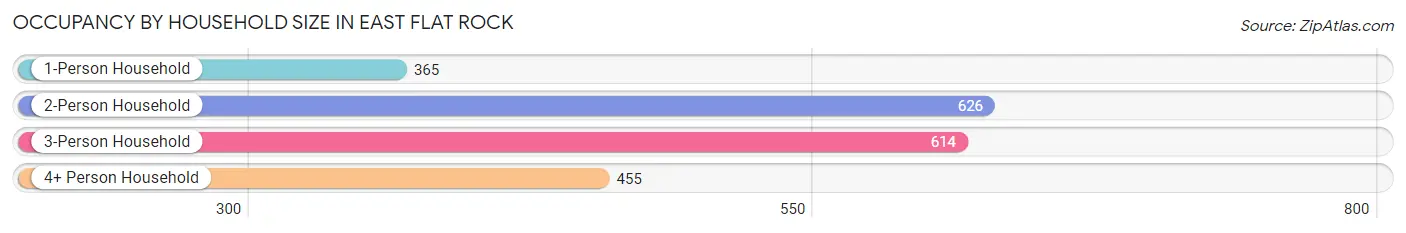
| Household Size | # Housing Units | % Housing Units |
| 1-Person Household | 365 | 17.7% |
| 2-Person Household | 626 | 30.4% |
| 3-Person Household | 614 | 29.8% |
| 4+ Person Household | 455 | 22.1% |
| Total Housing Units | 2,060 | 100.0% |
Occupancy by Ownership by Household Size in East Flat Rock
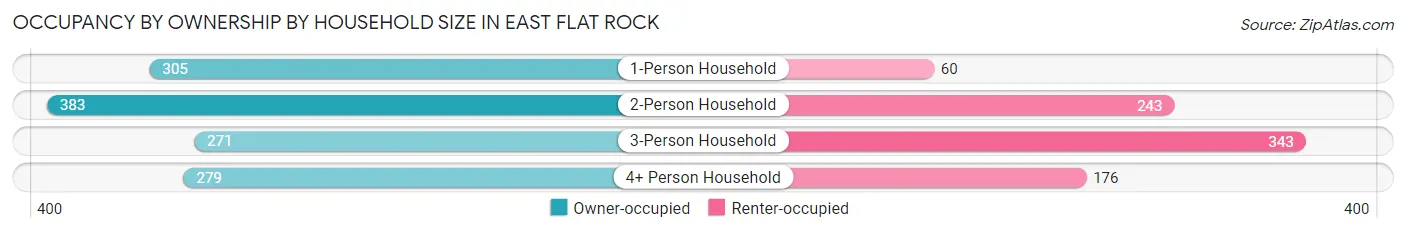
| Household Size | Owner-occupied | Renter-occupied |
| 1-Person Household | 305 (83.6%) | 60 (16.4%) |
| 2-Person Household | 383 (61.2%) | 243 (38.8%) |
| 3-Person Household | 271 (44.1%) | 343 (55.9%) |
| 4+ Person Household | 279 (61.3%) | 176 (38.7%) |
| Total Housing Units | 1,238 (60.1%) | 822 (39.9%) |
Occupancy by Educational Attainment in East Flat Rock
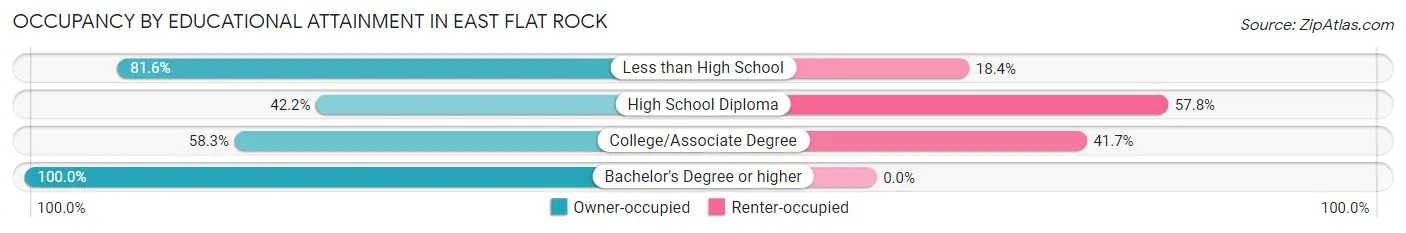
| Household Size | Owner-occupied | Renter-occupied |
| Less than High School | 151 (81.6%) | 34 (18.4%) |
| High School Diploma | 355 (42.2%) | 487 (57.8%) |
| College/Associate Degree | 421 (58.3%) | 301 (41.7%) |
| Bachelor's Degree or higher | 311 (100.0%) | 0 (0.0%) |
Occupancy by Age of Householder in East Flat Rock
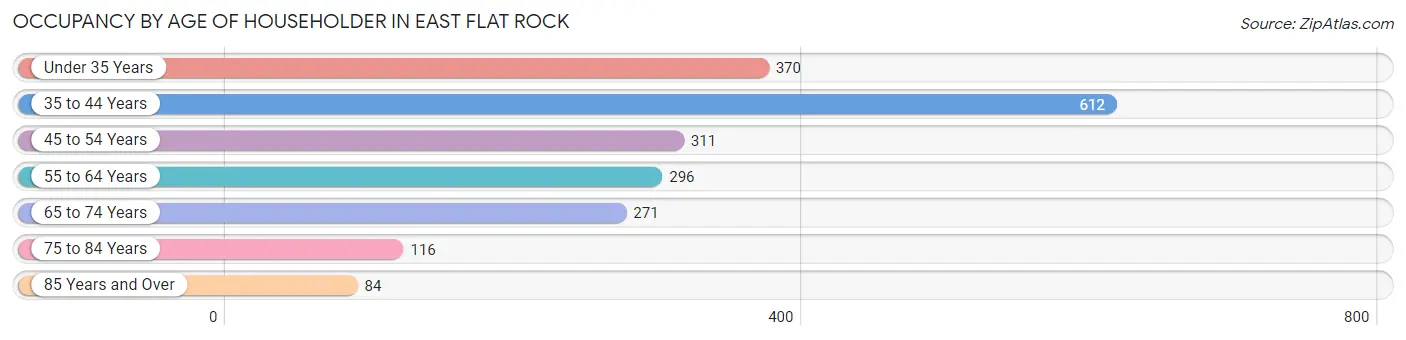
| Age Bracket | # Households | % Households |
| Under 35 Years | 370 | 18.0% |
| 35 to 44 Years | 612 | 29.7% |
| 45 to 54 Years | 311 | 15.1% |
| 55 to 64 Years | 296 | 14.4% |
| 65 to 74 Years | 271 | 13.2% |
| 75 to 84 Years | 116 | 5.6% |
| 85 Years and Over | 84 | 4.1% |
| Total | 2,060 | 100.0% |
Housing Finances in East Flat Rock
Median Income by Occupancy in East Flat Rock
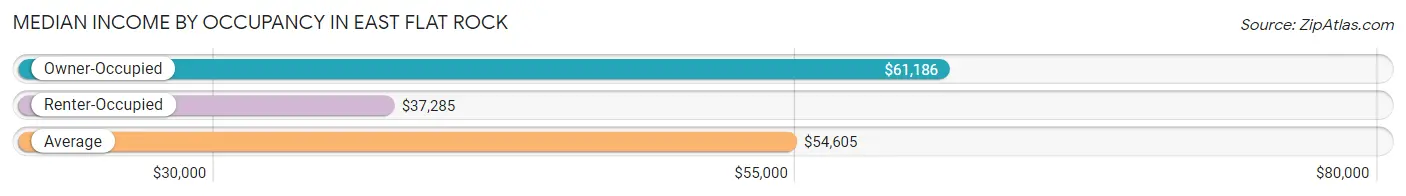
| Occupancy Type | # Households | Median Income |
| Owner-Occupied | 1,238 (60.1%) | $61,186 |
| Renter-Occupied | 822 (39.9%) | $37,285 |
| Average | 2,060 (100.0%) | $54,605 |
Occupancy by Householder Income Bracket in East Flat Rock
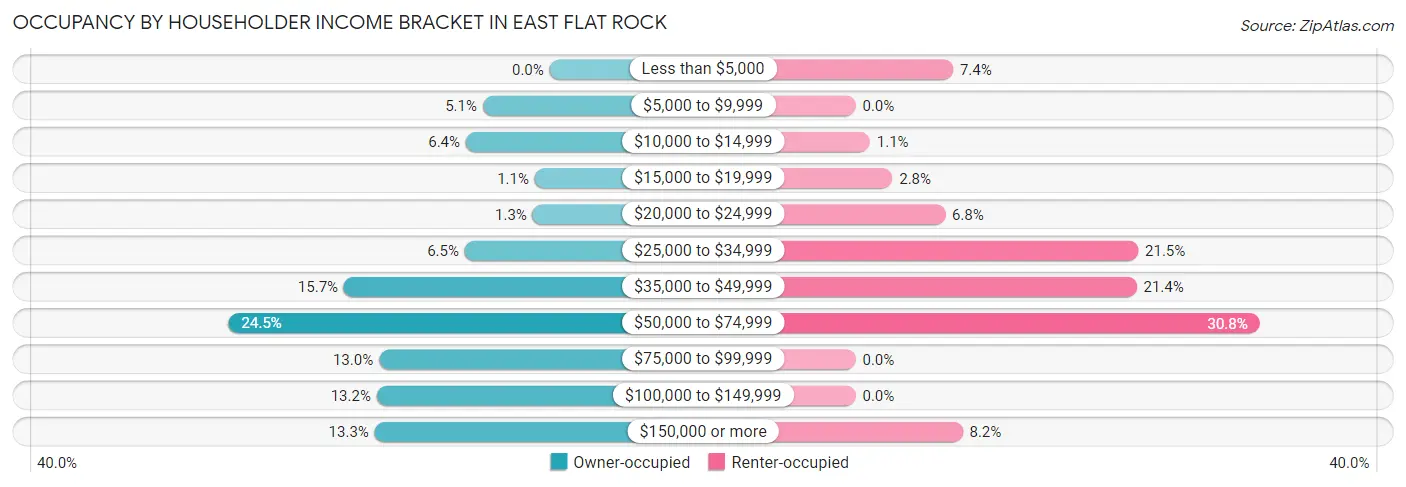
| Income Bracket | Owner-occupied | Renter-occupied |
| Less than $5,000 | 0 (0.0%) | 61 (7.4%) |
| $5,000 to $9,999 | 63 (5.1%) | 0 (0.0%) |
| $10,000 to $14,999 | 79 (6.4%) | 9 (1.1%) |
| $15,000 to $19,999 | 14 (1.1%) | 23 (2.8%) |
| $20,000 to $24,999 | 16 (1.3%) | 56 (6.8%) |
| $25,000 to $34,999 | 80 (6.5%) | 177 (21.5%) |
| $35,000 to $49,999 | 194 (15.7%) | 176 (21.4%) |
| $50,000 to $74,999 | 303 (24.5%) | 253 (30.8%) |
| $75,000 to $99,999 | 161 (13.0%) | 0 (0.0%) |
| $100,000 to $149,999 | 163 (13.2%) | 0 (0.0%) |
| $150,000 or more | 165 (13.3%) | 67 (8.2%) |
| Total | 1,238 (100.0%) | 822 (100.0%) |
Monthly Housing Cost Tiers in East Flat Rock
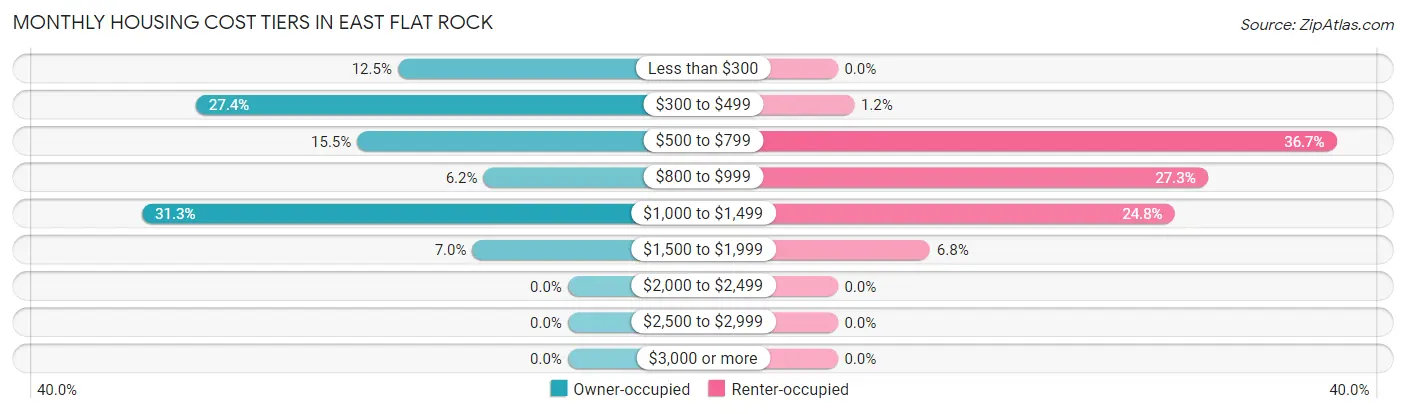
| Monthly Cost | Owner-occupied | Renter-occupied |
| Less than $300 | 155 (12.5%) | 0 (0.0%) |
| $300 to $499 | 339 (27.4%) | 10 (1.2%) |
| $500 to $799 | 192 (15.5%) | 302 (36.7%) |
| $800 to $999 | 77 (6.2%) | 224 (27.3%) |
| $1,000 to $1,499 | 388 (31.3%) | 204 (24.8%) |
| $1,500 to $1,999 | 87 (7.0%) | 56 (6.8%) |
| $2,000 to $2,499 | 0 (0.0%) | 0 (0.0%) |
| $2,500 to $2,999 | 0 (0.0%) | 0 (0.0%) |
| $3,000 or more | 0 (0.0%) | 0 (0.0%) |
| Total | 1,238 (100.0%) | 822 (100.0%) |
Physical Housing Characteristics in East Flat Rock
Housing Structures in East Flat Rock
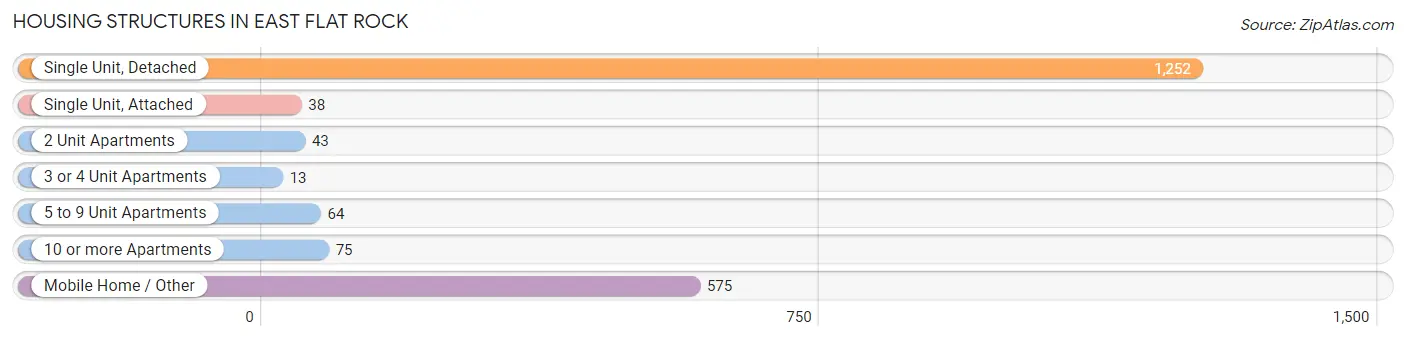
| Structure Type | # Housing Units | % Housing Units |
| Single Unit, Detached | 1,252 | 60.8% |
| Single Unit, Attached | 38 | 1.8% |
| 2 Unit Apartments | 43 | 2.1% |
| 3 or 4 Unit Apartments | 13 | 0.6% |
| 5 to 9 Unit Apartments | 64 | 3.1% |
| 10 or more Apartments | 75 | 3.6% |
| Mobile Home / Other | 575 | 27.9% |
| Total | 2,060 | 100.0% |
Housing Structures by Occupancy in East Flat Rock
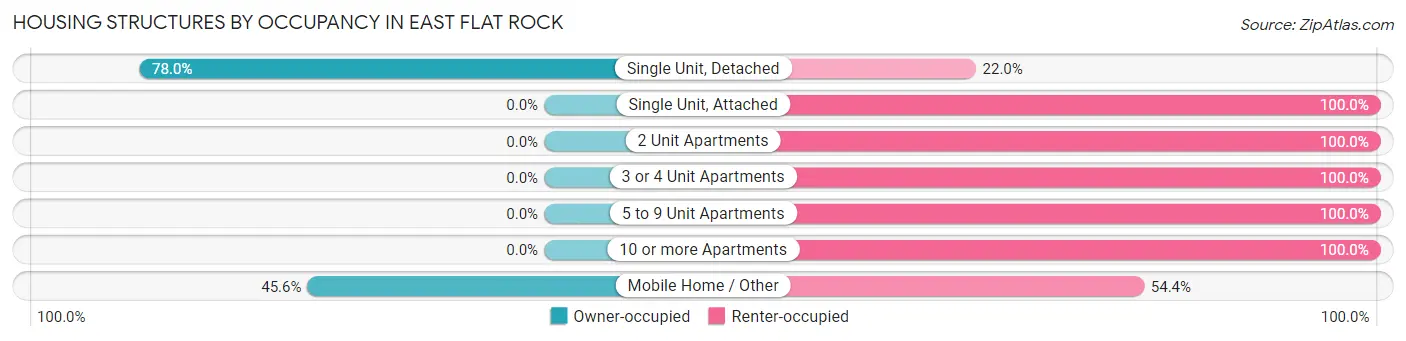
| Structure Type | Owner-occupied | Renter-occupied |
| Single Unit, Detached | 976 (78.0%) | 276 (22.0%) |
| Single Unit, Attached | 0 (0.0%) | 38 (100.0%) |
| 2 Unit Apartments | 0 (0.0%) | 43 (100.0%) |
| 3 or 4 Unit Apartments | 0 (0.0%) | 13 (100.0%) |
| 5 to 9 Unit Apartments | 0 (0.0%) | 64 (100.0%) |
| 10 or more Apartments | 0 (0.0%) | 75 (100.0%) |
| Mobile Home / Other | 262 (45.6%) | 313 (54.4%) |
| Total | 1,238 (60.1%) | 822 (39.9%) |
Housing Structures by Number of Rooms in East Flat Rock
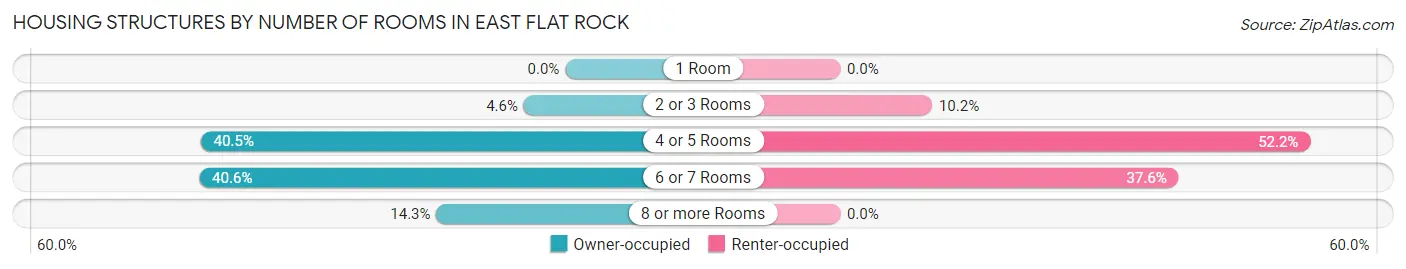
| Number of Rooms | Owner-occupied | Renter-occupied |
| 1 Room | 0 (0.0%) | 0 (0.0%) |
| 2 or 3 Rooms | 57 (4.6%) | 84 (10.2%) |
| 4 or 5 Rooms | 501 (40.5%) | 429 (52.2%) |
| 6 or 7 Rooms | 503 (40.6%) | 309 (37.6%) |
| 8 or more Rooms | 177 (14.3%) | 0 (0.0%) |
| Total | 1,238 (100.0%) | 822 (100.0%) |
Housing Structure by Heating Type in East Flat Rock
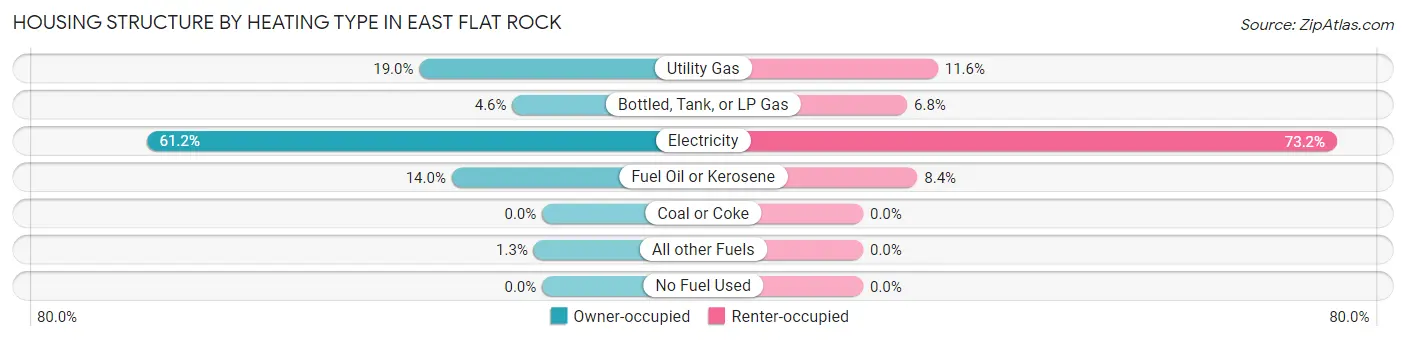
| Heating Type | Owner-occupied | Renter-occupied |
| Utility Gas | 235 (19.0%) | 95 (11.6%) |
| Bottled, Tank, or LP Gas | 57 (4.6%) | 56 (6.8%) |
| Electricity | 757 (61.2%) | 602 (73.2%) |
| Fuel Oil or Kerosene | 173 (14.0%) | 69 (8.4%) |
| Coal or Coke | 0 (0.0%) | 0 (0.0%) |
| All other Fuels | 16 (1.3%) | 0 (0.0%) |
| No Fuel Used | 0 (0.0%) | 0 (0.0%) |
| Total | 1,238 (100.0%) | 822 (100.0%) |
Household Vehicle Usage in East Flat Rock
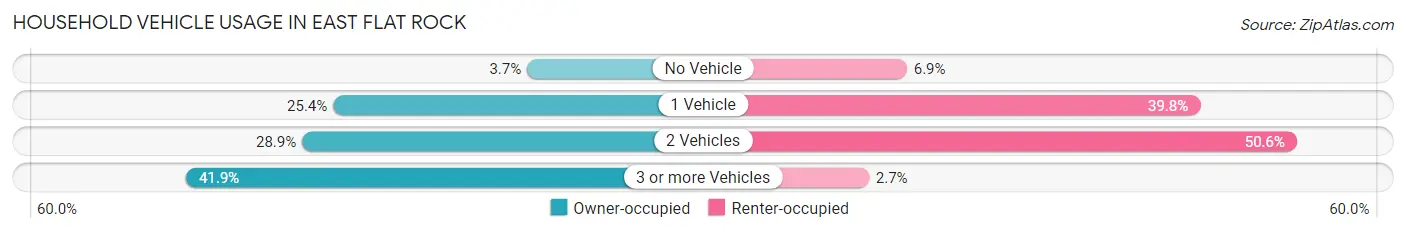
| Vehicles per Household | Owner-occupied | Renter-occupied |
| No Vehicle | 46 (3.7%) | 57 (6.9%) |
| 1 Vehicle | 315 (25.4%) | 327 (39.8%) |
| 2 Vehicles | 358 (28.9%) | 416 (50.6%) |
| 3 or more Vehicles | 519 (41.9%) | 22 (2.7%) |
| Total | 1,238 (100.0%) | 822 (100.0%) |
Real Estate & Mortgages in East Flat Rock
Real Estate and Mortgage Overview in East Flat Rock
| Characteristic | Without Mortgage | With Mortgage |
| Housing Units | 624 | 614 |
| Median Property Value | $203,000 | $191,700 |
| Median Household Income | $57,639 | $45 |
| Monthly Housing Costs | $419 | $0 |
| Real Estate Taxes | $1,052 | $13 |
Property Value by Mortgage Status in East Flat Rock
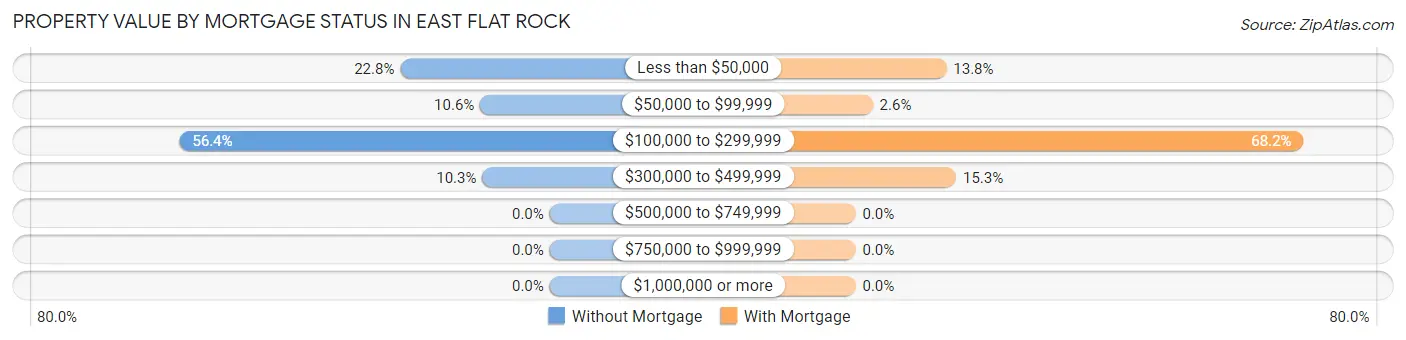
| Property Value | Without Mortgage | With Mortgage |
| Less than $50,000 | 142 (22.8%) | 85 (13.8%) |
| $50,000 to $99,999 | 66 (10.6%) | 16 (2.6%) |
| $100,000 to $299,999 | 352 (56.4%) | 419 (68.2%) |
| $300,000 to $499,999 | 64 (10.3%) | 94 (15.3%) |
| $500,000 to $749,999 | 0 (0.0%) | 0 (0.0%) |
| $750,000 to $999,999 | 0 (0.0%) | 0 (0.0%) |
| $1,000,000 or more | 0 (0.0%) | 0 (0.0%) |
| Total | 624 (100.0%) | 614 (100.0%) |
Household Income by Mortgage Status in East Flat Rock
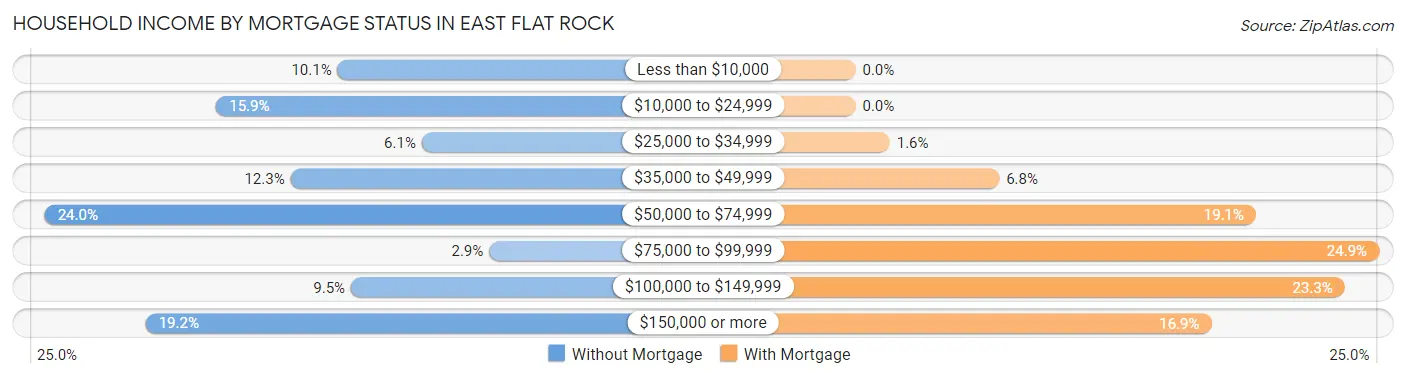
| Household Income | Without Mortgage | With Mortgage |
| Less than $10,000 | 63 (10.1%) | 0 (0.0%) |
| $10,000 to $24,999 | 99 (15.9%) | 0 (0.0%) |
| $25,000 to $34,999 | 38 (6.1%) | 10 (1.6%) |
| $35,000 to $49,999 | 77 (12.3%) | 42 (6.8%) |
| $50,000 to $74,999 | 150 (24.0%) | 117 (19.1%) |
| $75,000 to $99,999 | 18 (2.9%) | 153 (24.9%) |
| $100,000 to $149,999 | 59 (9.5%) | 143 (23.3%) |
| $150,000 or more | 120 (19.2%) | 104 (16.9%) |
| Total | 624 (100.0%) | 614 (100.0%) |
Property Value to Household Income Ratio in East Flat Rock
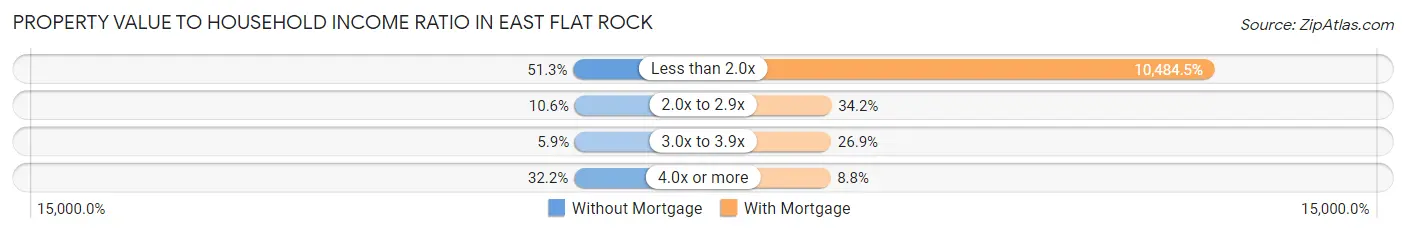
| Value-to-Income Ratio | Without Mortgage | With Mortgage |
| Less than 2.0x | 320 (51.3%) | 64,375 (10,484.5%) |
| 2.0x to 2.9x | 66 (10.6%) | 210 (34.2%) |
| 3.0x to 3.9x | 37 (5.9%) | 165 (26.9%) |
| 4.0x or more | 201 (32.2%) | 54 (8.8%) |
| Total | 624 (100.0%) | 614 (100.0%) |
Real Estate Taxes by Mortgage Status in East Flat Rock
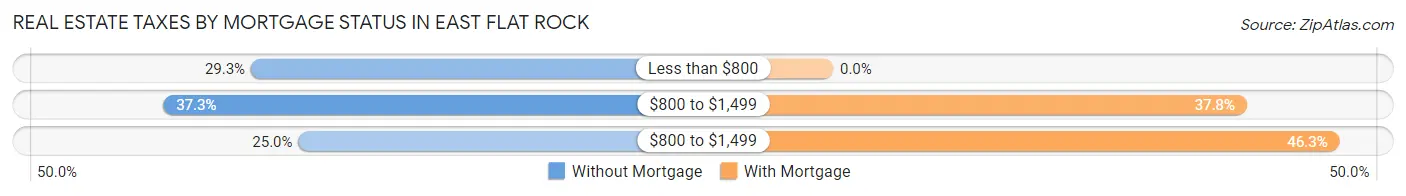
| Property Taxes | Without Mortgage | With Mortgage |
| Less than $800 | 183 (29.3%) | 0 (0.0%) |
| $800 to $1,499 | 233 (37.3%) | 232 (37.8%) |
| $800 to $1,499 | 156 (25.0%) | 284 (46.3%) |
| Total | 624 (100.0%) | 614 (100.0%) |
Health & Disability in East Flat Rock
Health Insurance Coverage by Age in East Flat Rock
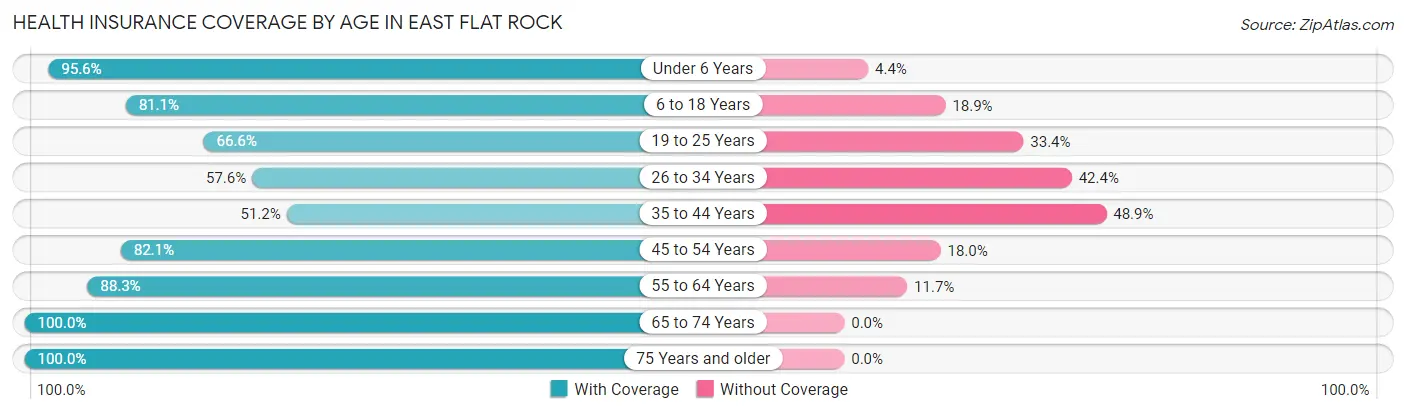
| Age Bracket | With Coverage | Without Coverage |
| Under 6 Years | 215 (95.6%) | 10 (4.4%) |
| 6 to 18 Years | 1,196 (81.1%) | 278 (18.9%) |
| 19 to 25 Years | 371 (66.6%) | 186 (33.4%) |
| 26 to 34 Years | 383 (57.6%) | 282 (42.4%) |
| 35 to 44 Years | 488 (51.1%) | 466 (48.8%) |
| 45 to 54 Years | 544 (82.1%) | 119 (17.9%) |
| 55 to 64 Years | 535 (88.3%) | 71 (11.7%) |
| 65 to 74 Years | 503 (100.0%) | 0 (0.0%) |
| 75 Years and older | 258 (100.0%) | 0 (0.0%) |
| Total | 4,493 (76.1%) | 1,412 (23.9%) |
Health Insurance Coverage by Citizenship Status in East Flat Rock
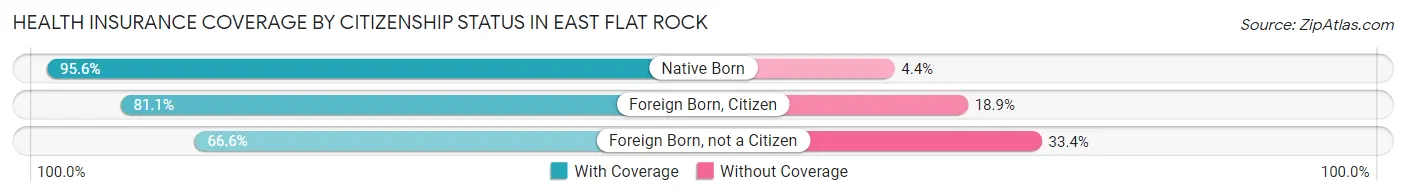
| Citizenship Status | With Coverage | Without Coverage |
| Native Born | 215 (95.6%) | 10 (4.4%) |
| Foreign Born, Citizen | 1,196 (81.1%) | 278 (18.9%) |
| Foreign Born, not a Citizen | 371 (66.6%) | 186 (33.4%) |
Health Insurance Coverage by Household Income in East Flat Rock
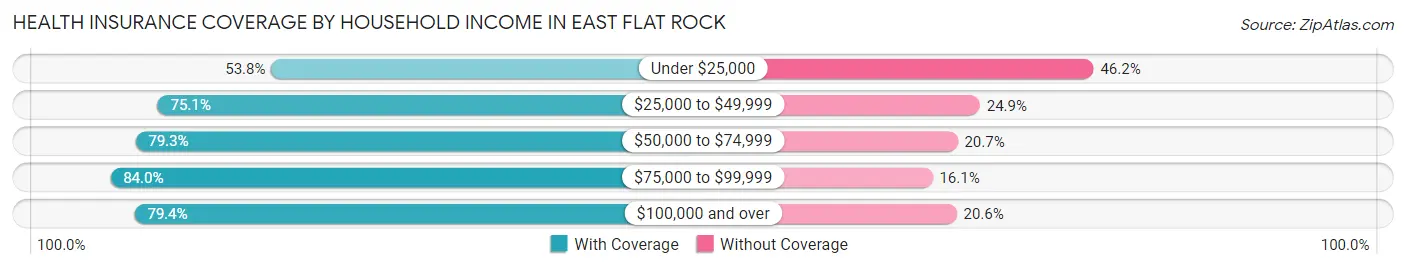
| Household Income | With Coverage | Without Coverage |
| Under $25,000 | 349 (53.8%) | 300 (46.2%) |
| $25,000 to $49,999 | 1,127 (75.1%) | 374 (24.9%) |
| $50,000 to $74,999 | 1,525 (79.3%) | 399 (20.7%) |
| $75,000 to $99,999 | 361 (84.0%) | 69 (16.1%) |
| $100,000 and over | 1,043 (79.4%) | 270 (20.6%) |
Public vs Private Health Insurance Coverage by Age in East Flat Rock
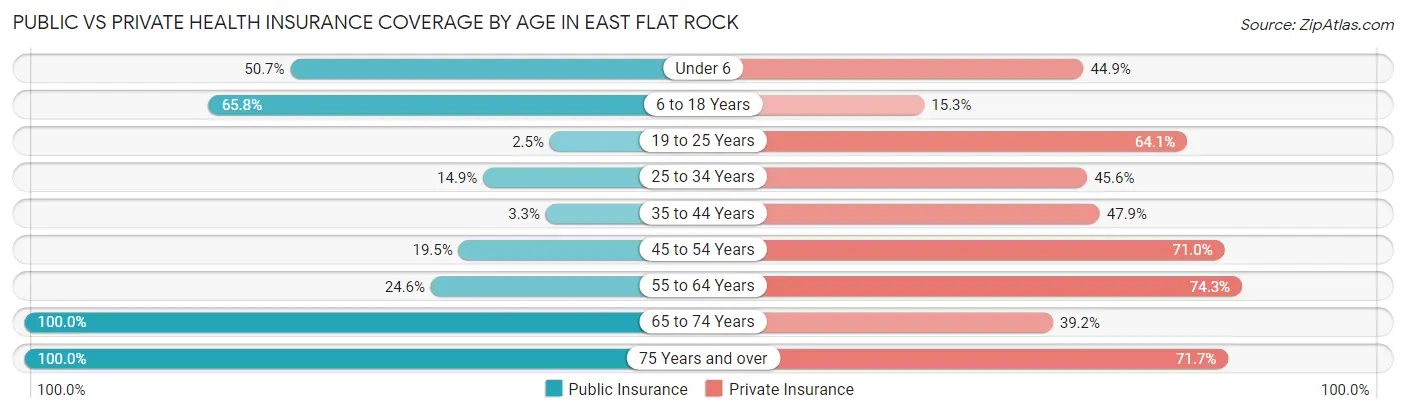
| Age Bracket | Public Insurance | Private Insurance |
| Under 6 | 114 (50.7%) | 101 (44.9%) |
| 6 to 18 Years | 970 (65.8%) | 226 (15.3%) |
| 19 to 25 Years | 14 (2.5%) | 357 (64.1%) |
| 25 to 34 Years | 99 (14.9%) | 303 (45.6%) |
| 35 to 44 Years | 31 (3.3%) | 457 (47.9%) |
| 45 to 54 Years | 129 (19.5%) | 471 (71.0%) |
| 55 to 64 Years | 149 (24.6%) | 450 (74.3%) |
| 65 to 74 Years | 503 (100.0%) | 197 (39.2%) |
| 75 Years and over | 258 (100.0%) | 185 (71.7%) |
| Total | 2,267 (38.4%) | 2,747 (46.5%) |
Disability Status by Sex by Age in East Flat Rock
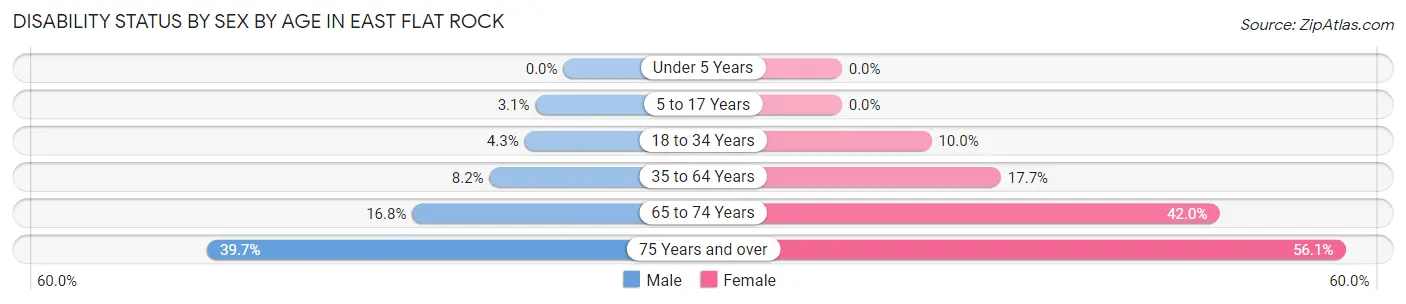
| Age Bracket | Male | Female |
| Under 5 Years | 0 (0.0%) | 0 (0.0%) |
| 5 to 17 Years | 13 (3.1%) | 0 (0.0%) |
| 18 to 34 Years | 30 (4.3%) | 70 (10.0%) |
| 35 to 64 Years | 77 (8.2%) | 228 (17.7%) |
| 65 to 74 Years | 35 (16.8%) | 124 (42.0%) |
| 75 Years and over | 50 (39.7%) | 74 (56.1%) |
Disability Class by Sex by Age in East Flat Rock
Disability Class: Hearing Difficulty
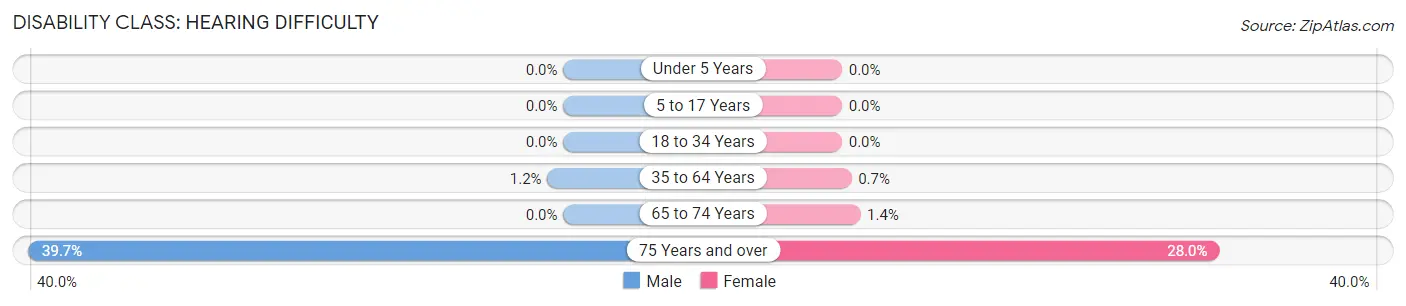
| Age Bracket | Male | Female |
| Under 5 Years | 0 (0.0%) | 0 (0.0%) |
| 5 to 17 Years | 0 (0.0%) | 0 (0.0%) |
| 18 to 34 Years | 0 (0.0%) | 0 (0.0%) |
| 35 to 64 Years | 11 (1.2%) | 9 (0.7%) |
| 65 to 74 Years | 0 (0.0%) | 4 (1.4%) |
| 75 Years and over | 50 (39.7%) | 37 (28.0%) |
Disability Class: Vision Difficulty
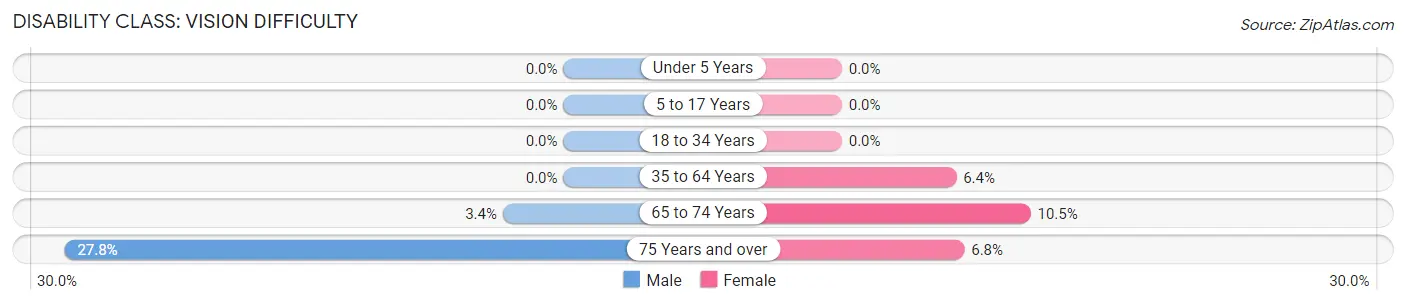
| Age Bracket | Male | Female |
| Under 5 Years | 0 (0.0%) | 0 (0.0%) |
| 5 to 17 Years | 0 (0.0%) | 0 (0.0%) |
| 18 to 34 Years | 0 (0.0%) | 0 (0.0%) |
| 35 to 64 Years | 0 (0.0%) | 82 (6.4%) |
| 65 to 74 Years | 7 (3.4%) | 31 (10.5%) |
| 75 Years and over | 35 (27.8%) | 9 (6.8%) |
Disability Class: Cognitive Difficulty
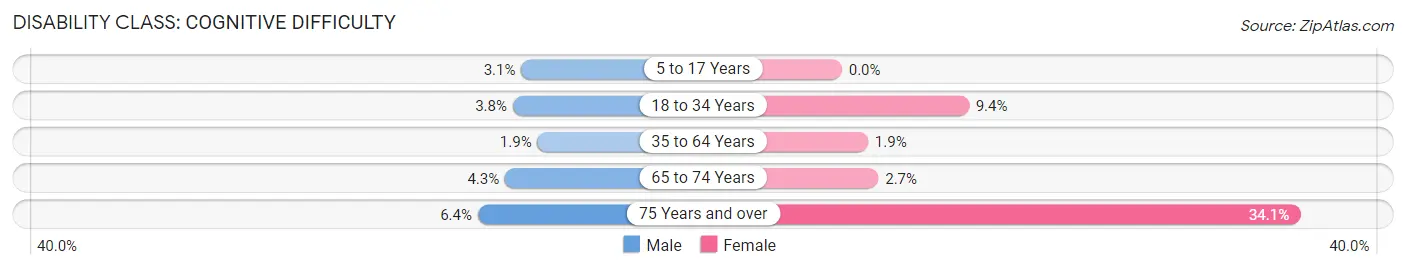
| Age Bracket | Male | Female |
| 5 to 17 Years | 13 (3.1%) | 0 (0.0%) |
| 18 to 34 Years | 26 (3.7%) | 66 (9.4%) |
| 35 to 64 Years | 18 (1.9%) | 25 (1.9%) |
| 65 to 74 Years | 9 (4.3%) | 8 (2.7%) |
| 75 Years and over | 8 (6.4%) | 45 (34.1%) |
Disability Class: Ambulatory Difficulty
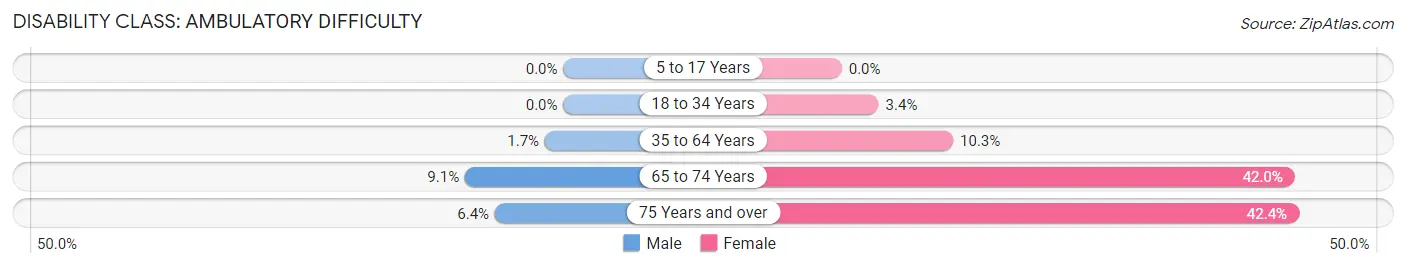
| Age Bracket | Male | Female |
| 5 to 17 Years | 0 (0.0%) | 0 (0.0%) |
| 18 to 34 Years | 0 (0.0%) | 24 (3.4%) |
| 35 to 64 Years | 16 (1.7%) | 133 (10.3%) |
| 65 to 74 Years | 19 (9.1%) | 124 (42.0%) |
| 75 Years and over | 8 (6.4%) | 56 (42.4%) |
Disability Class: Self-Care Difficulty
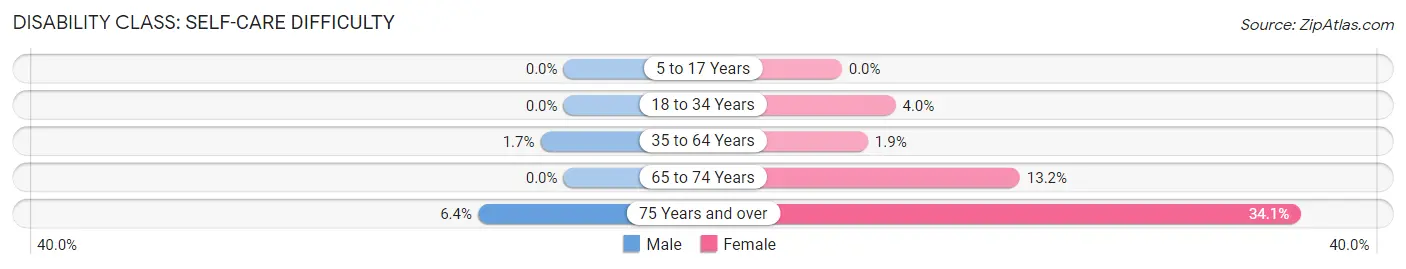
| Age Bracket | Male | Female |
| 5 to 17 Years | 0 (0.0%) | 0 (0.0%) |
| 18 to 34 Years | 0 (0.0%) | 28 (4.0%) |
| 35 to 64 Years | 16 (1.7%) | 25 (1.9%) |
| 65 to 74 Years | 0 (0.0%) | 39 (13.2%) |
| 75 Years and over | 8 (6.4%) | 45 (34.1%) |
Technology Access in East Flat Rock
Computing Device Access in East Flat Rock
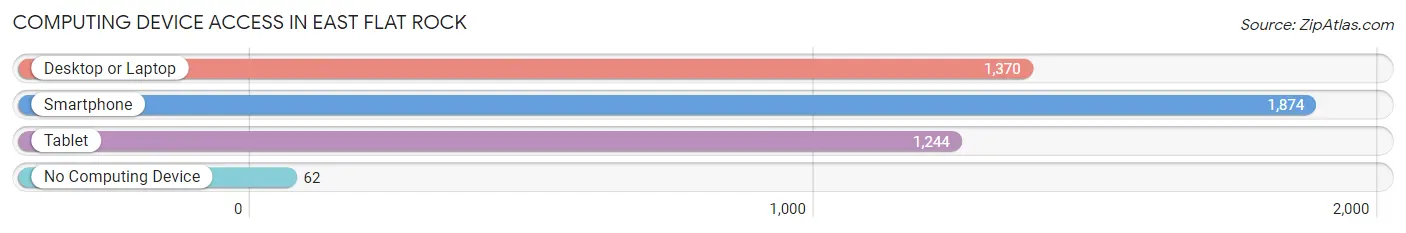
| Device Type | # Households | % Households |
| Desktop or Laptop | 1,370 | 66.5% |
| Smartphone | 1,874 | 91.0% |
| Tablet | 1,244 | 60.4% |
| No Computing Device | 62 | 3.0% |
| Total | 2,060 | 100.0% |
Internet Access in East Flat Rock
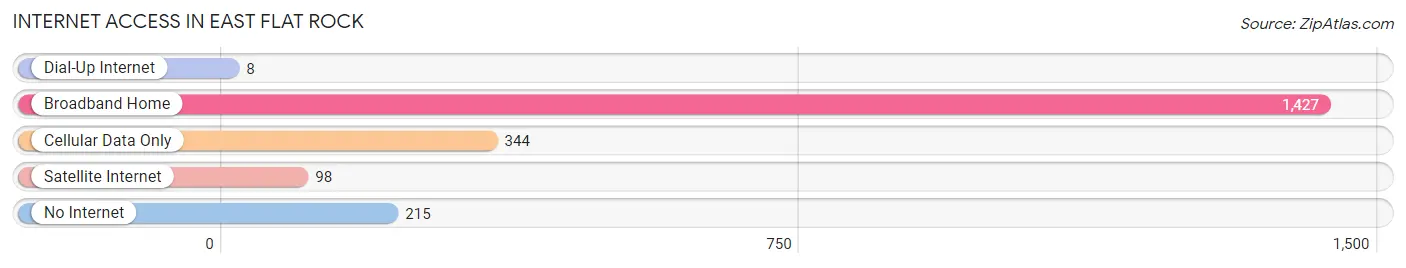
| Internet Type | # Households | % Households |
| Dial-Up Internet | 8 | 0.4% |
| Broadband Home | 1,427 | 69.3% |
| Cellular Data Only | 344 | 16.7% |
| Satellite Internet | 98 | 4.8% |
| No Internet | 215 | 10.4% |
| Total | 2,060 | 100.0% |
East Flat Rock Summary
History
East Flat Rock is a small unincorporated community located in Henderson County, North Carolina. It is situated in the foothills of the Blue Ridge Mountains, approximately 20 miles south of Asheville. The area was first settled in the late 1700s by the families of William and John Edney, who were among the first settlers in the area. The Edney family built a log cabin in the area, which is now known as the Edney Homestead.
The area was originally known as Edneyville, but the name was changed to East Flat Rock in 1891 when the post office was established. The name was chosen to distinguish it from the nearby town of Flat Rock, which was located on the other side of the French Broad River.
East Flat Rock has a rich history of farming and industry. In the late 1800s, the area was home to several grist mills, sawmills, and a cotton gin. The area was also home to several small businesses, including a general store, a blacksmith shop, and a hotel.
In the early 1900s, the area began to experience a period of growth and development. The East Flat Rock Railroad was built in 1906, connecting the town to nearby Hendersonville. This allowed for the transportation of goods and services to and from the area.
The area continued to grow and develop throughout the 20th century. In the 1950s, the East Flat Rock Elementary School was built, and in the 1960s, the East Flat Rock High School was built. The area also saw the construction of several churches, including the East Flat Rock Baptist Church, which was established in 1891.
Today, East Flat Rock is a small, rural community with a population of approximately 1,500 people. The area is home to several small businesses, including a grocery store, a hardware store, and a few restaurants. The area is also home to several churches, including the East Flat Rock Baptist Church, which is still active today.
Geography
East Flat Rock is located in Henderson County, North Carolina, in the foothills of the Blue Ridge Mountains. The area is situated along the French Broad River, approximately 20 miles south of Asheville. The area is characterized by rolling hills and valleys, with the highest point in the area being the summit of East Flat Rock Mountain, which is located at an elevation of 2,845 feet.
The climate in East Flat Rock is generally mild, with temperatures ranging from the mid-30s in the winter to the mid-80s in the summer. The area receives an average of 45 inches of precipitation per year, with most of it falling in the form of rain.
Economy
East Flat Rock is a small, rural community with a population of approximately 1,500 people. The area is home to several small businesses, including a grocery store, a hardware store, and a few restaurants. The area is also home to several churches, including the East Flat Rock Baptist Church, which is still active today.
The economy of East Flat Rock is largely based on agriculture. The area is home to several farms, which produce a variety of crops, including corn, soybeans, wheat, and hay. The area is also home to several nurseries, which produce a variety of plants and flowers.
In addition to agriculture, the area is home to several small businesses, including a few restaurants, a hardware store, and a grocery store. The area is also home to several churches, including the East Flat Rock Baptist Church, which is still active today.
Demographics
As of the 2010 census, the population of East Flat Rock was 1,521. The racial makeup of the area was 97.3% White, 0.7% African American, 0.3% Native American, 0.2% Asian, 0.1% Pacific Islander, 0.7% from other races, and 0.9% from two or more races. Hispanic or Latino of any race were 1.7% of the population.
The median household income in East Flat Rock was $37,917, and the median family income was $45,938. The per capita income for the area was $19,845. About 11.3% of families and 14.2% of the population were below the poverty line, including 19.2% of those under age 18 and 8.3% of those age 65 or over.
Common Questions
What is Per Capita Income in East Flat Rock?
Per Capita income in East Flat Rock is $26,292.
What is the Median Family Income in East Flat Rock?
Median Family Income in East Flat Rock is $62,529.
What is the Median Household income in East Flat Rock?
Median Household Income in East Flat Rock is $54,605.
What is Income or Wage Gap in East Flat Rock?
Income or Wage Gap in East Flat Rock is 11.6%.
Women in East Flat Rock earn 88.4 cents for every dollar earned by a man.
What is Inequality or Gini Index in East Flat Rock?
Inequality or Gini Index in East Flat Rock is 0.43.
What is the Total Population of East Flat Rock?
Total Population of East Flat Rock is 5,934.
What is the Total Male Population of East Flat Rock?
Total Male Population of East Flat Rock is 2,488.
What is the Total Female Population of East Flat Rock?
Total Female Population of East Flat Rock is 3,446.
What is the Ratio of Males per 100 Females in East Flat Rock?
There are 72.20 Males per 100 Females in East Flat Rock.
What is the Ratio of Females per 100 Males in East Flat Rock?
There are 138.50 Females per 100 Males in East Flat Rock.
What is the Median Population Age in East Flat Rock?
Median Population Age in East Flat Rock is 35.2 Years.
What is the Average Family Size in East Flat Rock
Average Family Size in East Flat Rock is 3.2 People.
What is the Average Household Size in East Flat Rock
Average Household Size in East Flat Rock is 2.8 People.
How Large is the Labor Force in East Flat Rock?
There are 3,268 People in the Labor Forcein in East Flat Rock.
What is the Percentage of People in the Labor Force in East Flat Rock?
70.0% of People are in the Labor Force in East Flat Rock.
What is the Unemployment Rate in East Flat Rock?
Unemployment Rate in East Flat Rock is 4.2%.