Durham, NH Map & Demographics
Durham Map
Durham Overview
$22,065
PER CAPITA INCOME
$155,948
AVG FAMILY INCOME
$93,542
AVG HOUSEHOLD INCOME
10.7%
WAGE / INCOME GAP [ % ]
89.3¢/ $1
WAGE / INCOME GAP [ $ ]
0.48
INEQUALITY / GINI INDEX
10,789
TOTAL POPULATION
4,910
MALE POPULATION
5,879
FEMALE POPULATION
83.52
MALES / 100 FEMALES
119.74
FEMALES / 100 MALES
20.0
MEDIAN AGE
3.0
AVG FAMILY SIZE
2.5
AVG HOUSEHOLD SIZE
5,482
LABOR FORCE [ PEOPLE ]
53.7%
PERCENT IN LABOR FORCE
3.9%
UNEMPLOYMENT RATE
Durham Zip Codes
Durham Area Codes
Income in Durham
Income Overview in Durham
Per Capita Income in Durham is $22,065, while median incomes of families and households are $155,948 and $93,542 respectively.
| Characteristic | Number | Measure |
| Per Capita Income | 10,789 | $22,065 |
| Median Family Income | 780 | $155,948 |
| Mean Family Income | 780 | $173,372 |
| Median Household Income | 1,428 | $93,542 |
| Mean Household Income | 1,428 | $124,918 |
| Income Deficit | 780 | $0 |
| Wage / Income Gap (%) | 10,789 | 10.72% |
| Wage / Income Gap ($) | 10,789 | 89.28¢ per $1 |
| Gini / Inequality Index | 10,789 | 0.48 |
Earnings by Sex in Durham
Average Earnings in Durham are $6,614, $6,970 for men and $6,223 for women, a difference of 10.7%.
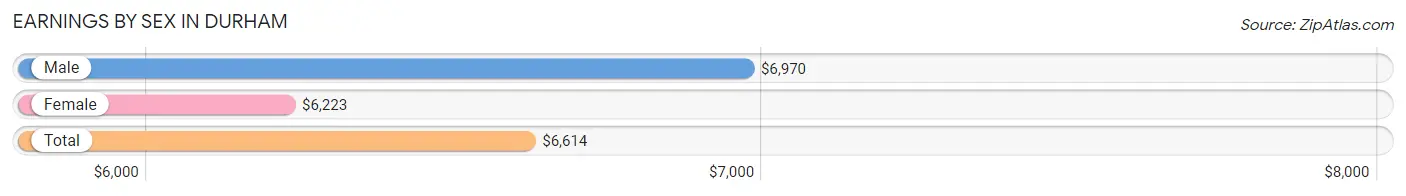
| Sex | Number | Average Earnings |
| Male | 3,833 (45.7%) | $6,970 |
| Female | 4,559 (54.3%) | $6,223 |
| Total | 8,392 (100.0%) | $6,614 |
Earnings by Sex by Income Bracket in Durham
The most common earnings brackets in Durham are $5,000 to $7,499 for men (851 | 22.2%) and $2,500 to $4,999 for women (996 | 21.8%).
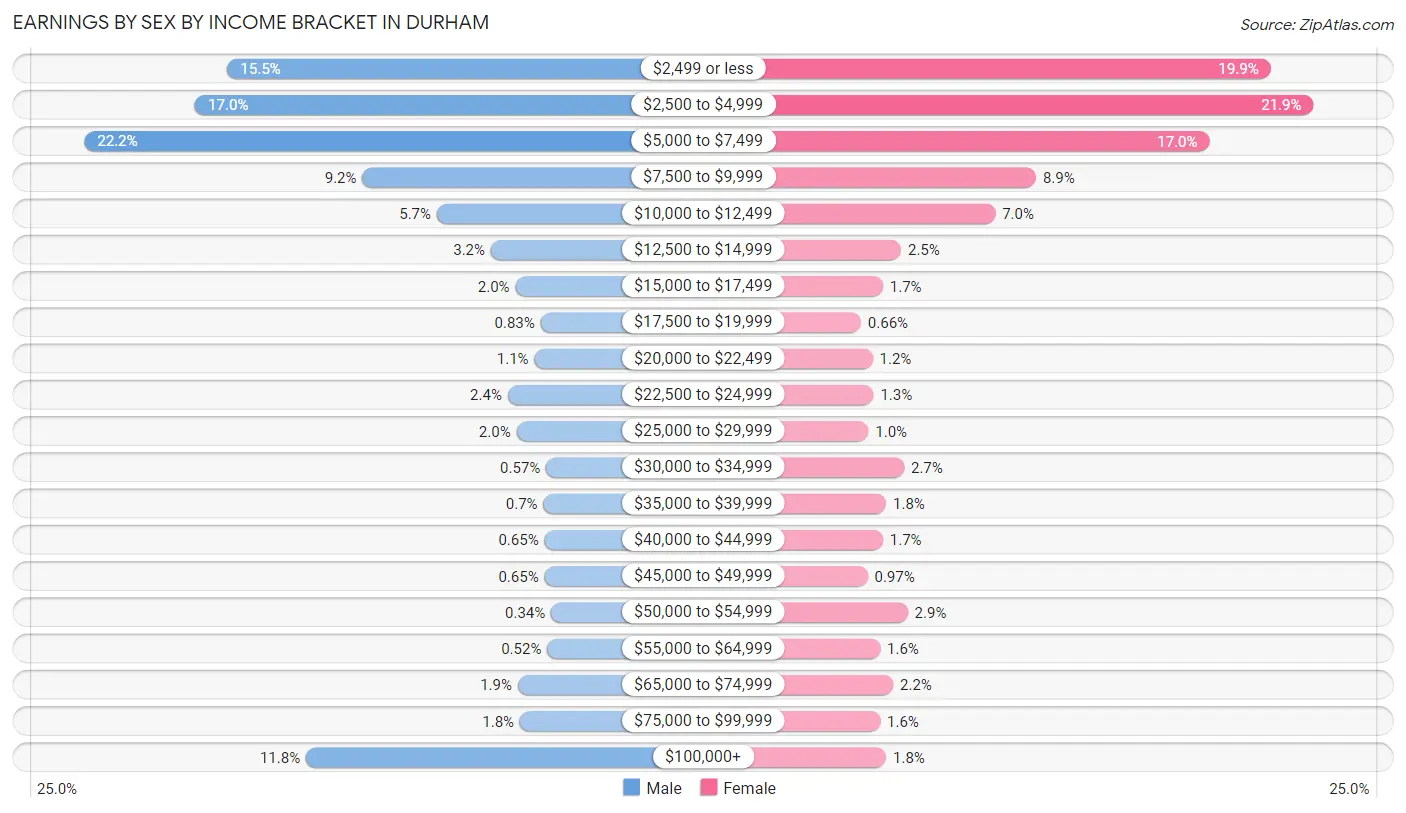
| Income | Male | Female |
| $2,499 or less | 594 (15.5%) | 905 (19.9%) |
| $2,500 to $4,999 | 652 (17.0%) | 996 (21.8%) |
| $5,000 to $7,499 | 851 (22.2%) | 774 (17.0%) |
| $7,500 to $9,999 | 352 (9.2%) | 404 (8.9%) |
| $10,000 to $12,499 | 218 (5.7%) | 317 (7.0%) |
| $12,500 to $14,999 | 121 (3.2%) | 116 (2.5%) |
| $15,000 to $17,499 | 77 (2.0%) | 77 (1.7%) |
| $17,500 to $19,999 | 32 (0.8%) | 30 (0.7%) |
| $20,000 to $22,499 | 43 (1.1%) | 55 (1.2%) |
| $22,500 to $24,999 | 91 (2.4%) | 57 (1.3%) |
| $25,000 to $29,999 | 75 (2.0%) | 46 (1.0%) |
| $30,000 to $34,999 | 22 (0.6%) | 122 (2.7%) |
| $35,000 to $39,999 | 27 (0.7%) | 84 (1.8%) |
| $40,000 to $44,999 | 25 (0.6%) | 77 (1.7%) |
| $45,000 to $49,999 | 25 (0.6%) | 44 (1.0%) |
| $50,000 to $54,999 | 13 (0.3%) | 130 (2.9%) |
| $55,000 to $64,999 | 20 (0.5%) | 71 (1.6%) |
| $65,000 to $74,999 | 73 (1.9%) | 99 (2.2%) |
| $75,000 to $99,999 | 69 (1.8%) | 71 (1.6%) |
| $100,000+ | 453 (11.8%) | 84 (1.8%) |
| Total | 3,833 (100.0%) | 4,559 (100.0%) |
Earnings by Sex by Educational Attainment in Durham
Average earnings in Durham are $110,817 for men and $50,926 for women, a difference of 54.0%. Men with an educational attainment of bachelor's degree enjoy the highest average annual earnings of $138,796, while those with high school diploma education earn the least with $46,635. Women with an educational attainment of graduate degree earn the most with the average annual earnings of $56,591, while those with college or associate's degree education have the smallest earnings of $37,931.
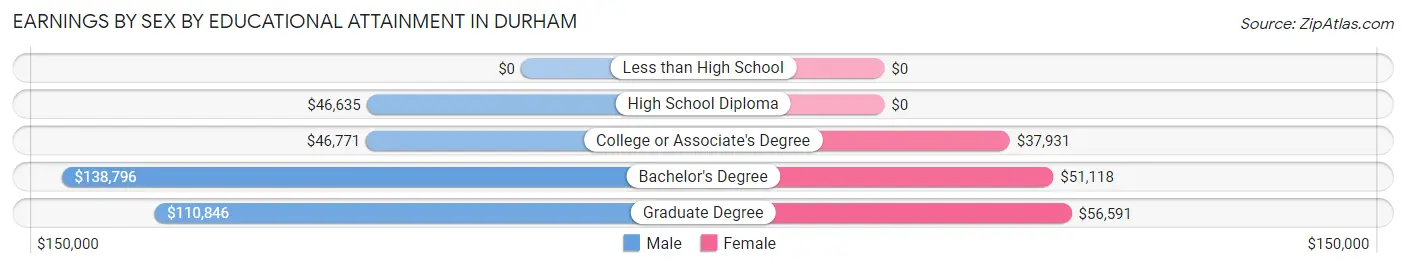
| Educational Attainment | Male Income | Female Income |
| Less than High School | - | - |
| High School Diploma | $46,635 | $0 |
| College or Associate's Degree | $46,771 | $37,931 |
| Bachelor's Degree | $138,796 | $51,118 |
| Graduate Degree | $110,846 | $56,591 |
| Total | $110,817 | $50,926 |
Family Income in Durham
Family Income Brackets in Durham
According to the Durham family income data, there are 254 families falling into the $200,000+ income range, which is the most common income bracket and makes up 32.6% of all families.
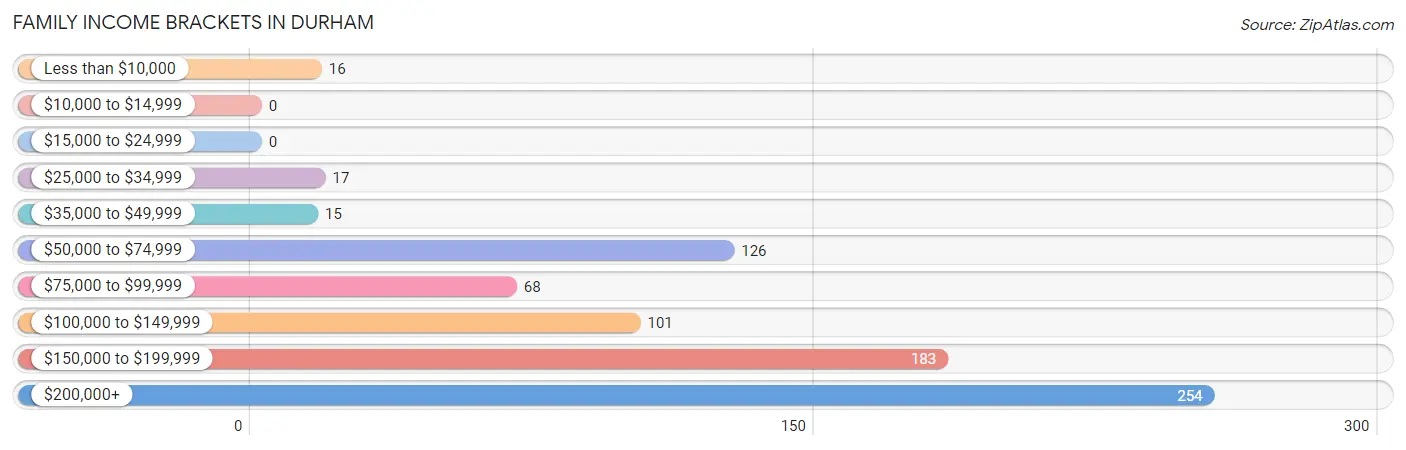
| Income Bracket | # Families | % Families |
| Less than $10,000 | 16 | 2.1% |
| $10,000 to $14,999 | 0 | 0.0% |
| $15,000 to $24,999 | 0 | 0.0% |
| $25,000 to $34,999 | 17 | 2.2% |
| $35,000 to $49,999 | 15 | 1.9% |
| $50,000 to $74,999 | 126 | 16.2% |
| $75,000 to $99,999 | 68 | 8.7% |
| $100,000 to $149,999 | 101 | 12.9% |
| $150,000 to $199,999 | 183 | 23.5% |
| $200,000+ | 254 | 32.6% |
Family Income by Famaliy Size in Durham
4-person families (214 | 27.4%) account for the highest median family income in Durham with $180,000 per family, while 3-person families (132 | 16.9%) have the highest median income of $56,750 per family member.
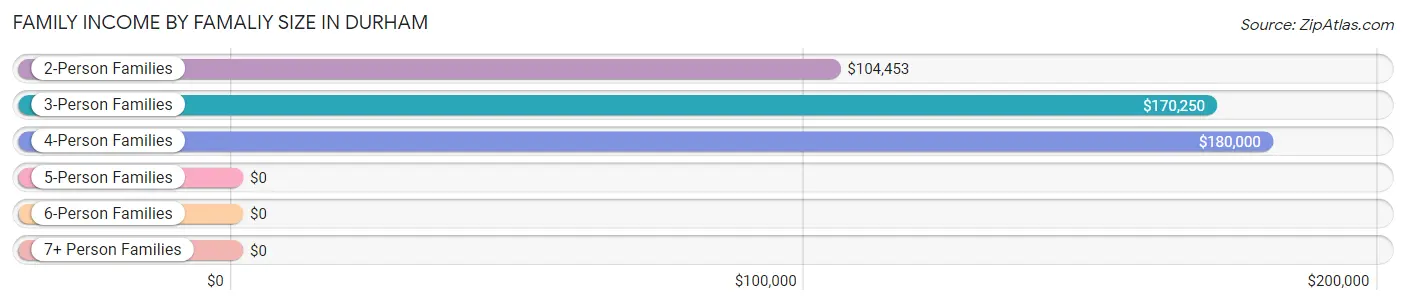
| Income Bracket | # Families | Median Income |
| 2-Person Families | 395 (50.6%) | $104,453 |
| 3-Person Families | 132 (16.9%) | $170,250 |
| 4-Person Families | 214 (27.4%) | $180,000 |
| 5-Person Families | 39 (5.0%) | $0 |
| 6-Person Families | 0 (0.0%) | $0 |
| 7+ Person Families | 0 (0.0%) | $0 |
| Total | 780 (100.0%) | $155,948 |
Family Income by Number of Earners in Durham
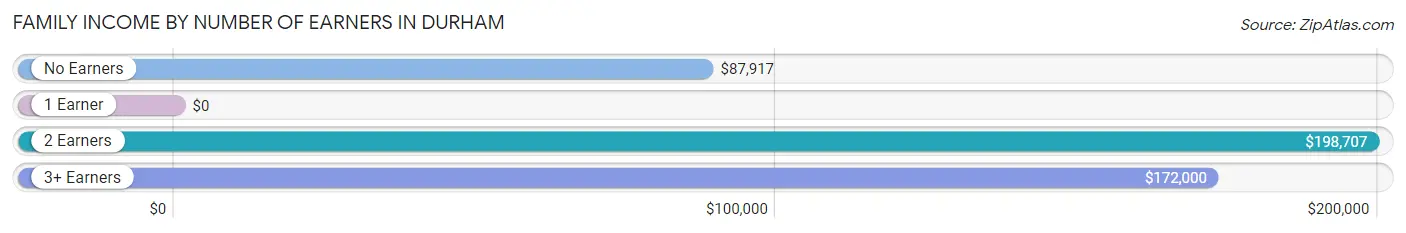
| Number of Earners | # Families | Median Income |
| No Earners | 142 (18.2%) | $87,917 |
| 1 Earner | 204 (26.2%) | $0 |
| 2 Earners | 362 (46.4%) | $198,707 |
| 3+ Earners | 72 (9.2%) | $172,000 |
| Total | 780 (100.0%) | $155,948 |
Household Income in Durham
Household Income Brackets in Durham
With 278 households falling in the category, the $200,000+ income range is the most frequent in Durham, accounting for 19.5% of all households. In contrast, only 56 households (3.9%) fall into the $25,000 to $34,999 income bracket, making it the least populous group.
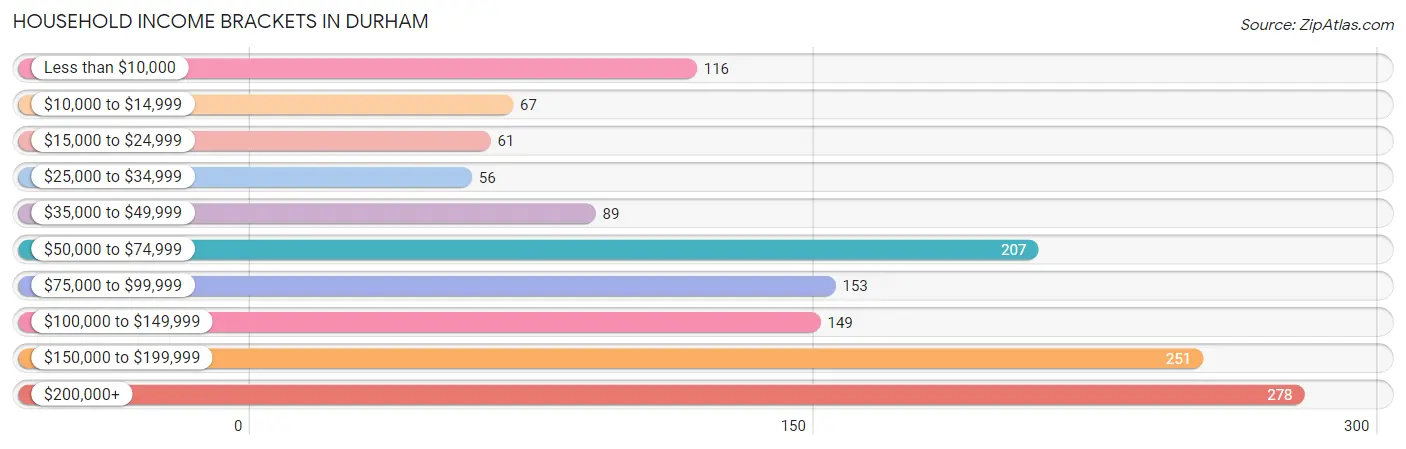
| Income Bracket | # Households | % Households |
| Less than $10,000 | 116 | 8.1% |
| $10,000 to $14,999 | 67 | 4.7% |
| $15,000 to $24,999 | 61 | 4.3% |
| $25,000 to $34,999 | 56 | 3.9% |
| $35,000 to $49,999 | 89 | 6.2% |
| $50,000 to $74,999 | 207 | 14.5% |
| $75,000 to $99,999 | 153 | 10.7% |
| $100,000 to $149,999 | 149 | 10.4% |
| $150,000 to $199,999 | 251 | 17.6% |
| $200,000+ | 278 | 19.5% |
Household Income by Householder Age in Durham
The median household income in Durham is $93,542, with the highest median household income of $157,731 found in the 25 to 44 years age bracket for the primary householder. A total of 382 households (26.8%) fall into this category. Meanwhile, the 15 to 24 years age bracket for the primary householder has the lowest median household income of $18,850, with 283 households (19.8%) in this group.
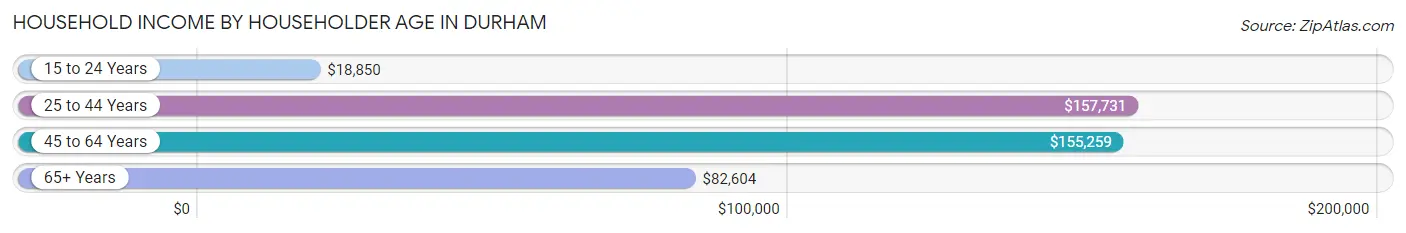
| Income Bracket | # Households | Median Income |
| 15 to 24 Years | 283 (19.8%) | $18,850 |
| 25 to 44 Years | 382 (26.8%) | $157,731 |
| 45 to 64 Years | 368 (25.8%) | $155,259 |
| 65+ Years | 395 (27.7%) | $82,604 |
| Total | 1,428 (100.0%) | $93,542 |
Poverty in Durham
Income Below Poverty by Sex and Age in Durham
With 15.4% poverty level for males and 17.5% for females among the residents of Durham, 18 to 24 year old males and 18 to 24 year old females are the most vulnerable to poverty, with 179 males (58.9%) and 325 females (50.0%) in their respective age groups living below the poverty level.
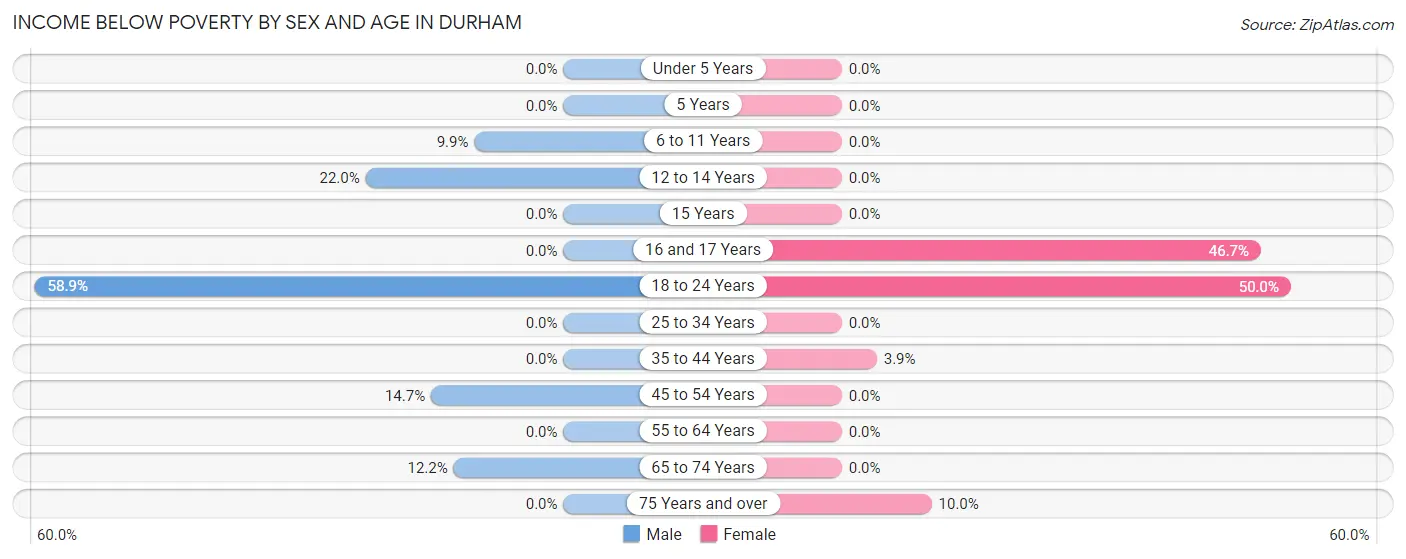
| Age Bracket | Male | Female |
| Under 5 Years | 0 (0.0%) | 0 (0.0%) |
| 5 Years | 0 (0.0%) | 0 (0.0%) |
| 6 to 11 Years | 13 (9.9%) | 0 (0.0%) |
| 12 to 14 Years | 13 (22.0%) | 0 (0.0%) |
| 15 Years | 0 (0.0%) | 0 (0.0%) |
| 16 and 17 Years | 0 (0.0%) | 7 (46.7%) |
| 18 to 24 Years | 179 (58.9%) | 325 (50.0%) |
| 25 to 34 Years | 0 (0.0%) | 0 (0.0%) |
| 35 to 44 Years | 0 (0.0%) | 9 (3.9%) |
| 45 to 54 Years | 23 (14.7%) | 0 (0.0%) |
| 55 to 64 Years | 0 (0.0%) | 0 (0.0%) |
| 65 to 74 Years | 17 (12.2%) | 0 (0.0%) |
| 75 Years and over | 0 (0.0%) | 21 (10.0%) |
| Total | 245 (15.4%) | 362 (17.5%) |
Income Above Poverty by Sex and Age in Durham
According to the poverty statistics in Durham, males aged under 5 years and females aged under 5 years are the age groups that are most secure financially, with 100.0% of males and 100.0% of females in these age groups living above the poverty line.
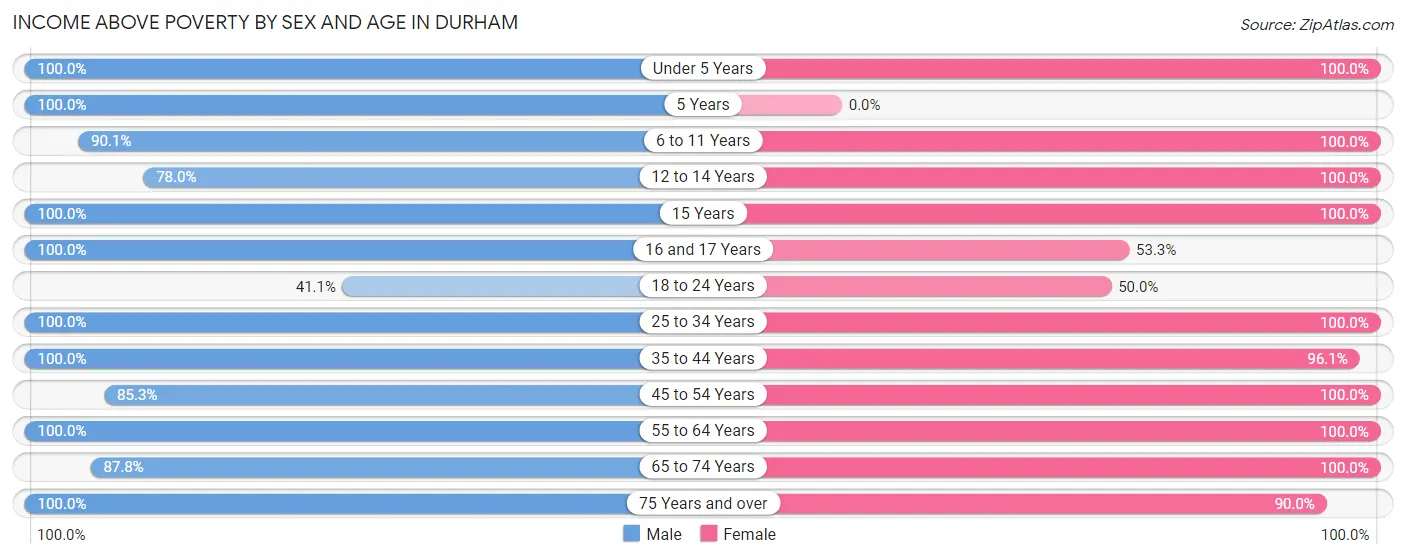
| Age Bracket | Male | Female |
| Under 5 Years | 20 (100.0%) | 59 (100.0%) |
| 5 Years | 36 (100.0%) | 0 (0.0%) |
| 6 to 11 Years | 118 (90.1%) | 105 (100.0%) |
| 12 to 14 Years | 46 (78.0%) | 113 (100.0%) |
| 15 Years | 51 (100.0%) | 7 (100.0%) |
| 16 and 17 Years | 64 (100.0%) | 8 (53.3%) |
| 18 to 24 Years | 125 (41.1%) | 325 (50.0%) |
| 25 to 34 Years | 168 (100.0%) | 185 (100.0%) |
| 35 to 44 Years | 183 (100.0%) | 222 (96.1%) |
| 45 to 54 Years | 133 (85.3%) | 190 (100.0%) |
| 55 to 64 Years | 169 (100.0%) | 143 (100.0%) |
| 65 to 74 Years | 122 (87.8%) | 163 (100.0%) |
| 75 Years and over | 111 (100.0%) | 189 (90.0%) |
| Total | 1,346 (84.6%) | 1,709 (82.5%) |
Income Below Poverty Among Married-Couple Families in Durham
The poverty statistics for married-couple families in Durham show that 2.5% or 16 of the total 630 families live below the poverty line. Families with 1 or 2 children have the highest poverty rate of 6.1%, comprising of 16 families. On the other hand, families with no children have the lowest poverty rate of 0.0%, which includes 0 families.
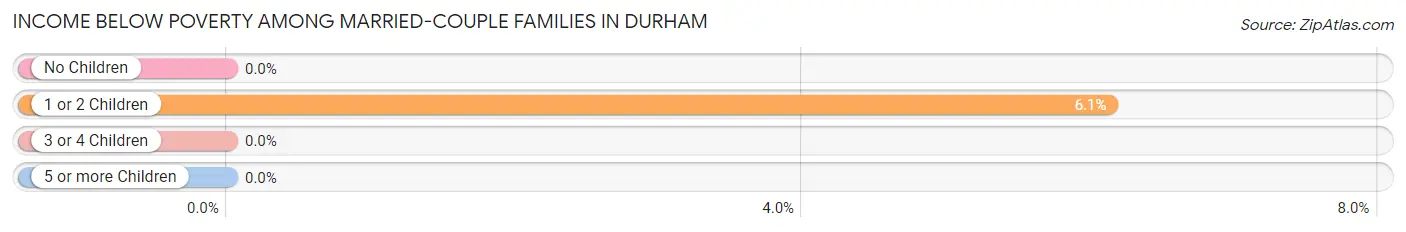
| Children | Above Poverty | Below Poverty |
| No Children | 347 (100.0%) | 0 (0.0%) |
| 1 or 2 Children | 245 (93.9%) | 16 (6.1%) |
| 3 or 4 Children | 22 (100.0%) | 0 (0.0%) |
| 5 or more Children | 0 (0.0%) | 0 (0.0%) |
| Total | 614 (97.5%) | 16 (2.5%) |
Income Below Poverty Among Single-Parent Households in Durham
| Children | Single Father | Single Mother |
| No Children | 0 (0.0%) | 0 (0.0%) |
| 1 or 2 Children | 0 (0.0%) | 0 (0.0%) |
| 3 or 4 Children | 0 (0.0%) | 0 (0.0%) |
| 5 or more Children | 0 (0.0%) | 0 (0.0%) |
| Total | 0 (0.0%) | 0 (0.0%) |
Income Below Poverty Among Married-Couple vs Single-Parent Households in Durham
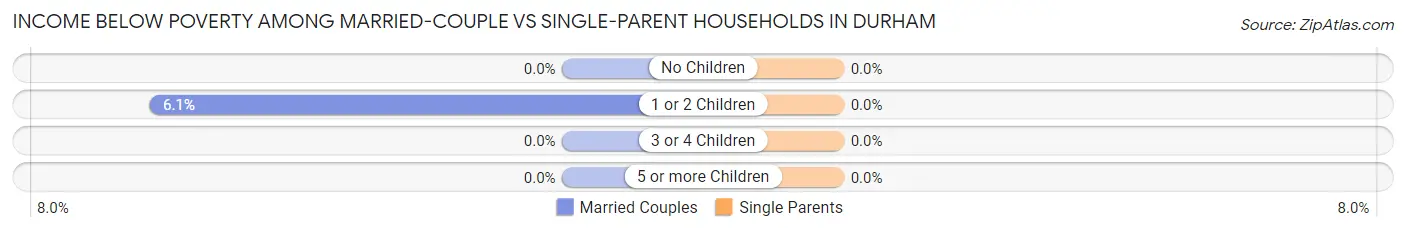
| Children | Married-Couple Families | Single-Parent Households |
| No Children | 0 (0.0%) | 0 (0.0%) |
| 1 or 2 Children | 16 (6.1%) | 0 (0.0%) |
| 3 or 4 Children | 0 (0.0%) | 0 (0.0%) |
| 5 or more Children | 0 (0.0%) | 0 (0.0%) |
| Total | 16 (2.5%) | 0 (0.0%) |
Race in Durham
The most populous races in Durham are White / Caucasian (9,647 | 89.4%), Two or more Races (630 | 5.8%), and Asian (449 | 4.2%).
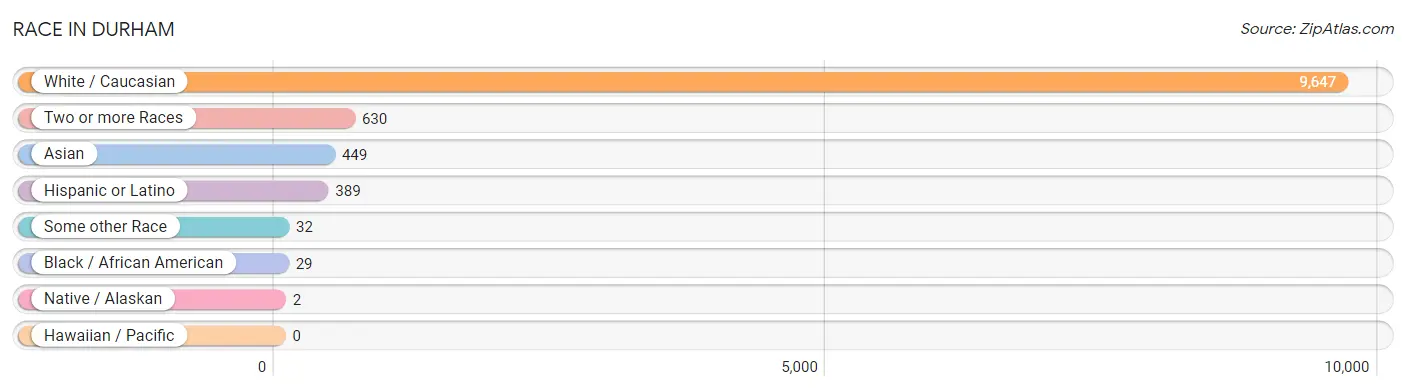
| Race | # Population | % Population |
| Asian | 449 | 4.2% |
| Black / African American | 29 | 0.3% |
| Hawaiian / Pacific | 0 | 0.0% |
| Hispanic or Latino | 389 | 3.6% |
| Native / Alaskan | 2 | 0.0% |
| White / Caucasian | 9,647 | 89.4% |
| Two or more Races | 630 | 5.8% |
| Some other Race | 32 | 0.3% |
| Total | 10,789 | 100.0% |
Ancestry in Durham
The most populous ancestries reported in Durham are Irish (3,019 | 28.0%), Italian (1,960 | 18.2%), English (1,606 | 14.9%), German (1,232 | 11.4%), and Polish (569 | 5.3%), together accounting for 77.7% of all Durham residents.
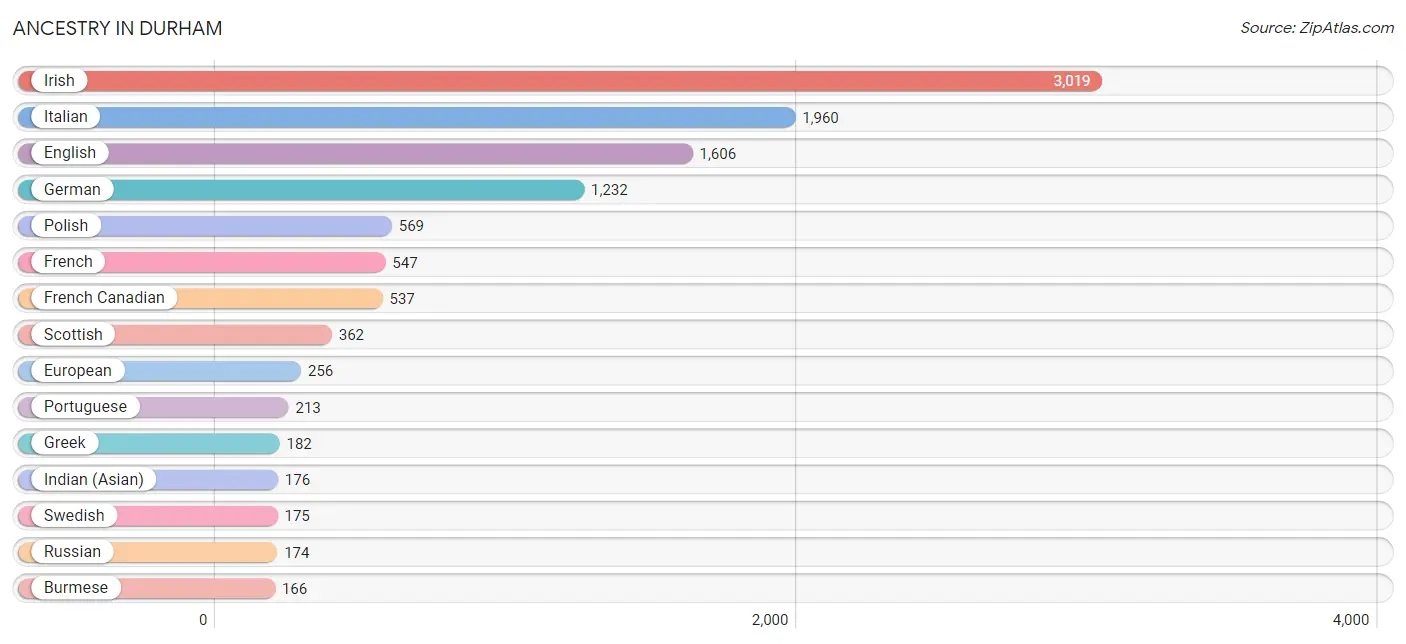
| Ancestry | # Population | % Population |
| Albanian | 21 | 0.2% |
| American | 106 | 1.0% |
| Apache | 8 | 0.1% |
| Arab | 63 | 0.6% |
| Argentinean | 10 | 0.1% |
| Armenian | 64 | 0.6% |
| Austrian | 43 | 0.4% |
| Belgian | 56 | 0.5% |
| Bhutanese | 23 | 0.2% |
| Blackfeet | 19 | 0.2% |
| Bolivian | 10 | 0.1% |
| Brazilian | 41 | 0.4% |
| British | 89 | 0.8% |
| Burmese | 166 | 1.5% |
| Canadian | 45 | 0.4% |
| Celtic | 5 | 0.1% |
| Central American | 8 | 0.1% |
| Cherokee | 5 | 0.1% |
| Chilean | 2 | 0.0% |
| Colombian | 32 | 0.3% |
| Costa Rican | 8 | 0.1% |
| Creek | 7 | 0.1% |
| Croatian | 6 | 0.1% |
| Cuban | 50 | 0.5% |
| Czech | 17 | 0.2% |
| Czechoslovakian | 6 | 0.1% |
| Danish | 106 | 1.0% |
| Dominican | 17 | 0.2% |
| Dutch | 98 | 0.9% |
| Eastern European | 61 | 0.6% |
| Egyptian | 4 | 0.0% |
| English | 1,606 | 14.9% |
| European | 256 | 2.4% |
| Finnish | 38 | 0.4% |
| French | 547 | 5.1% |
| French Canadian | 537 | 5.0% |
| German | 1,232 | 11.4% |
| Ghanaian | 19 | 0.2% |
| Greek | 182 | 1.7% |
| Haitian | 1 | 0.0% |
| Hungarian | 66 | 0.6% |
| Indian (Asian) | 176 | 1.6% |
| Iranian | 6 | 0.1% |
| Irish | 3,019 | 28.0% |
| Iroquois | 6 | 0.1% |
| Italian | 1,960 | 18.2% |
| Korean | 30 | 0.3% |
| Laotian | 17 | 0.2% |
| Lebanese | 48 | 0.4% |
| Lithuanian | 15 | 0.1% |
| Malaysian | 15 | 0.1% |
| Mexican | 93 | 0.9% |
| Nigerian | 8 | 0.1% |
| Northern European | 107 | 1.0% |
| Norwegian | 95 | 0.9% |
| Polish | 569 | 5.3% |
| Portuguese | 213 | 2.0% |
| Puerto Rican | 105 | 1.0% |
| Russian | 174 | 1.6% |
| Scandinavian | 40 | 0.4% |
| Scotch-Irish | 94 | 0.9% |
| Scottish | 362 | 3.4% |
| Serbian | 7 | 0.1% |
| Slavic | 29 | 0.3% |
| Slovak | 20 | 0.2% |
| Slovene | 11 | 0.1% |
| South American | 54 | 0.5% |
| Spaniard | 35 | 0.3% |
| Spanish | 14 | 0.1% |
| Sri Lankan | 52 | 0.5% |
| Subsaharan African | 36 | 0.3% |
| Swedish | 175 | 1.6% |
| Swiss | 10 | 0.1% |
| Syrian | 12 | 0.1% |
| Thai | 61 | 0.6% |
| Turkish | 20 | 0.2% |
| Ukrainian | 64 | 0.6% |
| Vietnamese | 16 | 0.2% |
| Welsh | 132 | 1.2% |
| Yugoslavian | 16 | 0.2% | View All 80 Rows |
Immigrants in Durham
The most numerous immigrant groups reported in Durham came from Asia (252 | 2.3%), Europe (175 | 1.6%), Eastern Asia (153 | 1.4%), Eastern Europe (98 | 0.9%), and China (91 | 0.8%), together accounting for 7.1% of all Durham residents.
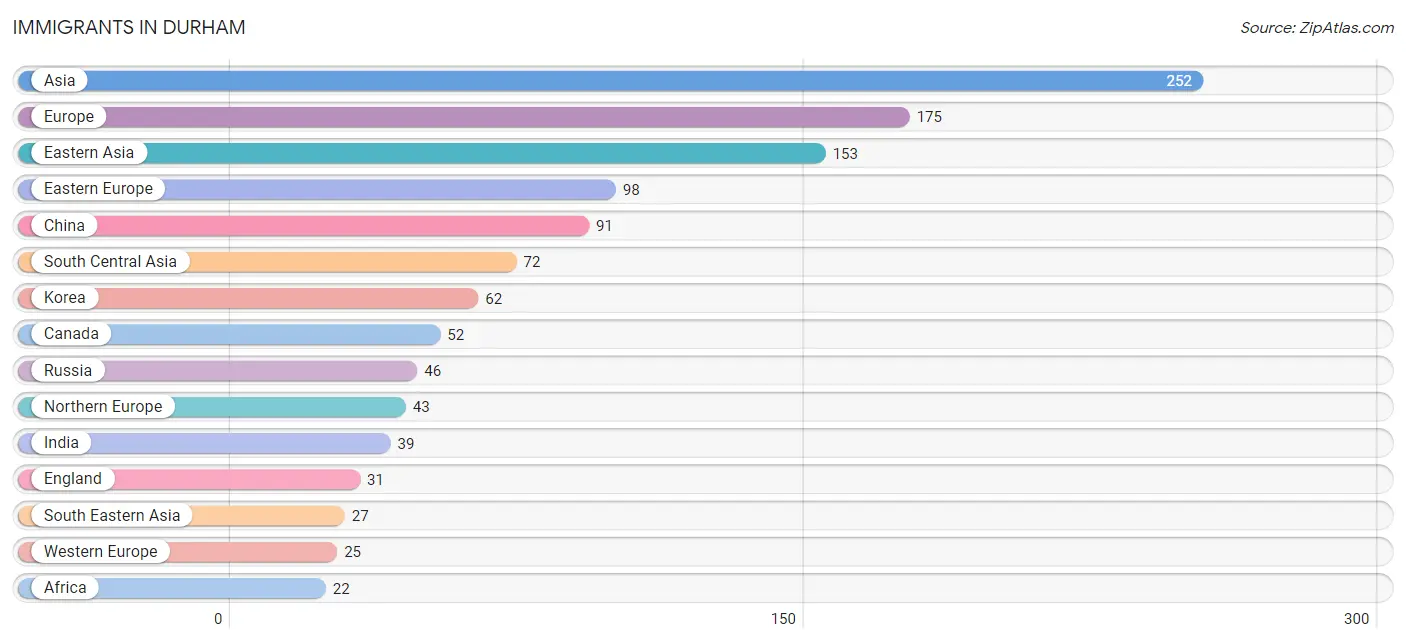
| Immigration Origin | # Population | % Population |
| Africa | 22 | 0.2% |
| Albania | 4 | 0.0% |
| Asia | 252 | 2.3% |
| Austria | 10 | 0.1% |
| Bangladesh | 16 | 0.2% |
| Bosnia and Herzegovina | 16 | 0.2% |
| Brazil | 8 | 0.1% |
| Bulgaria | 5 | 0.1% |
| Canada | 52 | 0.5% |
| Caribbean | 6 | 0.1% |
| China | 91 | 0.8% |
| Czechoslovakia | 2 | 0.0% |
| Dominican Republic | 6 | 0.1% |
| Eastern Africa | 5 | 0.1% |
| Eastern Asia | 153 | 1.4% |
| Eastern Europe | 98 | 0.9% |
| Egypt | 4 | 0.0% |
| England | 31 | 0.3% |
| Europe | 175 | 1.6% |
| Germany | 6 | 0.1% |
| Ghana | 5 | 0.1% |
| Greece | 9 | 0.1% |
| Hungary | 11 | 0.1% |
| India | 39 | 0.4% |
| Indonesia | 2 | 0.0% |
| Iran | 5 | 0.1% |
| Ireland | 4 | 0.0% |
| Korea | 62 | 0.6% |
| Latin America | 14 | 0.1% |
| Malaysia | 10 | 0.1% |
| Nepal | 6 | 0.1% |
| Netherlands | 9 | 0.1% |
| Nigeria | 8 | 0.1% |
| Northern Africa | 4 | 0.0% |
| Northern Europe | 43 | 0.4% |
| Oceania | 1 | 0.0% |
| Pakistan | 6 | 0.1% |
| Russia | 46 | 0.4% |
| Scotland | 8 | 0.1% |
| South America | 8 | 0.1% |
| South Central Asia | 72 | 0.7% |
| South Eastern Asia | 27 | 0.3% |
| Southern Europe | 9 | 0.1% |
| Ukraine | 14 | 0.1% |
| Vietnam | 15 | 0.1% |
| Western Africa | 13 | 0.1% |
| Western Europe | 25 | 0.2% | View All 47 Rows |
Sex and Age in Durham
Sex and Age in Durham
The most populous age groups in Durham are 15 to 19 Years (2,187 | 44.5%) for men and 15 to 19 Years (2,663 | 45.3%) for women.
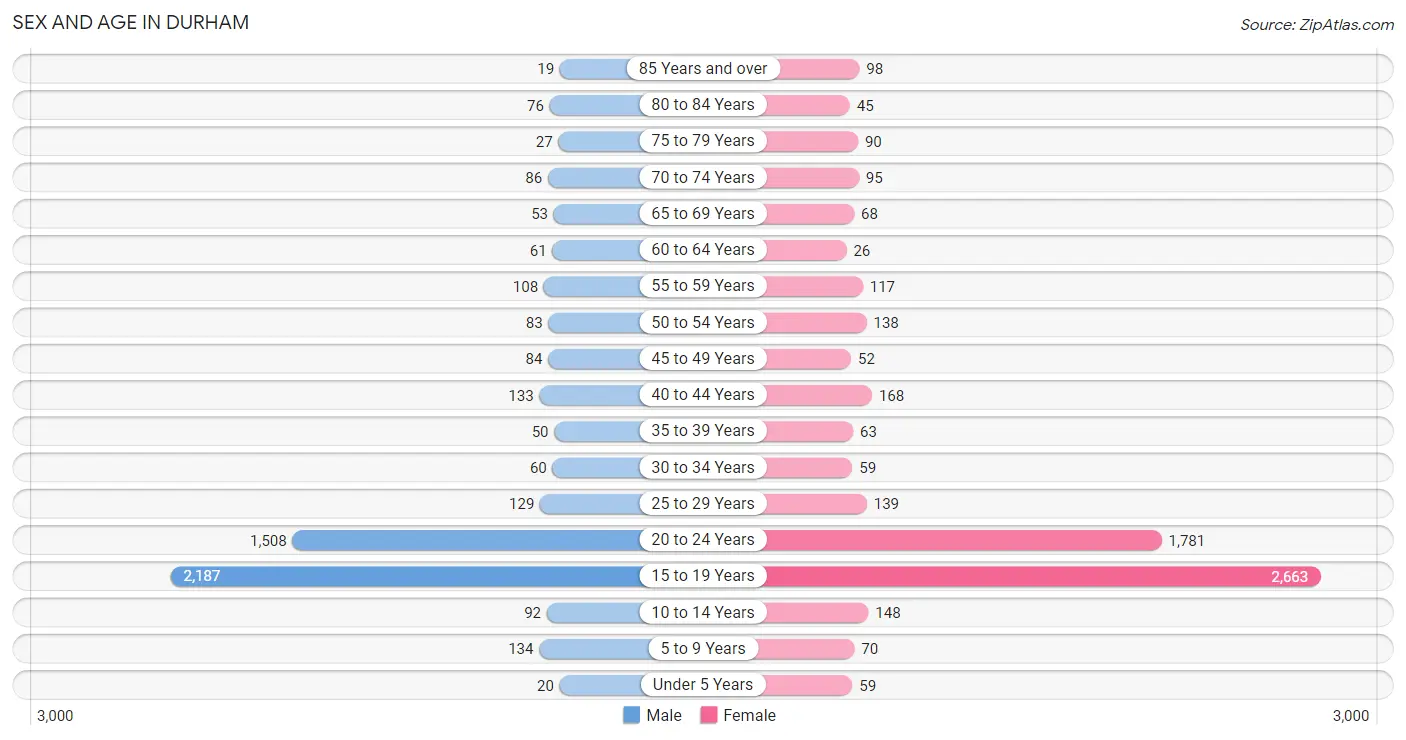
| Age Bracket | Male | Female |
| Under 5 Years | 20 (0.4%) | 59 (1.0%) |
| 5 to 9 Years | 134 (2.7%) | 70 (1.2%) |
| 10 to 14 Years | 92 (1.9%) | 148 (2.5%) |
| 15 to 19 Years | 2,187 (44.5%) | 2,663 (45.3%) |
| 20 to 24 Years | 1,508 (30.7%) | 1,781 (30.3%) |
| 25 to 29 Years | 129 (2.6%) | 139 (2.4%) |
| 30 to 34 Years | 60 (1.2%) | 59 (1.0%) |
| 35 to 39 Years | 50 (1.0%) | 63 (1.1%) |
| 40 to 44 Years | 133 (2.7%) | 168 (2.9%) |
| 45 to 49 Years | 84 (1.7%) | 52 (0.9%) |
| 50 to 54 Years | 83 (1.7%) | 138 (2.4%) |
| 55 to 59 Years | 108 (2.2%) | 117 (2.0%) |
| 60 to 64 Years | 61 (1.2%) | 26 (0.4%) |
| 65 to 69 Years | 53 (1.1%) | 68 (1.2%) |
| 70 to 74 Years | 86 (1.8%) | 95 (1.6%) |
| 75 to 79 Years | 27 (0.5%) | 90 (1.5%) |
| 80 to 84 Years | 76 (1.5%) | 45 (0.8%) |
| 85 Years and over | 19 (0.4%) | 98 (1.7%) |
| Total | 4,910 (100.0%) | 5,879 (100.0%) |
Families and Households in Durham
Median Family Size in Durham
The median family size in Durham is 2.95 persons per family, with single male/father families (46 | 5.9%) accounting for the largest median family size of 3.24 persons per family. On the other hand, single female/mother families (104 | 13.3%) represent the smallest median family size with 2.28 persons per family.
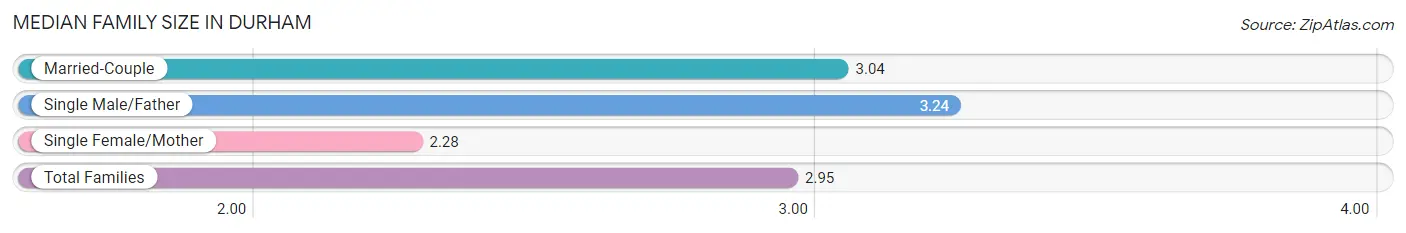
| Family Type | # Families | Family Size |
| Married-Couple | 630 (80.8%) | 3.04 |
| Single Male/Father | 46 (5.9%) | 3.24 |
| Single Female/Mother | 104 (13.3%) | 2.28 |
| Total Families | 780 (100.0%) | 2.95 |
Median Household Size in Durham
The median household size in Durham is 2.55 persons per household, with single male/father households (46 | 3.2%) accounting for the largest median household size of 3.54 persons per household. non-family households (648 | 45.4%) represent the smallest median household size with 2.01 persons per household.
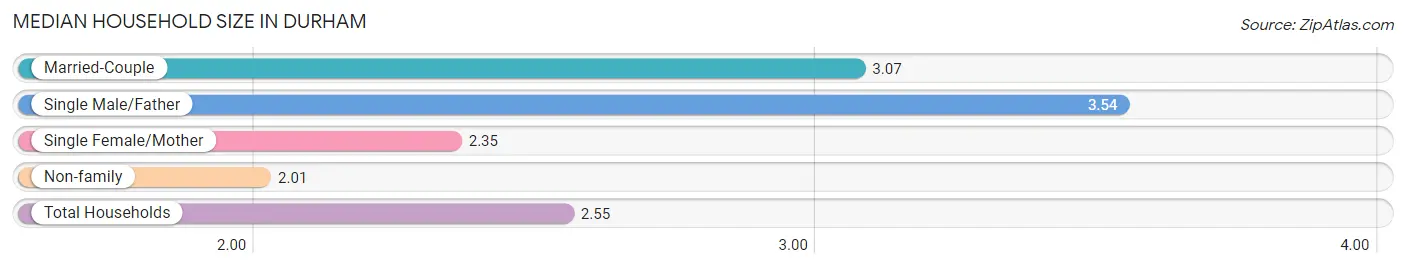
| Household Type | # Households | Household Size |
| Married-Couple | 630 (44.1%) | 3.07 |
| Single Male/Father | 46 (3.2%) | 3.54 |
| Single Female/Mother | 104 (7.3%) | 2.35 |
| Non-family | 648 (45.4%) | 2.01 |
| Total Households | 1,428 (100.0%) | 2.55 |
Household Size by Marriage Status in Durham
Out of a total of 1,428 households in Durham, 780 (54.6%) are family households, while 648 (45.4%) are nonfamily households. The most numerous type of family households are 2-person households, comprising 386, and the most common type of nonfamily households are 1-person households, comprising 408.
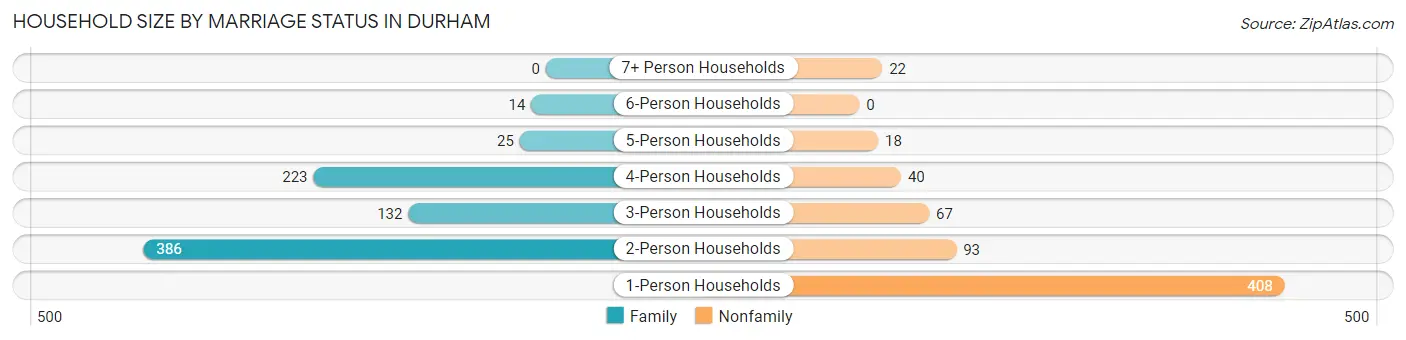
| Household Size | Family Households | Nonfamily Households |
| 1-Person Households | - | 408 (28.6%) |
| 2-Person Households | 386 (27.0%) | 93 (6.5%) |
| 3-Person Households | 132 (9.2%) | 67 (4.7%) |
| 4-Person Households | 223 (15.6%) | 40 (2.8%) |
| 5-Person Households | 25 (1.8%) | 18 (1.3%) |
| 6-Person Households | 14 (1.0%) | 0 (0.0%) |
| 7+ Person Households | 0 (0.0%) | 22 (1.5%) |
| Total | 780 (54.6%) | 648 (45.4%) |
Female Fertility in Durham
Fertility by Age in Durham
Average fertility rate in Durham is 3.0 births per 1,000 women. Women in the age bracket of 35 to 50 years have the highest fertility rate with 10.0 births per 1,000 women. Women in the age bracket of 20 to 34 years acount for 78.6% of all women with births.
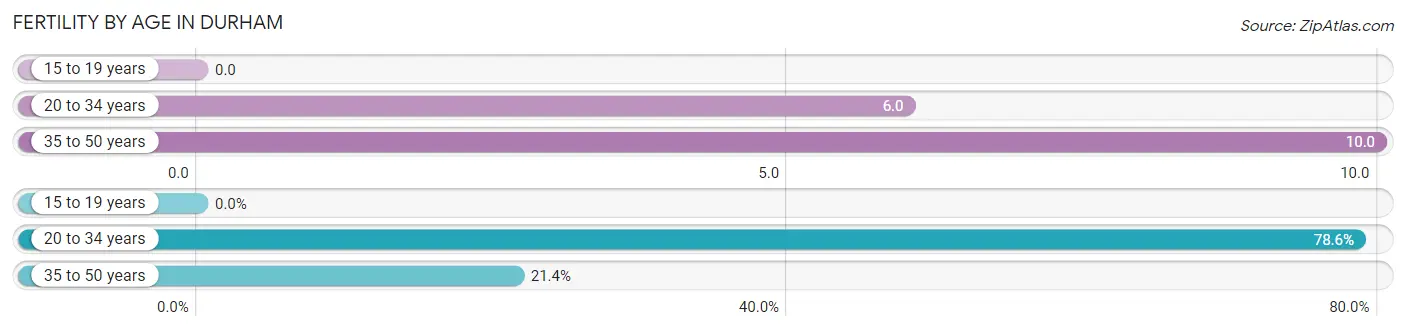
| Age Bracket | Women with Births | Births / 1,000 Women |
| 15 to 19 years | 0 (0.0%) | 0.0 |
| 20 to 34 years | 11 (78.6%) | 6.0 |
| 35 to 50 years | 3 (21.4%) | 10.0 |
| Total | 14 (100.0%) | 3.0 |
Fertility by Age by Marriage Status in Durham
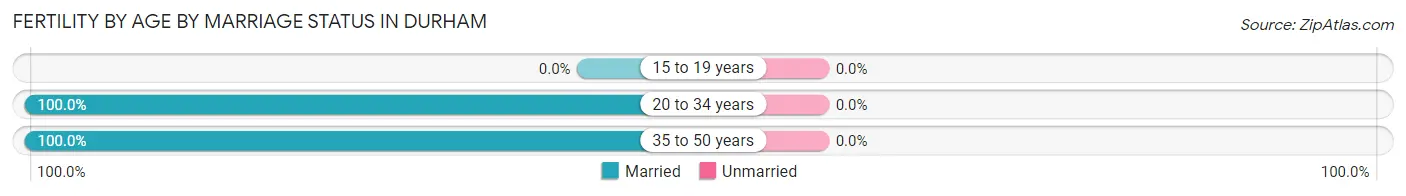
| Age Bracket | Married | Unmarried |
| 15 to 19 years | 0 (0.0%) | 0 (0.0%) |
| 20 to 34 years | 11 (100.0%) | 0 (0.0%) |
| 35 to 50 years | 3 (100.0%) | 0 (0.0%) |
| Total | 14 (100.0%) | 0 (0.0%) |
Fertility by Education in Durham
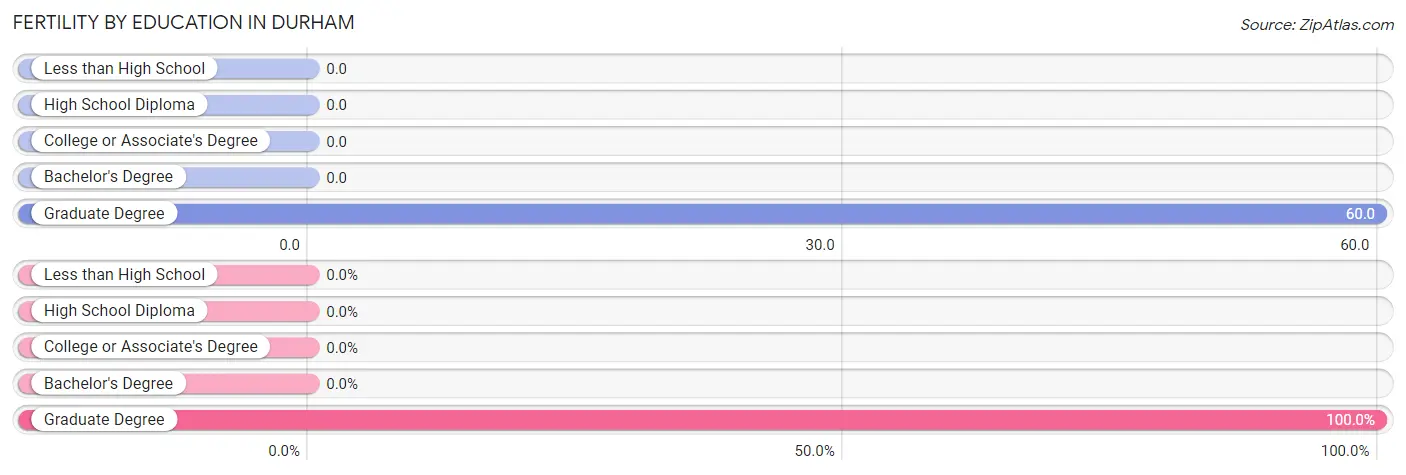
| Educational Attainment | Women with Births | Births / 1,000 Women |
| Less than High School | 0 (0.0%) | 0.0 |
| High School Diploma | 0 (0.0%) | 0.0 |
| College or Associate's Degree | 0 (0.0%) | 0.0 |
| Bachelor's Degree | 0 (0.0%) | 0.0 |
| Graduate Degree | 14 (100.0%) | 60.0 |
| Total | 14 (100.0%) | 3.0 |
Fertility by Education by Marriage Status in Durham
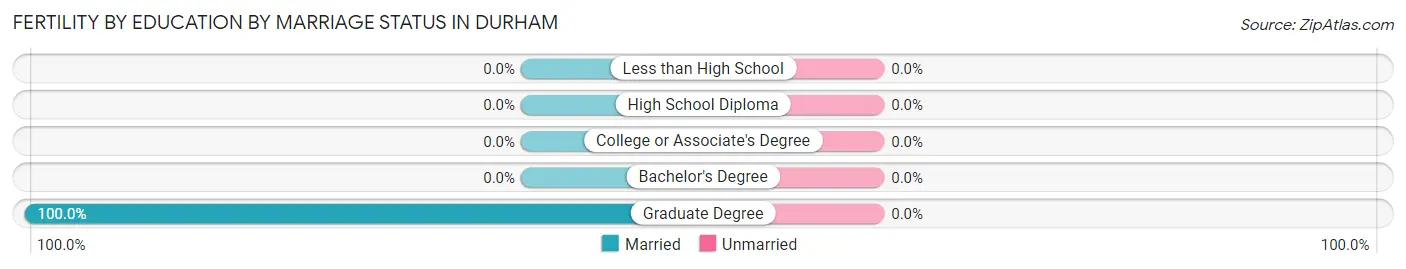
| Educational Attainment | Married | Unmarried |
| Less than High School | 0 (0.0%) | 0 (0.0%) |
| High School Diploma | 0 (0.0%) | 0 (0.0%) |
| College or Associate's Degree | 0 (0.0%) | 0 (0.0%) |
| Bachelor's Degree | 0 (0.0%) | 0 (0.0%) |
| Graduate Degree | 14 (100.0%) | 0 (0.0%) |
| Total | 14 (100.0%) | 0 (0.0%) |
Employment Characteristics in Durham
Employment by Class of Employer in Durham
Among the 3,937 employed individuals in Durham, private company employees (1,834 | 46.6%), state government employees (1,095 | 27.8%), and not-for-profit organizations (432 | 11.0%) make up the most common classes of employment.
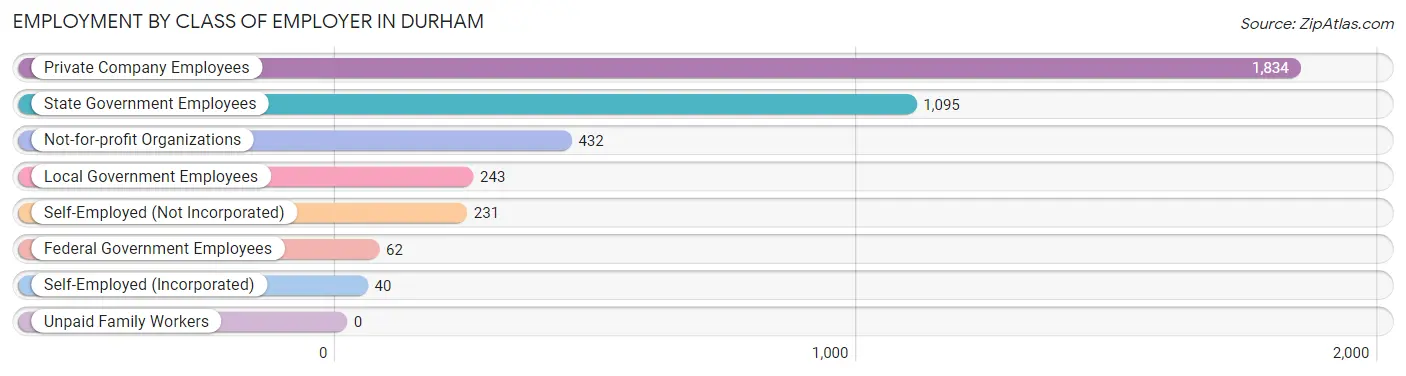
| Employer Class | # Employees | % Employees |
| Private Company Employees | 1,834 | 46.6% |
| Self-Employed (Incorporated) | 40 | 1.0% |
| Self-Employed (Not Incorporated) | 231 | 5.9% |
| Not-for-profit Organizations | 432 | 11.0% |
| Local Government Employees | 243 | 6.2% |
| State Government Employees | 1,095 | 27.8% |
| Federal Government Employees | 62 | 1.6% |
| Unpaid Family Workers | 0 | 0.0% |
| Total | 3,937 | 100.0% |
Employment Status by Age in Durham
According to the labor force statistics for Durham, out of the total population over 16 years of age (10,208), 53.7% or 5,482 individuals are in the labor force, with 3.9% or 214 of them unemployed. The age group with the highest labor force participation rate is 35 to 44 years, with 96.9% or 401 individuals in the labor force. Within the labor force, the 16 to 19 years age range has the highest percentage of unemployed individuals, with 6.0% or 132 of them being unemployed.
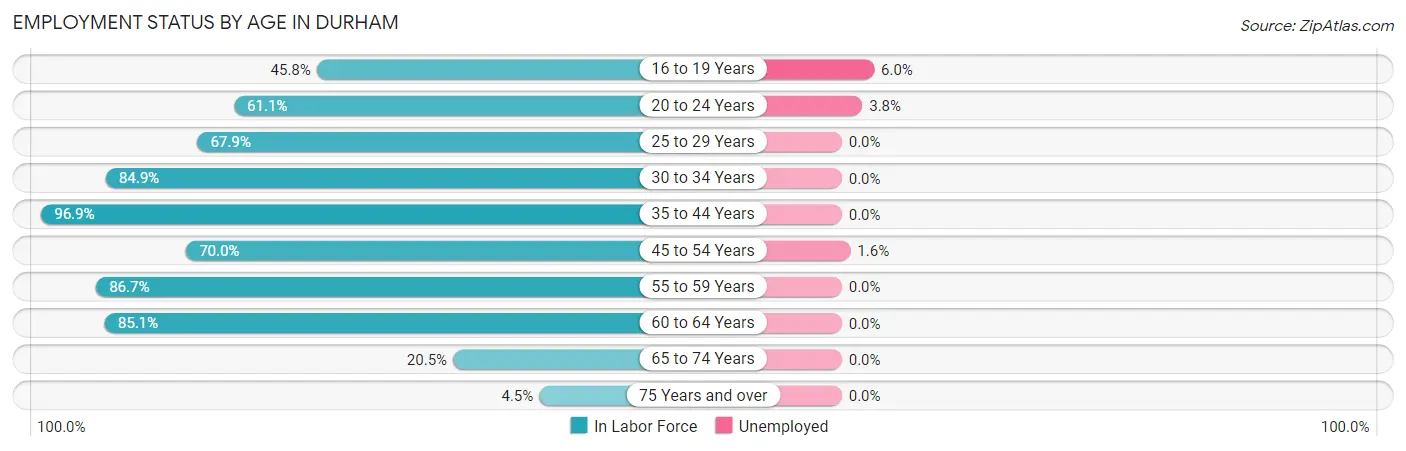
| Age Bracket | In Labor Force | Unemployed |
| 16 to 19 Years | 2,195 (45.8%) | 132 (6.0%) |
| 20 to 24 Years | 2,010 (61.1%) | 76 (3.8%) |
| 25 to 29 Years | 182 (67.9%) | 0 (0.0%) |
| 30 to 34 Years | 101 (84.9%) | 0 (0.0%) |
| 35 to 44 Years | 401 (96.9%) | 0 (0.0%) |
| 45 to 54 Years | 250 (70.0%) | 4 (1.6%) |
| 55 to 59 Years | 195 (86.7%) | 0 (0.0%) |
| 60 to 64 Years | 74 (85.1%) | 0 (0.0%) |
| 65 to 74 Years | 62 (20.5%) | 0 (0.0%) |
| 75 Years and over | 16 (4.5%) | 0 (0.0%) |
| Total | 5,482 (53.7%) | 214 (3.9%) |
Employment Status by Educational Attainment in Durham
According to labor force statistics for Durham, 81.8% of individuals (1,202) out of the total population between 25 and 64 years of age (1,470) are in the labor force, with 0.3% or 4 of them being unemployed. The group with the highest labor force participation rate are those with the educational attainment of bachelor's degree or higher, with 84.4% or 1,024 individuals in the labor force. Within the labor force, individuals with college / associate degree education have the highest percentage of unemployment, with 4.0% or 4 of them being unemployed.
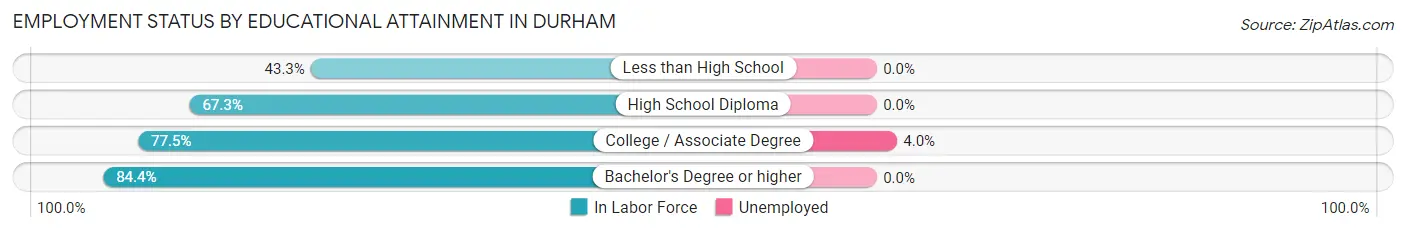
| Educational Attainment | In Labor Force | Unemployed |
| Less than High School | 13 (43.3%) | 0 (0.0%) |
| High School Diploma | 66 (67.3%) | 0 (0.0%) |
| College / Associate Degree | 100 (77.5%) | 5 (4.0%) |
| Bachelor's Degree or higher | 1,024 (84.4%) | 0 (0.0%) |
| Total | 1,202 (81.8%) | 4 (0.3%) |
Employment Occupations by Sex in Durham
Management, Business, Science and Arts Occupations
The most common Management, Business, Science and Arts occupations in Durham are Community & Social Service (677 | 12.8%), Education Instruction & Library (451 | 8.6%), Computers, Engineering & Science (450 | 8.5%), Management (315 | 6.0%), and Computers & Mathematics (206 | 3.9%).
Management, Business, Science and Arts Occupations by Sex
Within the Management, Business, Science and Arts occupations in Durham, the most male-oriented occupations are Business & Financial (75.8%), Architecture & Engineering (73.0%), and Computers & Mathematics (72.3%), while the most female-oriented occupations are Education, Arts & Media (94.9%), Health Diagnosing & Treating (77.6%), and Health Technologists (71.2%).
| Occupation | Male | Female |
| Management | 161 (51.1%) | 154 (48.9%) |
| Business & Financial | 91 (75.8%) | 29 (24.2%) |
| Computers, Engineering & Science | 277 (61.6%) | 173 (38.4%) |
| Computers & Mathematics | 149 (72.3%) | 57 (27.7%) |
| Architecture & Engineering | 89 (73.0%) | 33 (27.1%) |
| Life, Physical & Social Science | 39 (32.0%) | 83 (68.0%) |
| Community & Social Service | 360 (53.2%) | 317 (46.8%) |
| Education, Arts & Media | 3 (5.1%) | 56 (94.9%) |
| Legal Services & Support | 4 (57.1%) | 3 (42.9%) |
| Education Instruction & Library | 238 (52.8%) | 213 (47.2%) |
| Arts, Media & Entertainment | 115 (71.9%) | 45 (28.1%) |
| Health Diagnosing & Treating | 15 (22.4%) | 52 (77.6%) |
| Health Technologists | 15 (28.8%) | 37 (71.2%) |
| Total (Category) | 904 (55.5%) | 725 (44.5%) |
| Total (Overall) | 2,322 (44.0%) | 2,950 (56.0%) |
Services Occupations
The most common Services occupations in Durham are Food Preparation & Serving (838 | 15.9%), Personal Care & Service (421 | 8.0%), Cleaning & Maintenance (212 | 4.0%), Healthcare Support (176 | 3.3%), and Security & Protection (93 | 1.8%).
Services Occupations by Sex
Within the Services occupations in Durham, the most male-oriented occupations are Cleaning & Maintenance (65.1%), Law Enforcement (52.9%), and Personal Care & Service (39.7%), while the most female-oriented occupations are Healthcare Support (86.4%), Food Preparation & Serving (73.2%), and Firefighting & Prevention (72.4%).
| Occupation | Male | Female |
| Healthcare Support | 24 (13.6%) | 152 (86.4%) |
| Security & Protection | 30 (32.3%) | 63 (67.7%) |
| Firefighting & Prevention | 21 (27.6%) | 55 (72.4%) |
| Law Enforcement | 9 (52.9%) | 8 (47.1%) |
| Food Preparation & Serving | 225 (26.9%) | 613 (73.2%) |
| Cleaning & Maintenance | 138 (65.1%) | 74 (34.9%) |
| Personal Care & Service | 167 (39.7%) | 254 (60.3%) |
| Total (Category) | 584 (33.6%) | 1,156 (66.4%) |
| Total (Overall) | 2,322 (44.0%) | 2,950 (56.0%) |
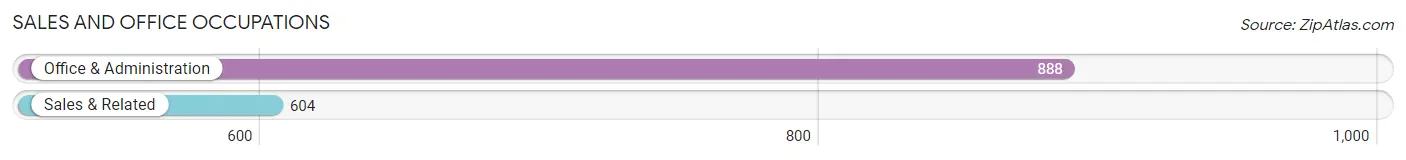
Sales and Office Occupations
The most common Sales and Office occupations in Durham are Office & Administration (888 | 16.8%), and Sales & Related (604 | 11.5%).
Sales and Office Occupations by Sex
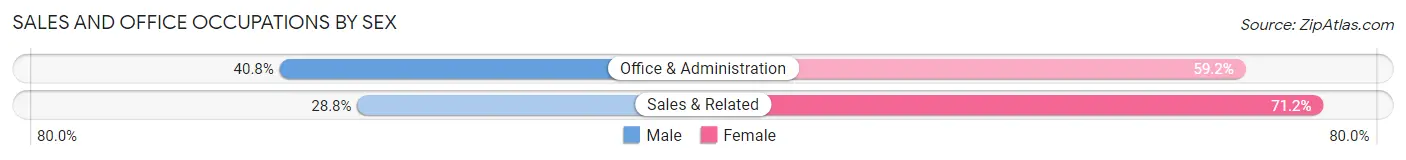
| Occupation | Male | Female |
| Sales & Related | 174 (28.8%) | 430 (71.2%) |
| Office & Administration | 362 (40.8%) | 526 (59.2%) |
| Total (Category) | 536 (35.9%) | 956 (64.1%) |
| Total (Overall) | 2,322 (44.0%) | 2,950 (56.0%) |
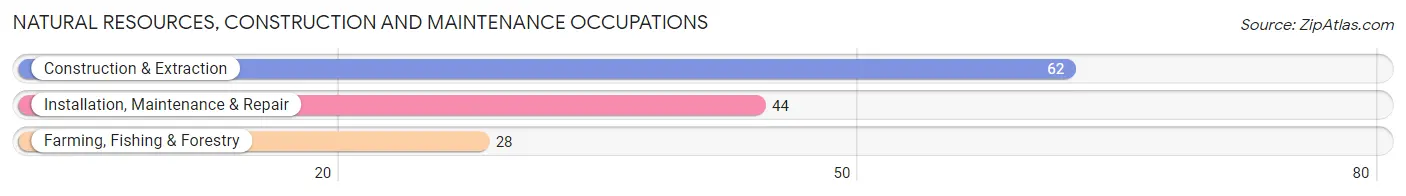
Natural Resources, Construction and Maintenance Occupations
The most common Natural Resources, Construction and Maintenance occupations in Durham are Construction & Extraction (62 | 1.2%), Installation, Maintenance & Repair (44 | 0.8%), and Farming, Fishing & Forestry (28 | 0.5%).
Natural Resources, Construction and Maintenance Occupations by Sex
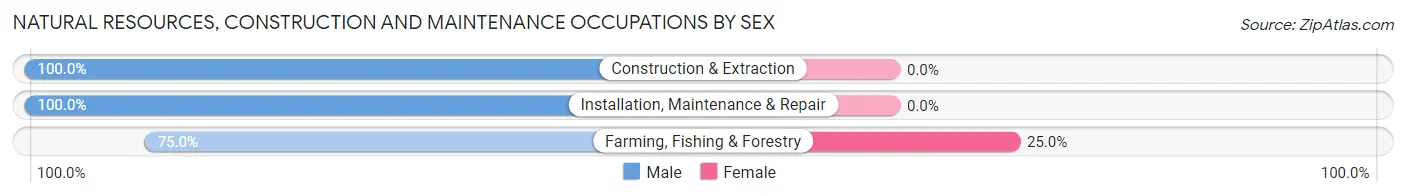
| Occupation | Male | Female |
| Farming, Fishing & Forestry | 21 (75.0%) | 7 (25.0%) |
| Construction & Extraction | 62 (100.0%) | 0 (0.0%) |
| Installation, Maintenance & Repair | 44 (100.0%) | 0 (0.0%) |
| Total (Category) | 127 (94.8%) | 7 (5.2%) |
| Total (Overall) | 2,322 (44.0%) | 2,950 (56.0%) |
Production, Transportation and Moving Occupations
The most common Production, Transportation and Moving occupations in Durham are Material Moving (127 | 2.4%), Transportation (80 | 1.5%), and Production (70 | 1.3%).
Production, Transportation and Moving Occupations by Sex
| Occupation | Male | Female |
| Production | 46 (65.7%) | 24 (34.3%) |
| Transportation | 47 (58.8%) | 33 (41.2%) |
| Material Moving | 78 (61.4%) | 49 (38.6%) |
| Total (Category) | 171 (61.7%) | 106 (38.3%) |
| Total (Overall) | 2,322 (44.0%) | 2,950 (56.0%) |
Employment Industries by Sex in Durham
Employment Industries in Durham
The major employment industries in Durham include Educational Services (1,247 | 23.6%), Retail Trade (914 | 17.3%), Accommodation & Food Services (721 | 13.7%), Health Care & Social Assistance (439 | 8.3%), and Arts, Entertainment & Recreation (388 | 7.4%).
Employment Industries by Sex in Durham
The Durham industries that see more men than women are Utilities (100.0%), Construction (86.4%), and Manufacturing (81.0%), whereas the industries that tend to have a higher number of women are Health Care & Social Assistance (89.1%), Public Administration (76.9%), and Accommodation & Food Services (75.7%).
| Industry | Male | Female |
| Agriculture, Fishing & Hunting | 21 (63.6%) | 12 (36.4%) |
| Mining, Quarrying, & Extraction | 0 (0.0%) | 0 (0.0%) |
| Construction | 76 (86.4%) | 12 (13.6%) |
| Manufacturing | 192 (81.0%) | 45 (19.0%) |
| Wholesale Trade | 7 (31.8%) | 15 (68.2%) |
| Retail Trade | 445 (48.7%) | 469 (51.3%) |
| Transportation & Warehousing | 52 (52.0%) | 48 (48.0%) |
| Utilities | 5 (100.0%) | 0 (0.0%) |
| Information | 30 (44.8%) | 37 (55.2%) |
| Finance & Insurance | 63 (72.4%) | 24 (27.6%) |
| Real Estate, Rental & Leasing | 16 (72.7%) | 6 (27.3%) |
| Professional & Scientific | 239 (68.7%) | 109 (31.3%) |
| Enterprise Management | 0 (0.0%) | 0 (0.0%) |
| Administrative & Support | 156 (77.6%) | 45 (22.4%) |
| Educational Services | 551 (44.2%) | 696 (55.8%) |
| Health Care & Social Assistance | 48 (10.9%) | 391 (89.1%) |
| Arts, Entertainment & Recreation | 165 (42.5%) | 223 (57.5%) |
| Accommodation & Food Services | 175 (24.3%) | 546 (75.7%) |
| Public Administration | 33 (23.1%) | 110 (76.9%) |
| Total | 2,322 (44.0%) | 2,950 (56.0%) |
Education in Durham
School Enrollment in Durham
The most common levels of schooling among the 8,606 students in Durham are college / undergraduate (7,756 | 90.1%), graduate / professional (219 | 2.5%), and middle school (217 | 2.5%).
| School Level | # Students | % Students |
| Nursery / Preschool | 51 | 0.6% |
| Kindergarten | 50 | 0.6% |
| Elementary School | 160 | 1.9% |
| Middle School | 217 | 2.5% |
| High School | 153 | 1.8% |
| College / Undergraduate | 7,756 | 90.1% |
| Graduate / Professional | 219 | 2.5% |
| Total | 8,606 | 100.0% |
School Enrollment by Age by Funding Source in Durham
Out of a total of 8,606 students who are enrolled in schools in Durham, 138 (1.6%) attend a private institution, while the remaining 8,468 (98.4%) are enrolled in public schools. The age group of 3 to 4 year olds has the highest likelihood of being enrolled in private schools, with 32 (94.1% in the age bracket) enrolled. Conversely, the age group of 10 to 14 year olds has the lowest likelihood of being enrolled in a private school, with 240 (100.0% in the age bracket) attending a public institution.
| Age Bracket | Public School | Private School |
| 3 to 4 Year Olds | 2 (5.9%) | 32 (94.1%) |
| 5 to 9 Year Old | 183 (89.7%) | 21 (10.3%) |
| 10 to 14 Year Olds | 240 (100.0%) | 0 (0.0%) |
| 15 to 17 Year Olds | 193 (100.0%) | 0 (0.0%) |
| 18 to 19 Year Olds | 4,630 (99.4%) | 27 (0.6%) |
| 20 to 24 Year Olds | 3,050 (98.8%) | 37 (1.2%) |
| 25 to 34 Year Olds | 146 (91.2%) | 14 (8.7%) |
| 35 Years and over | 22 (71.0%) | 9 (29.0%) |
| Total | 8,468 (98.4%) | 138 (1.6%) |
Educational Attainment by Field of Study in Durham
Engineering (249 | 14.5%), literature & languages (167 | 9.7%), business (165 | 9.6%), bio, nature & agricultural (163 | 9.5%), and computers & mathematics (160 | 9.3%) are the most common fields of study among 1,717 individuals in Durham who have obtained a bachelor's degree or higher.
| Field of Study | # Graduates | % Graduates |
| Computers & Mathematics | 160 | 9.3% |
| Bio, Nature & Agricultural | 163 | 9.5% |
| Physical & Health Sciences | 69 | 4.0% |
| Psychology | 128 | 7.4% |
| Social Sciences | 135 | 7.9% |
| Engineering | 249 | 14.5% |
| Multidisciplinary Studies | 13 | 0.8% |
| Science & Technology | 29 | 1.7% |
| Business | 165 | 9.6% |
| Education | 129 | 7.5% |
| Literature & Languages | 167 | 9.7% |
| Liberal Arts & History | 77 | 4.5% |
| Visual & Performing Arts | 40 | 2.3% |
| Communications | 45 | 2.6% |
| Arts & Humanities | 148 | 8.6% |
| Total | 1,717 | 100.0% |
Transportation & Commute in Durham
Vehicle Availability by Sex in Durham
The most prevalent vehicle ownership categories in Durham are males with 2 vehicles (366, accounting for 47.8%) and females with 2 vehicles (287, making up 34.5%).
| Vehicles Available | Male | Female |
| No Vehicle | 6 (0.8%) | 194 (18.3%) |
| 1 Vehicle | 148 (19.3%) | 219 (20.6%) |
| 2 Vehicles | 366 (47.8%) | 287 (27.1%) |
| 3 Vehicles | 193 (25.2%) | 286 (27.0%) |
| 4 Vehicles | 51 (6.7%) | 71 (6.7%) |
| 5 or more Vehicles | 2 (0.3%) | 4 (0.4%) |
| Total | 766 (100.0%) | 1,061 (100.0%) |
Commute Time in Durham
The most frequently occuring commute durations in Durham are 5 to 9 minutes (935 commuters, 27.6%), 15 to 19 minutes (598 commuters, 17.6%), and 10 to 14 minutes (372 commuters, 11.0%).
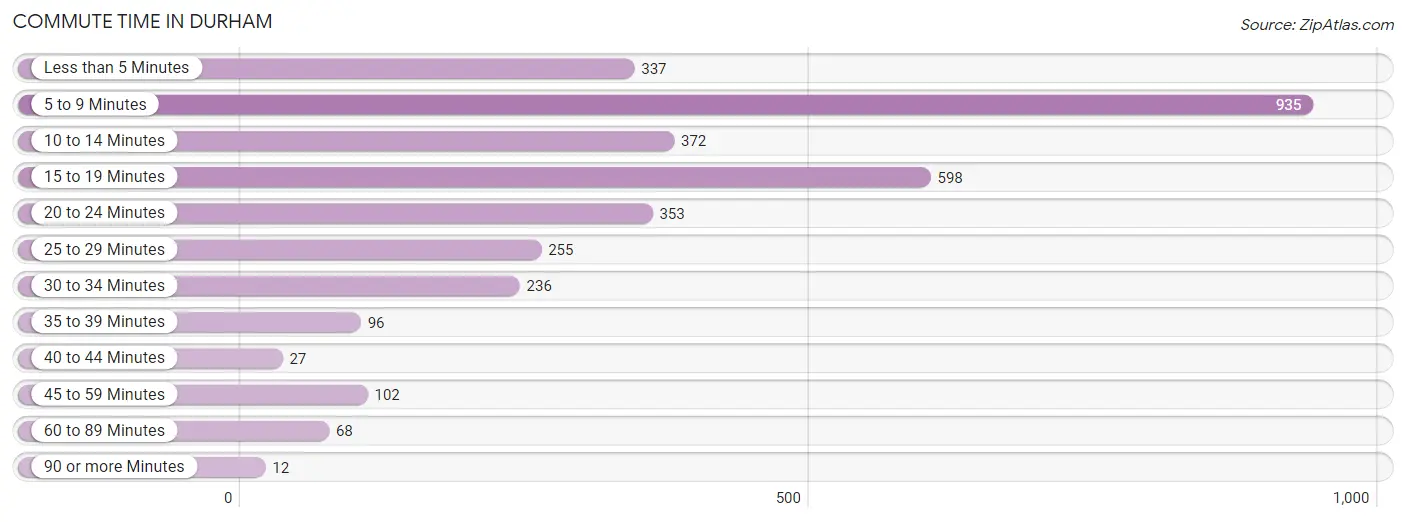
| Commute Time | # Commuters | % Commuters |
| Less than 5 Minutes | 337 | 9.9% |
| 5 to 9 Minutes | 935 | 27.6% |
| 10 to 14 Minutes | 372 | 11.0% |
| 15 to 19 Minutes | 598 | 17.6% |
| 20 to 24 Minutes | 353 | 10.4% |
| 25 to 29 Minutes | 255 | 7.5% |
| 30 to 34 Minutes | 236 | 7.0% |
| 35 to 39 Minutes | 96 | 2.8% |
| 40 to 44 Minutes | 27 | 0.8% |
| 45 to 59 Minutes | 102 | 3.0% |
| 60 to 89 Minutes | 68 | 2.0% |
| 90 or more Minutes | 12 | 0.4% |
Commute Time by Sex in Durham
The most common commute times in Durham are 5 to 9 minutes (470 commuters, 34.3%) for males and 5 to 9 minutes (465 commuters, 23.0%) for females.
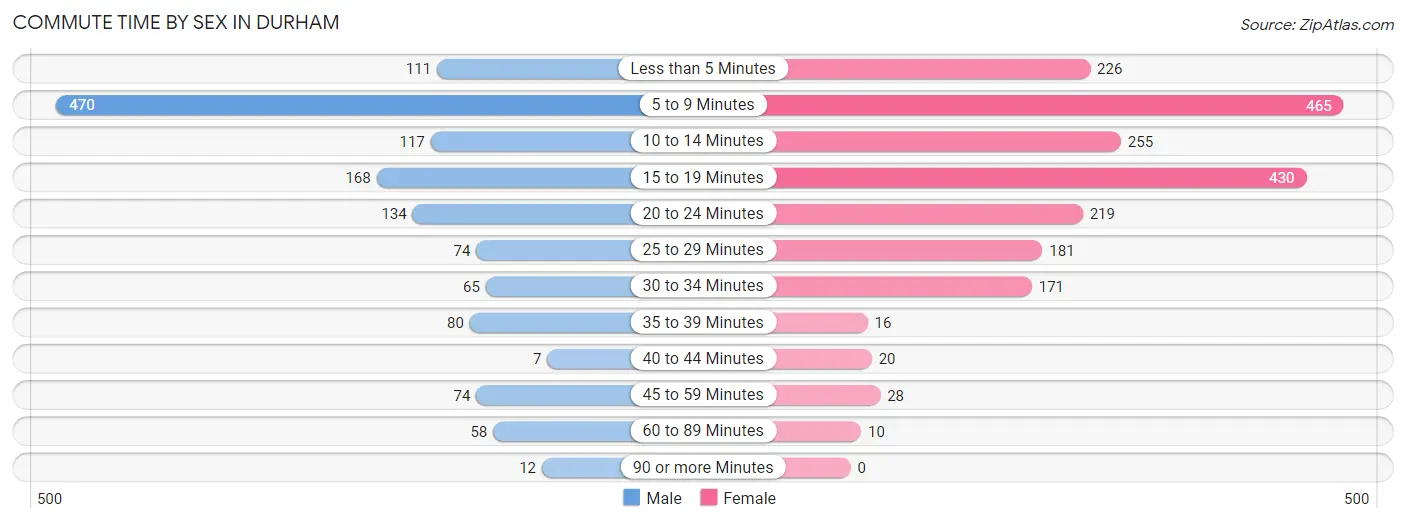
| Commute Time | Male | Female |
| Less than 5 Minutes | 111 (8.1%) | 226 (11.2%) |
| 5 to 9 Minutes | 470 (34.3%) | 465 (23.0%) |
| 10 to 14 Minutes | 117 (8.5%) | 255 (12.6%) |
| 15 to 19 Minutes | 168 (12.3%) | 430 (21.3%) |
| 20 to 24 Minutes | 134 (9.8%) | 219 (10.8%) |
| 25 to 29 Minutes | 74 (5.4%) | 181 (9.0%) |
| 30 to 34 Minutes | 65 (4.7%) | 171 (8.5%) |
| 35 to 39 Minutes | 80 (5.8%) | 16 (0.8%) |
| 40 to 44 Minutes | 7 (0.5%) | 20 (1.0%) |
| 45 to 59 Minutes | 74 (5.4%) | 28 (1.4%) |
| 60 to 89 Minutes | 58 (4.2%) | 10 (0.5%) |
| 90 or more Minutes | 12 (0.9%) | 0 (0.0%) |
Time of Departure to Work by Sex in Durham
The most frequent times of departure to work in Durham are 4:00 PM to 11:59 PM (275, 20.1%) for males and 12:00 PM to 3:59 PM (479, 23.7%) for females.
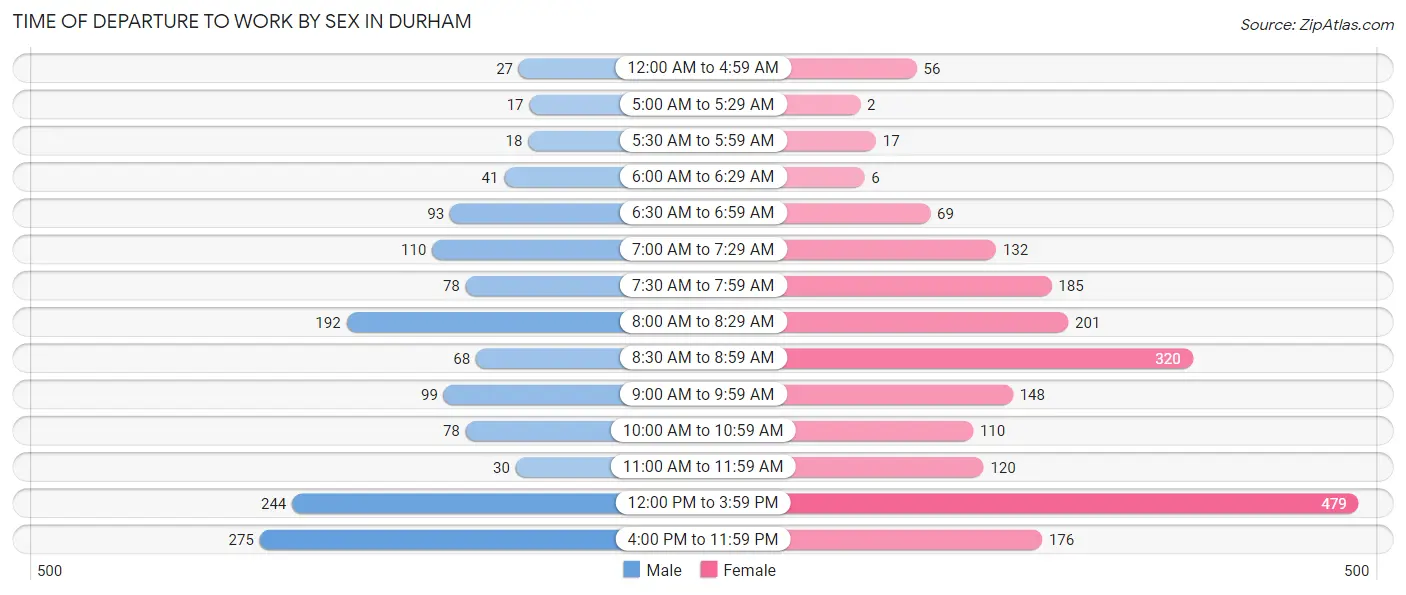
| Time of Departure | Male | Female |
| 12:00 AM to 4:59 AM | 27 (2.0%) | 56 (2.8%) |
| 5:00 AM to 5:29 AM | 17 (1.2%) | 2 (0.1%) |
| 5:30 AM to 5:59 AM | 18 (1.3%) | 17 (0.8%) |
| 6:00 AM to 6:29 AM | 41 (3.0%) | 6 (0.3%) |
| 6:30 AM to 6:59 AM | 93 (6.8%) | 69 (3.4%) |
| 7:00 AM to 7:29 AM | 110 (8.0%) | 132 (6.5%) |
| 7:30 AM to 7:59 AM | 78 (5.7%) | 185 (9.1%) |
| 8:00 AM to 8:29 AM | 192 (14.0%) | 201 (10.0%) |
| 8:30 AM to 8:59 AM | 68 (5.0%) | 320 (15.8%) |
| 9:00 AM to 9:59 AM | 99 (7.2%) | 148 (7.3%) |
| 10:00 AM to 10:59 AM | 78 (5.7%) | 110 (5.4%) |
| 11:00 AM to 11:59 AM | 30 (2.2%) | 120 (5.9%) |
| 12:00 PM to 3:59 PM | 244 (17.8%) | 479 (23.7%) |
| 4:00 PM to 11:59 PM | 275 (20.1%) | 176 (8.7%) |
| Total | 1,370 (100.0%) | 2,021 (100.0%) |
Housing Occupancy in Durham
Occupancy by Ownership in Durham
Of the total 1,428 dwellings in Durham, owner-occupied units account for 773 (54.1%), while renter-occupied units make up 655 (45.9%).
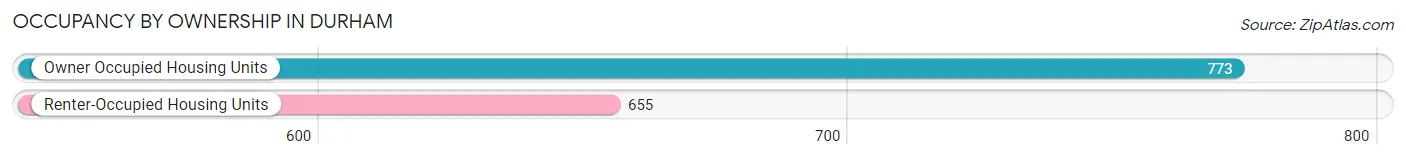
| Occupancy | # Housing Units | % Housing Units |
| Owner Occupied Housing Units | 773 | 54.1% |
| Renter-Occupied Housing Units | 655 | 45.9% |
| Total Occupied Housing Units | 1,428 | 100.0% |
Occupancy by Household Size in Durham
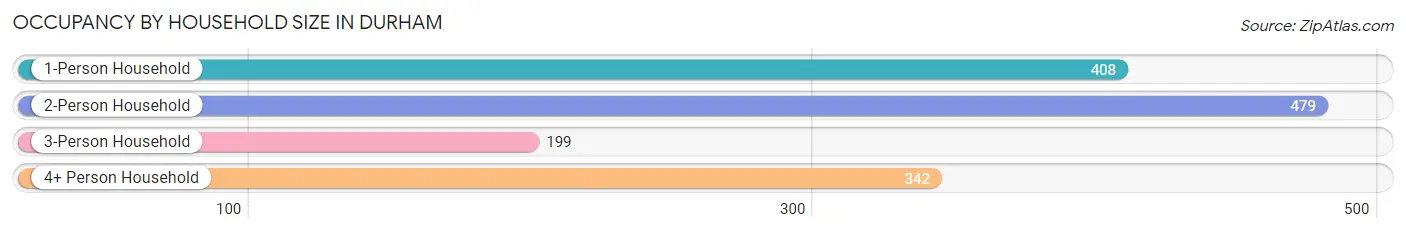
| Household Size | # Housing Units | % Housing Units |
| 1-Person Household | 408 | 28.6% |
| 2-Person Household | 479 | 33.5% |
| 3-Person Household | 199 | 13.9% |
| 4+ Person Household | 342 | 23.9% |
| Total Housing Units | 1,428 | 100.0% |
Occupancy by Ownership by Household Size in Durham
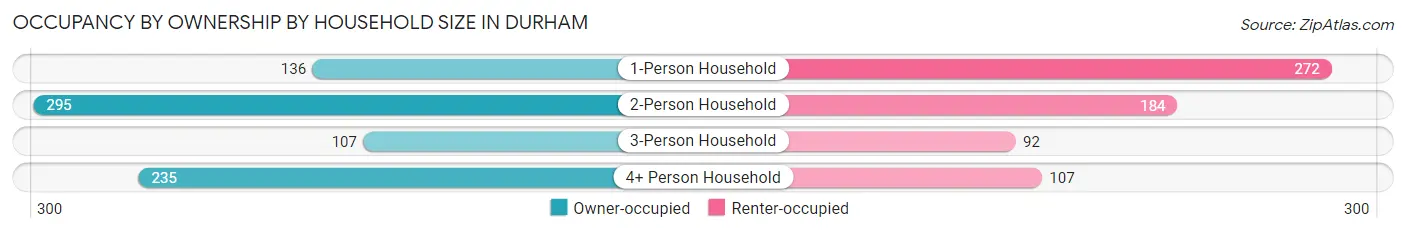
| Household Size | Owner-occupied | Renter-occupied |
| 1-Person Household | 136 (33.3%) | 272 (66.7%) |
| 2-Person Household | 295 (61.6%) | 184 (38.4%) |
| 3-Person Household | 107 (53.8%) | 92 (46.2%) |
| 4+ Person Household | 235 (68.7%) | 107 (31.3%) |
| Total Housing Units | 773 (54.1%) | 655 (45.9%) |
Occupancy by Educational Attainment in Durham
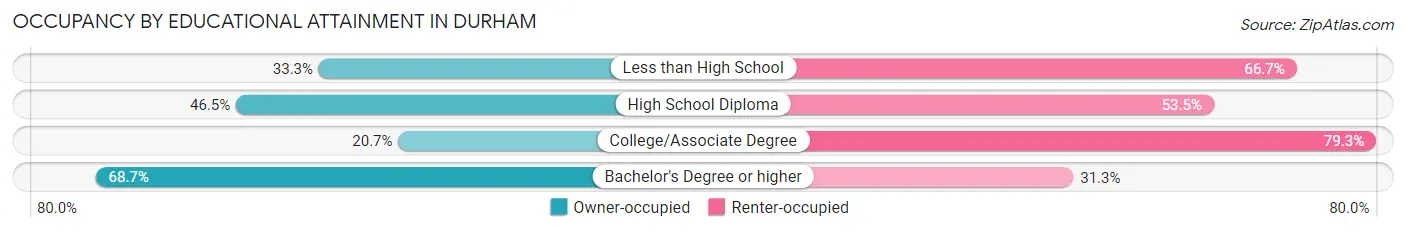
| Household Size | Owner-occupied | Renter-occupied |
| Less than High School | 6 (33.3%) | 12 (66.7%) |
| High School Diploma | 59 (46.5%) | 68 (53.5%) |
| College/Associate Degree | 75 (20.7%) | 287 (79.3%) |
| Bachelor's Degree or higher | 633 (68.7%) | 288 (31.3%) |
Occupancy by Age of Householder in Durham
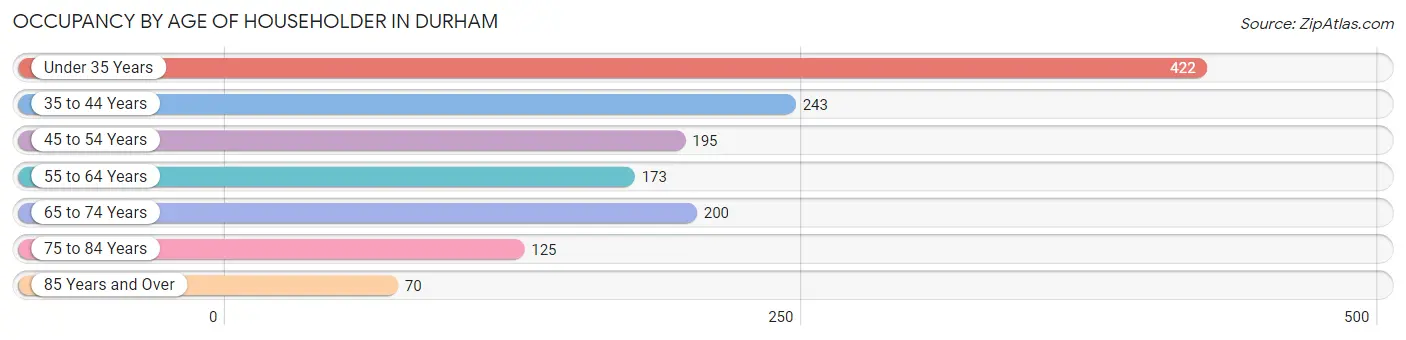
| Age Bracket | # Households | % Households |
| Under 35 Years | 422 | 29.5% |
| 35 to 44 Years | 243 | 17.0% |
| 45 to 54 Years | 195 | 13.7% |
| 55 to 64 Years | 173 | 12.1% |
| 65 to 74 Years | 200 | 14.0% |
| 75 to 84 Years | 125 | 8.7% |
| 85 Years and Over | 70 | 4.9% |
| Total | 1,428 | 100.0% |
Housing Finances in Durham
Median Income by Occupancy in Durham
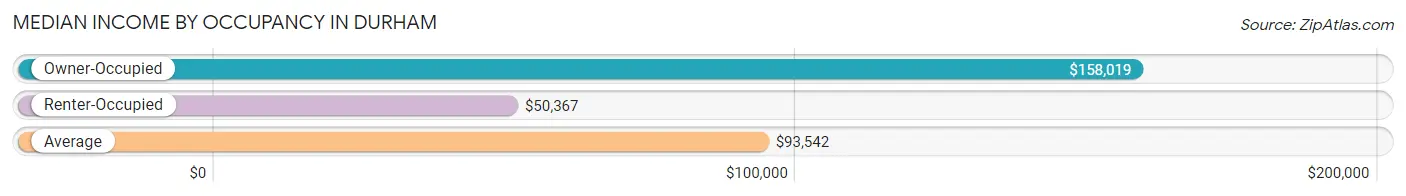
| Occupancy Type | # Households | Median Income |
| Owner-Occupied | 773 (54.1%) | $158,019 |
| Renter-Occupied | 655 (45.9%) | $50,367 |
| Average | 1,428 (100.0%) | $93,542 |
Occupancy by Householder Income Bracket in Durham
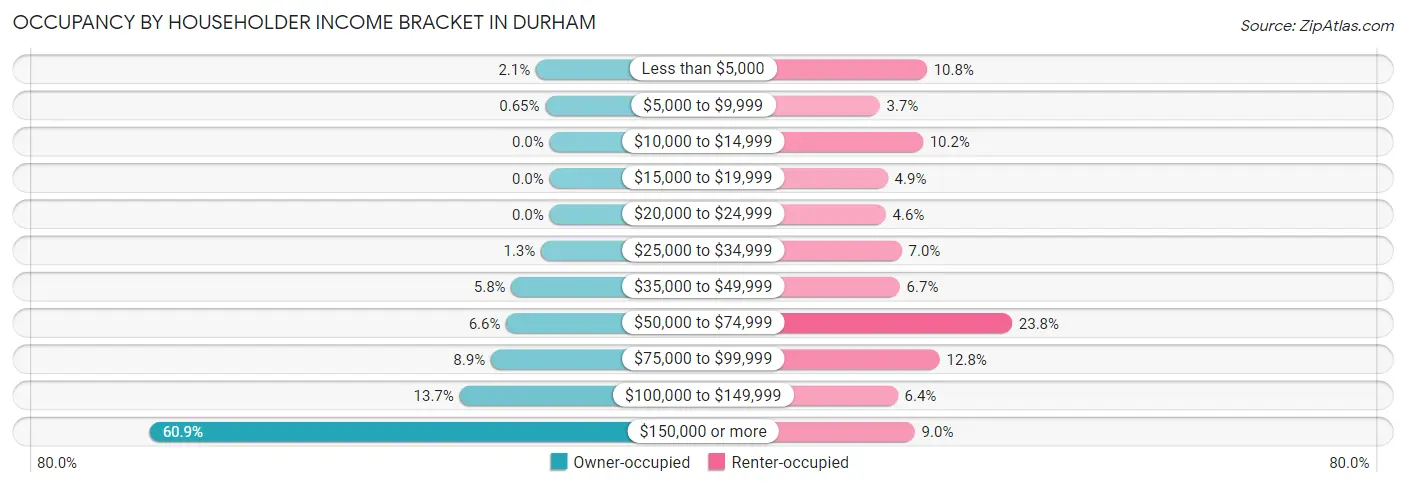
| Income Bracket | Owner-occupied | Renter-occupied |
| Less than $5,000 | 16 (2.1%) | 71 (10.8%) |
| $5,000 to $9,999 | 5 (0.6%) | 24 (3.7%) |
| $10,000 to $14,999 | 0 (0.0%) | 67 (10.2%) |
| $15,000 to $19,999 | 0 (0.0%) | 32 (4.9%) |
| $20,000 to $24,999 | 0 (0.0%) | 30 (4.6%) |
| $25,000 to $34,999 | 10 (1.3%) | 46 (7.0%) |
| $35,000 to $49,999 | 45 (5.8%) | 44 (6.7%) |
| $50,000 to $74,999 | 51 (6.6%) | 156 (23.8%) |
| $75,000 to $99,999 | 69 (8.9%) | 84 (12.8%) |
| $100,000 to $149,999 | 106 (13.7%) | 42 (6.4%) |
| $150,000 or more | 471 (60.9%) | 59 (9.0%) |
| Total | 773 (100.0%) | 655 (100.0%) |
Monthly Housing Cost Tiers in Durham
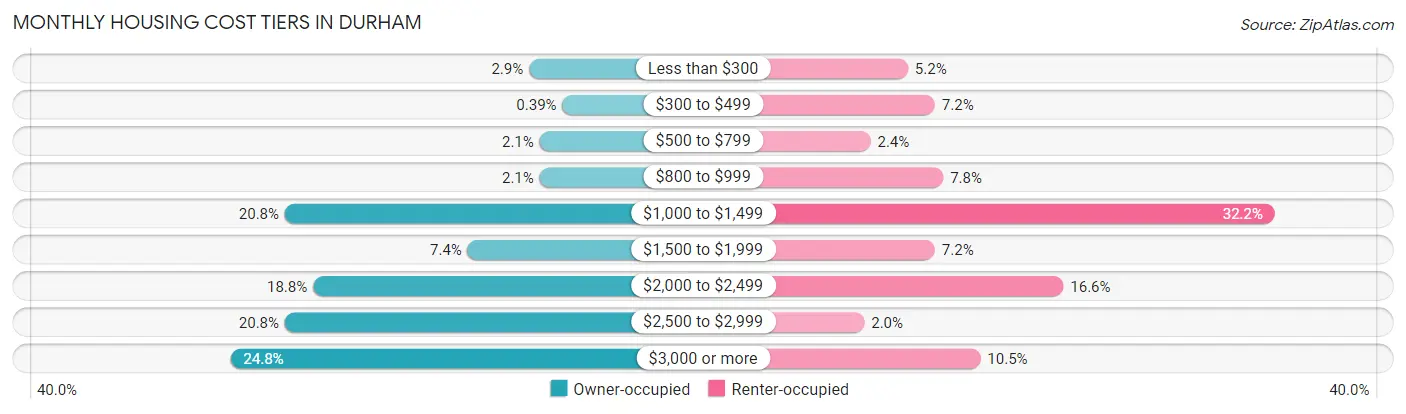
| Monthly Cost | Owner-occupied | Renter-occupied |
| Less than $300 | 22 (2.9%) | 34 (5.2%) |
| $300 to $499 | 3 (0.4%) | 47 (7.2%) |
| $500 to $799 | 16 (2.1%) | 16 (2.4%) |
| $800 to $999 | 16 (2.1%) | 51 (7.8%) |
| $1,000 to $1,499 | 161 (20.8%) | 211 (32.2%) |
| $1,500 to $1,999 | 57 (7.4%) | 47 (7.2%) |
| $2,000 to $2,499 | 145 (18.8%) | 109 (16.6%) |
| $2,500 to $2,999 | 161 (20.8%) | 13 (2.0%) |
| $3,000 or more | 192 (24.8%) | 69 (10.5%) |
| Total | 773 (100.0%) | 655 (100.0%) |
Physical Housing Characteristics in Durham
Housing Structures in Durham
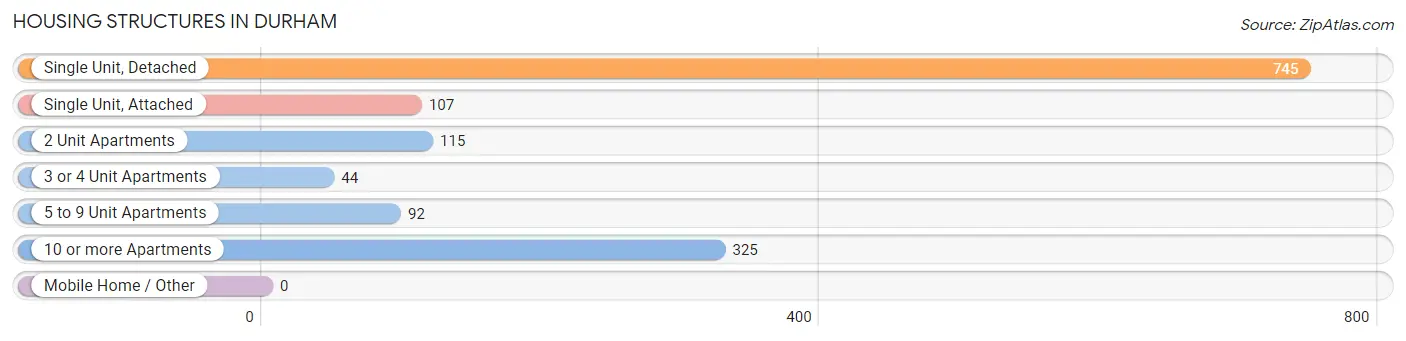
| Structure Type | # Housing Units | % Housing Units |
| Single Unit, Detached | 745 | 52.2% |
| Single Unit, Attached | 107 | 7.5% |
| 2 Unit Apartments | 115 | 8.1% |
| 3 or 4 Unit Apartments | 44 | 3.1% |
| 5 to 9 Unit Apartments | 92 | 6.4% |
| 10 or more Apartments | 325 | 22.8% |
| Mobile Home / Other | 0 | 0.0% |
| Total | 1,428 | 100.0% |
Housing Structures by Occupancy in Durham
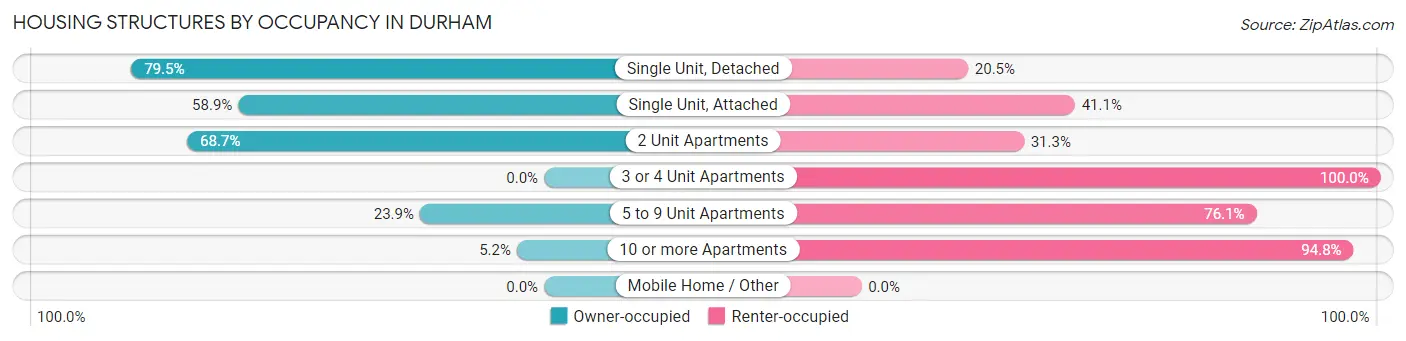
| Structure Type | Owner-occupied | Renter-occupied |
| Single Unit, Detached | 592 (79.5%) | 153 (20.5%) |
| Single Unit, Attached | 63 (58.9%) | 44 (41.1%) |
| 2 Unit Apartments | 79 (68.7%) | 36 (31.3%) |
| 3 or 4 Unit Apartments | 0 (0.0%) | 44 (100.0%) |
| 5 to 9 Unit Apartments | 22 (23.9%) | 70 (76.1%) |
| 10 or more Apartments | 17 (5.2%) | 308 (94.8%) |
| Mobile Home / Other | 0 (0.0%) | 0 (0.0%) |
| Total | 773 (54.1%) | 655 (45.9%) |
Housing Structures by Number of Rooms in Durham
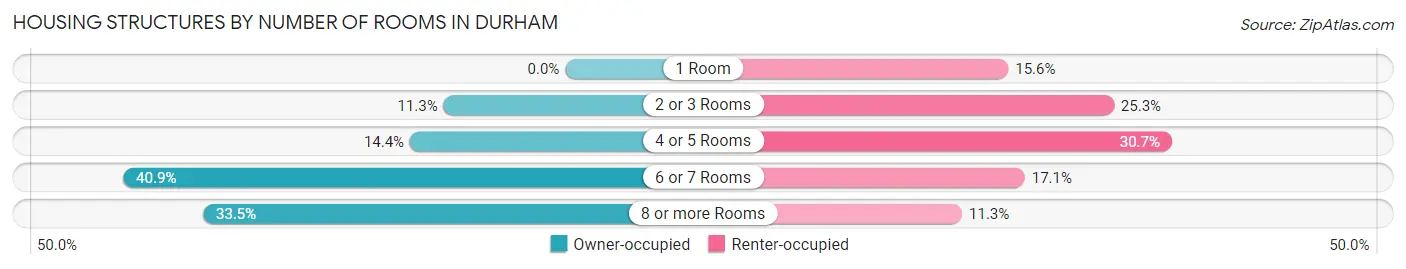
| Number of Rooms | Owner-occupied | Renter-occupied |
| 1 Room | 0 (0.0%) | 102 (15.6%) |
| 2 or 3 Rooms | 87 (11.3%) | 166 (25.3%) |
| 4 or 5 Rooms | 111 (14.4%) | 201 (30.7%) |
| 6 or 7 Rooms | 316 (40.9%) | 112 (17.1%) |
| 8 or more Rooms | 259 (33.5%) | 74 (11.3%) |
| Total | 773 (100.0%) | 655 (100.0%) |
Housing Structure by Heating Type in Durham
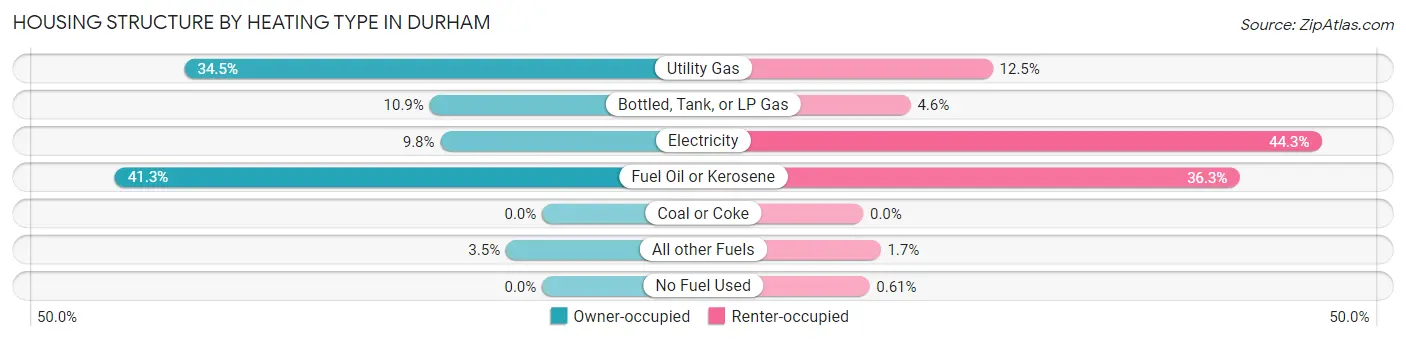
| Heating Type | Owner-occupied | Renter-occupied |
| Utility Gas | 267 (34.5%) | 82 (12.5%) |
| Bottled, Tank, or LP Gas | 84 (10.9%) | 30 (4.6%) |
| Electricity | 76 (9.8%) | 290 (44.3%) |
| Fuel Oil or Kerosene | 319 (41.3%) | 238 (36.3%) |
| Coal or Coke | 0 (0.0%) | 0 (0.0%) |
| All other Fuels | 27 (3.5%) | 11 (1.7%) |
| No Fuel Used | 0 (0.0%) | 4 (0.6%) |
| Total | 773 (100.0%) | 655 (100.0%) |
Household Vehicle Usage in Durham
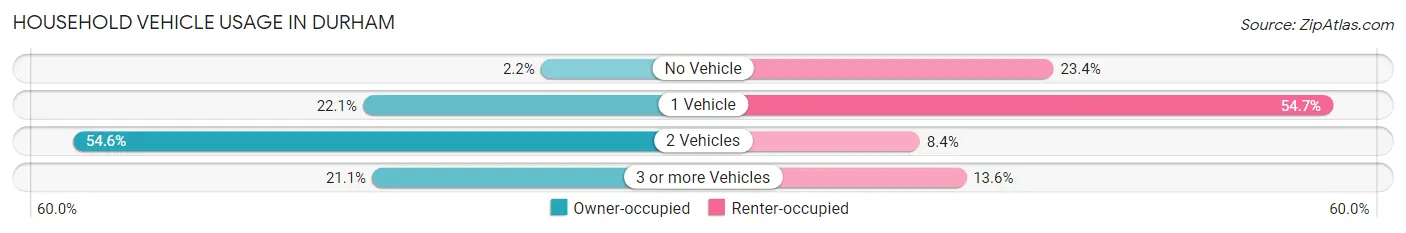
| Vehicles per Household | Owner-occupied | Renter-occupied |
| No Vehicle | 17 (2.2%) | 153 (23.4%) |
| 1 Vehicle | 171 (22.1%) | 358 (54.7%) |
| 2 Vehicles | 422 (54.6%) | 55 (8.4%) |
| 3 or more Vehicles | 163 (21.1%) | 89 (13.6%) |
| Total | 773 (100.0%) | 655 (100.0%) |
Real Estate & Mortgages in Durham
Real Estate and Mortgage Overview in Durham
| Characteristic | Without Mortgage | With Mortgage |
| Housing Units | 250 | 523 |
| Median Property Value | $433,000 | $430,700 |
| Median Household Income | $151,548 | $333 |
| Monthly Housing Costs | $1,282 | $192 |
| Real Estate Taxes | $9,160 | $0 |
Property Value by Mortgage Status in Durham
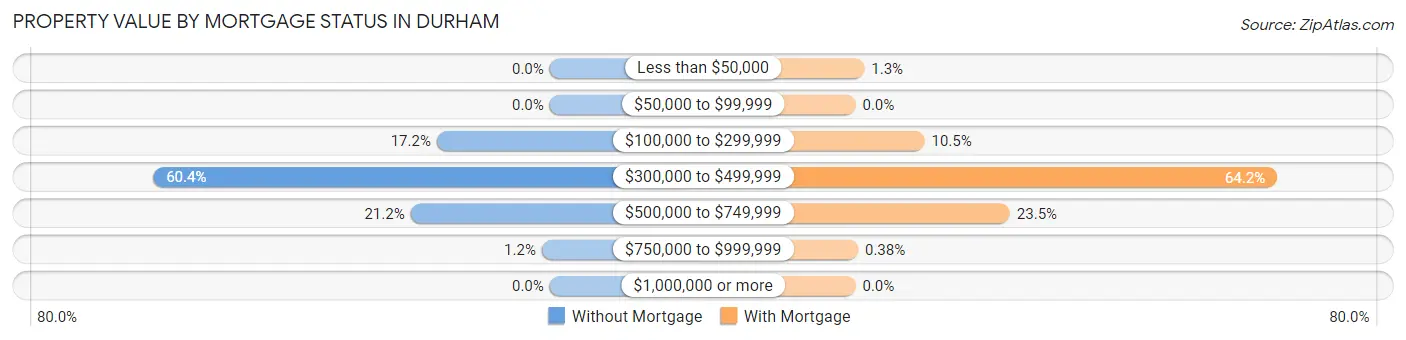
| Property Value | Without Mortgage | With Mortgage |
| Less than $50,000 | 0 (0.0%) | 7 (1.3%) |
| $50,000 to $99,999 | 0 (0.0%) | 0 (0.0%) |
| $100,000 to $299,999 | 43 (17.2%) | 55 (10.5%) |
| $300,000 to $499,999 | 151 (60.4%) | 336 (64.2%) |
| $500,000 to $749,999 | 53 (21.2%) | 123 (23.5%) |
| $750,000 to $999,999 | 3 (1.2%) | 2 (0.4%) |
| $1,000,000 or more | 0 (0.0%) | 0 (0.0%) |
| Total | 250 (100.0%) | 523 (100.0%) |
Household Income by Mortgage Status in Durham
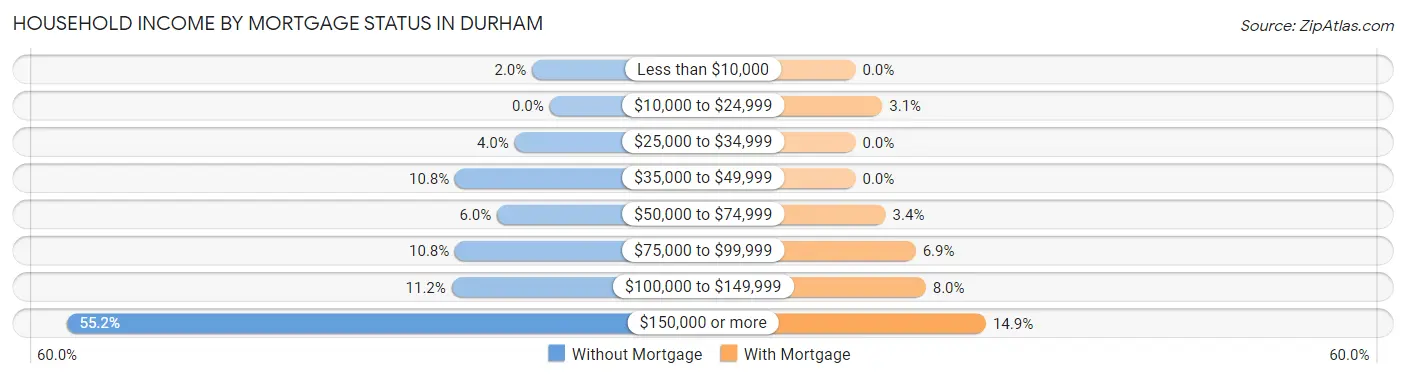
| Household Income | Without Mortgage | With Mortgage |
| Less than $10,000 | 5 (2.0%) | 0 (0.0%) |
| $10,000 to $24,999 | 0 (0.0%) | 16 (3.1%) |
| $25,000 to $34,999 | 10 (4.0%) | 0 (0.0%) |
| $35,000 to $49,999 | 27 (10.8%) | 0 (0.0%) |
| $50,000 to $74,999 | 15 (6.0%) | 18 (3.4%) |
| $75,000 to $99,999 | 27 (10.8%) | 36 (6.9%) |
| $100,000 to $149,999 | 28 (11.2%) | 42 (8.0%) |
| $150,000 or more | 138 (55.2%) | 78 (14.9%) |
| Total | 250 (100.0%) | 523 (100.0%) |
Property Value to Household Income Ratio in Durham
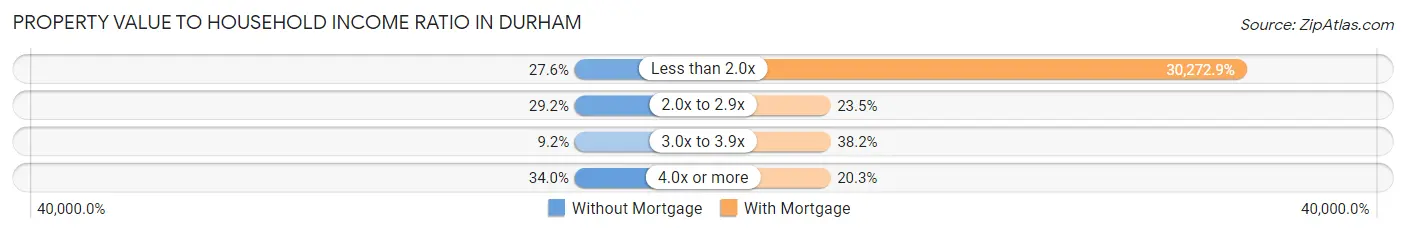
| Value-to-Income Ratio | Without Mortgage | With Mortgage |
| Less than 2.0x | 69 (27.6%) | 158,327 (30,272.8%) |
| 2.0x to 2.9x | 73 (29.2%) | 123 (23.5%) |
| 3.0x to 3.9x | 23 (9.2%) | 200 (38.2%) |
| 4.0x or more | 85 (34.0%) | 106 (20.3%) |
| Total | 250 (100.0%) | 523 (100.0%) |
Real Estate Taxes by Mortgage Status in Durham
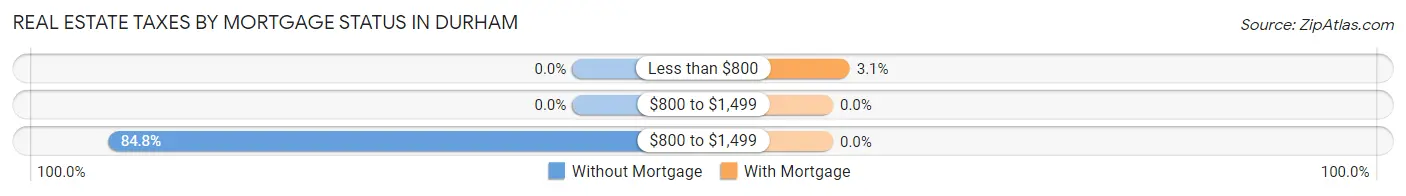
| Property Taxes | Without Mortgage | With Mortgage |
| Less than $800 | 0 (0.0%) | 16 (3.1%) |
| $800 to $1,499 | 0 (0.0%) | 0 (0.0%) |
| $800 to $1,499 | 212 (84.8%) | 0 (0.0%) |
| Total | 250 (100.0%) | 523 (100.0%) |
Health & Disability in Durham
Health Insurance Coverage by Age in Durham
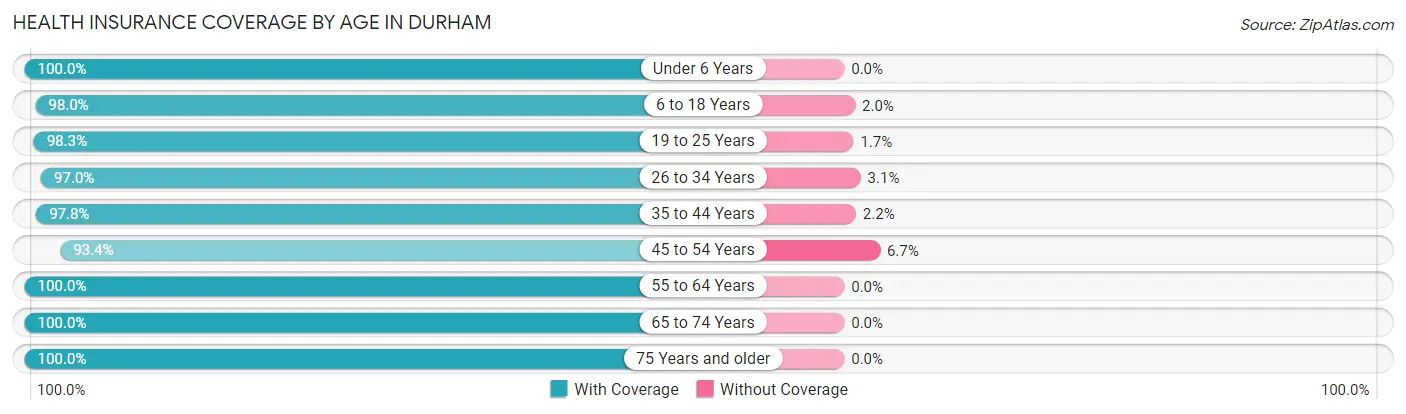
| Age Bracket | With Coverage | Without Coverage |
| Under 6 Years | 115 (100.0%) | 0 (0.0%) |
| 6 to 18 Years | 2,576 (98.0%) | 53 (2.0%) |
| 19 to 25 Years | 5,875 (98.3%) | 102 (1.7%) |
| 26 to 34 Years | 318 (97.0%) | 10 (3.0%) |
| 35 to 44 Years | 405 (97.8%) | 9 (2.2%) |
| 45 to 54 Years | 323 (93.3%) | 23 (6.7%) |
| 55 to 64 Years | 312 (100.0%) | 0 (0.0%) |
| 65 to 74 Years | 302 (100.0%) | 0 (0.0%) |
| 75 Years and older | 321 (100.0%) | 0 (0.0%) |
| Total | 10,547 (98.2%) | 197 (1.8%) |
Health Insurance Coverage by Citizenship Status in Durham
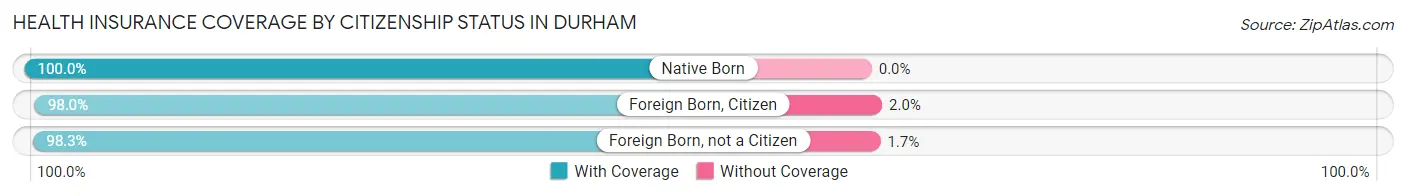
| Citizenship Status | With Coverage | Without Coverage |
| Native Born | 115 (100.0%) | 0 (0.0%) |
| Foreign Born, Citizen | 2,576 (98.0%) | 53 (2.0%) |
| Foreign Born, not a Citizen | 5,875 (98.3%) | 102 (1.7%) |
Health Insurance Coverage by Household Income in Durham
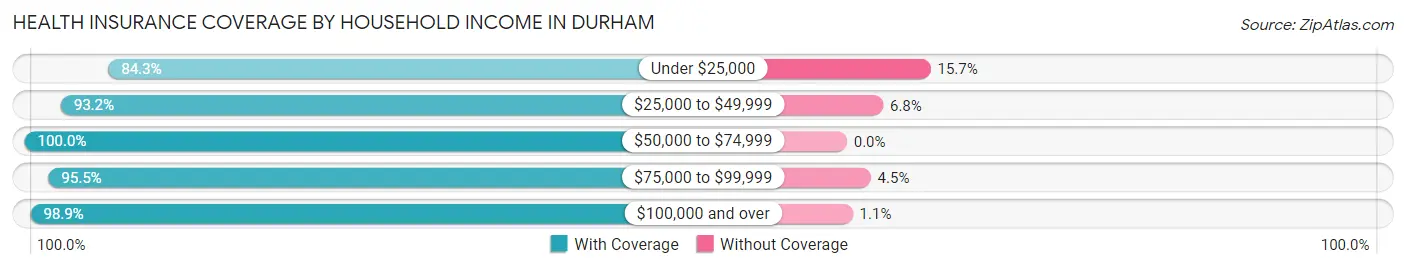
| Household Income | With Coverage | Without Coverage |
| Under $25,000 | 317 (84.3%) | 59 (15.7%) |
| $25,000 to $49,999 | 261 (93.2%) | 19 (6.8%) |
| $50,000 to $74,999 | 443 (100.0%) | 0 (0.0%) |
| $75,000 to $99,999 | 342 (95.5%) | 16 (4.5%) |
| $100,000 and over | 2,167 (98.9%) | 24 (1.1%) |
Public vs Private Health Insurance Coverage by Age in Durham
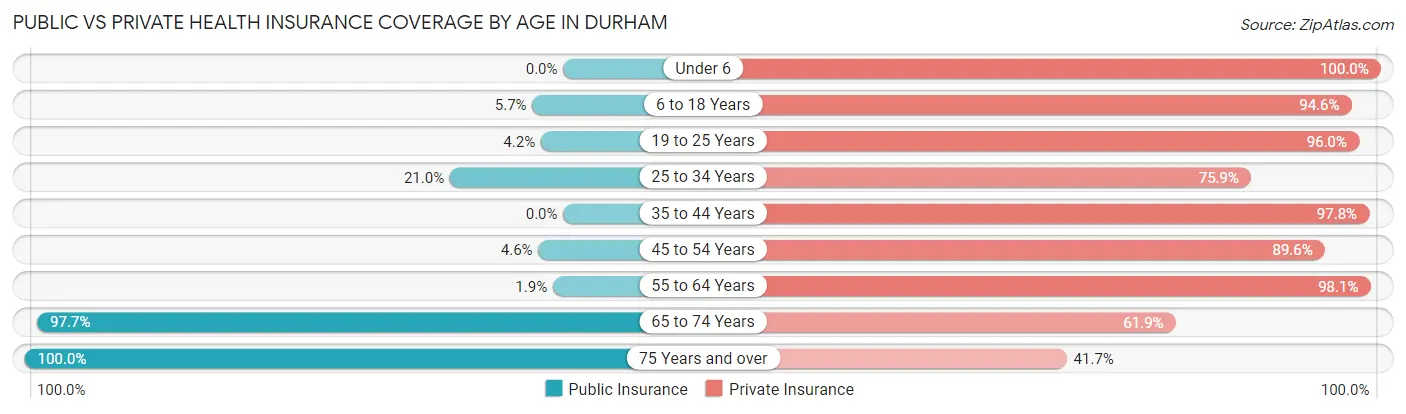
| Age Bracket | Public Insurance | Private Insurance |
| Under 6 | 0 (0.0%) | 115 (100.0%) |
| 6 to 18 Years | 151 (5.7%) | 2,486 (94.6%) |
| 19 to 25 Years | 248 (4.2%) | 5,736 (96.0%) |
| 25 to 34 Years | 69 (21.0%) | 249 (75.9%) |
| 35 to 44 Years | 0 (0.0%) | 405 (97.8%) |
| 45 to 54 Years | 16 (4.6%) | 310 (89.6%) |
| 55 to 64 Years | 6 (1.9%) | 306 (98.1%) |
| 65 to 74 Years | 295 (97.7%) | 187 (61.9%) |
| 75 Years and over | 321 (100.0%) | 134 (41.7%) |
| Total | 1,106 (10.3%) | 9,928 (92.4%) |
Disability Status by Sex by Age in Durham
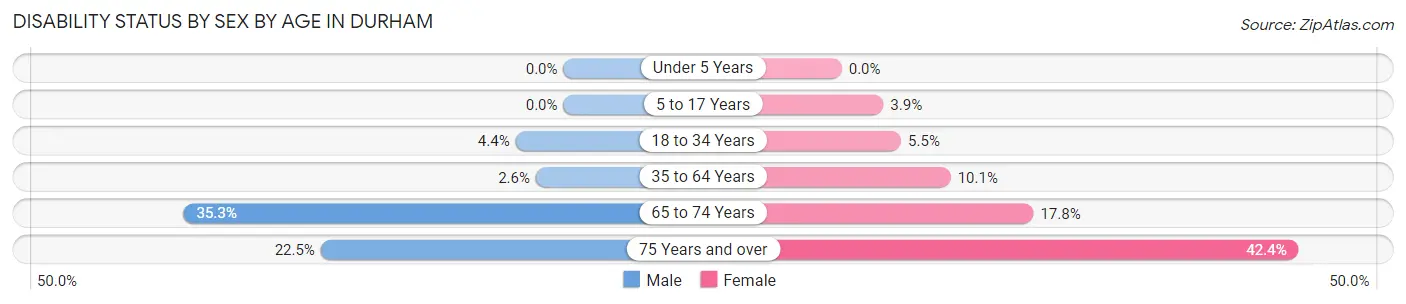
| Age Bracket | Male | Female |
| Under 5 Years | 0 (0.0%) | 0 (0.0%) |
| 5 to 17 Years | 0 (0.0%) | 11 (3.9%) |
| 18 to 34 Years | 167 (4.4%) | 252 (5.5%) |
| 35 to 64 Years | 13 (2.6%) | 57 (10.1%) |
| 65 to 74 Years | 49 (35.2%) | 29 (17.8%) |
| 75 Years and over | 25 (22.5%) | 89 (42.4%) |
Disability Class by Sex by Age in Durham
Disability Class: Hearing Difficulty
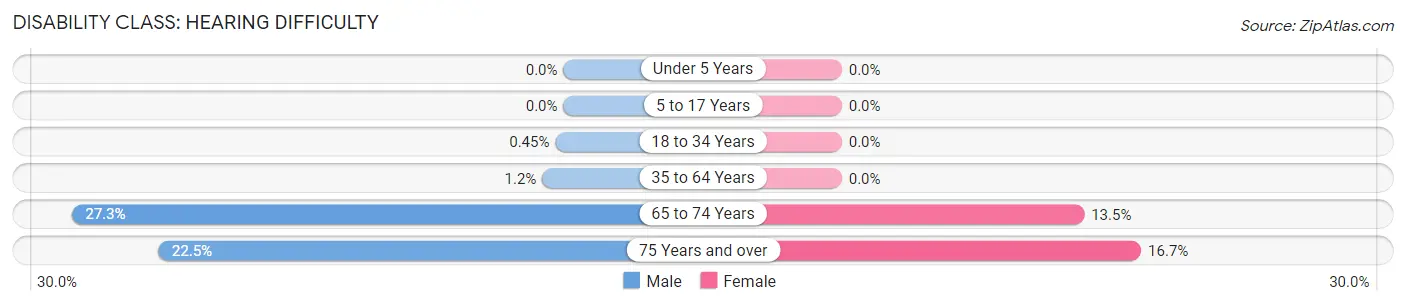
| Age Bracket | Male | Female |
| Under 5 Years | 0 (0.0%) | 0 (0.0%) |
| 5 to 17 Years | 0 (0.0%) | 0 (0.0%) |
| 18 to 34 Years | 17 (0.4%) | 0 (0.0%) |
| 35 to 64 Years | 6 (1.2%) | 0 (0.0%) |
| 65 to 74 Years | 38 (27.3%) | 22 (13.5%) |
| 75 Years and over | 25 (22.5%) | 35 (16.7%) |
Disability Class: Vision Difficulty
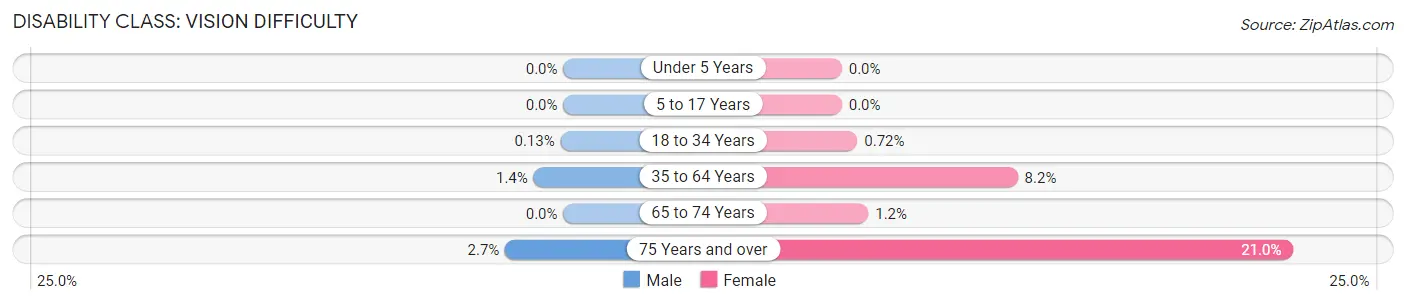
| Age Bracket | Male | Female |
| Under 5 Years | 0 (0.0%) | 0 (0.0%) |
| 5 to 17 Years | 0 (0.0%) | 0 (0.0%) |
| 18 to 34 Years | 5 (0.1%) | 33 (0.7%) |
| 35 to 64 Years | 7 (1.4%) | 46 (8.2%) |
| 65 to 74 Years | 0 (0.0%) | 2 (1.2%) |
| 75 Years and over | 3 (2.7%) | 44 (20.9%) |
Disability Class: Cognitive Difficulty
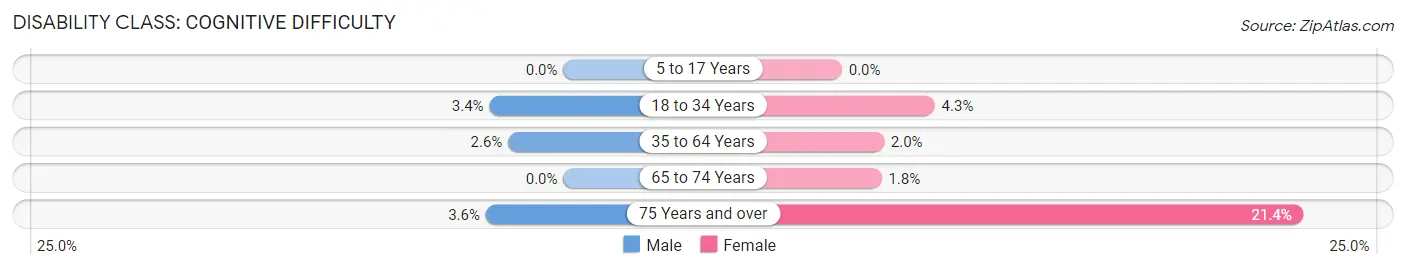
| Age Bracket | Male | Female |
| 5 to 17 Years | 0 (0.0%) | 0 (0.0%) |
| 18 to 34 Years | 129 (3.4%) | 197 (4.3%) |
| 35 to 64 Years | 13 (2.6%) | 11 (1.9%) |
| 65 to 74 Years | 0 (0.0%) | 3 (1.8%) |
| 75 Years and over | 4 (3.6%) | 45 (21.4%) |
Disability Class: Ambulatory Difficulty
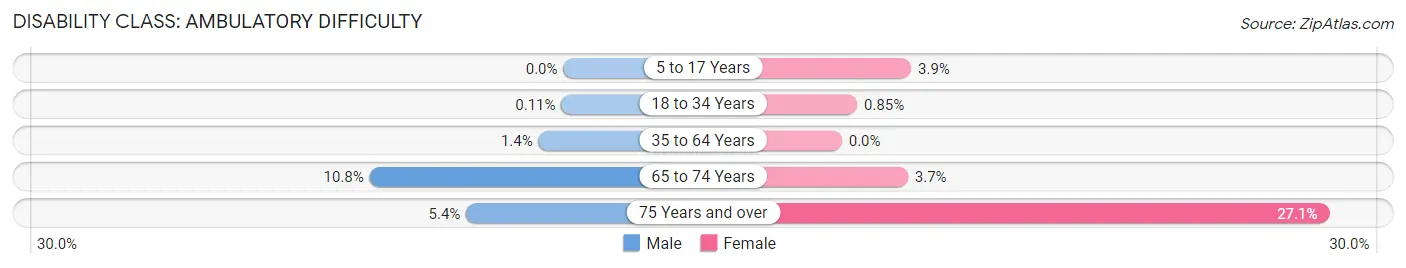
| Age Bracket | Male | Female |
| 5 to 17 Years | 0 (0.0%) | 11 (3.9%) |
| 18 to 34 Years | 4 (0.1%) | 39 (0.9%) |
| 35 to 64 Years | 7 (1.4%) | 0 (0.0%) |
| 65 to 74 Years | 15 (10.8%) | 6 (3.7%) |
| 75 Years and over | 6 (5.4%) | 57 (27.1%) |
Disability Class: Self-Care Difficulty
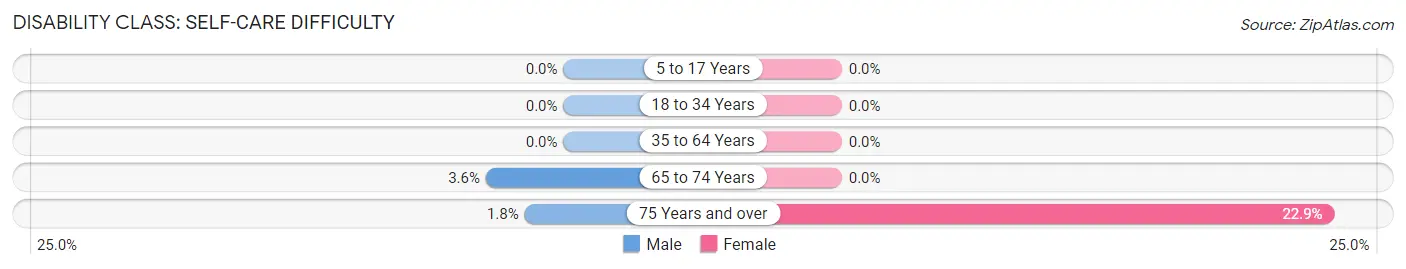
| Age Bracket | Male | Female |
| 5 to 17 Years | 0 (0.0%) | 0 (0.0%) |
| 18 to 34 Years | 0 (0.0%) | 0 (0.0%) |
| 35 to 64 Years | 0 (0.0%) | 0 (0.0%) |
| 65 to 74 Years | 5 (3.6%) | 0 (0.0%) |
| 75 Years and over | 2 (1.8%) | 48 (22.9%) |
Technology Access in Durham
Computing Device Access in Durham
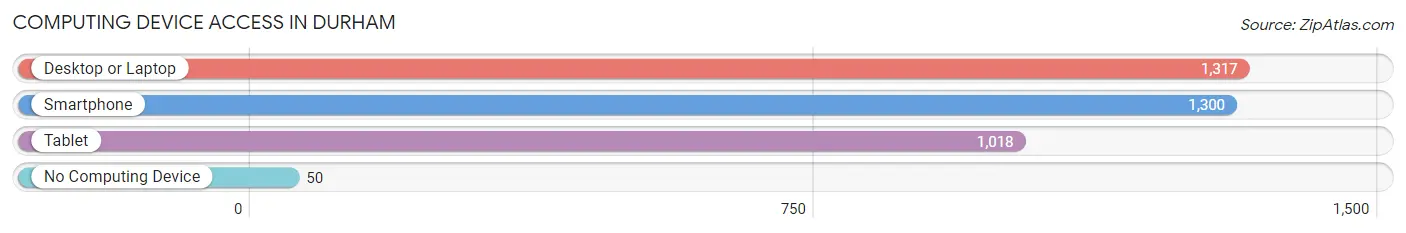
| Device Type | # Households | % Households |
| Desktop or Laptop | 1,317 | 92.2% |
| Smartphone | 1,300 | 91.0% |
| Tablet | 1,018 | 71.3% |
| No Computing Device | 50 | 3.5% |
| Total | 1,428 | 100.0% |
Internet Access in Durham
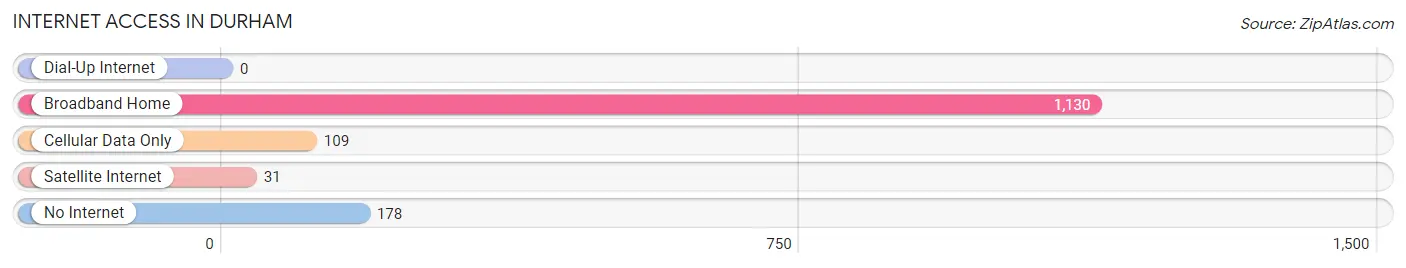
| Internet Type | # Households | % Households |
| Dial-Up Internet | 0 | 0.0% |
| Broadband Home | 1,130 | 79.1% |
| Cellular Data Only | 109 | 7.6% |
| Satellite Internet | 31 | 2.2% |
| No Internet | 178 | 12.5% |
| Total | 1,428 | 100.0% |
Durham Summary
Durham, New Hampshire is a small town located in the southeastern part of the state. It is part of the larger Seacoast region of New Hampshire and is situated along the Oyster River. The town has a population of approximately 14,638 people, according to the 2010 census.
Geography
Durham is located in Strafford County, New Hampshire, and is bordered by the towns of Madbury, Lee, Newmarket, and Dover. The town is situated on the Oyster River, which flows through the center of town. The town is also home to the University of New Hampshire, which is located on the western side of town. The town is located in the Piscataqua River watershed and is part of the Seacoast region of New Hampshire.
History
Durham was first settled in 1635 by colonists from England. The town was originally known as Oyster River Plantation and was part of the Massachusetts Bay Colony. In 1694, the town was granted a royal charter and was renamed Durham. The town was named after Durham, England, which was the hometown of the first settlers.
The town was an important center of shipbuilding during the Revolutionary War and was home to several shipyards. The town was also home to a number of mills, which produced lumber, textiles, and paper. The town was also home to a number of farms, which produced dairy products, vegetables, and fruit.
Economy
Durham is home to a number of businesses, including the University of New Hampshire, which is the largest employer in the town. The town is also home to a number of small businesses, including restaurants, retail stores, and professional services. The town is also home to a number of technology companies, including Oracle, which is located in the town.
The town is also home to a number of manufacturing companies, including the Durham Manufacturing Company, which produces a variety of products, including furniture, clothing, and medical supplies. The town is also home to a number of technology companies, including Oracle, which is located in the town.
Demographics
According to the 2010 census, the population of Durham was 14,638. The town has a median household income of $63,945 and a median family income of $77,945. The town has a population that is predominantly white, with approximately 87.3% of the population being white. The town also has a large population of college students, with approximately 25.3% of the population being enrolled in college.
Conclusion
Durham, New Hampshire is a small town located in the southeastern part of the state. It is part of the larger Seacoast region of New Hampshire and is situated along the Oyster River. The town has a population of approximately 14,638 people, according to the 2010 census. The town is home to a number of businesses, including the University of New Hampshire, which is the largest employer in the town. The town is also home to a number of small businesses, including restaurants, retail stores, and professional services. The town has a population that is predominantly white, with approximately 87.3% of the population being white. The town also has a large population of college students, with approximately 25.3% of the population being enrolled in college.
Common Questions
What is Per Capita Income in Durham?
Per Capita income in Durham is $22,065.
What is the Median Family Income in Durham?
Median Family Income in Durham is $155,948.
What is the Median Household income in Durham?
Median Household Income in Durham is $93,542.
What is Income or Wage Gap in Durham?
Income or Wage Gap in Durham is 10.7%.
Women in Durham earn 89.3 cents for every dollar earned by a man.
What is Inequality or Gini Index in Durham?
Inequality or Gini Index in Durham is 0.48.
What is the Total Population of Durham?
Total Population of Durham is 10,789.
What is the Total Male Population of Durham?
Total Male Population of Durham is 4,910.
What is the Total Female Population of Durham?
Total Female Population of Durham is 5,879.
What is the Ratio of Males per 100 Females in Durham?
There are 83.52 Males per 100 Females in Durham.
What is the Ratio of Females per 100 Males in Durham?
There are 119.74 Females per 100 Males in Durham.
What is the Median Population Age in Durham?
Median Population Age in Durham is 20.0 Years.
What is the Average Family Size in Durham
Average Family Size in Durham is 3.0 People.
What is the Average Household Size in Durham
Average Household Size in Durham is 2.5 People.
How Large is the Labor Force in Durham?
There are 5,482 People in the Labor Forcein in Durham.
What is the Percentage of People in the Labor Force in Durham?
53.7% of People are in the Labor Force in Durham.
What is the Unemployment Rate in Durham?
Unemployment Rate in Durham is 3.9%.