Atoka, TN Map & Demographics
Atoka Map
Atoka Overview
$37,187
PER CAPITA INCOME
$98,143
AVG FAMILY INCOME
$87,928
AVG HOUSEHOLD INCOME
38.8%
WAGE / INCOME GAP [ % ]
61.2¢/ $1
WAGE / INCOME GAP [ $ ]
0.37
INEQUALITY / GINI INDEX
10,070
TOTAL POPULATION
5,028
MALE POPULATION
5,042
FEMALE POPULATION
99.72
MALES / 100 FEMALES
100.28
FEMALES / 100 MALES
37.6
MEDIAN AGE
2.9
AVG FAMILY SIZE
2.6
AVG HOUSEHOLD SIZE
5,066
LABOR FORCE [ PEOPLE ]
65.5%
PERCENT IN LABOR FORCE
6.6%
UNEMPLOYMENT RATE
Atoka Zip Codes
Atoka Area Codes
Income in Atoka
Income Overview in Atoka
Per Capita Income in Atoka is $37,187, while median incomes of families and households are $98,143 and $87,928 respectively.
| Characteristic | Number | Measure |
| Per Capita Income | 10,070 | $37,187 |
| Median Family Income | 3,050 | $98,143 |
| Mean Family Income | 3,050 | $108,882 |
| Median Household Income | 3,793 | $87,928 |
| Mean Household Income | 3,793 | $100,958 |
| Income Deficit | 3,050 | $0 |
| Wage / Income Gap (%) | 10,070 | 38.81% |
| Wage / Income Gap ($) | 10,070 | 61.19¢ per $1 |
| Gini / Inequality Index | 10,070 | 0.37 |
Earnings by Sex in Atoka
Average Earnings in Atoka are $51,561, $69,799 for men and $42,710 for women, a difference of 38.8%.
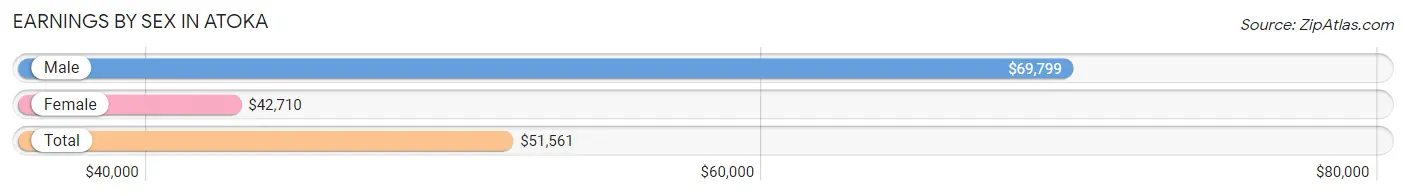
| Sex | Number | Average Earnings |
| Male | 2,675 (51.7%) | $69,799 |
| Female | 2,495 (48.3%) | $42,710 |
| Total | 5,170 (100.0%) | $51,561 |
Earnings by Sex by Income Bracket in Atoka
The most common earnings brackets in Atoka are $100,000+ for men (577 | 21.6%) and $50,000 to $54,999 for women (279 | 11.2%).
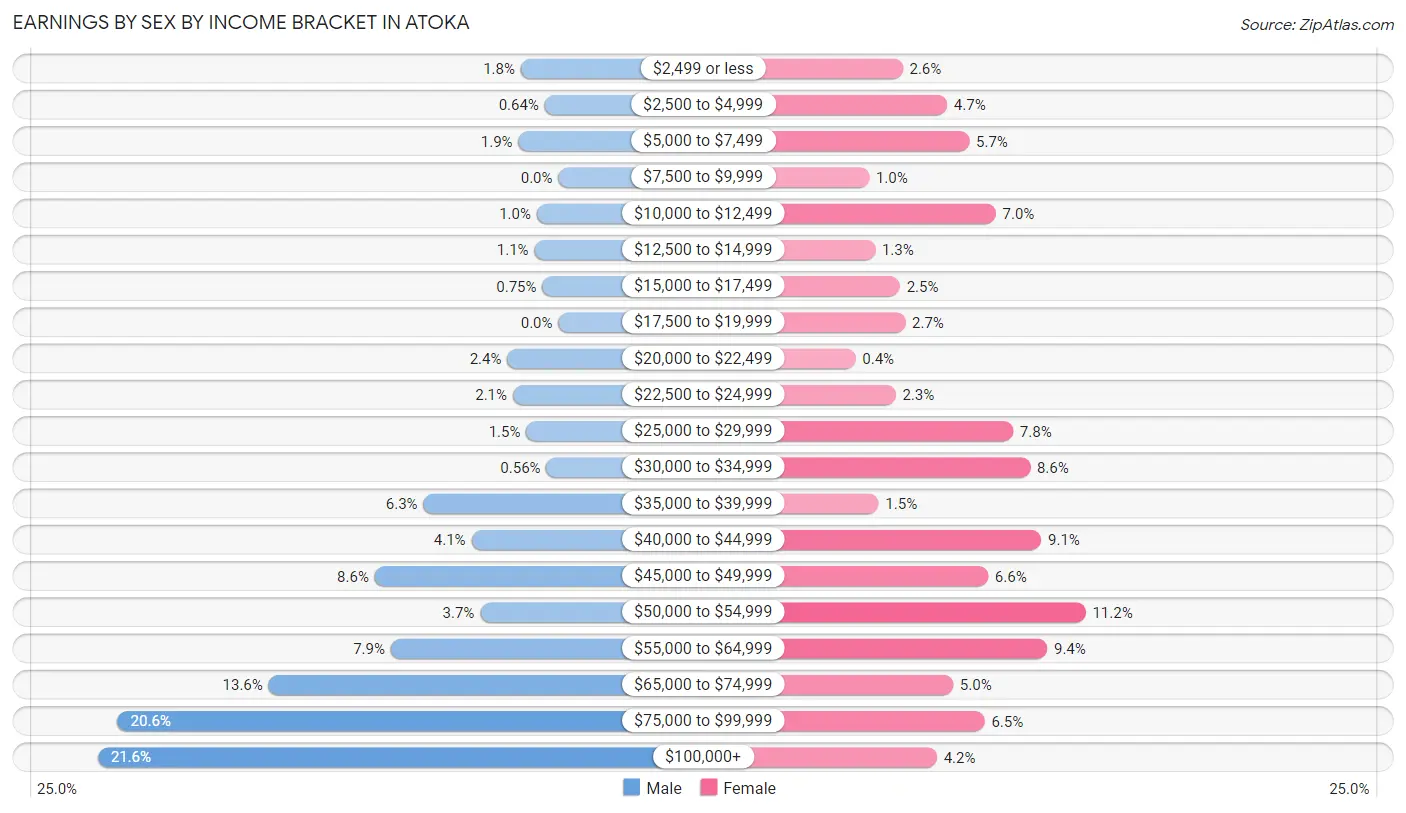
| Income | Male | Female |
| $2,499 or less | 47 (1.8%) | 65 (2.6%) |
| $2,500 to $4,999 | 17 (0.6%) | 117 (4.7%) |
| $5,000 to $7,499 | 50 (1.9%) | 143 (5.7%) |
| $7,500 to $9,999 | 0 (0.0%) | 26 (1.0%) |
| $10,000 to $12,499 | 27 (1.0%) | 174 (7.0%) |
| $12,500 to $14,999 | 30 (1.1%) | 33 (1.3%) |
| $15,000 to $17,499 | 20 (0.7%) | 62 (2.5%) |
| $17,500 to $19,999 | 0 (0.0%) | 68 (2.7%) |
| $20,000 to $22,499 | 64 (2.4%) | 10 (0.4%) |
| $22,500 to $24,999 | 57 (2.1%) | 57 (2.3%) |
| $25,000 to $29,999 | 40 (1.5%) | 194 (7.8%) |
| $30,000 to $34,999 | 15 (0.6%) | 214 (8.6%) |
| $35,000 to $39,999 | 169 (6.3%) | 37 (1.5%) |
| $40,000 to $44,999 | 109 (4.1%) | 227 (9.1%) |
| $45,000 to $49,999 | 230 (8.6%) | 165 (6.6%) |
| $50,000 to $54,999 | 98 (3.7%) | 279 (11.2%) |
| $55,000 to $64,999 | 210 (7.9%) | 234 (9.4%) |
| $65,000 to $74,999 | 363 (13.6%) | 124 (5.0%) |
| $75,000 to $99,999 | 552 (20.6%) | 161 (6.5%) |
| $100,000+ | 577 (21.6%) | 105 (4.2%) |
| Total | 2,675 (100.0%) | 2,495 (100.0%) |
Earnings by Sex by Educational Attainment in Atoka
Average earnings in Atoka are $71,165 for men and $43,584 for women, a difference of 38.8%. Men with an educational attainment of graduate degree enjoy the highest average annual earnings of $118,633, while those with high school diploma education earn the least with $54,306. Women with an educational attainment of graduate degree earn the most with the average annual earnings of $58,516, while those with college or associate's degree education have the smallest earnings of $31,635.
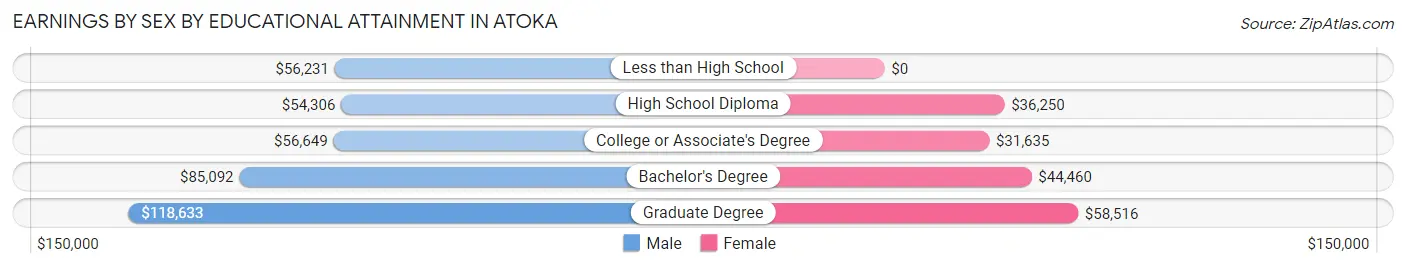
| Educational Attainment | Male Income | Female Income |
| Less than High School | $56,231 | $0 |
| High School Diploma | $54,306 | $36,250 |
| College or Associate's Degree | $56,649 | $31,635 |
| Bachelor's Degree | $85,092 | $44,460 |
| Graduate Degree | $118,633 | $58,516 |
| Total | $71,165 | $43,584 |
Family Income in Atoka
Family Income Brackets in Atoka
According to the Atoka family income data, there are 933 families falling into the $100,000 to $149,999 income range, which is the most common income bracket and makes up 30.6% of all families.
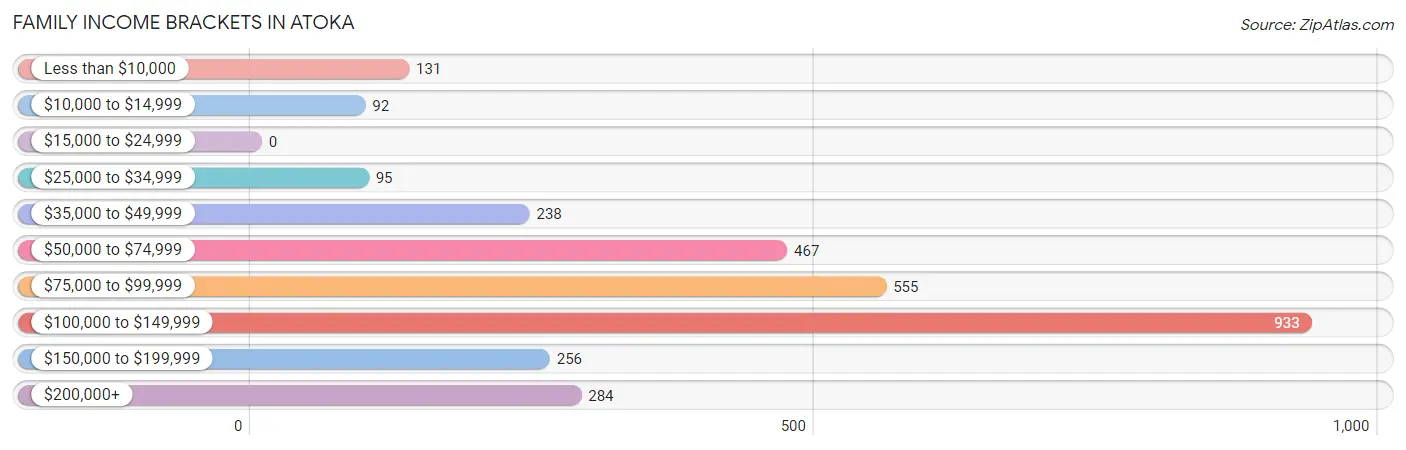
| Income Bracket | # Families | % Families |
| Less than $10,000 | 131 | 4.3% |
| $10,000 to $14,999 | 92 | 3.0% |
| $15,000 to $24,999 | 0 | 0.0% |
| $25,000 to $34,999 | 95 | 3.1% |
| $35,000 to $49,999 | 238 | 7.8% |
| $50,000 to $74,999 | 467 | 15.3% |
| $75,000 to $99,999 | 555 | 18.2% |
| $100,000 to $149,999 | 933 | 30.6% |
| $150,000 to $199,999 | 256 | 8.4% |
| $200,000+ | 284 | 9.3% |
Family Income by Famaliy Size in Atoka
4-person families (498 | 16.3%) account for the highest median family income in Atoka with $105,400 per family, while 2-person families (1,276 | 41.8%) have the highest median income of $44,758 per family member.
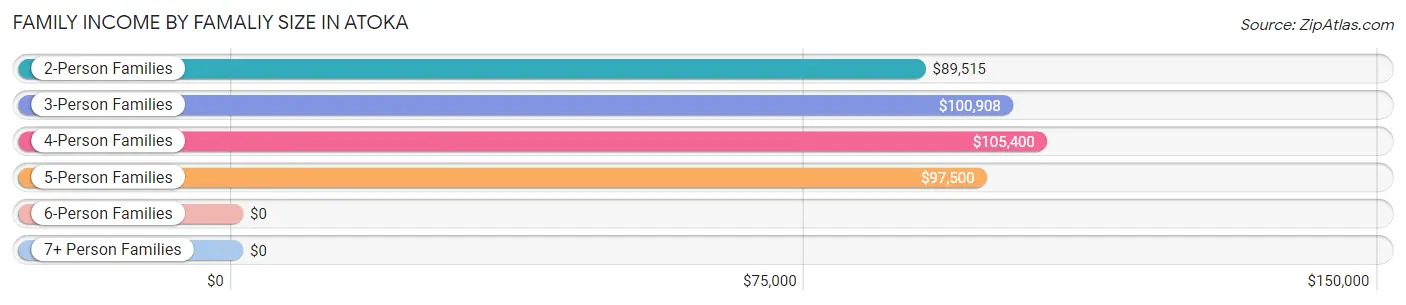
| Income Bracket | # Families | Median Income |
| 2-Person Families | 1,276 (41.8%) | $89,515 |
| 3-Person Families | 961 (31.5%) | $100,908 |
| 4-Person Families | 498 (16.3%) | $105,400 |
| 5-Person Families | 228 (7.5%) | $97,500 |
| 6-Person Families | 70 (2.3%) | $0 |
| 7+ Person Families | 17 (0.6%) | $0 |
| Total | 3,050 (100.0%) | $98,143 |
Family Income by Number of Earners in Atoka
The median family income in Atoka is $98,143, with families comprising 3+ earners (173) having the highest median family income of $137,772, while families with no earners (348) have the lowest median family income of $34,036, accounting for 5.7% and 11.4% of families, respectively.
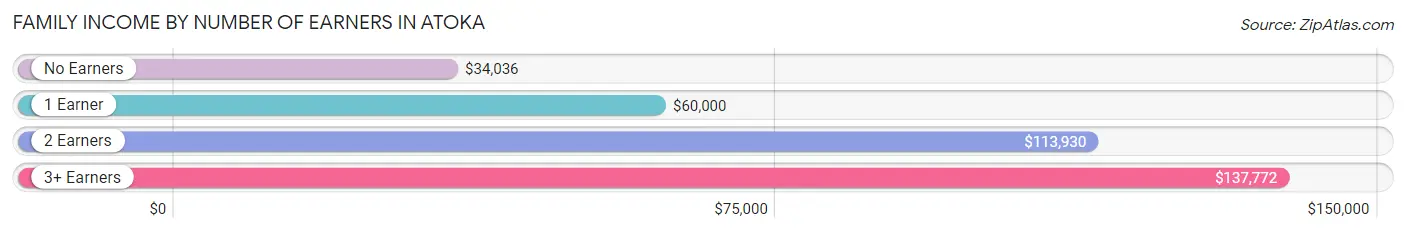
| Number of Earners | # Families | Median Income |
| No Earners | 348 (11.4%) | $34,036 |
| 1 Earner | 898 (29.4%) | $60,000 |
| 2 Earners | 1,631 (53.5%) | $113,930 |
| 3+ Earners | 173 (5.7%) | $137,772 |
| Total | 3,050 (100.0%) | $98,143 |
Household Income in Atoka
Household Income Brackets in Atoka
With 986 households falling in the category, the $100,000 to $149,999 income range is the most frequent in Atoka, accounting for 26.0% of all households. In contrast, only 38 households (1.0%) fall into the $15,000 to $24,999 income bracket, making it the least populous group.
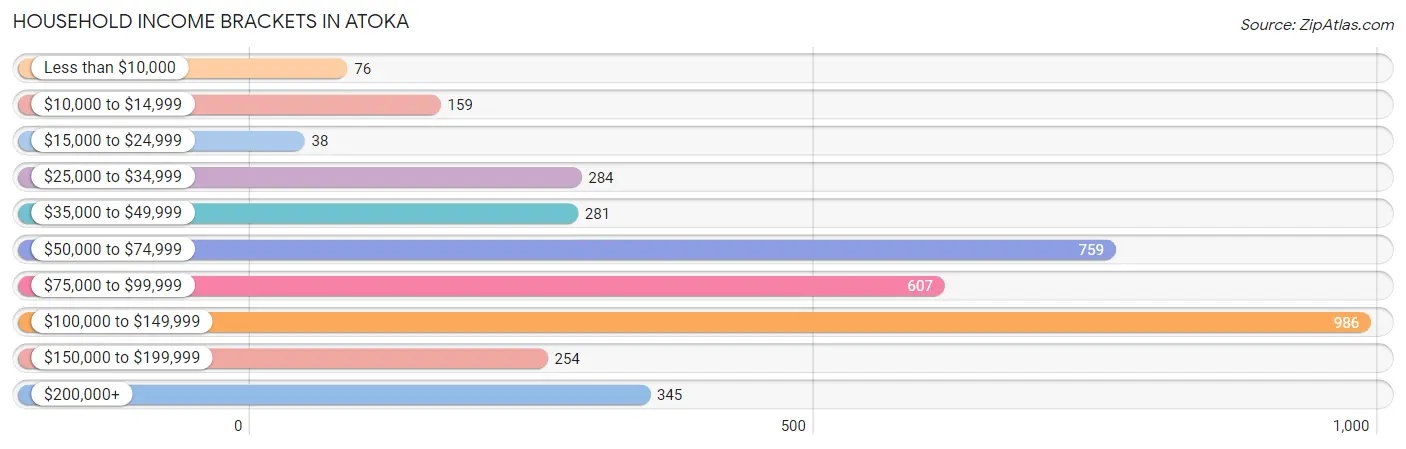
| Income Bracket | # Households | % Households |
| Less than $10,000 | 76 | 2.0% |
| $10,000 to $14,999 | 159 | 4.2% |
| $15,000 to $24,999 | 38 | 1.0% |
| $25,000 to $34,999 | 284 | 7.5% |
| $35,000 to $49,999 | 281 | 7.4% |
| $50,000 to $74,999 | 759 | 20.0% |
| $75,000 to $99,999 | 607 | 16.0% |
| $100,000 to $149,999 | 986 | 26.0% |
| $150,000 to $199,999 | 254 | 6.7% |
| $200,000+ | 345 | 9.1% |
Household Income by Householder Age in Atoka
The median household income in Atoka is $87,928, with the highest median household income of $95,096 found in the 45 to 64 years age bracket for the primary householder. A total of 1,587 households (41.8%) fall into this category. Meanwhile, the 15 to 24 years age bracket for the primary householder has the lowest median household income of $0, with 117 households (3.1%) in this group.
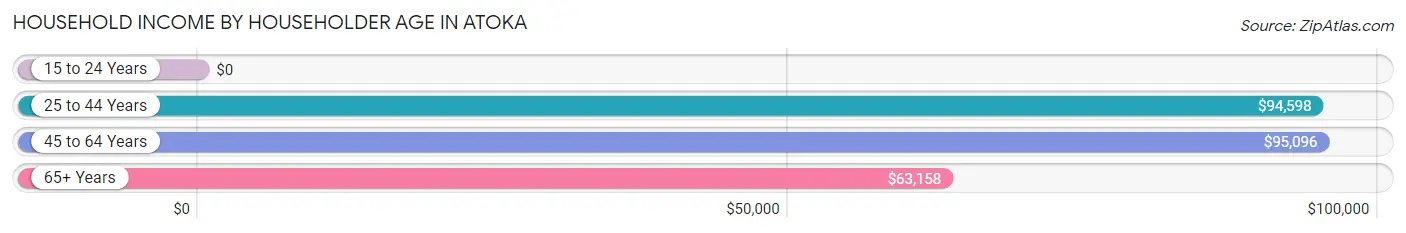
| Income Bracket | # Households | Median Income |
| 15 to 24 Years | 117 (3.1%) | $0 |
| 25 to 44 Years | 1,325 (34.9%) | $94,598 |
| 45 to 64 Years | 1,587 (41.8%) | $95,096 |
| 65+ Years | 764 (20.1%) | $63,158 |
| Total | 3,793 (100.0%) | $87,928 |
Poverty in Atoka
Income Below Poverty by Sex and Age in Atoka
With 4.5% poverty level for males and 12.1% for females among the residents of Atoka, 12 to 14 year old males and 16 and 17 year old females are the most vulnerable to poverty, with 53 males (25.2%) and 47 females (49.0%) in their respective age groups living below the poverty level.
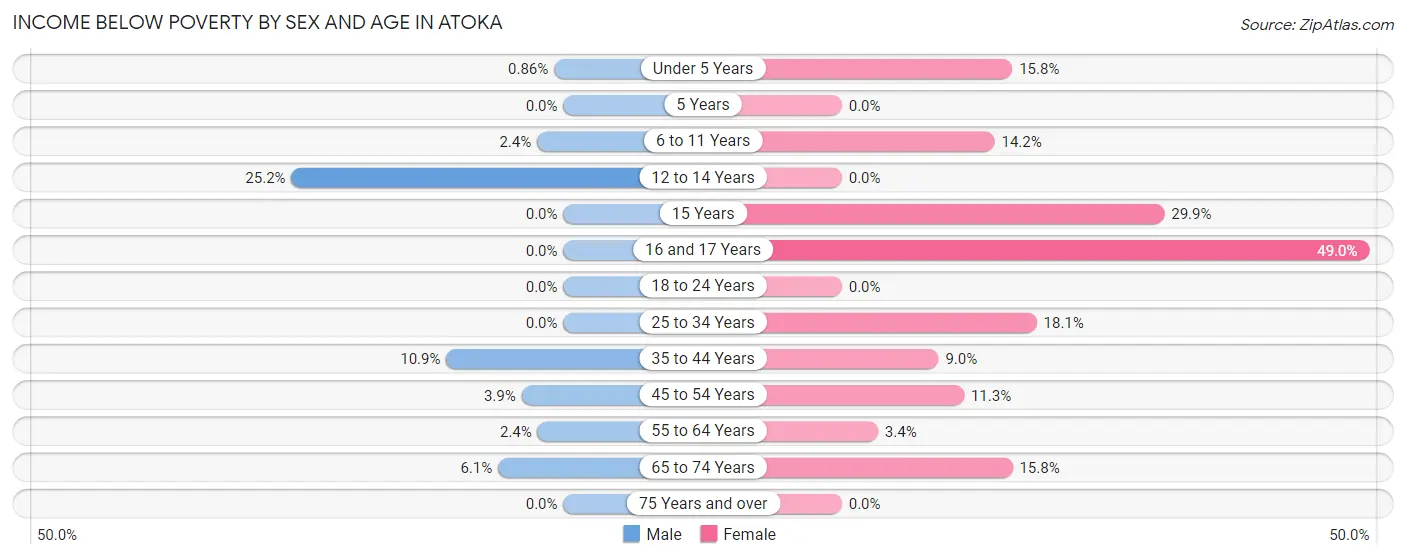
| Age Bracket | Male | Female |
| Under 5 Years | 3 (0.9%) | 47 (15.8%) |
| 5 Years | 0 (0.0%) | 0 (0.0%) |
| 6 to 11 Years | 11 (2.4%) | 92 (14.2%) |
| 12 to 14 Years | 53 (25.2%) | 0 (0.0%) |
| 15 Years | 0 (0.0%) | 44 (29.9%) |
| 16 and 17 Years | 0 (0.0%) | 47 (49.0%) |
| 18 to 24 Years | 0 (0.0%) | 0 (0.0%) |
| 25 to 34 Years | 0 (0.0%) | 141 (18.1%) |
| 35 to 44 Years | 87 (10.9%) | 73 (9.0%) |
| 45 to 54 Years | 30 (3.9%) | 93 (11.3%) |
| 55 to 64 Years | 18 (2.4%) | 18 (3.4%) |
| 65 to 74 Years | 24 (6.1%) | 54 (15.8%) |
| 75 Years and over | 0 (0.0%) | 0 (0.0%) |
| Total | 226 (4.5%) | 609 (12.1%) |
Income Above Poverty by Sex and Age in Atoka
According to the poverty statistics in Atoka, males aged 15 years and females aged 5 years are the age groups that are most secure financially, with 100.0% of males and 100.0% of females in these age groups living above the poverty line.
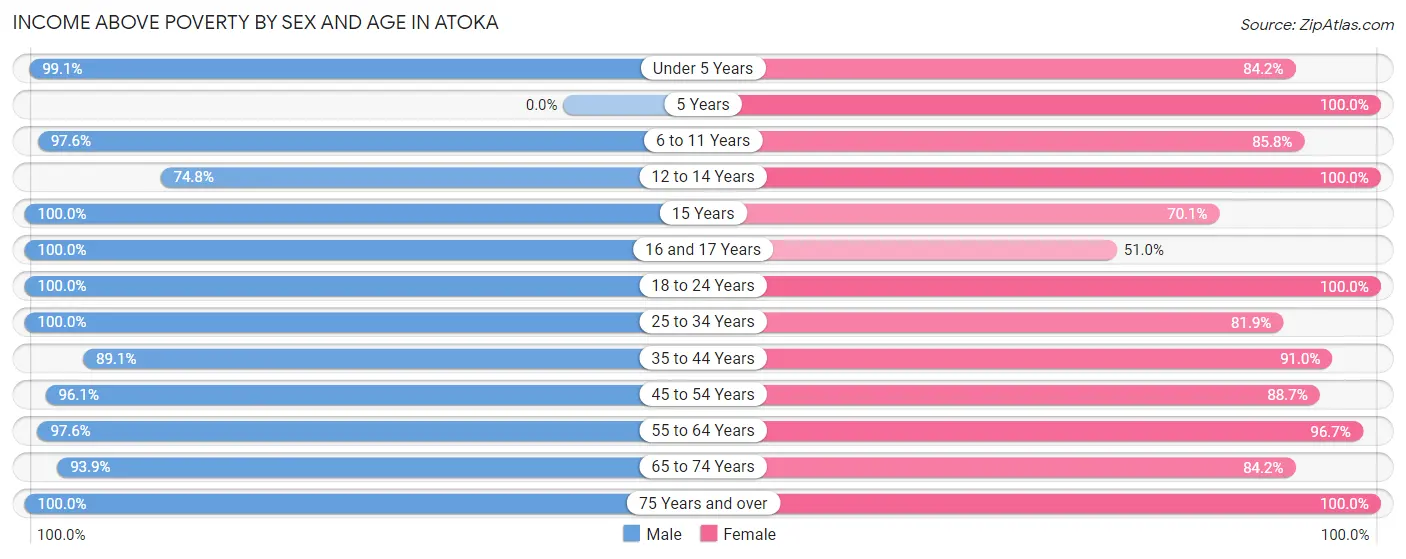
| Age Bracket | Male | Female |
| Under 5 Years | 347 (99.1%) | 250 (84.2%) |
| 5 Years | 0 (0.0%) | 27 (100.0%) |
| 6 to 11 Years | 439 (97.6%) | 557 (85.8%) |
| 12 to 14 Years | 157 (74.8%) | 86 (100.0%) |
| 15 Years | 72 (100.0%) | 103 (70.1%) |
| 16 and 17 Years | 186 (100.0%) | 49 (51.0%) |
| 18 to 24 Years | 298 (100.0%) | 196 (100.0%) |
| 25 to 34 Years | 567 (100.0%) | 639 (81.9%) |
| 35 to 44 Years | 714 (89.1%) | 741 (91.0%) |
| 45 to 54 Years | 743 (96.1%) | 727 (88.7%) |
| 55 to 64 Years | 735 (97.6%) | 519 (96.7%) |
| 65 to 74 Years | 372 (93.9%) | 287 (84.2%) |
| 75 Years and over | 141 (100.0%) | 236 (100.0%) |
| Total | 4,771 (95.5%) | 4,417 (87.9%) |
Income Below Poverty Among Married-Couple Families in Atoka
The poverty statistics for married-couple families in Atoka show that 4.4% or 103 of the total 2,344 families live below the poverty line. Families with 1 or 2 children have the highest poverty rate of 5.8%, comprising of 61 families. On the other hand, families with 3 or 4 children have the lowest poverty rate of 0.0%, which includes 0 families.
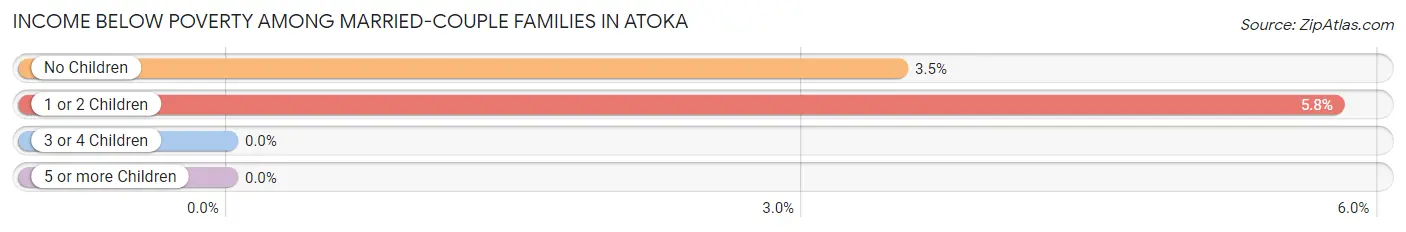
| Children | Above Poverty | Below Poverty |
| No Children | 1,159 (96.5%) | 42 (3.5%) |
| 1 or 2 Children | 995 (94.2%) | 61 (5.8%) |
| 3 or 4 Children | 79 (100.0%) | 0 (0.0%) |
| 5 or more Children | 8 (100.0%) | 0 (0.0%) |
| Total | 2,241 (95.6%) | 103 (4.4%) |
Income Below Poverty Among Single-Parent Households in Atoka
According to the poverty data in Atoka, 8.9% or 26 single-father households and 22.8% or 94 single-mother households are living below the poverty line. Among single-father households, those with 1 or 2 children have the highest poverty rate, with 26 households (17.4%) experiencing poverty. Likewise, among single-mother households, those with 3 or 4 children have the highest poverty rate, with 55 households (100.0%) falling below the poverty line.
| Children | Single Father | Single Mother |
| No Children | 0 (0.0%) | 39 (33.1%) |
| 1 or 2 Children | 26 (17.4%) | 0 (0.0%) |
| 3 or 4 Children | 0 (0.0%) | 55 (100.0%) |
| 5 or more Children | 0 (0.0%) | 0 (0.0%) |
| Total | 26 (8.9%) | 94 (22.8%) |
Income Below Poverty Among Married-Couple vs Single-Parent Households in Atoka
The poverty data for Atoka shows that 103 of the married-couple family households (4.4%) and 120 of the single-parent households (17.0%) are living below the poverty level. Within the married-couple family households, those with 1 or 2 children have the highest poverty rate, with 61 households (5.8%) falling below the poverty line. Among the single-parent households, those with 3 or 4 children have the highest poverty rate, with 55 household (100.0%) living below poverty.
| Children | Married-Couple Families | Single-Parent Households |
| No Children | 42 (3.5%) | 39 (14.9%) |
| 1 or 2 Children | 61 (5.8%) | 26 (6.7%) |
| 3 or 4 Children | 0 (0.0%) | 55 (100.0%) |
| 5 or more Children | 0 (0.0%) | 0 (0.0%) |
| Total | 103 (4.4%) | 120 (17.0%) |
Race in Atoka
The most populous races in Atoka are White / Caucasian (8,372 | 83.1%), Black / African American (1,137 | 11.3%), and Two or more Races (419 | 4.2%).
| Race | # Population | % Population |
| Asian | 120 | 1.2% |
| Black / African American | 1,137 | 11.3% |
| Hawaiian / Pacific | 0 | 0.0% |
| Hispanic or Latino | 257 | 2.5% |
| Native / Alaskan | 0 | 0.0% |
| White / Caucasian | 8,372 | 83.1% |
| Two or more Races | 419 | 4.2% |
| Some other Race | 22 | 0.2% |
| Total | 10,070 | 100.0% |
Ancestry in Atoka
The most populous ancestries reported in Atoka are American (2,275 | 22.6%), Irish (1,478 | 14.7%), German (1,338 | 13.3%), English (1,122 | 11.1%), and Polish (412 | 4.1%), together accounting for 65.8% of all Atoka residents.
| Ancestry | # Population | % Population |
| African | 153 | 1.5% |
| American | 2,275 | 22.6% |
| Bhutanese | 70 | 0.7% |
| British | 110 | 1.1% |
| Cherokee | 67 | 0.7% |
| Czech | 77 | 0.8% |
| Dutch | 80 | 0.8% |
| English | 1,122 | 11.1% |
| European | 233 | 2.3% |
| Finnish | 26 | 0.3% |
| French | 67 | 0.7% |
| French Canadian | 25 | 0.3% |
| German | 1,338 | 13.3% |
| Irish | 1,478 | 14.7% |
| Italian | 99 | 1.0% |
| Korean | 68 | 0.7% |
| Lithuanian | 43 | 0.4% |
| Mexican | 206 | 2.1% |
| Norwegian | 30 | 0.3% |
| Polish | 412 | 4.1% |
| Puerto Rican | 32 | 0.3% |
| Russian | 13 | 0.1% |
| Scandinavian | 40 | 0.4% |
| Scotch-Irish | 205 | 2.0% |
| Scottish | 265 | 2.6% |
| Spaniard | 19 | 0.2% |
| Sri Lankan | 128 | 1.3% |
| Subsaharan African | 153 | 1.5% |
| Swedish | 53 | 0.5% |
| Swiss | 19 | 0.2% |
| Thai | 25 | 0.3% |
| Welsh | 74 | 0.7% | View All 32 Rows |
Immigrants in Atoka
The most numerous immigrant groups reported in Atoka came from Asia (83 | 0.8%), Africa (77 | 0.8%), Sierra Leone (77 | 0.8%), Western Africa (77 | 0.8%), and Europe (63 | 0.6%), together accounting for 3.7% of all Atoka residents.
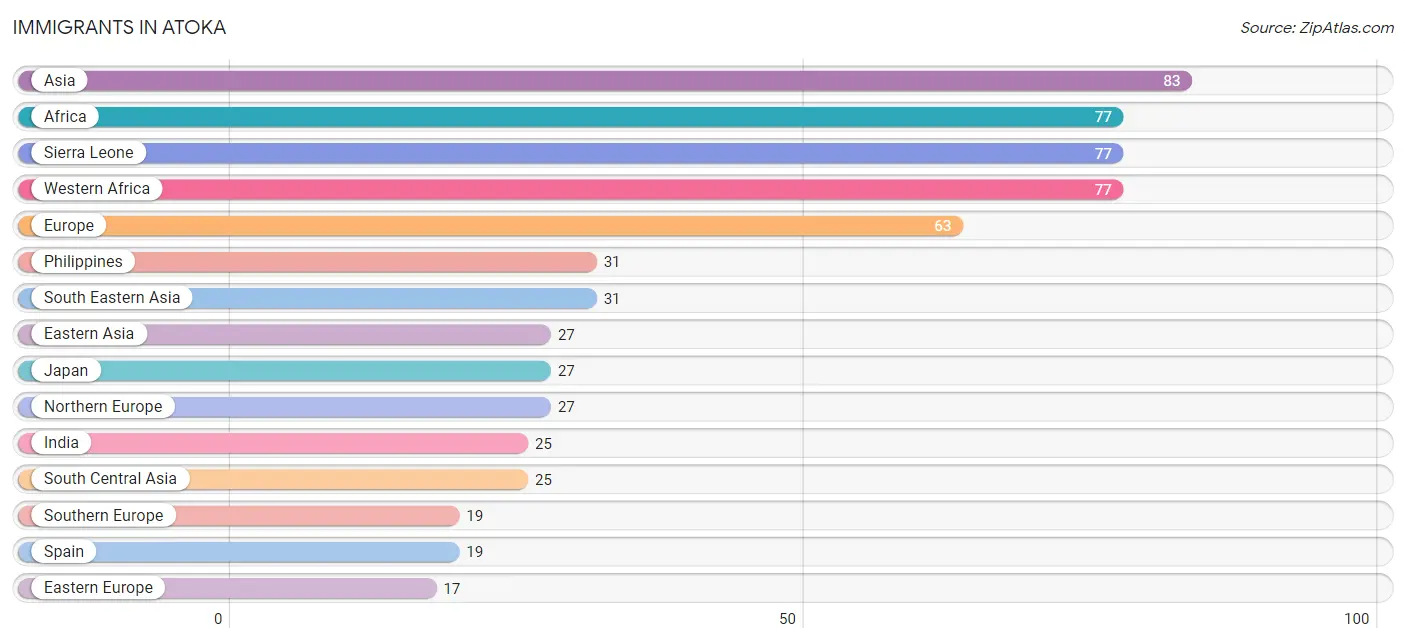
| Immigration Origin | # Population | % Population |
| Africa | 77 | 0.8% |
| Asia | 83 | 0.8% |
| Eastern Asia | 27 | 0.3% |
| Eastern Europe | 17 | 0.2% |
| Europe | 63 | 0.6% |
| India | 25 | 0.3% |
| Japan | 27 | 0.3% |
| Lithuania | 17 | 0.2% |
| Northern Europe | 27 | 0.3% |
| Philippines | 31 | 0.3% |
| Sierra Leone | 77 | 0.8% |
| South Central Asia | 25 | 0.3% |
| South Eastern Asia | 31 | 0.3% |
| Southern Europe | 19 | 0.2% |
| Spain | 19 | 0.2% |
| Western Africa | 77 | 0.8% | View All 16 Rows |
Sex and Age in Atoka
Sex and Age in Atoka
The most populous age groups in Atoka are 50 to 54 Years (488 | 9.7%) for men and 35 to 39 Years (522 | 10.3%) for women.
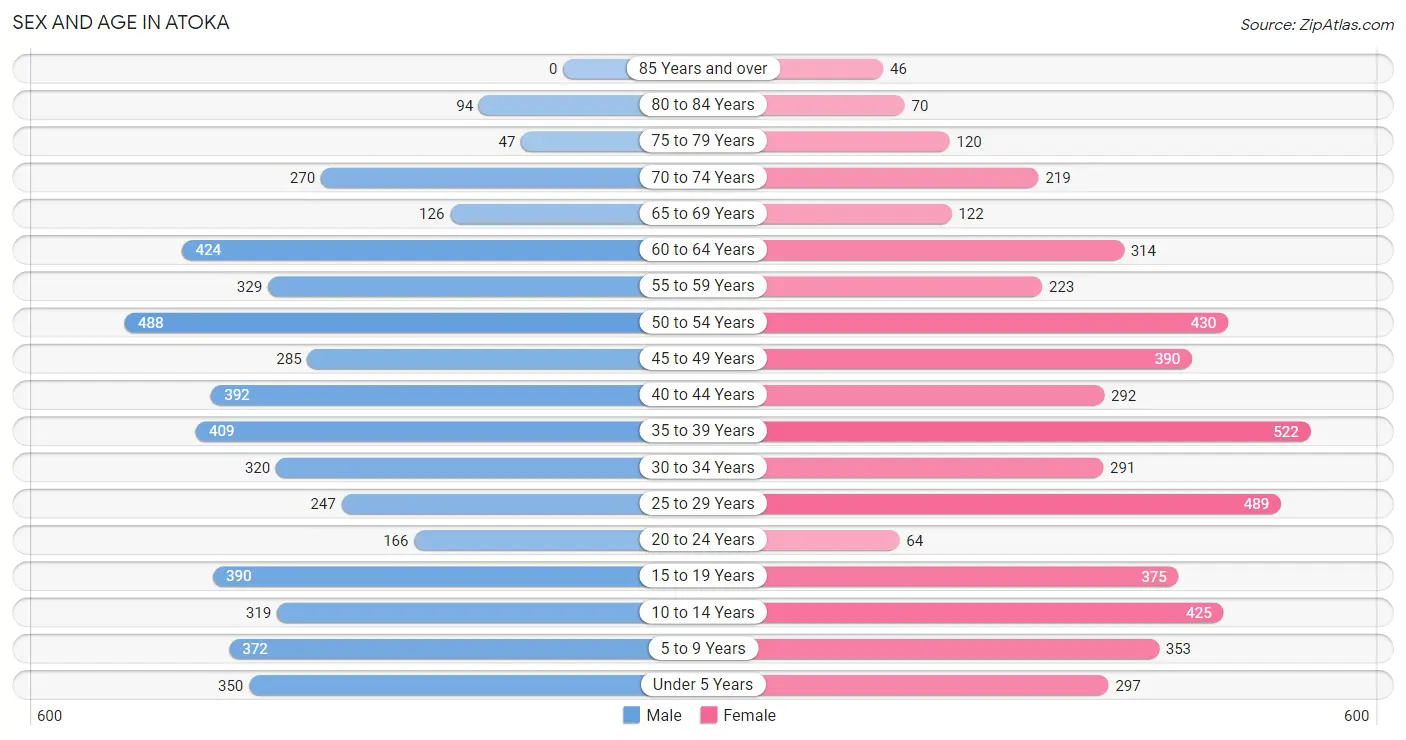
| Age Bracket | Male | Female |
| Under 5 Years | 350 (7.0%) | 297 (5.9%) |
| 5 to 9 Years | 372 (7.4%) | 353 (7.0%) |
| 10 to 14 Years | 319 (6.3%) | 425 (8.4%) |
| 15 to 19 Years | 390 (7.8%) | 375 (7.4%) |
| 20 to 24 Years | 166 (3.3%) | 64 (1.3%) |
| 25 to 29 Years | 247 (4.9%) | 489 (9.7%) |
| 30 to 34 Years | 320 (6.4%) | 291 (5.8%) |
| 35 to 39 Years | 409 (8.1%) | 522 (10.3%) |
| 40 to 44 Years | 392 (7.8%) | 292 (5.8%) |
| 45 to 49 Years | 285 (5.7%) | 390 (7.7%) |
| 50 to 54 Years | 488 (9.7%) | 430 (8.5%) |
| 55 to 59 Years | 329 (6.5%) | 223 (4.4%) |
| 60 to 64 Years | 424 (8.4%) | 314 (6.2%) |
| 65 to 69 Years | 126 (2.5%) | 122 (2.4%) |
| 70 to 74 Years | 270 (5.4%) | 219 (4.3%) |
| 75 to 79 Years | 47 (0.9%) | 120 (2.4%) |
| 80 to 84 Years | 94 (1.9%) | 70 (1.4%) |
| 85 Years and over | 0 (0.0%) | 46 (0.9%) |
| Total | 5,028 (100.0%) | 5,042 (100.0%) |
Families and Households in Atoka
Median Family Size in Atoka
The median family size in Atoka is 2.92 persons per family, with single male/father families (293 | 9.6%) accounting for the largest median family size of 2.99 persons per family. On the other hand, single female/mother families (413 | 13.5%) represent the smallest median family size with 2.85 persons per family.
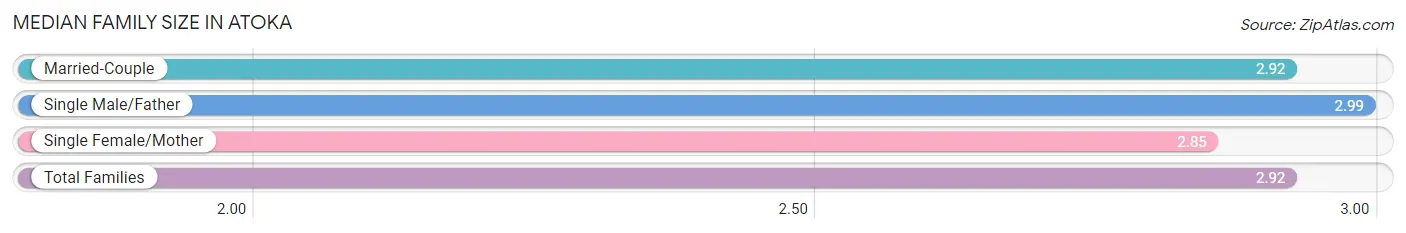
| Family Type | # Families | Family Size |
| Married-Couple | 2,344 (76.8%) | 2.92 |
| Single Male/Father | 293 (9.6%) | 2.99 |
| Single Female/Mother | 413 (13.5%) | 2.85 |
| Total Families | 3,050 (100.0%) | 2.92 |
Median Household Size in Atoka
The median household size in Atoka is 2.65 persons per household, with single male/father households (293 | 7.7%) accounting for the largest median household size of 3.7 persons per household. non-family households (743 | 19.6%) represent the smallest median household size with 1.04 persons per household.
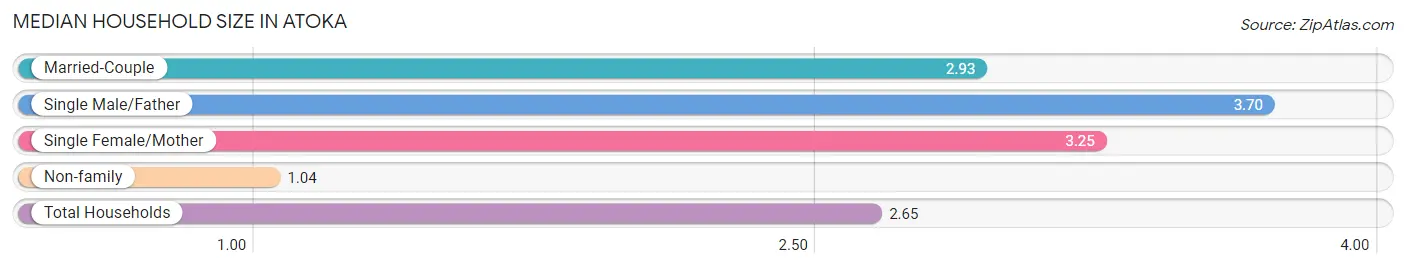
| Household Type | # Households | Household Size |
| Married-Couple | 2,344 (61.8%) | 2.93 |
| Single Male/Father | 293 (7.7%) | 3.70 |
| Single Female/Mother | 413 (10.9%) | 3.25 |
| Non-family | 743 (19.6%) | 1.04 |
| Total Households | 3,793 (100.0%) | 2.65 |
Household Size by Marriage Status in Atoka
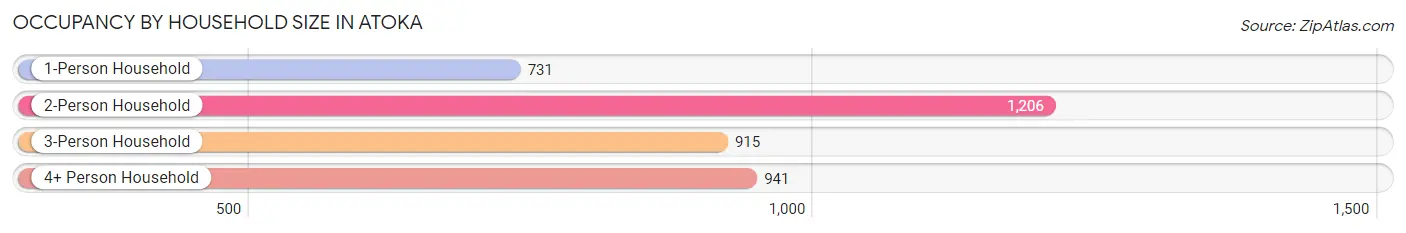
Out of a total of 3,793 households in Atoka, 3,050 (80.4%) are family households, while 743 (19.6%) are nonfamily households. The most numerous type of family households are 2-person households, comprising 1,206, and the most common type of nonfamily households are 1-person households, comprising 731.
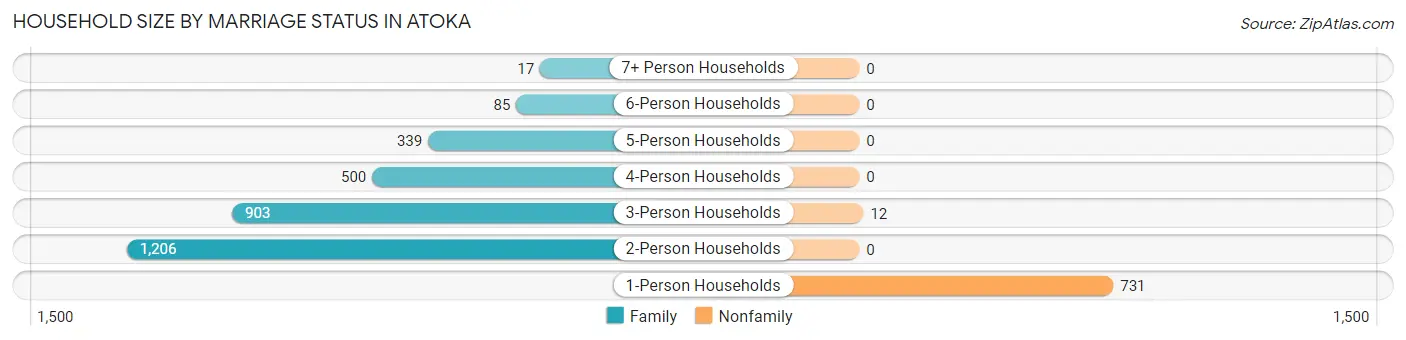
| Household Size | Family Households | Nonfamily Households |
| 1-Person Households | - | 731 (19.3%) |
| 2-Person Households | 1,206 (31.8%) | 0 (0.0%) |
| 3-Person Households | 903 (23.8%) | 12 (0.3%) |
| 4-Person Households | 500 (13.2%) | 0 (0.0%) |
| 5-Person Households | 339 (8.9%) | 0 (0.0%) |
| 6-Person Households | 85 (2.2%) | 0 (0.0%) |
| 7+ Person Households | 17 (0.4%) | 0 (0.0%) |
| Total | 3,050 (80.4%) | 743 (19.6%) |
Female Fertility in Atoka
Fertility by Age in Atoka
Average fertility rate in Atoka is 26.0 births per 1,000 women. Women in the age bracket of 20 to 34 years have the highest fertility rate with 49.0 births per 1,000 women. Women in the age bracket of 20 to 34 years acount for 62.1% of all women with births.
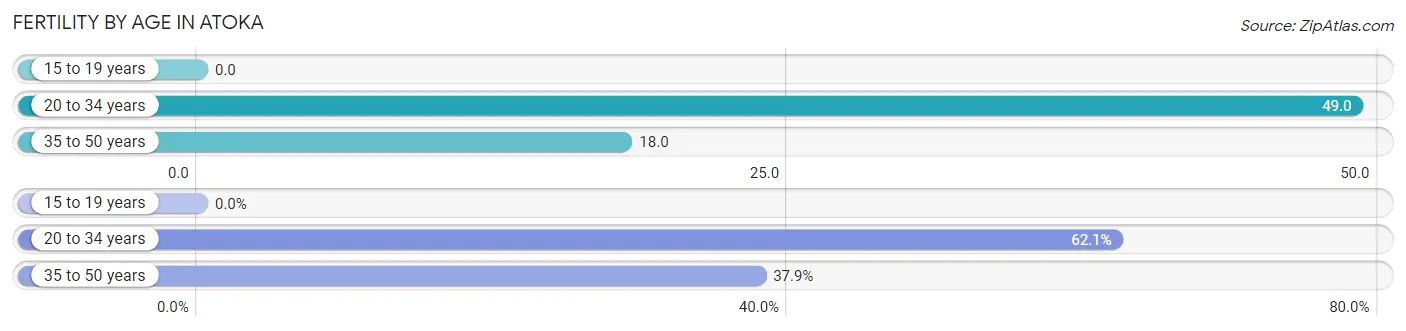
| Age Bracket | Women with Births | Births / 1,000 Women |
| 15 to 19 years | 0 (0.0%) | 0.0 |
| 20 to 34 years | 41 (62.1%) | 49.0 |
| 35 to 50 years | 25 (37.9%) | 18.0 |
| Total | 66 (100.0%) | 26.0 |
Fertility by Age by Marriage Status in Atoka
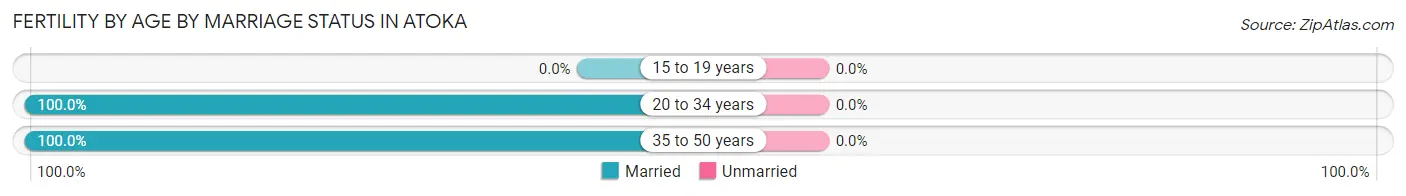
| Age Bracket | Married | Unmarried |
| 15 to 19 years | 0 (0.0%) | 0 (0.0%) |
| 20 to 34 years | 41 (100.0%) | 0 (0.0%) |
| 35 to 50 years | 25 (100.0%) | 0 (0.0%) |
| Total | 66 (100.0%) | 0 (0.0%) |
Fertility by Education in Atoka
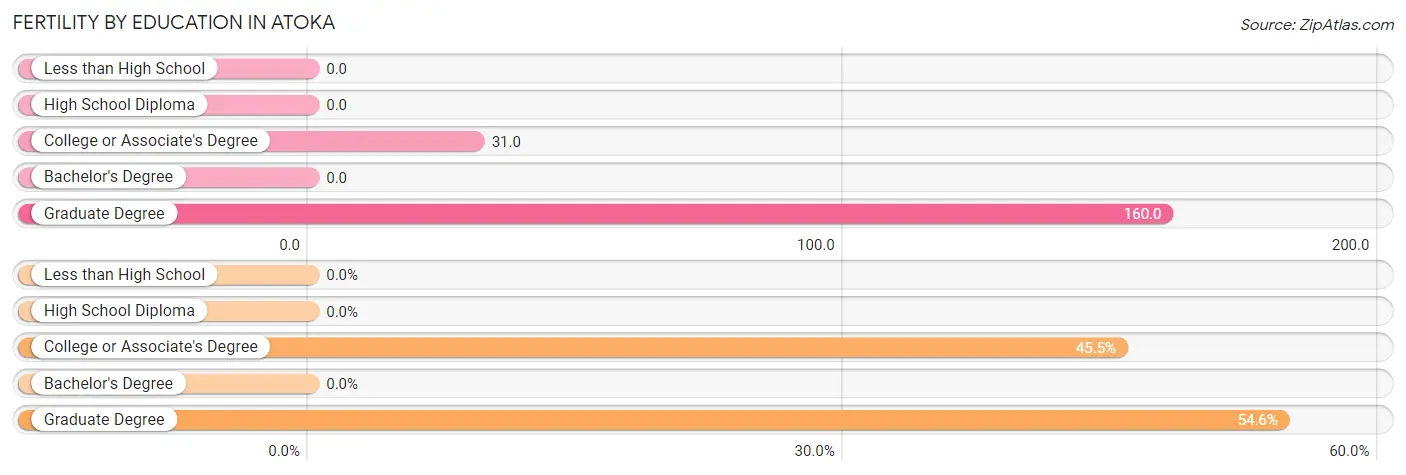
| Educational Attainment | Women with Births | Births / 1,000 Women |
| Less than High School | 0 (0.0%) | 0.0 |
| High School Diploma | 0 (0.0%) | 0.0 |
| College or Associate's Degree | 30 (45.5%) | 31.0 |
| Bachelor's Degree | 0 (0.0%) | 0.0 |
| Graduate Degree | 36 (54.5%) | 160.0 |
| Total | 66 (100.0%) | 26.0 |
Fertility by Education by Marriage Status in Atoka
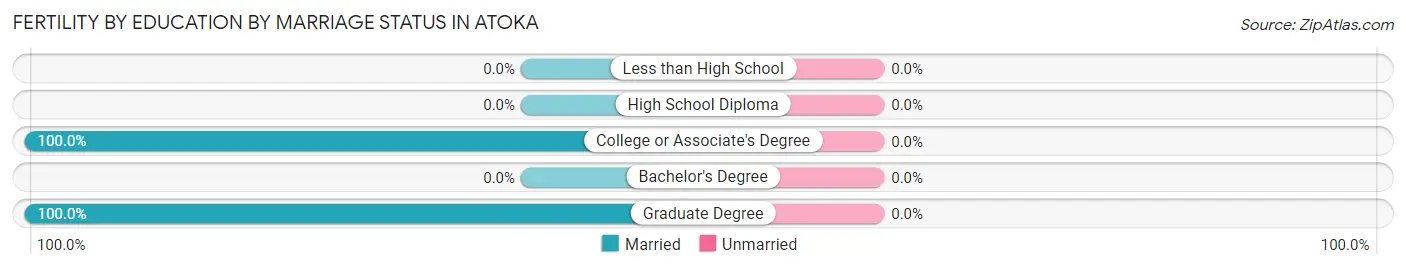
| Educational Attainment | Married | Unmarried |
| Less than High School | 0 (0.0%) | 0 (0.0%) |
| High School Diploma | 0 (0.0%) | 0 (0.0%) |
| College or Associate's Degree | 30 (100.0%) | 0 (0.0%) |
| Bachelor's Degree | 0 (0.0%) | 0 (0.0%) |
| Graduate Degree | 36 (100.0%) | 0 (0.0%) |
| Total | 66 (100.0%) | 0 (0.0%) |
Employment Characteristics in Atoka
Employment by Class of Employer in Atoka
Among the 4,740 employed individuals in Atoka, private company employees (2,775 | 58.5%), federal government employees (715 | 15.1%), and state government employees (440 | 9.3%) make up the most common classes of employment.
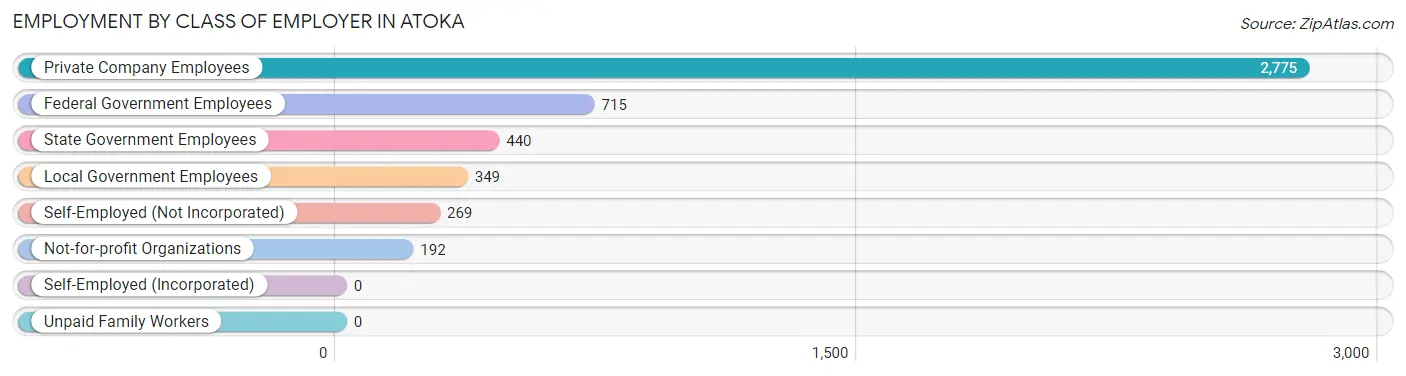
| Employer Class | # Employees | % Employees |
| Private Company Employees | 2,775 | 58.5% |
| Self-Employed (Incorporated) | 0 | 0.0% |
| Self-Employed (Not Incorporated) | 269 | 5.7% |
| Not-for-profit Organizations | 192 | 4.1% |
| Local Government Employees | 349 | 7.4% |
| State Government Employees | 440 | 9.3% |
| Federal Government Employees | 715 | 15.1% |
| Unpaid Family Workers | 0 | 0.0% |
| Total | 4,740 | 100.0% |
Employment Status by Age in Atoka
According to the labor force statistics for Atoka, out of the total population over 16 years of age (7,735), 65.5% or 5,066 individuals are in the labor force, with 6.6% or 334 of them unemployed. The age group with the highest labor force participation rate is 25 to 29 years, with 90.1% or 663 individuals in the labor force. Within the labor force, the 20 to 24 years age range has the highest percentage of unemployed individuals, with 65.0% or 106 of them being unemployed.
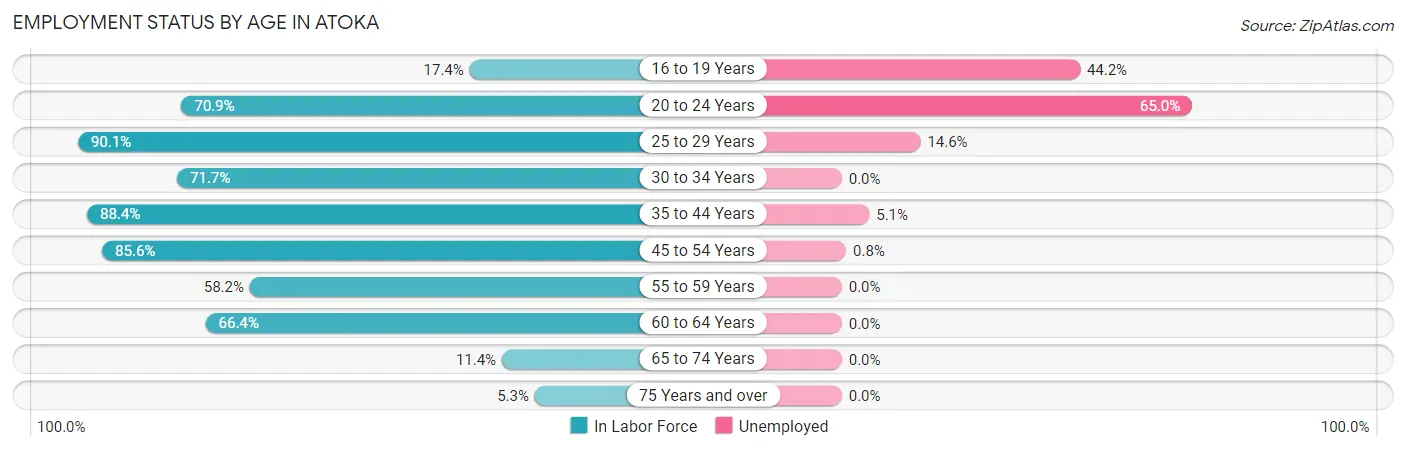
| Age Bracket | In Labor Force | Unemployed |
| 16 to 19 Years | 95 (17.4%) | 42 (44.2%) |
| 20 to 24 Years | 163 (70.9%) | 106 (65.0%) |
| 25 to 29 Years | 663 (90.1%) | 97 (14.6%) |
| 30 to 34 Years | 438 (71.7%) | 0 (0.0%) |
| 35 to 44 Years | 1,428 (88.4%) | 73 (5.1%) |
| 45 to 54 Years | 1,364 (85.6%) | 11 (0.8%) |
| 55 to 59 Years | 321 (58.2%) | 0 (0.0%) |
| 60 to 64 Years | 490 (66.4%) | 0 (0.0%) |
| 65 to 74 Years | 84 (11.4%) | 0 (0.0%) |
| 75 Years and over | 20 (5.3%) | 0 (0.0%) |
| Total | 5,066 (65.5%) | 334 (6.6%) |
Employment Status by Educational Attainment in Atoka
According to labor force statistics for Atoka, 80.5% of individuals (4,705) out of the total population between 25 and 64 years of age (5,845) are in the labor force, with 3.9% or 183 of them being unemployed. The group with the highest labor force participation rate are those with the educational attainment of bachelor's degree or higher, with 91.9% or 1,713 individuals in the labor force. Within the labor force, individuals with college / associate degree education have the highest percentage of unemployment, with 9.0% or 147 of them being unemployed.
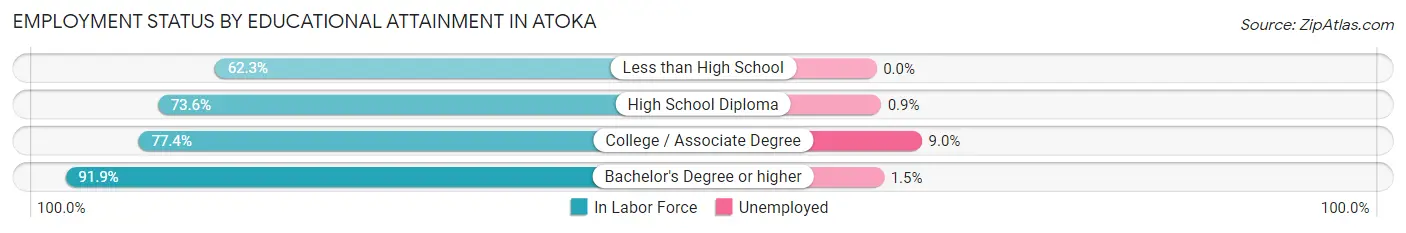
| Educational Attainment | In Labor Force | Unemployed |
| Less than High School | 101 (62.3%) | 0 (0.0%) |
| High School Diploma | 1,256 (73.6%) | 15 (0.9%) |
| College / Associate Degree | 1,635 (77.4%) | 190 (9.0%) |
| Bachelor's Degree or higher | 1,713 (91.9%) | 28 (1.5%) |
| Total | 4,705 (80.5%) | 228 (3.9%) |
Employment Occupations by Sex in Atoka
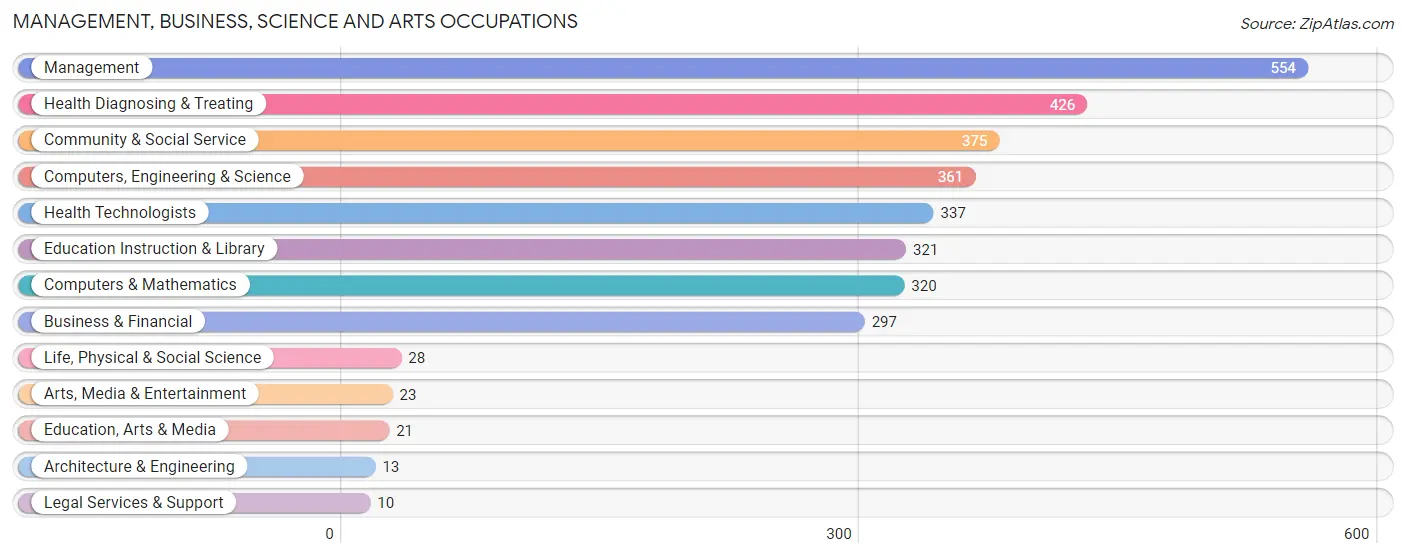
Management, Business, Science and Arts Occupations
The most common Management, Business, Science and Arts occupations in Atoka are Management (554 | 12.1%), Health Diagnosing & Treating (426 | 9.3%), Community & Social Service (375 | 8.2%), Computers, Engineering & Science (361 | 7.9%), and Health Technologists (337 | 7.3%).
Management, Business, Science and Arts Occupations by Sex
Within the Management, Business, Science and Arts occupations in Atoka, the most male-oriented occupations are Architecture & Engineering (100.0%), Life, Physical & Social Science (100.0%), and Arts, Media & Entertainment (100.0%), while the most female-oriented occupations are Education, Arts & Media (100.0%), Legal Services & Support (100.0%), and Health Technologists (92.0%).
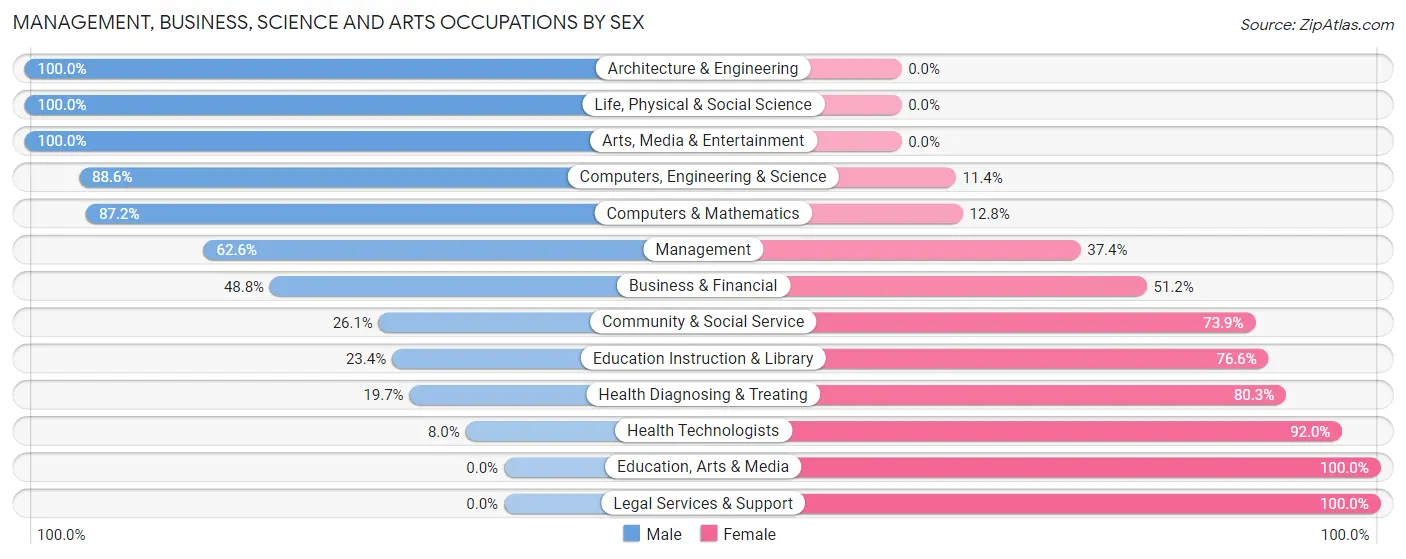
| Occupation | Male | Female |
| Management | 347 (62.6%) | 207 (37.4%) |
| Business & Financial | 145 (48.8%) | 152 (51.2%) |
| Computers, Engineering & Science | 320 (88.6%) | 41 (11.4%) |
| Computers & Mathematics | 279 (87.2%) | 41 (12.8%) |
| Architecture & Engineering | 13 (100.0%) | 0 (0.0%) |
| Life, Physical & Social Science | 28 (100.0%) | 0 (0.0%) |
| Community & Social Service | 98 (26.1%) | 277 (73.9%) |
| Education, Arts & Media | 0 (0.0%) | 21 (100.0%) |
| Legal Services & Support | 0 (0.0%) | 10 (100.0%) |
| Education Instruction & Library | 75 (23.4%) | 246 (76.6%) |
| Arts, Media & Entertainment | 23 (100.0%) | 0 (0.0%) |
| Health Diagnosing & Treating | 84 (19.7%) | 342 (80.3%) |
| Health Technologists | 27 (8.0%) | 310 (92.0%) |
| Total (Category) | 994 (49.4%) | 1,019 (50.6%) |
| Total (Overall) | 2,475 (54.0%) | 2,112 (46.0%) |
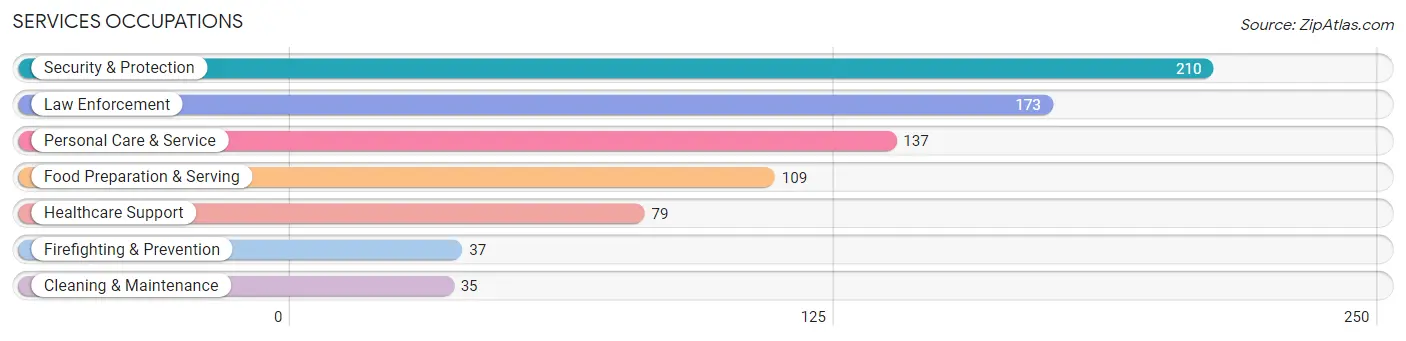
Services Occupations
The most common Services occupations in Atoka are Security & Protection (210 | 4.6%), Law Enforcement (173 | 3.8%), Personal Care & Service (137 | 3.0%), Food Preparation & Serving (109 | 2.4%), and Healthcare Support (79 | 1.7%).
Services Occupations by Sex
Within the Services occupations in Atoka, the most male-oriented occupations are Security & Protection (100.0%), Firefighting & Prevention (100.0%), and Law Enforcement (100.0%), while the most female-oriented occupations are Healthcare Support (100.0%), Personal Care & Service (83.9%), and Food Preparation & Serving (80.7%).
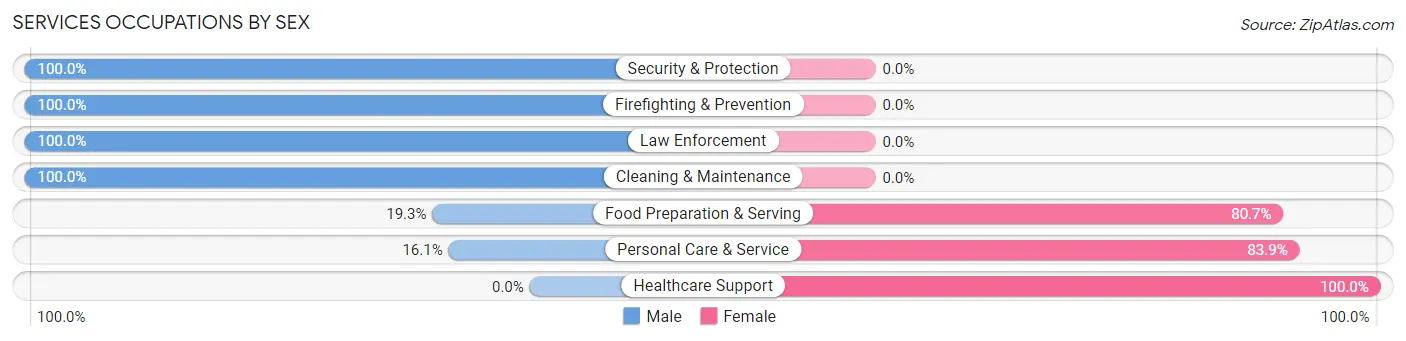
| Occupation | Male | Female |
| Healthcare Support | 0 (0.0%) | 79 (100.0%) |
| Security & Protection | 210 (100.0%) | 0 (0.0%) |
| Firefighting & Prevention | 37 (100.0%) | 0 (0.0%) |
| Law Enforcement | 173 (100.0%) | 0 (0.0%) |
| Food Preparation & Serving | 21 (19.3%) | 88 (80.7%) |
| Cleaning & Maintenance | 35 (100.0%) | 0 (0.0%) |
| Personal Care & Service | 22 (16.1%) | 115 (83.9%) |
| Total (Category) | 288 (50.5%) | 282 (49.5%) |
| Total (Overall) | 2,475 (54.0%) | 2,112 (46.0%) |
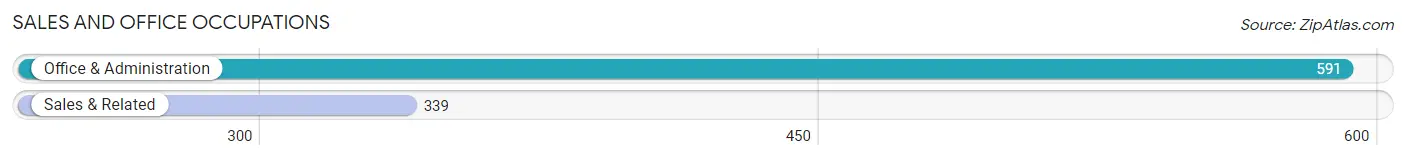
Sales and Office Occupations
The most common Sales and Office occupations in Atoka are Office & Administration (591 | 12.9%), and Sales & Related (339 | 7.4%).
Sales and Office Occupations by Sex
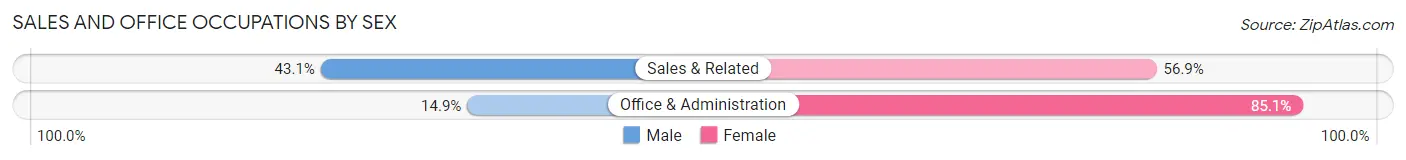
| Occupation | Male | Female |
| Sales & Related | 146 (43.1%) | 193 (56.9%) |
| Office & Administration | 88 (14.9%) | 503 (85.1%) |
| Total (Category) | 234 (25.2%) | 696 (74.8%) |
| Total (Overall) | 2,475 (54.0%) | 2,112 (46.0%) |
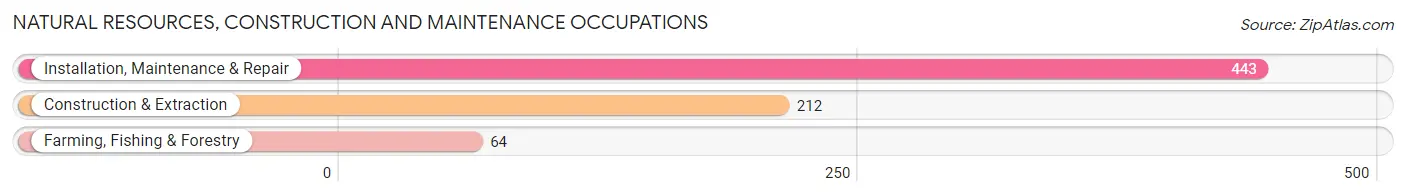
Natural Resources, Construction and Maintenance Occupations
The most common Natural Resources, Construction and Maintenance occupations in Atoka are Installation, Maintenance & Repair (443 | 9.7%), Construction & Extraction (212 | 4.6%), and Farming, Fishing & Forestry (64 | 1.4%).
Natural Resources, Construction and Maintenance Occupations by Sex
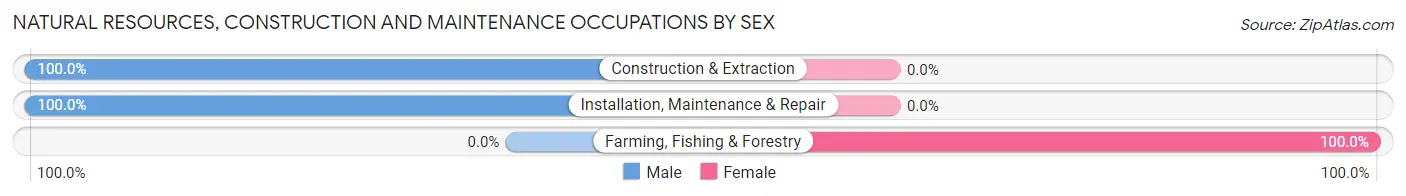
| Occupation | Male | Female |
| Farming, Fishing & Forestry | 0 (0.0%) | 64 (100.0%) |
| Construction & Extraction | 212 (100.0%) | 0 (0.0%) |
| Installation, Maintenance & Repair | 443 (100.0%) | 0 (0.0%) |
| Total (Category) | 655 (91.1%) | 64 (8.9%) |
| Total (Overall) | 2,475 (54.0%) | 2,112 (46.0%) |
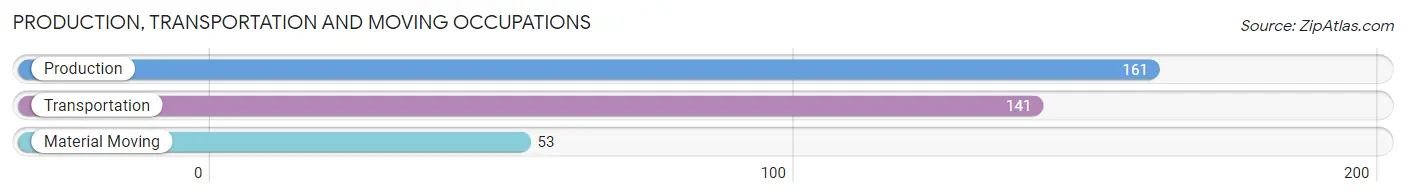
Production, Transportation and Moving Occupations
The most common Production, Transportation and Moving occupations in Atoka are Production (161 | 3.5%), Transportation (141 | 3.1%), and Material Moving (53 | 1.2%).
Production, Transportation and Moving Occupations by Sex
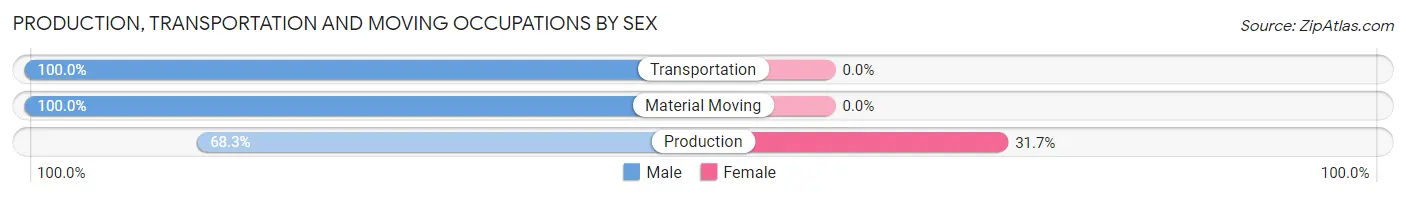
| Occupation | Male | Female |
| Production | 110 (68.3%) | 51 (31.7%) |
| Transportation | 141 (100.0%) | 0 (0.0%) |
| Material Moving | 53 (100.0%) | 0 (0.0%) |
| Total (Category) | 304 (85.6%) | 51 (14.4%) |
| Total (Overall) | 2,475 (54.0%) | 2,112 (46.0%) |
Employment Industries by Sex in Atoka
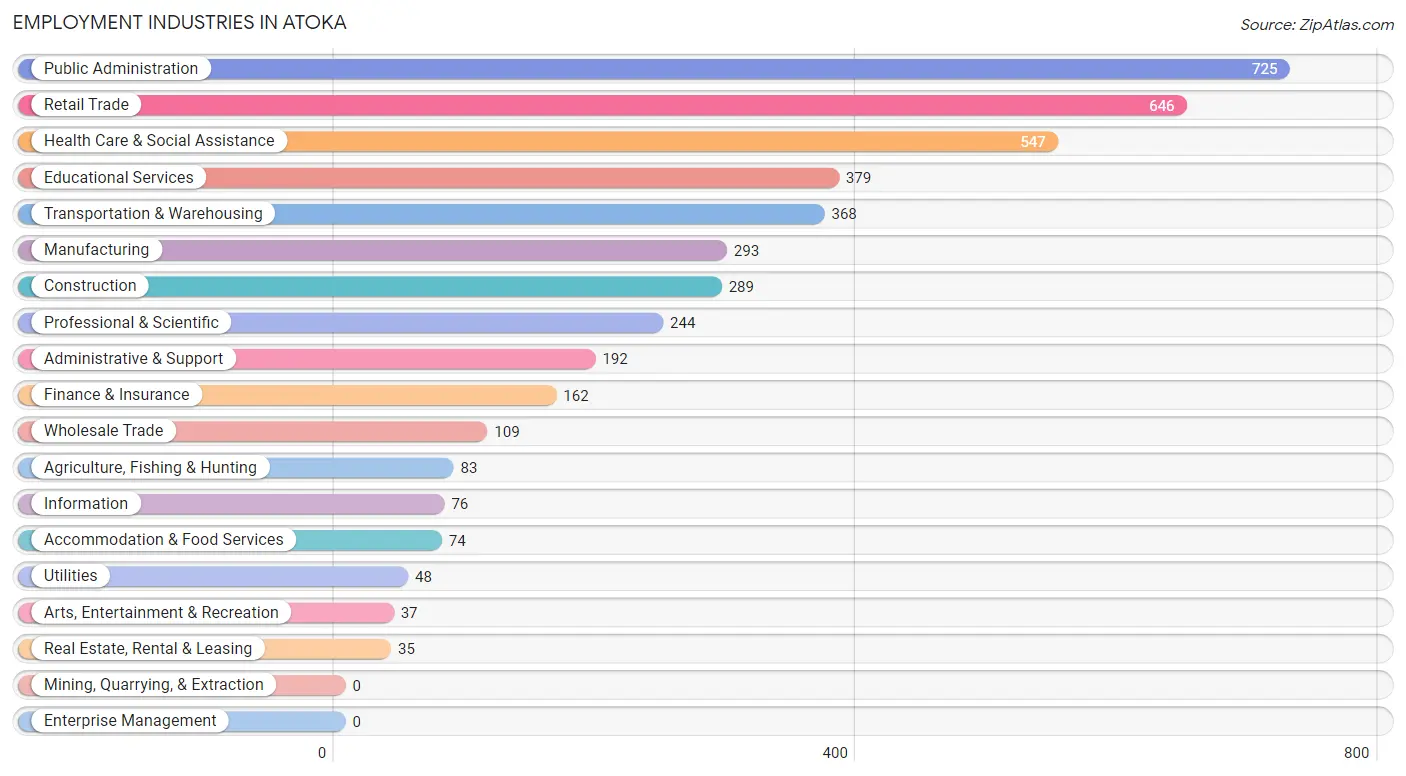
Employment Industries in Atoka
The major employment industries in Atoka include Public Administration (725 | 15.8%), Retail Trade (646 | 14.1%), Health Care & Social Assistance (547 | 11.9%), Educational Services (379 | 8.3%), and Transportation & Warehousing (368 | 8.0%).
Employment Industries by Sex in Atoka
The Atoka industries that see more men than women are Utilities (100.0%), Arts, Entertainment & Recreation (100.0%), and Construction (94.8%), whereas the industries that tend to have a higher number of women are Agriculture, Fishing & Hunting (100.0%), Health Care & Social Assistance (95.1%), and Educational Services (87.9%).
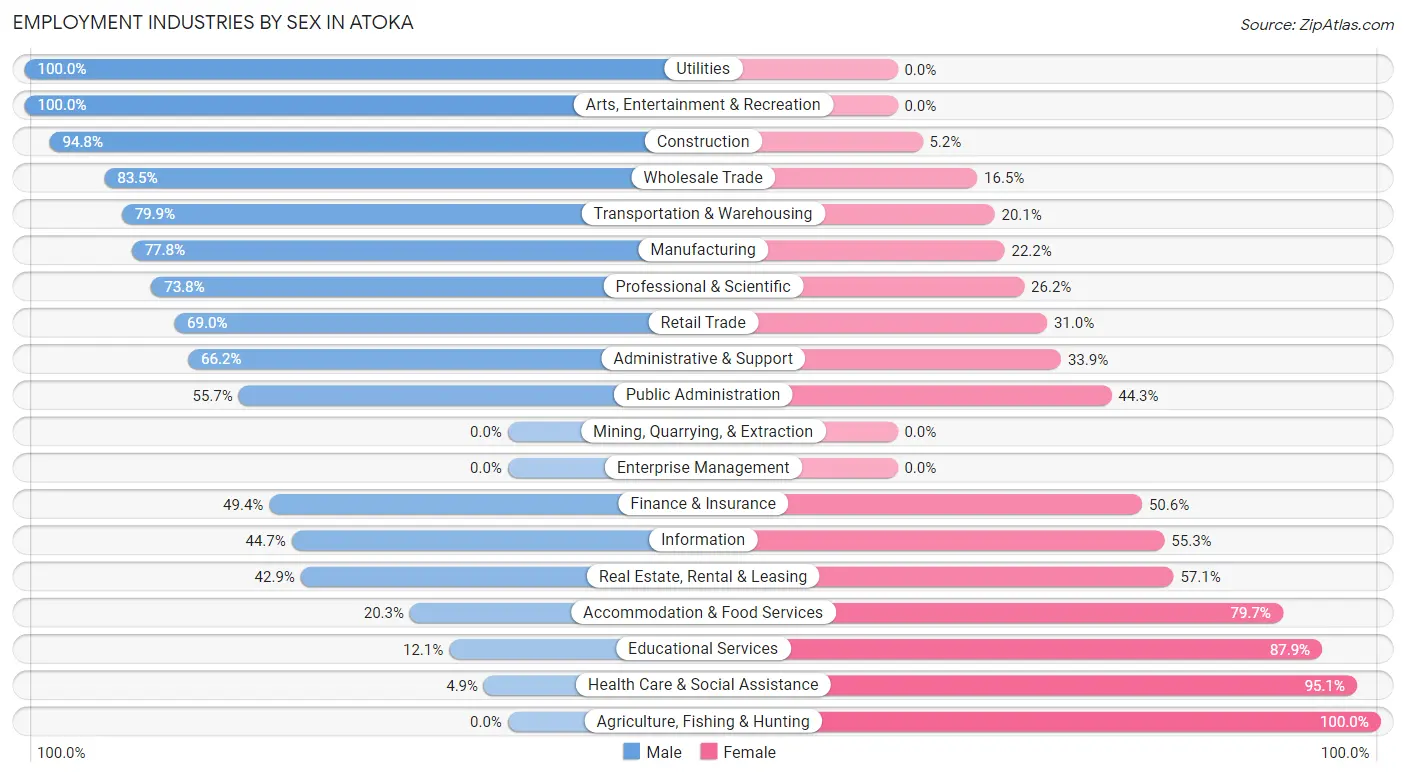
| Industry | Male | Female |
| Agriculture, Fishing & Hunting | 0 (0.0%) | 83 (100.0%) |
| Mining, Quarrying, & Extraction | 0 (0.0%) | 0 (0.0%) |
| Construction | 274 (94.8%) | 15 (5.2%) |
| Manufacturing | 228 (77.8%) | 65 (22.2%) |
| Wholesale Trade | 91 (83.5%) | 18 (16.5%) |
| Retail Trade | 446 (69.0%) | 200 (31.0%) |
| Transportation & Warehousing | 294 (79.9%) | 74 (20.1%) |
| Utilities | 48 (100.0%) | 0 (0.0%) |
| Information | 34 (44.7%) | 42 (55.3%) |
| Finance & Insurance | 80 (49.4%) | 82 (50.6%) |
| Real Estate, Rental & Leasing | 15 (42.9%) | 20 (57.1%) |
| Professional & Scientific | 180 (73.8%) | 64 (26.2%) |
| Enterprise Management | 0 (0.0%) | 0 (0.0%) |
| Administrative & Support | 127 (66.1%) | 65 (33.9%) |
| Educational Services | 46 (12.1%) | 333 (87.9%) |
| Health Care & Social Assistance | 27 (4.9%) | 520 (95.1%) |
| Arts, Entertainment & Recreation | 37 (100.0%) | 0 (0.0%) |
| Accommodation & Food Services | 15 (20.3%) | 59 (79.7%) |
| Public Administration | 404 (55.7%) | 321 (44.3%) |
| Total | 2,475 (54.0%) | 2,112 (46.0%) |
Education in Atoka
School Enrollment in Atoka
The most common levels of schooling among the 2,448 students in Atoka are elementary school (718 | 29.3%), high school (548 | 22.4%), and middle school (524 | 21.4%).
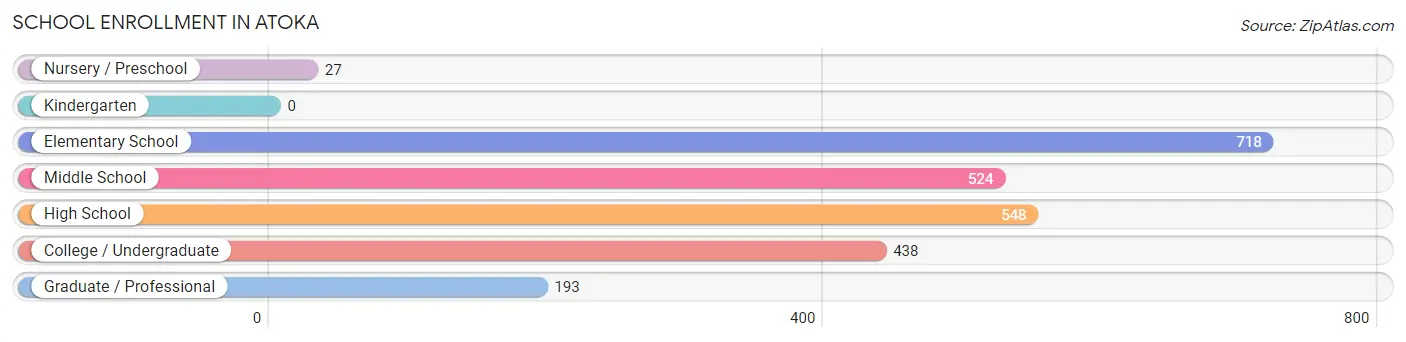
| School Level | # Students | % Students |
| Nursery / Preschool | 27 | 1.1% |
| Kindergarten | 0 | 0.0% |
| Elementary School | 718 | 29.3% |
| Middle School | 524 | 21.4% |
| High School | 548 | 22.4% |
| College / Undergraduate | 438 | 17.9% |
| Graduate / Professional | 193 | 7.9% |
| Total | 2,448 | 100.0% |
School Enrollment by Age by Funding Source in Atoka
Out of a total of 2,448 students who are enrolled in schools in Atoka, 321 (13.1%) attend a private institution, while the remaining 2,127 (86.9%) are enrolled in public schools. The age group of 25 to 34 year olds has the highest likelihood of being enrolled in private schools, with 55 (55.0% in the age bracket) enrolled. Conversely, the age group of 3 to 4 year olds has the lowest likelihood of being enrolled in a private school, with 9 (100.0% in the age bracket) attending a public institution.
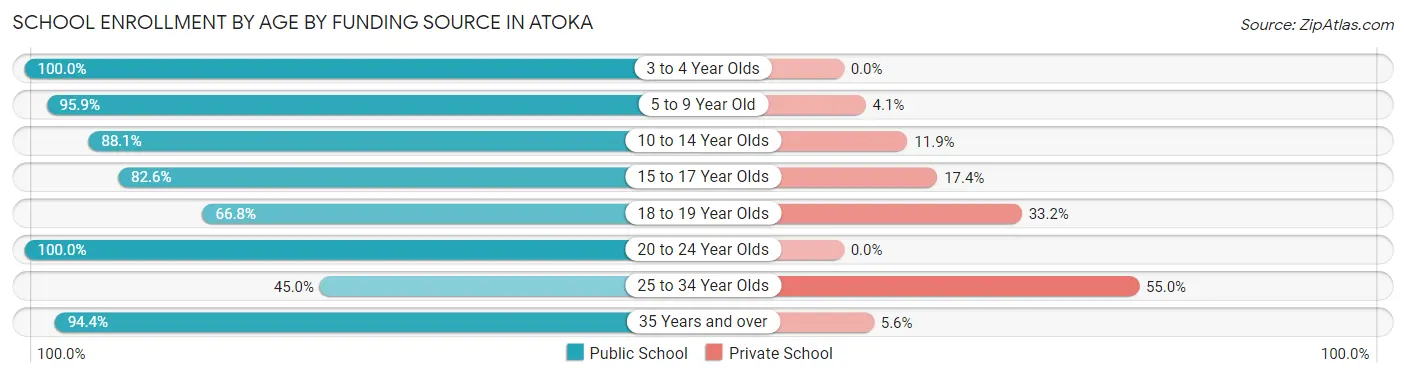
| Age Bracket | Public School | Private School |
| 3 to 4 Year Olds | 9 (100.0%) | 0 (0.0%) |
| 5 to 9 Year Old | 635 (95.9%) | 27 (4.1%) |
| 10 to 14 Year Olds | 631 (88.1%) | 85 (11.9%) |
| 15 to 17 Year Olds | 346 (82.6%) | 73 (17.4%) |
| 18 to 19 Year Olds | 127 (66.8%) | 63 (33.2%) |
| 20 to 24 Year Olds | 49 (100.0%) | 0 (0.0%) |
| 25 to 34 Year Olds | 45 (45.0%) | 55 (55.0%) |
| 35 Years and over | 286 (94.4%) | 17 (5.6%) |
| Total | 2,127 (86.9%) | 321 (13.1%) |
Educational Attainment by Field of Study in Atoka
Business (690 | 29.2%), science & technology (431 | 18.2%), education (250 | 10.6%), social sciences (224 | 9.5%), and arts & humanities (195 | 8.3%) are the most common fields of study among 2,362 individuals in Atoka who have obtained a bachelor's degree or higher.
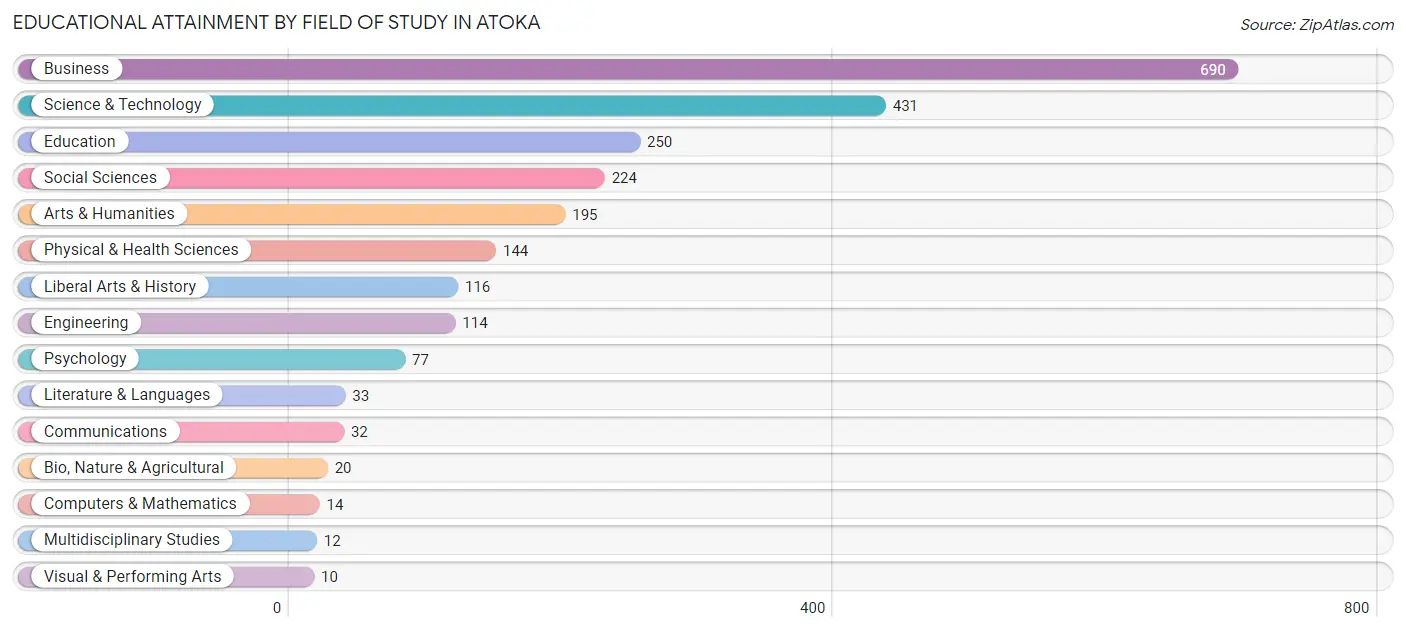
| Field of Study | # Graduates | % Graduates |
| Computers & Mathematics | 14 | 0.6% |
| Bio, Nature & Agricultural | 20 | 0.9% |
| Physical & Health Sciences | 144 | 6.1% |
| Psychology | 77 | 3.3% |
| Social Sciences | 224 | 9.5% |
| Engineering | 114 | 4.8% |
| Multidisciplinary Studies | 12 | 0.5% |
| Science & Technology | 431 | 18.2% |
| Business | 690 | 29.2% |
| Education | 250 | 10.6% |
| Literature & Languages | 33 | 1.4% |
| Liberal Arts & History | 116 | 4.9% |
| Visual & Performing Arts | 10 | 0.4% |
| Communications | 32 | 1.3% |
| Arts & Humanities | 195 | 8.3% |
| Total | 2,362 | 100.0% |
Transportation & Commute in Atoka
Vehicle Availability by Sex in Atoka
The most prevalent vehicle ownership categories in Atoka are males with 2 vehicles (989, accounting for 38.0%) and females with 2 vehicles (852, making up 46.3%).
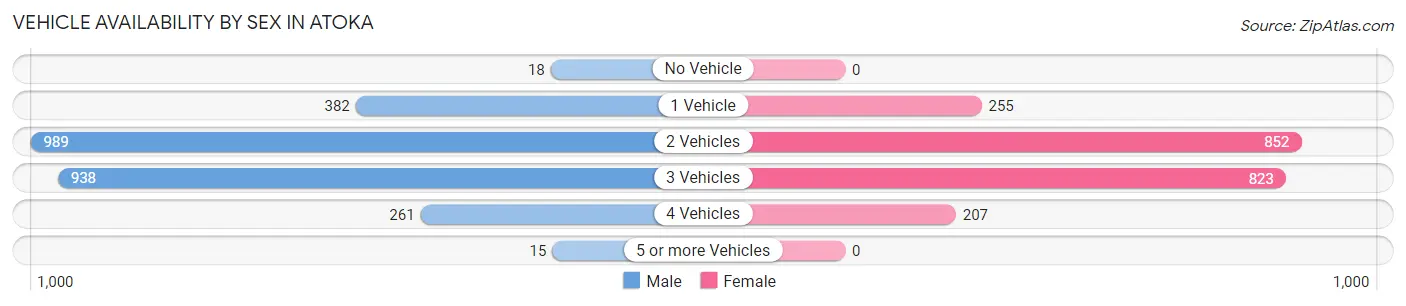
| Vehicles Available | Male | Female |
| No Vehicle | 18 (0.7%) | 0 (0.0%) |
| 1 Vehicle | 382 (14.7%) | 255 (11.9%) |
| 2 Vehicles | 989 (38.0%) | 852 (39.9%) |
| 3 Vehicles | 938 (36.0%) | 823 (38.5%) |
| 4 Vehicles | 261 (10.0%) | 207 (9.7%) |
| 5 or more Vehicles | 15 (0.6%) | 0 (0.0%) |
| Total | 2,603 (100.0%) | 2,137 (100.0%) |
Commute Time in Atoka
The most frequently occuring commute durations in Atoka are 45 to 59 minutes (1,539 commuters, 34.5%), 20 to 24 minutes (780 commuters, 17.5%), and 60 to 89 minutes (528 commuters, 11.8%).
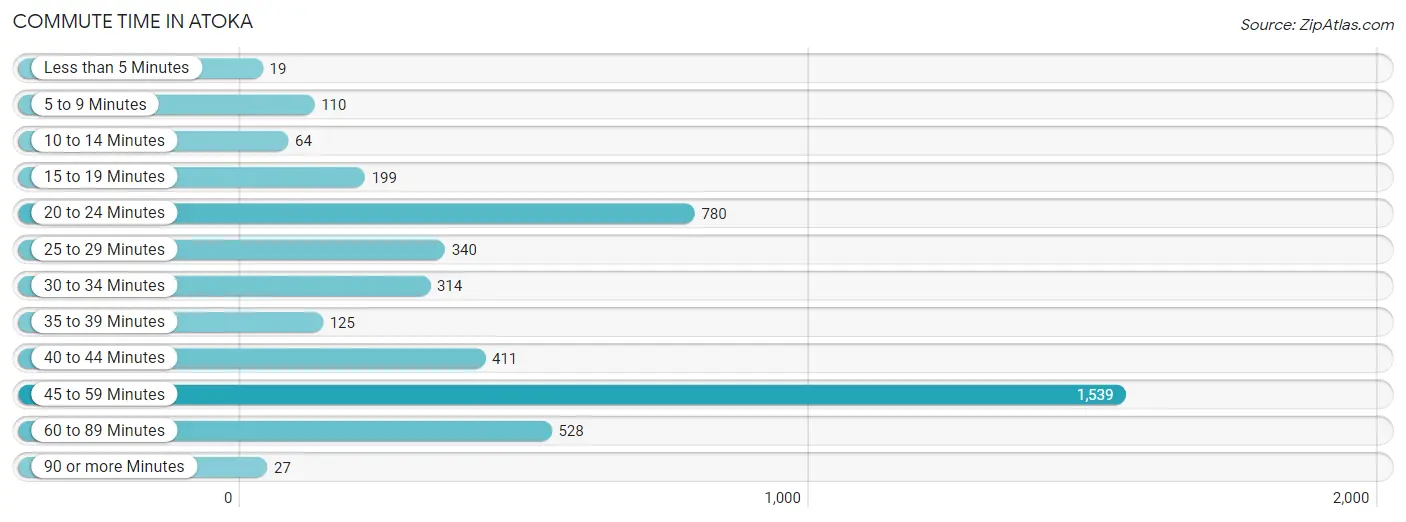
| Commute Time | # Commuters | % Commuters |
| Less than 5 Minutes | 19 | 0.4% |
| 5 to 9 Minutes | 110 | 2.5% |
| 10 to 14 Minutes | 64 | 1.4% |
| 15 to 19 Minutes | 199 | 4.5% |
| 20 to 24 Minutes | 780 | 17.5% |
| 25 to 29 Minutes | 340 | 7.6% |
| 30 to 34 Minutes | 314 | 7.0% |
| 35 to 39 Minutes | 125 | 2.8% |
| 40 to 44 Minutes | 411 | 9.2% |
| 45 to 59 Minutes | 1,539 | 34.5% |
| 60 to 89 Minutes | 528 | 11.8% |
| 90 or more Minutes | 27 | 0.6% |
Commute Time by Sex in Atoka
The most common commute times in Atoka are 45 to 59 minutes (870 commuters, 35.7%) for males and 45 to 59 minutes (669 commuters, 33.1%) for females.
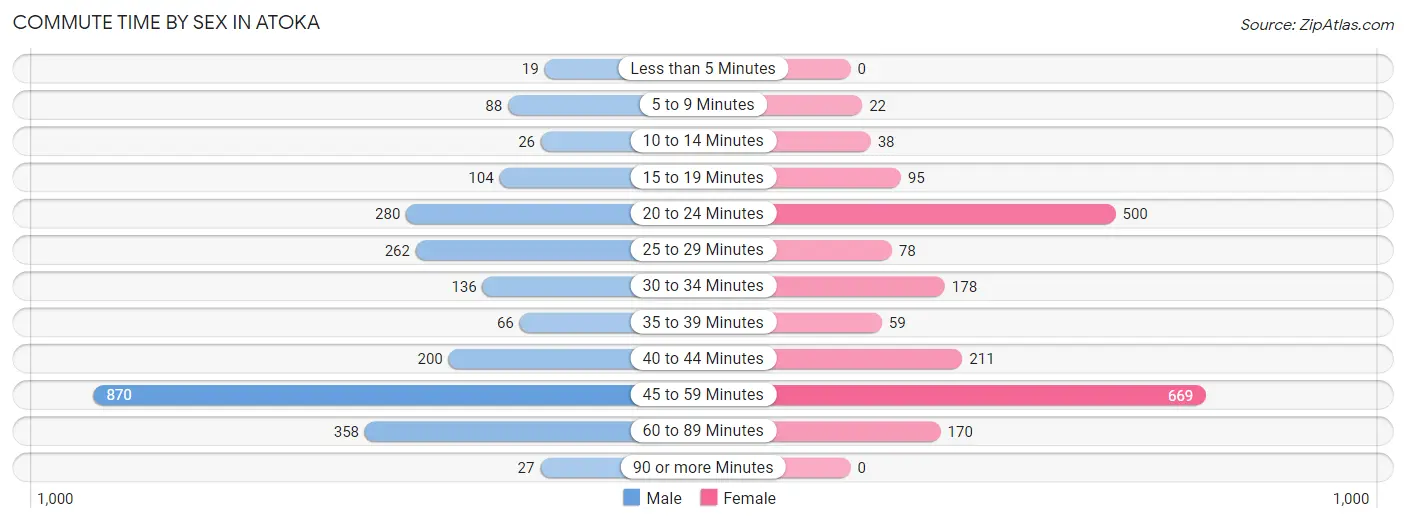
| Commute Time | Male | Female |
| Less than 5 Minutes | 19 (0.8%) | 0 (0.0%) |
| 5 to 9 Minutes | 88 (3.6%) | 22 (1.1%) |
| 10 to 14 Minutes | 26 (1.1%) | 38 (1.9%) |
| 15 to 19 Minutes | 104 (4.3%) | 95 (4.7%) |
| 20 to 24 Minutes | 280 (11.5%) | 500 (24.7%) |
| 25 to 29 Minutes | 262 (10.8%) | 78 (3.9%) |
| 30 to 34 Minutes | 136 (5.6%) | 178 (8.8%) |
| 35 to 39 Minutes | 66 (2.7%) | 59 (2.9%) |
| 40 to 44 Minutes | 200 (8.2%) | 211 (10.4%) |
| 45 to 59 Minutes | 870 (35.7%) | 669 (33.1%) |
| 60 to 89 Minutes | 358 (14.7%) | 170 (8.4%) |
| 90 or more Minutes | 27 (1.1%) | 0 (0.0%) |
Time of Departure to Work by Sex in Atoka
The most frequent times of departure to work in Atoka are 6:00 AM to 6:29 AM (551, 22.6%) for males and 7:30 AM to 7:59 AM (451, 22.3%) for females.
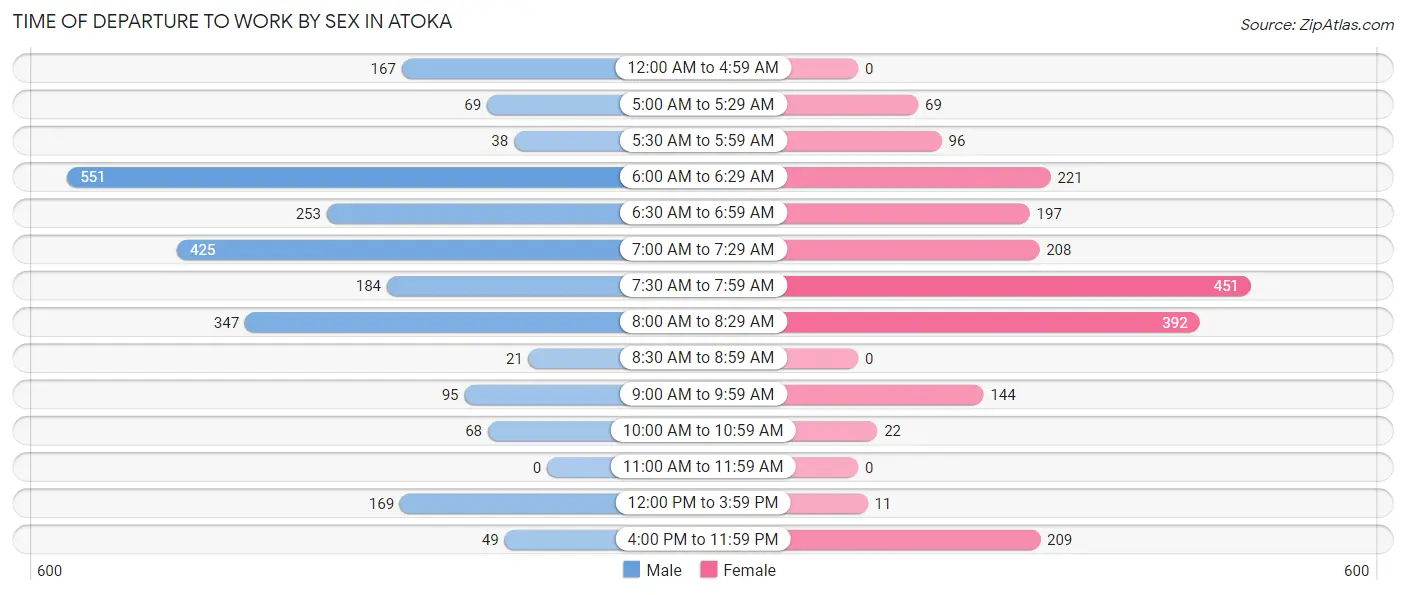
| Time of Departure | Male | Female |
| 12:00 AM to 4:59 AM | 167 (6.9%) | 0 (0.0%) |
| 5:00 AM to 5:29 AM | 69 (2.8%) | 69 (3.4%) |
| 5:30 AM to 5:59 AM | 38 (1.6%) | 96 (4.8%) |
| 6:00 AM to 6:29 AM | 551 (22.6%) | 221 (10.9%) |
| 6:30 AM to 6:59 AM | 253 (10.4%) | 197 (9.8%) |
| 7:00 AM to 7:29 AM | 425 (17.4%) | 208 (10.3%) |
| 7:30 AM to 7:59 AM | 184 (7.5%) | 451 (22.3%) |
| 8:00 AM to 8:29 AM | 347 (14.2%) | 392 (19.4%) |
| 8:30 AM to 8:59 AM | 21 (0.9%) | 0 (0.0%) |
| 9:00 AM to 9:59 AM | 95 (3.9%) | 144 (7.1%) |
| 10:00 AM to 10:59 AM | 68 (2.8%) | 22 (1.1%) |
| 11:00 AM to 11:59 AM | 0 (0.0%) | 0 (0.0%) |
| 12:00 PM to 3:59 PM | 169 (6.9%) | 11 (0.5%) |
| 4:00 PM to 11:59 PM | 49 (2.0%) | 209 (10.3%) |
| Total | 2,436 (100.0%) | 2,020 (100.0%) |
Housing Occupancy in Atoka
Occupancy by Ownership in Atoka
Of the total 3,793 dwellings in Atoka, owner-occupied units account for 3,232 (85.2%), while renter-occupied units make up 561 (14.8%).
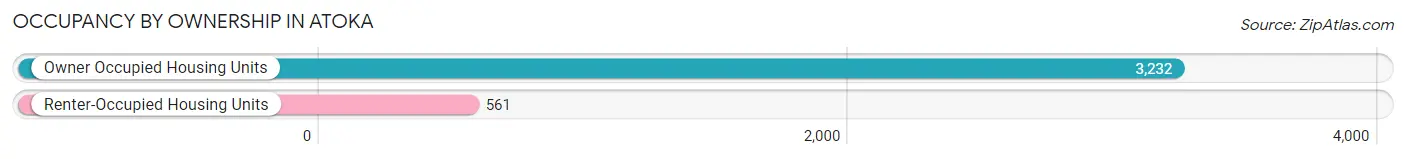
| Occupancy | # Housing Units | % Housing Units |
| Owner Occupied Housing Units | 3,232 | 85.2% |
| Renter-Occupied Housing Units | 561 | 14.8% |
| Total Occupied Housing Units | 3,793 | 100.0% |
Occupancy by Household Size in Atoka
| Household Size | # Housing Units | % Housing Units |
| 1-Person Household | 731 | 19.3% |
| 2-Person Household | 1,206 | 31.8% |
| 3-Person Household | 915 | 24.1% |
| 4+ Person Household | 941 | 24.8% |
| Total Housing Units | 3,793 | 100.0% |
Occupancy by Ownership by Household Size in Atoka
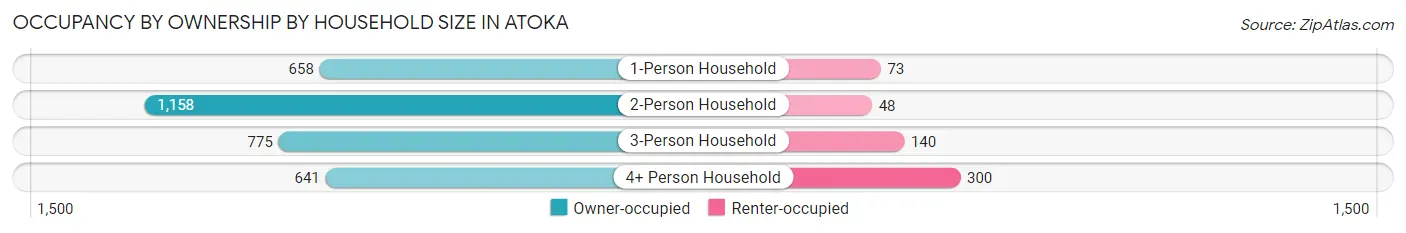
| Household Size | Owner-occupied | Renter-occupied |
| 1-Person Household | 658 (90.0%) | 73 (10.0%) |
| 2-Person Household | 1,158 (96.0%) | 48 (4.0%) |
| 3-Person Household | 775 (84.7%) | 140 (15.3%) |
| 4+ Person Household | 641 (68.1%) | 300 (31.9%) |
| Total Housing Units | 3,232 (85.2%) | 561 (14.8%) |
Occupancy by Educational Attainment in Atoka
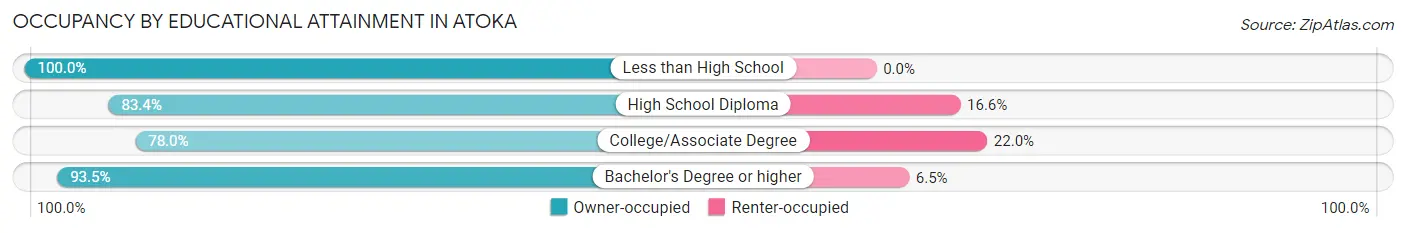
| Household Size | Owner-occupied | Renter-occupied |
| Less than High School | 104 (100.0%) | 0 (0.0%) |
| High School Diploma | 982 (83.4%) | 196 (16.6%) |
| College/Associate Degree | 1,020 (78.0%) | 287 (22.0%) |
| Bachelor's Degree or higher | 1,126 (93.5%) | 78 (6.5%) |
Occupancy by Age of Householder in Atoka
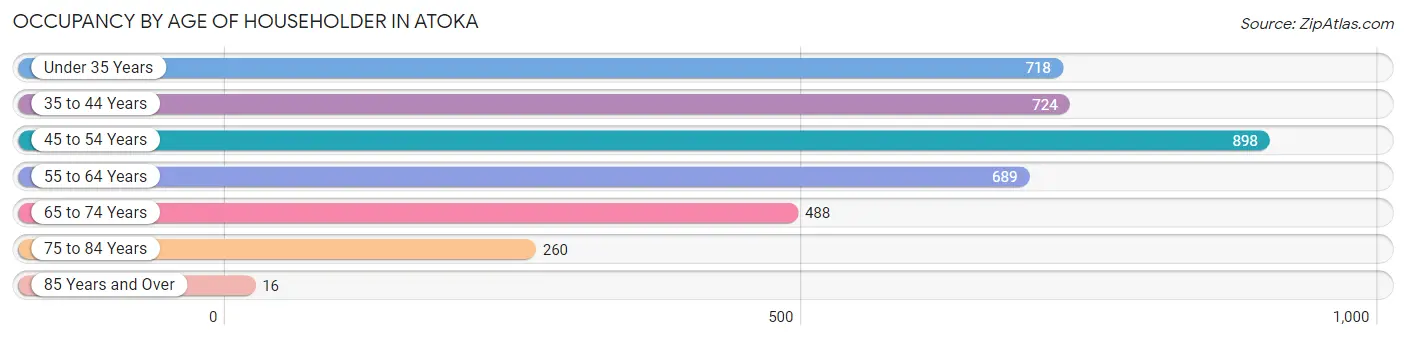
| Age Bracket | # Households | % Households |
| Under 35 Years | 718 | 18.9% |
| 35 to 44 Years | 724 | 19.1% |
| 45 to 54 Years | 898 | 23.7% |
| 55 to 64 Years | 689 | 18.2% |
| 65 to 74 Years | 488 | 12.9% |
| 75 to 84 Years | 260 | 6.9% |
| 85 Years and Over | 16 | 0.4% |
| Total | 3,793 | 100.0% |
Housing Finances in Atoka
Median Income by Occupancy in Atoka
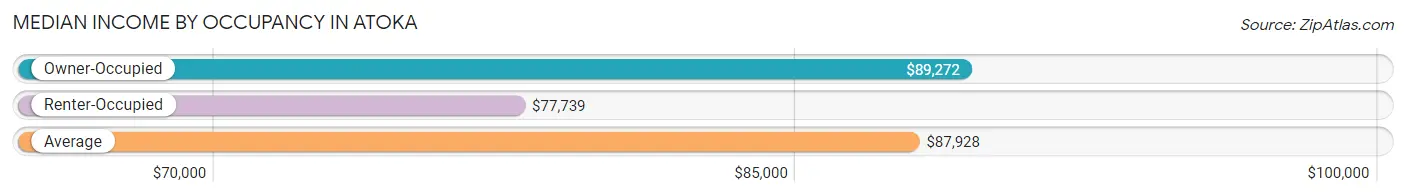
| Occupancy Type | # Households | Median Income |
| Owner-Occupied | 3,232 (85.2%) | $89,272 |
| Renter-Occupied | 561 (14.8%) | $77,739 |
| Average | 3,793 (100.0%) | $87,928 |
Occupancy by Householder Income Bracket in Atoka
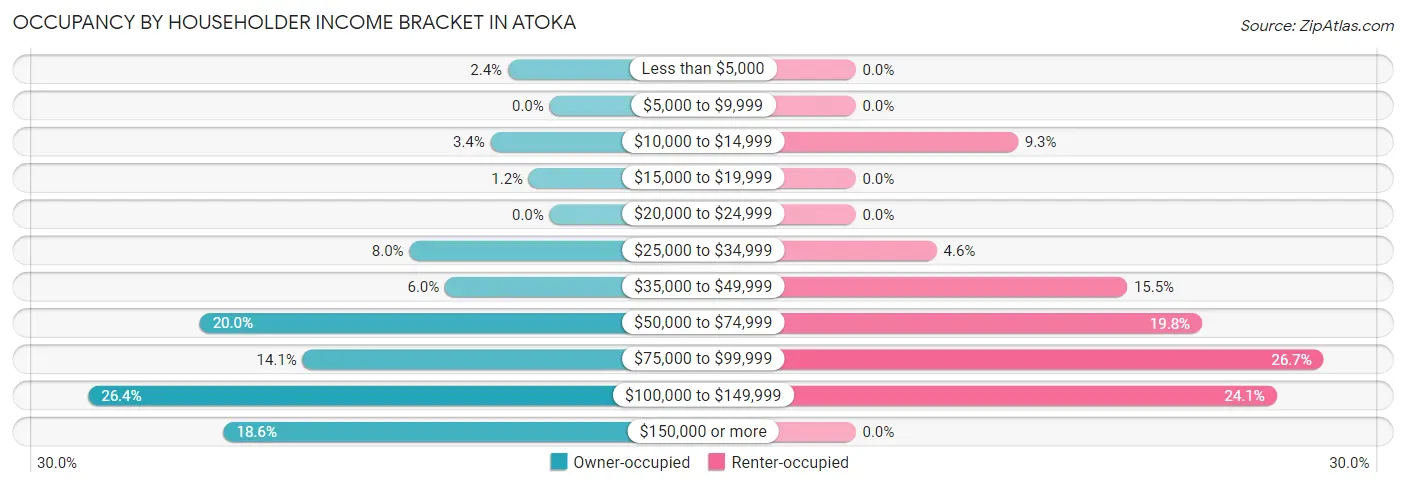
| Income Bracket | Owner-occupied | Renter-occupied |
| Less than $5,000 | 77 (2.4%) | 0 (0.0%) |
| $5,000 to $9,999 | 0 (0.0%) | 0 (0.0%) |
| $10,000 to $14,999 | 109 (3.4%) | 52 (9.3%) |
| $15,000 to $19,999 | 38 (1.2%) | 0 (0.0%) |
| $20,000 to $24,999 | 0 (0.0%) | 0 (0.0%) |
| $25,000 to $34,999 | 259 (8.0%) | 26 (4.6%) |
| $35,000 to $49,999 | 193 (6.0%) | 87 (15.5%) |
| $50,000 to $74,999 | 646 (20.0%) | 111 (19.8%) |
| $75,000 to $99,999 | 456 (14.1%) | 150 (26.7%) |
| $100,000 to $149,999 | 852 (26.4%) | 135 (24.1%) |
| $150,000 or more | 602 (18.6%) | 0 (0.0%) |
| Total | 3,232 (100.0%) | 561 (100.0%) |
Monthly Housing Cost Tiers in Atoka
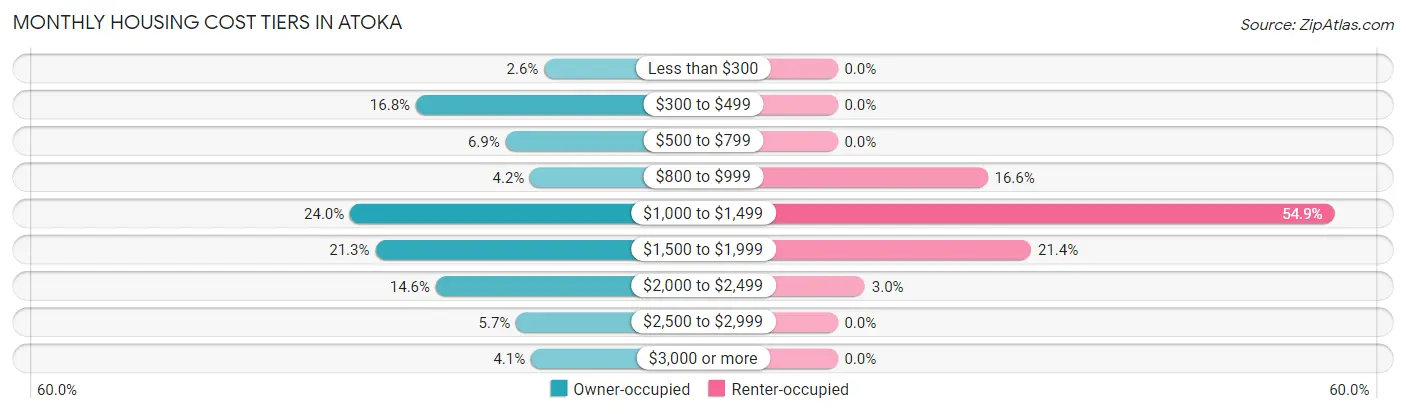
| Monthly Cost | Owner-occupied | Renter-occupied |
| Less than $300 | 84 (2.6%) | 0 (0.0%) |
| $300 to $499 | 542 (16.8%) | 0 (0.0%) |
| $500 to $799 | 222 (6.9%) | 0 (0.0%) |
| $800 to $999 | 134 (4.2%) | 93 (16.6%) |
| $1,000 to $1,499 | 777 (24.0%) | 308 (54.9%) |
| $1,500 to $1,999 | 687 (21.3%) | 120 (21.4%) |
| $2,000 to $2,499 | 471 (14.6%) | 17 (3.0%) |
| $2,500 to $2,999 | 184 (5.7%) | 0 (0.0%) |
| $3,000 or more | 131 (4.1%) | 0 (0.0%) |
| Total | 3,232 (100.0%) | 561 (100.0%) |
Physical Housing Characteristics in Atoka
Housing Structures in Atoka
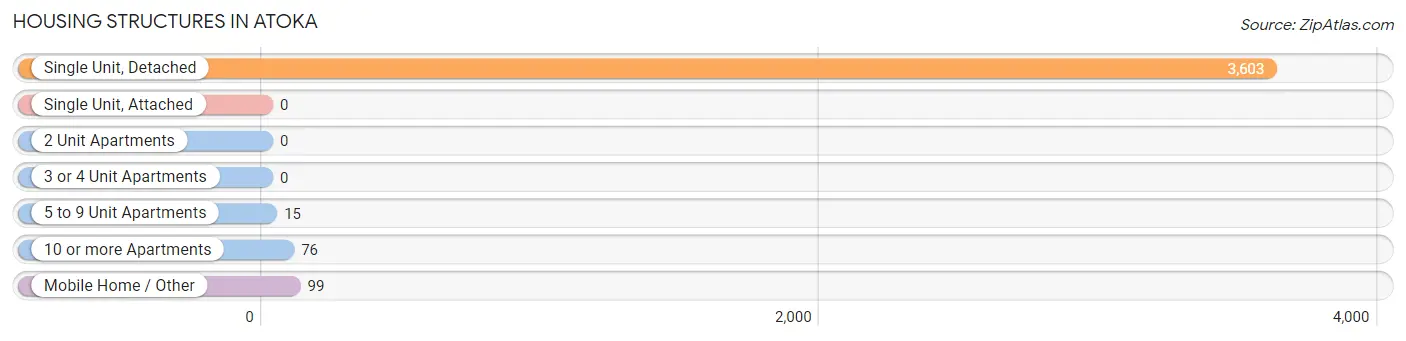
| Structure Type | # Housing Units | % Housing Units |
| Single Unit, Detached | 3,603 | 95.0% |
| Single Unit, Attached | 0 | 0.0% |
| 2 Unit Apartments | 0 | 0.0% |
| 3 or 4 Unit Apartments | 0 | 0.0% |
| 5 to 9 Unit Apartments | 15 | 0.4% |
| 10 or more Apartments | 76 | 2.0% |
| Mobile Home / Other | 99 | 2.6% |
| Total | 3,793 | 100.0% |
Housing Structures by Occupancy in Atoka
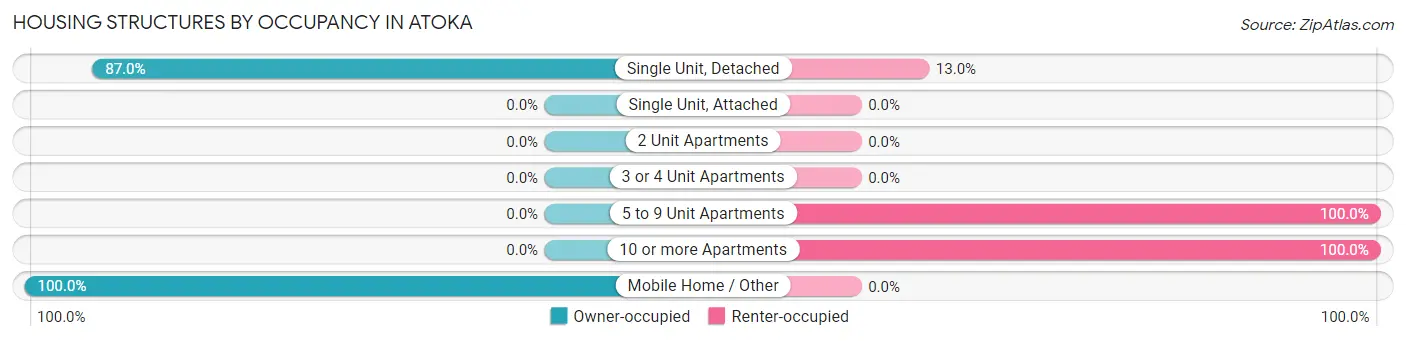
| Structure Type | Owner-occupied | Renter-occupied |
| Single Unit, Detached | 3,133 (87.0%) | 470 (13.0%) |
| Single Unit, Attached | 0 (0.0%) | 0 (0.0%) |
| 2 Unit Apartments | 0 (0.0%) | 0 (0.0%) |
| 3 or 4 Unit Apartments | 0 (0.0%) | 0 (0.0%) |
| 5 to 9 Unit Apartments | 0 (0.0%) | 15 (100.0%) |
| 10 or more Apartments | 0 (0.0%) | 76 (100.0%) |
| Mobile Home / Other | 99 (100.0%) | 0 (0.0%) |
| Total | 3,232 (85.2%) | 561 (14.8%) |
Housing Structures by Number of Rooms in Atoka
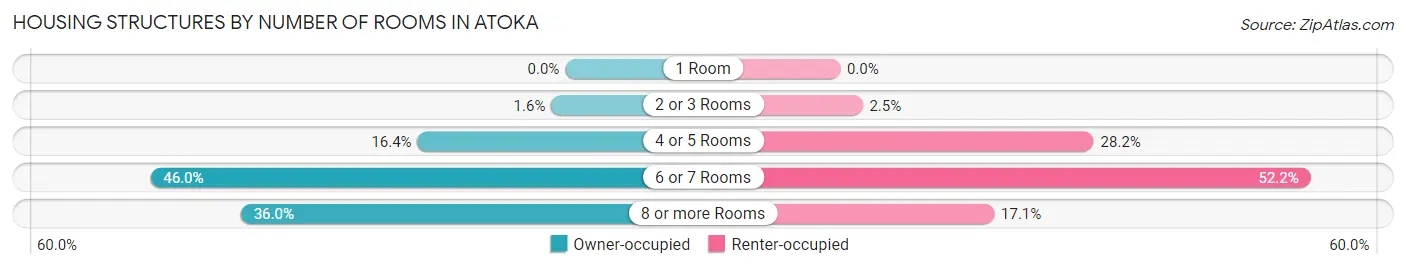
| Number of Rooms | Owner-occupied | Renter-occupied |
| 1 Room | 0 (0.0%) | 0 (0.0%) |
| 2 or 3 Rooms | 50 (1.5%) | 14 (2.5%) |
| 4 or 5 Rooms | 530 (16.4%) | 158 (28.2%) |
| 6 or 7 Rooms | 1,488 (46.0%) | 293 (52.2%) |
| 8 or more Rooms | 1,164 (36.0%) | 96 (17.1%) |
| Total | 3,232 (100.0%) | 561 (100.0%) |
Housing Structure by Heating Type in Atoka
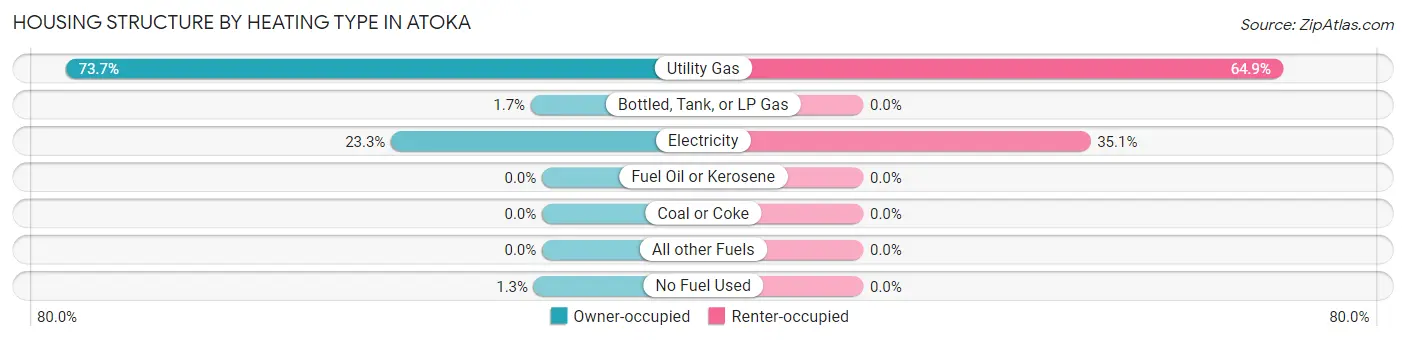
| Heating Type | Owner-occupied | Renter-occupied |
| Utility Gas | 2,381 (73.7%) | 364 (64.9%) |
| Bottled, Tank, or LP Gas | 56 (1.7%) | 0 (0.0%) |
| Electricity | 754 (23.3%) | 197 (35.1%) |
| Fuel Oil or Kerosene | 0 (0.0%) | 0 (0.0%) |
| Coal or Coke | 0 (0.0%) | 0 (0.0%) |
| All other Fuels | 0 (0.0%) | 0 (0.0%) |
| No Fuel Used | 41 (1.3%) | 0 (0.0%) |
| Total | 3,232 (100.0%) | 561 (100.0%) |
Household Vehicle Usage in Atoka
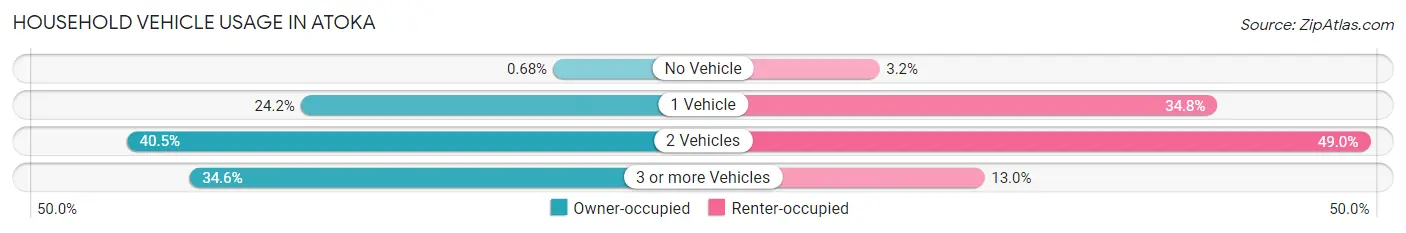
| Vehicles per Household | Owner-occupied | Renter-occupied |
| No Vehicle | 22 (0.7%) | 18 (3.2%) |
| 1 Vehicle | 783 (24.2%) | 195 (34.8%) |
| 2 Vehicles | 1,308 (40.5%) | 275 (49.0%) |
| 3 or more Vehicles | 1,119 (34.6%) | 73 (13.0%) |
| Total | 3,232 (100.0%) | 561 (100.0%) |
Real Estate & Mortgages in Atoka
Real Estate and Mortgage Overview in Atoka
| Characteristic | Without Mortgage | With Mortgage |
| Housing Units | 807 | 2,425 |
| Median Property Value | $235,200 | $252,200 |
| Median Household Income | $50,380 | $553 |
| Monthly Housing Costs | $444 | $131 |
| Real Estate Taxes | $1,340 | $57 |
Property Value by Mortgage Status in Atoka
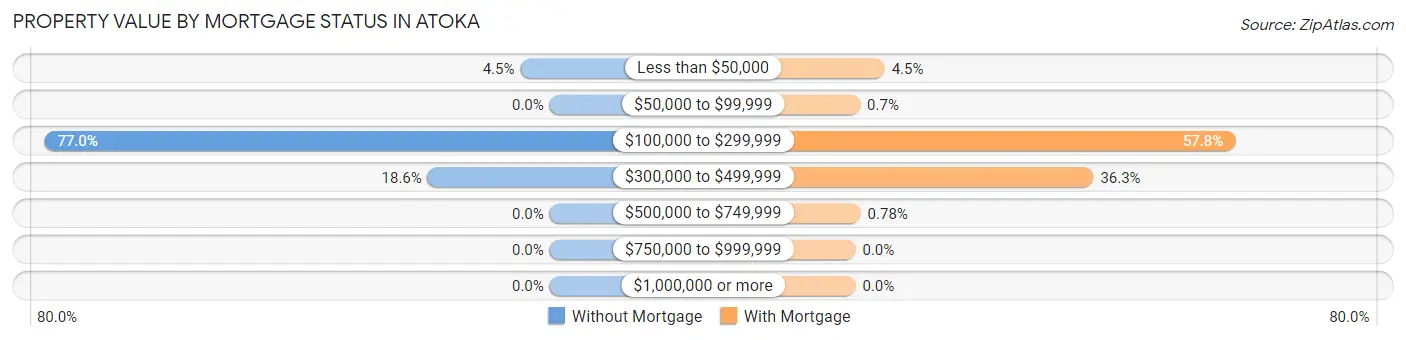
| Property Value | Without Mortgage | With Mortgage |
| Less than $50,000 | 36 (4.5%) | 108 (4.4%) |
| $50,000 to $99,999 | 0 (0.0%) | 17 (0.7%) |
| $100,000 to $299,999 | 621 (76.9%) | 1,402 (57.8%) |
| $300,000 to $499,999 | 150 (18.6%) | 879 (36.2%) |
| $500,000 to $749,999 | 0 (0.0%) | 19 (0.8%) |
| $750,000 to $999,999 | 0 (0.0%) | 0 (0.0%) |
| $1,000,000 or more | 0 (0.0%) | 0 (0.0%) |
| Total | 807 (100.0%) | 2,425 (100.0%) |
Household Income by Mortgage Status in Atoka
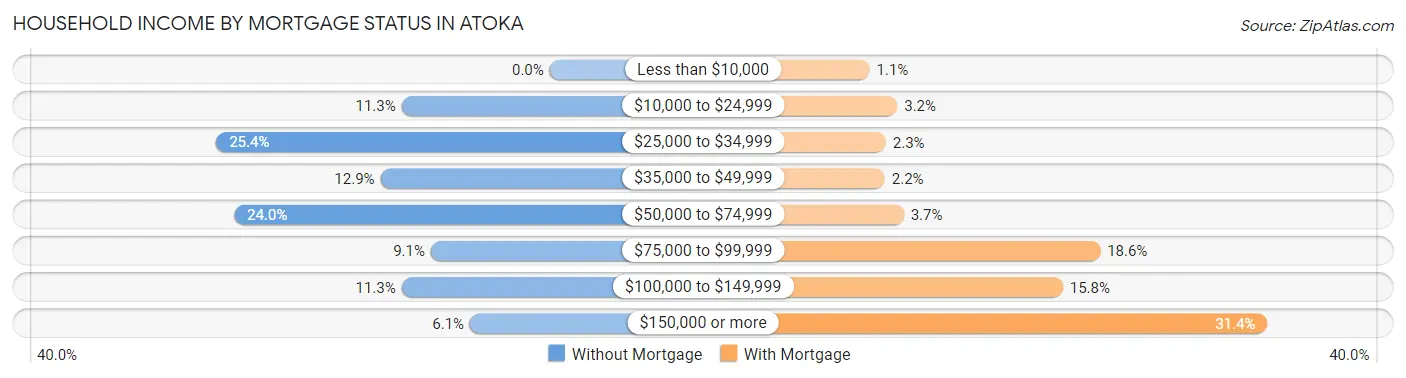
| Household Income | Without Mortgage | With Mortgage |
| Less than $10,000 | 0 (0.0%) | 26 (1.1%) |
| $10,000 to $24,999 | 91 (11.3%) | 77 (3.2%) |
| $25,000 to $34,999 | 205 (25.4%) | 56 (2.3%) |
| $35,000 to $49,999 | 104 (12.9%) | 54 (2.2%) |
| $50,000 to $74,999 | 194 (24.0%) | 89 (3.7%) |
| $75,000 to $99,999 | 73 (9.0%) | 452 (18.6%) |
| $100,000 to $149,999 | 91 (11.3%) | 383 (15.8%) |
| $150,000 or more | 49 (6.1%) | 761 (31.4%) |
| Total | 807 (100.0%) | 2,425 (100.0%) |
Property Value to Household Income Ratio in Atoka
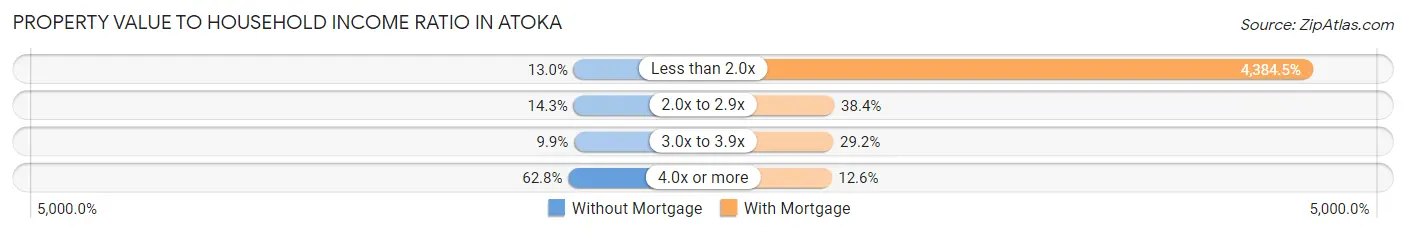
| Value-to-Income Ratio | Without Mortgage | With Mortgage |
| Less than 2.0x | 105 (13.0%) | 106,323 (4,384.4%) |
| 2.0x to 2.9x | 115 (14.2%) | 930 (38.4%) |
| 3.0x to 3.9x | 80 (9.9%) | 709 (29.2%) |
| 4.0x or more | 507 (62.8%) | 305 (12.6%) |
| Total | 807 (100.0%) | 2,425 (100.0%) |
Real Estate Taxes by Mortgage Status in Atoka
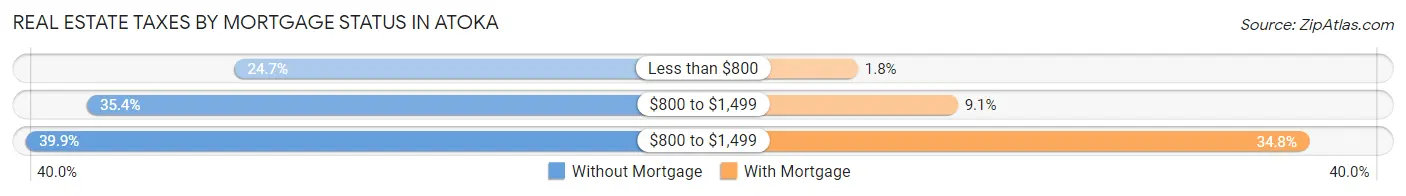
| Property Taxes | Without Mortgage | With Mortgage |
| Less than $800 | 199 (24.7%) | 44 (1.8%) |
| $800 to $1,499 | 286 (35.4%) | 221 (9.1%) |
| $800 to $1,499 | 322 (39.9%) | 843 (34.8%) |
| Total | 807 (100.0%) | 2,425 (100.0%) |
Health & Disability in Atoka
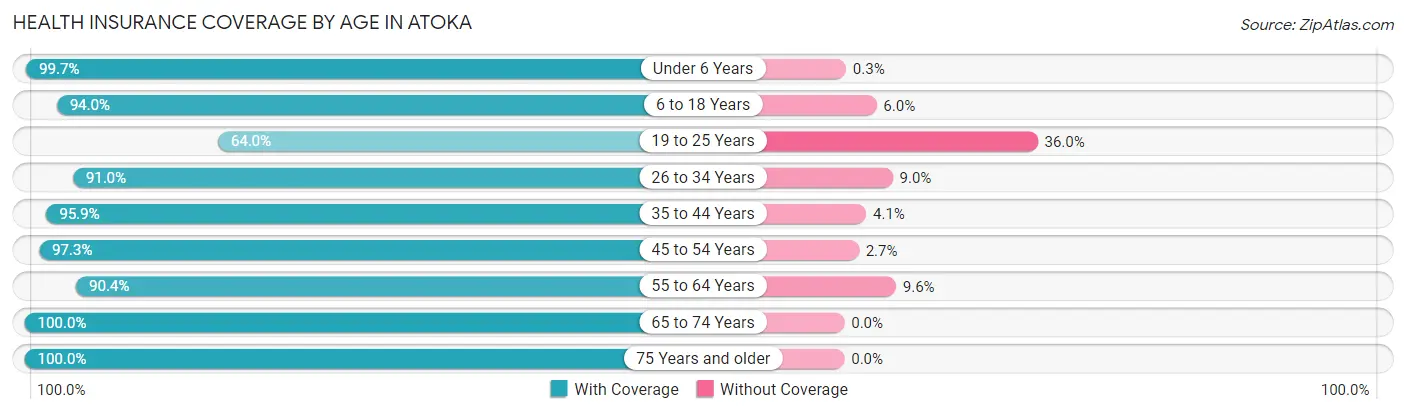
Health Insurance Coverage by Age in Atoka
| Age Bracket | With Coverage | Without Coverage |
| Under 6 Years | 672 (99.7%) | 2 (0.3%) |
| 6 to 18 Years | 1,979 (94.0%) | 126 (6.0%) |
| 19 to 25 Years | 362 (64.0%) | 204 (36.0%) |
| 26 to 34 Years | 960 (91.0%) | 95 (9.0%) |
| 35 to 44 Years | 1,490 (95.9%) | 63 (4.1%) |
| 45 to 54 Years | 1,518 (97.3%) | 42 (2.7%) |
| 55 to 64 Years | 1,166 (90.4%) | 124 (9.6%) |
| 65 to 74 Years | 737 (100.0%) | 0 (0.0%) |
| 75 Years and older | 377 (100.0%) | 0 (0.0%) |
| Total | 9,261 (93.4%) | 656 (6.6%) |
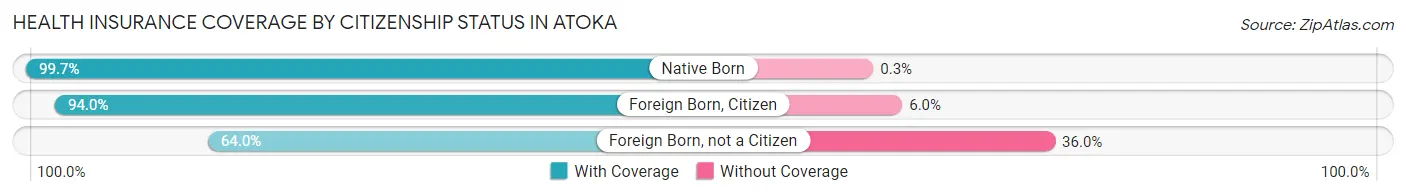
Health Insurance Coverage by Citizenship Status in Atoka
| Citizenship Status | With Coverage | Without Coverage |
| Native Born | 672 (99.7%) | 2 (0.3%) |
| Foreign Born, Citizen | 1,979 (94.0%) | 126 (6.0%) |
| Foreign Born, not a Citizen | 362 (64.0%) | 204 (36.0%) |
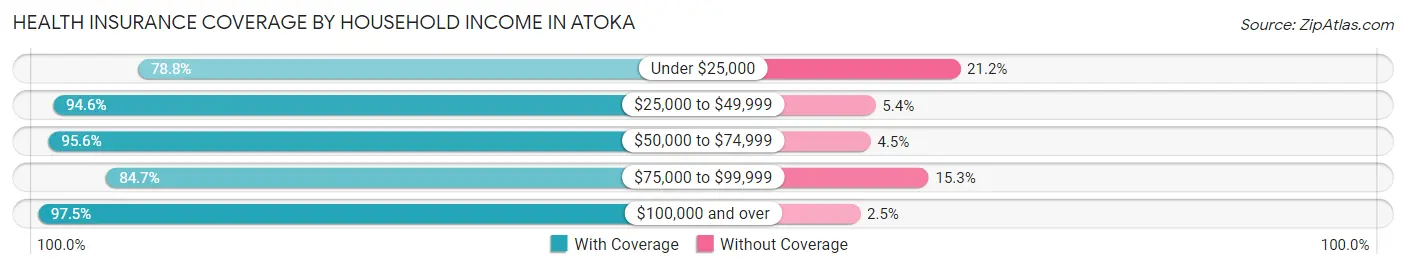
Health Insurance Coverage by Household Income in Atoka
| Household Income | With Coverage | Without Coverage |
| Under $25,000 | 471 (78.8%) | 127 (21.2%) |
| $25,000 to $49,999 | 1,078 (94.6%) | 61 (5.4%) |
| $50,000 to $74,999 | 1,590 (95.6%) | 74 (4.4%) |
| $75,000 to $99,999 | 1,531 (84.7%) | 277 (15.3%) |
| $100,000 and over | 4,591 (97.5%) | 117 (2.5%) |
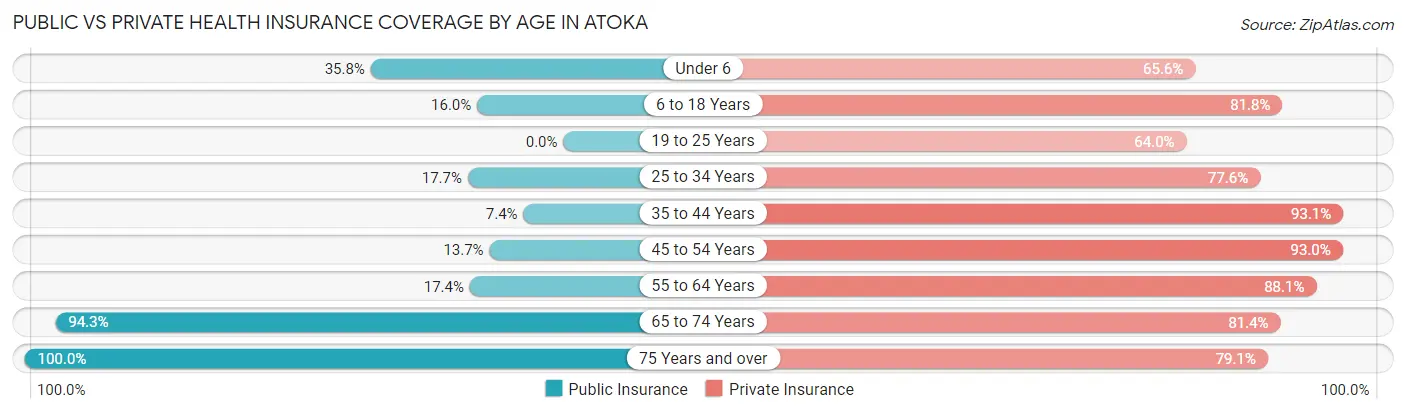
Public vs Private Health Insurance Coverage by Age in Atoka
| Age Bracket | Public Insurance | Private Insurance |
| Under 6 | 241 (35.8%) | 442 (65.6%) |
| 6 to 18 Years | 337 (16.0%) | 1,721 (81.8%) |
| 19 to 25 Years | 0 (0.0%) | 362 (64.0%) |
| 25 to 34 Years | 187 (17.7%) | 819 (77.6%) |
| 35 to 44 Years | 115 (7.4%) | 1,445 (93.0%) |
| 45 to 54 Years | 214 (13.7%) | 1,450 (92.9%) |
| 55 to 64 Years | 224 (17.4%) | 1,136 (88.1%) |
| 65 to 74 Years | 695 (94.3%) | 600 (81.4%) |
| 75 Years and over | 377 (100.0%) | 298 (79.0%) |
| Total | 2,390 (24.1%) | 8,273 (83.4%) |
Disability Status by Sex by Age in Atoka
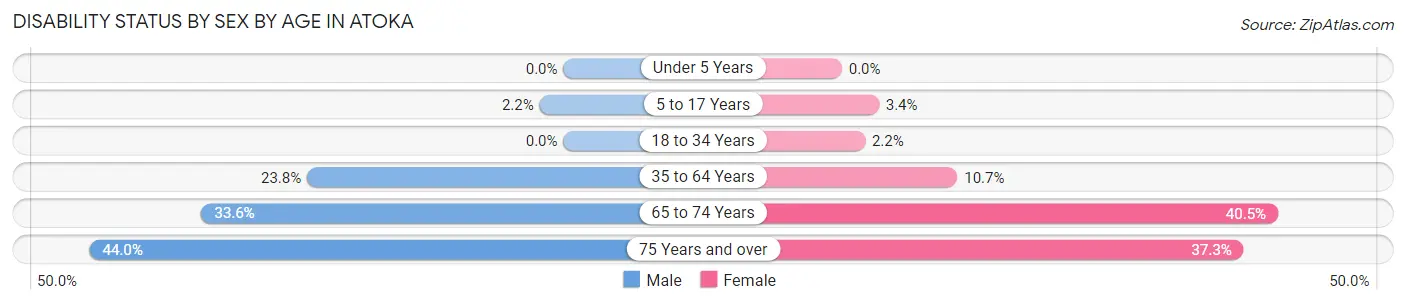
| Age Bracket | Male | Female |
| Under 5 Years | 0 (0.0%) | 0 (0.0%) |
| 5 to 17 Years | 21 (2.2%) | 35 (3.4%) |
| 18 to 34 Years | 0 (0.0%) | 21 (2.1%) |
| 35 to 64 Years | 537 (23.8%) | 230 (10.7%) |
| 65 to 74 Years | 133 (33.6%) | 138 (40.5%) |
| 75 Years and over | 62 (44.0%) | 88 (37.3%) |
Disability Class by Sex by Age in Atoka
Disability Class: Hearing Difficulty
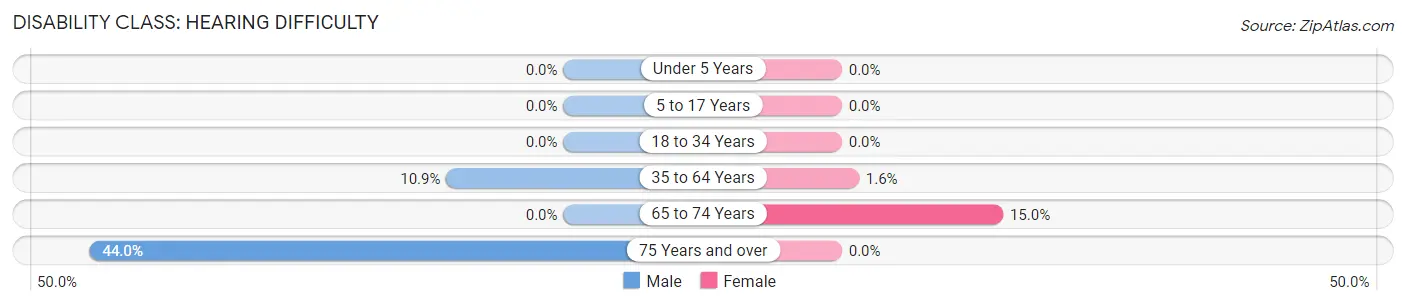
| Age Bracket | Male | Female |
| Under 5 Years | 0 (0.0%) | 0 (0.0%) |
| 5 to 17 Years | 0 (0.0%) | 0 (0.0%) |
| 18 to 34 Years | 0 (0.0%) | 0 (0.0%) |
| 35 to 64 Years | 245 (10.9%) | 34 (1.6%) |
| 65 to 74 Years | 0 (0.0%) | 51 (15.0%) |
| 75 Years and over | 62 (44.0%) | 0 (0.0%) |
Disability Class: Vision Difficulty
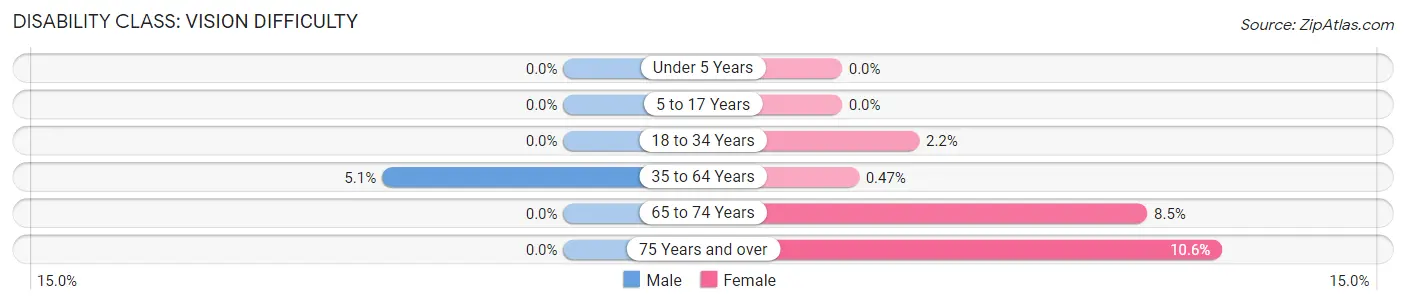
| Age Bracket | Male | Female |
| Under 5 Years | 0 (0.0%) | 0 (0.0%) |
| 5 to 17 Years | 0 (0.0%) | 0 (0.0%) |
| 18 to 34 Years | 0 (0.0%) | 21 (2.1%) |
| 35 to 64 Years | 114 (5.1%) | 10 (0.5%) |
| 65 to 74 Years | 0 (0.0%) | 29 (8.5%) |
| 75 Years and over | 0 (0.0%) | 25 (10.6%) |
Disability Class: Cognitive Difficulty
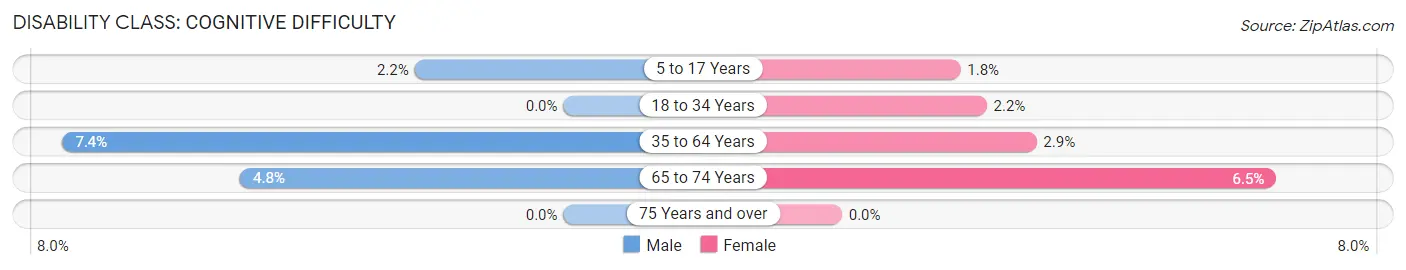
| Age Bracket | Male | Female |
| 5 to 17 Years | 21 (2.2%) | 18 (1.8%) |
| 18 to 34 Years | 0 (0.0%) | 21 (2.1%) |
| 35 to 64 Years | 168 (7.4%) | 62 (2.9%) |
| 65 to 74 Years | 19 (4.8%) | 22 (6.5%) |
| 75 Years and over | 0 (0.0%) | 0 (0.0%) |
Disability Class: Ambulatory Difficulty
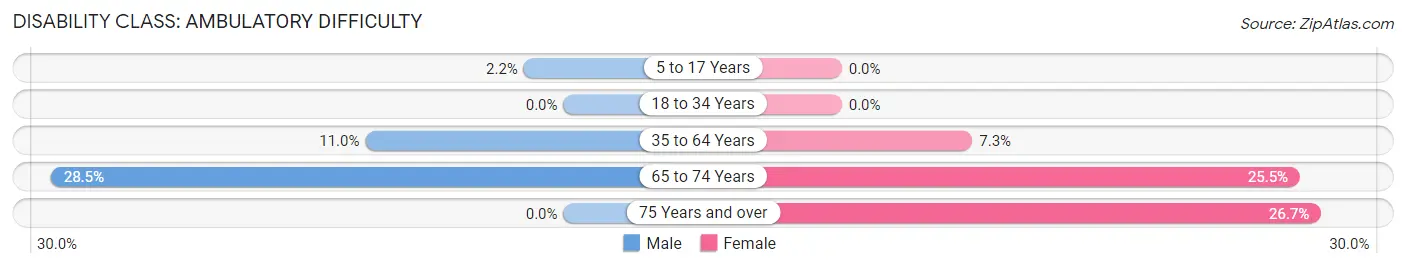
| Age Bracket | Male | Female |
| 5 to 17 Years | 21 (2.2%) | 0 (0.0%) |
| 18 to 34 Years | 0 (0.0%) | 0 (0.0%) |
| 35 to 64 Years | 249 (11.0%) | 156 (7.3%) |
| 65 to 74 Years | 113 (28.5%) | 87 (25.5%) |
| 75 Years and over | 0 (0.0%) | 63 (26.7%) |
Disability Class: Self-Care Difficulty

| Age Bracket | Male | Female |
| 5 to 17 Years | 21 (2.2%) | 35 (3.4%) |
| 18 to 34 Years | 0 (0.0%) | 0 (0.0%) |
| 35 to 64 Years | 23 (1.0%) | 69 (3.2%) |
| 65 to 74 Years | 39 (9.9%) | 0 (0.0%) |
| 75 Years and over | 0 (0.0%) | 17 (7.2%) |
Technology Access in Atoka
Computing Device Access in Atoka
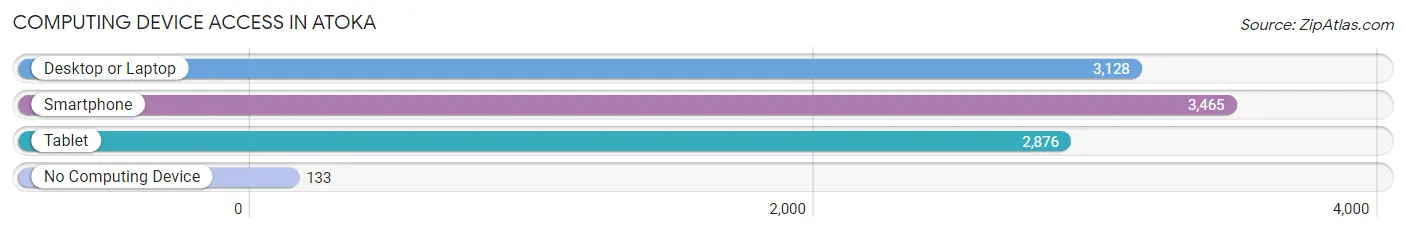
| Device Type | # Households | % Households |
| Desktop or Laptop | 3,128 | 82.5% |
| Smartphone | 3,465 | 91.3% |
| Tablet | 2,876 | 75.8% |
| No Computing Device | 133 | 3.5% |
| Total | 3,793 | 100.0% |
Internet Access in Atoka
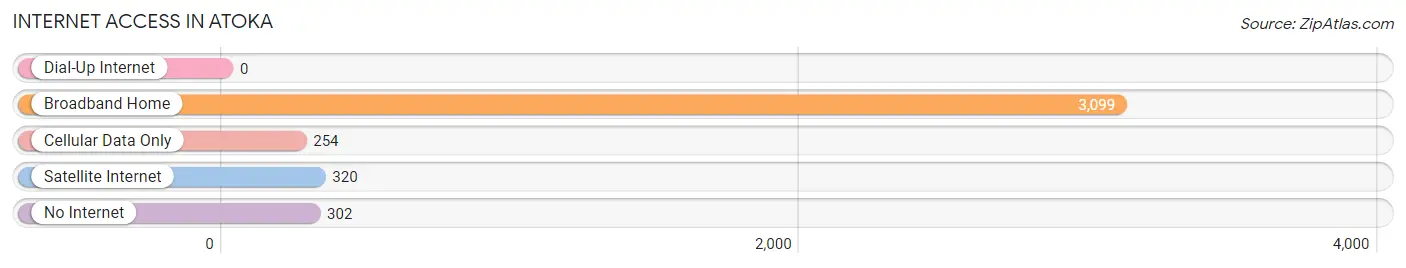
| Internet Type | # Households | % Households |
| Dial-Up Internet | 0 | 0.0% |
| Broadband Home | 3,099 | 81.7% |
| Cellular Data Only | 254 | 6.7% |
| Satellite Internet | 320 | 8.4% |
| No Internet | 302 | 8.0% |
| Total | 3,793 | 100.0% |
Atoka Summary
Atoka is a town located in Tipton County, Tennessee, United States. It is situated along the banks of the Hatchie River, approximately 25 miles northeast of Memphis. The population was 2,945 at the 2010 census.
History
Atoka was founded in 1854 by the Reverend John Atoka, a Methodist minister. The town was named after him and was incorporated in 1858. Atoka was a major stop on the Memphis and Ohio Railroad, which connected Memphis to Nashville. The railroad was completed in 1858 and Atoka quickly became a thriving community.
Atoka was the site of a major Civil War battle in 1862. Confederate forces under General Nathan Bedford Forrest defeated Union forces under General William T. Sherman. The battle was a major victory for the Confederacy and helped to secure the area for the South.
Atoka was also the site of a major railroad accident in 1867. A train carrying passengers and freight derailed, killing several people and injuring many more. The accident was caused by a broken rail and was one of the worst railroad accidents in the history of the United States.
Geography
Atoka is located at 35°25'25" North, 89°37'45" West (35.423, -89.629). According to the United States Census Bureau, the town has a total area of 4.2 square miles (10.8 km2), all land.
Economy
Atoka is a small town with a population of just over 2,900 people. The town is home to several small businesses, including a grocery store, a hardware store, a pharmacy, and a few restaurants. The town also has a few manufacturing plants, including a furniture factory and a plastics factory.
Atoka is also home to a large number of farms, which produce a variety of crops, including cotton, soybeans, corn, and wheat. The town is also home to a large number of cattle and poultry farms.
Demographics
Atoka is a predominantly white town, with a population of 2,945 people as of the 2010 census. The racial makeup of the town was 95.2% White, 1.2% African American, 0.3% Native American, 0.3% Asian, 0.1% Pacific Islander, 1.2% from other races, and 1.7% from two or more races. Hispanic or Latino of any race were 3.2% of the population.
The median income for a household in Atoka was $37,917, and the median income for a family was $45,938. Males had a median income of $35,000 versus $25,000 for females. The per capita income for the town was $17,945. About 8.2% of families and 10.2% of the population were below the poverty line, including 14.2% of those under age 18 and 8.3% of those age 65 or over.
Atoka is served by the Tipton County School System. The town has two elementary schools, one middle school, and one high school. The town also has a library and a museum.
Common Questions
What is Per Capita Income in Atoka?
Per Capita income in Atoka is $37,187.
What is the Median Family Income in Atoka?
Median Family Income in Atoka is $98,143.
What is the Median Household income in Atoka?
Median Household Income in Atoka is $87,928.
What is Income or Wage Gap in Atoka?
Income or Wage Gap in Atoka is 38.8%.
Women in Atoka earn 61.2 cents for every dollar earned by a man.
What is Inequality or Gini Index in Atoka?
Inequality or Gini Index in Atoka is 0.37.
What is the Total Population of Atoka?
Total Population of Atoka is 10,070.
What is the Total Male Population of Atoka?
Total Male Population of Atoka is 5,028.
What is the Total Female Population of Atoka?
Total Female Population of Atoka is 5,042.
What is the Ratio of Males per 100 Females in Atoka?
There are 99.72 Males per 100 Females in Atoka.
What is the Ratio of Females per 100 Males in Atoka?
There are 100.28 Females per 100 Males in Atoka.
What is the Median Population Age in Atoka?
Median Population Age in Atoka is 37.6 Years.
What is the Average Family Size in Atoka
Average Family Size in Atoka is 2.9 People.
What is the Average Household Size in Atoka
Average Household Size in Atoka is 2.6 People.
How Large is the Labor Force in Atoka?
There are 5,066 People in the Labor Forcein in Atoka.
What is the Percentage of People in the Labor Force in Atoka?
65.5% of People are in the Labor Force in Atoka.
What is the Unemployment Rate in Atoka?
Unemployment Rate in Atoka is 6.6%.