Pulaski, NY Map & Demographics
Pulaski Map
Pulaski Overview
$47,174
PER CAPITA INCOME
$87,250
AVG FAMILY INCOME
$61,226
AVG HOUSEHOLD INCOME
20.2%
WAGE / INCOME GAP [ % ]
79.8¢/ $1
WAGE / INCOME GAP [ $ ]
0.57
INEQUALITY / GINI INDEX
2,090
TOTAL POPULATION
998
MALE POPULATION
1,092
FEMALE POPULATION
91.39
MALES / 100 FEMALES
109.42
FEMALES / 100 MALES
44.5
MEDIAN AGE
2.8
AVG FAMILY SIZE
2.3
AVG HOUSEHOLD SIZE
918
LABOR FORCE [ PEOPLE ]
51.6%
PERCENT IN LABOR FORCE
3.5%
UNEMPLOYMENT RATE
Pulaski Zip Codes
Pulaski Area Codes
Income in Pulaski
Income Overview in Pulaski
Per Capita Income in Pulaski is $47,174, while median incomes of families and households are $87,250 and $61,226 respectively.
| Characteristic | Number | Measure |
| Per Capita Income | 2,090 | $47,174 |
| Median Family Income | 506 | $87,250 |
| Mean Family Income | 506 | $113,078 |
| Median Household Income | 892 | $61,226 |
| Mean Household Income | 892 | $111,912 |
| Income Deficit | 506 | $0 |
| Wage / Income Gap (%) | 2,090 | 20.18% |
| Wage / Income Gap ($) | 2,090 | 79.82¢ per $1 |
| Gini / Inequality Index | 2,090 | 0.57 |
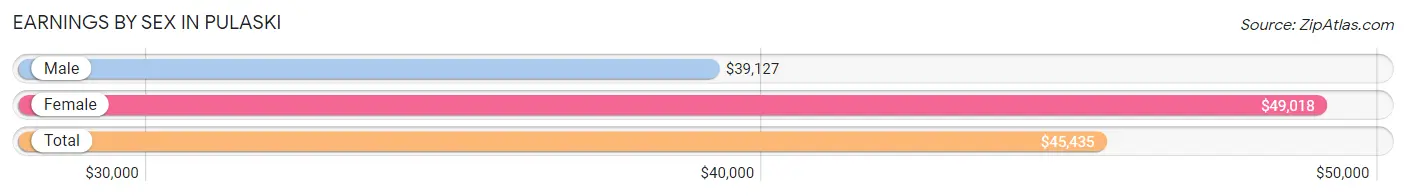
Earnings by Sex in Pulaski
Average Earnings in Pulaski are $45,435, $39,127 for men and $49,018 for women, a difference of 20.2%.
| Sex | Number | Average Earnings |
| Male | 543 (51.5%) | $39,127 |
| Female | 511 (48.5%) | $49,018 |
| Total | 1,054 (100.0%) | $45,435 |
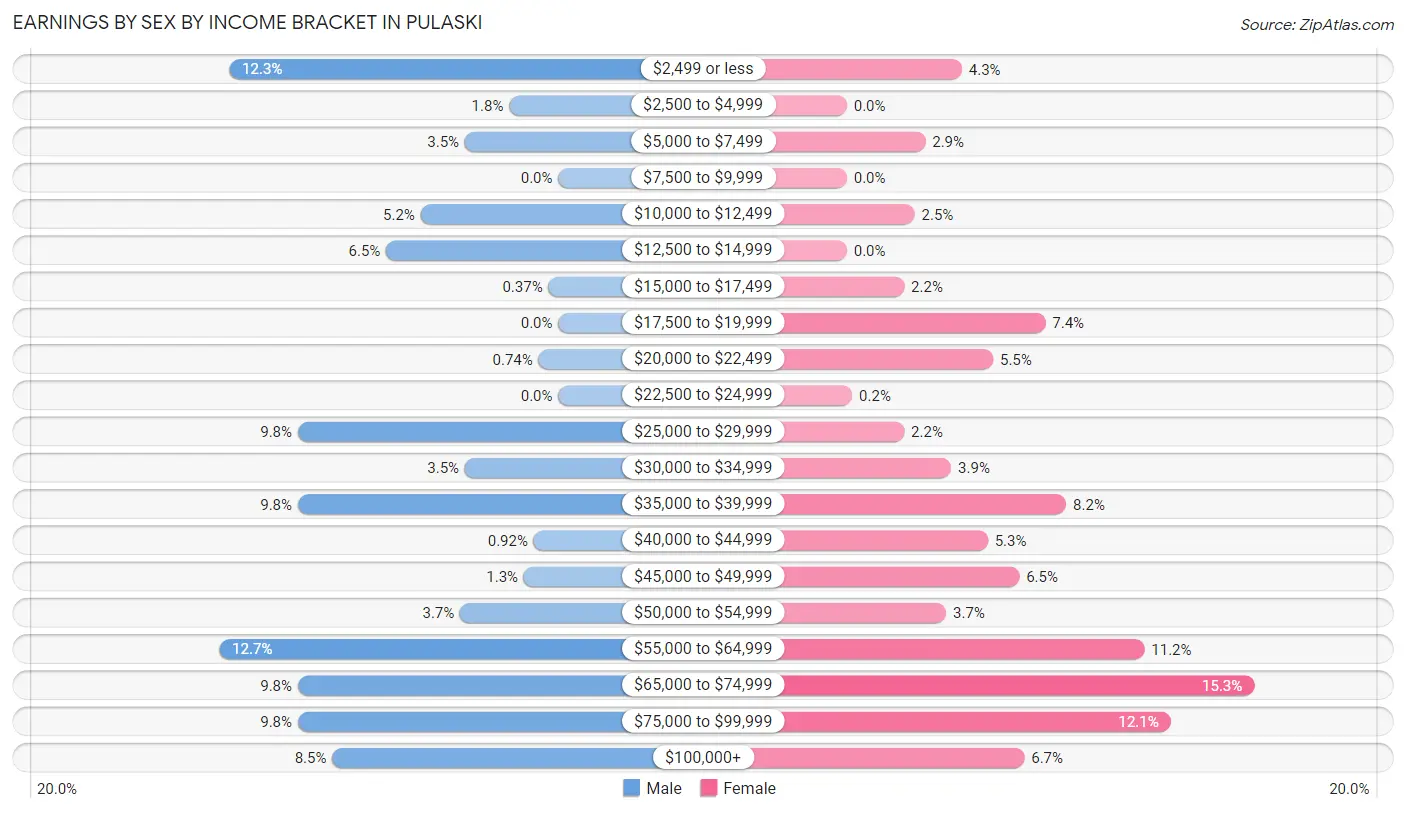
Earnings by Sex by Income Bracket in Pulaski
The most common earnings brackets in Pulaski are $55,000 to $64,999 for men (69 | 12.7%) and $65,000 to $74,999 for women (78 | 15.3%).
| Income | Male | Female |
| $2,499 or less | 67 (12.3%) | 22 (4.3%) |
| $2,500 to $4,999 | 10 (1.8%) | 0 (0.0%) |
| $5,000 to $7,499 | 19 (3.5%) | 15 (2.9%) |
| $7,500 to $9,999 | 0 (0.0%) | 0 (0.0%) |
| $10,000 to $12,499 | 28 (5.2%) | 13 (2.5%) |
| $12,500 to $14,999 | 35 (6.5%) | 0 (0.0%) |
| $15,000 to $17,499 | 2 (0.4%) | 11 (2.1%) |
| $17,500 to $19,999 | 0 (0.0%) | 38 (7.4%) |
| $20,000 to $22,499 | 4 (0.7%) | 28 (5.5%) |
| $22,500 to $24,999 | 0 (0.0%) | 1 (0.2%) |
| $25,000 to $29,999 | 53 (9.8%) | 11 (2.1%) |
| $30,000 to $34,999 | 19 (3.5%) | 20 (3.9%) |
| $35,000 to $39,999 | 53 (9.8%) | 42 (8.2%) |
| $40,000 to $44,999 | 5 (0.9%) | 27 (5.3%) |
| $45,000 to $49,999 | 7 (1.3%) | 33 (6.5%) |
| $50,000 to $54,999 | 20 (3.7%) | 19 (3.7%) |
| $55,000 to $64,999 | 69 (12.7%) | 57 (11.2%) |
| $65,000 to $74,999 | 53 (9.8%) | 78 (15.3%) |
| $75,000 to $99,999 | 53 (9.8%) | 62 (12.1%) |
| $100,000+ | 46 (8.5%) | 34 (6.7%) |
| Total | 543 (100.0%) | 511 (100.0%) |
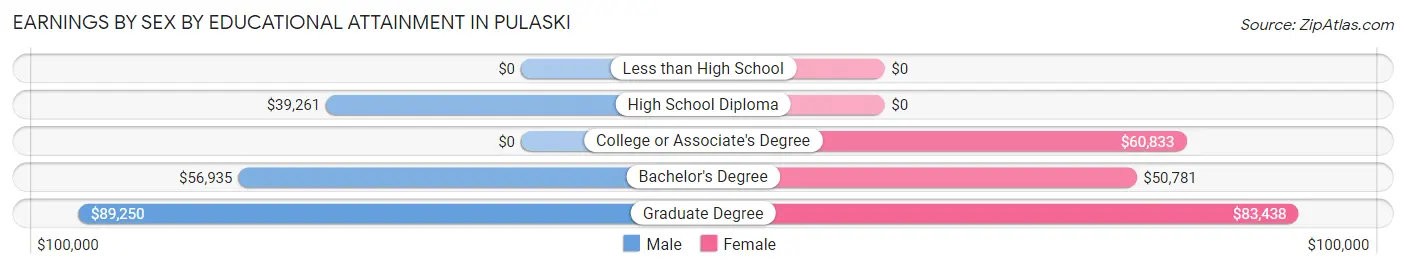
Earnings by Sex by Educational Attainment in Pulaski
Average earnings in Pulaski are $52,019 for men and $57,679 for women, a difference of 9.8%. Men with an educational attainment of graduate degree enjoy the highest average annual earnings of $89,250, while those with high school diploma education earn the least with $39,261. Women with an educational attainment of graduate degree earn the most with the average annual earnings of $83,438, while those with bachelor's degree education have the smallest earnings of $50,781.
| Educational Attainment | Male Income | Female Income |
| Less than High School | - | - |
| High School Diploma | $39,261 | $0 |
| College or Associate's Degree | - | - |
| Bachelor's Degree | $56,935 | $50,781 |
| Graduate Degree | $89,250 | $83,438 |
| Total | $52,019 | $57,679 |
Family Income in Pulaski
Family Income Brackets in Pulaski
According to the Pulaski family income data, there are 147 families falling into the $100,000 to $149,999 income range, which is the most common income bracket and makes up 29.0% of all families.
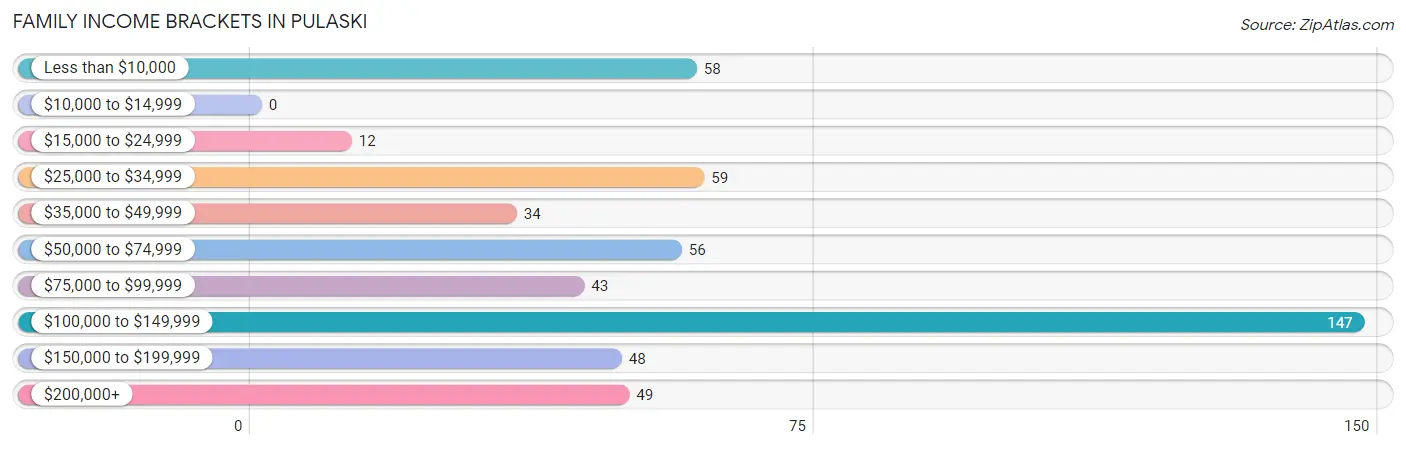
| Income Bracket | # Families | % Families |
| Less than $10,000 | 58 | 11.5% |
| $10,000 to $14,999 | 0 | 0.0% |
| $15,000 to $24,999 | 12 | 2.4% |
| $25,000 to $34,999 | 59 | 11.7% |
| $35,000 to $49,999 | 34 | 6.7% |
| $50,000 to $74,999 | 56 | 11.1% |
| $75,000 to $99,999 | 43 | 8.5% |
| $100,000 to $149,999 | 147 | 29.1% |
| $150,000 to $199,999 | 48 | 9.5% |
| $200,000+ | 49 | 9.7% |
Family Income by Famaliy Size in Pulaski
6-person families (32 | 6.3%) account for the highest median family income in Pulaski with $250,001 per family, while 6-person families (32 | 6.3%) have the highest median income of $41,667 per family member.
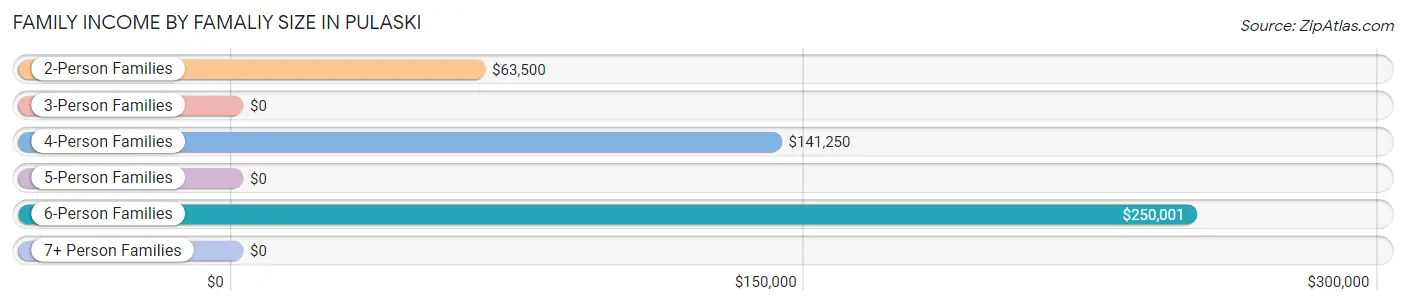
| Income Bracket | # Families | Median Income |
| 2-Person Families | 324 (64.0%) | $63,500 |
| 3-Person Families | 93 (18.4%) | $0 |
| 4-Person Families | 54 (10.7%) | $141,250 |
| 5-Person Families | 3 (0.6%) | $0 |
| 6-Person Families | 32 (6.3%) | $250,001 |
| 7+ Person Families | 0 (0.0%) | $0 |
| Total | 506 (100.0%) | $87,250 |
Family Income by Number of Earners in Pulaski
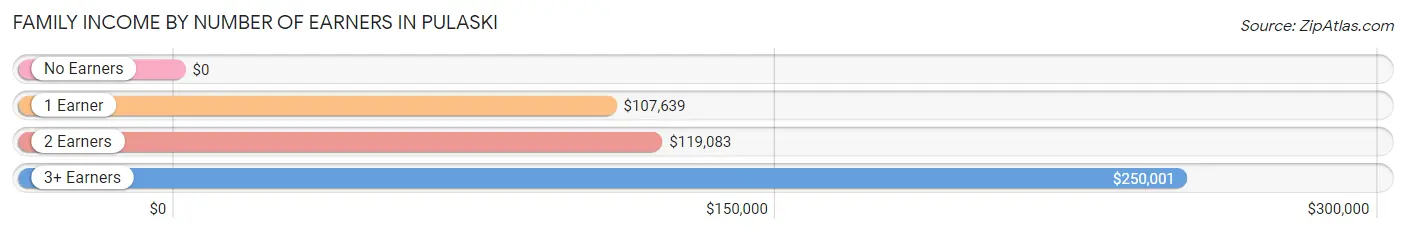
| Number of Earners | # Families | Median Income |
| No Earners | 166 (32.8%) | $0 |
| 1 Earner | 103 (20.4%) | $107,639 |
| 2 Earners | 201 (39.7%) | $119,083 |
| 3+ Earners | 36 (7.1%) | $250,001 |
| Total | 506 (100.0%) | $87,250 |
Household Income in Pulaski
Household Income Brackets in Pulaski
With 147 households falling in the category, the $100,000 to $149,999 income range is the most frequent in Pulaski, accounting for 16.5% of all households. In contrast, only 41 households (4.6%) fall into the $10,000 to $14,999 income bracket, making it the least populous group.
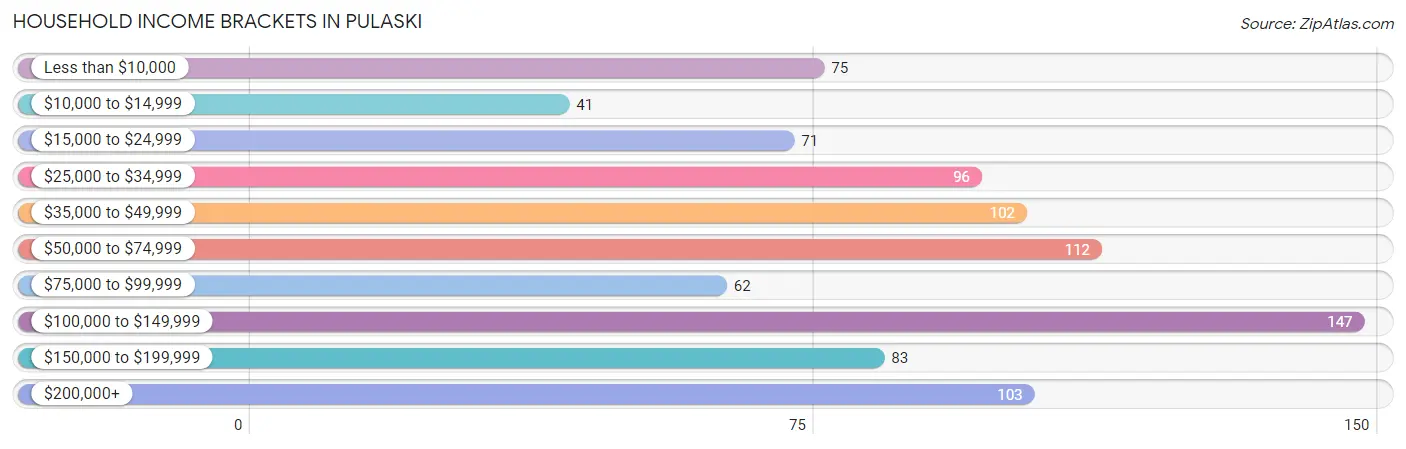
| Income Bracket | # Households | % Households |
| Less than $10,000 | 75 | 8.4% |
| $10,000 to $14,999 | 41 | 4.6% |
| $15,000 to $24,999 | 71 | 8.0% |
| $25,000 to $34,999 | 96 | 10.8% |
| $35,000 to $49,999 | 102 | 11.4% |
| $50,000 to $74,999 | 112 | 12.6% |
| $75,000 to $99,999 | 62 | 7.0% |
| $100,000 to $149,999 | 147 | 16.5% |
| $150,000 to $199,999 | 83 | 9.3% |
| $200,000+ | 103 | 11.5% |
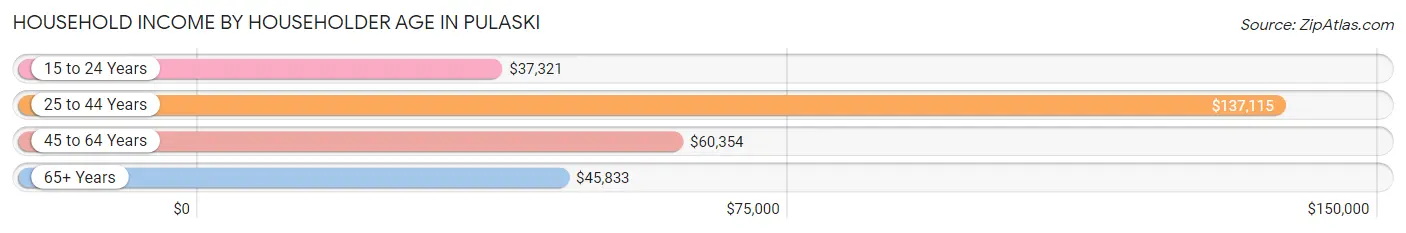
Household Income by Householder Age in Pulaski
The median household income in Pulaski is $61,226, with the highest median household income of $137,115 found in the 25 to 44 years age bracket for the primary householder. A total of 268 households (30.0%) fall into this category. Meanwhile, the 15 to 24 years age bracket for the primary householder has the lowest median household income of $37,321, with 29 households (3.3%) in this group.
| Income Bracket | # Households | Median Income |
| 15 to 24 Years | 29 (3.3%) | $37,321 |
| 25 to 44 Years | 268 (30.0%) | $137,115 |
| 45 to 64 Years | 295 (33.1%) | $60,354 |
| 65+ Years | 300 (33.6%) | $45,833 |
| Total | 892 (100.0%) | $61,226 |
Poverty in Pulaski
Income Below Poverty by Sex and Age in Pulaski
With 13.0% poverty level for males and 14.8% for females among the residents of Pulaski, 5 year old males and under 5 year old females are the most vulnerable to poverty, with 16 males (100.0%) and 20 females (46.5%) in their respective age groups living below the poverty level.
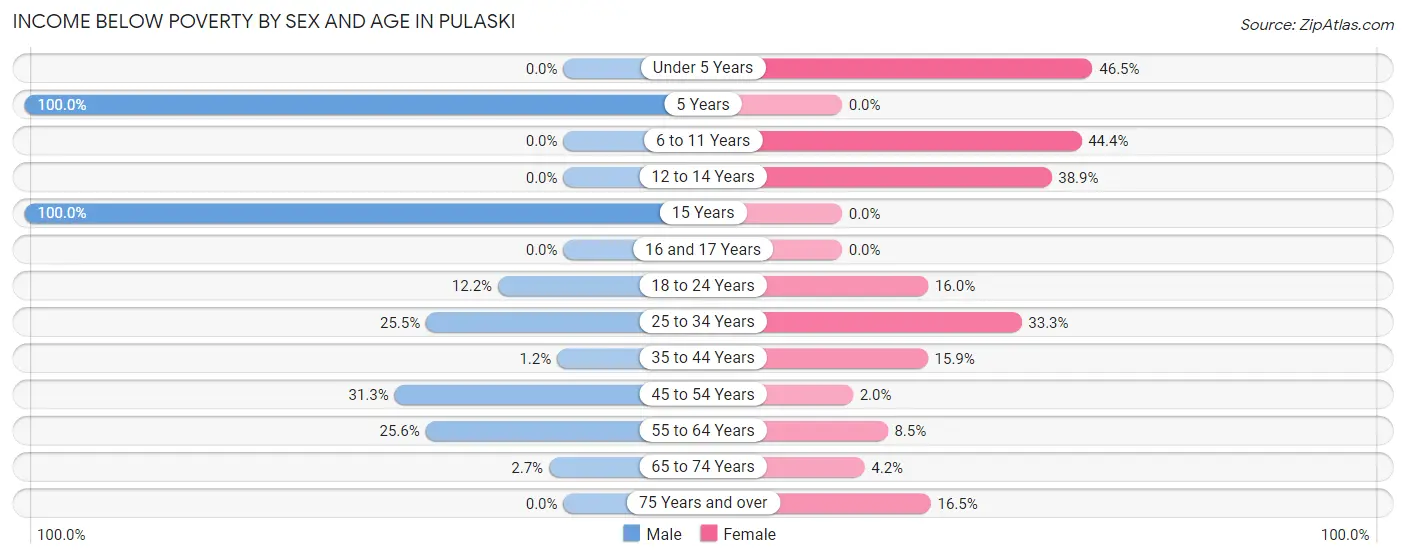
| Age Bracket | Male | Female |
| Under 5 Years | 0 (0.0%) | 20 (46.5%) |
| 5 Years | 16 (100.0%) | 0 (0.0%) |
| 6 to 11 Years | 0 (0.0%) | 12 (44.4%) |
| 12 to 14 Years | 0 (0.0%) | 21 (38.9%) |
| 15 Years | 6 (100.0%) | 0 (0.0%) |
| 16 and 17 Years | 0 (0.0%) | 0 (0.0%) |
| 18 to 24 Years | 13 (12.1%) | 8 (16.0%) |
| 25 to 34 Years | 40 (25.5%) | 34 (33.3%) |
| 35 to 44 Years | 2 (1.2%) | 18 (15.9%) |
| 45 to 54 Years | 26 (31.3%) | 3 (2.0%) |
| 55 to 64 Years | 22 (25.6%) | 19 (8.5%) |
| 65 to 74 Years | 4 (2.7%) | 7 (4.2%) |
| 75 Years and over | 0 (0.0%) | 16 (16.5%) |
| Total | 129 (13.0%) | 158 (14.8%) |
Income Above Poverty by Sex and Age in Pulaski
According to the poverty statistics in Pulaski, males aged under 5 years and females aged 15 years are the age groups that are most secure financially, with 100.0% of males and 100.0% of females in these age groups living above the poverty line.
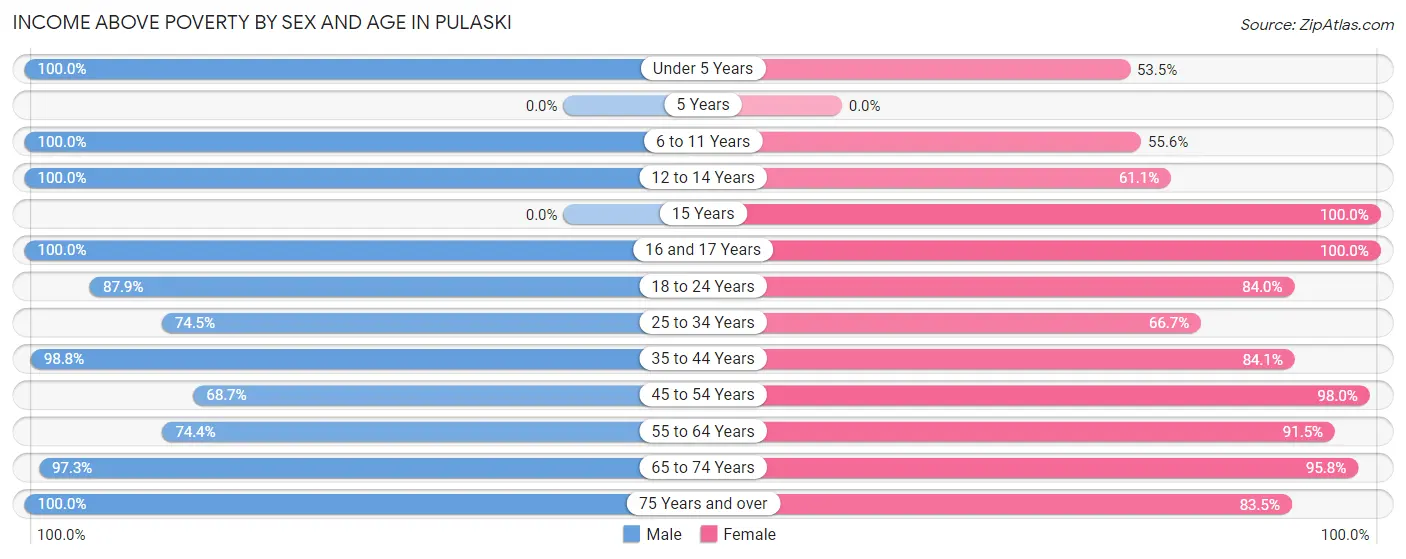
| Age Bracket | Male | Female |
| Under 5 Years | 12 (100.0%) | 23 (53.5%) |
| 5 Years | 0 (0.0%) | 0 (0.0%) |
| 6 to 11 Years | 56 (100.0%) | 15 (55.6%) |
| 12 to 14 Years | 49 (100.0%) | 33 (61.1%) |
| 15 Years | 0 (0.0%) | 18 (100.0%) |
| 16 and 17 Years | 21 (100.0%) | 26 (100.0%) |
| 18 to 24 Years | 94 (87.8%) | 42 (84.0%) |
| 25 to 34 Years | 117 (74.5%) | 68 (66.7%) |
| 35 to 44 Years | 169 (98.8%) | 95 (84.1%) |
| 45 to 54 Years | 57 (68.7%) | 145 (98.0%) |
| 55 to 64 Years | 64 (74.4%) | 205 (91.5%) |
| 65 to 74 Years | 146 (97.3%) | 160 (95.8%) |
| 75 Years and over | 78 (100.0%) | 81 (83.5%) |
| Total | 863 (87.0%) | 911 (85.2%) |
Income Below Poverty Among Married-Couple Families in Pulaski
The poverty statistics for married-couple families in Pulaski show that 3.1% or 11 of the total 353 families live below the poverty line. Families with no children have the highest poverty rate of 4.7%, comprising of 11 families. On the other hand, families with 1 or 2 children have the lowest poverty rate of 0.0%, which includes 0 families.
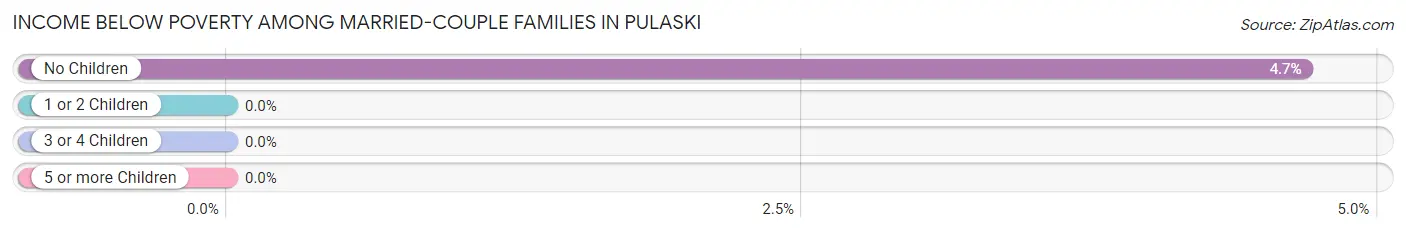
| Children | Above Poverty | Below Poverty |
| No Children | 224 (95.3%) | 11 (4.7%) |
| 1 or 2 Children | 110 (100.0%) | 0 (0.0%) |
| 3 or 4 Children | 8 (100.0%) | 0 (0.0%) |
| 5 or more Children | 0 (0.0%) | 0 (0.0%) |
| Total | 342 (96.9%) | 11 (3.1%) |
Income Below Poverty Among Single-Parent Households in Pulaski
According to the poverty data in Pulaski, 10.7% or 6 single-father households and 53.6% or 52 single-mother households are living below the poverty line. Among single-father households, those with no children have the highest poverty rate, with 6 households (10.7%) experiencing poverty. Likewise, among single-mother households, those with 1 or 2 children have the highest poverty rate, with 52 households (73.2%) falling below the poverty line.
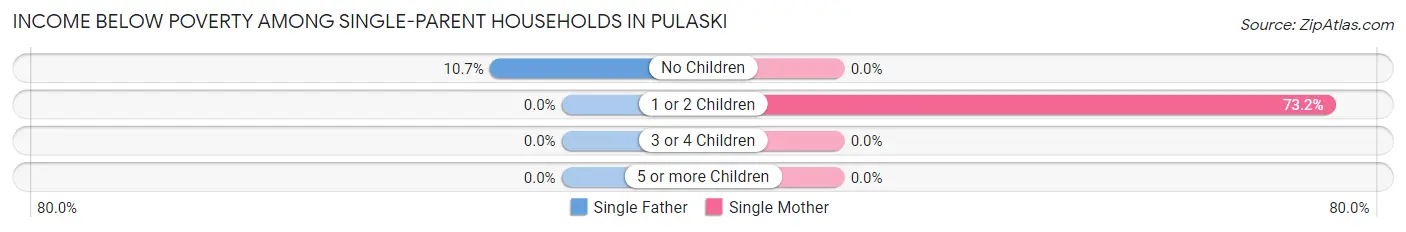
| Children | Single Father | Single Mother |
| No Children | 6 (10.7%) | 0 (0.0%) |
| 1 or 2 Children | 0 (0.0%) | 52 (73.2%) |
| 3 or 4 Children | 0 (0.0%) | 0 (0.0%) |
| 5 or more Children | 0 (0.0%) | 0 (0.0%) |
| Total | 6 (10.7%) | 52 (53.6%) |
Income Below Poverty Among Married-Couple vs Single-Parent Households in Pulaski
The poverty data for Pulaski shows that 11 of the married-couple family households (3.1%) and 58 of the single-parent households (37.9%) are living below the poverty level. Within the married-couple family households, those with no children have the highest poverty rate, with 11 households (4.7%) falling below the poverty line. Among the single-parent households, those with 1 or 2 children have the highest poverty rate, with 52 household (73.2%) living below poverty.
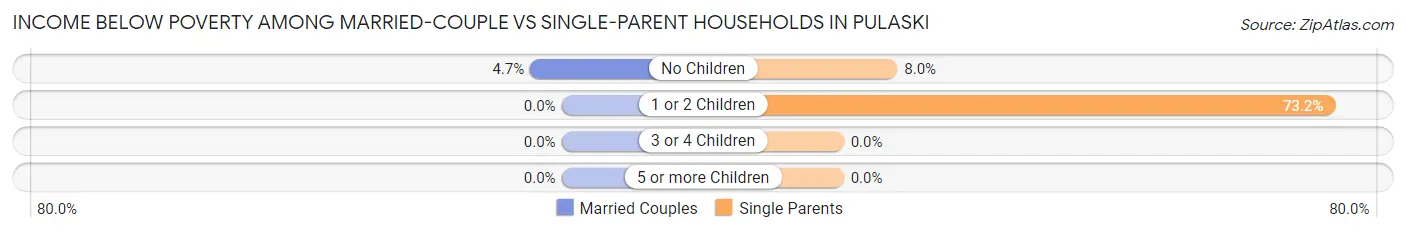
| Children | Married-Couple Families | Single-Parent Households |
| No Children | 11 (4.7%) | 6 (8.0%) |
| 1 or 2 Children | 0 (0.0%) | 52 (73.2%) |
| 3 or 4 Children | 0 (0.0%) | 0 (0.0%) |
| 5 or more Children | 0 (0.0%) | 0 (0.0%) |
| Total | 11 (3.1%) | 58 (37.9%) |
Race in Pulaski
The most populous races in Pulaski are White / Caucasian (2,062 | 98.7%), Hispanic or Latino (51 | 2.4%), and Two or more Races (19 | 0.9%).
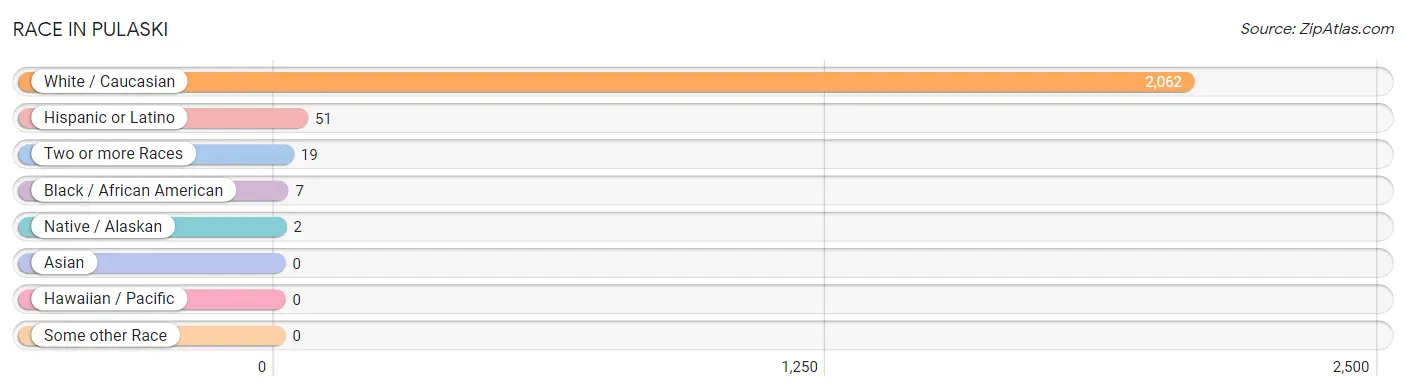
| Race | # Population | % Population |
| Asian | 0 | 0.0% |
| Black / African American | 7 | 0.3% |
| Hawaiian / Pacific | 0 | 0.0% |
| Hispanic or Latino | 51 | 2.4% |
| Native / Alaskan | 2 | 0.1% |
| White / Caucasian | 2,062 | 98.7% |
| Two or more Races | 19 | 0.9% |
| Some other Race | 0 | 0.0% |
| Total | 2,090 | 100.0% |
Ancestry in Pulaski
The most populous ancestries reported in Pulaski are English (301 | 14.4%), German (284 | 13.6%), Irish (260 | 12.4%), Canadian (100 | 4.8%), and Italian (99 | 4.7%), together accounting for 49.9% of all Pulaski residents.
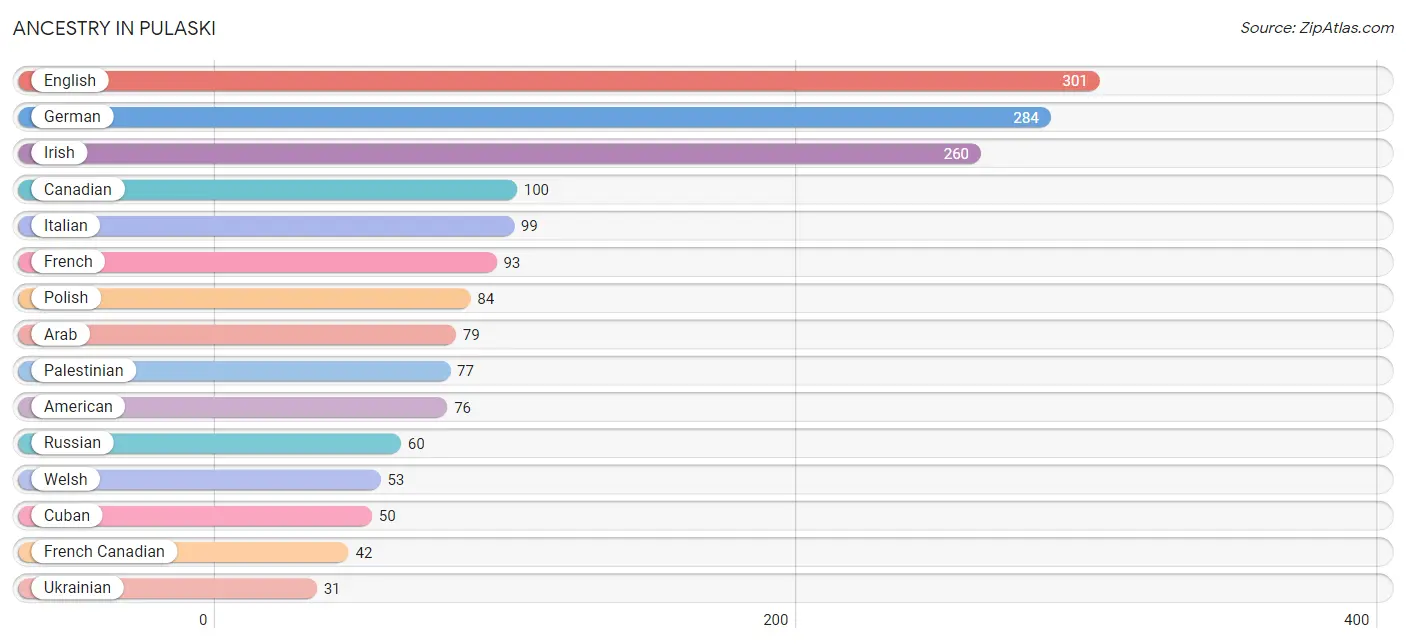
| Ancestry | # Population | % Population |
| American | 76 | 3.6% |
| Arab | 79 | 3.8% |
| Austrian | 4 | 0.2% |
| Bhutanese | 3 | 0.1% |
| Blackfeet | 3 | 0.1% |
| British | 8 | 0.4% |
| Canadian | 100 | 4.8% |
| Cherokee | 1 | 0.1% |
| Cuban | 50 | 2.4% |
| Danish | 6 | 0.3% |
| Dutch | 11 | 0.5% |
| English | 301 | 14.4% |
| European | 20 | 1.0% |
| French | 93 | 4.4% |
| French Canadian | 42 | 2.0% |
| German | 284 | 13.6% |
| Irish | 260 | 12.4% |
| Italian | 99 | 4.7% |
| Lithuanian | 4 | 0.2% |
| Northern European | 7 | 0.3% |
| Norwegian | 5 | 0.2% |
| Palestinian | 77 | 3.7% |
| Polish | 84 | 4.0% |
| Portuguese | 3 | 0.1% |
| Puerto Rican | 1 | 0.1% |
| Russian | 60 | 2.9% |
| Scotch-Irish | 16 | 0.8% |
| Scottish | 29 | 1.4% |
| Swedish | 12 | 0.6% |
| Ukrainian | 31 | 1.5% |
| Welsh | 53 | 2.5% | View All 31 Rows |
Immigrants in Pulaski
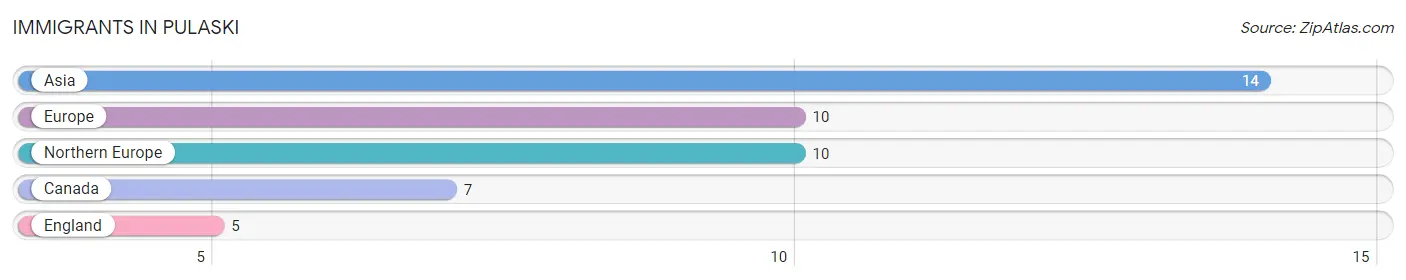
The most numerous immigrant groups reported in Pulaski came from Asia (14 | 0.7%), Europe (10 | 0.5%), Northern Europe (10 | 0.5%), Canada (7 | 0.3%), and England (5 | 0.2%), together accounting for 2.2% of all Pulaski residents.
| Immigration Origin | # Population | % Population |
| Asia | 14 | 0.7% |
| Canada | 7 | 0.3% |
| England | 5 | 0.2% |
| Europe | 10 | 0.5% |
| Northern Europe | 10 | 0.5% | View All 5 Rows |
Sex and Age in Pulaski
Sex and Age in Pulaski
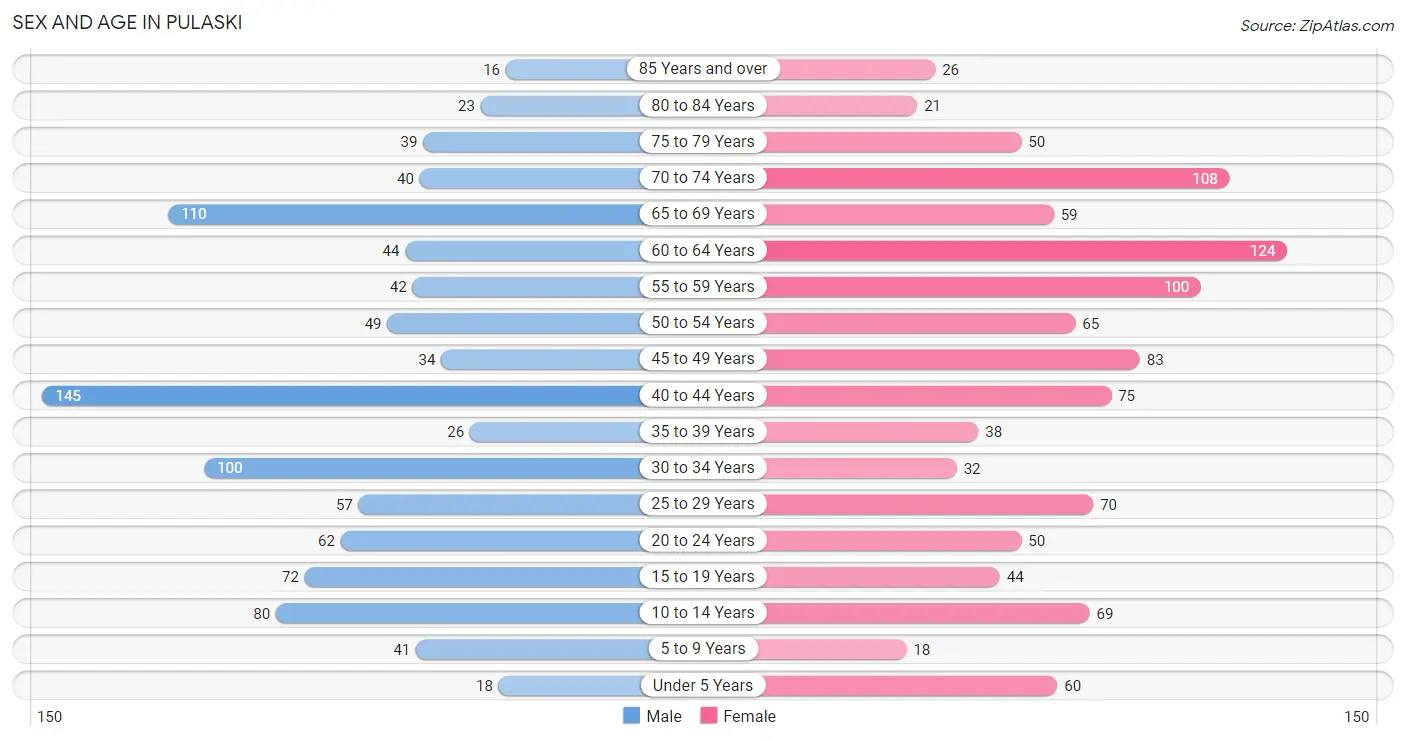
The most populous age groups in Pulaski are 40 to 44 Years (145 | 14.5%) for men and 60 to 64 Years (124 | 11.4%) for women.
| Age Bracket | Male | Female |
| Under 5 Years | 18 (1.8%) | 60 (5.5%) |
| 5 to 9 Years | 41 (4.1%) | 18 (1.7%) |
| 10 to 14 Years | 80 (8.0%) | 69 (6.3%) |
| 15 to 19 Years | 72 (7.2%) | 44 (4.0%) |
| 20 to 24 Years | 62 (6.2%) | 50 (4.6%) |
| 25 to 29 Years | 57 (5.7%) | 70 (6.4%) |
| 30 to 34 Years | 100 (10.0%) | 32 (2.9%) |
| 35 to 39 Years | 26 (2.6%) | 38 (3.5%) |
| 40 to 44 Years | 145 (14.5%) | 75 (6.9%) |
| 45 to 49 Years | 34 (3.4%) | 83 (7.6%) |
| 50 to 54 Years | 49 (4.9%) | 65 (5.9%) |
| 55 to 59 Years | 42 (4.2%) | 100 (9.2%) |
| 60 to 64 Years | 44 (4.4%) | 124 (11.4%) |
| 65 to 69 Years | 110 (11.0%) | 59 (5.4%) |
| 70 to 74 Years | 40 (4.0%) | 108 (9.9%) |
| 75 to 79 Years | 39 (3.9%) | 50 (4.6%) |
| 80 to 84 Years | 23 (2.3%) | 21 (1.9%) |
| 85 Years and over | 16 (1.6%) | 26 (2.4%) |
| Total | 998 (100.0%) | 1,092 (100.0%) |
Families and Households in Pulaski
Median Family Size in Pulaski
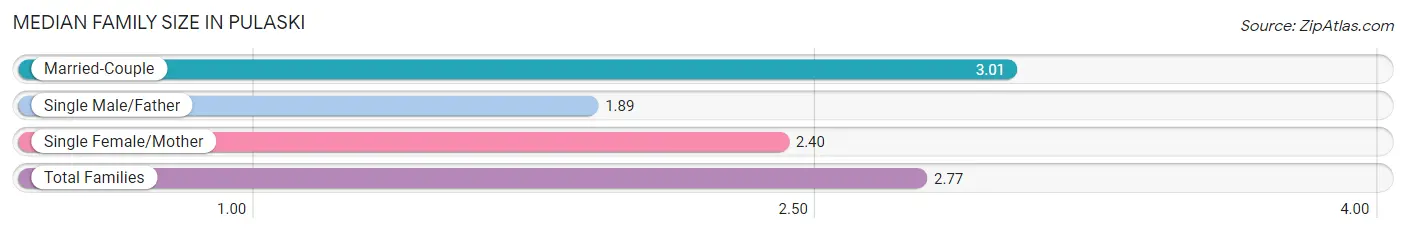
The median family size in Pulaski is 2.77 persons per family, with married-couple families (353 | 69.8%) accounting for the largest median family size of 3.01 persons per family. On the other hand, single male/father families (56 | 11.1%) represent the smallest median family size with 1.89 persons per family.
| Family Type | # Families | Family Size |
| Married-Couple | 353 (69.8%) | 3.01 |
| Single Male/Father | 56 (11.1%) | 1.89 |
| Single Female/Mother | 97 (19.2%) | 2.40 |
| Total Families | 506 (100.0%) | 2.77 |
Median Household Size in Pulaski
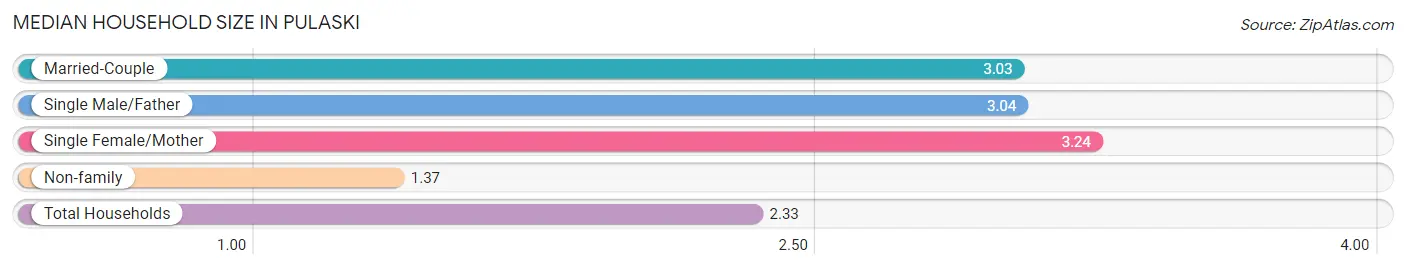
The median household size in Pulaski is 2.33 persons per household, with single female/mother households (97 | 10.9%) accounting for the largest median household size of 3.24 persons per household. non-family households (386 | 43.3%) represent the smallest median household size with 1.37 persons per household.
| Household Type | # Households | Household Size |
| Married-Couple | 353 (39.6%) | 3.03 |
| Single Male/Father | 56 (6.3%) | 3.04 |
| Single Female/Mother | 97 (10.9%) | 3.24 |
| Non-family | 386 (43.3%) | 1.37 |
| Total Households | 892 (100.0%) | 2.33 |
Household Size by Marriage Status in Pulaski
Out of a total of 892 households in Pulaski, 506 (56.7%) are family households, while 386 (43.3%) are nonfamily households. The most numerous type of family households are 2-person households, comprising 266, and the most common type of nonfamily households are 1-person households, comprising 260.
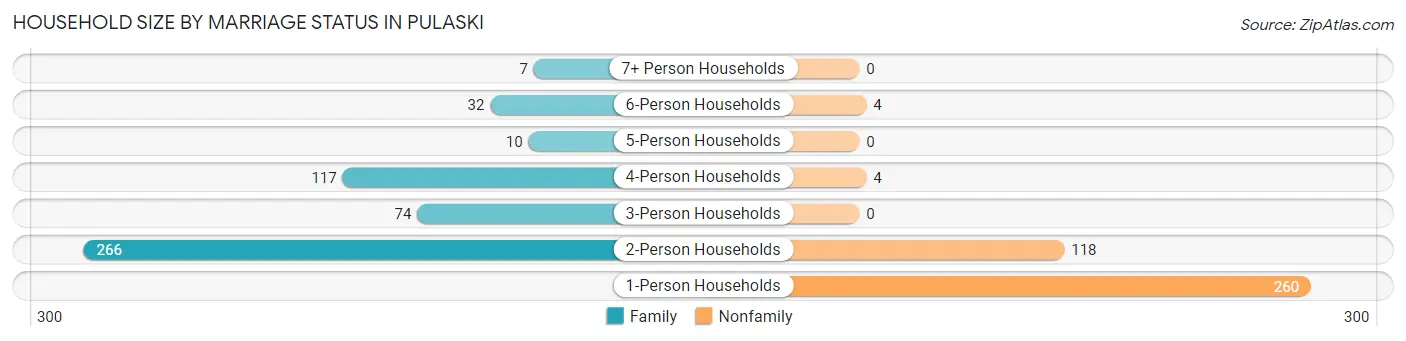
| Household Size | Family Households | Nonfamily Households |
| 1-Person Households | - | 260 (29.1%) |
| 2-Person Households | 266 (29.8%) | 118 (13.2%) |
| 3-Person Households | 74 (8.3%) | 0 (0.0%) |
| 4-Person Households | 117 (13.1%) | 4 (0.4%) |
| 5-Person Households | 10 (1.1%) | 0 (0.0%) |
| 6-Person Households | 32 (3.6%) | 4 (0.4%) |
| 7+ Person Households | 7 (0.8%) | 0 (0.0%) |
| Total | 506 (56.7%) | 386 (43.3%) |
Female Fertility in Pulaski
Fertility by Age in Pulaski
Average fertility rate in Pulaski is 2.0 births per 1,000 women. Women in the age bracket of 35 to 50 years have the highest fertility rate with 4.0 births per 1,000 women. Women in the age bracket of 35 to 50 years acount for 100.0% of all women with births.
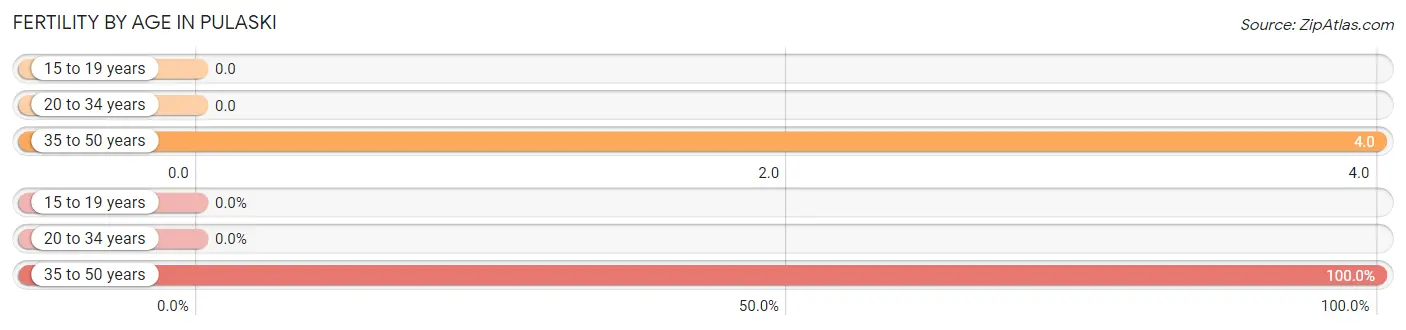
| Age Bracket | Women with Births | Births / 1,000 Women |
| 15 to 19 years | 0 (0.0%) | 0.0 |
| 20 to 34 years | 0 (0.0%) | 0.0 |
| 35 to 50 years | 1 (100.0%) | 4.0 |
| Total | 1 (100.0%) | 2.0 |
Fertility by Age by Marriage Status in Pulaski
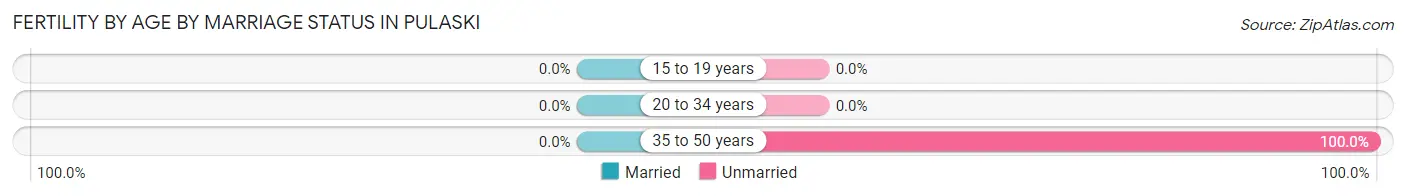
| Age Bracket | Married | Unmarried |
| 15 to 19 years | 0 (0.0%) | 0 (0.0%) |
| 20 to 34 years | 0 (0.0%) | 0 (0.0%) |
| 35 to 50 years | 0 (0.0%) | 1 (100.0%) |
| Total | 0 (0.0%) | 1 (100.0%) |
Fertility by Education in Pulaski
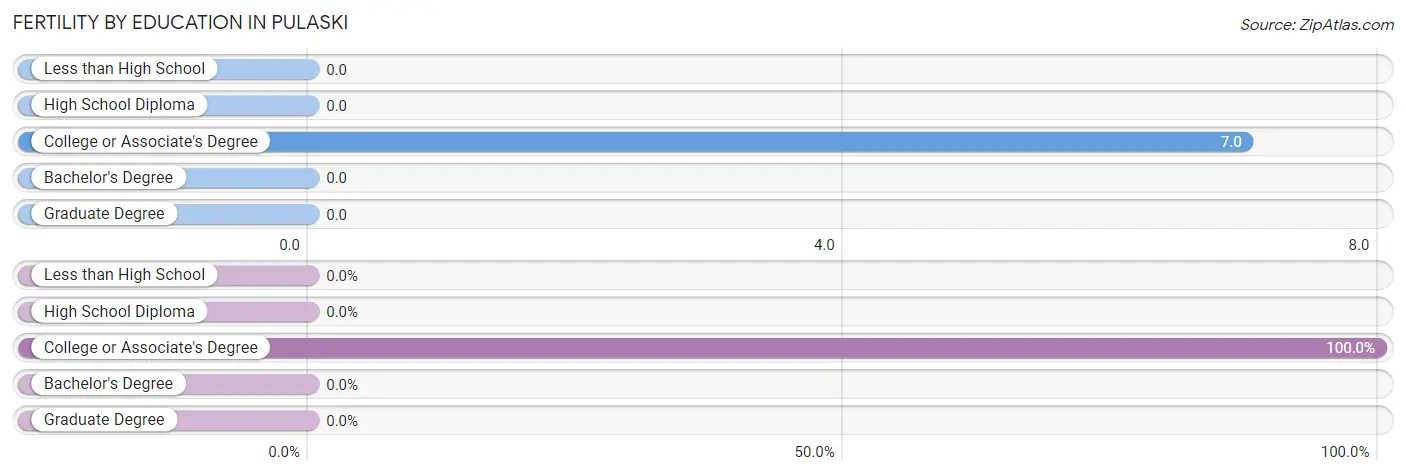
| Educational Attainment | Women with Births | Births / 1,000 Women |
| Less than High School | 0 (0.0%) | 0.0 |
| High School Diploma | 0 (0.0%) | 0.0 |
| College or Associate's Degree | 1 (100.0%) | 7.0 |
| Bachelor's Degree | 0 (0.0%) | 0.0 |
| Graduate Degree | 0 (0.0%) | 0.0 |
| Total | 1 (100.0%) | 2.0 |
Fertility by Education by Marriage Status in Pulaski
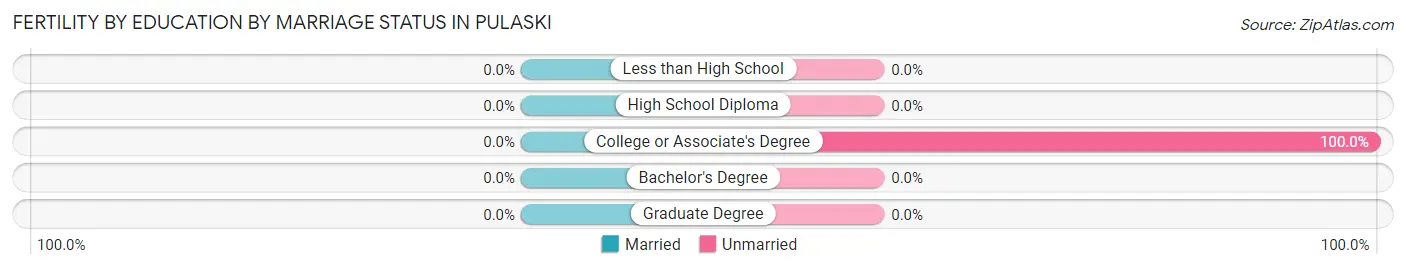
| Educational Attainment | Married | Unmarried |
| Less than High School | 0 (0.0%) | 0 (0.0%) |
| High School Diploma | 0 (0.0%) | 0 (0.0%) |
| College or Associate's Degree | 0 (0.0%) | 1 (100.0%) |
| Bachelor's Degree | 0 (0.0%) | 0 (0.0%) |
| Graduate Degree | 0 (0.0%) | 0 (0.0%) |
| Total | 0 (0.0%) | 1 (100.0%) |
Employment Characteristics in Pulaski
Employment by Class of Employer in Pulaski
Among the 836 employed individuals in Pulaski, private company employees (534 | 63.9%), local government employees (89 | 10.6%), and state government employees (65 | 7.8%) make up the most common classes of employment.
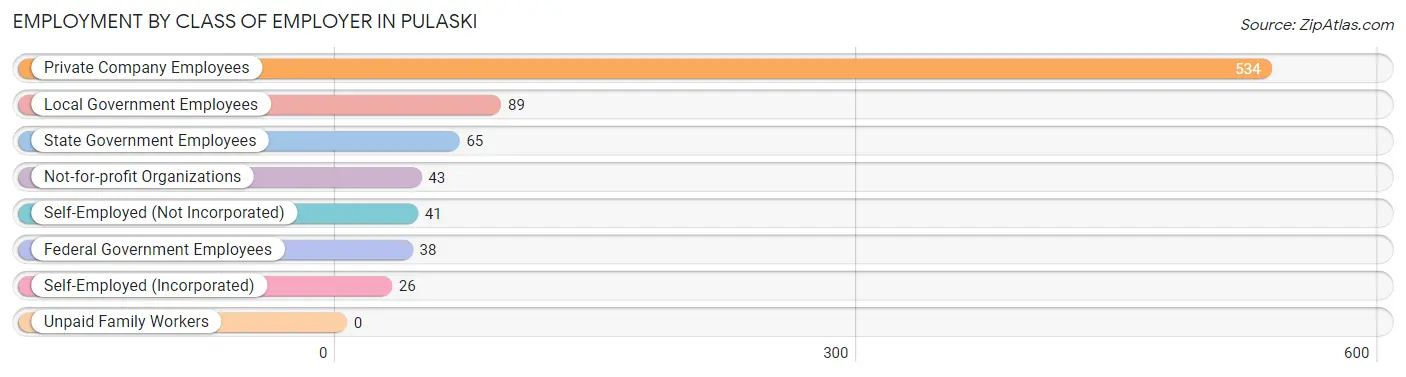
| Employer Class | # Employees | % Employees |
| Private Company Employees | 534 | 63.9% |
| Self-Employed (Incorporated) | 26 | 3.1% |
| Self-Employed (Not Incorporated) | 41 | 4.9% |
| Not-for-profit Organizations | 43 | 5.1% |
| Local Government Employees | 89 | 10.6% |
| State Government Employees | 65 | 7.8% |
| Federal Government Employees | 38 | 4.5% |
| Unpaid Family Workers | 0 | 0.0% |
| Total | 836 | 100.0% |
Employment Status by Age in Pulaski
According to the labor force statistics for Pulaski, out of the total population over 16 years of age (1,780), 51.6% or 918 individuals are in the labor force, with 3.5% or 32 of them unemployed. The age group with the highest labor force participation rate is 20 to 24 years, with 92.9% or 104 individuals in the labor force. Within the labor force, the 20 to 24 years age range has the highest percentage of unemployed individuals, with 21.2% or 22 of them being unemployed.
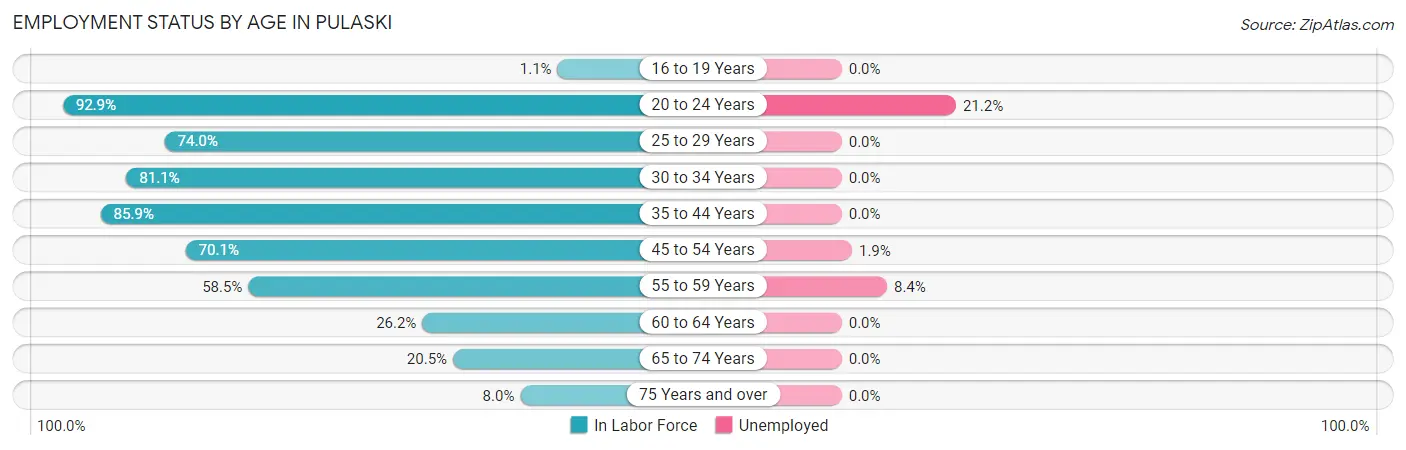
| Age Bracket | In Labor Force | Unemployed |
| 16 to 19 Years | 1 (1.1%) | 0 (0.0%) |
| 20 to 24 Years | 104 (92.9%) | 22 (21.2%) |
| 25 to 29 Years | 94 (74.0%) | 0 (0.0%) |
| 30 to 34 Years | 107 (81.1%) | 0 (0.0%) |
| 35 to 44 Years | 244 (85.9%) | 0 (0.0%) |
| 45 to 54 Years | 162 (70.1%) | 3 (1.9%) |
| 55 to 59 Years | 83 (58.5%) | 7 (8.4%) |
| 60 to 64 Years | 44 (26.2%) | 0 (0.0%) |
| 65 to 74 Years | 65 (20.5%) | 0 (0.0%) |
| 75 Years and over | 14 (8.0%) | 0 (0.0%) |
| Total | 918 (51.6%) | 32 (3.5%) |
Employment Status by Educational Attainment in Pulaski
According to labor force statistics for Pulaski, 67.7% of individuals (734) out of the total population between 25 and 64 years of age (1,084) are in the labor force, with 1.4% or 10 of them being unemployed. The group with the highest labor force participation rate are those with the educational attainment of bachelor's degree or higher, with 93.1% or 231 individuals in the labor force. Within the labor force, individuals with bachelor's degree or higher education have the highest percentage of unemployment, with 3.0% or 7 of them being unemployed.
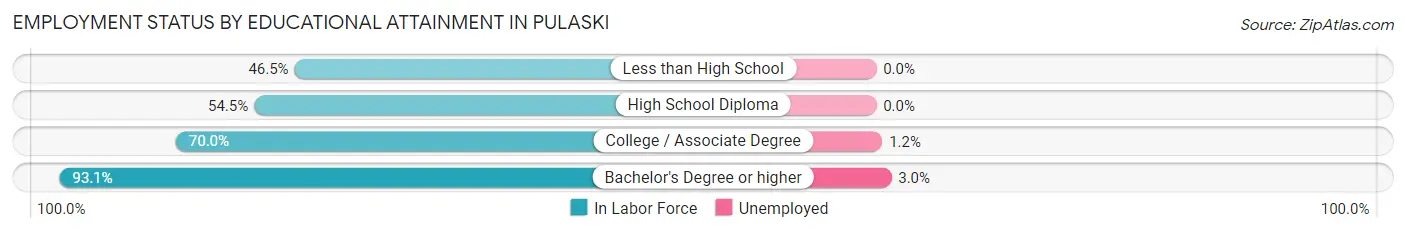
| Educational Attainment | In Labor Force | Unemployed |
| Less than High School | 40 (46.5%) | 0 (0.0%) |
| High School Diploma | 218 (54.5%) | 0 (0.0%) |
| College / Associate Degree | 245 (70.0%) | 4 (1.2%) |
| Bachelor's Degree or higher | 231 (93.1%) | 7 (3.0%) |
| Total | 734 (67.7%) | 15 (1.4%) |
Employment Occupations by Sex in Pulaski
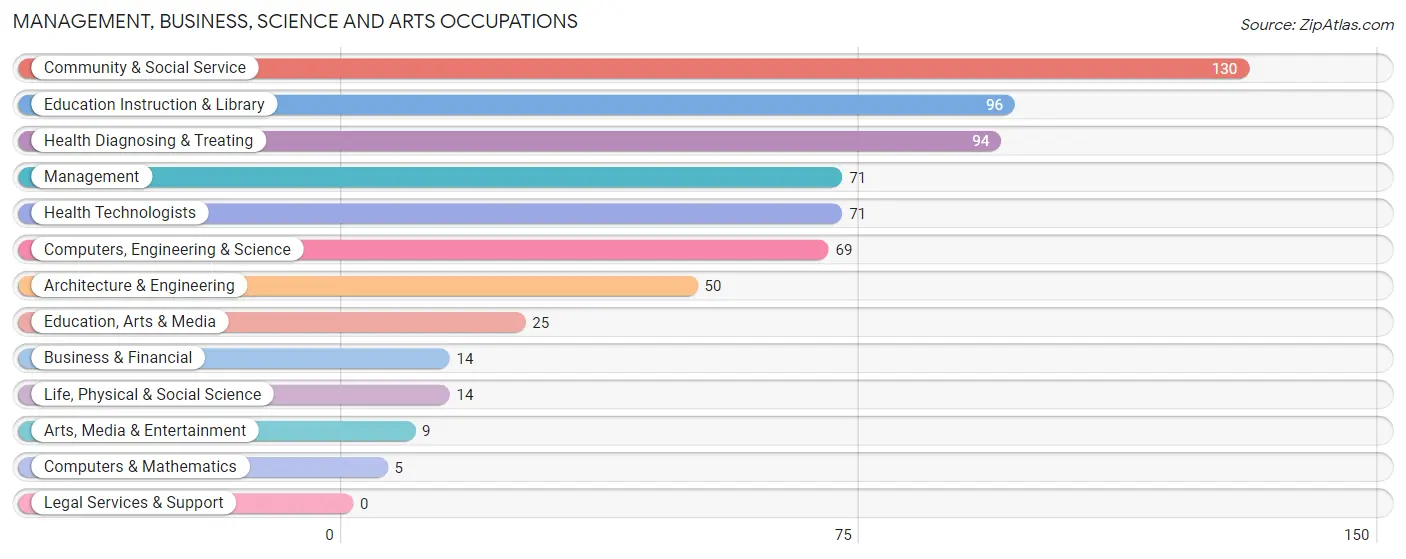
Management, Business, Science and Arts Occupations
The most common Management, Business, Science and Arts occupations in Pulaski are Community & Social Service (130 | 14.7%), Education Instruction & Library (96 | 10.8%), Health Diagnosing & Treating (94 | 10.6%), Management (71 | 8.0%), and Health Technologists (71 | 8.0%).
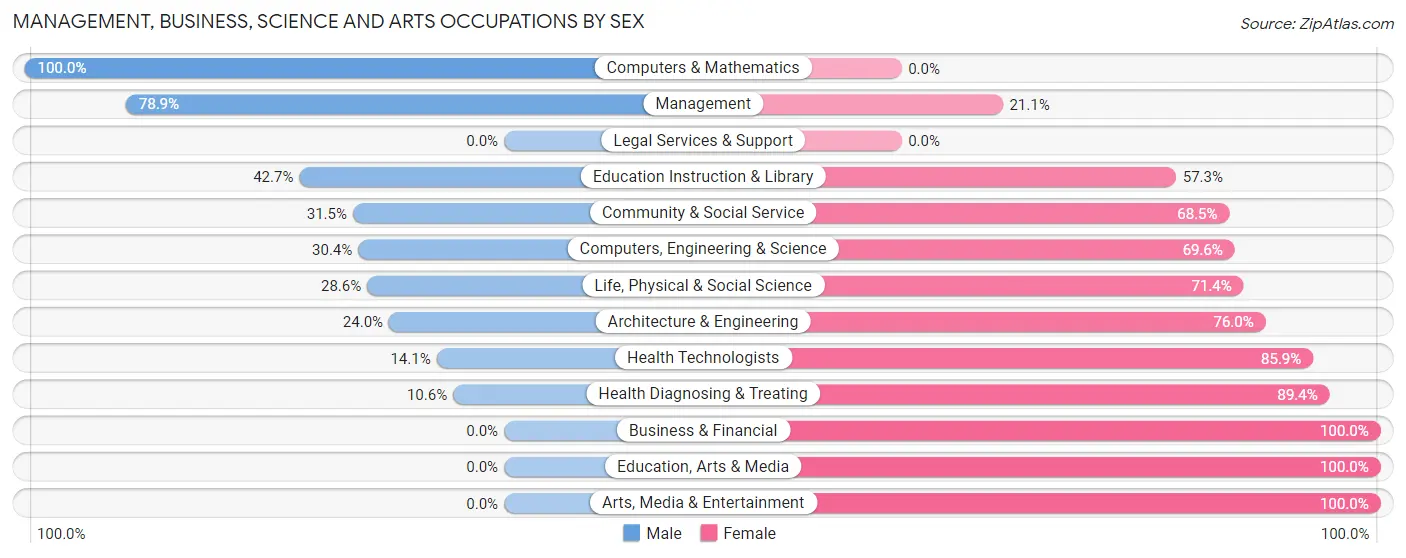
Management, Business, Science and Arts Occupations by Sex
Within the Management, Business, Science and Arts occupations in Pulaski, the most male-oriented occupations are Computers & Mathematics (100.0%), Management (78.9%), and Education Instruction & Library (42.7%), while the most female-oriented occupations are Business & Financial (100.0%), Education, Arts & Media (100.0%), and Arts, Media & Entertainment (100.0%).
| Occupation | Male | Female |
| Management | 56 (78.9%) | 15 (21.1%) |
| Business & Financial | 0 (0.0%) | 14 (100.0%) |
| Computers, Engineering & Science | 21 (30.4%) | 48 (69.6%) |
| Computers & Mathematics | 5 (100.0%) | 0 (0.0%) |
| Architecture & Engineering | 12 (24.0%) | 38 (76.0%) |
| Life, Physical & Social Science | 4 (28.6%) | 10 (71.4%) |
| Community & Social Service | 41 (31.5%) | 89 (68.5%) |
| Education, Arts & Media | 0 (0.0%) | 25 (100.0%) |
| Legal Services & Support | 0 (0.0%) | 0 (0.0%) |
| Education Instruction & Library | 41 (42.7%) | 55 (57.3%) |
| Arts, Media & Entertainment | 0 (0.0%) | 9 (100.0%) |
| Health Diagnosing & Treating | 10 (10.6%) | 84 (89.4%) |
| Health Technologists | 10 (14.1%) | 61 (85.9%) |
| Total (Category) | 128 (33.9%) | 250 (66.1%) |
| Total (Overall) | 454 (51.2%) | 432 (48.8%) |
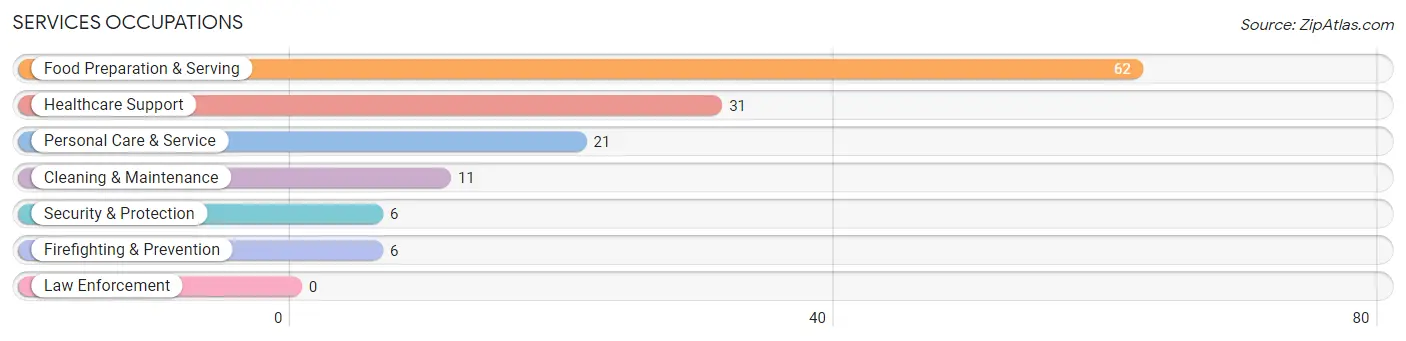
Services Occupations
The most common Services occupations in Pulaski are Food Preparation & Serving (62 | 7.0%), Healthcare Support (31 | 3.5%), Personal Care & Service (21 | 2.4%), Cleaning & Maintenance (11 | 1.2%), and Security & Protection (6 | 0.7%).
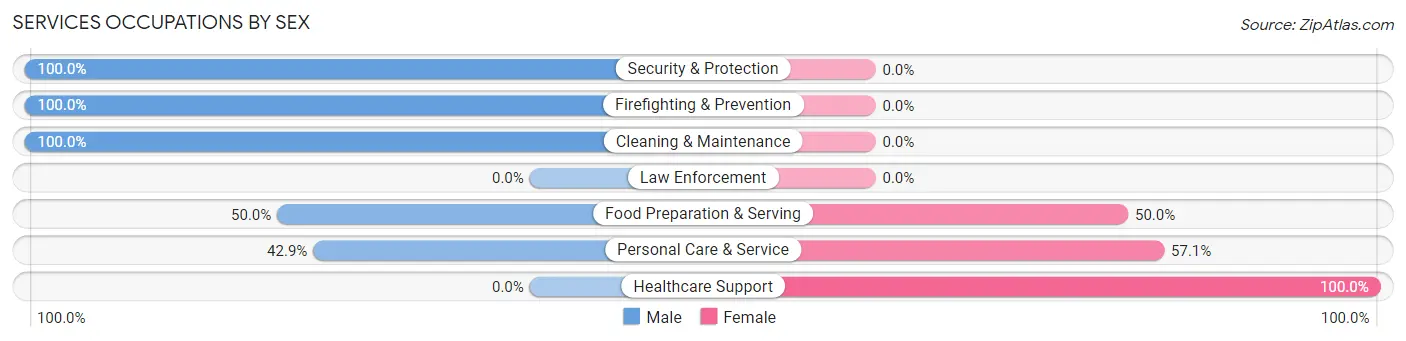
Services Occupations by Sex
Within the Services occupations in Pulaski, the most male-oriented occupations are Security & Protection (100.0%), Firefighting & Prevention (100.0%), and Cleaning & Maintenance (100.0%), while the most female-oriented occupations are Healthcare Support (100.0%), Personal Care & Service (57.1%), and Food Preparation & Serving (50.0%).
| Occupation | Male | Female |
| Healthcare Support | 0 (0.0%) | 31 (100.0%) |
| Security & Protection | 6 (100.0%) | 0 (0.0%) |
| Firefighting & Prevention | 6 (100.0%) | 0 (0.0%) |
| Law Enforcement | 0 (0.0%) | 0 (0.0%) |
| Food Preparation & Serving | 31 (50.0%) | 31 (50.0%) |
| Cleaning & Maintenance | 11 (100.0%) | 0 (0.0%) |
| Personal Care & Service | 9 (42.9%) | 12 (57.1%) |
| Total (Category) | 57 (43.5%) | 74 (56.5%) |
| Total (Overall) | 454 (51.2%) | 432 (48.8%) |
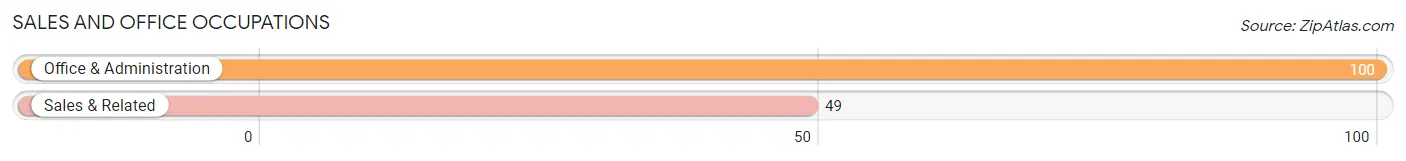
Sales and Office Occupations
The most common Sales and Office occupations in Pulaski are Office & Administration (100 | 11.3%), and Sales & Related (49 | 5.5%).
Sales and Office Occupations by Sex
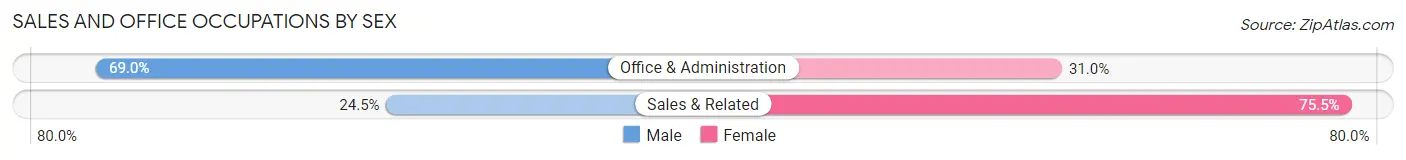
| Occupation | Male | Female |
| Sales & Related | 12 (24.5%) | 37 (75.5%) |
| Office & Administration | 69 (69.0%) | 31 (31.0%) |
| Total (Category) | 81 (54.4%) | 68 (45.6%) |
| Total (Overall) | 454 (51.2%) | 432 (48.8%) |
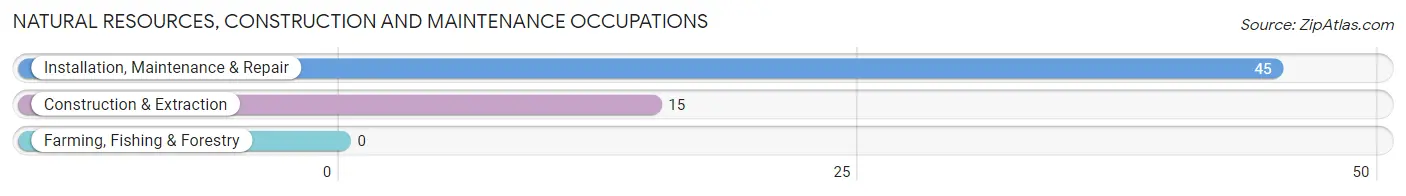
Natural Resources, Construction and Maintenance Occupations
The most common Natural Resources, Construction and Maintenance occupations in Pulaski are Installation, Maintenance & Repair (45 | 5.1%), and Construction & Extraction (15 | 1.7%).
Natural Resources, Construction and Maintenance Occupations by Sex
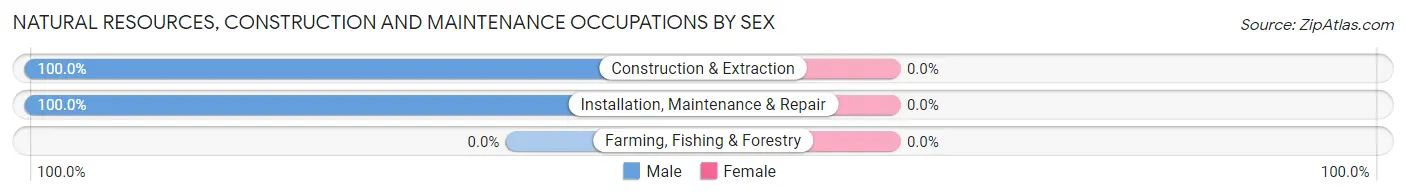
| Occupation | Male | Female |
| Farming, Fishing & Forestry | 0 (0.0%) | 0 (0.0%) |
| Construction & Extraction | 15 (100.0%) | 0 (0.0%) |
| Installation, Maintenance & Repair | 45 (100.0%) | 0 (0.0%) |
| Total (Category) | 60 (100.0%) | 0 (0.0%) |
| Total (Overall) | 454 (51.2%) | 432 (48.8%) |
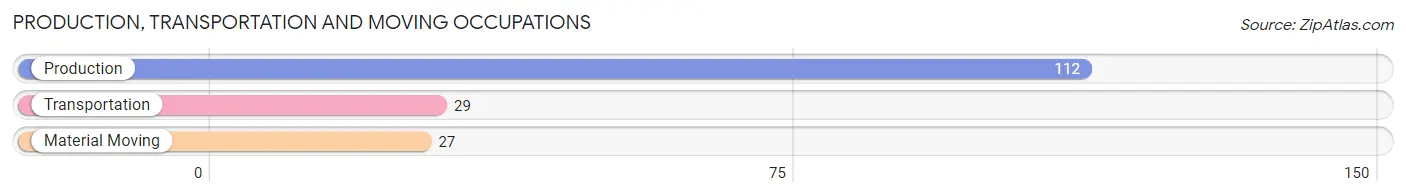
Production, Transportation and Moving Occupations
The most common Production, Transportation and Moving occupations in Pulaski are Production (112 | 12.6%), Transportation (29 | 3.3%), and Material Moving (27 | 3.0%).
Production, Transportation and Moving Occupations by Sex
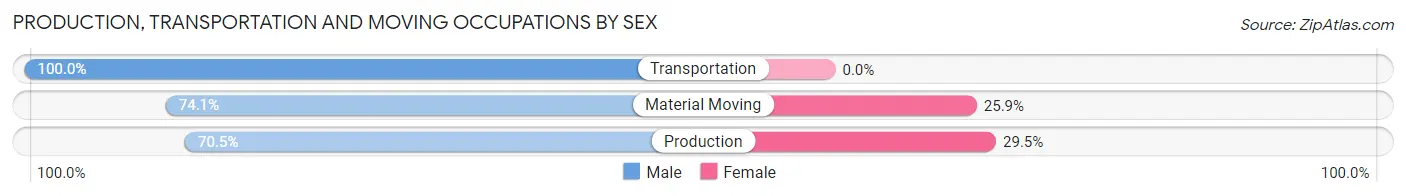
| Occupation | Male | Female |
| Production | 79 (70.5%) | 33 (29.5%) |
| Transportation | 29 (100.0%) | 0 (0.0%) |
| Material Moving | 20 (74.1%) | 7 (25.9%) |
| Total (Category) | 128 (76.2%) | 40 (23.8%) |
| Total (Overall) | 454 (51.2%) | 432 (48.8%) |
Employment Industries by Sex in Pulaski
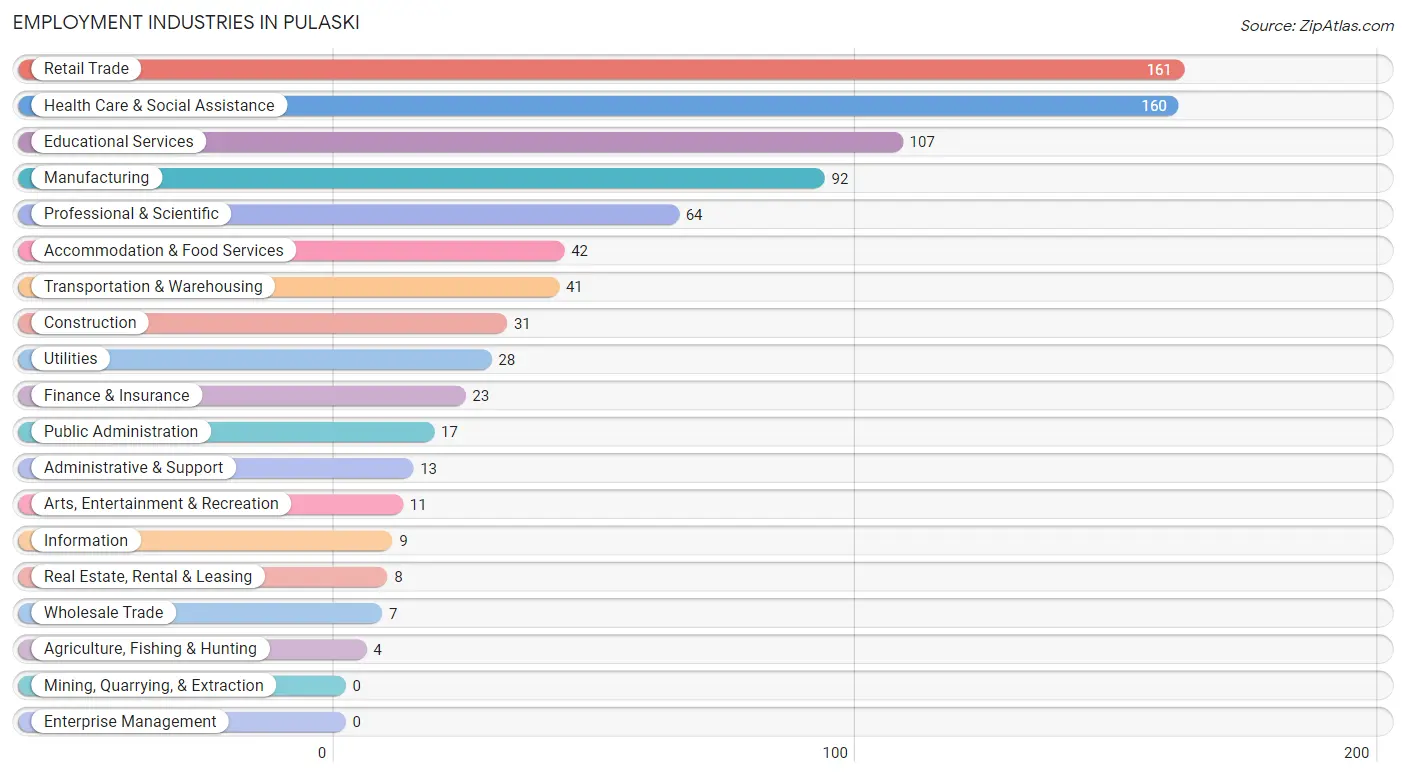
Employment Industries in Pulaski
The major employment industries in Pulaski include Retail Trade (161 | 18.2%), Health Care & Social Assistance (160 | 18.1%), Educational Services (107 | 12.1%), Manufacturing (92 | 10.4%), and Professional & Scientific (64 | 7.2%).
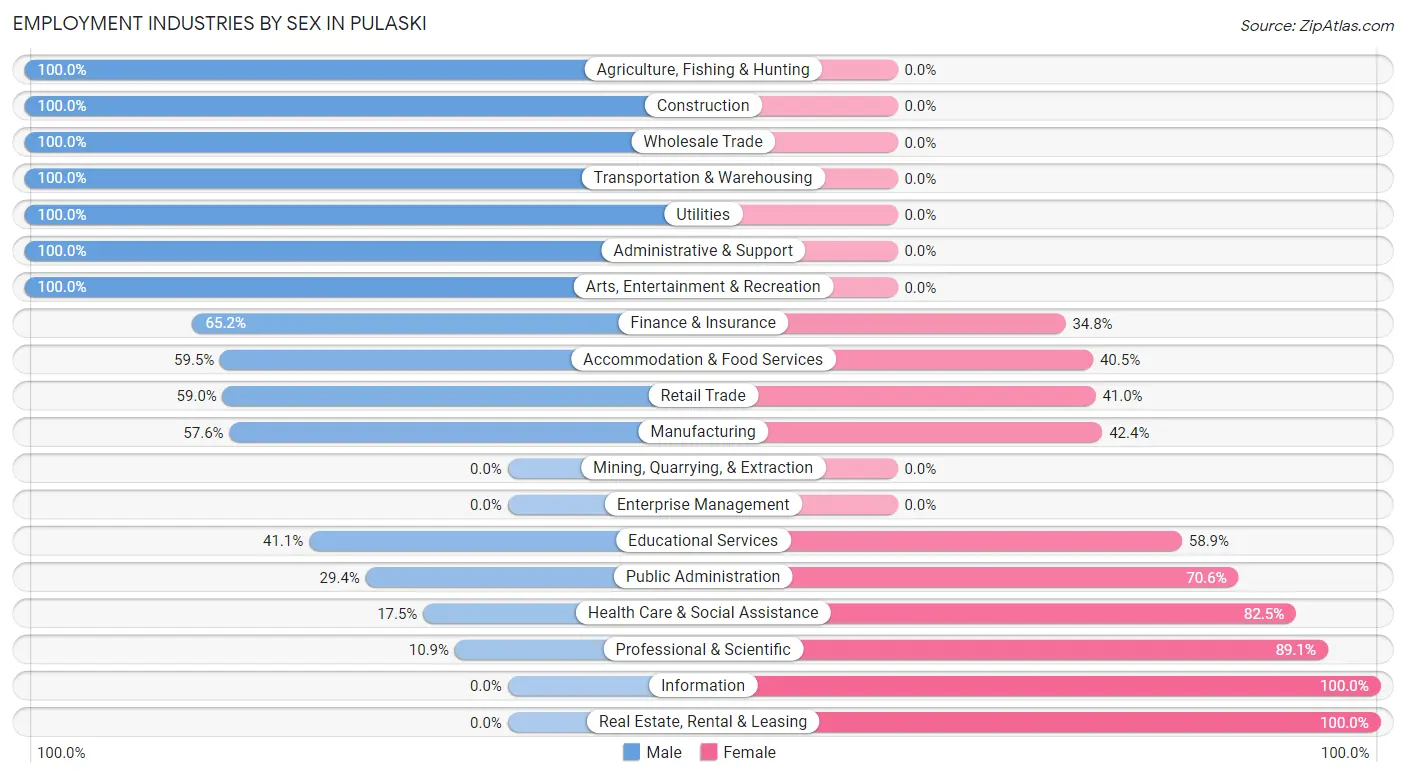
Employment Industries by Sex in Pulaski
The Pulaski industries that see more men than women are Agriculture, Fishing & Hunting (100.0%), Construction (100.0%), and Wholesale Trade (100.0%), whereas the industries that tend to have a higher number of women are Information (100.0%), Real Estate, Rental & Leasing (100.0%), and Professional & Scientific (89.1%).
| Industry | Male | Female |
| Agriculture, Fishing & Hunting | 4 (100.0%) | 0 (0.0%) |
| Mining, Quarrying, & Extraction | 0 (0.0%) | 0 (0.0%) |
| Construction | 31 (100.0%) | 0 (0.0%) |
| Manufacturing | 53 (57.6%) | 39 (42.4%) |
| Wholesale Trade | 7 (100.0%) | 0 (0.0%) |
| Retail Trade | 95 (59.0%) | 66 (41.0%) |
| Transportation & Warehousing | 41 (100.0%) | 0 (0.0%) |
| Utilities | 28 (100.0%) | 0 (0.0%) |
| Information | 0 (0.0%) | 9 (100.0%) |
| Finance & Insurance | 15 (65.2%) | 8 (34.8%) |
| Real Estate, Rental & Leasing | 0 (0.0%) | 8 (100.0%) |
| Professional & Scientific | 7 (10.9%) | 57 (89.1%) |
| Enterprise Management | 0 (0.0%) | 0 (0.0%) |
| Administrative & Support | 13 (100.0%) | 0 (0.0%) |
| Educational Services | 44 (41.1%) | 63 (58.9%) |
| Health Care & Social Assistance | 28 (17.5%) | 132 (82.5%) |
| Arts, Entertainment & Recreation | 11 (100.0%) | 0 (0.0%) |
| Accommodation & Food Services | 25 (59.5%) | 17 (40.5%) |
| Public Administration | 5 (29.4%) | 12 (70.6%) |
| Total | 454 (51.2%) | 432 (48.8%) |
Education in Pulaski
School Enrollment in Pulaski
The most common levels of schooling among the 351 students in Pulaski are high school (120 | 34.2%), middle school (112 | 31.9%), and elementary school (37 | 10.5%).
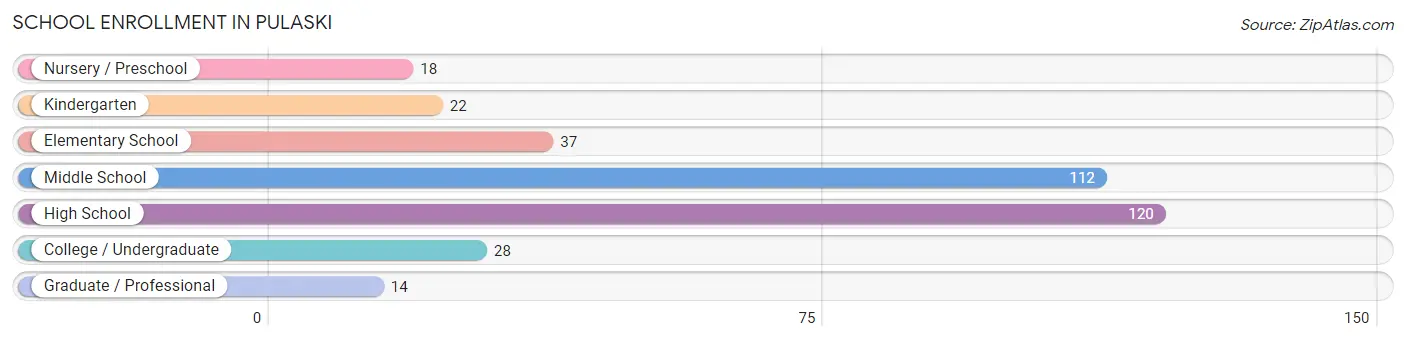
| School Level | # Students | % Students |
| Nursery / Preschool | 18 | 5.1% |
| Kindergarten | 22 | 6.3% |
| Elementary School | 37 | 10.5% |
| Middle School | 112 | 31.9% |
| High School | 120 | 34.2% |
| College / Undergraduate | 28 | 8.0% |
| Graduate / Professional | 14 | 4.0% |
| Total | 351 | 100.0% |
School Enrollment by Age by Funding Source in Pulaski
Out of a total of 351 students who are enrolled in schools in Pulaski, 74 (21.1%) attend a private institution, while the remaining 277 (78.9%) are enrolled in public schools. The age group of 35 years and over has the highest likelihood of being enrolled in private schools, with 9 (60.0% in the age bracket) enrolled. Conversely, the age group of 5 to 9 year old has the lowest likelihood of being enrolled in a private school, with 59 (100.0% in the age bracket) attending a public institution.
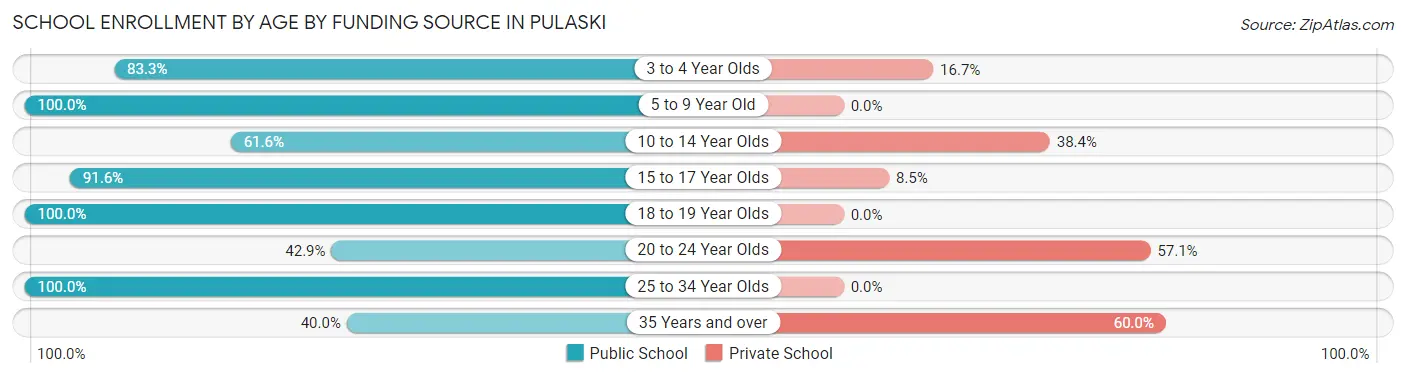
| Age Bracket | Public School | Private School |
| 3 to 4 Year Olds | 15 (83.3%) | 3 (16.7%) |
| 5 to 9 Year Old | 59 (100.0%) | 0 (0.0%) |
| 10 to 14 Year Olds | 77 (61.6%) | 48 (38.4%) |
| 15 to 17 Year Olds | 65 (91.5%) | 6 (8.5%) |
| 18 to 19 Year Olds | 45 (100.0%) | 0 (0.0%) |
| 20 to 24 Year Olds | 6 (42.9%) | 8 (57.1%) |
| 25 to 34 Year Olds | 4 (100.0%) | 0 (0.0%) |
| 35 Years and over | 6 (40.0%) | 9 (60.0%) |
| Total | 277 (78.9%) | 74 (21.1%) |
Educational Attainment by Field of Study in Pulaski
Education (92 | 23.8%), social sciences (41 | 10.6%), science & technology (40 | 10.3%), business (36 | 9.3%), and communications (31 | 8.0%) are the most common fields of study among 387 individuals in Pulaski who have obtained a bachelor's degree or higher.
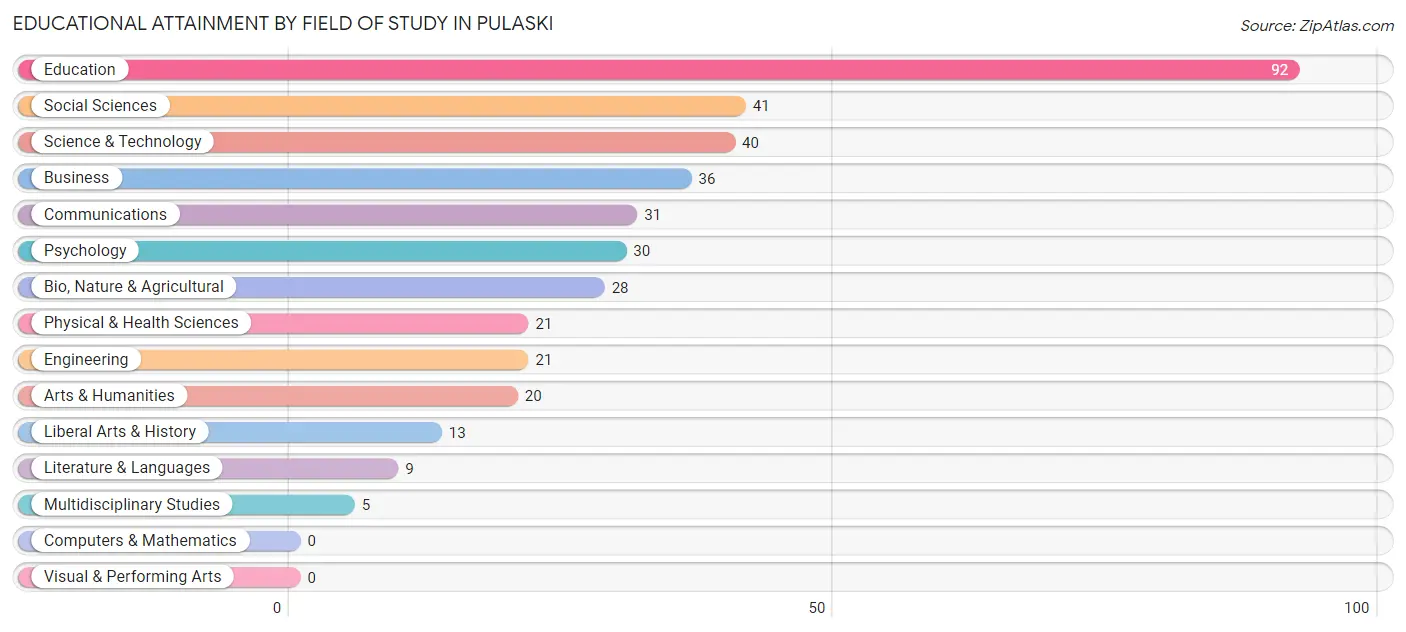
| Field of Study | # Graduates | % Graduates |
| Computers & Mathematics | 0 | 0.0% |
| Bio, Nature & Agricultural | 28 | 7.2% |
| Physical & Health Sciences | 21 | 5.4% |
| Psychology | 30 | 7.7% |
| Social Sciences | 41 | 10.6% |
| Engineering | 21 | 5.4% |
| Multidisciplinary Studies | 5 | 1.3% |
| Science & Technology | 40 | 10.3% |
| Business | 36 | 9.3% |
| Education | 92 | 23.8% |
| Literature & Languages | 9 | 2.3% |
| Liberal Arts & History | 13 | 3.4% |
| Visual & Performing Arts | 0 | 0.0% |
| Communications | 31 | 8.0% |
| Arts & Humanities | 20 | 5.2% |
| Total | 387 | 100.0% |
Transportation & Commute in Pulaski
Vehicle Availability by Sex in Pulaski
The most prevalent vehicle ownership categories in Pulaski are males with 1 vehicle (191, accounting for 45.1%) and females with 1 vehicle (140, making up 46.4%).
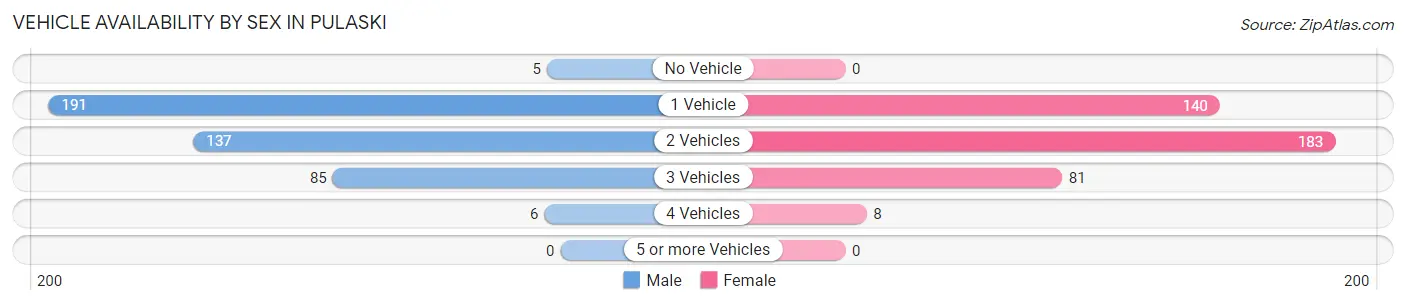
| Vehicles Available | Male | Female |
| No Vehicle | 5 (1.2%) | 0 (0.0%) |
| 1 Vehicle | 191 (45.1%) | 140 (34.0%) |
| 2 Vehicles | 137 (32.3%) | 183 (44.4%) |
| 3 Vehicles | 85 (20.1%) | 81 (19.7%) |
| 4 Vehicles | 6 (1.4%) | 8 (1.9%) |
| 5 or more Vehicles | 0 (0.0%) | 0 (0.0%) |
| Total | 424 (100.0%) | 412 (100.0%) |
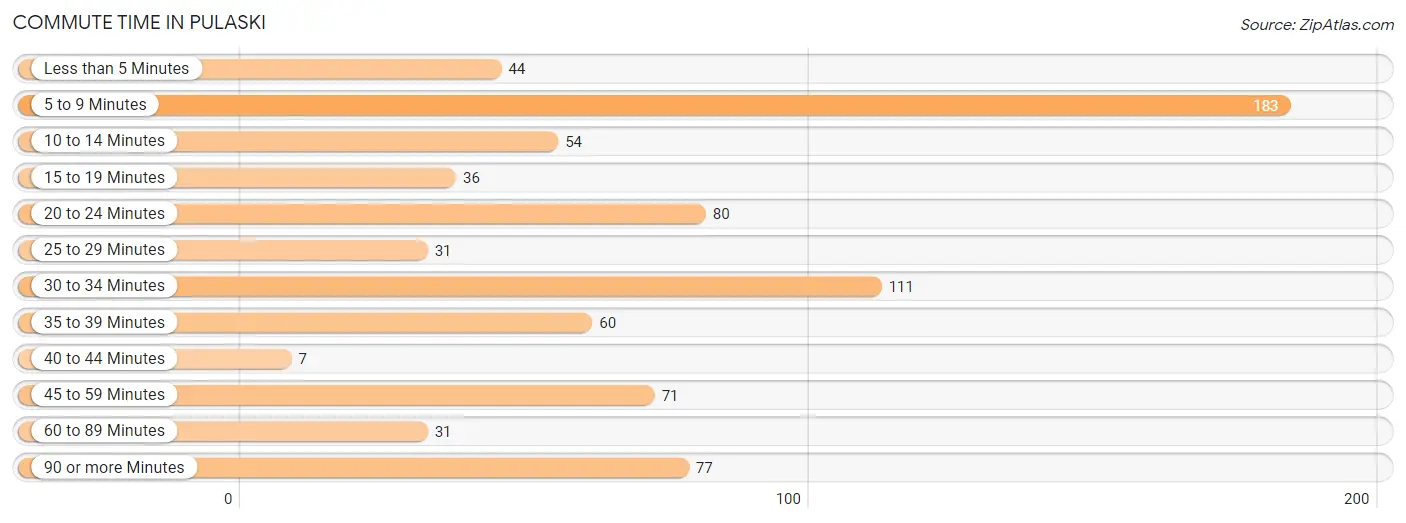
Commute Time in Pulaski
The most frequently occuring commute durations in Pulaski are 5 to 9 minutes (183 commuters, 23.3%), 30 to 34 minutes (111 commuters, 14.1%), and 20 to 24 minutes (80 commuters, 10.2%).
| Commute Time | # Commuters | % Commuters |
| Less than 5 Minutes | 44 | 5.6% |
| 5 to 9 Minutes | 183 | 23.3% |
| 10 to 14 Minutes | 54 | 6.9% |
| 15 to 19 Minutes | 36 | 4.6% |
| 20 to 24 Minutes | 80 | 10.2% |
| 25 to 29 Minutes | 31 | 4.0% |
| 30 to 34 Minutes | 111 | 14.1% |
| 35 to 39 Minutes | 60 | 7.6% |
| 40 to 44 Minutes | 7 | 0.9% |
| 45 to 59 Minutes | 71 | 9.0% |
| 60 to 89 Minutes | 31 | 4.0% |
| 90 or more Minutes | 77 | 9.8% |
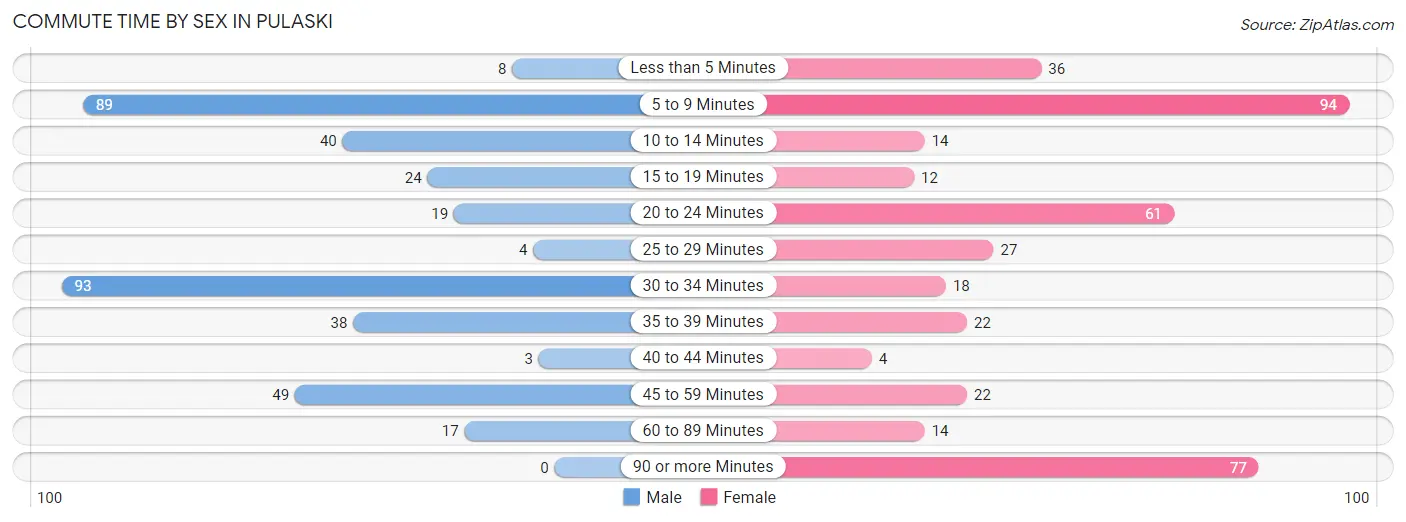
Commute Time by Sex in Pulaski
The most common commute times in Pulaski are 30 to 34 minutes (93 commuters, 24.2%) for males and 5 to 9 minutes (94 commuters, 23.4%) for females.
| Commute Time | Male | Female |
| Less than 5 Minutes | 8 (2.1%) | 36 (9.0%) |
| 5 to 9 Minutes | 89 (23.2%) | 94 (23.4%) |
| 10 to 14 Minutes | 40 (10.4%) | 14 (3.5%) |
| 15 to 19 Minutes | 24 (6.2%) | 12 (3.0%) |
| 20 to 24 Minutes | 19 (5.0%) | 61 (15.2%) |
| 25 to 29 Minutes | 4 (1.0%) | 27 (6.7%) |
| 30 to 34 Minutes | 93 (24.2%) | 18 (4.5%) |
| 35 to 39 Minutes | 38 (9.9%) | 22 (5.5%) |
| 40 to 44 Minutes | 3 (0.8%) | 4 (1.0%) |
| 45 to 59 Minutes | 49 (12.8%) | 22 (5.5%) |
| 60 to 89 Minutes | 17 (4.4%) | 14 (3.5%) |
| 90 or more Minutes | 0 (0.0%) | 77 (19.2%) |
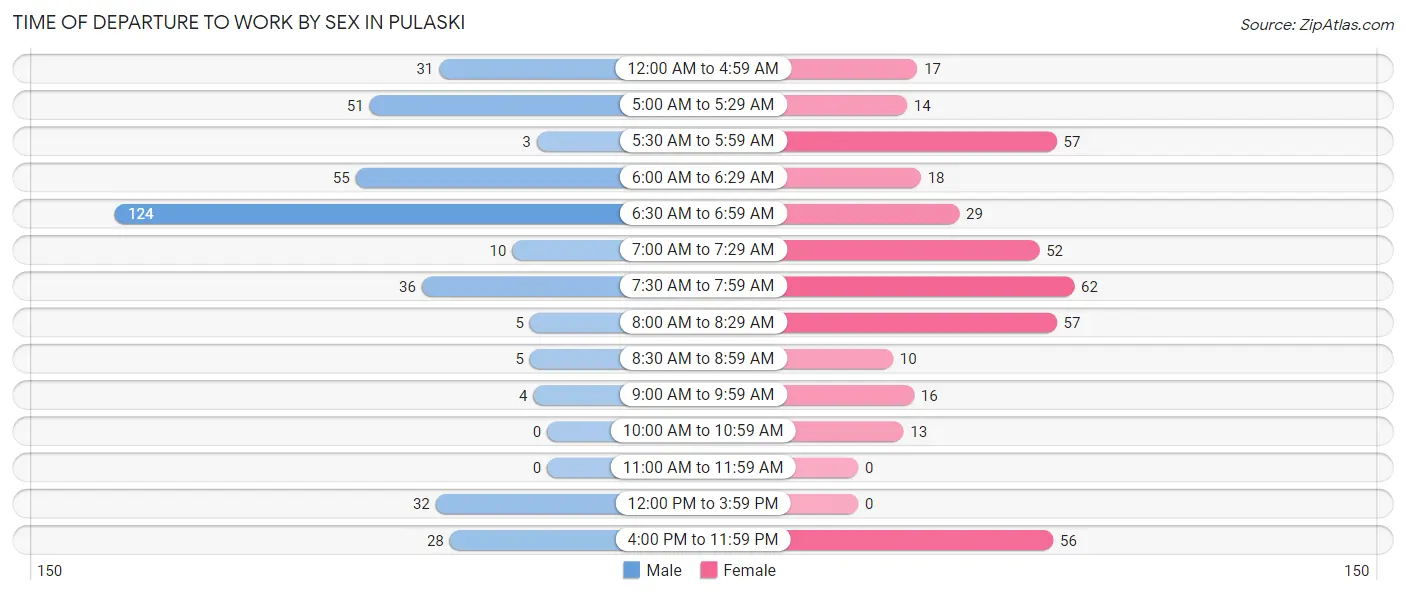
Time of Departure to Work by Sex in Pulaski
The most frequent times of departure to work in Pulaski are 6:30 AM to 6:59 AM (124, 32.3%) for males and 7:30 AM to 7:59 AM (62, 15.5%) for females.
| Time of Departure | Male | Female |
| 12:00 AM to 4:59 AM | 31 (8.1%) | 17 (4.2%) |
| 5:00 AM to 5:29 AM | 51 (13.3%) | 14 (3.5%) |
| 5:30 AM to 5:59 AM | 3 (0.8%) | 57 (14.2%) |
| 6:00 AM to 6:29 AM | 55 (14.3%) | 18 (4.5%) |
| 6:30 AM to 6:59 AM | 124 (32.3%) | 29 (7.2%) |
| 7:00 AM to 7:29 AM | 10 (2.6%) | 52 (13.0%) |
| 7:30 AM to 7:59 AM | 36 (9.4%) | 62 (15.5%) |
| 8:00 AM to 8:29 AM | 5 (1.3%) | 57 (14.2%) |
| 8:30 AM to 8:59 AM | 5 (1.3%) | 10 (2.5%) |
| 9:00 AM to 9:59 AM | 4 (1.0%) | 16 (4.0%) |
| 10:00 AM to 10:59 AM | 0 (0.0%) | 13 (3.2%) |
| 11:00 AM to 11:59 AM | 0 (0.0%) | 0 (0.0%) |
| 12:00 PM to 3:59 PM | 32 (8.3%) | 0 (0.0%) |
| 4:00 PM to 11:59 PM | 28 (7.3%) | 56 (14.0%) |
| Total | 384 (100.0%) | 401 (100.0%) |
Housing Occupancy in Pulaski
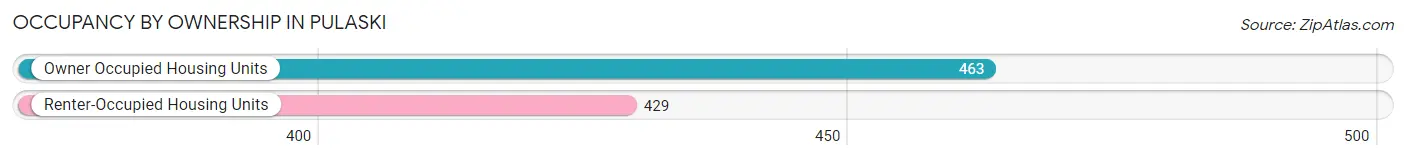
Occupancy by Ownership in Pulaski
Of the total 892 dwellings in Pulaski, owner-occupied units account for 463 (51.9%), while renter-occupied units make up 429 (48.1%).
| Occupancy | # Housing Units | % Housing Units |
| Owner Occupied Housing Units | 463 | 51.9% |
| Renter-Occupied Housing Units | 429 | 48.1% |
| Total Occupied Housing Units | 892 | 100.0% |
Occupancy by Household Size in Pulaski
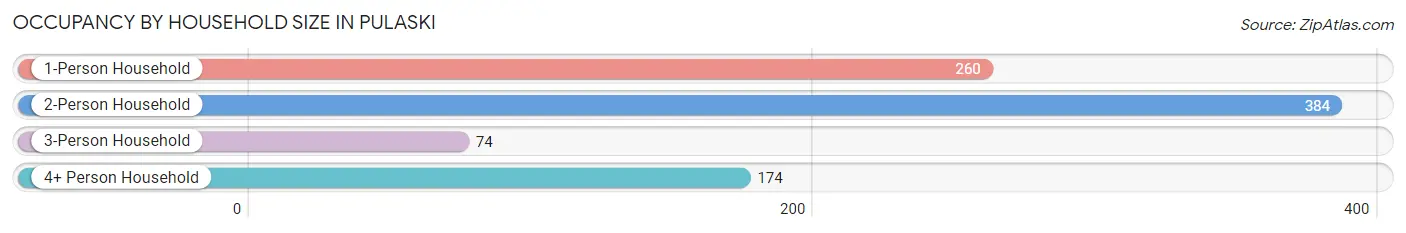
| Household Size | # Housing Units | % Housing Units |
| 1-Person Household | 260 | 29.1% |
| 2-Person Household | 384 | 43.0% |
| 3-Person Household | 74 | 8.3% |
| 4+ Person Household | 174 | 19.5% |
| Total Housing Units | 892 | 100.0% |
Occupancy by Ownership by Household Size in Pulaski
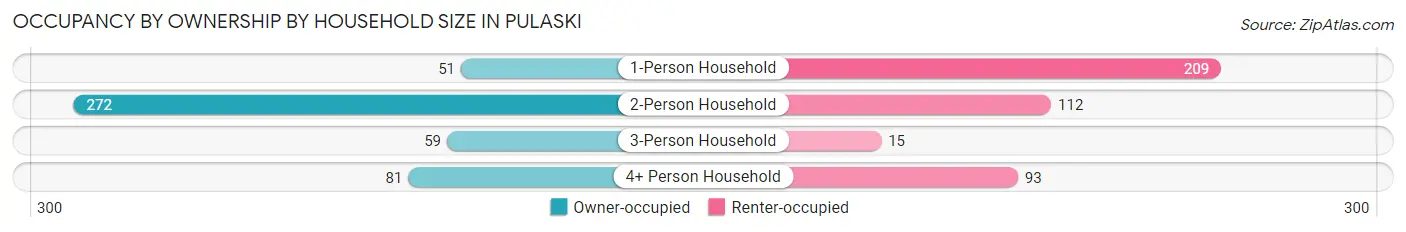
| Household Size | Owner-occupied | Renter-occupied |
| 1-Person Household | 51 (19.6%) | 209 (80.4%) |
| 2-Person Household | 272 (70.8%) | 112 (29.2%) |
| 3-Person Household | 59 (79.7%) | 15 (20.3%) |
| 4+ Person Household | 81 (46.6%) | 93 (53.4%) |
| Total Housing Units | 463 (51.9%) | 429 (48.1%) |
Occupancy by Educational Attainment in Pulaski
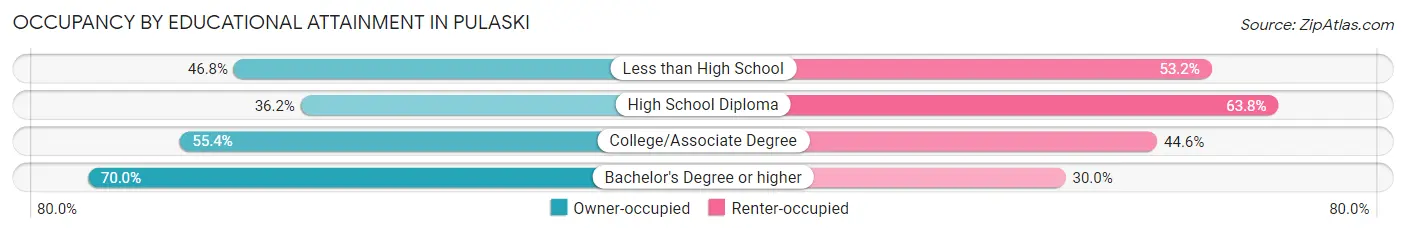
| Household Size | Owner-occupied | Renter-occupied |
| Less than High School | 44 (46.8%) | 50 (53.2%) |
| High School Diploma | 105 (36.2%) | 185 (63.8%) |
| College/Associate Degree | 158 (55.4%) | 127 (44.6%) |
| Bachelor's Degree or higher | 156 (70.0%) | 67 (30.0%) |
Occupancy by Age of Householder in Pulaski
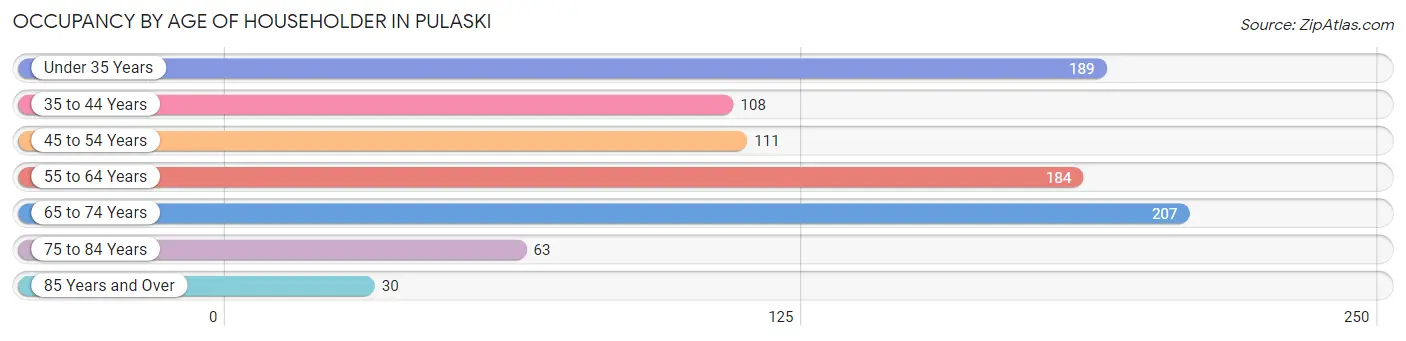
| Age Bracket | # Households | % Households |
| Under 35 Years | 189 | 21.2% |
| 35 to 44 Years | 108 | 12.1% |
| 45 to 54 Years | 111 | 12.4% |
| 55 to 64 Years | 184 | 20.6% |
| 65 to 74 Years | 207 | 23.2% |
| 75 to 84 Years | 63 | 7.1% |
| 85 Years and Over | 30 | 3.4% |
| Total | 892 | 100.0% |
Housing Finances in Pulaski
Median Income by Occupancy in Pulaski
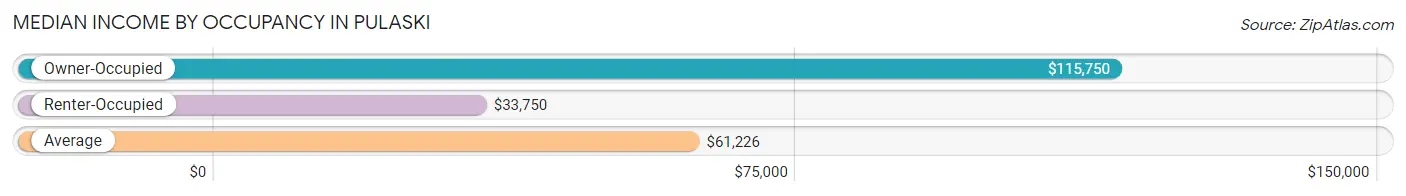
| Occupancy Type | # Households | Median Income |
| Owner-Occupied | 463 (51.9%) | $115,750 |
| Renter-Occupied | 429 (48.1%) | $33,750 |
| Average | 892 (100.0%) | $61,226 |
Occupancy by Householder Income Bracket in Pulaski
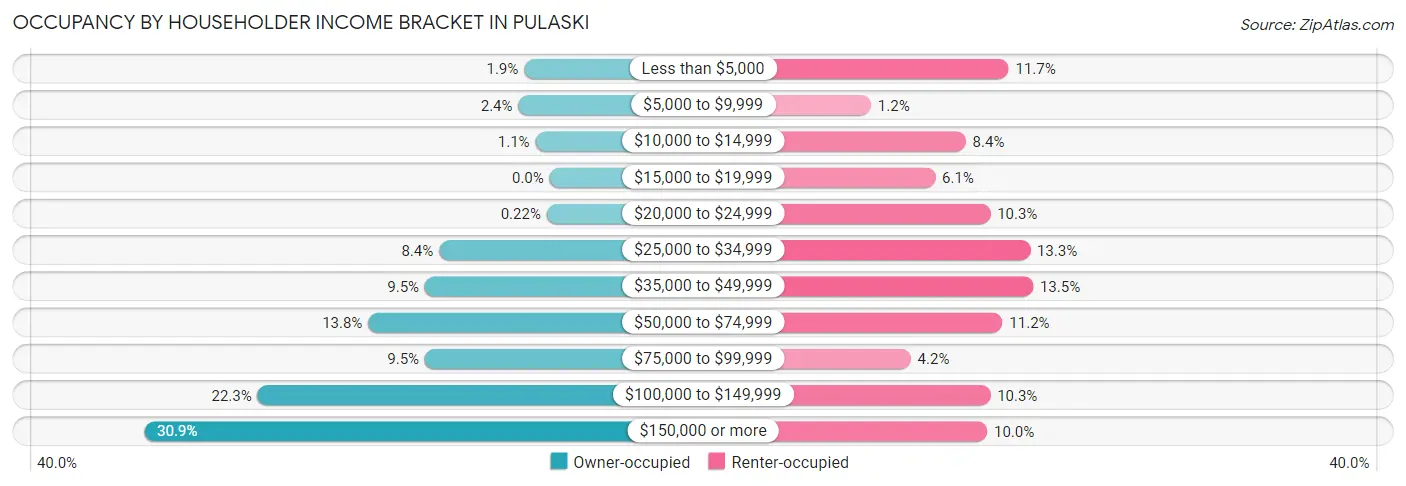
| Income Bracket | Owner-occupied | Renter-occupied |
| Less than $5,000 | 9 (1.9%) | 50 (11.7%) |
| $5,000 to $9,999 | 11 (2.4%) | 5 (1.2%) |
| $10,000 to $14,999 | 5 (1.1%) | 36 (8.4%) |
| $15,000 to $19,999 | 0 (0.0%) | 26 (6.1%) |
| $20,000 to $24,999 | 1 (0.2%) | 44 (10.3%) |
| $25,000 to $34,999 | 39 (8.4%) | 57 (13.3%) |
| $35,000 to $49,999 | 44 (9.5%) | 58 (13.5%) |
| $50,000 to $74,999 | 64 (13.8%) | 48 (11.2%) |
| $75,000 to $99,999 | 44 (9.5%) | 18 (4.2%) |
| $100,000 to $149,999 | 103 (22.3%) | 44 (10.3%) |
| $150,000 or more | 143 (30.9%) | 43 (10.0%) |
| Total | 463 (100.0%) | 429 (100.0%) |
Monthly Housing Cost Tiers in Pulaski
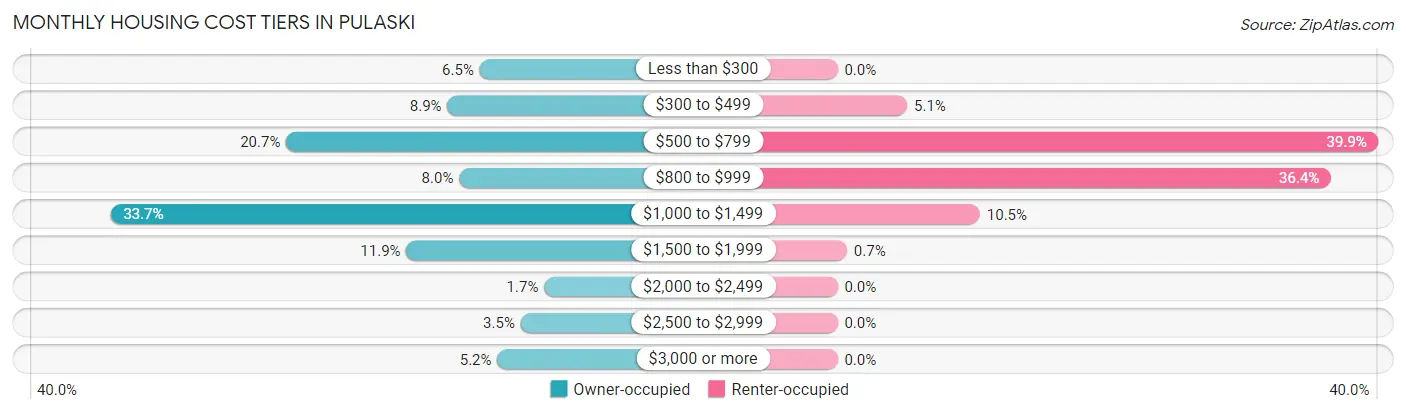
| Monthly Cost | Owner-occupied | Renter-occupied |
| Less than $300 | 30 (6.5%) | 0 (0.0%) |
| $300 to $499 | 41 (8.9%) | 22 (5.1%) |
| $500 to $799 | 96 (20.7%) | 171 (39.9%) |
| $800 to $999 | 37 (8.0%) | 156 (36.4%) |
| $1,000 to $1,499 | 156 (33.7%) | 45 (10.5%) |
| $1,500 to $1,999 | 55 (11.9%) | 3 (0.7%) |
| $2,000 to $2,499 | 8 (1.7%) | 0 (0.0%) |
| $2,500 to $2,999 | 16 (3.5%) | 0 (0.0%) |
| $3,000 or more | 24 (5.2%) | 0 (0.0%) |
| Total | 463 (100.0%) | 429 (100.0%) |
Physical Housing Characteristics in Pulaski
Housing Structures in Pulaski
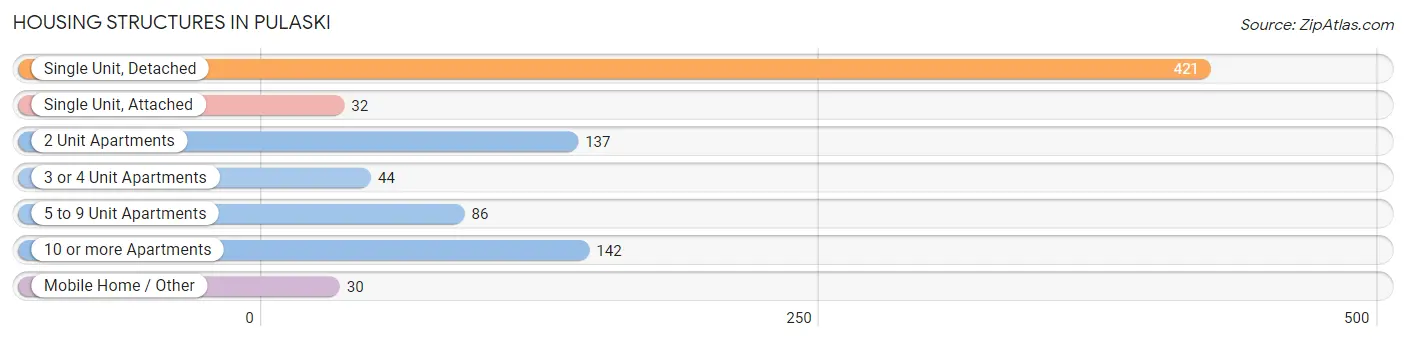
| Structure Type | # Housing Units | % Housing Units |
| Single Unit, Detached | 421 | 47.2% |
| Single Unit, Attached | 32 | 3.6% |
| 2 Unit Apartments | 137 | 15.4% |
| 3 or 4 Unit Apartments | 44 | 4.9% |
| 5 to 9 Unit Apartments | 86 | 9.6% |
| 10 or more Apartments | 142 | 15.9% |
| Mobile Home / Other | 30 | 3.4% |
| Total | 892 | 100.0% |
Housing Structures by Occupancy in Pulaski
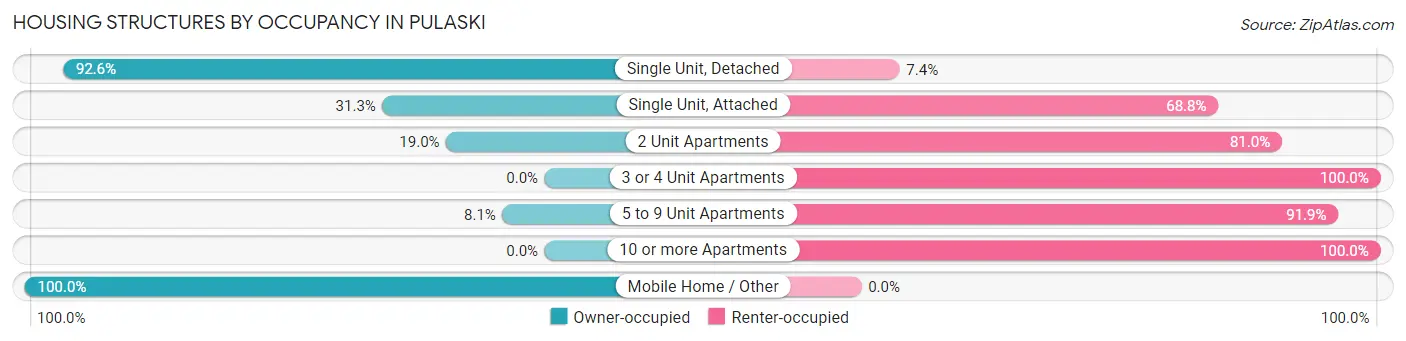
| Structure Type | Owner-occupied | Renter-occupied |
| Single Unit, Detached | 390 (92.6%) | 31 (7.4%) |
| Single Unit, Attached | 10 (31.2%) | 22 (68.8%) |
| 2 Unit Apartments | 26 (19.0%) | 111 (81.0%) |
| 3 or 4 Unit Apartments | 0 (0.0%) | 44 (100.0%) |
| 5 to 9 Unit Apartments | 7 (8.1%) | 79 (91.9%) |
| 10 or more Apartments | 0 (0.0%) | 142 (100.0%) |
| Mobile Home / Other | 30 (100.0%) | 0 (0.0%) |
| Total | 463 (51.9%) | 429 (48.1%) |
Housing Structures by Number of Rooms in Pulaski
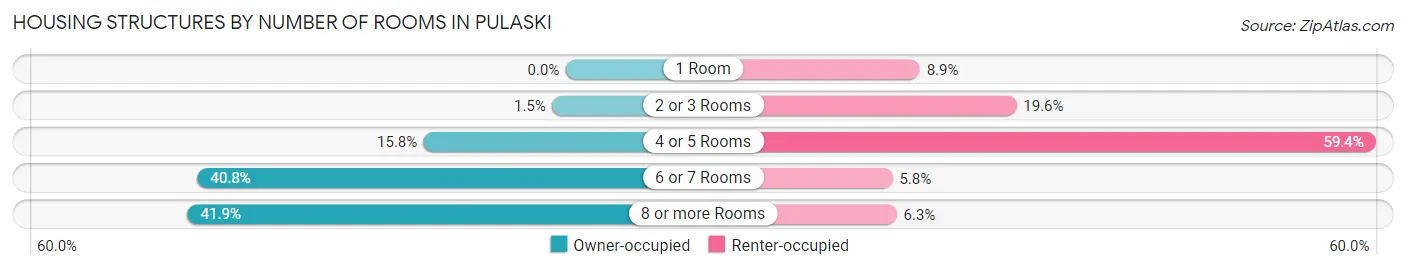
| Number of Rooms | Owner-occupied | Renter-occupied |
| 1 Room | 0 (0.0%) | 38 (8.9%) |
| 2 or 3 Rooms | 7 (1.5%) | 84 (19.6%) |
| 4 or 5 Rooms | 73 (15.8%) | 255 (59.4%) |
| 6 or 7 Rooms | 189 (40.8%) | 25 (5.8%) |
| 8 or more Rooms | 194 (41.9%) | 27 (6.3%) |
| Total | 463 (100.0%) | 429 (100.0%) |
Housing Structure by Heating Type in Pulaski
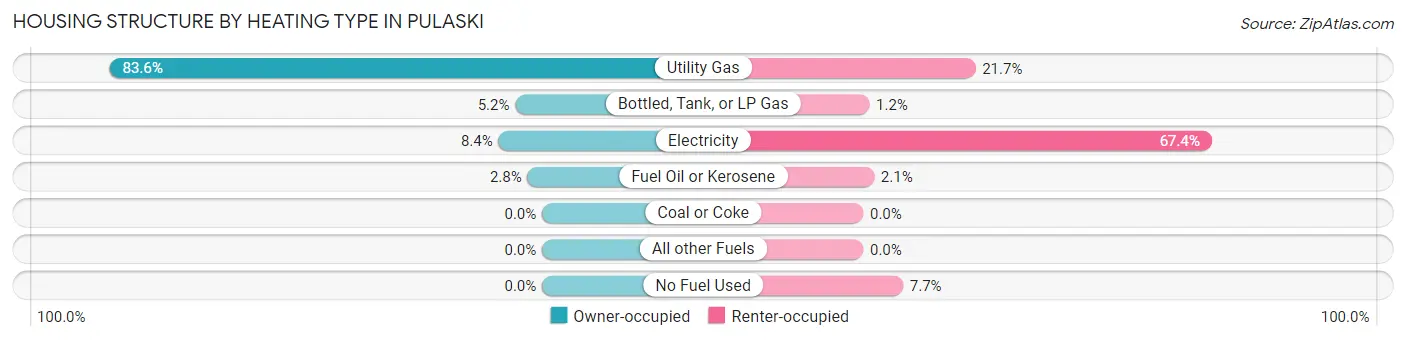
| Heating Type | Owner-occupied | Renter-occupied |
| Utility Gas | 387 (83.6%) | 93 (21.7%) |
| Bottled, Tank, or LP Gas | 24 (5.2%) | 5 (1.2%) |
| Electricity | 39 (8.4%) | 289 (67.4%) |
| Fuel Oil or Kerosene | 13 (2.8%) | 9 (2.1%) |
| Coal or Coke | 0 (0.0%) | 0 (0.0%) |
| All other Fuels | 0 (0.0%) | 0 (0.0%) |
| No Fuel Used | 0 (0.0%) | 33 (7.7%) |
| Total | 463 (100.0%) | 429 (100.0%) |
Household Vehicle Usage in Pulaski
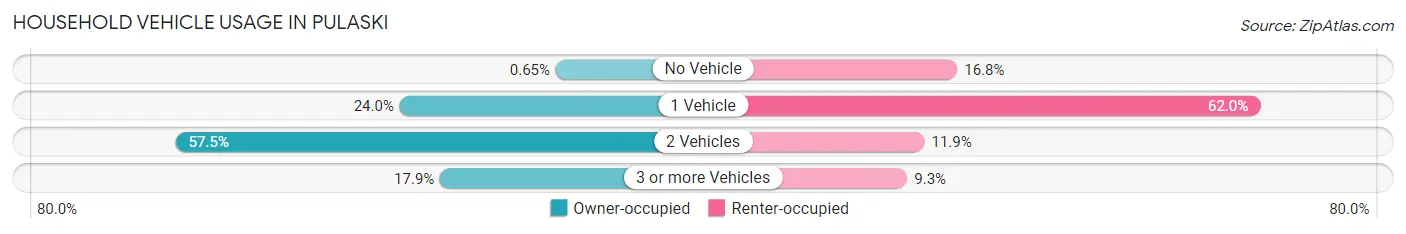
| Vehicles per Household | Owner-occupied | Renter-occupied |
| No Vehicle | 3 (0.6%) | 72 (16.8%) |
| 1 Vehicle | 111 (24.0%) | 266 (62.0%) |
| 2 Vehicles | 266 (57.5%) | 51 (11.9%) |
| 3 or more Vehicles | 83 (17.9%) | 40 (9.3%) |
| Total | 463 (100.0%) | 429 (100.0%) |
Real Estate & Mortgages in Pulaski
Real Estate and Mortgage Overview in Pulaski
| Characteristic | Without Mortgage | With Mortgage |
| Housing Units | 194 | 269 |
| Median Property Value | $112,800 | $174,000 |
| Median Household Income | $71,000 | $106 |
| Monthly Housing Costs | $619 | $24 |
| Real Estate Taxes | $2,727 | $0 |
Property Value by Mortgage Status in Pulaski
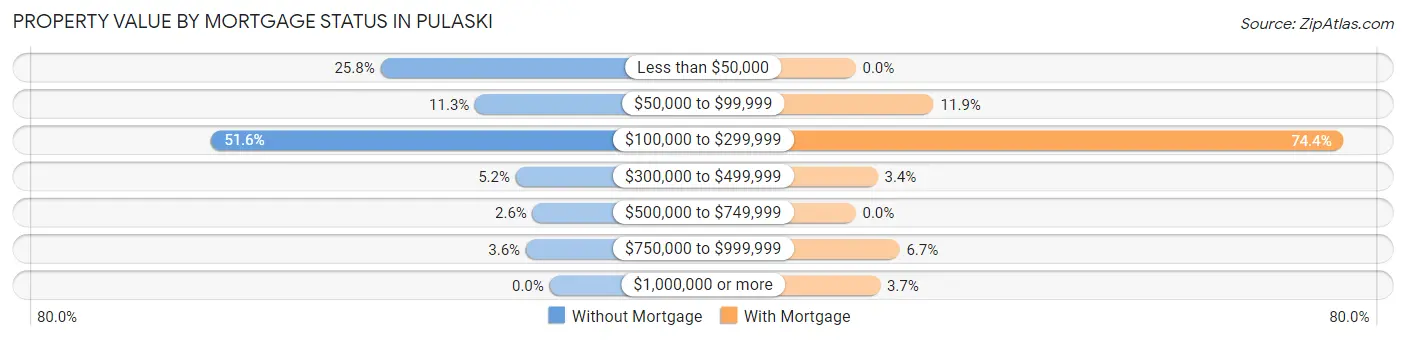
| Property Value | Without Mortgage | With Mortgage |
| Less than $50,000 | 50 (25.8%) | 0 (0.0%) |
| $50,000 to $99,999 | 22 (11.3%) | 32 (11.9%) |
| $100,000 to $299,999 | 100 (51.5%) | 200 (74.4%) |
| $300,000 to $499,999 | 10 (5.1%) | 9 (3.4%) |
| $500,000 to $749,999 | 5 (2.6%) | 0 (0.0%) |
| $750,000 to $999,999 | 7 (3.6%) | 18 (6.7%) |
| $1,000,000 or more | 0 (0.0%) | 10 (3.7%) |
| Total | 194 (100.0%) | 269 (100.0%) |
Household Income by Mortgage Status in Pulaski
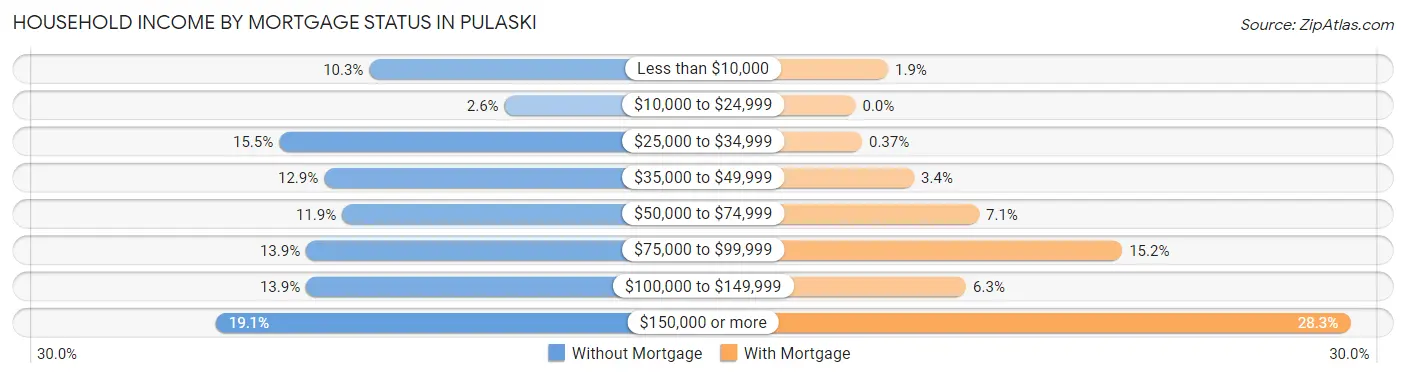
| Household Income | Without Mortgage | With Mortgage |
| Less than $10,000 | 20 (10.3%) | 5 (1.9%) |
| $10,000 to $24,999 | 5 (2.6%) | 0 (0.0%) |
| $25,000 to $34,999 | 30 (15.5%) | 1 (0.4%) |
| $35,000 to $49,999 | 25 (12.9%) | 9 (3.4%) |
| $50,000 to $74,999 | 23 (11.9%) | 19 (7.1%) |
| $75,000 to $99,999 | 27 (13.9%) | 41 (15.2%) |
| $100,000 to $149,999 | 27 (13.9%) | 17 (6.3%) |
| $150,000 or more | 37 (19.1%) | 76 (28.2%) |
| Total | 194 (100.0%) | 269 (100.0%) |
Property Value to Household Income Ratio in Pulaski
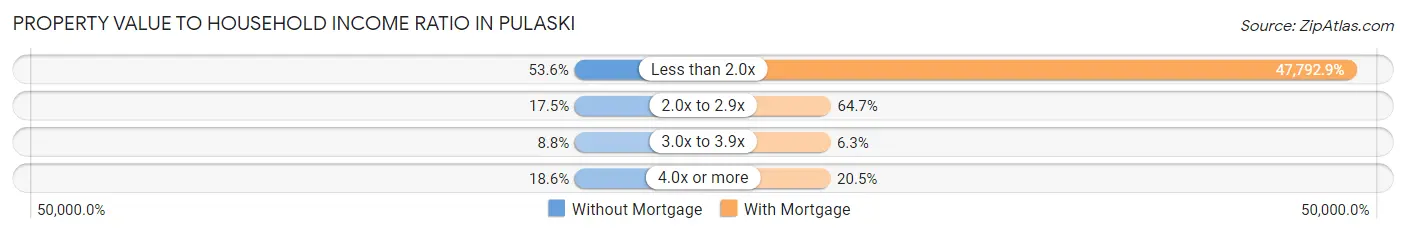
| Value-to-Income Ratio | Without Mortgage | With Mortgage |
| Less than 2.0x | 104 (53.6%) | 128,563 (47,792.9%) |
| 2.0x to 2.9x | 34 (17.5%) | 174 (64.7%) |
| 3.0x to 3.9x | 17 (8.8%) | 17 (6.3%) |
| 4.0x or more | 36 (18.6%) | 55 (20.4%) |
| Total | 194 (100.0%) | 269 (100.0%) |
Real Estate Taxes by Mortgage Status in Pulaski
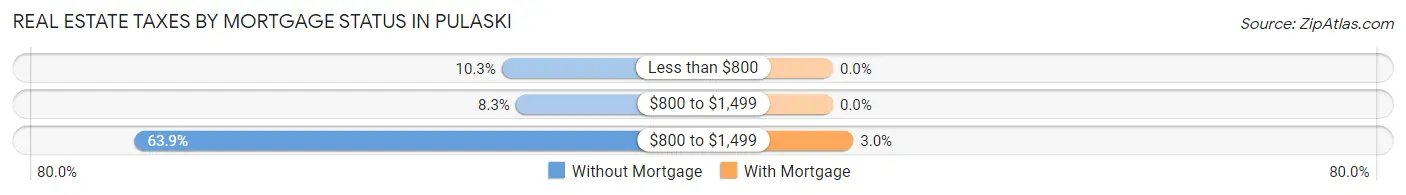
| Property Taxes | Without Mortgage | With Mortgage |
| Less than $800 | 20 (10.3%) | 0 (0.0%) |
| $800 to $1,499 | 16 (8.3%) | 0 (0.0%) |
| $800 to $1,499 | 124 (63.9%) | 8 (3.0%) |
| Total | 194 (100.0%) | 269 (100.0%) |
Health & Disability in Pulaski
Health Insurance Coverage by Age in Pulaski
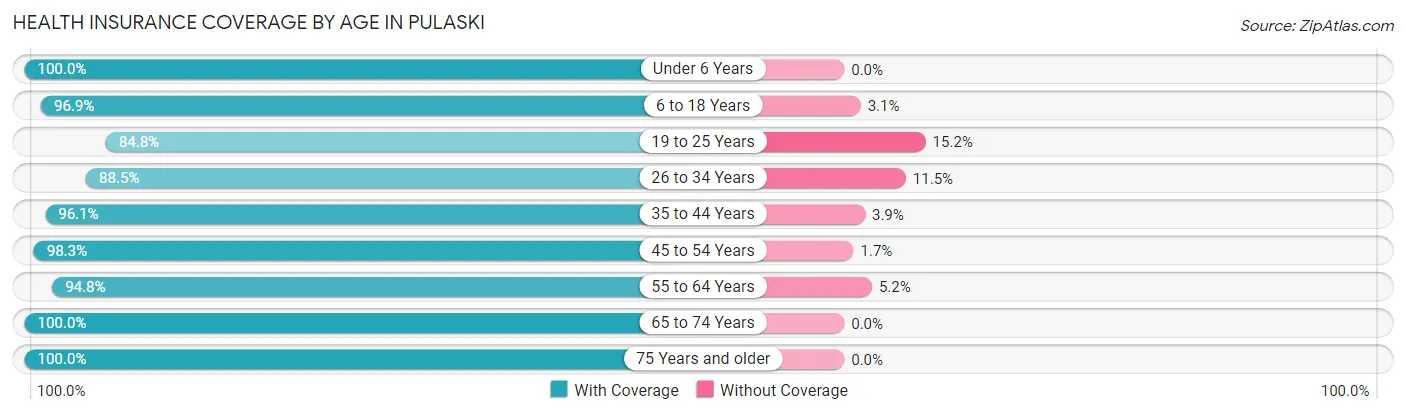
| Age Bracket | With Coverage | Without Coverage |
| Under 6 Years | 100 (100.0%) | 0 (0.0%) |
| 6 to 18 Years | 284 (96.9%) | 9 (3.1%) |
| 19 to 25 Years | 123 (84.8%) | 22 (15.2%) |
| 26 to 34 Years | 208 (88.5%) | 27 (11.5%) |
| 35 to 44 Years | 273 (96.1%) | 11 (3.9%) |
| 45 to 54 Years | 227 (98.3%) | 4 (1.7%) |
| 55 to 64 Years | 294 (94.8%) | 16 (5.2%) |
| 65 to 74 Years | 317 (100.0%) | 0 (0.0%) |
| 75 Years and older | 175 (100.0%) | 0 (0.0%) |
| Total | 2,001 (95.7%) | 89 (4.3%) |
Health Insurance Coverage by Citizenship Status in Pulaski
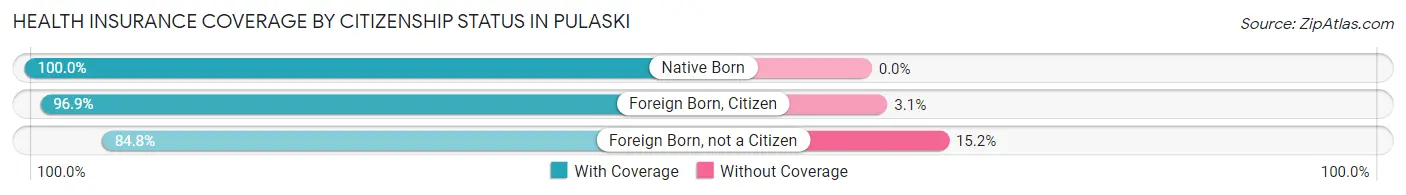
| Citizenship Status | With Coverage | Without Coverage |
| Native Born | 100 (100.0%) | 0 (0.0%) |
| Foreign Born, Citizen | 284 (96.9%) | 9 (3.1%) |
| Foreign Born, not a Citizen | 123 (84.8%) | 22 (15.2%) |
Health Insurance Coverage by Household Income in Pulaski
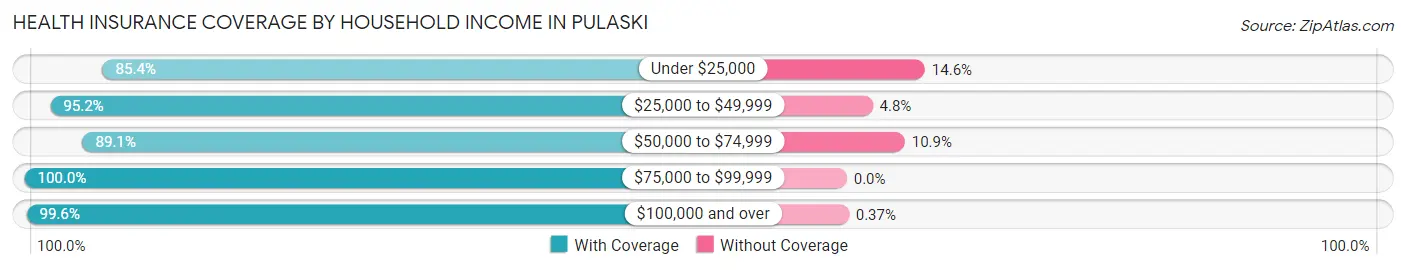
| Household Income | With Coverage | Without Coverage |
| Under $25,000 | 280 (85.4%) | 48 (14.6%) |
| $25,000 to $49,999 | 334 (95.2%) | 17 (4.8%) |
| $50,000 to $74,999 | 164 (89.1%) | 20 (10.9%) |
| $75,000 to $99,999 | 125 (100.0%) | 0 (0.0%) |
| $100,000 and over | 1,090 (99.6%) | 4 (0.4%) |
Public vs Private Health Insurance Coverage by Age in Pulaski
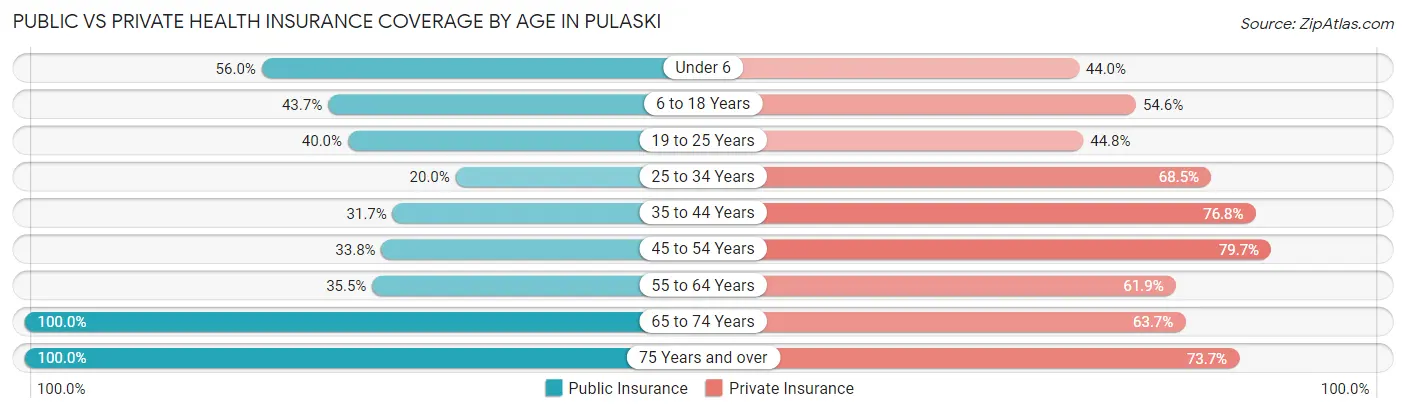
| Age Bracket | Public Insurance | Private Insurance |
| Under 6 | 56 (56.0%) | 44 (44.0%) |
| 6 to 18 Years | 128 (43.7%) | 160 (54.6%) |
| 19 to 25 Years | 58 (40.0%) | 65 (44.8%) |
| 25 to 34 Years | 47 (20.0%) | 161 (68.5%) |
| 35 to 44 Years | 90 (31.7%) | 218 (76.8%) |
| 45 to 54 Years | 78 (33.8%) | 184 (79.6%) |
| 55 to 64 Years | 110 (35.5%) | 192 (61.9%) |
| 65 to 74 Years | 317 (100.0%) | 202 (63.7%) |
| 75 Years and over | 175 (100.0%) | 129 (73.7%) |
| Total | 1,059 (50.7%) | 1,355 (64.8%) |
Disability Status by Sex by Age in Pulaski
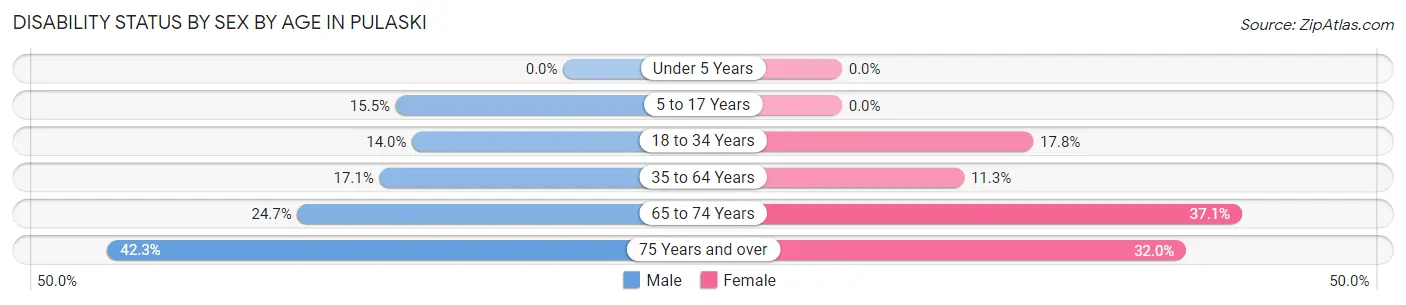
| Age Bracket | Male | Female |
| Under 5 Years | 0 (0.0%) | 0 (0.0%) |
| 5 to 17 Years | 23 (15.5%) | 0 (0.0%) |
| 18 to 34 Years | 37 (14.0%) | 27 (17.8%) |
| 35 to 64 Years | 58 (17.1%) | 55 (11.3%) |
| 65 to 74 Years | 37 (24.7%) | 62 (37.1%) |
| 75 Years and over | 33 (42.3%) | 31 (32.0%) |
Disability Class by Sex by Age in Pulaski
Disability Class: Hearing Difficulty
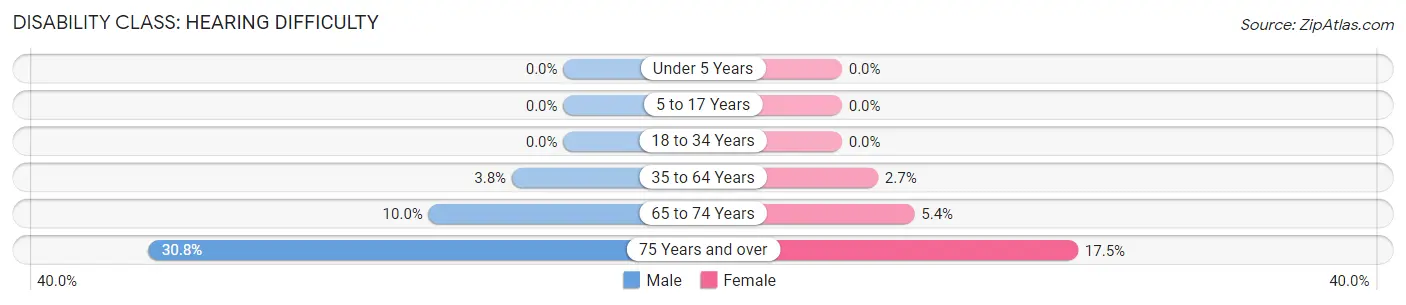
| Age Bracket | Male | Female |
| Under 5 Years | 0 (0.0%) | 0 (0.0%) |
| 5 to 17 Years | 0 (0.0%) | 0 (0.0%) |
| 18 to 34 Years | 0 (0.0%) | 0 (0.0%) |
| 35 to 64 Years | 13 (3.8%) | 13 (2.7%) |
| 65 to 74 Years | 15 (10.0%) | 9 (5.4%) |
| 75 Years and over | 24 (30.8%) | 17 (17.5%) |
Disability Class: Vision Difficulty
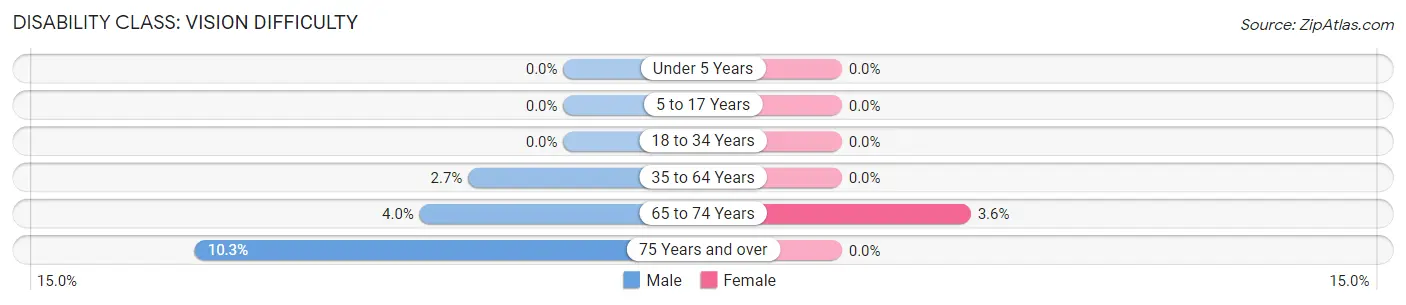
| Age Bracket | Male | Female |
| Under 5 Years | 0 (0.0%) | 0 (0.0%) |
| 5 to 17 Years | 0 (0.0%) | 0 (0.0%) |
| 18 to 34 Years | 0 (0.0%) | 0 (0.0%) |
| 35 to 64 Years | 9 (2.6%) | 0 (0.0%) |
| 65 to 74 Years | 6 (4.0%) | 6 (3.6%) |
| 75 Years and over | 8 (10.3%) | 0 (0.0%) |
Disability Class: Cognitive Difficulty
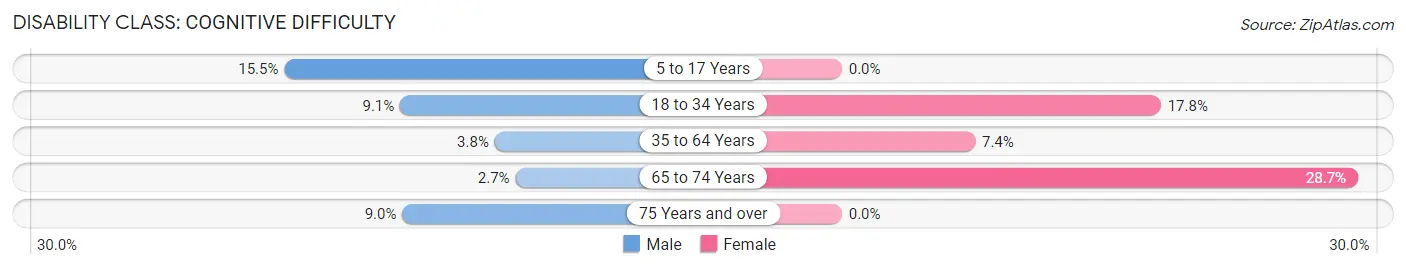
| Age Bracket | Male | Female |
| 5 to 17 Years | 23 (15.5%) | 0 (0.0%) |
| 18 to 34 Years | 24 (9.1%) | 27 (17.8%) |
| 35 to 64 Years | 13 (3.8%) | 36 (7.4%) |
| 65 to 74 Years | 4 (2.7%) | 48 (28.7%) |
| 75 Years and over | 7 (9.0%) | 0 (0.0%) |
Disability Class: Ambulatory Difficulty
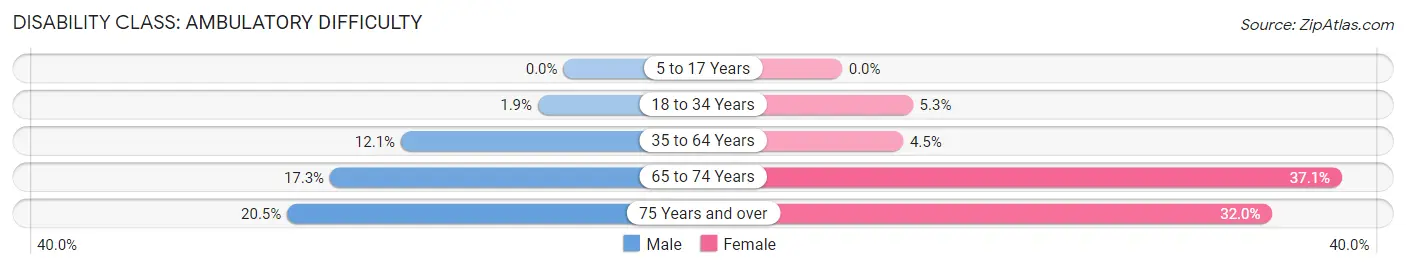
| Age Bracket | Male | Female |
| 5 to 17 Years | 0 (0.0%) | 0 (0.0%) |
| 18 to 34 Years | 5 (1.9%) | 8 (5.3%) |
| 35 to 64 Years | 41 (12.1%) | 22 (4.5%) |
| 65 to 74 Years | 26 (17.3%) | 62 (37.1%) |
| 75 Years and over | 16 (20.5%) | 31 (32.0%) |
Disability Class: Self-Care Difficulty
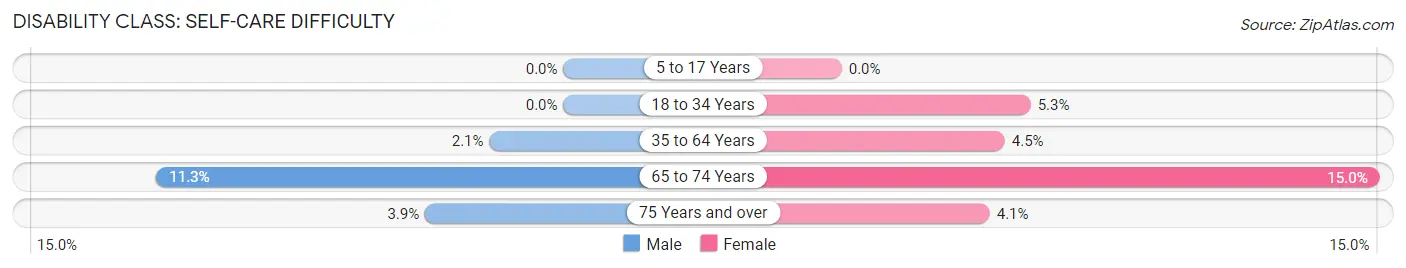
| Age Bracket | Male | Female |
| 5 to 17 Years | 0 (0.0%) | 0 (0.0%) |
| 18 to 34 Years | 0 (0.0%) | 8 (5.3%) |
| 35 to 64 Years | 7 (2.1%) | 22 (4.5%) |
| 65 to 74 Years | 17 (11.3%) | 25 (15.0%) |
| 75 Years and over | 3 (3.8%) | 4 (4.1%) |
Technology Access in Pulaski
Computing Device Access in Pulaski
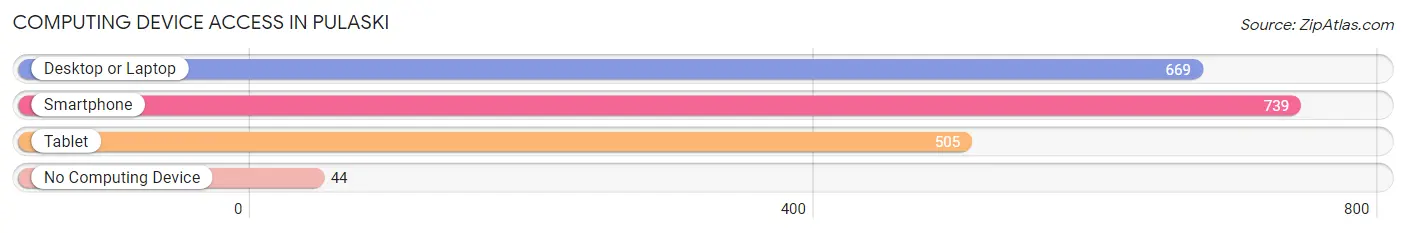
| Device Type | # Households | % Households |
| Desktop or Laptop | 669 | 75.0% |
| Smartphone | 739 | 82.9% |
| Tablet | 505 | 56.6% |
| No Computing Device | 44 | 4.9% |
| Total | 892 | 100.0% |
Internet Access in Pulaski
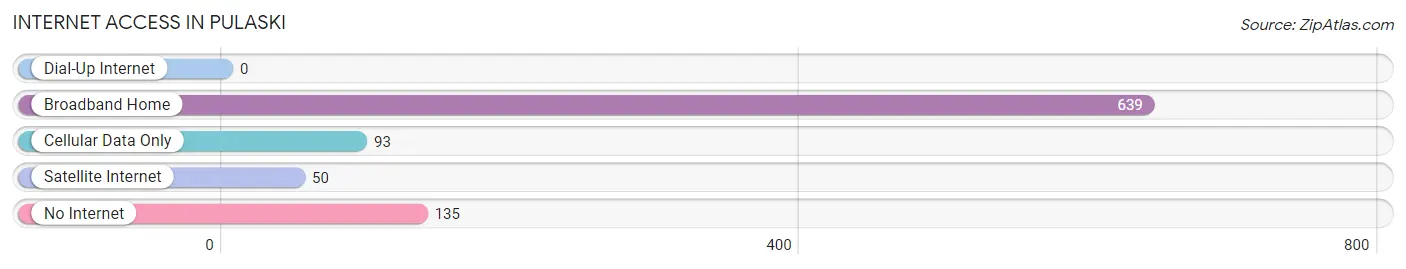
| Internet Type | # Households | % Households |
| Dial-Up Internet | 0 | 0.0% |
| Broadband Home | 639 | 71.6% |
| Cellular Data Only | 93 | 10.4% |
| Satellite Internet | 50 | 5.6% |
| No Internet | 135 | 15.1% |
| Total | 892 | 100.0% |
Pulaski Summary
Pulaski is a small village located in Oswego County, New York, United States. The population was 1,819 at the 2010 census. It is named after the Polish-born Revolutionary War hero, Kazimierz Pułaski. The village is located within the Town of Richland and is part of the Syracuse Metropolitan Statistical Area.
History
The area that is now Pulaski was first settled in 1797 by a group of settlers from Massachusetts. The village was originally known as "Richland" and was incorporated in 1827. The name was changed to Pulaski in 1834 in honor of the Polish-born Revolutionary War hero, Kazimierz Pułaski.
The village was an important stop on the Oswego Canal, which opened in 1828. The canal was used to transport goods and passengers between the Great Lakes and the Hudson River. The canal was eventually replaced by the New York State Barge Canal in 1918.
The village was also home to a number of industries, including a tannery, a grist mill, a saw mill, and a woolen mill. The village also had a number of stores and shops.
Geography
Pulaski is located at 43°30′N 76°10′W (43.50, -76.17). According to the United States Census Bureau, the village has a total area of 1.2 square miles (3.1 km2), all of it land.
The village is located on the Salmon River, which flows into Lake Ontario. The village is also located near the Salmon River Falls, a popular tourist destination.
Economy
The economy of Pulaski is largely based on tourism. The village is home to a number of tourist attractions, including the Salmon River Falls, the Salmon River Fish Hatchery, and the Salmon River State Forest. The village also has a number of restaurants, shops, and lodging establishments.
The village is also home to a number of manufacturing and industrial businesses, including a paper mill, a plastics factory, and a metal fabrication plant.
Demographics
As of the census of 2010, there were 1,819 people, 745 households, and 486 families residing in the village. The population density was 1,521.7 people per square mile (586.3/km2). There were 817 housing units at an average density of 681.3 per square mile (263.3/km2). The racial makeup of the village was 97.2% White, 0.7% African American, 0.2% Native American, 0.2% Asian, 0.2% from other races, and 1.7% from two or more races. Hispanic or Latino of any race were 1.2% of the population.
There were 745 households, out of which 30.2% had children under the age of 18 living with them, 46.2% were married couples living together, 13.2% had a female householder with no husband present, and 35.3% were non-families. 29.7% of all households were made up of individuals, and 13.2% had someone living alone who was 65 years of age or older. The average household size was 2.44 and the average family size was 3.02.
In the village, the population was spread out, with 25.2% under the age of 18, 8.2% from 18 to 24, 27.2% from 25 to 44, 24.2% from 45 to 64, and 15.2% who were 65 years of age or older. The median age was 38 years. For every 100 females, there were 92.2 males. For every 100 females age 18 and over, there were 88.2 males.
The median income for a household in the village was $35,000, and the median income for a family was $41,250. Males had a median income of $31,250 versus $22,500 for females. The per capita income for the village was $17,845. About 8.2% of families and 11.2% of the population were below the poverty line, including 15.2% of those under age 18 and 8.2% of those age 65 or over.
Common Questions
What is Per Capita Income in Pulaski?
Per Capita income in Pulaski is $47,174.
What is the Median Family Income in Pulaski?
Median Family Income in Pulaski is $87,250.
What is the Median Household income in Pulaski?
Median Household Income in Pulaski is $61,226.
What is Income or Wage Gap in Pulaski?
Income or Wage Gap in Pulaski is 20.2%.
Women in Pulaski earn 79.8 cents for every dollar earned by a man.
What is Inequality or Gini Index in Pulaski?
Inequality or Gini Index in Pulaski is 0.57.
What is the Total Population of Pulaski?
Total Population of Pulaski is 2,090.
What is the Total Male Population of Pulaski?
Total Male Population of Pulaski is 998.
What is the Total Female Population of Pulaski?
Total Female Population of Pulaski is 1,092.
What is the Ratio of Males per 100 Females in Pulaski?
There are 91.39 Males per 100 Females in Pulaski.
What is the Ratio of Females per 100 Males in Pulaski?
There are 109.42 Females per 100 Males in Pulaski.
What is the Median Population Age in Pulaski?
Median Population Age in Pulaski is 44.5 Years.
What is the Average Family Size in Pulaski
Average Family Size in Pulaski is 2.8 People.
What is the Average Household Size in Pulaski
Average Household Size in Pulaski is 2.3 People.
How Large is the Labor Force in Pulaski?
There are 918 People in the Labor Forcein in Pulaski.
What is the Percentage of People in the Labor Force in Pulaski?
51.6% of People are in the Labor Force in Pulaski.
What is the Unemployment Rate in Pulaski?
Unemployment Rate in Pulaski is 3.5%.