Landisville, PA Map & Demographics
Landisville Map

Landisville Overview
$49,781
PER CAPITA INCOME
$104,527
AVG FAMILY INCOME
$94,657
AVG HOUSEHOLD INCOME
8.3%
WAGE / INCOME GAP [ % ]
91.7¢/ $1
WAGE / INCOME GAP [ $ ]
0.47
INEQUALITY / GINI INDEX
2,613
TOTAL POPULATION
1,212
MALE POPULATION
1,401
FEMALE POPULATION
86.51
MALES / 100 FEMALES
115.59
FEMALES / 100 MALES
55.5
MEDIAN AGE
2.6
AVG FAMILY SIZE
2.4
AVG HOUSEHOLD SIZE
1,377
LABOR FORCE [ PEOPLE ]
59.5%
PERCENT IN LABOR FORCE
4.7%
UNEMPLOYMENT RATE
Landisville Zip Codes
Landisville Area Codes
Income in Landisville
Income Overview in Landisville
Per Capita Income in Landisville is $49,781, while median incomes of families and households are $104,527 and $94,657 respectively.
| Characteristic | Number | Measure |
| Per Capita Income | 2,613 | $49,781 |
| Median Family Income | 878 | $104,527 |
| Mean Family Income | 878 | $129,129 |
| Median Household Income | 1,093 | $94,657 |
| Mean Household Income | 1,093 | $115,489 |
| Income Deficit | 878 | $0 |
| Wage / Income Gap (%) | 2,613 | 8.33% |
| Wage / Income Gap ($) | 2,613 | 91.67¢ per $1 |
| Gini / Inequality Index | 2,613 | 0.47 |
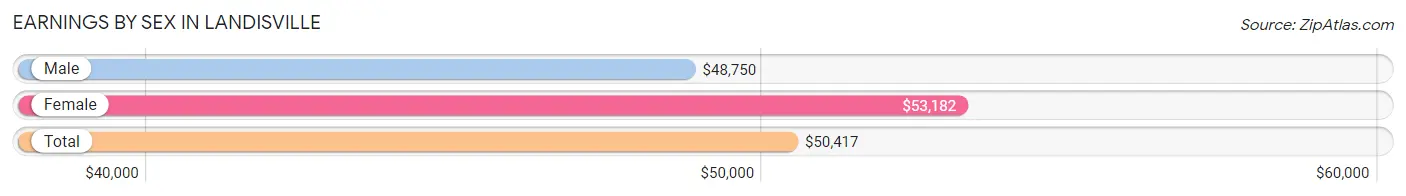
Earnings by Sex in Landisville
Average Earnings in Landisville are $50,417, $48,750 for men and $53,182 for women, a difference of 8.3%.
| Sex | Number | Average Earnings |
| Male | 765 (48.7%) | $48,750 |
| Female | 806 (51.3%) | $53,182 |
| Total | 1,571 (100.0%) | $50,417 |
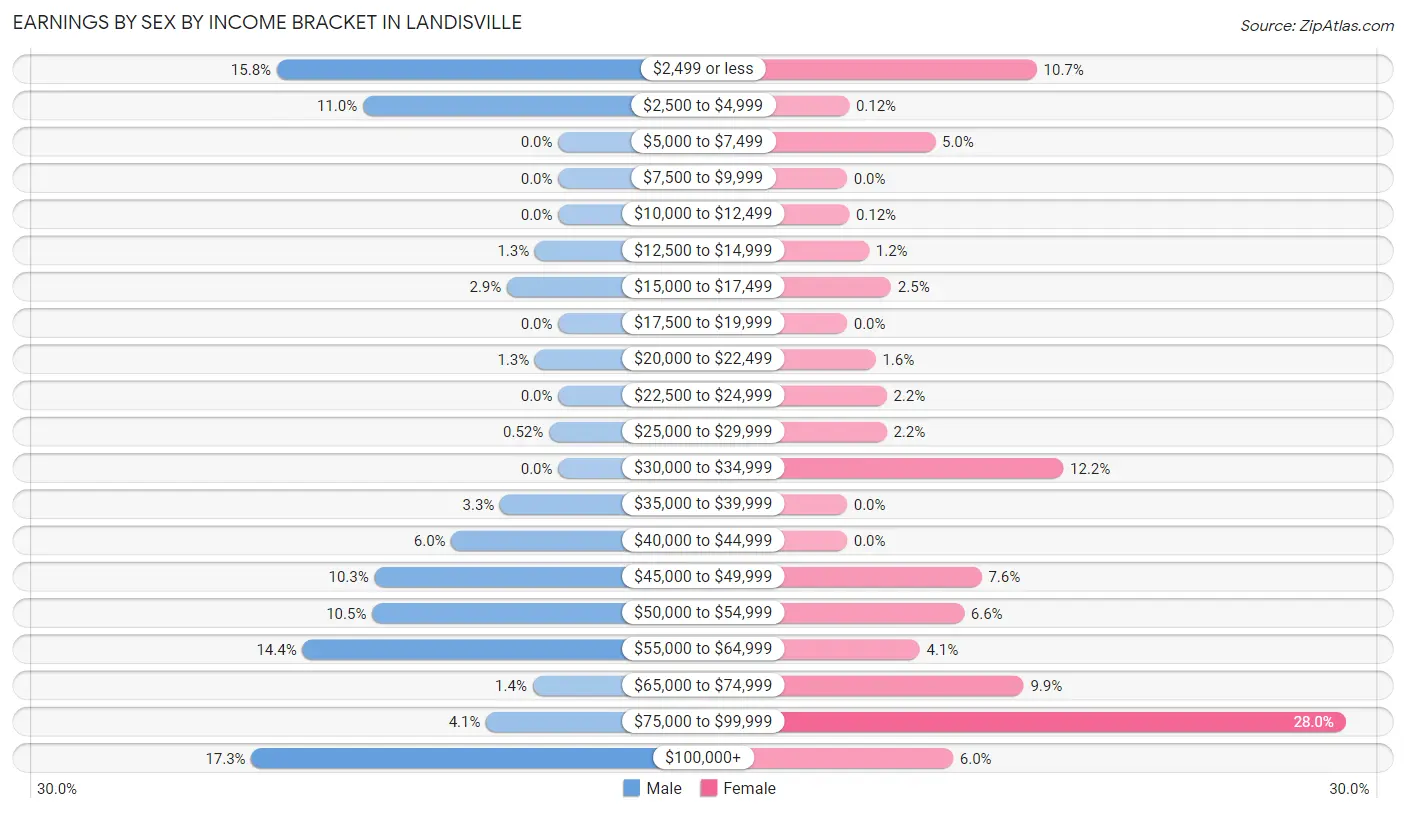
Earnings by Sex by Income Bracket in Landisville
The most common earnings brackets in Landisville are $100,000+ for men (132 | 17.2%) and $75,000 to $99,999 for women (226 | 28.0%).
| Income | Male | Female |
| $2,499 or less | 121 (15.8%) | 86 (10.7%) |
| $2,500 to $4,999 | 84 (11.0%) | 1 (0.1%) |
| $5,000 to $7,499 | 0 (0.0%) | 40 (5.0%) |
| $7,500 to $9,999 | 0 (0.0%) | 0 (0.0%) |
| $10,000 to $12,499 | 0 (0.0%) | 1 (0.1%) |
| $12,500 to $14,999 | 10 (1.3%) | 10 (1.2%) |
| $15,000 to $17,499 | 22 (2.9%) | 20 (2.5%) |
| $17,500 to $19,999 | 0 (0.0%) | 0 (0.0%) |
| $20,000 to $22,499 | 10 (1.3%) | 13 (1.6%) |
| $22,500 to $24,999 | 0 (0.0%) | 18 (2.2%) |
| $25,000 to $29,999 | 4 (0.5%) | 18 (2.2%) |
| $30,000 to $34,999 | 0 (0.0%) | 98 (12.2%) |
| $35,000 to $39,999 | 25 (3.3%) | 0 (0.0%) |
| $40,000 to $44,999 | 46 (6.0%) | 0 (0.0%) |
| $45,000 to $49,999 | 79 (10.3%) | 61 (7.6%) |
| $50,000 to $54,999 | 80 (10.5%) | 53 (6.6%) |
| $55,000 to $64,999 | 110 (14.4%) | 33 (4.1%) |
| $65,000 to $74,999 | 11 (1.4%) | 80 (9.9%) |
| $75,000 to $99,999 | 31 (4.1%) | 226 (28.0%) |
| $100,000+ | 132 (17.2%) | 48 (6.0%) |
| Total | 765 (100.0%) | 806 (100.0%) |
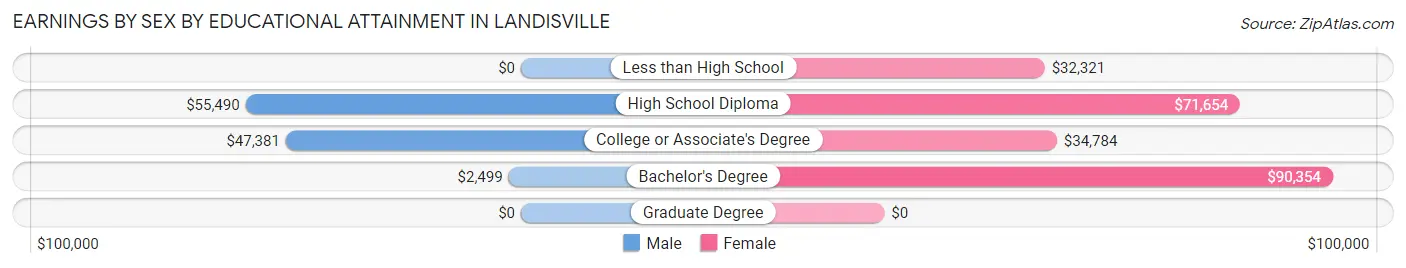
Earnings by Sex by Educational Attainment in Landisville
Average earnings in Landisville are $49,865 for men and $55,455 for women, a difference of 10.1%. Men with an educational attainment of high school diploma enjoy the highest average annual earnings of $55,490, while those with bachelor's degree education earn the least with $2,499. Women with an educational attainment of bachelor's degree earn the most with the average annual earnings of $90,354, while those with less than high school education have the smallest earnings of $32,321.
| Educational Attainment | Male Income | Female Income |
| Less than High School | - | - |
| High School Diploma | $55,490 | $71,654 |
| College or Associate's Degree | $47,381 | $34,784 |
| Bachelor's Degree | $2,499 | $90,354 |
| Graduate Degree | - | - |
| Total | $49,865 | $55,455 |
Family Income in Landisville
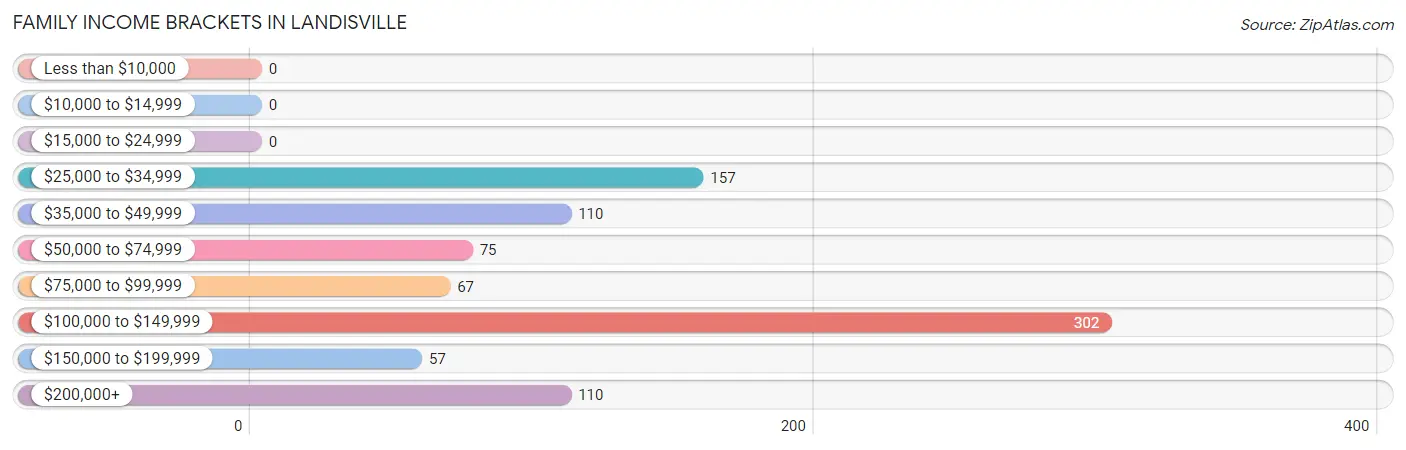
Family Income Brackets in Landisville
According to the Landisville family income data, there are 302 families falling into the $100,000 to $149,999 income range, which is the most common income bracket and makes up 34.4% of all families.
| Income Bracket | # Families | % Families |
| Less than $10,000 | 0 | 0.0% |
| $10,000 to $14,999 | 0 | 0.0% |
| $15,000 to $24,999 | 0 | 0.0% |
| $25,000 to $34,999 | 157 | 17.9% |
| $35,000 to $49,999 | 110 | 12.5% |
| $50,000 to $74,999 | 75 | 8.5% |
| $75,000 to $99,999 | 67 | 7.6% |
| $100,000 to $149,999 | 302 | 34.4% |
| $150,000 to $199,999 | 57 | 6.5% |
| $200,000+ | 110 | 12.5% |
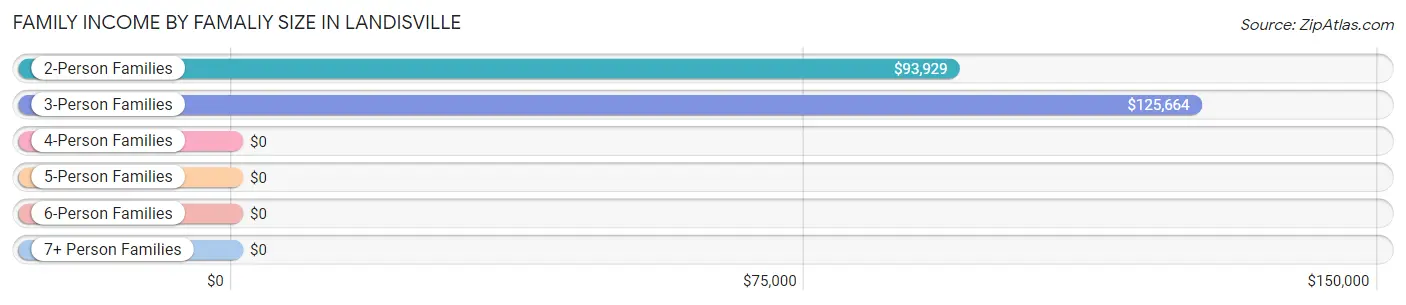
Family Income by Famaliy Size in Landisville
3-person families (185 | 21.1%) account for the highest median family income in Landisville with $125,664 per family, while 2-person families (566 | 64.5%) have the highest median income of $46,964 per family member.
| Income Bracket | # Families | Median Income |
| 2-Person Families | 566 (64.5%) | $93,929 |
| 3-Person Families | 185 (21.1%) | $125,664 |
| 4-Person Families | 72 (8.2%) | $0 |
| 5-Person Families | 35 (4.0%) | $0 |
| 6-Person Families | 20 (2.3%) | $0 |
| 7+ Person Families | 0 (0.0%) | $0 |
| Total | 878 (100.0%) | $104,527 |
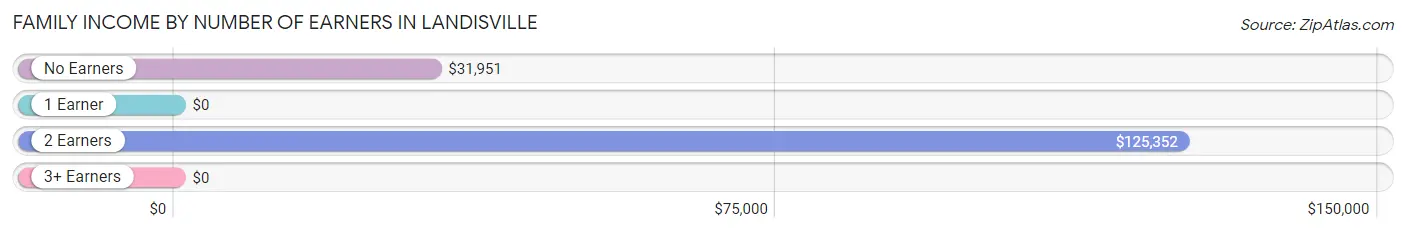
Family Income by Number of Earners in Landisville
| Number of Earners | # Families | Median Income |
| No Earners | 245 (27.9%) | $31,951 |
| 1 Earner | 50 (5.7%) | $0 |
| 2 Earners | 441 (50.2%) | $125,352 |
| 3+ Earners | 142 (16.2%) | $0 |
| Total | 878 (100.0%) | $104,527 |
Household Income in Landisville
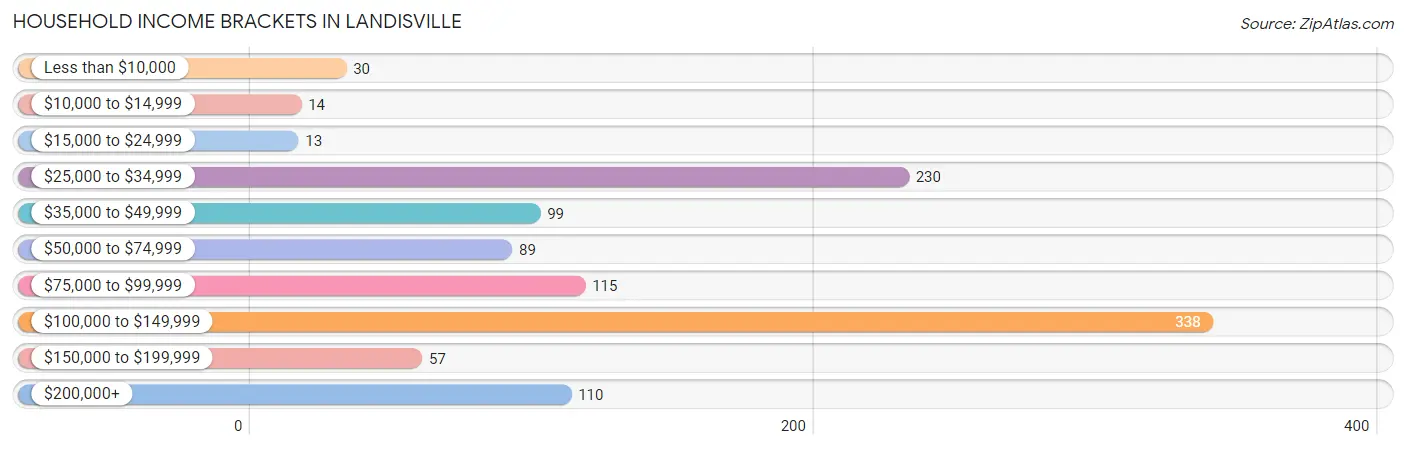
Household Income Brackets in Landisville
With 338 households falling in the category, the $100,000 to $149,999 income range is the most frequent in Landisville, accounting for 30.9% of all households. In contrast, only 13 households (1.2%) fall into the $15,000 to $24,999 income bracket, making it the least populous group.
| Income Bracket | # Households | % Households |
| Less than $10,000 | 30 | 2.7% |
| $10,000 to $14,999 | 14 | 1.3% |
| $15,000 to $24,999 | 13 | 1.2% |
| $25,000 to $34,999 | 230 | 21.0% |
| $35,000 to $49,999 | 99 | 9.1% |
| $50,000 to $74,999 | 89 | 8.1% |
| $75,000 to $99,999 | 115 | 10.5% |
| $100,000 to $149,999 | 338 | 30.9% |
| $150,000 to $199,999 | 57 | 5.2% |
| $200,000+ | 110 | 10.1% |
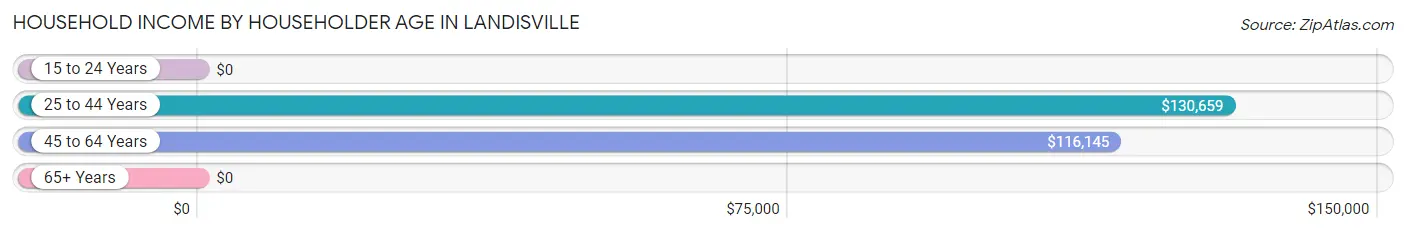
Household Income by Householder Age in Landisville
The median household income in Landisville is $94,657, with the highest median household income of $130,659 found in the 25 to 44 years age bracket for the primary householder. A total of 183 households (16.7%) fall into this category. Meanwhile, the 15 to 24 years age bracket for the primary householder has the lowest median household income of $0, with 22 households (2.0%) in this group.
| Income Bracket | # Households | Median Income |
| 15 to 24 Years | 22 (2.0%) | $0 |
| 25 to 44 Years | 183 (16.7%) | $130,659 |
| 45 to 64 Years | 524 (47.9%) | $116,145 |
| 65+ Years | 364 (33.3%) | $0 |
| Total | 1,093 (100.0%) | $94,657 |
Poverty in Landisville
Income Below Poverty by Sex and Age in Landisville
With 1.2% poverty level for males and 5.0% for females among the residents of Landisville, 75 year old and over males and 25 to 34 year old females are the most vulnerable to poverty, with 14 males (5.3%) and 29 females (13.1%) in their respective age groups living below the poverty level.
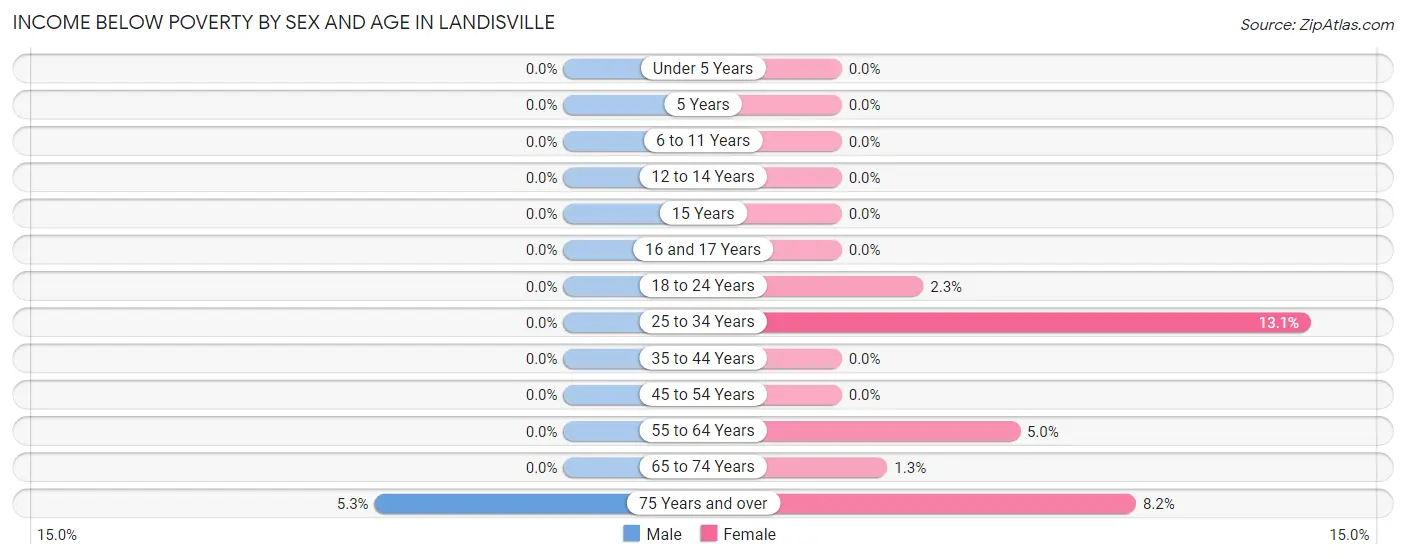
| Age Bracket | Male | Female |
| Under 5 Years | 0 (0.0%) | 0 (0.0%) |
| 5 Years | 0 (0.0%) | 0 (0.0%) |
| 6 to 11 Years | 0 (0.0%) | 0 (0.0%) |
| 12 to 14 Years | 0 (0.0%) | 0 (0.0%) |
| 15 Years | 0 (0.0%) | 0 (0.0%) |
| 16 and 17 Years | 0 (0.0%) | 0 (0.0%) |
| 18 to 24 Years | 0 (0.0%) | 1 (2.3%) |
| 25 to 34 Years | 0 (0.0%) | 29 (13.1%) |
| 35 to 44 Years | 0 (0.0%) | 0 (0.0%) |
| 45 to 54 Years | 0 (0.0%) | 0 (0.0%) |
| 55 to 64 Years | 0 (0.0%) | 19 (5.0%) |
| 65 to 74 Years | 0 (0.0%) | 1 (1.3%) |
| 75 Years and over | 14 (5.3%) | 19 (8.2%) |
| Total | 14 (1.2%) | 69 (5.0%) |
Income Above Poverty by Sex and Age in Landisville
According to the poverty statistics in Landisville, males aged under 5 years and females aged under 5 years are the age groups that are most secure financially, with 100.0% of males and 100.0% of females in these age groups living above the poverty line.
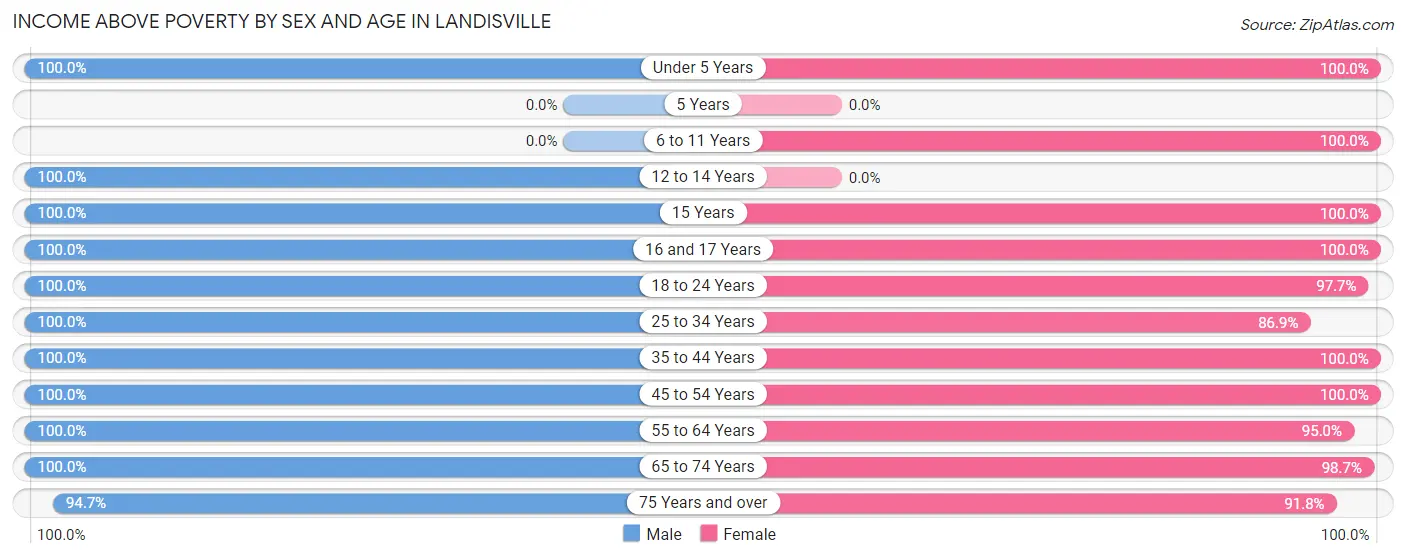
| Age Bracket | Male | Female |
| Under 5 Years | 10 (100.0%) | 89 (100.0%) |
| 5 Years | 0 (0.0%) | 0 (0.0%) |
| 6 to 11 Years | 0 (0.0%) | 95 (100.0%) |
| 12 to 14 Years | 13 (100.0%) | 0 (0.0%) |
| 15 Years | 40 (100.0%) | 34 (100.0%) |
| 16 and 17 Years | 31 (100.0%) | 21 (100.0%) |
| 18 to 24 Years | 89 (100.0%) | 43 (97.7%) |
| 25 to 34 Years | 162 (100.0%) | 193 (86.9%) |
| 35 to 44 Years | 90 (100.0%) | 46 (100.0%) |
| 45 to 54 Years | 124 (100.0%) | 138 (100.0%) |
| 55 to 64 Years | 310 (100.0%) | 364 (95.0%) |
| 65 to 74 Years | 77 (100.0%) | 78 (98.7%) |
| 75 Years and over | 252 (94.7%) | 213 (91.8%) |
| Total | 1,198 (98.8%) | 1,314 (95.0%) |
Income Below Poverty Among Married-Couple Families in Landisville
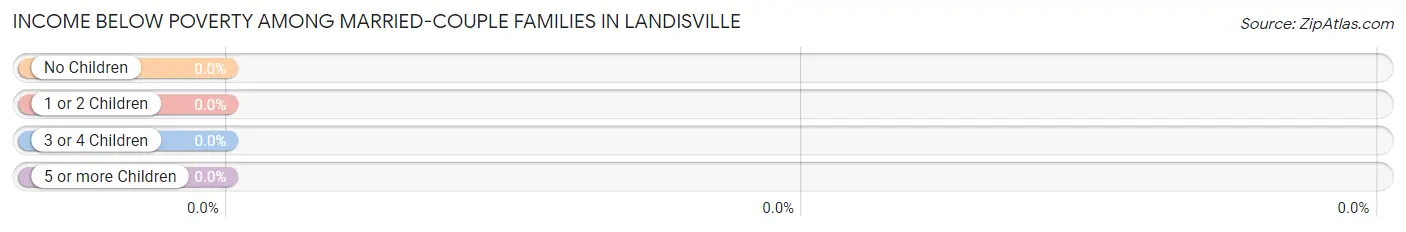
| Children | Above Poverty | Below Poverty |
| No Children | 640 (100.0%) | 0 (0.0%) |
| 1 or 2 Children | 173 (100.0%) | 0 (0.0%) |
| 3 or 4 Children | 35 (100.0%) | 0 (0.0%) |
| 5 or more Children | 0 (0.0%) | 0 (0.0%) |
| Total | 848 (100.0%) | 0 (0.0%) |
Income Below Poverty Among Single-Parent Households in Landisville
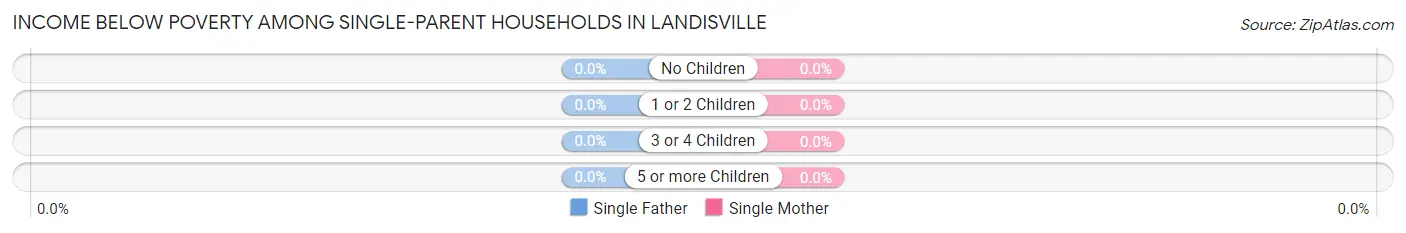
| Children | Single Father | Single Mother |
| No Children | 0 (0.0%) | 0 (0.0%) |
| 1 or 2 Children | 0 (0.0%) | 0 (0.0%) |
| 3 or 4 Children | 0 (0.0%) | 0 (0.0%) |
| 5 or more Children | 0 (0.0%) | 0 (0.0%) |
| Total | 0 (0.0%) | 0 (0.0%) |
Income Below Poverty Among Married-Couple vs Single-Parent Households in Landisville
| Children | Married-Couple Families | Single-Parent Households |
| No Children | 0 (0.0%) | 0 (0.0%) |
| 1 or 2 Children | 0 (0.0%) | 0 (0.0%) |
| 3 or 4 Children | 0 (0.0%) | 0 (0.0%) |
| 5 or more Children | 0 (0.0%) | 0 (0.0%) |
| Total | 0 (0.0%) | 0 (0.0%) |
Race in Landisville
The most populous races in Landisville are White / Caucasian (2,567 | 98.2%), Hispanic or Latino (86 | 3.3%), and Two or more Races (32 | 1.2%).
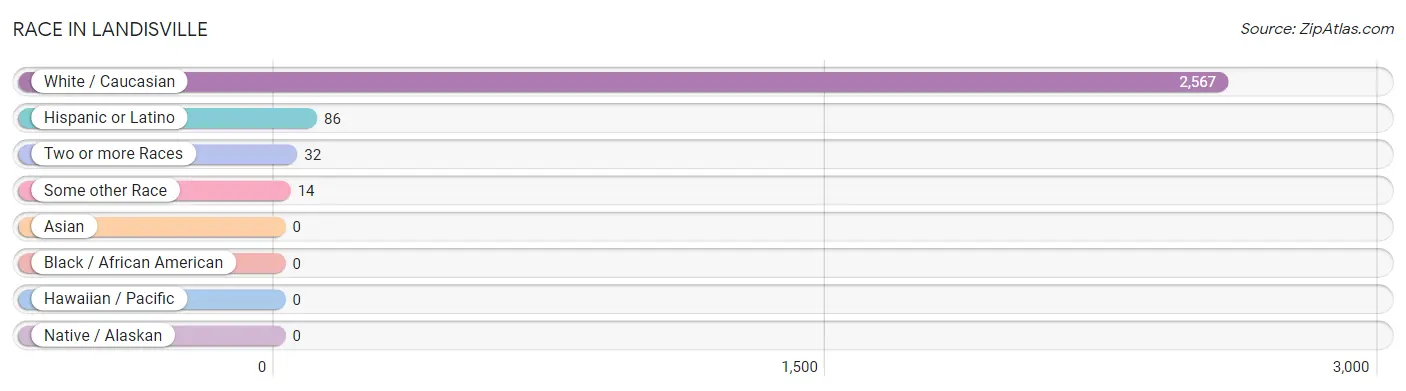
| Race | # Population | % Population |
| Asian | 0 | 0.0% |
| Black / African American | 0 | 0.0% |
| Hawaiian / Pacific | 0 | 0.0% |
| Hispanic or Latino | 86 | 3.3% |
| Native / Alaskan | 0 | 0.0% |
| White / Caucasian | 2,567 | 98.2% |
| Two or more Races | 32 | 1.2% |
| Some other Race | 14 | 0.5% |
| Total | 2,613 | 100.0% |
Ancestry in Landisville
The most populous ancestries reported in Landisville are German (1,081 | 41.4%), English (601 | 23.0%), Irish (586 | 22.4%), Italian (367 | 14.1%), and Scottish (115 | 4.4%), together accounting for 105.3% of all Landisville residents.
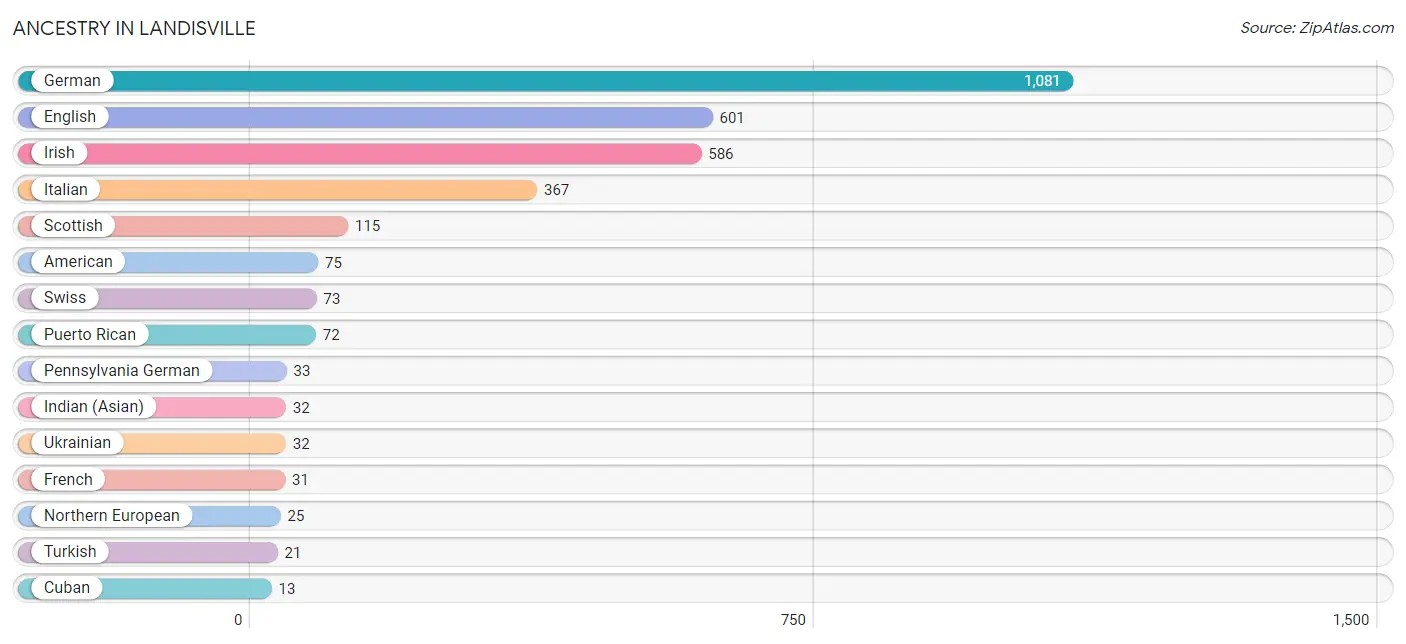
| Ancestry | # Population | % Population |
| American | 75 | 2.9% |
| Cuban | 13 | 0.5% |
| English | 601 | 23.0% |
| French | 31 | 1.2% |
| German | 1,081 | 41.4% |
| Indian (Asian) | 32 | 1.2% |
| Irish | 586 | 22.4% |
| Italian | 367 | 14.1% |
| Northern European | 25 | 1.0% |
| Pennsylvania German | 33 | 1.3% |
| Puerto Rican | 72 | 2.8% |
| Romanian | 9 | 0.3% |
| Scottish | 115 | 4.4% |
| Swedish | 5 | 0.2% |
| Swiss | 73 | 2.8% |
| Turkish | 21 | 0.8% |
| Ukrainian | 32 | 1.2% | View All 17 Rows |
Immigrants in Landisville
The most numerous immigrant groups reported in Landisville came from Asia (21 | 0.8%), Turkey (21 | 0.8%), Western Asia (21 | 0.8%), Caribbean (13 | 0.5%), and Cuba (13 | 0.5%), together accounting for 3.4% of all Landisville residents.
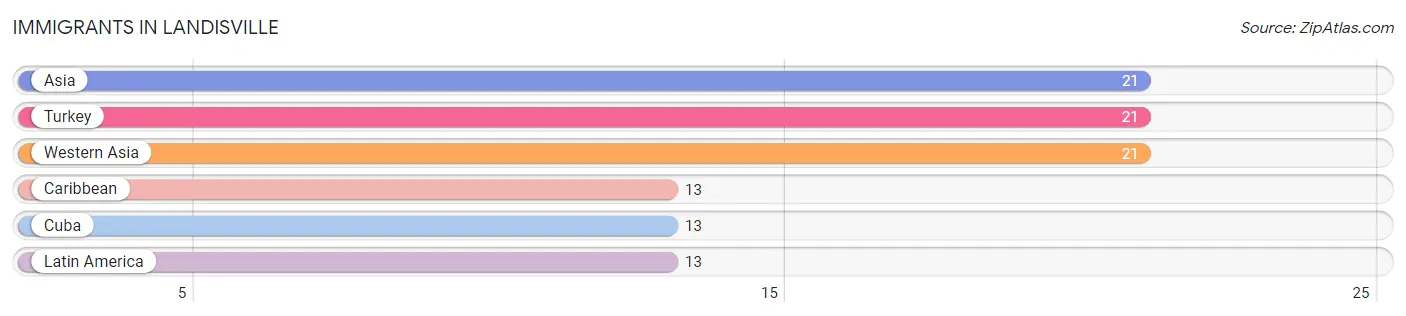
| Immigration Origin | # Population | % Population |
| Asia | 21 | 0.8% |
| Caribbean | 13 | 0.5% |
| Cuba | 13 | 0.5% |
| Latin America | 13 | 0.5% |
| Turkey | 21 | 0.8% |
| Western Asia | 21 | 0.8% | View All 6 Rows |
Sex and Age in Landisville
Sex and Age in Landisville
The most populous age groups in Landisville are 60 to 64 Years (245 | 20.2%) for men and 60 to 64 Years (231 | 16.5%) for women.
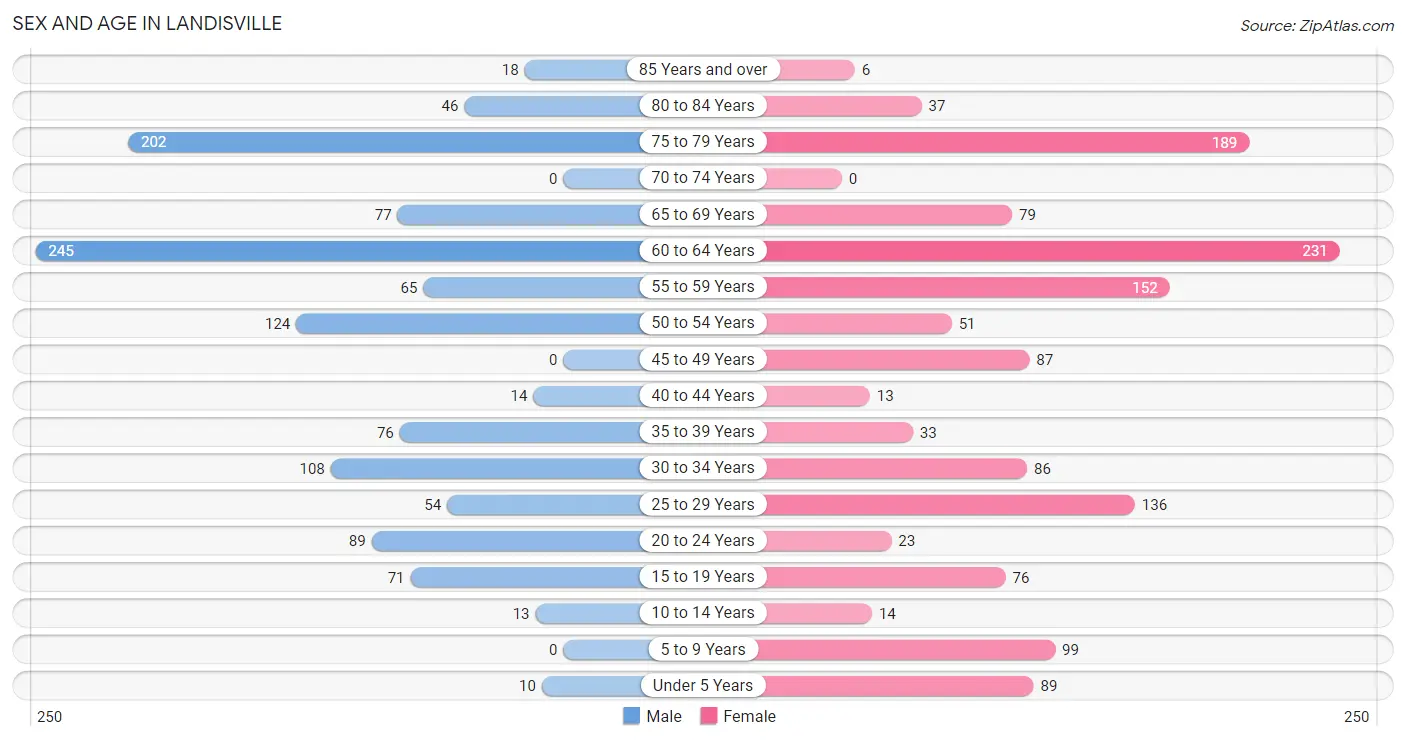
| Age Bracket | Male | Female |
| Under 5 Years | 10 (0.8%) | 89 (6.4%) |
| 5 to 9 Years | 0 (0.0%) | 99 (7.1%) |
| 10 to 14 Years | 13 (1.1%) | 14 (1.0%) |
| 15 to 19 Years | 71 (5.9%) | 76 (5.4%) |
| 20 to 24 Years | 89 (7.3%) | 23 (1.6%) |
| 25 to 29 Years | 54 (4.5%) | 136 (9.7%) |
| 30 to 34 Years | 108 (8.9%) | 86 (6.1%) |
| 35 to 39 Years | 76 (6.3%) | 33 (2.4%) |
| 40 to 44 Years | 14 (1.2%) | 13 (0.9%) |
| 45 to 49 Years | 0 (0.0%) | 87 (6.2%) |
| 50 to 54 Years | 124 (10.2%) | 51 (3.6%) |
| 55 to 59 Years | 65 (5.4%) | 152 (10.8%) |
| 60 to 64 Years | 245 (20.2%) | 231 (16.5%) |
| 65 to 69 Years | 77 (6.4%) | 79 (5.6%) |
| 70 to 74 Years | 0 (0.0%) | 0 (0.0%) |
| 75 to 79 Years | 202 (16.7%) | 189 (13.5%) |
| 80 to 84 Years | 46 (3.8%) | 37 (2.6%) |
| 85 Years and over | 18 (1.5%) | 6 (0.4%) |
| Total | 1,212 (100.0%) | 1,401 (100.0%) |
Families and Households in Landisville
Median Family Size in Landisville
The median family size in Landisville is 2.64 persons per family, with married-couple families (848 | 96.6%) accounting for the largest median family size of 2.66 persons per family. On the other hand, single male/father families (25 | 2.9%) represent the smallest median family size with 1.76 persons per family.
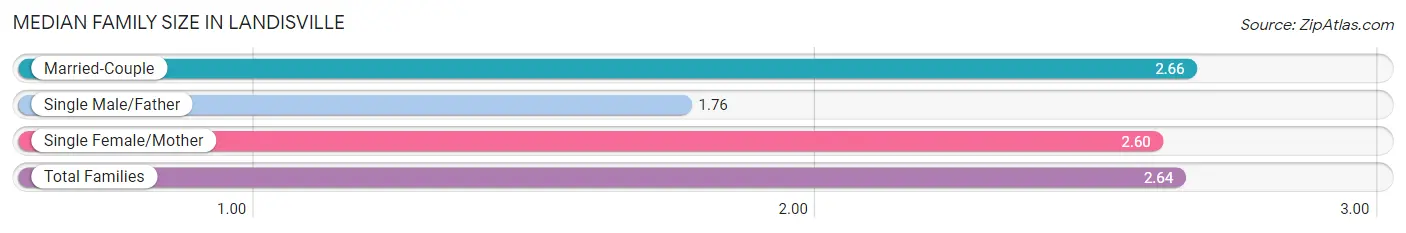
| Family Type | # Families | Family Size |
| Married-Couple | 848 (96.6%) | 2.66 |
| Single Male/Father | 25 (2.9%) | 1.76 |
| Single Female/Mother | 5 (0.6%) | 2.60 |
| Total Families | 878 (100.0%) | 2.64 |
Median Household Size in Landisville
The median household size in Landisville is 2.39 persons per household, with married-couple households (848 | 77.6%) accounting for the largest median household size of 2.73 persons per household. non-family households (215 | 19.7%) represent the smallest median household size with 1.10 persons per household.
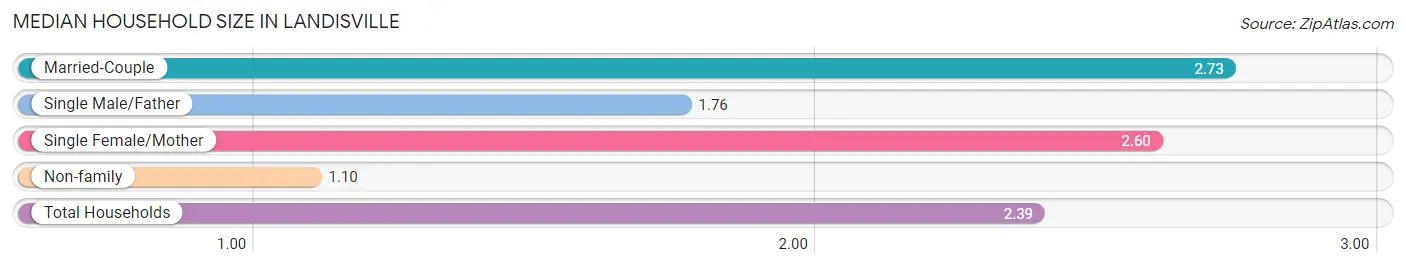
| Household Type | # Households | Household Size |
| Married-Couple | 848 (77.6%) | 2.73 |
| Single Male/Father | 25 (2.3%) | 1.76 |
| Single Female/Mother | 5 (0.5%) | 2.60 |
| Non-family | 215 (19.7%) | 1.10 |
| Total Households | 1,093 (100.0%) | 2.39 |
Household Size by Marriage Status in Landisville
Out of a total of 1,093 households in Landisville, 878 (80.3%) are family households, while 215 (19.7%) are nonfamily households. The most numerous type of family households are 2-person households, comprising 566, and the most common type of nonfamily households are 1-person households, comprising 186.
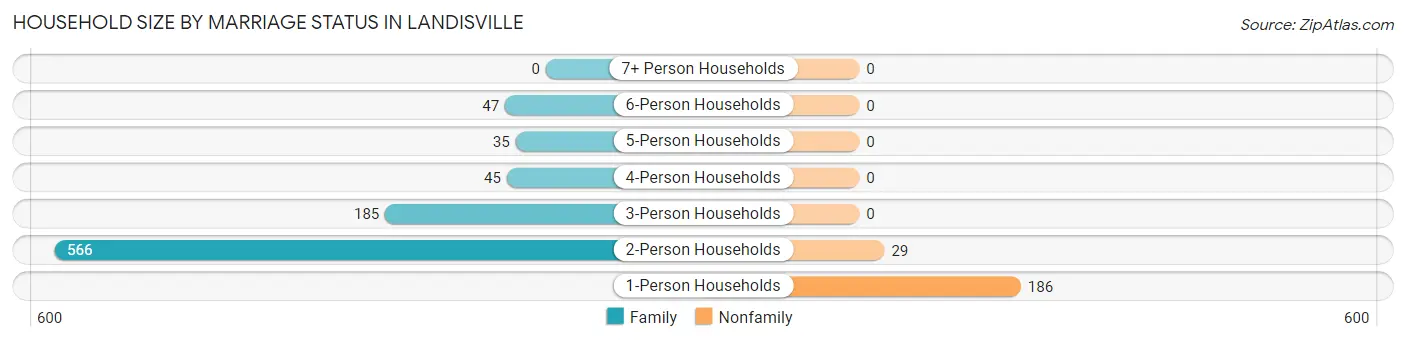
| Household Size | Family Households | Nonfamily Households |
| 1-Person Households | - | 186 (17.0%) |
| 2-Person Households | 566 (51.8%) | 29 (2.6%) |
| 3-Person Households | 185 (16.9%) | 0 (0.0%) |
| 4-Person Households | 45 (4.1%) | 0 (0.0%) |
| 5-Person Households | 35 (3.2%) | 0 (0.0%) |
| 6-Person Households | 47 (4.3%) | 0 (0.0%) |
| 7+ Person Households | 0 (0.0%) | 0 (0.0%) |
| Total | 878 (80.3%) | 215 (19.7%) |
Female Fertility in Landisville
Fertility by Age in Landisville
Average fertility rate in Landisville is 24.0 births per 1,000 women. Women in the age bracket of 20 to 34 years have the highest fertility rate with 45.0 births per 1,000 women. Women in the age bracket of 20 to 34 years acount for 100.0% of all women with births.
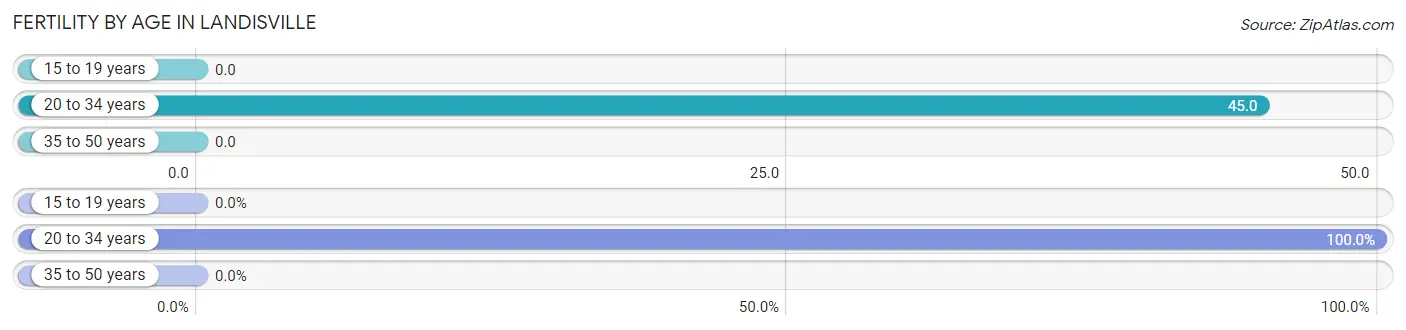
| Age Bracket | Women with Births | Births / 1,000 Women |
| 15 to 19 years | 0 (0.0%) | 0.0 |
| 20 to 34 years | 11 (100.0%) | 45.0 |
| 35 to 50 years | 0 (0.0%) | 0.0 |
| Total | 11 (100.0%) | 24.0 |
Fertility by Age by Marriage Status in Landisville
90.9% of women with births (11) in Landisville are married. The highest percentage of unmarried women with births falls into 20 to 34 years age bracket with 9.1% of them unmarried at the time of birth, while the lowest percentage of unmarried women with births belong to 20 to 34 years age bracket with 9.1% of them unmarried.
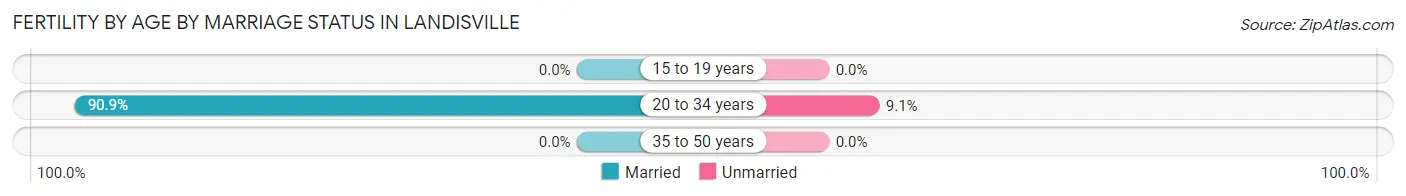
| Age Bracket | Married | Unmarried |
| 15 to 19 years | 0 (0.0%) | 0 (0.0%) |
| 20 to 34 years | 10 (90.9%) | 1 (9.1%) |
| 35 to 50 years | 0 (0.0%) | 0 (0.0%) |
| Total | 10 (90.9%) | 1 (9.1%) |
Fertility by Education in Landisville
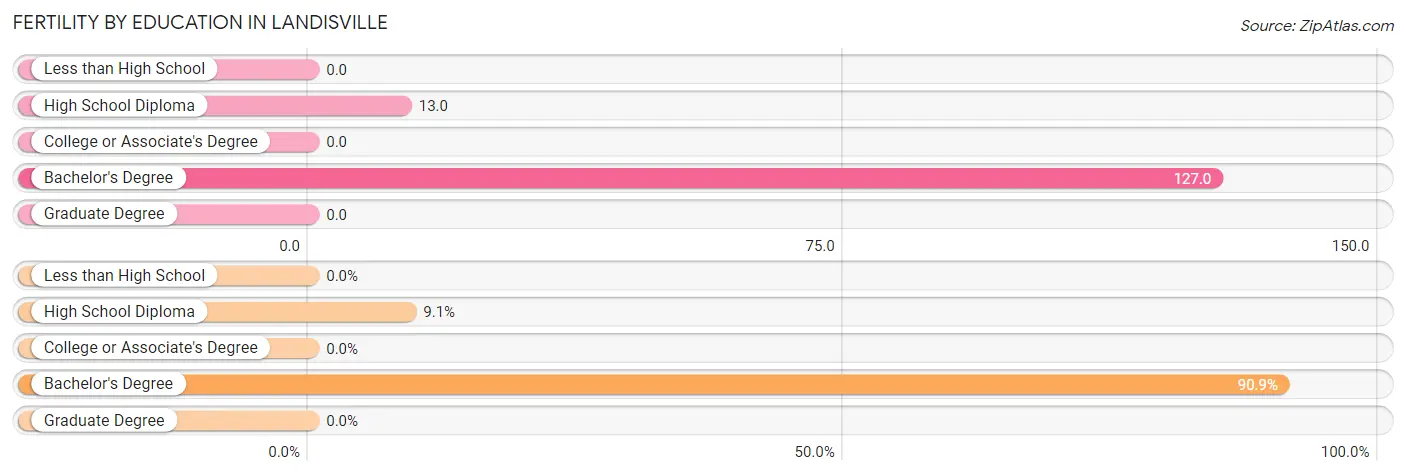
| Educational Attainment | Women with Births | Births / 1,000 Women |
| Less than High School | 0 (0.0%) | 0.0 |
| High School Diploma | 1 (9.1%) | 13.0 |
| College or Associate's Degree | 0 (0.0%) | 0.0 |
| Bachelor's Degree | 10 (90.9%) | 127.0 |
| Graduate Degree | 0 (0.0%) | 0.0 |
| Total | 11 (100.0%) | 24.0 |
Fertility by Education by Marriage Status in Landisville
9.1% of women with births in Landisville are unmarried. Women with the educational attainment of bachelor's degree are most likely to be married with 100.0% of them married at childbirth, while women with the educational attainment of high school diploma are least likely to be married with 100.0% of them unmarried at childbirth.
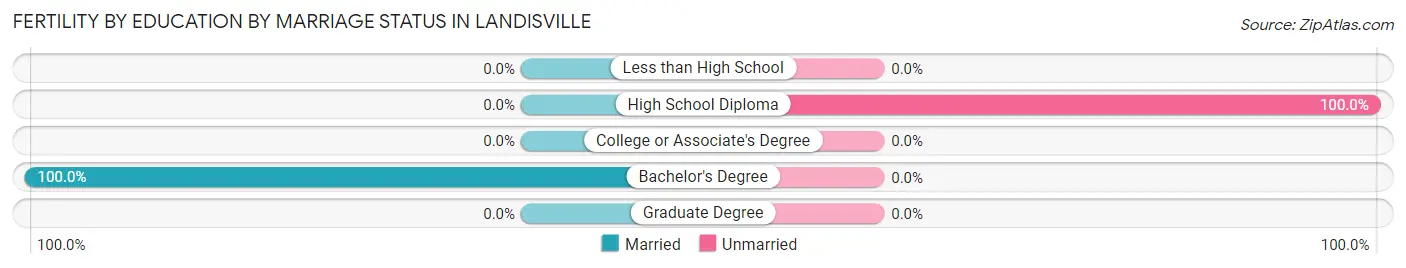
| Educational Attainment | Married | Unmarried |
| Less than High School | 0 (0.0%) | 0 (0.0%) |
| High School Diploma | 0 (0.0%) | 1 (100.0%) |
| College or Associate's Degree | 0 (0.0%) | 0 (0.0%) |
| Bachelor's Degree | 10 (100.0%) | 0 (0.0%) |
| Graduate Degree | 0 (0.0%) | 0 (0.0%) |
| Total | 10 (90.9%) | 1 (9.1%) |
Employment Characteristics in Landisville
Employment by Class of Employer in Landisville
Among the 1,312 employed individuals in Landisville, private company employees (730 | 55.6%), local government employees (226 | 17.2%), and not-for-profit organizations (124 | 9.5%) make up the most common classes of employment.
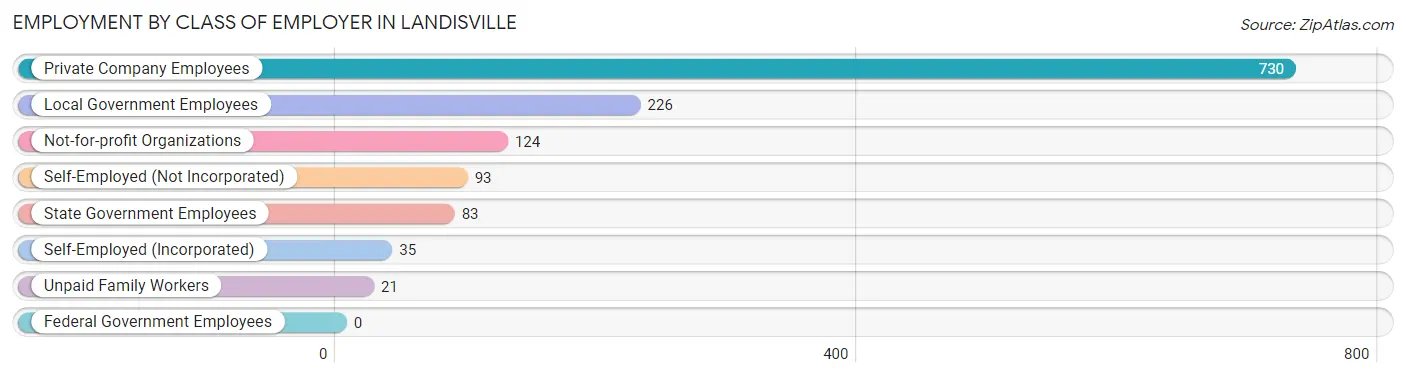
| Employer Class | # Employees | % Employees |
| Private Company Employees | 730 | 55.6% |
| Self-Employed (Incorporated) | 35 | 2.7% |
| Self-Employed (Not Incorporated) | 93 | 7.1% |
| Not-for-profit Organizations | 124 | 9.5% |
| Local Government Employees | 226 | 17.2% |
| State Government Employees | 83 | 6.3% |
| Federal Government Employees | 0 | 0.0% |
| Unpaid Family Workers | 21 | 1.6% |
| Total | 1,312 | 100.0% |
Employment Status by Age in Landisville
According to the labor force statistics for Landisville, out of the total population over 16 years of age (2,314), 59.5% or 1,377 individuals are in the labor force, with 4.7% or 65 of them unemployed. The age group with the highest labor force participation rate is 35 to 44 years, with 100.0% or 136 individuals in the labor force. Within the labor force, the 60 to 64 years age range has the highest percentage of unemployed individuals, with 18.8% or 65 of them being unemployed.
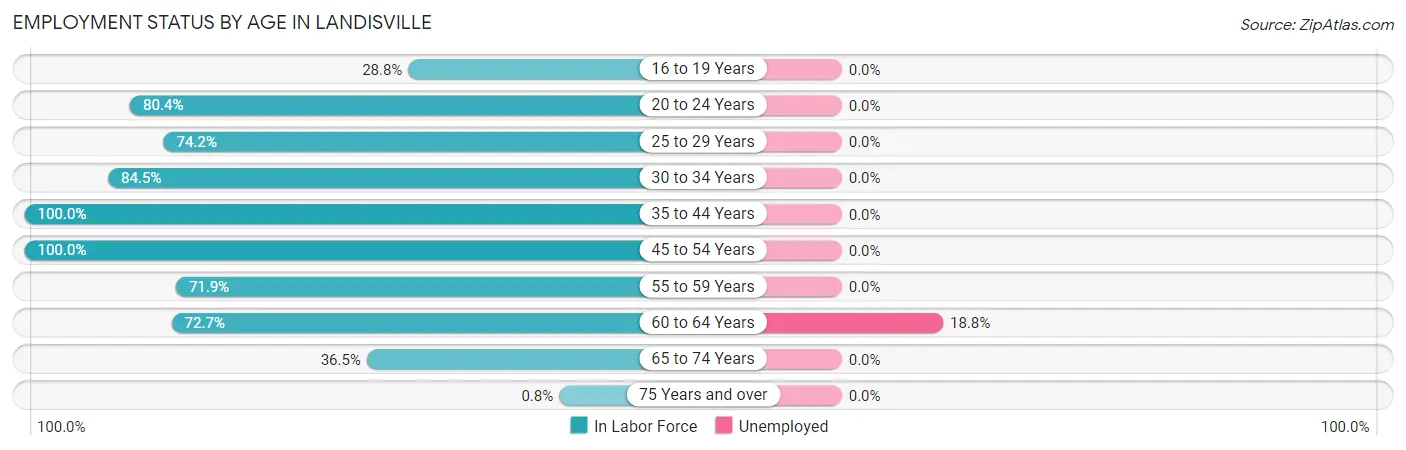
| Age Bracket | In Labor Force | Unemployed |
| 16 to 19 Years | 21 (28.8%) | 0 (0.0%) |
| 20 to 24 Years | 90 (80.4%) | 0 (0.0%) |
| 25 to 29 Years | 141 (74.2%) | 0 (0.0%) |
| 30 to 34 Years | 164 (84.5%) | 0 (0.0%) |
| 35 to 44 Years | 136 (100.0%) | 0 (0.0%) |
| 45 to 54 Years | 262 (100.0%) | 0 (0.0%) |
| 55 to 59 Years | 156 (71.9%) | 0 (0.0%) |
| 60 to 64 Years | 346 (72.7%) | 65 (18.8%) |
| 65 to 74 Years | 57 (36.5%) | 0 (0.0%) |
| 75 Years and over | 4 (0.8%) | 0 (0.0%) |
| Total | 1,377 (59.5%) | 65 (4.7%) |
Employment Status by Educational Attainment in Landisville
According to labor force statistics for Landisville, 81.7% of individuals (1,205) out of the total population between 25 and 64 years of age (1,475) are in the labor force, with 5.4% or 65 of them being unemployed. The group with the highest labor force participation rate are those with the educational attainment of less than high school, with 89.2% or 74 individuals in the labor force. Within the labor force, individuals with bachelor's degree or higher education have the highest percentage of unemployment, with 10.4% or 65 of them being unemployed.
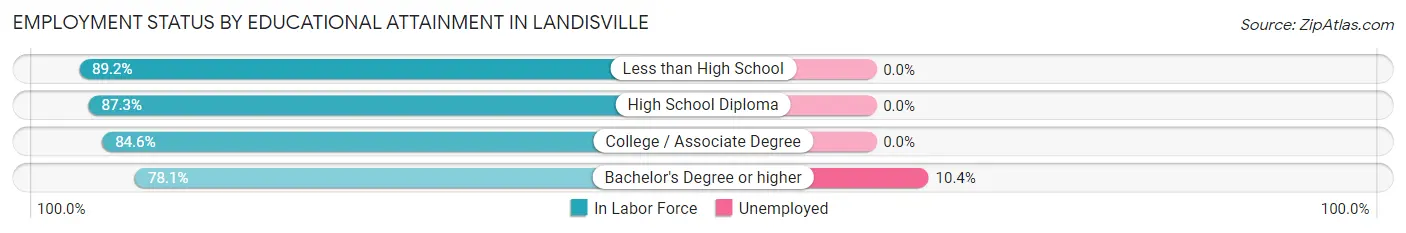
| Educational Attainment | In Labor Force | Unemployed |
| Less than High School | 74 (89.2%) | 0 (0.0%) |
| High School Diploma | 186 (87.3%) | 0 (0.0%) |
| College / Associate Degree | 319 (84.6%) | 0 (0.0%) |
| Bachelor's Degree or higher | 626 (78.1%) | 83 (10.4%) |
| Total | 1,205 (81.7%) | 80 (5.4%) |
Employment Occupations by Sex in Landisville
Management, Business, Science and Arts Occupations
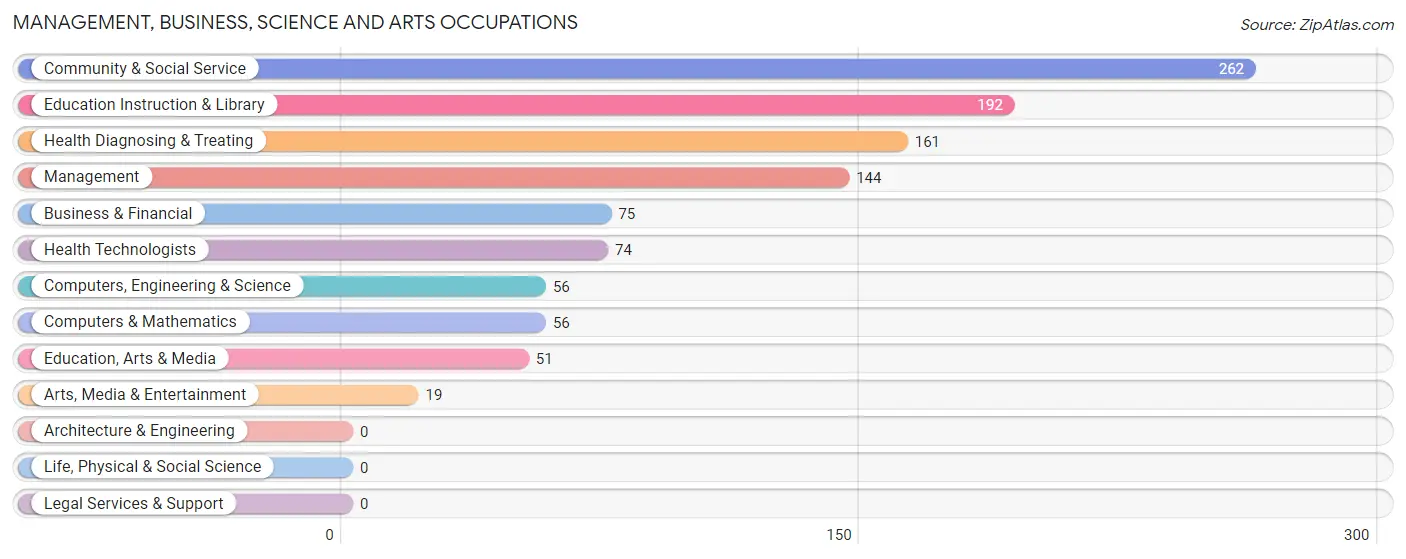
The most common Management, Business, Science and Arts occupations in Landisville are Community & Social Service (262 | 20.0%), Education Instruction & Library (192 | 14.6%), Health Diagnosing & Treating (161 | 12.3%), Management (144 | 11.0%), and Business & Financial (75 | 5.7%).
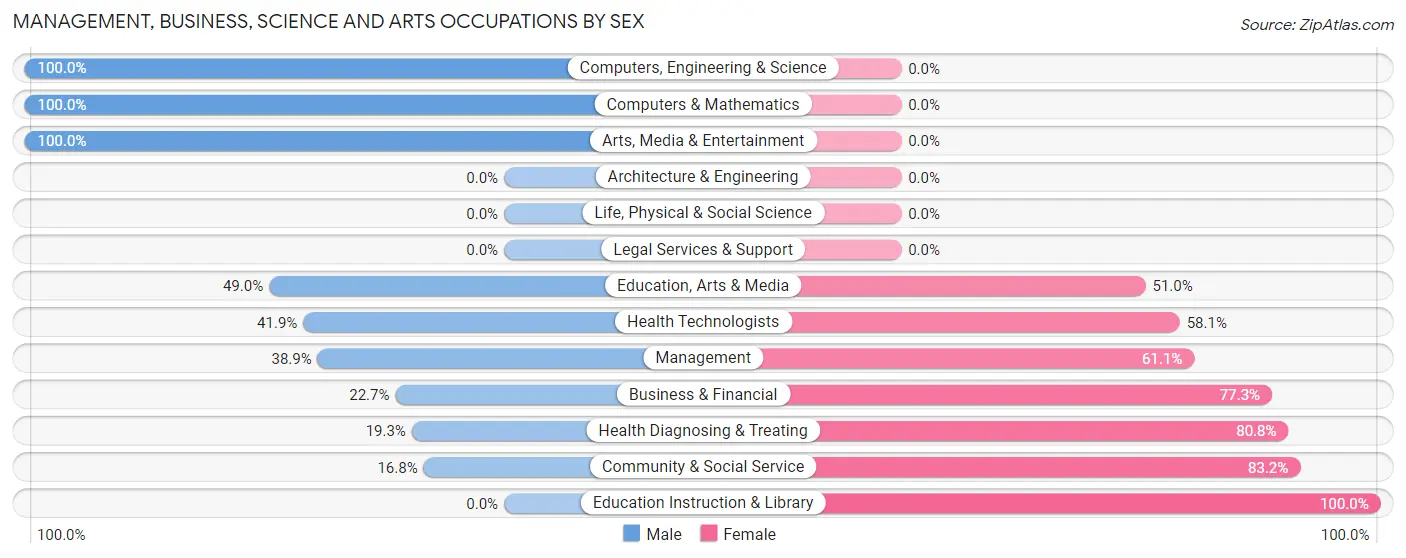
Management, Business, Science and Arts Occupations by Sex
Within the Management, Business, Science and Arts occupations in Landisville, the most male-oriented occupations are Computers, Engineering & Science (100.0%), Computers & Mathematics (100.0%), and Arts, Media & Entertainment (100.0%), while the most female-oriented occupations are Education Instruction & Library (100.0%), Community & Social Service (83.2%), and Health Diagnosing & Treating (80.7%).
| Occupation | Male | Female |
| Management | 56 (38.9%) | 88 (61.1%) |
| Business & Financial | 17 (22.7%) | 58 (77.3%) |
| Computers, Engineering & Science | 56 (100.0%) | 0 (0.0%) |
| Computers & Mathematics | 56 (100.0%) | 0 (0.0%) |
| Architecture & Engineering | 0 (0.0%) | 0 (0.0%) |
| Life, Physical & Social Science | 0 (0.0%) | 0 (0.0%) |
| Community & Social Service | 44 (16.8%) | 218 (83.2%) |
| Education, Arts & Media | 25 (49.0%) | 26 (51.0%) |
| Legal Services & Support | 0 (0.0%) | 0 (0.0%) |
| Education Instruction & Library | 0 (0.0%) | 192 (100.0%) |
| Arts, Media & Entertainment | 19 (100.0%) | 0 (0.0%) |
| Health Diagnosing & Treating | 31 (19.3%) | 130 (80.7%) |
| Health Technologists | 31 (41.9%) | 43 (58.1%) |
| Total (Category) | 204 (29.2%) | 494 (70.8%) |
| Total (Overall) | 527 (40.2%) | 785 (59.8%) |
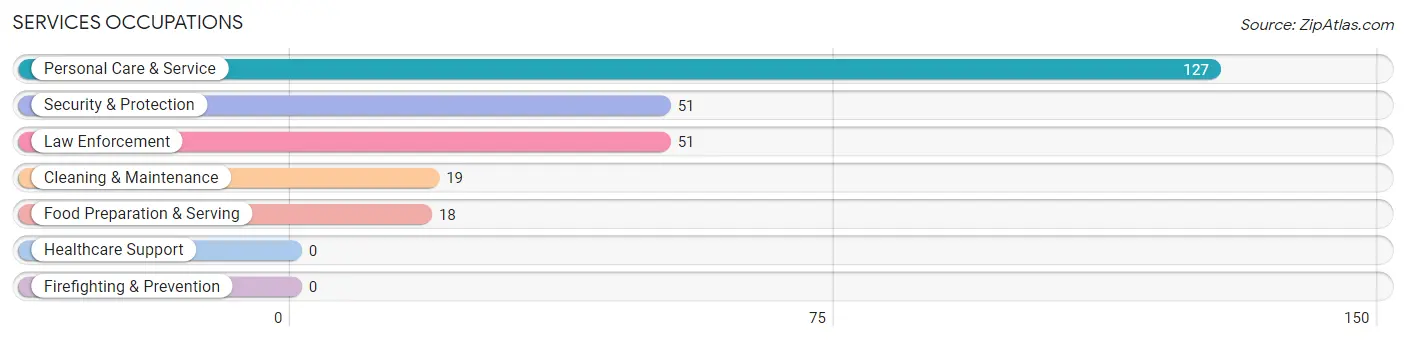
Services Occupations
The most common Services occupations in Landisville are Personal Care & Service (127 | 9.7%), Security & Protection (51 | 3.9%), Law Enforcement (51 | 3.9%), Cleaning & Maintenance (19 | 1.5%), and Food Preparation & Serving (18 | 1.4%).
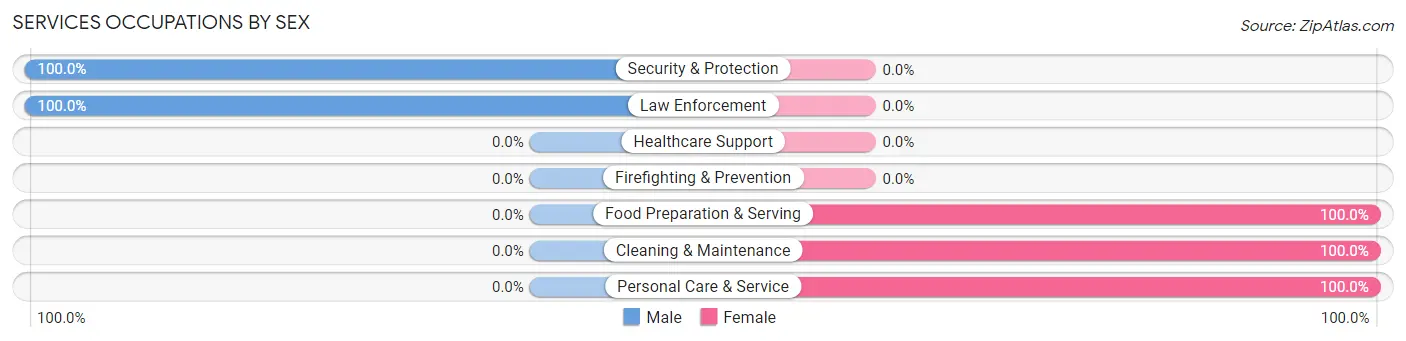
Services Occupations by Sex
Within the Services occupations in Landisville, the most male-oriented occupations are Security & Protection (100.0%), and Law Enforcement (100.0%), while the most female-oriented occupations are Food Preparation & Serving (100.0%), Cleaning & Maintenance (100.0%), and Personal Care & Service (100.0%).
| Occupation | Male | Female |
| Healthcare Support | 0 (0.0%) | 0 (0.0%) |
| Security & Protection | 51 (100.0%) | 0 (0.0%) |
| Firefighting & Prevention | 0 (0.0%) | 0 (0.0%) |
| Law Enforcement | 51 (100.0%) | 0 (0.0%) |
| Food Preparation & Serving | 0 (0.0%) | 18 (100.0%) |
| Cleaning & Maintenance | 0 (0.0%) | 19 (100.0%) |
| Personal Care & Service | 0 (0.0%) | 127 (100.0%) |
| Total (Category) | 51 (23.7%) | 164 (76.3%) |
| Total (Overall) | 527 (40.2%) | 785 (59.8%) |
Sales and Office Occupations
The most common Sales and Office occupations in Landisville are Office & Administration (123 | 9.4%), and Sales & Related (64 | 4.9%).

Sales and Office Occupations by Sex

| Occupation | Male | Female |
| Sales & Related | 30 (46.9%) | 34 (53.1%) |
| Office & Administration | 74 (60.2%) | 49 (39.8%) |
| Total (Category) | 104 (55.6%) | 83 (44.4%) |
| Total (Overall) | 527 (40.2%) | 785 (59.8%) |
Natural Resources, Construction and Maintenance Occupations
The most common Natural Resources, Construction and Maintenance occupations in Landisville are Installation, Maintenance & Repair (102 | 7.8%), and Farming, Fishing & Forestry (21 | 1.6%).

Natural Resources, Construction and Maintenance Occupations by Sex

| Occupation | Male | Female |
| Farming, Fishing & Forestry | 0 (0.0%) | 21 (100.0%) |
| Construction & Extraction | 0 (0.0%) | 0 (0.0%) |
| Installation, Maintenance & Repair | 80 (78.4%) | 22 (21.6%) |
| Total (Category) | 80 (65.0%) | 43 (35.0%) |
| Total (Overall) | 527 (40.2%) | 785 (59.8%) |
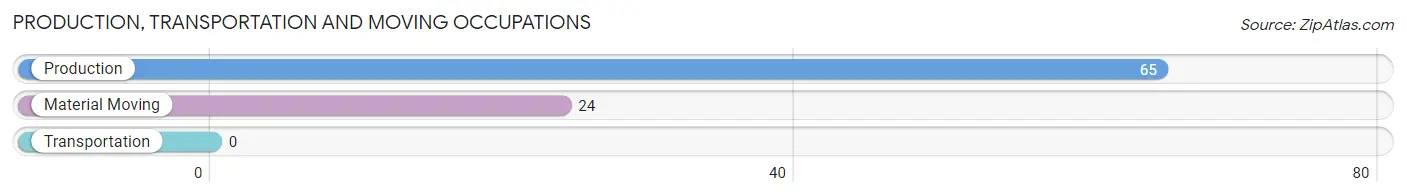
Production, Transportation and Moving Occupations
The most common Production, Transportation and Moving occupations in Landisville are Production (65 | 5.0%), and Material Moving (24 | 1.8%).
Production, Transportation and Moving Occupations by Sex
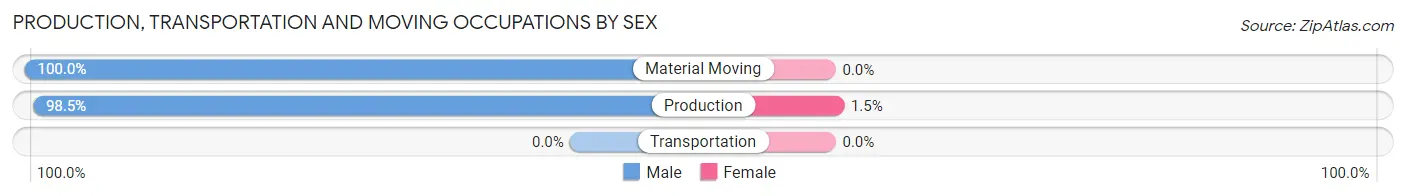
| Occupation | Male | Female |
| Production | 64 (98.5%) | 1 (1.5%) |
| Transportation | 0 (0.0%) | 0 (0.0%) |
| Material Moving | 24 (100.0%) | 0 (0.0%) |
| Total (Category) | 88 (98.9%) | 1 (1.1%) |
| Total (Overall) | 527 (40.2%) | 785 (59.8%) |
Employment Industries by Sex in Landisville
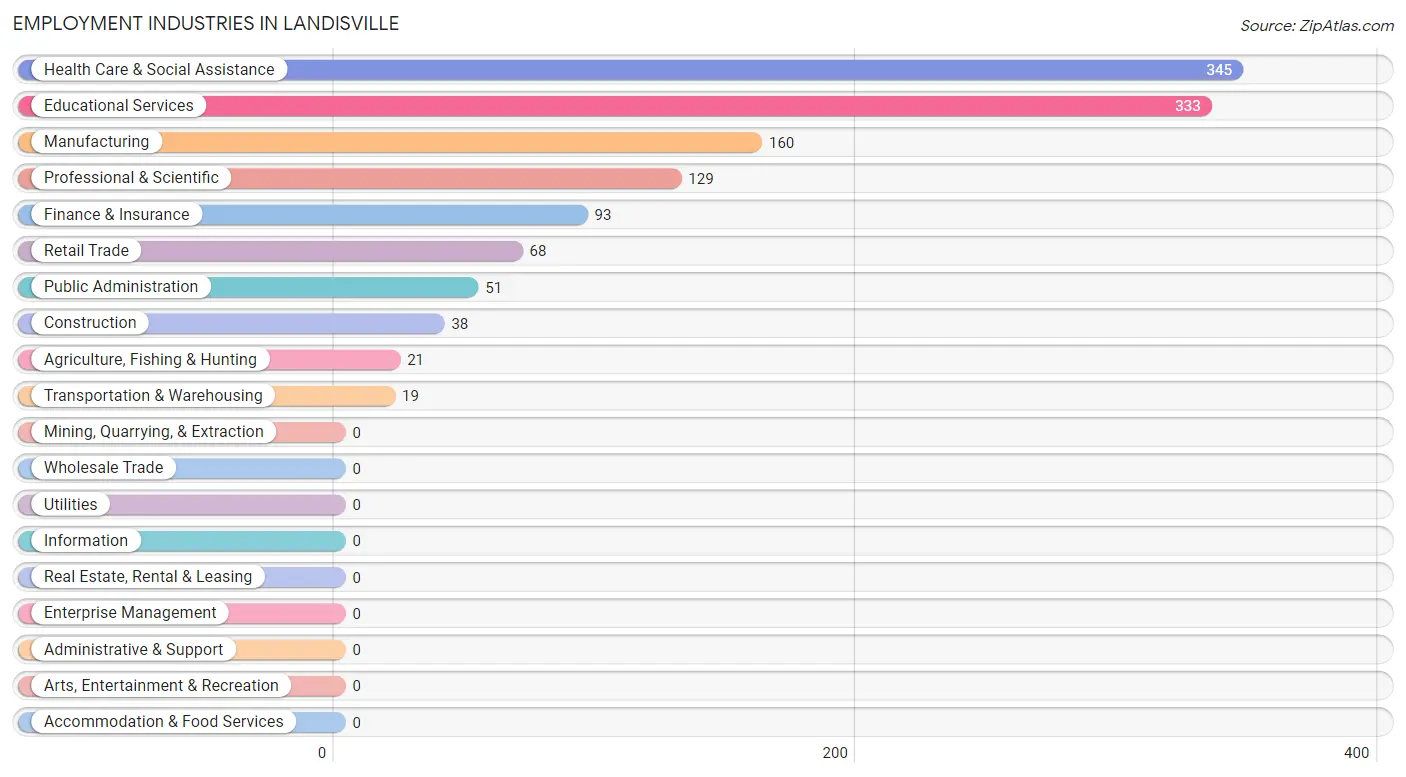
Employment Industries in Landisville
The major employment industries in Landisville include Health Care & Social Assistance (345 | 26.3%), Educational Services (333 | 25.4%), Manufacturing (160 | 12.2%), Professional & Scientific (129 | 9.8%), and Finance & Insurance (93 | 7.1%).
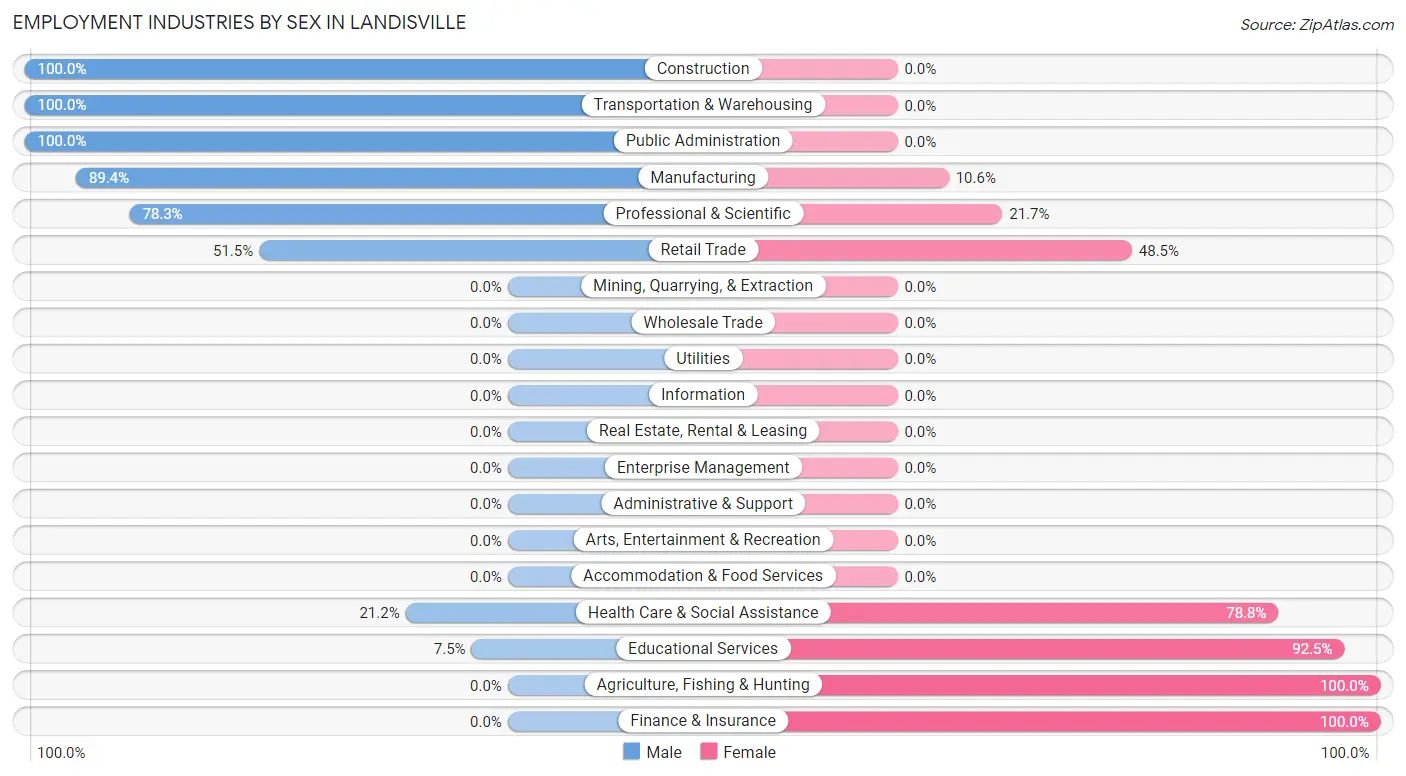
Employment Industries by Sex in Landisville
The Landisville industries that see more men than women are Construction (100.0%), Transportation & Warehousing (100.0%), and Public Administration (100.0%), whereas the industries that tend to have a higher number of women are Agriculture, Fishing & Hunting (100.0%), Finance & Insurance (100.0%), and Educational Services (92.5%).
| Industry | Male | Female |
| Agriculture, Fishing & Hunting | 0 (0.0%) | 21 (100.0%) |
| Mining, Quarrying, & Extraction | 0 (0.0%) | 0 (0.0%) |
| Construction | 38 (100.0%) | 0 (0.0%) |
| Manufacturing | 143 (89.4%) | 17 (10.6%) |
| Wholesale Trade | 0 (0.0%) | 0 (0.0%) |
| Retail Trade | 35 (51.5%) | 33 (48.5%) |
| Transportation & Warehousing | 19 (100.0%) | 0 (0.0%) |
| Utilities | 0 (0.0%) | 0 (0.0%) |
| Information | 0 (0.0%) | 0 (0.0%) |
| Finance & Insurance | 0 (0.0%) | 93 (100.0%) |
| Real Estate, Rental & Leasing | 0 (0.0%) | 0 (0.0%) |
| Professional & Scientific | 101 (78.3%) | 28 (21.7%) |
| Enterprise Management | 0 (0.0%) | 0 (0.0%) |
| Administrative & Support | 0 (0.0%) | 0 (0.0%) |
| Educational Services | 25 (7.5%) | 308 (92.5%) |
| Health Care & Social Assistance | 73 (21.2%) | 272 (78.8%) |
| Arts, Entertainment & Recreation | 0 (0.0%) | 0 (0.0%) |
| Accommodation & Food Services | 0 (0.0%) | 0 (0.0%) |
| Public Administration | 51 (100.0%) | 0 (0.0%) |
| Total | 527 (40.2%) | 785 (59.8%) |
Education in Landisville
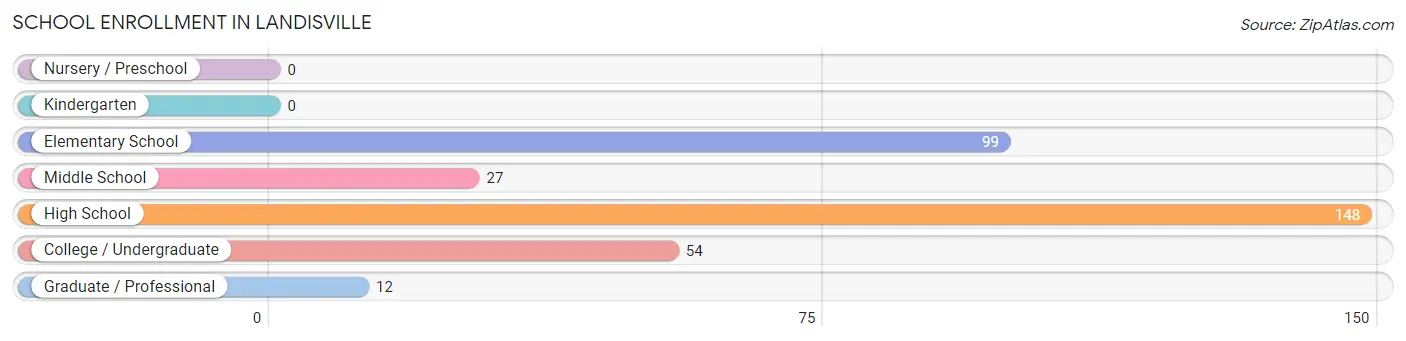
School Enrollment in Landisville
The most common levels of schooling among the 340 students in Landisville are high school (148 | 43.5%), elementary school (99 | 29.1%), and college / undergraduate (54 | 15.9%).
| School Level | # Students | % Students |
| Nursery / Preschool | 0 | 0.0% |
| Kindergarten | 0 | 0.0% |
| Elementary School | 99 | 29.1% |
| Middle School | 27 | 7.9% |
| High School | 148 | 43.5% |
| College / Undergraduate | 54 | 15.9% |
| Graduate / Professional | 12 | 3.5% |
| Total | 340 | 100.0% |
School Enrollment by Age by Funding Source in Landisville
Out of a total of 340 students who are enrolled in schools in Landisville, 51 (15.0%) attend a private institution, while the remaining 289 (85.0%) are enrolled in public schools. The age group of 35 years and over has the highest likelihood of being enrolled in private schools, with 12 (100.0% in the age bracket) enrolled. Conversely, the age group of 5 to 9 year old has the lowest likelihood of being enrolled in a private school, with 99 (100.0% in the age bracket) attending a public institution.
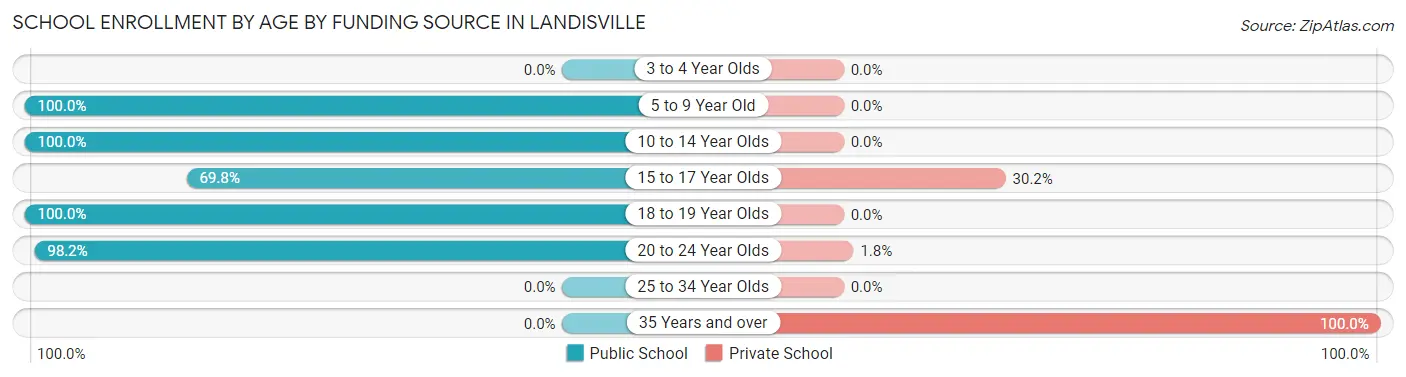
| Age Bracket | Public School | Private School |
| 3 to 4 Year Olds | 0 (0.0%) | 0 (0.0%) |
| 5 to 9 Year Old | 99 (100.0%) | 0 (0.0%) |
| 10 to 14 Year Olds | 27 (100.0%) | 0 (0.0%) |
| 15 to 17 Year Olds | 88 (69.8%) | 38 (30.2%) |
| 18 to 19 Year Olds | 21 (100.0%) | 0 (0.0%) |
| 20 to 24 Year Olds | 54 (98.2%) | 1 (1.8%) |
| 25 to 34 Year Olds | 0 (0.0%) | 0 (0.0%) |
| 35 Years and over | 0 (0.0%) | 12 (100.0%) |
| Total | 289 (85.0%) | 51 (15.0%) |
Educational Attainment by Field of Study in Landisville
Education (199 | 18.9%), liberal arts & history (165 | 15.7%), science & technology (145 | 13.8%), bio, nature & agricultural (132 | 12.5%), and business (120 | 11.4%) are the most common fields of study among 1,054 individuals in Landisville who have obtained a bachelor's degree or higher.
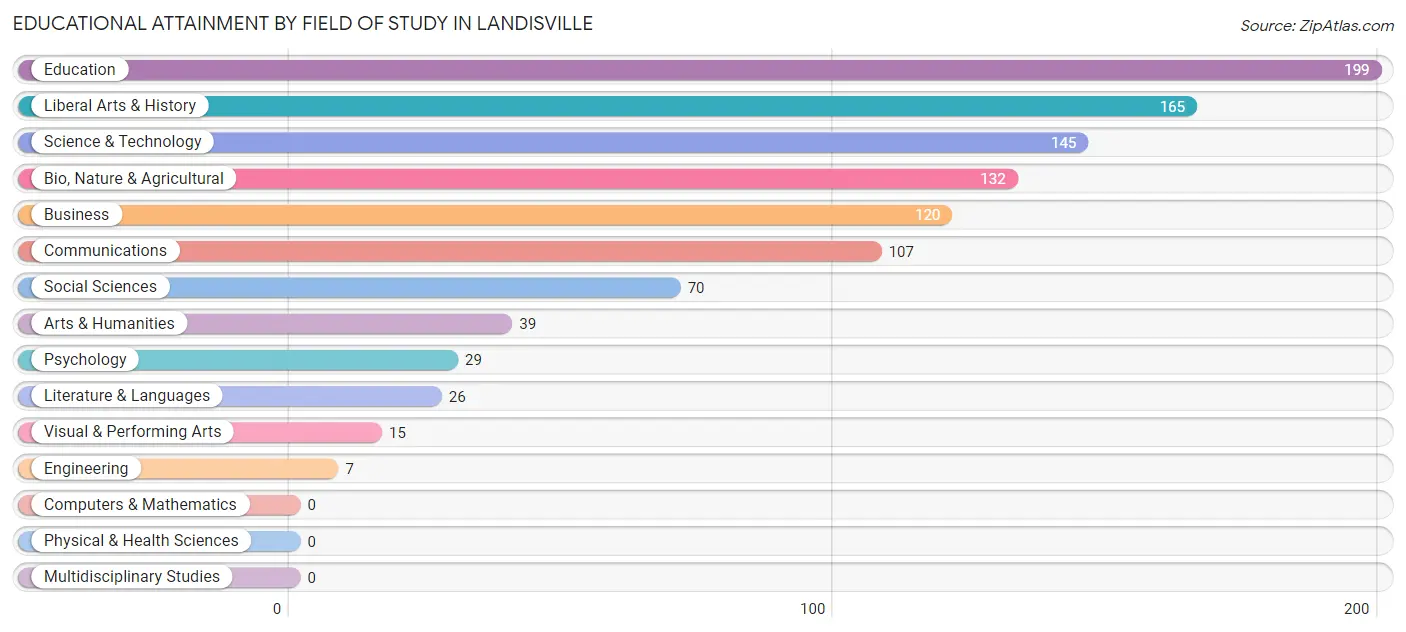
| Field of Study | # Graduates | % Graduates |
| Computers & Mathematics | 0 | 0.0% |
| Bio, Nature & Agricultural | 132 | 12.5% |
| Physical & Health Sciences | 0 | 0.0% |
| Psychology | 29 | 2.8% |
| Social Sciences | 70 | 6.6% |
| Engineering | 7 | 0.7% |
| Multidisciplinary Studies | 0 | 0.0% |
| Science & Technology | 145 | 13.8% |
| Business | 120 | 11.4% |
| Education | 199 | 18.9% |
| Literature & Languages | 26 | 2.5% |
| Liberal Arts & History | 165 | 15.7% |
| Visual & Performing Arts | 15 | 1.4% |
| Communications | 107 | 10.2% |
| Arts & Humanities | 39 | 3.7% |
| Total | 1,054 | 100.0% |
Transportation & Commute in Landisville
Vehicle Availability by Sex in Landisville
The most prevalent vehicle ownership categories in Landisville are males with 2 vehicles (194, accounting for 36.8%) and females with 2 vehicles (209, making up 24.7%).
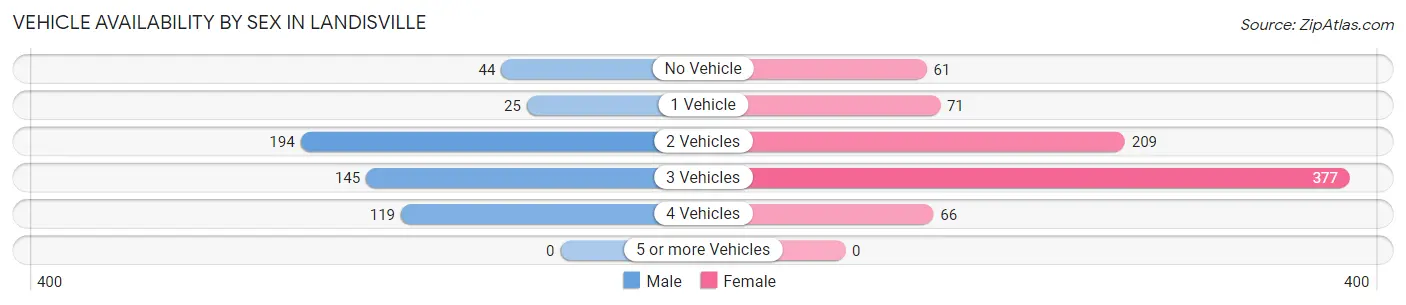
| Vehicles Available | Male | Female |
| No Vehicle | 44 (8.4%) | 61 (7.8%) |
| 1 Vehicle | 25 (4.7%) | 71 (9.1%) |
| 2 Vehicles | 194 (36.8%) | 209 (26.7%) |
| 3 Vehicles | 145 (27.5%) | 377 (48.1%) |
| 4 Vehicles | 119 (22.6%) | 66 (8.4%) |
| 5 or more Vehicles | 0 (0.0%) | 0 (0.0%) |
| Total | 527 (100.0%) | 784 (100.0%) |
Commute Time in Landisville
The most frequently occuring commute durations in Landisville are 20 to 24 minutes (212 commuters, 24.3%), 10 to 14 minutes (204 commuters, 23.4%), and 30 to 34 minutes (171 commuters, 19.6%).
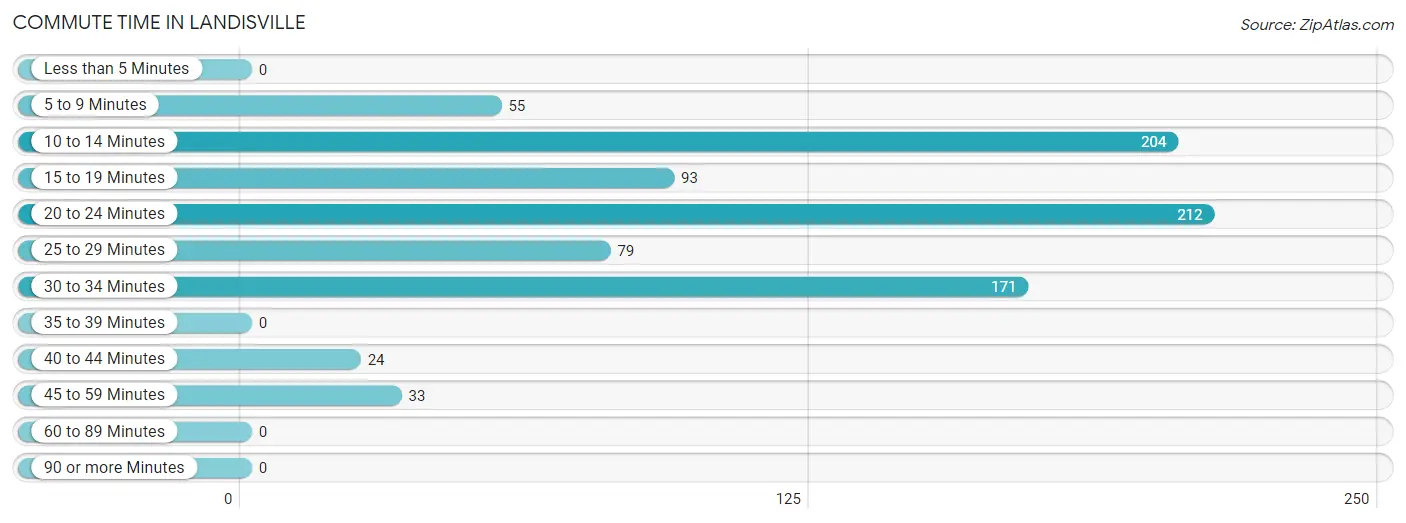
| Commute Time | # Commuters | % Commuters |
| Less than 5 Minutes | 0 | 0.0% |
| 5 to 9 Minutes | 55 | 6.3% |
| 10 to 14 Minutes | 204 | 23.4% |
| 15 to 19 Minutes | 93 | 10.7% |
| 20 to 24 Minutes | 212 | 24.3% |
| 25 to 29 Minutes | 79 | 9.1% |
| 30 to 34 Minutes | 171 | 19.6% |
| 35 to 39 Minutes | 0 | 0.0% |
| 40 to 44 Minutes | 24 | 2.8% |
| 45 to 59 Minutes | 33 | 3.8% |
| 60 to 89 Minutes | 0 | 0.0% |
| 90 or more Minutes | 0 | 0.0% |
Commute Time by Sex in Landisville
The most common commute times in Landisville are 10 to 14 minutes (140 commuters, 30.0%) for males and 30 to 34 minutes (138 commuters, 34.2%) for females.
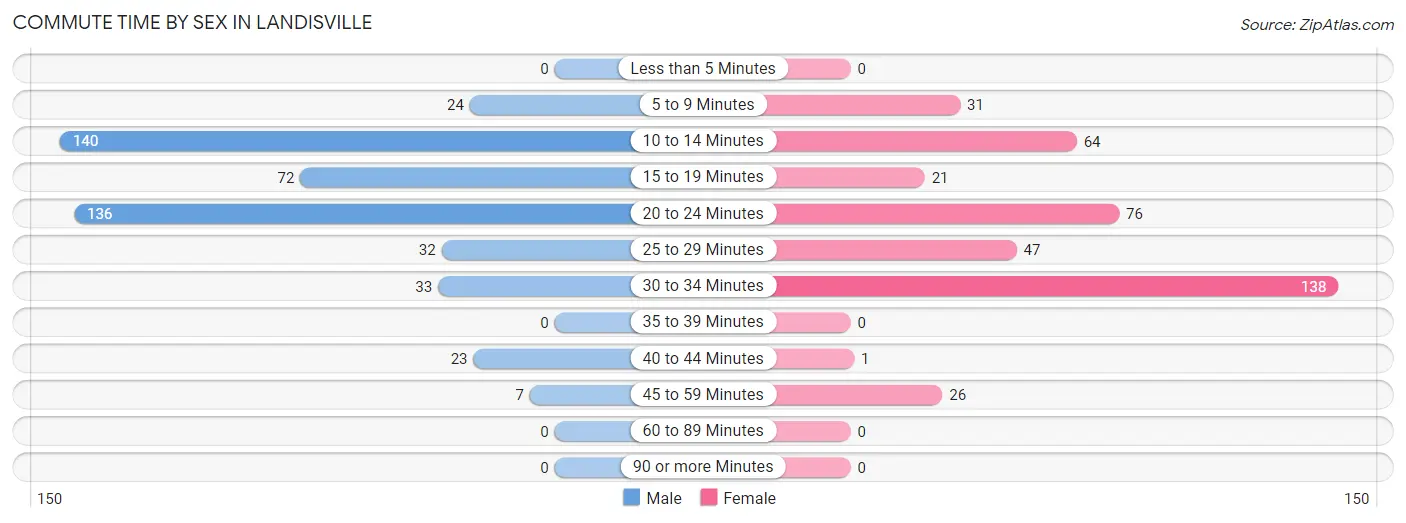
| Commute Time | Male | Female |
| Less than 5 Minutes | 0 (0.0%) | 0 (0.0%) |
| 5 to 9 Minutes | 24 (5.1%) | 31 (7.7%) |
| 10 to 14 Minutes | 140 (30.0%) | 64 (15.8%) |
| 15 to 19 Minutes | 72 (15.4%) | 21 (5.2%) |
| 20 to 24 Minutes | 136 (29.1%) | 76 (18.8%) |
| 25 to 29 Minutes | 32 (6.9%) | 47 (11.6%) |
| 30 to 34 Minutes | 33 (7.1%) | 138 (34.2%) |
| 35 to 39 Minutes | 0 (0.0%) | 0 (0.0%) |
| 40 to 44 Minutes | 23 (4.9%) | 1 (0.3%) |
| 45 to 59 Minutes | 7 (1.5%) | 26 (6.4%) |
| 60 to 89 Minutes | 0 (0.0%) | 0 (0.0%) |
| 90 or more Minutes | 0 (0.0%) | 0 (0.0%) |
Time of Departure to Work by Sex in Landisville
The most frequent times of departure to work in Landisville are 7:30 AM to 7:59 AM (174, 37.3%) for males and 6:30 AM to 6:59 AM (181, 44.8%) for females.
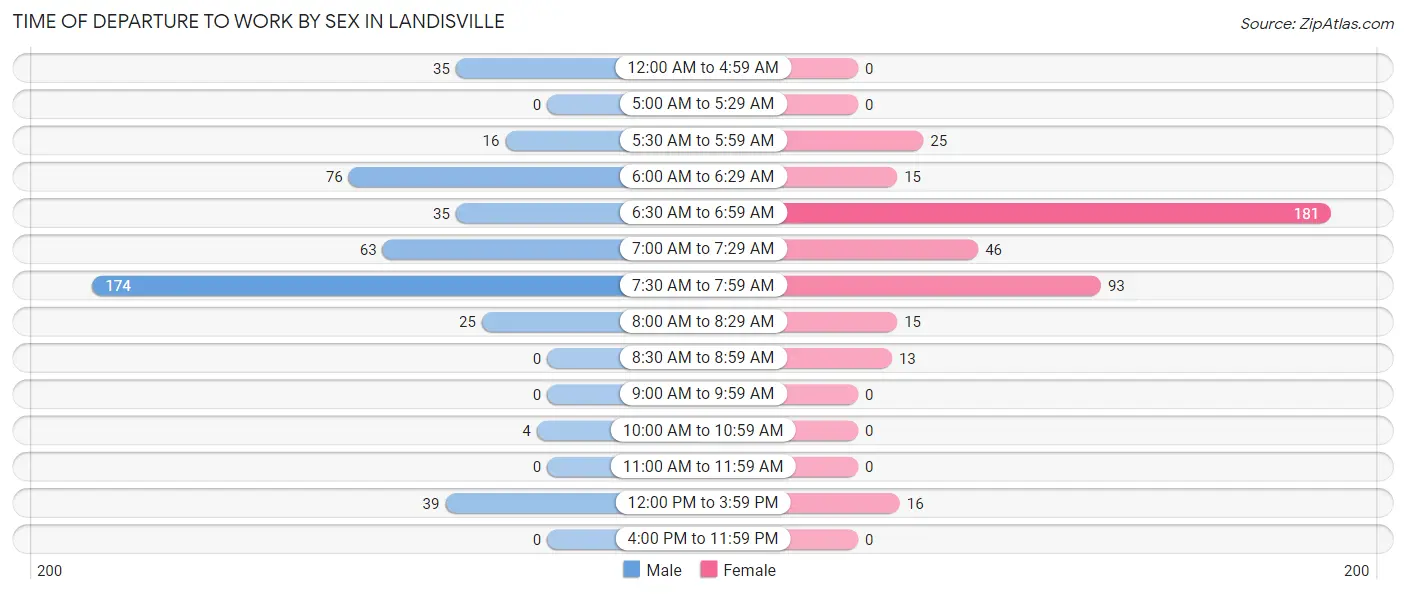
| Time of Departure | Male | Female |
| 12:00 AM to 4:59 AM | 35 (7.5%) | 0 (0.0%) |
| 5:00 AM to 5:29 AM | 0 (0.0%) | 0 (0.0%) |
| 5:30 AM to 5:59 AM | 16 (3.4%) | 25 (6.2%) |
| 6:00 AM to 6:29 AM | 76 (16.3%) | 15 (3.7%) |
| 6:30 AM to 6:59 AM | 35 (7.5%) | 181 (44.8%) |
| 7:00 AM to 7:29 AM | 63 (13.5%) | 46 (11.4%) |
| 7:30 AM to 7:59 AM | 174 (37.3%) | 93 (23.0%) |
| 8:00 AM to 8:29 AM | 25 (5.3%) | 15 (3.7%) |
| 8:30 AM to 8:59 AM | 0 (0.0%) | 13 (3.2%) |
| 9:00 AM to 9:59 AM | 0 (0.0%) | 0 (0.0%) |
| 10:00 AM to 10:59 AM | 4 (0.9%) | 0 (0.0%) |
| 11:00 AM to 11:59 AM | 0 (0.0%) | 0 (0.0%) |
| 12:00 PM to 3:59 PM | 39 (8.4%) | 16 (4.0%) |
| 4:00 PM to 11:59 PM | 0 (0.0%) | 0 (0.0%) |
| Total | 467 (100.0%) | 404 (100.0%) |
Housing Occupancy in Landisville
Occupancy by Ownership in Landisville
Of the total 1,093 dwellings in Landisville, owner-occupied units account for 974 (89.1%), while renter-occupied units make up 119 (10.9%).
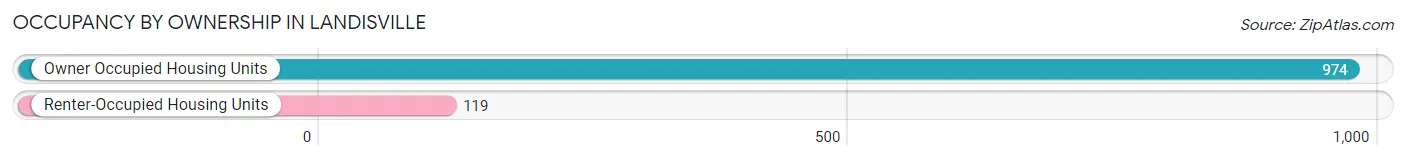
| Occupancy | # Housing Units | % Housing Units |
| Owner Occupied Housing Units | 974 | 89.1% |
| Renter-Occupied Housing Units | 119 | 10.9% |
| Total Occupied Housing Units | 1,093 | 100.0% |
Occupancy by Household Size in Landisville
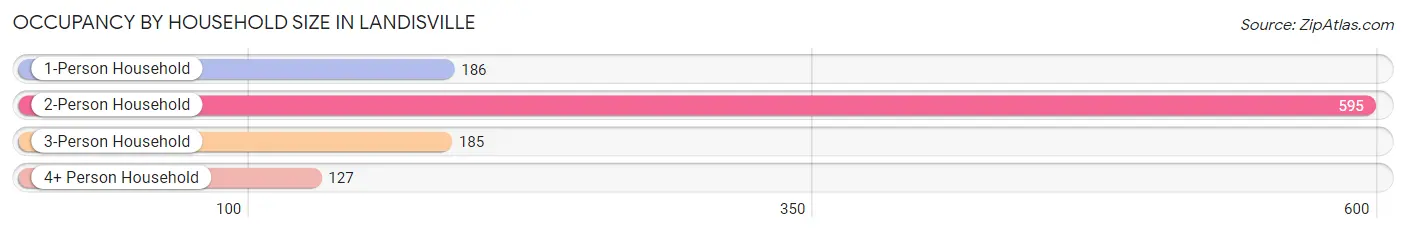
| Household Size | # Housing Units | % Housing Units |
| 1-Person Household | 186 | 17.0% |
| 2-Person Household | 595 | 54.4% |
| 3-Person Household | 185 | 16.9% |
| 4+ Person Household | 127 | 11.6% |
| Total Housing Units | 1,093 | 100.0% |
Occupancy by Ownership by Household Size in Landisville
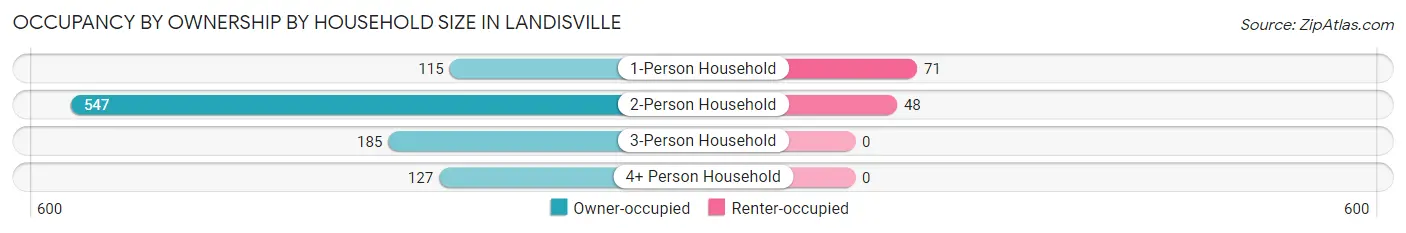
| Household Size | Owner-occupied | Renter-occupied |
| 1-Person Household | 115 (61.8%) | 71 (38.2%) |
| 2-Person Household | 547 (91.9%) | 48 (8.1%) |
| 3-Person Household | 185 (100.0%) | 0 (0.0%) |
| 4+ Person Household | 127 (100.0%) | 0 (0.0%) |
| Total Housing Units | 974 (89.1%) | 119 (10.9%) |
Occupancy by Educational Attainment in Landisville
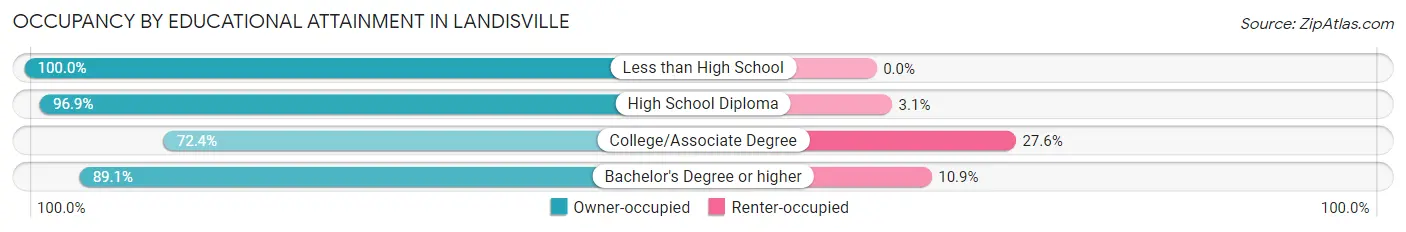
| Household Size | Owner-occupied | Renter-occupied |
| Less than High School | 20 (100.0%) | 0 (0.0%) |
| High School Diploma | 411 (96.9%) | 13 (3.1%) |
| College/Associate Degree | 152 (72.4%) | 58 (27.6%) |
| Bachelor's Degree or higher | 391 (89.1%) | 48 (10.9%) |
Occupancy by Age of Householder in Landisville
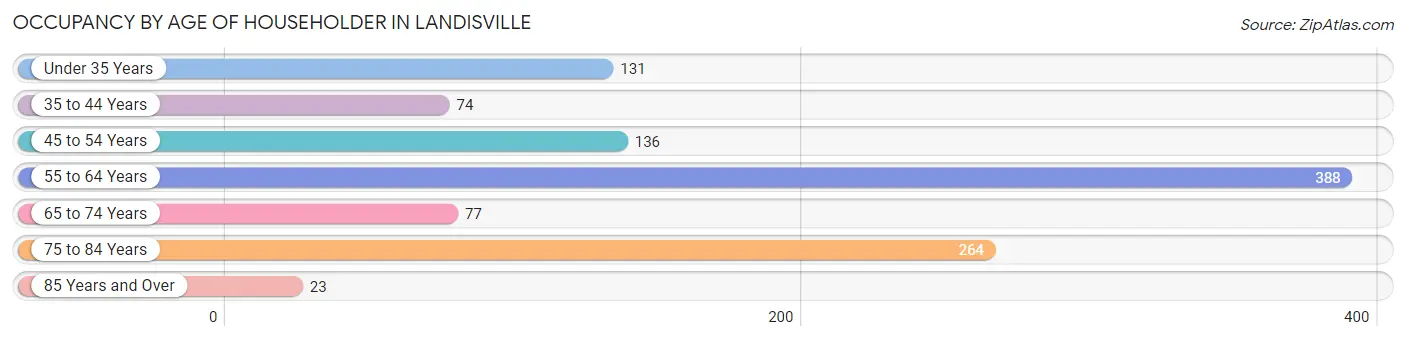
| Age Bracket | # Households | % Households |
| Under 35 Years | 131 | 12.0% |
| 35 to 44 Years | 74 | 6.8% |
| 45 to 54 Years | 136 | 12.4% |
| 55 to 64 Years | 388 | 35.5% |
| 65 to 74 Years | 77 | 7.0% |
| 75 to 84 Years | 264 | 24.1% |
| 85 Years and Over | 23 | 2.1% |
| Total | 1,093 | 100.0% |
Housing Finances in Landisville
Median Income by Occupancy in Landisville
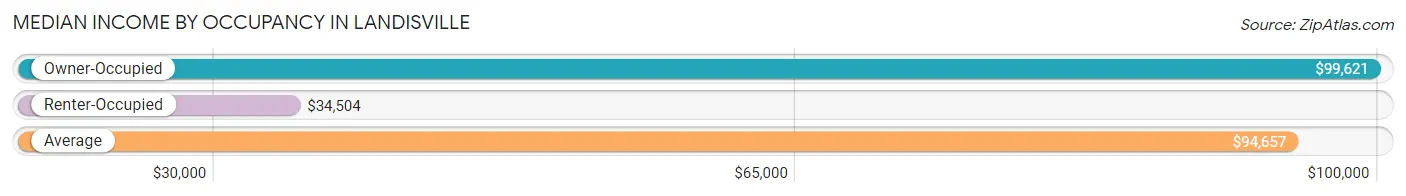
| Occupancy Type | # Households | Median Income |
| Owner-Occupied | 974 (89.1%) | $99,621 |
| Renter-Occupied | 119 (10.9%) | $34,504 |
| Average | 1,093 (100.0%) | $94,657 |
Occupancy by Householder Income Bracket in Landisville
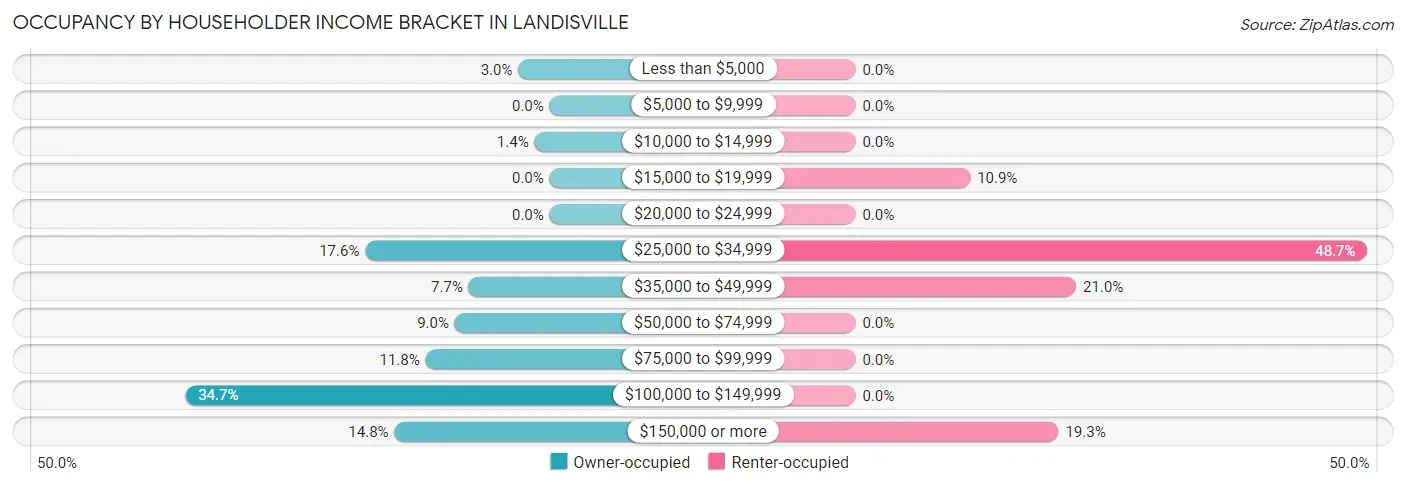
| Income Bracket | Owner-occupied | Renter-occupied |
| Less than $5,000 | 29 (3.0%) | 0 (0.0%) |
| $5,000 to $9,999 | 0 (0.0%) | 0 (0.0%) |
| $10,000 to $14,999 | 14 (1.4%) | 0 (0.0%) |
| $15,000 to $19,999 | 0 (0.0%) | 13 (10.9%) |
| $20,000 to $24,999 | 0 (0.0%) | 0 (0.0%) |
| $25,000 to $34,999 | 171 (17.6%) | 58 (48.7%) |
| $35,000 to $49,999 | 75 (7.7%) | 25 (21.0%) |
| $50,000 to $74,999 | 88 (9.0%) | 0 (0.0%) |
| $75,000 to $99,999 | 115 (11.8%) | 0 (0.0%) |
| $100,000 to $149,999 | 338 (34.7%) | 0 (0.0%) |
| $150,000 or more | 144 (14.8%) | 23 (19.3%) |
| Total | 974 (100.0%) | 119 (100.0%) |
Monthly Housing Cost Tiers in Landisville
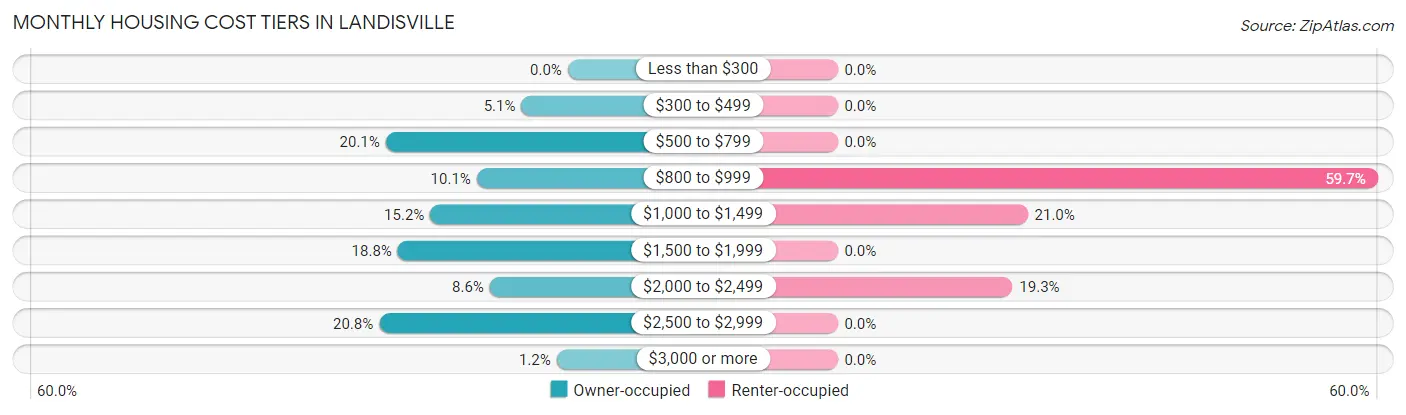
| Monthly Cost | Owner-occupied | Renter-occupied |
| Less than $300 | 0 (0.0%) | 0 (0.0%) |
| $300 to $499 | 50 (5.1%) | 0 (0.0%) |
| $500 to $799 | 196 (20.1%) | 0 (0.0%) |
| $800 to $999 | 98 (10.1%) | 71 (59.7%) |
| $1,000 to $1,499 | 148 (15.2%) | 25 (21.0%) |
| $1,500 to $1,999 | 183 (18.8%) | 0 (0.0%) |
| $2,000 to $2,499 | 84 (8.6%) | 23 (19.3%) |
| $2,500 to $2,999 | 203 (20.8%) | 0 (0.0%) |
| $3,000 or more | 12 (1.2%) | 0 (0.0%) |
| Total | 974 (100.0%) | 119 (100.0%) |
Physical Housing Characteristics in Landisville
Housing Structures in Landisville
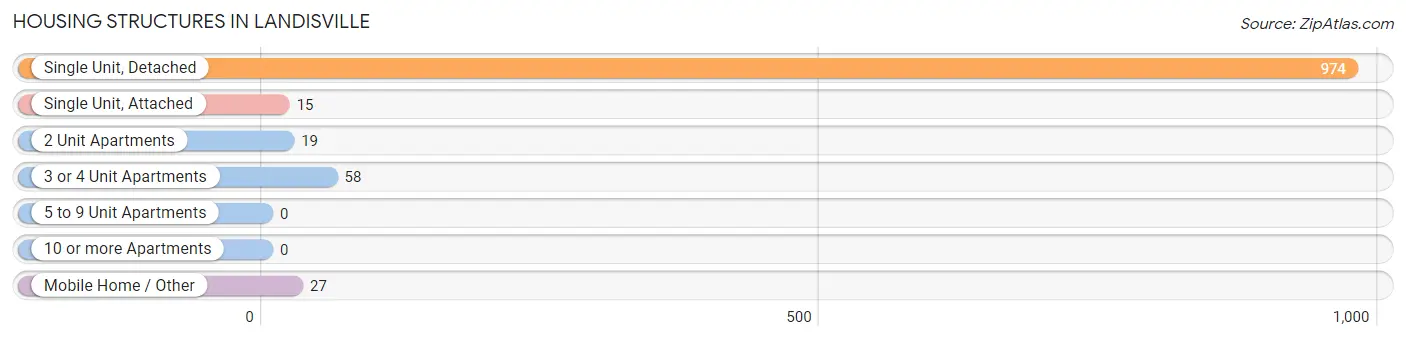
| Structure Type | # Housing Units | % Housing Units |
| Single Unit, Detached | 974 | 89.1% |
| Single Unit, Attached | 15 | 1.4% |
| 2 Unit Apartments | 19 | 1.7% |
| 3 or 4 Unit Apartments | 58 | 5.3% |
| 5 to 9 Unit Apartments | 0 | 0.0% |
| 10 or more Apartments | 0 | 0.0% |
| Mobile Home / Other | 27 | 2.5% |
| Total | 1,093 | 100.0% |
Housing Structures by Occupancy in Landisville
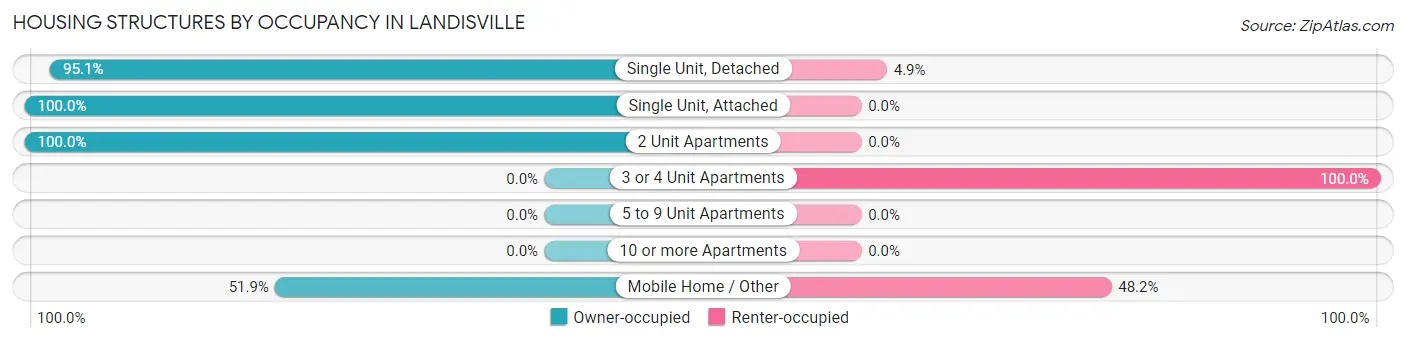
| Structure Type | Owner-occupied | Renter-occupied |
| Single Unit, Detached | 926 (95.1%) | 48 (4.9%) |
| Single Unit, Attached | 15 (100.0%) | 0 (0.0%) |
| 2 Unit Apartments | 19 (100.0%) | 0 (0.0%) |
| 3 or 4 Unit Apartments | 0 (0.0%) | 58 (100.0%) |
| 5 to 9 Unit Apartments | 0 (0.0%) | 0 (0.0%) |
| 10 or more Apartments | 0 (0.0%) | 0 (0.0%) |
| Mobile Home / Other | 14 (51.8%) | 13 (48.1%) |
| Total | 974 (89.1%) | 119 (10.9%) |
Housing Structures by Number of Rooms in Landisville
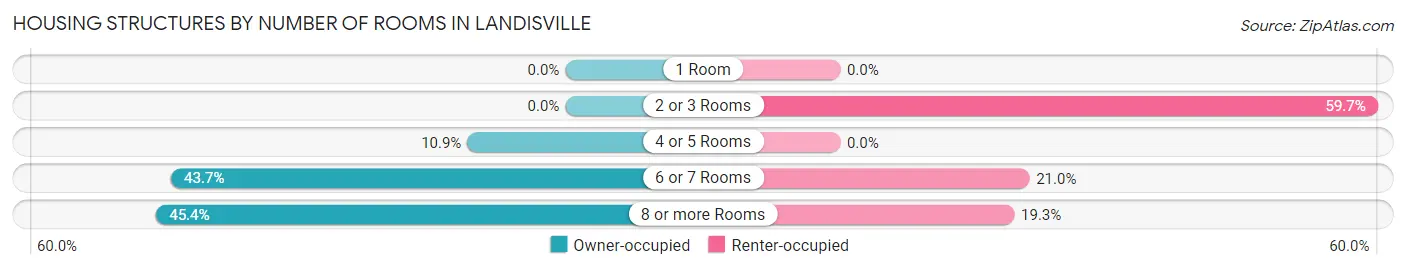
| Number of Rooms | Owner-occupied | Renter-occupied |
| 1 Room | 0 (0.0%) | 0 (0.0%) |
| 2 or 3 Rooms | 0 (0.0%) | 71 (59.7%) |
| 4 or 5 Rooms | 106 (10.9%) | 0 (0.0%) |
| 6 or 7 Rooms | 426 (43.7%) | 25 (21.0%) |
| 8 or more Rooms | 442 (45.4%) | 23 (19.3%) |
| Total | 974 (100.0%) | 119 (100.0%) |
Housing Structure by Heating Type in Landisville
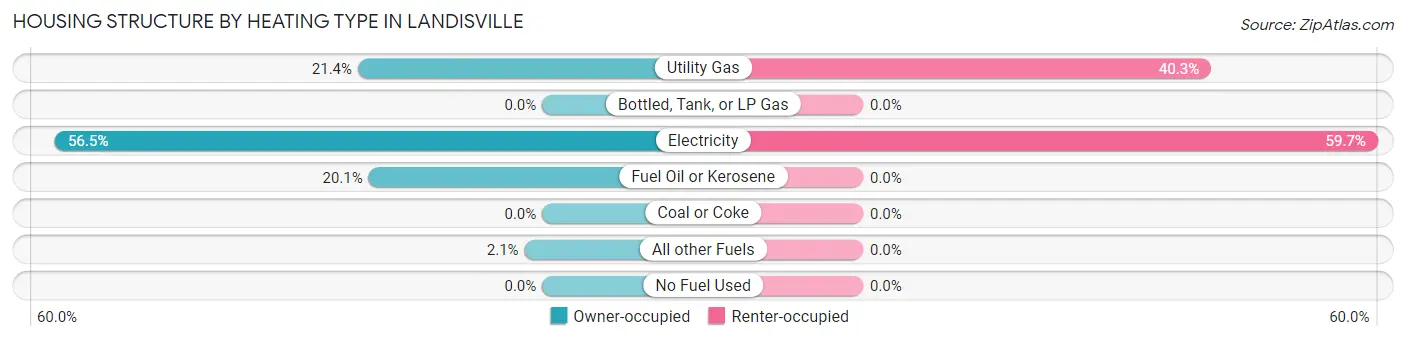
| Heating Type | Owner-occupied | Renter-occupied |
| Utility Gas | 208 (21.4%) | 48 (40.3%) |
| Bottled, Tank, or LP Gas | 0 (0.0%) | 0 (0.0%) |
| Electricity | 550 (56.5%) | 71 (59.7%) |
| Fuel Oil or Kerosene | 196 (20.1%) | 0 (0.0%) |
| Coal or Coke | 0 (0.0%) | 0 (0.0%) |
| All other Fuels | 20 (2.1%) | 0 (0.0%) |
| No Fuel Used | 0 (0.0%) | 0 (0.0%) |
| Total | 974 (100.0%) | 119 (100.0%) |
Household Vehicle Usage in Landisville
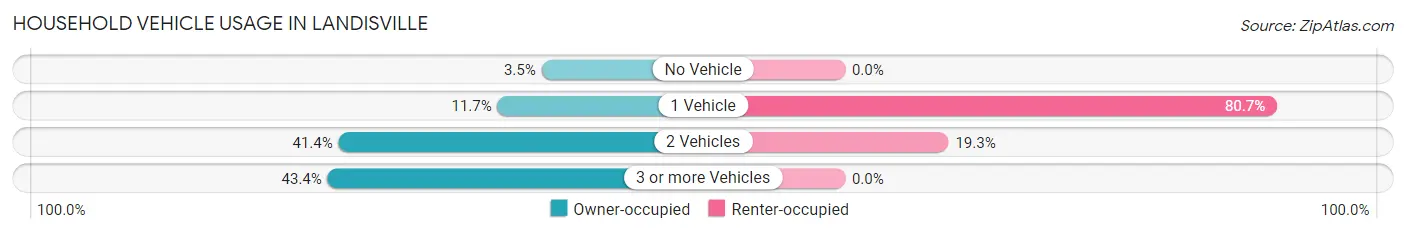
| Vehicles per Household | Owner-occupied | Renter-occupied |
| No Vehicle | 34 (3.5%) | 0 (0.0%) |
| 1 Vehicle | 114 (11.7%) | 96 (80.7%) |
| 2 Vehicles | 403 (41.4%) | 23 (19.3%) |
| 3 or more Vehicles | 423 (43.4%) | 0 (0.0%) |
| Total | 974 (100.0%) | 119 (100.0%) |
Real Estate & Mortgages in Landisville
Real Estate and Mortgage Overview in Landisville
| Characteristic | Without Mortgage | With Mortgage |
| Housing Units | 214 | 760 |
| Median Property Value | $286,800 | $251,100 |
| Median Household Income | $103,158 | $88 |
| Monthly Housing Costs | $846 | $12 |
| Real Estate Taxes | $4,000 | $0 |
Property Value by Mortgage Status in Landisville
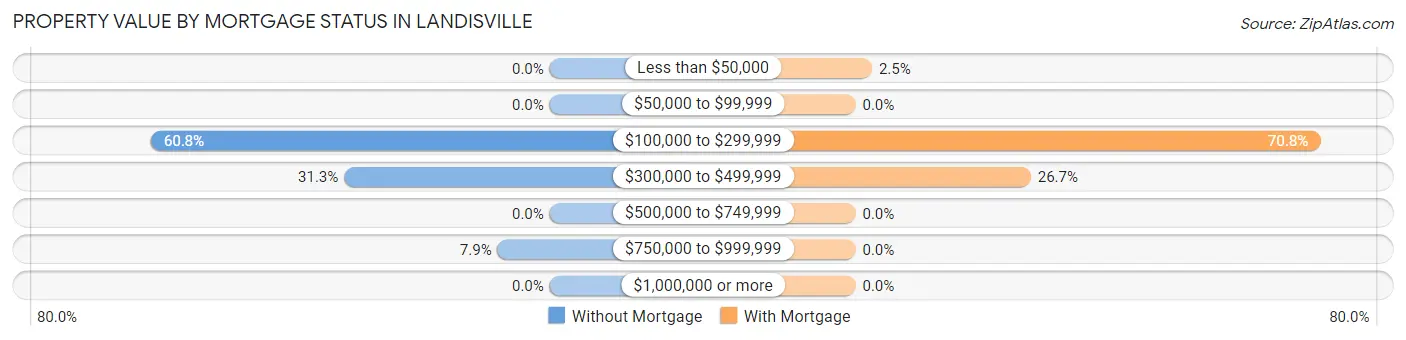
| Property Value | Without Mortgage | With Mortgage |
| Less than $50,000 | 0 (0.0%) | 19 (2.5%) |
| $50,000 to $99,999 | 0 (0.0%) | 0 (0.0%) |
| $100,000 to $299,999 | 130 (60.8%) | 538 (70.8%) |
| $300,000 to $499,999 | 67 (31.3%) | 203 (26.7%) |
| $500,000 to $749,999 | 0 (0.0%) | 0 (0.0%) |
| $750,000 to $999,999 | 17 (7.9%) | 0 (0.0%) |
| $1,000,000 or more | 0 (0.0%) | 0 (0.0%) |
| Total | 214 (100.0%) | 760 (100.0%) |
Household Income by Mortgage Status in Landisville
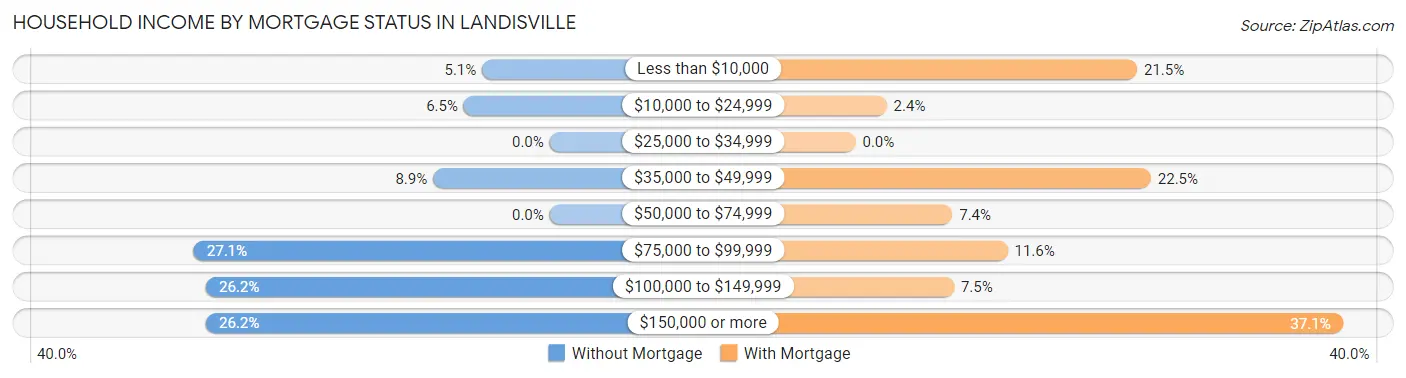
| Household Income | Without Mortgage | With Mortgage |
| Less than $10,000 | 11 (5.1%) | 163 (21.4%) |
| $10,000 to $24,999 | 14 (6.5%) | 18 (2.4%) |
| $25,000 to $34,999 | 0 (0.0%) | 0 (0.0%) |
| $35,000 to $49,999 | 19 (8.9%) | 171 (22.5%) |
| $50,000 to $74,999 | 0 (0.0%) | 56 (7.4%) |
| $75,000 to $99,999 | 58 (27.1%) | 88 (11.6%) |
| $100,000 to $149,999 | 56 (26.2%) | 57 (7.5%) |
| $150,000 or more | 56 (26.2%) | 282 (37.1%) |
| Total | 214 (100.0%) | 760 (100.0%) |
Property Value to Household Income Ratio in Landisville
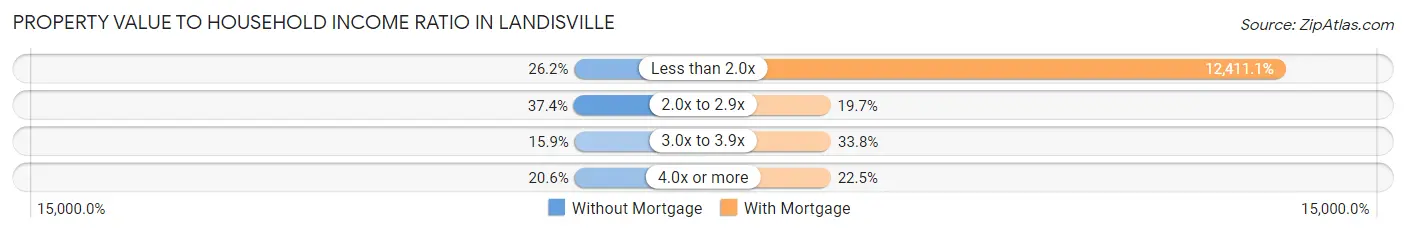
| Value-to-Income Ratio | Without Mortgage | With Mortgage |
| Less than 2.0x | 56 (26.2%) | 94,324 (12,411.1%) |
| 2.0x to 2.9x | 80 (37.4%) | 150 (19.7%) |
| 3.0x to 3.9x | 34 (15.9%) | 257 (33.8%) |
| 4.0x or more | 44 (20.6%) | 171 (22.5%) |
| Total | 214 (100.0%) | 760 (100.0%) |
Real Estate Taxes by Mortgage Status in Landisville

| Property Taxes | Without Mortgage | With Mortgage |
| Less than $800 | 0 (0.0%) | 0 (0.0%) |
| $800 to $1,499 | 0 (0.0%) | 37 (4.9%) |
| $800 to $1,499 | 214 (100.0%) | 18 (2.4%) |
| Total | 214 (100.0%) | 760 (100.0%) |
Health & Disability in Landisville
Health Insurance Coverage by Age in Landisville
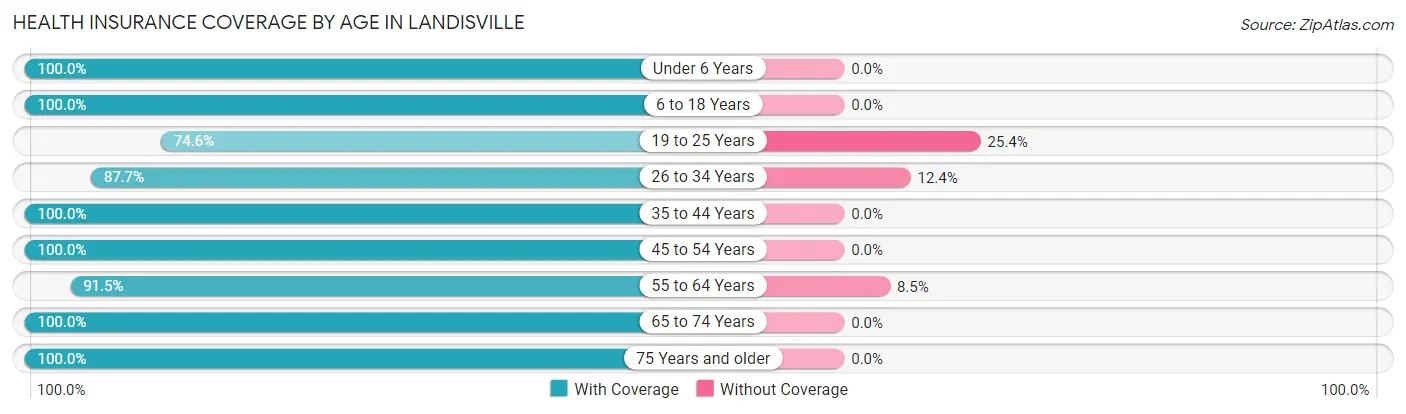
| Age Bracket | With Coverage | Without Coverage |
| Under 6 Years | 99 (100.0%) | 0 (0.0%) |
| 6 to 18 Years | 252 (100.0%) | 0 (0.0%) |
| 19 to 25 Years | 132 (74.6%) | 45 (25.4%) |
| 26 to 34 Years | 298 (87.6%) | 42 (12.3%) |
| 35 to 44 Years | 136 (100.0%) | 0 (0.0%) |
| 45 to 54 Years | 262 (100.0%) | 0 (0.0%) |
| 55 to 64 Years | 634 (91.5%) | 59 (8.5%) |
| 65 to 74 Years | 156 (100.0%) | 0 (0.0%) |
| 75 Years and older | 498 (100.0%) | 0 (0.0%) |
| Total | 2,467 (94.4%) | 146 (5.6%) |
Health Insurance Coverage by Citizenship Status in Landisville

| Citizenship Status | With Coverage | Without Coverage |
| Native Born | 99 (100.0%) | 0 (0.0%) |
| Foreign Born, Citizen | 252 (100.0%) | 0 (0.0%) |
| Foreign Born, not a Citizen | 132 (74.6%) | 45 (25.4%) |
Health Insurance Coverage by Household Income in Landisville
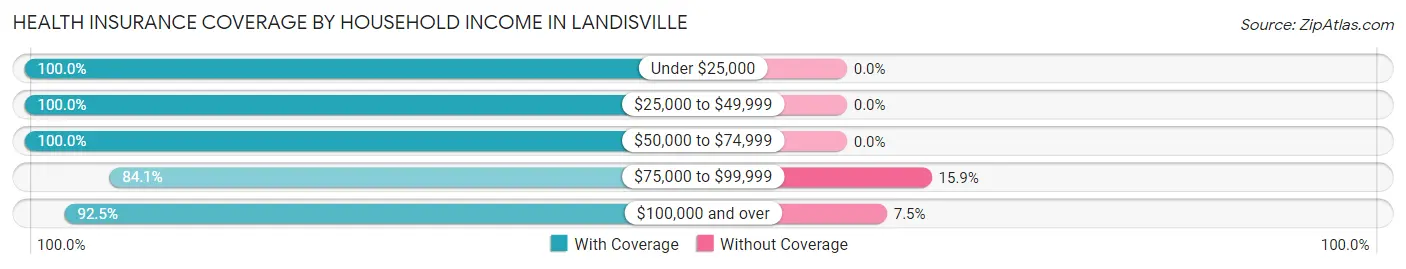
| Household Income | With Coverage | Without Coverage |
| Under $25,000 | 64 (100.0%) | 0 (0.0%) |
| $25,000 to $49,999 | 626 (100.0%) | 0 (0.0%) |
| $50,000 to $74,999 | 259 (100.0%) | 0 (0.0%) |
| $75,000 to $99,999 | 217 (84.1%) | 41 (15.9%) |
| $100,000 and over | 1,297 (92.5%) | 105 (7.5%) |
Public vs Private Health Insurance Coverage by Age in Landisville
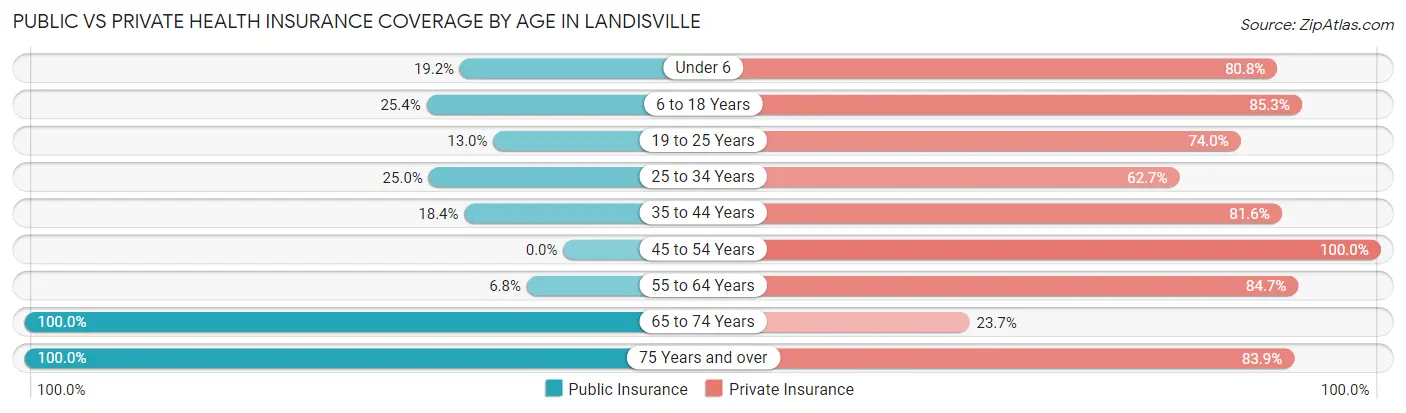
| Age Bracket | Public Insurance | Private Insurance |
| Under 6 | 19 (19.2%) | 80 (80.8%) |
| 6 to 18 Years | 64 (25.4%) | 215 (85.3%) |
| 19 to 25 Years | 23 (13.0%) | 131 (74.0%) |
| 25 to 34 Years | 85 (25.0%) | 213 (62.6%) |
| 35 to 44 Years | 25 (18.4%) | 111 (81.6%) |
| 45 to 54 Years | 0 (0.0%) | 262 (100.0%) |
| 55 to 64 Years | 47 (6.8%) | 587 (84.7%) |
| 65 to 74 Years | 156 (100.0%) | 37 (23.7%) |
| 75 Years and over | 498 (100.0%) | 418 (83.9%) |
| Total | 917 (35.1%) | 2,054 (78.6%) |
Disability Status by Sex by Age in Landisville
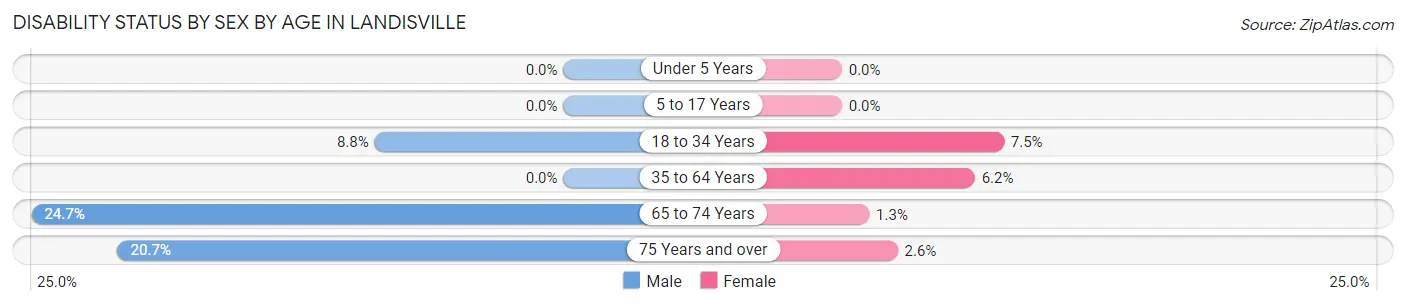
| Age Bracket | Male | Female |
| Under 5 Years | 0 (0.0%) | 0 (0.0%) |
| 5 to 17 Years | 0 (0.0%) | 0 (0.0%) |
| 18 to 34 Years | 22 (8.8%) | 20 (7.5%) |
| 35 to 64 Years | 0 (0.0%) | 35 (6.2%) |
| 65 to 74 Years | 19 (24.7%) | 1 (1.3%) |
| 75 Years and over | 55 (20.7%) | 6 (2.6%) |
Disability Class by Sex by Age in Landisville
Disability Class: Hearing Difficulty
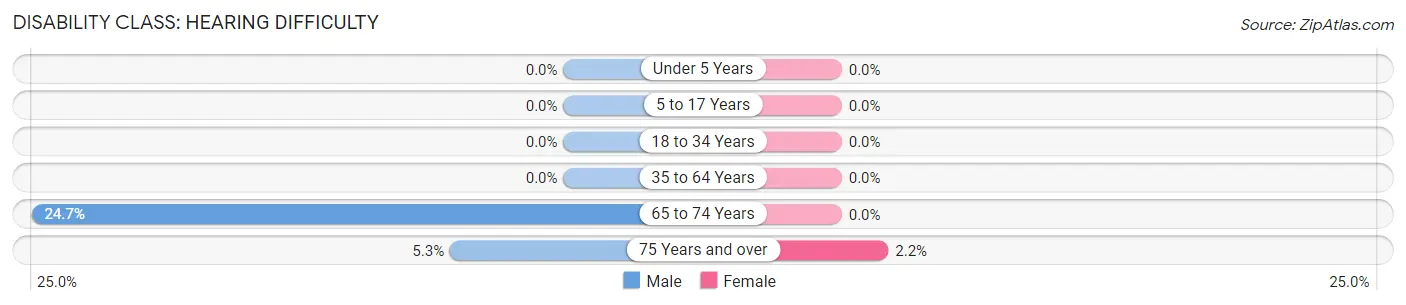
| Age Bracket | Male | Female |
| Under 5 Years | 0 (0.0%) | 0 (0.0%) |
| 5 to 17 Years | 0 (0.0%) | 0 (0.0%) |
| 18 to 34 Years | 0 (0.0%) | 0 (0.0%) |
| 35 to 64 Years | 0 (0.0%) | 0 (0.0%) |
| 65 to 74 Years | 19 (24.7%) | 0 (0.0%) |
| 75 Years and over | 14 (5.3%) | 5 (2.2%) |
Disability Class: Vision Difficulty
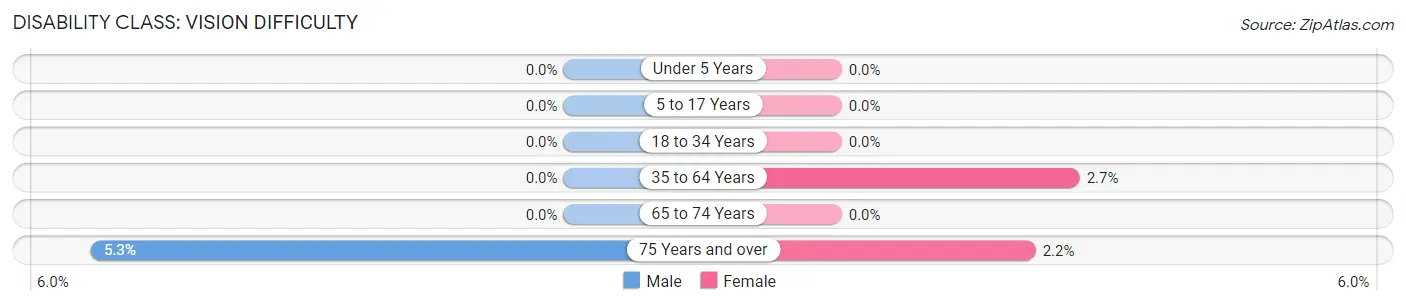
| Age Bracket | Male | Female |
| Under 5 Years | 0 (0.0%) | 0 (0.0%) |
| 5 to 17 Years | 0 (0.0%) | 0 (0.0%) |
| 18 to 34 Years | 0 (0.0%) | 0 (0.0%) |
| 35 to 64 Years | 0 (0.0%) | 15 (2.6%) |
| 65 to 74 Years | 0 (0.0%) | 0 (0.0%) |
| 75 Years and over | 14 (5.3%) | 5 (2.2%) |
Disability Class: Cognitive Difficulty
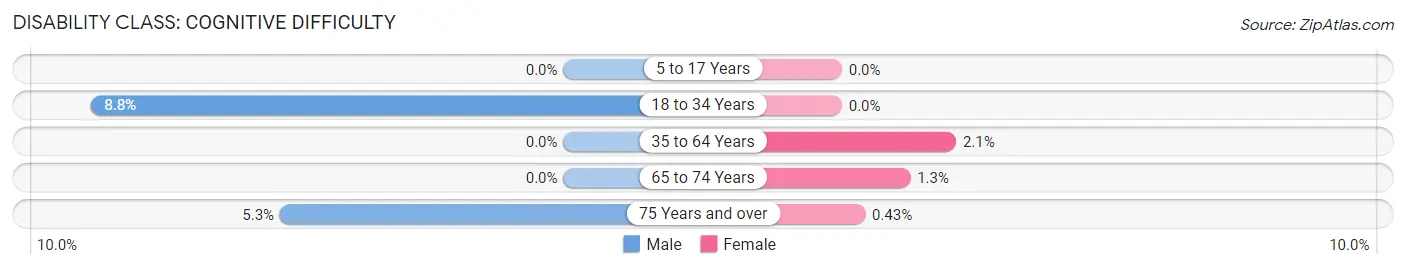
| Age Bracket | Male | Female |
| 5 to 17 Years | 0 (0.0%) | 0 (0.0%) |
| 18 to 34 Years | 22 (8.8%) | 0 (0.0%) |
| 35 to 64 Years | 0 (0.0%) | 12 (2.1%) |
| 65 to 74 Years | 0 (0.0%) | 1 (1.3%) |
| 75 Years and over | 14 (5.3%) | 1 (0.4%) |
Disability Class: Ambulatory Difficulty
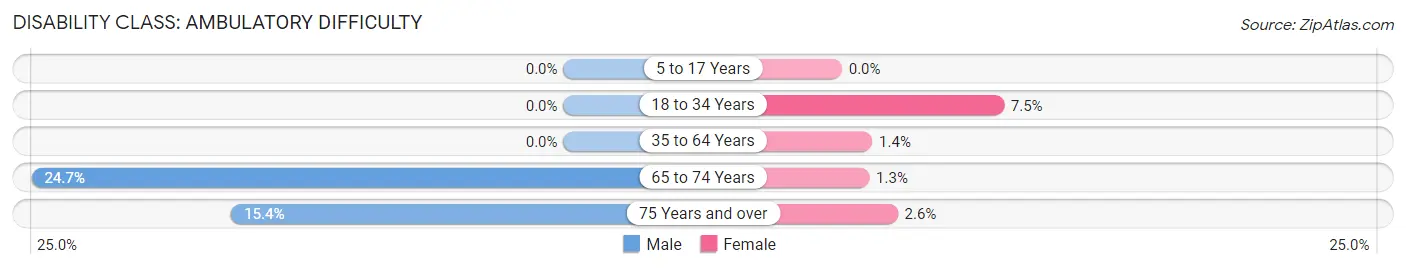
| Age Bracket | Male | Female |
| 5 to 17 Years | 0 (0.0%) | 0 (0.0%) |
| 18 to 34 Years | 0 (0.0%) | 20 (7.5%) |
| 35 to 64 Years | 0 (0.0%) | 8 (1.4%) |
| 65 to 74 Years | 19 (24.7%) | 1 (1.3%) |
| 75 Years and over | 41 (15.4%) | 6 (2.6%) |
Disability Class: Self-Care Difficulty
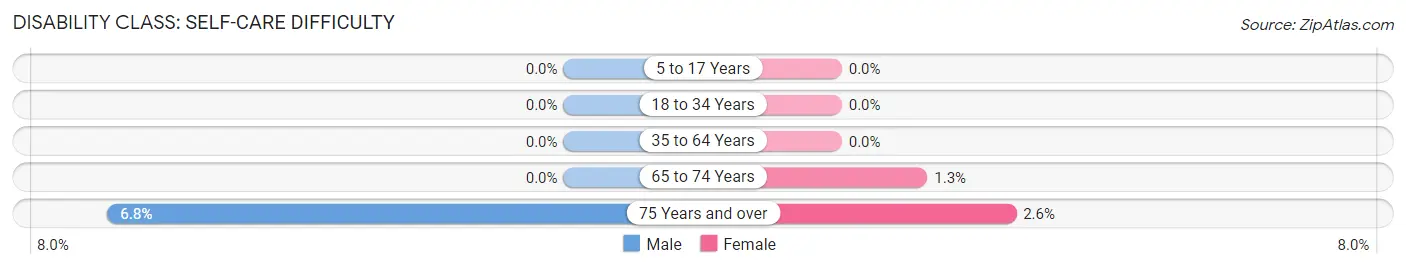
| Age Bracket | Male | Female |
| 5 to 17 Years | 0 (0.0%) | 0 (0.0%) |
| 18 to 34 Years | 0 (0.0%) | 0 (0.0%) |
| 35 to 64 Years | 0 (0.0%) | 0 (0.0%) |
| 65 to 74 Years | 0 (0.0%) | 1 (1.3%) |
| 75 Years and over | 18 (6.8%) | 6 (2.6%) |
Technology Access in Landisville
Computing Device Access in Landisville
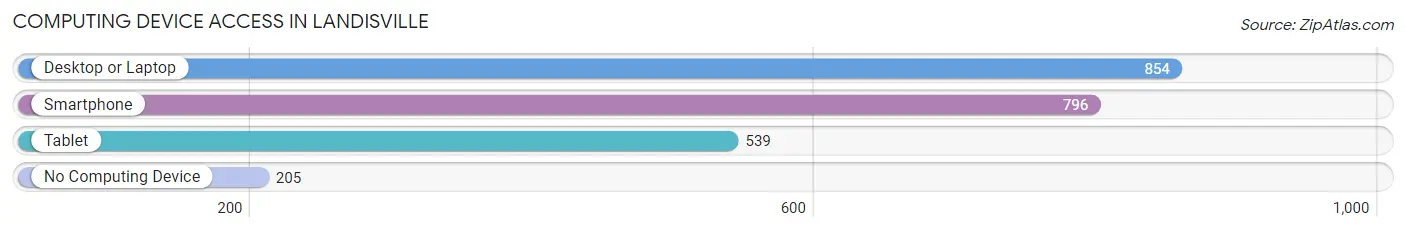
| Device Type | # Households | % Households |
| Desktop or Laptop | 854 | 78.1% |
| Smartphone | 796 | 72.8% |
| Tablet | 539 | 49.3% |
| No Computing Device | 205 | 18.8% |
| Total | 1,093 | 100.0% |
Internet Access in Landisville
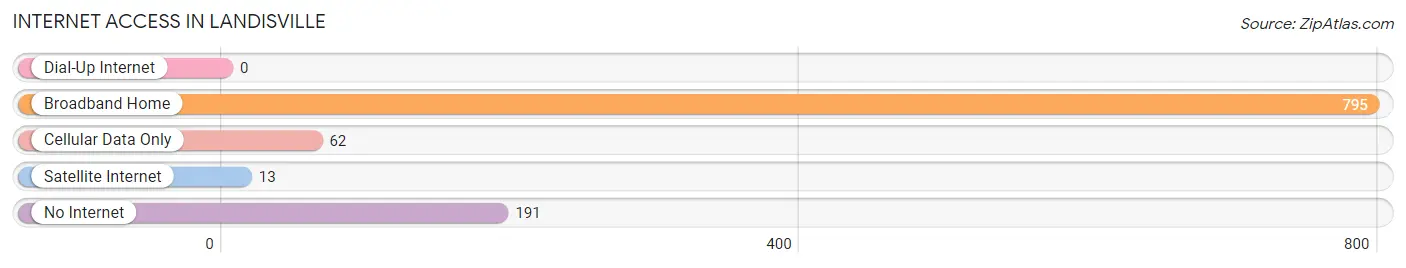
| Internet Type | # Households | % Households |
| Dial-Up Internet | 0 | 0.0% |
| Broadband Home | 795 | 72.7% |
| Cellular Data Only | 62 | 5.7% |
| Satellite Internet | 13 | 1.2% |
| No Internet | 191 | 17.5% |
| Total | 1,093 | 100.0% |
Landisville Summary
Landisville, Pennsylvania is a small borough located in Lancaster County. It is situated in the southeastern corner of the county, just south of the city of Lancaster. The population of Landisville was 2,845 as of the 2010 census.
Geography
Landisville is located at 40°1'45" North, 76°17'45" West (40.02917, -76.29583). It is situated in the southeastern corner of Lancaster County, just south of the city of Lancaster. The borough is bordered by East Hempfield Township to the north, West Hempfield Township to the east, and Manor Township to the south and west. The borough is located in the Conestoga Valley, a region of rolling hills and farmland. The Conestoga River flows through the borough, and is a popular destination for fishing and canoeing.
History
Landisville was founded in 1790 by John Landis, a German immigrant. The borough was originally known as Landis' Mill, and was a small farming community. In 1845, the borough was officially incorporated as Landisville. The borough grew slowly over the years, and by the early 20th century, it had become a popular summer resort destination. The borough was home to several resorts, including the Landisville Hotel, which was built in 1891.
Economy
Landisville is a small, rural community, and the economy is largely based on agriculture. The borough is home to several farms, and the surrounding area is known for its production of corn, wheat, and other crops. The borough is also home to several small businesses, including restaurants, shops, and other services.
Demographics
As of the 2010 census, the population of Landisville was 2,845. The racial makeup of the borough was 94.3% White, 1.2% African American, 0.2% Native American, 0.7% Asian, 0.1% Pacific Islander, 1.7% from other races, and 1.9% from two or more races. Hispanic or Latino of any race were 4.2% of the population.
The median household income in Landisville was $50,938, and the median family income was $60,938. The per capita income for the borough was $25,938. About 4.2% of families and 5.7% of the population were below the poverty line, including 8.2% of those under age 18 and 4.2% of those age 65 or over.
Landisville is served by the Hempfield School District. The borough is home to one elementary school, Landisville Elementary School, and one middle school, Landisville Middle School. The borough is also home to several churches, including the Landisville United Methodist Church, the Landisville Presbyterian Church, and the Landisville Bible Church.
Common Questions
What is Per Capita Income in Landisville?
Per Capita income in Landisville is $49,781.
What is the Median Family Income in Landisville?
Median Family Income in Landisville is $104,527.
What is the Median Household income in Landisville?
Median Household Income in Landisville is $94,657.
What is Income or Wage Gap in Landisville?
Income or Wage Gap in Landisville is 8.3%.
Women in Landisville earn 91.7 cents for every dollar earned by a man.
What is Inequality or Gini Index in Landisville?
Inequality or Gini Index in Landisville is 0.47.
What is the Total Population of Landisville?
Total Population of Landisville is 2,613.
What is the Total Male Population of Landisville?
Total Male Population of Landisville is 1,212.
What is the Total Female Population of Landisville?
Total Female Population of Landisville is 1,401.
What is the Ratio of Males per 100 Females in Landisville?
There are 86.51 Males per 100 Females in Landisville.
What is the Ratio of Females per 100 Males in Landisville?
There are 115.59 Females per 100 Males in Landisville.
What is the Median Population Age in Landisville?
Median Population Age in Landisville is 55.5 Years.
What is the Average Family Size in Landisville
Average Family Size in Landisville is 2.6 People.
What is the Average Household Size in Landisville
Average Household Size in Landisville is 2.4 People.
How Large is the Labor Force in Landisville?
There are 1,377 People in the Labor Forcein in Landisville.
What is the Percentage of People in the Labor Force in Landisville?
59.5% of People are in the Labor Force in Landisville.
What is the Unemployment Rate in Landisville?
Unemployment Rate in Landisville is 4.7%.