Stanford, CA Map & Demographics
Stanford Map
Stanford Overview
$40,495
PER CAPITA INCOME
$234,625
AVG FAMILY INCOME
$69,631
AVG HOUSEHOLD INCOME
56.0%
WAGE / INCOME GAP [ % ]
44.0¢/ $1
WAGE / INCOME GAP [ $ ]
0.62
INEQUALITY / GINI INDEX
17,255
TOTAL POPULATION
8,384
MALE POPULATION
8,871
FEMALE POPULATION
94.51
MALES / 100 FEMALES
105.81
FEMALES / 100 MALES
22.1
MEDIAN AGE
2.9
AVG FAMILY SIZE
2.0
AVG HOUSEHOLD SIZE
8,044
LABOR FORCE [ PEOPLE ]
49.0%
PERCENT IN LABOR FORCE
6.1%
UNEMPLOYMENT RATE
Stanford Zip Codes
Stanford Area Codes
Income in Stanford
Income Overview in Stanford
Per Capita Income in Stanford is $40,495, while median incomes of families and households are $234,625 and $69,631 respectively.
| Characteristic | Number | Measure |
| Per Capita Income | 17,255 | $40,495 |
| Median Family Income | 1,219 | $234,625 |
| Mean Family Income | 1,219 | $305,631 |
| Median Household Income | 3,629 | $69,631 |
| Mean Household Income | 3,629 | $155,195 |
| Income Deficit | 1,219 | $0 |
| Wage / Income Gap (%) | 17,255 | 55.97% |
| Wage / Income Gap ($) | 17,255 | 44.03¢ per $1 |
| Gini / Inequality Index | 17,255 | 0.62 |
Earnings by Sex in Stanford
Average Earnings in Stanford are $13,937, $21,950 for men and $9,665 for women, a difference of 56.0%.
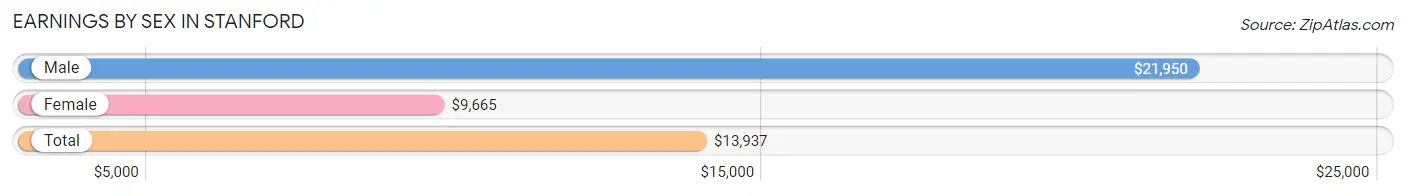
| Sex | Number | Average Earnings |
| Male | 5,641 (49.1%) | $21,950 |
| Female | 5,844 (50.9%) | $9,665 |
| Total | 11,485 (100.0%) | $13,937 |
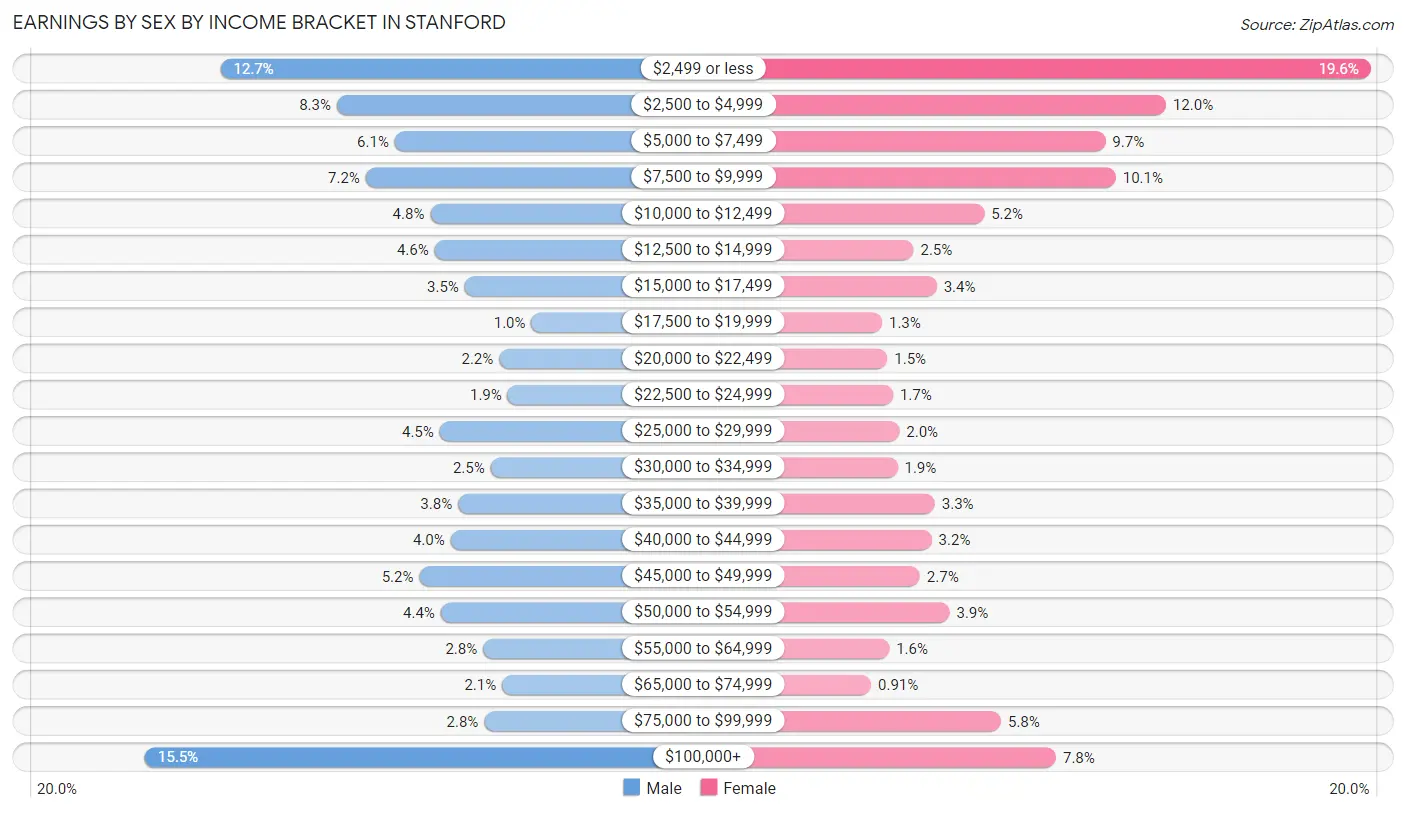
Earnings by Sex by Income Bracket in Stanford
The most common earnings brackets in Stanford are $100,000+ for men (874 | 15.5%) and $2,499 or less for women (1,147 | 19.6%).
| Income | Male | Female |
| $2,499 or less | 714 (12.7%) | 1,147 (19.6%) |
| $2,500 to $4,999 | 468 (8.3%) | 699 (12.0%) |
| $5,000 to $7,499 | 346 (6.1%) | 566 (9.7%) |
| $7,500 to $9,999 | 407 (7.2%) | 589 (10.1%) |
| $10,000 to $12,499 | 271 (4.8%) | 301 (5.1%) |
| $12,500 to $14,999 | 262 (4.6%) | 146 (2.5%) |
| $15,000 to $17,499 | 198 (3.5%) | 197 (3.4%) |
| $17,500 to $19,999 | 57 (1.0%) | 77 (1.3%) |
| $20,000 to $22,499 | 125 (2.2%) | 89 (1.5%) |
| $22,500 to $24,999 | 107 (1.9%) | 101 (1.7%) |
| $25,000 to $29,999 | 251 (4.4%) | 115 (2.0%) |
| $30,000 to $34,999 | 143 (2.5%) | 111 (1.9%) |
| $35,000 to $39,999 | 212 (3.8%) | 193 (3.3%) |
| $40,000 to $44,999 | 228 (4.0%) | 186 (3.2%) |
| $45,000 to $49,999 | 294 (5.2%) | 160 (2.7%) |
| $50,000 to $54,999 | 249 (4.4%) | 225 (3.8%) |
| $55,000 to $64,999 | 159 (2.8%) | 93 (1.6%) |
| $65,000 to $74,999 | 119 (2.1%) | 53 (0.9%) |
| $75,000 to $99,999 | 157 (2.8%) | 338 (5.8%) |
| $100,000+ | 874 (15.5%) | 458 (7.8%) |
| Total | 5,641 (100.0%) | 5,844 (100.0%) |
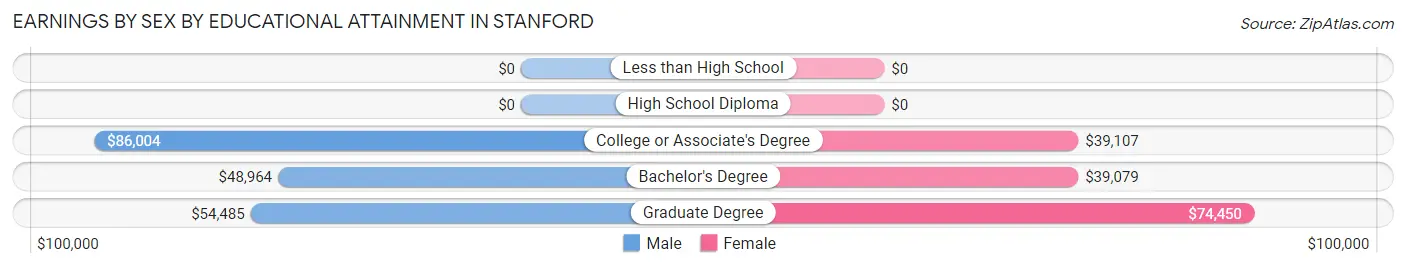
Earnings by Sex by Educational Attainment in Stanford
Average earnings in Stanford are $51,608 for men and $51,013 for women, a difference of 1.1%. Men with an educational attainment of college or associate's degree enjoy the highest average annual earnings of $86,004, while those with bachelor's degree education earn the least with $48,964. Women with an educational attainment of graduate degree earn the most with the average annual earnings of $74,450, while those with bachelor's degree education have the smallest earnings of $39,079.
| Educational Attainment | Male Income | Female Income |
| Less than High School | - | - |
| High School Diploma | - | - |
| College or Associate's Degree | $86,004 | $39,107 |
| Bachelor's Degree | $48,964 | $39,079 |
| Graduate Degree | $54,485 | $74,450 |
| Total | $51,608 | $51,013 |
Family Income in Stanford
Family Income Brackets in Stanford
According to the Stanford family income data, there are 696 families falling into the $200,000+ income range, which is the most common income bracket and makes up 57.1% of all families. Conversely, the $10,000 to $14,999 income bracket is the least frequent group with only 6 families (0.5%) belonging to this category.
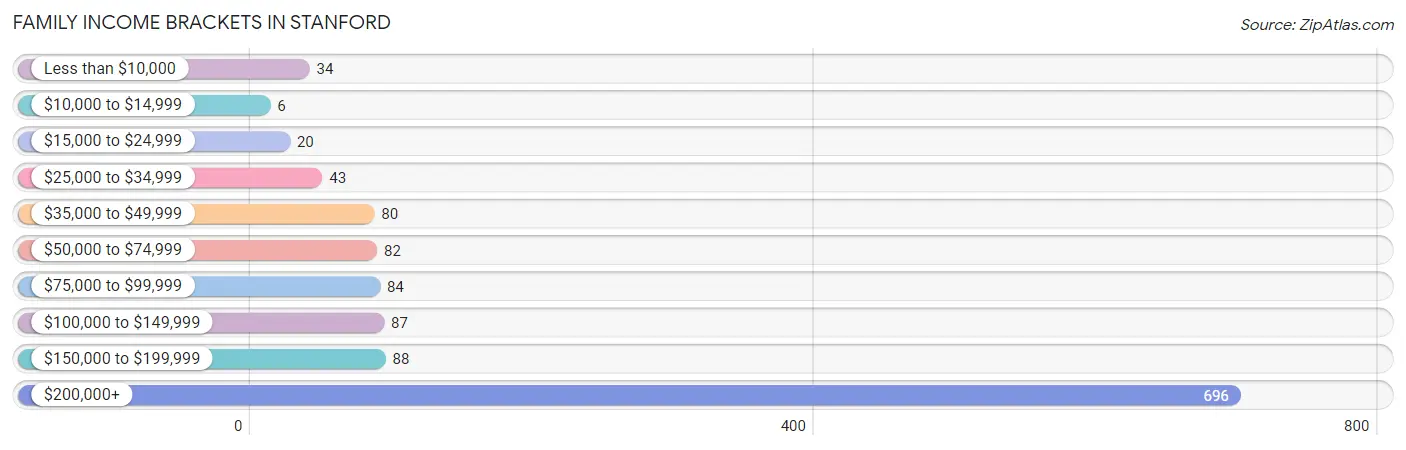
| Income Bracket | # Families | % Families |
| Less than $10,000 | 34 | 2.8% |
| $10,000 to $14,999 | 6 | 0.5% |
| $15,000 to $24,999 | 20 | 1.6% |
| $25,000 to $34,999 | 43 | 3.5% |
| $35,000 to $49,999 | 80 | 6.6% |
| $50,000 to $74,999 | 82 | 6.7% |
| $75,000 to $99,999 | 84 | 6.9% |
| $100,000 to $149,999 | 87 | 7.1% |
| $150,000 to $199,999 | 88 | 7.2% |
| $200,000+ | 696 | 57.1% |
Family Income by Famaliy Size in Stanford
2-person families (683 | 56.0%) account for the highest median family income in Stanford with $250,001 per family, while 2-person families (683 | 56.0%) have the highest median income of $125,000 per family member.
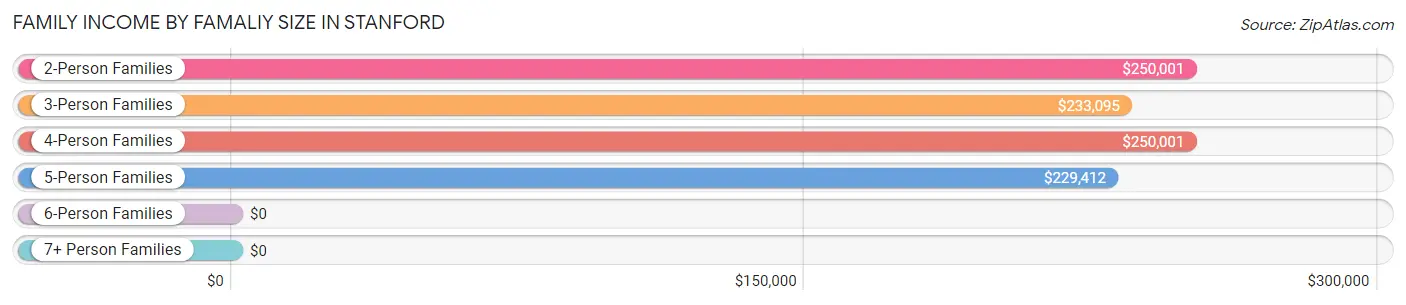
| Income Bracket | # Families | Median Income |
| 2-Person Families | 683 (56.0%) | $250,001 |
| 3-Person Families | 180 (14.8%) | $233,095 |
| 4-Person Families | 249 (20.4%) | $250,001 |
| 5-Person Families | 86 (7.0%) | $229,412 |
| 6-Person Families | 21 (1.7%) | $0 |
| 7+ Person Families | 0 (0.0%) | $0 |
| Total | 1,219 (100.0%) | $234,625 |
Family Income by Number of Earners in Stanford
The median family income in Stanford is $234,625, with families comprising 2 earners (612) having the highest median family income of $250,001, while families with 1 earner (402) have the lowest median family income of $118,947, accounting for 50.2% and 33.0% of families, respectively.
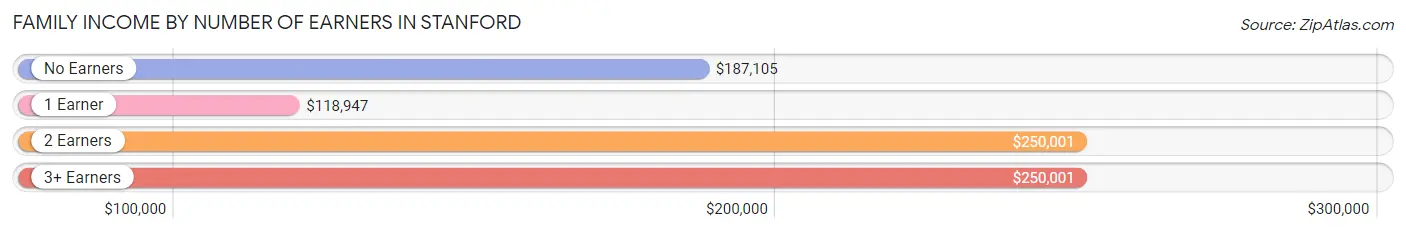
| Number of Earners | # Families | Median Income |
| No Earners | 154 (12.6%) | $187,105 |
| 1 Earner | 402 (33.0%) | $118,947 |
| 2 Earners | 612 (50.2%) | $250,001 |
| 3+ Earners | 51 (4.2%) | $250,001 |
| Total | 1,219 (100.0%) | $234,625 |
Household Income in Stanford
Household Income Brackets in Stanford
With 896 households falling in the category, the $200,000+ income range is the most frequent in Stanford, accounting for 24.7% of all households. In contrast, only 120 households (3.3%) fall into the $10,000 to $14,999 income bracket, making it the least populous group.
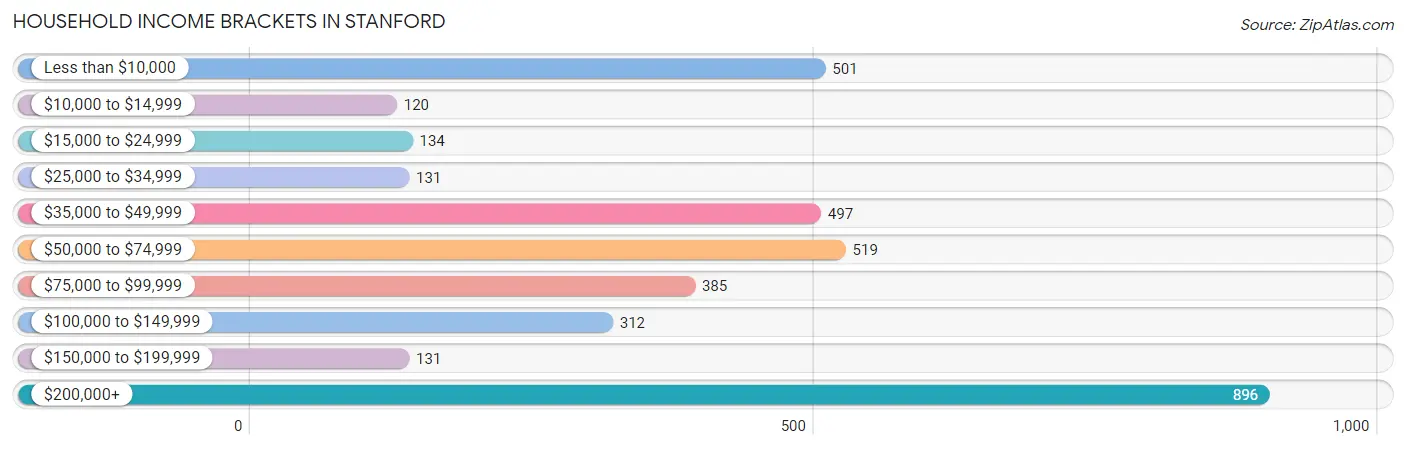
| Income Bracket | # Households | % Households |
| Less than $10,000 | 501 | 13.8% |
| $10,000 to $14,999 | 120 | 3.3% |
| $15,000 to $24,999 | 134 | 3.7% |
| $25,000 to $34,999 | 131 | 3.6% |
| $35,000 to $49,999 | 497 | 13.7% |
| $50,000 to $74,999 | 519 | 14.3% |
| $75,000 to $99,999 | 385 | 10.6% |
| $100,000 to $149,999 | 312 | 8.6% |
| $150,000 to $199,999 | 131 | 3.6% |
| $200,000+ | 896 | 24.7% |
Household Income by Householder Age in Stanford
The median household income in Stanford is $69,631, with the highest median household income of $250,001 found in the 45 to 64 years age bracket for the primary householder. A total of 551 households (15.2%) fall into this category. Meanwhile, the 15 to 24 years age bracket for the primary householder has the lowest median household income of $0, with 669 households (18.4%) in this group.
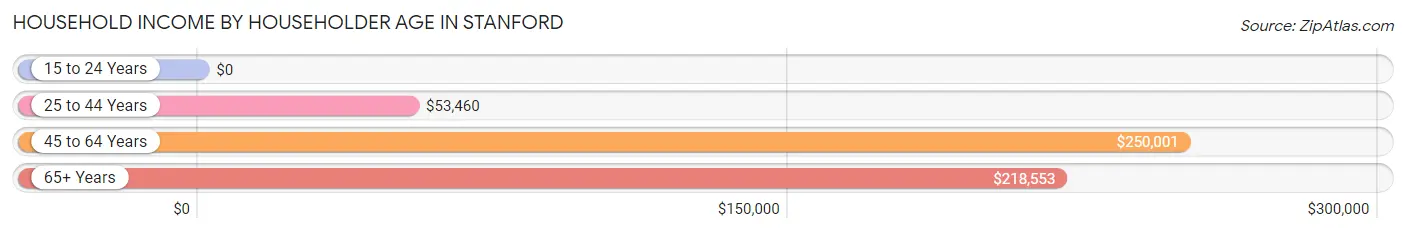
| Income Bracket | # Households | Median Income |
| 15 to 24 Years | 669 (18.4%) | $0 |
| 25 to 44 Years | 1,955 (53.9%) | $53,460 |
| 45 to 64 Years | 551 (15.2%) | $250,001 |
| 65+ Years | 454 (12.5%) | $218,553 |
| Total | 3,629 (100.0%) | $69,631 |
Poverty in Stanford
Income Below Poverty by Sex and Age in Stanford
With 22.0% poverty level for males and 19.9% for females among the residents of Stanford, 18 to 24 year old males and 18 to 24 year old females are the most vulnerable to poverty, with 262 males (50.7%) and 282 females (39.2%) in their respective age groups living below the poverty level.
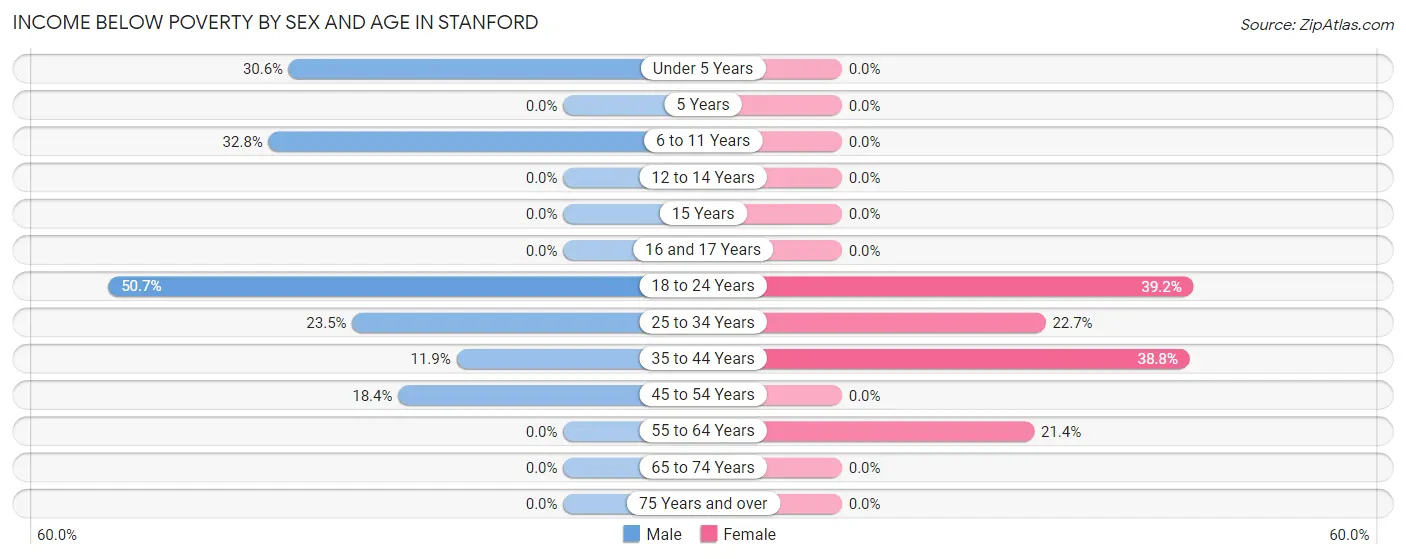
| Age Bracket | Male | Female |
| Under 5 Years | 44 (30.6%) | 0 (0.0%) |
| 5 Years | 0 (0.0%) | 0 (0.0%) |
| 6 to 11 Years | 43 (32.8%) | 0 (0.0%) |
| 12 to 14 Years | 0 (0.0%) | 0 (0.0%) |
| 15 Years | 0 (0.0%) | 0 (0.0%) |
| 16 and 17 Years | 0 (0.0%) | 0 (0.0%) |
| 18 to 24 Years | 262 (50.7%) | 282 (39.2%) |
| 25 to 34 Years | 411 (23.5%) | 269 (22.7%) |
| 35 to 44 Years | 34 (11.9%) | 62 (38.8%) |
| 45 to 54 Years | 43 (18.4%) | 0 (0.0%) |
| 55 to 64 Years | 0 (0.0%) | 85 (21.4%) |
| 65 to 74 Years | 0 (0.0%) | 0 (0.0%) |
| 75 Years and over | 0 (0.0%) | 0 (0.0%) |
| Total | 837 (22.0%) | 698 (19.9%) |
Income Above Poverty by Sex and Age in Stanford
According to the poverty statistics in Stanford, males aged 5 years and females aged under 5 years are the age groups that are most secure financially, with 100.0% of males and 100.0% of females in these age groups living above the poverty line.
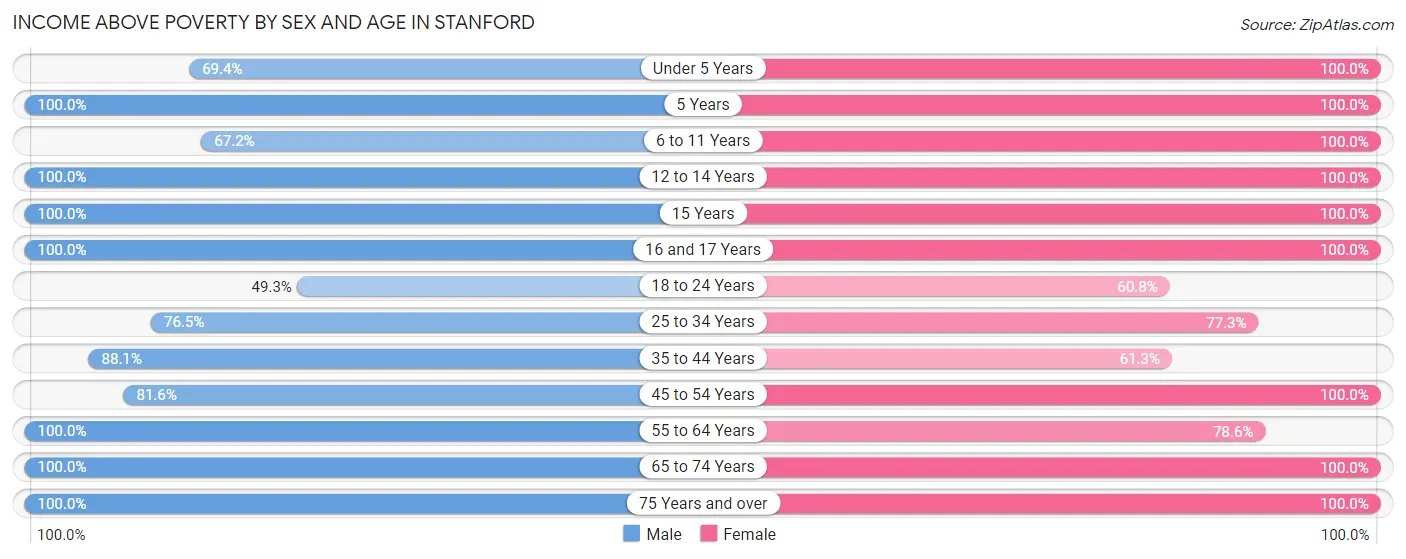
| Age Bracket | Male | Female |
| Under 5 Years | 100 (69.4%) | 166 (100.0%) |
| 5 Years | 28 (100.0%) | 9 (100.0%) |
| 6 to 11 Years | 88 (67.2%) | 184 (100.0%) |
| 12 to 14 Years | 31 (100.0%) | 77 (100.0%) |
| 15 Years | 56 (100.0%) | 8 (100.0%) |
| 16 and 17 Years | 38 (100.0%) | 41 (100.0%) |
| 18 to 24 Years | 255 (49.3%) | 438 (60.8%) |
| 25 to 34 Years | 1,339 (76.5%) | 917 (77.3%) |
| 35 to 44 Years | 252 (88.1%) | 98 (61.3%) |
| 45 to 54 Years | 191 (81.6%) | 201 (100.0%) |
| 55 to 64 Years | 303 (100.0%) | 312 (78.6%) |
| 65 to 74 Years | 157 (100.0%) | 125 (100.0%) |
| 75 Years and over | 128 (100.0%) | 237 (100.0%) |
| Total | 2,966 (78.0%) | 2,813 (80.1%) |
Income Below Poverty Among Married-Couple Families in Stanford
The poverty statistics for married-couple families in Stanford show that 5.8% or 59 of the total 1,014 families live below the poverty line. Families with 1 or 2 children have the highest poverty rate of 10.2%, comprising of 34 families. On the other hand, families with 3 or 4 children have the lowest poverty rate of 0.0%, which includes 0 families.
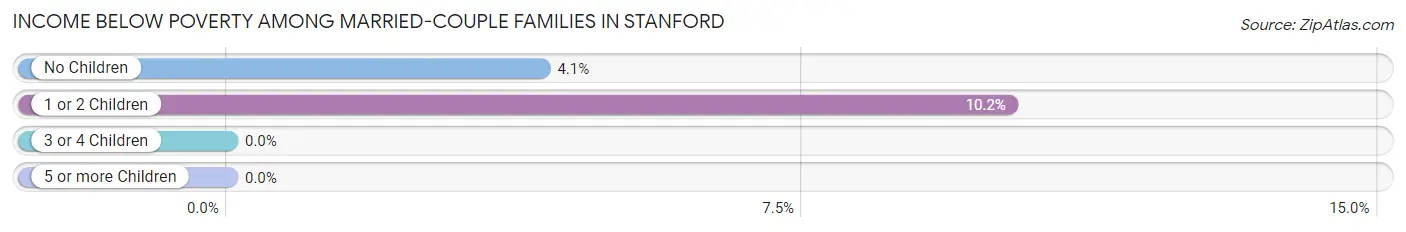
| Children | Above Poverty | Below Poverty |
| No Children | 587 (95.9%) | 25 (4.1%) |
| 1 or 2 Children | 300 (89.8%) | 34 (10.2%) |
| 3 or 4 Children | 68 (100.0%) | 0 (0.0%) |
| 5 or more Children | 0 (0.0%) | 0 (0.0%) |
| Total | 955 (94.2%) | 59 (5.8%) |
Income Below Poverty Among Single-Parent Households in Stanford
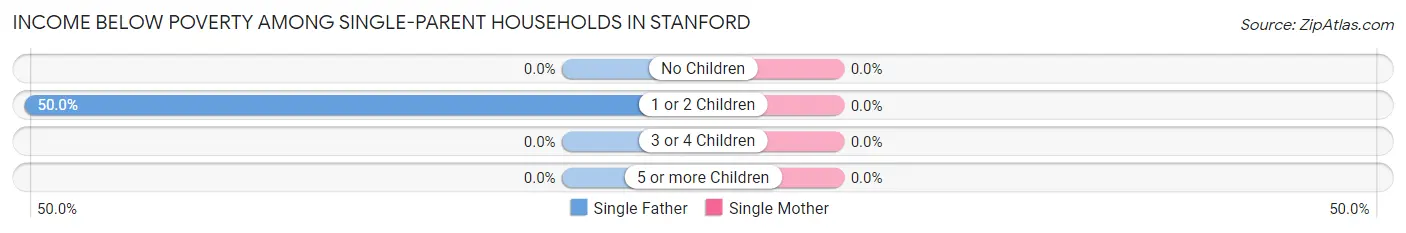
| Children | Single Father | Single Mother |
| No Children | 0 (0.0%) | 0 (0.0%) |
| 1 or 2 Children | 43 (50.0%) | 0 (0.0%) |
| 3 or 4 Children | 0 (0.0%) | 0 (0.0%) |
| 5 or more Children | 0 (0.0%) | 0 (0.0%) |
| Total | 43 (38.4%) | 0 (0.0%) |
Income Below Poverty Among Married-Couple vs Single-Parent Households in Stanford
The poverty data for Stanford shows that 59 of the married-couple family households (5.8%) and 43 of the single-parent households (21.0%) are living below the poverty level. Within the married-couple family households, those with 1 or 2 children have the highest poverty rate, with 34 households (10.2%) falling below the poverty line. Among the single-parent households, those with 1 or 2 children have the highest poverty rate, with 43 household (35.0%) living below poverty.
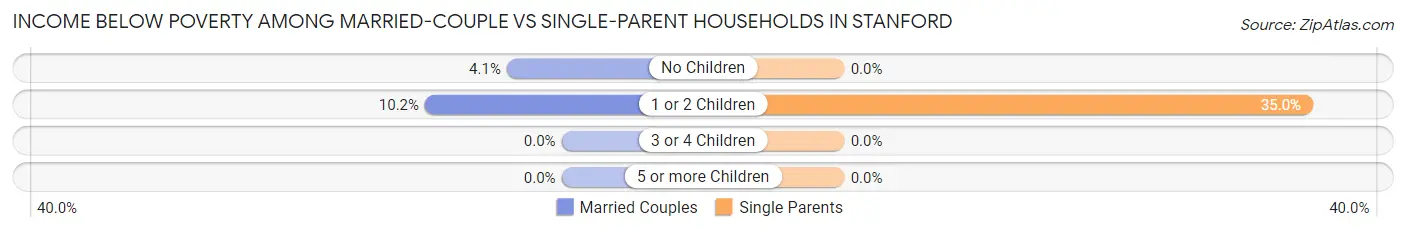
| Children | Married-Couple Families | Single-Parent Households |
| No Children | 25 (4.1%) | 0 (0.0%) |
| 1 or 2 Children | 34 (10.2%) | 43 (35.0%) |
| 3 or 4 Children | 0 (0.0%) | 0 (0.0%) |
| 5 or more Children | 0 (0.0%) | 0 (0.0%) |
| Total | 59 (5.8%) | 43 (21.0%) |
Race in Stanford
The most populous races in Stanford are White / Caucasian (8,900 | 51.6%), Asian (4,474 | 25.9%), and Hispanic or Latino (2,917 | 16.9%).
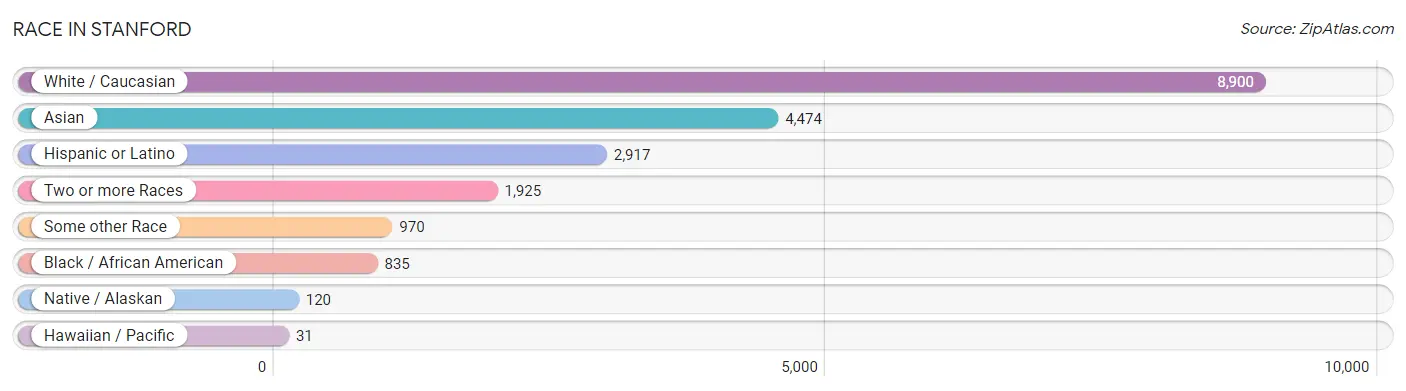
| Race | # Population | % Population |
| Asian | 4,474 | 25.9% |
| Black / African American | 835 | 4.8% |
| Hawaiian / Pacific | 31 | 0.2% |
| Hispanic or Latino | 2,917 | 16.9% |
| Native / Alaskan | 120 | 0.7% |
| White / Caucasian | 8,900 | 51.6% |
| Two or more Races | 1,925 | 11.2% |
| Some other Race | 970 | 5.6% |
| Total | 17,255 | 100.0% |
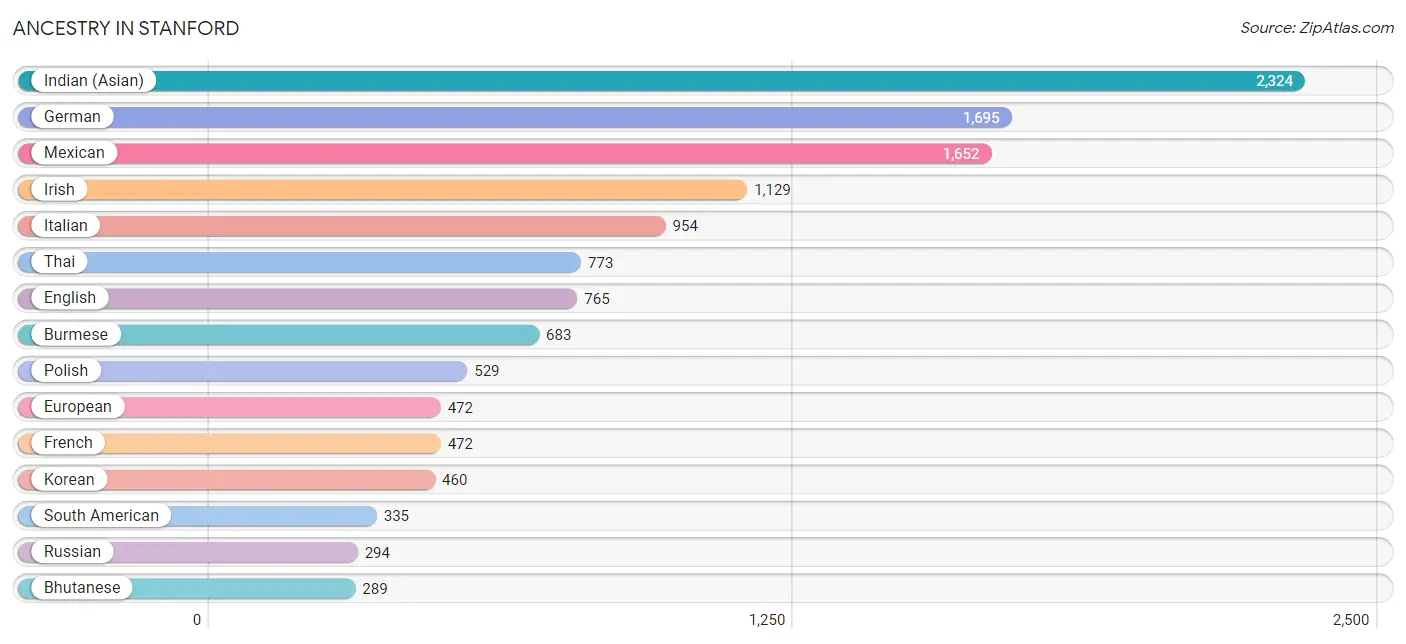
Ancestry in Stanford
The most populous ancestries reported in Stanford are Indian (Asian) (2,324 | 13.5%), German (1,695 | 9.8%), Mexican (1,652 | 9.6%), Irish (1,129 | 6.5%), and Italian (954 | 5.5%), together accounting for 44.9% of all Stanford residents.
| Ancestry | # Population | % Population |
| African | 94 | 0.5% |
| Albanian | 19 | 0.1% |
| American | 216 | 1.3% |
| Arab | 254 | 1.5% |
| Argentinean | 117 | 0.7% |
| Armenian | 90 | 0.5% |
| Assyrian / Chaldean / Syriac | 19 | 0.1% |
| Austrian | 22 | 0.1% |
| Bahamian | 15 | 0.1% |
| Bangladeshi | 17 | 0.1% |
| Barbadian | 7 | 0.0% |
| Belgian | 21 | 0.1% |
| Bhutanese | 289 | 1.7% |
| Bolivian | 9 | 0.1% |
| Brazilian | 125 | 0.7% |
| British | 83 | 0.5% |
| Burmese | 683 | 4.0% |
| Canadian | 15 | 0.1% |
| Central American | 219 | 1.3% |
| Central American Indian | 36 | 0.2% |
| Cherokee | 22 | 0.1% |
| Chilean | 72 | 0.4% |
| Colombian | 50 | 0.3% |
| Colville | 19 | 0.1% |
| Costa Rican | 7 | 0.0% |
| Creek | 11 | 0.1% |
| Croatian | 16 | 0.1% |
| Cuban | 42 | 0.2% |
| Cypriot | 173 | 1.0% |
| Czech | 36 | 0.2% |
| Czechoslovakian | 3 | 0.0% |
| Danish | 121 | 0.7% |
| Dominican | 53 | 0.3% |
| Dutch | 115 | 0.7% |
| Eastern European | 118 | 0.7% |
| Ecuadorian | 11 | 0.1% |
| Egyptian | 67 | 0.4% |
| English | 765 | 4.4% |
| Estonian | 2 | 0.0% |
| Ethiopian | 7 | 0.0% |
| European | 472 | 2.7% |
| Filipino | 145 | 0.8% |
| Finnish | 29 | 0.2% |
| French | 472 | 2.7% |
| French Canadian | 149 | 0.9% |
| German | 1,695 | 9.8% |
| Greek | 219 | 1.3% |
| Guatemalan | 70 | 0.4% |
| Guyanese | 16 | 0.1% |
| Haitian | 20 | 0.1% |
| Hungarian | 42 | 0.2% |
| Indian (Asian) | 2,324 | 13.5% |
| Indonesian | 14 | 0.1% |
| Iranian | 92 | 0.5% |
| Irish | 1,129 | 6.5% |
| Israeli | 12 | 0.1% |
| Italian | 954 | 5.5% |
| Jamaican | 120 | 0.7% |
| Japanese | 209 | 1.2% |
| Kenyan | 7 | 0.0% |
| Korean | 460 | 2.7% |
| Laotian | 7 | 0.0% |
| Latvian | 20 | 0.1% |
| Lebanese | 116 | 0.7% |
| Lithuanian | 65 | 0.4% |
| Maltese | 33 | 0.2% |
| Mexican | 1,652 | 9.6% |
| Mexican American Indian | 15 | 0.1% |
| Moroccan | 20 | 0.1% |
| Native Hawaiian | 46 | 0.3% |
| Nicaraguan | 52 | 0.3% |
| Nigerian | 23 | 0.1% |
| Northern European | 25 | 0.1% |
| Norwegian | 139 | 0.8% |
| Okinawan | 10 | 0.1% |
| Pakistani | 33 | 0.2% |
| Palestinian | 21 | 0.1% |
| Peruvian | 35 | 0.2% |
| Polish | 529 | 3.1% |
| Portuguese | 103 | 0.6% |
| Puerto Rican | 187 | 1.1% |
| Romanian | 35 | 0.2% |
| Russian | 294 | 1.7% |
| Salvadoran | 90 | 0.5% |
| Samoan | 5 | 0.0% |
| Scandinavian | 3 | 0.0% |
| Scotch-Irish | 110 | 0.6% |
| Scottish | 282 | 1.6% |
| Serbian | 6 | 0.0% |
| Sioux | 11 | 0.1% |
| South African | 6 | 0.0% |
| South American | 335 | 1.9% |
| Spaniard | 187 | 1.1% |
| Spanish | 39 | 0.2% |
| Sri Lankan | 273 | 1.6% |
| Subsaharan African | 209 | 1.2% |
| Sudanese | 54 | 0.3% |
| Swedish | 225 | 1.3% |
| Swiss | 218 | 1.3% |
| Thai | 773 | 4.5% |
| Trinidadian and Tobagonian | 7 | 0.0% |
| Turkish | 139 | 0.8% |
| Ugandan | 1 | 0.0% |
| Ukrainian | 61 | 0.4% |
| Venezuelan | 41 | 0.2% |
| Vietnamese | 4 | 0.0% |
| Welsh | 59 | 0.3% |
| Yugoslavian | 11 | 0.1% | View All 108 Rows |
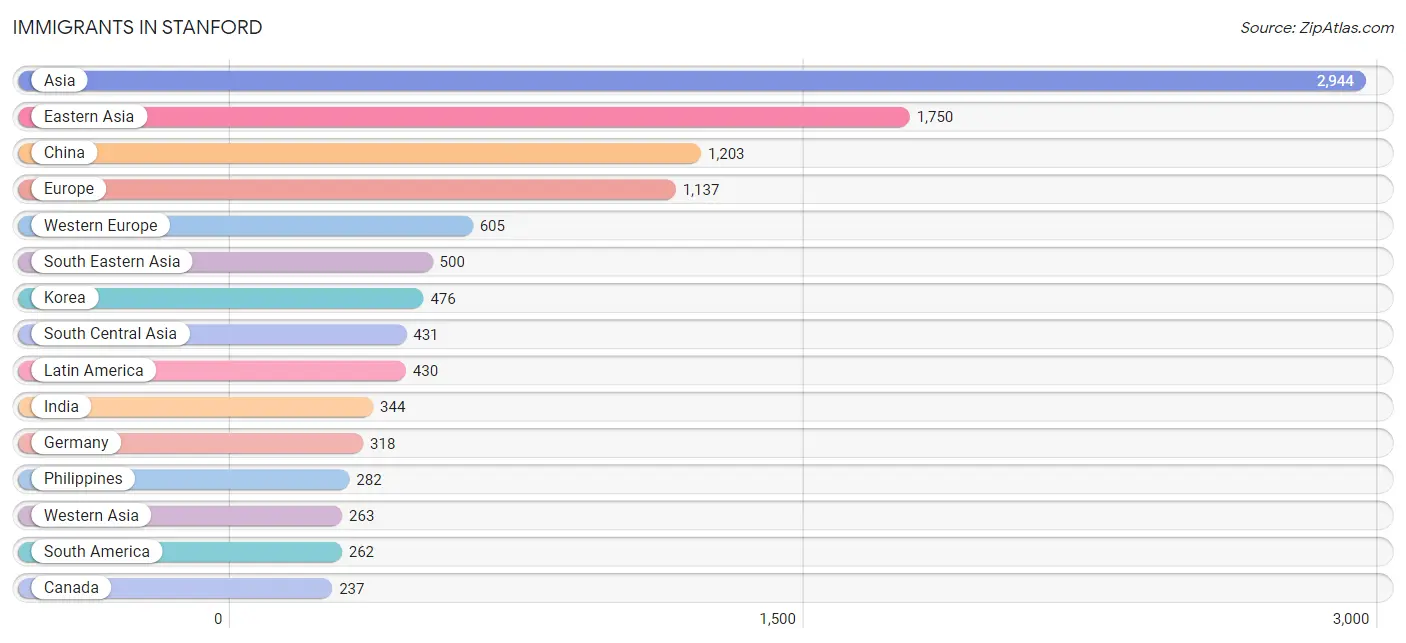
Immigrants in Stanford
The most numerous immigrant groups reported in Stanford came from Asia (2,944 | 17.1%), Eastern Asia (1,750 | 10.1%), China (1,203 | 7.0%), Europe (1,137 | 6.6%), and Western Europe (605 | 3.5%), together accounting for 44.3% of all Stanford residents.
| Immigration Origin | # Population | % Population |
| Africa | 155 | 0.9% |
| Albania | 19 | 0.1% |
| Argentina | 80 | 0.5% |
| Asia | 2,944 | 17.1% |
| Austria | 19 | 0.1% |
| Brazil | 64 | 0.4% |
| Cambodia | 90 | 0.5% |
| Cameroon | 3 | 0.0% |
| Canada | 237 | 1.4% |
| Caribbean | 24 | 0.1% |
| Central America | 144 | 0.8% |
| Chile | 54 | 0.3% |
| China | 1,203 | 7.0% |
| Colombia | 21 | 0.1% |
| Dominican Republic | 17 | 0.1% |
| Eastern Asia | 1,750 | 10.1% |
| Eastern Europe | 94 | 0.5% |
| Egypt | 56 | 0.3% |
| El Salvador | 13 | 0.1% |
| England | 163 | 0.9% |
| Europe | 1,137 | 6.6% |
| France | 113 | 0.6% |
| Germany | 318 | 1.8% |
| Greece | 23 | 0.1% |
| Guyana | 9 | 0.1% |
| Hong Kong | 124 | 0.7% |
| India | 344 | 2.0% |
| Indonesia | 11 | 0.1% |
| Iran | 59 | 0.3% |
| Israel | 13 | 0.1% |
| Italy | 132 | 0.8% |
| Japan | 71 | 0.4% |
| Jordan | 21 | 0.1% |
| Korea | 476 | 2.8% |
| Latin America | 430 | 2.5% |
| Lebanon | 86 | 0.5% |
| Malaysia | 5 | 0.0% |
| Mexico | 127 | 0.7% |
| Middle Africa | 3 | 0.0% |
| Moldova | 4 | 0.0% |
| Morocco | 12 | 0.1% |
| Nepal | 13 | 0.1% |
| Nicaragua | 4 | 0.0% |
| Northern Africa | 115 | 0.7% |
| Northern Europe | 220 | 1.3% |
| Norway | 8 | 0.1% |
| Pakistan | 15 | 0.1% |
| Peru | 17 | 0.1% |
| Philippines | 282 | 1.6% |
| Russia | 11 | 0.1% |
| Saudi Arabia | 6 | 0.0% |
| Serbia | 45 | 0.3% |
| Singapore | 13 | 0.1% |
| South Africa | 25 | 0.1% |
| South America | 262 | 1.5% |
| South Central Asia | 431 | 2.5% |
| South Eastern Asia | 500 | 2.9% |
| Southern Europe | 218 | 1.3% |
| Spain | 63 | 0.4% |
| Sudan | 34 | 0.2% |
| Sweden | 11 | 0.1% |
| Switzerland | 155 | 0.9% |
| Taiwan | 134 | 0.8% |
| Thailand | 37 | 0.2% |
| Trinidad and Tobago | 7 | 0.0% |
| Turkey | 101 | 0.6% |
| Ukraine | 15 | 0.1% |
| Venezuela | 17 | 0.1% |
| Vietnam | 62 | 0.4% |
| Western Asia | 263 | 1.5% |
| Western Europe | 605 | 3.5% | View All 71 Rows |
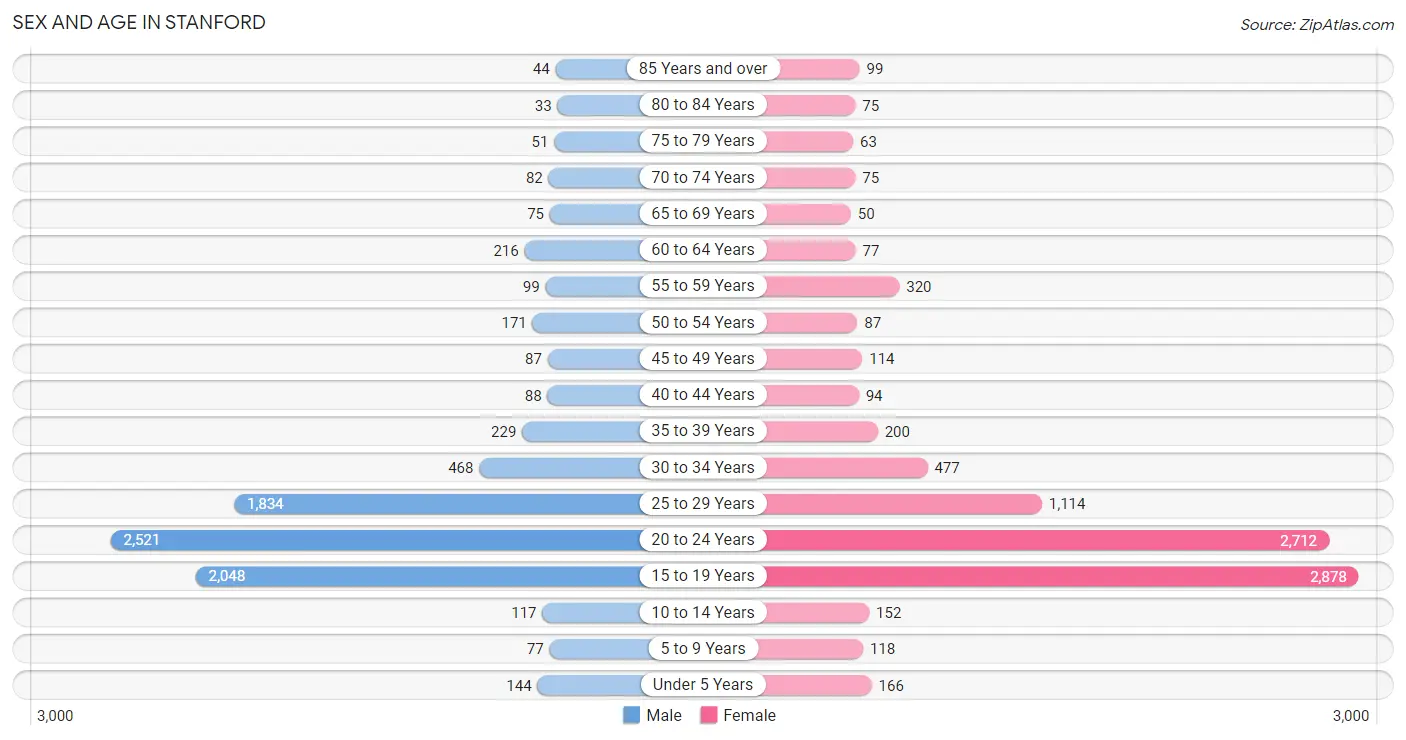
Sex and Age in Stanford
Sex and Age in Stanford
The most populous age groups in Stanford are 20 to 24 Years (2,521 | 30.1%) for men and 15 to 19 Years (2,878 | 32.4%) for women.
| Age Bracket | Male | Female |
| Under 5 Years | 144 (1.7%) | 166 (1.9%) |
| 5 to 9 Years | 77 (0.9%) | 118 (1.3%) |
| 10 to 14 Years | 117 (1.4%) | 152 (1.7%) |
| 15 to 19 Years | 2,048 (24.4%) | 2,878 (32.4%) |
| 20 to 24 Years | 2,521 (30.1%) | 2,712 (30.6%) |
| 25 to 29 Years | 1,834 (21.9%) | 1,114 (12.6%) |
| 30 to 34 Years | 468 (5.6%) | 477 (5.4%) |
| 35 to 39 Years | 229 (2.7%) | 200 (2.2%) |
| 40 to 44 Years | 88 (1.1%) | 94 (1.1%) |
| 45 to 49 Years | 87 (1.0%) | 114 (1.3%) |
| 50 to 54 Years | 171 (2.0%) | 87 (1.0%) |
| 55 to 59 Years | 99 (1.2%) | 320 (3.6%) |
| 60 to 64 Years | 216 (2.6%) | 77 (0.9%) |
| 65 to 69 Years | 75 (0.9%) | 50 (0.6%) |
| 70 to 74 Years | 82 (1.0%) | 75 (0.9%) |
| 75 to 79 Years | 51 (0.6%) | 63 (0.7%) |
| 80 to 84 Years | 33 (0.4%) | 75 (0.9%) |
| 85 Years and over | 44 (0.5%) | 99 (1.1%) |
| Total | 8,384 (100.0%) | 8,871 (100.0%) |
Families and Households in Stanford
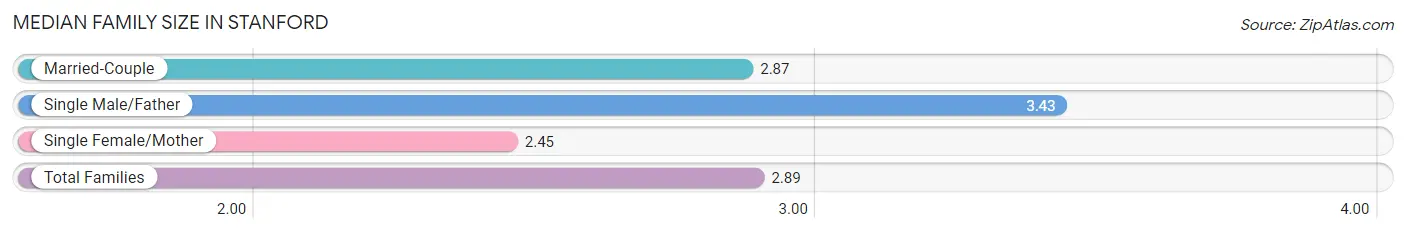
Median Family Size in Stanford
The median family size in Stanford is 2.89 persons per family, with single male/father families (112 | 9.2%) accounting for the largest median family size of 3.43 persons per family. On the other hand, single female/mother families (93 | 7.6%) represent the smallest median family size with 2.45 persons per family.
| Family Type | # Families | Family Size |
| Married-Couple | 1,014 (83.2%) | 2.87 |
| Single Male/Father | 112 (9.2%) | 3.43 |
| Single Female/Mother | 93 (7.6%) | 2.45 |
| Total Families | 1,219 (100.0%) | 2.89 |
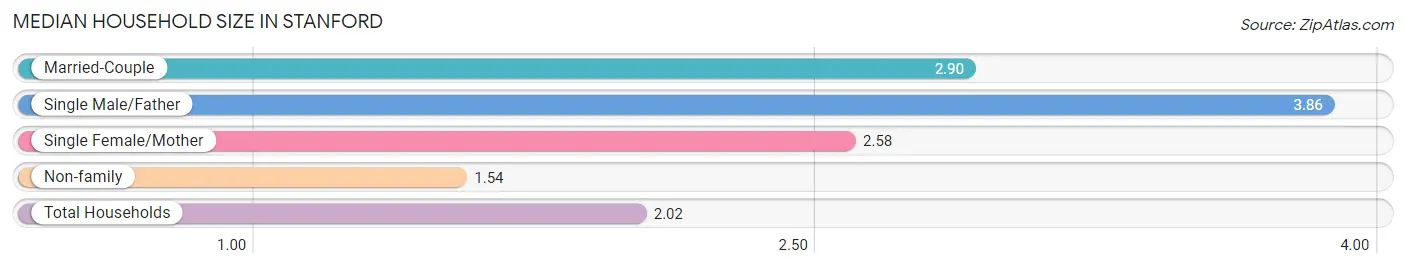
Median Household Size in Stanford
The median household size in Stanford is 2.02 persons per household, with single male/father households (112 | 3.1%) accounting for the largest median household size of 3.86 persons per household. non-family households (2,410 | 66.4%) represent the smallest median household size with 1.54 persons per household.
| Household Type | # Households | Household Size |
| Married-Couple | 1,014 (27.9%) | 2.90 |
| Single Male/Father | 112 (3.1%) | 3.86 |
| Single Female/Mother | 93 (2.6%) | 2.58 |
| Non-family | 2,410 (66.4%) | 1.54 |
| Total Households | 3,629 (100.0%) | 2.02 |
Household Size by Marriage Status in Stanford
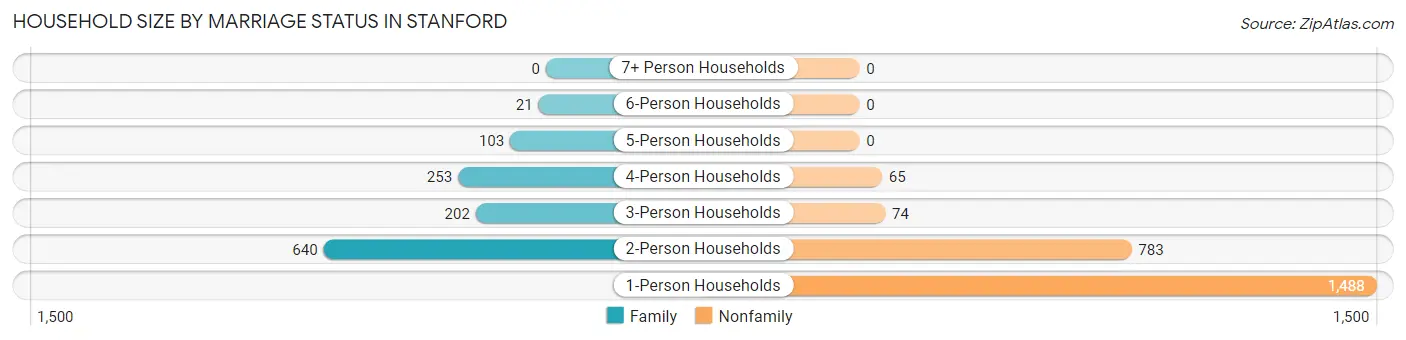
Out of a total of 3,629 households in Stanford, 1,219 (33.6%) are family households, while 2,410 (66.4%) are nonfamily households. The most numerous type of family households are 2-person households, comprising 640, and the most common type of nonfamily households are 1-person households, comprising 1,488.
| Household Size | Family Households | Nonfamily Households |
| 1-Person Households | - | 1,488 (41.0%) |
| 2-Person Households | 640 (17.6%) | 783 (21.6%) |
| 3-Person Households | 202 (5.6%) | 74 (2.0%) |
| 4-Person Households | 253 (7.0%) | 65 (1.8%) |
| 5-Person Households | 103 (2.8%) | 0 (0.0%) |
| 6-Person Households | 21 (0.6%) | 0 (0.0%) |
| 7+ Person Households | 0 (0.0%) | 0 (0.0%) |
| Total | 1,219 (33.6%) | 2,410 (66.4%) |
Female Fertility in Stanford
Fertility by Age in Stanford
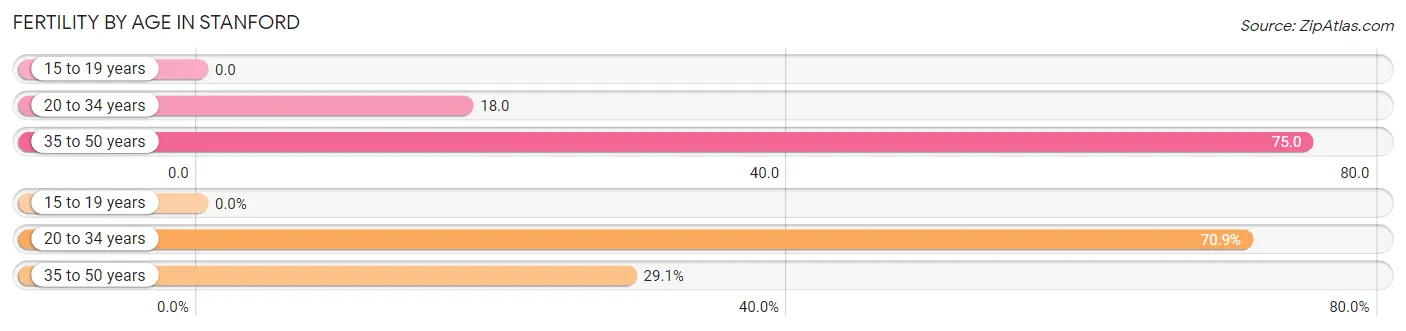
Average fertility rate in Stanford is 14.0 births per 1,000 women. Women in the age bracket of 35 to 50 years have the highest fertility rate with 75.0 births per 1,000 women. Women in the age bracket of 20 to 34 years acount for 70.9% of all women with births.
| Age Bracket | Women with Births | Births / 1,000 Women |
| 15 to 19 years | 0 (0.0%) | 0.0 |
| 20 to 34 years | 78 (70.9%) | 18.0 |
| 35 to 50 years | 32 (29.1%) | 75.0 |
| Total | 110 (100.0%) | 14.0 |
Fertility by Age by Marriage Status in Stanford
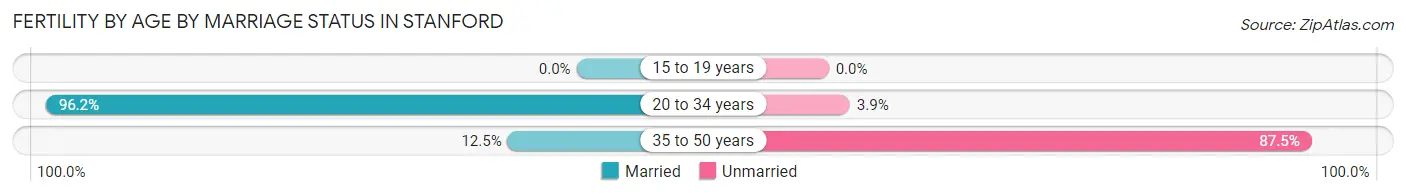
71.8% of women with births (110) in Stanford are married. The highest percentage of unmarried women with births falls into 35 to 50 years age bracket with 87.5% of them unmarried at the time of birth, while the lowest percentage of unmarried women with births belong to 20 to 34 years age bracket with 3.8% of them unmarried.
| Age Bracket | Married | Unmarried |
| 15 to 19 years | 0 (0.0%) | 0 (0.0%) |
| 20 to 34 years | 75 (96.2%) | 3 (3.8%) |
| 35 to 50 years | 4 (12.5%) | 28 (87.5%) |
| Total | 79 (71.8%) | 31 (28.2%) |
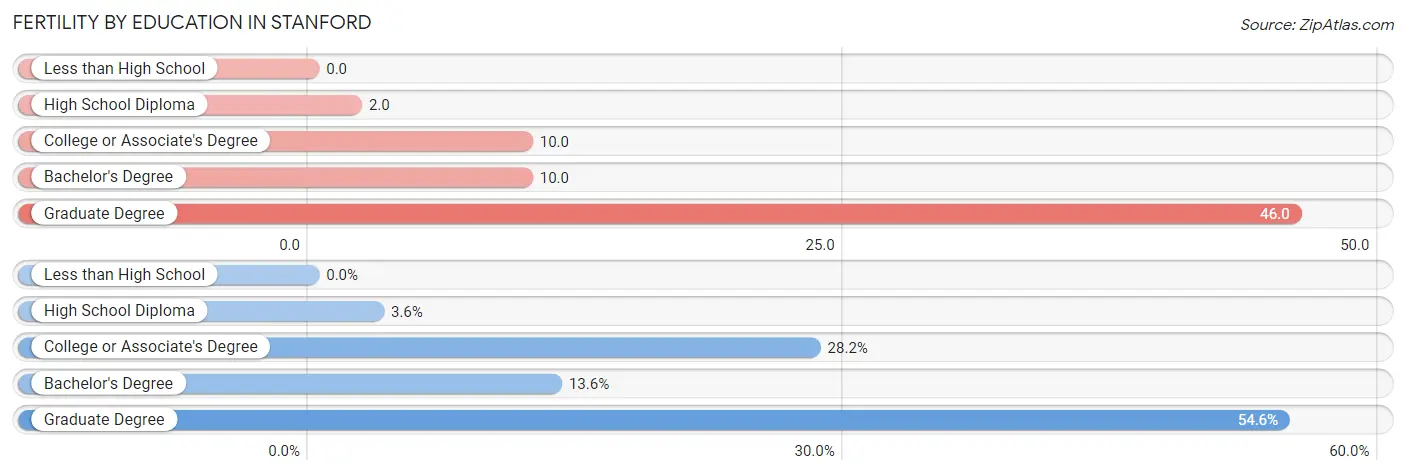
Fertility by Education in Stanford
| Educational Attainment | Women with Births | Births / 1,000 Women |
| Less than High School | 0 (0.0%) | 0.0 |
| High School Diploma | 4 (3.6%) | 2.0 |
| College or Associate's Degree | 31 (28.2%) | 10.0 |
| Bachelor's Degree | 15 (13.6%) | 10.0 |
| Graduate Degree | 60 (54.5%) | 46.0 |
| Total | 110 (100.0%) | 14.0 |
Fertility by Education by Marriage Status in Stanford
28.2% of women with births in Stanford are unmarried. Women with the educational attainment of high school diploma are most likely to be married with 100.0% of them married at childbirth, while women with the educational attainment of college or associate's degree are least likely to be married with 100.0% of them unmarried at childbirth.
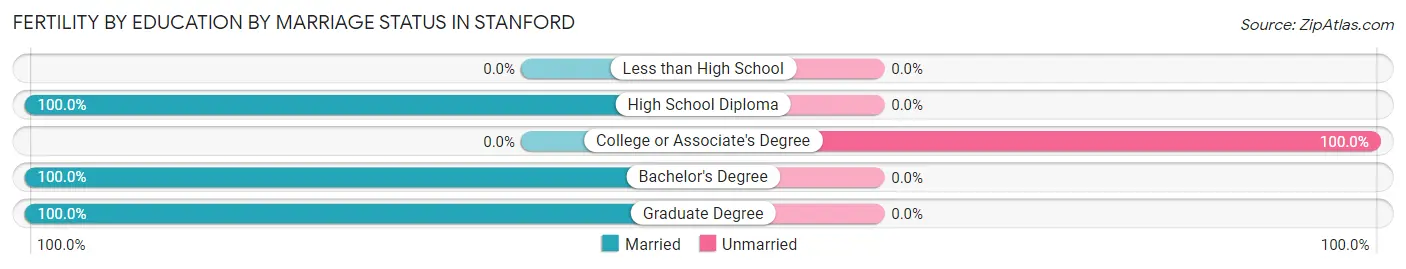
| Educational Attainment | Married | Unmarried |
| Less than High School | 0 (0.0%) | 0 (0.0%) |
| High School Diploma | 4 (100.0%) | 0 (0.0%) |
| College or Associate's Degree | 0 (0.0%) | 31 (100.0%) |
| Bachelor's Degree | 15 (100.0%) | 0 (0.0%) |
| Graduate Degree | 60 (100.0%) | 0 (0.0%) |
| Total | 79 (71.8%) | 31 (28.2%) |
Employment Characteristics in Stanford
Employment by Class of Employer in Stanford
Among the 7,403 employed individuals in Stanford, private company employees (3,169 | 42.8%), not-for-profit organizations (3,024 | 40.8%), and state government employees (718 | 9.7%) make up the most common classes of employment.
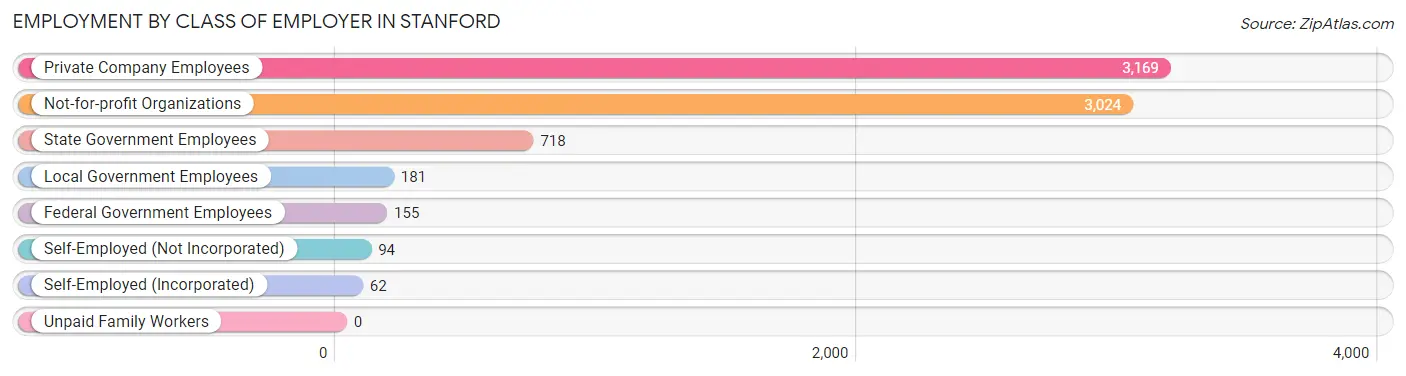
| Employer Class | # Employees | % Employees |
| Private Company Employees | 3,169 | 42.8% |
| Self-Employed (Incorporated) | 62 | 0.8% |
| Self-Employed (Not Incorporated) | 94 | 1.3% |
| Not-for-profit Organizations | 3,024 | 40.8% |
| Local Government Employees | 181 | 2.4% |
| State Government Employees | 718 | 9.7% |
| Federal Government Employees | 155 | 2.1% |
| Unpaid Family Workers | 0 | 0.0% |
| Total | 7,403 | 100.0% |
Employment Status by Age in Stanford
According to the labor force statistics for Stanford, out of the total population over 16 years of age (16,417), 49.0% or 8,044 individuals are in the labor force, with 6.1% or 491 of them unemployed. The age group with the highest labor force participation rate is 60 to 64 years, with 83.3% or 244 individuals in the labor force. Within the labor force, the 16 to 19 years age range has the highest percentage of unemployed individuals, with 18.5% or 290 of them being unemployed.
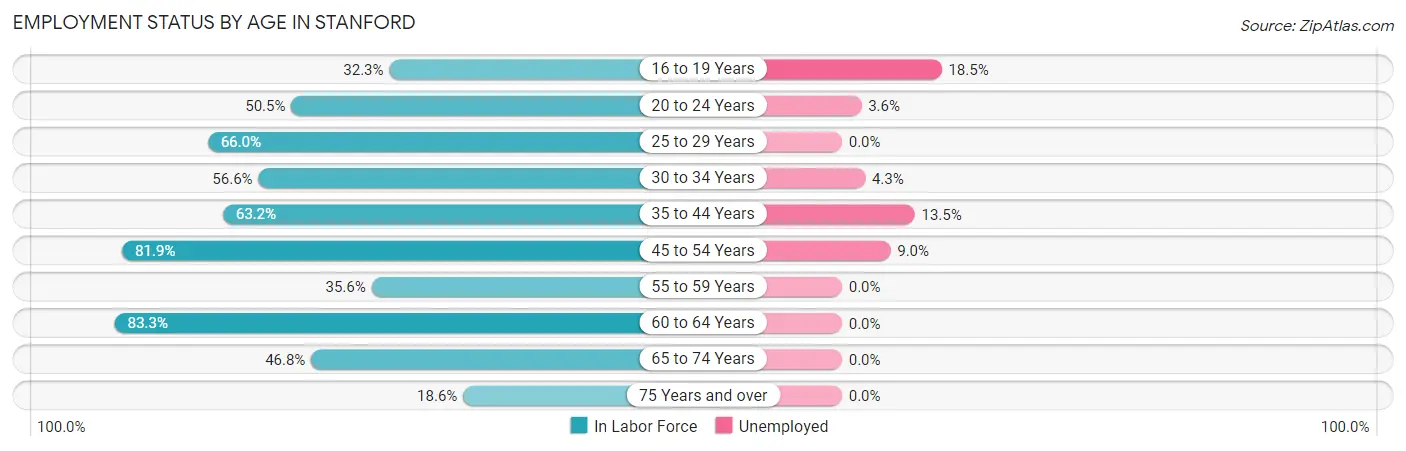
| Age Bracket | In Labor Force | Unemployed |
| 16 to 19 Years | 1,570 (32.3%) | 290 (18.5%) |
| 20 to 24 Years | 2,643 (50.5%) | 95 (3.6%) |
| 25 to 29 Years | 1,946 (66.0%) | 0 (0.0%) |
| 30 to 34 Years | 535 (56.6%) | 23 (4.3%) |
| 35 to 44 Years | 386 (63.2%) | 52 (13.5%) |
| 45 to 54 Years | 376 (81.9%) | 34 (9.0%) |
| 55 to 59 Years | 149 (35.6%) | 0 (0.0%) |
| 60 to 64 Years | 244 (83.3%) | 0 (0.0%) |
| 65 to 74 Years | 132 (46.8%) | 0 (0.0%) |
| 75 Years and over | 68 (18.6%) | 0 (0.0%) |
| Total | 8,044 (49.0%) | 491 (6.1%) |
Employment Status by Educational Attainment in Stanford
According to labor force statistics for Stanford, 64.1% of individuals (3,638) out of the total population between 25 and 64 years of age (5,675) are in the labor force, with 3.0% or 109 of them being unemployed. The group with the highest labor force participation rate are those with the educational attainment of college / associate degree, with 72.0% or 175 individuals in the labor force. Within the labor force, individuals with high school diploma education have the highest percentage of unemployment, with 44.2% or 23 of them being unemployed.
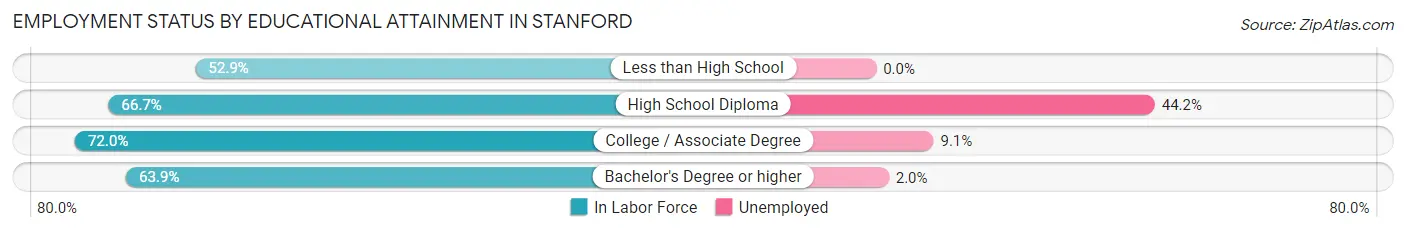
| Educational Attainment | In Labor Force | Unemployed |
| Less than High School | 55 (52.9%) | 0 (0.0%) |
| High School Diploma | 52 (66.7%) | 34 (44.2%) |
| College / Associate Degree | 175 (72.0%) | 22 (9.1%) |
| Bachelor's Degree or higher | 3,355 (63.9%) | 105 (2.0%) |
| Total | 3,638 (64.1%) | 170 (3.0%) |
Employment Occupations by Sex in Stanford
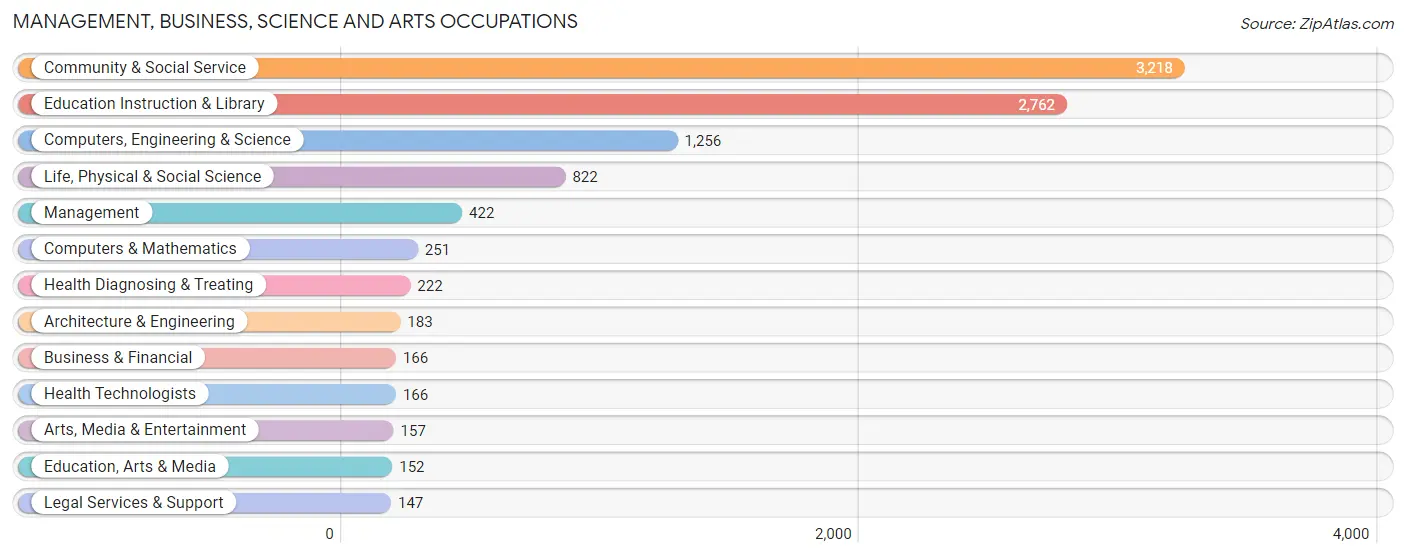
Management, Business, Science and Arts Occupations
The most common Management, Business, Science and Arts occupations in Stanford are Community & Social Service (3,218 | 42.7%), Education Instruction & Library (2,762 | 36.7%), Computers, Engineering & Science (1,256 | 16.7%), Life, Physical & Social Science (822 | 10.9%), and Management (422 | 5.6%).
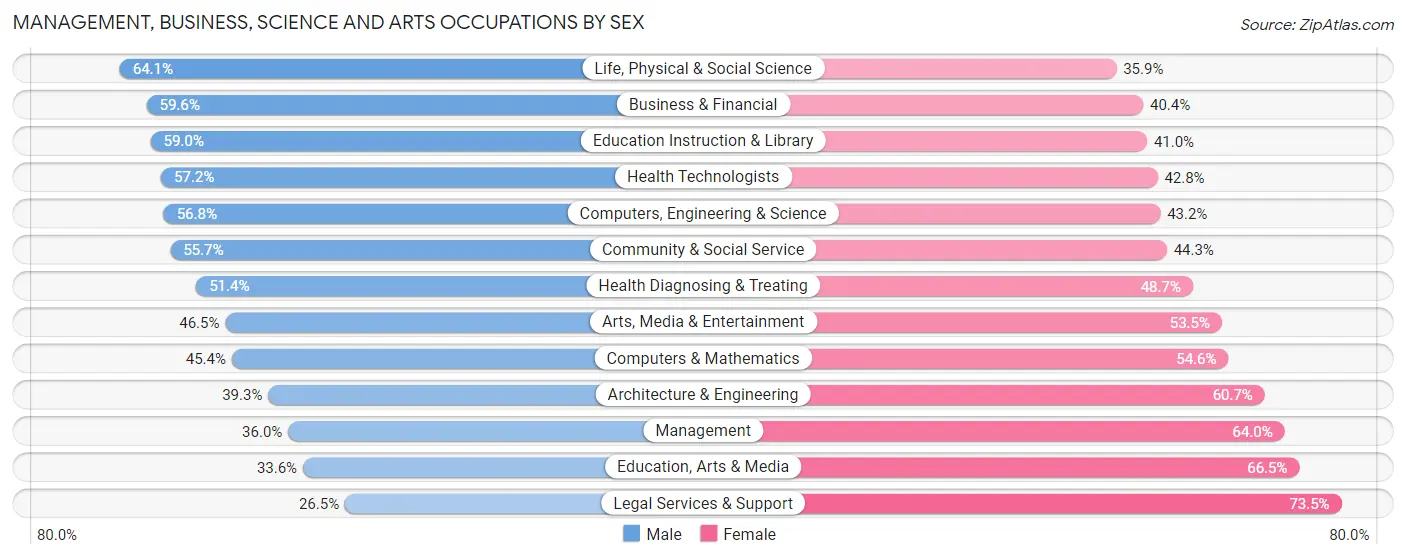
Management, Business, Science and Arts Occupations by Sex
Within the Management, Business, Science and Arts occupations in Stanford, the most male-oriented occupations are Life, Physical & Social Science (64.1%), Business & Financial (59.6%), and Education Instruction & Library (59.0%), while the most female-oriented occupations are Legal Services & Support (73.5%), Education, Arts & Media (66.4%), and Management (64.0%).
| Occupation | Male | Female |
| Management | 152 (36.0%) | 270 (64.0%) |
| Business & Financial | 99 (59.6%) | 67 (40.4%) |
| Computers, Engineering & Science | 713 (56.8%) | 543 (43.2%) |
| Computers & Mathematics | 114 (45.4%) | 137 (54.6%) |
| Architecture & Engineering | 72 (39.3%) | 111 (60.7%) |
| Life, Physical & Social Science | 527 (64.1%) | 295 (35.9%) |
| Community & Social Service | 1,792 (55.7%) | 1,426 (44.3%) |
| Education, Arts & Media | 51 (33.6%) | 101 (66.4%) |
| Legal Services & Support | 39 (26.5%) | 108 (73.5%) |
| Education Instruction & Library | 1,629 (59.0%) | 1,133 (41.0%) |
| Arts, Media & Entertainment | 73 (46.5%) | 84 (53.5%) |
| Health Diagnosing & Treating | 114 (51.3%) | 108 (48.6%) |
| Health Technologists | 95 (57.2%) | 71 (42.8%) |
| Total (Category) | 2,870 (54.3%) | 2,414 (45.7%) |
| Total (Overall) | 3,860 (51.3%) | 3,667 (48.7%) |
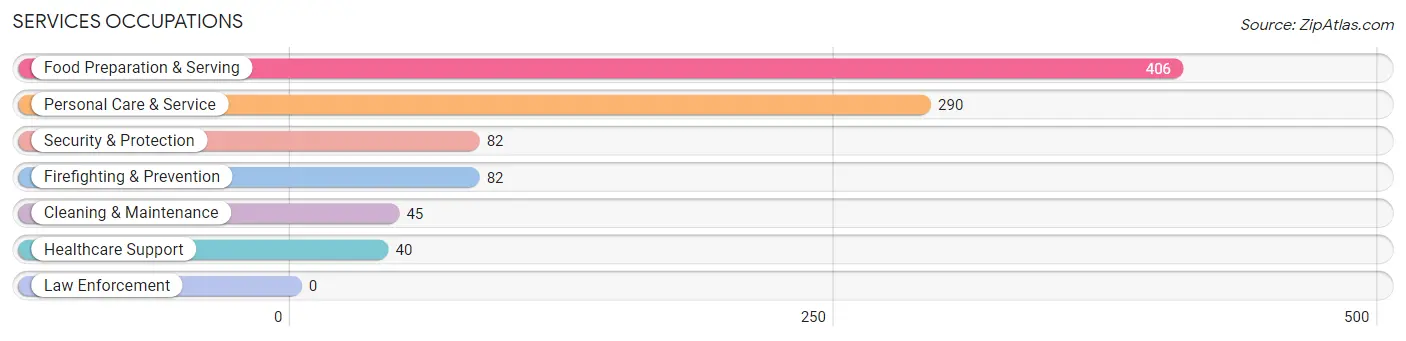
Services Occupations
The most common Services occupations in Stanford are Food Preparation & Serving (406 | 5.4%), Personal Care & Service (290 | 3.8%), Security & Protection (82 | 1.1%), Firefighting & Prevention (82 | 1.1%), and Cleaning & Maintenance (45 | 0.6%).
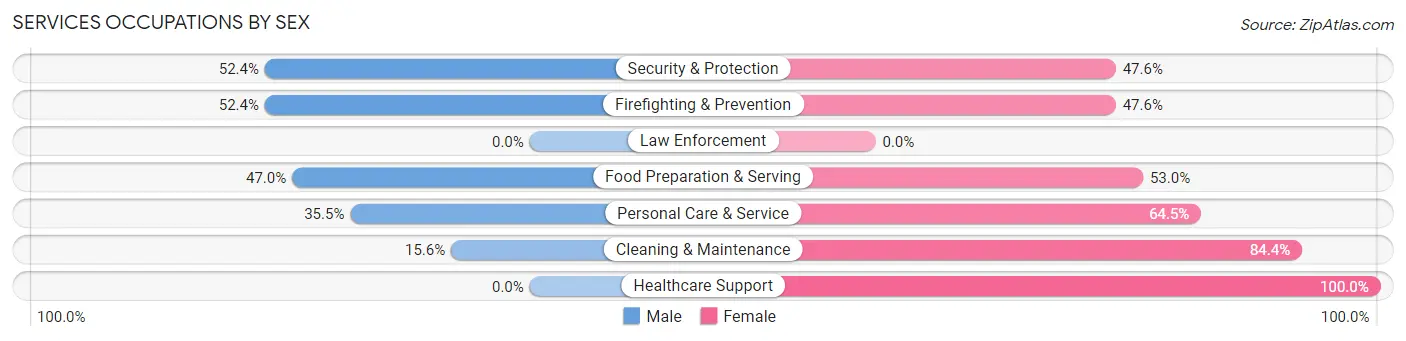
Services Occupations by Sex
Within the Services occupations in Stanford, the most male-oriented occupations are Security & Protection (52.4%), Firefighting & Prevention (52.4%), and Food Preparation & Serving (47.0%), while the most female-oriented occupations are Healthcare Support (100.0%), Cleaning & Maintenance (84.4%), and Personal Care & Service (64.5%).
| Occupation | Male | Female |
| Healthcare Support | 0 (0.0%) | 40 (100.0%) |
| Security & Protection | 43 (52.4%) | 39 (47.6%) |
| Firefighting & Prevention | 43 (52.4%) | 39 (47.6%) |
| Law Enforcement | 0 (0.0%) | 0 (0.0%) |
| Food Preparation & Serving | 191 (47.0%) | 215 (53.0%) |
| Cleaning & Maintenance | 7 (15.6%) | 38 (84.4%) |
| Personal Care & Service | 103 (35.5%) | 187 (64.5%) |
| Total (Category) | 344 (39.9%) | 519 (60.1%) |
| Total (Overall) | 3,860 (51.3%) | 3,667 (48.7%) |
Sales and Office Occupations
The most common Sales and Office occupations in Stanford are Office & Administration (602 | 8.0%), and Sales & Related (467 | 6.2%).
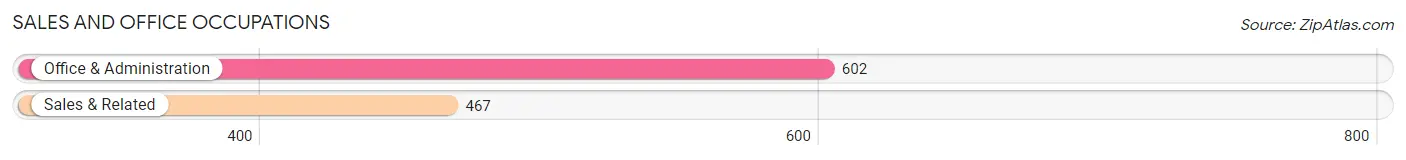
Sales and Office Occupations by Sex
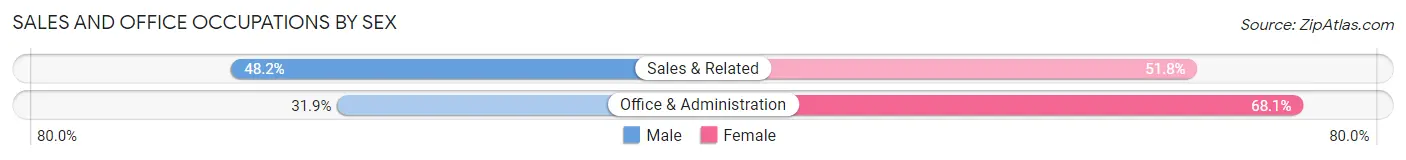
| Occupation | Male | Female |
| Sales & Related | 225 (48.2%) | 242 (51.8%) |
| Office & Administration | 192 (31.9%) | 410 (68.1%) |
| Total (Category) | 417 (39.0%) | 652 (61.0%) |
| Total (Overall) | 3,860 (51.3%) | 3,667 (48.7%) |
Natural Resources, Construction and Maintenance Occupations
The most common Natural Resources, Construction and Maintenance occupations in Stanford are Construction & Extraction (112 | 1.5%), and Installation, Maintenance & Repair (14 | 0.2%).
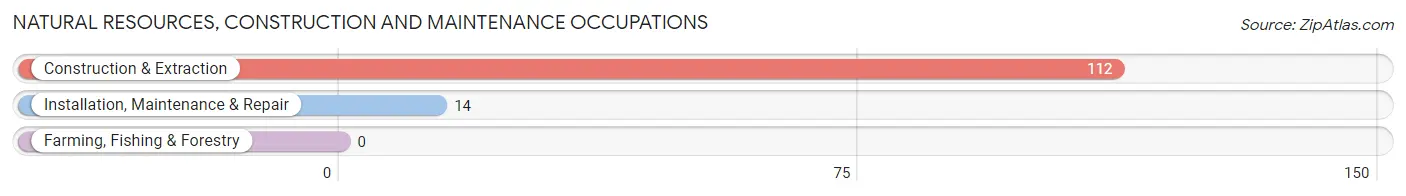
Natural Resources, Construction and Maintenance Occupations by Sex
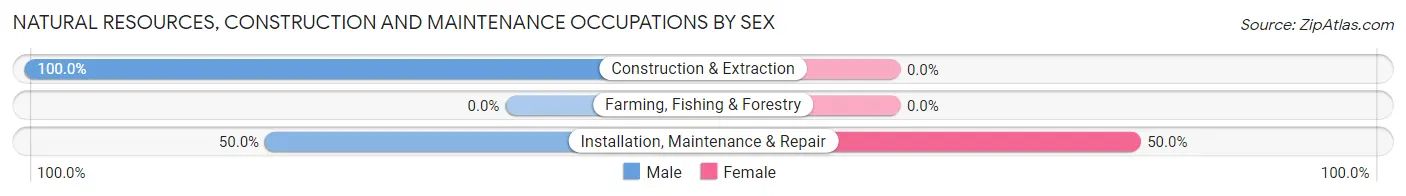
| Occupation | Male | Female |
| Farming, Fishing & Forestry | 0 (0.0%) | 0 (0.0%) |
| Construction & Extraction | 112 (100.0%) | 0 (0.0%) |
| Installation, Maintenance & Repair | 7 (50.0%) | 7 (50.0%) |
| Total (Category) | 119 (94.4%) | 7 (5.6%) |
| Total (Overall) | 3,860 (51.3%) | 3,667 (48.7%) |
Production, Transportation and Moving Occupations
The most common Production, Transportation and Moving occupations in Stanford are Material Moving (111 | 1.5%), Production (45 | 0.6%), and Transportation (29 | 0.4%).
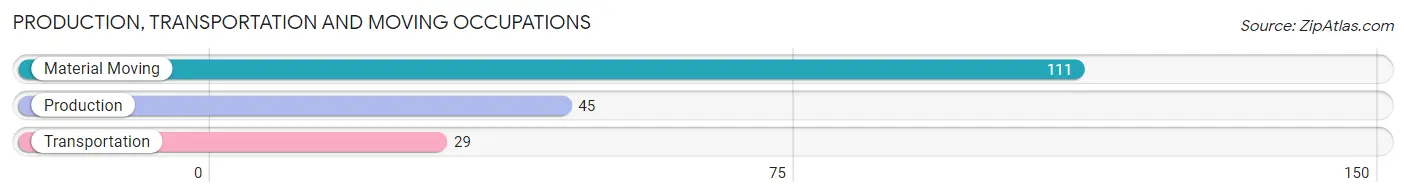
Production, Transportation and Moving Occupations by Sex
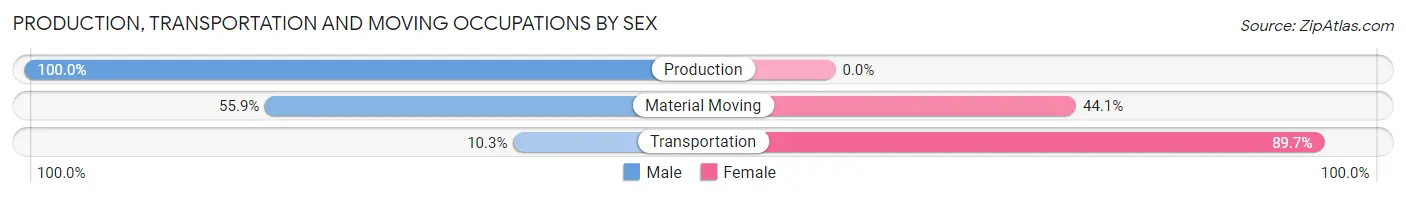
| Occupation | Male | Female |
| Production | 45 (100.0%) | 0 (0.0%) |
| Transportation | 3 (10.3%) | 26 (89.7%) |
| Material Moving | 62 (55.9%) | 49 (44.1%) |
| Total (Category) | 110 (59.5%) | 75 (40.5%) |
| Total (Overall) | 3,860 (51.3%) | 3,667 (48.7%) |
Employment Industries by Sex in Stanford
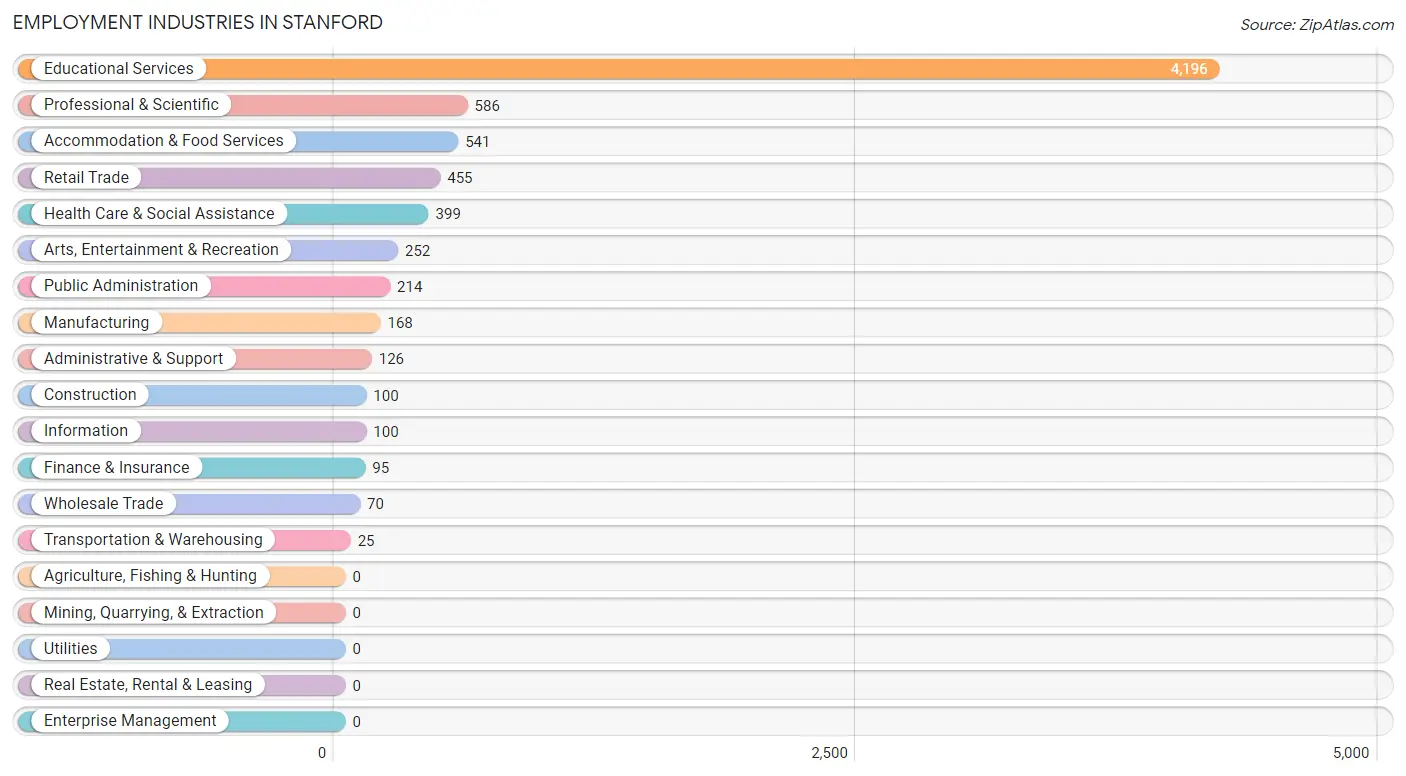
Employment Industries in Stanford
The major employment industries in Stanford include Educational Services (4,196 | 55.7%), Professional & Scientific (586 | 7.8%), Accommodation & Food Services (541 | 7.2%), Retail Trade (455 | 6.0%), and Health Care & Social Assistance (399 | 5.3%).
Employment Industries by Sex in Stanford
The Stanford industries that see more men than women are Construction (100.0%), Manufacturing (76.8%), and Wholesale Trade (75.7%), whereas the industries that tend to have a higher number of women are Professional & Scientific (80.0%), Public Administration (78.5%), and Arts, Entertainment & Recreation (78.2%).
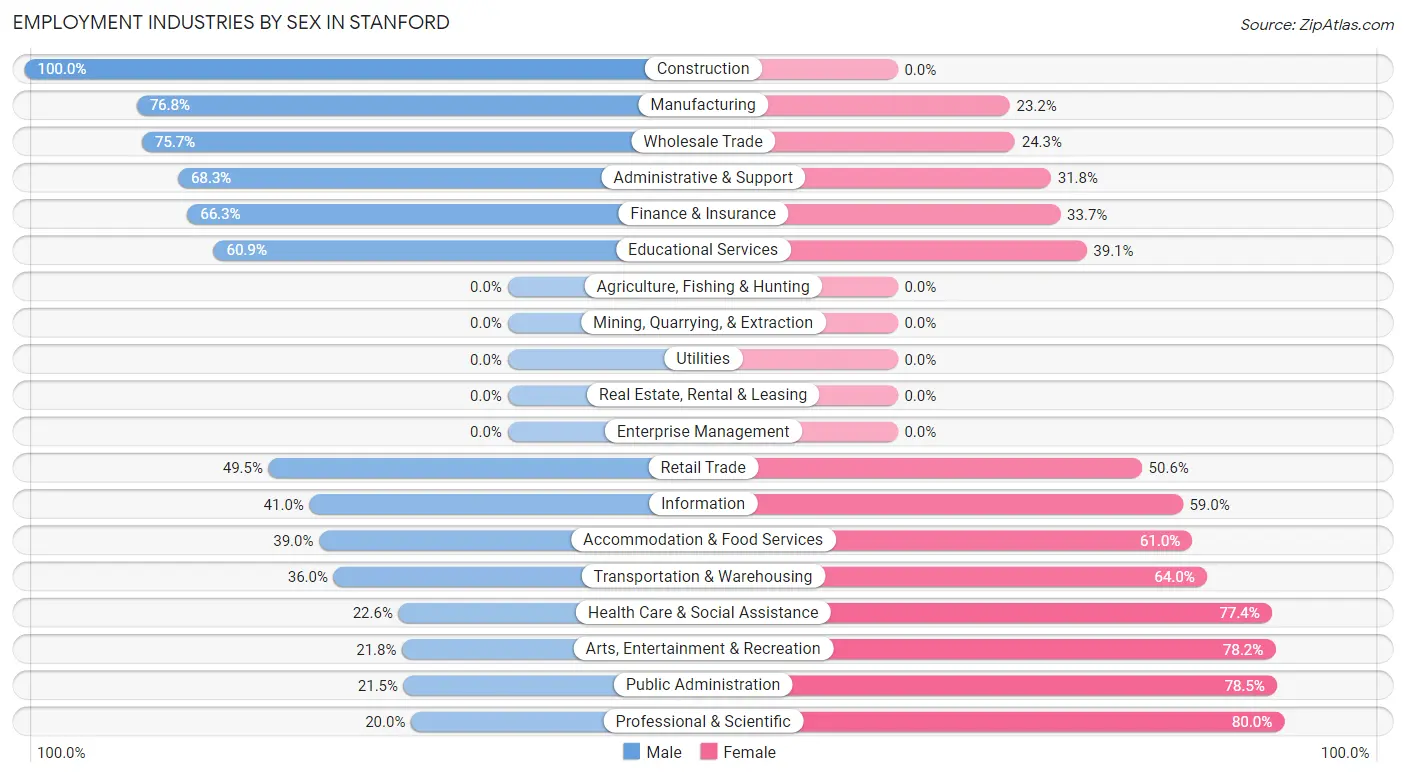
| Industry | Male | Female |
| Agriculture, Fishing & Hunting | 0 (0.0%) | 0 (0.0%) |
| Mining, Quarrying, & Extraction | 0 (0.0%) | 0 (0.0%) |
| Construction | 100 (100.0%) | 0 (0.0%) |
| Manufacturing | 129 (76.8%) | 39 (23.2%) |
| Wholesale Trade | 53 (75.7%) | 17 (24.3%) |
| Retail Trade | 225 (49.4%) | 230 (50.5%) |
| Transportation & Warehousing | 9 (36.0%) | 16 (64.0%) |
| Utilities | 0 (0.0%) | 0 (0.0%) |
| Information | 41 (41.0%) | 59 (59.0%) |
| Finance & Insurance | 63 (66.3%) | 32 (33.7%) |
| Real Estate, Rental & Leasing | 0 (0.0%) | 0 (0.0%) |
| Professional & Scientific | 117 (20.0%) | 469 (80.0%) |
| Enterprise Management | 0 (0.0%) | 0 (0.0%) |
| Administrative & Support | 86 (68.2%) | 40 (31.8%) |
| Educational Services | 2,555 (60.9%) | 1,641 (39.1%) |
| Health Care & Social Assistance | 90 (22.6%) | 309 (77.4%) |
| Arts, Entertainment & Recreation | 55 (21.8%) | 197 (78.2%) |
| Accommodation & Food Services | 211 (39.0%) | 330 (61.0%) |
| Public Administration | 46 (21.5%) | 168 (78.5%) |
| Total | 3,860 (51.3%) | 3,667 (48.7%) |
Education in Stanford
School Enrollment in Stanford
The most common levels of schooling among the 14,093 students in Stanford are college / undergraduate (8,498 | 60.3%), graduate / professional (4,846 | 34.4%), and middle school (198 | 1.4%).
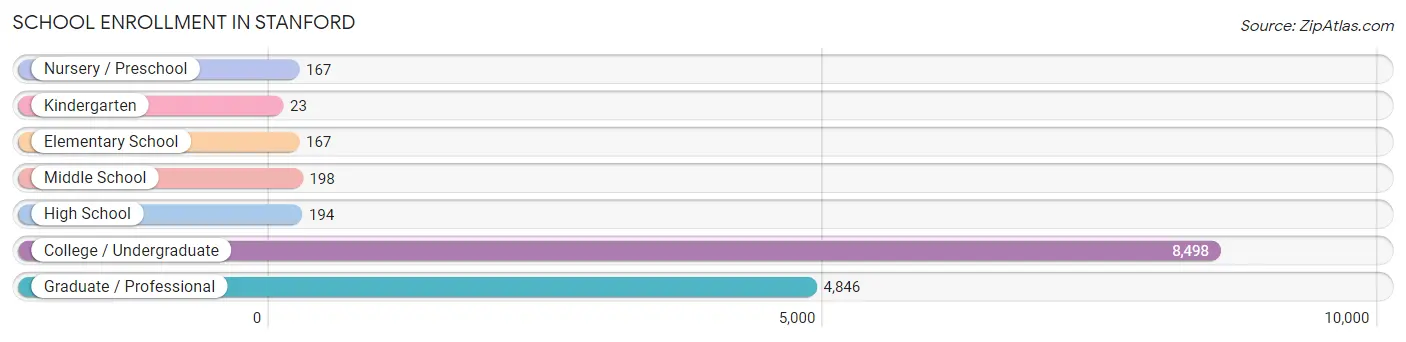
| School Level | # Students | % Students |
| Nursery / Preschool | 167 | 1.2% |
| Kindergarten | 23 | 0.2% |
| Elementary School | 167 | 1.2% |
| Middle School | 198 | 1.4% |
| High School | 194 | 1.4% |
| College / Undergraduate | 8,498 | 60.3% |
| Graduate / Professional | 4,846 | 34.4% |
| Total | 14,093 | 100.0% |
School Enrollment by Age by Funding Source in Stanford
Out of a total of 14,093 students who are enrolled in schools in Stanford, 9,048 (64.2%) attend a private institution, while the remaining 5,045 (35.8%) are enrolled in public schools. The age group of 25 to 34 year olds has the highest likelihood of being enrolled in private schools, with 2,707 (89.7% in the age bracket) enrolled. Conversely, the age group of 10 to 14 year olds has the lowest likelihood of being enrolled in a private school, with 239 (88.8% in the age bracket) attending a public institution.
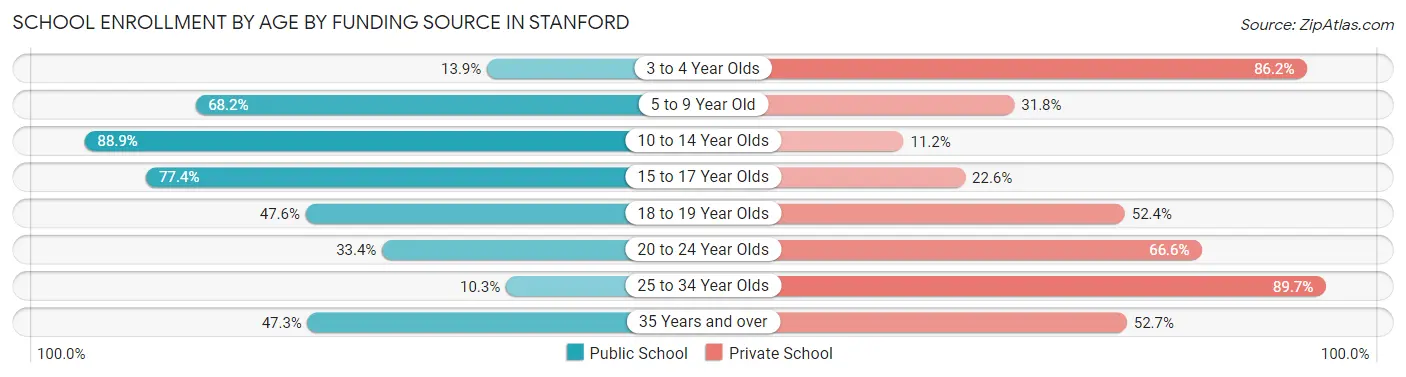
| Age Bracket | Public School | Private School |
| 3 to 4 Year Olds | 18 (13.9%) | 112 (86.2%) |
| 5 to 9 Year Old | 133 (68.2%) | 62 (31.8%) |
| 10 to 14 Year Olds | 239 (88.8%) | 30 (11.2%) |
| 15 to 17 Year Olds | 236 (77.4%) | 69 (22.6%) |
| 18 to 19 Year Olds | 2,201 (47.6%) | 2,420 (52.4%) |
| 20 to 24 Year Olds | 1,726 (33.4%) | 3,443 (66.6%) |
| 25 to 34 Year Olds | 312 (10.3%) | 2,707 (89.7%) |
| 35 Years and over | 182 (47.3%) | 203 (52.7%) |
| Total | 5,045 (35.8%) | 9,048 (64.2%) |
Educational Attainment by Field of Study in Stanford
Bio, nature & agricultural (1,323 | 20.3%), engineering (1,196 | 18.3%), social sciences (720 | 11.0%), physical & health sciences (523 | 8.0%), and computers & mathematics (522 | 8.0%) are the most common fields of study among 6,530 individuals in Stanford who have obtained a bachelor's degree or higher.
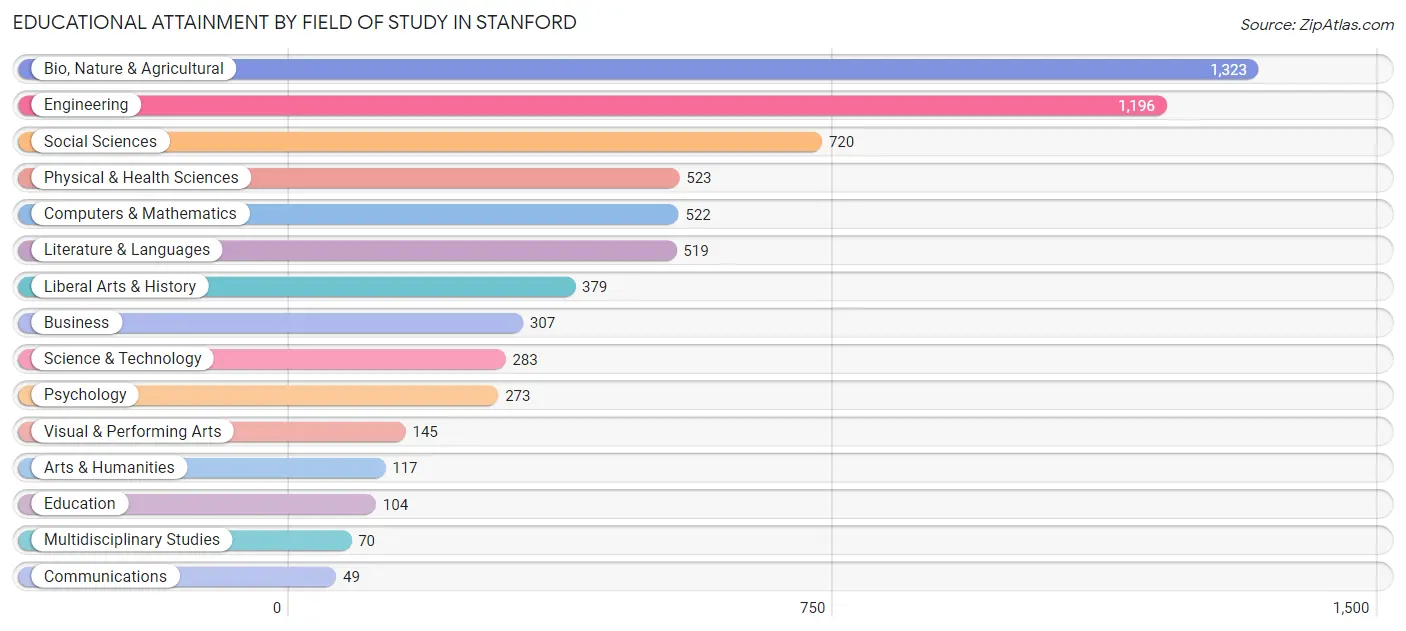
| Field of Study | # Graduates | % Graduates |
| Computers & Mathematics | 522 | 8.0% |
| Bio, Nature & Agricultural | 1,323 | 20.3% |
| Physical & Health Sciences | 523 | 8.0% |
| Psychology | 273 | 4.2% |
| Social Sciences | 720 | 11.0% |
| Engineering | 1,196 | 18.3% |
| Multidisciplinary Studies | 70 | 1.1% |
| Science & Technology | 283 | 4.3% |
| Business | 307 | 4.7% |
| Education | 104 | 1.6% |
| Literature & Languages | 519 | 8.0% |
| Liberal Arts & History | 379 | 5.8% |
| Visual & Performing Arts | 145 | 2.2% |
| Communications | 49 | 0.7% |
| Arts & Humanities | 117 | 1.8% |
| Total | 6,530 | 100.0% |
Transportation & Commute in Stanford
Vehicle Availability by Sex in Stanford
The most prevalent vehicle ownership categories in Stanford are males with 1 vehicle (734, accounting for 36.8%) and females with 1 vehicle (554, making up 46.4%).
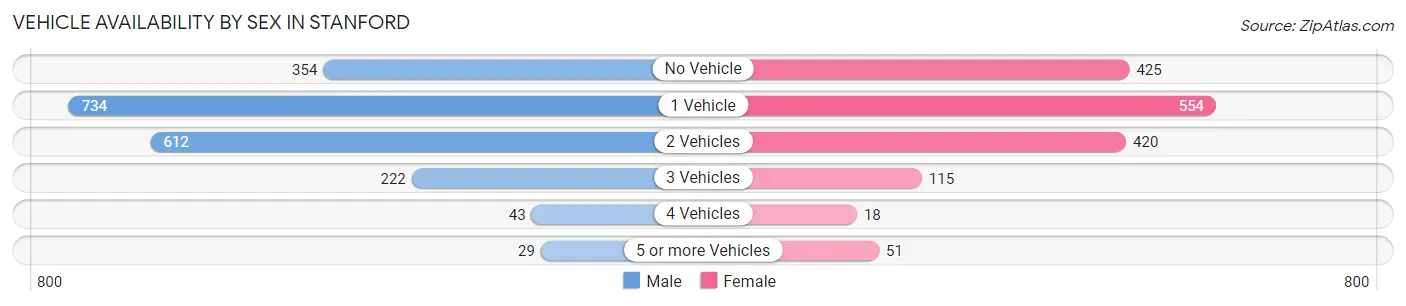
| Vehicles Available | Male | Female |
| No Vehicle | 354 (17.7%) | 425 (26.9%) |
| 1 Vehicle | 734 (36.8%) | 554 (35.0%) |
| 2 Vehicles | 612 (30.7%) | 420 (26.5%) |
| 3 Vehicles | 222 (11.1%) | 115 (7.3%) |
| 4 Vehicles | 43 (2.2%) | 18 (1.1%) |
| 5 or more Vehicles | 29 (1.5%) | 51 (3.2%) |
| Total | 1,994 (100.0%) | 1,583 (100.0%) |
Commute Time in Stanford
The most frequently occuring commute durations in Stanford are 10 to 14 minutes (1,489 commuters, 25.5%), 5 to 9 minutes (1,439 commuters, 24.7%), and 15 to 19 minutes (1,260 commuters, 21.6%).
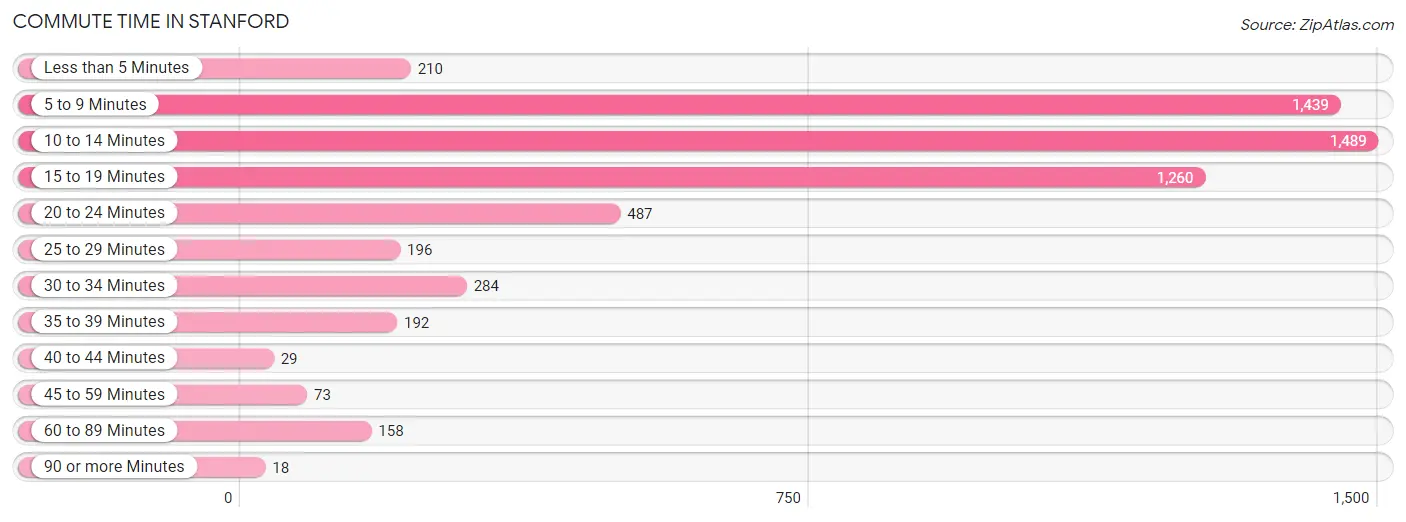
| Commute Time | # Commuters | % Commuters |
| Less than 5 Minutes | 210 | 3.6% |
| 5 to 9 Minutes | 1,439 | 24.7% |
| 10 to 14 Minutes | 1,489 | 25.5% |
| 15 to 19 Minutes | 1,260 | 21.6% |
| 20 to 24 Minutes | 487 | 8.4% |
| 25 to 29 Minutes | 196 | 3.4% |
| 30 to 34 Minutes | 284 | 4.9% |
| 35 to 39 Minutes | 192 | 3.3% |
| 40 to 44 Minutes | 29 | 0.5% |
| 45 to 59 Minutes | 73 | 1.3% |
| 60 to 89 Minutes | 158 | 2.7% |
| 90 or more Minutes | 18 | 0.3% |
Commute Time by Sex in Stanford
The most common commute times in Stanford are 10 to 14 minutes (901 commuters, 30.2%) for males and 5 to 9 minutes (720 commuters, 25.2%) for females.
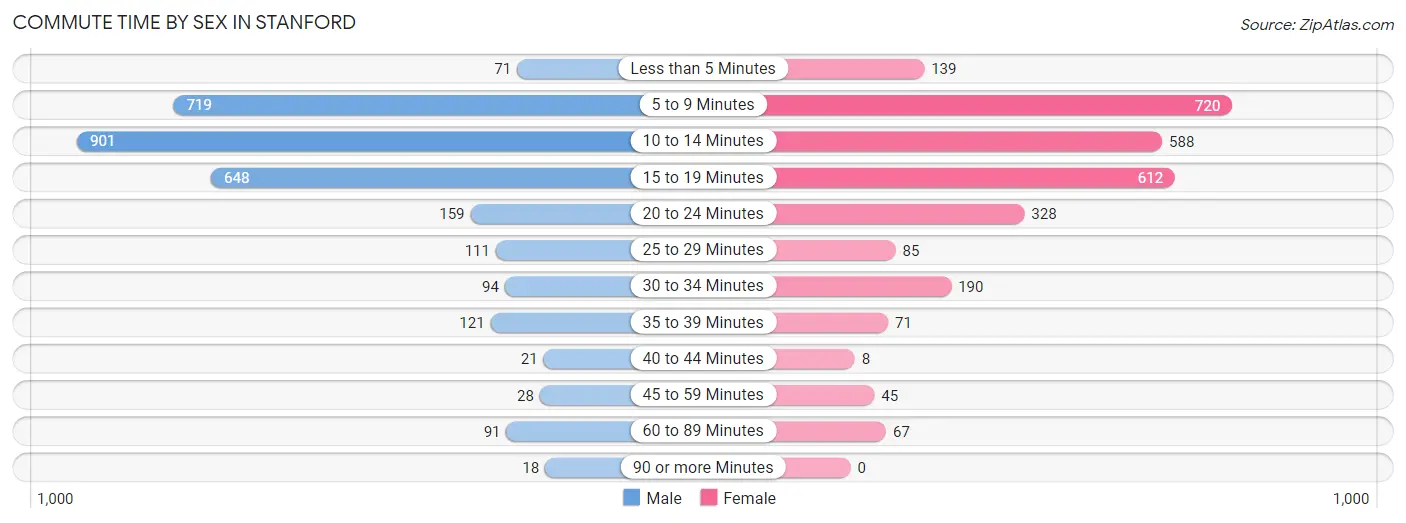
| Commute Time | Male | Female |
| Less than 5 Minutes | 71 (2.4%) | 139 (4.9%) |
| 5 to 9 Minutes | 719 (24.1%) | 720 (25.2%) |
| 10 to 14 Minutes | 901 (30.2%) | 588 (20.6%) |
| 15 to 19 Minutes | 648 (21.7%) | 612 (21.4%) |
| 20 to 24 Minutes | 159 (5.3%) | 328 (11.5%) |
| 25 to 29 Minutes | 111 (3.7%) | 85 (3.0%) |
| 30 to 34 Minutes | 94 (3.2%) | 190 (6.7%) |
| 35 to 39 Minutes | 121 (4.1%) | 71 (2.5%) |
| 40 to 44 Minutes | 21 (0.7%) | 8 (0.3%) |
| 45 to 59 Minutes | 28 (0.9%) | 45 (1.6%) |
| 60 to 89 Minutes | 91 (3.0%) | 67 (2.4%) |
| 90 or more Minutes | 18 (0.6%) | 0 (0.0%) |
Time of Departure to Work by Sex in Stanford
The most frequent times of departure to work in Stanford are 9:00 AM to 9:59 AM (803, 26.9%) for males and 12:00 PM to 3:59 PM (712, 25.0%) for females.
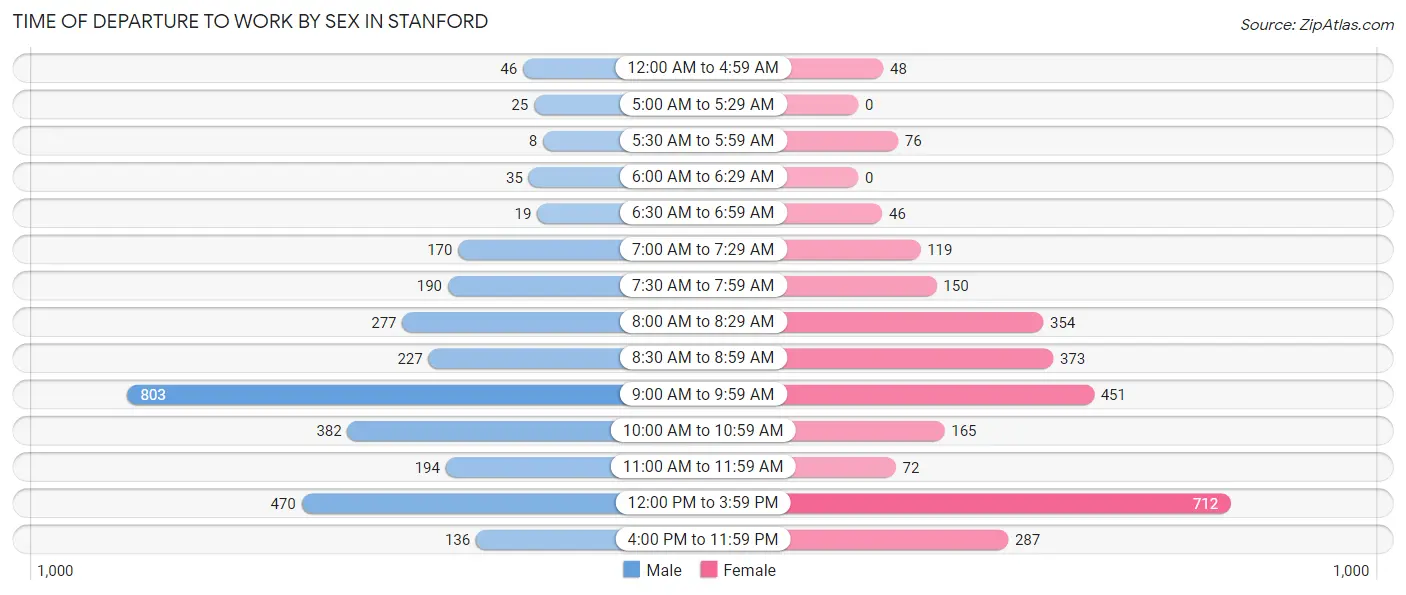
| Time of Departure | Male | Female |
| 12:00 AM to 4:59 AM | 46 (1.5%) | 48 (1.7%) |
| 5:00 AM to 5:29 AM | 25 (0.8%) | 0 (0.0%) |
| 5:30 AM to 5:59 AM | 8 (0.3%) | 76 (2.7%) |
| 6:00 AM to 6:29 AM | 35 (1.2%) | 0 (0.0%) |
| 6:30 AM to 6:59 AM | 19 (0.6%) | 46 (1.6%) |
| 7:00 AM to 7:29 AM | 170 (5.7%) | 119 (4.2%) |
| 7:30 AM to 7:59 AM | 190 (6.4%) | 150 (5.3%) |
| 8:00 AM to 8:29 AM | 277 (9.3%) | 354 (12.4%) |
| 8:30 AM to 8:59 AM | 227 (7.6%) | 373 (13.1%) |
| 9:00 AM to 9:59 AM | 803 (26.9%) | 451 (15.8%) |
| 10:00 AM to 10:59 AM | 382 (12.8%) | 165 (5.8%) |
| 11:00 AM to 11:59 AM | 194 (6.5%) | 72 (2.5%) |
| 12:00 PM to 3:59 PM | 470 (15.8%) | 712 (25.0%) |
| 4:00 PM to 11:59 PM | 136 (4.6%) | 287 (10.1%) |
| Total | 2,982 (100.0%) | 2,853 (100.0%) |
Housing Occupancy in Stanford
Occupancy by Ownership in Stanford
Of the total 3,629 dwellings in Stanford, owner-occupied units account for 929 (25.6%), while renter-occupied units make up 2,700 (74.4%).
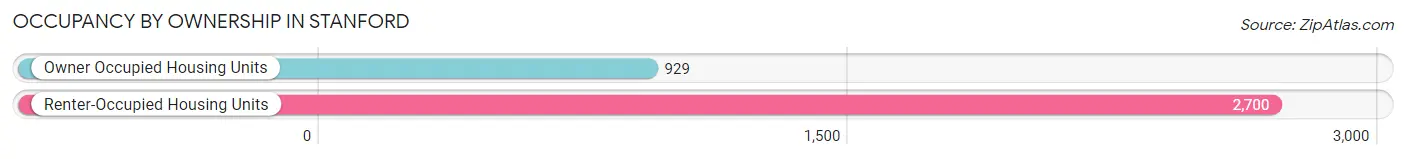
| Occupancy | # Housing Units | % Housing Units |
| Owner Occupied Housing Units | 929 | 25.6% |
| Renter-Occupied Housing Units | 2,700 | 74.4% |
| Total Occupied Housing Units | 3,629 | 100.0% |
Occupancy by Household Size in Stanford
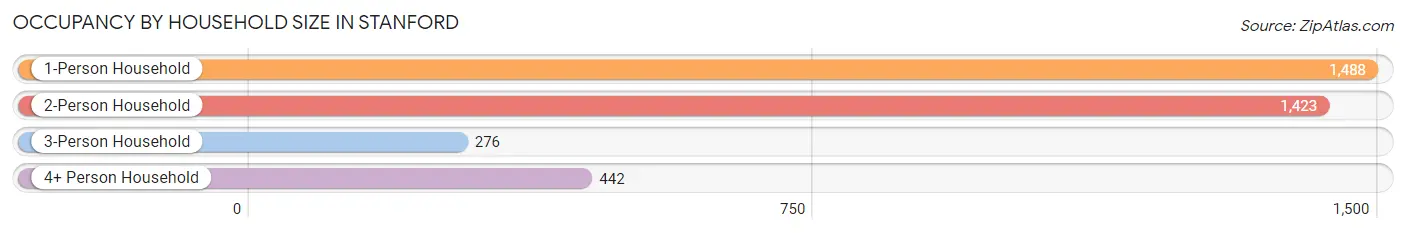
| Household Size | # Housing Units | % Housing Units |
| 1-Person Household | 1,488 | 41.0% |
| 2-Person Household | 1,423 | 39.2% |
| 3-Person Household | 276 | 7.6% |
| 4+ Person Household | 442 | 12.2% |
| Total Housing Units | 3,629 | 100.0% |
Occupancy by Ownership by Household Size in Stanford
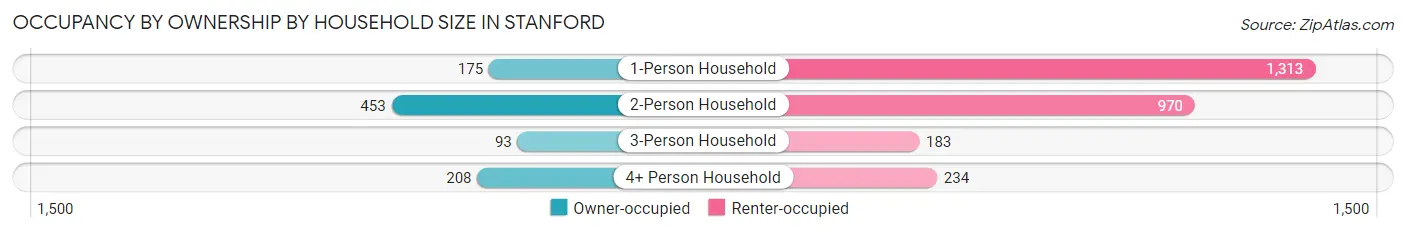
| Household Size | Owner-occupied | Renter-occupied |
| 1-Person Household | 175 (11.8%) | 1,313 (88.2%) |
| 2-Person Household | 453 (31.8%) | 970 (68.2%) |
| 3-Person Household | 93 (33.7%) | 183 (66.3%) |
| 4+ Person Household | 208 (47.1%) | 234 (52.9%) |
| Total Housing Units | 929 (25.6%) | 2,700 (74.4%) |
Occupancy by Educational Attainment in Stanford
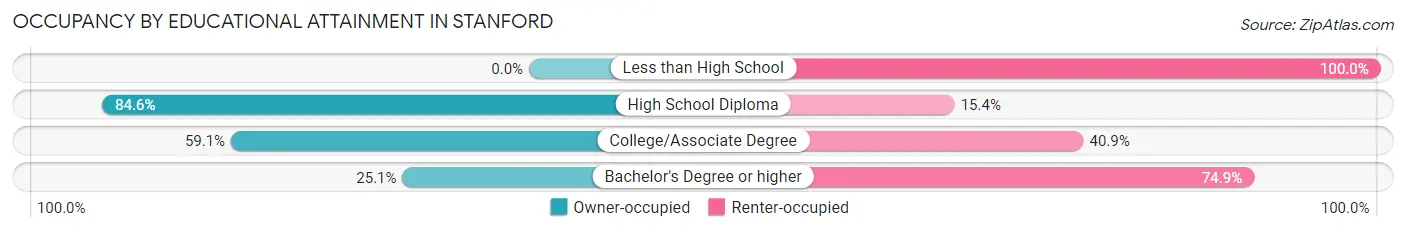
| Household Size | Owner-occupied | Renter-occupied |
| Less than High School | 0 (0.0%) | 49 (100.0%) |
| High School Diploma | 22 (84.6%) | 4 (15.4%) |
| College/Associate Degree | 26 (59.1%) | 18 (40.9%) |
| Bachelor's Degree or higher | 881 (25.1%) | 2,629 (74.9%) |
Occupancy by Age of Householder in Stanford
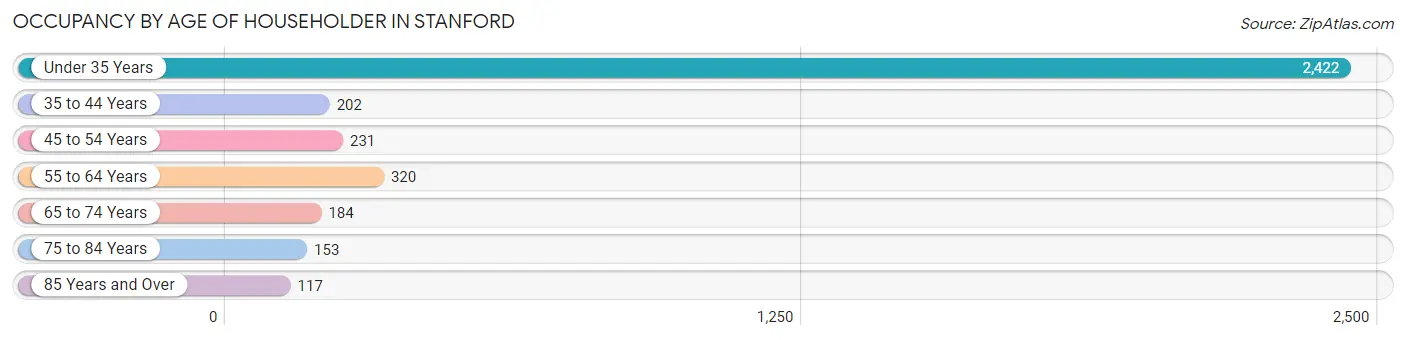
| Age Bracket | # Households | % Households |
| Under 35 Years | 2,422 | 66.7% |
| 35 to 44 Years | 202 | 5.6% |
| 45 to 54 Years | 231 | 6.4% |
| 55 to 64 Years | 320 | 8.8% |
| 65 to 74 Years | 184 | 5.1% |
| 75 to 84 Years | 153 | 4.2% |
| 85 Years and Over | 117 | 3.2% |
| Total | 3,629 | 100.0% |
Housing Finances in Stanford
Median Income by Occupancy in Stanford
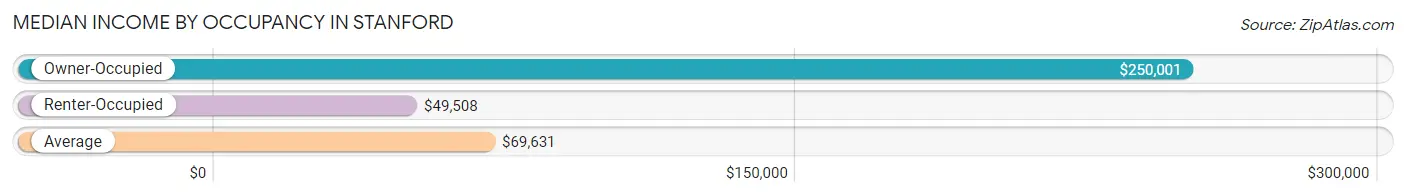
| Occupancy Type | # Households | Median Income |
| Owner-Occupied | 929 (25.6%) | $250,001 |
| Renter-Occupied | 2,700 (74.4%) | $49,508 |
| Average | 3,629 (100.0%) | $69,631 |
Occupancy by Householder Income Bracket in Stanford
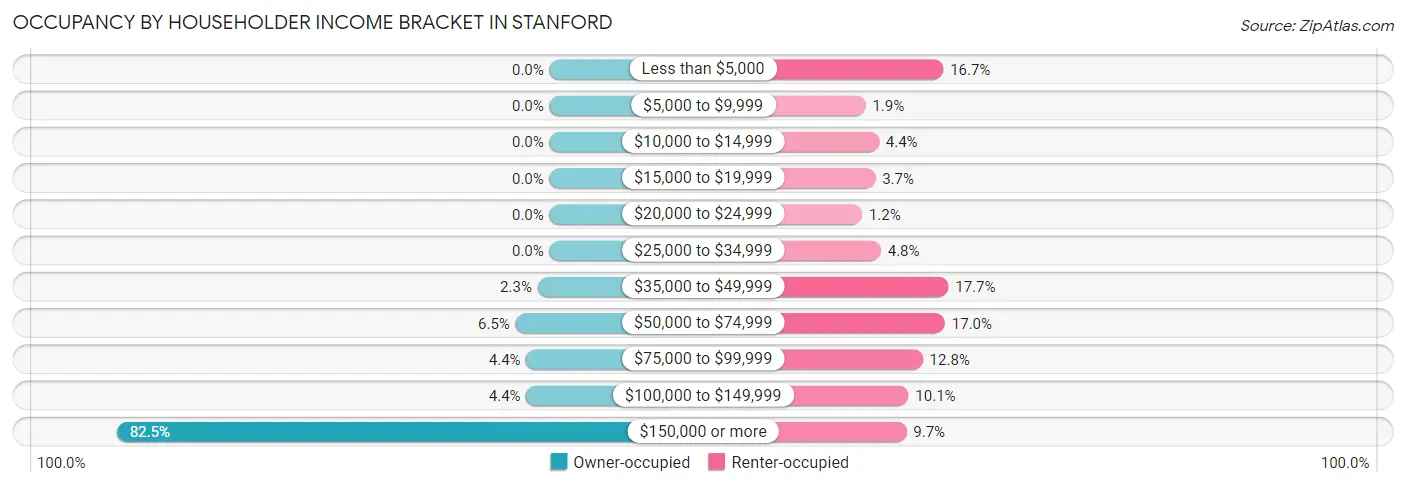
| Income Bracket | Owner-occupied | Renter-occupied |
| Less than $5,000 | 0 (0.0%) | 451 (16.7%) |
| $5,000 to $9,999 | 0 (0.0%) | 51 (1.9%) |
| $10,000 to $14,999 | 0 (0.0%) | 120 (4.4%) |
| $15,000 to $19,999 | 0 (0.0%) | 101 (3.7%) |
| $20,000 to $24,999 | 0 (0.0%) | 33 (1.2%) |
| $25,000 to $34,999 | 0 (0.0%) | 130 (4.8%) |
| $35,000 to $49,999 | 21 (2.3%) | 477 (17.7%) |
| $50,000 to $74,999 | 60 (6.5%) | 459 (17.0%) |
| $75,000 to $99,999 | 41 (4.4%) | 345 (12.8%) |
| $100,000 to $149,999 | 41 (4.4%) | 272 (10.1%) |
| $150,000 or more | 766 (82.5%) | 261 (9.7%) |
| Total | 929 (100.0%) | 2,700 (100.0%) |
Monthly Housing Cost Tiers in Stanford
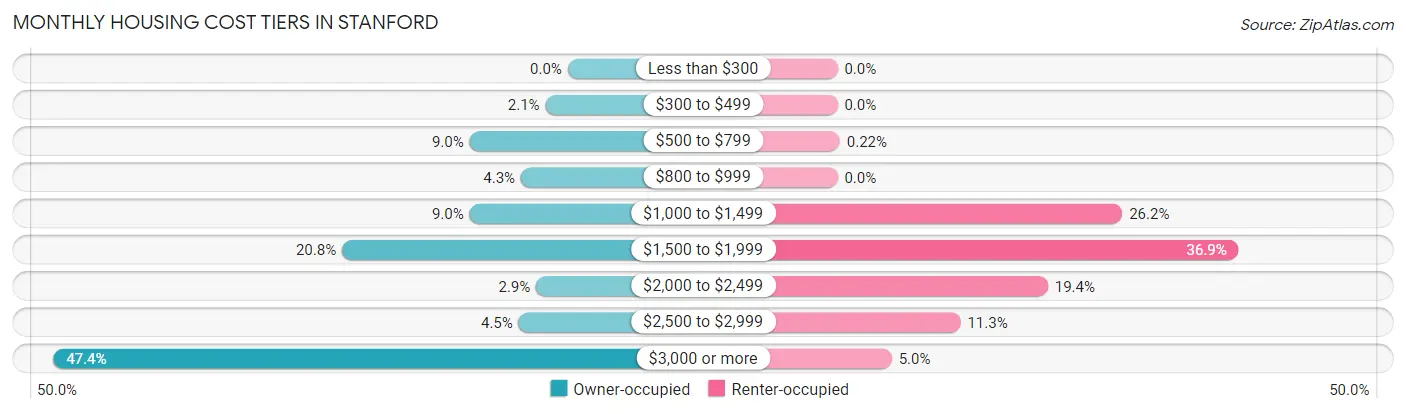
| Monthly Cost | Owner-occupied | Renter-occupied |
| Less than $300 | 0 (0.0%) | 0 (0.0%) |
| $300 to $499 | 19 (2.1%) | 0 (0.0%) |
| $500 to $799 | 84 (9.0%) | 6 (0.2%) |
| $800 to $999 | 40 (4.3%) | 0 (0.0%) |
| $1,000 to $1,499 | 84 (9.0%) | 708 (26.2%) |
| $1,500 to $1,999 | 193 (20.8%) | 997 (36.9%) |
| $2,000 to $2,499 | 27 (2.9%) | 523 (19.4%) |
| $2,500 to $2,999 | 42 (4.5%) | 306 (11.3%) |
| $3,000 or more | 440 (47.4%) | 135 (5.0%) |
| Total | 929 (100.0%) | 2,700 (100.0%) |
Physical Housing Characteristics in Stanford
Housing Structures in Stanford
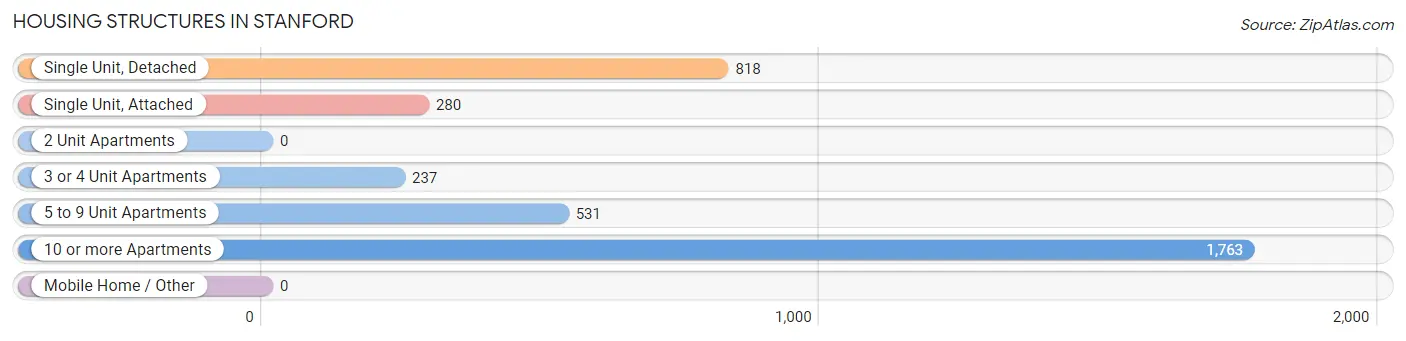
| Structure Type | # Housing Units | % Housing Units |
| Single Unit, Detached | 818 | 22.5% |
| Single Unit, Attached | 280 | 7.7% |
| 2 Unit Apartments | 0 | 0.0% |
| 3 or 4 Unit Apartments | 237 | 6.5% |
| 5 to 9 Unit Apartments | 531 | 14.6% |
| 10 or more Apartments | 1,763 | 48.6% |
| Mobile Home / Other | 0 | 0.0% |
| Total | 3,629 | 100.0% |
Housing Structures by Occupancy in Stanford
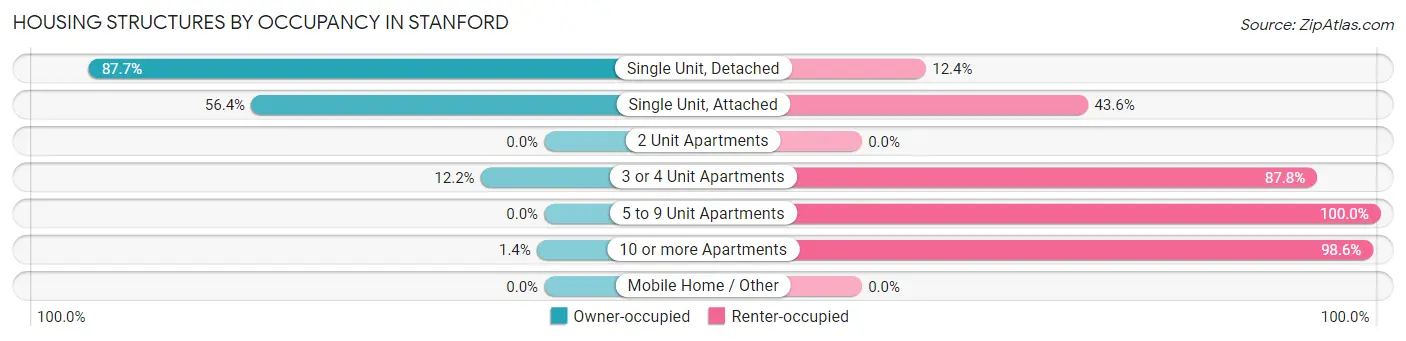
| Structure Type | Owner-occupied | Renter-occupied |
| Single Unit, Detached | 717 (87.6%) | 101 (12.3%) |
| Single Unit, Attached | 158 (56.4%) | 122 (43.6%) |
| 2 Unit Apartments | 0 (0.0%) | 0 (0.0%) |
| 3 or 4 Unit Apartments | 29 (12.2%) | 208 (87.8%) |
| 5 to 9 Unit Apartments | 0 (0.0%) | 531 (100.0%) |
| 10 or more Apartments | 25 (1.4%) | 1,738 (98.6%) |
| Mobile Home / Other | 0 (0.0%) | 0 (0.0%) |
| Total | 929 (25.6%) | 2,700 (74.4%) |
Housing Structures by Number of Rooms in Stanford
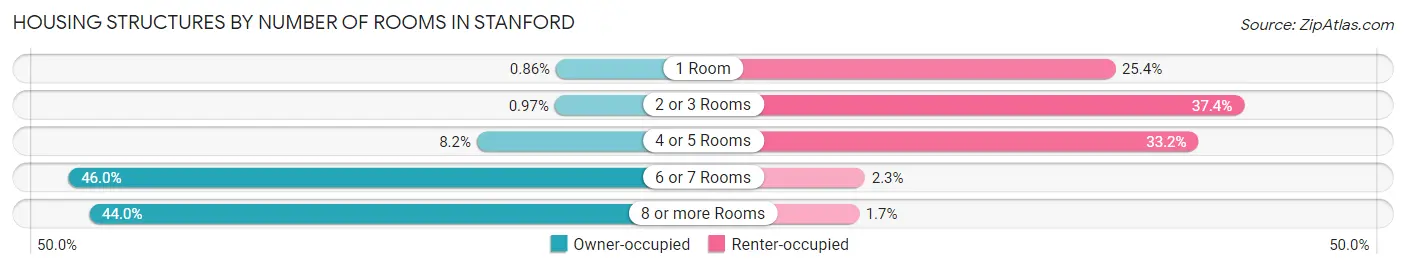
| Number of Rooms | Owner-occupied | Renter-occupied |
| 1 Room | 8 (0.9%) | 687 (25.4%) |
| 2 or 3 Rooms | 9 (1.0%) | 1,009 (37.4%) |
| 4 or 5 Rooms | 76 (8.2%) | 895 (33.2%) |
| 6 or 7 Rooms | 427 (46.0%) | 62 (2.3%) |
| 8 or more Rooms | 409 (44.0%) | 47 (1.7%) |
| Total | 929 (100.0%) | 2,700 (100.0%) |
Housing Structure by Heating Type in Stanford
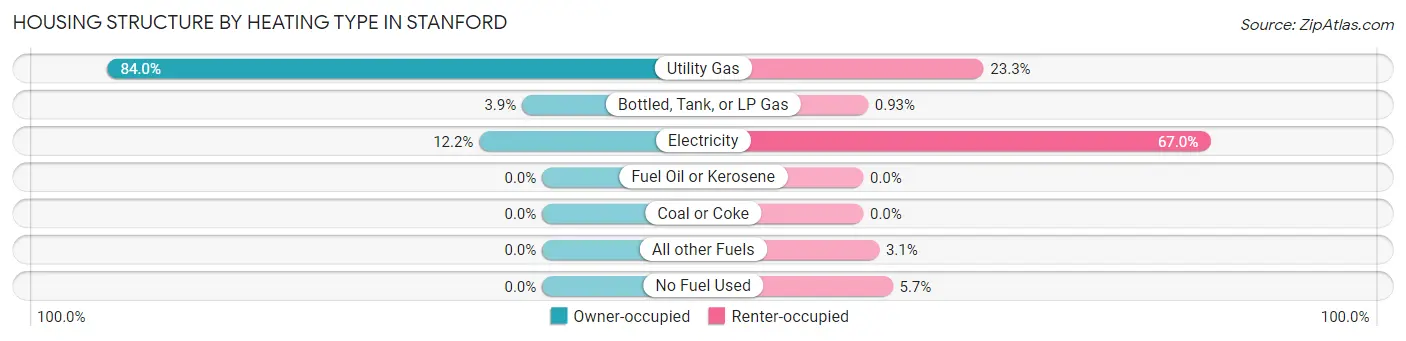
| Heating Type | Owner-occupied | Renter-occupied |
| Utility Gas | 780 (84.0%) | 628 (23.3%) |
| Bottled, Tank, or LP Gas | 36 (3.9%) | 25 (0.9%) |
| Electricity | 113 (12.2%) | 1,810 (67.0%) |
| Fuel Oil or Kerosene | 0 (0.0%) | 0 (0.0%) |
| Coal or Coke | 0 (0.0%) | 0 (0.0%) |
| All other Fuels | 0 (0.0%) | 83 (3.1%) |
| No Fuel Used | 0 (0.0%) | 154 (5.7%) |
| Total | 929 (100.0%) | 2,700 (100.0%) |
Household Vehicle Usage in Stanford
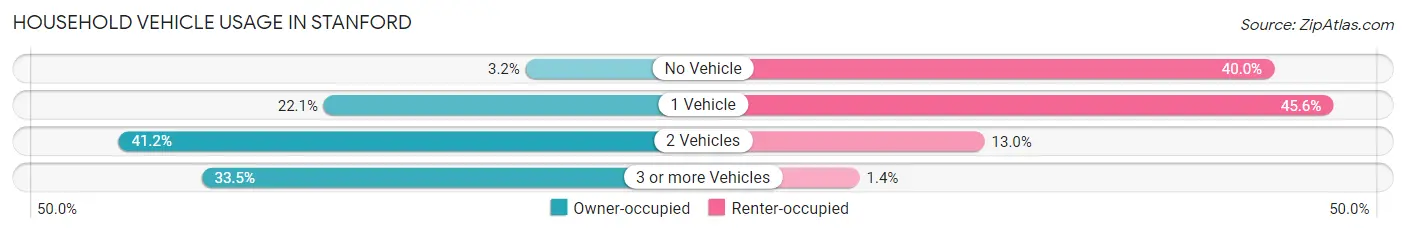
| Vehicles per Household | Owner-occupied | Renter-occupied |
| No Vehicle | 30 (3.2%) | 1,081 (40.0%) |
| 1 Vehicle | 205 (22.1%) | 1,230 (45.6%) |
| 2 Vehicles | 383 (41.2%) | 352 (13.0%) |
| 3 or more Vehicles | 311 (33.5%) | 37 (1.4%) |
| Total | 929 (100.0%) | 2,700 (100.0%) |
Real Estate & Mortgages in Stanford
Real Estate and Mortgage Overview in Stanford
| Characteristic | Without Mortgage | With Mortgage |
| Housing Units | 493 | 436 |
| Median Property Value | $1,734,500 | $2,000,001 |
| Median Household Income | $250,001 | $419 |
| Monthly Housing Costs | $1,501 | $415 |
| Real Estate Taxes | $5,589 | $0 |
Property Value by Mortgage Status in Stanford
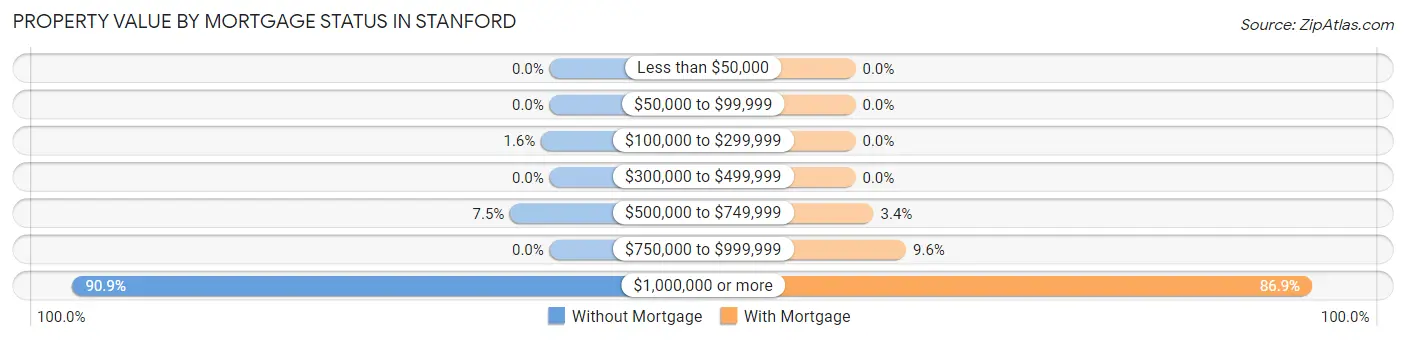
| Property Value | Without Mortgage | With Mortgage |
| Less than $50,000 | 0 (0.0%) | 0 (0.0%) |
| $50,000 to $99,999 | 0 (0.0%) | 0 (0.0%) |
| $100,000 to $299,999 | 8 (1.6%) | 0 (0.0%) |
| $300,000 to $499,999 | 0 (0.0%) | 0 (0.0%) |
| $500,000 to $749,999 | 37 (7.5%) | 15 (3.4%) |
| $750,000 to $999,999 | 0 (0.0%) | 42 (9.6%) |
| $1,000,000 or more | 448 (90.9%) | 379 (86.9%) |
| Total | 493 (100.0%) | 436 (100.0%) |
Household Income by Mortgage Status in Stanford
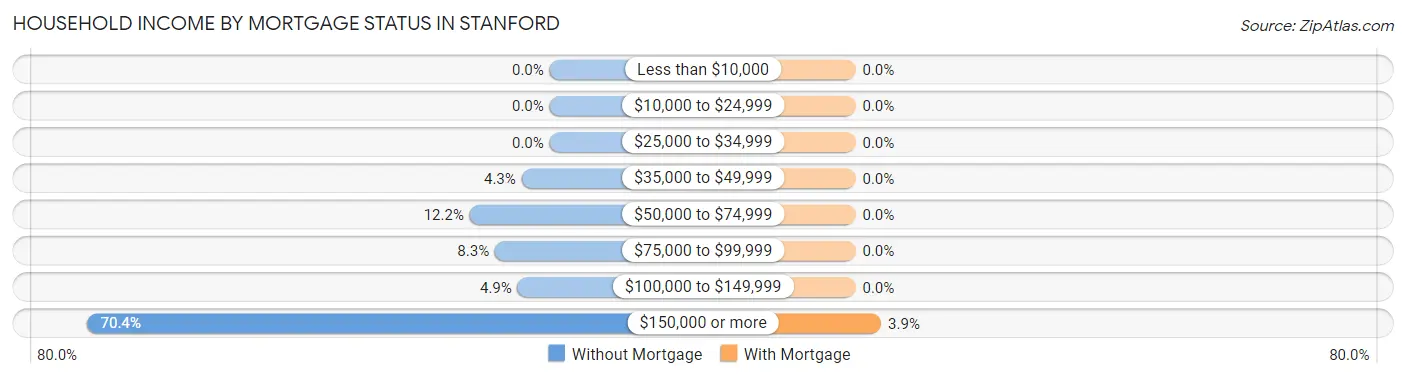
| Household Income | Without Mortgage | With Mortgage |
| Less than $10,000 | 0 (0.0%) | 0 (0.0%) |
| $10,000 to $24,999 | 0 (0.0%) | 0 (0.0%) |
| $25,000 to $34,999 | 0 (0.0%) | 0 (0.0%) |
| $35,000 to $49,999 | 21 (4.3%) | 0 (0.0%) |
| $50,000 to $74,999 | 60 (12.2%) | 0 (0.0%) |
| $75,000 to $99,999 | 41 (8.3%) | 0 (0.0%) |
| $100,000 to $149,999 | 24 (4.9%) | 0 (0.0%) |
| $150,000 or more | 347 (70.4%) | 17 (3.9%) |
| Total | 493 (100.0%) | 436 (100.0%) |
Property Value to Household Income Ratio in Stanford
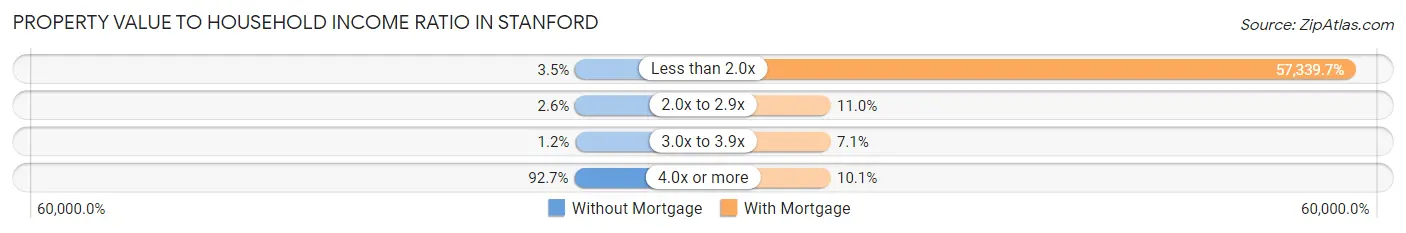
| Value-to-Income Ratio | Without Mortgage | With Mortgage |
| Less than 2.0x | 17 (3.5%) | 250,001 (57,339.7%) |
| 2.0x to 2.9x | 13 (2.6%) | 48 (11.0%) |
| 3.0x to 3.9x | 6 (1.2%) | 31 (7.1%) |
| 4.0x or more | 457 (92.7%) | 44 (10.1%) |
| Total | 493 (100.0%) | 436 (100.0%) |
Real Estate Taxes by Mortgage Status in Stanford
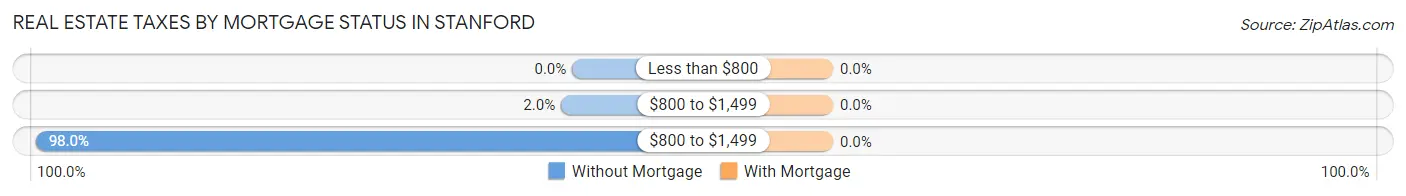
| Property Taxes | Without Mortgage | With Mortgage |
| Less than $800 | 0 (0.0%) | 0 (0.0%) |
| $800 to $1,499 | 10 (2.0%) | 0 (0.0%) |
| $800 to $1,499 | 483 (98.0%) | 0 (0.0%) |
| Total | 493 (100.0%) | 436 (100.0%) |
Health & Disability in Stanford
Health Insurance Coverage by Age in Stanford
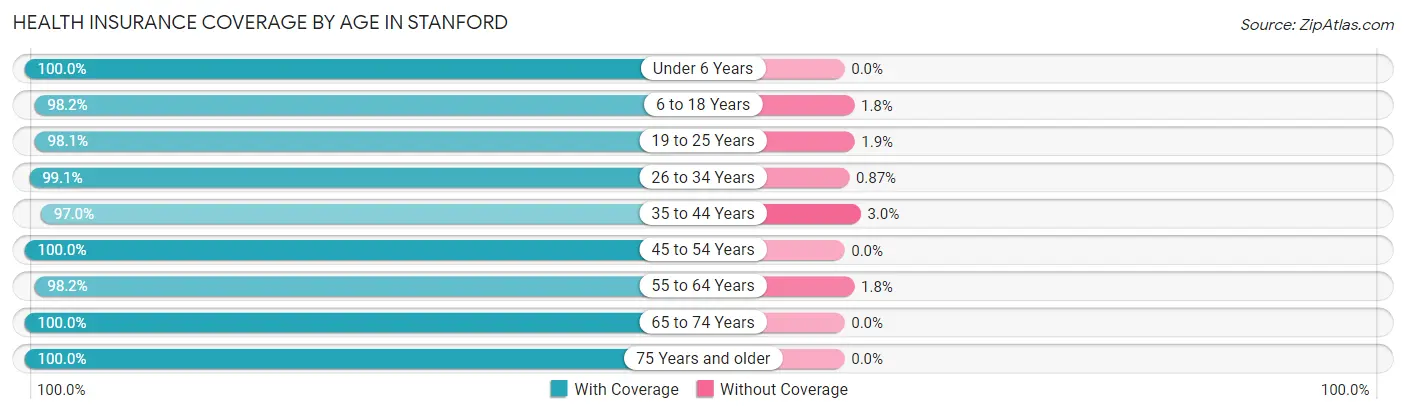
| Age Bracket | With Coverage | Without Coverage |
| Under 6 Years | 351 (100.0%) | 0 (0.0%) |
| 6 to 18 Years | 3,019 (98.2%) | 56 (1.8%) |
| 19 to 25 Years | 7,894 (98.1%) | 151 (1.9%) |
| 26 to 34 Years | 3,312 (99.1%) | 29 (0.9%) |
| 35 to 44 Years | 578 (97.0%) | 18 (3.0%) |
| 45 to 54 Years | 459 (100.0%) | 0 (0.0%) |
| 55 to 64 Years | 699 (98.2%) | 13 (1.8%) |
| 65 to 74 Years | 282 (100.0%) | 0 (0.0%) |
| 75 Years and older | 365 (100.0%) | 0 (0.0%) |
| Total | 16,959 (98.5%) | 267 (1.5%) |
Health Insurance Coverage by Citizenship Status in Stanford
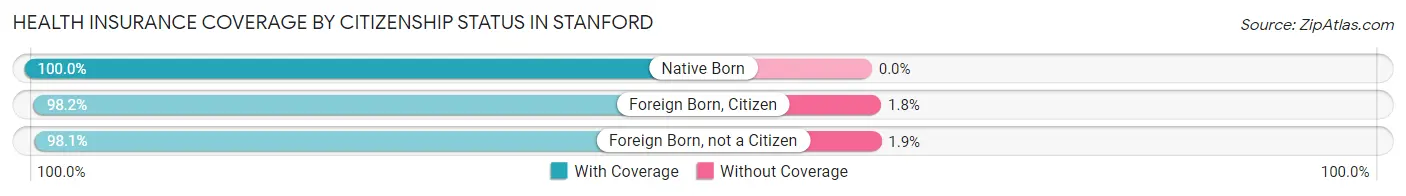
| Citizenship Status | With Coverage | Without Coverage |
| Native Born | 351 (100.0%) | 0 (0.0%) |
| Foreign Born, Citizen | 3,019 (98.2%) | 56 (1.8%) |
| Foreign Born, not a Citizen | 7,894 (98.1%) | 151 (1.9%) |
Health Insurance Coverage by Household Income in Stanford
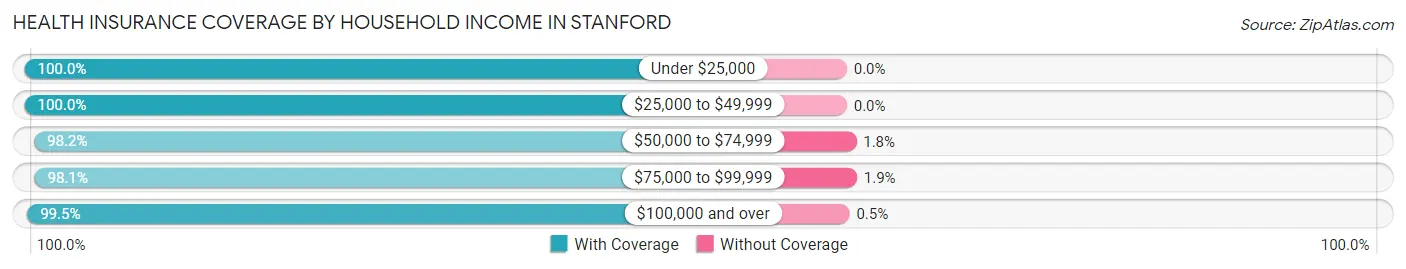
| Household Income | With Coverage | Without Coverage |
| Under $25,000 | 1,040 (100.0%) | 0 (0.0%) |
| $25,000 to $49,999 | 1,108 (100.0%) | 0 (0.0%) |
| $50,000 to $74,999 | 829 (98.2%) | 15 (1.8%) |
| $75,000 to $99,999 | 680 (98.1%) | 13 (1.9%) |
| $100,000 and over | 3,600 (99.5%) | 18 (0.5%) |
Public vs Private Health Insurance Coverage by Age in Stanford
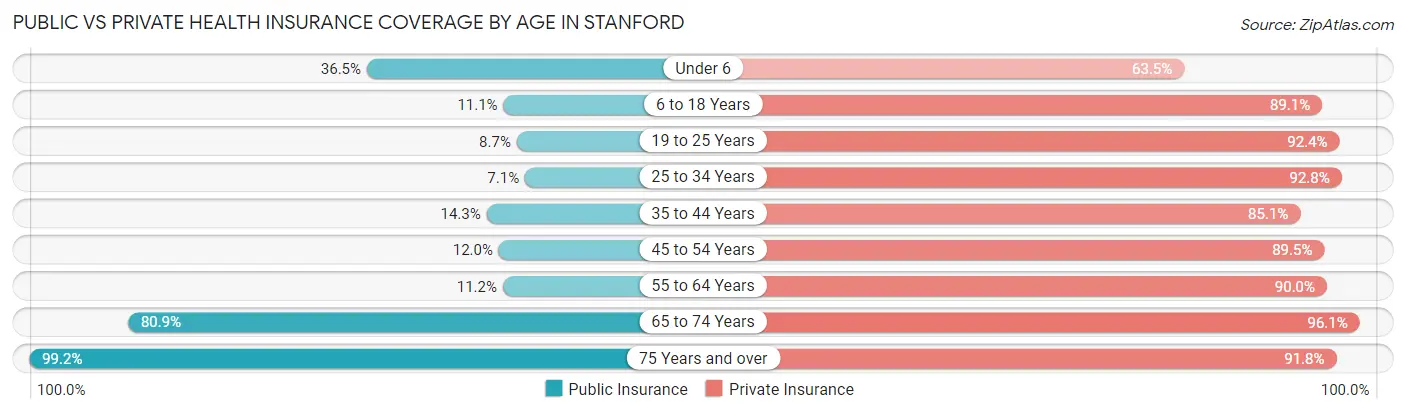
| Age Bracket | Public Insurance | Private Insurance |
| Under 6 | 128 (36.5%) | 223 (63.5%) |
| 6 to 18 Years | 342 (11.1%) | 2,741 (89.1%) |
| 19 to 25 Years | 696 (8.6%) | 7,430 (92.4%) |
| 25 to 34 Years | 238 (7.1%) | 3,099 (92.8%) |
| 35 to 44 Years | 85 (14.3%) | 507 (85.1%) |
| 45 to 54 Years | 55 (12.0%) | 411 (89.5%) |
| 55 to 64 Years | 80 (11.2%) | 641 (90.0%) |
| 65 to 74 Years | 228 (80.8%) | 271 (96.1%) |
| 75 Years and over | 362 (99.2%) | 335 (91.8%) |
| Total | 2,214 (12.9%) | 15,658 (90.9%) |
Disability Status by Sex by Age in Stanford
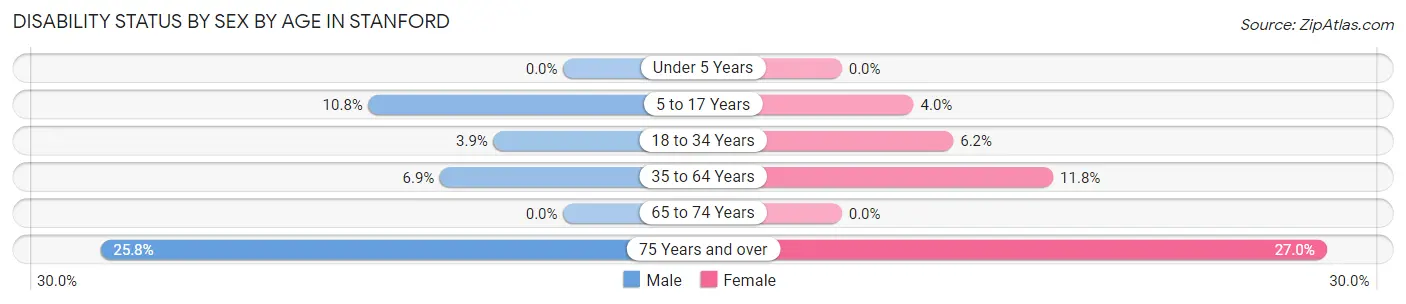
| Age Bracket | Male | Female |
| Under 5 Years | 0 (0.0%) | 0 (0.0%) |
| 5 to 17 Years | 40 (10.8%) | 16 (4.0%) |
| 18 to 34 Years | 259 (3.9%) | 438 (6.2%) |
| 35 to 64 Years | 60 (6.9%) | 105 (11.8%) |
| 65 to 74 Years | 0 (0.0%) | 0 (0.0%) |
| 75 Years and over | 33 (25.8%) | 64 (27.0%) |
Disability Class by Sex by Age in Stanford
Disability Class: Hearing Difficulty
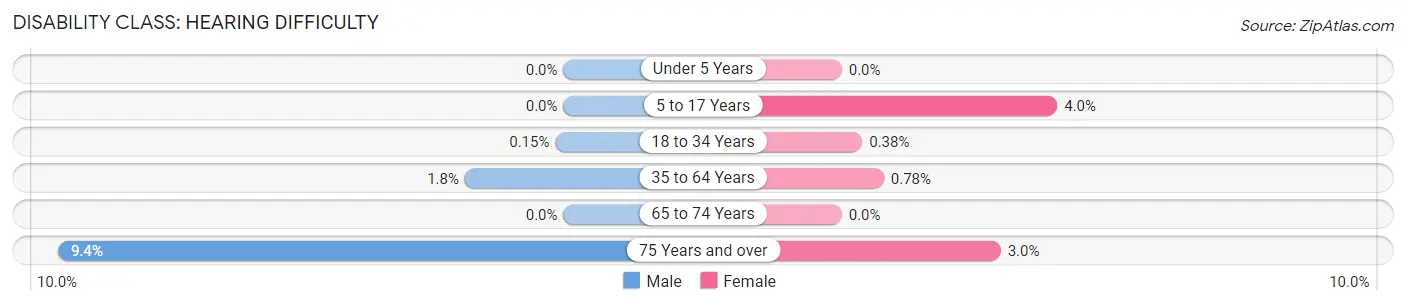
| Age Bracket | Male | Female |
| Under 5 Years | 0 (0.0%) | 0 (0.0%) |
| 5 to 17 Years | 0 (0.0%) | 16 (4.0%) |
| 18 to 34 Years | 10 (0.2%) | 27 (0.4%) |
| 35 to 64 Years | 16 (1.8%) | 7 (0.8%) |
| 65 to 74 Years | 0 (0.0%) | 0 (0.0%) |
| 75 Years and over | 12 (9.4%) | 7 (2.9%) |
Disability Class: Vision Difficulty
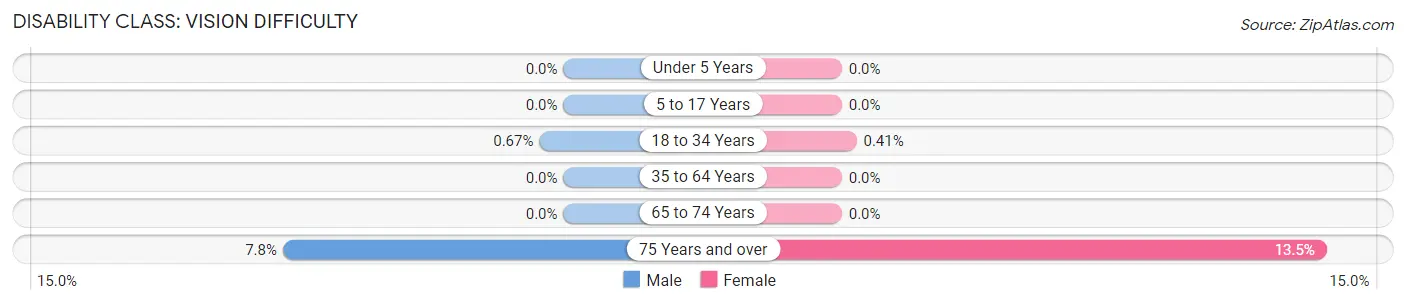
| Age Bracket | Male | Female |
| Under 5 Years | 0 (0.0%) | 0 (0.0%) |
| 5 to 17 Years | 0 (0.0%) | 0 (0.0%) |
| 18 to 34 Years | 45 (0.7%) | 29 (0.4%) |
| 35 to 64 Years | 0 (0.0%) | 0 (0.0%) |
| 65 to 74 Years | 0 (0.0%) | 0 (0.0%) |
| 75 Years and over | 10 (7.8%) | 32 (13.5%) |
Disability Class: Cognitive Difficulty
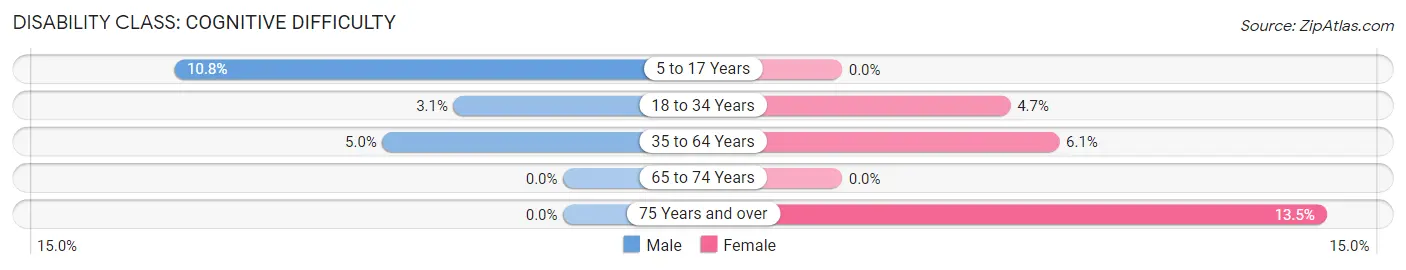
| Age Bracket | Male | Female |
| 5 to 17 Years | 40 (10.8%) | 0 (0.0%) |
| 18 to 34 Years | 204 (3.0%) | 331 (4.7%) |
| 35 to 64 Years | 44 (5.0%) | 54 (6.0%) |
| 65 to 74 Years | 0 (0.0%) | 0 (0.0%) |
| 75 Years and over | 0 (0.0%) | 32 (13.5%) |
Disability Class: Ambulatory Difficulty
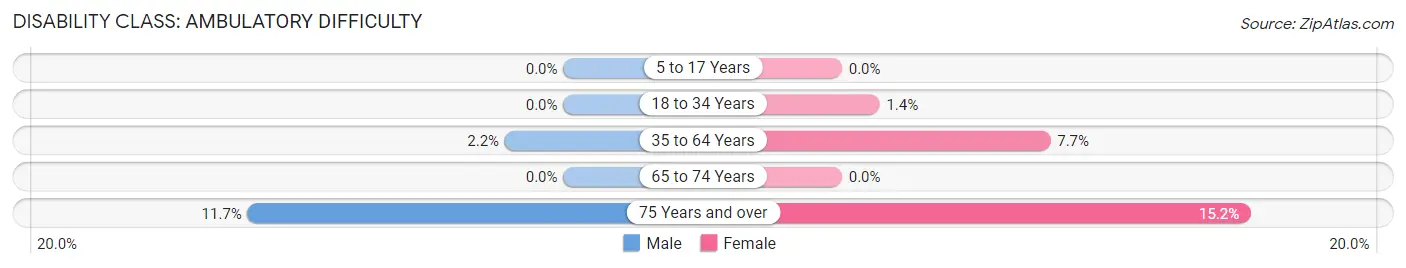
| Age Bracket | Male | Female |
| 5 to 17 Years | 0 (0.0%) | 0 (0.0%) |
| 18 to 34 Years | 0 (0.0%) | 99 (1.4%) |
| 35 to 64 Years | 19 (2.2%) | 69 (7.7%) |
| 65 to 74 Years | 0 (0.0%) | 0 (0.0%) |
| 75 Years and over | 15 (11.7%) | 36 (15.2%) |
Disability Class: Self-Care Difficulty
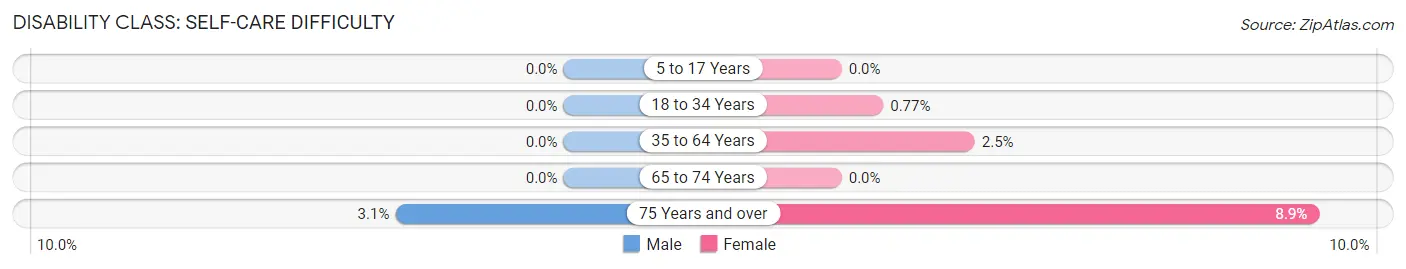
| Age Bracket | Male | Female |
| 5 to 17 Years | 0 (0.0%) | 0 (0.0%) |
| 18 to 34 Years | 0 (0.0%) | 54 (0.8%) |
| 35 to 64 Years | 0 (0.0%) | 22 (2.5%) |
| 65 to 74 Years | 0 (0.0%) | 0 (0.0%) |
| 75 Years and over | 4 (3.1%) | 21 (8.9%) |
Technology Access in Stanford
Computing Device Access in Stanford
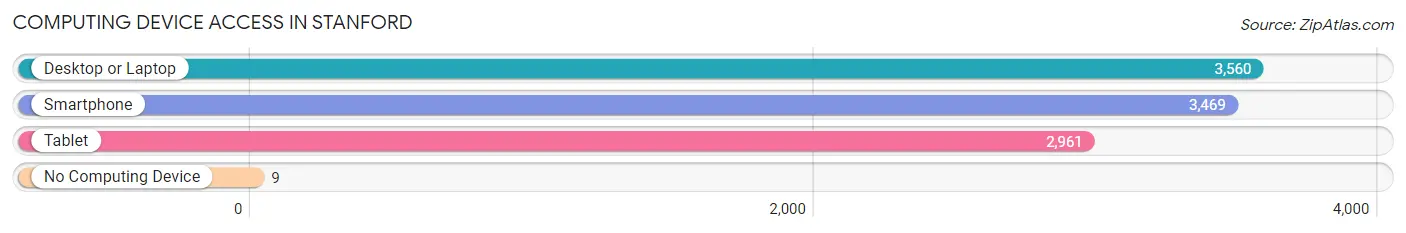
| Device Type | # Households | % Households |
| Desktop or Laptop | 3,560 | 98.1% |
| Smartphone | 3,469 | 95.6% |
| Tablet | 2,961 | 81.6% |
| No Computing Device | 9 | 0.3% |
| Total | 3,629 | 100.0% |
Internet Access in Stanford
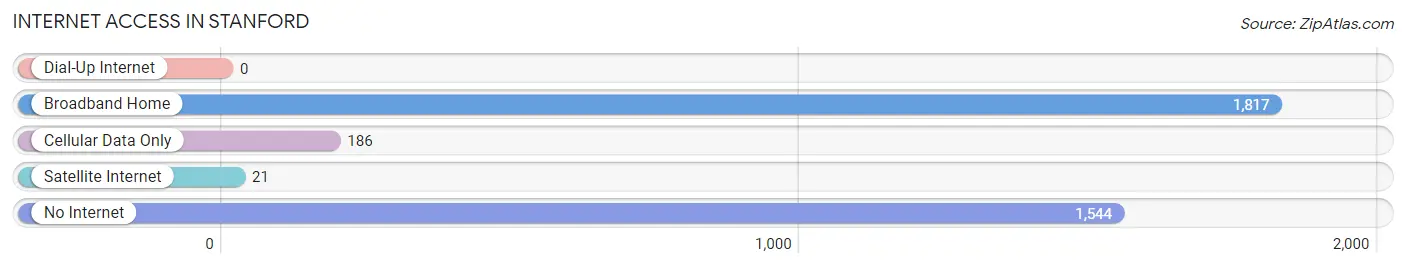
| Internet Type | # Households | % Households |
| Dial-Up Internet | 0 | 0.0% |
| Broadband Home | 1,817 | 50.1% |
| Cellular Data Only | 186 | 5.1% |
| Satellite Internet | 21 | 0.6% |
| No Internet | 1,544 | 42.5% |
| Total | 3,629 | 100.0% |
Stanford Summary
Stanford, California is a small city located in the heart of Silicon Valley, in the San Francisco Bay Area. It is home to Stanford University, one of the world’s most prestigious universities, and is known for its high-tech industry, innovative culture, and vibrant economy.
History
Stanford was founded in 1885 by Leland Stanford, a former California governor and railroad tycoon. Stanford was originally a farming community, but it quickly grew into a bustling city as the railroad industry expanded. In 1891, Stanford University was founded, and the city soon became a center of education and culture.
In the early 20th century, Stanford became a hub for the burgeoning technology industry. Companies such as Hewlett-Packard, Apple, and Google all had their roots in Stanford. The city also became a center for the arts, with the Stanford Jazz Festival and the Stanford Summer Theater Festival both taking place in the city.
Geography
Stanford is located in the San Francisco Bay Area, in the northern part of Santa Clara County. It is bordered by Palo Alto to the north, Menlo Park to the east, and Mountain View to the south. The city is situated on the San Francisco Peninsula, and is surrounded by the San Francisco Bay on three sides.
The city has a total area of 8.5 square miles, and is located at an elevation of 82 feet above sea level. The climate is mild, with temperatures ranging from the mid-50s to the mid-70s throughout the year.
Economy
Stanford’s economy is largely driven by the technology industry. The city is home to many high-tech companies, including Hewlett-Packard, Apple, Google, and Oracle. Stanford is also home to several venture capital firms, which provide funding for start-up companies.
The city is also home to Stanford University, which is one of the world’s leading research universities. The university is a major employer in the city, and its students and faculty contribute to the local economy.
Demographics
As of the 2010 census, Stanford had a population of 13,809. The population is largely white (71.3%), with a significant Asian population (20.2%). The median household income is $118,844, and the median age is 33.
Stanford is a diverse city, with a variety of cultures and backgrounds represented. The city is home to a large number of immigrants, and is a popular destination for students and professionals from around the world.
Common Questions
What is Per Capita Income in Stanford?
Per Capita income in Stanford is $40,495.
What is the Median Family Income in Stanford?
Median Family Income in Stanford is $234,625.
What is the Median Household income in Stanford?
Median Household Income in Stanford is $69,631.
What is Income or Wage Gap in Stanford?
Income or Wage Gap in Stanford is 56.0%.
Women in Stanford earn 44.0 cents for every dollar earned by a man.
What is Inequality or Gini Index in Stanford?
Inequality or Gini Index in Stanford is 0.62.
What is the Total Population of Stanford?
Total Population of Stanford is 17,255.
What is the Total Male Population of Stanford?
Total Male Population of Stanford is 8,384.
What is the Total Female Population of Stanford?
Total Female Population of Stanford is 8,871.
What is the Ratio of Males per 100 Females in Stanford?
There are 94.51 Males per 100 Females in Stanford.
What is the Ratio of Females per 100 Males in Stanford?
There are 105.81 Females per 100 Males in Stanford.
What is the Median Population Age in Stanford?
Median Population Age in Stanford is 22.1 Years.
What is the Average Family Size in Stanford
Average Family Size in Stanford is 2.9 People.
What is the Average Household Size in Stanford
Average Household Size in Stanford is 2.0 People.
How Large is the Labor Force in Stanford?
There are 8,044 People in the Labor Forcein in Stanford.
What is the Percentage of People in the Labor Force in Stanford?
49.0% of People are in the Labor Force in Stanford.
What is the Unemployment Rate in Stanford?
Unemployment Rate in Stanford is 6.1%.