Pioneer, OH Map & Demographics
Pioneer Map
Pioneer Overview
$23,963
PER CAPITA INCOME
$65,625
AVG FAMILY INCOME
$46,528
AVG HOUSEHOLD INCOME
23.3%
WAGE / INCOME GAP [ % ]
76.7¢/ $1
WAGE / INCOME GAP [ $ ]
0.39
INEQUALITY / GINI INDEX
1,333
TOTAL POPULATION
635
MALE POPULATION
698
FEMALE POPULATION
90.97
MALES / 100 FEMALES
109.92
FEMALES / 100 MALES
36.8
MEDIAN AGE
3.1
AVG FAMILY SIZE
2.3
AVG HOUSEHOLD SIZE
695
LABOR FORCE [ PEOPLE ]
65.5%
PERCENT IN LABOR FORCE
4.6%
UNEMPLOYMENT RATE
Pioneer Zip Codes
Pioneer Area Codes
Income in Pioneer
Income Overview in Pioneer
Per Capita Income in Pioneer is $23,963, while median incomes of families and households are $65,625 and $46,528 respectively.
| Characteristic | Number | Measure |
| Per Capita Income | 1,333 | $23,963 |
| Median Family Income | 297 | $65,625 |
| Mean Family Income | 297 | $74,486 |
| Median Household Income | 588 | $46,528 |
| Mean Household Income | 588 | $55,026 |
| Income Deficit | 297 | $0 |
| Wage / Income Gap (%) | 1,333 | 23.32% |
| Wage / Income Gap ($) | 1,333 | 76.68¢ per $1 |
| Gini / Inequality Index | 1,333 | 0.39 |
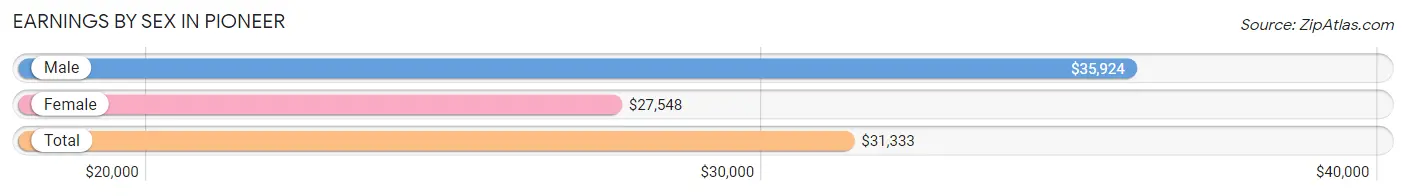
Earnings by Sex in Pioneer
Average Earnings in Pioneer are $31,333, $35,924 for men and $27,548 for women, a difference of 23.3%.
| Sex | Number | Average Earnings |
| Male | 367 (49.9%) | $35,924 |
| Female | 369 (50.1%) | $27,548 |
| Total | 736 (100.0%) | $31,333 |
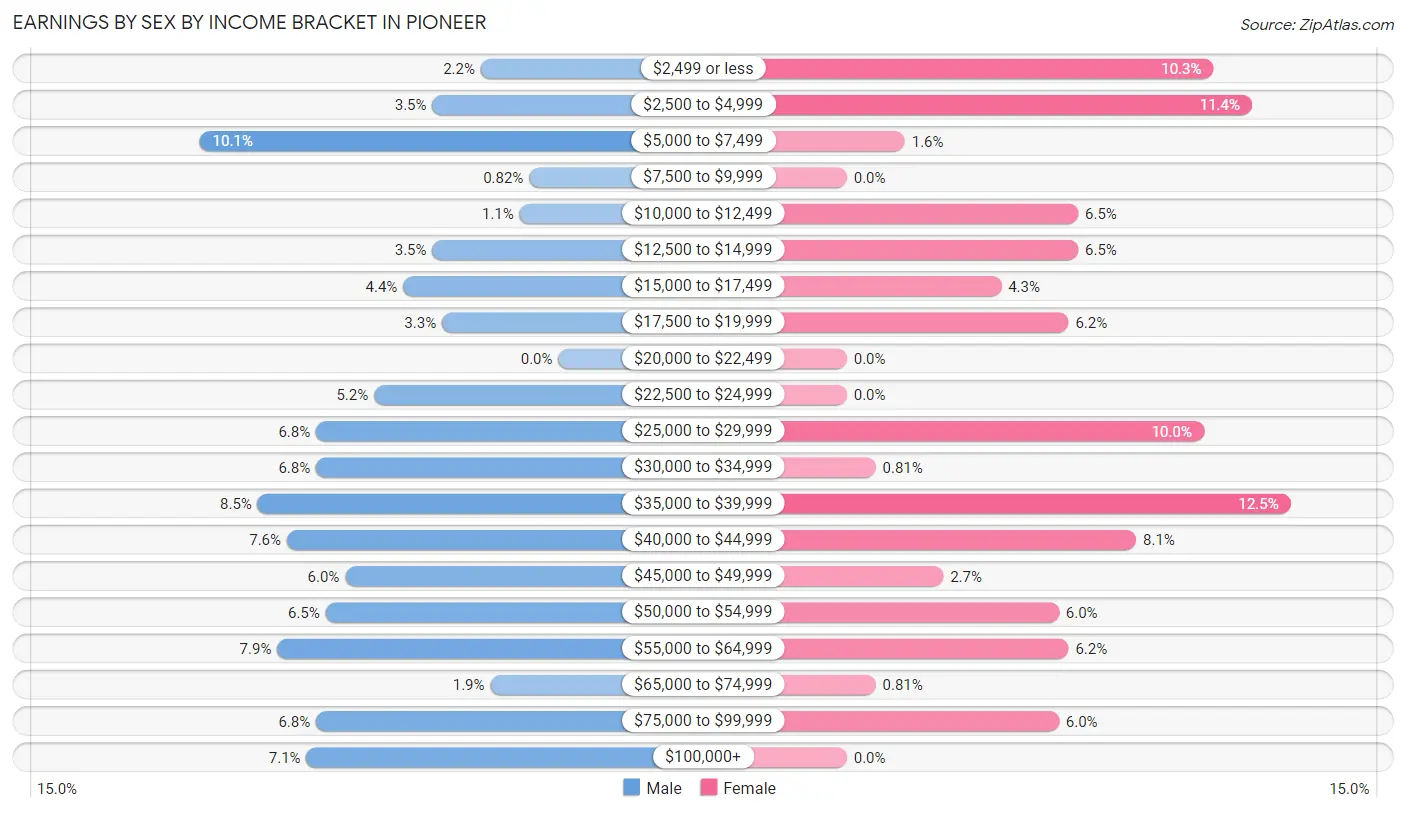
Earnings by Sex by Income Bracket in Pioneer
The most common earnings brackets in Pioneer are $5,000 to $7,499 for men (37 | 10.1%) and $35,000 to $39,999 for women (46 | 12.5%).
| Income | Male | Female |
| $2,499 or less | 8 (2.2%) | 38 (10.3%) |
| $2,500 to $4,999 | 13 (3.5%) | 42 (11.4%) |
| $5,000 to $7,499 | 37 (10.1%) | 6 (1.6%) |
| $7,500 to $9,999 | 3 (0.8%) | 0 (0.0%) |
| $10,000 to $12,499 | 4 (1.1%) | 24 (6.5%) |
| $12,500 to $14,999 | 13 (3.5%) | 24 (6.5%) |
| $15,000 to $17,499 | 16 (4.4%) | 16 (4.3%) |
| $17,500 to $19,999 | 12 (3.3%) | 23 (6.2%) |
| $20,000 to $22,499 | 0 (0.0%) | 0 (0.0%) |
| $22,500 to $24,999 | 19 (5.2%) | 0 (0.0%) |
| $25,000 to $29,999 | 25 (6.8%) | 37 (10.0%) |
| $30,000 to $34,999 | 25 (6.8%) | 3 (0.8%) |
| $35,000 to $39,999 | 31 (8.5%) | 46 (12.5%) |
| $40,000 to $44,999 | 28 (7.6%) | 30 (8.1%) |
| $45,000 to $49,999 | 22 (6.0%) | 10 (2.7%) |
| $50,000 to $54,999 | 24 (6.5%) | 22 (6.0%) |
| $55,000 to $64,999 | 29 (7.9%) | 23 (6.2%) |
| $65,000 to $74,999 | 7 (1.9%) | 3 (0.8%) |
| $75,000 to $99,999 | 25 (6.8%) | 22 (6.0%) |
| $100,000+ | 26 (7.1%) | 0 (0.0%) |
| Total | 367 (100.0%) | 369 (100.0%) |
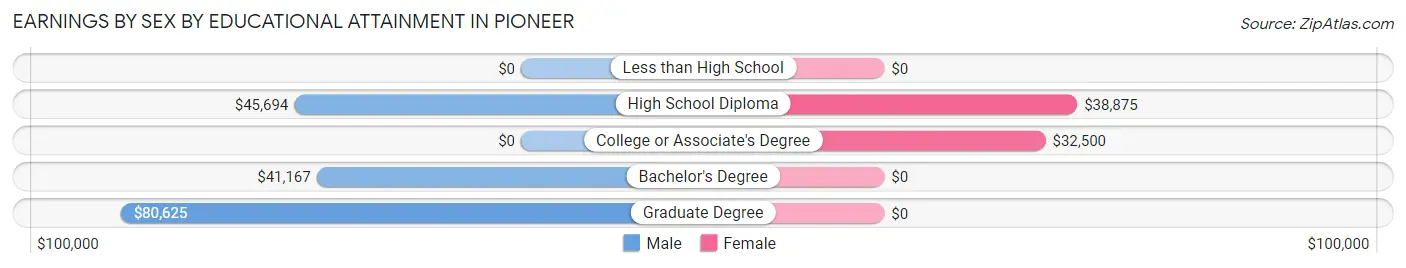
Earnings by Sex by Educational Attainment in Pioneer
Average earnings in Pioneer are $44,250 for men and $34,583 for women, a difference of 21.8%. Men with an educational attainment of graduate degree enjoy the highest average annual earnings of $80,625, while those with bachelor's degree education earn the least with $41,167. Women with an educational attainment of high school diploma earn the most with the average annual earnings of $38,875, while those with college or associate's degree education have the smallest earnings of $32,500.
| Educational Attainment | Male Income | Female Income |
| Less than High School | - | - |
| High School Diploma | $45,694 | $38,875 |
| College or Associate's Degree | - | - |
| Bachelor's Degree | $41,167 | $0 |
| Graduate Degree | $80,625 | $0 |
| Total | $44,250 | $34,583 |
Family Income in Pioneer
Family Income Brackets in Pioneer
According to the Pioneer family income data, there are 104 families falling into the $50,000 to $74,999 income range, which is the most common income bracket and makes up 35.0% of all families.
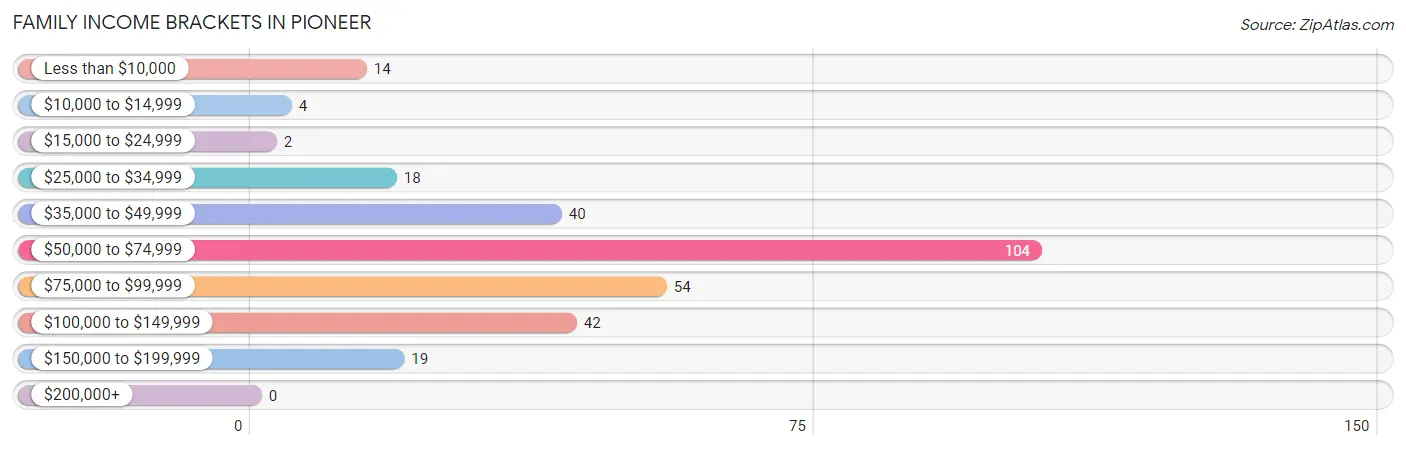
| Income Bracket | # Families | % Families |
| Less than $10,000 | 14 | 4.7% |
| $10,000 to $14,999 | 4 | 1.3% |
| $15,000 to $24,999 | 2 | 0.7% |
| $25,000 to $34,999 | 18 | 6.1% |
| $35,000 to $49,999 | 40 | 13.5% |
| $50,000 to $74,999 | 104 | 35.0% |
| $75,000 to $99,999 | 54 | 18.2% |
| $100,000 to $149,999 | 42 | 14.1% |
| $150,000 to $199,999 | 19 | 6.4% |
| $200,000+ | 0 | 0.0% |
Family Income by Famaliy Size in Pioneer
5-person families (26 | 8.7%) account for the highest median family income in Pioneer with $116,389 per family, while 2-person families (137 | 46.1%) have the highest median income of $26,302 per family member.
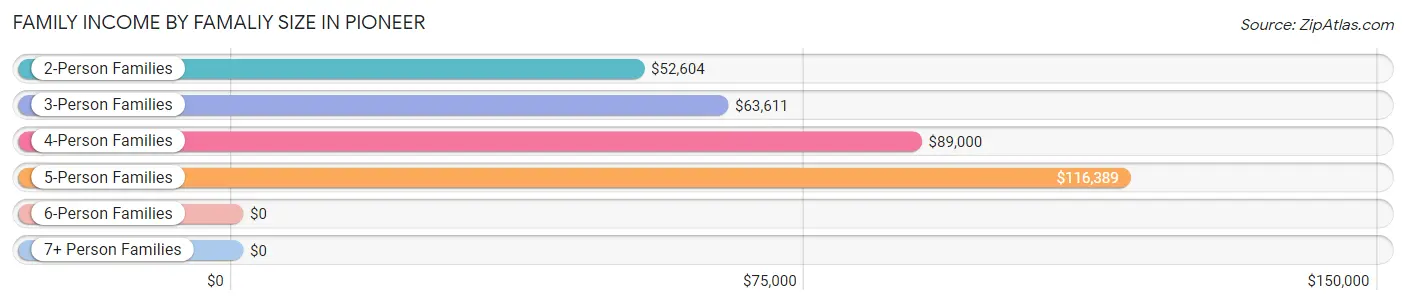
| Income Bracket | # Families | Median Income |
| 2-Person Families | 137 (46.1%) | $52,604 |
| 3-Person Families | 64 (21.5%) | $63,611 |
| 4-Person Families | 52 (17.5%) | $89,000 |
| 5-Person Families | 26 (8.7%) | $116,389 |
| 6-Person Families | 14 (4.7%) | $0 |
| 7+ Person Families | 4 (1.3%) | $0 |
| Total | 297 (100.0%) | $65,625 |
Family Income by Number of Earners in Pioneer
The median family income in Pioneer is $65,625, with families comprising 3+ earners (21) having the highest median family income of $114,875, while families with no earners (64) have the lowest median family income of $45,625, accounting for 7.1% and 21.5% of families, respectively.
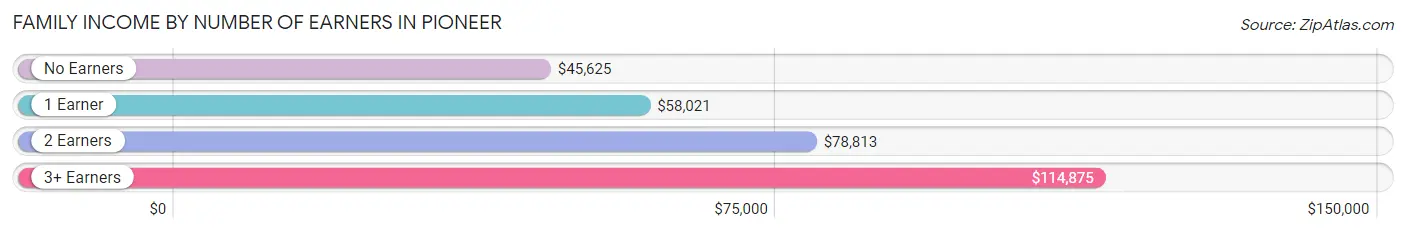
| Number of Earners | # Families | Median Income |
| No Earners | 64 (21.5%) | $45,625 |
| 1 Earner | 63 (21.2%) | $58,021 |
| 2 Earners | 149 (50.2%) | $78,813 |
| 3+ Earners | 21 (7.1%) | $114,875 |
| Total | 297 (100.0%) | $65,625 |
Household Income in Pioneer
Household Income Brackets in Pioneer
With 136 households falling in the category, the $50,000 to $74,999 income range is the most frequent in Pioneer, accounting for 23.1% of all households.
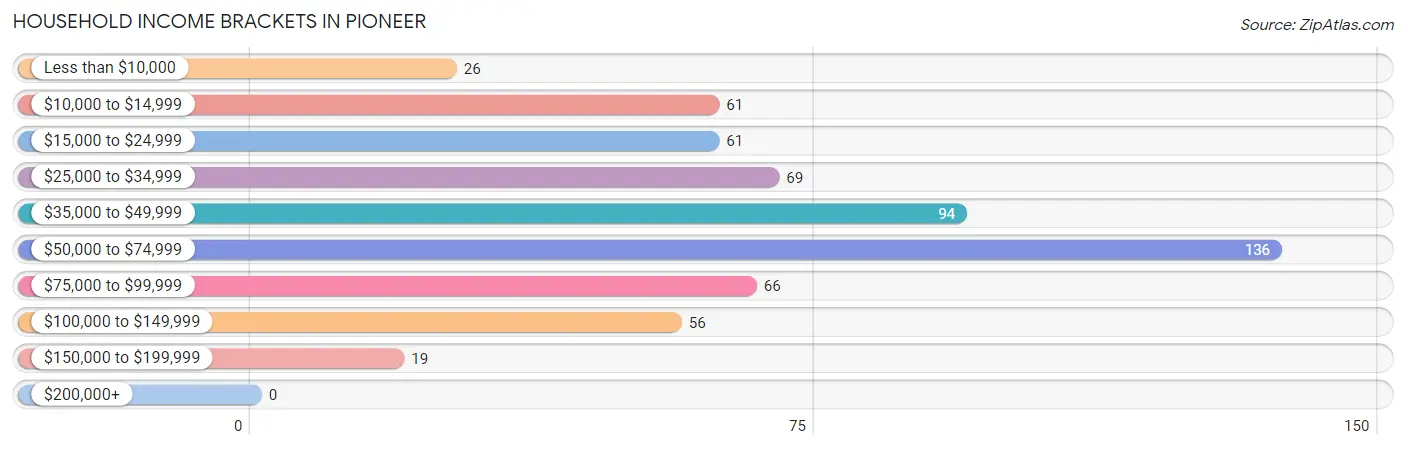
| Income Bracket | # Households | % Households |
| Less than $10,000 | 26 | 4.4% |
| $10,000 to $14,999 | 61 | 10.4% |
| $15,000 to $24,999 | 61 | 10.4% |
| $25,000 to $34,999 | 69 | 11.7% |
| $35,000 to $49,999 | 94 | 16.0% |
| $50,000 to $74,999 | 136 | 23.1% |
| $75,000 to $99,999 | 66 | 11.2% |
| $100,000 to $149,999 | 56 | 9.5% |
| $150,000 to $199,999 | 19 | 3.2% |
| $200,000+ | 0 | 0.0% |
Household Income by Householder Age in Pioneer
The median household income in Pioneer is $46,528, with the highest median household income of $64,028 found in the 25 to 44 years age bracket for the primary householder. A total of 203 households (34.5%) fall into this category. Meanwhile, the 65+ years age bracket for the primary householder has the lowest median household income of $29,722, with 154 households (26.2%) in this group.
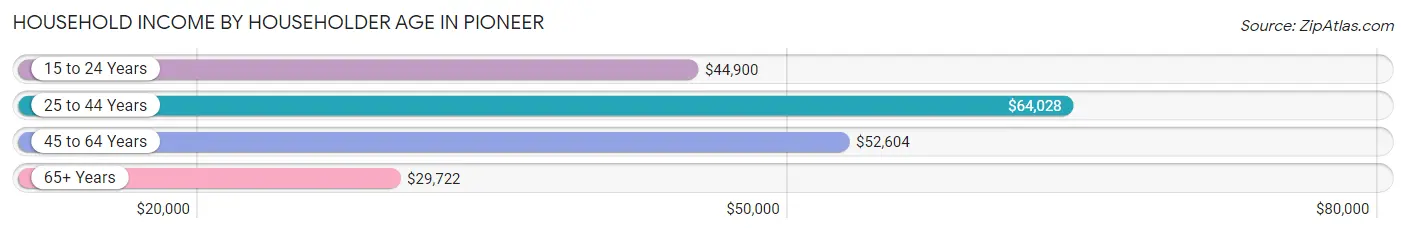
| Income Bracket | # Households | Median Income |
| 15 to 24 Years | 56 (9.5%) | $44,900 |
| 25 to 44 Years | 203 (34.5%) | $64,028 |
| 45 to 64 Years | 175 (29.8%) | $52,604 |
| 65+ Years | 154 (26.2%) | $29,722 |
| Total | 588 (100.0%) | $46,528 |
Poverty in Pioneer
Income Below Poverty by Sex and Age in Pioneer
With 16.2% poverty level for males and 16.8% for females among the residents of Pioneer, 15 year old males and 18 to 24 year old females are the most vulnerable to poverty, with 4 males (100.0%) and 45 females (47.4%) in their respective age groups living below the poverty level.
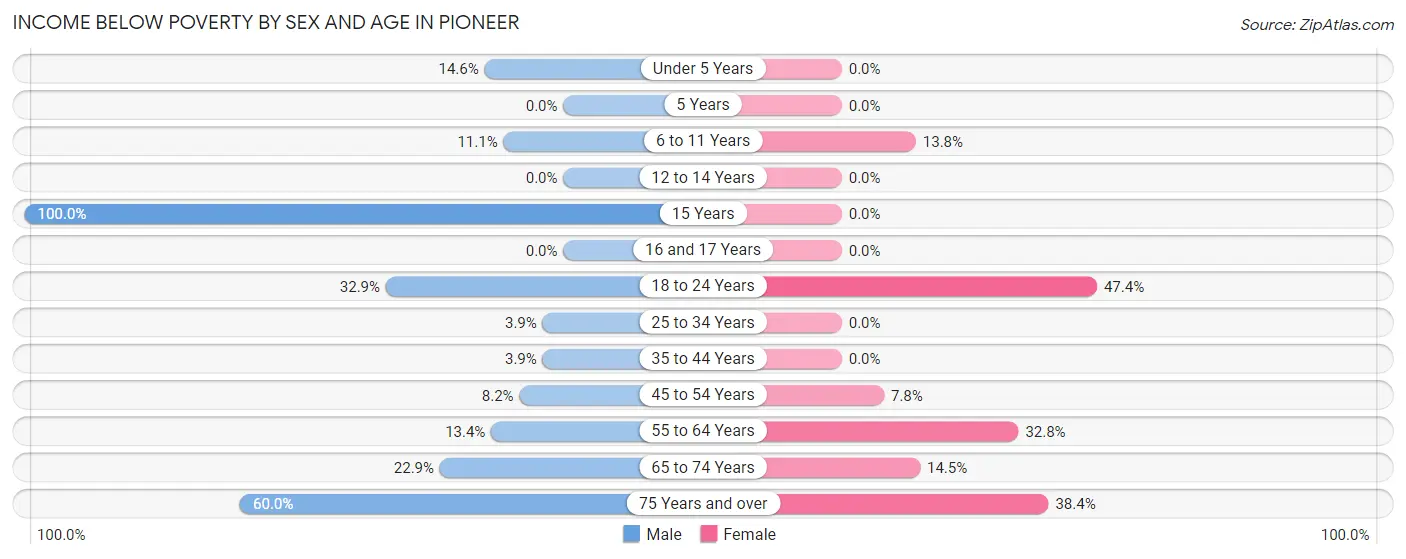
| Age Bracket | Male | Female |
| Under 5 Years | 6 (14.6%) | 0 (0.0%) |
| 5 Years | 0 (0.0%) | 0 (0.0%) |
| 6 to 11 Years | 3 (11.1%) | 11 (13.8%) |
| 12 to 14 Years | 0 (0.0%) | 0 (0.0%) |
| 15 Years | 4 (100.0%) | 0 (0.0%) |
| 16 and 17 Years | 0 (0.0%) | 0 (0.0%) |
| 18 to 24 Years | 28 (32.9%) | 45 (47.4%) |
| 25 to 34 Years | 3 (3.8%) | 0 (0.0%) |
| 35 to 44 Years | 3 (3.8%) | 0 (0.0%) |
| 45 to 54 Years | 4 (8.2%) | 4 (7.8%) |
| 55 to 64 Years | 17 (13.4%) | 20 (32.8%) |
| 65 to 74 Years | 11 (22.9%) | 9 (14.5%) |
| 75 Years and over | 24 (60.0%) | 28 (38.4%) |
| Total | 103 (16.2%) | 117 (16.8%) |
Income Above Poverty by Sex and Age in Pioneer
According to the poverty statistics in Pioneer, males aged 12 to 14 years and females aged under 5 years are the age groups that are most secure financially, with 100.0% of males and 100.0% of females in these age groups living above the poverty line.
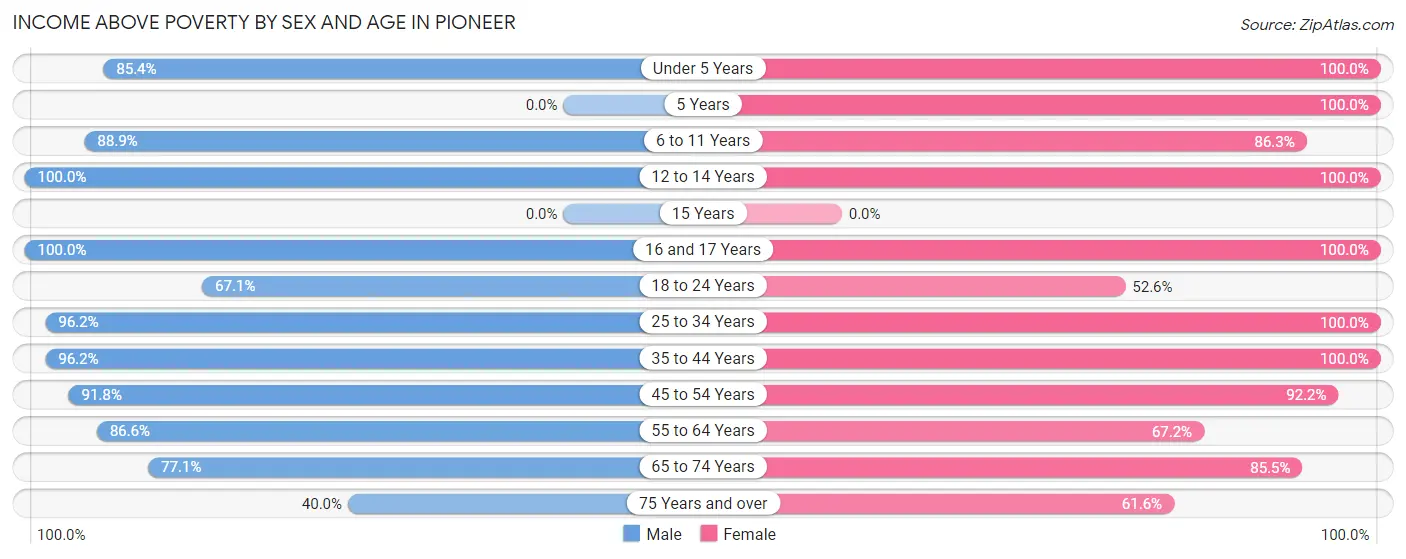
| Age Bracket | Male | Female |
| Under 5 Years | 35 (85.4%) | 12 (100.0%) |
| 5 Years | 0 (0.0%) | 5 (100.0%) |
| 6 to 11 Years | 24 (88.9%) | 69 (86.3%) |
| 12 to 14 Years | 37 (100.0%) | 66 (100.0%) |
| 15 Years | 0 (0.0%) | 0 (0.0%) |
| 16 and 17 Years | 21 (100.0%) | 15 (100.0%) |
| 18 to 24 Years | 57 (67.1%) | 50 (52.6%) |
| 25 to 34 Years | 75 (96.2%) | 84 (100.0%) |
| 35 to 44 Years | 75 (96.2%) | 94 (100.0%) |
| 45 to 54 Years | 45 (91.8%) | 47 (92.2%) |
| 55 to 64 Years | 110 (86.6%) | 41 (67.2%) |
| 65 to 74 Years | 37 (77.1%) | 53 (85.5%) |
| 75 Years and over | 16 (40.0%) | 45 (61.6%) |
| Total | 532 (83.8%) | 581 (83.2%) |
Income Below Poverty Among Married-Couple Families in Pioneer
The poverty statistics for married-couple families in Pioneer show that 2.8% or 6 of the total 211 families live below the poverty line. Families with 3 or 4 children have the highest poverty rate of 14.8%, comprising of 4 families. On the other hand, families with 1 or 2 children have the lowest poverty rate of 0.0%, which includes 0 families.
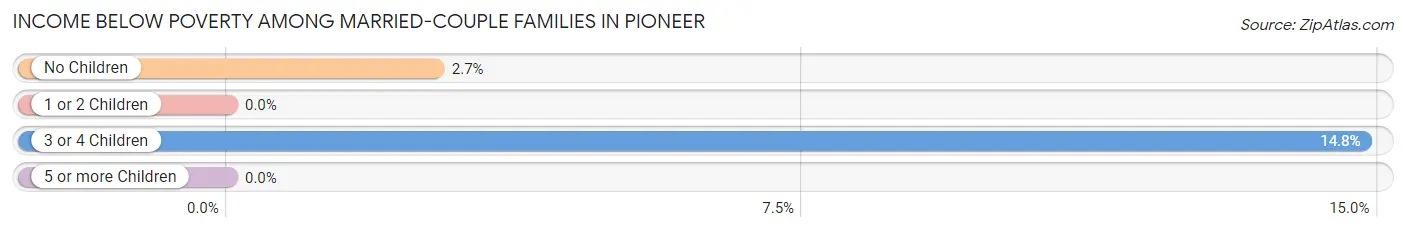
| Children | Above Poverty | Below Poverty |
| No Children | 72 (97.3%) | 2 (2.7%) |
| 1 or 2 Children | 110 (100.0%) | 0 (0.0%) |
| 3 or 4 Children | 23 (85.2%) | 4 (14.8%) |
| 5 or more Children | 0 (0.0%) | 0 (0.0%) |
| Total | 205 (97.2%) | 6 (2.8%) |
Income Below Poverty Among Single-Parent Households in Pioneer
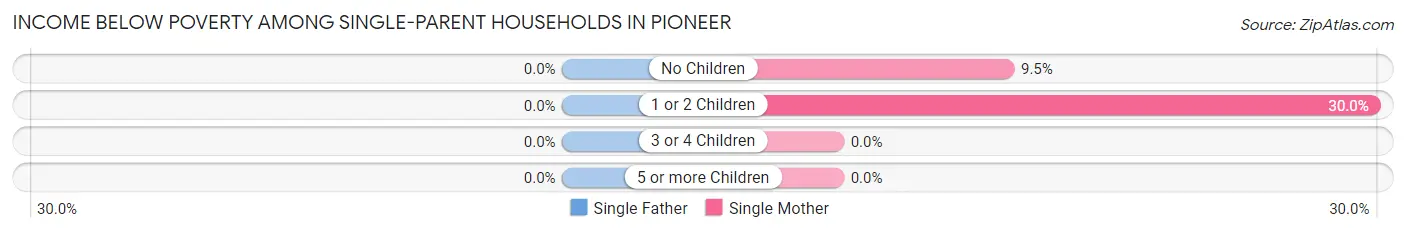
| Children | Single Father | Single Mother |
| No Children | 0 (0.0%) | 2 (9.5%) |
| 1 or 2 Children | 0 (0.0%) | 12 (30.0%) |
| 3 or 4 Children | 0 (0.0%) | 0 (0.0%) |
| 5 or more Children | 0 (0.0%) | 0 (0.0%) |
| Total | 0 (0.0%) | 14 (23.0%) |
Income Below Poverty Among Married-Couple vs Single-Parent Households in Pioneer
The poverty data for Pioneer shows that 6 of the married-couple family households (2.8%) and 14 of the single-parent households (16.3%) are living below the poverty level. Within the married-couple family households, those with 3 or 4 children have the highest poverty rate, with 4 households (14.8%) falling below the poverty line. Among the single-parent households, those with 1 or 2 children have the highest poverty rate, with 12 household (23.1%) living below poverty.
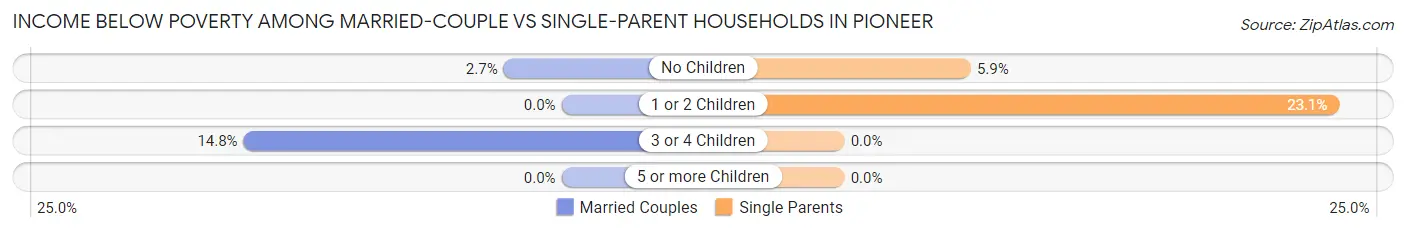
| Children | Married-Couple Families | Single-Parent Households |
| No Children | 2 (2.7%) | 2 (5.9%) |
| 1 or 2 Children | 0 (0.0%) | 12 (23.1%) |
| 3 or 4 Children | 4 (14.8%) | 0 (0.0%) |
| 5 or more Children | 0 (0.0%) | 0 (0.0%) |
| Total | 6 (2.8%) | 14 (16.3%) |
Race in Pioneer
The most populous races in Pioneer are White / Caucasian (1,288 | 96.6%), Hispanic or Latino (28 | 2.1%), and Black / African American (21 | 1.6%).
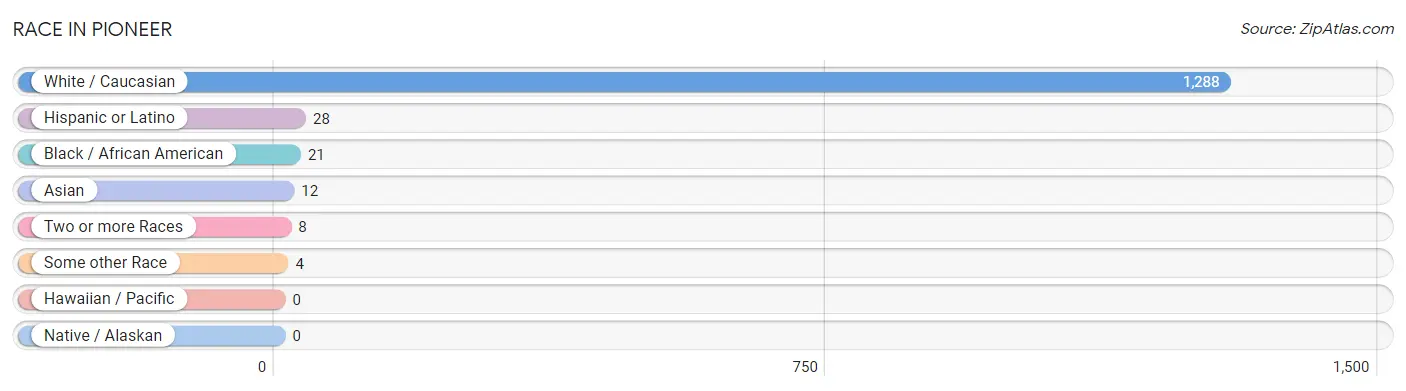
| Race | # Population | % Population |
| Asian | 12 | 0.9% |
| Black / African American | 21 | 1.6% |
| Hawaiian / Pacific | 0 | 0.0% |
| Hispanic or Latino | 28 | 2.1% |
| Native / Alaskan | 0 | 0.0% |
| White / Caucasian | 1,288 | 96.6% |
| Two or more Races | 8 | 0.6% |
| Some other Race | 4 | 0.3% |
| Total | 1,333 | 100.0% |
Ancestry in Pioneer
The most populous ancestries reported in Pioneer are German (590 | 44.3%), Irish (206 | 15.4%), English (144 | 10.8%), Scottish (44 | 3.3%), and French (40 | 3.0%), together accounting for 76.8% of all Pioneer residents.
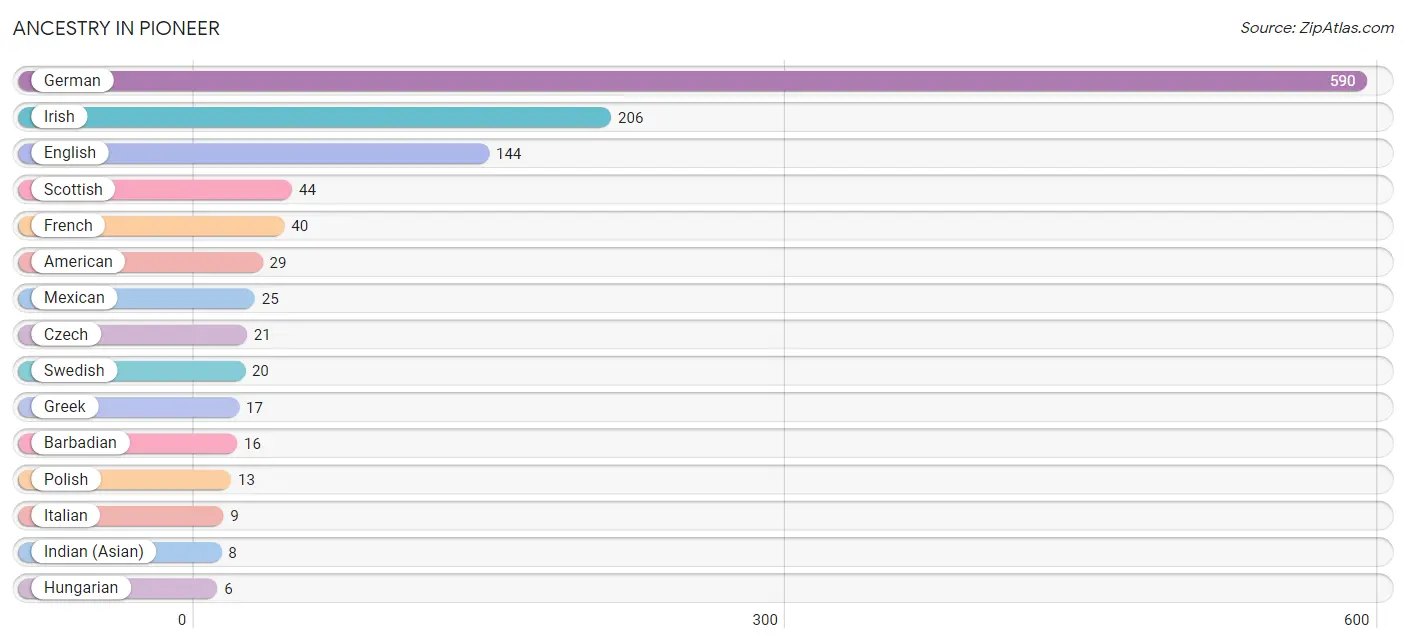
| Ancestry | # Population | % Population |
| American | 29 | 2.2% |
| Barbadian | 16 | 1.2% |
| British | 4 | 0.3% |
| Burmese | 4 | 0.3% |
| Czech | 21 | 1.6% |
| Dutch | 5 | 0.4% |
| English | 144 | 10.8% |
| Finnish | 2 | 0.2% |
| French | 40 | 3.0% |
| German | 590 | 44.3% |
| Greek | 17 | 1.3% |
| Hungarian | 6 | 0.4% |
| Indian (Asian) | 8 | 0.6% |
| Irish | 206 | 15.4% |
| Italian | 9 | 0.7% |
| Mexican | 25 | 1.9% |
| Norwegian | 3 | 0.2% |
| Polish | 13 | 1.0% |
| Puerto Rican | 3 | 0.2% |
| Scottish | 44 | 3.3% |
| Swedish | 20 | 1.5% |
| Welsh | 3 | 0.2% | View All 22 Rows |
Immigrants in Pioneer
The most numerous immigrant groups reported in Pioneer came from Asia (12 | 0.9%), Eastern Asia (12 | 0.9%), China (8 | 0.6%), Central America (4 | 0.3%), and Korea (4 | 0.3%), together accounting for 3.0% of all Pioneer residents.
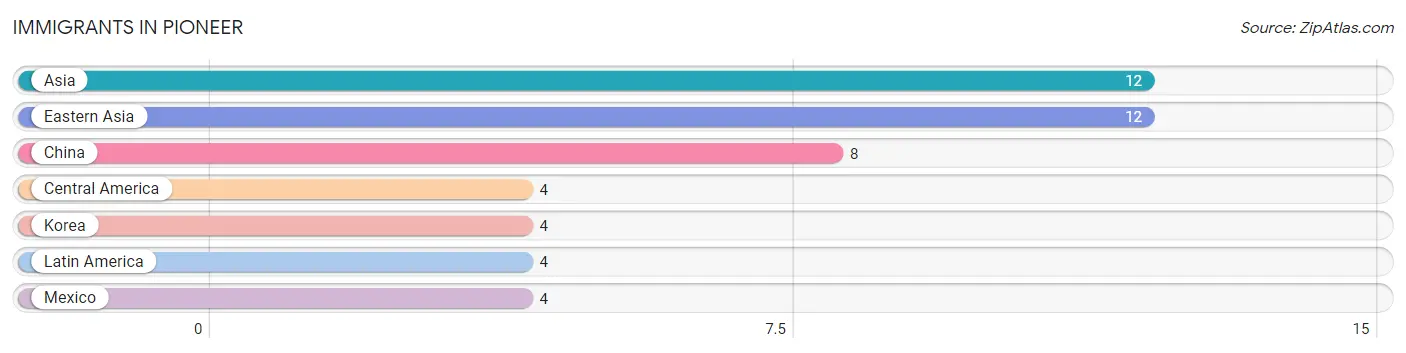
| Immigration Origin | # Population | % Population |
| Asia | 12 | 0.9% |
| Central America | 4 | 0.3% |
| China | 8 | 0.6% |
| Eastern Asia | 12 | 0.9% |
| Korea | 4 | 0.3% |
| Latin America | 4 | 0.3% |
| Mexico | 4 | 0.3% | View All 7 Rows |
Sex and Age in Pioneer
Sex and Age in Pioneer
The most populous age groups in Pioneer are 60 to 64 Years (86 | 13.5%) for men and 10 to 14 Years (83 | 11.9%) for women.
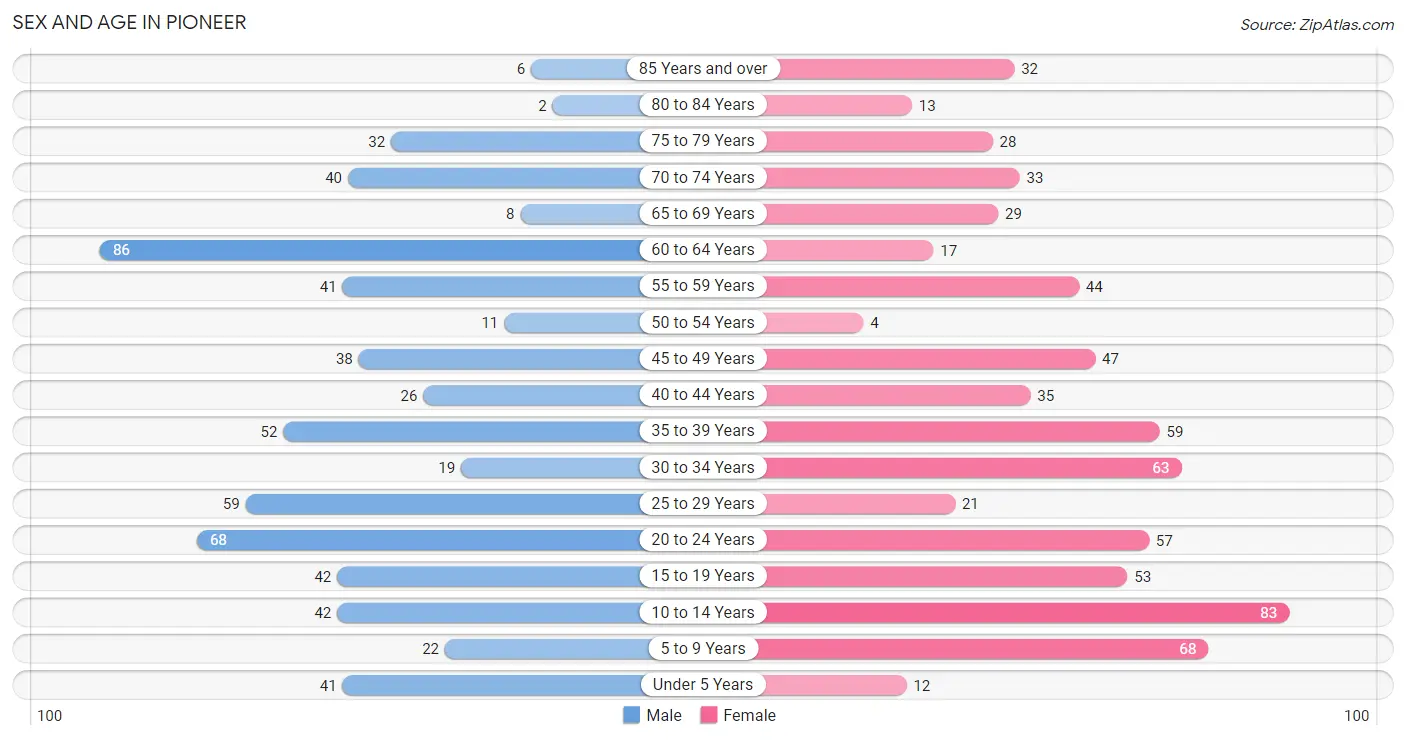
| Age Bracket | Male | Female |
| Under 5 Years | 41 (6.5%) | 12 (1.7%) |
| 5 to 9 Years | 22 (3.5%) | 68 (9.7%) |
| 10 to 14 Years | 42 (6.6%) | 83 (11.9%) |
| 15 to 19 Years | 42 (6.6%) | 53 (7.6%) |
| 20 to 24 Years | 68 (10.7%) | 57 (8.2%) |
| 25 to 29 Years | 59 (9.3%) | 21 (3.0%) |
| 30 to 34 Years | 19 (3.0%) | 63 (9.0%) |
| 35 to 39 Years | 52 (8.2%) | 59 (8.5%) |
| 40 to 44 Years | 26 (4.1%) | 35 (5.0%) |
| 45 to 49 Years | 38 (6.0%) | 47 (6.7%) |
| 50 to 54 Years | 11 (1.7%) | 4 (0.6%) |
| 55 to 59 Years | 41 (6.5%) | 44 (6.3%) |
| 60 to 64 Years | 86 (13.5%) | 17 (2.4%) |
| 65 to 69 Years | 8 (1.3%) | 29 (4.2%) |
| 70 to 74 Years | 40 (6.3%) | 33 (4.7%) |
| 75 to 79 Years | 32 (5.0%) | 28 (4.0%) |
| 80 to 84 Years | 2 (0.3%) | 13 (1.9%) |
| 85 Years and over | 6 (0.9%) | 32 (4.6%) |
| Total | 635 (100.0%) | 698 (100.0%) |
Families and Households in Pioneer
Median Family Size in Pioneer
The median family size in Pioneer is 3.09 persons per family, with married-couple families (211 | 71.0%) accounting for the largest median family size of 3.34 persons per family. On the other hand, single male/father families (25 | 8.4%) represent the smallest median family size with 2.36 persons per family.
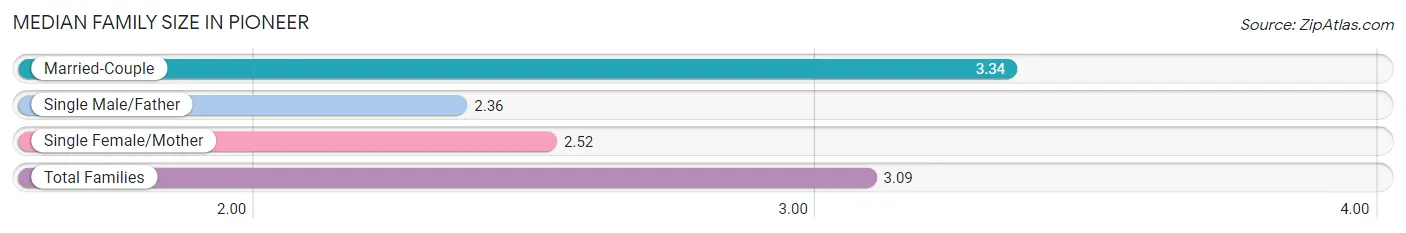
| Family Type | # Families | Family Size |
| Married-Couple | 211 (71.0%) | 3.34 |
| Single Male/Father | 25 (8.4%) | 2.36 |
| Single Female/Mother | 61 (20.5%) | 2.52 |
| Total Families | 297 (100.0%) | 3.09 |
Median Household Size in Pioneer
The median household size in Pioneer is 2.27 persons per household, with married-couple households (211 | 35.9%) accounting for the largest median household size of 3.34 persons per household. non-family households (291 | 49.5%) represent the smallest median household size with 1.43 persons per household.
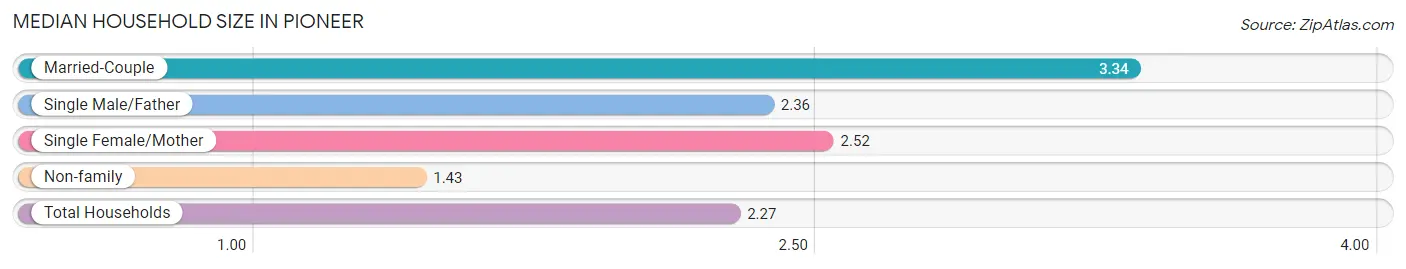
| Household Type | # Households | Household Size |
| Married-Couple | 211 (35.9%) | 3.34 |
| Single Male/Father | 25 (4.3%) | 2.36 |
| Single Female/Mother | 61 (10.4%) | 2.52 |
| Non-family | 291 (49.5%) | 1.43 |
| Total Households | 588 (100.0%) | 2.27 |
Household Size by Marriage Status in Pioneer
Out of a total of 588 households in Pioneer, 297 (50.5%) are family households, while 291 (49.5%) are nonfamily households. The most numerous type of family households are 2-person households, comprising 137, and the most common type of nonfamily households are 1-person households, comprising 194.
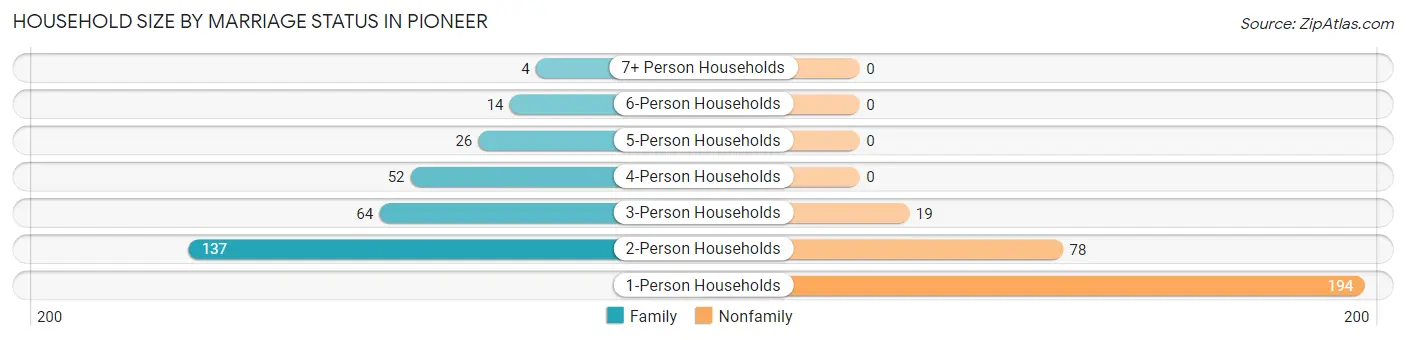
| Household Size | Family Households | Nonfamily Households |
| 1-Person Households | - | 194 (33.0%) |
| 2-Person Households | 137 (23.3%) | 78 (13.3%) |
| 3-Person Households | 64 (10.9%) | 19 (3.2%) |
| 4-Person Households | 52 (8.8%) | 0 (0.0%) |
| 5-Person Households | 26 (4.4%) | 0 (0.0%) |
| 6-Person Households | 14 (2.4%) | 0 (0.0%) |
| 7+ Person Households | 4 (0.7%) | 0 (0.0%) |
| Total | 297 (50.5%) | 291 (49.5%) |
Female Fertility in Pioneer
Fertility by Age in Pioneer
Average fertility rate in Pioneer is 3.0 births per 1,000 women. Women in the age bracket of 20 to 34 years have the highest fertility rate with 7.0 births per 1,000 women. Women in the age bracket of 20 to 34 years acount for 100.0% of all women with births.
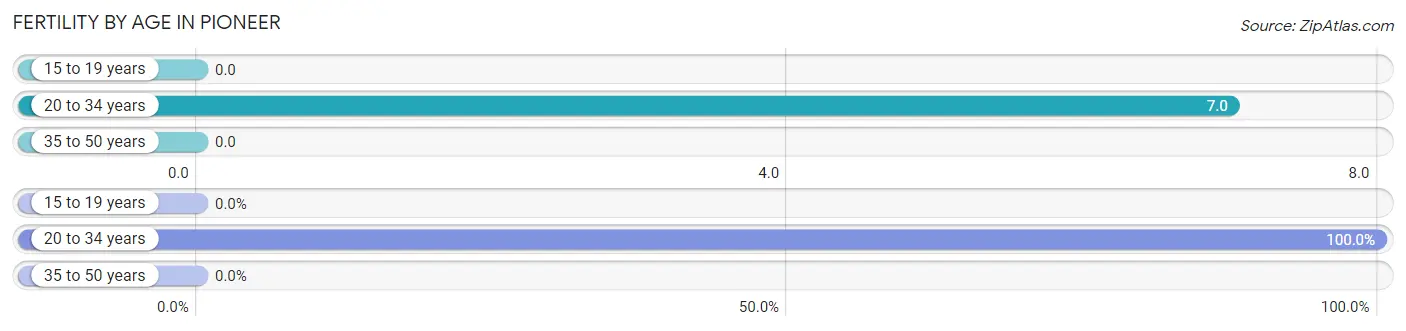
| Age Bracket | Women with Births | Births / 1,000 Women |
| 15 to 19 years | 0 (0.0%) | 0.0 |
| 20 to 34 years | 1 (100.0%) | 7.0 |
| 35 to 50 years | 0 (0.0%) | 0.0 |
| Total | 1 (100.0%) | 3.0 |
Fertility by Age by Marriage Status in Pioneer
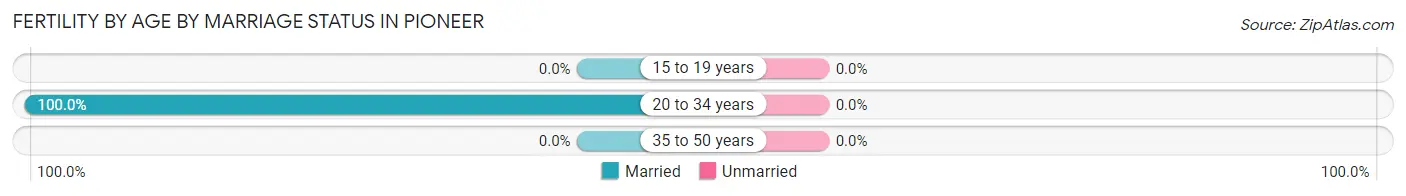
| Age Bracket | Married | Unmarried |
| 15 to 19 years | 0 (0.0%) | 0 (0.0%) |
| 20 to 34 years | 1 (100.0%) | 0 (0.0%) |
| 35 to 50 years | 0 (0.0%) | 0 (0.0%) |
| Total | 1 (100.0%) | 0 (0.0%) |
Fertility by Education in Pioneer
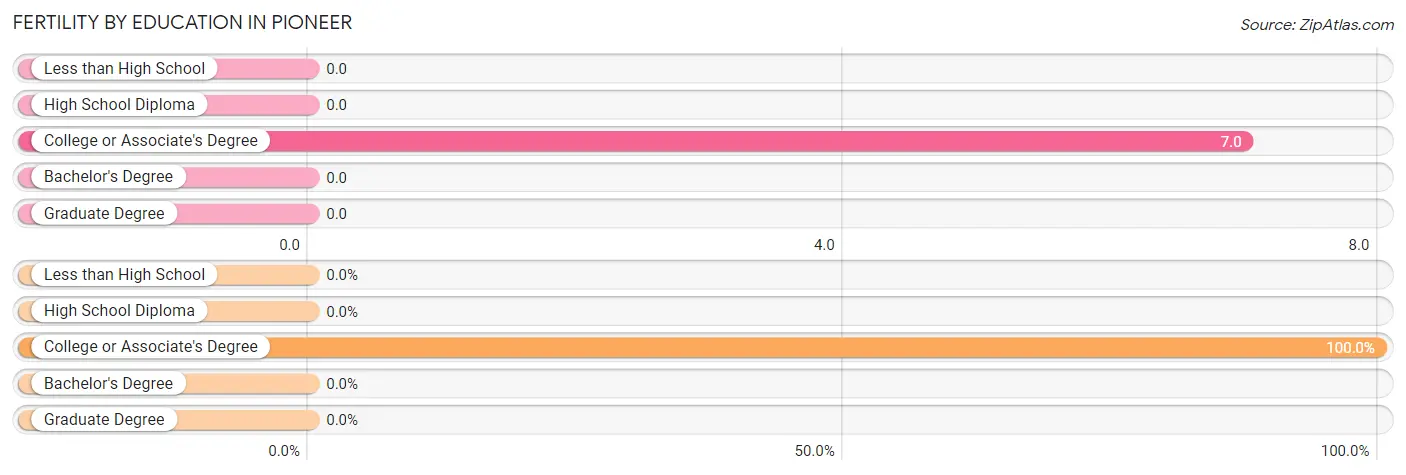
| Educational Attainment | Women with Births | Births / 1,000 Women |
| Less than High School | 0 (0.0%) | 0.0 |
| High School Diploma | 0 (0.0%) | 0.0 |
| College or Associate's Degree | 1 (100.0%) | 7.0 |
| Bachelor's Degree | 0 (0.0%) | 0.0 |
| Graduate Degree | 0 (0.0%) | 0.0 |
| Total | 1 (100.0%) | 3.0 |
Fertility by Education by Marriage Status in Pioneer
| Educational Attainment | Married | Unmarried |
| Less than High School | 0 (0.0%) | 0 (0.0%) |
| High School Diploma | 0 (0.0%) | 0 (0.0%) |
| College or Associate's Degree | 1 (100.0%) | 0 (0.0%) |
| Bachelor's Degree | 0 (0.0%) | 0 (0.0%) |
| Graduate Degree | 0 (0.0%) | 0 (0.0%) |
| Total | 1 (100.0%) | 0 (0.0%) |
Employment Characteristics in Pioneer
Employment by Class of Employer in Pioneer
Among the 661 employed individuals in Pioneer, private company employees (468 | 70.8%), local government employees (109 | 16.5%), and not-for-profit organizations (56 | 8.5%) make up the most common classes of employment.
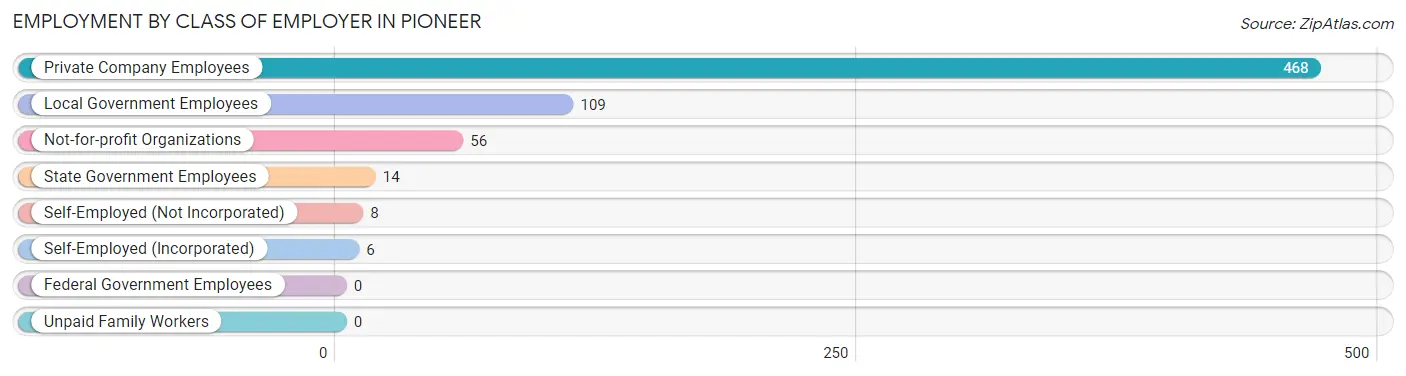
| Employer Class | # Employees | % Employees |
| Private Company Employees | 468 | 70.8% |
| Self-Employed (Incorporated) | 6 | 0.9% |
| Self-Employed (Not Incorporated) | 8 | 1.2% |
| Not-for-profit Organizations | 56 | 8.5% |
| Local Government Employees | 109 | 16.5% |
| State Government Employees | 14 | 2.1% |
| Federal Government Employees | 0 | 0.0% |
| Unpaid Family Workers | 0 | 0.0% |
| Total | 661 | 100.0% |
Employment Status by Age in Pioneer
According to the labor force statistics for Pioneer, out of the total population over 16 years of age (1,061), 65.5% or 695 individuals are in the labor force, with 4.6% or 32 of them unemployed. The age group with the highest labor force participation rate is 25 to 29 years, with 97.5% or 78 individuals in the labor force. Within the labor force, the 20 to 24 years age range has the highest percentage of unemployed individuals, with 23.1% or 28 of them being unemployed.
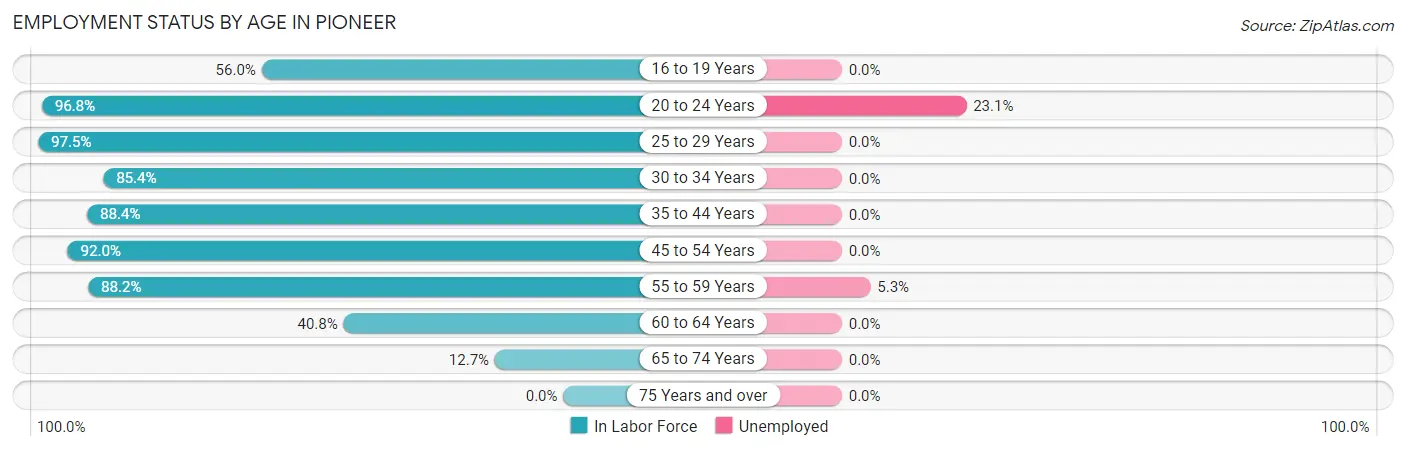
| Age Bracket | In Labor Force | Unemployed |
| 16 to 19 Years | 51 (56.0%) | 0 (0.0%) |
| 20 to 24 Years | 121 (96.8%) | 28 (23.1%) |
| 25 to 29 Years | 78 (97.5%) | 0 (0.0%) |
| 30 to 34 Years | 70 (85.4%) | 0 (0.0%) |
| 35 to 44 Years | 152 (88.4%) | 0 (0.0%) |
| 45 to 54 Years | 92 (92.0%) | 0 (0.0%) |
| 55 to 59 Years | 75 (88.2%) | 4 (5.3%) |
| 60 to 64 Years | 42 (40.8%) | 0 (0.0%) |
| 65 to 74 Years | 14 (12.7%) | 0 (0.0%) |
| 75 Years and over | 0 (0.0%) | 0 (0.0%) |
| Total | 695 (65.5%) | 32 (4.6%) |
Employment Status by Educational Attainment in Pioneer
According to labor force statistics for Pioneer, 81.8% of individuals (509) out of the total population between 25 and 64 years of age (622) are in the labor force, with 0.8% or 4 of them being unemployed. The group with the highest labor force participation rate are those with the educational attainment of bachelor's degree or higher, with 97.9% or 138 individuals in the labor force. Within the labor force, individuals with high school diploma education have the highest percentage of unemployment, with 1.9% or 4 of them being unemployed.
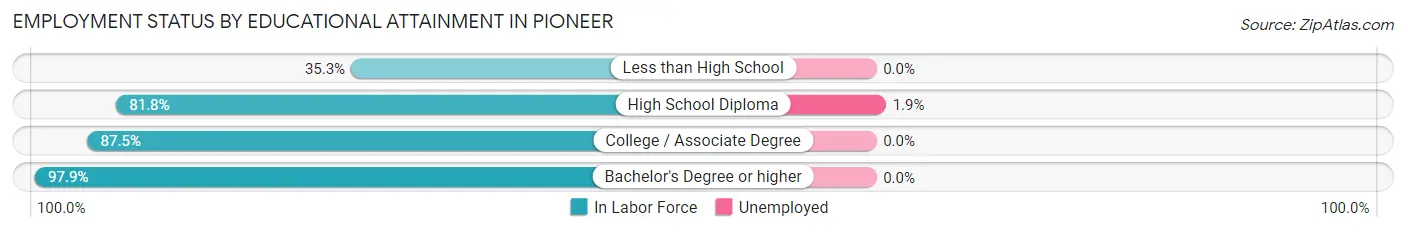
| Educational Attainment | In Labor Force | Unemployed |
| Less than High School | 24 (35.3%) | 0 (0.0%) |
| High School Diploma | 207 (81.8%) | 5 (1.9%) |
| College / Associate Degree | 140 (87.5%) | 0 (0.0%) |
| Bachelor's Degree or higher | 138 (97.9%) | 0 (0.0%) |
| Total | 509 (81.8%) | 5 (0.8%) |
Employment Occupations by Sex in Pioneer
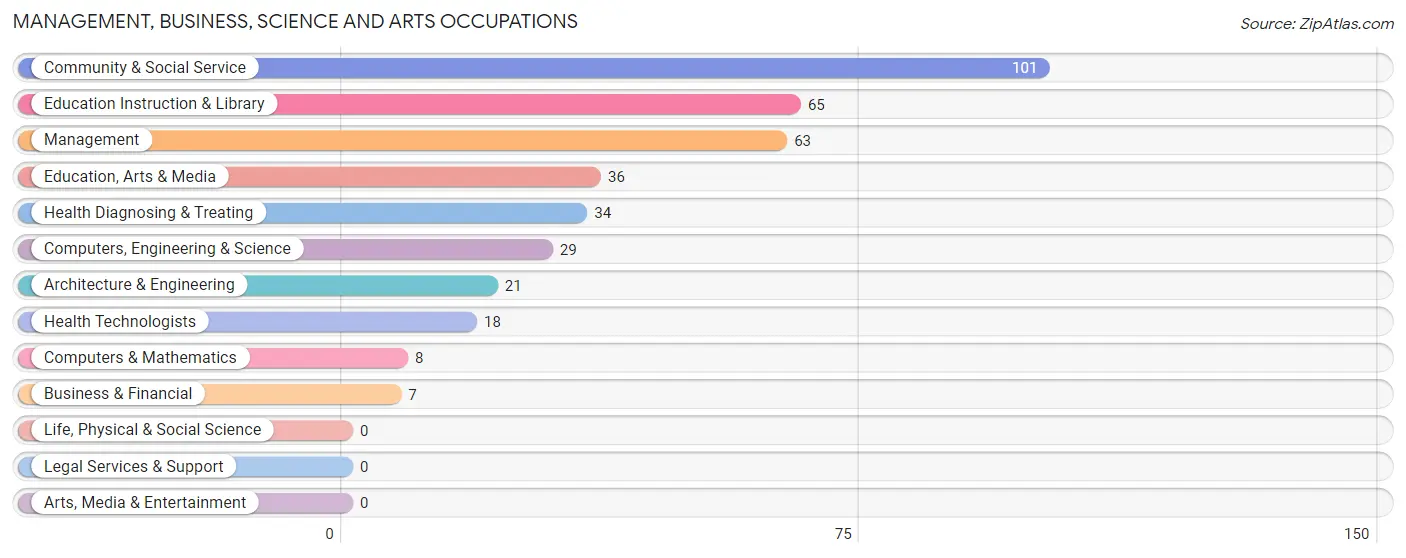
Management, Business, Science and Arts Occupations
The most common Management, Business, Science and Arts occupations in Pioneer are Community & Social Service (101 | 15.2%), Education Instruction & Library (65 | 9.8%), Management (63 | 9.5%), Education, Arts & Media (36 | 5.4%), and Health Diagnosing & Treating (34 | 5.1%).
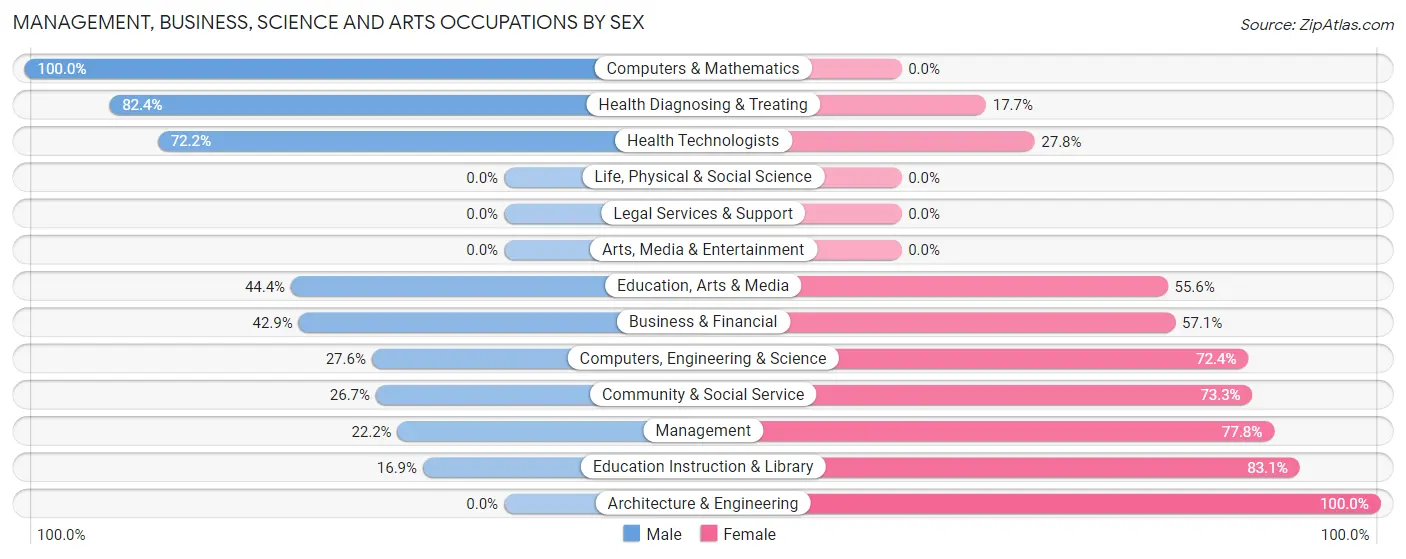
Management, Business, Science and Arts Occupations by Sex
Within the Management, Business, Science and Arts occupations in Pioneer, the most male-oriented occupations are Computers & Mathematics (100.0%), Health Diagnosing & Treating (82.4%), and Health Technologists (72.2%), while the most female-oriented occupations are Architecture & Engineering (100.0%), Education Instruction & Library (83.1%), and Management (77.8%).
| Occupation | Male | Female |
| Management | 14 (22.2%) | 49 (77.8%) |
| Business & Financial | 3 (42.9%) | 4 (57.1%) |
| Computers, Engineering & Science | 8 (27.6%) | 21 (72.4%) |
| Computers & Mathematics | 8 (100.0%) | 0 (0.0%) |
| Architecture & Engineering | 0 (0.0%) | 21 (100.0%) |
| Life, Physical & Social Science | 0 (0.0%) | 0 (0.0%) |
| Community & Social Service | 27 (26.7%) | 74 (73.3%) |
| Education, Arts & Media | 16 (44.4%) | 20 (55.6%) |
| Legal Services & Support | 0 (0.0%) | 0 (0.0%) |
| Education Instruction & Library | 11 (16.9%) | 54 (83.1%) |
| Arts, Media & Entertainment | 0 (0.0%) | 0 (0.0%) |
| Health Diagnosing & Treating | 28 (82.4%) | 6 (17.6%) |
| Health Technologists | 13 (72.2%) | 5 (27.8%) |
| Total (Category) | 80 (34.2%) | 154 (65.8%) |
| Total (Overall) | 320 (48.3%) | 343 (51.7%) |
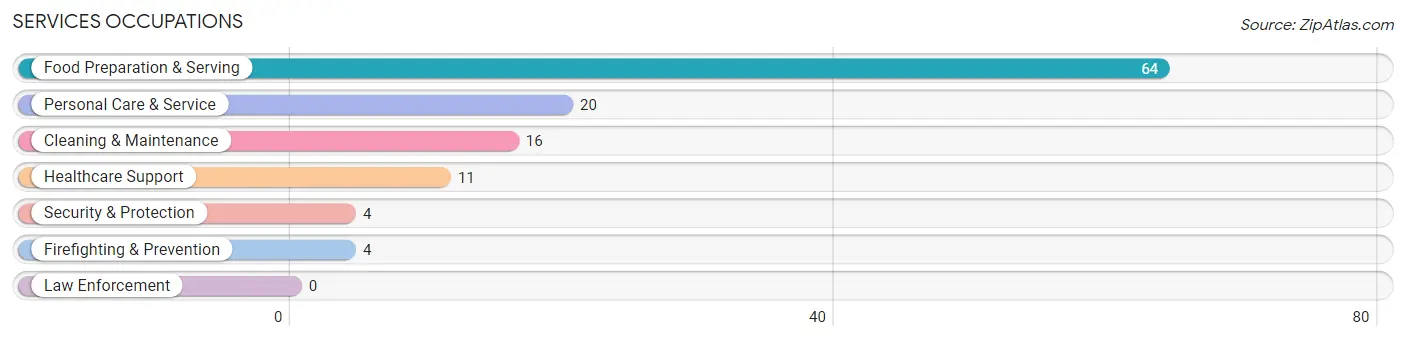
Services Occupations
The most common Services occupations in Pioneer are Food Preparation & Serving (64 | 9.7%), Personal Care & Service (20 | 3.0%), Cleaning & Maintenance (16 | 2.4%), Healthcare Support (11 | 1.7%), and Security & Protection (4 | 0.6%).
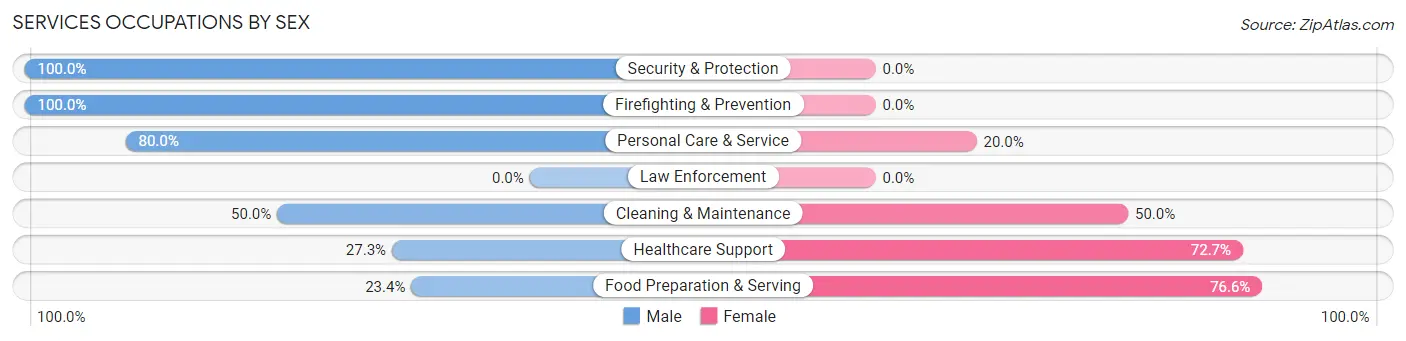
Services Occupations by Sex
Within the Services occupations in Pioneer, the most male-oriented occupations are Security & Protection (100.0%), Firefighting & Prevention (100.0%), and Personal Care & Service (80.0%), while the most female-oriented occupations are Food Preparation & Serving (76.6%), Healthcare Support (72.7%), and Cleaning & Maintenance (50.0%).
| Occupation | Male | Female |
| Healthcare Support | 3 (27.3%) | 8 (72.7%) |
| Security & Protection | 4 (100.0%) | 0 (0.0%) |
| Firefighting & Prevention | 4 (100.0%) | 0 (0.0%) |
| Law Enforcement | 0 (0.0%) | 0 (0.0%) |
| Food Preparation & Serving | 15 (23.4%) | 49 (76.6%) |
| Cleaning & Maintenance | 8 (50.0%) | 8 (50.0%) |
| Personal Care & Service | 16 (80.0%) | 4 (20.0%) |
| Total (Category) | 46 (40.0%) | 69 (60.0%) |
| Total (Overall) | 320 (48.3%) | 343 (51.7%) |
Sales and Office Occupations
The most common Sales and Office occupations in Pioneer are Sales & Related (75 | 11.3%), and Office & Administration (18 | 2.7%).
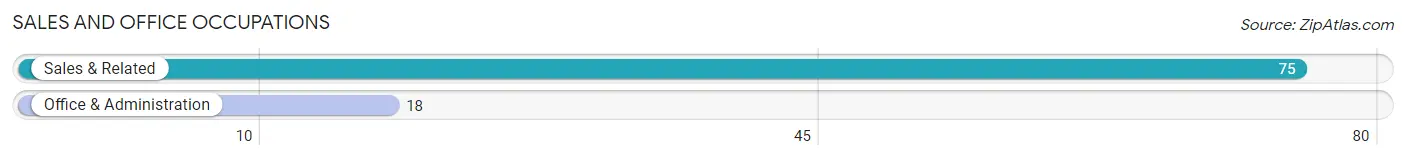
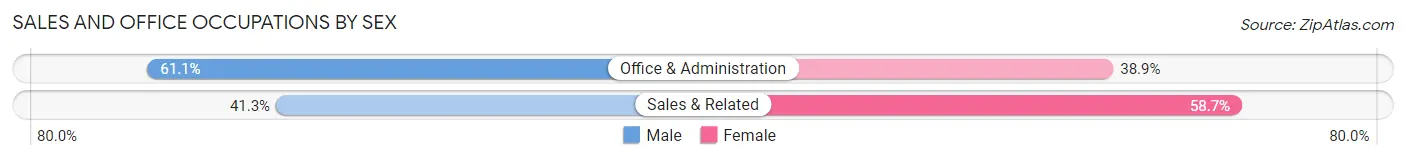
Sales and Office Occupations by Sex
| Occupation | Male | Female |
| Sales & Related | 31 (41.3%) | 44 (58.7%) |
| Office & Administration | 11 (61.1%) | 7 (38.9%) |
| Total (Category) | 42 (45.2%) | 51 (54.8%) |
| Total (Overall) | 320 (48.3%) | 343 (51.7%) |
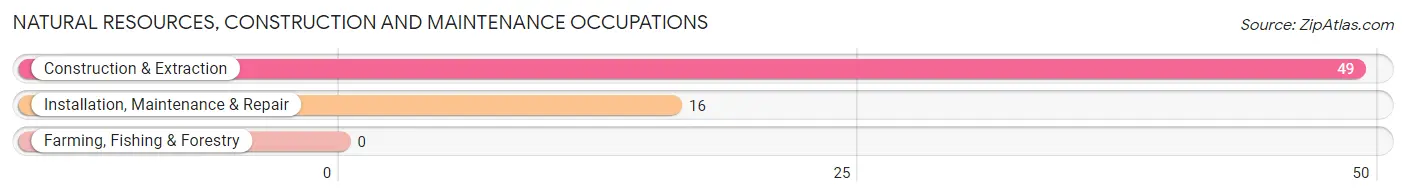
Natural Resources, Construction and Maintenance Occupations
The most common Natural Resources, Construction and Maintenance occupations in Pioneer are Construction & Extraction (49 | 7.4%), and Installation, Maintenance & Repair (16 | 2.4%).
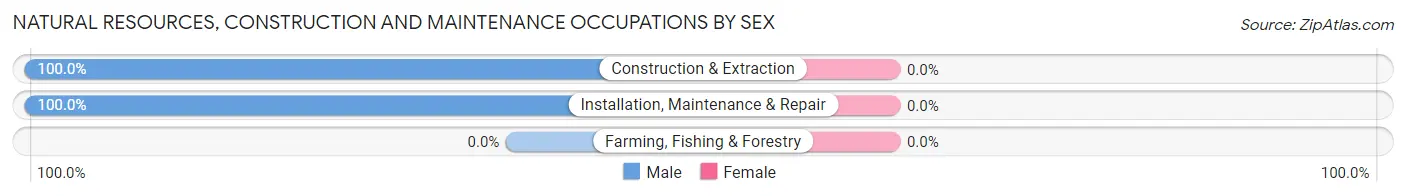
Natural Resources, Construction and Maintenance Occupations by Sex
| Occupation | Male | Female |
| Farming, Fishing & Forestry | 0 (0.0%) | 0 (0.0%) |
| Construction & Extraction | 49 (100.0%) | 0 (0.0%) |
| Installation, Maintenance & Repair | 16 (100.0%) | 0 (0.0%) |
| Total (Category) | 65 (100.0%) | 0 (0.0%) |
| Total (Overall) | 320 (48.3%) | 343 (51.7%) |
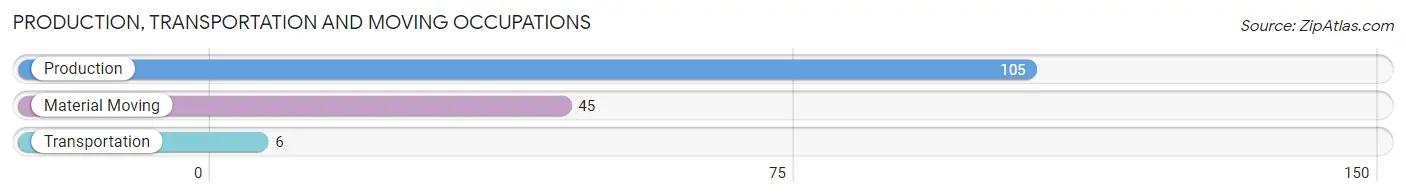
Production, Transportation and Moving Occupations
The most common Production, Transportation and Moving occupations in Pioneer are Production (105 | 15.8%), Material Moving (45 | 6.8%), and Transportation (6 | 0.9%).
Production, Transportation and Moving Occupations by Sex
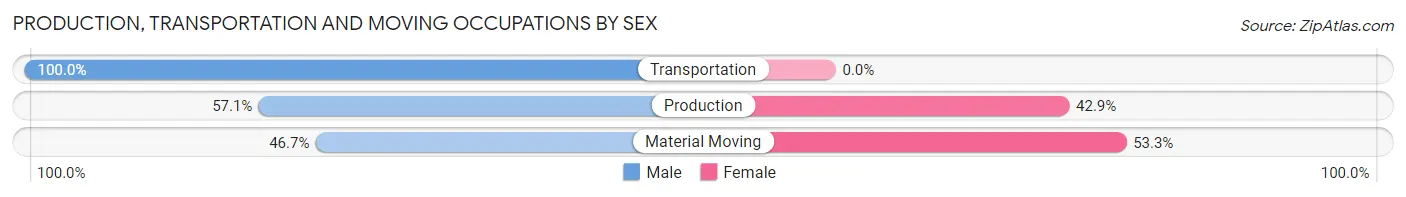
| Occupation | Male | Female |
| Production | 60 (57.1%) | 45 (42.9%) |
| Transportation | 6 (100.0%) | 0 (0.0%) |
| Material Moving | 21 (46.7%) | 24 (53.3%) |
| Total (Category) | 87 (55.8%) | 69 (44.2%) |
| Total (Overall) | 320 (48.3%) | 343 (51.7%) |
Employment Industries by Sex in Pioneer
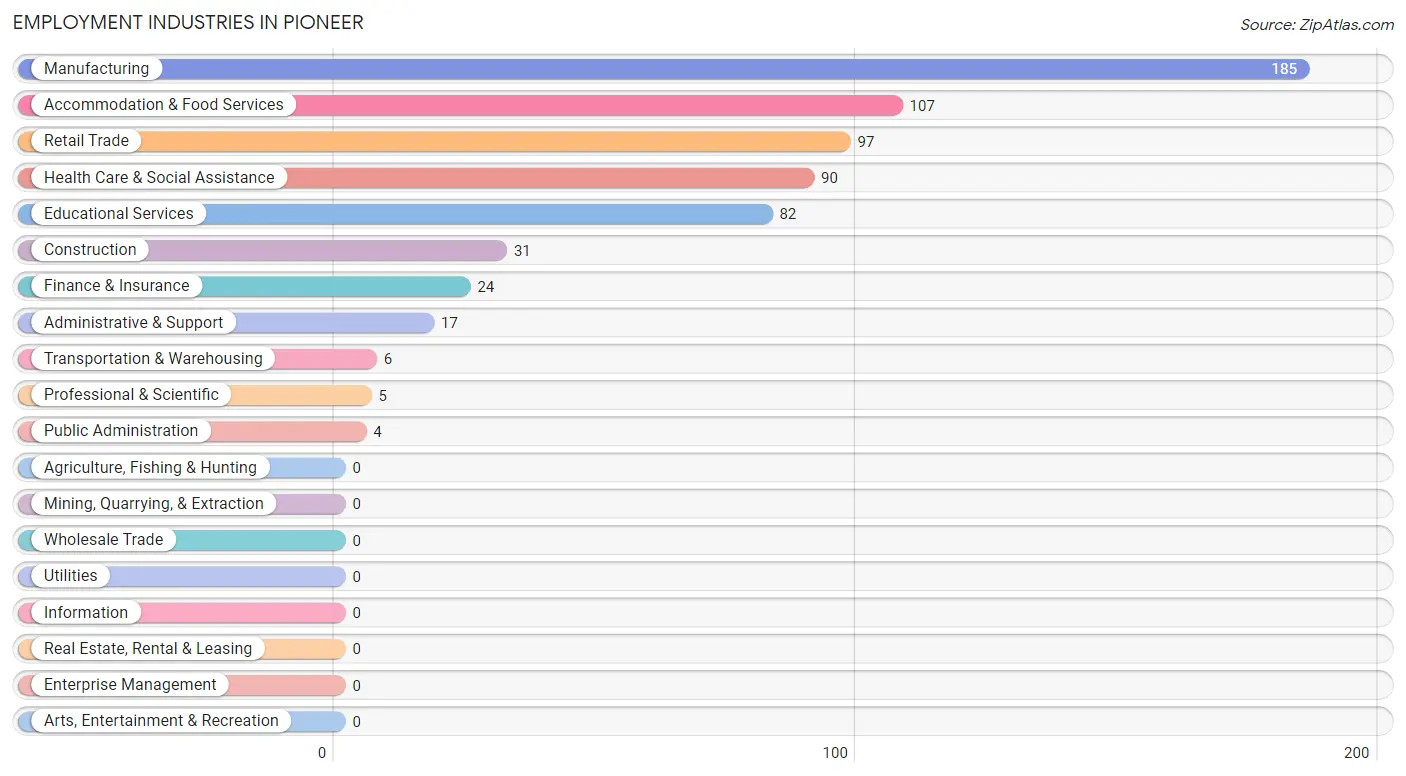
Employment Industries in Pioneer
The major employment industries in Pioneer include Manufacturing (185 | 27.9%), Accommodation & Food Services (107 | 16.1%), Retail Trade (97 | 14.6%), Health Care & Social Assistance (90 | 13.6%), and Educational Services (82 | 12.4%).
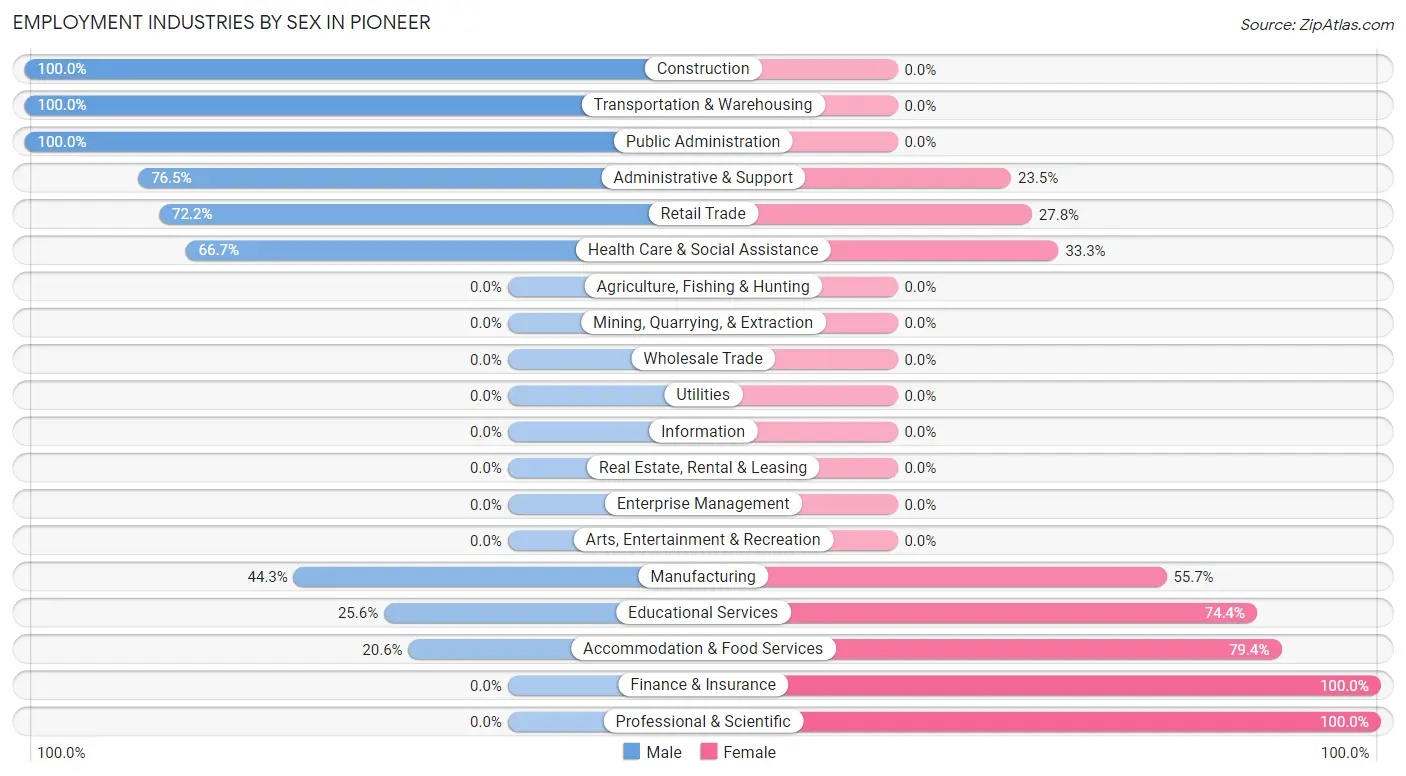
Employment Industries by Sex in Pioneer
The Pioneer industries that see more men than women are Construction (100.0%), Transportation & Warehousing (100.0%), and Public Administration (100.0%), whereas the industries that tend to have a higher number of women are Finance & Insurance (100.0%), Professional & Scientific (100.0%), and Accommodation & Food Services (79.4%).
| Industry | Male | Female |
| Agriculture, Fishing & Hunting | 0 (0.0%) | 0 (0.0%) |
| Mining, Quarrying, & Extraction | 0 (0.0%) | 0 (0.0%) |
| Construction | 31 (100.0%) | 0 (0.0%) |
| Manufacturing | 82 (44.3%) | 103 (55.7%) |
| Wholesale Trade | 0 (0.0%) | 0 (0.0%) |
| Retail Trade | 70 (72.2%) | 27 (27.8%) |
| Transportation & Warehousing | 6 (100.0%) | 0 (0.0%) |
| Utilities | 0 (0.0%) | 0 (0.0%) |
| Information | 0 (0.0%) | 0 (0.0%) |
| Finance & Insurance | 0 (0.0%) | 24 (100.0%) |
| Real Estate, Rental & Leasing | 0 (0.0%) | 0 (0.0%) |
| Professional & Scientific | 0 (0.0%) | 5 (100.0%) |
| Enterprise Management | 0 (0.0%) | 0 (0.0%) |
| Administrative & Support | 13 (76.5%) | 4 (23.5%) |
| Educational Services | 21 (25.6%) | 61 (74.4%) |
| Health Care & Social Assistance | 60 (66.7%) | 30 (33.3%) |
| Arts, Entertainment & Recreation | 0 (0.0%) | 0 (0.0%) |
| Accommodation & Food Services | 22 (20.6%) | 85 (79.4%) |
| Public Administration | 4 (100.0%) | 0 (0.0%) |
| Total | 320 (48.3%) | 343 (51.7%) |
Education in Pioneer
School Enrollment in Pioneer
The most common levels of schooling among the 339 students in Pioneer are middle school (95 | 28.0%), elementary school (84 | 24.8%), and college / undergraduate (73 | 21.5%).
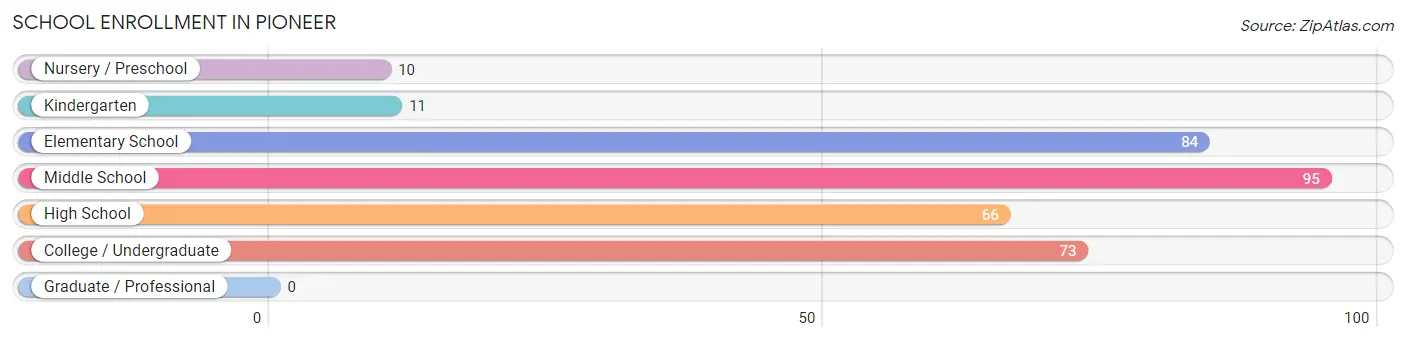
| School Level | # Students | % Students |
| Nursery / Preschool | 10 | 2.9% |
| Kindergarten | 11 | 3.2% |
| Elementary School | 84 | 24.8% |
| Middle School | 95 | 28.0% |
| High School | 66 | 19.5% |
| College / Undergraduate | 73 | 21.5% |
| Graduate / Professional | 0 | 0.0% |
| Total | 339 | 100.0% |
School Enrollment by Age by Funding Source in Pioneer
Out of a total of 339 students who are enrolled in schools in Pioneer, 28 (8.3%) attend a private institution, while the remaining 311 (91.7%) are enrolled in public schools. The age group of 35 years and over has the highest likelihood of being enrolled in private schools, with 13 (100.0% in the age bracket) enrolled. Conversely, the age group of 10 to 14 year olds has the lowest likelihood of being enrolled in a private school, with 125 (100.0% in the age bracket) attending a public institution.
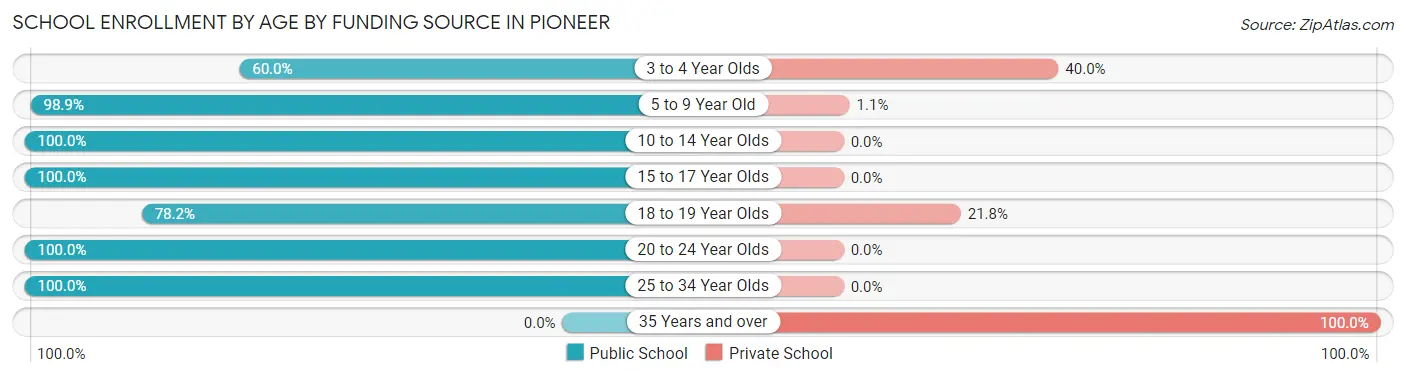
| Age Bracket | Public School | Private School |
| 3 to 4 Year Olds | 3 (60.0%) | 2 (40.0%) |
| 5 to 9 Year Old | 89 (98.9%) | 1 (1.1%) |
| 10 to 14 Year Olds | 125 (100.0%) | 0 (0.0%) |
| 15 to 17 Year Olds | 40 (100.0%) | 0 (0.0%) |
| 18 to 19 Year Olds | 43 (78.2%) | 12 (21.8%) |
| 20 to 24 Year Olds | 9 (100.0%) | 0 (0.0%) |
| 25 to 34 Year Olds | 2 (100.0%) | 0 (0.0%) |
| 35 Years and over | 0 (0.0%) | 13 (100.0%) |
| Total | 311 (91.7%) | 28 (8.3%) |
Educational Attainment by Field of Study in Pioneer
Education (45 | 25.0%), social sciences (43 | 23.9%), business (41 | 22.8%), psychology (15 | 8.3%), and engineering (13 | 7.2%) are the most common fields of study among 180 individuals in Pioneer who have obtained a bachelor's degree or higher.
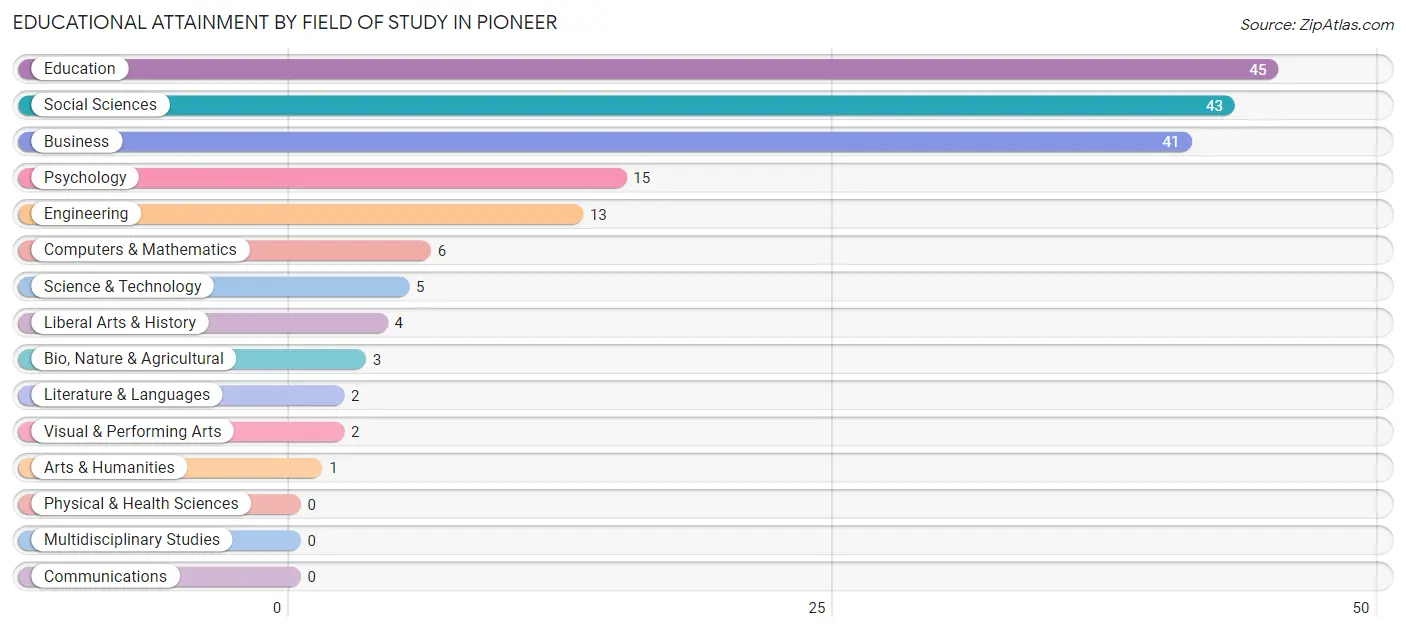
| Field of Study | # Graduates | % Graduates |
| Computers & Mathematics | 6 | 3.3% |
| Bio, Nature & Agricultural | 3 | 1.7% |
| Physical & Health Sciences | 0 | 0.0% |
| Psychology | 15 | 8.3% |
| Social Sciences | 43 | 23.9% |
| Engineering | 13 | 7.2% |
| Multidisciplinary Studies | 0 | 0.0% |
| Science & Technology | 5 | 2.8% |
| Business | 41 | 22.8% |
| Education | 45 | 25.0% |
| Literature & Languages | 2 | 1.1% |
| Liberal Arts & History | 4 | 2.2% |
| Visual & Performing Arts | 2 | 1.1% |
| Communications | 0 | 0.0% |
| Arts & Humanities | 1 | 0.6% |
| Total | 180 | 100.0% |
Transportation & Commute in Pioneer
Vehicle Availability by Sex in Pioneer
The most prevalent vehicle ownership categories in Pioneer are males with 2 vehicles (148, accounting for 46.3%) and females with 2 vehicles (124, making up 43.4%).
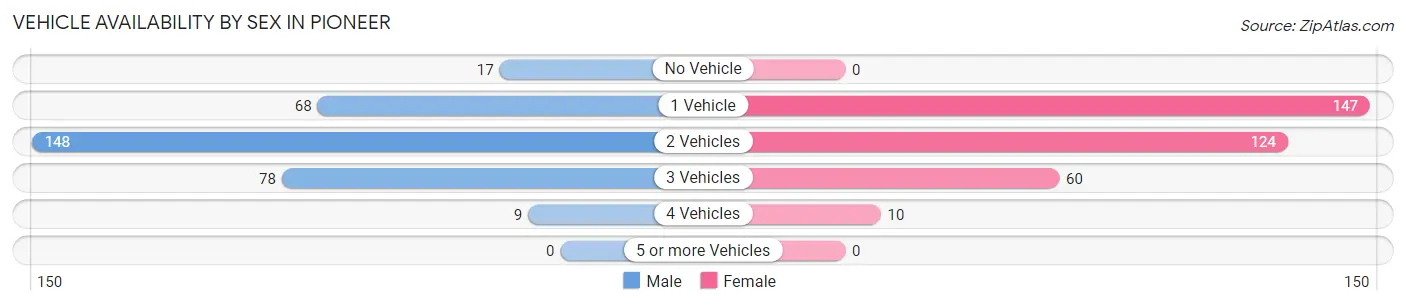
| Vehicles Available | Male | Female |
| No Vehicle | 17 (5.3%) | 0 (0.0%) |
| 1 Vehicle | 68 (21.2%) | 147 (43.1%) |
| 2 Vehicles | 148 (46.3%) | 124 (36.4%) |
| 3 Vehicles | 78 (24.4%) | 60 (17.6%) |
| 4 Vehicles | 9 (2.8%) | 10 (2.9%) |
| 5 or more Vehicles | 0 (0.0%) | 0 (0.0%) |
| Total | 320 (100.0%) | 341 (100.0%) |
Commute Time in Pioneer
The most frequently occuring commute durations in Pioneer are 5 to 9 minutes (200 commuters, 31.1%), 10 to 14 minutes (120 commuters, 18.6%), and 20 to 24 minutes (72 commuters, 11.2%).
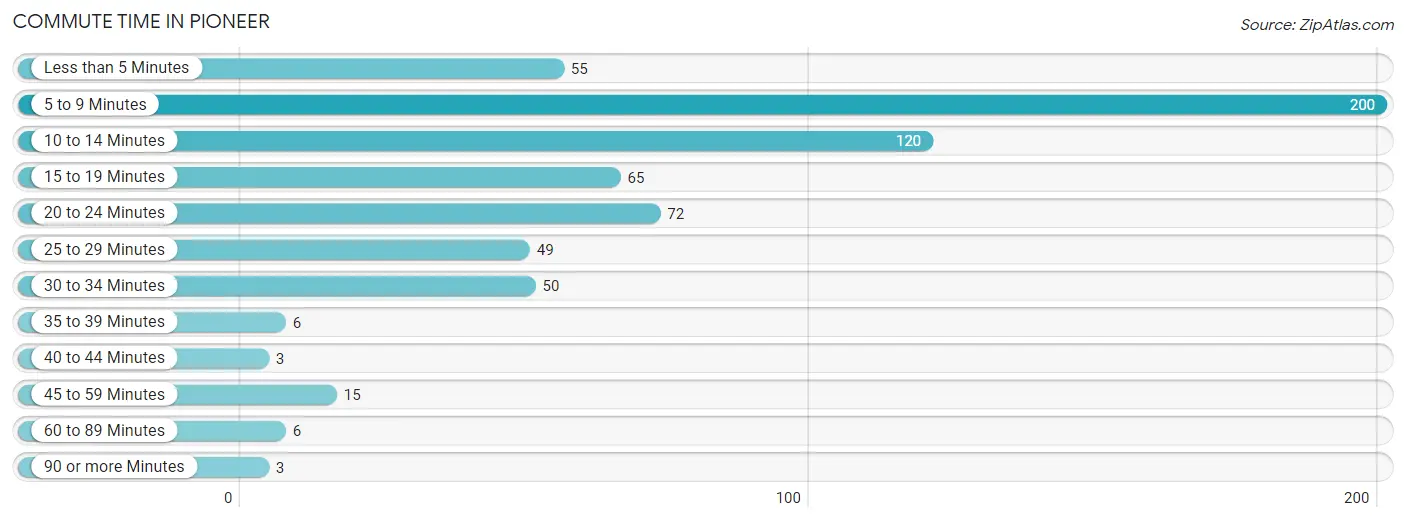
| Commute Time | # Commuters | % Commuters |
| Less than 5 Minutes | 55 | 8.5% |
| 5 to 9 Minutes | 200 | 31.1% |
| 10 to 14 Minutes | 120 | 18.6% |
| 15 to 19 Minutes | 65 | 10.1% |
| 20 to 24 Minutes | 72 | 11.2% |
| 25 to 29 Minutes | 49 | 7.6% |
| 30 to 34 Minutes | 50 | 7.8% |
| 35 to 39 Minutes | 6 | 0.9% |
| 40 to 44 Minutes | 3 | 0.5% |
| 45 to 59 Minutes | 15 | 2.3% |
| 60 to 89 Minutes | 6 | 0.9% |
| 90 or more Minutes | 3 | 0.5% |
Commute Time by Sex in Pioneer
The most common commute times in Pioneer are 5 to 9 minutes (90 commuters, 29.5%) for males and 5 to 9 minutes (110 commuters, 32.5%) for females.
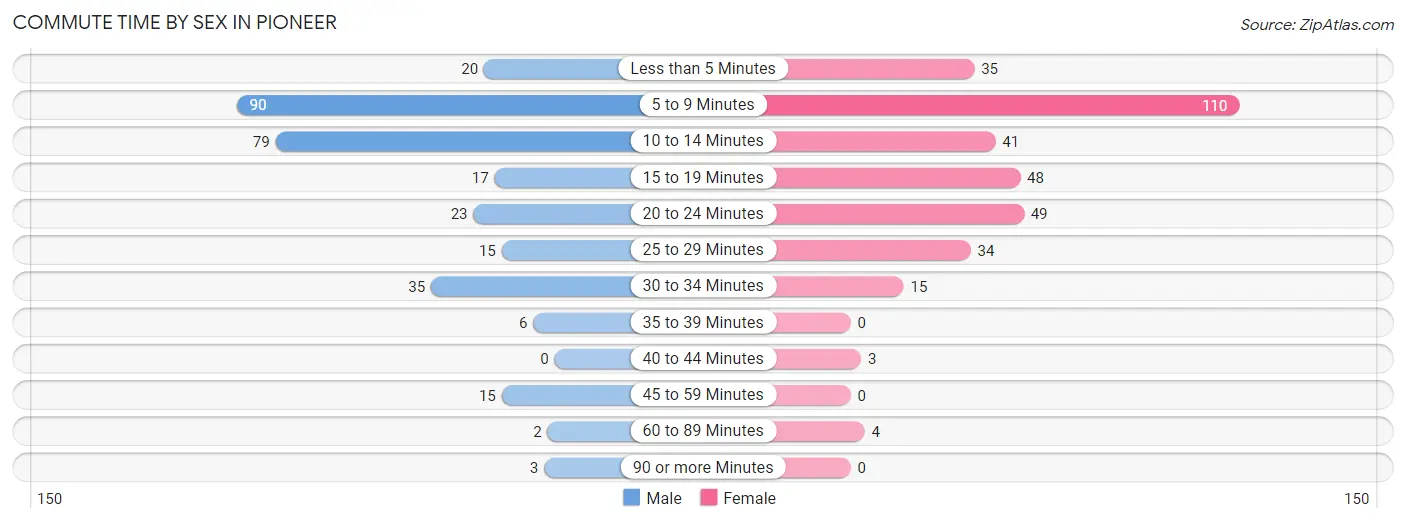
| Commute Time | Male | Female |
| Less than 5 Minutes | 20 (6.6%) | 35 (10.3%) |
| 5 to 9 Minutes | 90 (29.5%) | 110 (32.5%) |
| 10 to 14 Minutes | 79 (25.9%) | 41 (12.1%) |
| 15 to 19 Minutes | 17 (5.6%) | 48 (14.2%) |
| 20 to 24 Minutes | 23 (7.5%) | 49 (14.4%) |
| 25 to 29 Minutes | 15 (4.9%) | 34 (10.0%) |
| 30 to 34 Minutes | 35 (11.5%) | 15 (4.4%) |
| 35 to 39 Minutes | 6 (2.0%) | 0 (0.0%) |
| 40 to 44 Minutes | 0 (0.0%) | 3 (0.9%) |
| 45 to 59 Minutes | 15 (4.9%) | 0 (0.0%) |
| 60 to 89 Minutes | 2 (0.7%) | 4 (1.2%) |
| 90 or more Minutes | 3 (1.0%) | 0 (0.0%) |
Time of Departure to Work by Sex in Pioneer
The most frequent times of departure to work in Pioneer are 6:30 AM to 6:59 AM (60, 19.7%) for males and 7:30 AM to 7:59 AM (93, 27.4%) for females.
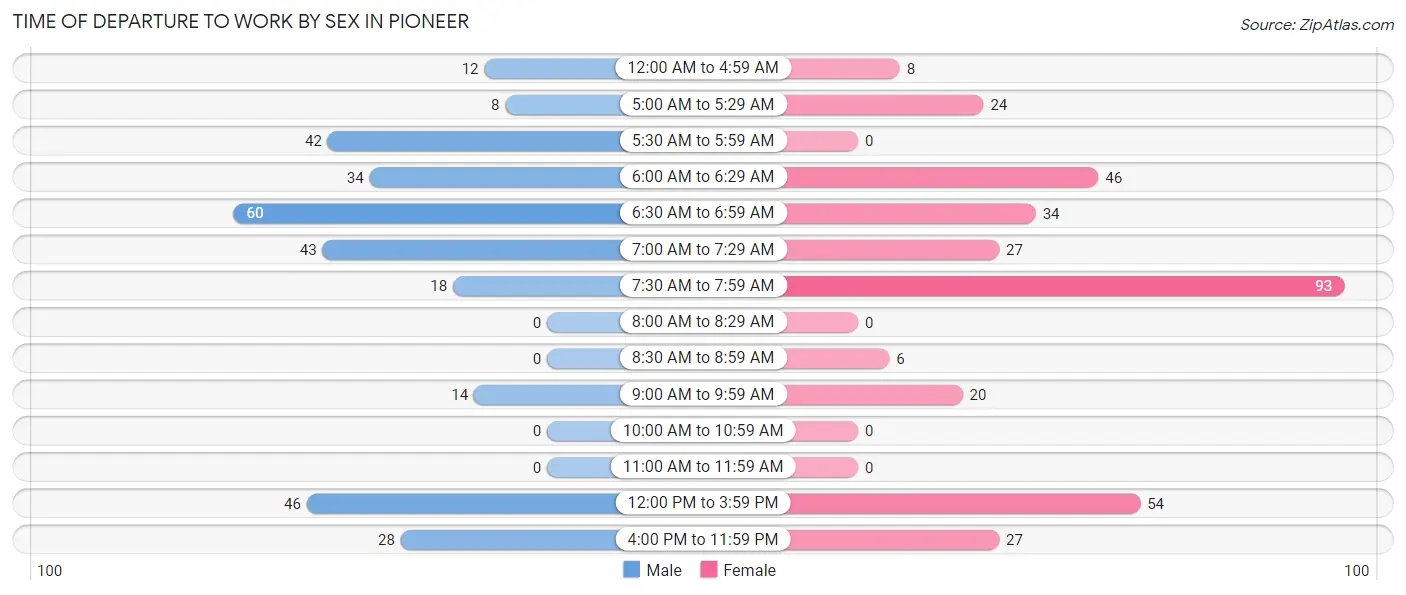
| Time of Departure | Male | Female |
| 12:00 AM to 4:59 AM | 12 (3.9%) | 8 (2.4%) |
| 5:00 AM to 5:29 AM | 8 (2.6%) | 24 (7.1%) |
| 5:30 AM to 5:59 AM | 42 (13.8%) | 0 (0.0%) |
| 6:00 AM to 6:29 AM | 34 (11.2%) | 46 (13.6%) |
| 6:30 AM to 6:59 AM | 60 (19.7%) | 34 (10.0%) |
| 7:00 AM to 7:29 AM | 43 (14.1%) | 27 (8.0%) |
| 7:30 AM to 7:59 AM | 18 (5.9%) | 93 (27.4%) |
| 8:00 AM to 8:29 AM | 0 (0.0%) | 0 (0.0%) |
| 8:30 AM to 8:59 AM | 0 (0.0%) | 6 (1.8%) |
| 9:00 AM to 9:59 AM | 14 (4.6%) | 20 (5.9%) |
| 10:00 AM to 10:59 AM | 0 (0.0%) | 0 (0.0%) |
| 11:00 AM to 11:59 AM | 0 (0.0%) | 0 (0.0%) |
| 12:00 PM to 3:59 PM | 46 (15.1%) | 54 (15.9%) |
| 4:00 PM to 11:59 PM | 28 (9.2%) | 27 (8.0%) |
| Total | 305 (100.0%) | 339 (100.0%) |
Housing Occupancy in Pioneer
Occupancy by Ownership in Pioneer
Of the total 588 dwellings in Pioneer, owner-occupied units account for 300 (51.0%), while renter-occupied units make up 288 (49.0%).
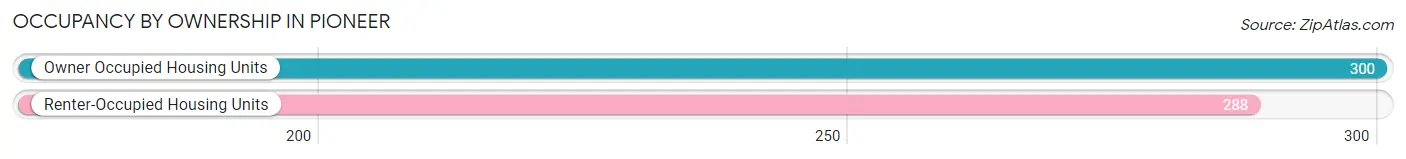
| Occupancy | # Housing Units | % Housing Units |
| Owner Occupied Housing Units | 300 | 51.0% |
| Renter-Occupied Housing Units | 288 | 49.0% |
| Total Occupied Housing Units | 588 | 100.0% |
Occupancy by Household Size in Pioneer
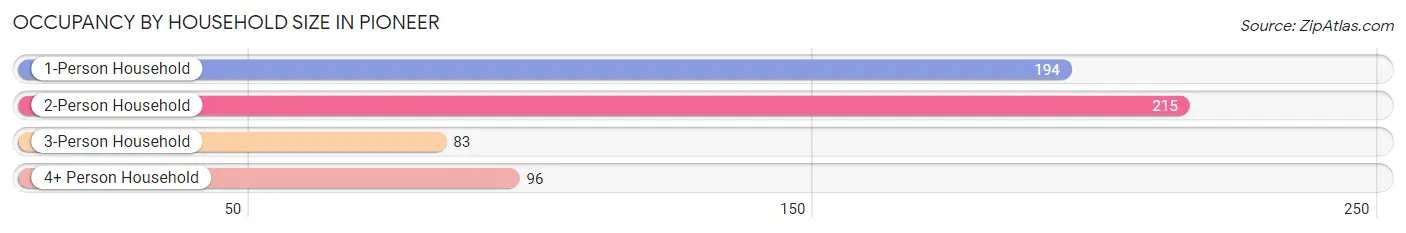
| Household Size | # Housing Units | % Housing Units |
| 1-Person Household | 194 | 33.0% |
| 2-Person Household | 215 | 36.6% |
| 3-Person Household | 83 | 14.1% |
| 4+ Person Household | 96 | 16.3% |
| Total Housing Units | 588 | 100.0% |
Occupancy by Ownership by Household Size in Pioneer
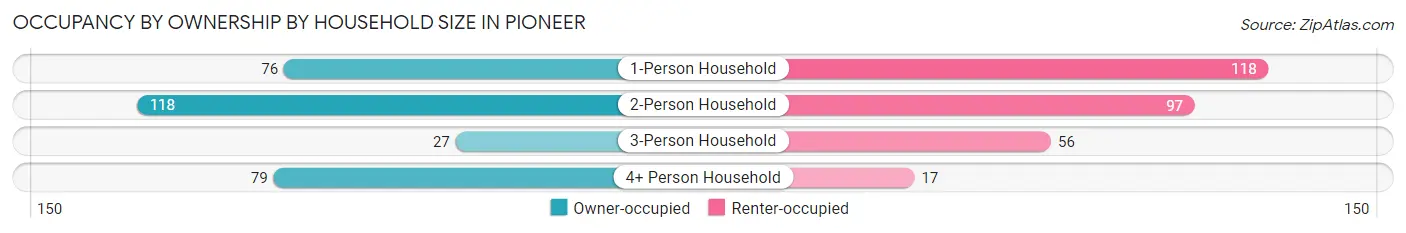
| Household Size | Owner-occupied | Renter-occupied |
| 1-Person Household | 76 (39.2%) | 118 (60.8%) |
| 2-Person Household | 118 (54.9%) | 97 (45.1%) |
| 3-Person Household | 27 (32.5%) | 56 (67.5%) |
| 4+ Person Household | 79 (82.3%) | 17 (17.7%) |
| Total Housing Units | 300 (51.0%) | 288 (49.0%) |
Occupancy by Educational Attainment in Pioneer
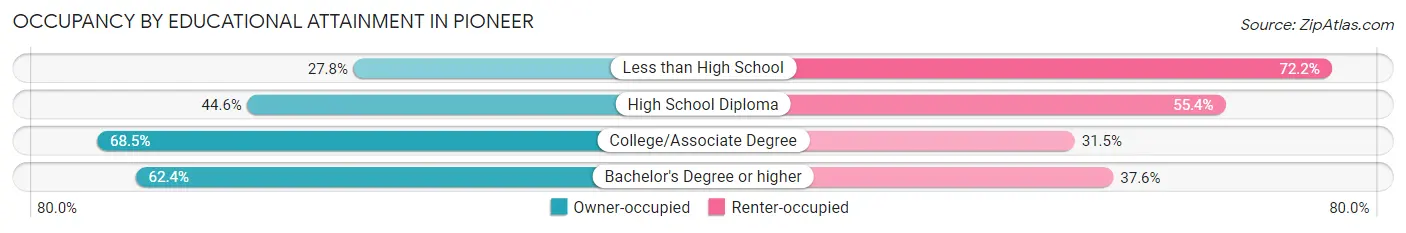
| Household Size | Owner-occupied | Renter-occupied |
| Less than High School | 25 (27.8%) | 65 (72.2%) |
| High School Diploma | 112 (44.6%) | 139 (55.4%) |
| College/Associate Degree | 100 (68.5%) | 46 (31.5%) |
| Bachelor's Degree or higher | 63 (62.4%) | 38 (37.6%) |
Occupancy by Age of Householder in Pioneer
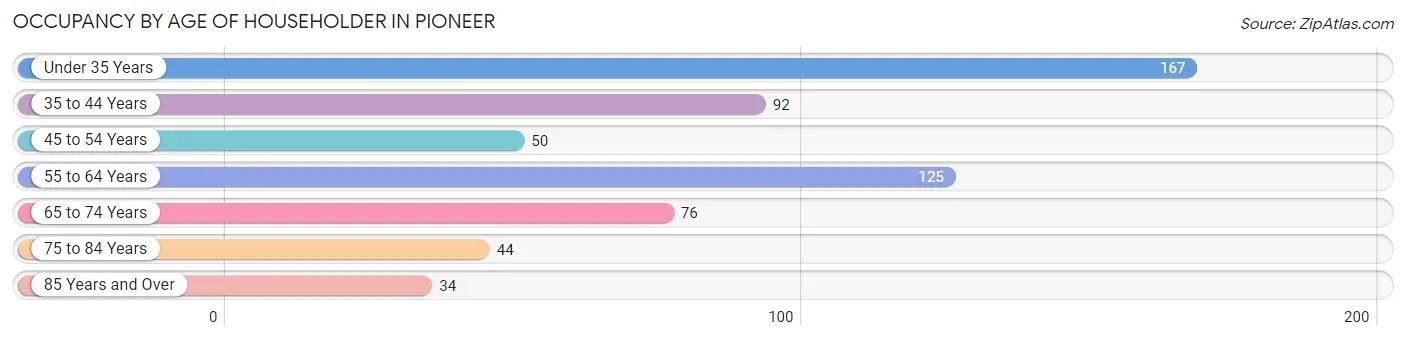
| Age Bracket | # Households | % Households |
| Under 35 Years | 167 | 28.4% |
| 35 to 44 Years | 92 | 15.7% |
| 45 to 54 Years | 50 | 8.5% |
| 55 to 64 Years | 125 | 21.3% |
| 65 to 74 Years | 76 | 12.9% |
| 75 to 84 Years | 44 | 7.5% |
| 85 Years and Over | 34 | 5.8% |
| Total | 588 | 100.0% |
Housing Finances in Pioneer
Median Income by Occupancy in Pioneer
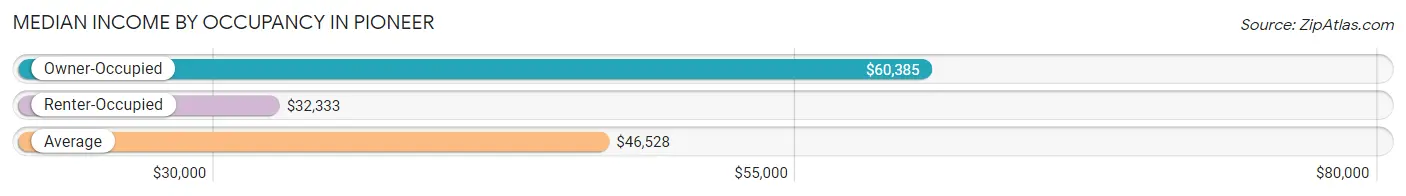
| Occupancy Type | # Households | Median Income |
| Owner-Occupied | 300 (51.0%) | $60,385 |
| Renter-Occupied | 288 (49.0%) | $32,333 |
| Average | 588 (100.0%) | $46,528 |
Occupancy by Householder Income Bracket in Pioneer
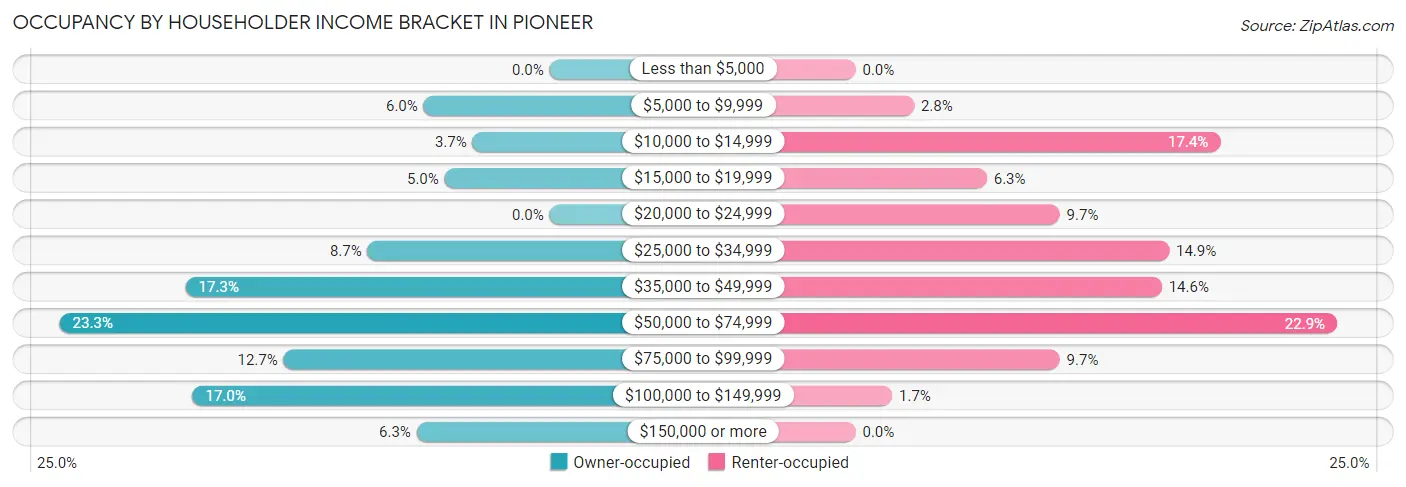
| Income Bracket | Owner-occupied | Renter-occupied |
| Less than $5,000 | 0 (0.0%) | 0 (0.0%) |
| $5,000 to $9,999 | 18 (6.0%) | 8 (2.8%) |
| $10,000 to $14,999 | 11 (3.7%) | 50 (17.4%) |
| $15,000 to $19,999 | 15 (5.0%) | 18 (6.2%) |
| $20,000 to $24,999 | 0 (0.0%) | 28 (9.7%) |
| $25,000 to $34,999 | 26 (8.7%) | 43 (14.9%) |
| $35,000 to $49,999 | 52 (17.3%) | 42 (14.6%) |
| $50,000 to $74,999 | 70 (23.3%) | 66 (22.9%) |
| $75,000 to $99,999 | 38 (12.7%) | 28 (9.7%) |
| $100,000 to $149,999 | 51 (17.0%) | 5 (1.7%) |
| $150,000 or more | 19 (6.3%) | 0 (0.0%) |
| Total | 300 (100.0%) | 288 (100.0%) |
Monthly Housing Cost Tiers in Pioneer
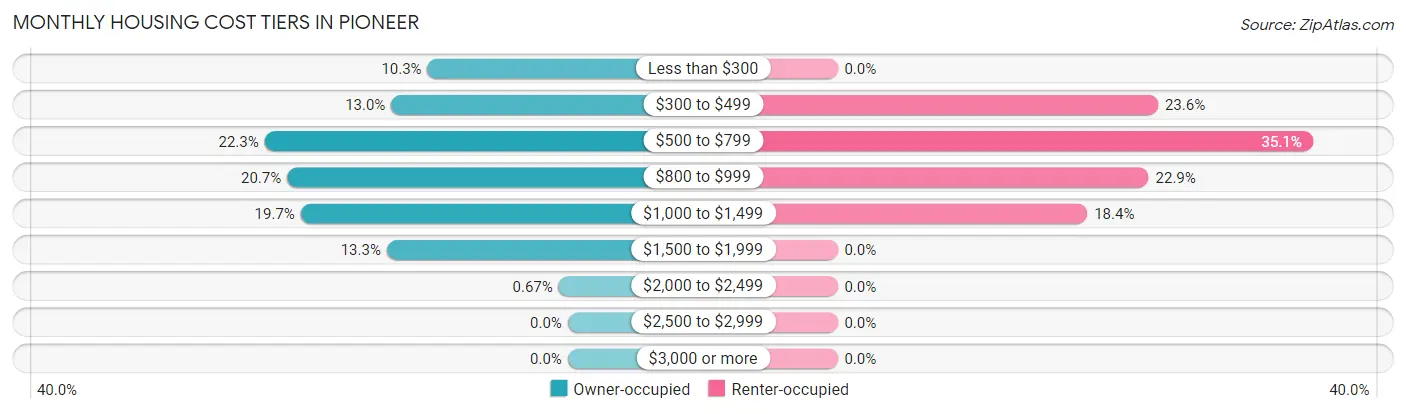
| Monthly Cost | Owner-occupied | Renter-occupied |
| Less than $300 | 31 (10.3%) | 0 (0.0%) |
| $300 to $499 | 39 (13.0%) | 68 (23.6%) |
| $500 to $799 | 67 (22.3%) | 101 (35.1%) |
| $800 to $999 | 62 (20.7%) | 66 (22.9%) |
| $1,000 to $1,499 | 59 (19.7%) | 53 (18.4%) |
| $1,500 to $1,999 | 40 (13.3%) | 0 (0.0%) |
| $2,000 to $2,499 | 2 (0.7%) | 0 (0.0%) |
| $2,500 to $2,999 | 0 (0.0%) | 0 (0.0%) |
| $3,000 or more | 0 (0.0%) | 0 (0.0%) |
| Total | 300 (100.0%) | 288 (100.0%) |
Physical Housing Characteristics in Pioneer
Housing Structures in Pioneer
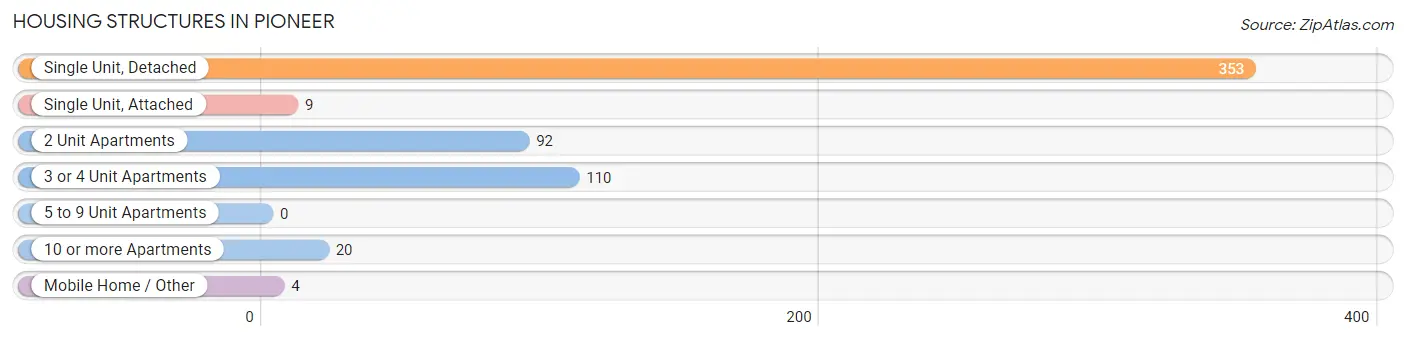
| Structure Type | # Housing Units | % Housing Units |
| Single Unit, Detached | 353 | 60.0% |
| Single Unit, Attached | 9 | 1.5% |
| 2 Unit Apartments | 92 | 15.7% |
| 3 or 4 Unit Apartments | 110 | 18.7% |
| 5 to 9 Unit Apartments | 0 | 0.0% |
| 10 or more Apartments | 20 | 3.4% |
| Mobile Home / Other | 4 | 0.7% |
| Total | 588 | 100.0% |
Housing Structures by Occupancy in Pioneer
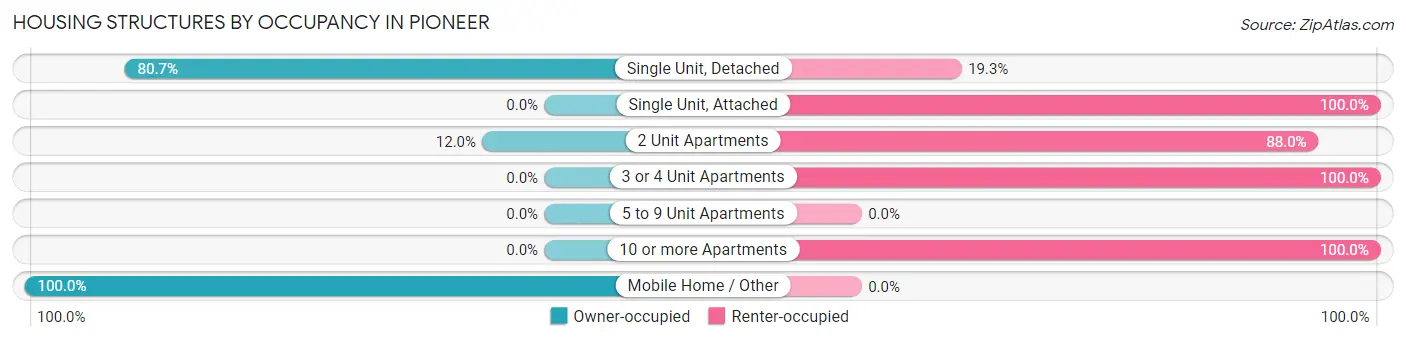
| Structure Type | Owner-occupied | Renter-occupied |
| Single Unit, Detached | 285 (80.7%) | 68 (19.3%) |
| Single Unit, Attached | 0 (0.0%) | 9 (100.0%) |
| 2 Unit Apartments | 11 (12.0%) | 81 (88.0%) |
| 3 or 4 Unit Apartments | 0 (0.0%) | 110 (100.0%) |
| 5 to 9 Unit Apartments | 0 (0.0%) | 0 (0.0%) |
| 10 or more Apartments | 0 (0.0%) | 20 (100.0%) |
| Mobile Home / Other | 4 (100.0%) | 0 (0.0%) |
| Total | 300 (51.0%) | 288 (49.0%) |
Housing Structures by Number of Rooms in Pioneer
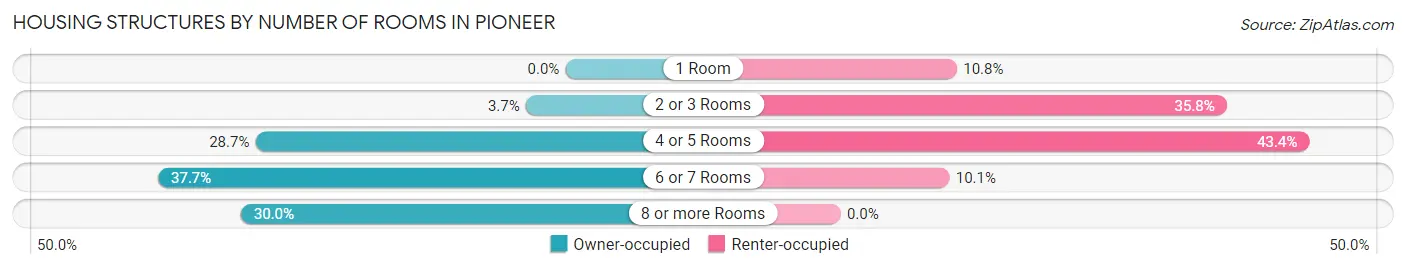
| Number of Rooms | Owner-occupied | Renter-occupied |
| 1 Room | 0 (0.0%) | 31 (10.8%) |
| 2 or 3 Rooms | 11 (3.7%) | 103 (35.8%) |
| 4 or 5 Rooms | 86 (28.7%) | 125 (43.4%) |
| 6 or 7 Rooms | 113 (37.7%) | 29 (10.1%) |
| 8 or more Rooms | 90 (30.0%) | 0 (0.0%) |
| Total | 300 (100.0%) | 288 (100.0%) |
Housing Structure by Heating Type in Pioneer
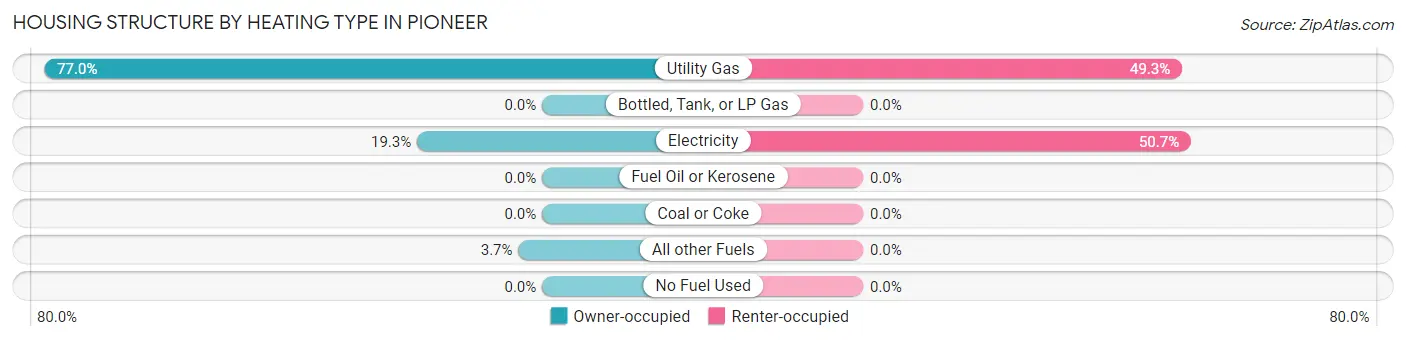
| Heating Type | Owner-occupied | Renter-occupied |
| Utility Gas | 231 (77.0%) | 142 (49.3%) |
| Bottled, Tank, or LP Gas | 0 (0.0%) | 0 (0.0%) |
| Electricity | 58 (19.3%) | 146 (50.7%) |
| Fuel Oil or Kerosene | 0 (0.0%) | 0 (0.0%) |
| Coal or Coke | 0 (0.0%) | 0 (0.0%) |
| All other Fuels | 11 (3.7%) | 0 (0.0%) |
| No Fuel Used | 0 (0.0%) | 0 (0.0%) |
| Total | 300 (100.0%) | 288 (100.0%) |
Household Vehicle Usage in Pioneer
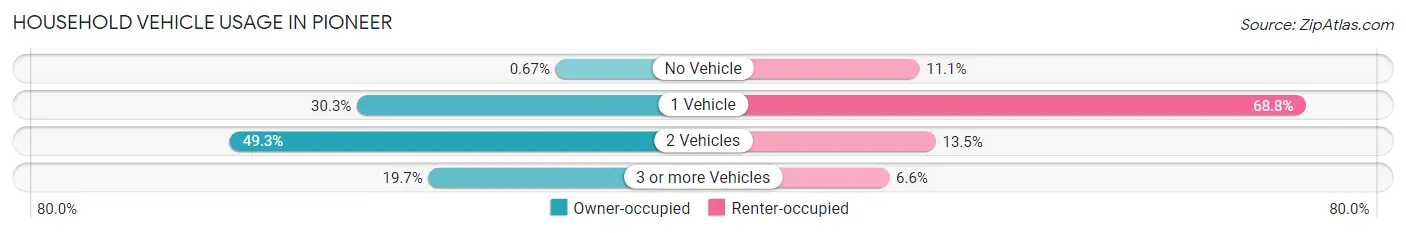
| Vehicles per Household | Owner-occupied | Renter-occupied |
| No Vehicle | 2 (0.7%) | 32 (11.1%) |
| 1 Vehicle | 91 (30.3%) | 198 (68.8%) |
| 2 Vehicles | 148 (49.3%) | 39 (13.5%) |
| 3 or more Vehicles | 59 (19.7%) | 19 (6.6%) |
| Total | 300 (100.0%) | 288 (100.0%) |
Real Estate & Mortgages in Pioneer
Real Estate and Mortgage Overview in Pioneer
| Characteristic | Without Mortgage | With Mortgage |
| Housing Units | 89 | 211 |
| Median Property Value | $88,300 | $131,900 |
| Median Household Income | $46,250 | $0 |
| Monthly Housing Costs | $375 | $0 |
| Real Estate Taxes | $1,228 | $0 |
Property Value by Mortgage Status in Pioneer
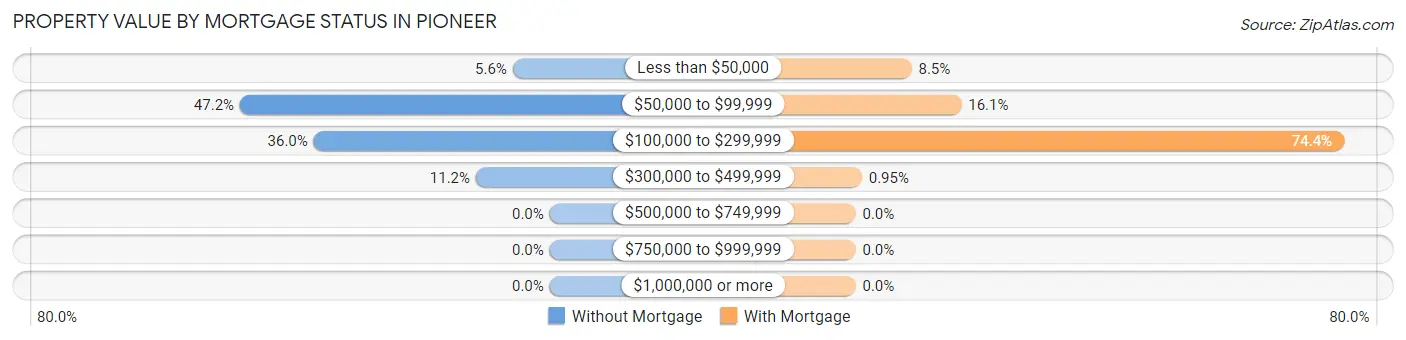
| Property Value | Without Mortgage | With Mortgage |
| Less than $50,000 | 5 (5.6%) | 18 (8.5%) |
| $50,000 to $99,999 | 42 (47.2%) | 34 (16.1%) |
| $100,000 to $299,999 | 32 (36.0%) | 157 (74.4%) |
| $300,000 to $499,999 | 10 (11.2%) | 2 (0.9%) |
| $500,000 to $749,999 | 0 (0.0%) | 0 (0.0%) |
| $750,000 to $999,999 | 0 (0.0%) | 0 (0.0%) |
| $1,000,000 or more | 0 (0.0%) | 0 (0.0%) |
| Total | 89 (100.0%) | 211 (100.0%) |
Household Income by Mortgage Status in Pioneer
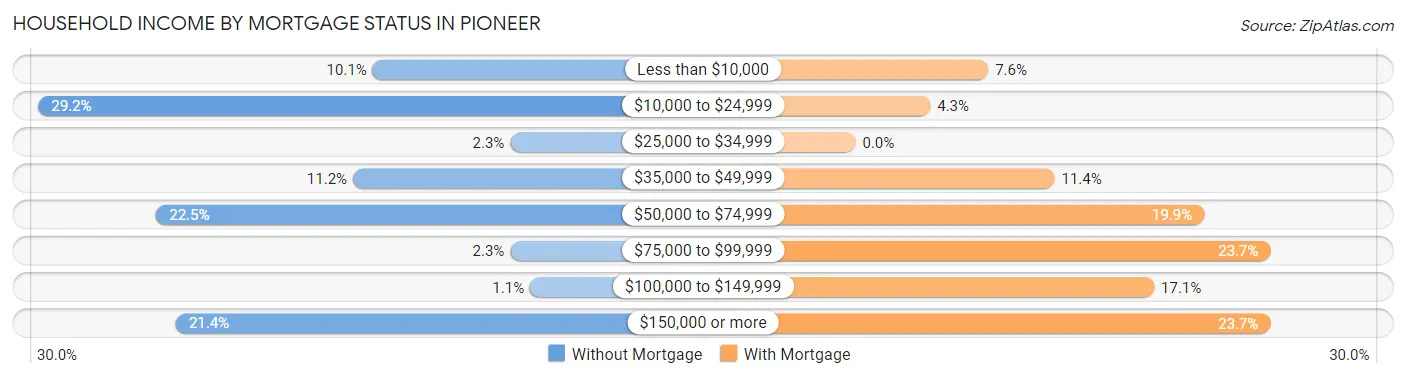
| Household Income | Without Mortgage | With Mortgage |
| Less than $10,000 | 9 (10.1%) | 16 (7.6%) |
| $10,000 to $24,999 | 26 (29.2%) | 9 (4.3%) |
| $25,000 to $34,999 | 2 (2.2%) | 0 (0.0%) |
| $35,000 to $49,999 | 10 (11.2%) | 24 (11.4%) |
| $50,000 to $74,999 | 20 (22.5%) | 42 (19.9%) |
| $75,000 to $99,999 | 2 (2.2%) | 50 (23.7%) |
| $100,000 to $149,999 | 1 (1.1%) | 36 (17.1%) |
| $150,000 or more | 19 (21.3%) | 50 (23.7%) |
| Total | 89 (100.0%) | 211 (100.0%) |
Property Value to Household Income Ratio in Pioneer
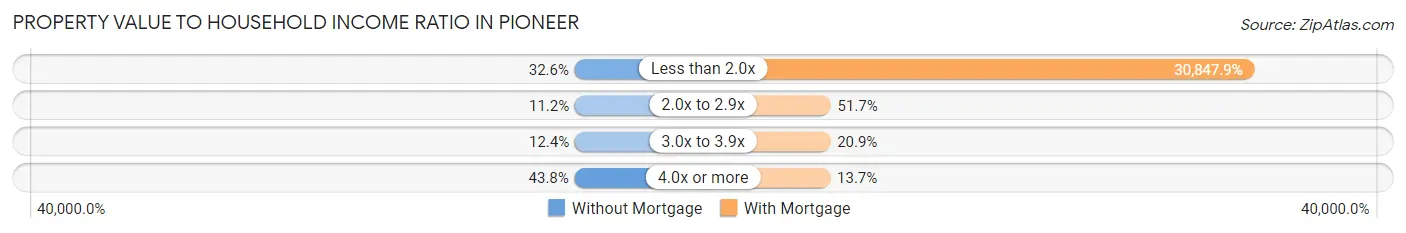
| Value-to-Income Ratio | Without Mortgage | With Mortgage |
| Less than 2.0x | 29 (32.6%) | 65,089 (30,847.9%) |
| 2.0x to 2.9x | 10 (11.2%) | 109 (51.7%) |
| 3.0x to 3.9x | 11 (12.4%) | 44 (20.8%) |
| 4.0x or more | 39 (43.8%) | 29 (13.7%) |
| Total | 89 (100.0%) | 211 (100.0%) |
Real Estate Taxes by Mortgage Status in Pioneer
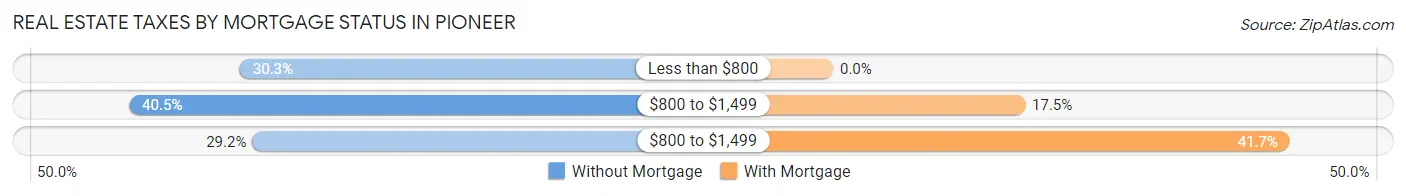
| Property Taxes | Without Mortgage | With Mortgage |
| Less than $800 | 27 (30.3%) | 0 (0.0%) |
| $800 to $1,499 | 36 (40.5%) | 37 (17.5%) |
| $800 to $1,499 | 26 (29.2%) | 88 (41.7%) |
| Total | 89 (100.0%) | 211 (100.0%) |
Health & Disability in Pioneer
Health Insurance Coverage by Age in Pioneer
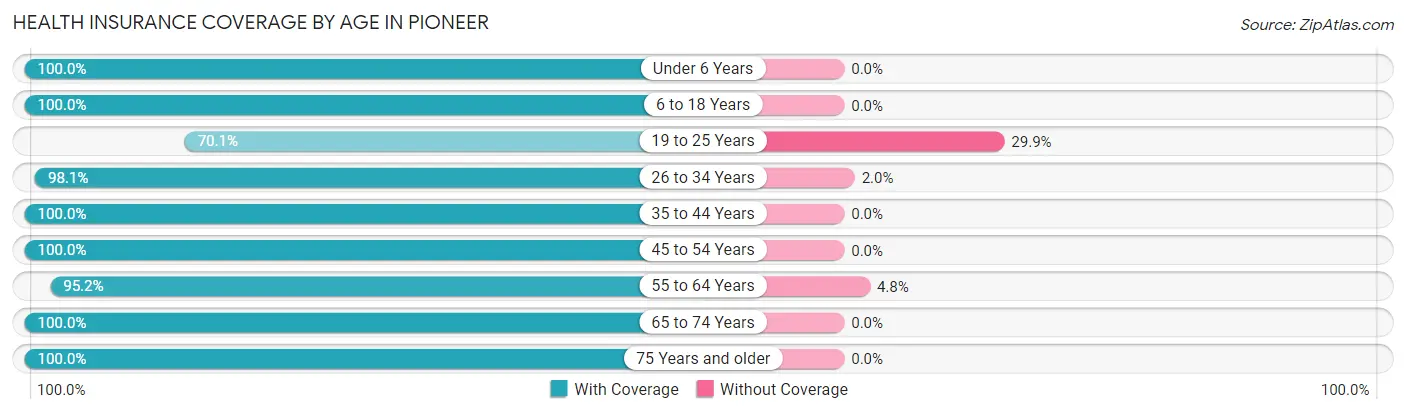
| Age Bracket | With Coverage | Without Coverage |
| Under 6 Years | 58 (100.0%) | 0 (0.0%) |
| 6 to 18 Years | 294 (100.0%) | 0 (0.0%) |
| 19 to 25 Years | 101 (70.1%) | 43 (29.9%) |
| 26 to 34 Years | 151 (98.1%) | 3 (1.9%) |
| 35 to 44 Years | 172 (100.0%) | 0 (0.0%) |
| 45 to 54 Years | 100 (100.0%) | 0 (0.0%) |
| 55 to 64 Years | 179 (95.2%) | 9 (4.8%) |
| 65 to 74 Years | 110 (100.0%) | 0 (0.0%) |
| 75 Years and older | 113 (100.0%) | 0 (0.0%) |
| Total | 1,278 (95.9%) | 55 (4.1%) |
Health Insurance Coverage by Citizenship Status in Pioneer
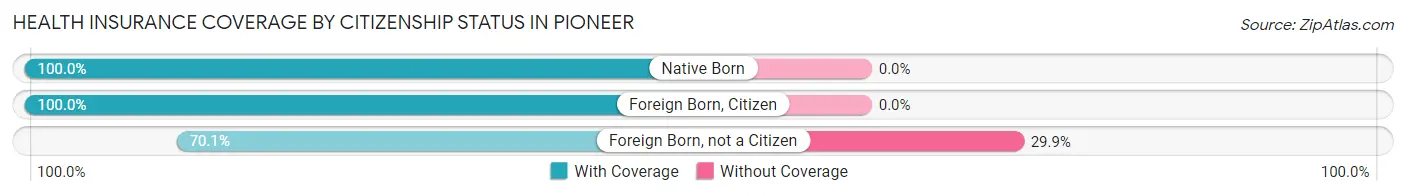
| Citizenship Status | With Coverage | Without Coverage |
| Native Born | 58 (100.0%) | 0 (0.0%) |
| Foreign Born, Citizen | 294 (100.0%) | 0 (0.0%) |
| Foreign Born, not a Citizen | 101 (70.1%) | 43 (29.9%) |
Health Insurance Coverage by Household Income in Pioneer
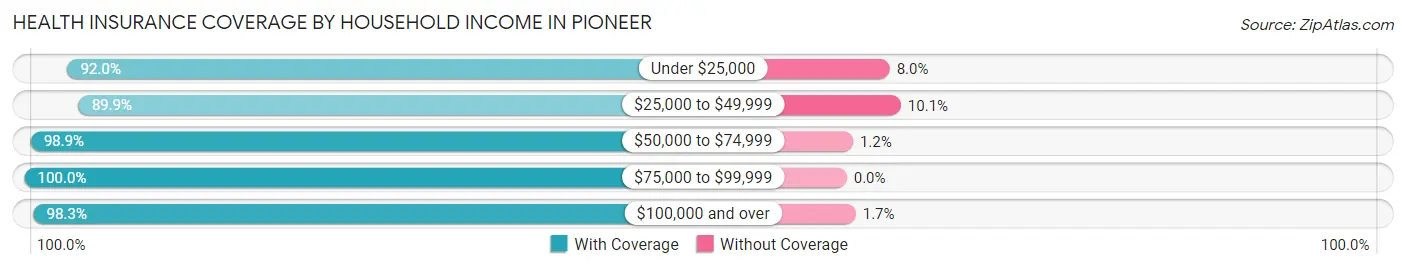
| Household Income | With Coverage | Without Coverage |
| Under $25,000 | 206 (92.0%) | 18 (8.0%) |
| $25,000 to $49,999 | 248 (89.9%) | 28 (10.1%) |
| $50,000 to $74,999 | 431 (98.9%) | 5 (1.1%) |
| $75,000 to $99,999 | 160 (100.0%) | 0 (0.0%) |
| $100,000 and over | 233 (98.3%) | 4 (1.7%) |
Public vs Private Health Insurance Coverage by Age in Pioneer
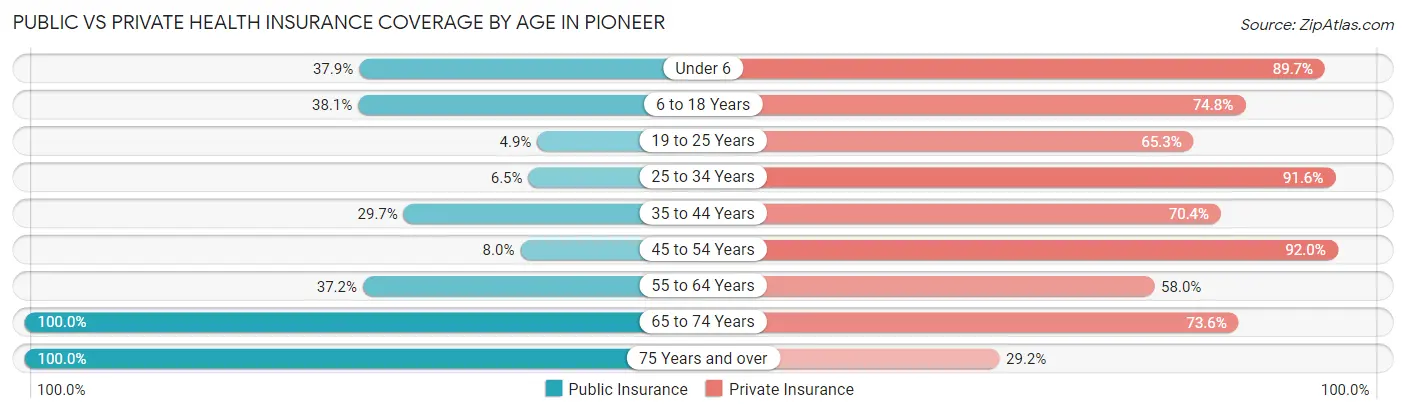
| Age Bracket | Public Insurance | Private Insurance |
| Under 6 | 22 (37.9%) | 52 (89.7%) |
| 6 to 18 Years | 112 (38.1%) | 220 (74.8%) |
| 19 to 25 Years | 7 (4.9%) | 94 (65.3%) |
| 25 to 34 Years | 10 (6.5%) | 141 (91.6%) |
| 35 to 44 Years | 51 (29.6%) | 121 (70.4%) |
| 45 to 54 Years | 8 (8.0%) | 92 (92.0%) |
| 55 to 64 Years | 70 (37.2%) | 109 (58.0%) |
| 65 to 74 Years | 110 (100.0%) | 81 (73.6%) |
| 75 Years and over | 113 (100.0%) | 33 (29.2%) |
| Total | 503 (37.7%) | 943 (70.7%) |
Disability Status by Sex by Age in Pioneer
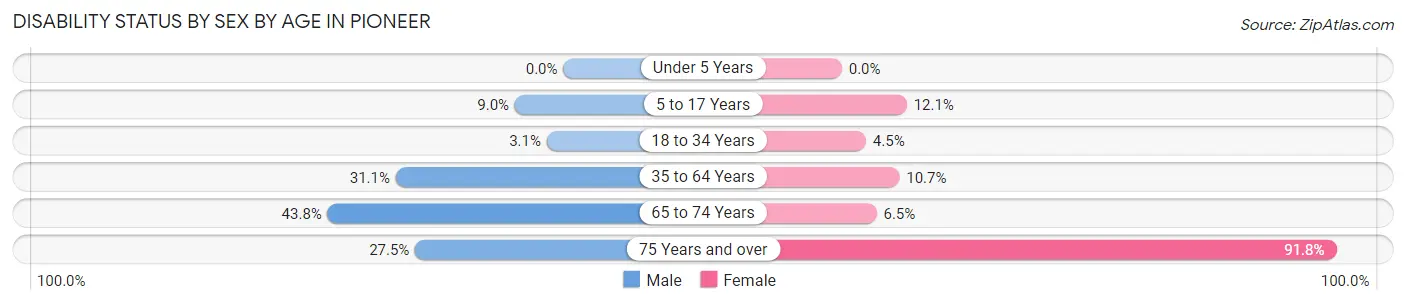
| Age Bracket | Male | Female |
| Under 5 Years | 0 (0.0%) | 0 (0.0%) |
| 5 to 17 Years | 8 (9.0%) | 20 (12.0%) |
| 18 to 34 Years | 5 (3.1%) | 8 (4.5%) |
| 35 to 64 Years | 79 (31.1%) | 22 (10.7%) |
| 65 to 74 Years | 21 (43.8%) | 4 (6.5%) |
| 75 Years and over | 11 (27.5%) | 67 (91.8%) |
Disability Class by Sex by Age in Pioneer
Disability Class: Hearing Difficulty
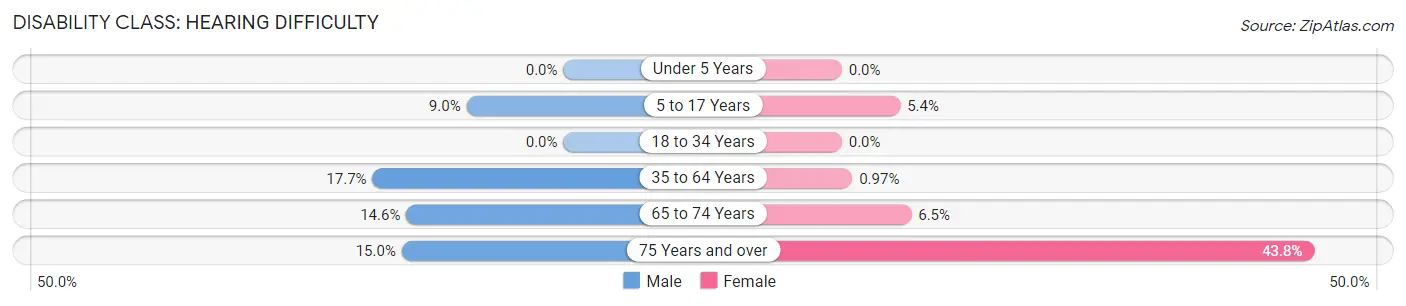
| Age Bracket | Male | Female |
| Under 5 Years | 0 (0.0%) | 0 (0.0%) |
| 5 to 17 Years | 8 (9.0%) | 9 (5.4%) |
| 18 to 34 Years | 0 (0.0%) | 0 (0.0%) |
| 35 to 64 Years | 45 (17.7%) | 2 (1.0%) |
| 65 to 74 Years | 7 (14.6%) | 4 (6.5%) |
| 75 Years and over | 6 (15.0%) | 32 (43.8%) |
Disability Class: Vision Difficulty
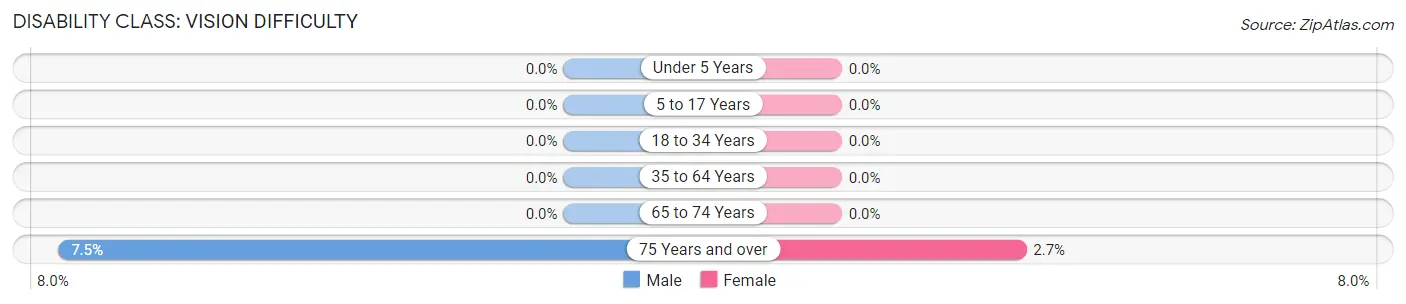
| Age Bracket | Male | Female |
| Under 5 Years | 0 (0.0%) | 0 (0.0%) |
| 5 to 17 Years | 0 (0.0%) | 0 (0.0%) |
| 18 to 34 Years | 0 (0.0%) | 0 (0.0%) |
| 35 to 64 Years | 0 (0.0%) | 0 (0.0%) |
| 65 to 74 Years | 0 (0.0%) | 0 (0.0%) |
| 75 Years and over | 3 (7.5%) | 2 (2.7%) |
Disability Class: Cognitive Difficulty
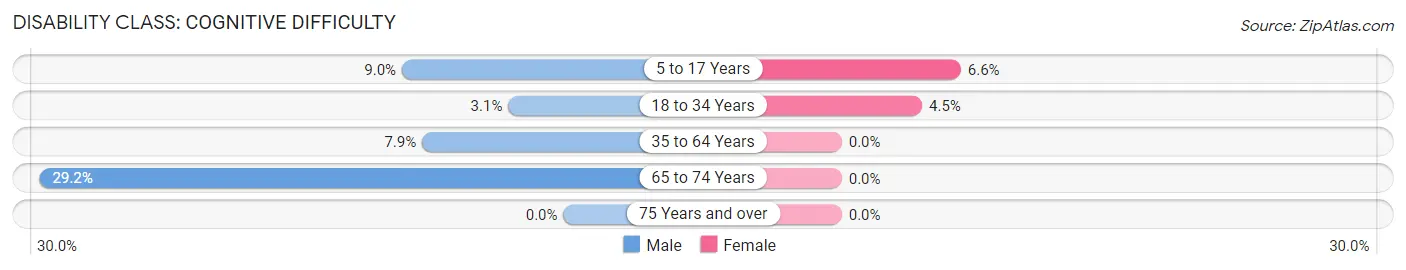
| Age Bracket | Male | Female |
| 5 to 17 Years | 8 (9.0%) | 11 (6.6%) |
| 18 to 34 Years | 5 (3.1%) | 8 (4.5%) |
| 35 to 64 Years | 20 (7.9%) | 0 (0.0%) |
| 65 to 74 Years | 14 (29.2%) | 0 (0.0%) |
| 75 Years and over | 0 (0.0%) | 0 (0.0%) |
Disability Class: Ambulatory Difficulty
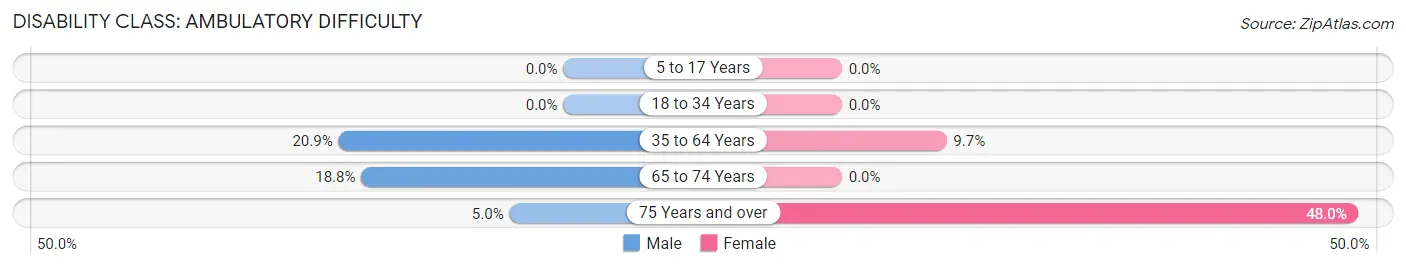
| Age Bracket | Male | Female |
| 5 to 17 Years | 0 (0.0%) | 0 (0.0%) |
| 18 to 34 Years | 0 (0.0%) | 0 (0.0%) |
| 35 to 64 Years | 53 (20.9%) | 20 (9.7%) |
| 65 to 74 Years | 9 (18.8%) | 0 (0.0%) |
| 75 Years and over | 2 (5.0%) | 35 (47.9%) |
Disability Class: Self-Care Difficulty
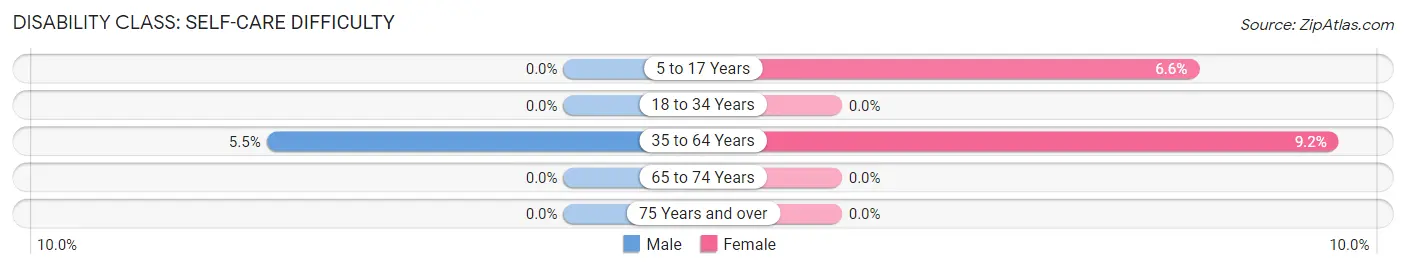
| Age Bracket | Male | Female |
| 5 to 17 Years | 0 (0.0%) | 11 (6.6%) |
| 18 to 34 Years | 0 (0.0%) | 0 (0.0%) |
| 35 to 64 Years | 14 (5.5%) | 19 (9.2%) |
| 65 to 74 Years | 0 (0.0%) | 0 (0.0%) |
| 75 Years and over | 0 (0.0%) | 0 (0.0%) |
Technology Access in Pioneer
Computing Device Access in Pioneer
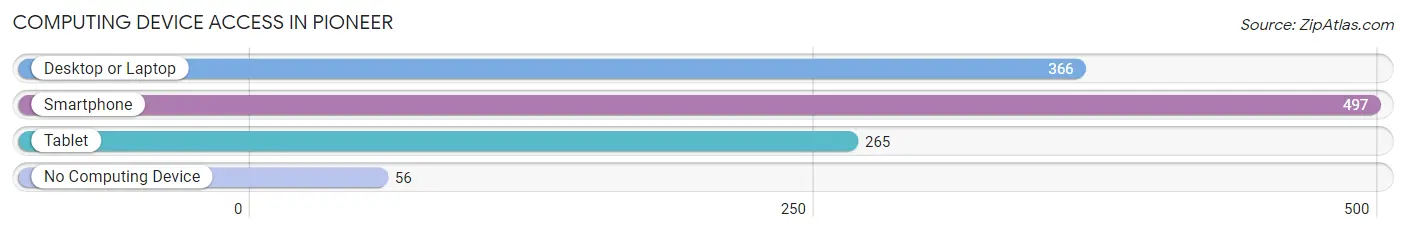
| Device Type | # Households | % Households |
| Desktop or Laptop | 366 | 62.2% |
| Smartphone | 497 | 84.5% |
| Tablet | 265 | 45.1% |
| No Computing Device | 56 | 9.5% |
| Total | 588 | 100.0% |
Internet Access in Pioneer
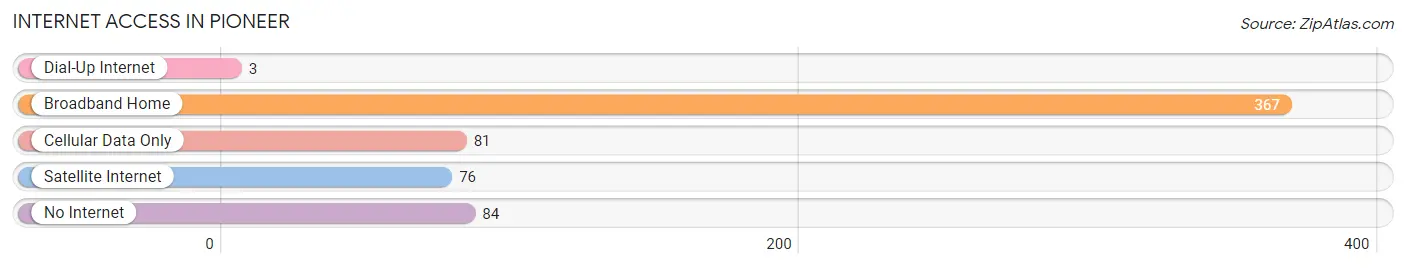
| Internet Type | # Households | % Households |
| Dial-Up Internet | 3 | 0.5% |
| Broadband Home | 367 | 62.4% |
| Cellular Data Only | 81 | 13.8% |
| Satellite Internet | 76 | 12.9% |
| No Internet | 84 | 14.3% |
| Total | 588 | 100.0% |
Pioneer Summary
Pioneer, Ohio is a small village located in Williams County, Ohio. It is situated in the northwest corner of the state, near the Michigan border. The village has a population of approximately 1,000 people and is part of the Bryan Micropolitan Statistical Area.
History
Pioneer was founded in 1837 by a group of settlers from New York. The village was named after the pioneers who settled the area. The first settlers were mostly farmers and the village was primarily an agricultural community. The first post office was established in 1845 and the village was incorporated in 1875.
In the late 19th century, Pioneer became a center for the lumber industry. The village was home to several sawmills and a planing mill. The lumber industry was a major source of employment for the village and helped to fuel its growth.
Geography
Pioneer is located in the northwest corner of Ohio, near the Michigan border. The village is situated in the Maumee River Valley, which is part of the Great Black Swamp region. The terrain is mostly flat and the soil is mostly clay. The village is surrounded by farmland and woodlands.
The climate in Pioneer is humid continental, with hot summers and cold winters. The average annual temperature is around 50 degrees Fahrenheit. The average annual precipitation is around 40 inches.
Economy
The economy of Pioneer is primarily based on agriculture and manufacturing. The village is home to several farms, which produce corn, soybeans, wheat, and other crops. The village is also home to several manufacturing companies, which produce a variety of products, including furniture, automotive parts, and plastics.
The village is also home to several small businesses, including restaurants, retail stores, and service providers. The village is served by several state and county roads, as well as the Pioneer-Bryan Airport.
Demographics
As of the 2010 census, the population of Pioneer was 1,000 people. The racial makeup of the village was 97.2% White, 0.7% African American, 0.3% Native American, 0.2% Asian, and 1.6% from other races. The median household income was $41,250 and the median family income was $50,000.
The village is served by the Pioneer Local School District, which consists of one elementary school, one middle school, and one high school. The village is also home to several churches, including the Pioneer United Methodist Church, the Pioneer Baptist Church, and the Pioneer Church of the Nazarene.
Conclusion
Pioneer, Ohio is a small village located in Williams County, Ohio. It is situated in the northwest corner of the state, near the Michigan border. The village has a population of approximately 1,000 people and is part of the Bryan Micropolitan Statistical Area. The economy of Pioneer is primarily based on agriculture and manufacturing, and the village is served by several state and county roads, as well as the Pioneer-Bryan Airport. The village is served by the Pioneer Local School District, which consists of one elementary school, one middle school, and one high school. The village is also home to several churches, including the Pioneer United Methodist Church, the Pioneer Baptist Church, and the Pioneer Church of the Nazarene.
Common Questions
What is Per Capita Income in Pioneer?
Per Capita income in Pioneer is $23,963.
What is the Median Family Income in Pioneer?
Median Family Income in Pioneer is $65,625.
What is the Median Household income in Pioneer?
Median Household Income in Pioneer is $46,528.
What is Income or Wage Gap in Pioneer?
Income or Wage Gap in Pioneer is 23.3%.
Women in Pioneer earn 76.7 cents for every dollar earned by a man.
What is Inequality or Gini Index in Pioneer?
Inequality or Gini Index in Pioneer is 0.39.
What is the Total Population of Pioneer?
Total Population of Pioneer is 1,333.
What is the Total Male Population of Pioneer?
Total Male Population of Pioneer is 635.
What is the Total Female Population of Pioneer?
Total Female Population of Pioneer is 698.
What is the Ratio of Males per 100 Females in Pioneer?
There are 90.97 Males per 100 Females in Pioneer.
What is the Ratio of Females per 100 Males in Pioneer?
There are 109.92 Females per 100 Males in Pioneer.
What is the Median Population Age in Pioneer?
Median Population Age in Pioneer is 36.8 Years.
What is the Average Family Size in Pioneer
Average Family Size in Pioneer is 3.1 People.
What is the Average Household Size in Pioneer
Average Household Size in Pioneer is 2.3 People.
How Large is the Labor Force in Pioneer?
There are 695 People in the Labor Forcein in Pioneer.
What is the Percentage of People in the Labor Force in Pioneer?
65.5% of People are in the Labor Force in Pioneer.
What is the Unemployment Rate in Pioneer?
Unemployment Rate in Pioneer is 4.6%.