Bastrop, LA Map & Demographics
Bastrop Map

Bastrop Overview
$16,783
PER CAPITA INCOME
$38,527
AVG FAMILY INCOME
$29,286
AVG HOUSEHOLD INCOME
26.8%
WAGE / INCOME GAP [ % ]
73.2¢/ $1
WAGE / INCOME GAP [ $ ]
$9,108
FAMILY INCOME DEFICIT
0.48
INEQUALITY / GINI INDEX
9,623
TOTAL POPULATION
4,884
MALE POPULATION
4,739
FEMALE POPULATION
103.06
MALES / 100 FEMALES
97.03
FEMALES / 100 MALES
33.8
MEDIAN AGE
3.7
AVG FAMILY SIZE
2.6
AVG HOUSEHOLD SIZE
3,870
LABOR FORCE [ PEOPLE ]
52.2%
PERCENT IN LABOR FORCE
11.5%
UNEMPLOYMENT RATE
Bastrop Zip Codes
Bastrop Area Codes
Income in Bastrop
Income Overview in Bastrop
Per Capita Income in Bastrop is $16,783, while median incomes of families and households are $38,527 and $29,286 respectively.
| Characteristic | Number | Measure |
| Per Capita Income | 9,623 | $16,783 |
| Median Family Income | 2,063 | $38,527 |
| Mean Family Income | 2,063 | $55,933 |
| Median Household Income | 3,548 | $29,286 |
| Mean Household Income | 3,548 | $42,900 |
| Income Deficit | 2,063 | $9,108 |
| Wage / Income Gap (%) | 9,623 | 26.84% |
| Wage / Income Gap ($) | 9,623 | 73.16¢ per $1 |
| Gini / Inequality Index | 9,623 | 0.48 |
Earnings by Sex in Bastrop
Average Earnings in Bastrop are $24,807, $28,132 for men and $20,581 for women, a difference of 26.8%.
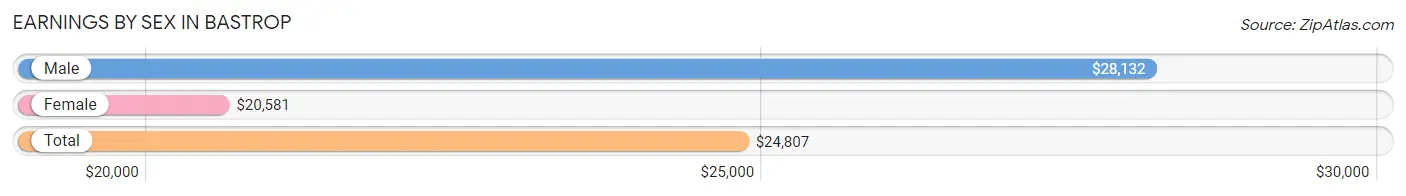
| Sex | Number | Average Earnings |
| Male | 1,977 (49.7%) | $28,132 |
| Female | 2,002 (50.3%) | $20,581 |
| Total | 3,979 (100.0%) | $24,807 |
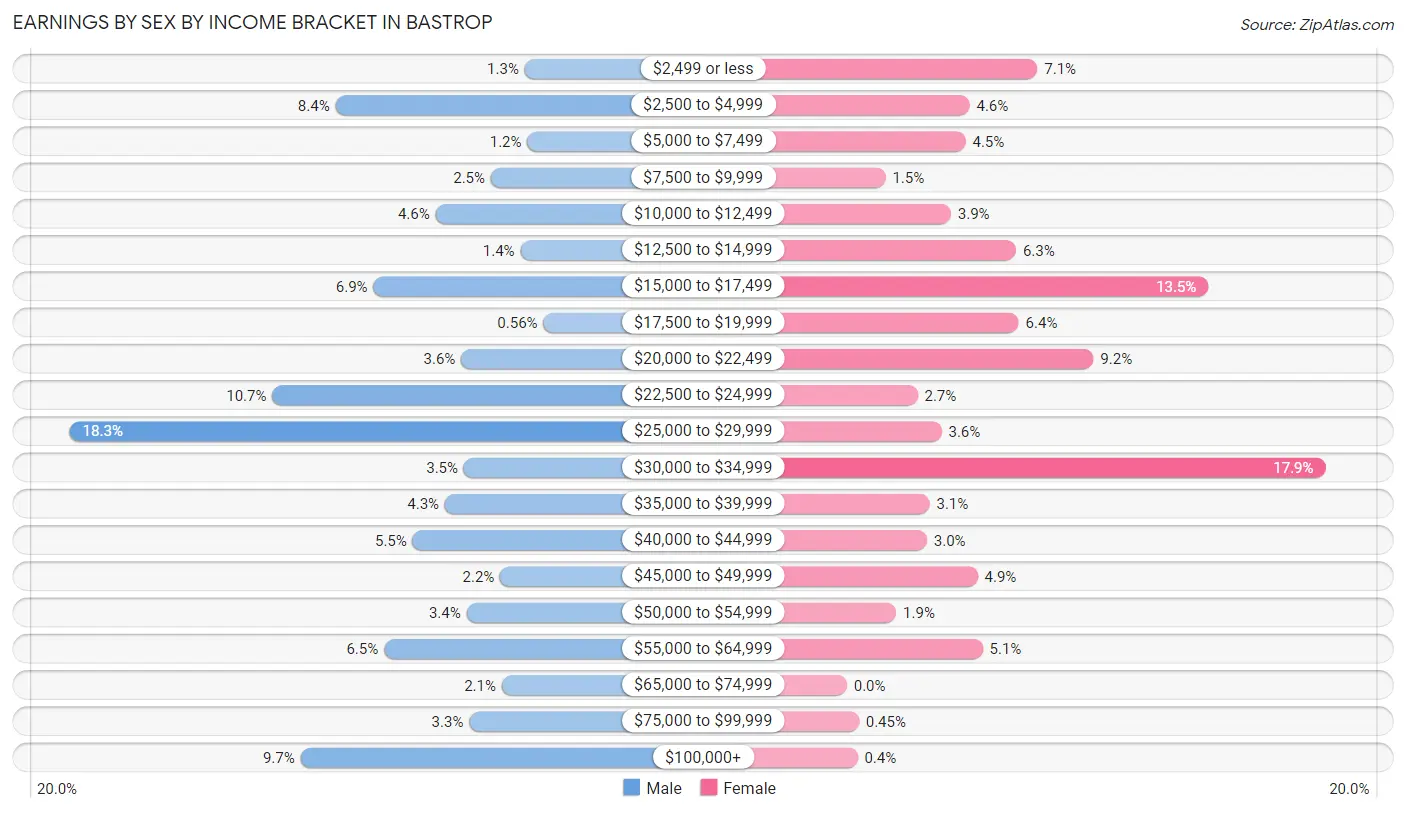
Earnings by Sex by Income Bracket in Bastrop
The most common earnings brackets in Bastrop are $25,000 to $29,999 for men (362 | 18.3%) and $30,000 to $34,999 for women (359 | 17.9%).
| Income | Male | Female |
| $2,499 or less | 25 (1.3%) | 143 (7.1%) |
| $2,500 to $4,999 | 165 (8.4%) | 92 (4.6%) |
| $5,000 to $7,499 | 23 (1.2%) | 89 (4.4%) |
| $7,500 to $9,999 | 50 (2.5%) | 29 (1.5%) |
| $10,000 to $12,499 | 91 (4.6%) | 78 (3.9%) |
| $12,500 to $14,999 | 28 (1.4%) | 127 (6.3%) |
| $15,000 to $17,499 | 137 (6.9%) | 271 (13.5%) |
| $17,500 to $19,999 | 11 (0.6%) | 129 (6.4%) |
| $20,000 to $22,499 | 72 (3.6%) | 185 (9.2%) |
| $22,500 to $24,999 | 212 (10.7%) | 53 (2.6%) |
| $25,000 to $29,999 | 362 (18.3%) | 71 (3.5%) |
| $30,000 to $34,999 | 70 (3.5%) | 359 (17.9%) |
| $35,000 to $39,999 | 84 (4.3%) | 62 (3.1%) |
| $40,000 to $44,999 | 108 (5.5%) | 60 (3.0%) |
| $45,000 to $49,999 | 43 (2.2%) | 98 (4.9%) |
| $50,000 to $54,999 | 68 (3.4%) | 37 (1.8%) |
| $55,000 to $64,999 | 129 (6.5%) | 102 (5.1%) |
| $65,000 to $74,999 | 42 (2.1%) | 0 (0.0%) |
| $75,000 to $99,999 | 66 (3.3%) | 9 (0.4%) |
| $100,000+ | 191 (9.7%) | 8 (0.4%) |
| Total | 1,977 (100.0%) | 2,002 (100.0%) |
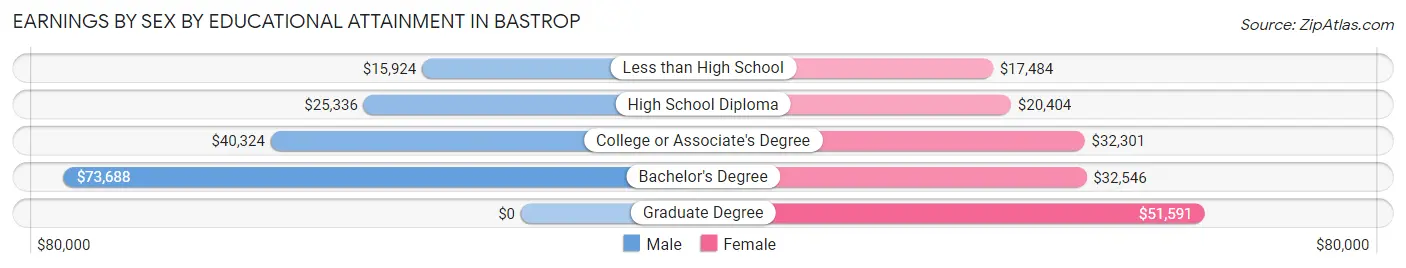
Earnings by Sex by Educational Attainment in Bastrop
Average earnings in Bastrop are $29,446 for men and $22,264 for women, a difference of 24.4%. Men with an educational attainment of bachelor's degree enjoy the highest average annual earnings of $73,688, while those with less than high school education earn the least with $15,924. Women with an educational attainment of graduate degree earn the most with the average annual earnings of $51,591, while those with less than high school education have the smallest earnings of $17,484.
| Educational Attainment | Male Income | Female Income |
| Less than High School | $15,924 | $17,484 |
| High School Diploma | $25,336 | $20,404 |
| College or Associate's Degree | $40,324 | $32,301 |
| Bachelor's Degree | $73,688 | $32,546 |
| Graduate Degree | - | - |
| Total | $29,446 | $22,264 |
Family Income in Bastrop
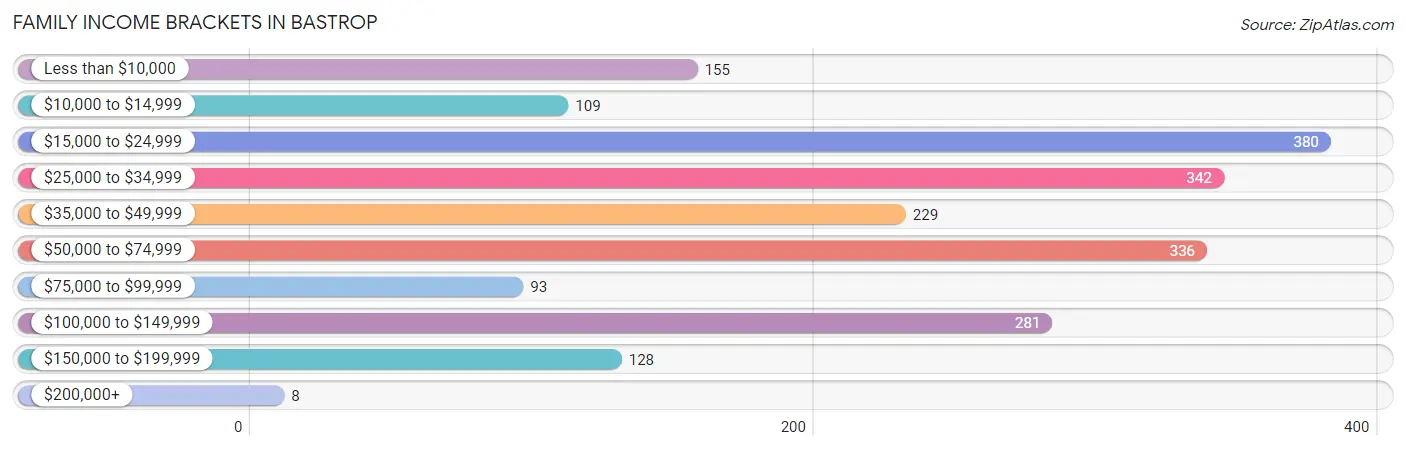
Family Income Brackets in Bastrop
According to the Bastrop family income data, there are 380 families falling into the $15,000 to $24,999 income range, which is the most common income bracket and makes up 18.4% of all families. Conversely, the $200,000+ income bracket is the least frequent group with only 8 families (0.4%) belonging to this category.
| Income Bracket | # Families | % Families |
| Less than $10,000 | 155 | 7.5% |
| $10,000 to $14,999 | 109 | 5.3% |
| $15,000 to $24,999 | 380 | 18.4% |
| $25,000 to $34,999 | 342 | 16.6% |
| $35,000 to $49,999 | 229 | 11.1% |
| $50,000 to $74,999 | 336 | 16.3% |
| $75,000 to $99,999 | 93 | 4.5% |
| $100,000 to $149,999 | 281 | 13.6% |
| $150,000 to $199,999 | 128 | 6.2% |
| $200,000+ | 8 | 0.4% |
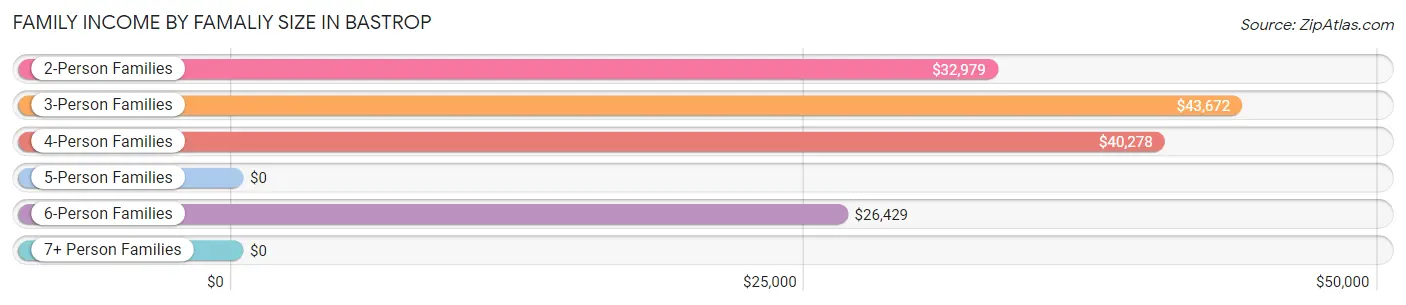
Family Income by Famaliy Size in Bastrop
3-person families (596 | 28.9%) account for the highest median family income in Bastrop with $43,672 per family, while 2-person families (926 | 44.9%) have the highest median income of $16,490 per family member.
| Income Bracket | # Families | Median Income |
| 2-Person Families | 926 (44.9%) | $32,979 |
| 3-Person Families | 596 (28.9%) | $43,672 |
| 4-Person Families | 222 (10.8%) | $40,278 |
| 5-Person Families | 251 (12.2%) | $0 |
| 6-Person Families | 54 (2.6%) | $26,429 |
| 7+ Person Families | 14 (0.7%) | $0 |
| Total | 2,063 (100.0%) | $38,527 |
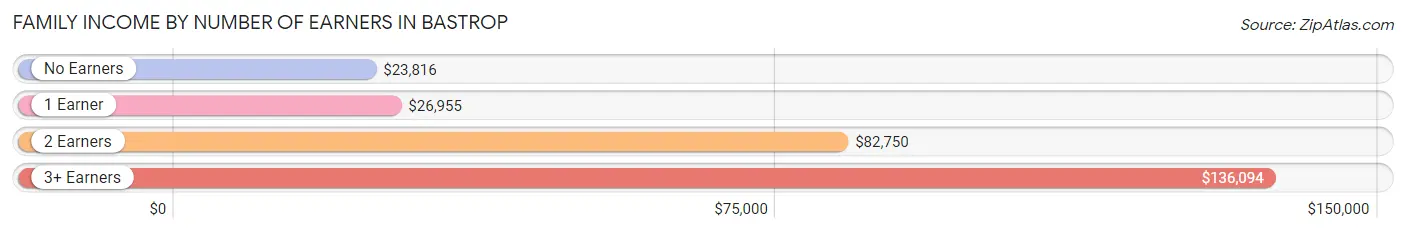
Family Income by Number of Earners in Bastrop
The median family income in Bastrop is $38,527, with families comprising 3+ earners (231) having the highest median family income of $136,094, while families with no earners (380) have the lowest median family income of $23,816, accounting for 11.2% and 18.4% of families, respectively.
| Number of Earners | # Families | Median Income |
| No Earners | 380 (18.4%) | $23,816 |
| 1 Earner | 944 (45.8%) | $26,955 |
| 2 Earners | 508 (24.6%) | $82,750 |
| 3+ Earners | 231 (11.2%) | $136,094 |
| Total | 2,063 (100.0%) | $38,527 |
Household Income in Bastrop
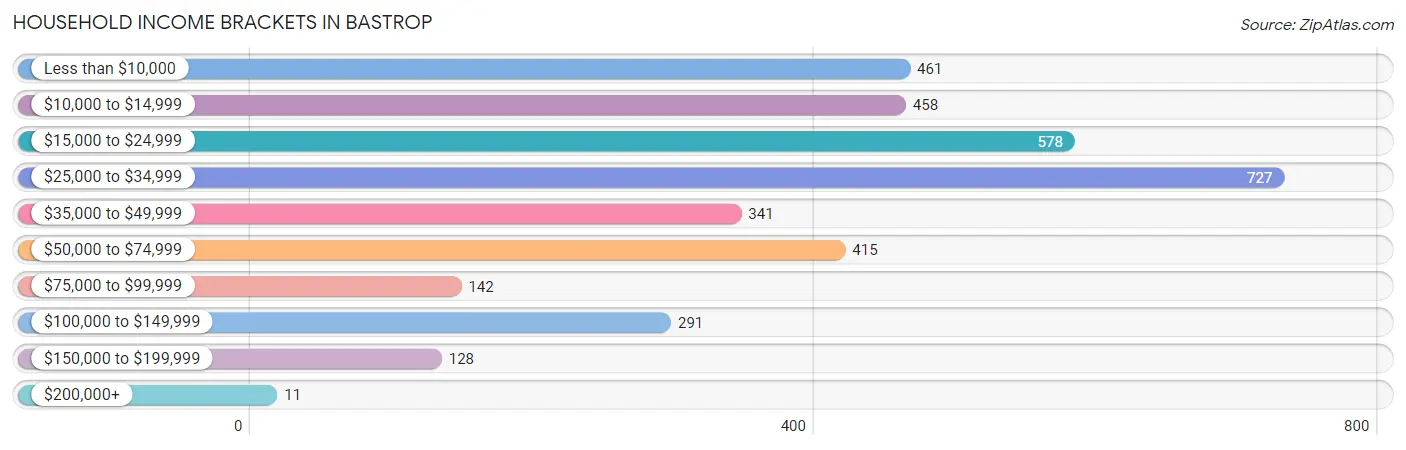
Household Income Brackets in Bastrop
With 727 households falling in the category, the $25,000 to $34,999 income range is the most frequent in Bastrop, accounting for 20.5% of all households. In contrast, only 11 households (0.3%) fall into the $200,000+ income bracket, making it the least populous group.
| Income Bracket | # Households | % Households |
| Less than $10,000 | 461 | 13.0% |
| $10,000 to $14,999 | 458 | 12.9% |
| $15,000 to $24,999 | 578 | 16.3% |
| $25,000 to $34,999 | 727 | 20.5% |
| $35,000 to $49,999 | 341 | 9.6% |
| $50,000 to $74,999 | 415 | 11.7% |
| $75,000 to $99,999 | 142 | 4.0% |
| $100,000 to $149,999 | 291 | 8.2% |
| $150,000 to $199,999 | 128 | 3.6% |
| $200,000+ | 11 | 0.3% |
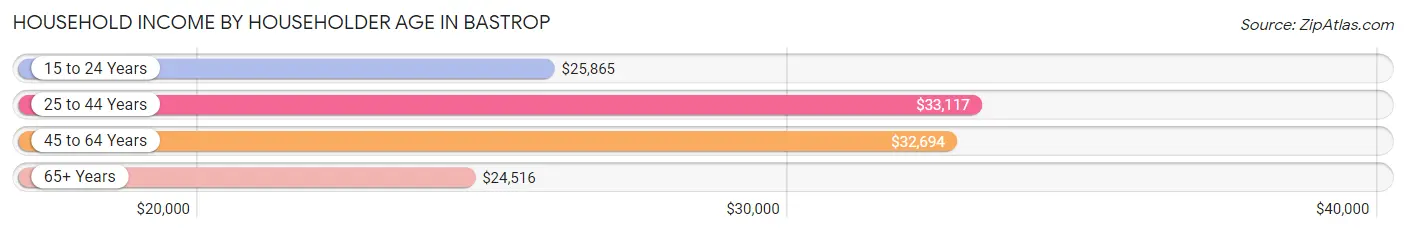
Household Income by Householder Age in Bastrop
The median household income in Bastrop is $29,286, with the highest median household income of $33,117 found in the 25 to 44 years age bracket for the primary householder. A total of 1,157 households (32.6%) fall into this category. Meanwhile, the 65+ years age bracket for the primary householder has the lowest median household income of $24,516, with 868 households (24.5%) in this group.
| Income Bracket | # Households | Median Income |
| 15 to 24 Years | 60 (1.7%) | $25,865 |
| 25 to 44 Years | 1,157 (32.6%) | $33,117 |
| 45 to 64 Years | 1,463 (41.2%) | $32,694 |
| 65+ Years | 868 (24.5%) | $24,516 |
| Total | 3,548 (100.0%) | $29,286 |
Poverty in Bastrop
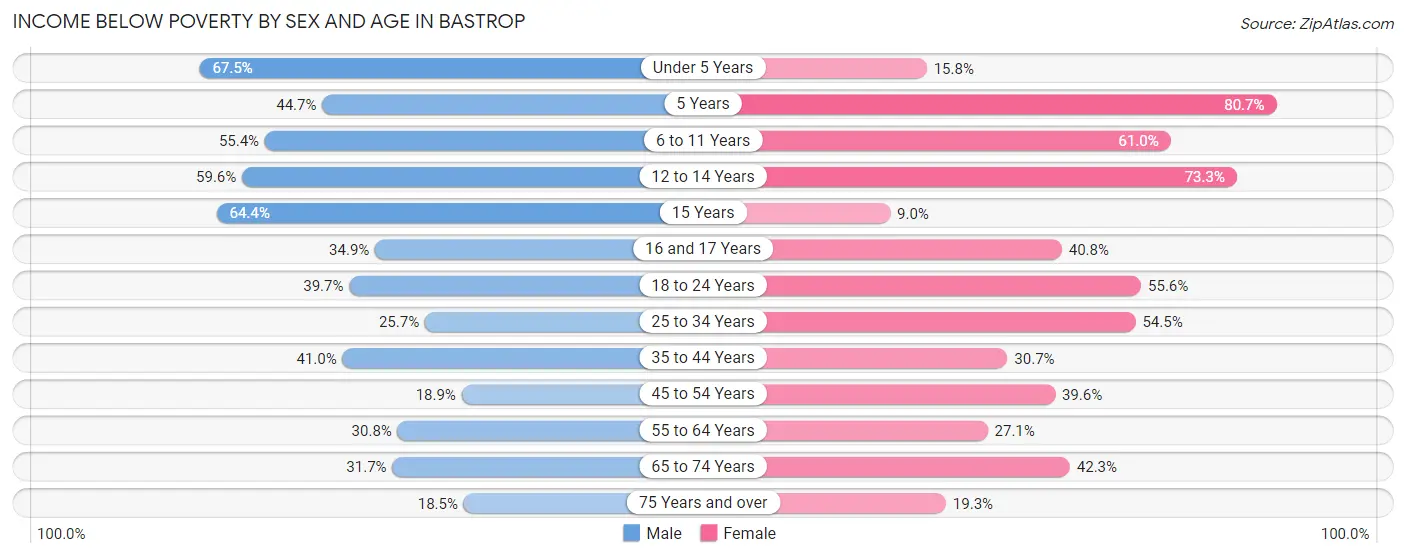
Income Below Poverty by Sex and Age in Bastrop
With 38.3% poverty level for males and 41.1% for females among the residents of Bastrop, under 5 year old males and 5 year old females are the most vulnerable to poverty, with 285 males (67.5%) and 50 females (80.6%) in their respective age groups living below the poverty level.
| Age Bracket | Male | Female |
| Under 5 Years | 285 (67.5%) | 44 (15.8%) |
| 5 Years | 34 (44.7%) | 50 (80.6%) |
| 6 to 11 Years | 303 (55.4%) | 202 (61.0%) |
| 12 to 14 Years | 65 (59.6%) | 140 (73.3%) |
| 15 Years | 65 (64.4%) | 7 (9.0%) |
| 16 and 17 Years | 51 (34.9%) | 89 (40.8%) |
| 18 to 24 Years | 240 (39.7%) | 275 (55.6%) |
| 25 to 34 Years | 180 (25.7%) | 260 (54.5%) |
| 35 to 44 Years | 216 (41.0%) | 178 (30.7%) |
| 45 to 54 Years | 107 (18.9%) | 258 (39.6%) |
| 55 to 64 Years | 115 (30.7%) | 154 (27.1%) |
| 65 to 74 Years | 125 (31.7%) | 207 (42.3%) |
| 75 Years and over | 34 (18.5%) | 40 (19.3%) |
| Total | 1,820 (38.3%) | 1,904 (41.1%) |
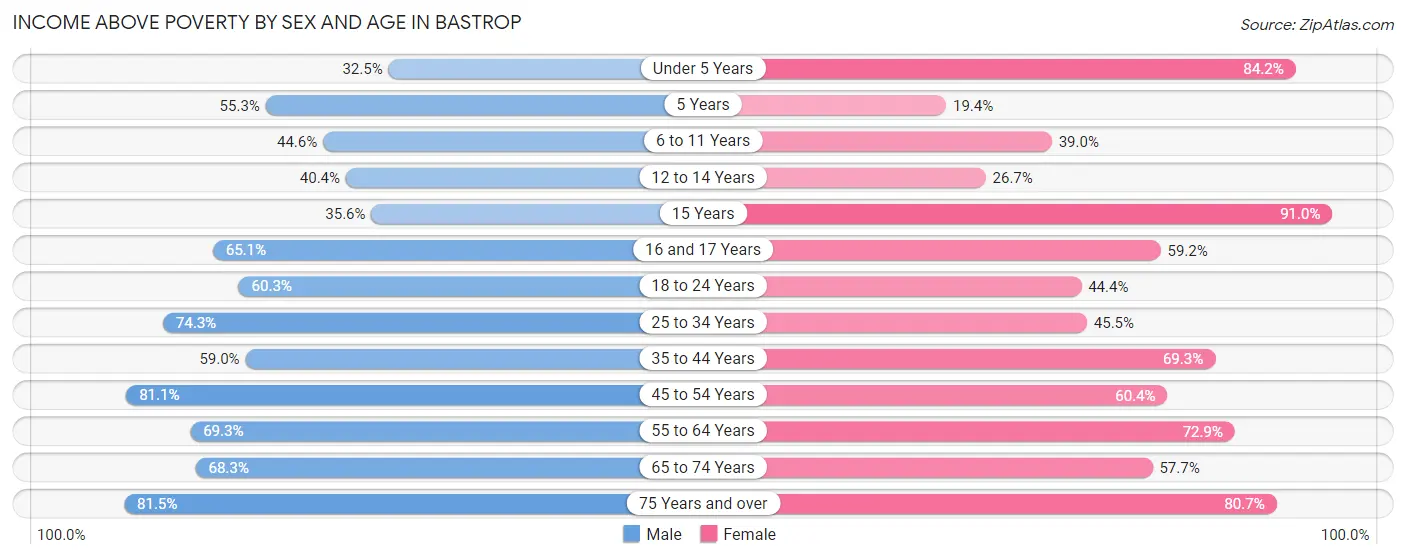
Income Above Poverty by Sex and Age in Bastrop
According to the poverty statistics in Bastrop, males aged 75 years and over and females aged 15 years are the age groups that are most secure financially, with 81.5% of males and 91.0% of females in these age groups living above the poverty line.
| Age Bracket | Male | Female |
| Under 5 Years | 137 (32.5%) | 235 (84.2%) |
| 5 Years | 42 (55.3%) | 12 (19.4%) |
| 6 to 11 Years | 244 (44.6%) | 129 (39.0%) |
| 12 to 14 Years | 44 (40.4%) | 51 (26.7%) |
| 15 Years | 36 (35.6%) | 71 (91.0%) |
| 16 and 17 Years | 95 (65.1%) | 129 (59.2%) |
| 18 to 24 Years | 364 (60.3%) | 220 (44.4%) |
| 25 to 34 Years | 521 (74.3%) | 217 (45.5%) |
| 35 to 44 Years | 311 (59.0%) | 401 (69.3%) |
| 45 to 54 Years | 460 (81.1%) | 394 (60.4%) |
| 55 to 64 Years | 259 (69.3%) | 415 (72.9%) |
| 65 to 74 Years | 269 (68.3%) | 282 (57.7%) |
| 75 Years and over | 150 (81.5%) | 167 (80.7%) |
| Total | 2,932 (61.7%) | 2,723 (58.9%) |
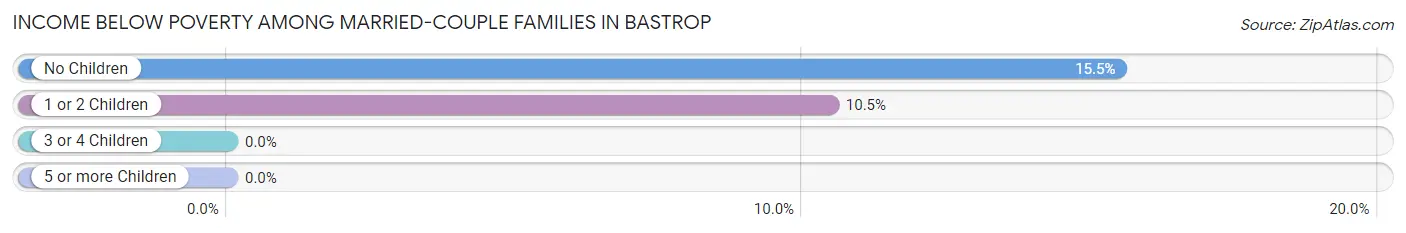
Income Below Poverty Among Married-Couple Families in Bastrop
The poverty statistics for married-couple families in Bastrop show that 13.8% or 134 of the total 973 families live below the poverty line. Families with no children have the highest poverty rate of 15.5%, comprising of 102 families. On the other hand, families with 3 or 4 children have the lowest poverty rate of 0.0%, which includes 0 families.
| Children | Above Poverty | Below Poverty |
| No Children | 557 (84.5%) | 102 (15.5%) |
| 1 or 2 Children | 274 (89.5%) | 32 (10.5%) |
| 3 or 4 Children | 8 (100.0%) | 0 (0.0%) |
| 5 or more Children | 0 (0.0%) | 0 (0.0%) |
| Total | 839 (86.2%) | 134 (13.8%) |
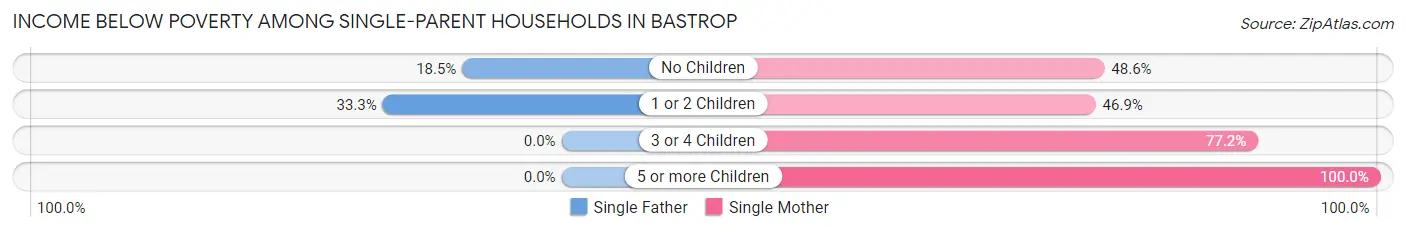
Income Below Poverty Among Single-Parent Households in Bastrop
According to the poverty data in Bastrop, 23.8% or 53 single-father households and 54.1% or 469 single-mother households are living below the poverty line. Among single-father households, those with 1 or 2 children have the highest poverty rate, with 31 households (33.3%) experiencing poverty. Likewise, among single-mother households, those with 5 or more children have the highest poverty rate, with 14 households (100.0%) falling below the poverty line.
| Children | Single Father | Single Mother |
| No Children | 22 (18.5%) | 85 (48.6%) |
| 1 or 2 Children | 31 (33.3%) | 238 (46.9%) |
| 3 or 4 Children | 0 (0.0%) | 132 (77.2%) |
| 5 or more Children | 0 (0.0%) | 14 (100.0%) |
| Total | 53 (23.8%) | 469 (54.1%) |
Income Below Poverty Among Married-Couple vs Single-Parent Households in Bastrop
The poverty data for Bastrop shows that 134 of the married-couple family households (13.8%) and 522 of the single-parent households (47.9%) are living below the poverty level. Within the married-couple family households, those with no children have the highest poverty rate, with 102 households (15.5%) falling below the poverty line. Among the single-parent households, those with 5 or more children have the highest poverty rate, with 14 household (100.0%) living below poverty.
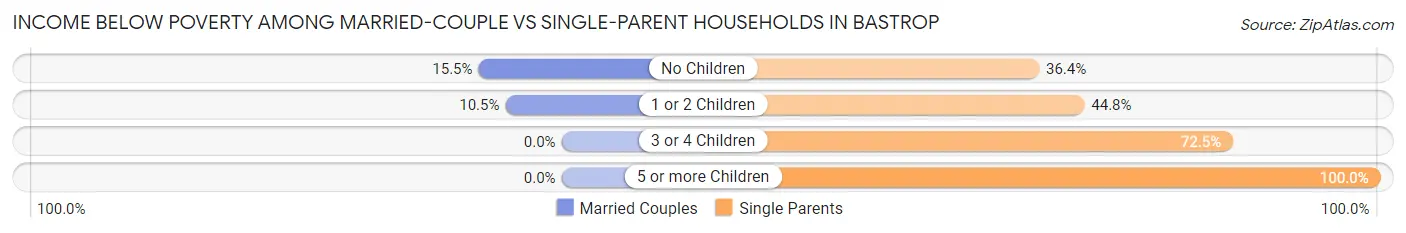
| Children | Married-Couple Families | Single-Parent Households |
| No Children | 102 (15.5%) | 107 (36.4%) |
| 1 or 2 Children | 32 (10.5%) | 269 (44.8%) |
| 3 or 4 Children | 0 (0.0%) | 132 (72.5%) |
| 5 or more Children | 0 (0.0%) | 14 (100.0%) |
| Total | 134 (13.8%) | 522 (47.9%) |
Race in Bastrop
The most populous races in Bastrop are Black / African American (7,470 | 77.6%), White / Caucasian (1,837 | 19.1%), and Two or more Races (215 | 2.2%).
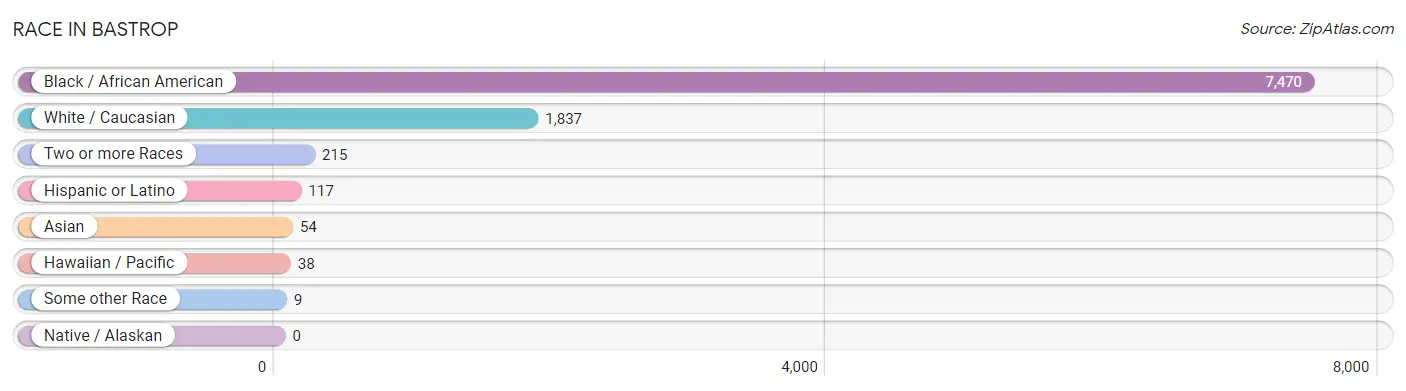
| Race | # Population | % Population |
| Asian | 54 | 0.6% |
| Black / African American | 7,470 | 77.6% |
| Hawaiian / Pacific | 38 | 0.4% |
| Hispanic or Latino | 117 | 1.2% |
| Native / Alaskan | 0 | 0.0% |
| White / Caucasian | 1,837 | 19.1% |
| Two or more Races | 215 | 2.2% |
| Some other Race | 9 | 0.1% |
| Total | 9,623 | 100.0% |
Ancestry in Bastrop
The most populous ancestries reported in Bastrop are American (374 | 3.9%), Italian (296 | 3.1%), English (275 | 2.9%), Irish (204 | 2.1%), and German (147 | 1.5%), together accounting for 13.5% of all Bastrop residents.
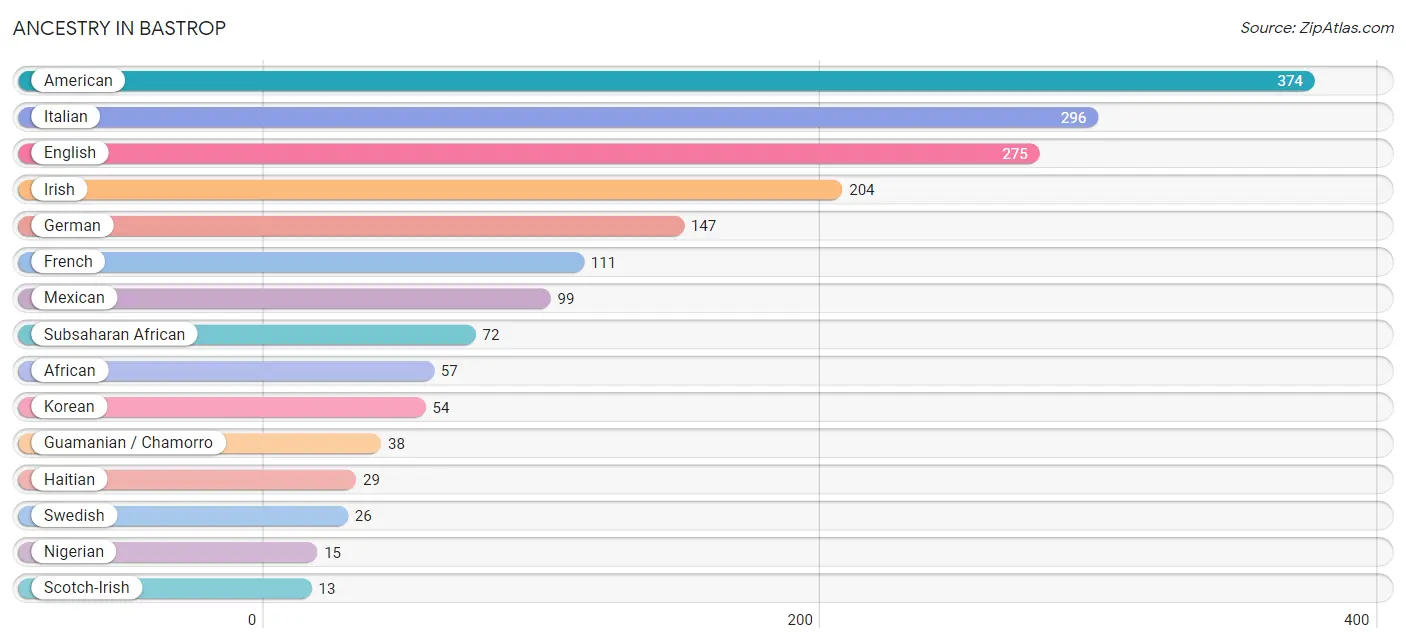
| Ancestry | # Population | % Population |
| African | 57 | 0.6% |
| American | 374 | 3.9% |
| Arab | 8 | 0.1% |
| English | 275 | 2.9% |
| Finnish | 3 | 0.0% |
| French | 111 | 1.1% |
| French Canadian | 6 | 0.1% |
| German | 147 | 1.5% |
| Guamanian / Chamorro | 38 | 0.4% |
| Haitian | 29 | 0.3% |
| Irish | 204 | 2.1% |
| Italian | 296 | 3.1% |
| Jordanian | 8 | 0.1% |
| Korean | 54 | 0.6% |
| Mexican | 99 | 1.0% |
| Moroccan | 8 | 0.1% |
| Nigerian | 15 | 0.2% |
| Scotch-Irish | 13 | 0.1% |
| Subsaharan African | 72 | 0.7% |
| Swedish | 26 | 0.3% | View All 20 Rows |
Immigrants in Bastrop
The most numerous immigrant groups reported in Bastrop came from Asia (54 | 0.6%), Philippines (54 | 0.6%), South Eastern Asia (54 | 0.6%), Europe (39 | 0.4%), and Germany (38 | 0.4%), together accounting for 2.5% of all Bastrop residents.
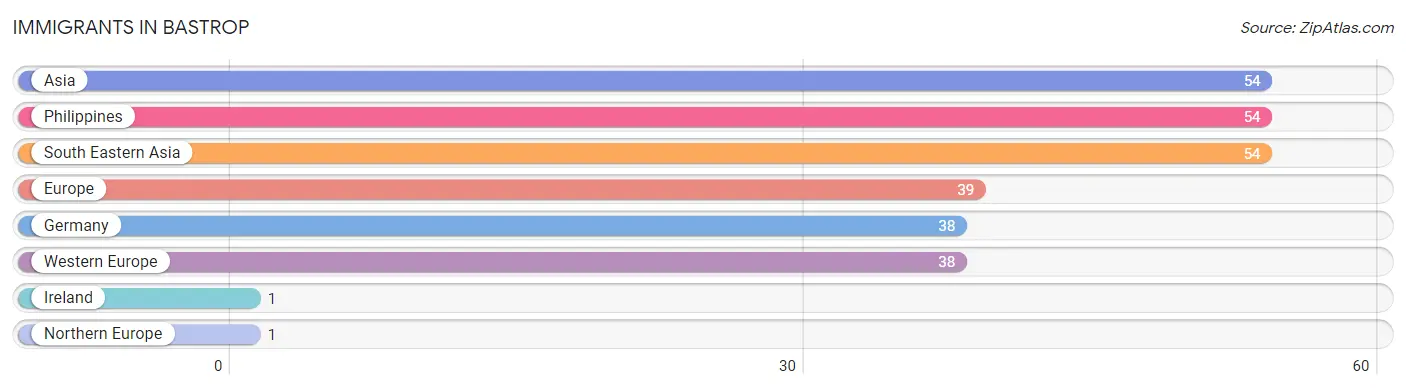
| Immigration Origin | # Population | % Population |
| Asia | 54 | 0.6% |
| Europe | 39 | 0.4% |
| Germany | 38 | 0.4% |
| Ireland | 1 | 0.0% |
| Northern Europe | 1 | 0.0% |
| Philippines | 54 | 0.6% |
| South Eastern Asia | 54 | 0.6% |
| Western Europe | 38 | 0.4% | View All 8 Rows |
Sex and Age in Bastrop
Sex and Age in Bastrop
The most populous age groups in Bastrop are 25 to 29 Years (502 | 10.3%) for men and 35 to 39 Years (466 | 9.8%) for women.
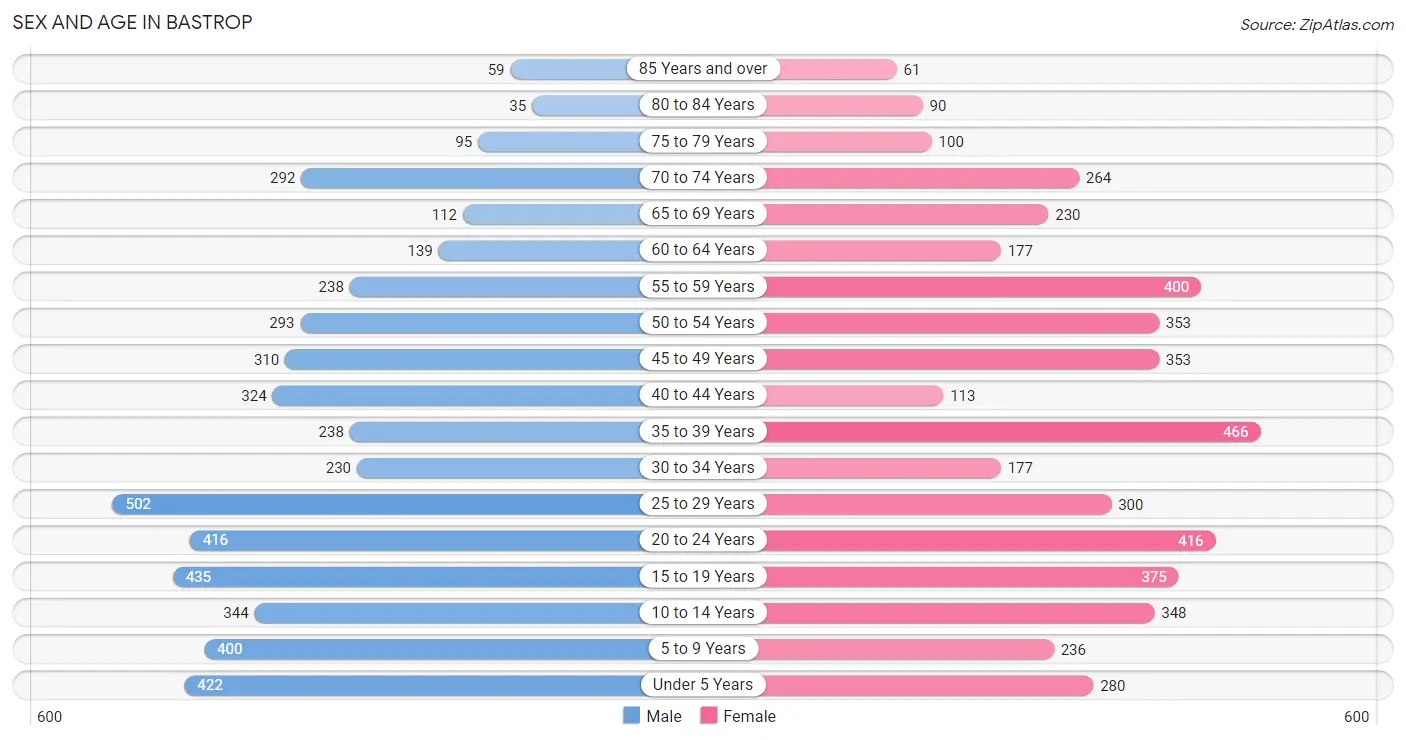
| Age Bracket | Male | Female |
| Under 5 Years | 422 (8.6%) | 280 (5.9%) |
| 5 to 9 Years | 400 (8.2%) | 236 (5.0%) |
| 10 to 14 Years | 344 (7.0%) | 348 (7.3%) |
| 15 to 19 Years | 435 (8.9%) | 375 (7.9%) |
| 20 to 24 Years | 416 (8.5%) | 416 (8.8%) |
| 25 to 29 Years | 502 (10.3%) | 300 (6.3%) |
| 30 to 34 Years | 230 (4.7%) | 177 (3.7%) |
| 35 to 39 Years | 238 (4.9%) | 466 (9.8%) |
| 40 to 44 Years | 324 (6.6%) | 113 (2.4%) |
| 45 to 49 Years | 310 (6.4%) | 353 (7.4%) |
| 50 to 54 Years | 293 (6.0%) | 353 (7.4%) |
| 55 to 59 Years | 238 (4.9%) | 400 (8.4%) |
| 60 to 64 Years | 139 (2.9%) | 177 (3.7%) |
| 65 to 69 Years | 112 (2.3%) | 230 (4.9%) |
| 70 to 74 Years | 292 (6.0%) | 264 (5.6%) |
| 75 to 79 Years | 95 (1.9%) | 100 (2.1%) |
| 80 to 84 Years | 35 (0.7%) | 90 (1.9%) |
| 85 Years and over | 59 (1.2%) | 61 (1.3%) |
| Total | 4,884 (100.0%) | 4,739 (100.0%) |
Families and Households in Bastrop
Median Family Size in Bastrop
The median family size in Bastrop is 3.66 persons per family, with single female/mother families (867 | 42.0%) accounting for the largest median family size of 4.62 persons per family. On the other hand, single male/father families (223 | 10.8%) represent the smallest median family size with 2.13 persons per family.
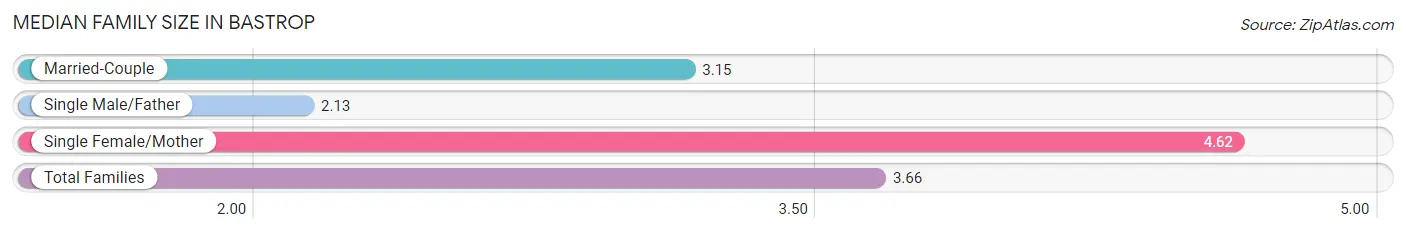
| Family Type | # Families | Family Size |
| Married-Couple | 973 (47.2%) | 3.15 |
| Single Male/Father | 223 (10.8%) | 2.13 |
| Single Female/Mother | 867 (42.0%) | 4.62 |
| Total Families | 2,063 (100.0%) | 3.66 |
Median Household Size in Bastrop
The median household size in Bastrop is 2.63 persons per household, with single female/mother households (867 | 24.4%) accounting for the largest median household size of 4.75 persons per household. non-family households (1,485 | 41.8%) represent the smallest median household size with 1.11 persons per household.
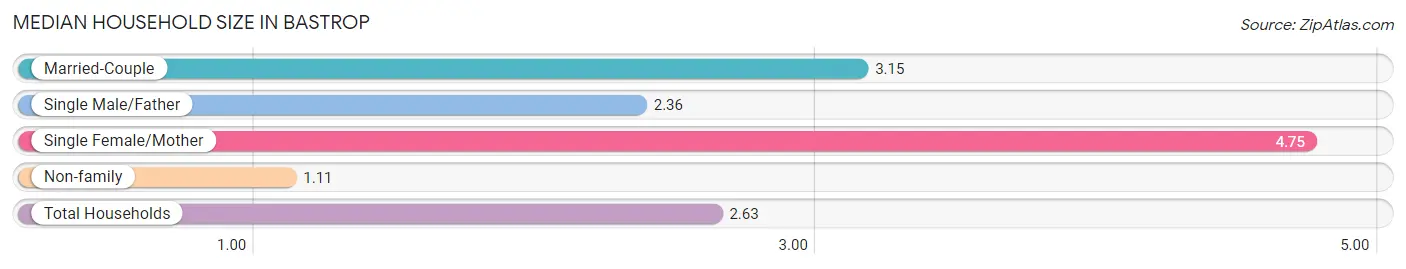
| Household Type | # Households | Household Size |
| Married-Couple | 973 (27.4%) | 3.15 |
| Single Male/Father | 223 (6.3%) | 2.36 |
| Single Female/Mother | 867 (24.4%) | 4.75 |
| Non-family | 1,485 (41.8%) | 1.11 |
| Total Households | 3,548 (100.0%) | 2.63 |
Household Size by Marriage Status in Bastrop
Out of a total of 3,548 households in Bastrop, 2,063 (58.2%) are family households, while 1,485 (41.8%) are nonfamily households. The most numerous type of family households are 2-person households, comprising 899, and the most common type of nonfamily households are 1-person households, comprising 1,346.
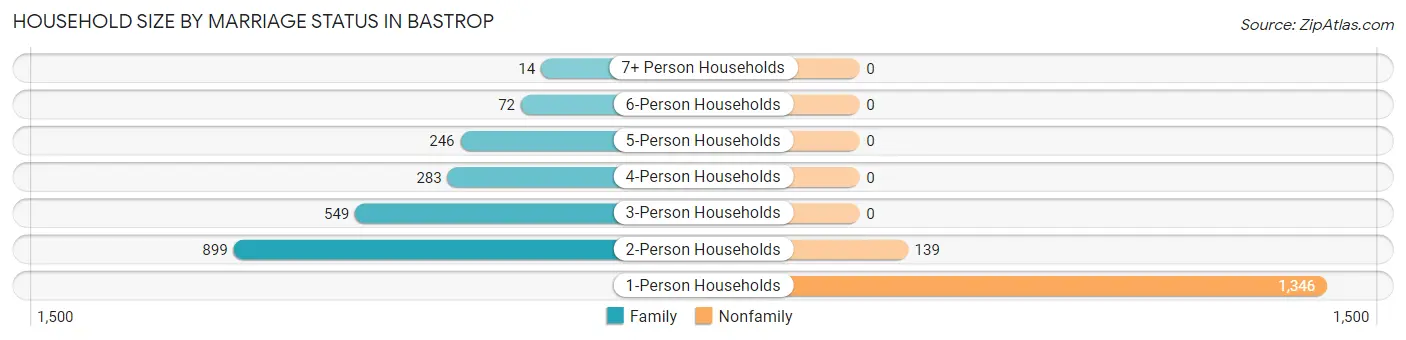
| Household Size | Family Households | Nonfamily Households |
| 1-Person Households | - | 1,346 (37.9%) |
| 2-Person Households | 899 (25.3%) | 139 (3.9%) |
| 3-Person Households | 549 (15.5%) | 0 (0.0%) |
| 4-Person Households | 283 (8.0%) | 0 (0.0%) |
| 5-Person Households | 246 (6.9%) | 0 (0.0%) |
| 6-Person Households | 72 (2.0%) | 0 (0.0%) |
| 7+ Person Households | 14 (0.4%) | 0 (0.0%) |
| Total | 2,063 (58.2%) | 1,485 (41.8%) |
Female Fertility in Bastrop
Fertility by Age in Bastrop
Average fertility rate in Bastrop is 20.0 births per 1,000 women. Women in the age bracket of 15 to 19 years have the highest fertility rate with 72.0 births per 1,000 women. Women in the age bracket of 15 to 19 years acount for 58.7% of all women with births.
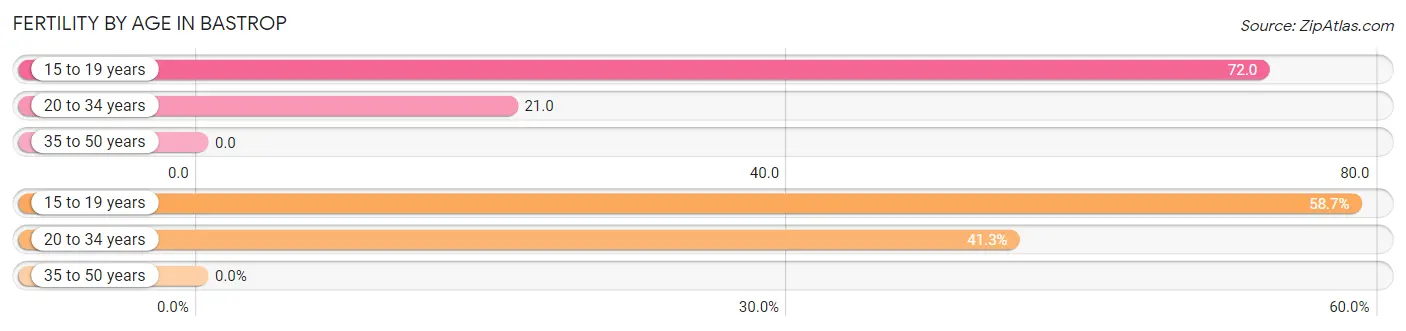
| Age Bracket | Women with Births | Births / 1,000 Women |
| 15 to 19 years | 27 (58.7%) | 72.0 |
| 20 to 34 years | 19 (41.3%) | 21.0 |
| 35 to 50 years | 0 (0.0%) | 0.0 |
| Total | 46 (100.0%) | 20.0 |
Fertility by Age by Marriage Status in Bastrop
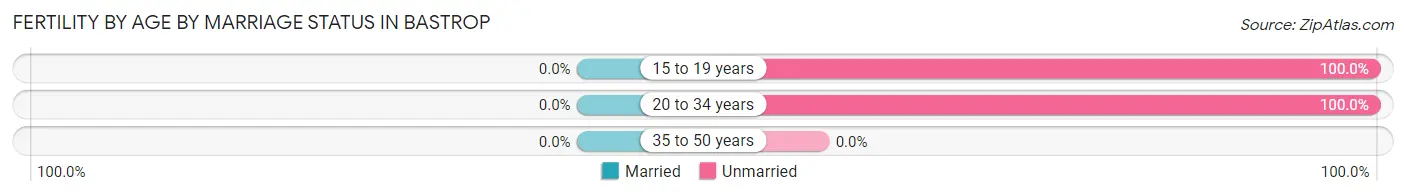
| Age Bracket | Married | Unmarried |
| 15 to 19 years | 0 (0.0%) | 27 (100.0%) |
| 20 to 34 years | 0 (0.0%) | 19 (100.0%) |
| 35 to 50 years | 0 (0.0%) | 0 (0.0%) |
| Total | 0 (0.0%) | 46 (100.0%) |
Fertility by Education in Bastrop
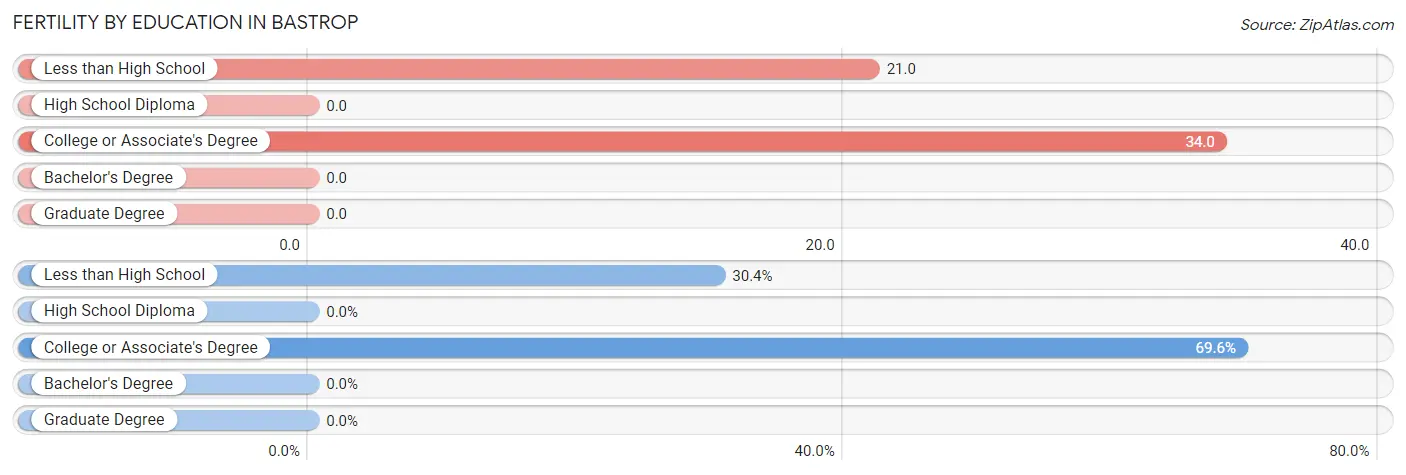
| Educational Attainment | Women with Births | Births / 1,000 Women |
| Less than High School | 14 (30.4%) | 21.0 |
| High School Diploma | 0 (0.0%) | 0.0 |
| College or Associate's Degree | 32 (69.6%) | 34.0 |
| Bachelor's Degree | 0 (0.0%) | 0.0 |
| Graduate Degree | 0 (0.0%) | 0.0 |
| Total | 46 (100.0%) | 20.0 |
Fertility by Education by Marriage Status in Bastrop
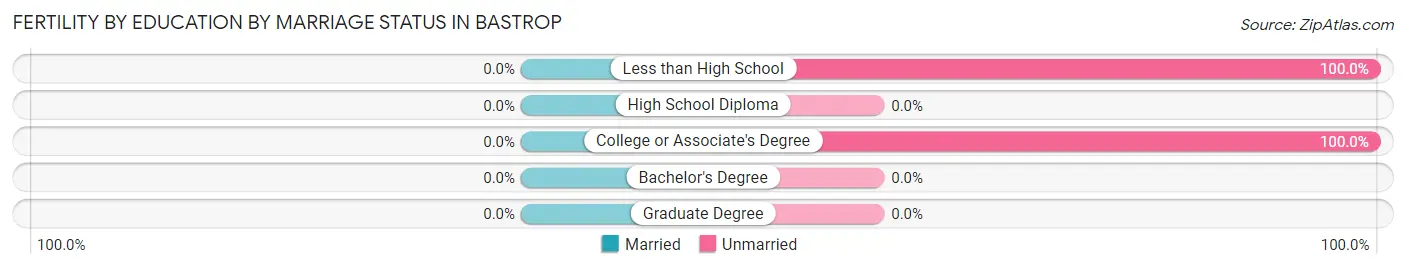
| Educational Attainment | Married | Unmarried |
| Less than High School | 0 (0.0%) | 14 (100.0%) |
| High School Diploma | 0 (0.0%) | 0 (0.0%) |
| College or Associate's Degree | 0 (0.0%) | 32 (100.0%) |
| Bachelor's Degree | 0 (0.0%) | 0 (0.0%) |
| Graduate Degree | 0 (0.0%) | 0 (0.0%) |
| Total | 0 (0.0%) | 46 (100.0%) |
Employment Characteristics in Bastrop
Employment by Class of Employer in Bastrop
Among the 3,349 employed individuals in Bastrop, private company employees (2,391 | 71.4%), local government employees (397 | 11.8%), and self-employed (not incorporated) (245 | 7.3%) make up the most common classes of employment.
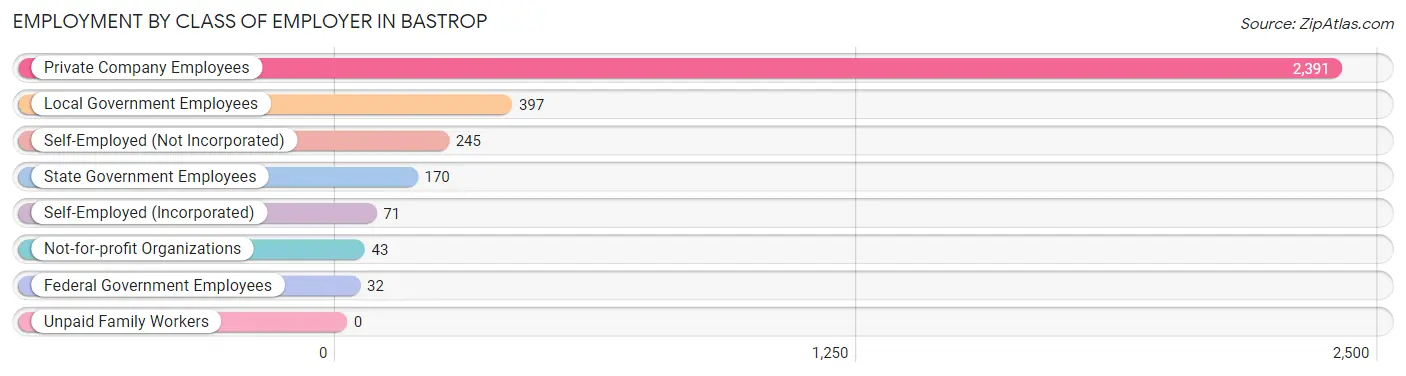
| Employer Class | # Employees | % Employees |
| Private Company Employees | 2,391 | 71.4% |
| Self-Employed (Incorporated) | 71 | 2.1% |
| Self-Employed (Not Incorporated) | 245 | 7.3% |
| Not-for-profit Organizations | 43 | 1.3% |
| Local Government Employees | 397 | 11.8% |
| State Government Employees | 170 | 5.1% |
| Federal Government Employees | 32 | 1.0% |
| Unpaid Family Workers | 0 | 0.0% |
| Total | 3,349 | 100.0% |
Employment Status by Age in Bastrop
According to the labor force statistics for Bastrop, out of the total population over 16 years of age (7,414), 52.2% or 3,870 individuals are in the labor force, with 11.5% or 445 of them unemployed. The age group with the highest labor force participation rate is 35 to 44 years, with 78.3% or 893 individuals in the labor force. Within the labor force, the 16 to 19 years age range has the highest percentage of unemployed individuals, with 21.8% or 52 of them being unemployed.
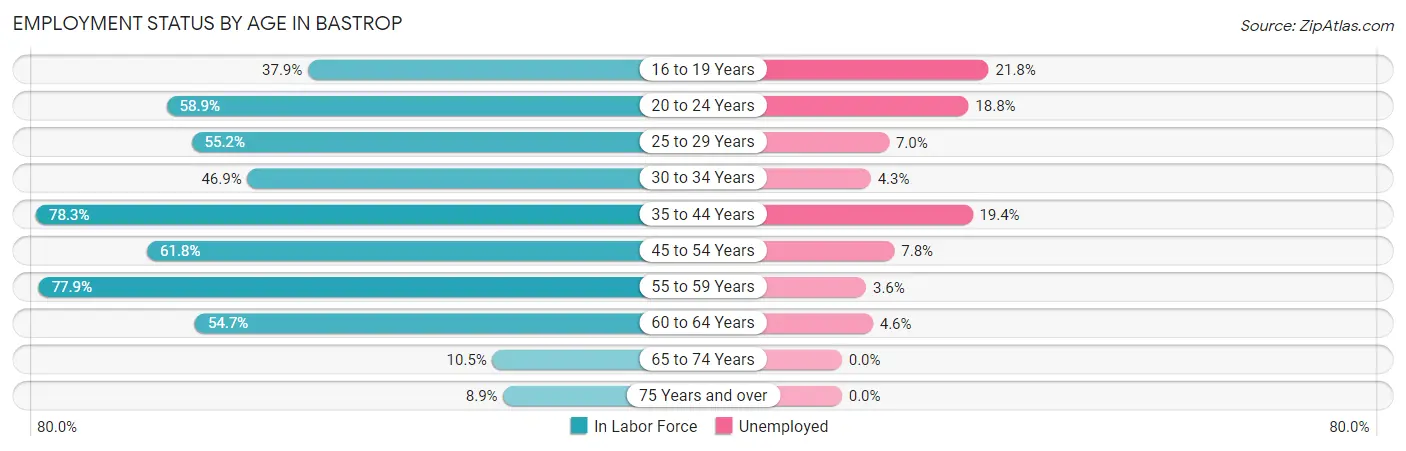
| Age Bracket | In Labor Force | Unemployed |
| 16 to 19 Years | 239 (37.9%) | 52 (21.8%) |
| 20 to 24 Years | 490 (58.9%) | 92 (18.8%) |
| 25 to 29 Years | 443 (55.2%) | 31 (7.0%) |
| 30 to 34 Years | 191 (46.9%) | 8 (4.3%) |
| 35 to 44 Years | 893 (78.3%) | 173 (19.4%) |
| 45 to 54 Years | 809 (61.8%) | 63 (7.8%) |
| 55 to 59 Years | 497 (77.9%) | 18 (3.6%) |
| 60 to 64 Years | 173 (54.7%) | 8 (4.6%) |
| 65 to 74 Years | 94 (10.5%) | 0 (0.0%) |
| 75 Years and over | 39 (8.9%) | 0 (0.0%) |
| Total | 3,870 (52.2%) | 445 (11.5%) |
Employment Status by Educational Attainment in Bastrop
According to labor force statistics for Bastrop, 65.2% of individuals (3,008) out of the total population between 25 and 64 years of age (4,613) are in the labor force, with 10.0% or 301 of them being unemployed. The group with the highest labor force participation rate are those with the educational attainment of high school diploma, with 76.6% or 1,146 individuals in the labor force. Within the labor force, individuals with high school diploma education have the highest percentage of unemployment, with 16.0% or 183 of them being unemployed.
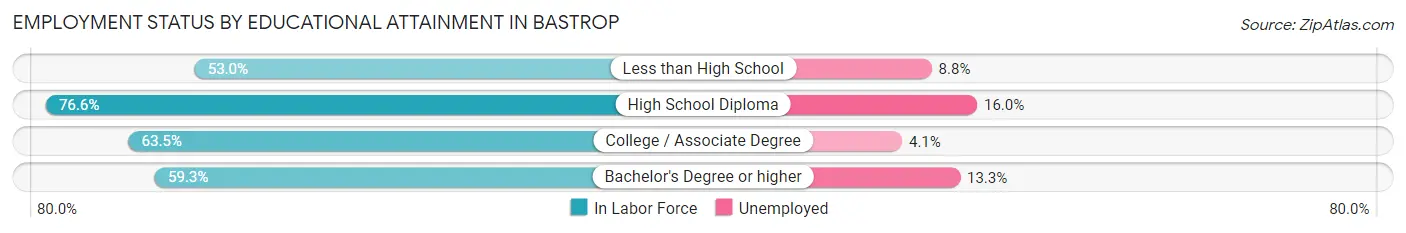
| Educational Attainment | In Labor Force | Unemployed |
| Less than High School | 533 (53.0%) | 88 (8.8%) |
| High School Diploma | 1,146 (76.6%) | 239 (16.0%) |
| College / Associate Degree | 1,140 (63.5%) | 74 (4.1%) |
| Bachelor's Degree or higher | 188 (59.3%) | 42 (13.3%) |
| Total | 3,008 (65.2%) | 461 (10.0%) |
Employment Occupations by Sex in Bastrop
Management, Business, Science and Arts Occupations
The most common Management, Business, Science and Arts occupations in Bastrop are Health Diagnosing & Treating (233 | 6.8%), Community & Social Service (134 | 3.9%), Education Instruction & Library (124 | 3.6%), Health Technologists (124 | 3.6%), and Management (114 | 3.3%).
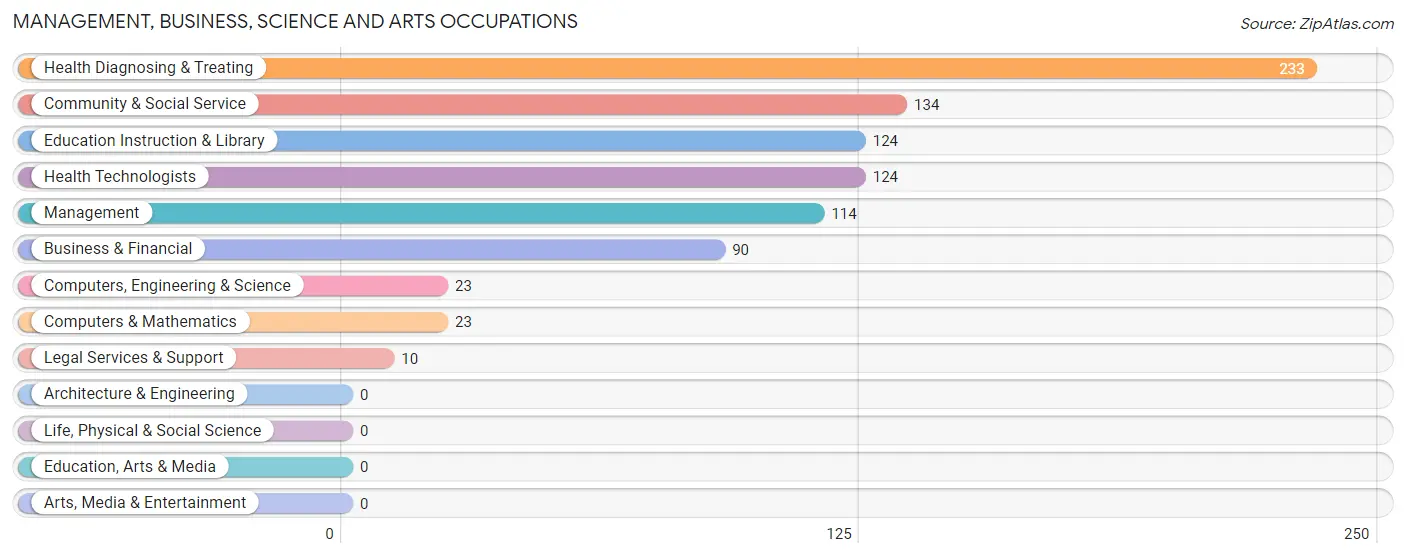
Management, Business, Science and Arts Occupations by Sex
Within the Management, Business, Science and Arts occupations in Bastrop, the most male-oriented occupations are Legal Services & Support (100.0%), Management (44.7%), and Health Technologists (42.7%), while the most female-oriented occupations are Business & Financial (100.0%), Computers, Engineering & Science (100.0%), and Computers & Mathematics (100.0%).
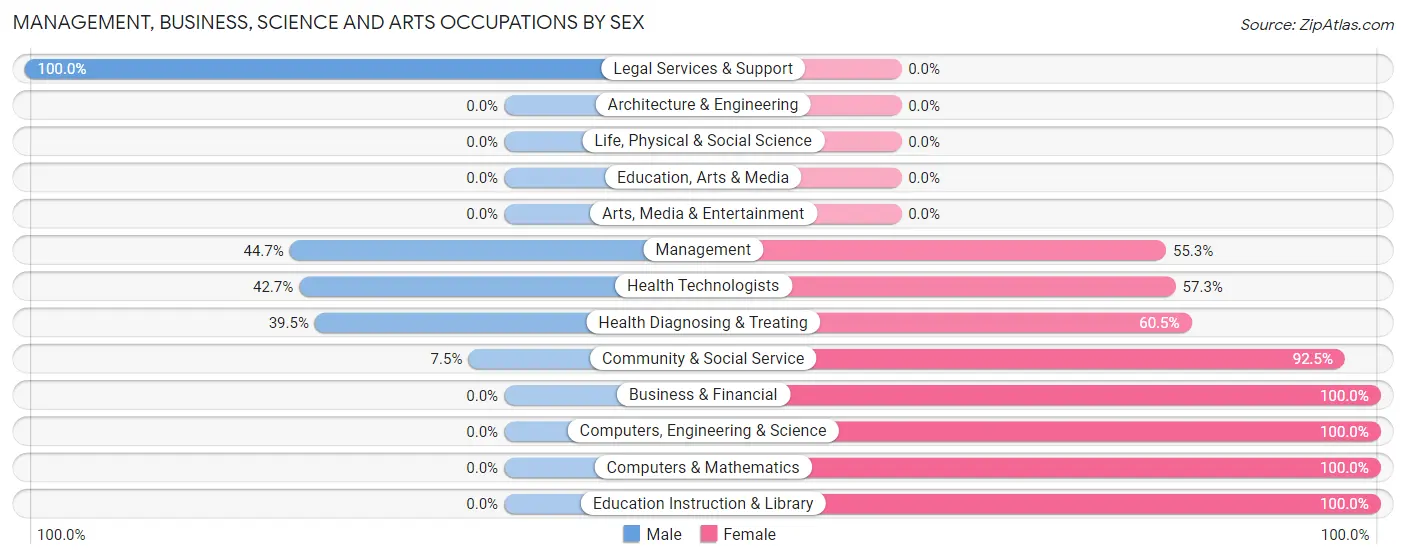
| Occupation | Male | Female |
| Management | 51 (44.7%) | 63 (55.3%) |
| Business & Financial | 0 (0.0%) | 90 (100.0%) |
| Computers, Engineering & Science | 0 (0.0%) | 23 (100.0%) |
| Computers & Mathematics | 0 (0.0%) | 23 (100.0%) |
| Architecture & Engineering | 0 (0.0%) | 0 (0.0%) |
| Life, Physical & Social Science | 0 (0.0%) | 0 (0.0%) |
| Community & Social Service | 10 (7.5%) | 124 (92.5%) |
| Education, Arts & Media | 0 (0.0%) | 0 (0.0%) |
| Legal Services & Support | 10 (100.0%) | 0 (0.0%) |
| Education Instruction & Library | 0 (0.0%) | 124 (100.0%) |
| Arts, Media & Entertainment | 0 (0.0%) | 0 (0.0%) |
| Health Diagnosing & Treating | 92 (39.5%) | 141 (60.5%) |
| Health Technologists | 53 (42.7%) | 71 (57.3%) |
| Total (Category) | 153 (25.8%) | 441 (74.2%) |
| Total (Overall) | 1,593 (46.6%) | 1,823 (53.4%) |
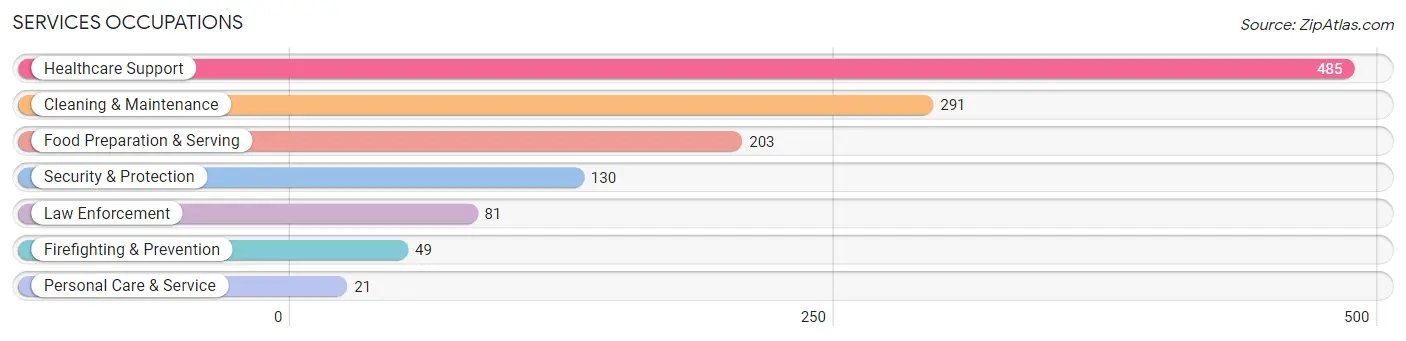
Services Occupations
The most common Services occupations in Bastrop are Healthcare Support (485 | 14.2%), Cleaning & Maintenance (291 | 8.5%), Food Preparation & Serving (203 | 5.9%), Security & Protection (130 | 3.8%), and Law Enforcement (81 | 2.4%).
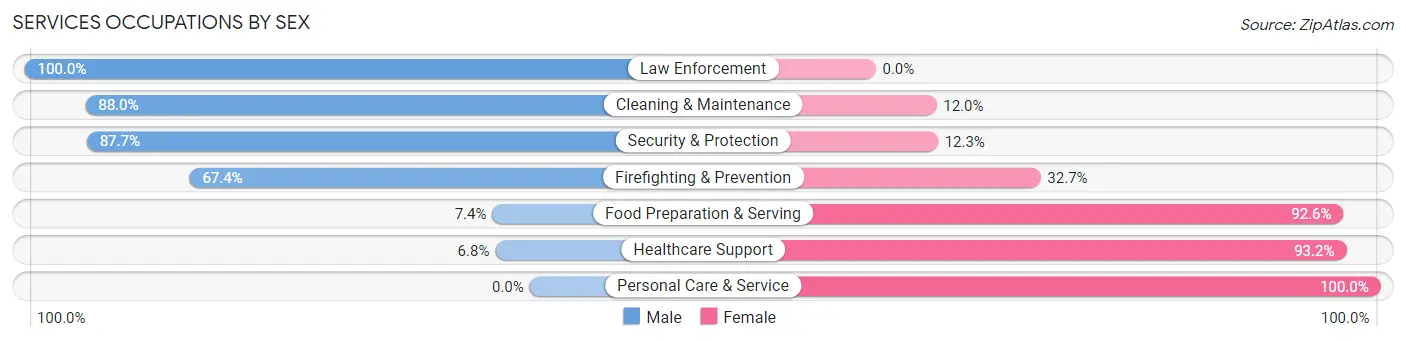
Services Occupations by Sex
Within the Services occupations in Bastrop, the most male-oriented occupations are Law Enforcement (100.0%), Cleaning & Maintenance (88.0%), and Security & Protection (87.7%), while the most female-oriented occupations are Personal Care & Service (100.0%), Healthcare Support (93.2%), and Food Preparation & Serving (92.6%).
| Occupation | Male | Female |
| Healthcare Support | 33 (6.8%) | 452 (93.2%) |
| Security & Protection | 114 (87.7%) | 16 (12.3%) |
| Firefighting & Prevention | 33 (67.3%) | 16 (32.7%) |
| Law Enforcement | 81 (100.0%) | 0 (0.0%) |
| Food Preparation & Serving | 15 (7.4%) | 188 (92.6%) |
| Cleaning & Maintenance | 256 (88.0%) | 35 (12.0%) |
| Personal Care & Service | 0 (0.0%) | 21 (100.0%) |
| Total (Category) | 418 (37.0%) | 712 (63.0%) |
| Total (Overall) | 1,593 (46.6%) | 1,823 (53.4%) |
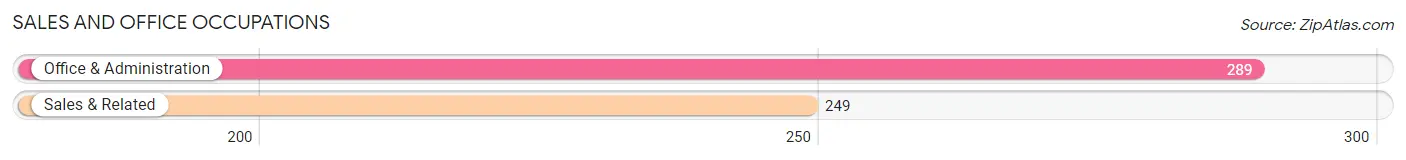
Sales and Office Occupations
The most common Sales and Office occupations in Bastrop are Office & Administration (289 | 8.5%), and Sales & Related (249 | 7.3%).
Sales and Office Occupations by Sex
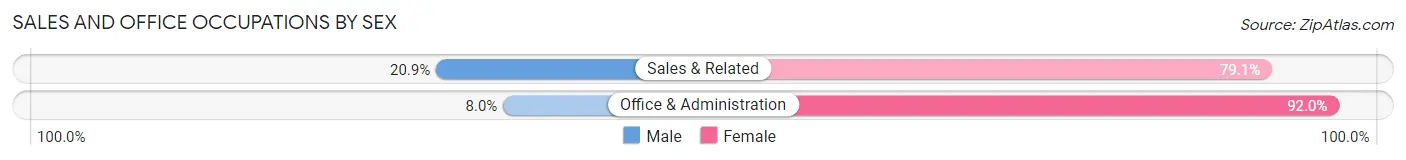
| Occupation | Male | Female |
| Sales & Related | 52 (20.9%) | 197 (79.1%) |
| Office & Administration | 23 (8.0%) | 266 (92.0%) |
| Total (Category) | 75 (13.9%) | 463 (86.1%) |
| Total (Overall) | 1,593 (46.6%) | 1,823 (53.4%) |
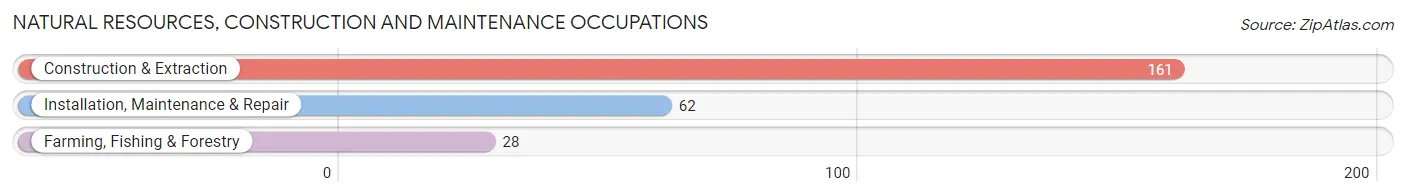
Natural Resources, Construction and Maintenance Occupations
The most common Natural Resources, Construction and Maintenance occupations in Bastrop are Construction & Extraction (161 | 4.7%), Installation, Maintenance & Repair (62 | 1.8%), and Farming, Fishing & Forestry (28 | 0.8%).
Natural Resources, Construction and Maintenance Occupations by Sex
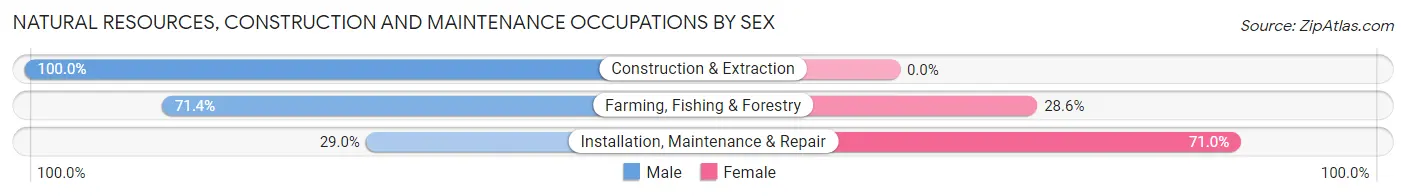
| Occupation | Male | Female |
| Farming, Fishing & Forestry | 20 (71.4%) | 8 (28.6%) |
| Construction & Extraction | 161 (100.0%) | 0 (0.0%) |
| Installation, Maintenance & Repair | 18 (29.0%) | 44 (71.0%) |
| Total (Category) | 199 (79.3%) | 52 (20.7%) |
| Total (Overall) | 1,593 (46.6%) | 1,823 (53.4%) |
Production, Transportation and Moving Occupations
The most common Production, Transportation and Moving occupations in Bastrop are Production (565 | 16.5%), Material Moving (269 | 7.9%), and Transportation (69 | 2.0%).
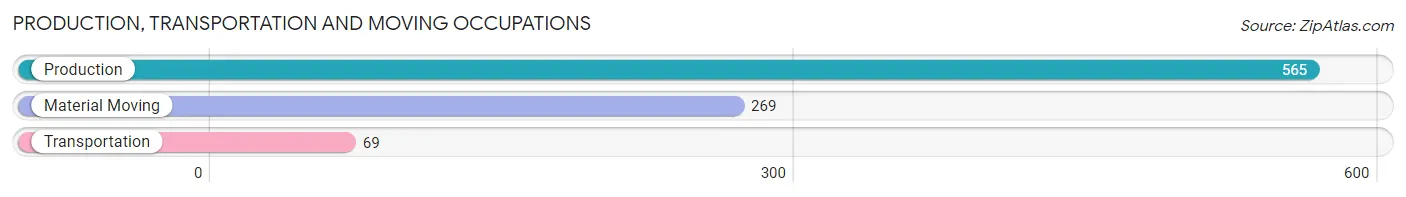
Production, Transportation and Moving Occupations by Sex
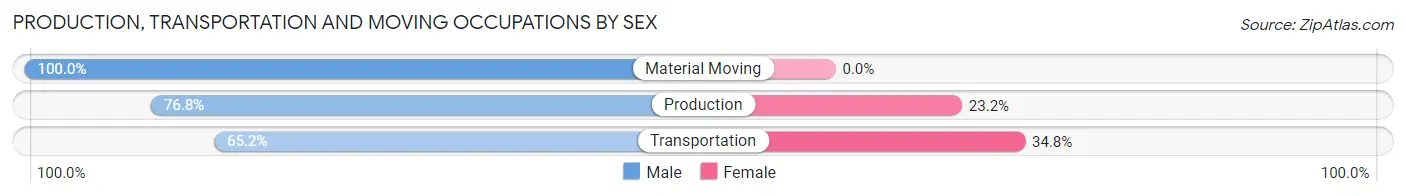
| Occupation | Male | Female |
| Production | 434 (76.8%) | 131 (23.2%) |
| Transportation | 45 (65.2%) | 24 (34.8%) |
| Material Moving | 269 (100.0%) | 0 (0.0%) |
| Total (Category) | 748 (82.8%) | 155 (17.2%) |
| Total (Overall) | 1,593 (46.6%) | 1,823 (53.4%) |
Employment Industries by Sex in Bastrop
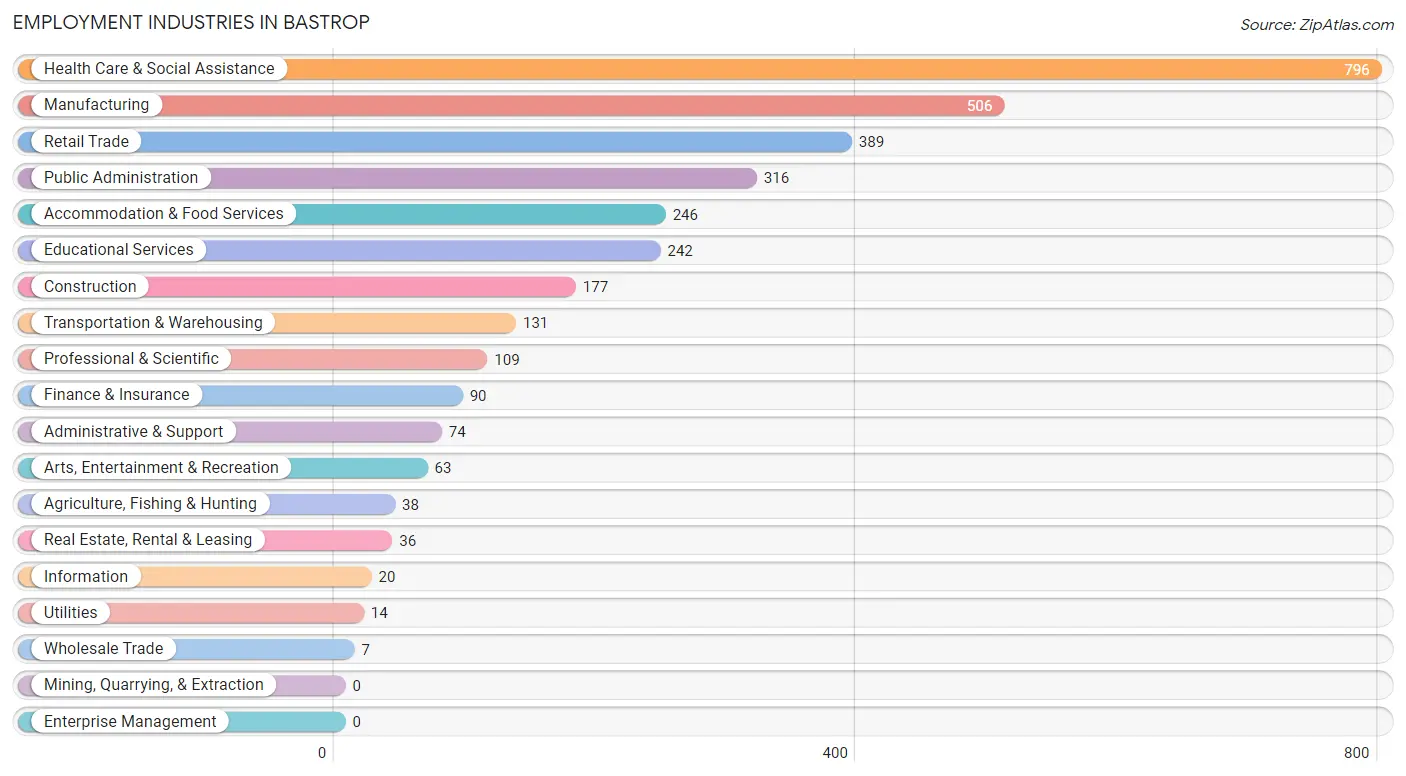
Employment Industries in Bastrop
The major employment industries in Bastrop include Health Care & Social Assistance (796 | 23.3%), Manufacturing (506 | 14.8%), Retail Trade (389 | 11.4%), Public Administration (316 | 9.2%), and Accommodation & Food Services (246 | 7.2%).
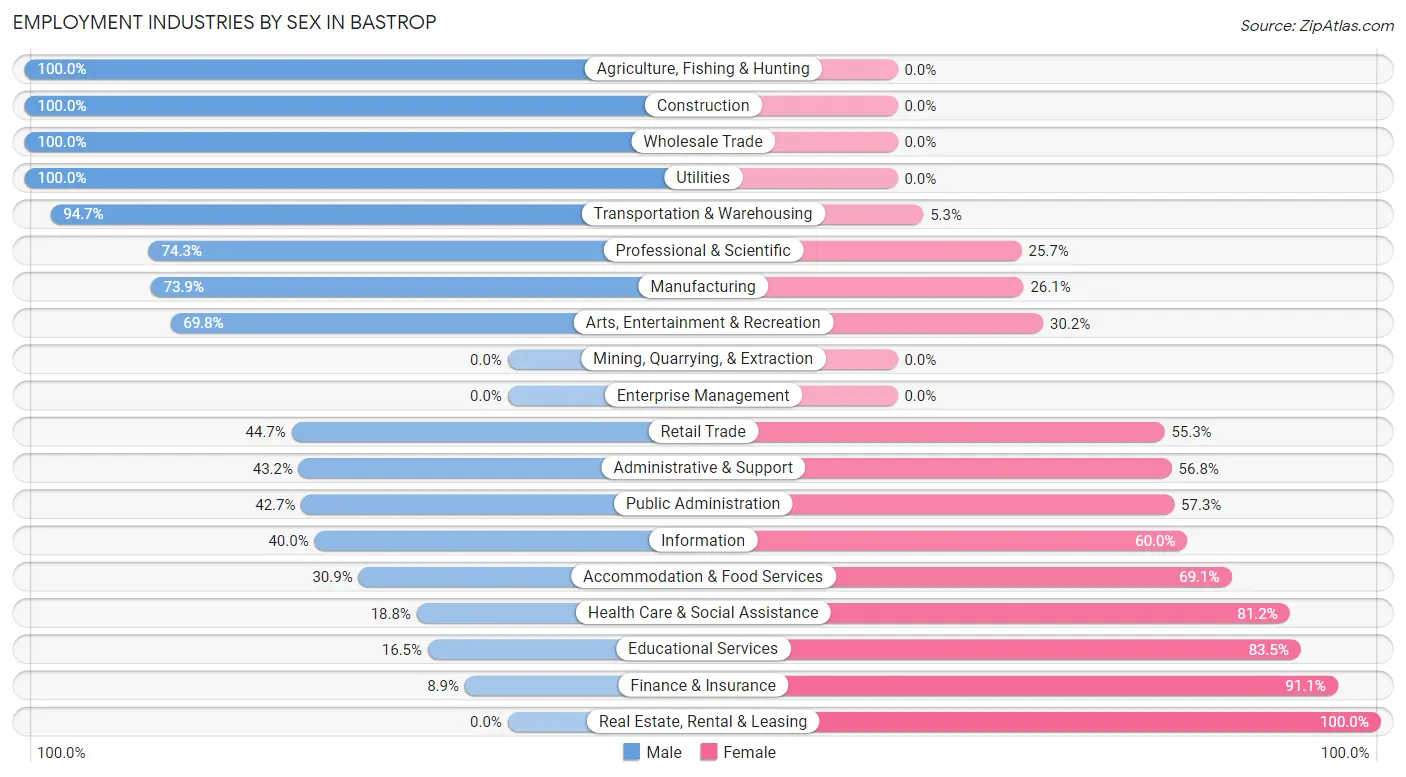
Employment Industries by Sex in Bastrop
The Bastrop industries that see more men than women are Agriculture, Fishing & Hunting (100.0%), Construction (100.0%), and Wholesale Trade (100.0%), whereas the industries that tend to have a higher number of women are Real Estate, Rental & Leasing (100.0%), Finance & Insurance (91.1%), and Educational Services (83.5%).
| Industry | Male | Female |
| Agriculture, Fishing & Hunting | 38 (100.0%) | 0 (0.0%) |
| Mining, Quarrying, & Extraction | 0 (0.0%) | 0 (0.0%) |
| Construction | 177 (100.0%) | 0 (0.0%) |
| Manufacturing | 374 (73.9%) | 132 (26.1%) |
| Wholesale Trade | 7 (100.0%) | 0 (0.0%) |
| Retail Trade | 174 (44.7%) | 215 (55.3%) |
| Transportation & Warehousing | 124 (94.7%) | 7 (5.3%) |
| Utilities | 14 (100.0%) | 0 (0.0%) |
| Information | 8 (40.0%) | 12 (60.0%) |
| Finance & Insurance | 8 (8.9%) | 82 (91.1%) |
| Real Estate, Rental & Leasing | 0 (0.0%) | 36 (100.0%) |
| Professional & Scientific | 81 (74.3%) | 28 (25.7%) |
| Enterprise Management | 0 (0.0%) | 0 (0.0%) |
| Administrative & Support | 32 (43.2%) | 42 (56.8%) |
| Educational Services | 40 (16.5%) | 202 (83.5%) |
| Health Care & Social Assistance | 150 (18.8%) | 646 (81.2%) |
| Arts, Entertainment & Recreation | 44 (69.8%) | 19 (30.2%) |
| Accommodation & Food Services | 76 (30.9%) | 170 (69.1%) |
| Public Administration | 135 (42.7%) | 181 (57.3%) |
| Total | 1,593 (46.6%) | 1,823 (53.4%) |
Education in Bastrop
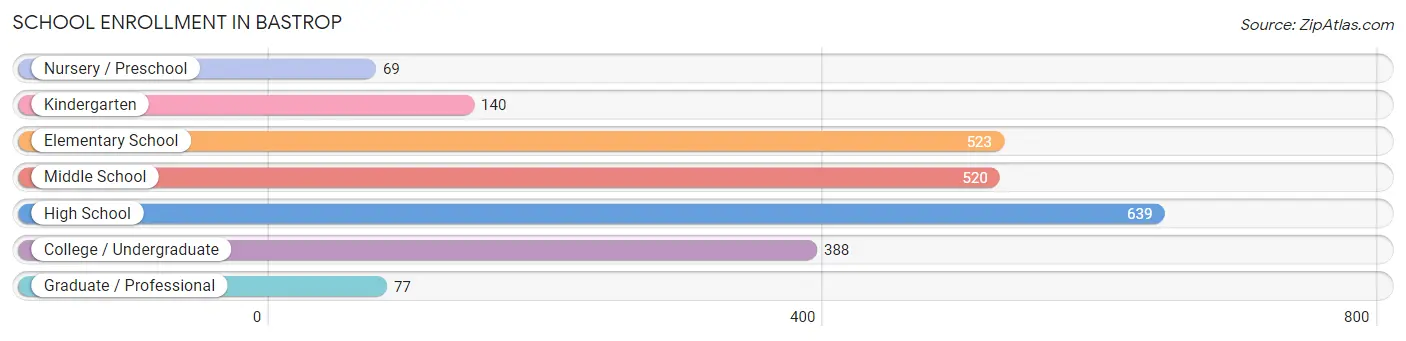
School Enrollment in Bastrop
The most common levels of schooling among the 2,356 students in Bastrop are high school (639 | 27.1%), elementary school (523 | 22.2%), and middle school (520 | 22.1%).
| School Level | # Students | % Students |
| Nursery / Preschool | 69 | 2.9% |
| Kindergarten | 140 | 5.9% |
| Elementary School | 523 | 22.2% |
| Middle School | 520 | 22.1% |
| High School | 639 | 27.1% |
| College / Undergraduate | 388 | 16.5% |
| Graduate / Professional | 77 | 3.3% |
| Total | 2,356 | 100.0% |
School Enrollment by Age by Funding Source in Bastrop
Out of a total of 2,356 students who are enrolled in schools in Bastrop, 191 (8.1%) attend a private institution, while the remaining 2,165 (91.9%) are enrolled in public schools. The age group of 35 years and over has the highest likelihood of being enrolled in private schools, with 46 (37.7% in the age bracket) enrolled. Conversely, the age group of 3 to 4 year olds has the lowest likelihood of being enrolled in a private school, with 35 (100.0% in the age bracket) attending a public institution.
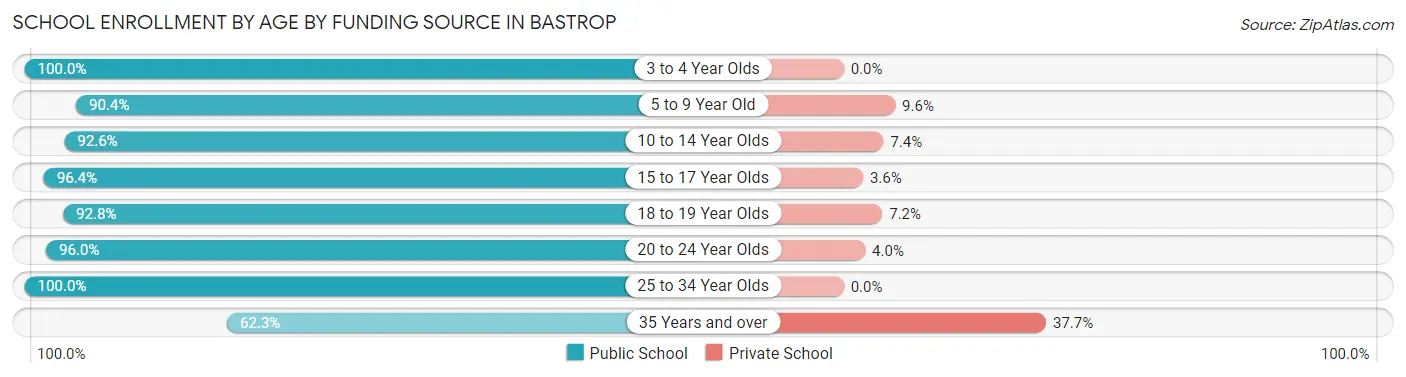
| Age Bracket | Public School | Private School |
| 3 to 4 Year Olds | 35 (100.0%) | 0 (0.0%) |
| 5 to 9 Year Old | 575 (90.4%) | 61 (9.6%) |
| 10 to 14 Year Olds | 586 (92.6%) | 47 (7.4%) |
| 15 to 17 Year Olds | 484 (96.4%) | 18 (3.6%) |
| 18 to 19 Year Olds | 155 (92.8%) | 12 (7.2%) |
| 20 to 24 Year Olds | 168 (96.0%) | 7 (4.0%) |
| 25 to 34 Year Olds | 86 (100.0%) | 0 (0.0%) |
| 35 Years and over | 76 (62.3%) | 46 (37.7%) |
| Total | 2,165 (91.9%) | 191 (8.1%) |
Educational Attainment by Field of Study in Bastrop
Arts & humanities (119 | 29.9%), liberal arts & history (59 | 14.8%), psychology (47 | 11.8%), science & technology (41 | 10.3%), and education (39 | 9.8%) are the most common fields of study among 398 individuals in Bastrop who have obtained a bachelor's degree or higher.
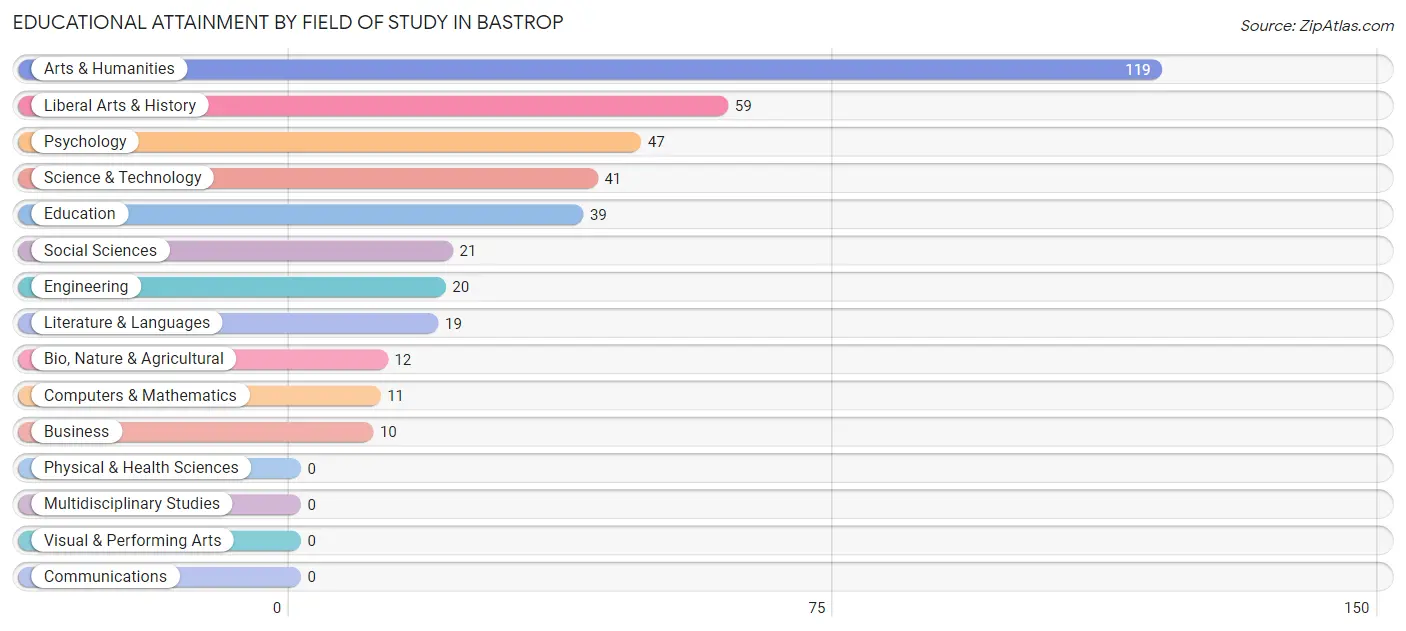
| Field of Study | # Graduates | % Graduates |
| Computers & Mathematics | 11 | 2.8% |
| Bio, Nature & Agricultural | 12 | 3.0% |
| Physical & Health Sciences | 0 | 0.0% |
| Psychology | 47 | 11.8% |
| Social Sciences | 21 | 5.3% |
| Engineering | 20 | 5.0% |
| Multidisciplinary Studies | 0 | 0.0% |
| Science & Technology | 41 | 10.3% |
| Business | 10 | 2.5% |
| Education | 39 | 9.8% |
| Literature & Languages | 19 | 4.8% |
| Liberal Arts & History | 59 | 14.8% |
| Visual & Performing Arts | 0 | 0.0% |
| Communications | 0 | 0.0% |
| Arts & Humanities | 119 | 29.9% |
| Total | 398 | 100.0% |
Transportation & Commute in Bastrop
Vehicle Availability by Sex in Bastrop
The most prevalent vehicle ownership categories in Bastrop are males with 3 vehicles (528, accounting for 33.8%) and females with 3 vehicles (439, making up 29.5%).
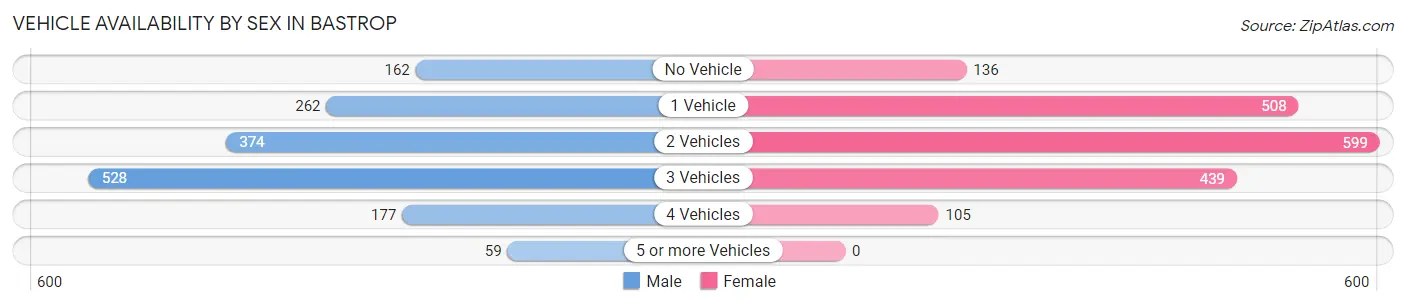
| Vehicles Available | Male | Female |
| No Vehicle | 162 (10.4%) | 136 (7.6%) |
| 1 Vehicle | 262 (16.8%) | 508 (28.4%) |
| 2 Vehicles | 374 (23.9%) | 599 (33.5%) |
| 3 Vehicles | 528 (33.8%) | 439 (24.6%) |
| 4 Vehicles | 177 (11.3%) | 105 (5.9%) |
| 5 or more Vehicles | 59 (3.8%) | 0 (0.0%) |
| Total | 1,562 (100.0%) | 1,787 (100.0%) |
Commute Time in Bastrop
The most frequently occuring commute durations in Bastrop are 10 to 14 minutes (753 commuters, 23.1%), 5 to 9 minutes (647 commuters, 19.9%), and 15 to 19 minutes (383 commuters, 11.8%).
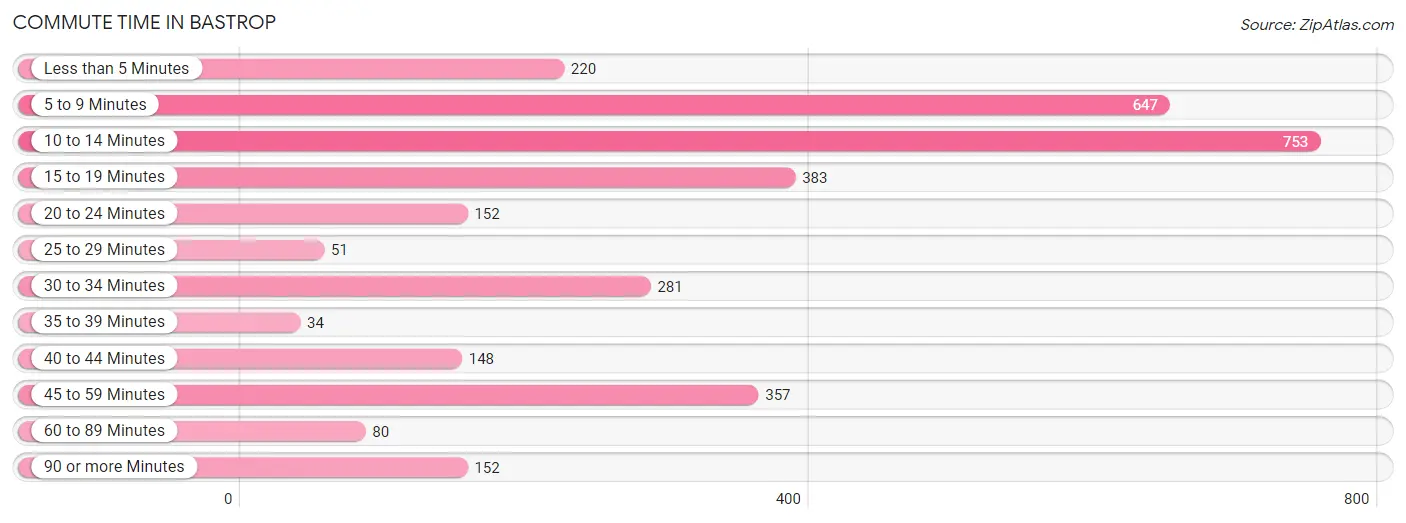
| Commute Time | # Commuters | % Commuters |
| Less than 5 Minutes | 220 | 6.8% |
| 5 to 9 Minutes | 647 | 19.9% |
| 10 to 14 Minutes | 753 | 23.1% |
| 15 to 19 Minutes | 383 | 11.8% |
| 20 to 24 Minutes | 152 | 4.7% |
| 25 to 29 Minutes | 51 | 1.6% |
| 30 to 34 Minutes | 281 | 8.6% |
| 35 to 39 Minutes | 34 | 1.0% |
| 40 to 44 Minutes | 148 | 4.5% |
| 45 to 59 Minutes | 357 | 11.0% |
| 60 to 89 Minutes | 80 | 2.5% |
| 90 or more Minutes | 152 | 4.7% |
Commute Time by Sex in Bastrop
The most common commute times in Bastrop are 5 to 9 minutes (282 commuters, 18.6%) for males and 10 to 14 minutes (481 commuters, 27.7%) for females.
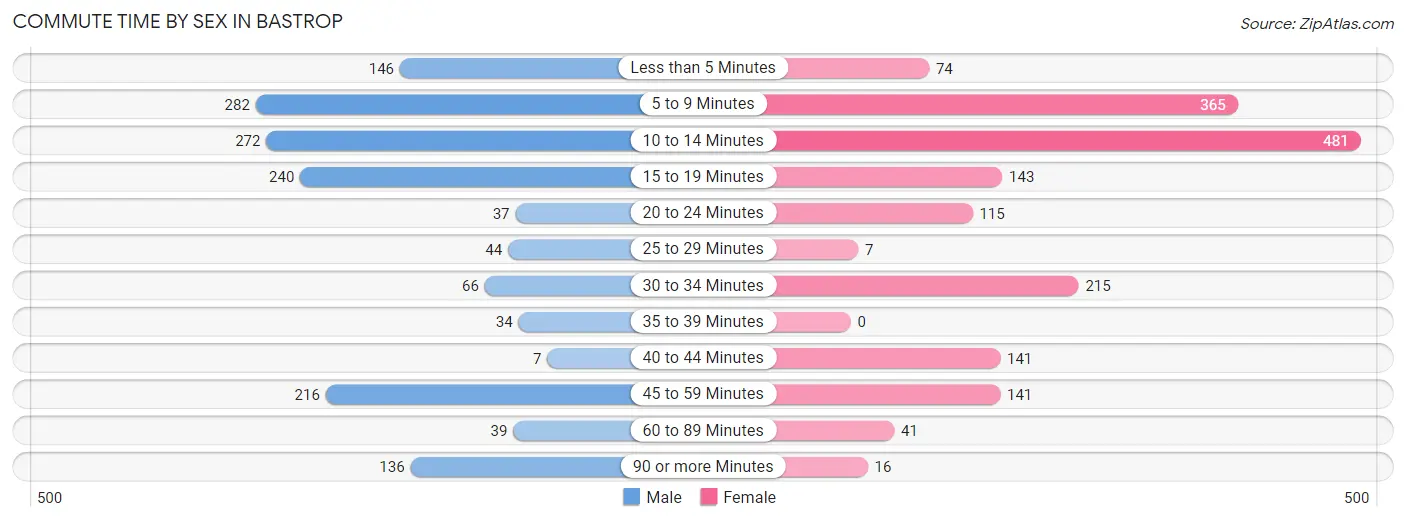
| Commute Time | Male | Female |
| Less than 5 Minutes | 146 (9.6%) | 74 (4.3%) |
| 5 to 9 Minutes | 282 (18.6%) | 365 (21.0%) |
| 10 to 14 Minutes | 272 (17.9%) | 481 (27.7%) |
| 15 to 19 Minutes | 240 (15.8%) | 143 (8.2%) |
| 20 to 24 Minutes | 37 (2.4%) | 115 (6.6%) |
| 25 to 29 Minutes | 44 (2.9%) | 7 (0.4%) |
| 30 to 34 Minutes | 66 (4.3%) | 215 (12.4%) |
| 35 to 39 Minutes | 34 (2.2%) | 0 (0.0%) |
| 40 to 44 Minutes | 7 (0.5%) | 141 (8.1%) |
| 45 to 59 Minutes | 216 (14.2%) | 141 (8.1%) |
| 60 to 89 Minutes | 39 (2.6%) | 41 (2.4%) |
| 90 or more Minutes | 136 (8.9%) | 16 (0.9%) |
Time of Departure to Work by Sex in Bastrop
The most frequent times of departure to work in Bastrop are 6:00 AM to 6:29 AM (391, 25.7%) for males and 7:00 AM to 7:29 AM (420, 24.1%) for females.
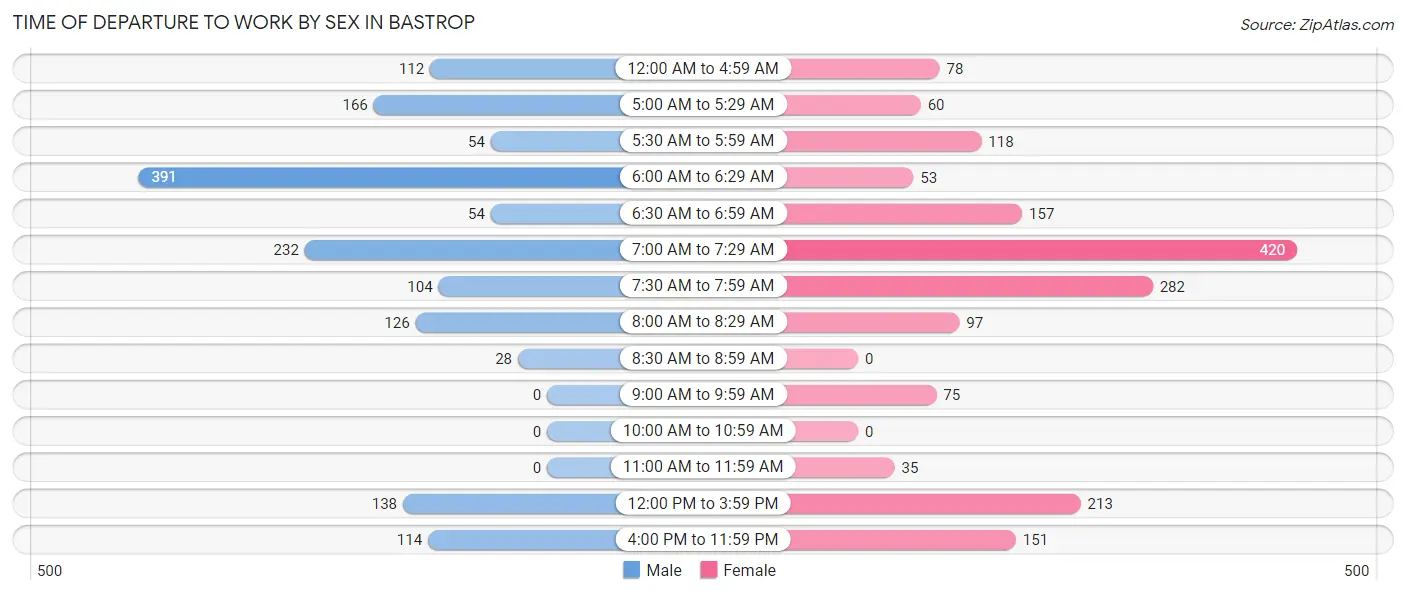
| Time of Departure | Male | Female |
| 12:00 AM to 4:59 AM | 112 (7.4%) | 78 (4.5%) |
| 5:00 AM to 5:29 AM | 166 (10.9%) | 60 (3.5%) |
| 5:30 AM to 5:59 AM | 54 (3.5%) | 118 (6.8%) |
| 6:00 AM to 6:29 AM | 391 (25.7%) | 53 (3.0%) |
| 6:30 AM to 6:59 AM | 54 (3.5%) | 157 (9.0%) |
| 7:00 AM to 7:29 AM | 232 (15.3%) | 420 (24.1%) |
| 7:30 AM to 7:59 AM | 104 (6.9%) | 282 (16.2%) |
| 8:00 AM to 8:29 AM | 126 (8.3%) | 97 (5.6%) |
| 8:30 AM to 8:59 AM | 28 (1.8%) | 0 (0.0%) |
| 9:00 AM to 9:59 AM | 0 (0.0%) | 75 (4.3%) |
| 10:00 AM to 10:59 AM | 0 (0.0%) | 0 (0.0%) |
| 11:00 AM to 11:59 AM | 0 (0.0%) | 35 (2.0%) |
| 12:00 PM to 3:59 PM | 138 (9.1%) | 213 (12.2%) |
| 4:00 PM to 11:59 PM | 114 (7.5%) | 151 (8.7%) |
| Total | 1,519 (100.0%) | 1,739 (100.0%) |
Housing Occupancy in Bastrop
Occupancy by Ownership in Bastrop
Of the total 3,548 dwellings in Bastrop, owner-occupied units account for 1,896 (53.4%), while renter-occupied units make up 1,652 (46.6%).
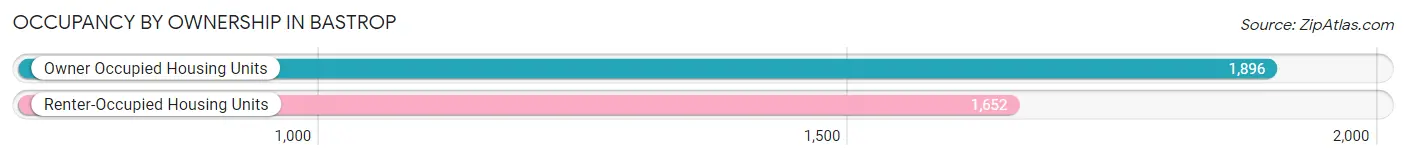
| Occupancy | # Housing Units | % Housing Units |
| Owner Occupied Housing Units | 1,896 | 53.4% |
| Renter-Occupied Housing Units | 1,652 | 46.6% |
| Total Occupied Housing Units | 3,548 | 100.0% |
Occupancy by Household Size in Bastrop
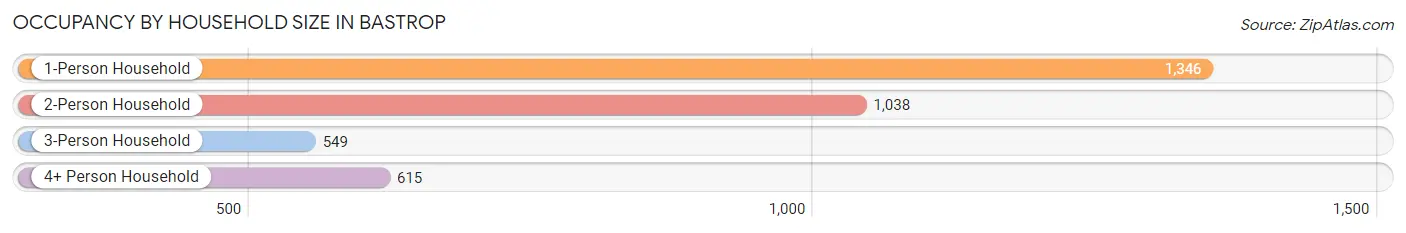
| Household Size | # Housing Units | % Housing Units |
| 1-Person Household | 1,346 | 37.9% |
| 2-Person Household | 1,038 | 29.3% |
| 3-Person Household | 549 | 15.5% |
| 4+ Person Household | 615 | 17.3% |
| Total Housing Units | 3,548 | 100.0% |
Occupancy by Ownership by Household Size in Bastrop
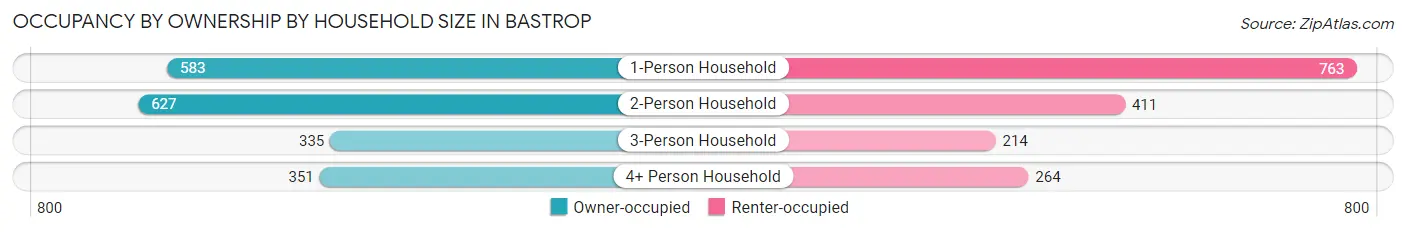
| Household Size | Owner-occupied | Renter-occupied |
| 1-Person Household | 583 (43.3%) | 763 (56.7%) |
| 2-Person Household | 627 (60.4%) | 411 (39.6%) |
| 3-Person Household | 335 (61.0%) | 214 (39.0%) |
| 4+ Person Household | 351 (57.1%) | 264 (42.9%) |
| Total Housing Units | 1,896 (53.4%) | 1,652 (46.6%) |
Occupancy by Educational Attainment in Bastrop
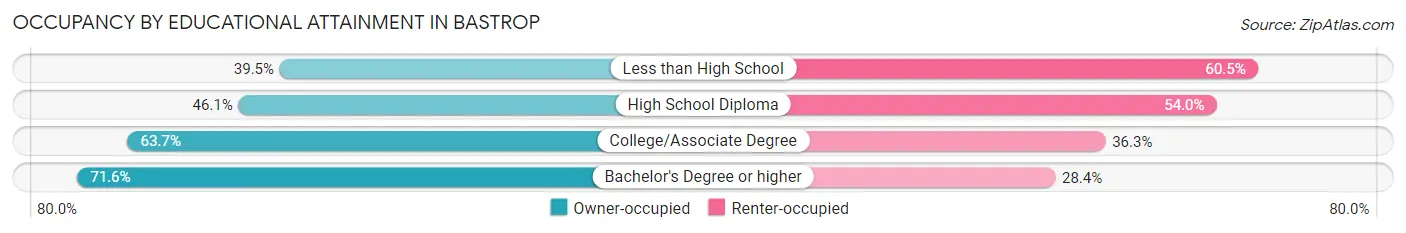
| Household Size | Owner-occupied | Renter-occupied |
| Less than High School | 290 (39.5%) | 444 (60.5%) |
| High School Diploma | 530 (46.1%) | 621 (53.9%) |
| College/Associate Degree | 922 (63.7%) | 526 (36.3%) |
| Bachelor's Degree or higher | 154 (71.6%) | 61 (28.4%) |
Occupancy by Age of Householder in Bastrop
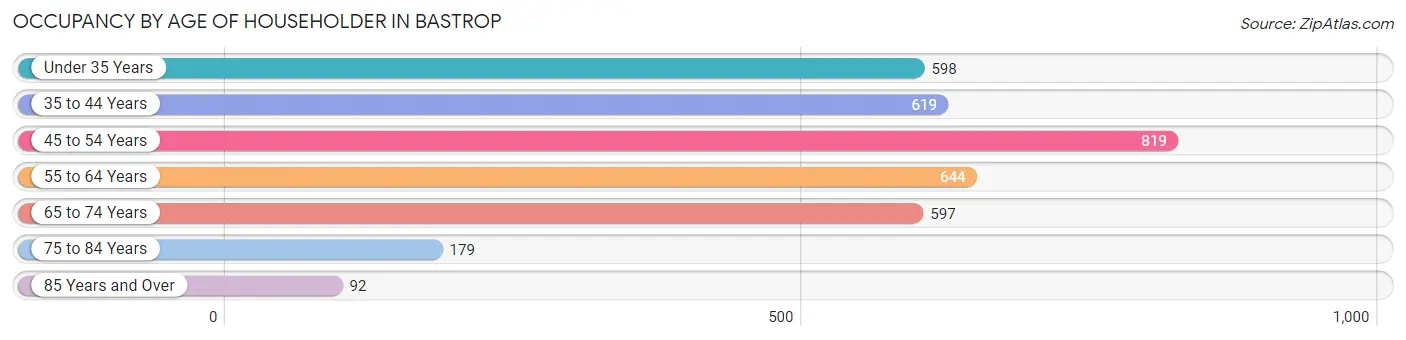
| Age Bracket | # Households | % Households |
| Under 35 Years | 598 | 16.9% |
| 35 to 44 Years | 619 | 17.4% |
| 45 to 54 Years | 819 | 23.1% |
| 55 to 64 Years | 644 | 18.1% |
| 65 to 74 Years | 597 | 16.8% |
| 75 to 84 Years | 179 | 5.1% |
| 85 Years and Over | 92 | 2.6% |
| Total | 3,548 | 100.0% |
Housing Finances in Bastrop
Median Income by Occupancy in Bastrop
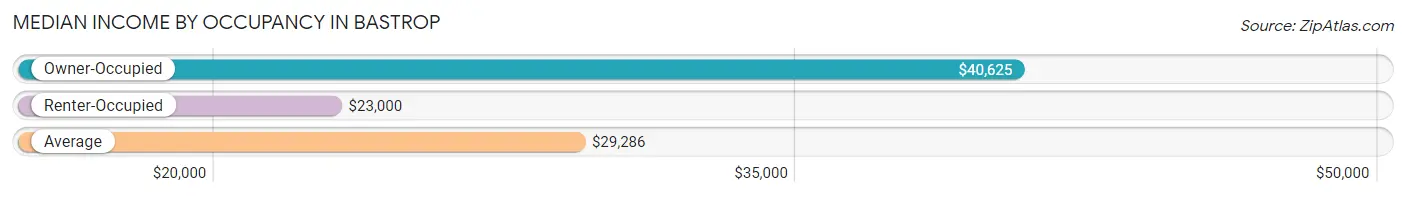
| Occupancy Type | # Households | Median Income |
| Owner-Occupied | 1,896 (53.4%) | $40,625 |
| Renter-Occupied | 1,652 (46.6%) | $23,000 |
| Average | 3,548 (100.0%) | $29,286 |
Occupancy by Householder Income Bracket in Bastrop
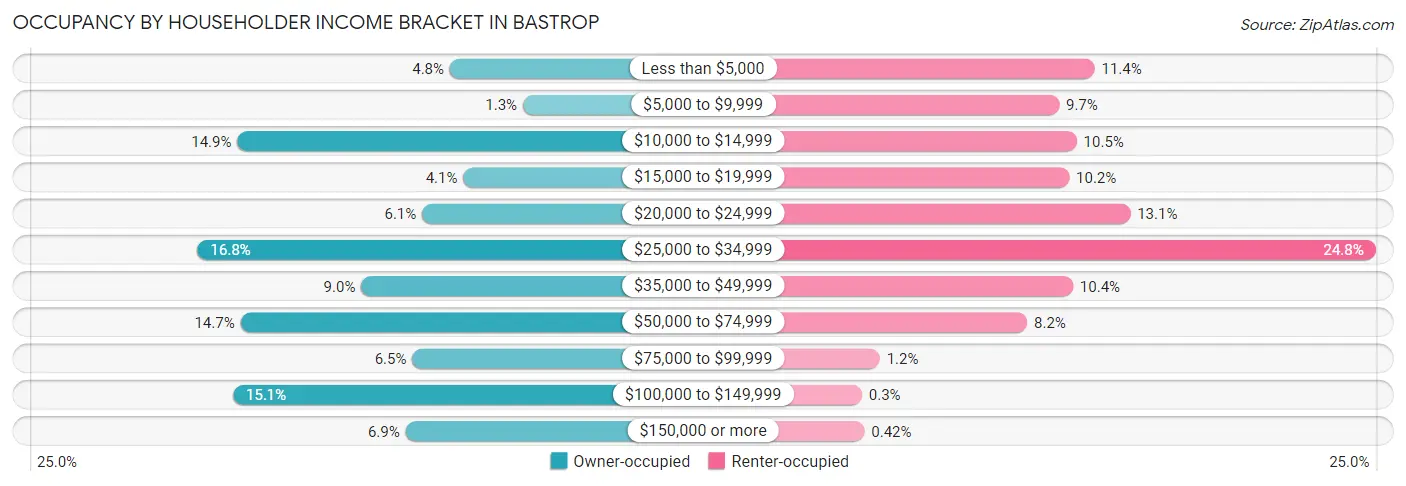
| Income Bracket | Owner-occupied | Renter-occupied |
| Less than $5,000 | 90 (4.8%) | 188 (11.4%) |
| $5,000 to $9,999 | 24 (1.3%) | 160 (9.7%) |
| $10,000 to $14,999 | 282 (14.9%) | 174 (10.5%) |
| $15,000 to $19,999 | 78 (4.1%) | 168 (10.2%) |
| $20,000 to $24,999 | 115 (6.1%) | 216 (13.1%) |
| $25,000 to $34,999 | 318 (16.8%) | 409 (24.8%) |
| $35,000 to $49,999 | 170 (9.0%) | 171 (10.3%) |
| $50,000 to $74,999 | 279 (14.7%) | 135 (8.2%) |
| $75,000 to $99,999 | 124 (6.5%) | 19 (1.1%) |
| $100,000 to $149,999 | 286 (15.1%) | 5 (0.3%) |
| $150,000 or more | 130 (6.9%) | 7 (0.4%) |
| Total | 1,896 (100.0%) | 1,652 (100.0%) |
Monthly Housing Cost Tiers in Bastrop
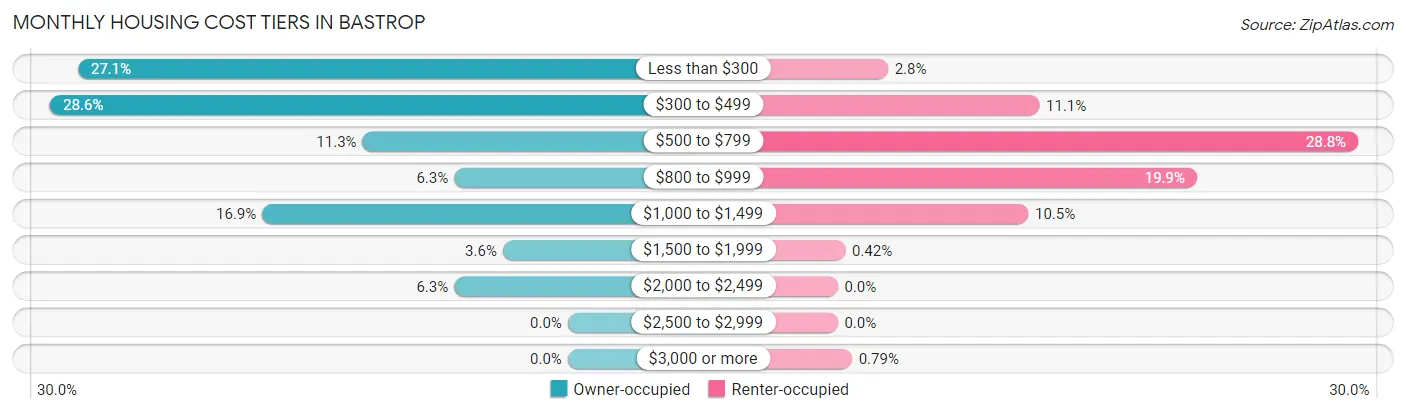
| Monthly Cost | Owner-occupied | Renter-occupied |
| Less than $300 | 513 (27.1%) | 46 (2.8%) |
| $300 to $499 | 542 (28.6%) | 184 (11.1%) |
| $500 to $799 | 215 (11.3%) | 475 (28.7%) |
| $800 to $999 | 119 (6.3%) | 328 (19.9%) |
| $1,000 to $1,499 | 320 (16.9%) | 174 (10.5%) |
| $1,500 to $1,999 | 68 (3.6%) | 7 (0.4%) |
| $2,000 to $2,499 | 119 (6.3%) | 0 (0.0%) |
| $2,500 to $2,999 | 0 (0.0%) | 0 (0.0%) |
| $3,000 or more | 0 (0.0%) | 13 (0.8%) |
| Total | 1,896 (100.0%) | 1,652 (100.0%) |
Physical Housing Characteristics in Bastrop
Housing Structures in Bastrop
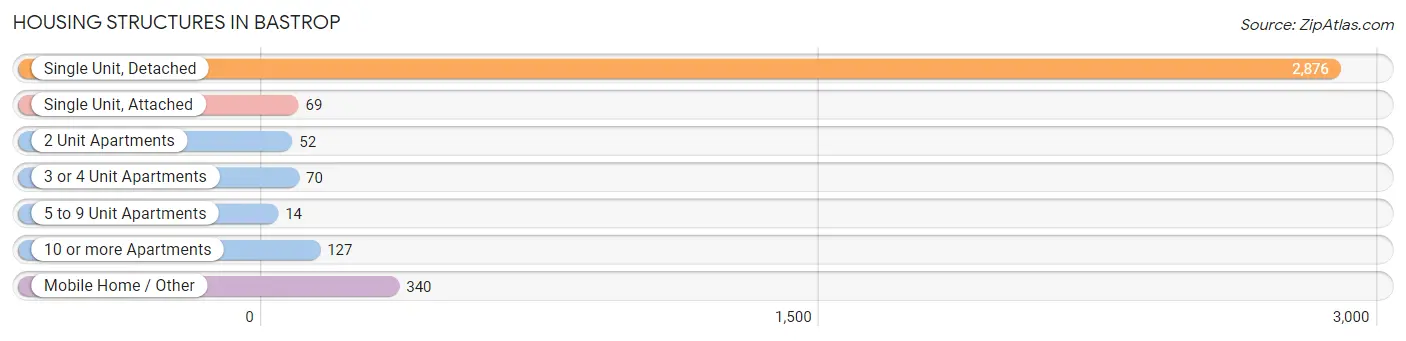
| Structure Type | # Housing Units | % Housing Units |
| Single Unit, Detached | 2,876 | 81.1% |
| Single Unit, Attached | 69 | 1.9% |
| 2 Unit Apartments | 52 | 1.5% |
| 3 or 4 Unit Apartments | 70 | 2.0% |
| 5 to 9 Unit Apartments | 14 | 0.4% |
| 10 or more Apartments | 127 | 3.6% |
| Mobile Home / Other | 340 | 9.6% |
| Total | 3,548 | 100.0% |
Housing Structures by Occupancy in Bastrop
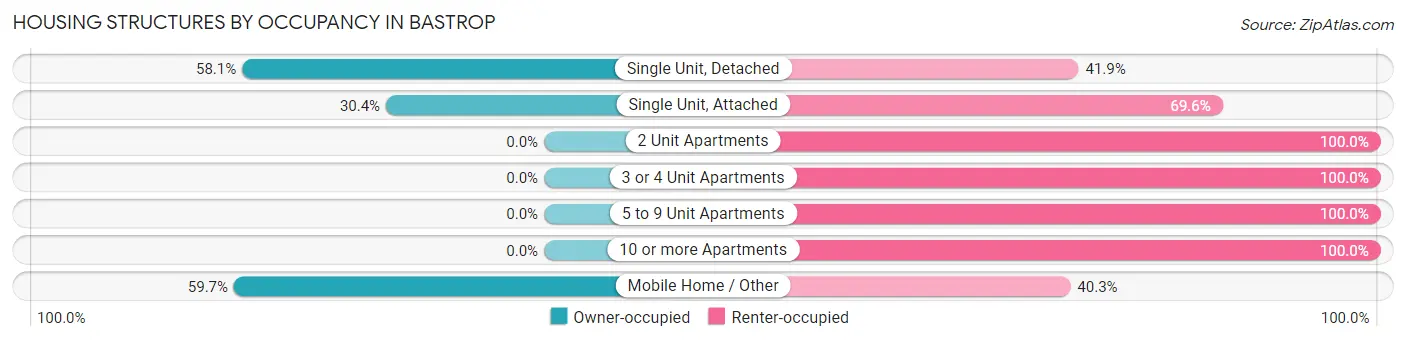
| Structure Type | Owner-occupied | Renter-occupied |
| Single Unit, Detached | 1,672 (58.1%) | 1,204 (41.9%) |
| Single Unit, Attached | 21 (30.4%) | 48 (69.6%) |
| 2 Unit Apartments | 0 (0.0%) | 52 (100.0%) |
| 3 or 4 Unit Apartments | 0 (0.0%) | 70 (100.0%) |
| 5 to 9 Unit Apartments | 0 (0.0%) | 14 (100.0%) |
| 10 or more Apartments | 0 (0.0%) | 127 (100.0%) |
| Mobile Home / Other | 203 (59.7%) | 137 (40.3%) |
| Total | 1,896 (53.4%) | 1,652 (46.6%) |
Housing Structures by Number of Rooms in Bastrop
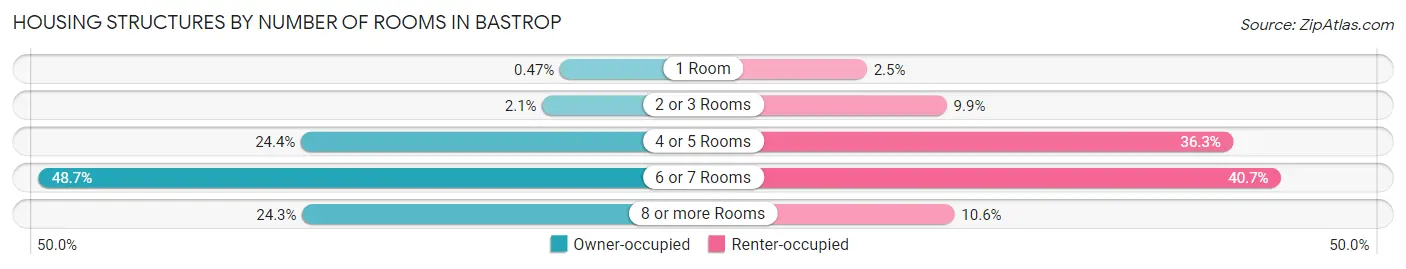
| Number of Rooms | Owner-occupied | Renter-occupied |
| 1 Room | 9 (0.5%) | 41 (2.5%) |
| 2 or 3 Rooms | 40 (2.1%) | 163 (9.9%) |
| 4 or 5 Rooms | 463 (24.4%) | 600 (36.3%) |
| 6 or 7 Rooms | 923 (48.7%) | 673 (40.7%) |
| 8 or more Rooms | 461 (24.3%) | 175 (10.6%) |
| Total | 1,896 (100.0%) | 1,652 (100.0%) |
Housing Structure by Heating Type in Bastrop
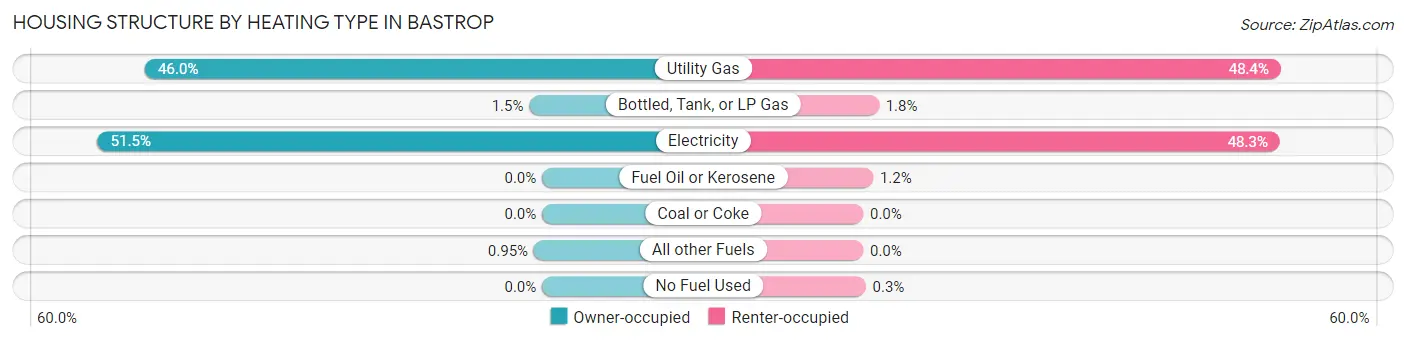
| Heating Type | Owner-occupied | Renter-occupied |
| Utility Gas | 873 (46.0%) | 800 (48.4%) |
| Bottled, Tank, or LP Gas | 28 (1.5%) | 30 (1.8%) |
| Electricity | 977 (51.5%) | 798 (48.3%) |
| Fuel Oil or Kerosene | 0 (0.0%) | 19 (1.1%) |
| Coal or Coke | 0 (0.0%) | 0 (0.0%) |
| All other Fuels | 18 (0.9%) | 0 (0.0%) |
| No Fuel Used | 0 (0.0%) | 5 (0.3%) |
| Total | 1,896 (100.0%) | 1,652 (100.0%) |
Household Vehicle Usage in Bastrop
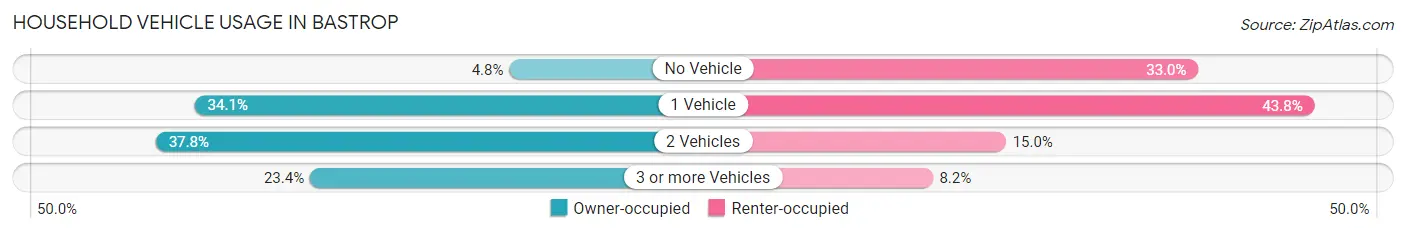
| Vehicles per Household | Owner-occupied | Renter-occupied |
| No Vehicle | 90 (4.8%) | 545 (33.0%) |
| 1 Vehicle | 647 (34.1%) | 724 (43.8%) |
| 2 Vehicles | 716 (37.8%) | 248 (15.0%) |
| 3 or more Vehicles | 443 (23.4%) | 135 (8.2%) |
| Total | 1,896 (100.0%) | 1,652 (100.0%) |
Real Estate & Mortgages in Bastrop
Real Estate and Mortgage Overview in Bastrop
| Characteristic | Without Mortgage | With Mortgage |
| Housing Units | 1,156 | 740 |
| Median Property Value | $52,400 | $157,800 |
| Median Household Income | $28,984 | $126 |
| Monthly Housing Costs | $324 | $0 |
| Real Estate Taxes | $199 | $60 |
Property Value by Mortgage Status in Bastrop
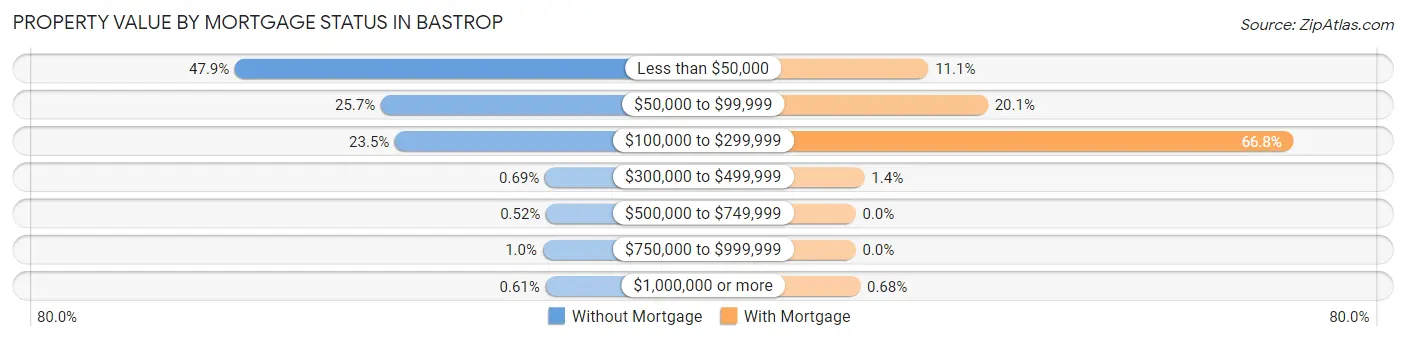
| Property Value | Without Mortgage | With Mortgage |
| Less than $50,000 | 554 (47.9%) | 82 (11.1%) |
| $50,000 to $99,999 | 297 (25.7%) | 149 (20.1%) |
| $100,000 to $299,999 | 272 (23.5%) | 494 (66.8%) |
| $300,000 to $499,999 | 8 (0.7%) | 10 (1.3%) |
| $500,000 to $749,999 | 6 (0.5%) | 0 (0.0%) |
| $750,000 to $999,999 | 12 (1.0%) | 0 (0.0%) |
| $1,000,000 or more | 7 (0.6%) | 5 (0.7%) |
| Total | 1,156 (100.0%) | 740 (100.0%) |
Household Income by Mortgage Status in Bastrop
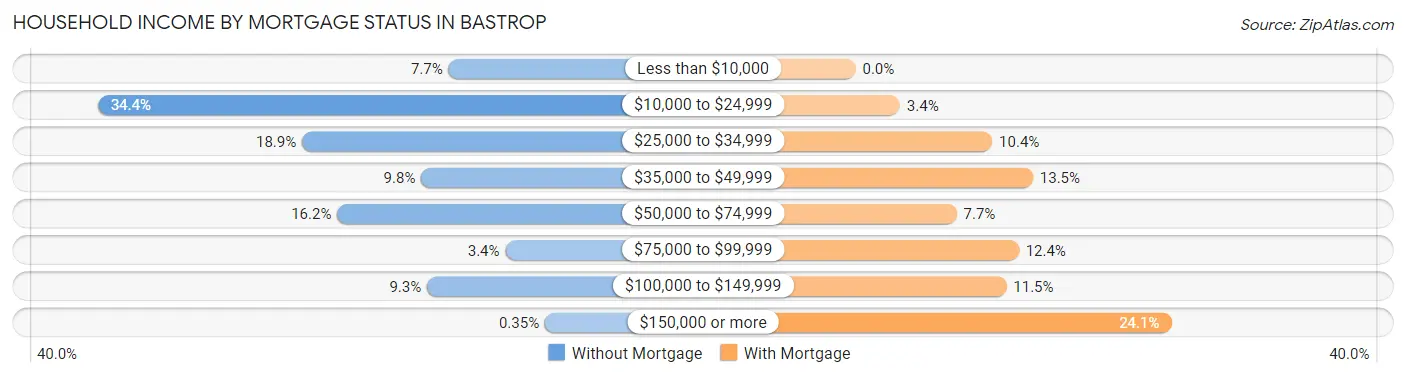
| Household Income | Without Mortgage | With Mortgage |
| Less than $10,000 | 89 (7.7%) | 0 (0.0%) |
| $10,000 to $24,999 | 398 (34.4%) | 25 (3.4%) |
| $25,000 to $34,999 | 218 (18.9%) | 77 (10.4%) |
| $35,000 to $49,999 | 113 (9.8%) | 100 (13.5%) |
| $50,000 to $74,999 | 187 (16.2%) | 57 (7.7%) |
| $75,000 to $99,999 | 39 (3.4%) | 92 (12.4%) |
| $100,000 to $149,999 | 108 (9.3%) | 85 (11.5%) |
| $150,000 or more | 4 (0.4%) | 178 (24.0%) |
| Total | 1,156 (100.0%) | 740 (100.0%) |
Property Value to Household Income Ratio in Bastrop
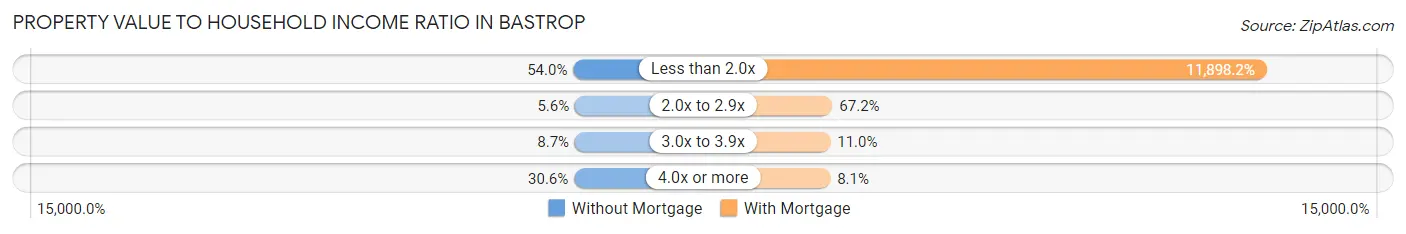
| Value-to-Income Ratio | Without Mortgage | With Mortgage |
| Less than 2.0x | 624 (54.0%) | 88,047 (11,898.2%) |
| 2.0x to 2.9x | 65 (5.6%) | 497 (67.2%) |
| 3.0x to 3.9x | 101 (8.7%) | 81 (11.0%) |
| 4.0x or more | 354 (30.6%) | 60 (8.1%) |
| Total | 1,156 (100.0%) | 740 (100.0%) |
Real Estate Taxes by Mortgage Status in Bastrop
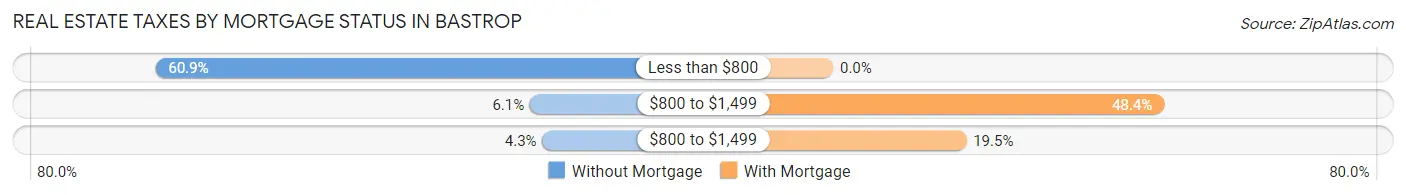
| Property Taxes | Without Mortgage | With Mortgage |
| Less than $800 | 704 (60.9%) | 0 (0.0%) |
| $800 to $1,499 | 71 (6.1%) | 358 (48.4%) |
| $800 to $1,499 | 50 (4.3%) | 144 (19.5%) |
| Total | 1,156 (100.0%) | 740 (100.0%) |
Health & Disability in Bastrop
Health Insurance Coverage by Age in Bastrop
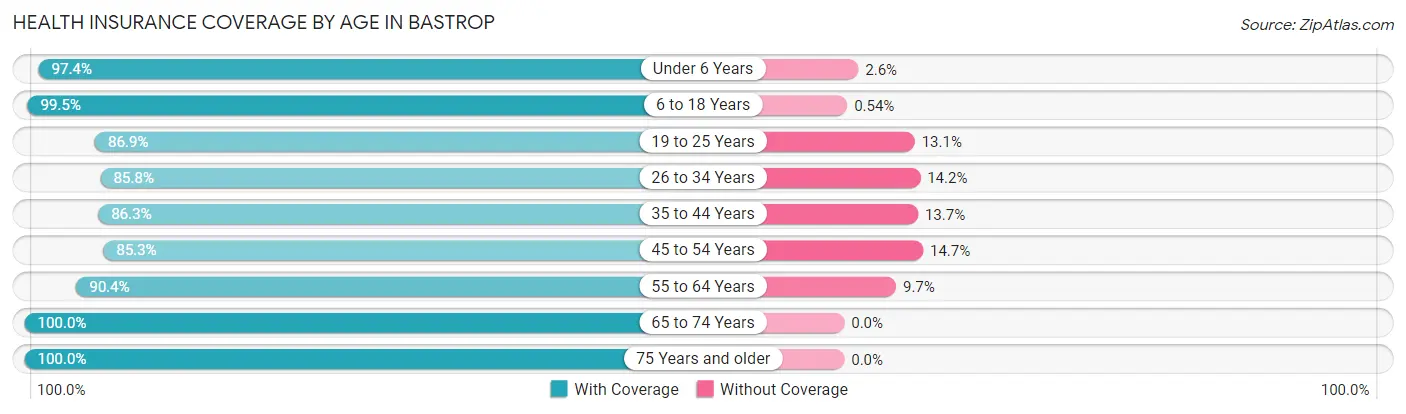
| Age Bracket | With Coverage | Without Coverage |
| Under 6 Years | 818 (97.4%) | 22 (2.6%) |
| 6 to 18 Years | 1,837 (99.5%) | 10 (0.5%) |
| 19 to 25 Years | 879 (86.9%) | 133 (13.1%) |
| 26 to 34 Years | 982 (85.8%) | 162 (14.2%) |
| 35 to 44 Years | 954 (86.3%) | 152 (13.7%) |
| 45 to 54 Years | 1,040 (85.3%) | 179 (14.7%) |
| 55 to 64 Years | 852 (90.3%) | 91 (9.7%) |
| 65 to 74 Years | 883 (100.0%) | 0 (0.0%) |
| 75 Years and older | 391 (100.0%) | 0 (0.0%) |
| Total | 8,636 (92.0%) | 749 (8.0%) |
Health Insurance Coverage by Citizenship Status in Bastrop
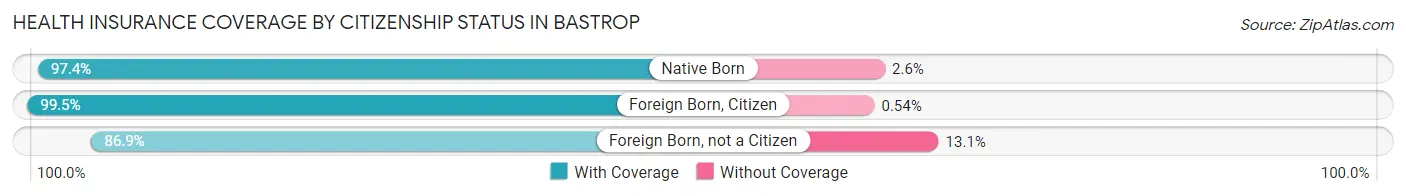
| Citizenship Status | With Coverage | Without Coverage |
| Native Born | 818 (97.4%) | 22 (2.6%) |
| Foreign Born, Citizen | 1,837 (99.5%) | 10 (0.5%) |
| Foreign Born, not a Citizen | 879 (86.9%) | 133 (13.1%) |
Health Insurance Coverage by Household Income in Bastrop
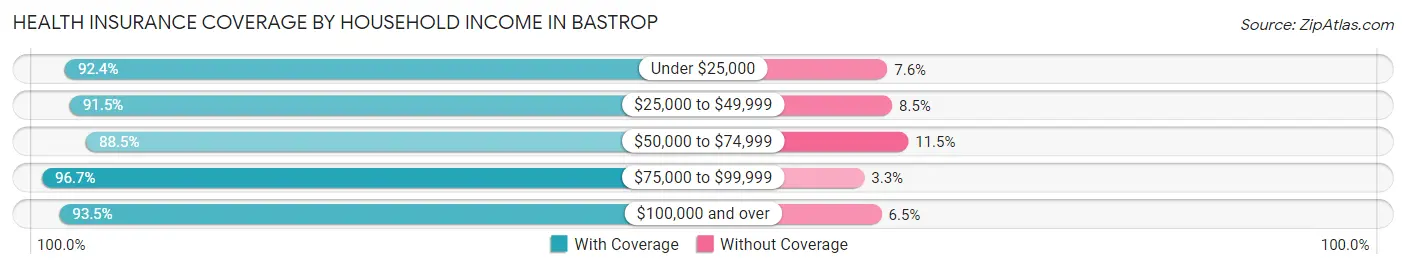
| Household Income | With Coverage | Without Coverage |
| Under $25,000 | 2,908 (92.4%) | 239 (7.6%) |
| $25,000 to $49,999 | 2,813 (91.5%) | 261 (8.5%) |
| $50,000 to $74,999 | 1,052 (88.5%) | 137 (11.5%) |
| $75,000 to $99,999 | 412 (96.7%) | 14 (3.3%) |
| $100,000 and over | 1,404 (93.5%) | 98 (6.5%) |
Public vs Private Health Insurance Coverage by Age in Bastrop
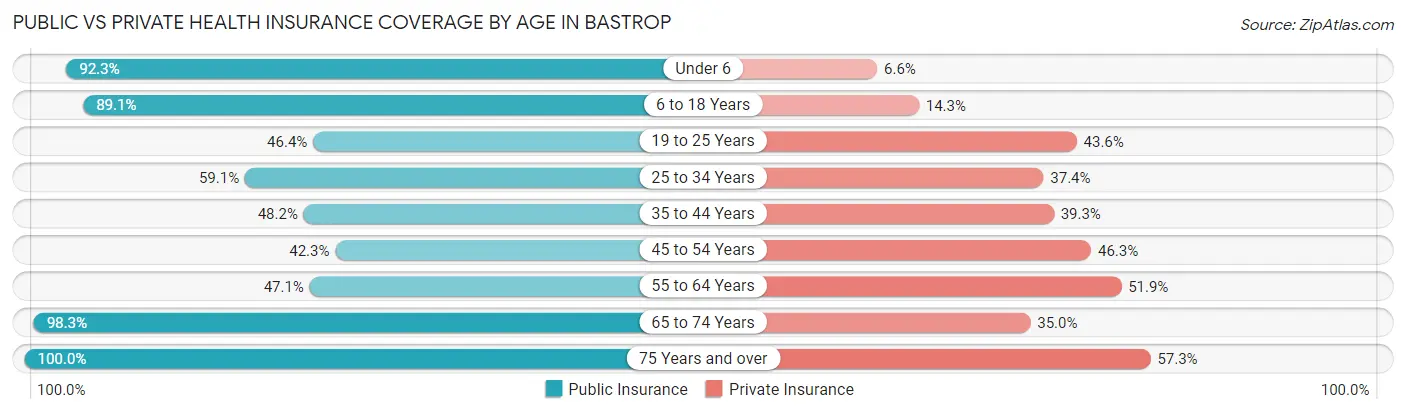
| Age Bracket | Public Insurance | Private Insurance |
| Under 6 | 775 (92.3%) | 55 (6.6%) |
| 6 to 18 Years | 1,646 (89.1%) | 264 (14.3%) |
| 19 to 25 Years | 470 (46.4%) | 441 (43.6%) |
| 25 to 34 Years | 676 (59.1%) | 428 (37.4%) |
| 35 to 44 Years | 533 (48.2%) | 435 (39.3%) |
| 45 to 54 Years | 516 (42.3%) | 564 (46.3%) |
| 55 to 64 Years | 444 (47.1%) | 489 (51.9%) |
| 65 to 74 Years | 868 (98.3%) | 309 (35.0%) |
| 75 Years and over | 391 (100.0%) | 224 (57.3%) |
| Total | 6,319 (67.3%) | 3,209 (34.2%) |
Disability Status by Sex by Age in Bastrop
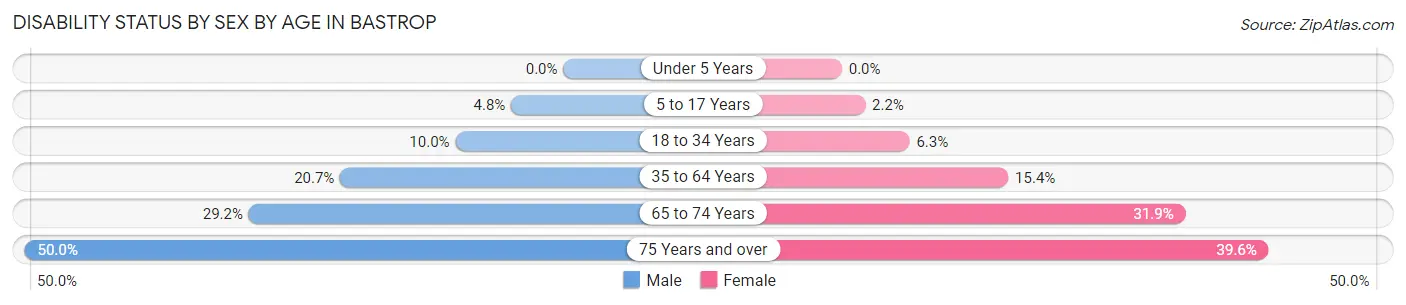
| Age Bracket | Male | Female |
| Under 5 Years | 0 (0.0%) | 0 (0.0%) |
| 5 to 17 Years | 48 (4.8%) | 19 (2.2%) |
| 18 to 34 Years | 130 (10.0%) | 61 (6.3%) |
| 35 to 64 Years | 304 (20.7%) | 278 (15.4%) |
| 65 to 74 Years | 115 (29.2%) | 156 (31.9%) |
| 75 Years and over | 92 (50.0%) | 82 (39.6%) |
Disability Class by Sex by Age in Bastrop
Disability Class: Hearing Difficulty
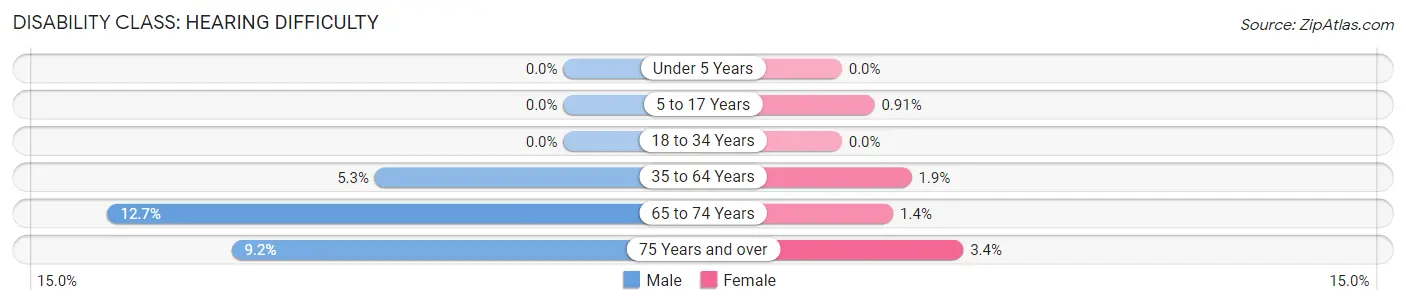
| Age Bracket | Male | Female |
| Under 5 Years | 0 (0.0%) | 0 (0.0%) |
| 5 to 17 Years | 0 (0.0%) | 8 (0.9%) |
| 18 to 34 Years | 0 (0.0%) | 0 (0.0%) |
| 35 to 64 Years | 77 (5.2%) | 35 (1.9%) |
| 65 to 74 Years | 50 (12.7%) | 7 (1.4%) |
| 75 Years and over | 17 (9.2%) | 7 (3.4%) |
Disability Class: Vision Difficulty
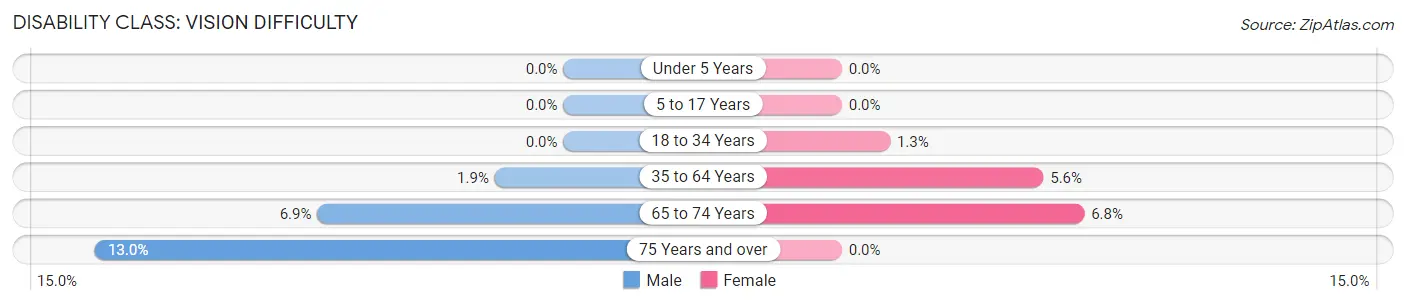
| Age Bracket | Male | Female |
| Under 5 Years | 0 (0.0%) | 0 (0.0%) |
| 5 to 17 Years | 0 (0.0%) | 0 (0.0%) |
| 18 to 34 Years | 0 (0.0%) | 13 (1.3%) |
| 35 to 64 Years | 28 (1.9%) | 101 (5.6%) |
| 65 to 74 Years | 27 (6.9%) | 33 (6.8%) |
| 75 Years and over | 24 (13.0%) | 0 (0.0%) |
Disability Class: Cognitive Difficulty
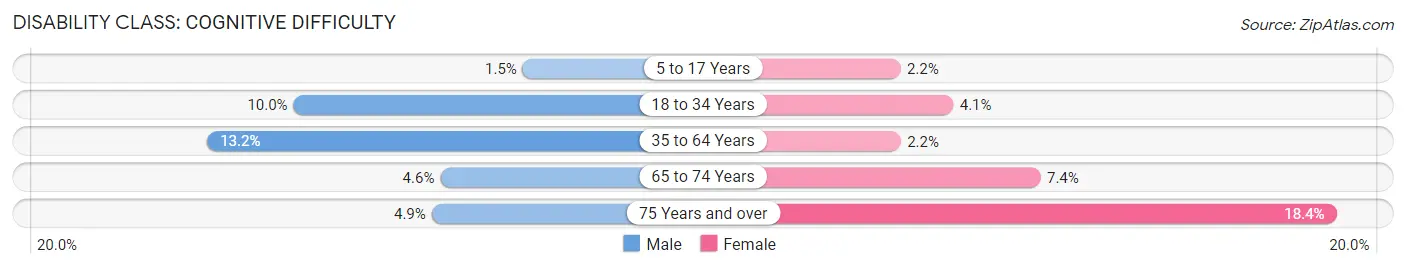
| Age Bracket | Male | Female |
| 5 to 17 Years | 15 (1.5%) | 19 (2.2%) |
| 18 to 34 Years | 130 (10.0%) | 40 (4.1%) |
| 35 to 64 Years | 194 (13.2%) | 39 (2.2%) |
| 65 to 74 Years | 18 (4.6%) | 36 (7.4%) |
| 75 Years and over | 9 (4.9%) | 38 (18.4%) |
Disability Class: Ambulatory Difficulty
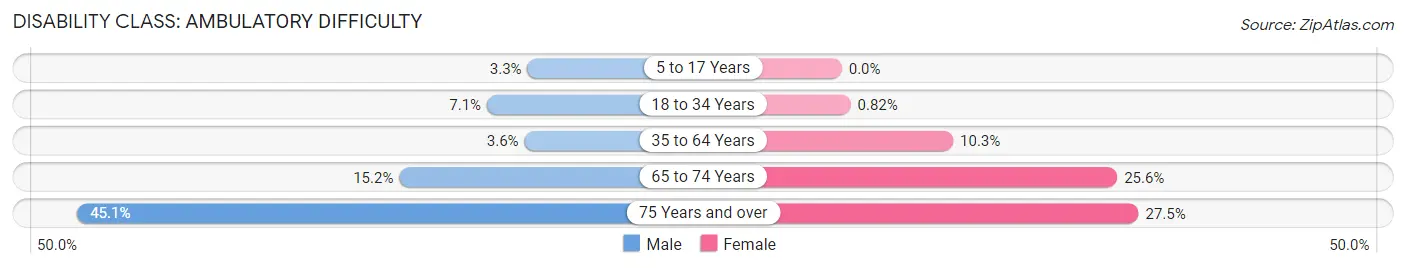
| Age Bracket | Male | Female |
| 5 to 17 Years | 33 (3.3%) | 0 (0.0%) |
| 18 to 34 Years | 92 (7.1%) | 8 (0.8%) |
| 35 to 64 Years | 53 (3.6%) | 186 (10.3%) |
| 65 to 74 Years | 60 (15.2%) | 125 (25.6%) |
| 75 Years and over | 83 (45.1%) | 57 (27.5%) |
Disability Class: Self-Care Difficulty
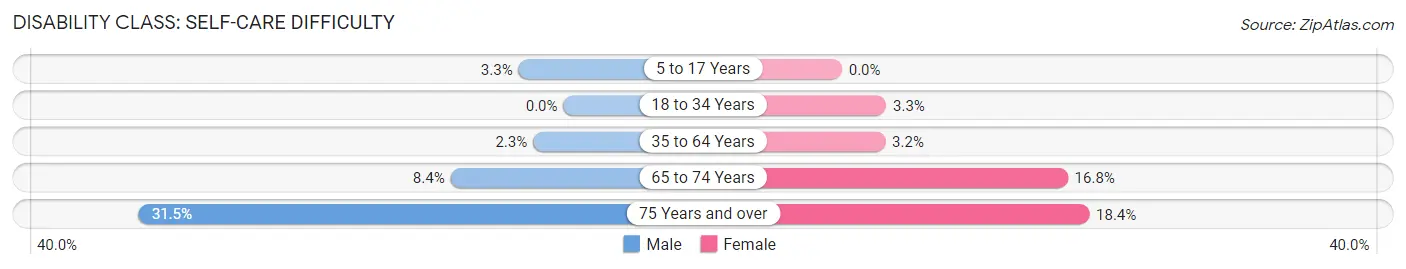
| Age Bracket | Male | Female |
| 5 to 17 Years | 33 (3.3%) | 0 (0.0%) |
| 18 to 34 Years | 0 (0.0%) | 32 (3.3%) |
| 35 to 64 Years | 33 (2.2%) | 58 (3.2%) |
| 65 to 74 Years | 33 (8.4%) | 82 (16.8%) |
| 75 Years and over | 58 (31.5%) | 38 (18.4%) |
Technology Access in Bastrop
Computing Device Access in Bastrop
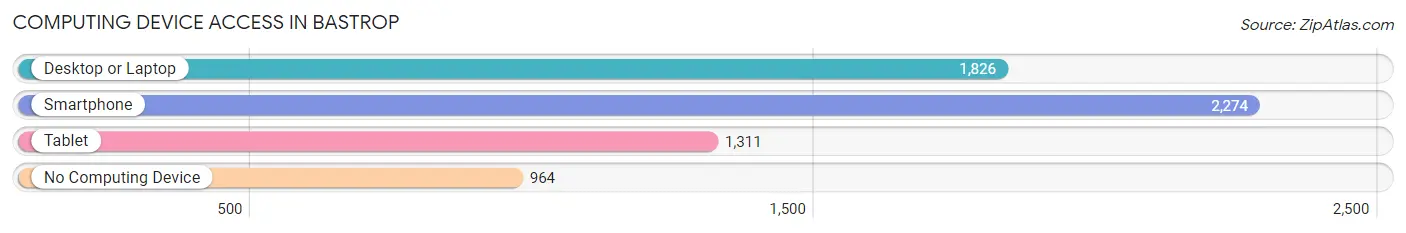
| Device Type | # Households | % Households |
| Desktop or Laptop | 1,826 | 51.5% |
| Smartphone | 2,274 | 64.1% |
| Tablet | 1,311 | 36.9% |
| No Computing Device | 964 | 27.2% |
| Total | 3,548 | 100.0% |
Internet Access in Bastrop
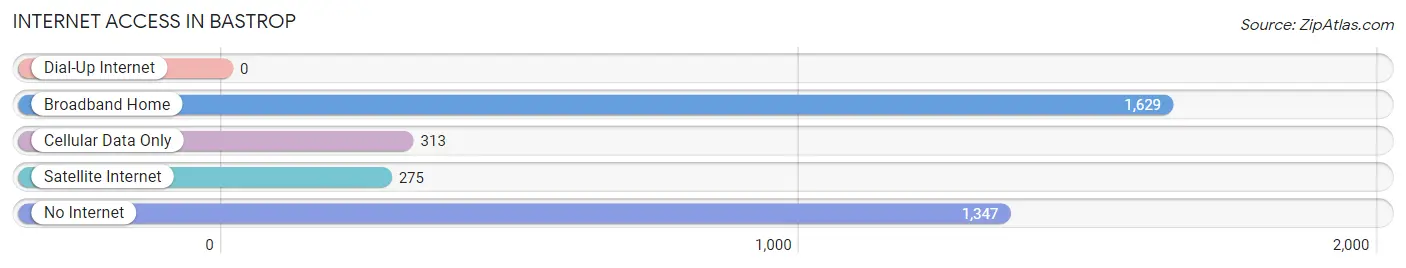
| Internet Type | # Households | % Households |
| Dial-Up Internet | 0 | 0.0% |
| Broadband Home | 1,629 | 45.9% |
| Cellular Data Only | 313 | 8.8% |
| Satellite Internet | 275 | 7.7% |
| No Internet | 1,347 | 38.0% |
| Total | 3,548 | 100.0% |
Bastrop Summary
Bastrop, Louisiana is a small town located in Morehouse Parish, Louisiana. It is situated on the banks of the Ouachita River, approximately 30 miles northeast of Monroe. The town has a population of approximately 13,000 people and is the parish seat of Morehouse Parish.
History
Bastrop was founded in 1821 by William B. Miller, a settler from North Carolina. Miller named the town after his hometown of Bastrop, Texas. The town was incorporated in 1844 and was the first town in Morehouse Parish.
In the early days, Bastrop was a bustling river port and a major trading center for the surrounding area. The town was also home to a number of businesses, including a cotton gin, a sawmill, and a gristmill.
In the late 19th century, the town began to decline as the railroad bypassed it. The town was further impacted by the Great Depression and the Dust Bowl. However, the town began to recover in the 1940s and 1950s, when the local economy began to diversify.
Geography
Bastrop is located in the northern part of Morehouse Parish, approximately 30 miles northeast of Monroe. The town is situated on the banks of the Ouachita River and is surrounded by rolling hills and forests. The town is located at an elevation of approximately 200 feet above sea level.
The climate in Bastrop is humid subtropical, with hot, humid summers and mild winters. The average annual temperature is around 70 degrees Fahrenheit. The average annual precipitation is around 50 inches.
Economy
The economy of Bastrop is largely based on agriculture and manufacturing. The town is home to a number of agricultural businesses, including cotton gins, sawmills, and gristmills. The town is also home to a number of manufacturing businesses, including furniture makers, clothing manufacturers, and food processors.
The town is also home to a number of retail businesses, including grocery stores, restaurants, and clothing stores. The town is also home to a number of service businesses, including banks, insurance companies, and medical offices.
Demographics
As of the 2010 census, the population of Bastrop was 13,365. The racial makeup of the town was 65.3% White, 30.2% African American, 0.3% Native American, 0.7% Asian, 0.1% Pacific Islander, and 3.4% from other races. The median household income was $30,945, and the median family income was $37,813.
The town is home to a number of churches, including Baptist, Methodist, and Catholic. The town is also home to a number of schools, including Bastrop High School, Bastrop Middle School, and Bastrop Elementary School.
Conclusion
Bastrop, Louisiana is a small town located in Morehouse Parish, Louisiana. It is situated on the banks of the Ouachita River, approximately 30 miles northeast of Monroe. The town has a population of approximately 13,000 people and is the parish seat of Morehouse Parish. The town was founded in 1821 and was the first town in Morehouse Parish. The economy of Bastrop is largely based on agriculture and manufacturing. The town is home to a number of churches, schools, and retail businesses. The racial makeup of the town is 65.3% White, 30.2% African American, 0.3% Native American, 0.7% Asian, 0.1% Pacific Islander, and 3.4% from other races. The median household income was $30,945, and the median family income was $37,813.
Common Questions
What is Per Capita Income in Bastrop?
Per Capita income in Bastrop is $16,783.
What is the Median Family Income in Bastrop?
Median Family Income in Bastrop is $38,527.
What is the Median Household income in Bastrop?
Median Household Income in Bastrop is $29,286.
What is Income or Wage Gap in Bastrop?
Income or Wage Gap in Bastrop is 26.8%.
Women in Bastrop earn 73.2 cents for every dollar earned by a man.
What is Family Income Deficit in Bastrop?
Family Income Deficit in Bastrop is $9,108.
Families that are below poverty line in Bastrop earn $9,108 less on average than the poverty threshold level.
What is Inequality or Gini Index in Bastrop?
Inequality or Gini Index in Bastrop is 0.48.
What is the Total Population of Bastrop?
Total Population of Bastrop is 9,623.
What is the Total Male Population of Bastrop?
Total Male Population of Bastrop is 4,884.
What is the Total Female Population of Bastrop?
Total Female Population of Bastrop is 4,739.
What is the Ratio of Males per 100 Females in Bastrop?
There are 103.06 Males per 100 Females in Bastrop.
What is the Ratio of Females per 100 Males in Bastrop?
There are 97.03 Females per 100 Males in Bastrop.
What is the Median Population Age in Bastrop?
Median Population Age in Bastrop is 33.8 Years.
What is the Average Family Size in Bastrop
Average Family Size in Bastrop is 3.7 People.
What is the Average Household Size in Bastrop
Average Household Size in Bastrop is 2.6 People.
How Large is the Labor Force in Bastrop?
There are 3,870 People in the Labor Forcein in Bastrop.
What is the Percentage of People in the Labor Force in Bastrop?
52.2% of People are in the Labor Force in Bastrop.
What is the Unemployment Rate in Bastrop?
Unemployment Rate in Bastrop is 11.5%.