Harlem, GA Map & Demographics
Harlem Map
Harlem Overview
$30,375
PER CAPITA INCOME
$64,204
AVG FAMILY INCOME
$51,855
AVG HOUSEHOLD INCOME
42.7%
WAGE / INCOME GAP [ % ]
57.3¢/ $1
WAGE / INCOME GAP [ $ ]
0.40
INEQUALITY / GINI INDEX
3,682
TOTAL POPULATION
1,521
MALE POPULATION
2,161
FEMALE POPULATION
70.38
MALES / 100 FEMALES
142.08
FEMALES / 100 MALES
29.9
MEDIAN AGE
3.6
AVG FAMILY SIZE
3.0
AVG HOUSEHOLD SIZE
1,781
LABOR FORCE [ PEOPLE ]
70.7%
PERCENT IN LABOR FORCE
3.7%
UNEMPLOYMENT RATE
Harlem Zip Codes
Harlem Area Codes
Income in Harlem
Income Overview in Harlem
Per Capita Income in Harlem is $30,375, while median incomes of families and households are $64,204 and $51,855 respectively.
| Characteristic | Number | Measure |
| Per Capita Income | 3,682 | $30,375 |
| Median Family Income | 826 | $64,204 |
| Mean Family Income | 826 | $80,433 |
| Median Household Income | 1,241 | $51,855 |
| Mean Household Income | 1,241 | $77,446 |
| Income Deficit | 826 | $0 |
| Wage / Income Gap (%) | 3,682 | 42.73% |
| Wage / Income Gap ($) | 3,682 | 57.27¢ per $1 |
| Gini / Inequality Index | 3,682 | 0.40 |
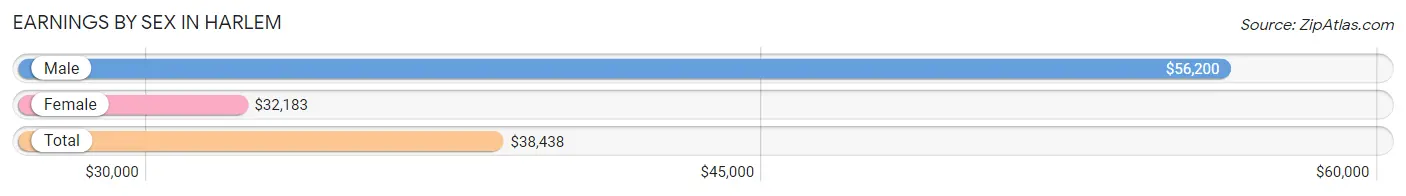
Earnings by Sex in Harlem
Average Earnings in Harlem are $38,438, $56,200 for men and $32,183 for women, a difference of 42.7%.
| Sex | Number | Average Earnings |
| Male | 754 (41.3%) | $56,200 |
| Female | 1,072 (58.7%) | $32,183 |
| Total | 1,826 (100.0%) | $38,438 |
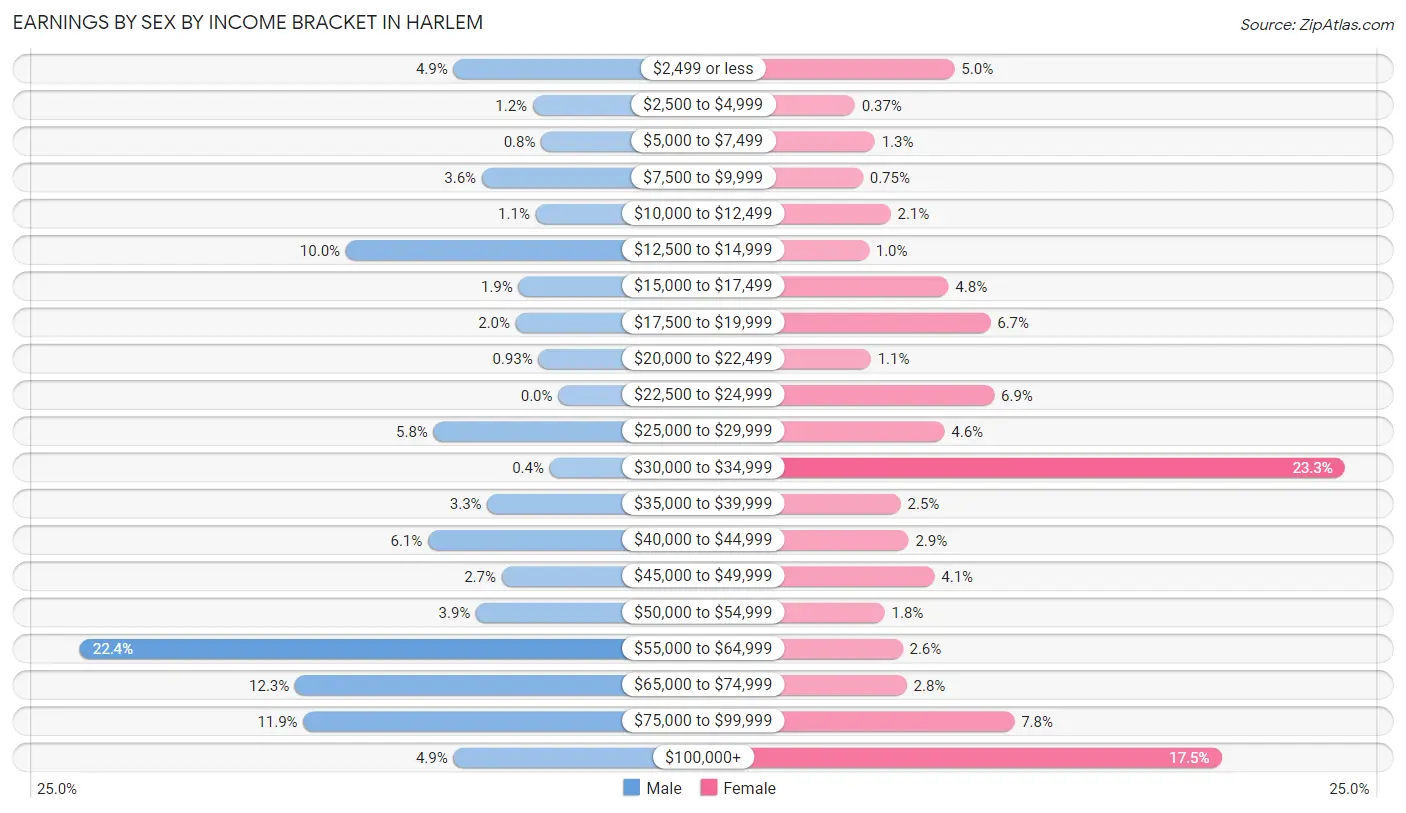
Earnings by Sex by Income Bracket in Harlem
The most common earnings brackets in Harlem are $55,000 to $64,999 for men (169 | 22.4%) and $30,000 to $34,999 for women (250 | 23.3%).
| Income | Male | Female |
| $2,499 or less | 37 (4.9%) | 54 (5.0%) |
| $2,500 to $4,999 | 9 (1.2%) | 4 (0.4%) |
| $5,000 to $7,499 | 6 (0.8%) | 14 (1.3%) |
| $7,500 to $9,999 | 27 (3.6%) | 8 (0.7%) |
| $10,000 to $12,499 | 8 (1.1%) | 22 (2.1%) |
| $12,500 to $14,999 | 75 (10.0%) | 11 (1.0%) |
| $15,000 to $17,499 | 14 (1.9%) | 51 (4.8%) |
| $17,500 to $19,999 | 15 (2.0%) | 72 (6.7%) |
| $20,000 to $22,499 | 7 (0.9%) | 12 (1.1%) |
| $22,500 to $24,999 | 0 (0.0%) | 74 (6.9%) |
| $25,000 to $29,999 | 44 (5.8%) | 49 (4.6%) |
| $30,000 to $34,999 | 3 (0.4%) | 250 (23.3%) |
| $35,000 to $39,999 | 25 (3.3%) | 27 (2.5%) |
| $40,000 to $44,999 | 46 (6.1%) | 31 (2.9%) |
| $45,000 to $49,999 | 20 (2.6%) | 44 (4.1%) |
| $50,000 to $54,999 | 29 (3.8%) | 19 (1.8%) |
| $55,000 to $64,999 | 169 (22.4%) | 28 (2.6%) |
| $65,000 to $74,999 | 93 (12.3%) | 30 (2.8%) |
| $75,000 to $99,999 | 90 (11.9%) | 84 (7.8%) |
| $100,000+ | 37 (4.9%) | 188 (17.5%) |
| Total | 754 (100.0%) | 1,072 (100.0%) |
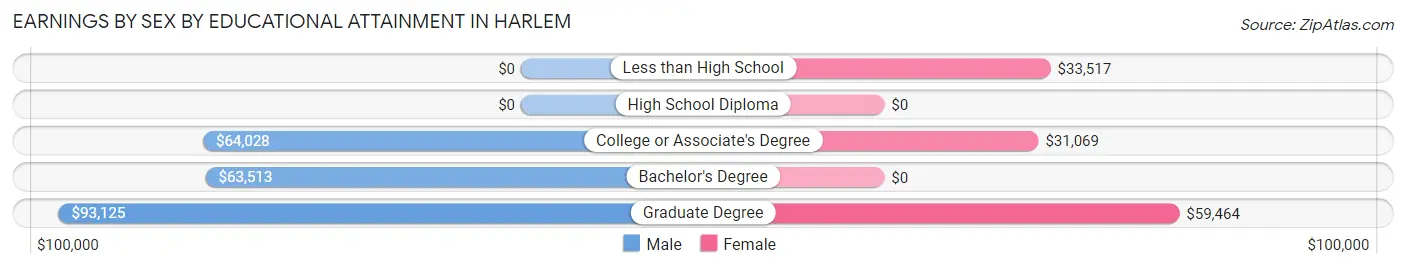
Earnings by Sex by Educational Attainment in Harlem
Average earnings in Harlem are $62,891 for men and $32,474 for women, a difference of 48.4%. Men with an educational attainment of graduate degree enjoy the highest average annual earnings of $93,125, while those with bachelor's degree education earn the least with $63,513. Women with an educational attainment of graduate degree earn the most with the average annual earnings of $59,464, while those with college or associate's degree education have the smallest earnings of $31,069.
| Educational Attainment | Male Income | Female Income |
| Less than High School | - | - |
| High School Diploma | - | - |
| College or Associate's Degree | $64,028 | $31,069 |
| Bachelor's Degree | $63,513 | $0 |
| Graduate Degree | $93,125 | $59,464 |
| Total | $62,891 | $32,474 |
Family Income in Harlem
Family Income Brackets in Harlem
According to the Harlem family income data, there are 218 families falling into the $50,000 to $74,999 income range, which is the most common income bracket and makes up 26.4% of all families.
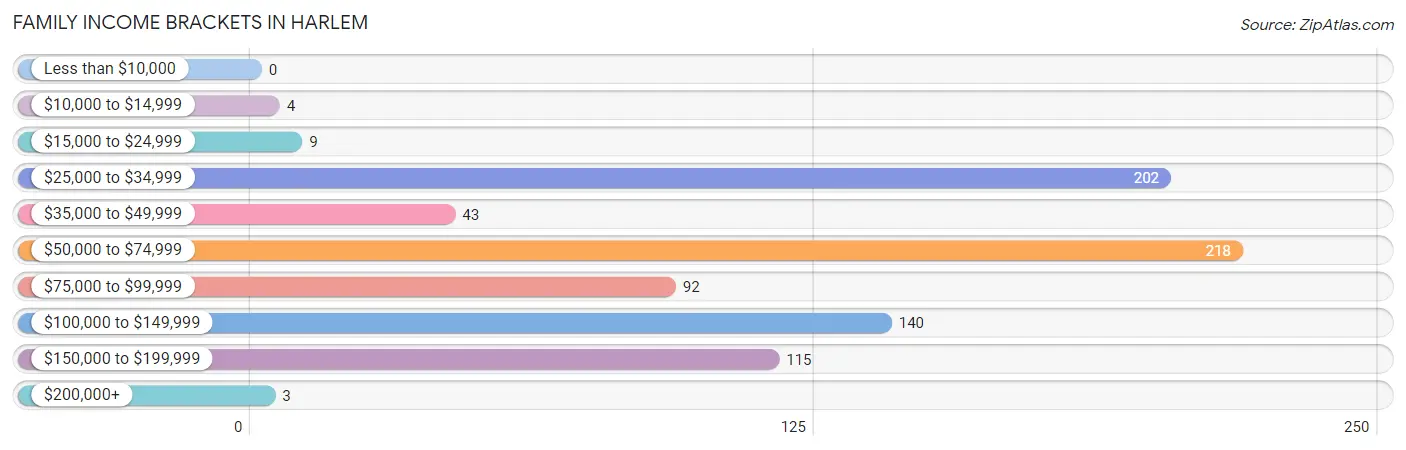
| Income Bracket | # Families | % Families |
| Less than $10,000 | 0 | 0.0% |
| $10,000 to $14,999 | 4 | 0.5% |
| $15,000 to $24,999 | 9 | 1.1% |
| $25,000 to $34,999 | 202 | 24.5% |
| $35,000 to $49,999 | 43 | 5.2% |
| $50,000 to $74,999 | 218 | 26.4% |
| $75,000 to $99,999 | 92 | 11.1% |
| $100,000 to $149,999 | 140 | 16.9% |
| $150,000 to $199,999 | 115 | 13.9% |
| $200,000+ | 3 | 0.4% |
Family Income by Famaliy Size in Harlem
5-person families (131 | 15.9%) account for the highest median family income in Harlem with $120,966 per family, while 4-person families (74 | 9.0%) have the highest median income of $24,250 per family member.
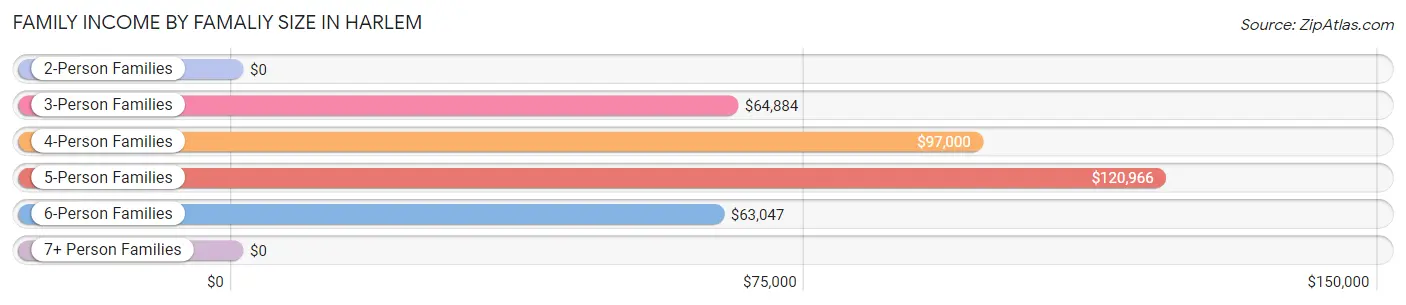
| Income Bracket | # Families | Median Income |
| 2-Person Families | 407 (49.3%) | $0 |
| 3-Person Families | 189 (22.9%) | $64,884 |
| 4-Person Families | 74 (9.0%) | $97,000 |
| 5-Person Families | 131 (15.9%) | $120,966 |
| 6-Person Families | 25 (3.0%) | $63,047 |
| 7+ Person Families | 0 (0.0%) | $0 |
| Total | 826 (100.0%) | $64,204 |
Family Income by Number of Earners in Harlem
The median family income in Harlem is $64,204, with families comprising 2 earners (329) having the highest median family income of $120,982, while families with 1 earner (390) have the lowest median family income of $38,750, accounting for 39.8% and 47.2% of families, respectively.
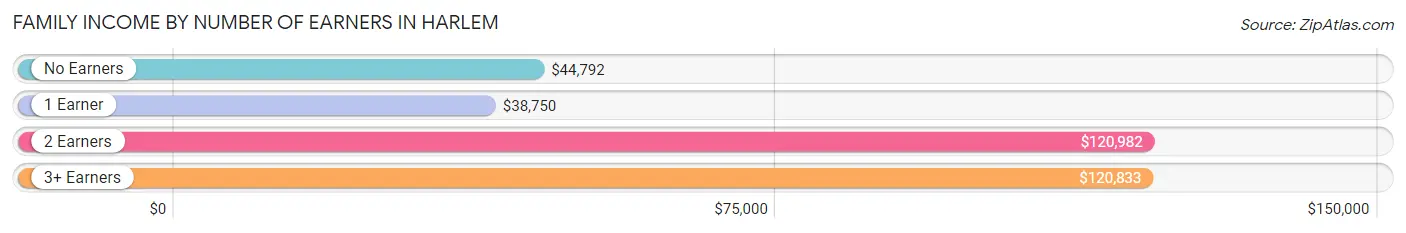
| Number of Earners | # Families | Median Income |
| No Earners | 55 (6.7%) | $44,792 |
| 1 Earner | 390 (47.2%) | $38,750 |
| 2 Earners | 329 (39.8%) | $120,982 |
| 3+ Earners | 52 (6.3%) | $120,833 |
| Total | 826 (100.0%) | $64,204 |
Household Income in Harlem
Household Income Brackets in Harlem
With 294 households falling in the category, the $25,000 to $34,999 income range is the most frequent in Harlem, accounting for 23.7% of all households.
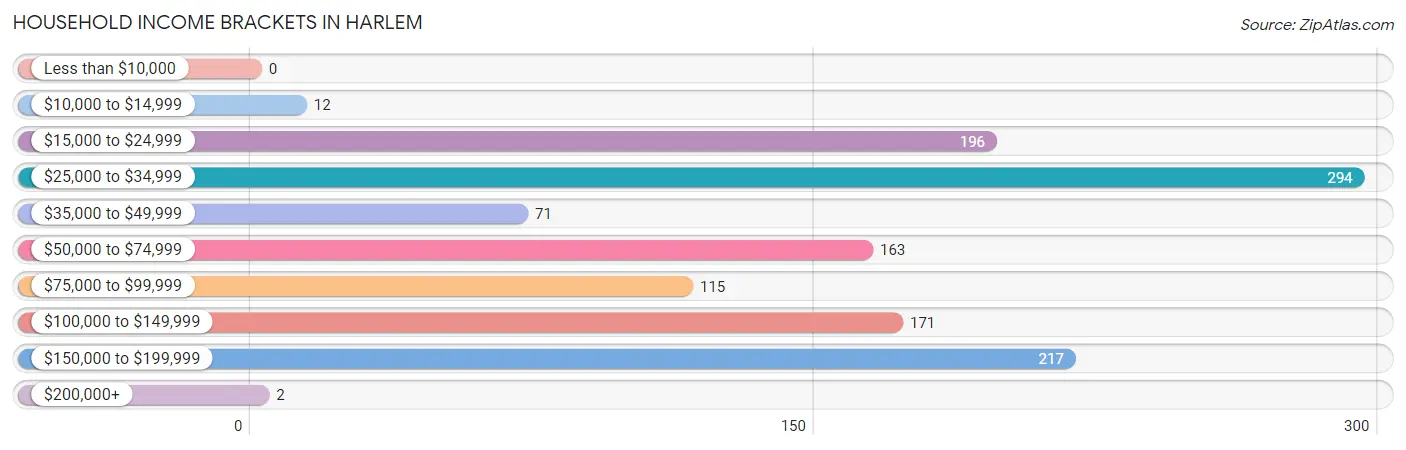
| Income Bracket | # Households | % Households |
| Less than $10,000 | 0 | 0.0% |
| $10,000 to $14,999 | 12 | 1.0% |
| $15,000 to $24,999 | 196 | 15.8% |
| $25,000 to $34,999 | 294 | 23.7% |
| $35,000 to $49,999 | 71 | 5.7% |
| $50,000 to $74,999 | 163 | 13.1% |
| $75,000 to $99,999 | 115 | 9.3% |
| $100,000 to $149,999 | 171 | 13.8% |
| $150,000 to $199,999 | 217 | 17.5% |
| $200,000+ | 2 | 0.2% |
Household Income by Householder Age in Harlem
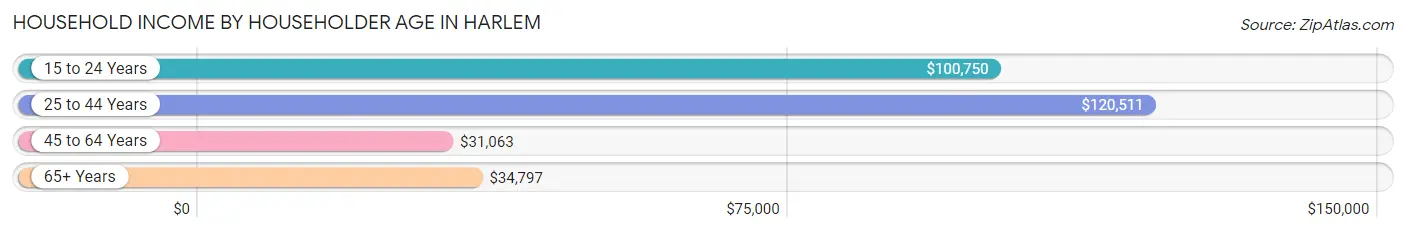
The median household income in Harlem is $51,855, with the highest median household income of $120,511 found in the 25 to 44 years age bracket for the primary householder. A total of 485 households (39.1%) fall into this category. Meanwhile, the 45 to 64 years age bracket for the primary householder has the lowest median household income of $31,063, with 431 households (34.7%) in this group.
| Income Bracket | # Households | Median Income |
| 15 to 24 Years | 29 (2.3%) | $100,750 |
| 25 to 44 Years | 485 (39.1%) | $120,511 |
| 45 to 64 Years | 431 (34.7%) | $31,063 |
| 65+ Years | 296 (23.8%) | $34,797 |
| Total | 1,241 (100.0%) | $51,855 |
Poverty in Harlem
Income Below Poverty by Sex and Age in Harlem
With 3.0% poverty level for males and 1.6% for females among the residents of Harlem, 18 to 24 year old males and 18 to 24 year old females are the most vulnerable to poverty, with 12 males (9.3%) and 10 females (7.1%) in their respective age groups living below the poverty level.
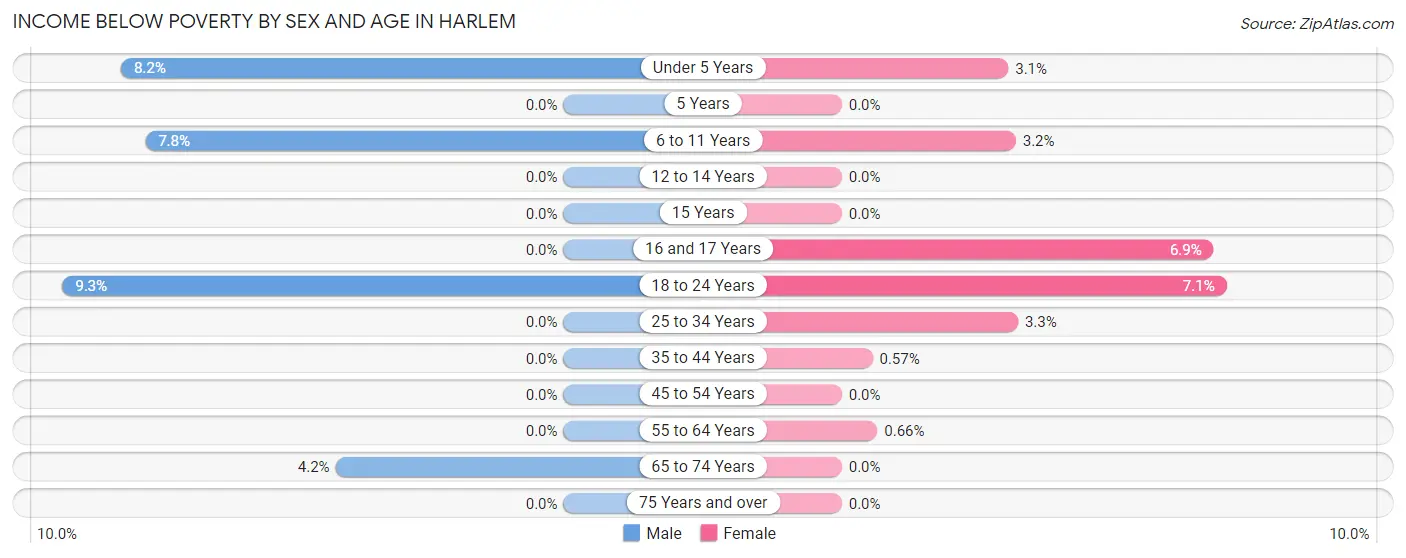
| Age Bracket | Male | Female |
| Under 5 Years | 17 (8.2%) | 3 (3.1%) |
| 5 Years | 0 (0.0%) | 0 (0.0%) |
| 6 to 11 Years | 9 (7.8%) | 5 (3.2%) |
| 12 to 14 Years | 0 (0.0%) | 0 (0.0%) |
| 15 Years | 0 (0.0%) | 0 (0.0%) |
| 16 and 17 Years | 0 (0.0%) | 2 (6.9%) |
| 18 to 24 Years | 12 (9.3%) | 10 (7.1%) |
| 25 to 34 Years | 0 (0.0%) | 11 (3.3%) |
| 35 to 44 Years | 0 (0.0%) | 2 (0.6%) |
| 45 to 54 Years | 0 (0.0%) | 0 (0.0%) |
| 55 to 64 Years | 0 (0.0%) | 2 (0.7%) |
| 65 to 74 Years | 8 (4.2%) | 0 (0.0%) |
| 75 Years and over | 0 (0.0%) | 0 (0.0%) |
| Total | 46 (3.0%) | 35 (1.6%) |
Income Above Poverty by Sex and Age in Harlem
According to the poverty statistics in Harlem, males aged 5 years and females aged 5 years are the age groups that are most secure financially, with 100.0% of males and 100.0% of females in these age groups living above the poverty line.
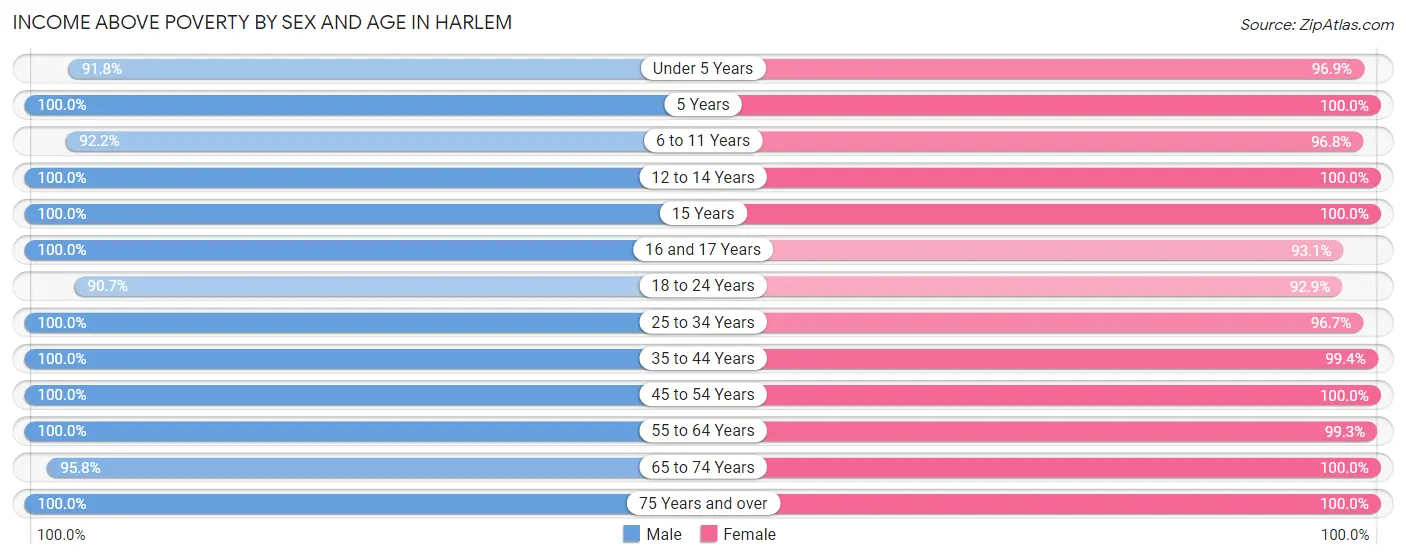
| Age Bracket | Male | Female |
| Under 5 Years | 190 (91.8%) | 94 (96.9%) |
| 5 Years | 60 (100.0%) | 34 (100.0%) |
| 6 to 11 Years | 107 (92.2%) | 150 (96.8%) |
| 12 to 14 Years | 62 (100.0%) | 337 (100.0%) |
| 15 Years | 19 (100.0%) | 69 (100.0%) |
| 16 and 17 Years | 31 (100.0%) | 27 (93.1%) |
| 18 to 24 Years | 117 (90.7%) | 130 (92.9%) |
| 25 to 34 Years | 248 (100.0%) | 325 (96.7%) |
| 35 to 44 Years | 262 (100.0%) | 347 (99.4%) |
| 45 to 54 Years | 62 (100.0%) | 55 (100.0%) |
| 55 to 64 Years | 124 (100.0%) | 302 (99.3%) |
| 65 to 74 Years | 181 (95.8%) | 160 (100.0%) |
| 75 Years and over | 5 (100.0%) | 96 (100.0%) |
| Total | 1,468 (97.0%) | 2,126 (98.4%) |
Income Below Poverty Among Married-Couple Families in Harlem
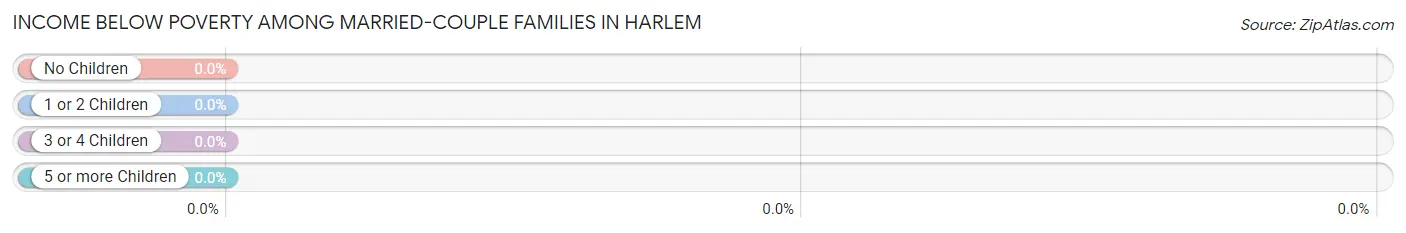
| Children | Above Poverty | Below Poverty |
| No Children | 202 (100.0%) | 0 (0.0%) |
| 1 or 2 Children | 145 (100.0%) | 0 (0.0%) |
| 3 or 4 Children | 85 (100.0%) | 0 (0.0%) |
| 5 or more Children | 0 (0.0%) | 0 (0.0%) |
| Total | 432 (100.0%) | 0 (0.0%) |
Income Below Poverty Among Single-Parent Households in Harlem
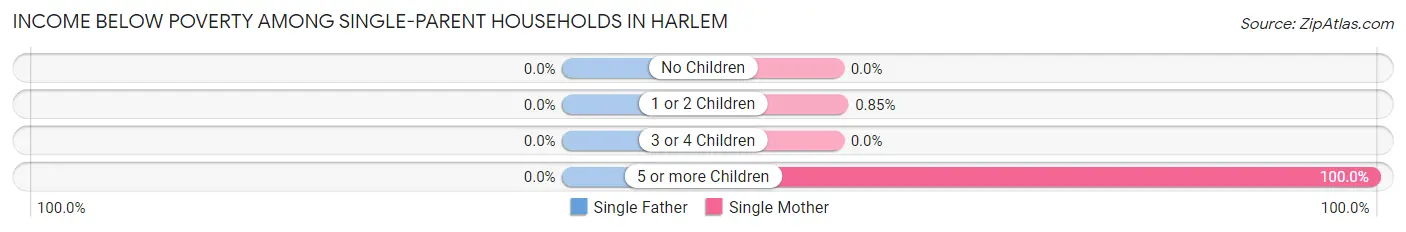
| Children | Single Father | Single Mother |
| No Children | 0 (0.0%) | 0 (0.0%) |
| 1 or 2 Children | 0 (0.0%) | 2 (0.9%) |
| 3 or 4 Children | 0 (0.0%) | 0 (0.0%) |
| 5 or more Children | 0 (0.0%) | 4 (100.0%) |
| Total | 0 (0.0%) | 6 (2.1%) |
Income Below Poverty Among Married-Couple vs Single-Parent Households in Harlem
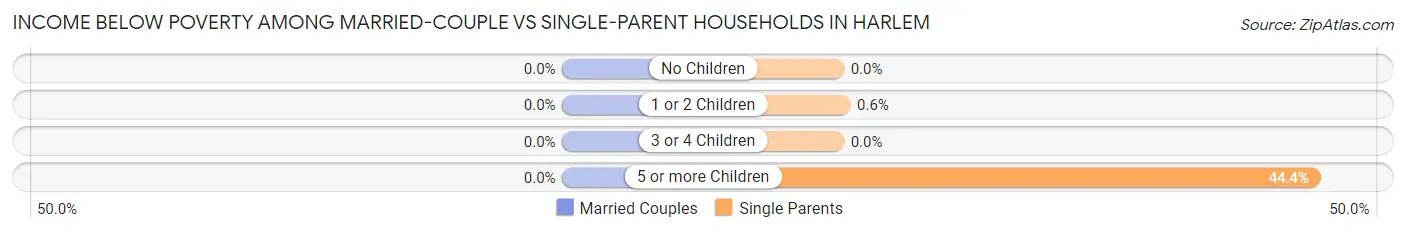
| Children | Married-Couple Families | Single-Parent Households |
| No Children | 0 (0.0%) | 0 (0.0%) |
| 1 or 2 Children | 0 (0.0%) | 2 (0.6%) |
| 3 or 4 Children | 0 (0.0%) | 0 (0.0%) |
| 5 or more Children | 0 (0.0%) | 4 (44.4%) |
| Total | 0 (0.0%) | 6 (1.5%) |
Race in Harlem
The most populous races in Harlem are White / Caucasian (2,504 | 68.0%), Black / African American (1,002 | 27.2%), and Two or more Races (148 | 4.0%).
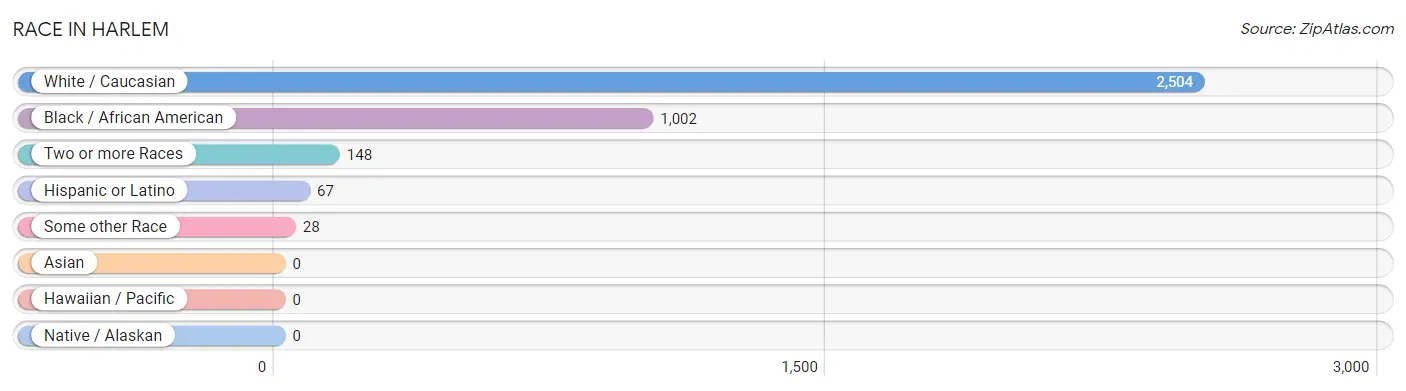
| Race | # Population | % Population |
| Asian | 0 | 0.0% |
| Black / African American | 1,002 | 27.2% |
| Hawaiian / Pacific | 0 | 0.0% |
| Hispanic or Latino | 67 | 1.8% |
| Native / Alaskan | 0 | 0.0% |
| White / Caucasian | 2,504 | 68.0% |
| Two or more Races | 148 | 4.0% |
| Some other Race | 28 | 0.8% |
| Total | 3,682 | 100.0% |
Ancestry in Harlem
The most populous ancestries reported in Harlem are German (449 | 12.2%), American (354 | 9.6%), English (263 | 7.1%), Irish (241 | 6.6%), and Scandinavian (175 | 4.8%), together accounting for 40.2% of all Harlem residents.
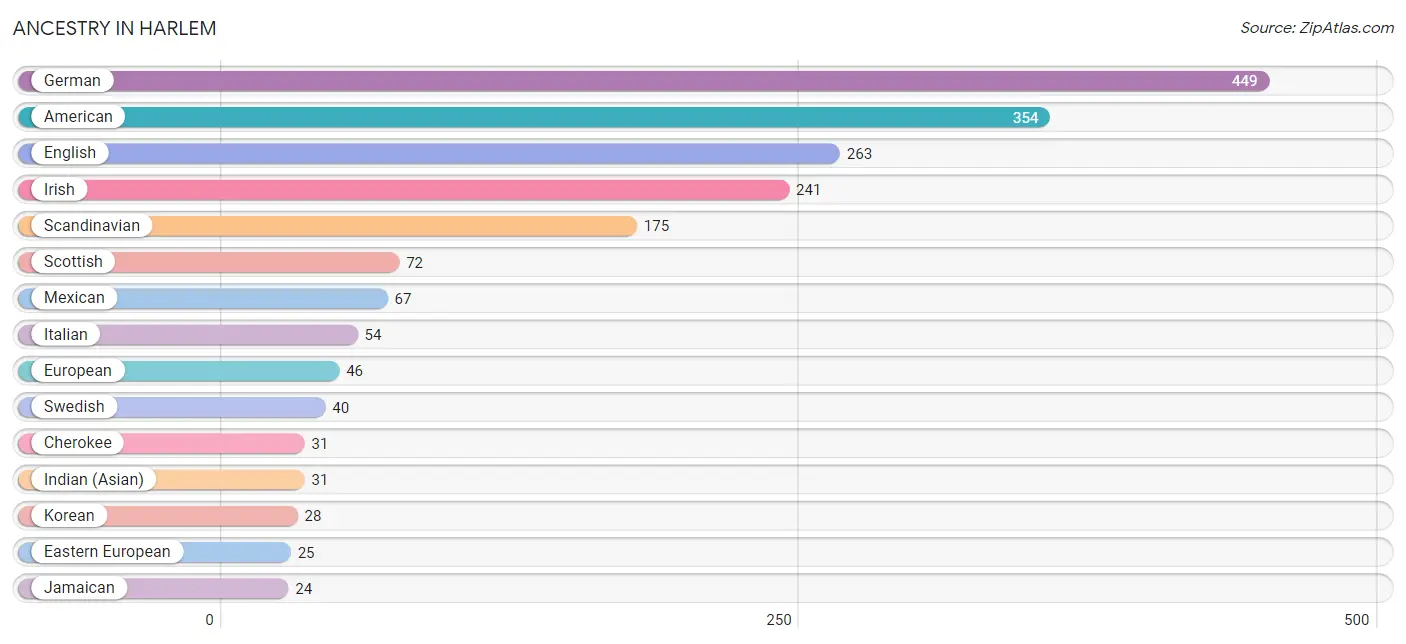
| Ancestry | # Population | % Population |
| African | 14 | 0.4% |
| American | 354 | 9.6% |
| Arab | 22 | 0.6% |
| British | 22 | 0.6% |
| Cherokee | 31 | 0.8% |
| Czechoslovakian | 16 | 0.4% |
| Dutch | 4 | 0.1% |
| Eastern European | 25 | 0.7% |
| English | 263 | 7.1% |
| European | 46 | 1.3% |
| French | 23 | 0.6% |
| German | 449 | 12.2% |
| Indian (Asian) | 31 | 0.8% |
| Iranian | 8 | 0.2% |
| Irish | 241 | 6.6% |
| Italian | 54 | 1.5% |
| Jamaican | 24 | 0.6% |
| Korean | 28 | 0.8% |
| Mexican | 67 | 1.8% |
| Norwegian | 8 | 0.2% |
| Russian | 4 | 0.1% |
| Scandinavian | 175 | 4.8% |
| Scotch-Irish | 5 | 0.1% |
| Scottish | 72 | 2.0% |
| Subsaharan African | 14 | 0.4% |
| Swedish | 40 | 1.1% |
| Swiss | 4 | 0.1% | View All 27 Rows |
Immigrants in Harlem
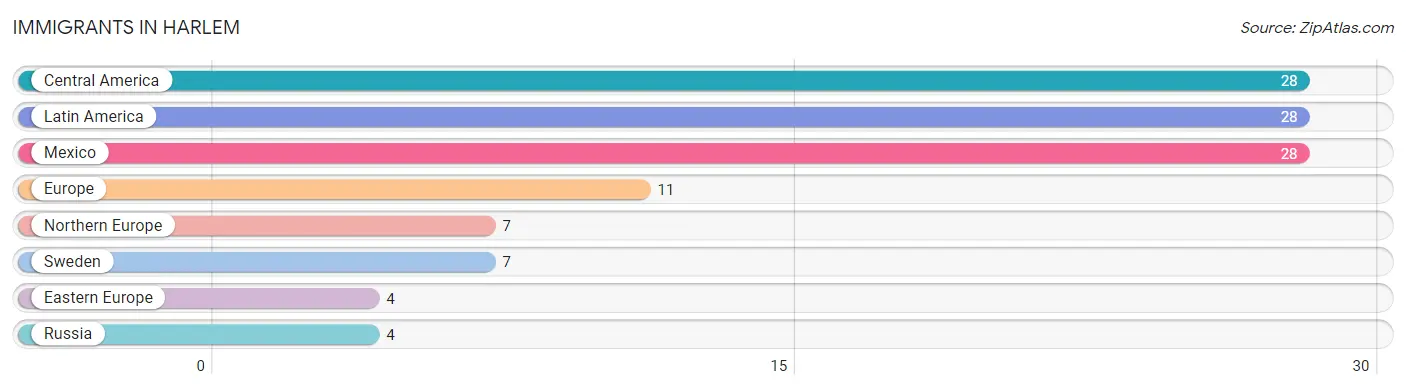
The most numerous immigrant groups reported in Harlem came from Central America (28 | 0.8%), Latin America (28 | 0.8%), Mexico (28 | 0.8%), Europe (11 | 0.3%), and Northern Europe (7 | 0.2%), together accounting for 2.8% of all Harlem residents.
| Immigration Origin | # Population | % Population |
| Central America | 28 | 0.8% |
| Eastern Europe | 4 | 0.1% |
| Europe | 11 | 0.3% |
| Latin America | 28 | 0.8% |
| Mexico | 28 | 0.8% |
| Northern Europe | 7 | 0.2% |
| Russia | 4 | 0.1% |
| Sweden | 7 | 0.2% | View All 8 Rows |
Sex and Age in Harlem
Sex and Age in Harlem
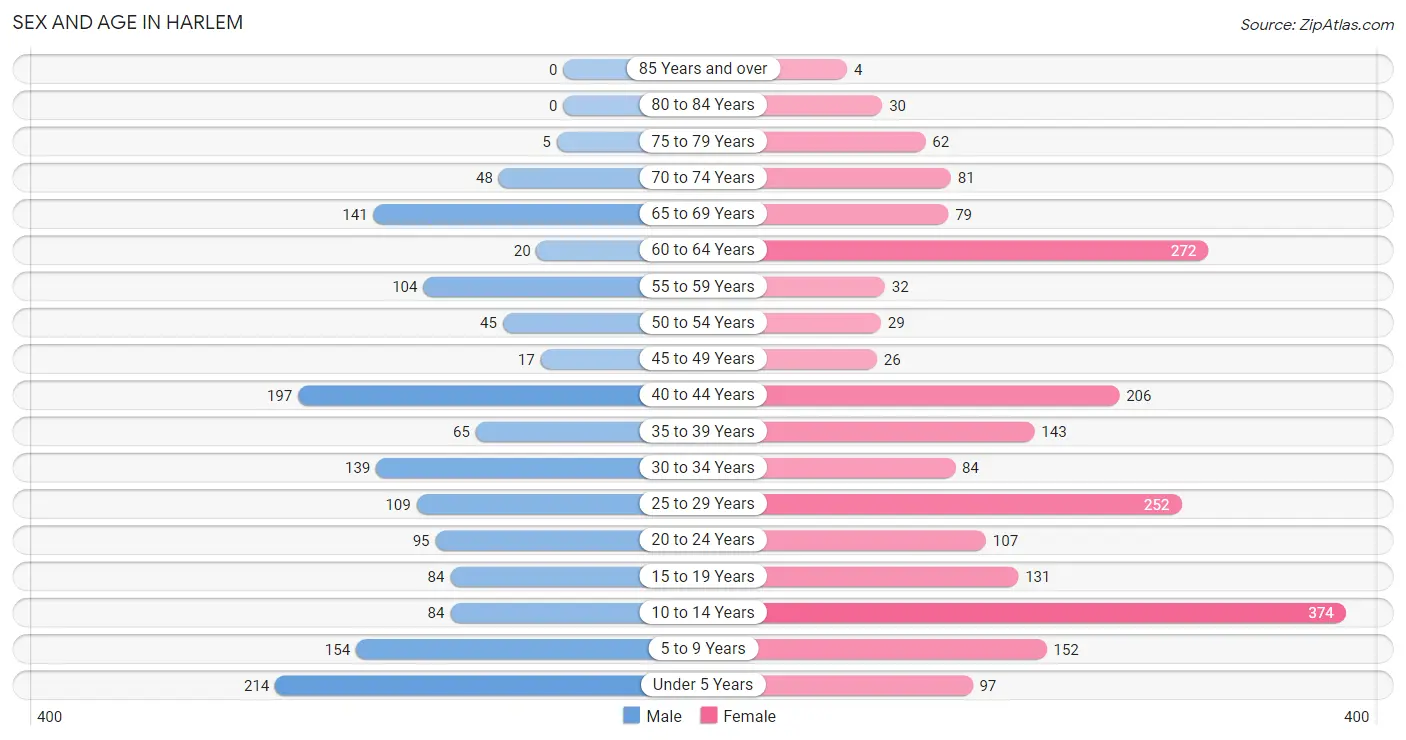
The most populous age groups in Harlem are Under 5 Years (214 | 14.1%) for men and 10 to 14 Years (374 | 17.3%) for women.
| Age Bracket | Male | Female |
| Under 5 Years | 214 (14.1%) | 97 (4.5%) |
| 5 to 9 Years | 154 (10.1%) | 152 (7.0%) |
| 10 to 14 Years | 84 (5.5%) | 374 (17.3%) |
| 15 to 19 Years | 84 (5.5%) | 131 (6.1%) |
| 20 to 24 Years | 95 (6.2%) | 107 (5.0%) |
| 25 to 29 Years | 109 (7.2%) | 252 (11.7%) |
| 30 to 34 Years | 139 (9.1%) | 84 (3.9%) |
| 35 to 39 Years | 65 (4.3%) | 143 (6.6%) |
| 40 to 44 Years | 197 (13.0%) | 206 (9.5%) |
| 45 to 49 Years | 17 (1.1%) | 26 (1.2%) |
| 50 to 54 Years | 45 (3.0%) | 29 (1.3%) |
| 55 to 59 Years | 104 (6.8%) | 32 (1.5%) |
| 60 to 64 Years | 20 (1.3%) | 272 (12.6%) |
| 65 to 69 Years | 141 (9.3%) | 79 (3.7%) |
| 70 to 74 Years | 48 (3.2%) | 81 (3.7%) |
| 75 to 79 Years | 5 (0.3%) | 62 (2.9%) |
| 80 to 84 Years | 0 (0.0%) | 30 (1.4%) |
| 85 Years and over | 0 (0.0%) | 4 (0.2%) |
| Total | 1,521 (100.0%) | 2,161 (100.0%) |
Families and Households in Harlem
Median Family Size in Harlem
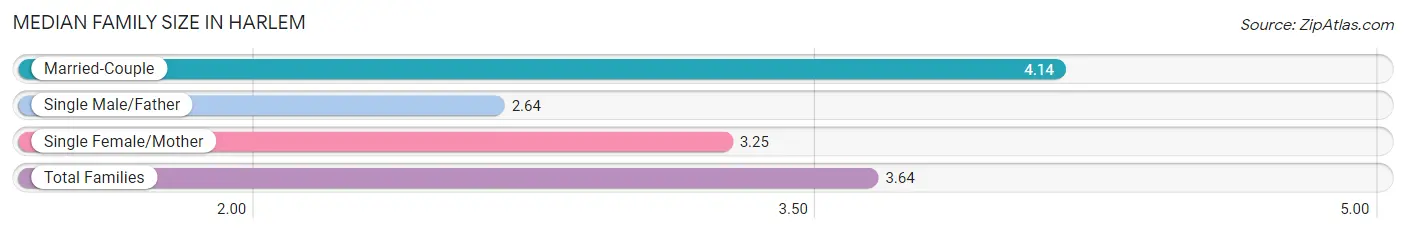
The median family size in Harlem is 3.64 persons per family, with married-couple families (432 | 52.3%) accounting for the largest median family size of 4.14 persons per family. On the other hand, single male/father families (107 | 13.0%) represent the smallest median family size with 2.64 persons per family.
| Family Type | # Families | Family Size |
| Married-Couple | 432 (52.3%) | 4.14 |
| Single Male/Father | 107 (13.0%) | 2.64 |
| Single Female/Mother | 287 (34.7%) | 3.25 |
| Total Families | 826 (100.0%) | 3.64 |
Median Household Size in Harlem
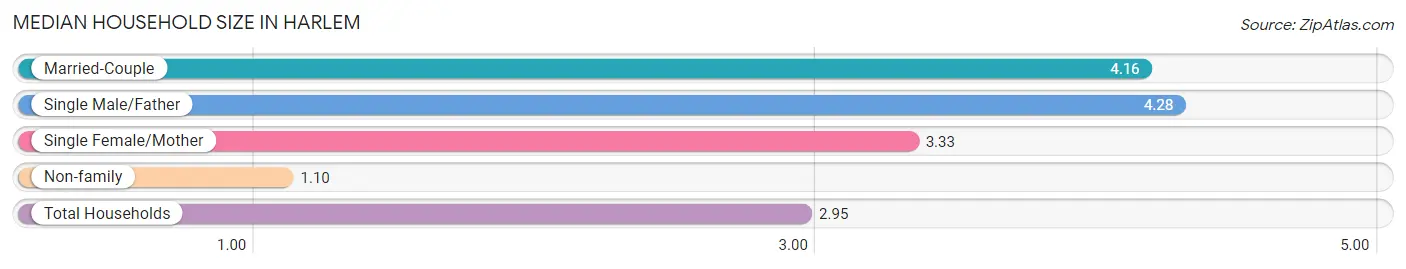
The median household size in Harlem is 2.95 persons per household, with single male/father households (107 | 8.6%) accounting for the largest median household size of 4.28 persons per household. non-family households (415 | 33.4%) represent the smallest median household size with 1.10 persons per household.
| Household Type | # Households | Household Size |
| Married-Couple | 432 (34.8%) | 4.16 |
| Single Male/Father | 107 (8.6%) | 4.28 |
| Single Female/Mother | 287 (23.1%) | 3.33 |
| Non-family | 415 (33.4%) | 1.10 |
| Total Households | 1,241 (100.0%) | 2.95 |
Household Size by Marriage Status in Harlem
Out of a total of 1,241 households in Harlem, 826 (66.6%) are family households, while 415 (33.4%) are nonfamily households. The most numerous type of family households are 2-person households, comprising 385, and the most common type of nonfamily households are 1-person households, comprising 390.
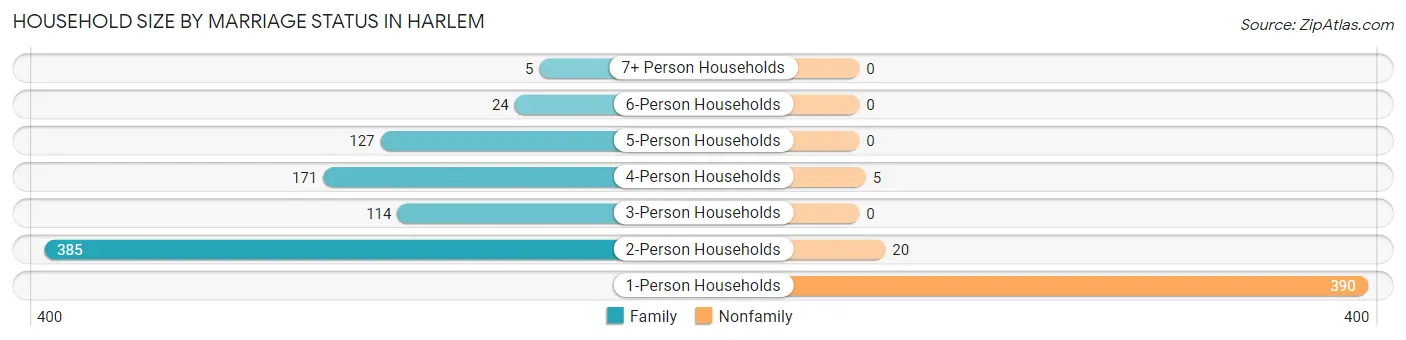
| Household Size | Family Households | Nonfamily Households |
| 1-Person Households | - | 390 (31.4%) |
| 2-Person Households | 385 (31.0%) | 20 (1.6%) |
| 3-Person Households | 114 (9.2%) | 0 (0.0%) |
| 4-Person Households | 171 (13.8%) | 5 (0.4%) |
| 5-Person Households | 127 (10.2%) | 0 (0.0%) |
| 6-Person Households | 24 (1.9%) | 0 (0.0%) |
| 7+ Person Households | 5 (0.4%) | 0 (0.0%) |
| Total | 826 (66.6%) | 415 (33.4%) |
Female Fertility in Harlem
Fertility by Age in Harlem
Average fertility rate in Harlem is 47.0 births per 1,000 women. Women in the age bracket of 20 to 34 years have the highest fertility rate with 79.0 births per 1,000 women. Women in the age bracket of 20 to 34 years acount for 77.8% of all women with births.
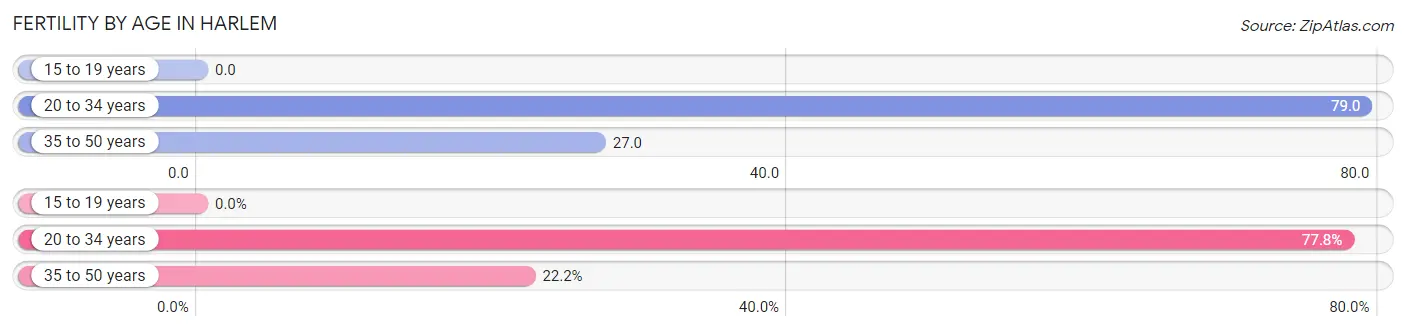
| Age Bracket | Women with Births | Births / 1,000 Women |
| 15 to 19 years | 0 (0.0%) | 0.0 |
| 20 to 34 years | 35 (77.8%) | 79.0 |
| 35 to 50 years | 10 (22.2%) | 27.0 |
| Total | 45 (100.0%) | 47.0 |
Fertility by Age by Marriage Status in Harlem
84.4% of women with births (45) in Harlem are married. The highest percentage of unmarried women with births falls into 20 to 34 years age bracket with 20.0% of them unmarried at the time of birth, while the lowest percentage of unmarried women with births belong to 35 to 50 years age bracket with 0.0% of them unmarried.
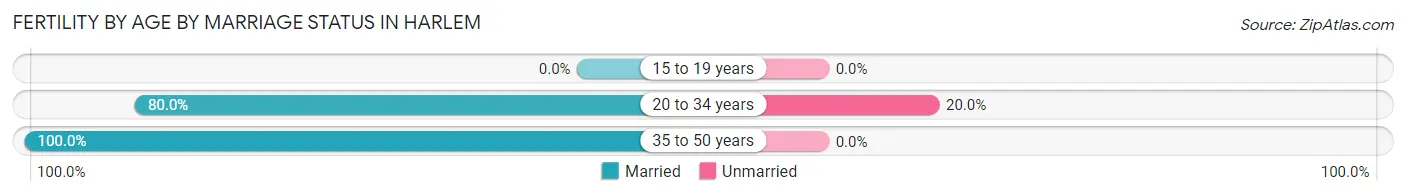
| Age Bracket | Married | Unmarried |
| 15 to 19 years | 0 (0.0%) | 0 (0.0%) |
| 20 to 34 years | 28 (80.0%) | 7 (20.0%) |
| 35 to 50 years | 10 (100.0%) | 0 (0.0%) |
| Total | 38 (84.4%) | 7 (15.6%) |
Fertility by Education in Harlem
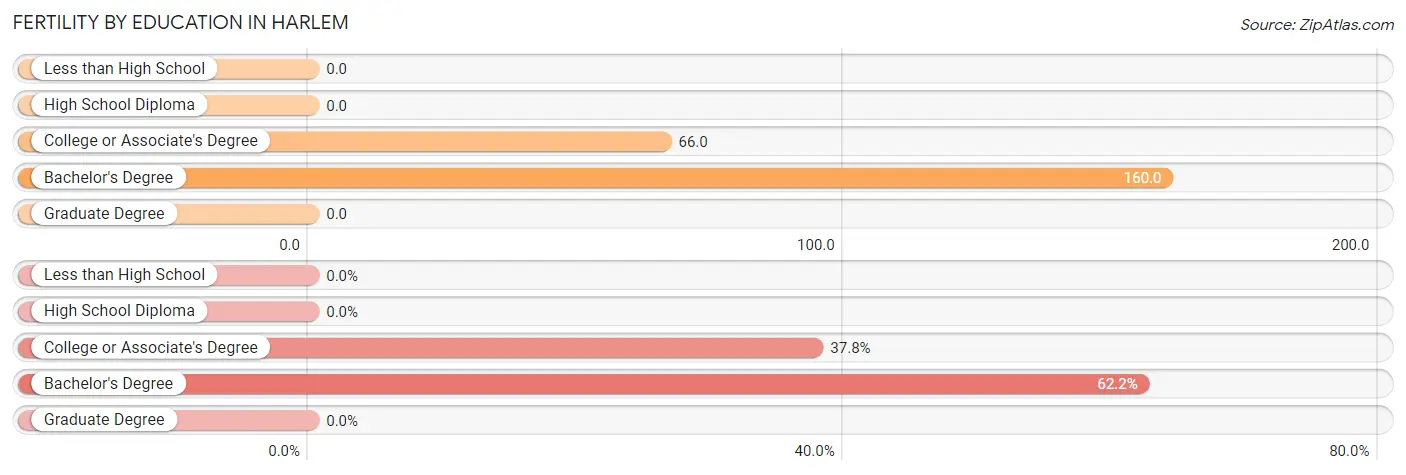
| Educational Attainment | Women with Births | Births / 1,000 Women |
| Less than High School | 0 (0.0%) | 0.0 |
| High School Diploma | 0 (0.0%) | 0.0 |
| College or Associate's Degree | 17 (37.8%) | 66.0 |
| Bachelor's Degree | 28 (62.2%) | 160.0 |
| Graduate Degree | 0 (0.0%) | 0.0 |
| Total | 45 (100.0%) | 47.0 |
Fertility by Education by Marriage Status in Harlem
15.6% of women with births in Harlem are unmarried. Women with the educational attainment of bachelor's degree are most likely to be married with 100.0% of them married at childbirth, while women with the educational attainment of college or associate's degree are least likely to be married with 41.2% of them unmarried at childbirth.
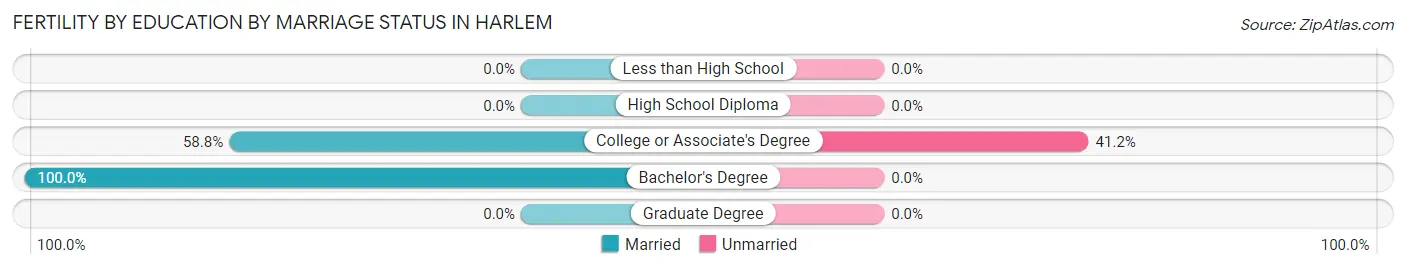
| Educational Attainment | Married | Unmarried |
| Less than High School | 0 (0.0%) | 0 (0.0%) |
| High School Diploma | 0 (0.0%) | 0 (0.0%) |
| College or Associate's Degree | 10 (58.8%) | 7 (41.2%) |
| Bachelor's Degree | 28 (100.0%) | 0 (0.0%) |
| Graduate Degree | 0 (0.0%) | 0 (0.0%) |
| Total | 38 (84.4%) | 7 (15.6%) |
Employment Characteristics in Harlem
Employment by Class of Employer in Harlem
Among the 1,705 employed individuals in Harlem, private company employees (1,267 | 74.3%), local government employees (241 | 14.1%), and federal government employees (112 | 6.6%) make up the most common classes of employment.
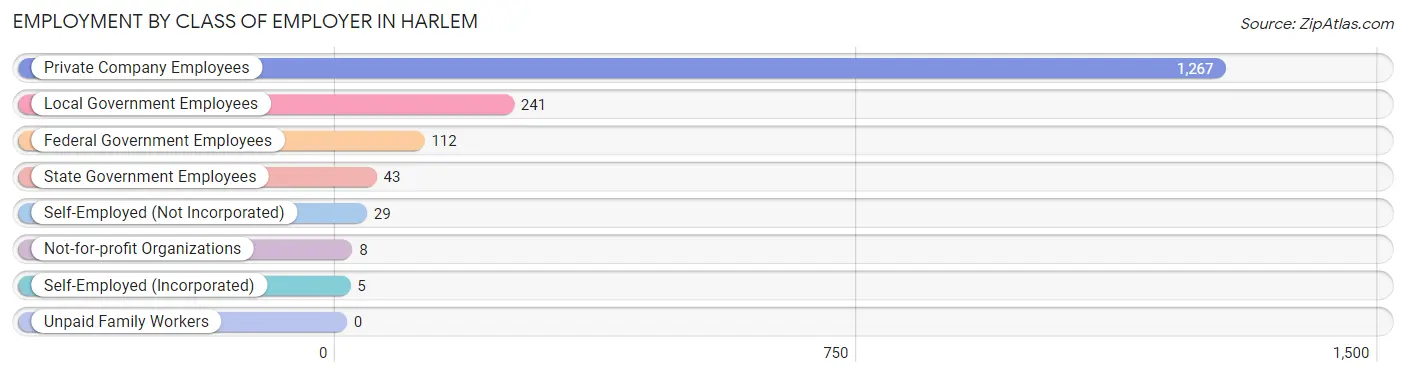
| Employer Class | # Employees | % Employees |
| Private Company Employees | 1,267 | 74.3% |
| Self-Employed (Incorporated) | 5 | 0.3% |
| Self-Employed (Not Incorporated) | 29 | 1.7% |
| Not-for-profit Organizations | 8 | 0.5% |
| Local Government Employees | 241 | 14.1% |
| State Government Employees | 43 | 2.5% |
| Federal Government Employees | 112 | 6.6% |
| Unpaid Family Workers | 0 | 0.0% |
| Total | 1,705 | 100.0% |
Employment Status by Age in Harlem
According to the labor force statistics for Harlem, out of the total population over 16 years of age (2,519), 70.7% or 1,781 individuals are in the labor force, with 3.7% or 66 of them unemployed. The age group with the highest labor force participation rate is 35 to 44 years, with 98.4% or 601 individuals in the labor force. Within the labor force, the 55 to 59 years age range has the highest percentage of unemployed individuals, with 27.9% or 19 of them being unemployed.
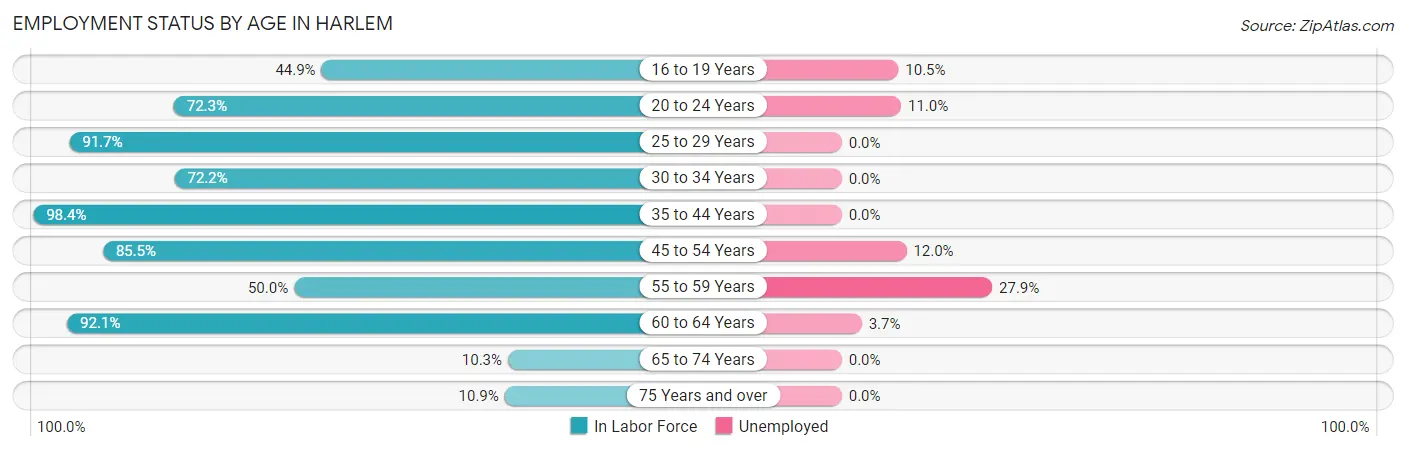
| Age Bracket | In Labor Force | Unemployed |
| 16 to 19 Years | 57 (44.9%) | 6 (10.5%) |
| 20 to 24 Years | 146 (72.3%) | 16 (11.0%) |
| 25 to 29 Years | 331 (91.7%) | 0 (0.0%) |
| 30 to 34 Years | 161 (72.2%) | 0 (0.0%) |
| 35 to 44 Years | 601 (98.4%) | 0 (0.0%) |
| 45 to 54 Years | 100 (85.5%) | 12 (12.0%) |
| 55 to 59 Years | 68 (50.0%) | 19 (27.9%) |
| 60 to 64 Years | 269 (92.1%) | 10 (3.7%) |
| 65 to 74 Years | 36 (10.3%) | 0 (0.0%) |
| 75 Years and over | 11 (10.9%) | 0 (0.0%) |
| Total | 1,781 (70.7%) | 66 (3.7%) |
Employment Status by Educational Attainment in Harlem
According to labor force statistics for Harlem, 87.9% of individuals (1,529) out of the total population between 25 and 64 years of age (1,740) are in the labor force, with 2.8% or 43 of them being unemployed. The group with the highest labor force participation rate are those with the educational attainment of less than high school, with 100.0% or 56 individuals in the labor force. Within the labor force, individuals with high school diploma education have the highest percentage of unemployment, with 5.2% or 27 of them being unemployed.
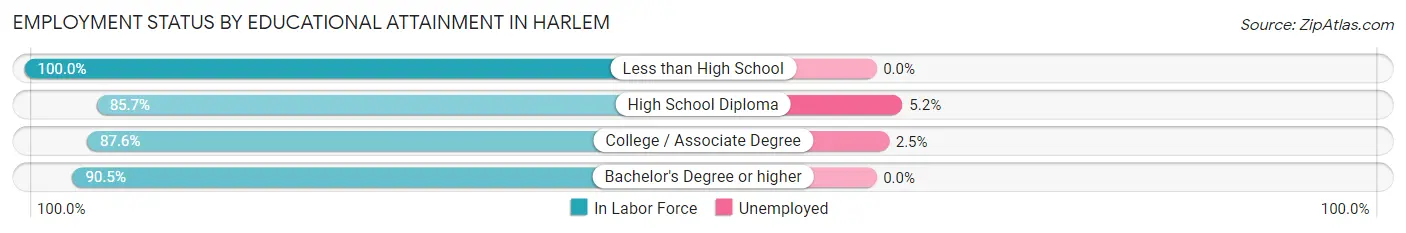
| Educational Attainment | In Labor Force | Unemployed |
| Less than High School | 56 (100.0%) | 0 (0.0%) |
| High School Diploma | 528 (85.7%) | 32 (5.2%) |
| College / Associate Degree | 621 (87.6%) | 18 (2.5%) |
| Bachelor's Degree or higher | 325 (90.5%) | 0 (0.0%) |
| Total | 1,529 (87.9%) | 49 (2.8%) |
Employment Occupations by Sex in Harlem
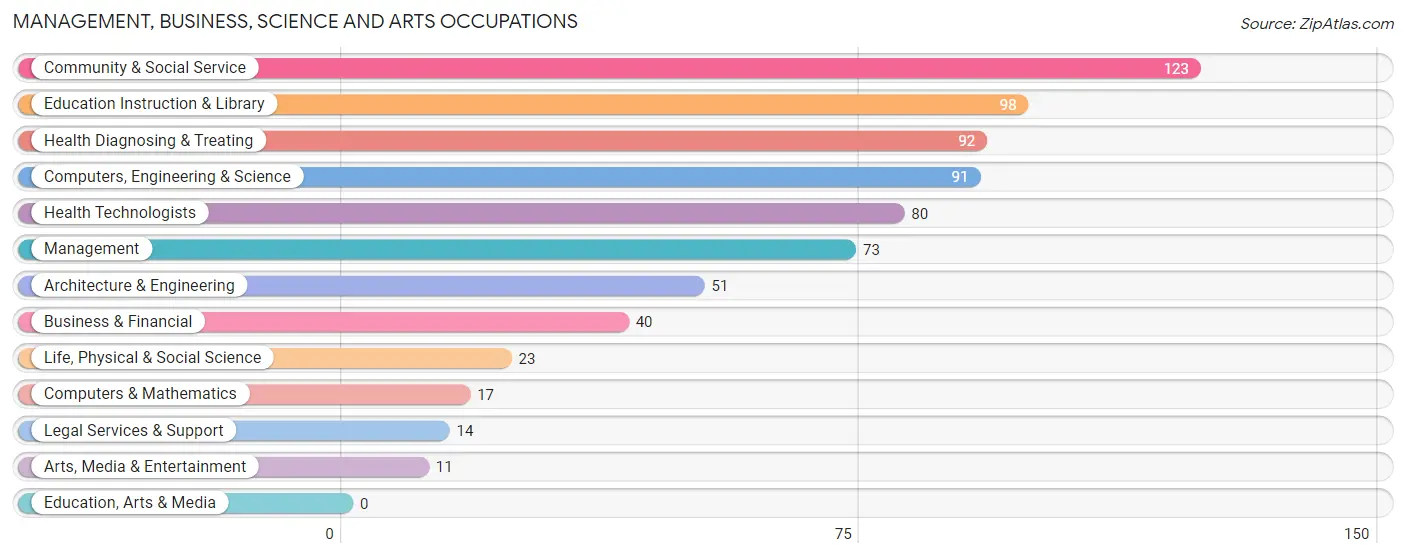
Management, Business, Science and Arts Occupations
The most common Management, Business, Science and Arts occupations in Harlem are Community & Social Service (123 | 7.4%), Education Instruction & Library (98 | 5.9%), Health Diagnosing & Treating (92 | 5.5%), Computers, Engineering & Science (91 | 5.5%), and Health Technologists (80 | 4.8%).
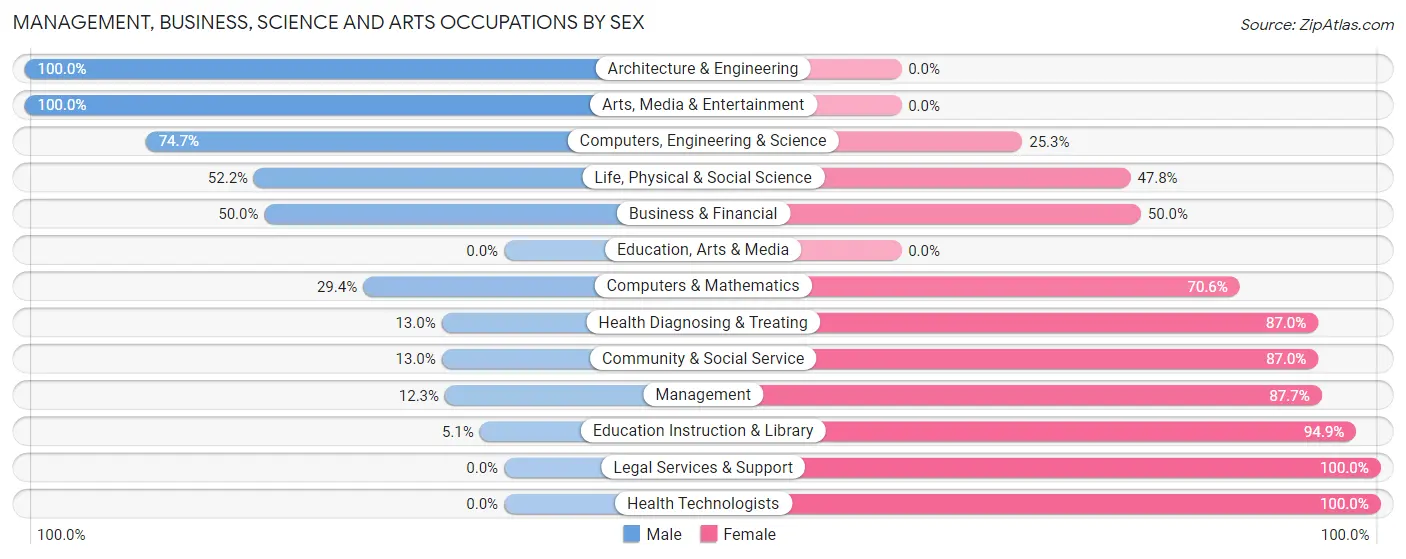
Management, Business, Science and Arts Occupations by Sex
Within the Management, Business, Science and Arts occupations in Harlem, the most male-oriented occupations are Architecture & Engineering (100.0%), Arts, Media & Entertainment (100.0%), and Computers, Engineering & Science (74.7%), while the most female-oriented occupations are Legal Services & Support (100.0%), Health Technologists (100.0%), and Education Instruction & Library (94.9%).
| Occupation | Male | Female |
| Management | 9 (12.3%) | 64 (87.7%) |
| Business & Financial | 20 (50.0%) | 20 (50.0%) |
| Computers, Engineering & Science | 68 (74.7%) | 23 (25.3%) |
| Computers & Mathematics | 5 (29.4%) | 12 (70.6%) |
| Architecture & Engineering | 51 (100.0%) | 0 (0.0%) |
| Life, Physical & Social Science | 12 (52.2%) | 11 (47.8%) |
| Community & Social Service | 16 (13.0%) | 107 (87.0%) |
| Education, Arts & Media | 0 (0.0%) | 0 (0.0%) |
| Legal Services & Support | 0 (0.0%) | 14 (100.0%) |
| Education Instruction & Library | 5 (5.1%) | 93 (94.9%) |
| Arts, Media & Entertainment | 11 (100.0%) | 0 (0.0%) |
| Health Diagnosing & Treating | 12 (13.0%) | 80 (87.0%) |
| Health Technologists | 0 (0.0%) | 80 (100.0%) |
| Total (Category) | 125 (29.8%) | 294 (70.2%) |
| Total (Overall) | 609 (36.6%) | 1,054 (63.4%) |
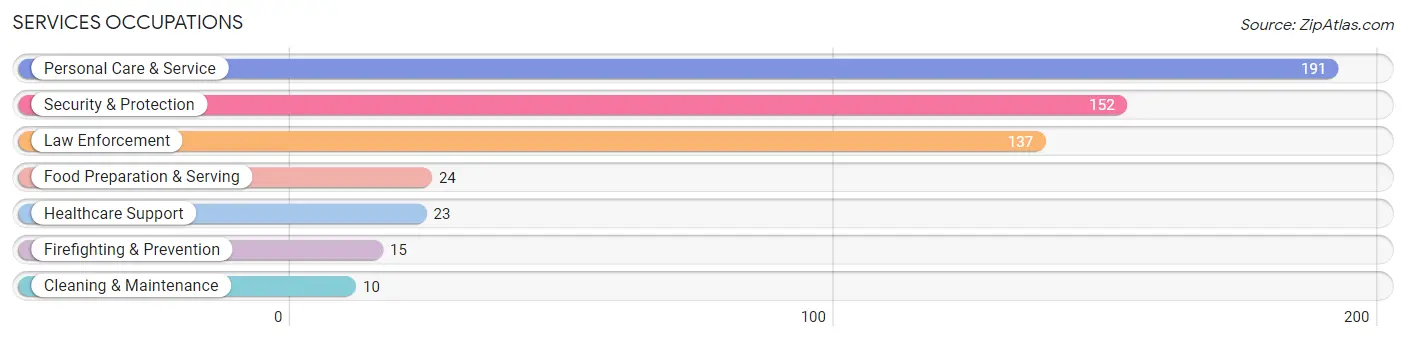
Services Occupations
The most common Services occupations in Harlem are Personal Care & Service (191 | 11.5%), Security & Protection (152 | 9.1%), Law Enforcement (137 | 8.2%), Food Preparation & Serving (24 | 1.4%), and Healthcare Support (23 | 1.4%).
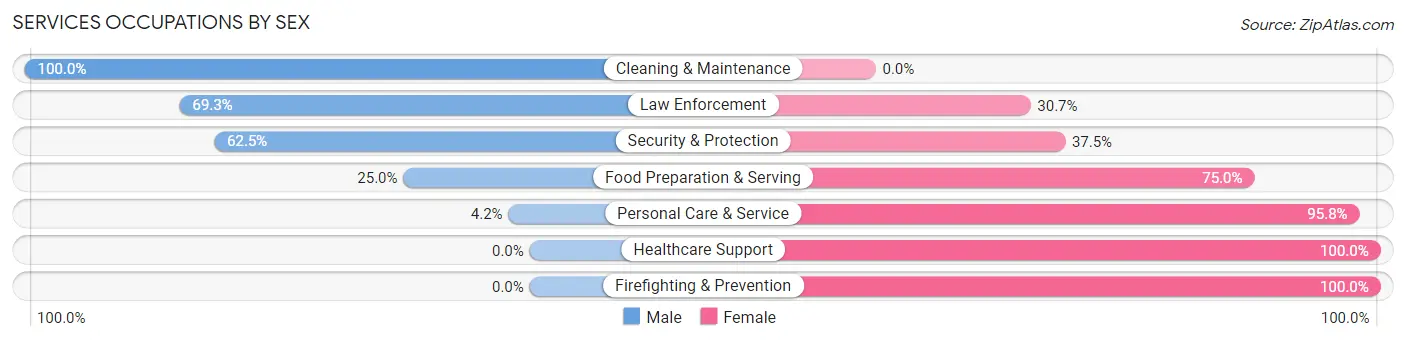
Services Occupations by Sex
Within the Services occupations in Harlem, the most male-oriented occupations are Cleaning & Maintenance (100.0%), Law Enforcement (69.3%), and Security & Protection (62.5%), while the most female-oriented occupations are Healthcare Support (100.0%), Firefighting & Prevention (100.0%), and Personal Care & Service (95.8%).
| Occupation | Male | Female |
| Healthcare Support | 0 (0.0%) | 23 (100.0%) |
| Security & Protection | 95 (62.5%) | 57 (37.5%) |
| Firefighting & Prevention | 0 (0.0%) | 15 (100.0%) |
| Law Enforcement | 95 (69.3%) | 42 (30.7%) |
| Food Preparation & Serving | 6 (25.0%) | 18 (75.0%) |
| Cleaning & Maintenance | 10 (100.0%) | 0 (0.0%) |
| Personal Care & Service | 8 (4.2%) | 183 (95.8%) |
| Total (Category) | 119 (29.7%) | 281 (70.3%) |
| Total (Overall) | 609 (36.6%) | 1,054 (63.4%) |
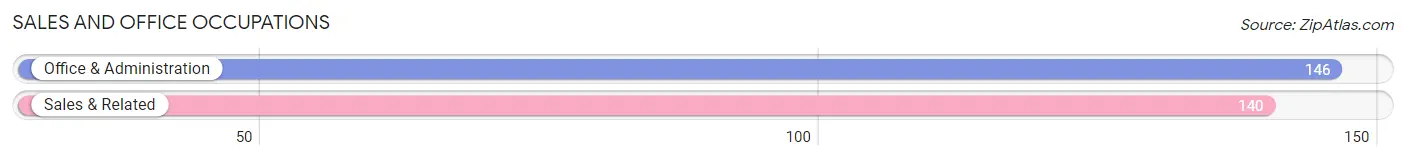
Sales and Office Occupations
The most common Sales and Office occupations in Harlem are Office & Administration (146 | 8.8%), and Sales & Related (140 | 8.4%).
Sales and Office Occupations by Sex
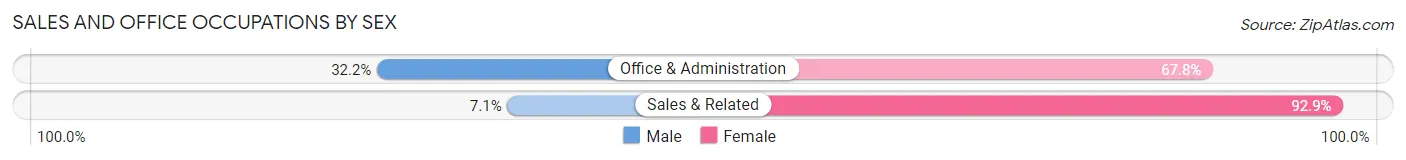
| Occupation | Male | Female |
| Sales & Related | 10 (7.1%) | 130 (92.9%) |
| Office & Administration | 47 (32.2%) | 99 (67.8%) |
| Total (Category) | 57 (19.9%) | 229 (80.1%) |
| Total (Overall) | 609 (36.6%) | 1,054 (63.4%) |
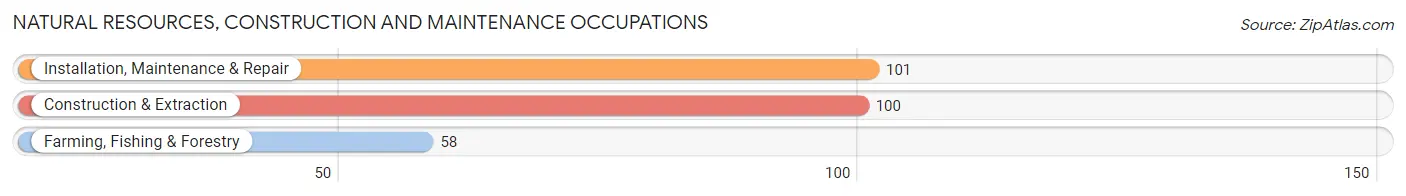
Natural Resources, Construction and Maintenance Occupations
The most common Natural Resources, Construction and Maintenance occupations in Harlem are Installation, Maintenance & Repair (101 | 6.1%), Construction & Extraction (100 | 6.0%), and Farming, Fishing & Forestry (58 | 3.5%).
Natural Resources, Construction and Maintenance Occupations by Sex
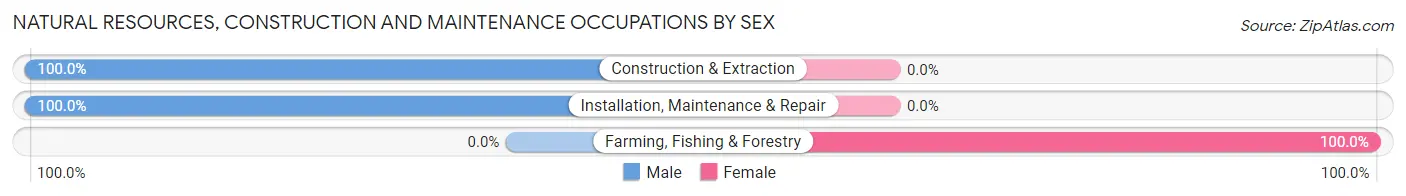
| Occupation | Male | Female |
| Farming, Fishing & Forestry | 0 (0.0%) | 58 (100.0%) |
| Construction & Extraction | 100 (100.0%) | 0 (0.0%) |
| Installation, Maintenance & Repair | 101 (100.0%) | 0 (0.0%) |
| Total (Category) | 201 (77.6%) | 58 (22.4%) |
| Total (Overall) | 609 (36.6%) | 1,054 (63.4%) |
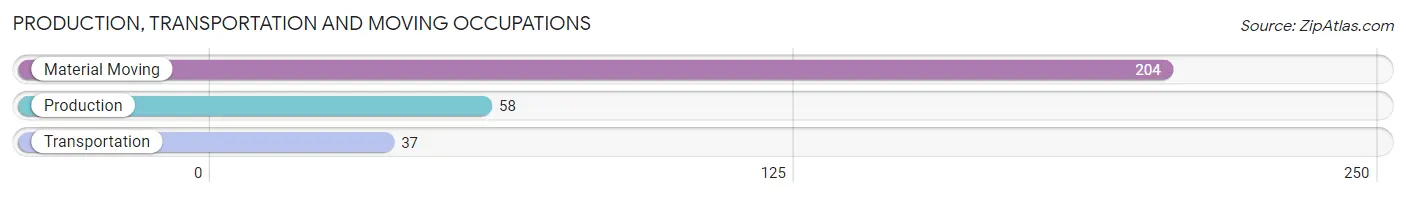
Production, Transportation and Moving Occupations
The most common Production, Transportation and Moving occupations in Harlem are Material Moving (204 | 12.3%), Production (58 | 3.5%), and Transportation (37 | 2.2%).
Production, Transportation and Moving Occupations by Sex
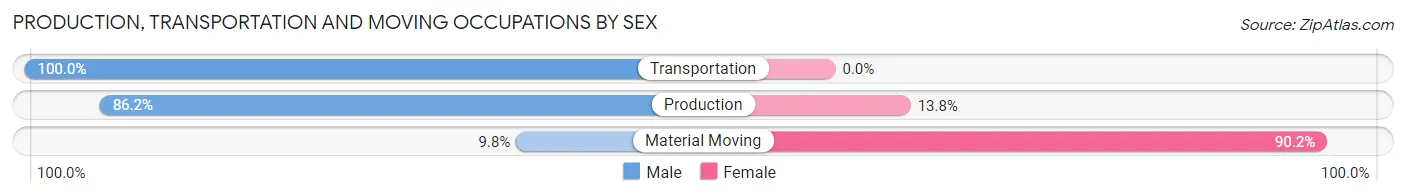
| Occupation | Male | Female |
| Production | 50 (86.2%) | 8 (13.8%) |
| Transportation | 37 (100.0%) | 0 (0.0%) |
| Material Moving | 20 (9.8%) | 184 (90.2%) |
| Total (Category) | 107 (35.8%) | 192 (64.2%) |
| Total (Overall) | 609 (36.6%) | 1,054 (63.4%) |
Employment Industries by Sex in Harlem
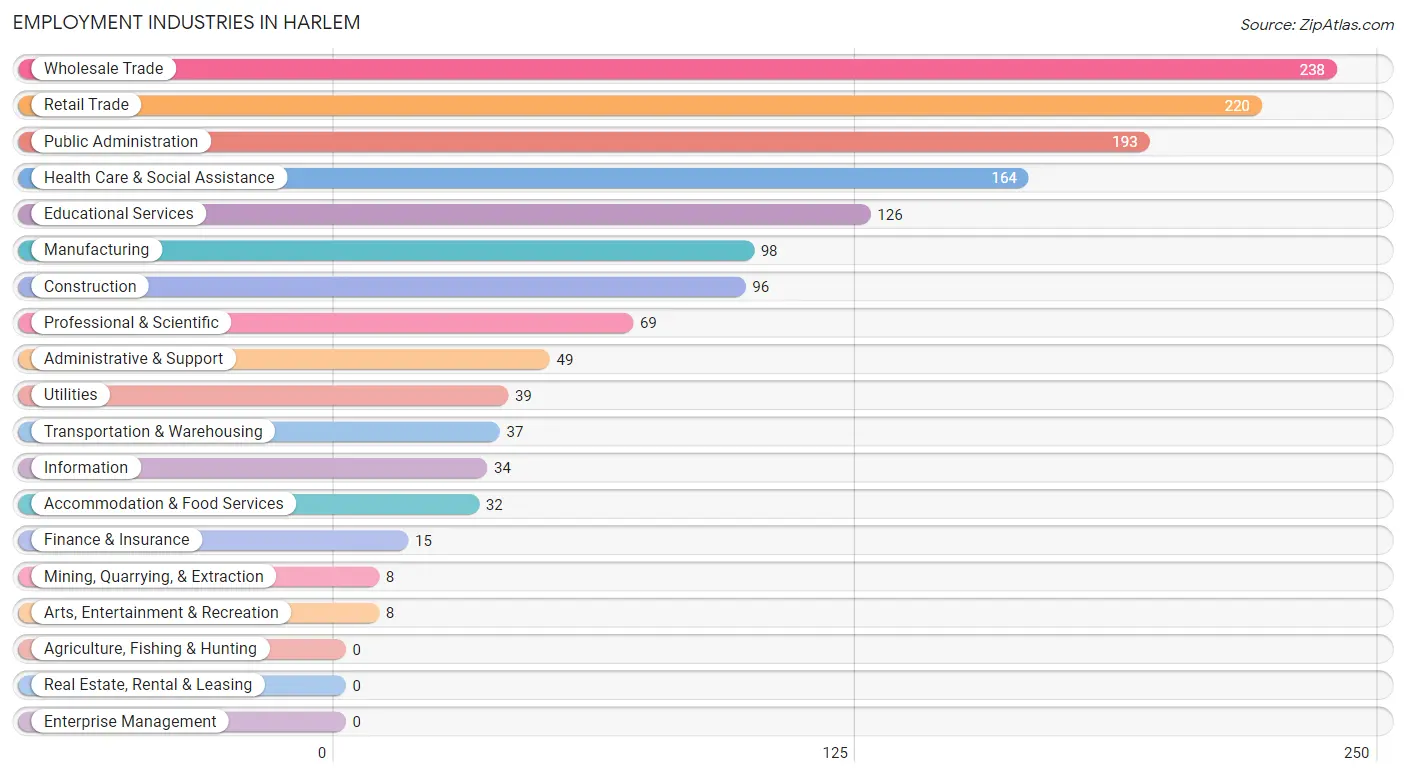
Employment Industries in Harlem
The major employment industries in Harlem include Wholesale Trade (238 | 14.3%), Retail Trade (220 | 13.2%), Public Administration (193 | 11.6%), Health Care & Social Assistance (164 | 9.9%), and Educational Services (126 | 7.6%).
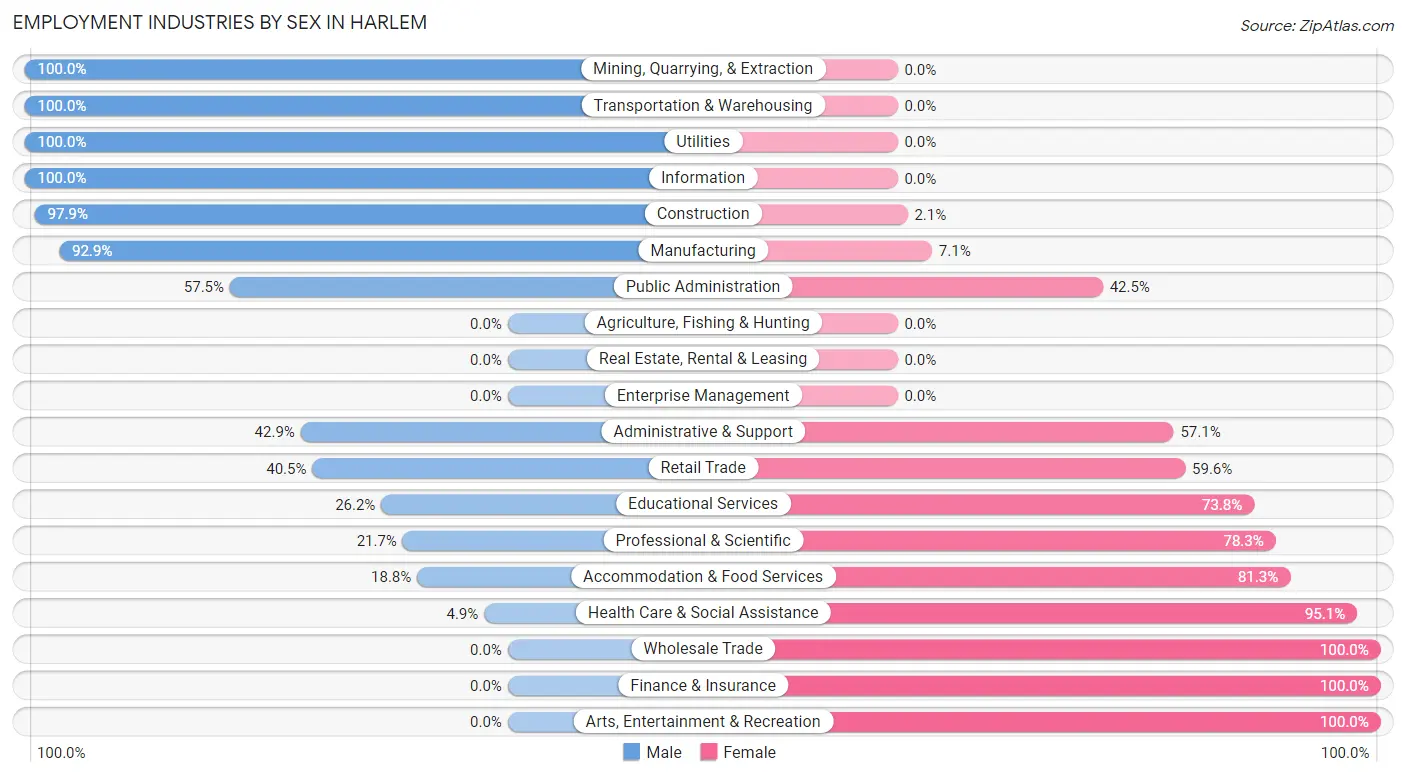
Employment Industries by Sex in Harlem
The Harlem industries that see more men than women are Mining, Quarrying, & Extraction (100.0%), Transportation & Warehousing (100.0%), and Utilities (100.0%), whereas the industries that tend to have a higher number of women are Wholesale Trade (100.0%), Finance & Insurance (100.0%), and Arts, Entertainment & Recreation (100.0%).
| Industry | Male | Female |
| Agriculture, Fishing & Hunting | 0 (0.0%) | 0 (0.0%) |
| Mining, Quarrying, & Extraction | 8 (100.0%) | 0 (0.0%) |
| Construction | 94 (97.9%) | 2 (2.1%) |
| Manufacturing | 91 (92.9%) | 7 (7.1%) |
| Wholesale Trade | 0 (0.0%) | 238 (100.0%) |
| Retail Trade | 89 (40.5%) | 131 (59.6%) |
| Transportation & Warehousing | 37 (100.0%) | 0 (0.0%) |
| Utilities | 39 (100.0%) | 0 (0.0%) |
| Information | 34 (100.0%) | 0 (0.0%) |
| Finance & Insurance | 0 (0.0%) | 15 (100.0%) |
| Real Estate, Rental & Leasing | 0 (0.0%) | 0 (0.0%) |
| Professional & Scientific | 15 (21.7%) | 54 (78.3%) |
| Enterprise Management | 0 (0.0%) | 0 (0.0%) |
| Administrative & Support | 21 (42.9%) | 28 (57.1%) |
| Educational Services | 33 (26.2%) | 93 (73.8%) |
| Health Care & Social Assistance | 8 (4.9%) | 156 (95.1%) |
| Arts, Entertainment & Recreation | 0 (0.0%) | 8 (100.0%) |
| Accommodation & Food Services | 6 (18.8%) | 26 (81.2%) |
| Public Administration | 111 (57.5%) | 82 (42.5%) |
| Total | 609 (36.6%) | 1,054 (63.4%) |
Education in Harlem
School Enrollment in Harlem
The most common levels of schooling among the 1,340 students in Harlem are high school (445 | 33.2%), college / undergraduate (253 | 18.9%), and middle school (173 | 12.9%).
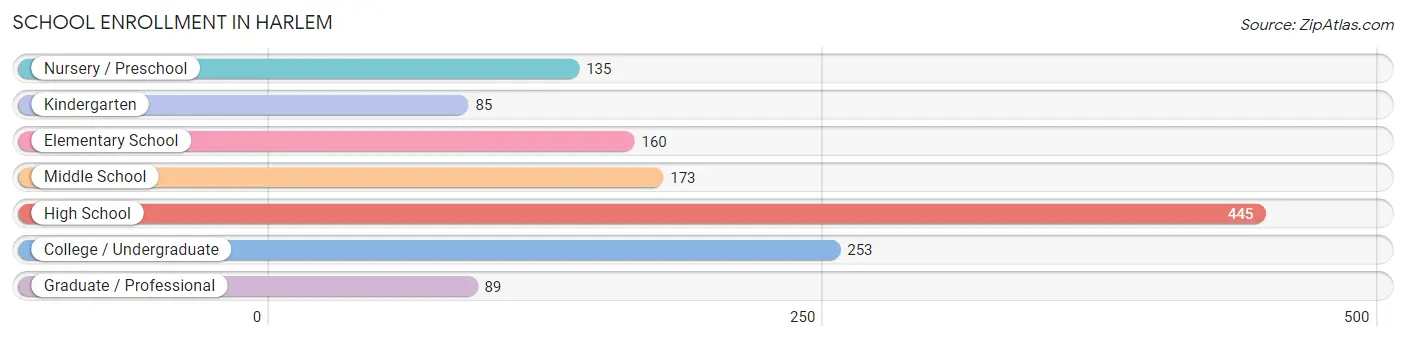
| School Level | # Students | % Students |
| Nursery / Preschool | 135 | 10.1% |
| Kindergarten | 85 | 6.3% |
| Elementary School | 160 | 11.9% |
| Middle School | 173 | 12.9% |
| High School | 445 | 33.2% |
| College / Undergraduate | 253 | 18.9% |
| Graduate / Professional | 89 | 6.6% |
| Total | 1,340 | 100.0% |
School Enrollment by Age by Funding Source in Harlem
Out of a total of 1,340 students who are enrolled in schools in Harlem, 296 (22.1%) attend a private institution, while the remaining 1,044 (77.9%) are enrolled in public schools. The age group of 3 to 4 year olds has the highest likelihood of being enrolled in private schools, with 89 (93.7% in the age bracket) enrolled. Conversely, the age group of 10 to 14 year olds has the lowest likelihood of being enrolled in a private school, with 458 (100.0% in the age bracket) attending a public institution.
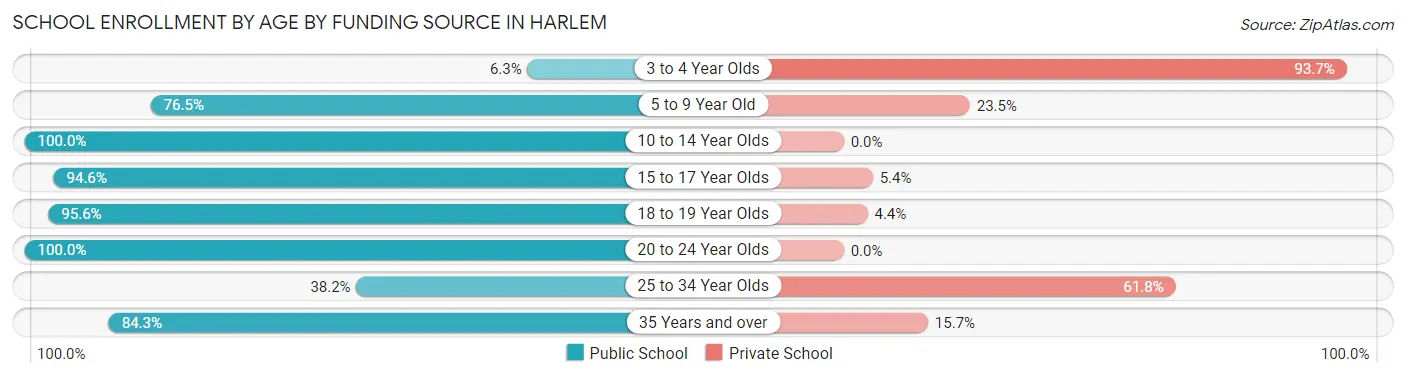
| Age Bracket | Public School | Private School |
| 3 to 4 Year Olds | 6 (6.3%) | 89 (93.7%) |
| 5 to 9 Year Old | 215 (76.5%) | 66 (23.5%) |
| 10 to 14 Year Olds | 458 (100.0%) | 0 (0.0%) |
| 15 to 17 Year Olds | 140 (94.6%) | 8 (5.4%) |
| 18 to 19 Year Olds | 43 (95.6%) | 2 (4.4%) |
| 20 to 24 Year Olds | 63 (100.0%) | 0 (0.0%) |
| 25 to 34 Year Olds | 76 (38.2%) | 123 (61.8%) |
| 35 Years and over | 43 (84.3%) | 8 (15.7%) |
| Total | 1,044 (77.9%) | 296 (22.1%) |
Educational Attainment by Field of Study in Harlem
Business (134 | 29.8%), science & technology (101 | 22.5%), education (85 | 18.9%), social sciences (28 | 6.2%), and bio, nature & agricultural (19 | 4.2%) are the most common fields of study among 449 individuals in Harlem who have obtained a bachelor's degree or higher.
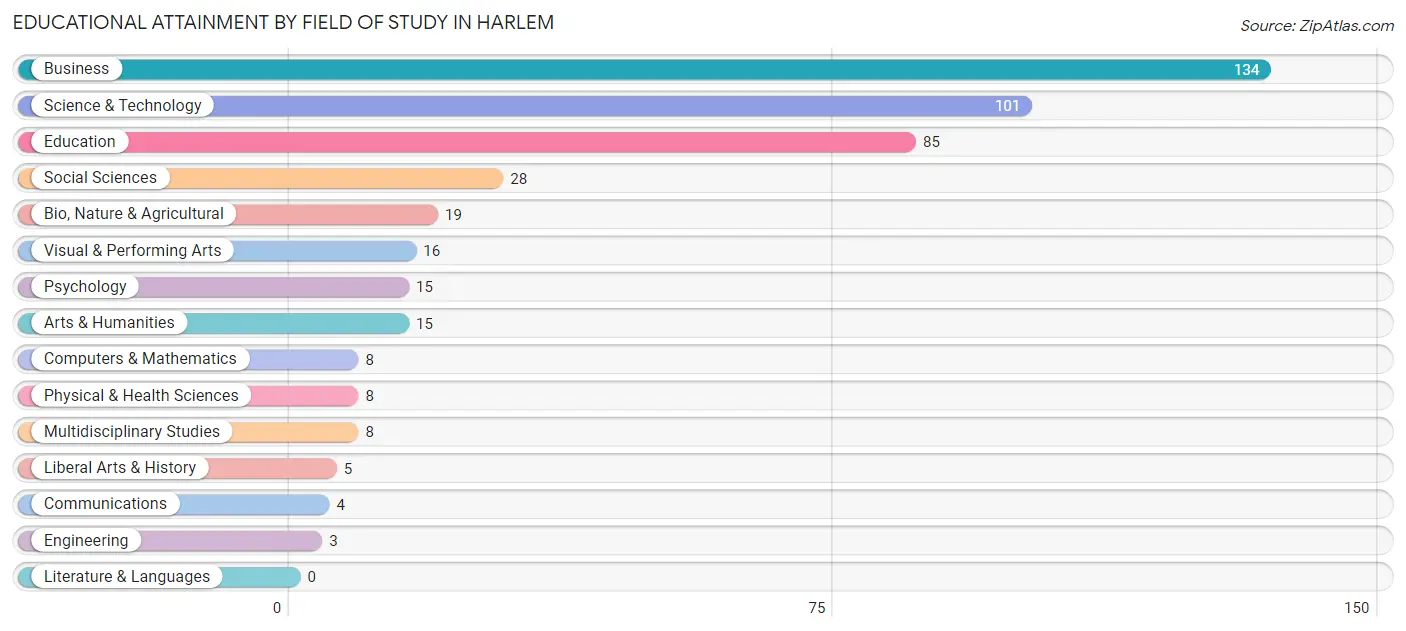
| Field of Study | # Graduates | % Graduates |
| Computers & Mathematics | 8 | 1.8% |
| Bio, Nature & Agricultural | 19 | 4.2% |
| Physical & Health Sciences | 8 | 1.8% |
| Psychology | 15 | 3.3% |
| Social Sciences | 28 | 6.2% |
| Engineering | 3 | 0.7% |
| Multidisciplinary Studies | 8 | 1.8% |
| Science & Technology | 101 | 22.5% |
| Business | 134 | 29.8% |
| Education | 85 | 18.9% |
| Literature & Languages | 0 | 0.0% |
| Liberal Arts & History | 5 | 1.1% |
| Visual & Performing Arts | 16 | 3.6% |
| Communications | 4 | 0.9% |
| Arts & Humanities | 15 | 3.3% |
| Total | 449 | 100.0% |
Transportation & Commute in Harlem
Vehicle Availability by Sex in Harlem
The most prevalent vehicle ownership categories in Harlem are males with 2 vehicles (318, accounting for 48.0%) and females with 2 vehicles (472, making up 30.6%).
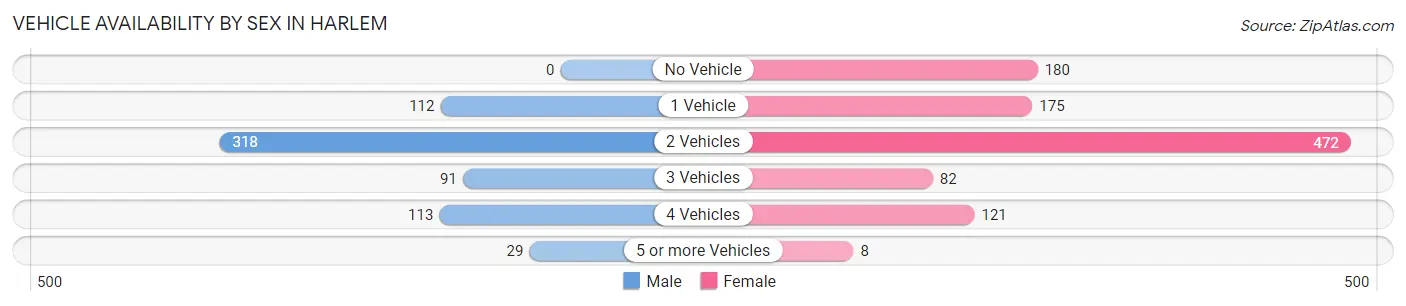
| Vehicles Available | Male | Female |
| No Vehicle | 0 (0.0%) | 180 (17.3%) |
| 1 Vehicle | 112 (16.9%) | 175 (16.9%) |
| 2 Vehicles | 318 (48.0%) | 472 (45.5%) |
| 3 Vehicles | 91 (13.7%) | 82 (7.9%) |
| 4 Vehicles | 113 (17.0%) | 121 (11.7%) |
| 5 or more Vehicles | 29 (4.4%) | 8 (0.8%) |
| Total | 663 (100.0%) | 1,038 (100.0%) |
Commute Time in Harlem
The most frequently occuring commute durations in Harlem are 30 to 34 minutes (500 commuters, 33.1%), 20 to 24 minutes (234 commuters, 15.5%), and 15 to 19 minutes (233 commuters, 15.4%).
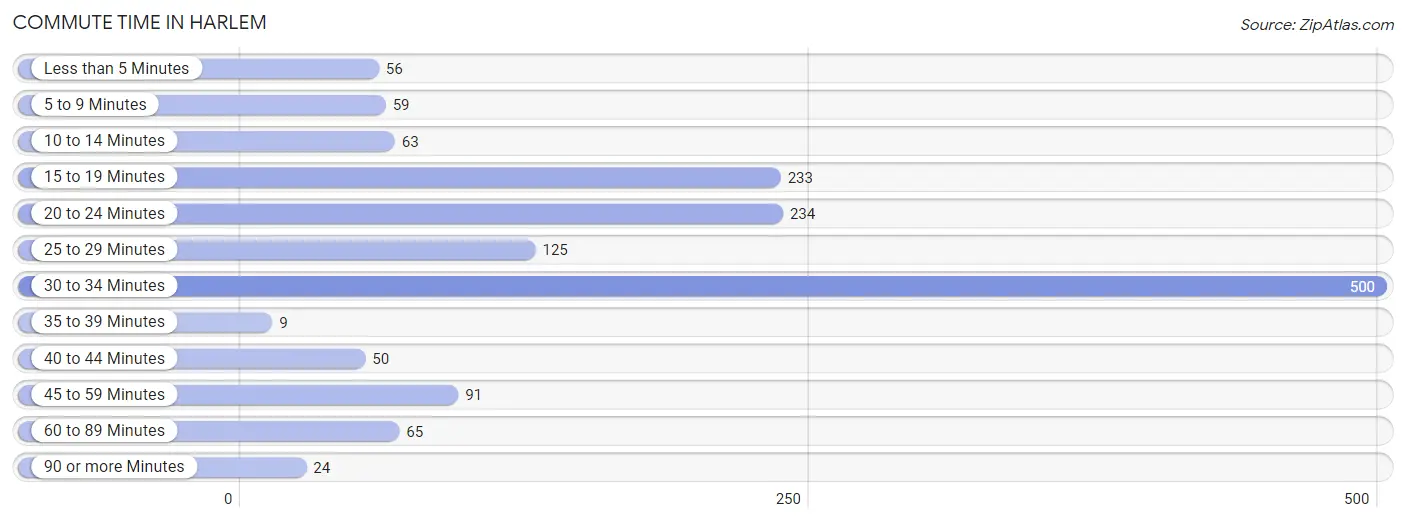
| Commute Time | # Commuters | % Commuters |
| Less than 5 Minutes | 56 | 3.7% |
| 5 to 9 Minutes | 59 | 3.9% |
| 10 to 14 Minutes | 63 | 4.2% |
| 15 to 19 Minutes | 233 | 15.4% |
| 20 to 24 Minutes | 234 | 15.5% |
| 25 to 29 Minutes | 125 | 8.3% |
| 30 to 34 Minutes | 500 | 33.1% |
| 35 to 39 Minutes | 9 | 0.6% |
| 40 to 44 Minutes | 50 | 3.3% |
| 45 to 59 Minutes | 91 | 6.0% |
| 60 to 89 Minutes | 65 | 4.3% |
| 90 or more Minutes | 24 | 1.6% |
Commute Time by Sex in Harlem
The most common commute times in Harlem are 30 to 34 minutes (186 commuters, 28.1%) for males and 30 to 34 minutes (314 commuters, 37.1%) for females.
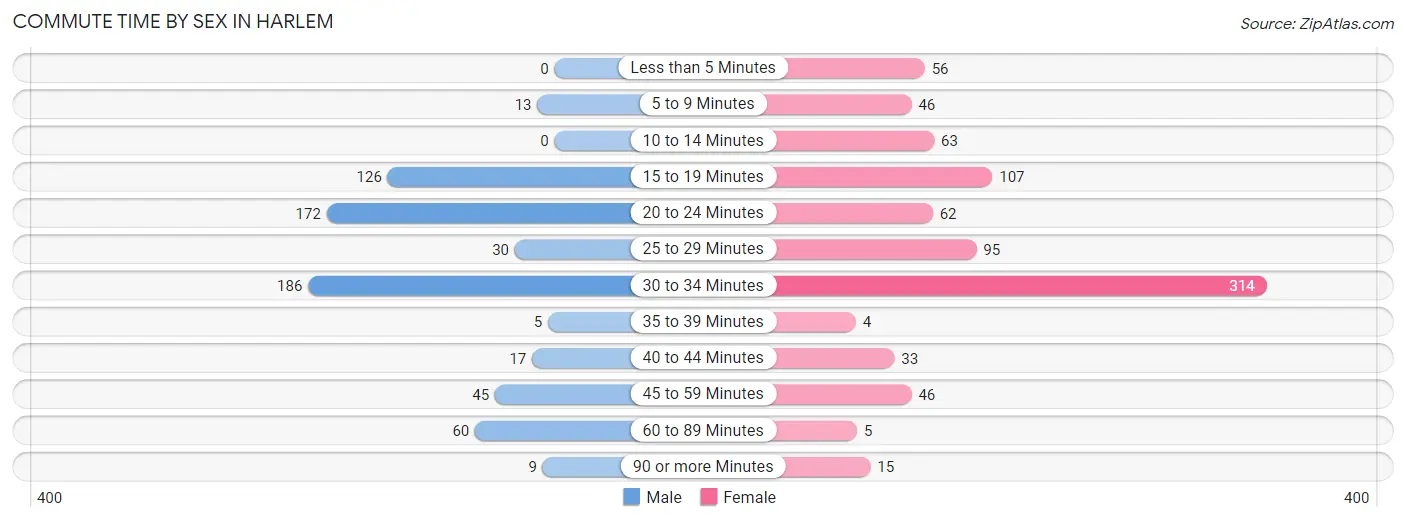
| Commute Time | Male | Female |
| Less than 5 Minutes | 0 (0.0%) | 56 (6.6%) |
| 5 to 9 Minutes | 13 (2.0%) | 46 (5.4%) |
| 10 to 14 Minutes | 0 (0.0%) | 63 (7.4%) |
| 15 to 19 Minutes | 126 (19.0%) | 107 (12.7%) |
| 20 to 24 Minutes | 172 (25.9%) | 62 (7.3%) |
| 25 to 29 Minutes | 30 (4.5%) | 95 (11.2%) |
| 30 to 34 Minutes | 186 (28.1%) | 314 (37.1%) |
| 35 to 39 Minutes | 5 (0.7%) | 4 (0.5%) |
| 40 to 44 Minutes | 17 (2.6%) | 33 (3.9%) |
| 45 to 59 Minutes | 45 (6.8%) | 46 (5.4%) |
| 60 to 89 Minutes | 60 (9.0%) | 5 (0.6%) |
| 90 or more Minutes | 9 (1.4%) | 15 (1.8%) |
Time of Departure to Work by Sex in Harlem
The most frequent times of departure to work in Harlem are 6:00 AM to 6:29 AM (119, 17.9%) for males and 8:00 AM to 8:29 AM (196, 23.2%) for females.
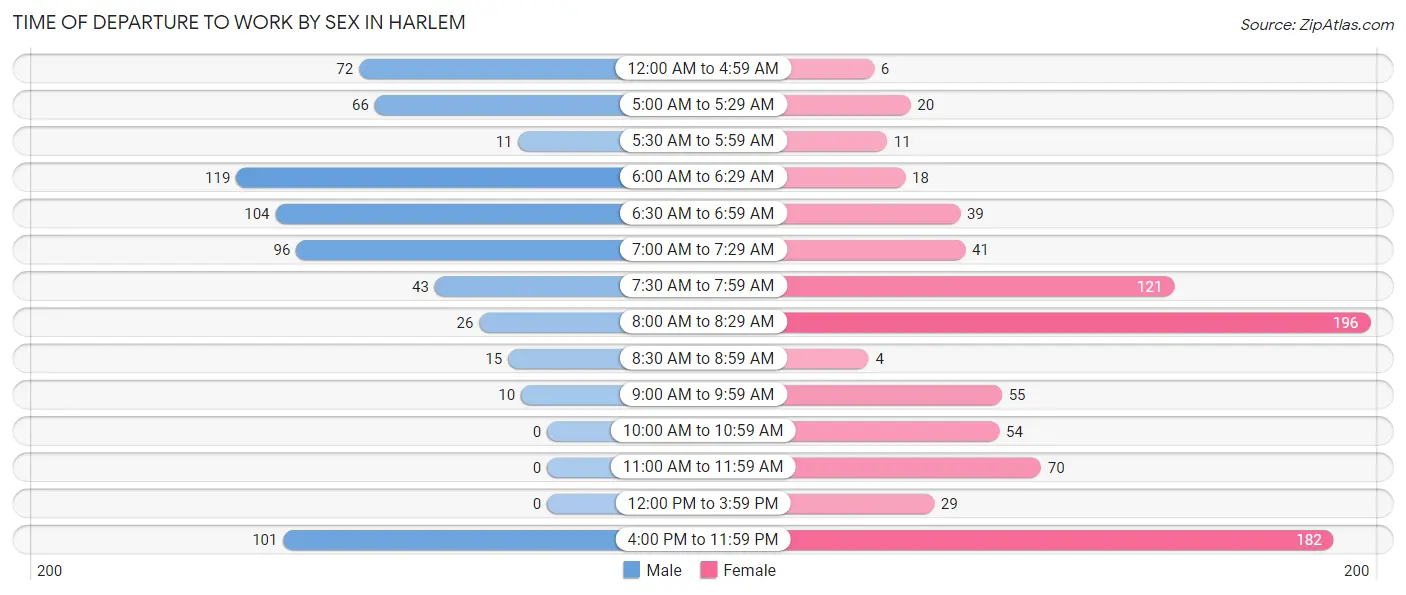
| Time of Departure | Male | Female |
| 12:00 AM to 4:59 AM | 72 (10.9%) | 6 (0.7%) |
| 5:00 AM to 5:29 AM | 66 (10.0%) | 20 (2.4%) |
| 5:30 AM to 5:59 AM | 11 (1.7%) | 11 (1.3%) |
| 6:00 AM to 6:29 AM | 119 (17.9%) | 18 (2.1%) |
| 6:30 AM to 6:59 AM | 104 (15.7%) | 39 (4.6%) |
| 7:00 AM to 7:29 AM | 96 (14.5%) | 41 (4.9%) |
| 7:30 AM to 7:59 AM | 43 (6.5%) | 121 (14.3%) |
| 8:00 AM to 8:29 AM | 26 (3.9%) | 196 (23.2%) |
| 8:30 AM to 8:59 AM | 15 (2.3%) | 4 (0.5%) |
| 9:00 AM to 9:59 AM | 10 (1.5%) | 55 (6.5%) |
| 10:00 AM to 10:59 AM | 0 (0.0%) | 54 (6.4%) |
| 11:00 AM to 11:59 AM | 0 (0.0%) | 70 (8.3%) |
| 12:00 PM to 3:59 PM | 0 (0.0%) | 29 (3.4%) |
| 4:00 PM to 11:59 PM | 101 (15.2%) | 182 (21.5%) |
| Total | 663 (100.0%) | 846 (100.0%) |
Housing Occupancy in Harlem
Occupancy by Ownership in Harlem
Of the total 1,241 dwellings in Harlem, owner-occupied units account for 802 (64.6%), while renter-occupied units make up 439 (35.4%).
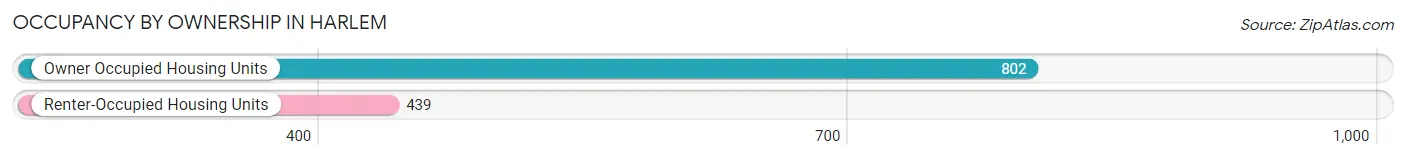
| Occupancy | # Housing Units | % Housing Units |
| Owner Occupied Housing Units | 802 | 64.6% |
| Renter-Occupied Housing Units | 439 | 35.4% |
| Total Occupied Housing Units | 1,241 | 100.0% |
Occupancy by Household Size in Harlem
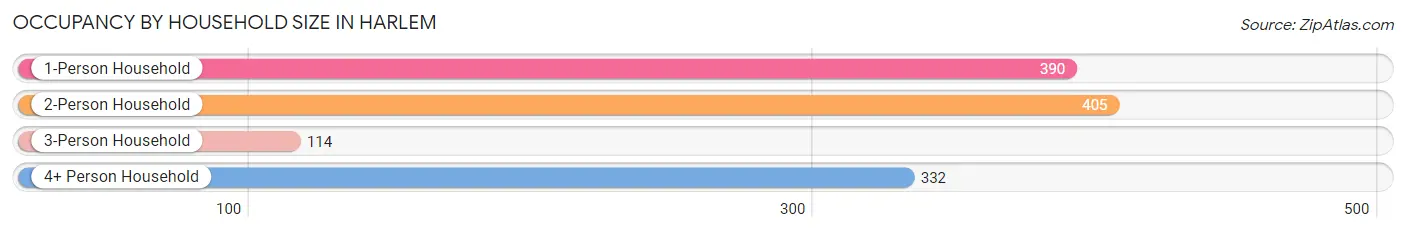
| Household Size | # Housing Units | % Housing Units |
| 1-Person Household | 390 | 31.4% |
| 2-Person Household | 405 | 32.6% |
| 3-Person Household | 114 | 9.2% |
| 4+ Person Household | 332 | 26.8% |
| Total Housing Units | 1,241 | 100.0% |
Occupancy by Ownership by Household Size in Harlem
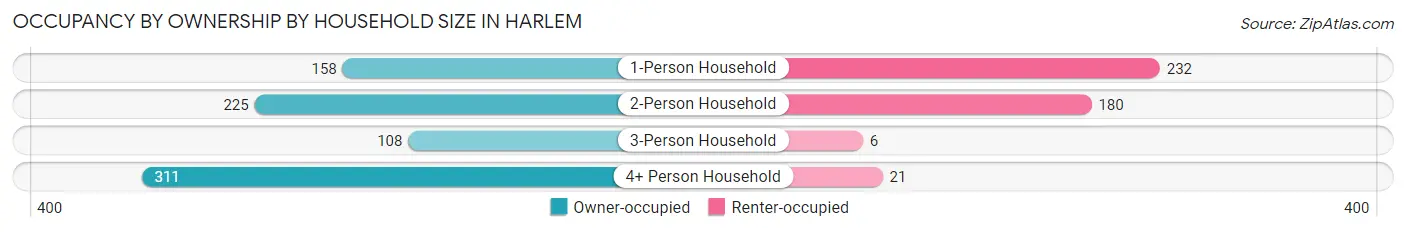
| Household Size | Owner-occupied | Renter-occupied |
| 1-Person Household | 158 (40.5%) | 232 (59.5%) |
| 2-Person Household | 225 (55.6%) | 180 (44.4%) |
| 3-Person Household | 108 (94.7%) | 6 (5.3%) |
| 4+ Person Household | 311 (93.7%) | 21 (6.3%) |
| Total Housing Units | 802 (64.6%) | 439 (35.4%) |
Occupancy by Educational Attainment in Harlem
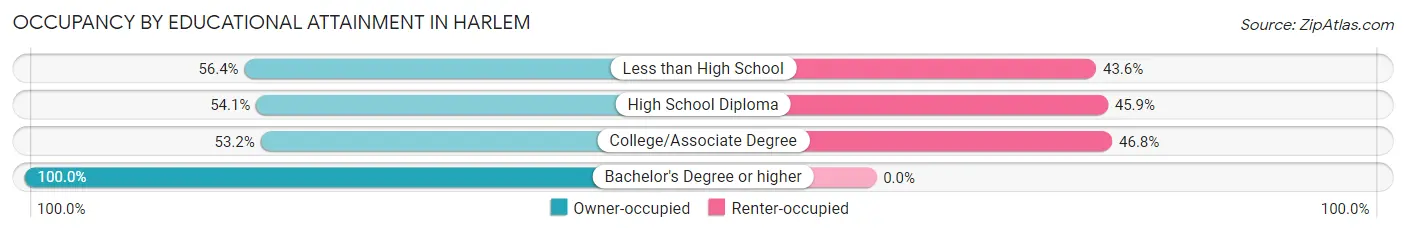
| Household Size | Owner-occupied | Renter-occupied |
| Less than High School | 22 (56.4%) | 17 (43.6%) |
| High School Diploma | 232 (54.1%) | 197 (45.9%) |
| College/Associate Degree | 256 (53.2%) | 225 (46.8%) |
| Bachelor's Degree or higher | 292 (100.0%) | 0 (0.0%) |
Occupancy by Age of Householder in Harlem
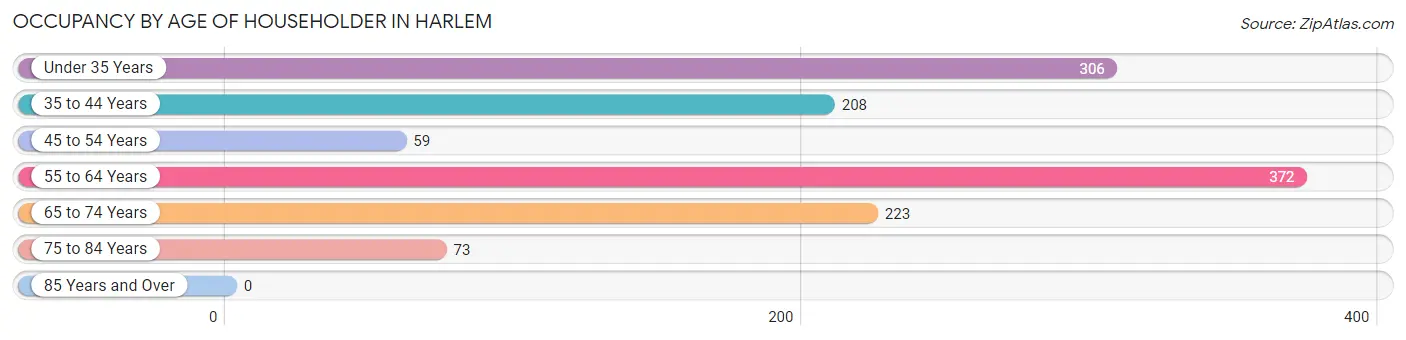
| Age Bracket | # Households | % Households |
| Under 35 Years | 306 | 24.7% |
| 35 to 44 Years | 208 | 16.8% |
| 45 to 54 Years | 59 | 4.8% |
| 55 to 64 Years | 372 | 30.0% |
| 65 to 74 Years | 223 | 18.0% |
| 75 to 84 Years | 73 | 5.9% |
| 85 Years and Over | 0 | 0.0% |
| Total | 1,241 | 100.0% |
Housing Finances in Harlem
Median Income by Occupancy in Harlem
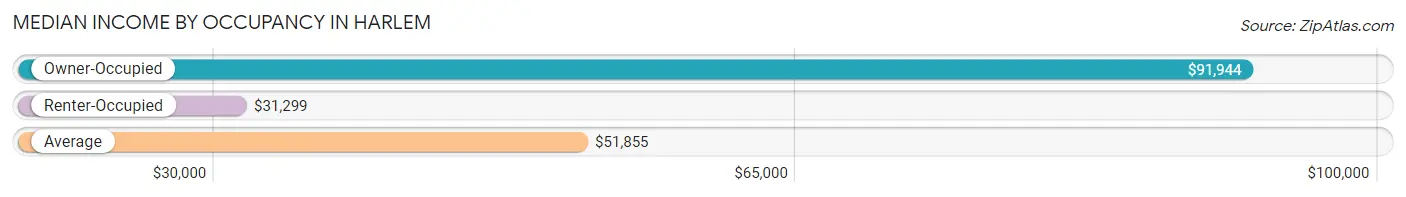
| Occupancy Type | # Households | Median Income |
| Owner-Occupied | 802 (64.6%) | $91,944 |
| Renter-Occupied | 439 (35.4%) | $31,299 |
| Average | 1,241 (100.0%) | $51,855 |
Occupancy by Householder Income Bracket in Harlem
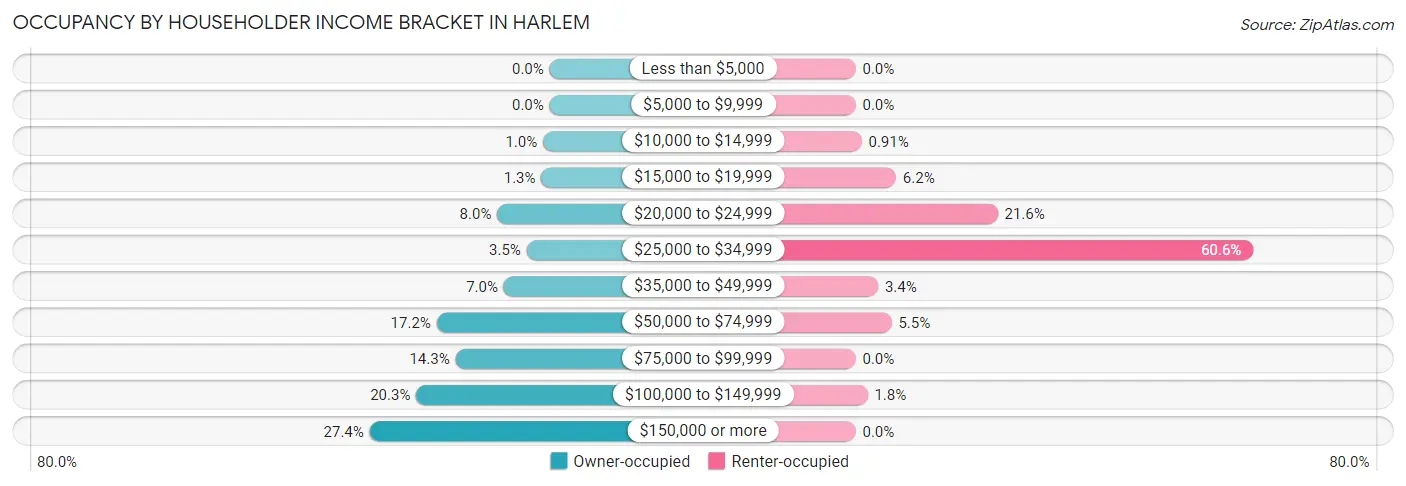
| Income Bracket | Owner-occupied | Renter-occupied |
| Less than $5,000 | 0 (0.0%) | 0 (0.0%) |
| $5,000 to $9,999 | 0 (0.0%) | 0 (0.0%) |
| $10,000 to $14,999 | 8 (1.0%) | 4 (0.9%) |
| $15,000 to $19,999 | 10 (1.3%) | 27 (6.1%) |
| $20,000 to $24,999 | 64 (8.0%) | 95 (21.6%) |
| $25,000 to $34,999 | 28 (3.5%) | 266 (60.6%) |
| $35,000 to $49,999 | 56 (7.0%) | 15 (3.4%) |
| $50,000 to $74,999 | 138 (17.2%) | 24 (5.5%) |
| $75,000 to $99,999 | 115 (14.3%) | 0 (0.0%) |
| $100,000 to $149,999 | 163 (20.3%) | 8 (1.8%) |
| $150,000 or more | 220 (27.4%) | 0 (0.0%) |
| Total | 802 (100.0%) | 439 (100.0%) |
Monthly Housing Cost Tiers in Harlem
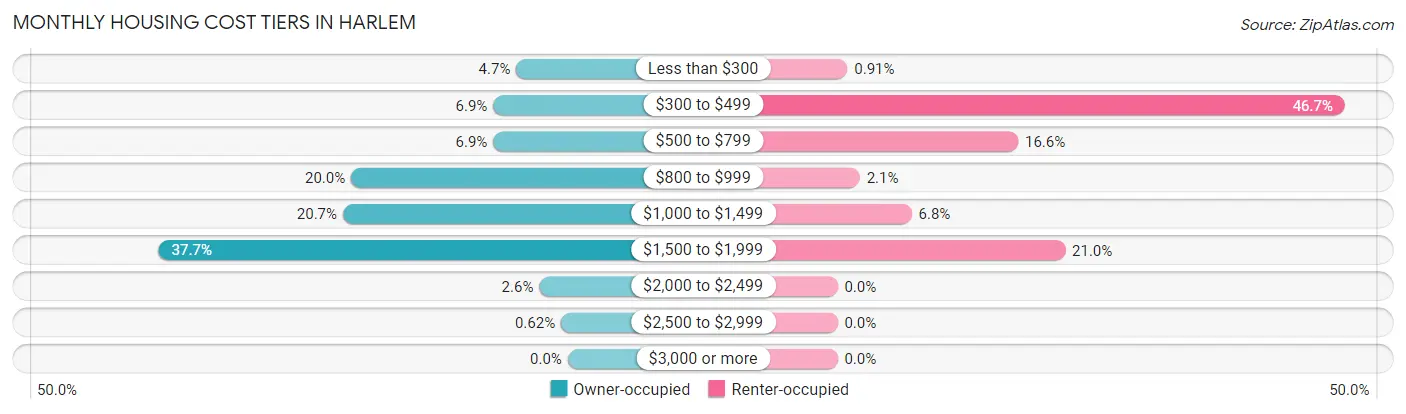
| Monthly Cost | Owner-occupied | Renter-occupied |
| Less than $300 | 38 (4.7%) | 4 (0.9%) |
| $300 to $499 | 55 (6.9%) | 205 (46.7%) |
| $500 to $799 | 55 (6.9%) | 73 (16.6%) |
| $800 to $999 | 160 (20.0%) | 9 (2.1%) |
| $1,000 to $1,499 | 166 (20.7%) | 30 (6.8%) |
| $1,500 to $1,999 | 302 (37.7%) | 92 (21.0%) |
| $2,000 to $2,499 | 21 (2.6%) | 0 (0.0%) |
| $2,500 to $2,999 | 5 (0.6%) | 0 (0.0%) |
| $3,000 or more | 0 (0.0%) | 0 (0.0%) |
| Total | 802 (100.0%) | 439 (100.0%) |
Physical Housing Characteristics in Harlem
Housing Structures in Harlem
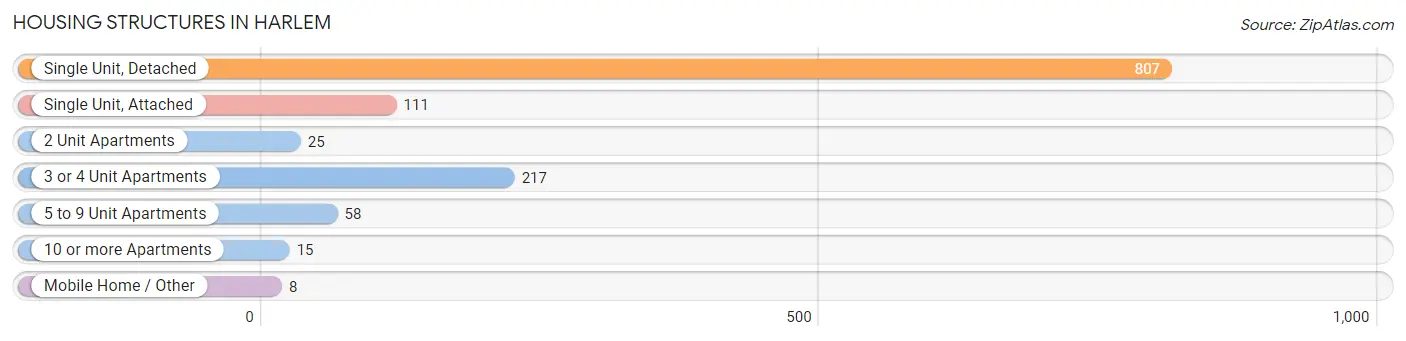
| Structure Type | # Housing Units | % Housing Units |
| Single Unit, Detached | 807 | 65.0% |
| Single Unit, Attached | 111 | 8.9% |
| 2 Unit Apartments | 25 | 2.0% |
| 3 or 4 Unit Apartments | 217 | 17.5% |
| 5 to 9 Unit Apartments | 58 | 4.7% |
| 10 or more Apartments | 15 | 1.2% |
| Mobile Home / Other | 8 | 0.6% |
| Total | 1,241 | 100.0% |
Housing Structures by Occupancy in Harlem
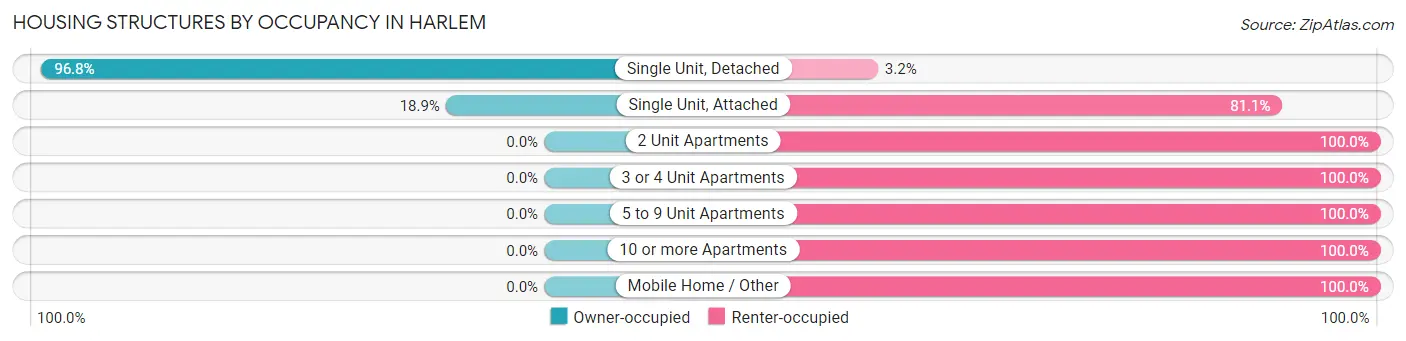
| Structure Type | Owner-occupied | Renter-occupied |
| Single Unit, Detached | 781 (96.8%) | 26 (3.2%) |
| Single Unit, Attached | 21 (18.9%) | 90 (81.1%) |
| 2 Unit Apartments | 0 (0.0%) | 25 (100.0%) |
| 3 or 4 Unit Apartments | 0 (0.0%) | 217 (100.0%) |
| 5 to 9 Unit Apartments | 0 (0.0%) | 58 (100.0%) |
| 10 or more Apartments | 0 (0.0%) | 15 (100.0%) |
| Mobile Home / Other | 0 (0.0%) | 8 (100.0%) |
| Total | 802 (64.6%) | 439 (35.4%) |
Housing Structures by Number of Rooms in Harlem
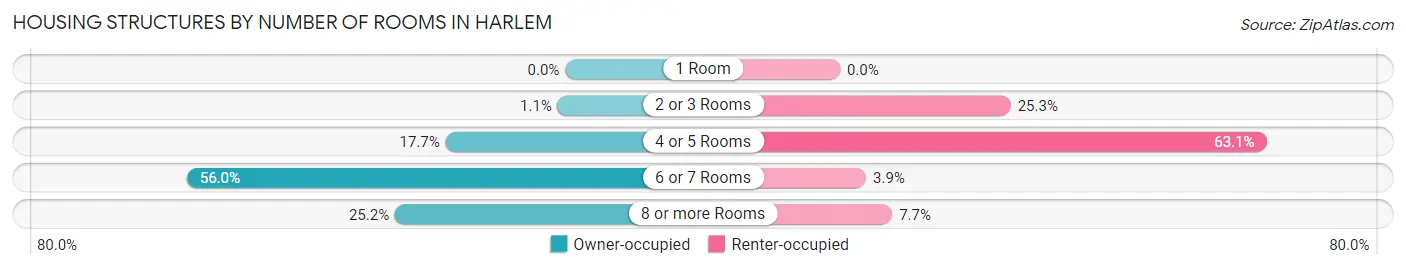
| Number of Rooms | Owner-occupied | Renter-occupied |
| 1 Room | 0 (0.0%) | 0 (0.0%) |
| 2 or 3 Rooms | 9 (1.1%) | 111 (25.3%) |
| 4 or 5 Rooms | 142 (17.7%) | 277 (63.1%) |
| 6 or 7 Rooms | 449 (56.0%) | 17 (3.9%) |
| 8 or more Rooms | 202 (25.2%) | 34 (7.7%) |
| Total | 802 (100.0%) | 439 (100.0%) |
Housing Structure by Heating Type in Harlem
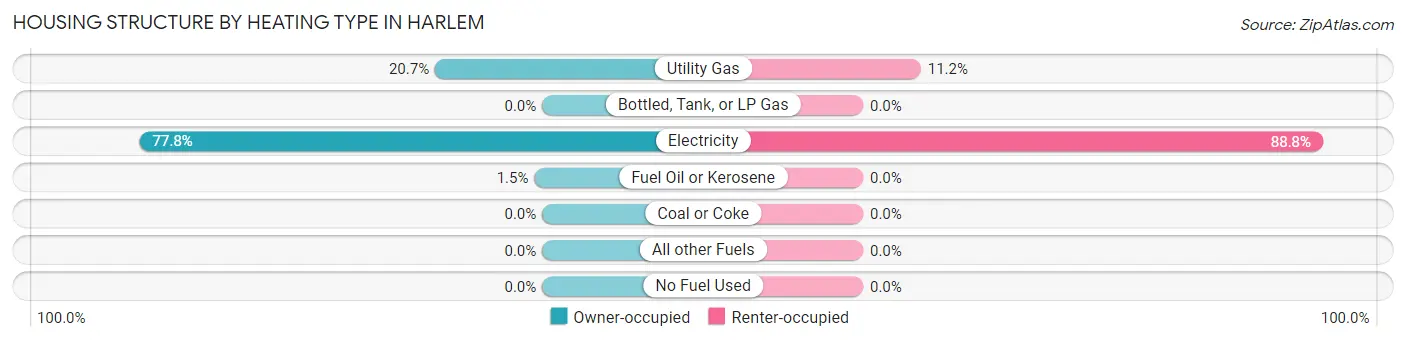
| Heating Type | Owner-occupied | Renter-occupied |
| Utility Gas | 166 (20.7%) | 49 (11.2%) |
| Bottled, Tank, or LP Gas | 0 (0.0%) | 0 (0.0%) |
| Electricity | 624 (77.8%) | 390 (88.8%) |
| Fuel Oil or Kerosene | 12 (1.5%) | 0 (0.0%) |
| Coal or Coke | 0 (0.0%) | 0 (0.0%) |
| All other Fuels | 0 (0.0%) | 0 (0.0%) |
| No Fuel Used | 0 (0.0%) | 0 (0.0%) |
| Total | 802 (100.0%) | 439 (100.0%) |
Household Vehicle Usage in Harlem
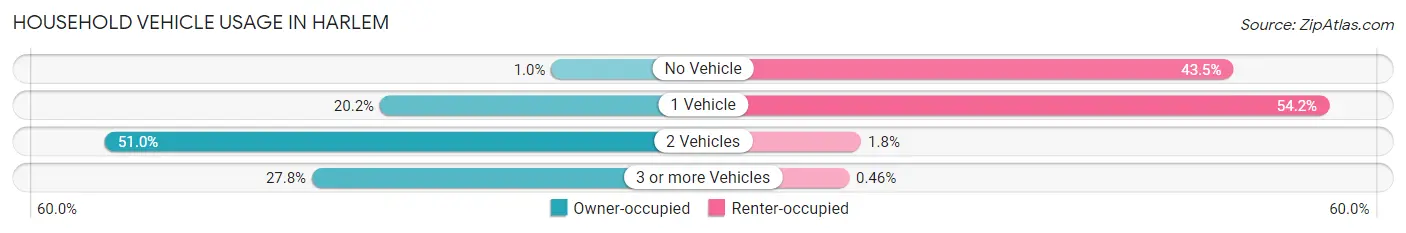
| Vehicles per Household | Owner-occupied | Renter-occupied |
| No Vehicle | 8 (1.0%) | 191 (43.5%) |
| 1 Vehicle | 162 (20.2%) | 238 (54.2%) |
| 2 Vehicles | 409 (51.0%) | 8 (1.8%) |
| 3 or more Vehicles | 223 (27.8%) | 2 (0.5%) |
| Total | 802 (100.0%) | 439 (100.0%) |
Real Estate & Mortgages in Harlem
Real Estate and Mortgage Overview in Harlem
| Characteristic | Without Mortgage | With Mortgage |
| Housing Units | 183 | 619 |
| Median Property Value | $206,800 | $215,100 |
| Median Household Income | - | - |
| Monthly Housing Costs | $488 | $0 |
| Real Estate Taxes | - | - |
Property Value by Mortgage Status in Harlem
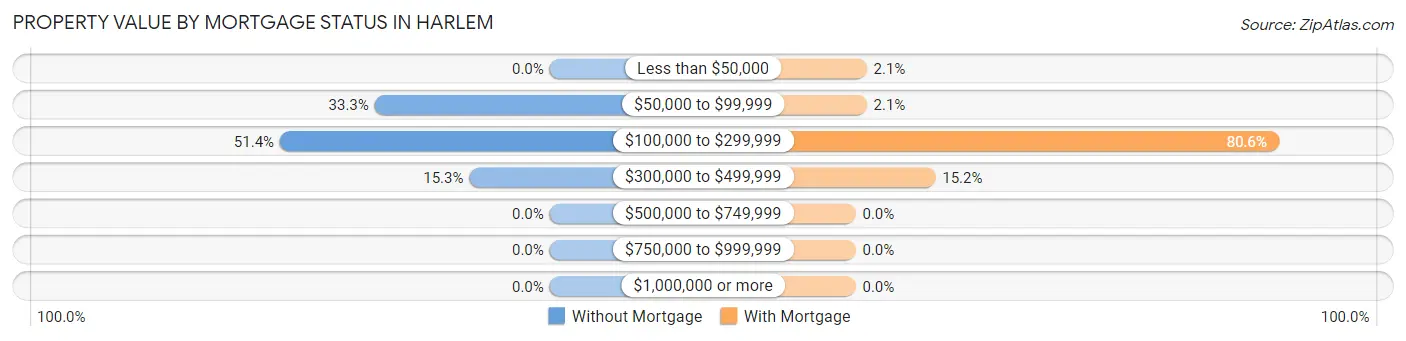
| Property Value | Without Mortgage | With Mortgage |
| Less than $50,000 | 0 (0.0%) | 13 (2.1%) |
| $50,000 to $99,999 | 61 (33.3%) | 13 (2.1%) |
| $100,000 to $299,999 | 94 (51.4%) | 499 (80.6%) |
| $300,000 to $499,999 | 28 (15.3%) | 94 (15.2%) |
| $500,000 to $749,999 | 0 (0.0%) | 0 (0.0%) |
| $750,000 to $999,999 | 0 (0.0%) | 0 (0.0%) |
| $1,000,000 or more | 0 (0.0%) | 0 (0.0%) |
| Total | 183 (100.0%) | 619 (100.0%) |
Household Income by Mortgage Status in Harlem
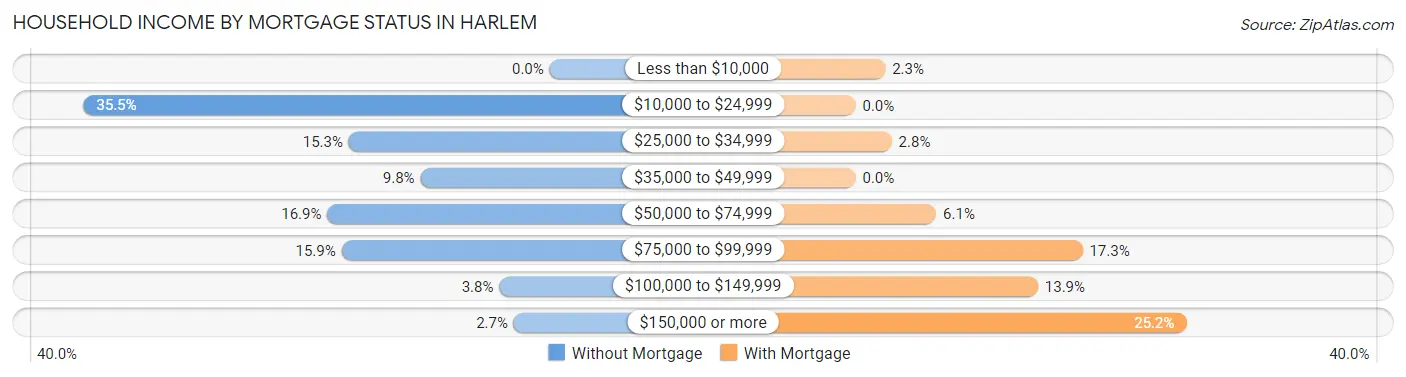
| Household Income | Without Mortgage | With Mortgage |
| Less than $10,000 | 0 (0.0%) | 14 (2.3%) |
| $10,000 to $24,999 | 65 (35.5%) | 0 (0.0%) |
| $25,000 to $34,999 | 28 (15.3%) | 17 (2.8%) |
| $35,000 to $49,999 | 18 (9.8%) | 0 (0.0%) |
| $50,000 to $74,999 | 31 (16.9%) | 38 (6.1%) |
| $75,000 to $99,999 | 29 (15.9%) | 107 (17.3%) |
| $100,000 to $149,999 | 7 (3.8%) | 86 (13.9%) |
| $150,000 or more | 5 (2.7%) | 156 (25.2%) |
| Total | 183 (100.0%) | 619 (100.0%) |
Property Value to Household Income Ratio in Harlem
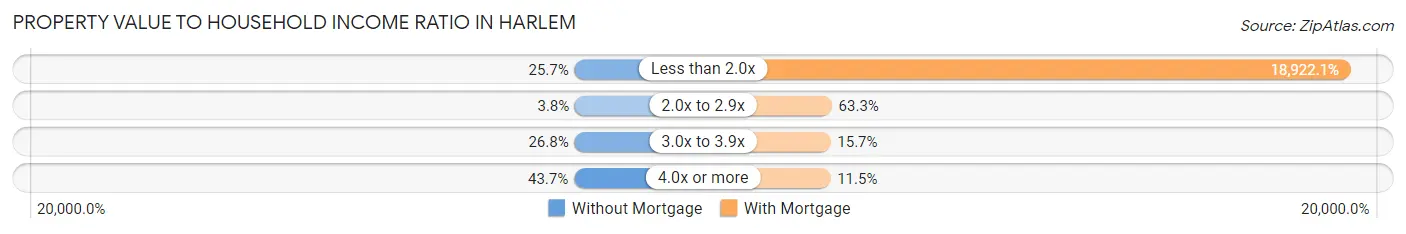
| Value-to-Income Ratio | Without Mortgage | With Mortgage |
| Less than 2.0x | 47 (25.7%) | 117,128 (18,922.1%) |
| 2.0x to 2.9x | 7 (3.8%) | 392 (63.3%) |
| 3.0x to 3.9x | 49 (26.8%) | 97 (15.7%) |
| 4.0x or more | 80 (43.7%) | 71 (11.5%) |
| Total | 183 (100.0%) | 619 (100.0%) |
Real Estate Taxes by Mortgage Status in Harlem
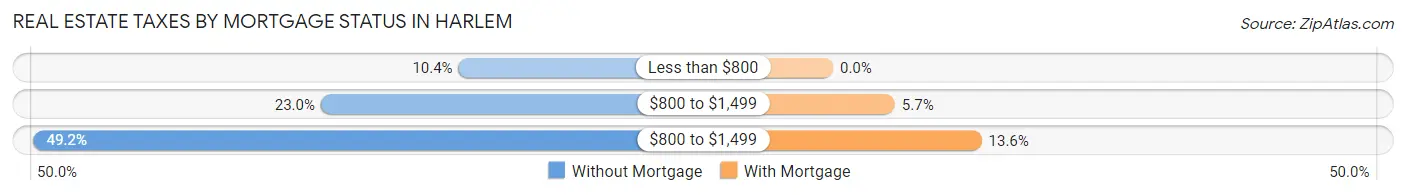
| Property Taxes | Without Mortgage | With Mortgage |
| Less than $800 | 19 (10.4%) | 0 (0.0%) |
| $800 to $1,499 | 42 (23.0%) | 35 (5.7%) |
| $800 to $1,499 | 90 (49.2%) | 84 (13.6%) |
| Total | 183 (100.0%) | 619 (100.0%) |
Health & Disability in Harlem
Health Insurance Coverage by Age in Harlem
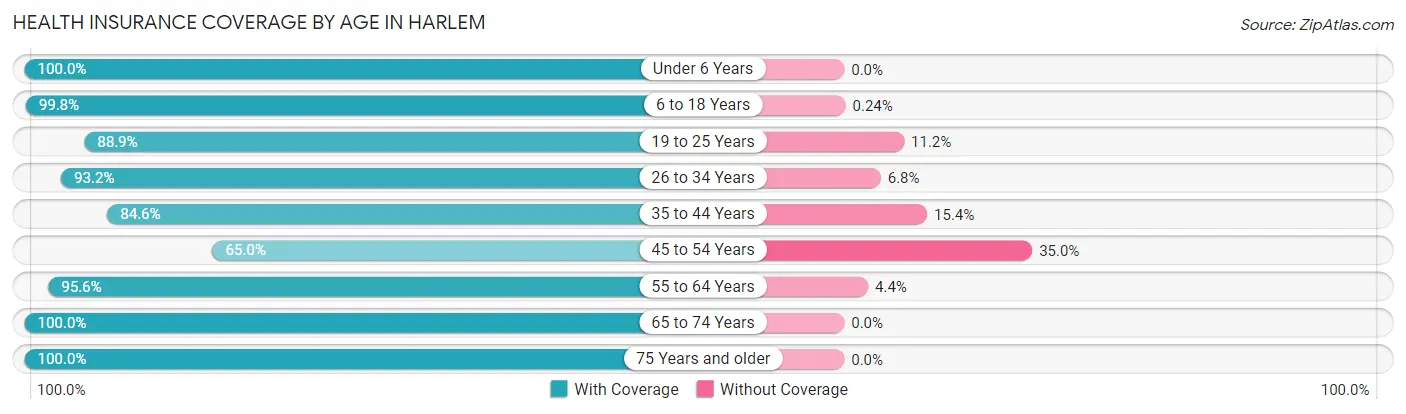
| Age Bracket | With Coverage | Without Coverage |
| Under 6 Years | 405 (100.0%) | 0 (0.0%) |
| 6 to 18 Years | 841 (99.8%) | 2 (0.2%) |
| 19 to 25 Years | 231 (88.8%) | 29 (11.2%) |
| 26 to 34 Years | 493 (93.2%) | 36 (6.8%) |
| 35 to 44 Years | 504 (84.6%) | 92 (15.4%) |
| 45 to 54 Years | 76 (65.0%) | 41 (35.0%) |
| 55 to 64 Years | 409 (95.6%) | 19 (4.4%) |
| 65 to 74 Years | 349 (100.0%) | 0 (0.0%) |
| 75 Years and older | 101 (100.0%) | 0 (0.0%) |
| Total | 3,409 (94.0%) | 219 (6.0%) |
Health Insurance Coverage by Citizenship Status in Harlem
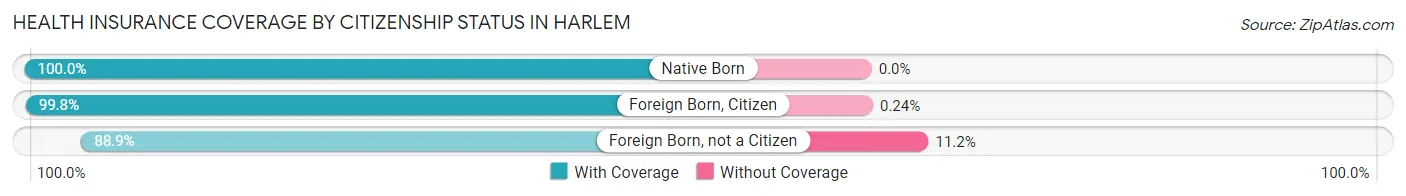
| Citizenship Status | With Coverage | Without Coverage |
| Native Born | 405 (100.0%) | 0 (0.0%) |
| Foreign Born, Citizen | 841 (99.8%) | 2 (0.2%) |
| Foreign Born, not a Citizen | 231 (88.8%) | 29 (11.2%) |
Health Insurance Coverage by Household Income in Harlem
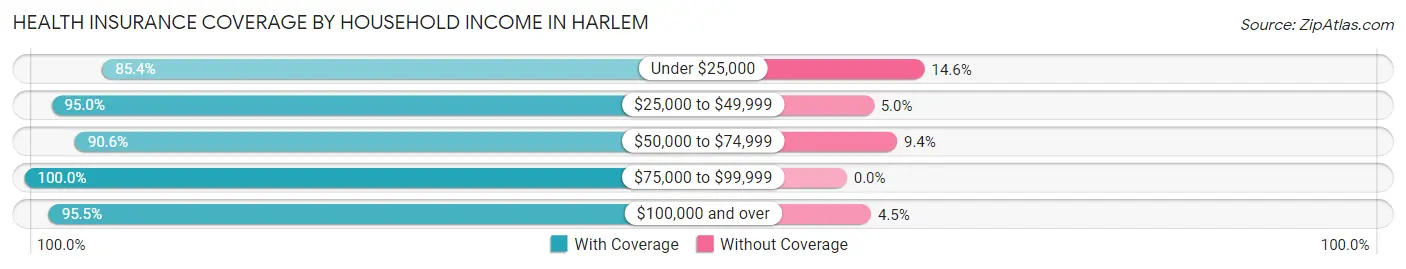
| Household Income | With Coverage | Without Coverage |
| Under $25,000 | 211 (85.4%) | 36 (14.6%) |
| $25,000 to $49,999 | 660 (95.0%) | 35 (5.0%) |
| $50,000 to $74,999 | 780 (90.6%) | 81 (9.4%) |
| $75,000 to $99,999 | 378 (100.0%) | 0 (0.0%) |
| $100,000 and over | 1,366 (95.5%) | 65 (4.5%) |
Public vs Private Health Insurance Coverage by Age in Harlem
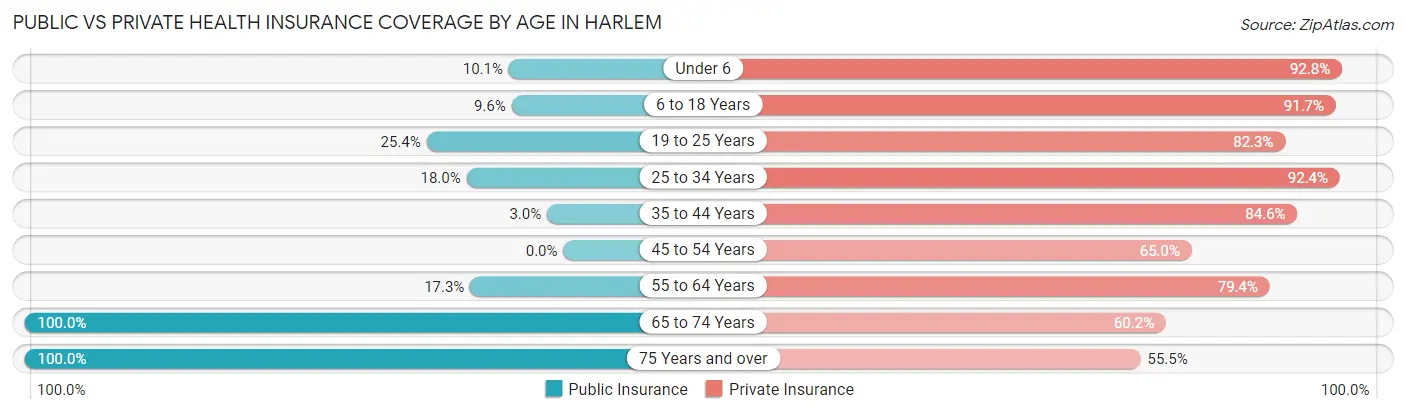
| Age Bracket | Public Insurance | Private Insurance |
| Under 6 | 41 (10.1%) | 376 (92.8%) |
| 6 to 18 Years | 81 (9.6%) | 773 (91.7%) |
| 19 to 25 Years | 66 (25.4%) | 214 (82.3%) |
| 25 to 34 Years | 95 (18.0%) | 489 (92.4%) |
| 35 to 44 Years | 18 (3.0%) | 504 (84.6%) |
| 45 to 54 Years | 0 (0.0%) | 76 (65.0%) |
| 55 to 64 Years | 74 (17.3%) | 340 (79.4%) |
| 65 to 74 Years | 349 (100.0%) | 210 (60.2%) |
| 75 Years and over | 101 (100.0%) | 56 (55.4%) |
| Total | 825 (22.7%) | 3,038 (83.7%) |
Disability Status by Sex by Age in Harlem
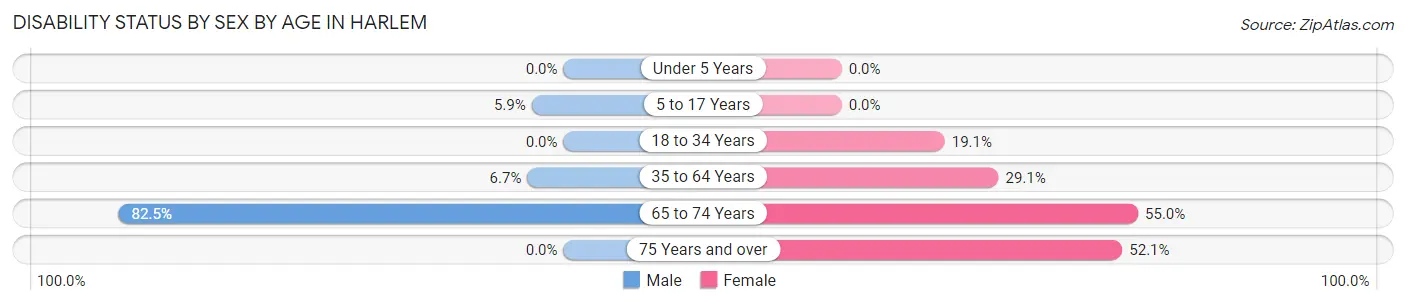
| Age Bracket | Male | Female |
| Under 5 Years | 0 (0.0%) | 0 (0.0%) |
| 5 to 17 Years | 17 (5.9%) | 0 (0.0%) |
| 18 to 34 Years | 0 (0.0%) | 91 (19.1%) |
| 35 to 64 Years | 29 (6.7%) | 206 (29.1%) |
| 65 to 74 Years | 156 (82.5%) | 88 (55.0%) |
| 75 Years and over | 0 (0.0%) | 50 (52.1%) |
Disability Class by Sex by Age in Harlem
Disability Class: Hearing Difficulty
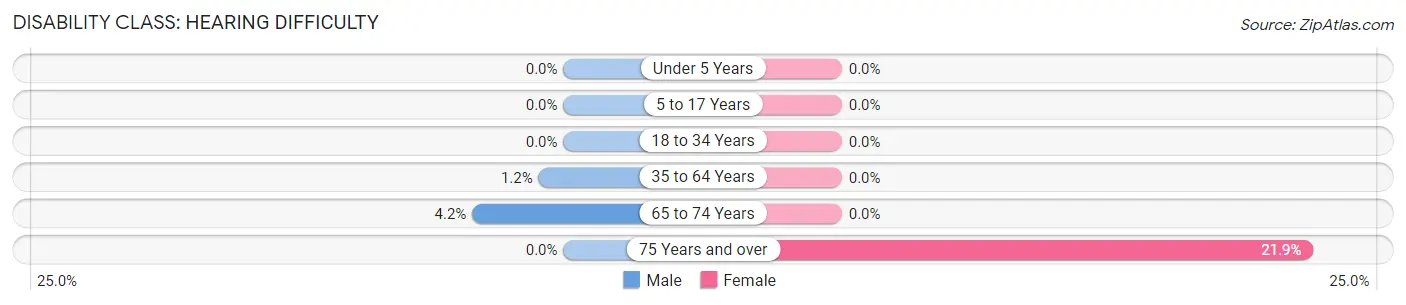
| Age Bracket | Male | Female |
| Under 5 Years | 0 (0.0%) | 0 (0.0%) |
| 5 to 17 Years | 0 (0.0%) | 0 (0.0%) |
| 18 to 34 Years | 0 (0.0%) | 0 (0.0%) |
| 35 to 64 Years | 5 (1.1%) | 0 (0.0%) |
| 65 to 74 Years | 8 (4.2%) | 0 (0.0%) |
| 75 Years and over | 0 (0.0%) | 21 (21.9%) |
Disability Class: Vision Difficulty
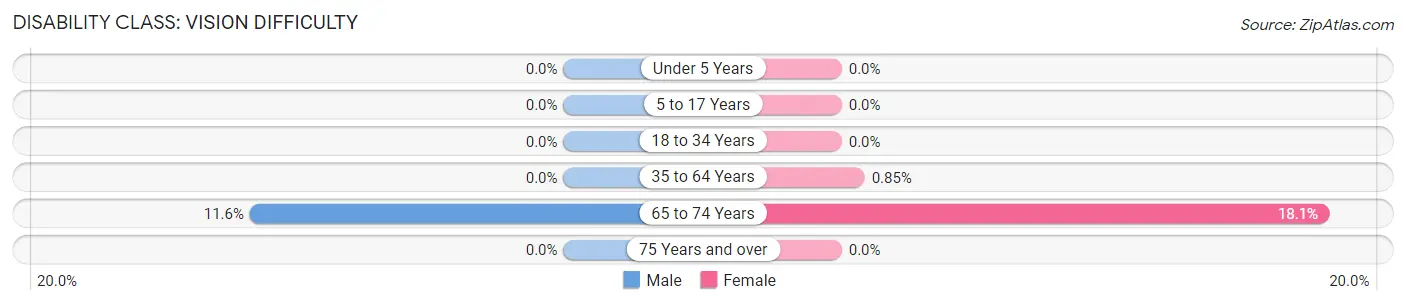
| Age Bracket | Male | Female |
| Under 5 Years | 0 (0.0%) | 0 (0.0%) |
| 5 to 17 Years | 0 (0.0%) | 0 (0.0%) |
| 18 to 34 Years | 0 (0.0%) | 0 (0.0%) |
| 35 to 64 Years | 0 (0.0%) | 6 (0.9%) |
| 65 to 74 Years | 22 (11.6%) | 29 (18.1%) |
| 75 Years and over | 0 (0.0%) | 0 (0.0%) |
Disability Class: Cognitive Difficulty
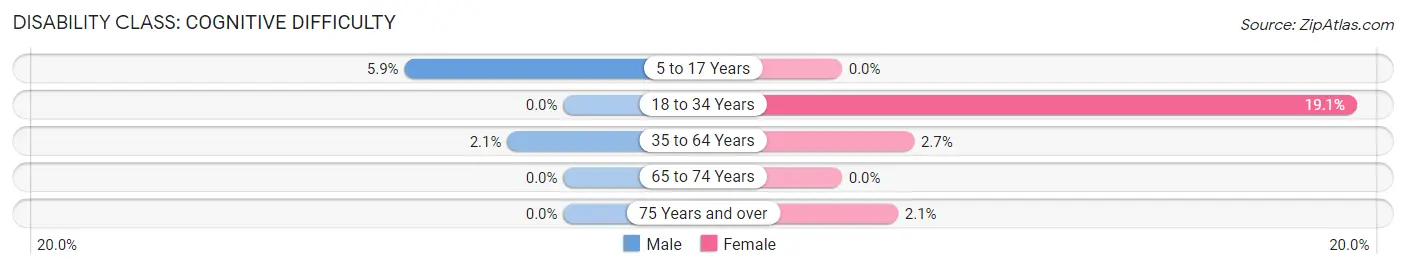
| Age Bracket | Male | Female |
| 5 to 17 Years | 17 (5.9%) | 0 (0.0%) |
| 18 to 34 Years | 0 (0.0%) | 91 (19.1%) |
| 35 to 64 Years | 9 (2.1%) | 19 (2.7%) |
| 65 to 74 Years | 0 (0.0%) | 0 (0.0%) |
| 75 Years and over | 0 (0.0%) | 2 (2.1%) |
Disability Class: Ambulatory Difficulty
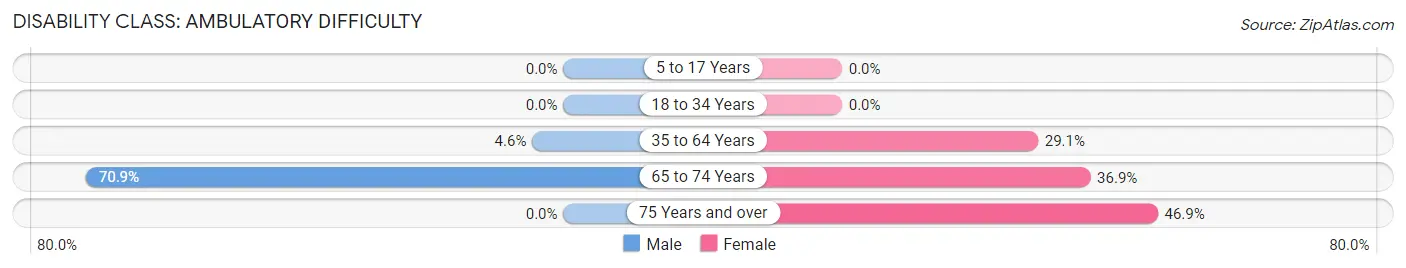
| Age Bracket | Male | Female |
| 5 to 17 Years | 0 (0.0%) | 0 (0.0%) |
| 18 to 34 Years | 0 (0.0%) | 0 (0.0%) |
| 35 to 64 Years | 20 (4.6%) | 206 (29.1%) |
| 65 to 74 Years | 134 (70.9%) | 59 (36.9%) |
| 75 Years and over | 0 (0.0%) | 45 (46.9%) |
Disability Class: Self-Care Difficulty
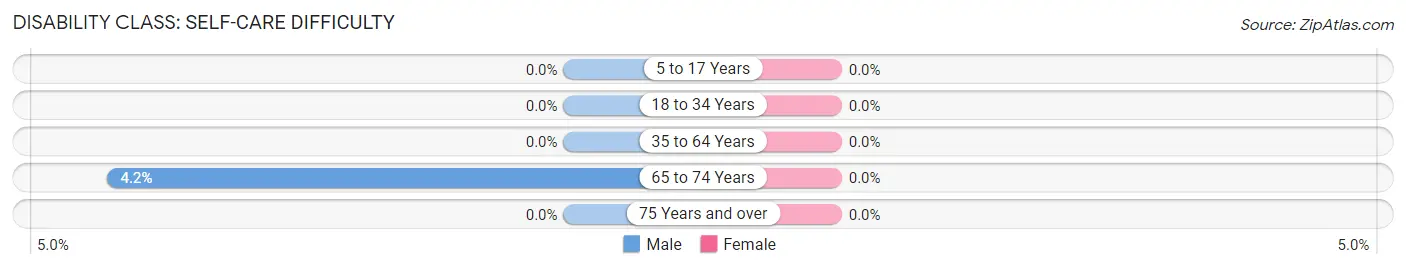
| Age Bracket | Male | Female |
| 5 to 17 Years | 0 (0.0%) | 0 (0.0%) |
| 18 to 34 Years | 0 (0.0%) | 0 (0.0%) |
| 35 to 64 Years | 0 (0.0%) | 0 (0.0%) |
| 65 to 74 Years | 8 (4.2%) | 0 (0.0%) |
| 75 Years and over | 0 (0.0%) | 0 (0.0%) |
Technology Access in Harlem
Computing Device Access in Harlem
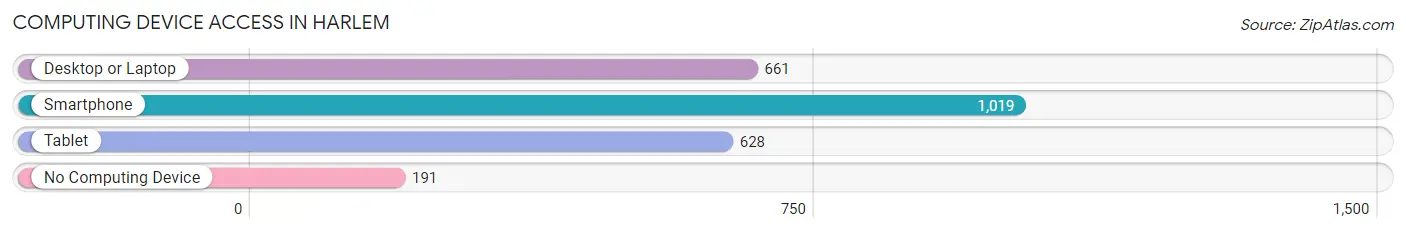
| Device Type | # Households | % Households |
| Desktop or Laptop | 661 | 53.3% |
| Smartphone | 1,019 | 82.1% |
| Tablet | 628 | 50.6% |
| No Computing Device | 191 | 15.4% |
| Total | 1,241 | 100.0% |
Internet Access in Harlem
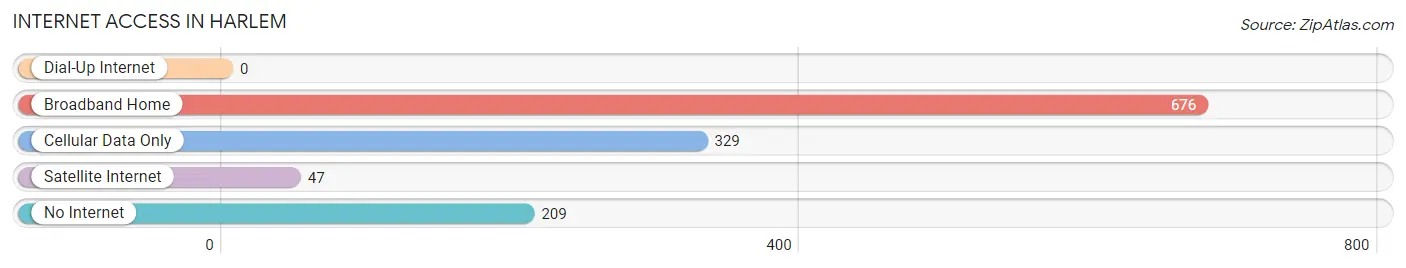
| Internet Type | # Households | % Households |
| Dial-Up Internet | 0 | 0.0% |
| Broadband Home | 676 | 54.5% |
| Cellular Data Only | 329 | 26.5% |
| Satellite Internet | 47 | 3.8% |
| No Internet | 209 | 16.8% |
| Total | 1,241 | 100.0% |
Harlem Summary
Harlem, Georgia is a small city located in Columbia County, Georgia, United States. It is situated about 20 miles west of Augusta, the state’s second-largest city. The city is part of the Augusta-Richmond County Metropolitan Statistical Area. As of the 2010 census, the city had a population of 2,666.
History
Harlem was founded in 1836 by a group of settlers from South Carolina. The city was named after the Dutch city of Haarlem, which was the birthplace of one of the settlers. The city was incorporated in 1891.
Harlem was a small farming community until the early 20th century, when it began to experience rapid growth due to the development of the nearby Augusta-Aiken Railroad. The railroad brought new industry and jobs to the area, and the population of Harlem began to grow.
In the 1950s, the city experienced a period of decline as the railroad industry began to decline. However, the city has since experienced a resurgence, and today it is a thriving community.
Geography
Harlem is located in Columbia County, Georgia, at 33.45°N 82.17°W. The city is situated about 20 miles west of Augusta, the state’s second-largest city. The city is part of the Augusta-Richmond County Metropolitan Statistical Area.
The city has a total area of 4.2 square miles, all of which is land. The city is located in the Piedmont region of Georgia, and is characterized by rolling hills and forests. The city is located near the Savannah River, and is home to several small lakes and ponds.
Economy
Harlem’s economy is largely based on agriculture and manufacturing. The city is home to several large farms, and is a major producer of cotton, corn, soybeans, and other crops. The city is also home to several manufacturing companies, including a paper mill and a furniture factory.
The city is also home to several small businesses, including restaurants, retail stores, and service providers. The city is also home to several medical facilities, including a hospital and several clinics.
Demographics
As of the 2010 census, the city had a population of 2,666. The racial makeup of the city was 65.2% White, 28.2% African American, 0.3% Native American, 0.7% Asian, 0.1% Pacific Islander, 4.2% from other races, and 1.3% from two or more races. Hispanic or Latino of any race were 8.2% of the population.
The median income for a household in the city was $31,250, and the median income for a family was $37,500. The per capita income for the city was $17,845. About 17.2% of families and 20.2% of the population were below the poverty line, including 28.2% of those under age 18 and 15.2% of those age 65 or over.
Common Questions
What is Per Capita Income in Harlem?
Per Capita income in Harlem is $30,375.
What is the Median Family Income in Harlem?
Median Family Income in Harlem is $64,204.
What is the Median Household income in Harlem?
Median Household Income in Harlem is $51,855.
What is Income or Wage Gap in Harlem?
Income or Wage Gap in Harlem is 42.7%.
Women in Harlem earn 57.3 cents for every dollar earned by a man.
What is Inequality or Gini Index in Harlem?
Inequality or Gini Index in Harlem is 0.40.
What is the Total Population of Harlem?
Total Population of Harlem is 3,682.
What is the Total Male Population of Harlem?
Total Male Population of Harlem is 1,521.
What is the Total Female Population of Harlem?
Total Female Population of Harlem is 2,161.
What is the Ratio of Males per 100 Females in Harlem?
There are 70.38 Males per 100 Females in Harlem.
What is the Ratio of Females per 100 Males in Harlem?
There are 142.08 Females per 100 Males in Harlem.
What is the Median Population Age in Harlem?
Median Population Age in Harlem is 29.9 Years.
What is the Average Family Size in Harlem
Average Family Size in Harlem is 3.6 People.
What is the Average Household Size in Harlem
Average Household Size in Harlem is 3.0 People.
How Large is the Labor Force in Harlem?
There are 1,781 People in the Labor Forcein in Harlem.
What is the Percentage of People in the Labor Force in Harlem?
70.7% of People are in the Labor Force in Harlem.
What is the Unemployment Rate in Harlem?
Unemployment Rate in Harlem is 3.7%.