Big Pine, CA Map & Demographics
Big Pine Map
Big Pine Overview
$39,964
PER CAPITA INCOME
$87,841
AVG FAMILY INCOME
$62,576
AVG HOUSEHOLD INCOME
13.9%
WAGE / INCOME GAP [ % ]
86.1¢/ $1
WAGE / INCOME GAP [ $ ]
0.47
INEQUALITY / GINI INDEX
1,563
TOTAL POPULATION
863
MALE POPULATION
700
FEMALE POPULATION
123.29
MALES / 100 FEMALES
81.11
FEMALES / 100 MALES
49.3
MEDIAN AGE
3.4
AVG FAMILY SIZE
2.3
AVG HOUSEHOLD SIZE
751
LABOR FORCE [ PEOPLE ]
58.5%
PERCENT IN LABOR FORCE
3.5%
UNEMPLOYMENT RATE
Big Pine Zip Codes
Big Pine Area Codes
Income in Big Pine
Income Overview in Big Pine
Per Capita Income in Big Pine is $39,964, while median incomes of families and households are $87,841 and $62,576 respectively.
| Characteristic | Number | Measure |
| Per Capita Income | 1,563 | $39,964 |
| Median Family Income | 329 | $87,841 |
| Mean Family Income | 329 | $119,438 |
| Median Household Income | 678 | $62,576 |
| Mean Household Income | 678 | $87,313 |
| Income Deficit | 329 | $0 |
| Wage / Income Gap (%) | 1,563 | 13.94% |
| Wage / Income Gap ($) | 1,563 | 86.06¢ per $1 |
| Gini / Inequality Index | 1,563 | 0.47 |
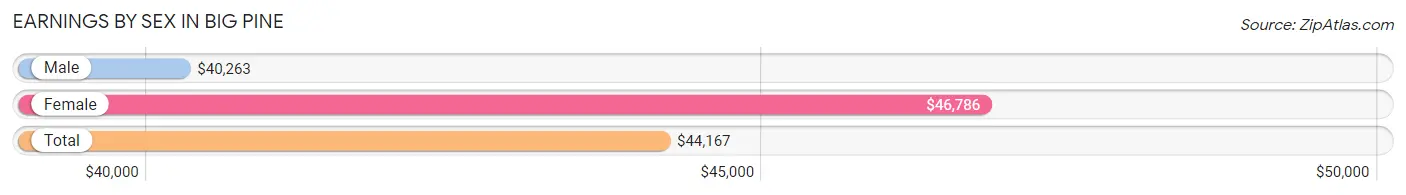
Earnings by Sex in Big Pine
Average Earnings in Big Pine are $44,167, $40,263 for men and $46,786 for women, a difference of 13.9%.
| Sex | Number | Average Earnings |
| Male | 382 (48.0%) | $40,263 |
| Female | 414 (52.0%) | $46,786 |
| Total | 796 (100.0%) | $44,167 |
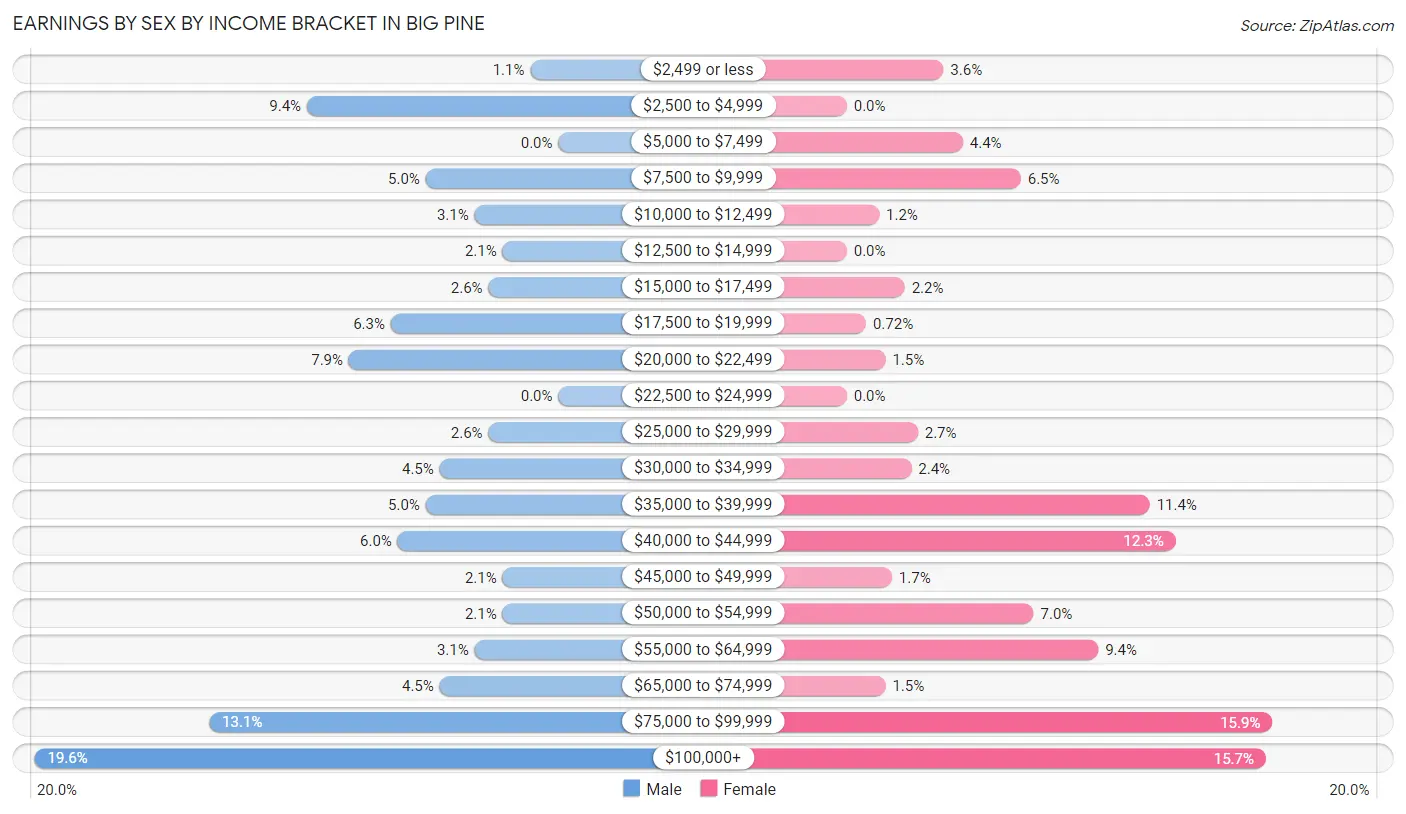
Earnings by Sex by Income Bracket in Big Pine
The most common earnings brackets in Big Pine are $100,000+ for men (75 | 19.6%) and $75,000 to $99,999 for women (66 | 15.9%).
| Income | Male | Female |
| $2,499 or less | 4 (1.1%) | 15 (3.6%) |
| $2,500 to $4,999 | 36 (9.4%) | 0 (0.0%) |
| $5,000 to $7,499 | 0 (0.0%) | 18 (4.3%) |
| $7,500 to $9,999 | 19 (5.0%) | 27 (6.5%) |
| $10,000 to $12,499 | 12 (3.1%) | 5 (1.2%) |
| $12,500 to $14,999 | 8 (2.1%) | 0 (0.0%) |
| $15,000 to $17,499 | 10 (2.6%) | 9 (2.2%) |
| $17,500 to $19,999 | 24 (6.3%) | 3 (0.7%) |
| $20,000 to $22,499 | 30 (7.9%) | 6 (1.5%) |
| $22,500 to $24,999 | 0 (0.0%) | 0 (0.0%) |
| $25,000 to $29,999 | 10 (2.6%) | 11 (2.7%) |
| $30,000 to $34,999 | 17 (4.4%) | 10 (2.4%) |
| $35,000 to $39,999 | 19 (5.0%) | 47 (11.4%) |
| $40,000 to $44,999 | 23 (6.0%) | 51 (12.3%) |
| $45,000 to $49,999 | 8 (2.1%) | 7 (1.7%) |
| $50,000 to $54,999 | 8 (2.1%) | 29 (7.0%) |
| $55,000 to $64,999 | 12 (3.1%) | 39 (9.4%) |
| $65,000 to $74,999 | 17 (4.4%) | 6 (1.5%) |
| $75,000 to $99,999 | 50 (13.1%) | 66 (15.9%) |
| $100,000+ | 75 (19.6%) | 65 (15.7%) |
| Total | 382 (100.0%) | 414 (100.0%) |
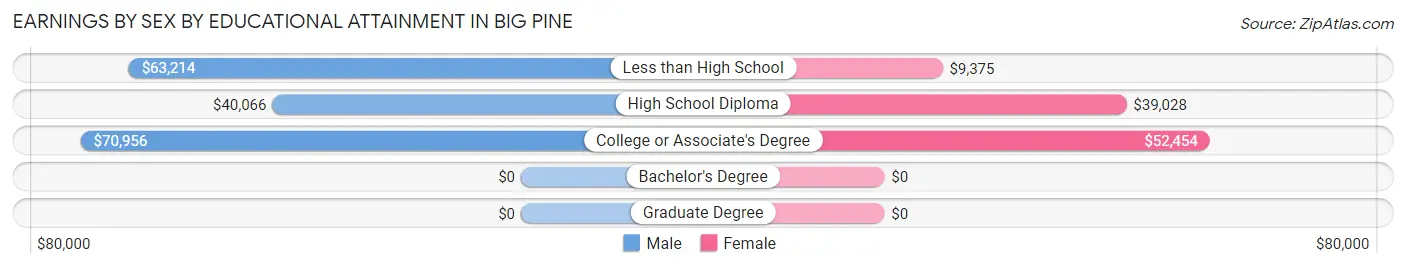
Earnings by Sex by Educational Attainment in Big Pine
Average earnings in Big Pine are $54,792 for men and $50,690 for women, a difference of 7.5%. Men with an educational attainment of college or associate's degree enjoy the highest average annual earnings of $70,956, while those with high school diploma education earn the least with $40,066. Women with an educational attainment of college or associate's degree earn the most with the average annual earnings of $52,454, while those with less than high school education have the smallest earnings of $9,375.
| Educational Attainment | Male Income | Female Income |
| Less than High School | $63,214 | $9,375 |
| High School Diploma | $40,066 | $39,028 |
| College or Associate's Degree | $70,956 | $52,454 |
| Bachelor's Degree | - | - |
| Graduate Degree | - | - |
| Total | $54,792 | $50,690 |
Family Income in Big Pine
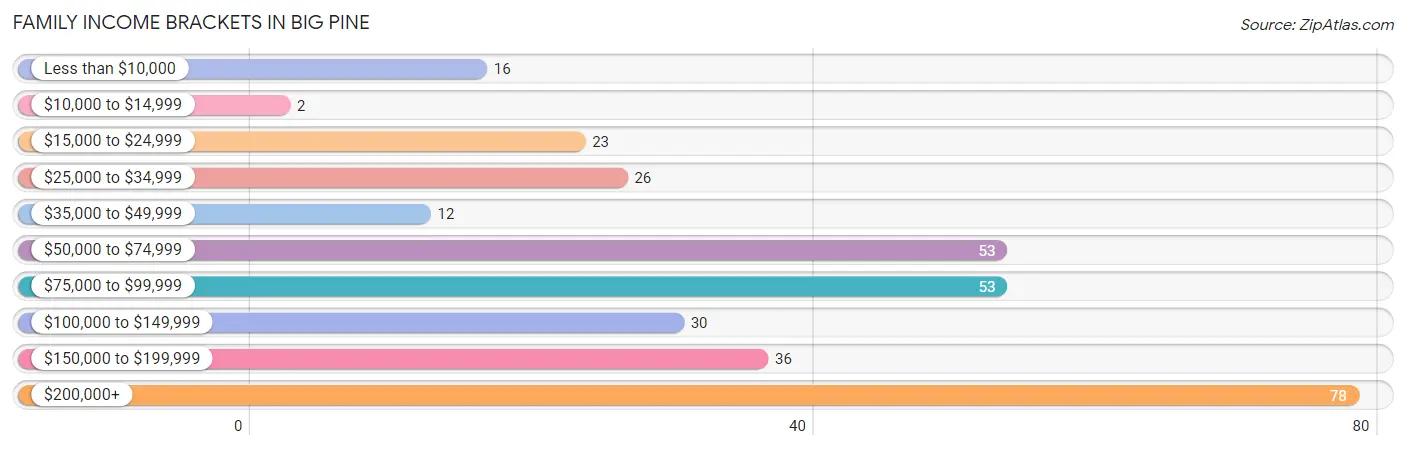
Family Income Brackets in Big Pine
According to the Big Pine family income data, there are 78 families falling into the $200,000+ income range, which is the most common income bracket and makes up 23.7% of all families. Conversely, the $10,000 to $14,999 income bracket is the least frequent group with only 2 families (0.6%) belonging to this category.
| Income Bracket | # Families | % Families |
| Less than $10,000 | 16 | 4.9% |
| $10,000 to $14,999 | 2 | 0.6% |
| $15,000 to $24,999 | 23 | 7.0% |
| $25,000 to $34,999 | 26 | 7.9% |
| $35,000 to $49,999 | 12 | 3.6% |
| $50,000 to $74,999 | 53 | 16.1% |
| $75,000 to $99,999 | 53 | 16.1% |
| $100,000 to $149,999 | 30 | 9.1% |
| $150,000 to $199,999 | 36 | 10.9% |
| $200,000+ | 78 | 23.7% |
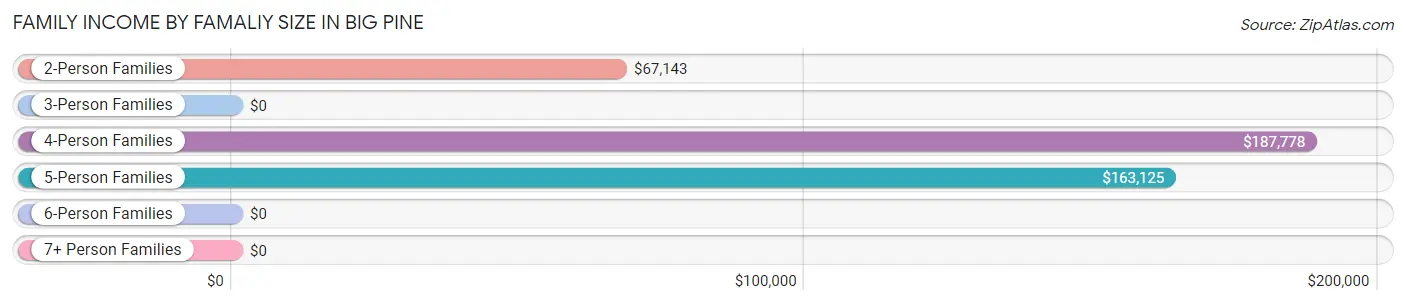
Family Income by Famaliy Size in Big Pine
4-person families (28 | 8.5%) account for the highest median family income in Big Pine with $187,778 per family, while 4-person families (28 | 8.5%) have the highest median income of $46,944 per family member.
| Income Bracket | # Families | Median Income |
| 2-Person Families | 188 (57.1%) | $67,143 |
| 3-Person Families | 70 (21.3%) | $0 |
| 4-Person Families | 28 (8.5%) | $187,778 |
| 5-Person Families | 24 (7.3%) | $163,125 |
| 6-Person Families | 19 (5.8%) | $0 |
| 7+ Person Families | 0 (0.0%) | $0 |
| Total | 329 (100.0%) | $87,841 |
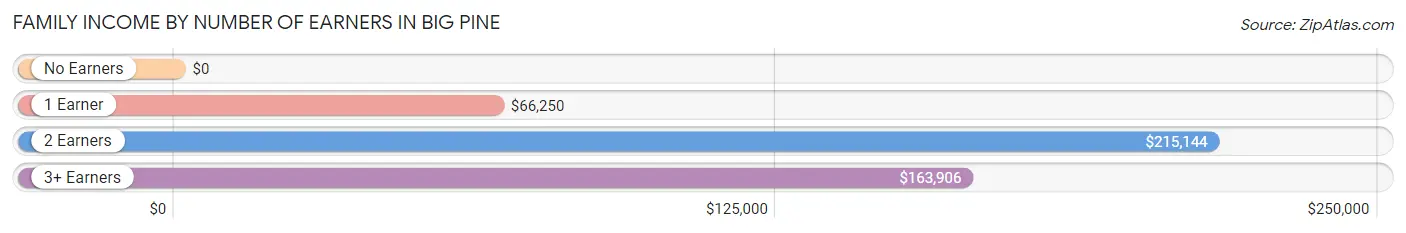
Family Income by Number of Earners in Big Pine
| Number of Earners | # Families | Median Income |
| No Earners | 75 (22.8%) | $0 |
| 1 Earner | 98 (29.8%) | $66,250 |
| 2 Earners | 105 (31.9%) | $215,144 |
| 3+ Earners | 51 (15.5%) | $163,906 |
| Total | 329 (100.0%) | $87,841 |
Household Income in Big Pine
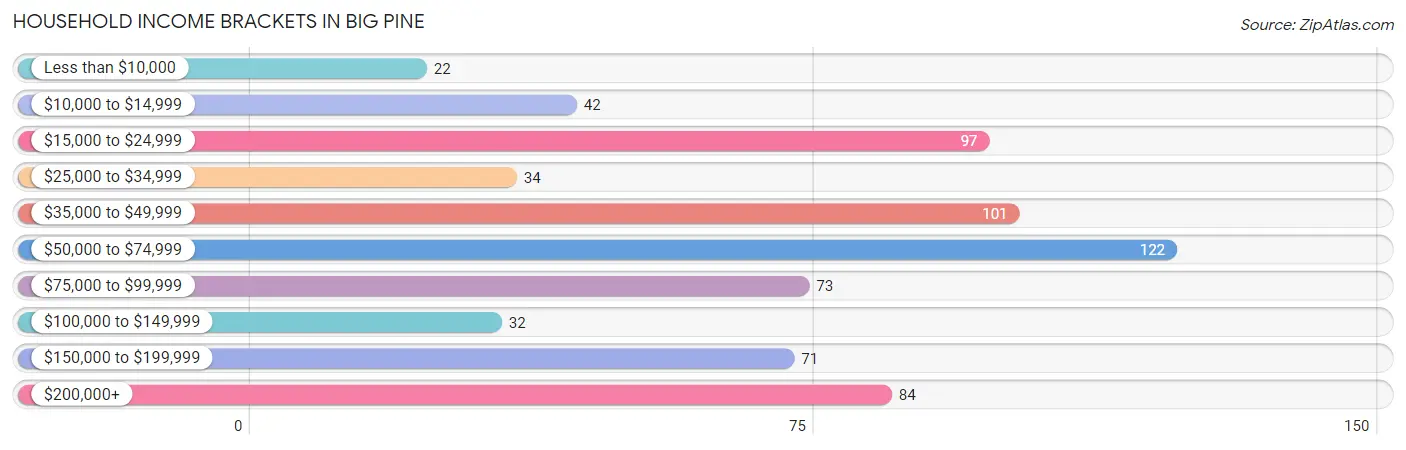
Household Income Brackets in Big Pine
With 122 households falling in the category, the $50,000 to $74,999 income range is the most frequent in Big Pine, accounting for 18.0% of all households. In contrast, only 22 households (3.2%) fall into the less than $10,000 income bracket, making it the least populous group.
| Income Bracket | # Households | % Households |
| Less than $10,000 | 22 | 3.2% |
| $10,000 to $14,999 | 42 | 6.2% |
| $15,000 to $24,999 | 97 | 14.3% |
| $25,000 to $34,999 | 34 | 5.0% |
| $35,000 to $49,999 | 101 | 14.9% |
| $50,000 to $74,999 | 122 | 18.0% |
| $75,000 to $99,999 | 73 | 10.8% |
| $100,000 to $149,999 | 32 | 4.7% |
| $150,000 to $199,999 | 71 | 10.5% |
| $200,000+ | 84 | 12.4% |
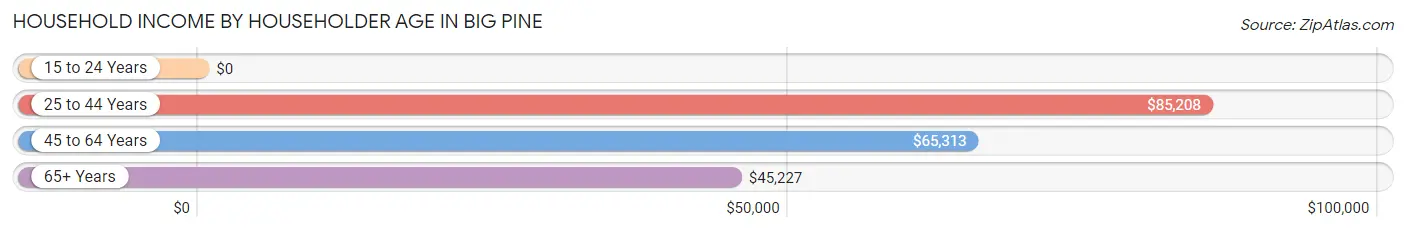
Household Income by Householder Age in Big Pine
The median household income in Big Pine is $62,576, with the highest median household income of $85,208 found in the 25 to 44 years age bracket for the primary householder. A total of 115 households (17.0%) fall into this category. Meanwhile, the 15 to 24 years age bracket for the primary householder has the lowest median household income of $0, with 9 households (1.3%) in this group.
| Income Bracket | # Households | Median Income |
| 15 to 24 Years | 9 (1.3%) | $0 |
| 25 to 44 Years | 115 (17.0%) | $85,208 |
| 45 to 64 Years | 294 (43.4%) | $65,313 |
| 65+ Years | 260 (38.4%) | $45,227 |
| Total | 678 (100.0%) | $62,576 |
Poverty in Big Pine
Income Below Poverty by Sex and Age in Big Pine
With 8.7% poverty level for males and 8.7% for females among the residents of Big Pine, 5 year old males and 16 and 17 year old females are the most vulnerable to poverty, with 1 males (100.0%) and 2 females (28.6%) in their respective age groups living below the poverty level.
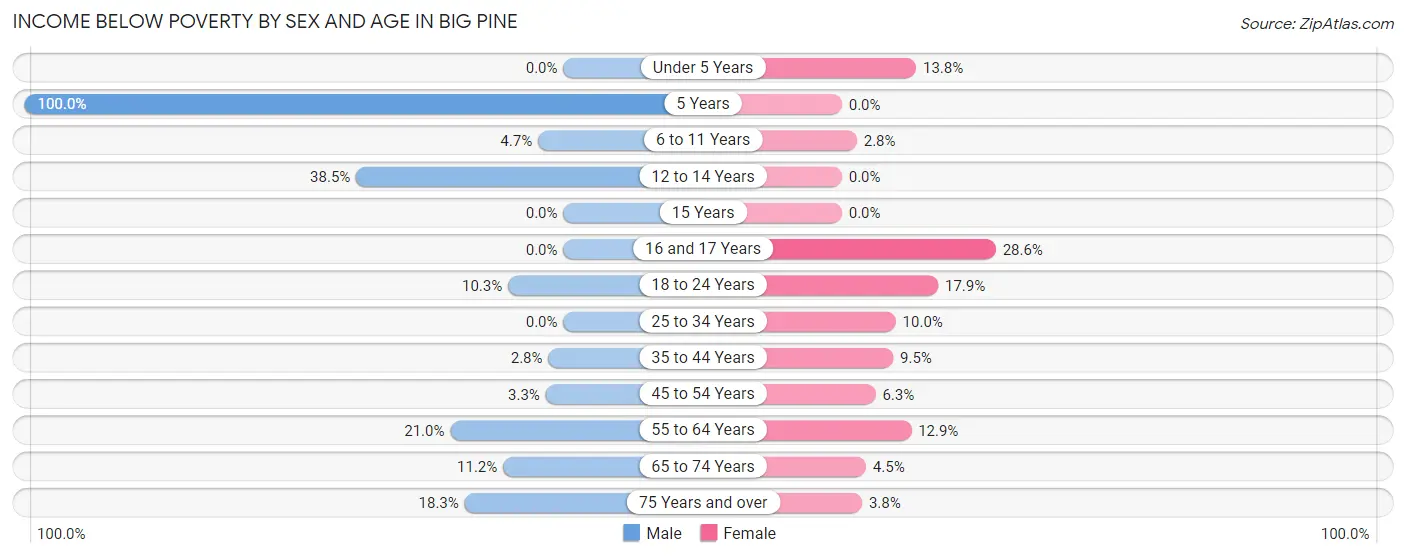
| Age Bracket | Male | Female |
| Under 5 Years | 0 (0.0%) | 4 (13.8%) |
| 5 Years | 1 (100.0%) | 0 (0.0%) |
| 6 to 11 Years | 4 (4.7%) | 1 (2.8%) |
| 12 to 14 Years | 10 (38.5%) | 0 (0.0%) |
| 15 Years | 0 (0.0%) | 0 (0.0%) |
| 16 and 17 Years | 0 (0.0%) | 2 (28.6%) |
| 18 to 24 Years | 8 (10.3%) | 5 (17.9%) |
| 25 to 34 Years | 0 (0.0%) | 5 (10.0%) |
| 35 to 44 Years | 3 (2.8%) | 8 (9.5%) |
| 45 to 54 Years | 4 (3.3%) | 9 (6.2%) |
| 55 to 64 Years | 17 (21.0%) | 21 (12.9%) |
| 65 to 74 Years | 17 (11.2%) | 3 (4.5%) |
| 75 Years and over | 11 (18.3%) | 3 (3.7%) |
| Total | 75 (8.7%) | 61 (8.7%) |
Income Above Poverty by Sex and Age in Big Pine
According to the poverty statistics in Big Pine, males aged under 5 years and females aged 12 to 14 years are the age groups that are most secure financially, with 100.0% of males and 100.0% of females in these age groups living above the poverty line.
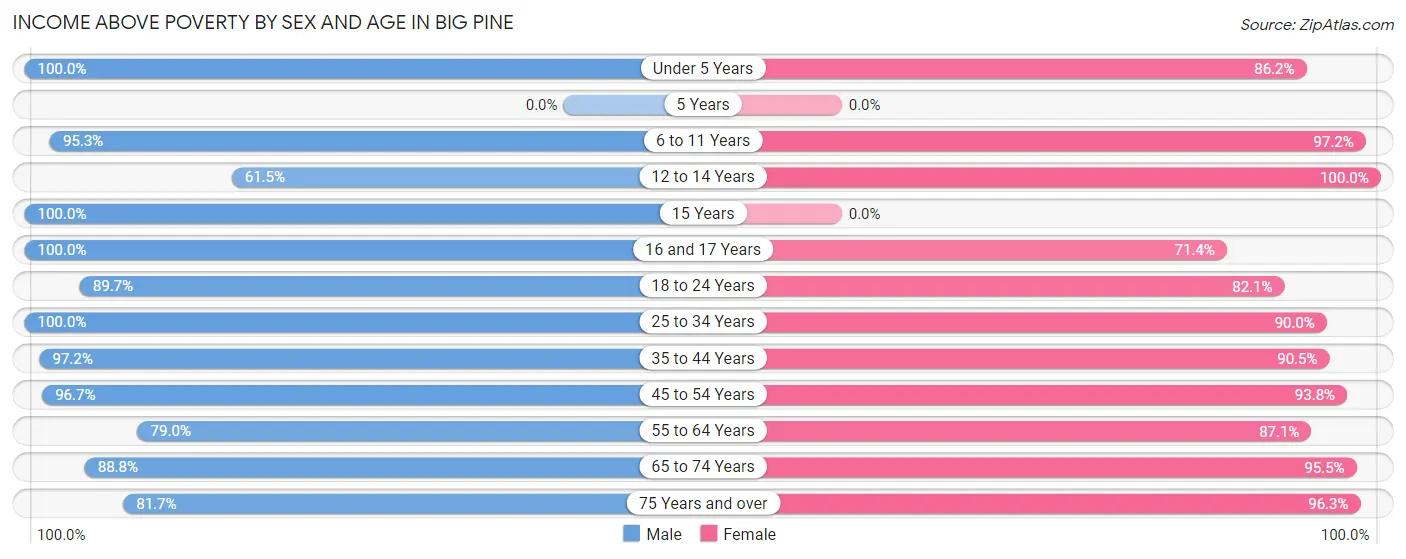
| Age Bracket | Male | Female |
| Under 5 Years | 45 (100.0%) | 25 (86.2%) |
| 5 Years | 0 (0.0%) | 0 (0.0%) |
| 6 to 11 Years | 81 (95.3%) | 35 (97.2%) |
| 12 to 14 Years | 16 (61.5%) | 12 (100.0%) |
| 15 Years | 46 (100.0%) | 0 (0.0%) |
| 16 and 17 Years | 12 (100.0%) | 5 (71.4%) |
| 18 to 24 Years | 70 (89.7%) | 23 (82.1%) |
| 25 to 34 Years | 47 (100.0%) | 45 (90.0%) |
| 35 to 44 Years | 105 (97.2%) | 76 (90.5%) |
| 45 to 54 Years | 118 (96.7%) | 135 (93.8%) |
| 55 to 64 Years | 64 (79.0%) | 142 (87.1%) |
| 65 to 74 Years | 135 (88.8%) | 64 (95.5%) |
| 75 Years and over | 49 (81.7%) | 77 (96.3%) |
| Total | 788 (91.3%) | 639 (91.3%) |
Income Below Poverty Among Married-Couple Families in Big Pine
The poverty statistics for married-couple families in Big Pine show that 5.8% or 13 of the total 224 families live below the poverty line. Families with no children have the highest poverty rate of 9.5%, comprising of 12 families. On the other hand, families with 3 or 4 children have the lowest poverty rate of 0.0%, which includes 0 families.
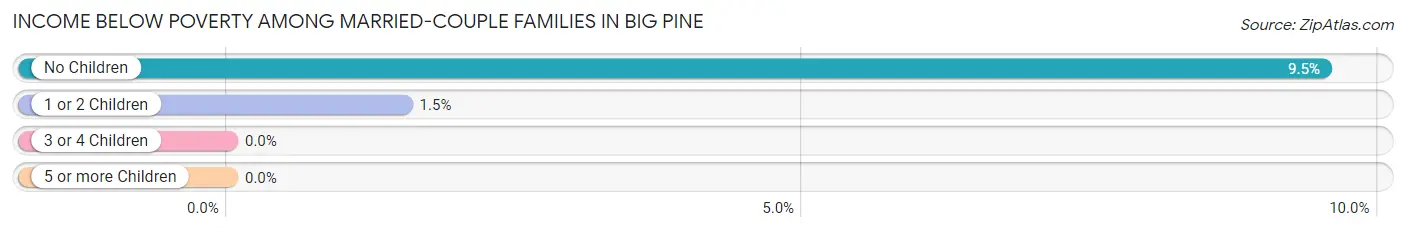
| Children | Above Poverty | Below Poverty |
| No Children | 114 (90.5%) | 12 (9.5%) |
| 1 or 2 Children | 65 (98.5%) | 1 (1.5%) |
| 3 or 4 Children | 32 (100.0%) | 0 (0.0%) |
| 5 or more Children | 0 (0.0%) | 0 (0.0%) |
| Total | 211 (94.2%) | 13 (5.8%) |
Income Below Poverty Among Single-Parent Households in Big Pine
According to the poverty data in Big Pine, 8.1% or 3 single-father households and 14.7% or 10 single-mother households are living below the poverty line. Among single-father households, those with 1 or 2 children have the highest poverty rate, with 3 households (21.4%) experiencing poverty. Likewise, among single-mother households, those with 1 or 2 children have the highest poverty rate, with 8 households (53.3%) falling below the poverty line.
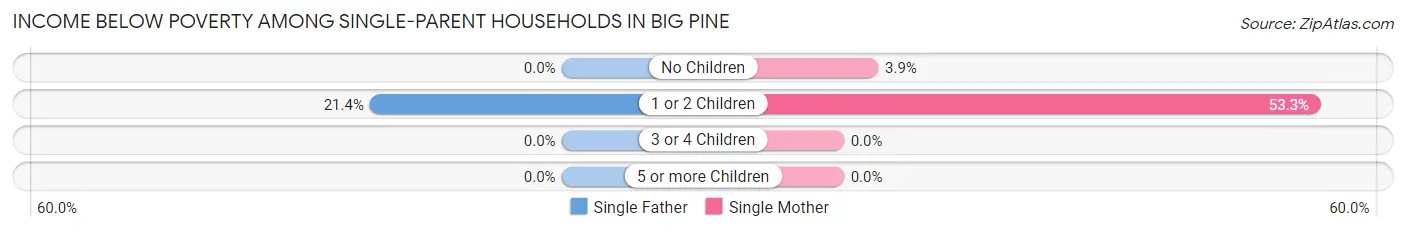
| Children | Single Father | Single Mother |
| No Children | 0 (0.0%) | 2 (3.8%) |
| 1 or 2 Children | 3 (21.4%) | 8 (53.3%) |
| 3 or 4 Children | 0 (0.0%) | 0 (0.0%) |
| 5 or more Children | 0 (0.0%) | 0 (0.0%) |
| Total | 3 (8.1%) | 10 (14.7%) |
Income Below Poverty Among Married-Couple vs Single-Parent Households in Big Pine
The poverty data for Big Pine shows that 13 of the married-couple family households (5.8%) and 13 of the single-parent households (12.4%) are living below the poverty level. Within the married-couple family households, those with no children have the highest poverty rate, with 12 households (9.5%) falling below the poverty line. Among the single-parent households, those with 1 or 2 children have the highest poverty rate, with 11 household (37.9%) living below poverty.
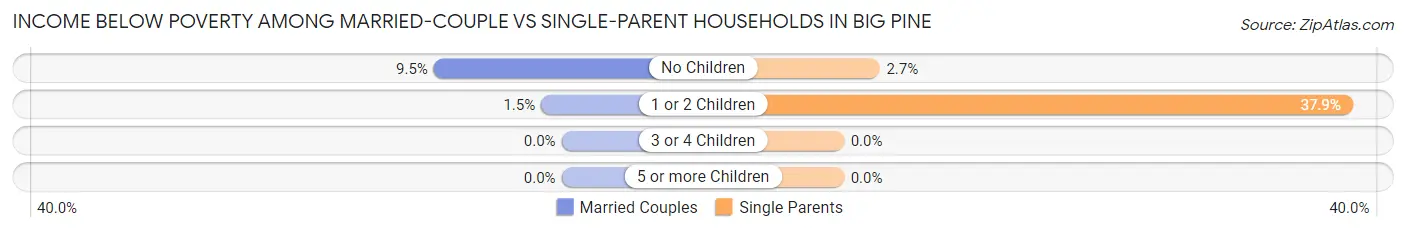
| Children | Married-Couple Families | Single-Parent Households |
| No Children | 12 (9.5%) | 2 (2.7%) |
| 1 or 2 Children | 1 (1.5%) | 11 (37.9%) |
| 3 or 4 Children | 0 (0.0%) | 0 (0.0%) |
| 5 or more Children | 0 (0.0%) | 0 (0.0%) |
| Total | 13 (5.8%) | 13 (12.4%) |
Race in Big Pine
The most populous races in Big Pine are White / Caucasian (1,045 | 66.9%), Native / Alaskan (284 | 18.2%), and Hispanic or Latino (199 | 12.7%).
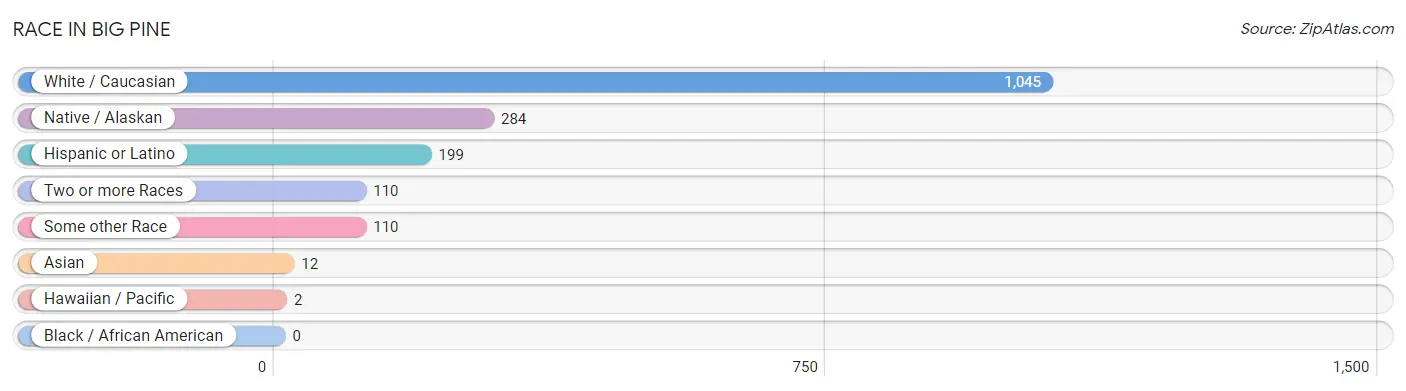
| Race | # Population | % Population |
| Asian | 12 | 0.8% |
| Black / African American | 0 | 0.0% |
| Hawaiian / Pacific | 2 | 0.1% |
| Hispanic or Latino | 199 | 12.7% |
| Native / Alaskan | 284 | 18.2% |
| White / Caucasian | 1,045 | 66.9% |
| Two or more Races | 110 | 7.0% |
| Some other Race | 110 | 7.0% |
| Total | 1,563 | 100.0% |
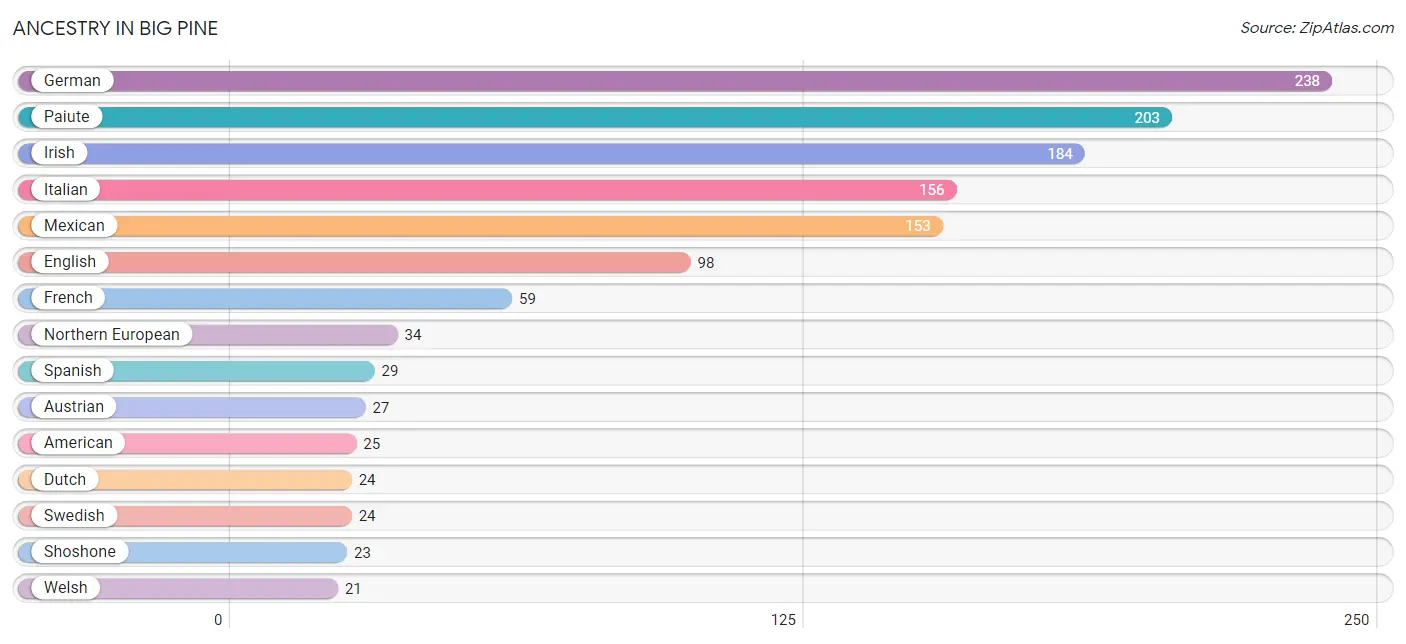
Ancestry in Big Pine
The most populous ancestries reported in Big Pine are German (238 | 15.2%), Paiute (203 | 13.0%), Irish (184 | 11.8%), Italian (156 | 10.0%), and Mexican (153 | 9.8%), together accounting for 59.8% of all Big Pine residents.
| Ancestry | # Population | % Population |
| American | 25 | 1.6% |
| Apache | 2 | 0.1% |
| Austrian | 27 | 1.7% |
| Basque | 2 | 0.1% |
| Bhutanese | 5 | 0.3% |
| Blackfeet | 2 | 0.1% |
| Central American | 7 | 0.4% |
| Central American Indian | 7 | 0.4% |
| Cherokee | 1 | 0.1% |
| Chippewa | 1 | 0.1% |
| Choctaw | 7 | 0.4% |
| Creek | 1 | 0.1% |
| Dutch | 24 | 1.5% |
| English | 98 | 6.3% |
| European | 20 | 1.3% |
| French | 59 | 3.8% |
| German | 238 | 15.2% |
| Guamanian / Chamorro | 2 | 0.1% |
| Guatemalan | 7 | 0.4% |
| Hungarian | 17 | 1.1% |
| Irish | 184 | 11.8% |
| Italian | 156 | 10.0% |
| Korean | 7 | 0.4% |
| Mexican | 153 | 9.8% |
| Northern European | 34 | 2.2% |
| Norwegian | 7 | 0.4% |
| Paiute | 203 | 13.0% |
| Polish | 9 | 0.6% |
| Portuguese | 2 | 0.1% |
| Russian | 9 | 0.6% |
| Scandinavian | 6 | 0.4% |
| Scotch-Irish | 2 | 0.1% |
| Scottish | 18 | 1.1% |
| Shoshone | 23 | 1.5% |
| Sioux | 18 | 1.1% |
| Slavic | 2 | 0.1% |
| Slovak | 5 | 0.3% |
| Spaniard | 7 | 0.4% |
| Spanish | 29 | 1.9% |
| Swedish | 24 | 1.5% |
| Swiss | 12 | 0.8% |
| Welsh | 21 | 1.3% |
| Yup'ik | 17 | 1.1% | View All 43 Rows |
Immigrants in Big Pine
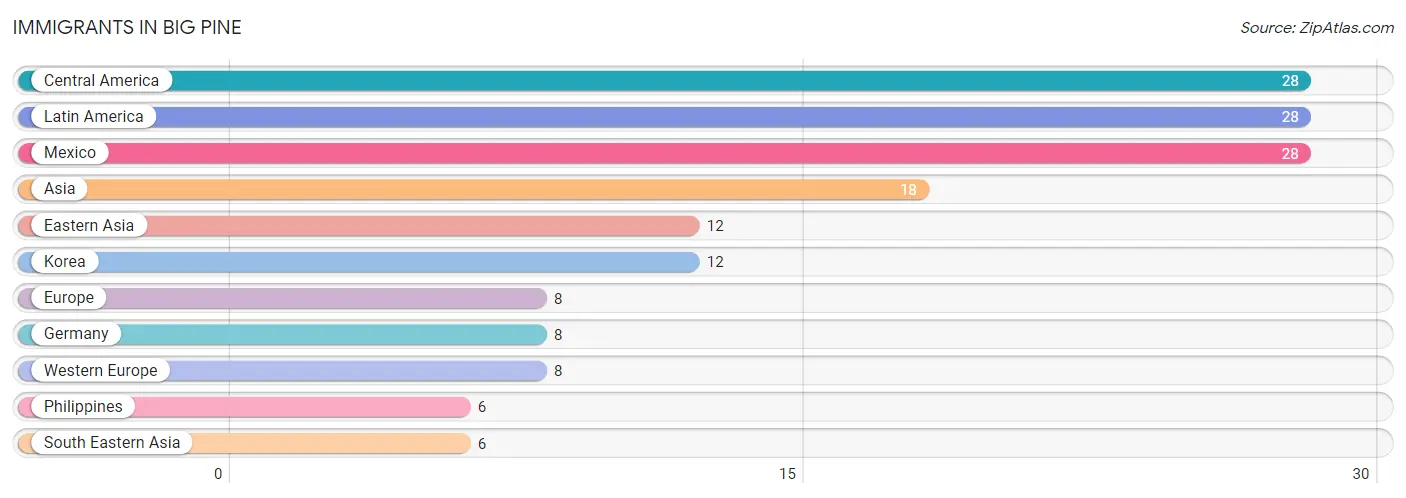
The most numerous immigrant groups reported in Big Pine came from Central America (28 | 1.8%), Latin America (28 | 1.8%), Mexico (28 | 1.8%), Asia (18 | 1.1%), and Eastern Asia (12 | 0.8%), together accounting for 7.3% of all Big Pine residents.
| Immigration Origin | # Population | % Population |
| Asia | 18 | 1.1% |
| Central America | 28 | 1.8% |
| Eastern Asia | 12 | 0.8% |
| Europe | 8 | 0.5% |
| Germany | 8 | 0.5% |
| Korea | 12 | 0.8% |
| Latin America | 28 | 1.8% |
| Mexico | 28 | 1.8% |
| Philippines | 6 | 0.4% |
| South Eastern Asia | 6 | 0.4% |
| Western Europe | 8 | 0.5% | View All 11 Rows |
Sex and Age in Big Pine
Sex and Age in Big Pine
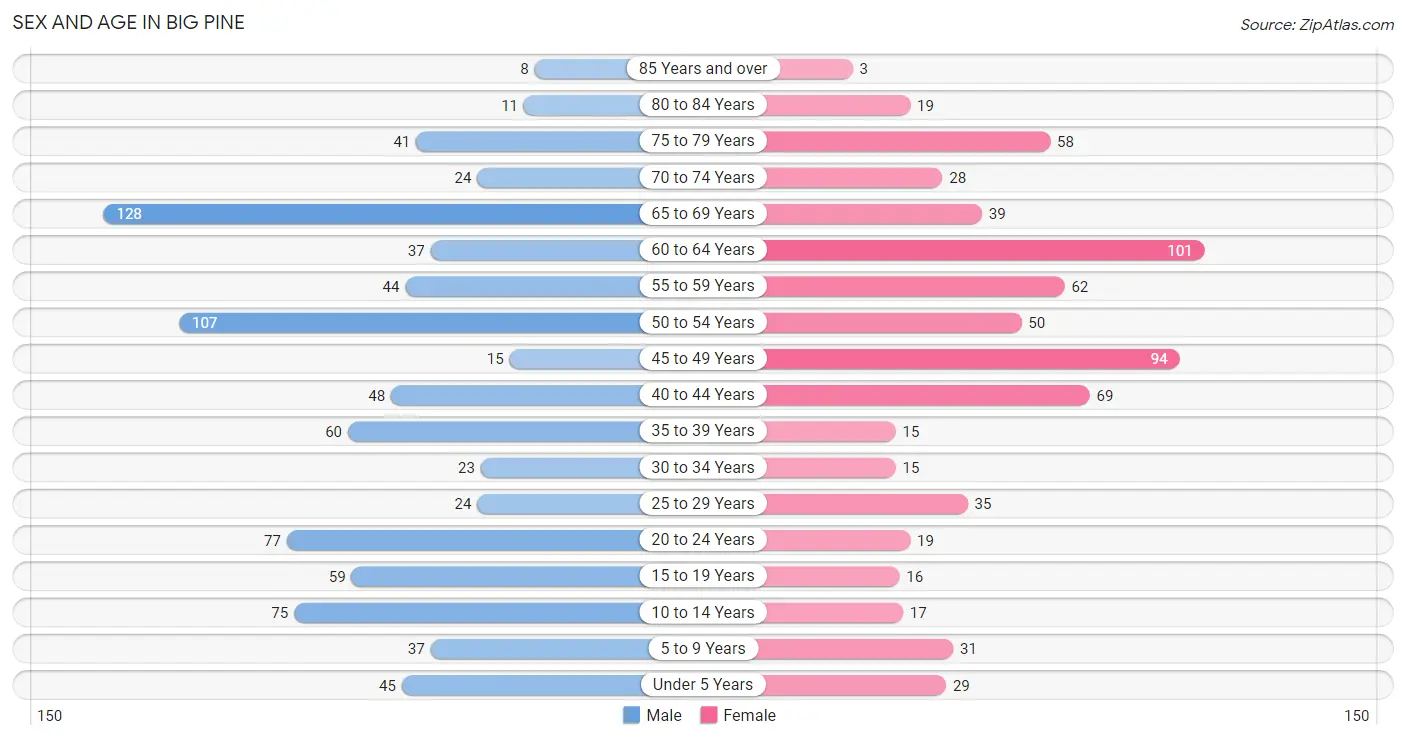
The most populous age groups in Big Pine are 65 to 69 Years (128 | 14.8%) for men and 60 to 64 Years (101 | 14.4%) for women.
| Age Bracket | Male | Female |
| Under 5 Years | 45 (5.2%) | 29 (4.1%) |
| 5 to 9 Years | 37 (4.3%) | 31 (4.4%) |
| 10 to 14 Years | 75 (8.7%) | 17 (2.4%) |
| 15 to 19 Years | 59 (6.8%) | 16 (2.3%) |
| 20 to 24 Years | 77 (8.9%) | 19 (2.7%) |
| 25 to 29 Years | 24 (2.8%) | 35 (5.0%) |
| 30 to 34 Years | 23 (2.7%) | 15 (2.1%) |
| 35 to 39 Years | 60 (7.0%) | 15 (2.1%) |
| 40 to 44 Years | 48 (5.6%) | 69 (9.9%) |
| 45 to 49 Years | 15 (1.7%) | 94 (13.4%) |
| 50 to 54 Years | 107 (12.4%) | 50 (7.1%) |
| 55 to 59 Years | 44 (5.1%) | 62 (8.9%) |
| 60 to 64 Years | 37 (4.3%) | 101 (14.4%) |
| 65 to 69 Years | 128 (14.8%) | 39 (5.6%) |
| 70 to 74 Years | 24 (2.8%) | 28 (4.0%) |
| 75 to 79 Years | 41 (4.8%) | 58 (8.3%) |
| 80 to 84 Years | 11 (1.3%) | 19 (2.7%) |
| 85 Years and over | 8 (0.9%) | 3 (0.4%) |
| Total | 863 (100.0%) | 700 (100.0%) |
Families and Households in Big Pine
Median Family Size in Big Pine
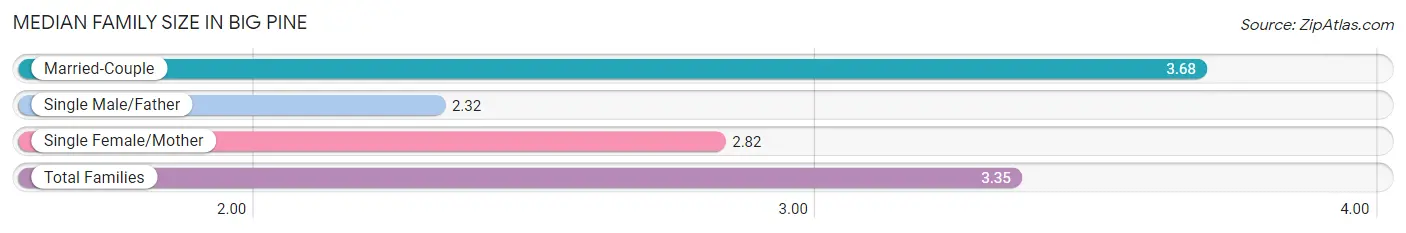
The median family size in Big Pine is 3.35 persons per family, with married-couple families (224 | 68.1%) accounting for the largest median family size of 3.68 persons per family. On the other hand, single male/father families (37 | 11.3%) represent the smallest median family size with 2.32 persons per family.
| Family Type | # Families | Family Size |
| Married-Couple | 224 (68.1%) | 3.68 |
| Single Male/Father | 37 (11.3%) | 2.32 |
| Single Female/Mother | 68 (20.7%) | 2.82 |
| Total Families | 329 (100.0%) | 3.35 |
Median Household Size in Big Pine
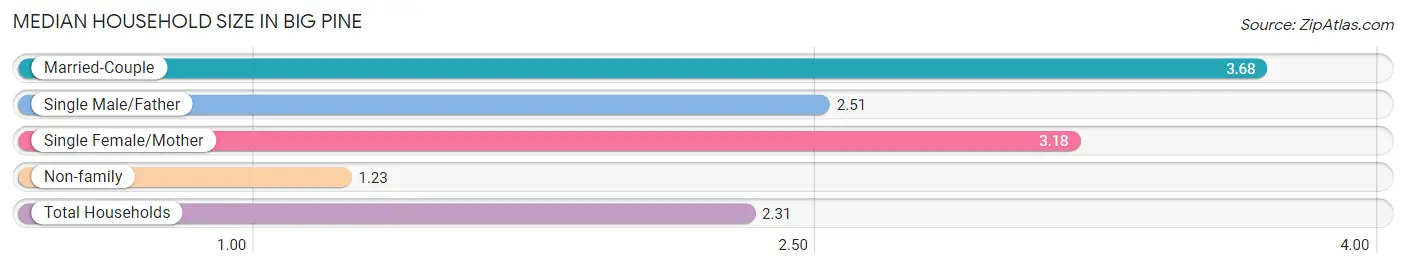
The median household size in Big Pine is 2.31 persons per household, with married-couple households (224 | 33.0%) accounting for the largest median household size of 3.68 persons per household. non-family households (349 | 51.5%) represent the smallest median household size with 1.23 persons per household.
| Household Type | # Households | Household Size |
| Married-Couple | 224 (33.0%) | 3.68 |
| Single Male/Father | 37 (5.5%) | 2.51 |
| Single Female/Mother | 68 (10.0%) | 3.18 |
| Non-family | 349 (51.5%) | 1.23 |
| Total Households | 678 (100.0%) | 2.31 |
Household Size by Marriage Status in Big Pine
Out of a total of 678 households in Big Pine, 329 (48.5%) are family households, while 349 (51.5%) are nonfamily households. The most numerous type of family households are 2-person households, comprising 164, and the most common type of nonfamily households are 1-person households, comprising 274.
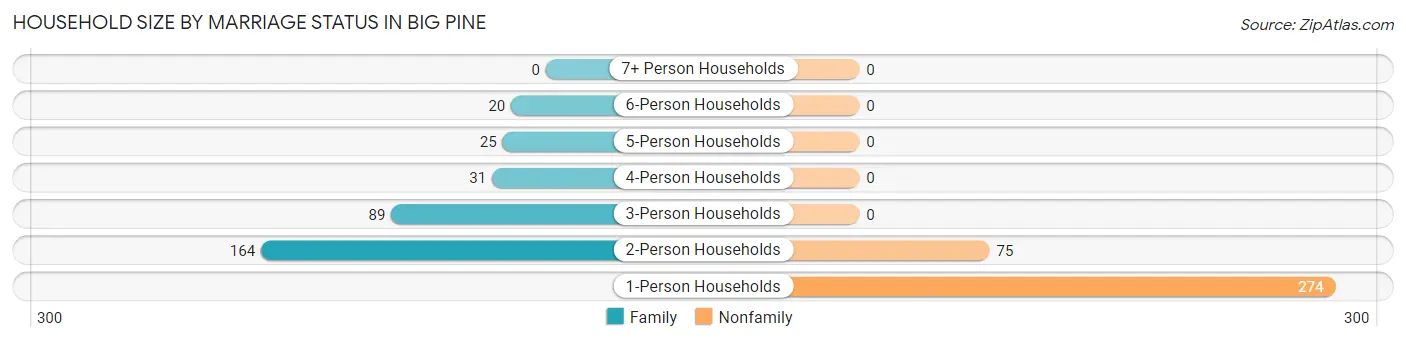
| Household Size | Family Households | Nonfamily Households |
| 1-Person Households | - | 274 (40.4%) |
| 2-Person Households | 164 (24.2%) | 75 (11.1%) |
| 3-Person Households | 89 (13.1%) | 0 (0.0%) |
| 4-Person Households | 31 (4.6%) | 0 (0.0%) |
| 5-Person Households | 25 (3.7%) | 0 (0.0%) |
| 6-Person Households | 20 (2.9%) | 0 (0.0%) |
| 7+ Person Households | 0 (0.0%) | 0 (0.0%) |
| Total | 329 (48.5%) | 349 (51.5%) |
Female Fertility in Big Pine
Fertility by Age in Big Pine
Average fertility rate in Big Pine is 3.0 births per 1,000 women. Women in the age bracket of 35 to 50 years have the highest fertility rate with 5.0 births per 1,000 women. Women in the age bracket of 35 to 50 years acount for 100.0% of all women with births.
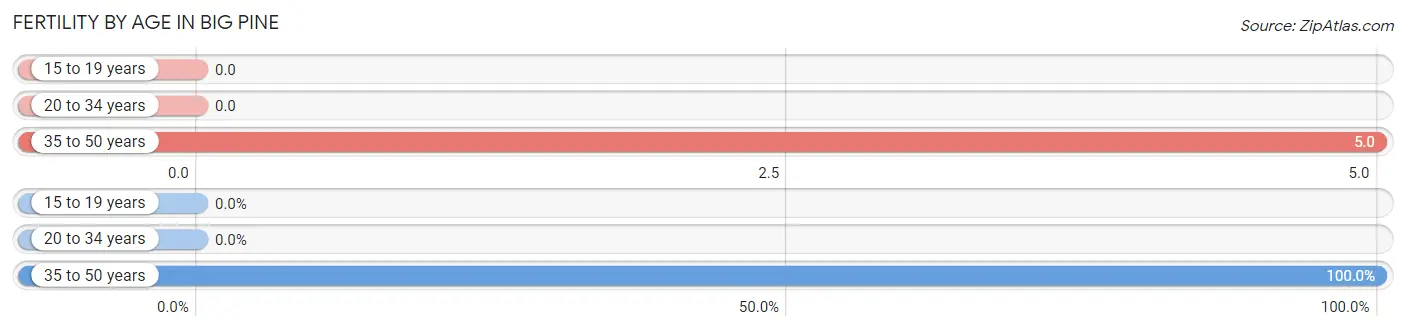
| Age Bracket | Women with Births | Births / 1,000 Women |
| 15 to 19 years | 0 (0.0%) | 0.0 |
| 20 to 34 years | 0 (0.0%) | 0.0 |
| 35 to 50 years | 1 (100.0%) | 5.0 |
| Total | 1 (100.0%) | 3.0 |
Fertility by Age by Marriage Status in Big Pine
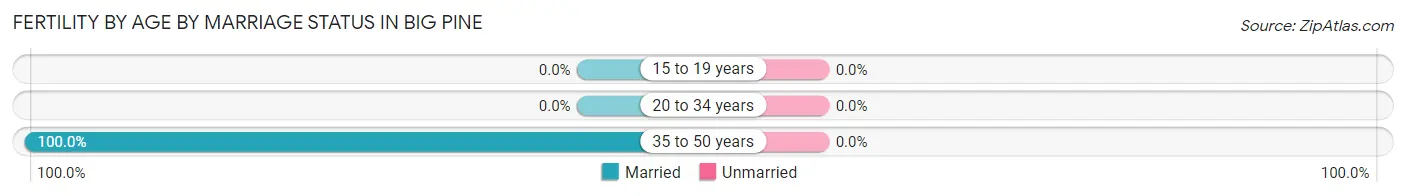
| Age Bracket | Married | Unmarried |
| 15 to 19 years | 0 (0.0%) | 0 (0.0%) |
| 20 to 34 years | 0 (0.0%) | 0 (0.0%) |
| 35 to 50 years | 1 (100.0%) | 0 (0.0%) |
| Total | 1 (100.0%) | 0 (0.0%) |
Fertility by Education in Big Pine
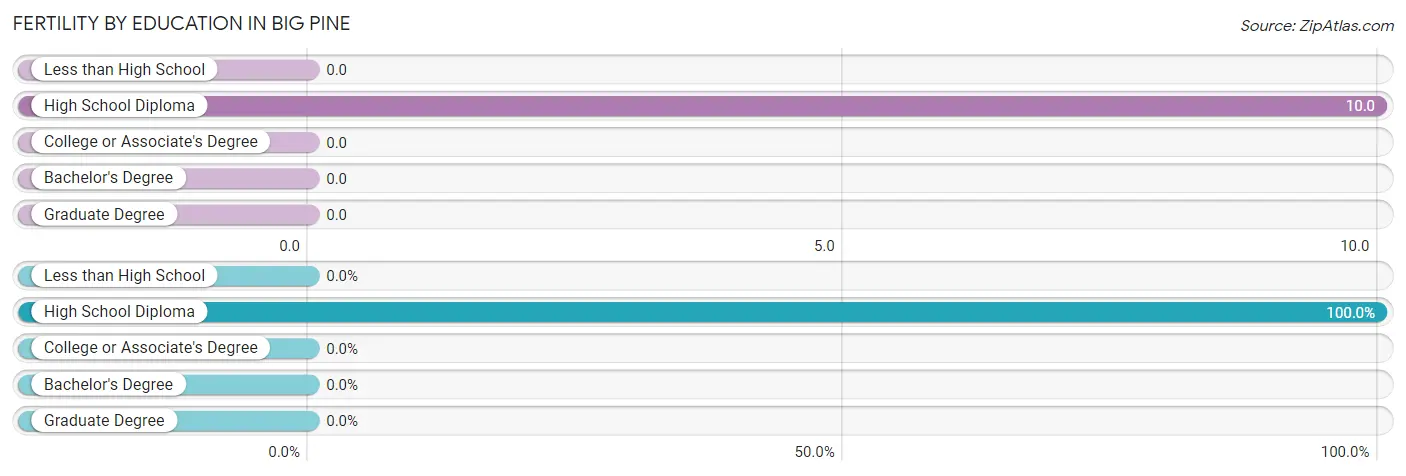
| Educational Attainment | Women with Births | Births / 1,000 Women |
| Less than High School | 0 (0.0%) | 0.0 |
| High School Diploma | 1 (100.0%) | 10.0 |
| College or Associate's Degree | 0 (0.0%) | 0.0 |
| Bachelor's Degree | 0 (0.0%) | 0.0 |
| Graduate Degree | 0 (0.0%) | 0.0 |
| Total | 1 (100.0%) | 3.0 |
Fertility by Education by Marriage Status in Big Pine
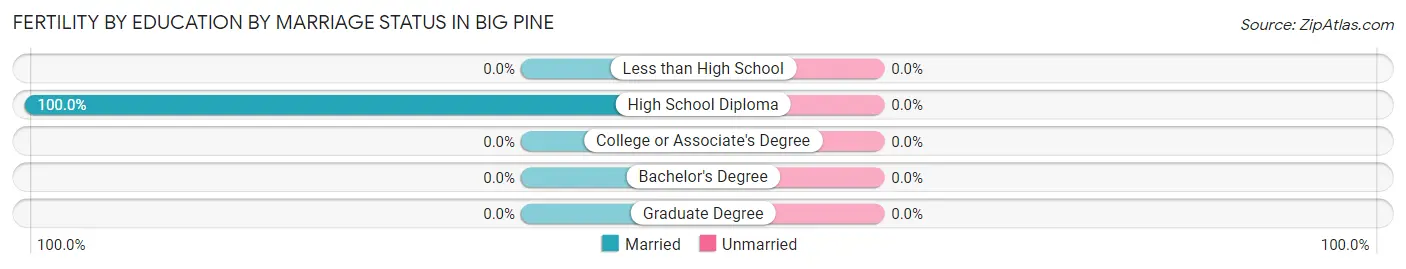
| Educational Attainment | Married | Unmarried |
| Less than High School | 0 (0.0%) | 0 (0.0%) |
| High School Diploma | 1 (100.0%) | 0 (0.0%) |
| College or Associate's Degree | 0 (0.0%) | 0 (0.0%) |
| Bachelor's Degree | 0 (0.0%) | 0 (0.0%) |
| Graduate Degree | 0 (0.0%) | 0 (0.0%) |
| Total | 1 (100.0%) | 0 (0.0%) |
Employment Characteristics in Big Pine
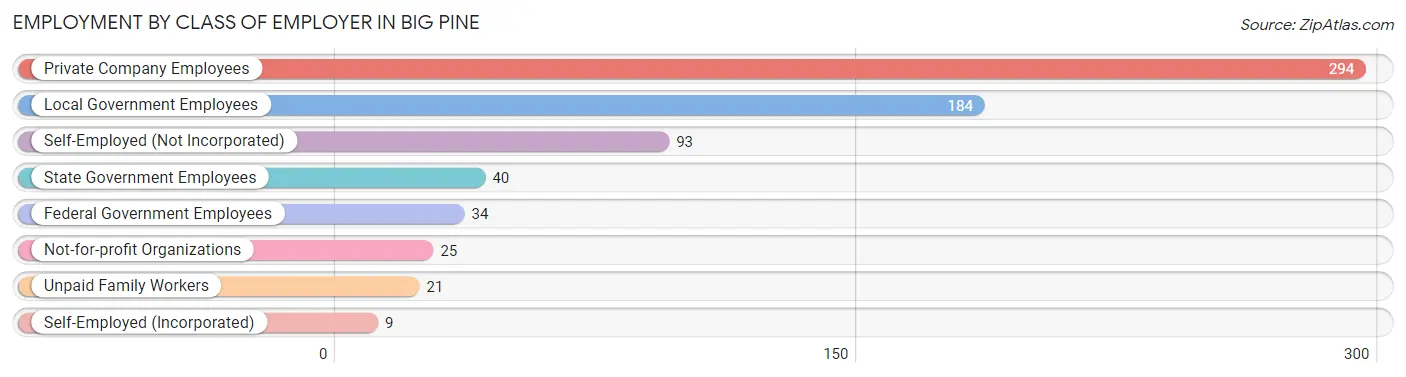
Employment by Class of Employer in Big Pine
Among the 700 employed individuals in Big Pine, private company employees (294 | 42.0%), local government employees (184 | 26.3%), and self-employed (not incorporated) (93 | 13.3%) make up the most common classes of employment.
| Employer Class | # Employees | % Employees |
| Private Company Employees | 294 | 42.0% |
| Self-Employed (Incorporated) | 9 | 1.3% |
| Self-Employed (Not Incorporated) | 93 | 13.3% |
| Not-for-profit Organizations | 25 | 3.6% |
| Local Government Employees | 184 | 26.3% |
| State Government Employees | 40 | 5.7% |
| Federal Government Employees | 34 | 4.9% |
| Unpaid Family Workers | 21 | 3.0% |
| Total | 700 | 100.0% |
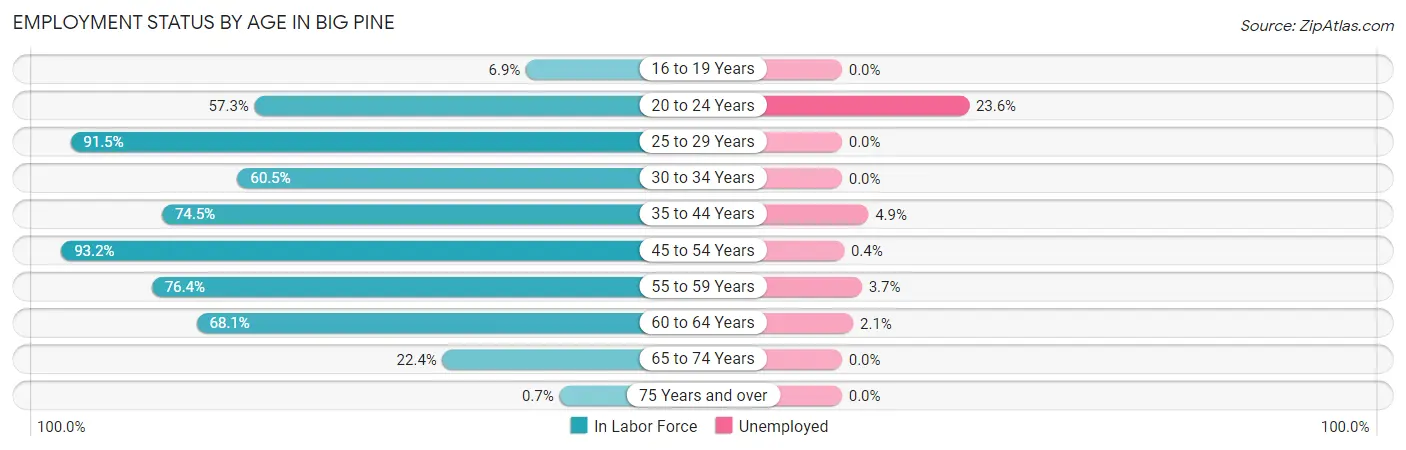
Employment Status by Age in Big Pine
According to the labor force statistics for Big Pine, out of the total population over 16 years of age (1,283), 58.5% or 751 individuals are in the labor force, with 3.5% or 26 of them unemployed. The age group with the highest labor force participation rate is 45 to 54 years, with 93.2% or 248 individuals in the labor force. Within the labor force, the 20 to 24 years age range has the highest percentage of unemployed individuals, with 23.6% or 13 of them being unemployed.
| Age Bracket | In Labor Force | Unemployed |
| 16 to 19 Years | 2 (6.9%) | 0 (0.0%) |
| 20 to 24 Years | 55 (57.3%) | 13 (23.6%) |
| 25 to 29 Years | 54 (91.5%) | 0 (0.0%) |
| 30 to 34 Years | 23 (60.5%) | 0 (0.0%) |
| 35 to 44 Years | 143 (74.5%) | 7 (4.9%) |
| 45 to 54 Years | 248 (93.2%) | 1 (0.4%) |
| 55 to 59 Years | 81 (76.4%) | 3 (3.7%) |
| 60 to 64 Years | 94 (68.1%) | 2 (2.1%) |
| 65 to 74 Years | 49 (22.4%) | 0 (0.0%) |
| 75 Years and over | 1 (0.7%) | 0 (0.0%) |
| Total | 751 (58.5%) | 26 (3.5%) |
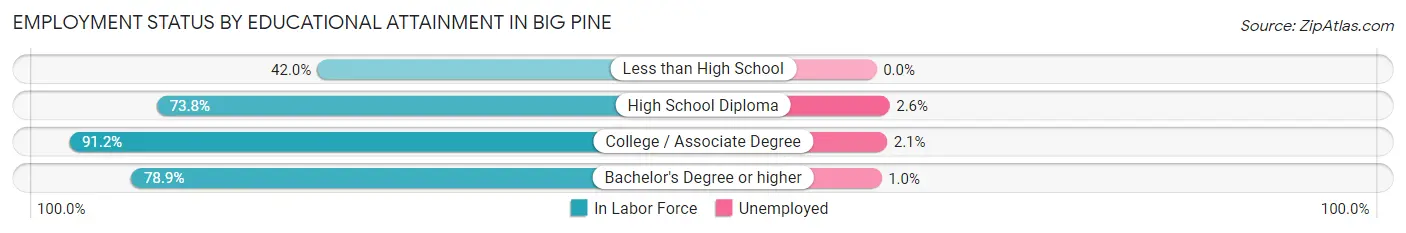
Employment Status by Educational Attainment in Big Pine
According to labor force statistics for Big Pine, 80.5% of individuals (643) out of the total population between 25 and 64 years of age (799) are in the labor force, with 2.0% or 13 of them being unemployed. The group with the highest labor force participation rate are those with the educational attainment of college / associate degree, with 91.2% or 331 individuals in the labor force. Within the labor force, individuals with high school diploma education have the highest percentage of unemployment, with 2.6% or 5 of them being unemployed.
| Educational Attainment | In Labor Force | Unemployed |
| Less than High School | 21 (42.0%) | 0 (0.0%) |
| High School Diploma | 194 (73.8%) | 7 (2.6%) |
| College / Associate Degree | 331 (91.2%) | 8 (2.1%) |
| Bachelor's Degree or higher | 97 (78.9%) | 1 (1.0%) |
| Total | 643 (80.5%) | 16 (2.0%) |
Employment Occupations by Sex in Big Pine
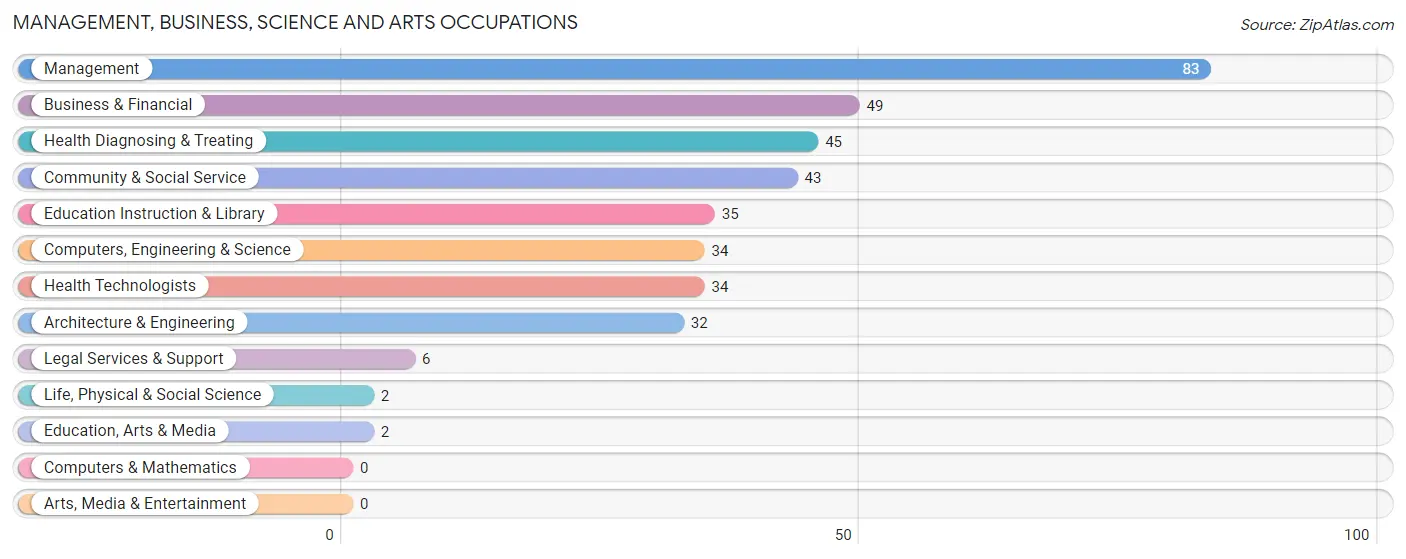
Management, Business, Science and Arts Occupations
The most common Management, Business, Science and Arts occupations in Big Pine are Management (83 | 11.5%), Business & Financial (49 | 6.8%), Health Diagnosing & Treating (45 | 6.2%), Community & Social Service (43 | 5.9%), and Education Instruction & Library (35 | 4.8%).
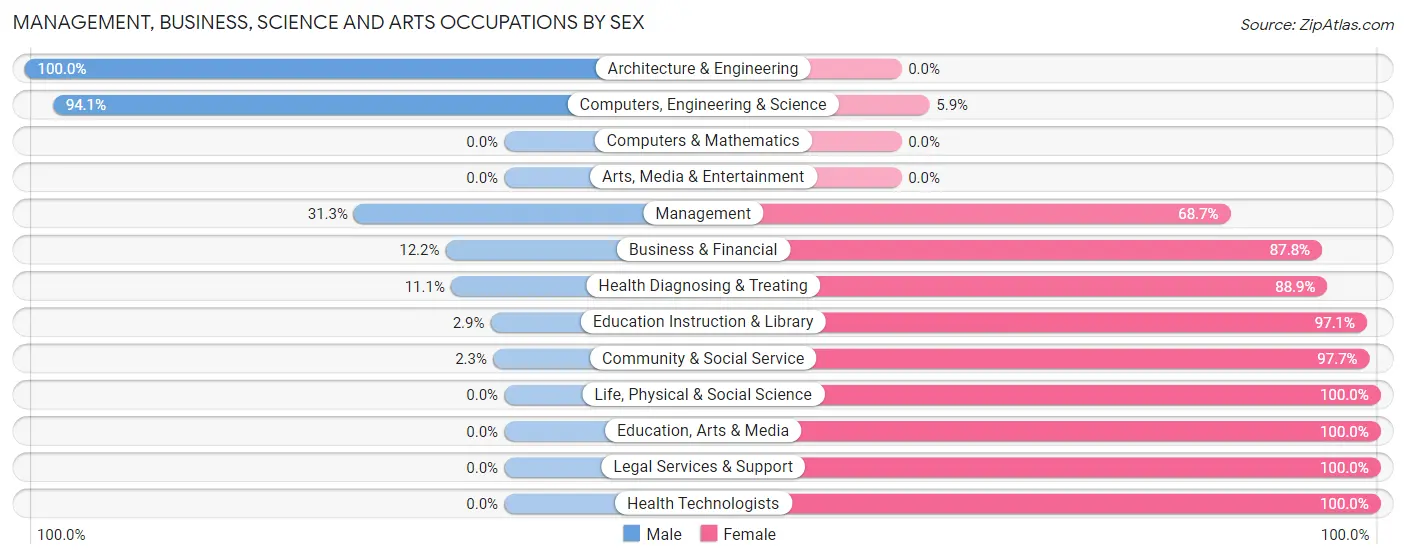
Management, Business, Science and Arts Occupations by Sex
Within the Management, Business, Science and Arts occupations in Big Pine, the most male-oriented occupations are Architecture & Engineering (100.0%), Computers, Engineering & Science (94.1%), and Management (31.3%), while the most female-oriented occupations are Life, Physical & Social Science (100.0%), Education, Arts & Media (100.0%), and Legal Services & Support (100.0%).
| Occupation | Male | Female |
| Management | 26 (31.3%) | 57 (68.7%) |
| Business & Financial | 6 (12.2%) | 43 (87.8%) |
| Computers, Engineering & Science | 32 (94.1%) | 2 (5.9%) |
| Computers & Mathematics | 0 (0.0%) | 0 (0.0%) |
| Architecture & Engineering | 32 (100.0%) | 0 (0.0%) |
| Life, Physical & Social Science | 0 (0.0%) | 2 (100.0%) |
| Community & Social Service | 1 (2.3%) | 42 (97.7%) |
| Education, Arts & Media | 0 (0.0%) | 2 (100.0%) |
| Legal Services & Support | 0 (0.0%) | 6 (100.0%) |
| Education Instruction & Library | 1 (2.9%) | 34 (97.1%) |
| Arts, Media & Entertainment | 0 (0.0%) | 0 (0.0%) |
| Health Diagnosing & Treating | 5 (11.1%) | 40 (88.9%) |
| Health Technologists | 0 (0.0%) | 34 (100.0%) |
| Total (Category) | 70 (27.6%) | 184 (72.4%) |
| Total (Overall) | 319 (44.1%) | 405 (55.9%) |
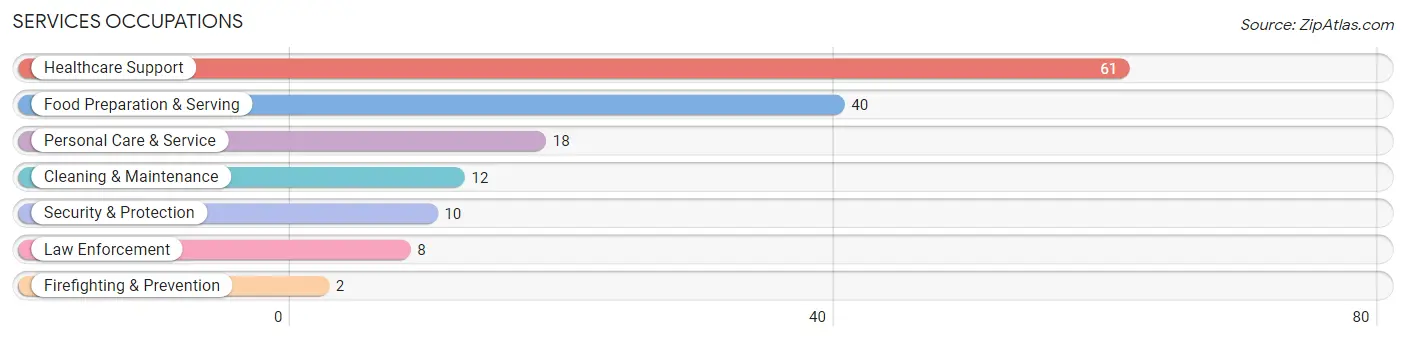
Services Occupations
The most common Services occupations in Big Pine are Healthcare Support (61 | 8.4%), Food Preparation & Serving (40 | 5.5%), Personal Care & Service (18 | 2.5%), Cleaning & Maintenance (12 | 1.7%), and Security & Protection (10 | 1.4%).
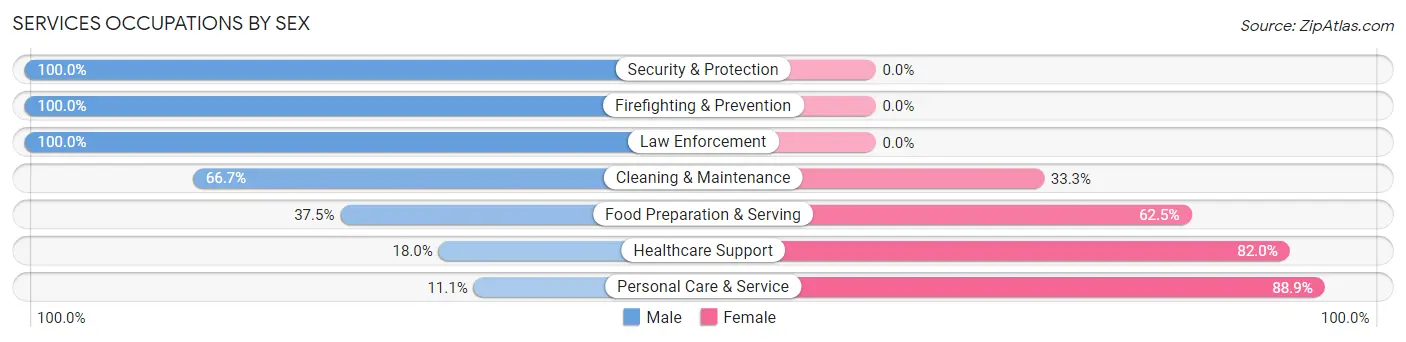
Services Occupations by Sex
Within the Services occupations in Big Pine, the most male-oriented occupations are Security & Protection (100.0%), Firefighting & Prevention (100.0%), and Law Enforcement (100.0%), while the most female-oriented occupations are Personal Care & Service (88.9%), Healthcare Support (82.0%), and Food Preparation & Serving (62.5%).
| Occupation | Male | Female |
| Healthcare Support | 11 (18.0%) | 50 (82.0%) |
| Security & Protection | 10 (100.0%) | 0 (0.0%) |
| Firefighting & Prevention | 2 (100.0%) | 0 (0.0%) |
| Law Enforcement | 8 (100.0%) | 0 (0.0%) |
| Food Preparation & Serving | 15 (37.5%) | 25 (62.5%) |
| Cleaning & Maintenance | 8 (66.7%) | 4 (33.3%) |
| Personal Care & Service | 2 (11.1%) | 16 (88.9%) |
| Total (Category) | 46 (32.6%) | 95 (67.4%) |
| Total (Overall) | 319 (44.1%) | 405 (55.9%) |
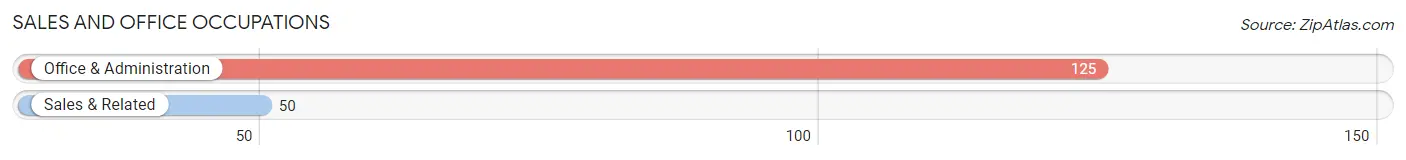
Sales and Office Occupations
The most common Sales and Office occupations in Big Pine are Office & Administration (125 | 17.3%), and Sales & Related (50 | 6.9%).
Sales and Office Occupations by Sex
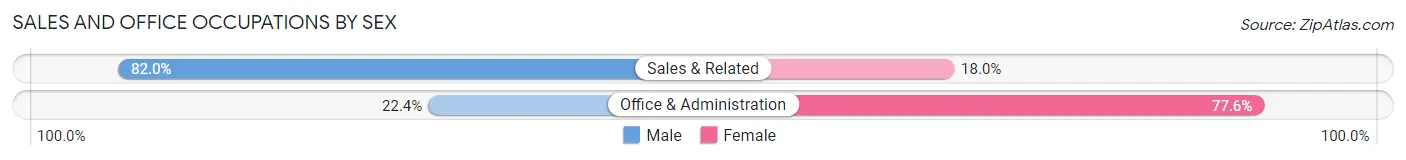
| Occupation | Male | Female |
| Sales & Related | 41 (82.0%) | 9 (18.0%) |
| Office & Administration | 28 (22.4%) | 97 (77.6%) |
| Total (Category) | 69 (39.4%) | 106 (60.6%) |
| Total (Overall) | 319 (44.1%) | 405 (55.9%) |
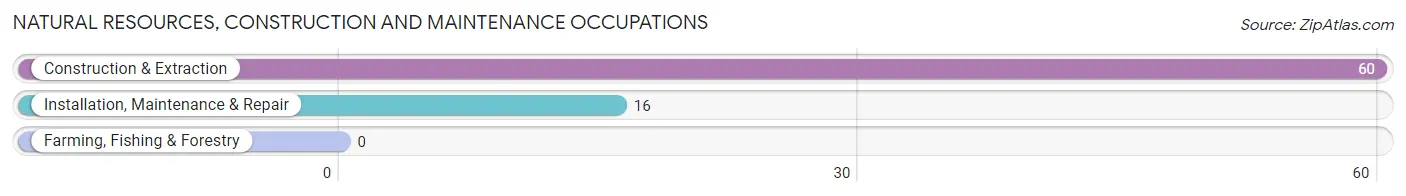
Natural Resources, Construction and Maintenance Occupations
The most common Natural Resources, Construction and Maintenance occupations in Big Pine are Construction & Extraction (60 | 8.3%), and Installation, Maintenance & Repair (16 | 2.2%).
Natural Resources, Construction and Maintenance Occupations by Sex
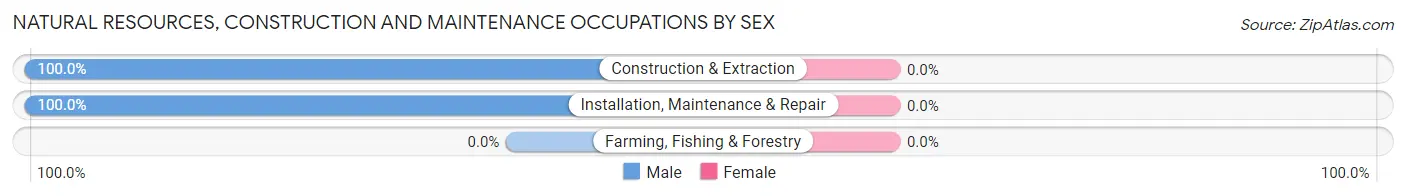
| Occupation | Male | Female |
| Farming, Fishing & Forestry | 0 (0.0%) | 0 (0.0%) |
| Construction & Extraction | 60 (100.0%) | 0 (0.0%) |
| Installation, Maintenance & Repair | 16 (100.0%) | 0 (0.0%) |
| Total (Category) | 76 (100.0%) | 0 (0.0%) |
| Total (Overall) | 319 (44.1%) | 405 (55.9%) |
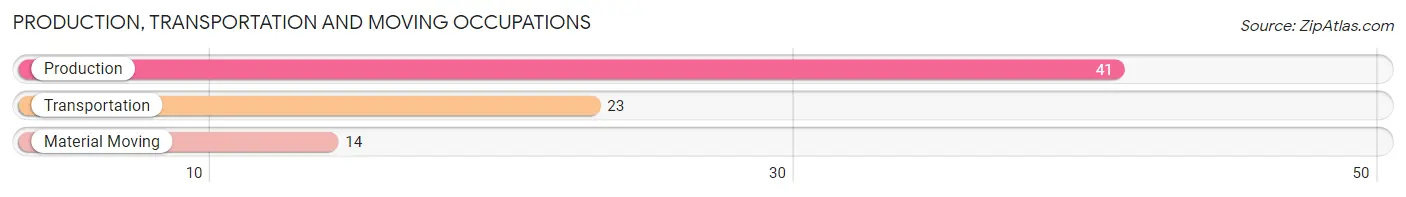
Production, Transportation and Moving Occupations
The most common Production, Transportation and Moving occupations in Big Pine are Production (41 | 5.7%), Transportation (23 | 3.2%), and Material Moving (14 | 1.9%).
Production, Transportation and Moving Occupations by Sex
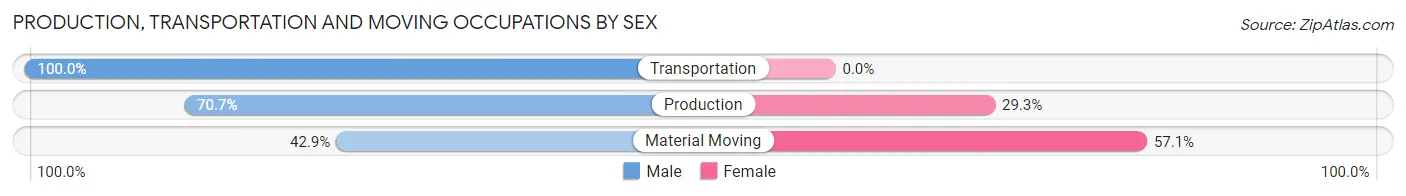
| Occupation | Male | Female |
| Production | 29 (70.7%) | 12 (29.3%) |
| Transportation | 23 (100.0%) | 0 (0.0%) |
| Material Moving | 6 (42.9%) | 8 (57.1%) |
| Total (Category) | 58 (74.4%) | 20 (25.6%) |
| Total (Overall) | 319 (44.1%) | 405 (55.9%) |
Employment Industries by Sex in Big Pine
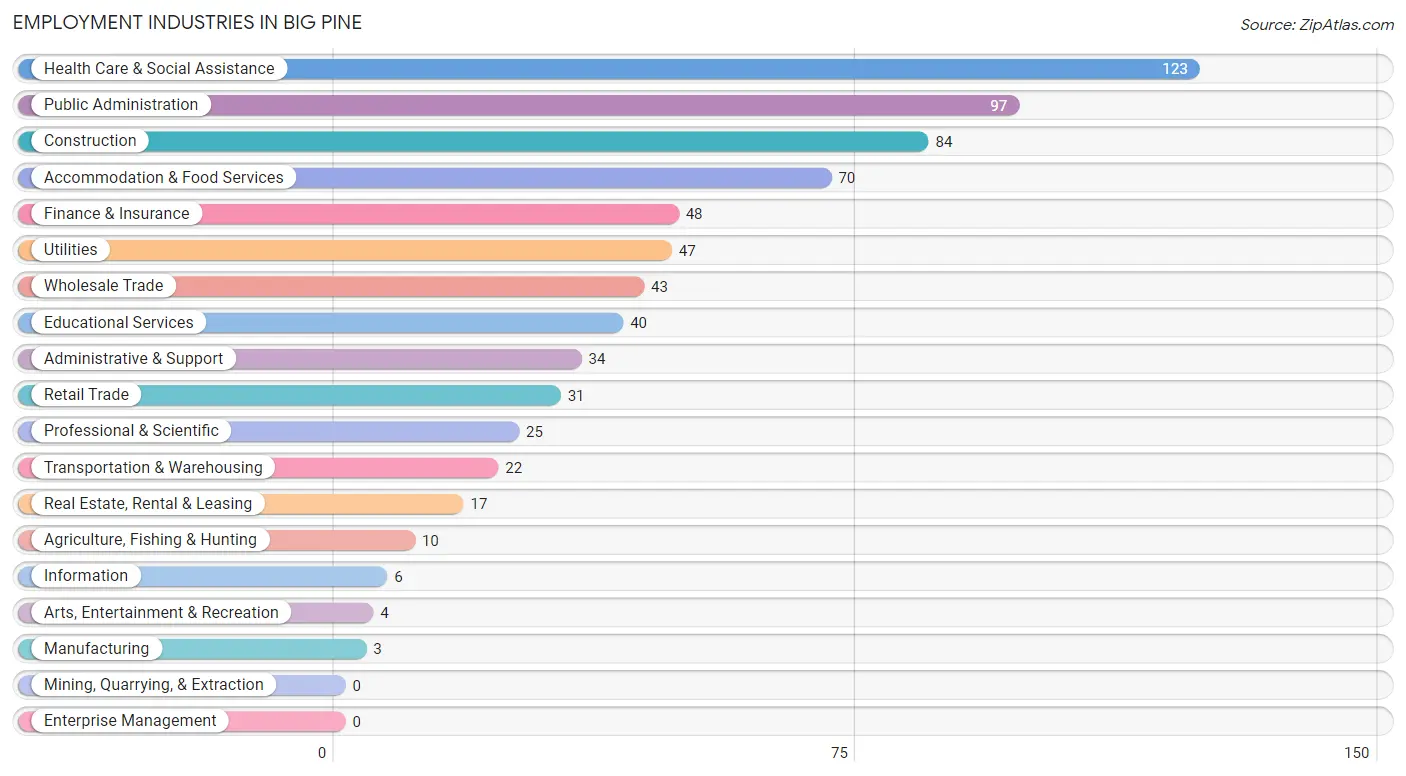
Employment Industries in Big Pine
The major employment industries in Big Pine include Health Care & Social Assistance (123 | 17.0%), Public Administration (97 | 13.4%), Construction (84 | 11.6%), Accommodation & Food Services (70 | 9.7%), and Finance & Insurance (48 | 6.6%).
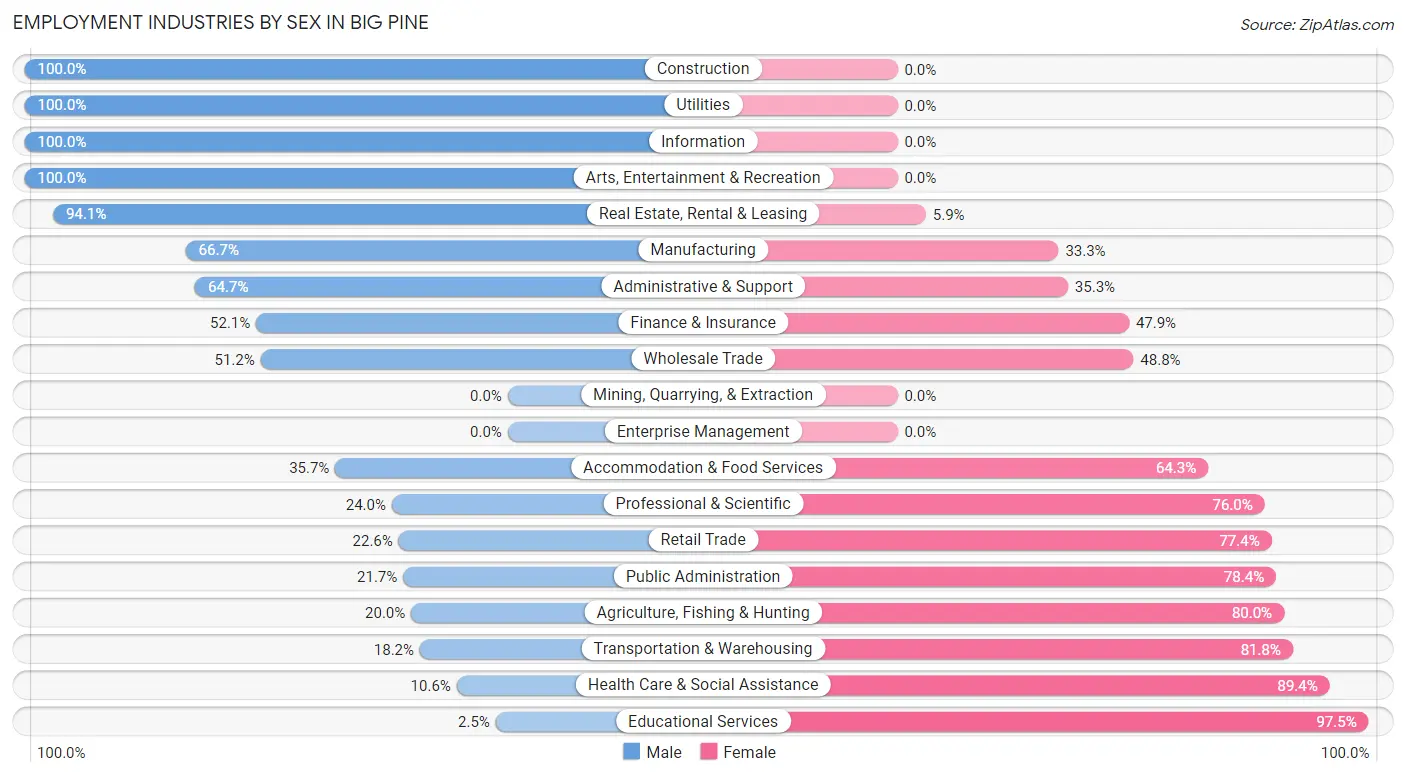
Employment Industries by Sex in Big Pine
The Big Pine industries that see more men than women are Construction (100.0%), Utilities (100.0%), and Information (100.0%), whereas the industries that tend to have a higher number of women are Educational Services (97.5%), Health Care & Social Assistance (89.4%), and Transportation & Warehousing (81.8%).
| Industry | Male | Female |
| Agriculture, Fishing & Hunting | 2 (20.0%) | 8 (80.0%) |
| Mining, Quarrying, & Extraction | 0 (0.0%) | 0 (0.0%) |
| Construction | 84 (100.0%) | 0 (0.0%) |
| Manufacturing | 2 (66.7%) | 1 (33.3%) |
| Wholesale Trade | 22 (51.2%) | 21 (48.8%) |
| Retail Trade | 7 (22.6%) | 24 (77.4%) |
| Transportation & Warehousing | 4 (18.2%) | 18 (81.8%) |
| Utilities | 47 (100.0%) | 0 (0.0%) |
| Information | 6 (100.0%) | 0 (0.0%) |
| Finance & Insurance | 25 (52.1%) | 23 (47.9%) |
| Real Estate, Rental & Leasing | 16 (94.1%) | 1 (5.9%) |
| Professional & Scientific | 6 (24.0%) | 19 (76.0%) |
| Enterprise Management | 0 (0.0%) | 0 (0.0%) |
| Administrative & Support | 22 (64.7%) | 12 (35.3%) |
| Educational Services | 1 (2.5%) | 39 (97.5%) |
| Health Care & Social Assistance | 13 (10.6%) | 110 (89.4%) |
| Arts, Entertainment & Recreation | 4 (100.0%) | 0 (0.0%) |
| Accommodation & Food Services | 25 (35.7%) | 45 (64.3%) |
| Public Administration | 21 (21.6%) | 76 (78.3%) |
| Total | 319 (44.1%) | 405 (55.9%) |
Education in Big Pine
School Enrollment in Big Pine
The most common levels of schooling among the 319 students in Big Pine are middle school (85 | 26.7%), elementary school (70 | 21.9%), and high school (67 | 21.0%).
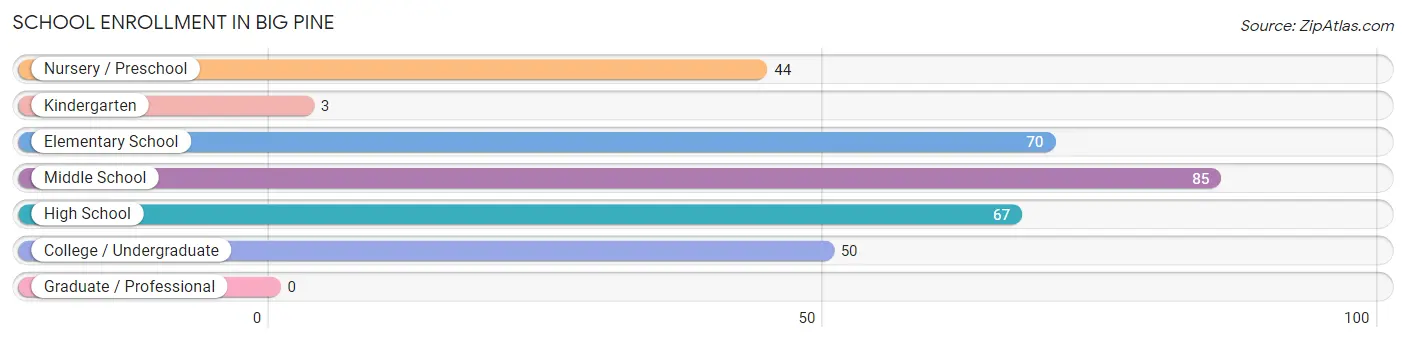
| School Level | # Students | % Students |
| Nursery / Preschool | 44 | 13.8% |
| Kindergarten | 3 | 0.9% |
| Elementary School | 70 | 21.9% |
| Middle School | 85 | 26.7% |
| High School | 67 | 21.0% |
| College / Undergraduate | 50 | 15.7% |
| Graduate / Professional | 0 | 0.0% |
| Total | 319 | 100.0% |
School Enrollment by Age by Funding Source in Big Pine
Out of a total of 319 students who are enrolled in schools in Big Pine, 23 (7.2%) attend a private institution, while the remaining 296 (92.8%) are enrolled in public schools. The age group of 3 to 4 year olds has the highest likelihood of being enrolled in private schools, with 8 (18.2% in the age bracket) enrolled. Conversely, the age group of 10 to 14 year olds has the lowest likelihood of being enrolled in a private school, with 92 (100.0% in the age bracket) attending a public institution.
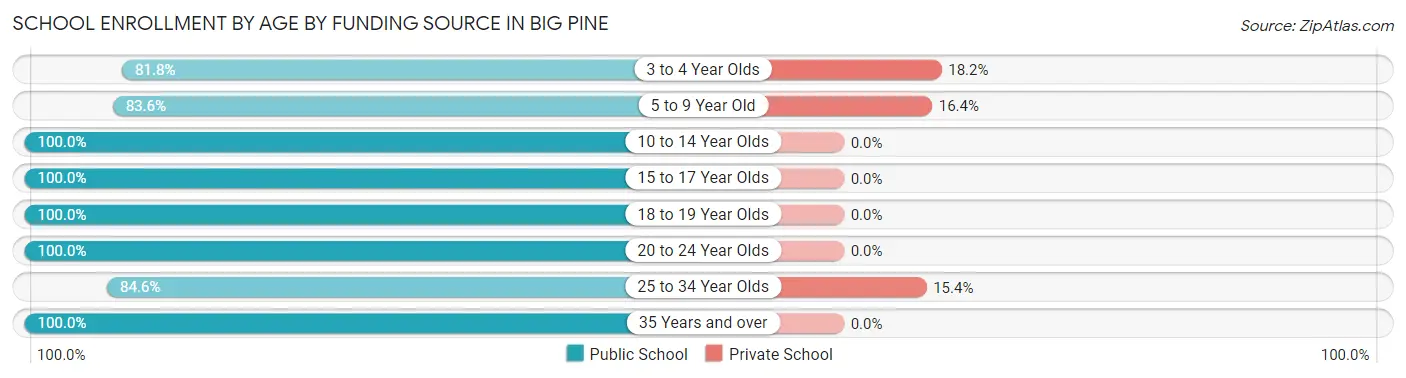
| Age Bracket | Public School | Private School |
| 3 to 4 Year Olds | 36 (81.8%) | 8 (18.2%) |
| 5 to 9 Year Old | 56 (83.6%) | 11 (16.4%) |
| 10 to 14 Year Olds | 92 (100.0%) | 0 (0.0%) |
| 15 to 17 Year Olds | 65 (100.0%) | 0 (0.0%) |
| 18 to 19 Year Olds | 2 (100.0%) | 0 (0.0%) |
| 20 to 24 Year Olds | 5 (100.0%) | 0 (0.0%) |
| 25 to 34 Year Olds | 22 (84.6%) | 4 (15.4%) |
| 35 Years and over | 18 (100.0%) | 0 (0.0%) |
| Total | 296 (92.8%) | 23 (7.2%) |
Educational Attainment by Field of Study in Big Pine
Education (40 | 18.4%), business (34 | 15.7%), social sciences (22 | 10.1%), liberal arts & history (21 | 9.7%), and science & technology (20 | 9.2%) are the most common fields of study among 217 individuals in Big Pine who have obtained a bachelor's degree or higher.
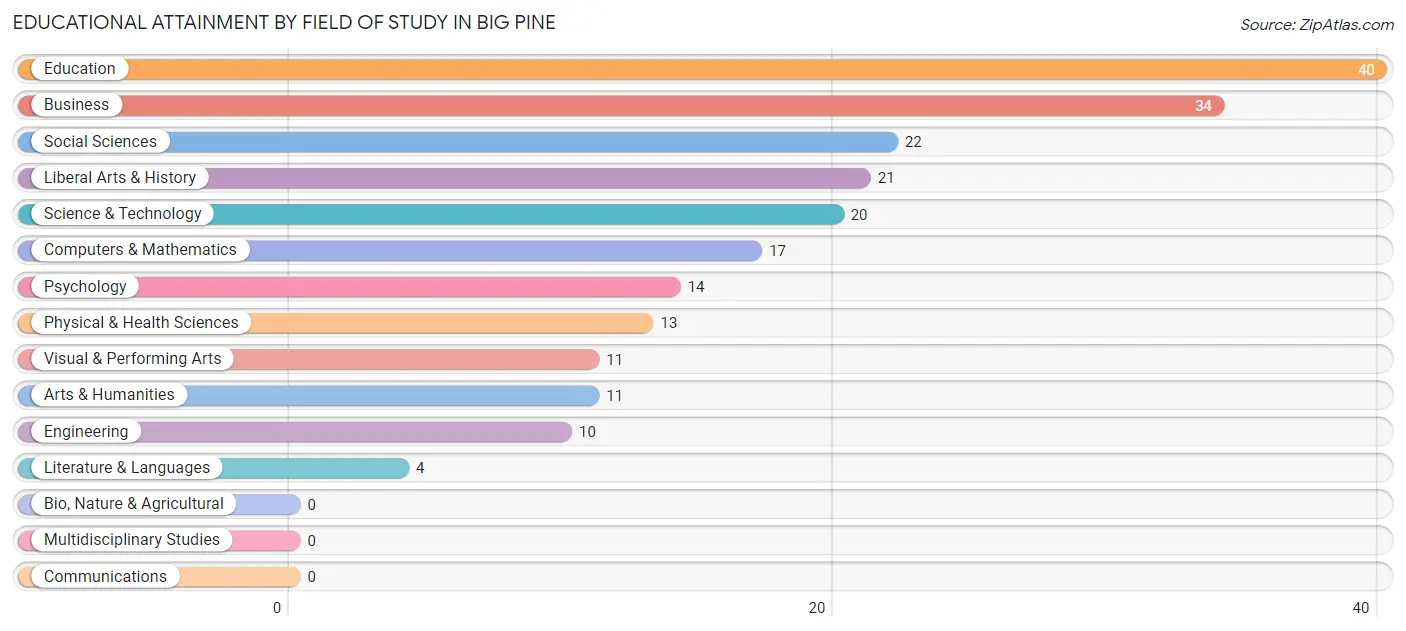
| Field of Study | # Graduates | % Graduates |
| Computers & Mathematics | 17 | 7.8% |
| Bio, Nature & Agricultural | 0 | 0.0% |
| Physical & Health Sciences | 13 | 6.0% |
| Psychology | 14 | 6.5% |
| Social Sciences | 22 | 10.1% |
| Engineering | 10 | 4.6% |
| Multidisciplinary Studies | 0 | 0.0% |
| Science & Technology | 20 | 9.2% |
| Business | 34 | 15.7% |
| Education | 40 | 18.4% |
| Literature & Languages | 4 | 1.8% |
| Liberal Arts & History | 21 | 9.7% |
| Visual & Performing Arts | 11 | 5.1% |
| Communications | 0 | 0.0% |
| Arts & Humanities | 11 | 5.1% |
| Total | 217 | 100.0% |
Transportation & Commute in Big Pine
Vehicle Availability by Sex in Big Pine
The most prevalent vehicle ownership categories in Big Pine are males with 1 vehicle (116, accounting for 37.9%) and females with 1 vehicle (90, making up 29.4%).
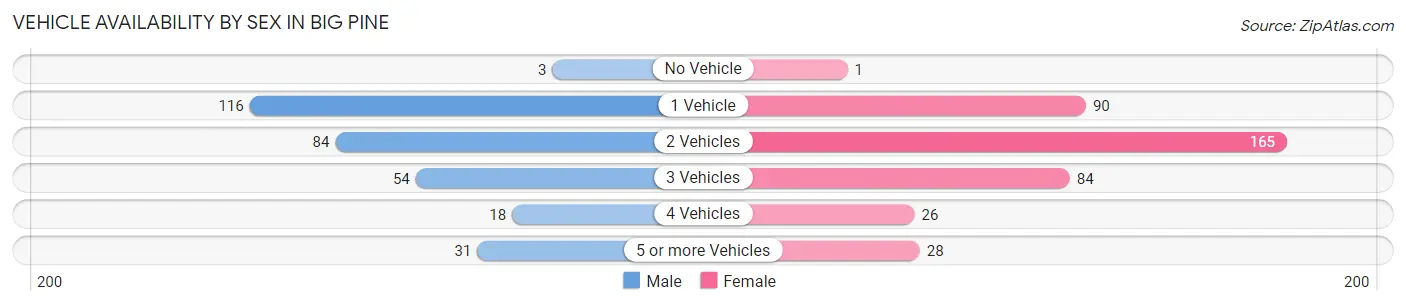
| Vehicles Available | Male | Female |
| No Vehicle | 3 (1.0%) | 1 (0.3%) |
| 1 Vehicle | 116 (37.9%) | 90 (22.8%) |
| 2 Vehicles | 84 (27.5%) | 165 (41.9%) |
| 3 Vehicles | 54 (17.6%) | 84 (21.3%) |
| 4 Vehicles | 18 (5.9%) | 26 (6.6%) |
| 5 or more Vehicles | 31 (10.1%) | 28 (7.1%) |
| Total | 306 (100.0%) | 394 (100.0%) |
Commute Time in Big Pine
The most frequently occuring commute durations in Big Pine are 20 to 24 minutes (282 commuters, 42.3%), 15 to 19 minutes (171 commuters, 25.7%), and 30 to 34 minutes (54 commuters, 8.1%).
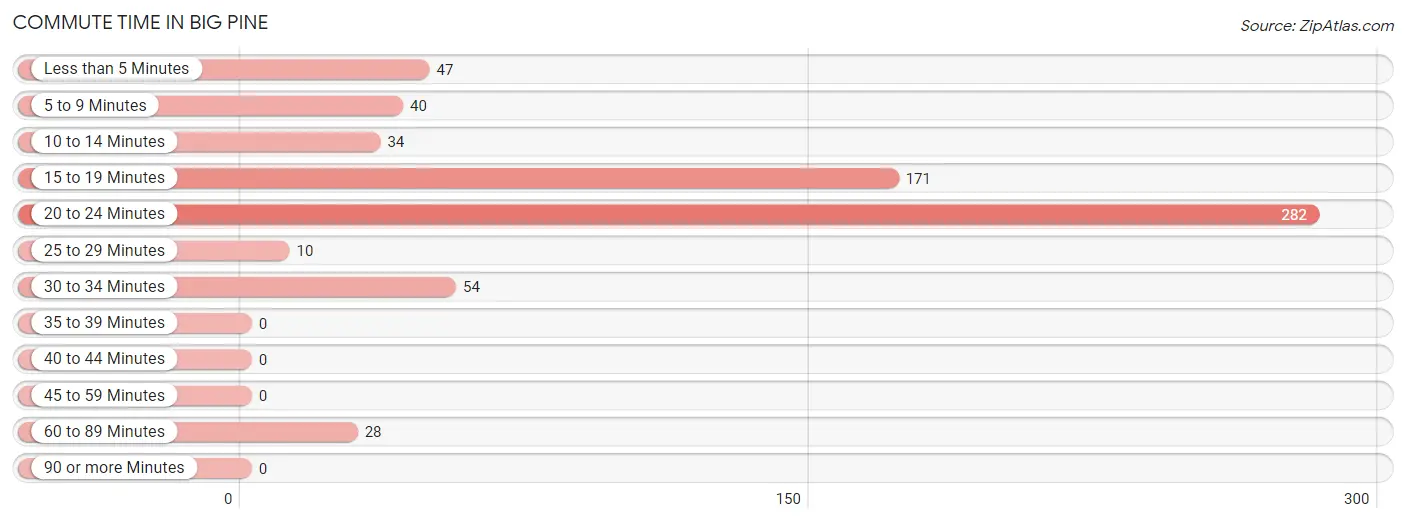
| Commute Time | # Commuters | % Commuters |
| Less than 5 Minutes | 47 | 7.1% |
| 5 to 9 Minutes | 40 | 6.0% |
| 10 to 14 Minutes | 34 | 5.1% |
| 15 to 19 Minutes | 171 | 25.7% |
| 20 to 24 Minutes | 282 | 42.3% |
| 25 to 29 Minutes | 10 | 1.5% |
| 30 to 34 Minutes | 54 | 8.1% |
| 35 to 39 Minutes | 0 | 0.0% |
| 40 to 44 Minutes | 0 | 0.0% |
| 45 to 59 Minutes | 0 | 0.0% |
| 60 to 89 Minutes | 28 | 4.2% |
| 90 or more Minutes | 0 | 0.0% |
Commute Time by Sex in Big Pine
The most common commute times in Big Pine are 20 to 24 minutes (94 commuters, 33.8%) for males and 20 to 24 minutes (188 commuters, 48.4%) for females.
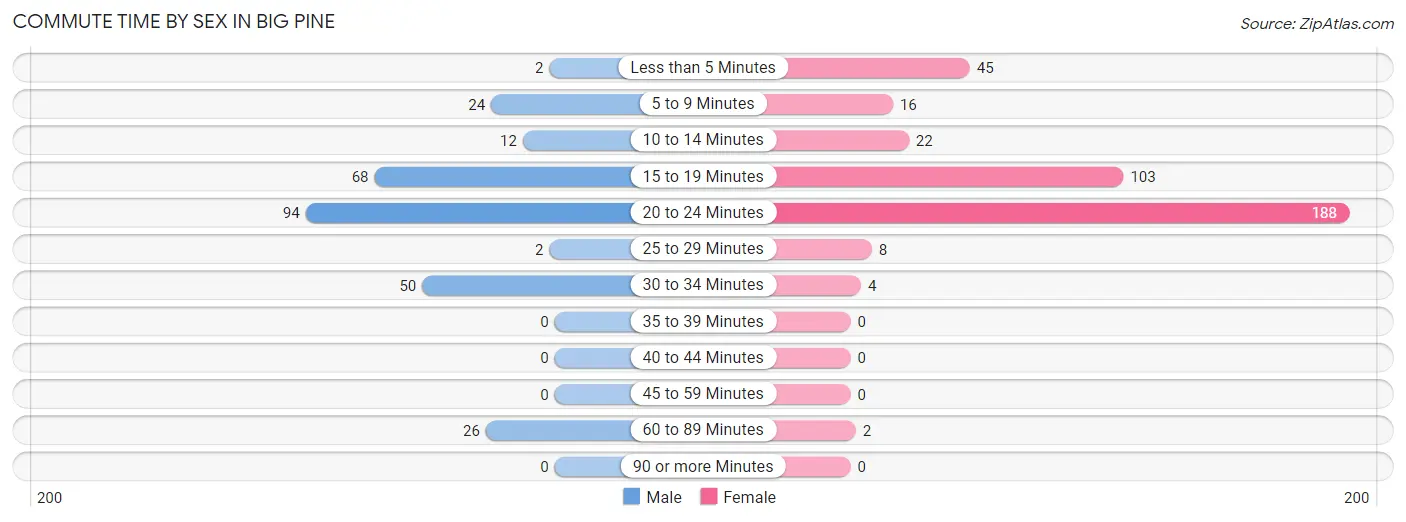
| Commute Time | Male | Female |
| Less than 5 Minutes | 2 (0.7%) | 45 (11.6%) |
| 5 to 9 Minutes | 24 (8.6%) | 16 (4.1%) |
| 10 to 14 Minutes | 12 (4.3%) | 22 (5.7%) |
| 15 to 19 Minutes | 68 (24.5%) | 103 (26.6%) |
| 20 to 24 Minutes | 94 (33.8%) | 188 (48.4%) |
| 25 to 29 Minutes | 2 (0.7%) | 8 (2.1%) |
| 30 to 34 Minutes | 50 (18.0%) | 4 (1.0%) |
| 35 to 39 Minutes | 0 (0.0%) | 0 (0.0%) |
| 40 to 44 Minutes | 0 (0.0%) | 0 (0.0%) |
| 45 to 59 Minutes | 0 (0.0%) | 0 (0.0%) |
| 60 to 89 Minutes | 26 (9.3%) | 2 (0.5%) |
| 90 or more Minutes | 0 (0.0%) | 0 (0.0%) |
Time of Departure to Work by Sex in Big Pine
The most frequent times of departure to work in Big Pine are 6:00 AM to 6:29 AM (60, 21.6%) for males and 7:30 AM to 7:59 AM (122, 31.4%) for females.
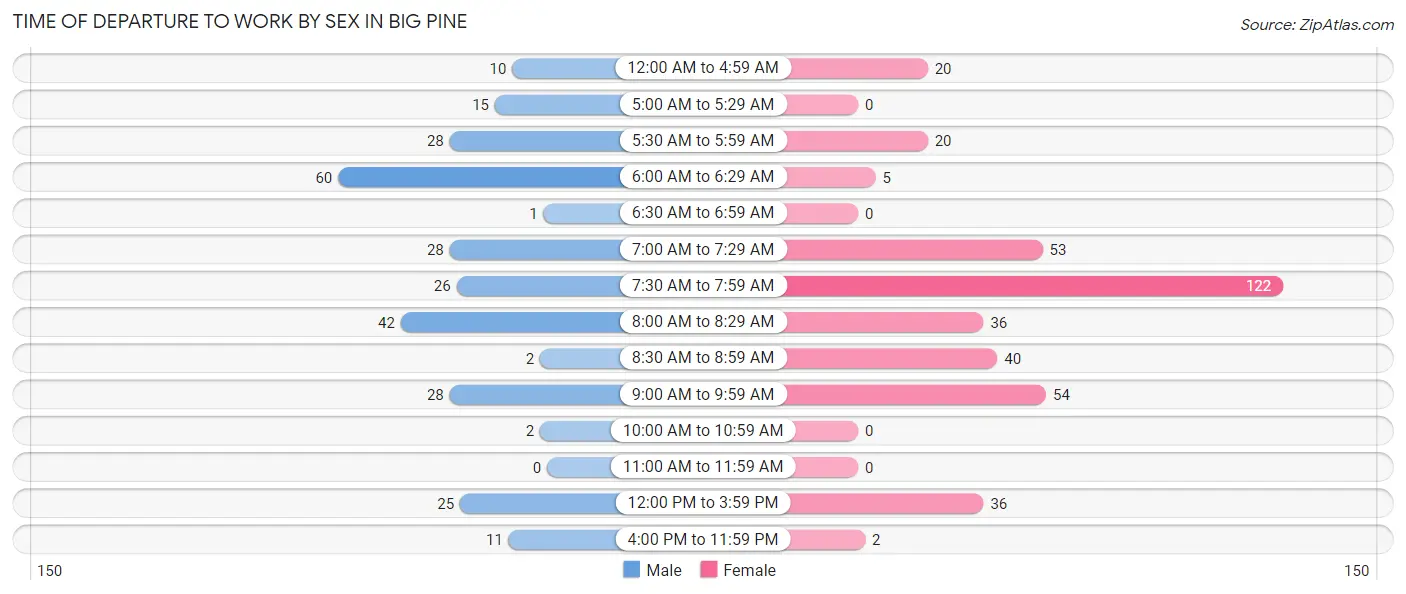
| Time of Departure | Male | Female |
| 12:00 AM to 4:59 AM | 10 (3.6%) | 20 (5.1%) |
| 5:00 AM to 5:29 AM | 15 (5.4%) | 0 (0.0%) |
| 5:30 AM to 5:59 AM | 28 (10.1%) | 20 (5.1%) |
| 6:00 AM to 6:29 AM | 60 (21.6%) | 5 (1.3%) |
| 6:30 AM to 6:59 AM | 1 (0.4%) | 0 (0.0%) |
| 7:00 AM to 7:29 AM | 28 (10.1%) | 53 (13.7%) |
| 7:30 AM to 7:59 AM | 26 (9.3%) | 122 (31.4%) |
| 8:00 AM to 8:29 AM | 42 (15.1%) | 36 (9.3%) |
| 8:30 AM to 8:59 AM | 2 (0.7%) | 40 (10.3%) |
| 9:00 AM to 9:59 AM | 28 (10.1%) | 54 (13.9%) |
| 10:00 AM to 10:59 AM | 2 (0.7%) | 0 (0.0%) |
| 11:00 AM to 11:59 AM | 0 (0.0%) | 0 (0.0%) |
| 12:00 PM to 3:59 PM | 25 (9.0%) | 36 (9.3%) |
| 4:00 PM to 11:59 PM | 11 (4.0%) | 2 (0.5%) |
| Total | 278 (100.0%) | 388 (100.0%) |
Housing Occupancy in Big Pine
Occupancy by Ownership in Big Pine
Of the total 678 dwellings in Big Pine, owner-occupied units account for 509 (75.1%), while renter-occupied units make up 169 (24.9%).
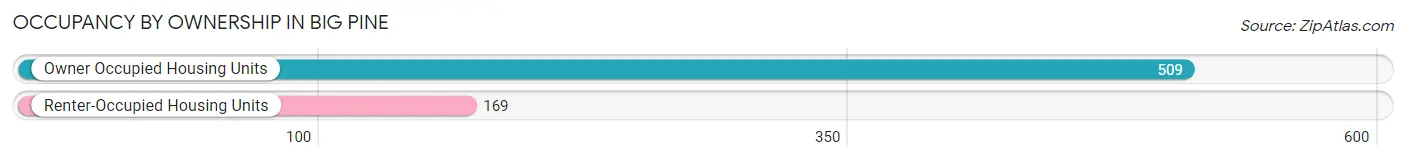
| Occupancy | # Housing Units | % Housing Units |
| Owner Occupied Housing Units | 509 | 75.1% |
| Renter-Occupied Housing Units | 169 | 24.9% |
| Total Occupied Housing Units | 678 | 100.0% |
Occupancy by Household Size in Big Pine
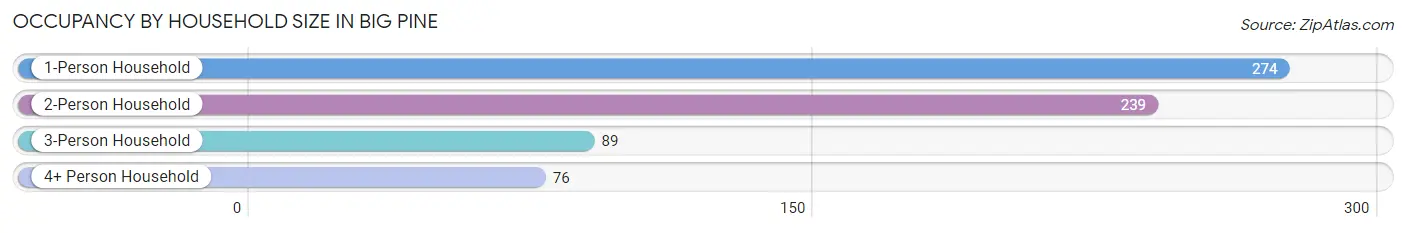
| Household Size | # Housing Units | % Housing Units |
| 1-Person Household | 274 | 40.4% |
| 2-Person Household | 239 | 35.2% |
| 3-Person Household | 89 | 13.1% |
| 4+ Person Household | 76 | 11.2% |
| Total Housing Units | 678 | 100.0% |
Occupancy by Ownership by Household Size in Big Pine
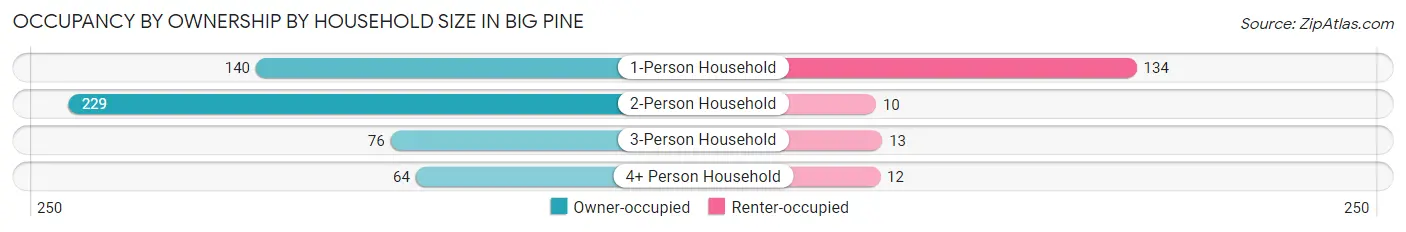
| Household Size | Owner-occupied | Renter-occupied |
| 1-Person Household | 140 (51.1%) | 134 (48.9%) |
| 2-Person Household | 229 (95.8%) | 10 (4.2%) |
| 3-Person Household | 76 (85.4%) | 13 (14.6%) |
| 4+ Person Household | 64 (84.2%) | 12 (15.8%) |
| Total Housing Units | 509 (75.1%) | 169 (24.9%) |
Occupancy by Educational Attainment in Big Pine
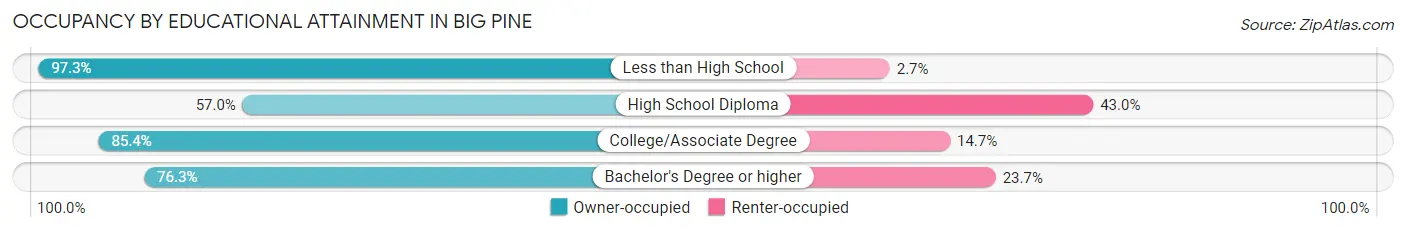
| Household Size | Owner-occupied | Renter-occupied |
| Less than High School | 36 (97.3%) | 1 (2.7%) |
| High School Diploma | 131 (57.0%) | 99 (43.0%) |
| College/Associate Degree | 268 (85.4%) | 46 (14.6%) |
| Bachelor's Degree or higher | 74 (76.3%) | 23 (23.7%) |
Occupancy by Age of Householder in Big Pine
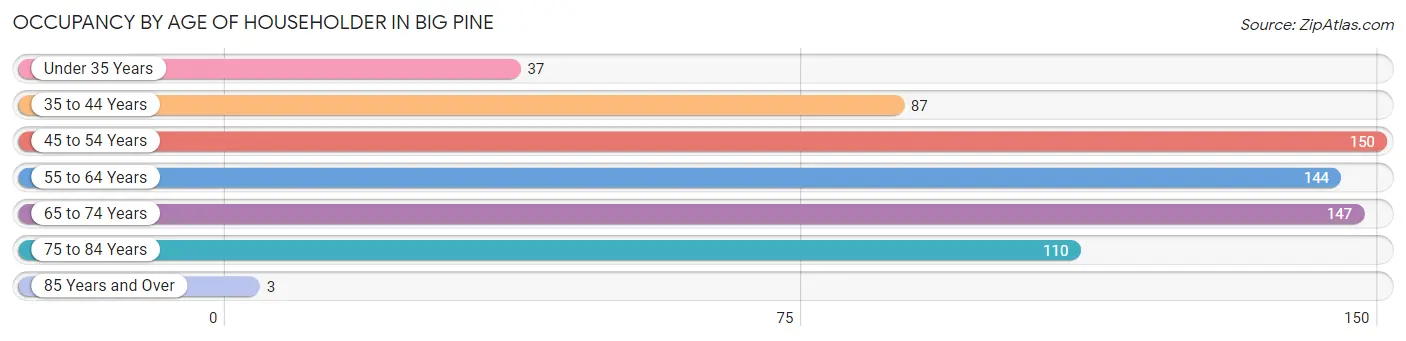
| Age Bracket | # Households | % Households |
| Under 35 Years | 37 | 5.5% |
| 35 to 44 Years | 87 | 12.8% |
| 45 to 54 Years | 150 | 22.1% |
| 55 to 64 Years | 144 | 21.2% |
| 65 to 74 Years | 147 | 21.7% |
| 75 to 84 Years | 110 | 16.2% |
| 85 Years and Over | 3 | 0.4% |
| Total | 678 | 100.0% |
Housing Finances in Big Pine
Median Income by Occupancy in Big Pine
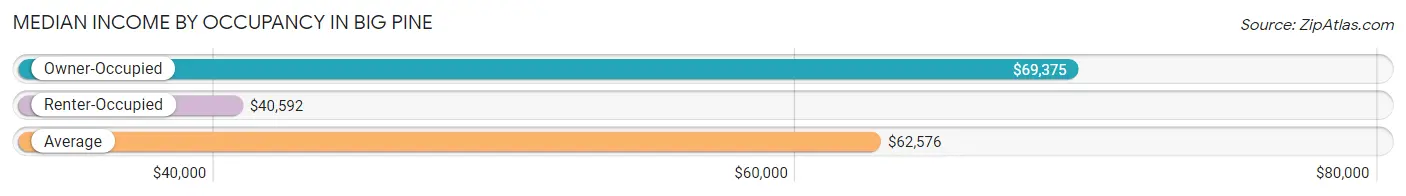
| Occupancy Type | # Households | Median Income |
| Owner-Occupied | 509 (75.1%) | $69,375 |
| Renter-Occupied | 169 (24.9%) | $40,592 |
| Average | 678 (100.0%) | $62,576 |
Occupancy by Householder Income Bracket in Big Pine
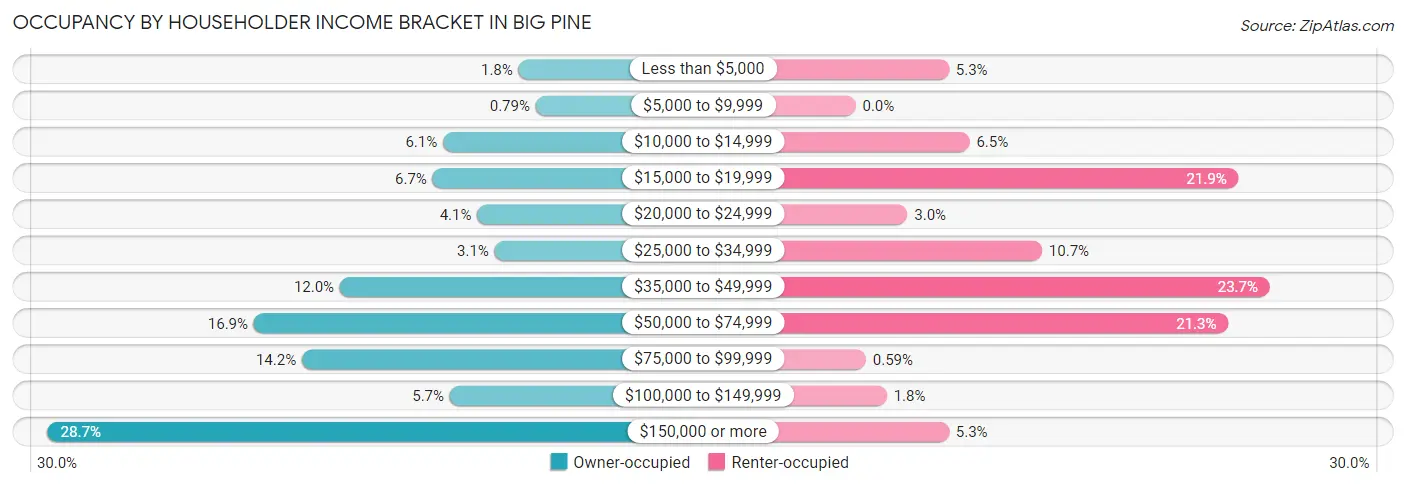
| Income Bracket | Owner-occupied | Renter-occupied |
| Less than $5,000 | 9 (1.8%) | 9 (5.3%) |
| $5,000 to $9,999 | 4 (0.8%) | 0 (0.0%) |
| $10,000 to $14,999 | 31 (6.1%) | 11 (6.5%) |
| $15,000 to $19,999 | 34 (6.7%) | 37 (21.9%) |
| $20,000 to $24,999 | 21 (4.1%) | 5 (3.0%) |
| $25,000 to $34,999 | 16 (3.1%) | 18 (10.6%) |
| $35,000 to $49,999 | 61 (12.0%) | 40 (23.7%) |
| $50,000 to $74,999 | 86 (16.9%) | 36 (21.3%) |
| $75,000 to $99,999 | 72 (14.1%) | 1 (0.6%) |
| $100,000 to $149,999 | 29 (5.7%) | 3 (1.8%) |
| $150,000 or more | 146 (28.7%) | 9 (5.3%) |
| Total | 509 (100.0%) | 169 (100.0%) |
Monthly Housing Cost Tiers in Big Pine
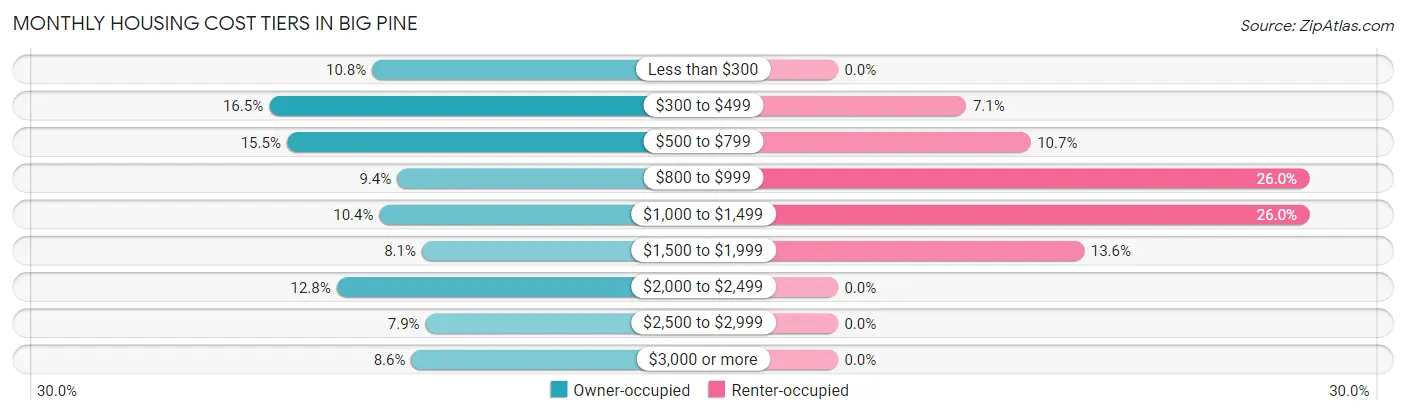
| Monthly Cost | Owner-occupied | Renter-occupied |
| Less than $300 | 55 (10.8%) | 0 (0.0%) |
| $300 to $499 | 84 (16.5%) | 12 (7.1%) |
| $500 to $799 | 79 (15.5%) | 18 (10.6%) |
| $800 to $999 | 48 (9.4%) | 44 (26.0%) |
| $1,000 to $1,499 | 53 (10.4%) | 44 (26.0%) |
| $1,500 to $1,999 | 41 (8.1%) | 23 (13.6%) |
| $2,000 to $2,499 | 65 (12.8%) | 0 (0.0%) |
| $2,500 to $2,999 | 40 (7.9%) | 0 (0.0%) |
| $3,000 or more | 44 (8.6%) | 0 (0.0%) |
| Total | 509 (100.0%) | 169 (100.0%) |
Physical Housing Characteristics in Big Pine
Housing Structures in Big Pine
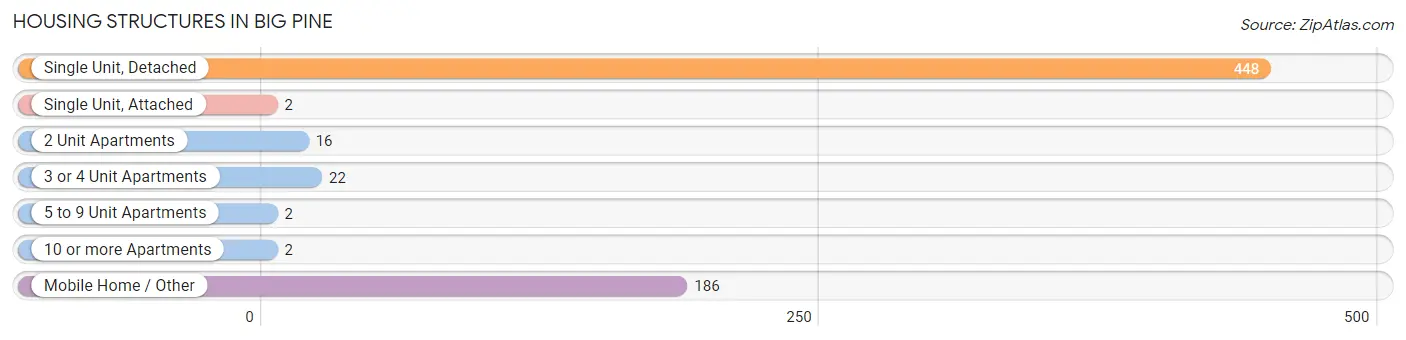
| Structure Type | # Housing Units | % Housing Units |
| Single Unit, Detached | 448 | 66.1% |
| Single Unit, Attached | 2 | 0.3% |
| 2 Unit Apartments | 16 | 2.4% |
| 3 or 4 Unit Apartments | 22 | 3.2% |
| 5 to 9 Unit Apartments | 2 | 0.3% |
| 10 or more Apartments | 2 | 0.3% |
| Mobile Home / Other | 186 | 27.4% |
| Total | 678 | 100.0% |
Housing Structures by Occupancy in Big Pine
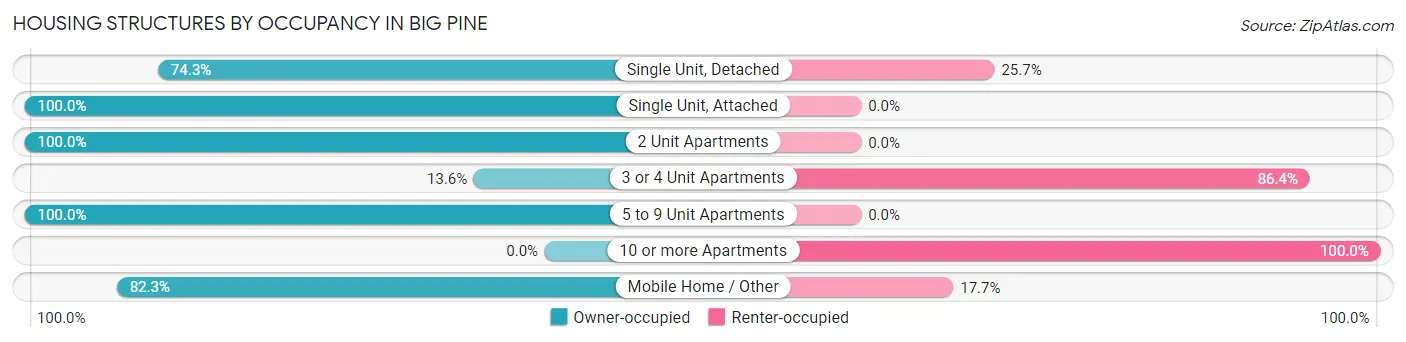
| Structure Type | Owner-occupied | Renter-occupied |
| Single Unit, Detached | 333 (74.3%) | 115 (25.7%) |
| Single Unit, Attached | 2 (100.0%) | 0 (0.0%) |
| 2 Unit Apartments | 16 (100.0%) | 0 (0.0%) |
| 3 or 4 Unit Apartments | 3 (13.6%) | 19 (86.4%) |
| 5 to 9 Unit Apartments | 2 (100.0%) | 0 (0.0%) |
| 10 or more Apartments | 0 (0.0%) | 2 (100.0%) |
| Mobile Home / Other | 153 (82.3%) | 33 (17.7%) |
| Total | 509 (75.1%) | 169 (24.9%) |
Housing Structures by Number of Rooms in Big Pine
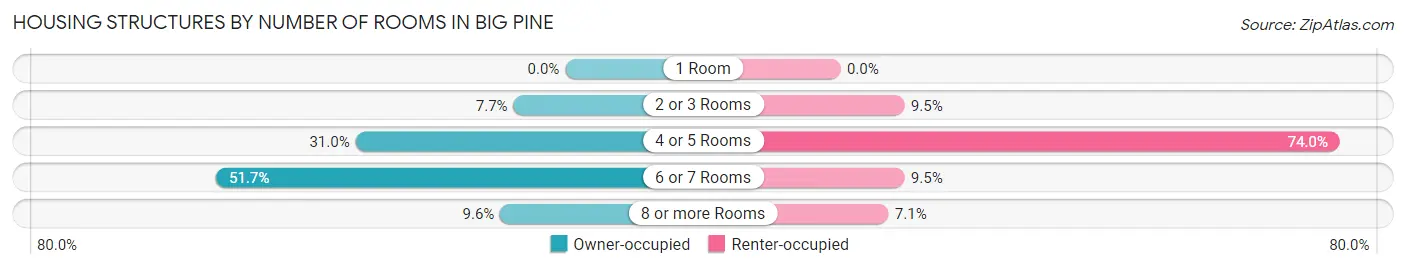
| Number of Rooms | Owner-occupied | Renter-occupied |
| 1 Room | 0 (0.0%) | 0 (0.0%) |
| 2 or 3 Rooms | 39 (7.7%) | 16 (9.5%) |
| 4 or 5 Rooms | 158 (31.0%) | 125 (74.0%) |
| 6 or 7 Rooms | 263 (51.7%) | 16 (9.5%) |
| 8 or more Rooms | 49 (9.6%) | 12 (7.1%) |
| Total | 509 (100.0%) | 169 (100.0%) |
Housing Structure by Heating Type in Big Pine
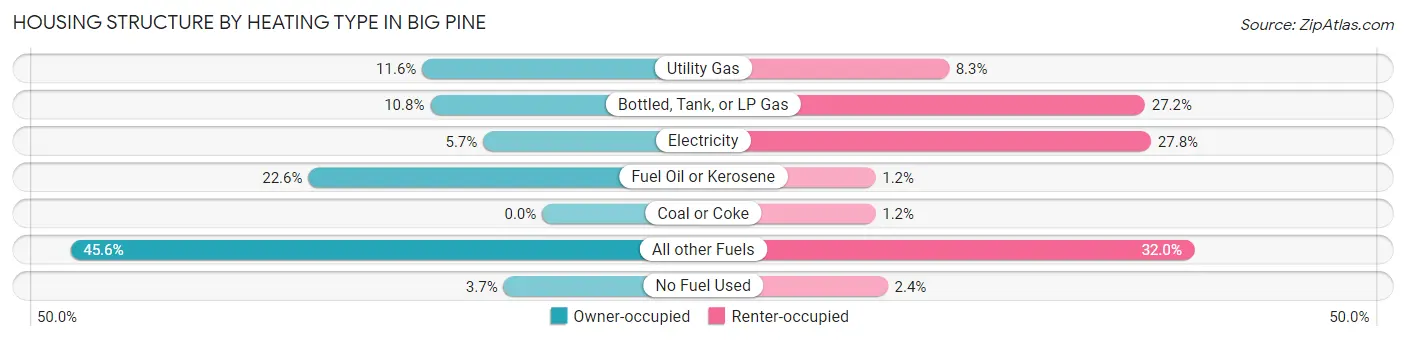
| Heating Type | Owner-occupied | Renter-occupied |
| Utility Gas | 59 (11.6%) | 14 (8.3%) |
| Bottled, Tank, or LP Gas | 55 (10.8%) | 46 (27.2%) |
| Electricity | 29 (5.7%) | 47 (27.8%) |
| Fuel Oil or Kerosene | 115 (22.6%) | 2 (1.2%) |
| Coal or Coke | 0 (0.0%) | 2 (1.2%) |
| All other Fuels | 232 (45.6%) | 54 (32.0%) |
| No Fuel Used | 19 (3.7%) | 4 (2.4%) |
| Total | 509 (100.0%) | 169 (100.0%) |
Household Vehicle Usage in Big Pine
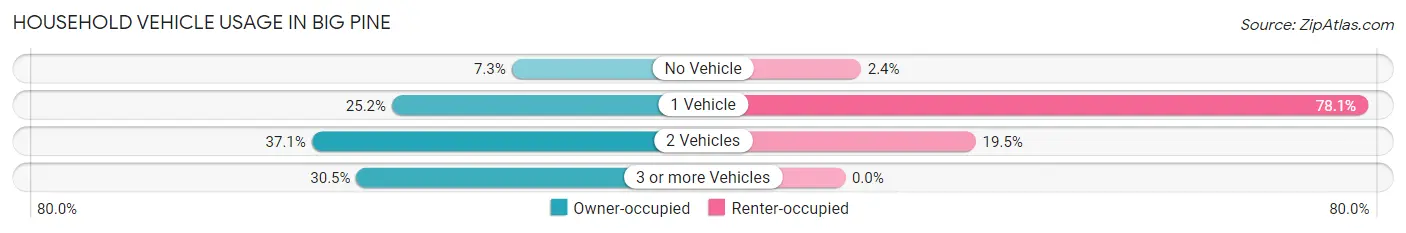
| Vehicles per Household | Owner-occupied | Renter-occupied |
| No Vehicle | 37 (7.3%) | 4 (2.4%) |
| 1 Vehicle | 128 (25.2%) | 132 (78.1%) |
| 2 Vehicles | 189 (37.1%) | 33 (19.5%) |
| 3 or more Vehicles | 155 (30.4%) | 0 (0.0%) |
| Total | 509 (100.0%) | 169 (100.0%) |
Real Estate & Mortgages in Big Pine
Real Estate and Mortgage Overview in Big Pine
| Characteristic | Without Mortgage | With Mortgage |
| Housing Units | 243 | 266 |
| Median Property Value | $245,100 | $346,300 |
| Median Household Income | $42,917 | $120 |
| Monthly Housing Costs | $505 | $44 |
| Real Estate Taxes | $2,081 | $48 |
Property Value by Mortgage Status in Big Pine
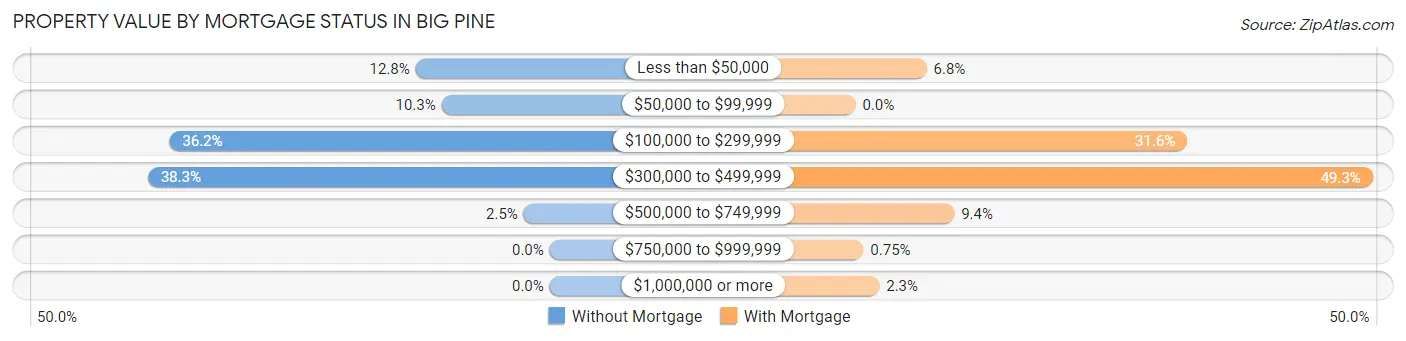
| Property Value | Without Mortgage | With Mortgage |
| Less than $50,000 | 31 (12.8%) | 18 (6.8%) |
| $50,000 to $99,999 | 25 (10.3%) | 0 (0.0%) |
| $100,000 to $299,999 | 88 (36.2%) | 84 (31.6%) |
| $300,000 to $499,999 | 93 (38.3%) | 131 (49.2%) |
| $500,000 to $749,999 | 6 (2.5%) | 25 (9.4%) |
| $750,000 to $999,999 | 0 (0.0%) | 2 (0.7%) |
| $1,000,000 or more | 0 (0.0%) | 6 (2.3%) |
| Total | 243 (100.0%) | 266 (100.0%) |
Household Income by Mortgage Status in Big Pine
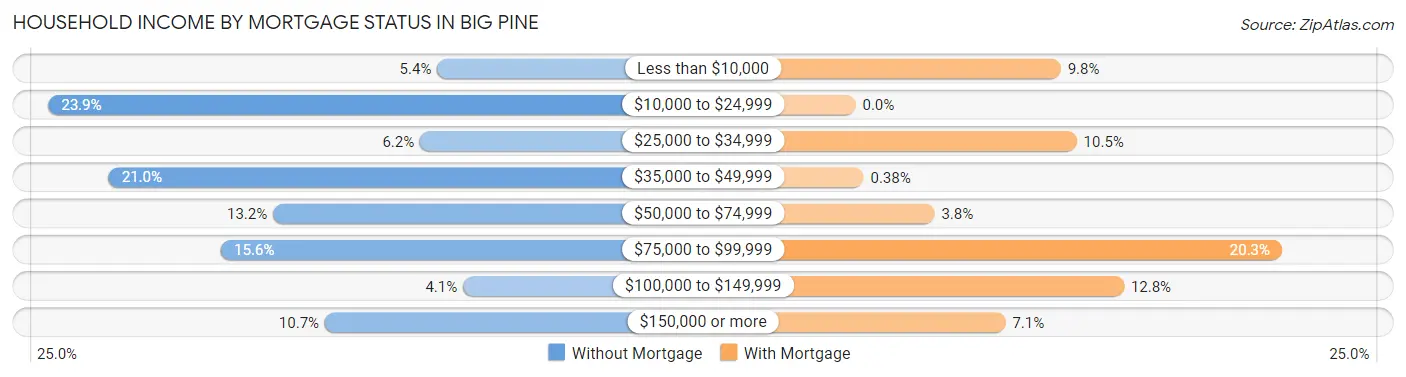
| Household Income | Without Mortgage | With Mortgage |
| Less than $10,000 | 13 (5.3%) | 26 (9.8%) |
| $10,000 to $24,999 | 58 (23.9%) | 0 (0.0%) |
| $25,000 to $34,999 | 15 (6.2%) | 28 (10.5%) |
| $35,000 to $49,999 | 51 (21.0%) | 1 (0.4%) |
| $50,000 to $74,999 | 32 (13.2%) | 10 (3.8%) |
| $75,000 to $99,999 | 38 (15.6%) | 54 (20.3%) |
| $100,000 to $149,999 | 10 (4.1%) | 34 (12.8%) |
| $150,000 or more | 26 (10.7%) | 19 (7.1%) |
| Total | 243 (100.0%) | 266 (100.0%) |
Property Value to Household Income Ratio in Big Pine
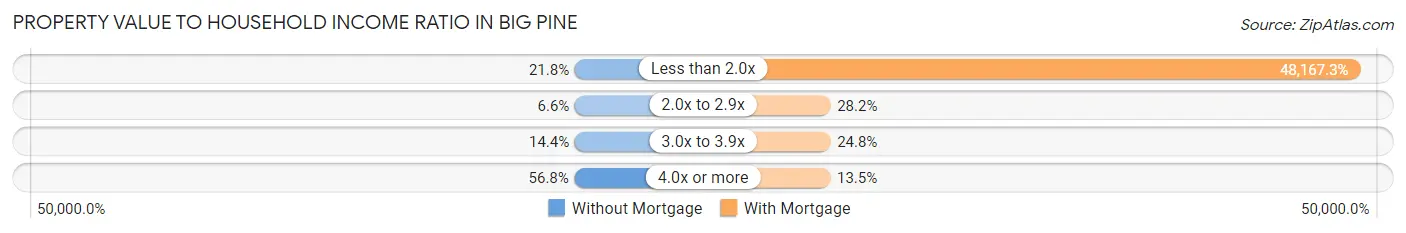
| Value-to-Income Ratio | Without Mortgage | With Mortgage |
| Less than 2.0x | 53 (21.8%) | 128,125 (48,167.3%) |
| 2.0x to 2.9x | 16 (6.6%) | 75 (28.2%) |
| 3.0x to 3.9x | 35 (14.4%) | 66 (24.8%) |
| 4.0x or more | 138 (56.8%) | 36 (13.5%) |
| Total | 243 (100.0%) | 266 (100.0%) |
Real Estate Taxes by Mortgage Status in Big Pine
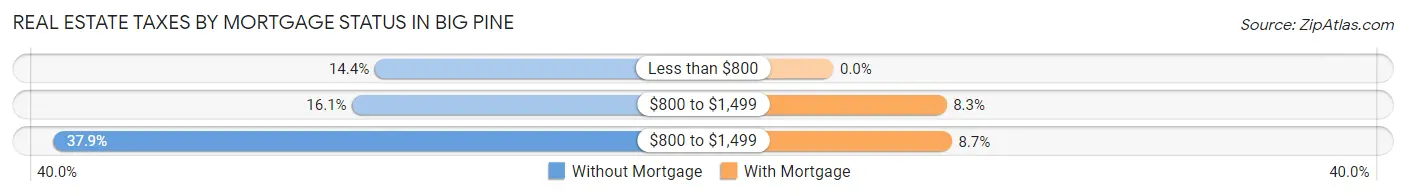
| Property Taxes | Without Mortgage | With Mortgage |
| Less than $800 | 35 (14.4%) | 0 (0.0%) |
| $800 to $1,499 | 39 (16.1%) | 22 (8.3%) |
| $800 to $1,499 | 92 (37.9%) | 23 (8.6%) |
| Total | 243 (100.0%) | 266 (100.0%) |
Health & Disability in Big Pine
Health Insurance Coverage by Age in Big Pine
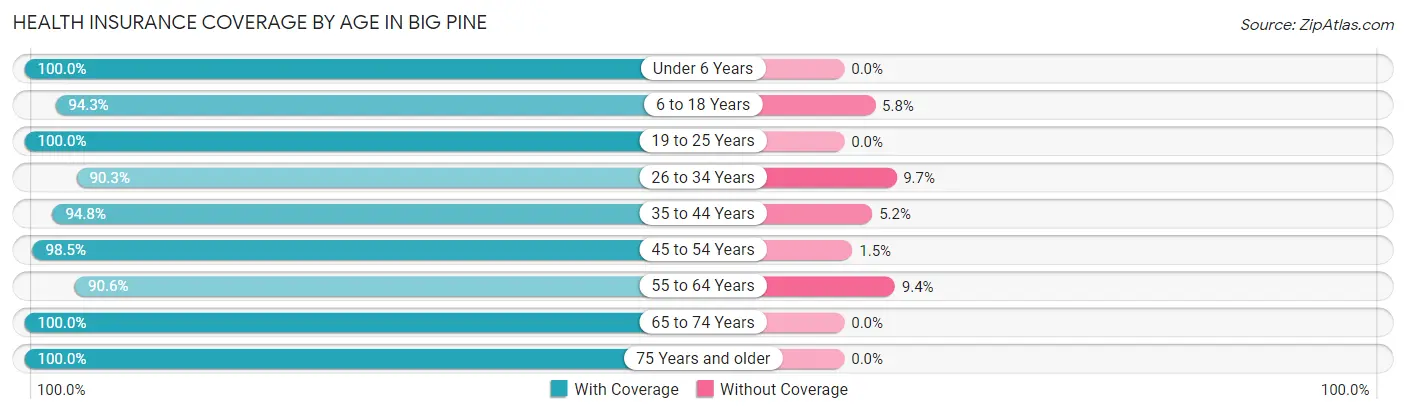
| Age Bracket | With Coverage | Without Coverage |
| Under 6 Years | 75 (100.0%) | 0 (0.0%) |
| 6 to 18 Years | 213 (94.3%) | 13 (5.8%) |
| 19 to 25 Years | 108 (100.0%) | 0 (0.0%) |
| 26 to 34 Years | 84 (90.3%) | 9 (9.7%) |
| 35 to 44 Years | 182 (94.8%) | 10 (5.2%) |
| 45 to 54 Years | 262 (98.5%) | 4 (1.5%) |
| 55 to 64 Years | 221 (90.6%) | 23 (9.4%) |
| 65 to 74 Years | 219 (100.0%) | 0 (0.0%) |
| 75 Years and older | 140 (100.0%) | 0 (0.0%) |
| Total | 1,504 (96.2%) | 59 (3.8%) |
Health Insurance Coverage by Citizenship Status in Big Pine
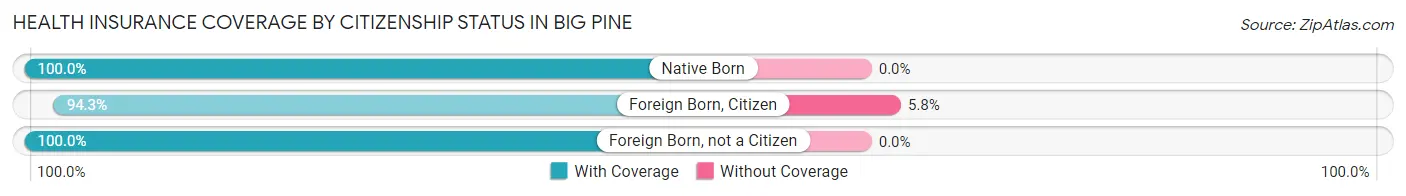
| Citizenship Status | With Coverage | Without Coverage |
| Native Born | 75 (100.0%) | 0 (0.0%) |
| Foreign Born, Citizen | 213 (94.3%) | 13 (5.8%) |
| Foreign Born, not a Citizen | 108 (100.0%) | 0 (0.0%) |
Health Insurance Coverage by Household Income in Big Pine
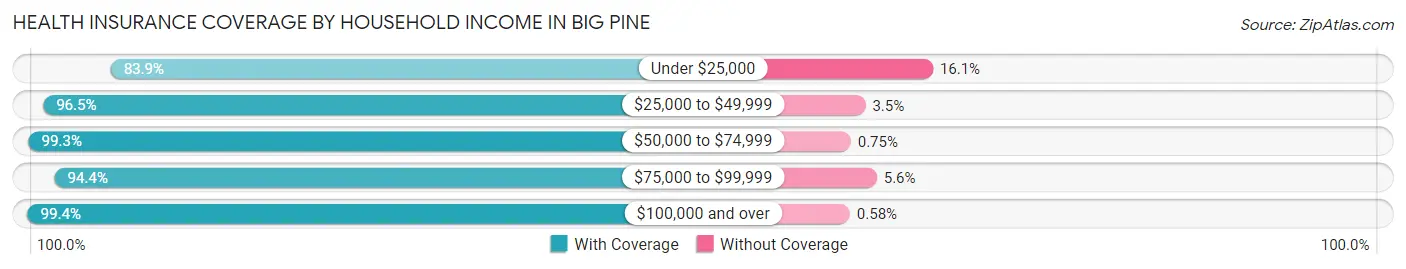
| Household Income | With Coverage | Without Coverage |
| Under $25,000 | 187 (83.9%) | 36 (16.1%) |
| $25,000 to $49,999 | 193 (96.5%) | 7 (3.5%) |
| $50,000 to $74,999 | 265 (99.3%) | 2 (0.7%) |
| $75,000 to $99,999 | 168 (94.4%) | 10 (5.6%) |
| $100,000 and over | 691 (99.4%) | 4 (0.6%) |
Public vs Private Health Insurance Coverage by Age in Big Pine
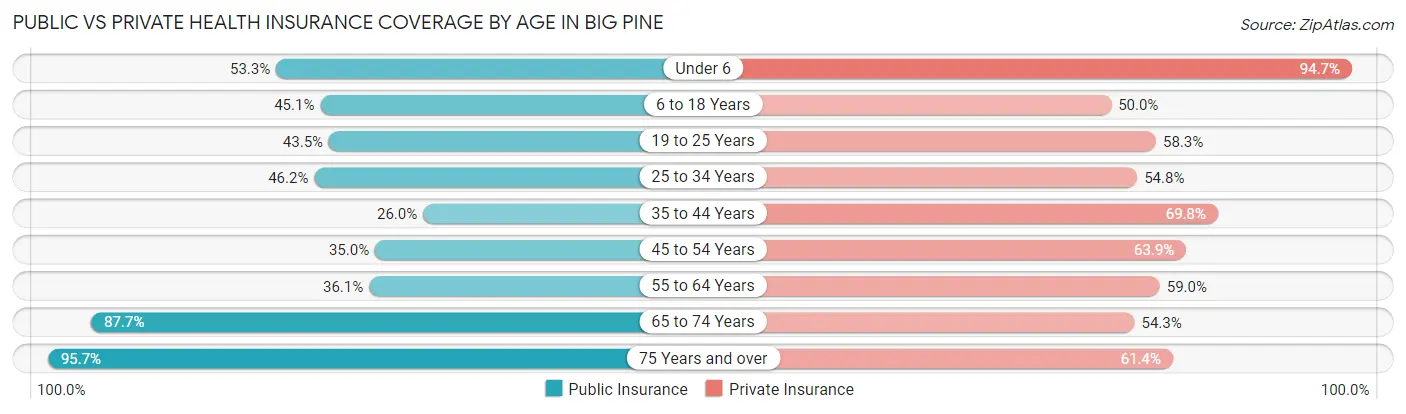
| Age Bracket | Public Insurance | Private Insurance |
| Under 6 | 40 (53.3%) | 71 (94.7%) |
| 6 to 18 Years | 102 (45.1%) | 113 (50.0%) |
| 19 to 25 Years | 47 (43.5%) | 63 (58.3%) |
| 25 to 34 Years | 43 (46.2%) | 51 (54.8%) |
| 35 to 44 Years | 50 (26.0%) | 134 (69.8%) |
| 45 to 54 Years | 93 (35.0%) | 170 (63.9%) |
| 55 to 64 Years | 88 (36.1%) | 144 (59.0%) |
| 65 to 74 Years | 192 (87.7%) | 119 (54.3%) |
| 75 Years and over | 134 (95.7%) | 86 (61.4%) |
| Total | 789 (50.5%) | 951 (60.8%) |
Disability Status by Sex by Age in Big Pine
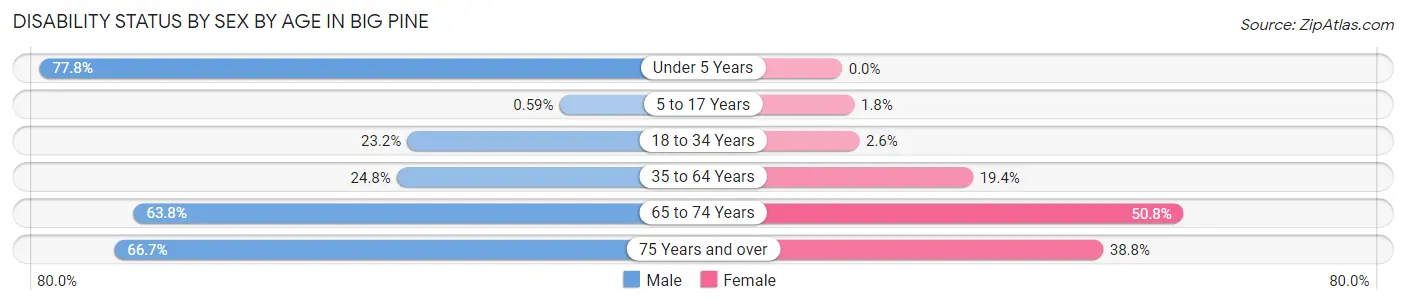
| Age Bracket | Male | Female |
| Under 5 Years | 35 (77.8%) | 0 (0.0%) |
| 5 to 17 Years | 1 (0.6%) | 1 (1.8%) |
| 18 to 34 Years | 29 (23.2%) | 2 (2.6%) |
| 35 to 64 Years | 77 (24.8%) | 76 (19.4%) |
| 65 to 74 Years | 97 (63.8%) | 34 (50.7%) |
| 75 Years and over | 40 (66.7%) | 31 (38.8%) |
Disability Class by Sex by Age in Big Pine
Disability Class: Hearing Difficulty
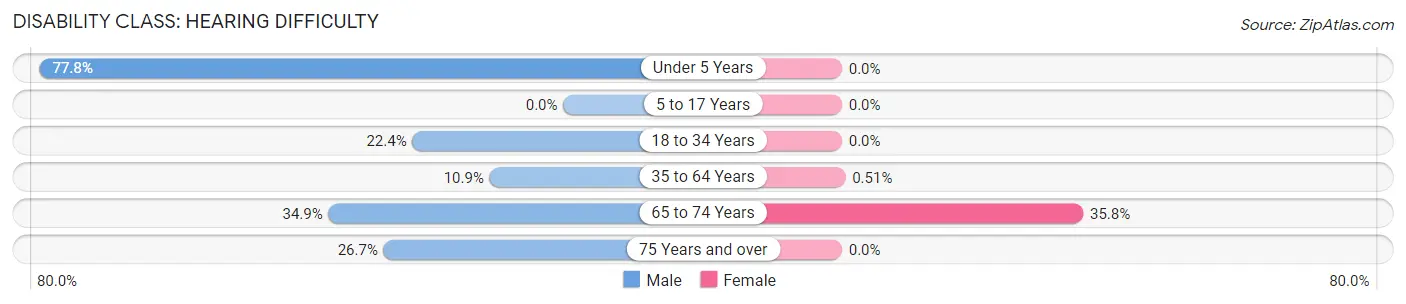
| Age Bracket | Male | Female |
| Under 5 Years | 35 (77.8%) | 0 (0.0%) |
| 5 to 17 Years | 0 (0.0%) | 0 (0.0%) |
| 18 to 34 Years | 28 (22.4%) | 0 (0.0%) |
| 35 to 64 Years | 34 (10.9%) | 2 (0.5%) |
| 65 to 74 Years | 53 (34.9%) | 24 (35.8%) |
| 75 Years and over | 16 (26.7%) | 0 (0.0%) |
Disability Class: Vision Difficulty
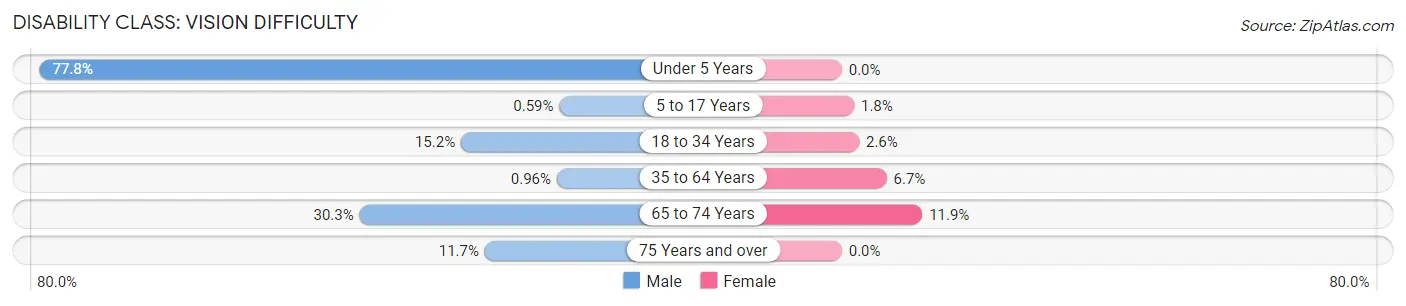
| Age Bracket | Male | Female |
| Under 5 Years | 35 (77.8%) | 0 (0.0%) |
| 5 to 17 Years | 1 (0.6%) | 1 (1.8%) |
| 18 to 34 Years | 19 (15.2%) | 2 (2.6%) |
| 35 to 64 Years | 3 (1.0%) | 26 (6.7%) |
| 65 to 74 Years | 46 (30.3%) | 8 (11.9%) |
| 75 Years and over | 7 (11.7%) | 0 (0.0%) |
Disability Class: Cognitive Difficulty
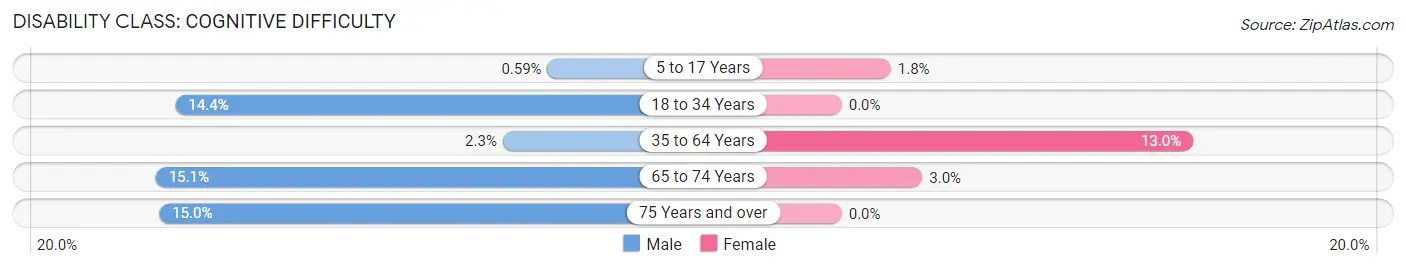
| Age Bracket | Male | Female |
| 5 to 17 Years | 1 (0.6%) | 1 (1.8%) |
| 18 to 34 Years | 18 (14.4%) | 0 (0.0%) |
| 35 to 64 Years | 7 (2.2%) | 51 (13.0%) |
| 65 to 74 Years | 23 (15.1%) | 2 (3.0%) |
| 75 Years and over | 9 (15.0%) | 0 (0.0%) |
Disability Class: Ambulatory Difficulty
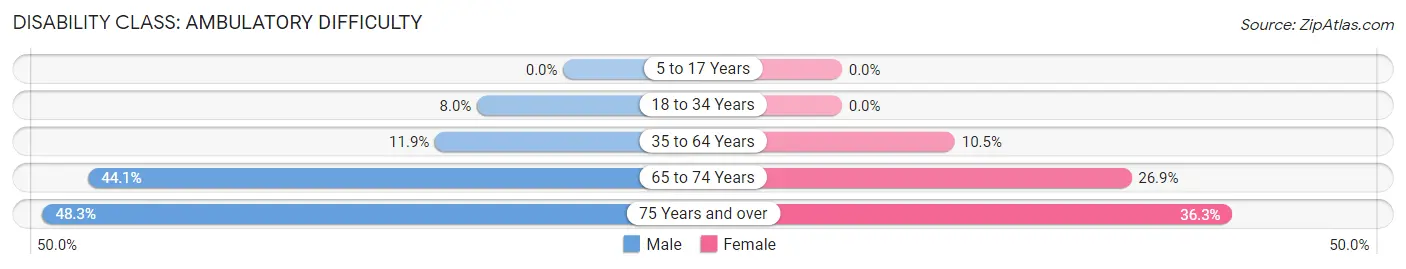
| Age Bracket | Male | Female |
| 5 to 17 Years | 0 (0.0%) | 0 (0.0%) |
| 18 to 34 Years | 10 (8.0%) | 0 (0.0%) |
| 35 to 64 Years | 37 (11.9%) | 41 (10.5%) |
| 65 to 74 Years | 67 (44.1%) | 18 (26.9%) |
| 75 Years and over | 29 (48.3%) | 29 (36.2%) |
Disability Class: Self-Care Difficulty
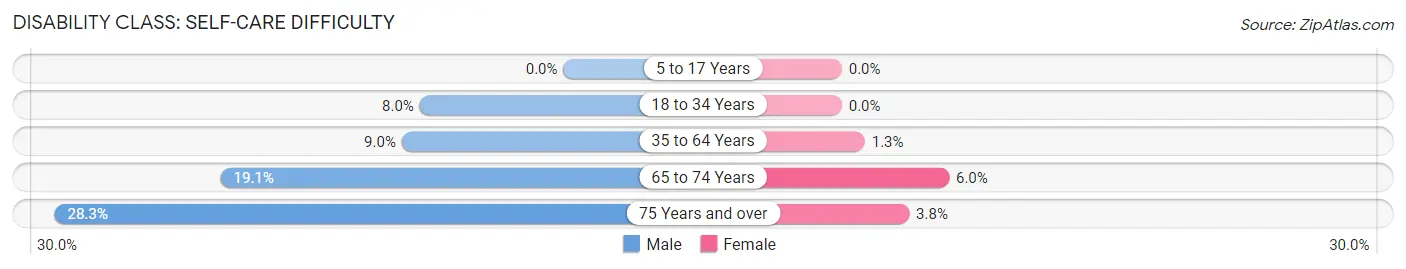
| Age Bracket | Male | Female |
| 5 to 17 Years | 0 (0.0%) | 0 (0.0%) |
| 18 to 34 Years | 10 (8.0%) | 0 (0.0%) |
| 35 to 64 Years | 28 (9.0%) | 5 (1.3%) |
| 65 to 74 Years | 29 (19.1%) | 4 (6.0%) |
| 75 Years and over | 17 (28.3%) | 3 (3.7%) |
Technology Access in Big Pine
Computing Device Access in Big Pine
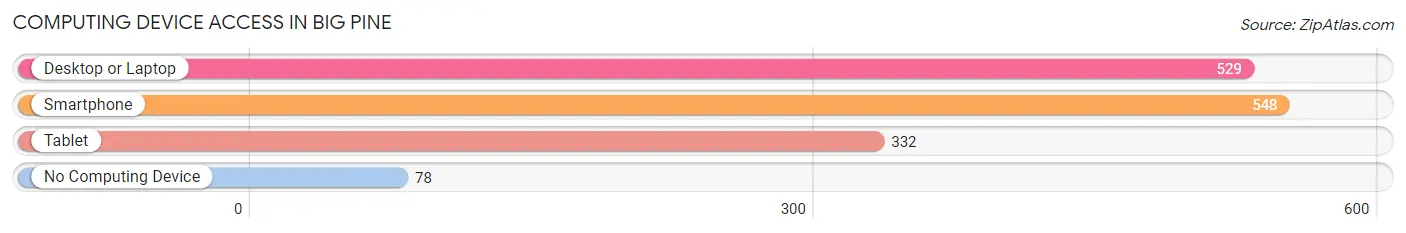
| Device Type | # Households | % Households |
| Desktop or Laptop | 529 | 78.0% |
| Smartphone | 548 | 80.8% |
| Tablet | 332 | 49.0% |
| No Computing Device | 78 | 11.5% |
| Total | 678 | 100.0% |
Internet Access in Big Pine
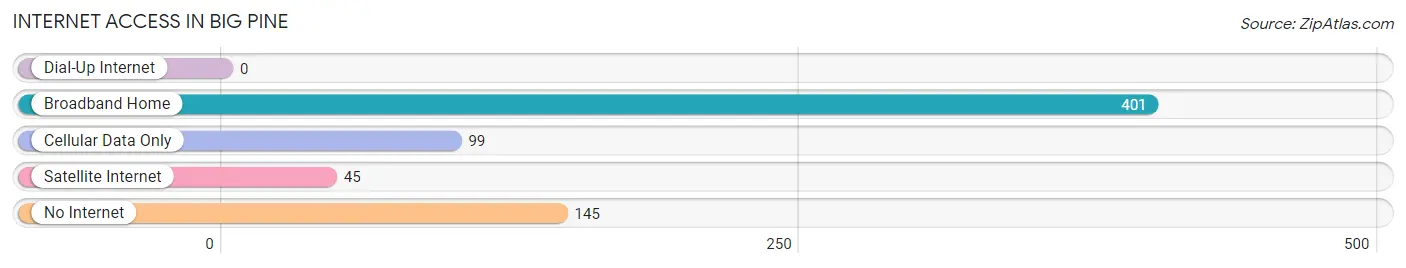
| Internet Type | # Households | % Households |
| Dial-Up Internet | 0 | 0.0% |
| Broadband Home | 401 | 59.1% |
| Cellular Data Only | 99 | 14.6% |
| Satellite Internet | 45 | 6.6% |
| No Internet | 145 | 21.4% |
| Total | 678 | 100.0% |
Big Pine Summary
Big Pine is a small town located in Inyo County, California, United States. It is situated in the Owens Valley, near the eastern slope of the Sierra Nevada mountain range. The town has a population of 1,756 as of the 2010 census.
History
Big Pine was originally inhabited by the Paiute and Shoshone Native American tribes. The first European settlers arrived in the area in the late 19th century, and the town was officially founded in 1883. The town was named after the large pine trees that grew in the area.
In the early 20th century, Big Pine was a popular tourist destination due to its proximity to the Sierra Nevada mountain range. The town was also home to a number of resorts and hotels, as well as a movie theater.
Geography
Big Pine is located in the Owens Valley, at an elevation of 3,945 feet (1,202 m). The town is situated at the base of the Sierra Nevada mountain range, and is surrounded by the White Mountains to the east and the Inyo Mountains to the west.
The town is located along U.S. Route 395, which runs through the Owens Valley from north to south. The nearest major cities are Bishop, California, to the north, and Lone Pine, California, to the south.
Economy
The economy of Big Pine is largely based on tourism. The town is a popular destination for outdoor recreation, such as camping, fishing, and hiking. The nearby White Mountains are a popular destination for rock climbing and mountain biking.
The town is also home to a number of small businesses, including restaurants, shops, and lodging. The town is also home to a number of government offices, including the Inyo County Sheriff's Office and the Inyo County Courthouse.
Demographics
As of the 2010 census, Big Pine had a population of 1,756. The racial makeup of the town was 87.3% White, 0.7% African American, 0.7% Native American, 0.7% Asian, 0.2% Pacific Islander, 8.2% from other races, and 2.2% from two or more races. Hispanic or Latino of any race were 16.2% of the population.
The median household income in Big Pine was $37,917, and the median family income was $45,000. The per capita income for the town was $19,945. About 11.2% of families and 14.2% of the population were below the poverty line, including 18.2% of those under age 18 and 8.3% of those age 65 or over.
Common Questions
What is Per Capita Income in Big Pine?
Per Capita income in Big Pine is $39,964.
What is the Median Family Income in Big Pine?
Median Family Income in Big Pine is $87,841.
What is the Median Household income in Big Pine?
Median Household Income in Big Pine is $62,576.
What is Income or Wage Gap in Big Pine?
Income or Wage Gap in Big Pine is 13.9%.
Women in Big Pine earn 86.1 cents for every dollar earned by a man.
What is Inequality or Gini Index in Big Pine?
Inequality or Gini Index in Big Pine is 0.47.
What is the Total Population of Big Pine?
Total Population of Big Pine is 1,563.
What is the Total Male Population of Big Pine?
Total Male Population of Big Pine is 863.
What is the Total Female Population of Big Pine?
Total Female Population of Big Pine is 700.
What is the Ratio of Males per 100 Females in Big Pine?
There are 123.29 Males per 100 Females in Big Pine.
What is the Ratio of Females per 100 Males in Big Pine?
There are 81.11 Females per 100 Males in Big Pine.
What is the Median Population Age in Big Pine?
Median Population Age in Big Pine is 49.3 Years.
What is the Average Family Size in Big Pine
Average Family Size in Big Pine is 3.4 People.
What is the Average Household Size in Big Pine
Average Household Size in Big Pine is 2.3 People.
How Large is the Labor Force in Big Pine?
There are 751 People in the Labor Forcein in Big Pine.
What is the Percentage of People in the Labor Force in Big Pine?
58.5% of People are in the Labor Force in Big Pine.
What is the Unemployment Rate in Big Pine?
Unemployment Rate in Big Pine is 3.5%.