Havre De Grace, MD Map & Demographics
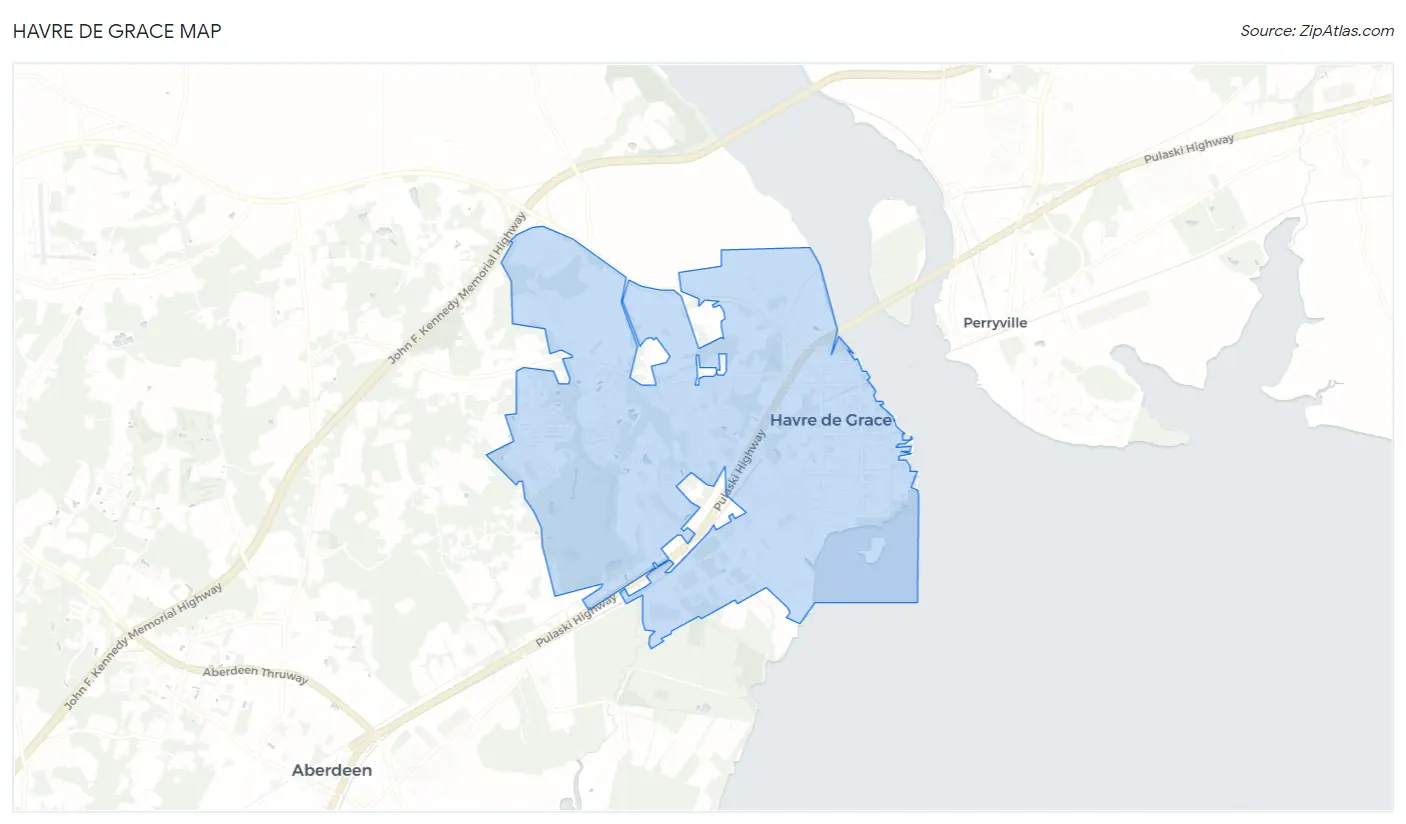
Havre De Grace Map
Havre De Grace Overview
$51,421
PER CAPITA INCOME
$117,969
AVG FAMILY INCOME
$95,025
AVG HOUSEHOLD INCOME
44.2%
WAGE / INCOME GAP [ % ]
55.8¢/ $1
WAGE / INCOME GAP [ $ ]
0.45
INEQUALITY / GINI INDEX
14,743
TOTAL POPULATION
6,643
MALE POPULATION
8,100
FEMALE POPULATION
82.01
MALES / 100 FEMALES
121.93
FEMALES / 100 MALES
44.8
MEDIAN AGE
3.0
AVG FAMILY SIZE
2.4
AVG HOUSEHOLD SIZE
7,729
LABOR FORCE [ PEOPLE ]
63.2%
PERCENT IN LABOR FORCE
4.0%
UNEMPLOYMENT RATE
Havre De Grace Zip Codes
Income in Havre De Grace
Income Overview in Havre De Grace
Per Capita Income in Havre De Grace is $51,421, while median incomes of families and households are $117,969 and $95,025 respectively.
| Characteristic | Number | Measure |
| Per Capita Income | 14,743 | $51,421 |
| Median Family Income | 3,656 | $117,969 |
| Mean Family Income | 3,656 | $133,418 |
| Median Household Income | 6,093 | $95,025 |
| Mean Household Income | 6,093 | $124,567 |
| Income Deficit | 3,656 | $0 |
| Wage / Income Gap (%) | 14,743 | 44.20% |
| Wage / Income Gap ($) | 14,743 | 55.80¢ per $1 |
| Gini / Inequality Index | 14,743 | 0.45 |
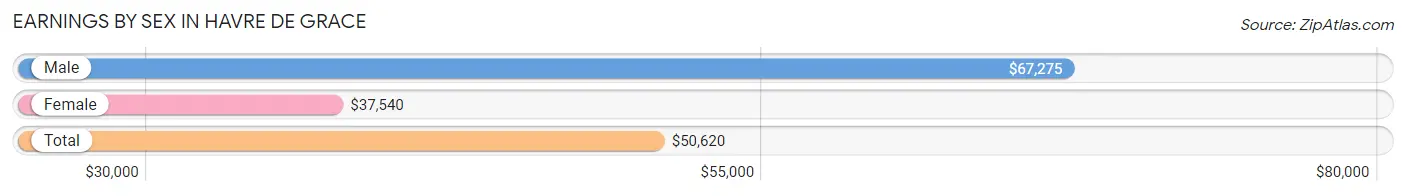
Earnings by Sex in Havre De Grace
Average Earnings in Havre De Grace are $50,620, $67,275 for men and $37,540 for women, a difference of 44.2%.
| Sex | Number | Average Earnings |
| Male | 4,289 (53.1%) | $67,275 |
| Female | 3,794 (46.9%) | $37,540 |
| Total | 8,083 (100.0%) | $50,620 |
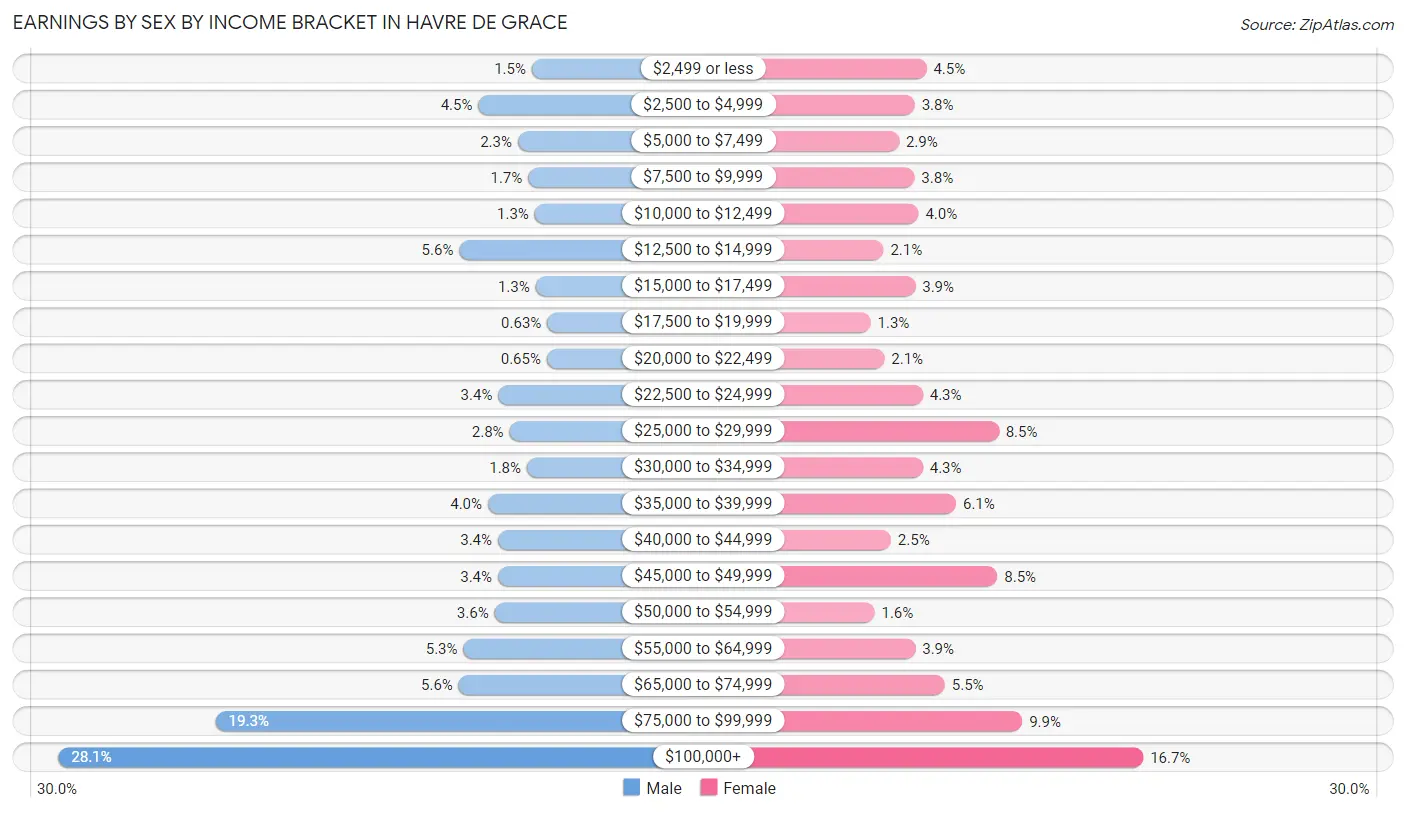
Earnings by Sex by Income Bracket in Havre De Grace
The most common earnings brackets in Havre De Grace are $100,000+ for men (1,205 | 28.1%) and $100,000+ for women (632 | 16.7%).
| Income | Male | Female |
| $2,499 or less | 64 (1.5%) | 170 (4.5%) |
| $2,500 to $4,999 | 193 (4.5%) | 145 (3.8%) |
| $5,000 to $7,499 | 98 (2.3%) | 111 (2.9%) |
| $7,500 to $9,999 | 73 (1.7%) | 144 (3.8%) |
| $10,000 to $12,499 | 57 (1.3%) | 153 (4.0%) |
| $12,500 to $14,999 | 239 (5.6%) | 78 (2.1%) |
| $15,000 to $17,499 | 55 (1.3%) | 146 (3.8%) |
| $17,500 to $19,999 | 27 (0.6%) | 51 (1.3%) |
| $20,000 to $22,499 | 28 (0.6%) | 80 (2.1%) |
| $22,500 to $24,999 | 145 (3.4%) | 162 (4.3%) |
| $25,000 to $29,999 | 118 (2.8%) | 324 (8.5%) |
| $30,000 to $34,999 | 76 (1.8%) | 162 (4.3%) |
| $35,000 to $39,999 | 170 (4.0%) | 233 (6.1%) |
| $40,000 to $44,999 | 146 (3.4%) | 94 (2.5%) |
| $45,000 to $49,999 | 146 (3.4%) | 321 (8.5%) |
| $50,000 to $54,999 | 154 (3.6%) | 59 (1.6%) |
| $55,000 to $64,999 | 229 (5.3%) | 146 (3.8%) |
| $65,000 to $74,999 | 240 (5.6%) | 209 (5.5%) |
| $75,000 to $99,999 | 826 (19.3%) | 374 (9.9%) |
| $100,000+ | 1,205 (28.1%) | 632 (16.7%) |
| Total | 4,289 (100.0%) | 3,794 (100.0%) |
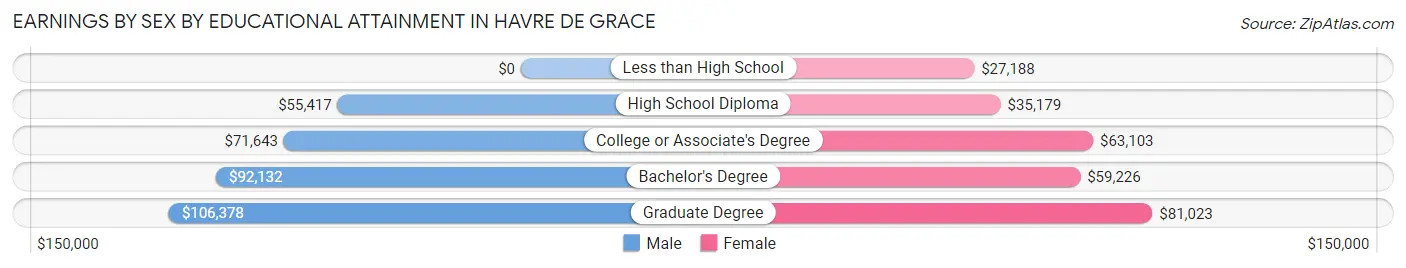
Earnings by Sex by Educational Attainment in Havre De Grace
Average earnings in Havre De Grace are $83,298 for men and $46,224 for women, a difference of 44.5%. Men with an educational attainment of graduate degree enjoy the highest average annual earnings of $106,378, while those with high school diploma education earn the least with $55,417. Women with an educational attainment of graduate degree earn the most with the average annual earnings of $81,023, while those with less than high school education have the smallest earnings of $27,188.
| Educational Attainment | Male Income | Female Income |
| Less than High School | - | - |
| High School Diploma | $55,417 | $35,179 |
| College or Associate's Degree | $71,643 | $63,103 |
| Bachelor's Degree | $92,132 | $59,226 |
| Graduate Degree | $106,378 | $81,023 |
| Total | $83,298 | $46,224 |
Family Income in Havre De Grace
Family Income Brackets in Havre De Grace
According to the Havre De Grace family income data, there are 896 families falling into the $100,000 to $149,999 income range, which is the most common income bracket and makes up 24.5% of all families.
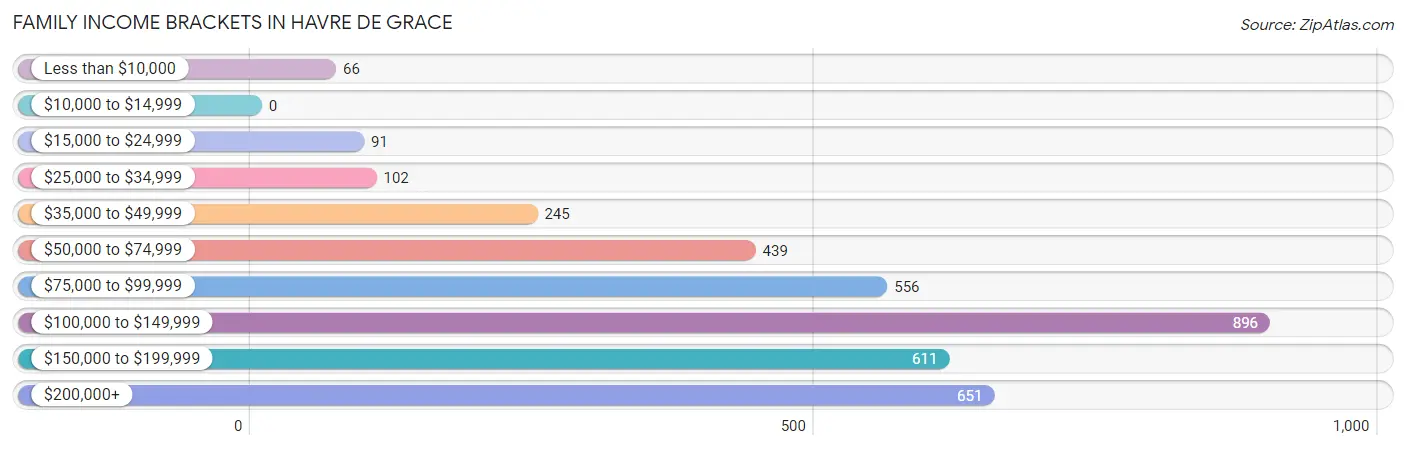
| Income Bracket | # Families | % Families |
| Less than $10,000 | 66 | 1.8% |
| $10,000 to $14,999 | 0 | 0.0% |
| $15,000 to $24,999 | 91 | 2.5% |
| $25,000 to $34,999 | 102 | 2.8% |
| $35,000 to $49,999 | 245 | 6.7% |
| $50,000 to $74,999 | 439 | 12.0% |
| $75,000 to $99,999 | 556 | 15.2% |
| $100,000 to $149,999 | 896 | 24.5% |
| $150,000 to $199,999 | 611 | 16.7% |
| $200,000+ | 651 | 17.8% |
Family Income by Famaliy Size in Havre De Grace
5-person families (236 | 6.5%) account for the highest median family income in Havre De Grace with $170,956 per family, while 2-person families (1,943 | 53.1%) have the highest median income of $52,008 per family member.
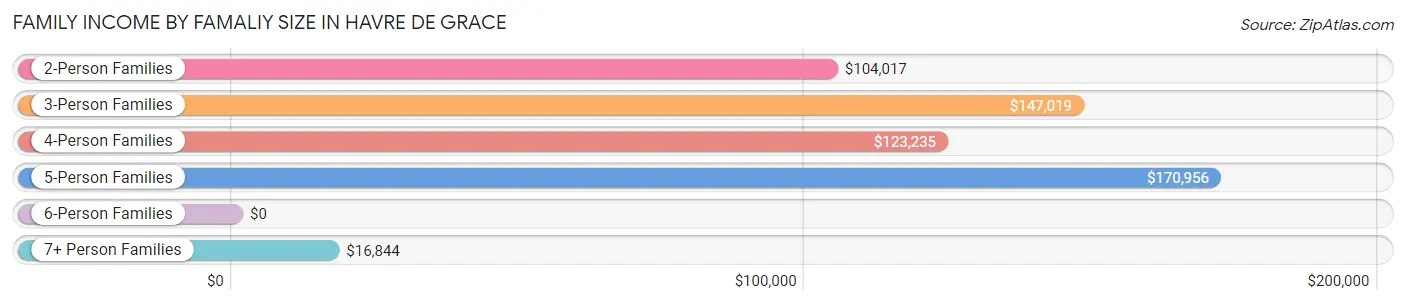
| Income Bracket | # Families | Median Income |
| 2-Person Families | 1,943 (53.1%) | $104,017 |
| 3-Person Families | 628 (17.2%) | $147,019 |
| 4-Person Families | 744 (20.3%) | $123,235 |
| 5-Person Families | 236 (6.5%) | $170,956 |
| 6-Person Families | 46 (1.3%) | $0 |
| 7+ Person Families | 59 (1.6%) | $16,844 |
| Total | 3,656 (100.0%) | $117,969 |
Family Income by Number of Earners in Havre De Grace
The median family income in Havre De Grace is $117,969, with families comprising 3+ earners (406) having the highest median family income of $140,329, while families with no earners (468) have the lowest median family income of $88,304, accounting for 11.1% and 12.8% of families, respectively.
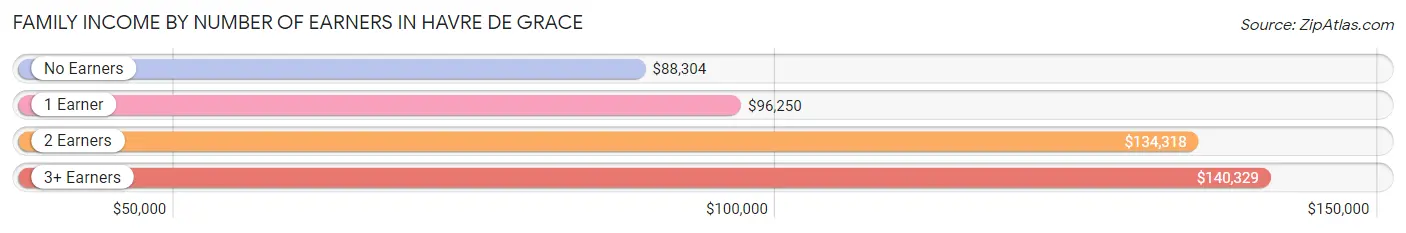
| Number of Earners | # Families | Median Income |
| No Earners | 468 (12.8%) | $88,304 |
| 1 Earner | 1,290 (35.3%) | $96,250 |
| 2 Earners | 1,492 (40.8%) | $134,318 |
| 3+ Earners | 406 (11.1%) | $140,329 |
| Total | 3,656 (100.0%) | $117,969 |
Household Income in Havre De Grace
Household Income Brackets in Havre De Grace
With 1,261 households falling in the category, the $100,000 to $149,999 income range is the most frequent in Havre De Grace, accounting for 20.7% of all households. In contrast, only 177 households (2.9%) fall into the less than $10,000 income bracket, making it the least populous group.
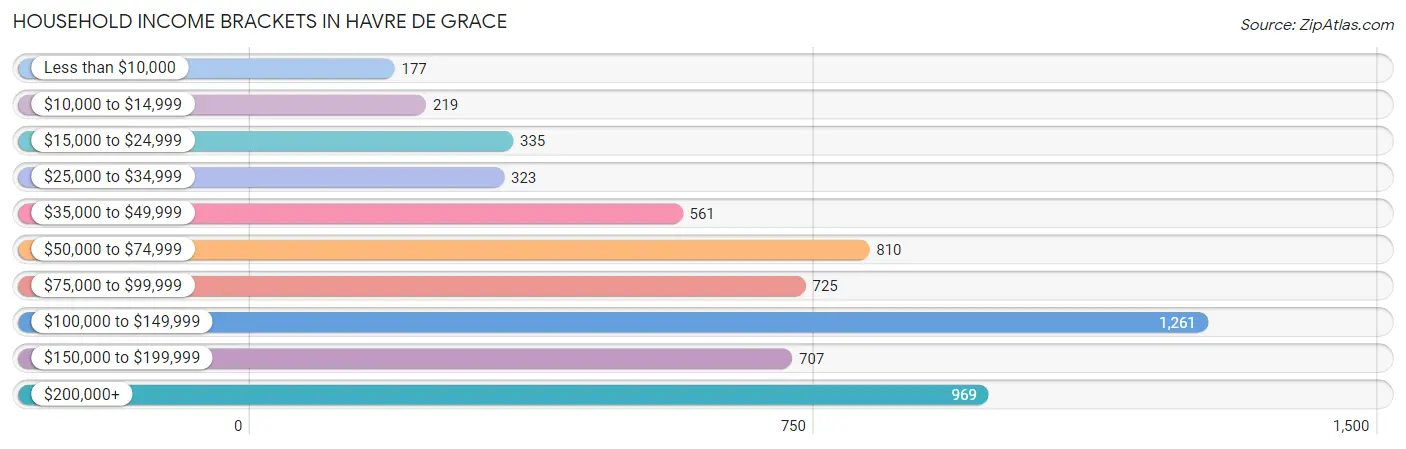
| Income Bracket | # Households | % Households |
| Less than $10,000 | 177 | 2.9% |
| $10,000 to $14,999 | 219 | 3.6% |
| $15,000 to $24,999 | 335 | 5.5% |
| $25,000 to $34,999 | 323 | 5.3% |
| $35,000 to $49,999 | 561 | 9.2% |
| $50,000 to $74,999 | 810 | 13.3% |
| $75,000 to $99,999 | 725 | 11.9% |
| $100,000 to $149,999 | 1,261 | 20.7% |
| $150,000 to $199,999 | 707 | 11.6% |
| $200,000+ | 969 | 15.9% |
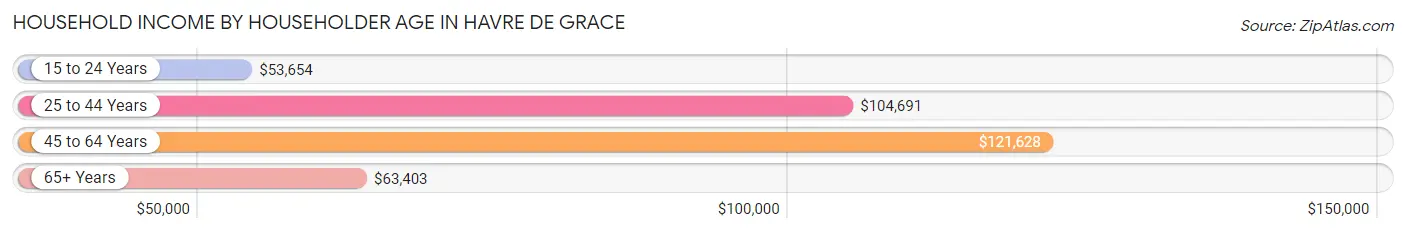
Household Income by Householder Age in Havre De Grace
The median household income in Havre De Grace is $95,025, with the highest median household income of $121,628 found in the 45 to 64 years age bracket for the primary householder. A total of 2,554 households (41.9%) fall into this category. Meanwhile, the 15 to 24 years age bracket for the primary householder has the lowest median household income of $53,654, with 222 households (3.6%) in this group.
| Income Bracket | # Households | Median Income |
| 15 to 24 Years | 222 (3.6%) | $53,654 |
| 25 to 44 Years | 1,483 (24.3%) | $104,691 |
| 45 to 64 Years | 2,554 (41.9%) | $121,628 |
| 65+ Years | 1,834 (30.1%) | $63,403 |
| Total | 6,093 (100.0%) | $95,025 |
Poverty in Havre De Grace
Income Below Poverty by Sex and Age in Havre De Grace
With 11.9% poverty level for males and 8.8% for females among the residents of Havre De Grace, 16 and 17 year old males and 6 to 11 year old females are the most vulnerable to poverty, with 240 males (92.3%) and 198 females (38.6%) in their respective age groups living below the poverty level.
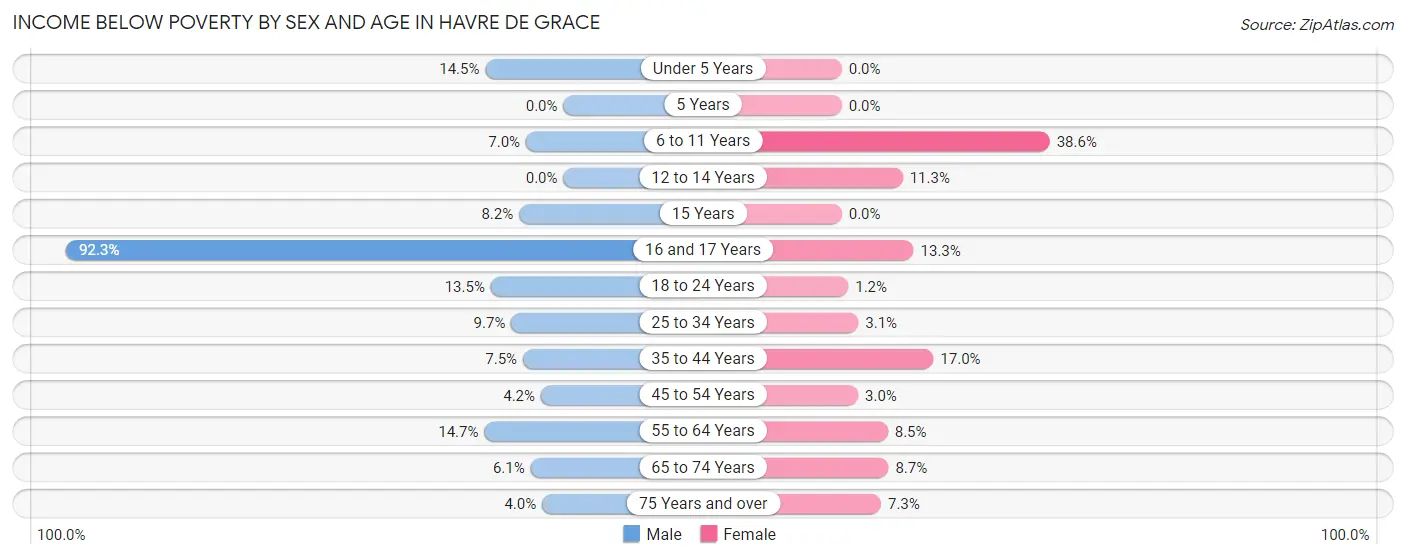
| Age Bracket | Male | Female |
| Under 5 Years | 42 (14.5%) | 0 (0.0%) |
| 5 Years | 0 (0.0%) | 0 (0.0%) |
| 6 to 11 Years | 21 (7.0%) | 198 (38.6%) |
| 12 to 14 Years | 0 (0.0%) | 51 (11.3%) |
| 15 Years | 6 (8.2%) | 0 (0.0%) |
| 16 and 17 Years | 240 (92.3%) | 12 (13.3%) |
| 18 to 24 Years | 79 (13.5%) | 8 (1.2%) |
| 25 to 34 Years | 85 (9.7%) | 28 (3.1%) |
| 35 to 44 Years | 56 (7.5%) | 126 (17.0%) |
| 45 to 54 Years | 43 (4.2%) | 35 (3.0%) |
| 55 to 64 Years | 157 (14.7%) | 101 (8.5%) |
| 65 to 74 Years | 47 (6.1%) | 75 (8.7%) |
| 75 Years and over | 12 (4.0%) | 60 (7.3%) |
| Total | 788 (11.9%) | 694 (8.8%) |
Income Above Poverty by Sex and Age in Havre De Grace
According to the poverty statistics in Havre De Grace, males aged 5 years and females aged under 5 years are the age groups that are most secure financially, with 100.0% of males and 100.0% of females in these age groups living above the poverty line.
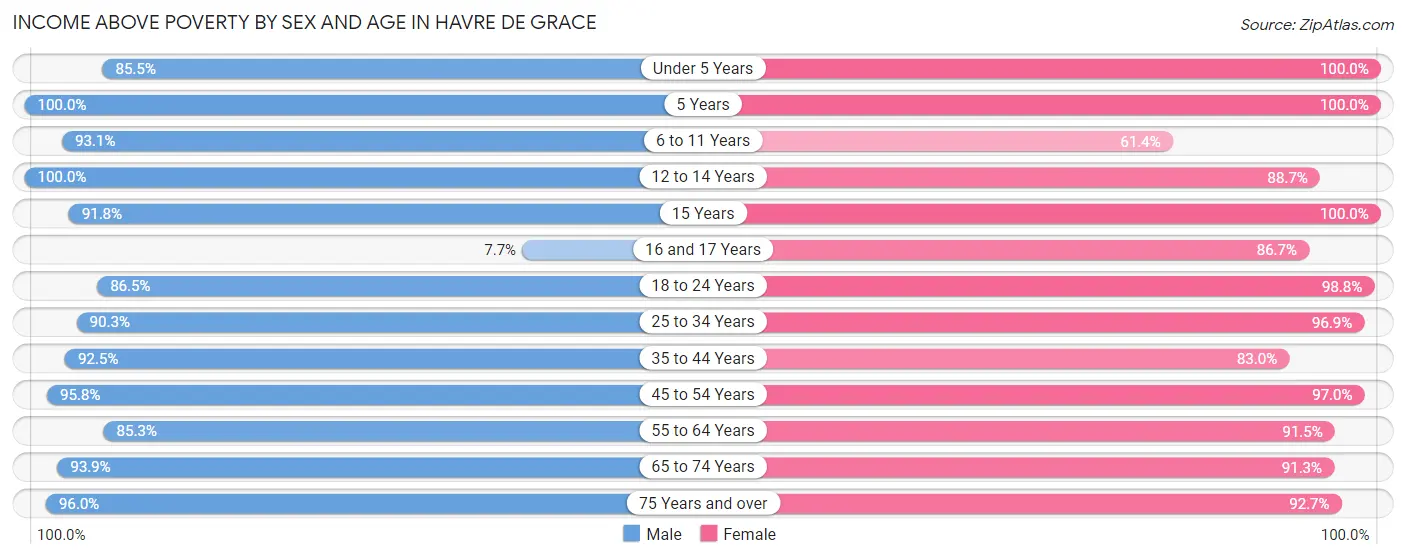
| Age Bracket | Male | Female |
| Under 5 Years | 248 (85.5%) | 304 (100.0%) |
| 5 Years | 51 (100.0%) | 40 (100.0%) |
| 6 to 11 Years | 281 (93.0%) | 315 (61.4%) |
| 12 to 14 Years | 261 (100.0%) | 400 (88.7%) |
| 15 Years | 67 (91.8%) | 179 (100.0%) |
| 16 and 17 Years | 20 (7.7%) | 78 (86.7%) |
| 18 to 24 Years | 507 (86.5%) | 651 (98.8%) |
| 25 to 34 Years | 794 (90.3%) | 885 (96.9%) |
| 35 to 44 Years | 691 (92.5%) | 615 (83.0%) |
| 45 to 54 Years | 987 (95.8%) | 1,124 (97.0%) |
| 55 to 64 Years | 913 (85.3%) | 1,081 (91.5%) |
| 65 to 74 Years | 725 (93.9%) | 790 (91.3%) |
| 75 Years and over | 291 (96.0%) | 764 (92.7%) |
| Total | 5,836 (88.1%) | 7,226 (91.2%) |
Income Below Poverty Among Married-Couple Families in Havre De Grace
The poverty statistics for married-couple families in Havre De Grace show that 2.0% or 57 of the total 2,900 families live below the poverty line. Families with 5 or more children have the highest poverty rate of 26.3%, comprising of 5 families. On the other hand, families with 3 or 4 children have the lowest poverty rate of 0.0%, which includes 0 families.
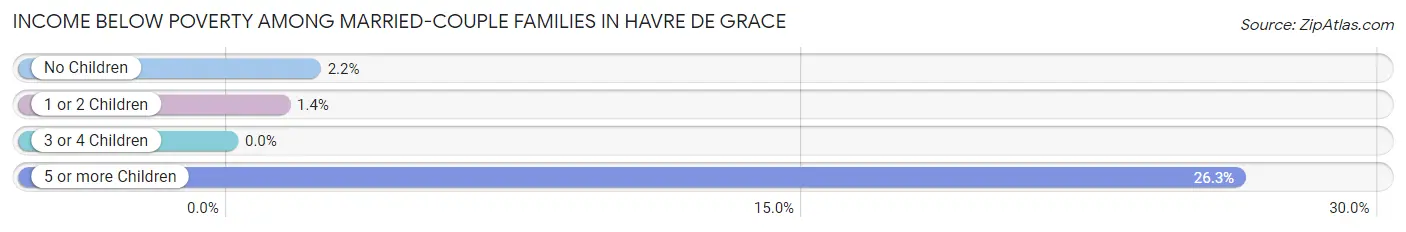
| Children | Above Poverty | Below Poverty |
| No Children | 1,853 (97.8%) | 41 (2.2%) |
| 1 or 2 Children | 799 (98.6%) | 11 (1.4%) |
| 3 or 4 Children | 177 (100.0%) | 0 (0.0%) |
| 5 or more Children | 14 (73.7%) | 5 (26.3%) |
| Total | 2,843 (98.0%) | 57 (2.0%) |
Income Below Poverty Among Single-Parent Households in Havre De Grace
According to the poverty data in Havre De Grace, 19.5% or 47 single-father households and 9.1% or 47 single-mother households are living below the poverty line. Among single-father households, those with 1 or 2 children have the highest poverty rate, with 20 households (22.0%) experiencing poverty. Likewise, among single-mother households, those with 5 or more children have the highest poverty rate, with 40 households (100.0%) falling below the poverty line.
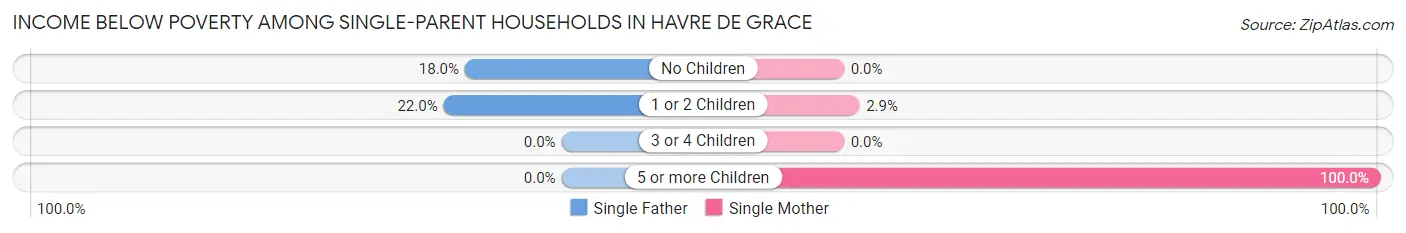
| Children | Single Father | Single Mother |
| No Children | 27 (18.0%) | 0 (0.0%) |
| 1 or 2 Children | 20 (22.0%) | 7 (2.9%) |
| 3 or 4 Children | 0 (0.0%) | 0 (0.0%) |
| 5 or more Children | 0 (0.0%) | 40 (100.0%) |
| Total | 47 (19.5%) | 47 (9.1%) |
Income Below Poverty Among Married-Couple vs Single-Parent Households in Havre De Grace
The poverty data for Havre De Grace shows that 57 of the married-couple family households (2.0%) and 94 of the single-parent households (12.4%) are living below the poverty level. Within the married-couple family households, those with 5 or more children have the highest poverty rate, with 5 households (26.3%) falling below the poverty line. Among the single-parent households, those with 5 or more children have the highest poverty rate, with 40 household (100.0%) living below poverty.
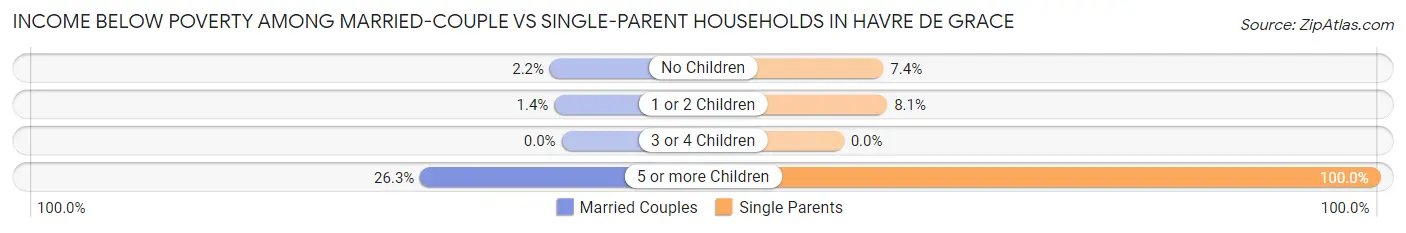
| Children | Married-Couple Families | Single-Parent Households |
| No Children | 41 (2.2%) | 27 (7.4%) |
| 1 or 2 Children | 11 (1.4%) | 27 (8.1%) |
| 3 or 4 Children | 0 (0.0%) | 0 (0.0%) |
| 5 or more Children | 5 (26.3%) | 40 (100.0%) |
| Total | 57 (2.0%) | 94 (12.4%) |
Race in Havre De Grace
The most populous races in Havre De Grace are White / Caucasian (10,256 | 69.6%), Black / African American (2,689 | 18.2%), and Hispanic or Latino (1,126 | 7.6%).
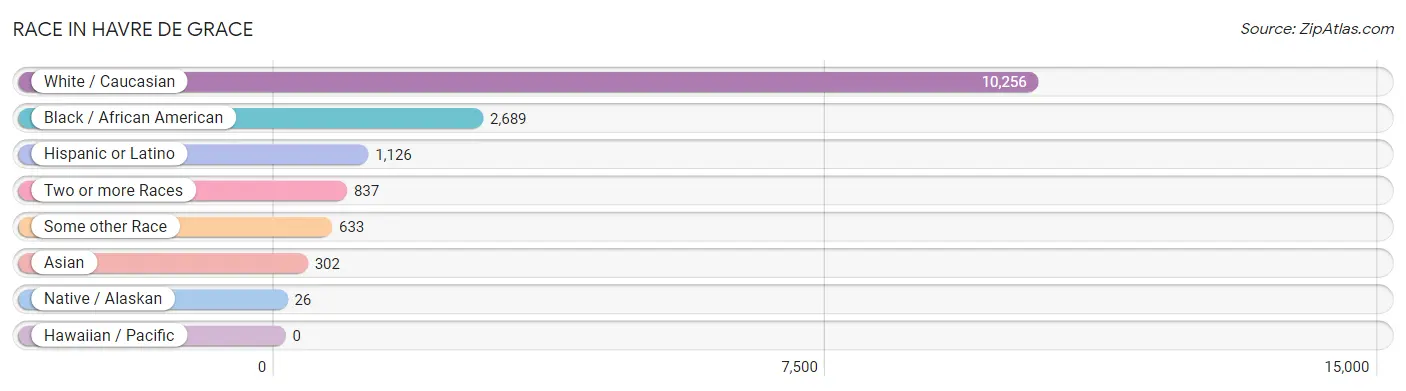
| Race | # Population | % Population |
| Asian | 302 | 2.1% |
| Black / African American | 2,689 | 18.2% |
| Hawaiian / Pacific | 0 | 0.0% |
| Hispanic or Latino | 1,126 | 7.6% |
| Native / Alaskan | 26 | 0.2% |
| White / Caucasian | 10,256 | 69.6% |
| Two or more Races | 837 | 5.7% |
| Some other Race | 633 | 4.3% |
| Total | 14,743 | 100.0% |
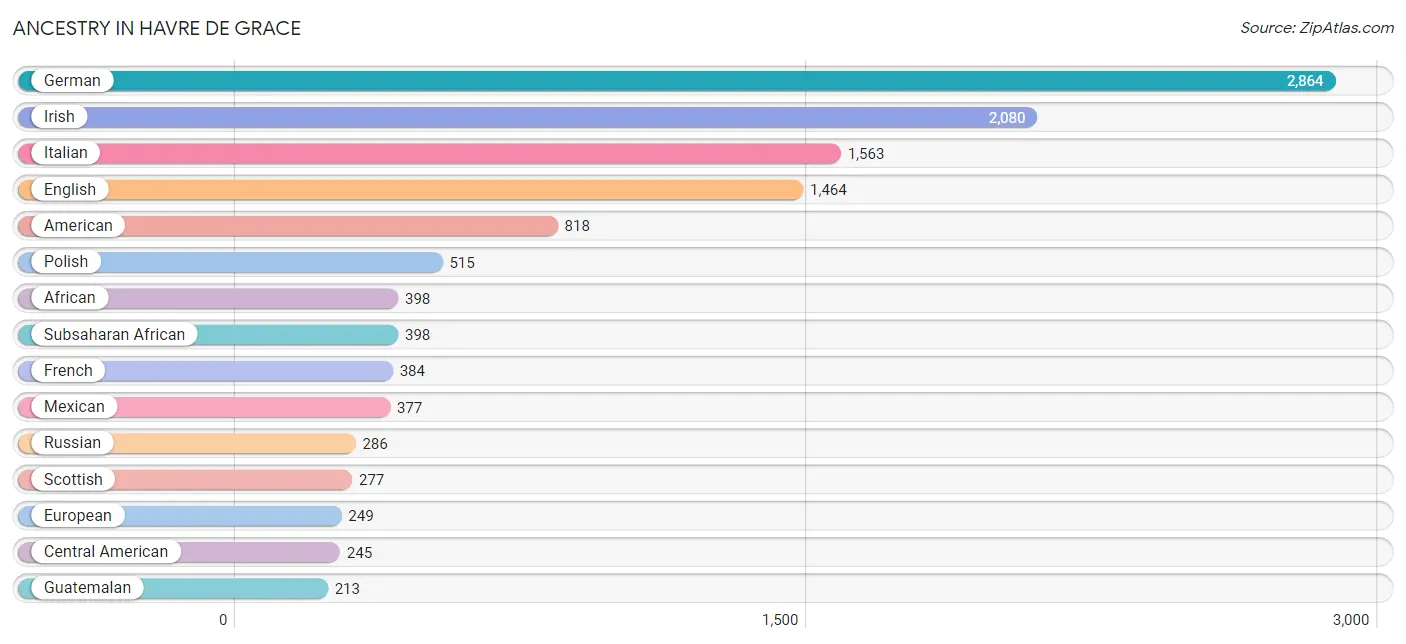
Ancestry in Havre De Grace
The most populous ancestries reported in Havre De Grace are German (2,864 | 19.4%), Irish (2,080 | 14.1%), Italian (1,563 | 10.6%), English (1,464 | 9.9%), and American (818 | 5.6%), together accounting for 59.6% of all Havre De Grace residents.
| Ancestry | # Population | % Population |
| African | 398 | 2.7% |
| American | 818 | 5.6% |
| Arab | 26 | 0.2% |
| Argentinean | 62 | 0.4% |
| Australian | 37 | 0.3% |
| Austrian | 86 | 0.6% |
| Belgian | 17 | 0.1% |
| Bhutanese | 5 | 0.0% |
| British | 143 | 1.0% |
| British West Indian | 10 | 0.1% |
| Burmese | 34 | 0.2% |
| Canadian | 16 | 0.1% |
| Central American | 245 | 1.7% |
| Cherokee | 14 | 0.1% |
| Colombian | 39 | 0.3% |
| Creek | 25 | 0.2% |
| Croatian | 36 | 0.2% |
| Cuban | 140 | 0.9% |
| Czech | 47 | 0.3% |
| Czechoslovakian | 44 | 0.3% |
| Danish | 29 | 0.2% |
| Dominican | 87 | 0.6% |
| Dutch | 49 | 0.3% |
| Eastern European | 93 | 0.6% |
| English | 1,464 | 9.9% |
| European | 249 | 1.7% |
| Finnish | 4 | 0.0% |
| French | 384 | 2.6% |
| French Canadian | 5 | 0.0% |
| German | 2,864 | 19.4% |
| Greek | 58 | 0.4% |
| Guatemalan | 213 | 1.4% |
| Hungarian | 171 | 1.2% |
| Icelander | 5 | 0.0% |
| Indian (Asian) | 62 | 0.4% |
| Irish | 2,080 | 14.1% |
| Italian | 1,563 | 10.6% |
| Jamaican | 165 | 1.1% |
| Kiowa | 11 | 0.1% |
| Korean | 204 | 1.4% |
| Lebanese | 5 | 0.0% |
| Lithuanian | 43 | 0.3% |
| Mexican | 377 | 2.6% |
| Navajo | 37 | 0.3% |
| Northern European | 54 | 0.4% |
| Norwegian | 106 | 0.7% |
| Panamanian | 32 | 0.2% |
| Polish | 515 | 3.5% |
| Portuguese | 10 | 0.1% |
| Puerto Rican | 124 | 0.8% |
| Romanian | 31 | 0.2% |
| Russian | 286 | 1.9% |
| Samoan | 25 | 0.2% |
| Scandinavian | 39 | 0.3% |
| Scotch-Irish | 95 | 0.6% |
| Scottish | 277 | 1.9% |
| Serbian | 13 | 0.1% |
| Slovak | 41 | 0.3% |
| South American | 101 | 0.7% |
| Spaniard | 37 | 0.3% |
| Subsaharan African | 398 | 2.7% |
| Swedish | 192 | 1.3% |
| Swiss | 5 | 0.0% |
| Syrian | 21 | 0.1% |
| Thai | 99 | 0.7% |
| Trinidadian and Tobagonian | 24 | 0.2% |
| Ukrainian | 105 | 0.7% |
| Welsh | 62 | 0.4% | View All 68 Rows |
Immigrants in Havre De Grace
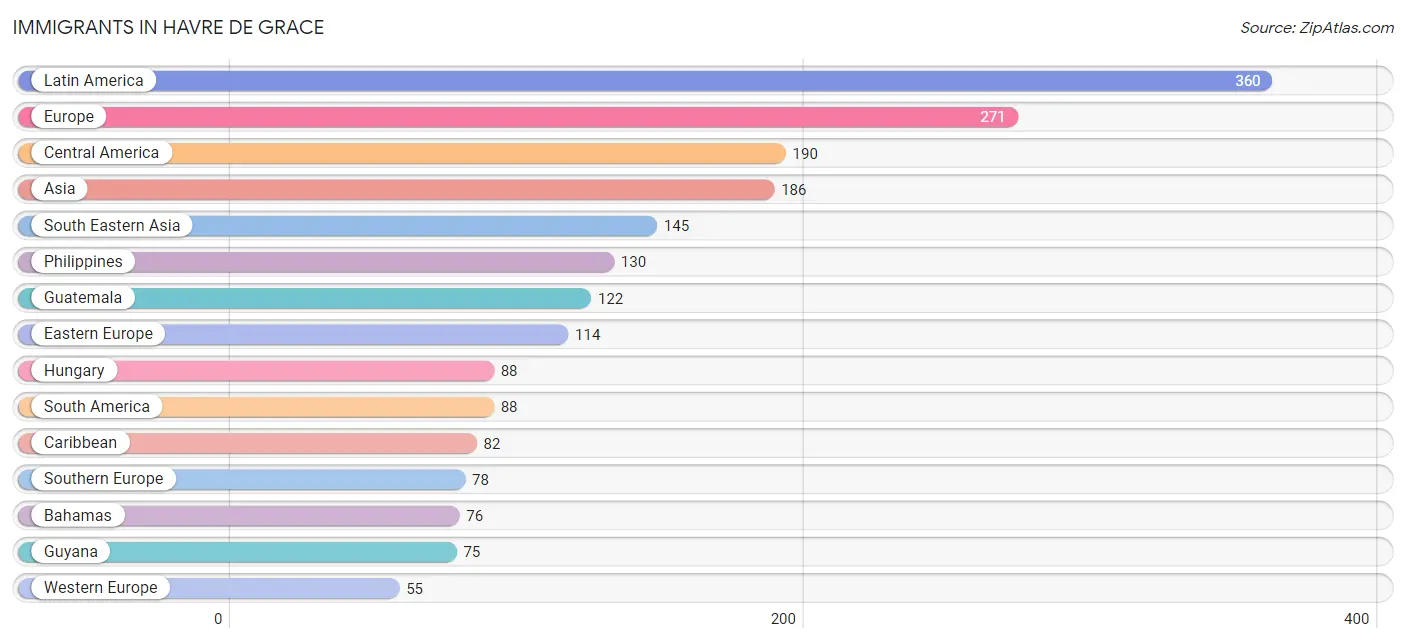
The most numerous immigrant groups reported in Havre De Grace came from Latin America (360 | 2.4%), Europe (271 | 1.8%), Central America (190 | 1.3%), Asia (186 | 1.3%), and South Eastern Asia (145 | 1.0%), together accounting for 7.8% of all Havre De Grace residents.
| Immigration Origin | # Population | % Population |
| Africa | 17 | 0.1% |
| Asia | 186 | 1.3% |
| Australia | 37 | 0.3% |
| Austria | 18 | 0.1% |
| Bahamas | 76 | 0.5% |
| Canada | 10 | 0.1% |
| Caribbean | 82 | 0.6% |
| Central America | 190 | 1.3% |
| Chile | 13 | 0.1% |
| Czechoslovakia | 13 | 0.1% |
| Eastern Asia | 17 | 0.1% |
| Eastern Europe | 114 | 0.8% |
| England | 24 | 0.2% |
| Europe | 271 | 1.8% |
| Germany | 37 | 0.3% |
| Greece | 42 | 0.3% |
| Guatemala | 122 | 0.8% |
| Guyana | 75 | 0.5% |
| Hungary | 88 | 0.6% |
| India | 24 | 0.2% |
| Italy | 36 | 0.2% |
| Jamaica | 6 | 0.0% |
| Korea | 17 | 0.1% |
| Latin America | 360 | 2.4% |
| Malaysia | 15 | 0.1% |
| Mexico | 36 | 0.2% |
| Northern Europe | 24 | 0.2% |
| Oceania | 37 | 0.3% |
| Panama | 32 | 0.2% |
| Philippines | 130 | 0.9% |
| Russia | 13 | 0.1% |
| South Africa | 17 | 0.1% |
| South America | 88 | 0.6% |
| South Central Asia | 24 | 0.2% |
| South Eastern Asia | 145 | 1.0% |
| Southern Europe | 78 | 0.5% |
| Western Europe | 55 | 0.4% | View All 37 Rows |
Sex and Age in Havre De Grace
Sex and Age in Havre De Grace
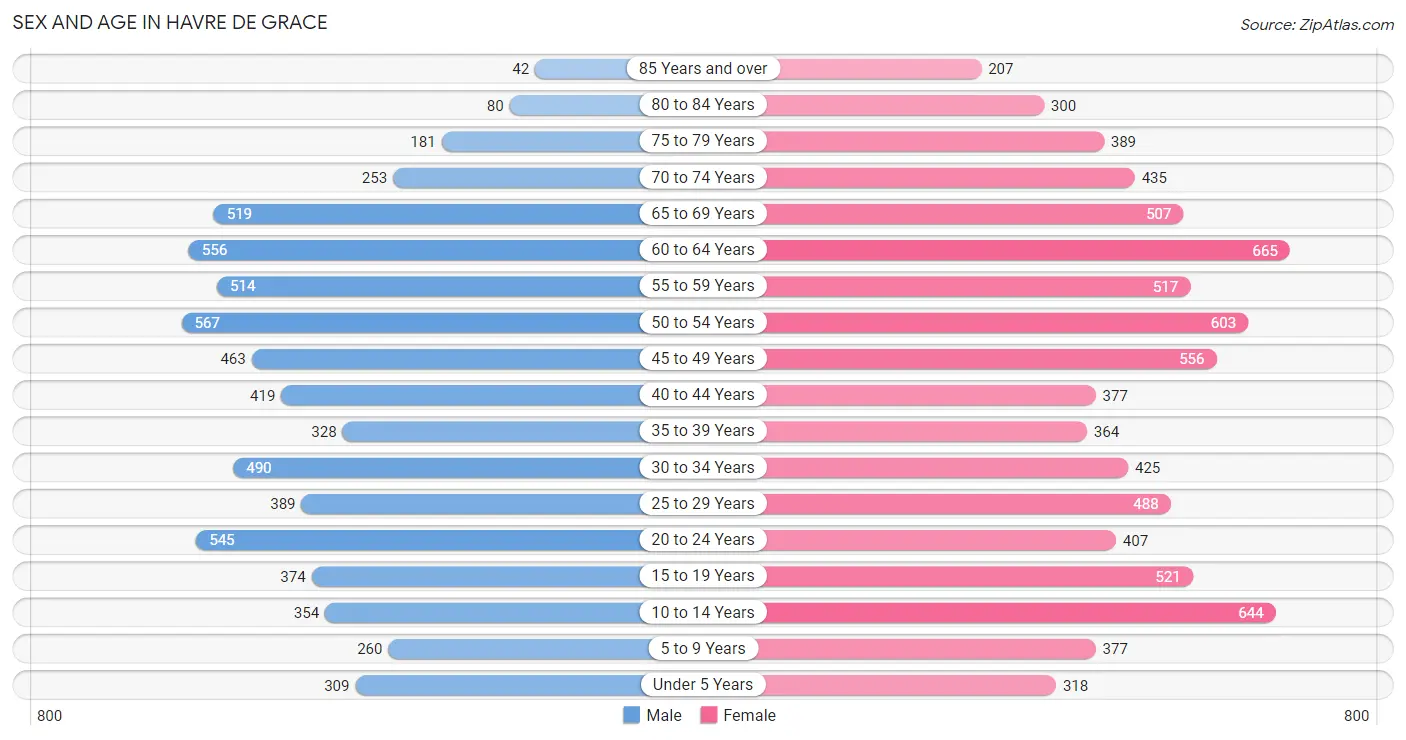
The most populous age groups in Havre De Grace are 50 to 54 Years (567 | 8.5%) for men and 60 to 64 Years (665 | 8.2%) for women.
| Age Bracket | Male | Female |
| Under 5 Years | 309 (4.6%) | 318 (3.9%) |
| 5 to 9 Years | 260 (3.9%) | 377 (4.6%) |
| 10 to 14 Years | 354 (5.3%) | 644 (8.0%) |
| 15 to 19 Years | 374 (5.6%) | 521 (6.4%) |
| 20 to 24 Years | 545 (8.2%) | 407 (5.0%) |
| 25 to 29 Years | 389 (5.9%) | 488 (6.0%) |
| 30 to 34 Years | 490 (7.4%) | 425 (5.2%) |
| 35 to 39 Years | 328 (4.9%) | 364 (4.5%) |
| 40 to 44 Years | 419 (6.3%) | 377 (4.6%) |
| 45 to 49 Years | 463 (7.0%) | 556 (6.9%) |
| 50 to 54 Years | 567 (8.5%) | 603 (7.4%) |
| 55 to 59 Years | 514 (7.7%) | 517 (6.4%) |
| 60 to 64 Years | 556 (8.4%) | 665 (8.2%) |
| 65 to 69 Years | 519 (7.8%) | 507 (6.3%) |
| 70 to 74 Years | 253 (3.8%) | 435 (5.4%) |
| 75 to 79 Years | 181 (2.7%) | 389 (4.8%) |
| 80 to 84 Years | 80 (1.2%) | 300 (3.7%) |
| 85 Years and over | 42 (0.6%) | 207 (2.6%) |
| Total | 6,643 (100.0%) | 8,100 (100.0%) |
Families and Households in Havre De Grace
Median Family Size in Havre De Grace
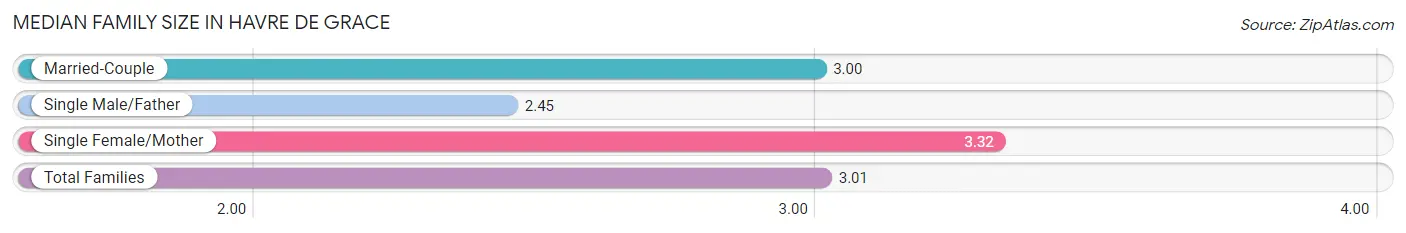
The median family size in Havre De Grace is 3.01 persons per family, with single female/mother families (515 | 14.1%) accounting for the largest median family size of 3.32 persons per family. On the other hand, single male/father families (241 | 6.6%) represent the smallest median family size with 2.45 persons per family.
| Family Type | # Families | Family Size |
| Married-Couple | 2,900 (79.3%) | 3.00 |
| Single Male/Father | 241 (6.6%) | 2.45 |
| Single Female/Mother | 515 (14.1%) | 3.32 |
| Total Families | 3,656 (100.0%) | 3.01 |
Median Household Size in Havre De Grace
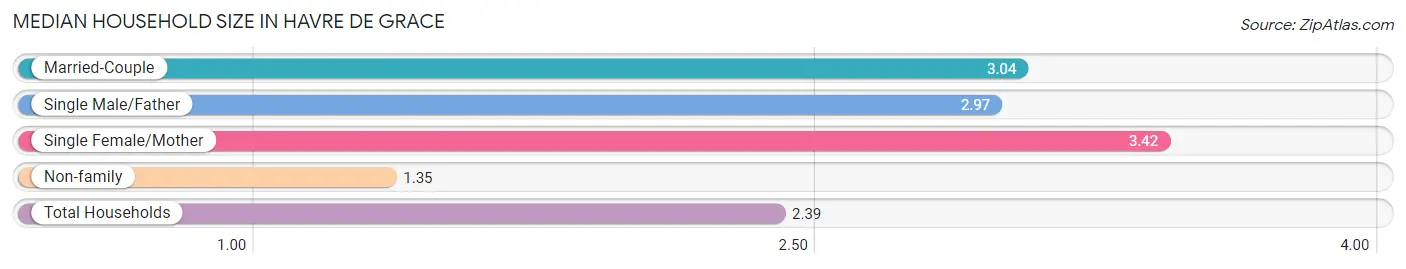
The median household size in Havre De Grace is 2.39 persons per household, with single female/mother households (515 | 8.5%) accounting for the largest median household size of 3.42 persons per household. non-family households (2,437 | 40.0%) represent the smallest median household size with 1.35 persons per household.
| Household Type | # Households | Household Size |
| Married-Couple | 2,900 (47.6%) | 3.04 |
| Single Male/Father | 241 (4.0%) | 2.97 |
| Single Female/Mother | 515 (8.5%) | 3.42 |
| Non-family | 2,437 (40.0%) | 1.35 |
| Total Households | 6,093 (100.0%) | 2.39 |
Household Size by Marriage Status in Havre De Grace
Out of a total of 6,093 households in Havre De Grace, 3,656 (60.0%) are family households, while 2,437 (40.0%) are nonfamily households. The most numerous type of family households are 2-person households, comprising 1,886, and the most common type of nonfamily households are 1-person households, comprising 1,894.
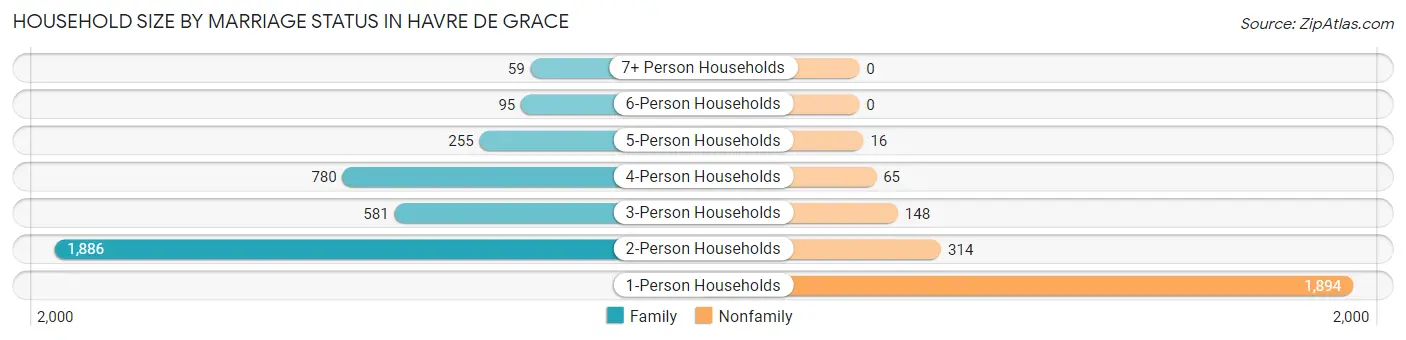
| Household Size | Family Households | Nonfamily Households |
| 1-Person Households | - | 1,894 (31.1%) |
| 2-Person Households | 1,886 (30.9%) | 314 (5.1%) |
| 3-Person Households | 581 (9.5%) | 148 (2.4%) |
| 4-Person Households | 780 (12.8%) | 65 (1.1%) |
| 5-Person Households | 255 (4.2%) | 16 (0.3%) |
| 6-Person Households | 95 (1.6%) | 0 (0.0%) |
| 7+ Person Households | 59 (1.0%) | 0 (0.0%) |
| Total | 3,656 (60.0%) | 2,437 (40.0%) |
Female Fertility in Havre De Grace
Fertility by Age in Havre De Grace
Average fertility rate in Havre De Grace is 36.0 births per 1,000 women. Women in the age bracket of 20 to 34 years have the highest fertility rate with 77.0 births per 1,000 women. Women in the age bracket of 20 to 34 years acount for 87.9% of all women with births.
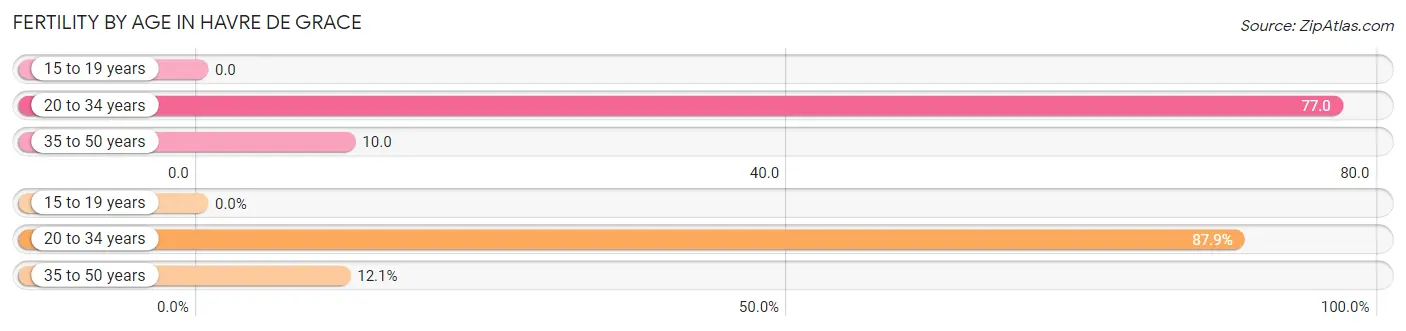
| Age Bracket | Women with Births | Births / 1,000 Women |
| 15 to 19 years | 0 (0.0%) | 0.0 |
| 20 to 34 years | 102 (87.9%) | 77.0 |
| 35 to 50 years | 14 (12.1%) | 10.0 |
| Total | 116 (100.0%) | 36.0 |
Fertility by Age by Marriage Status in Havre De Grace
80.2% of women with births (116) in Havre De Grace are married. The highest percentage of unmarried women with births falls into 20 to 34 years age bracket with 22.6% of them unmarried at the time of birth, while the lowest percentage of unmarried women with births belong to 35 to 50 years age bracket with 0.0% of them unmarried.
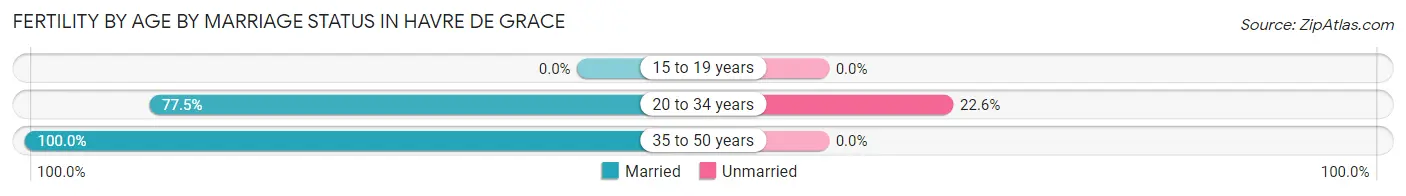
| Age Bracket | Married | Unmarried |
| 15 to 19 years | 0 (0.0%) | 0 (0.0%) |
| 20 to 34 years | 79 (77.4%) | 23 (22.6%) |
| 35 to 50 years | 14 (100.0%) | 0 (0.0%) |
| Total | 93 (80.2%) | 23 (19.8%) |
Fertility by Education in Havre De Grace
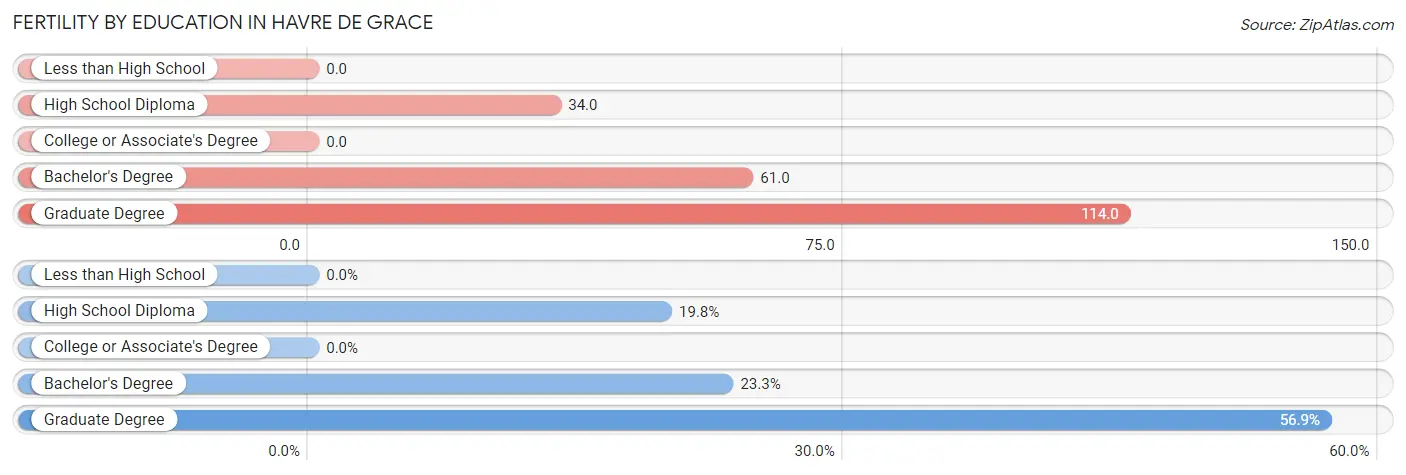
| Educational Attainment | Women with Births | Births / 1,000 Women |
| Less than High School | 0 (0.0%) | 0.0 |
| High School Diploma | 23 (19.8%) | 34.0 |
| College or Associate's Degree | 0 (0.0%) | 0.0 |
| Bachelor's Degree | 27 (23.3%) | 61.0 |
| Graduate Degree | 66 (56.9%) | 114.0 |
| Total | 116 (100.0%) | 36.0 |
Fertility by Education by Marriage Status in Havre De Grace
19.8% of women with births in Havre De Grace are unmarried. Women with the educational attainment of bachelor's degree are most likely to be married with 100.0% of them married at childbirth, while women with the educational attainment of high school diploma are least likely to be married with 100.0% of them unmarried at childbirth.
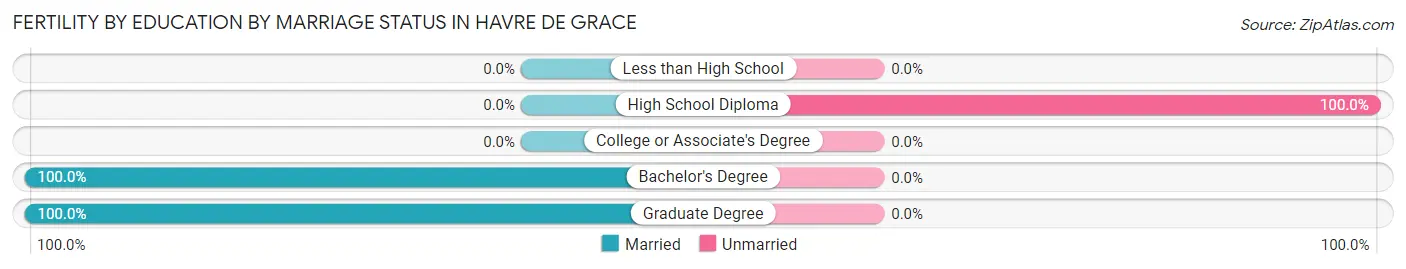
| Educational Attainment | Married | Unmarried |
| Less than High School | 0 (0.0%) | 0 (0.0%) |
| High School Diploma | 0 (0.0%) | 23 (100.0%) |
| College or Associate's Degree | 0 (0.0%) | 0 (0.0%) |
| Bachelor's Degree | 27 (100.0%) | 0 (0.0%) |
| Graduate Degree | 66 (100.0%) | 0 (0.0%) |
| Total | 93 (80.2%) | 23 (19.8%) |
Employment Characteristics in Havre De Grace
Employment by Class of Employer in Havre De Grace
Among the 7,296 employed individuals in Havre De Grace, private company employees (4,130 | 56.6%), federal government employees (1,123 | 15.4%), and not-for-profit organizations (718 | 9.8%) make up the most common classes of employment.
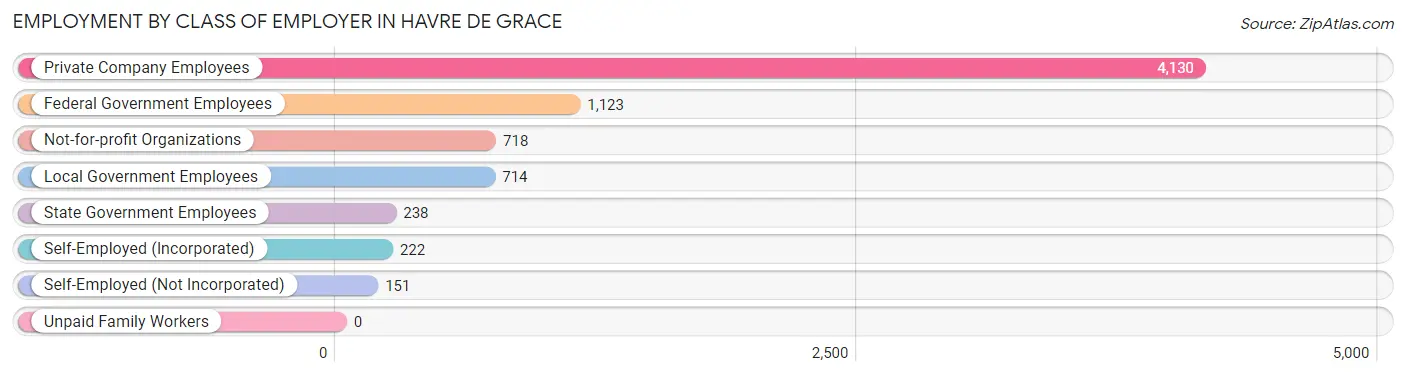
| Employer Class | # Employees | % Employees |
| Private Company Employees | 4,130 | 56.6% |
| Self-Employed (Incorporated) | 222 | 3.0% |
| Self-Employed (Not Incorporated) | 151 | 2.1% |
| Not-for-profit Organizations | 718 | 9.8% |
| Local Government Employees | 714 | 9.8% |
| State Government Employees | 238 | 3.3% |
| Federal Government Employees | 1,123 | 15.4% |
| Unpaid Family Workers | 0 | 0.0% |
| Total | 7,296 | 100.0% |
Employment Status by Age in Havre De Grace
According to the labor force statistics for Havre De Grace, out of the total population over 16 years of age (12,229), 63.2% or 7,729 individuals are in the labor force, with 4.0% or 309 of them unemployed. The age group with the highest labor force participation rate is 30 to 34 years, with 85.5% or 782 individuals in the labor force. Within the labor force, the 16 to 19 years age range has the highest percentage of unemployed individuals, with 27.0% or 80 of them being unemployed.
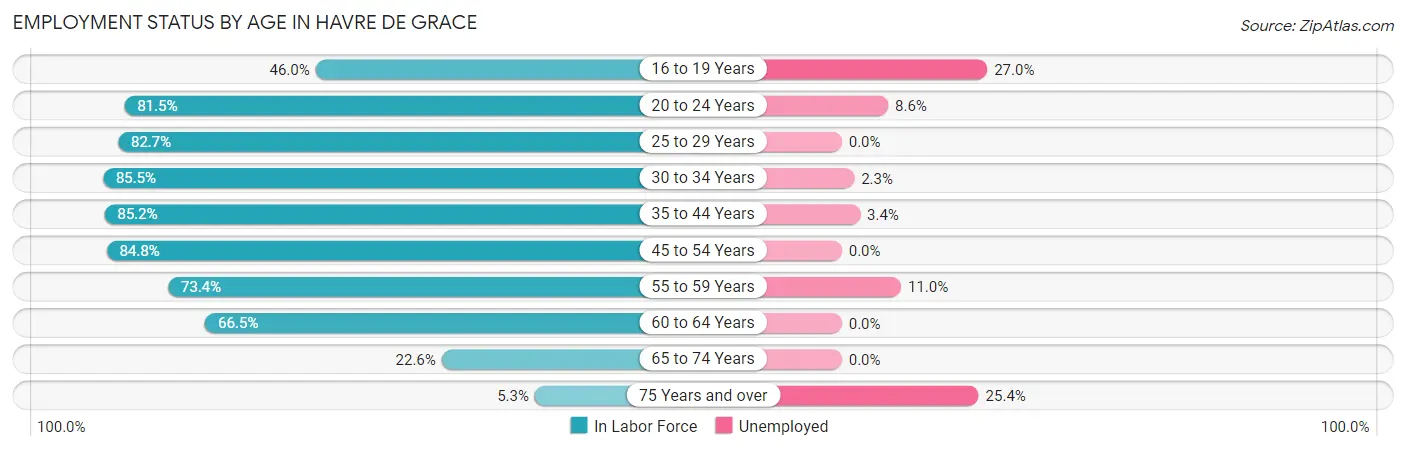
| Age Bracket | In Labor Force | Unemployed |
| 16 to 19 Years | 296 (46.0%) | 80 (27.0%) |
| 20 to 24 Years | 776 (81.5%) | 67 (8.6%) |
| 25 to 29 Years | 725 (82.7%) | 0 (0.0%) |
| 30 to 34 Years | 782 (85.5%) | 18 (2.3%) |
| 35 to 44 Years | 1,268 (85.2%) | 43 (3.4%) |
| 45 to 54 Years | 1,856 (84.8%) | 0 (0.0%) |
| 55 to 59 Years | 757 (73.4%) | 83 (11.0%) |
| 60 to 64 Years | 812 (66.5%) | 0 (0.0%) |
| 65 to 74 Years | 387 (22.6%) | 0 (0.0%) |
| 75 Years and over | 64 (5.3%) | 16 (25.4%) |
| Total | 7,729 (63.2%) | 309 (4.0%) |
Employment Status by Educational Attainment in Havre De Grace
According to labor force statistics for Havre De Grace, 80.3% of individuals (6,200) out of the total population between 25 and 64 years of age (7,721) are in the labor force, with 2.3% or 143 of them being unemployed. The group with the highest labor force participation rate are those with the educational attainment of bachelor's degree or higher, with 91.2% or 3,102 individuals in the labor force. Within the labor force, individuals with high school diploma education have the highest percentage of unemployment, with 4.7% or 61 of them being unemployed.
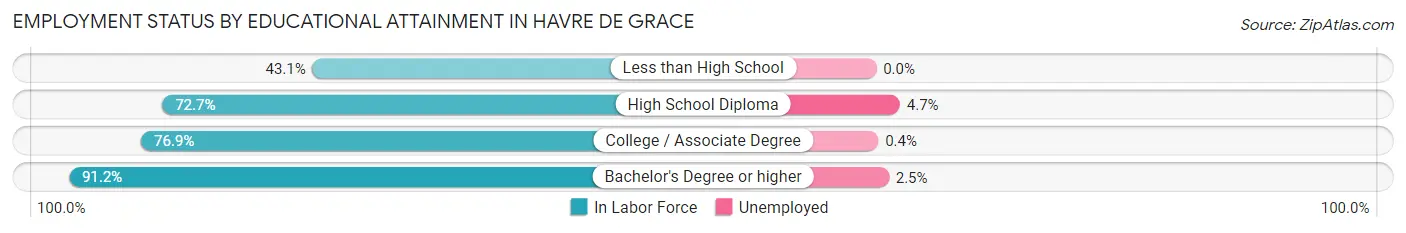
| Educational Attainment | In Labor Force | Unemployed |
| Less than High School | 186 (43.1%) | 0 (0.0%) |
| High School Diploma | 1,303 (72.7%) | 84 (4.7%) |
| College / Associate Degree | 1,612 (76.9%) | 8 (0.4%) |
| Bachelor's Degree or higher | 3,102 (91.2%) | 85 (2.5%) |
| Total | 6,200 (80.3%) | 178 (2.3%) |
Employment Occupations by Sex in Havre De Grace
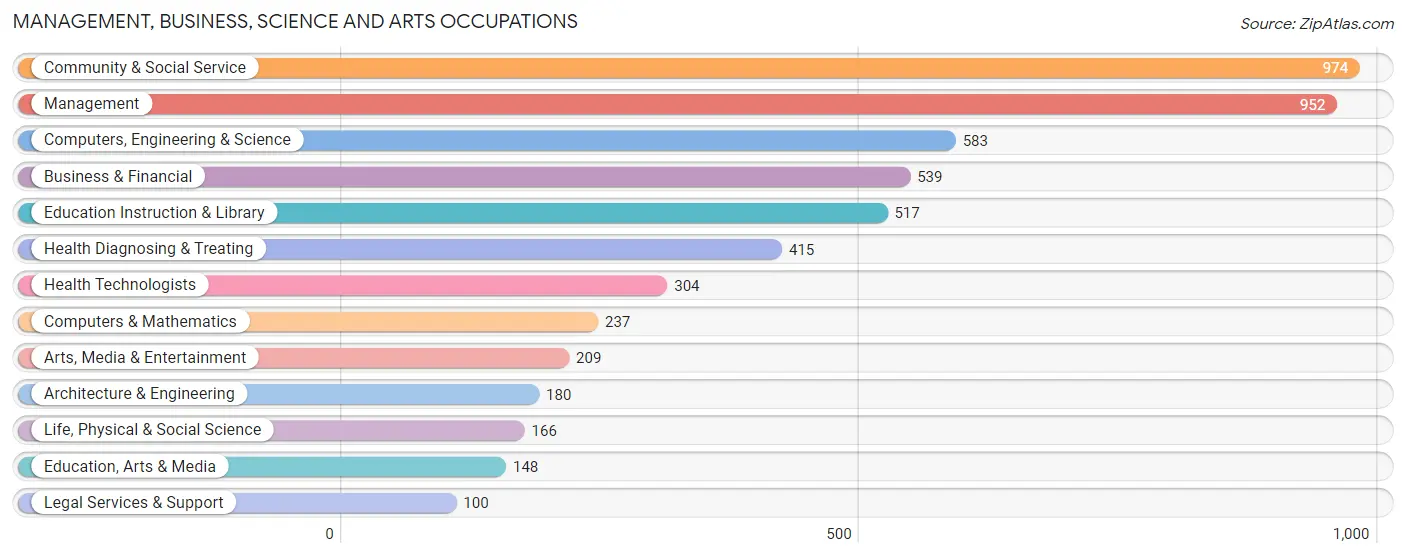
Management, Business, Science and Arts Occupations
The most common Management, Business, Science and Arts occupations in Havre De Grace are Community & Social Service (974 | 13.2%), Management (952 | 12.9%), Computers, Engineering & Science (583 | 7.9%), Business & Financial (539 | 7.3%), and Education Instruction & Library (517 | 7.0%).
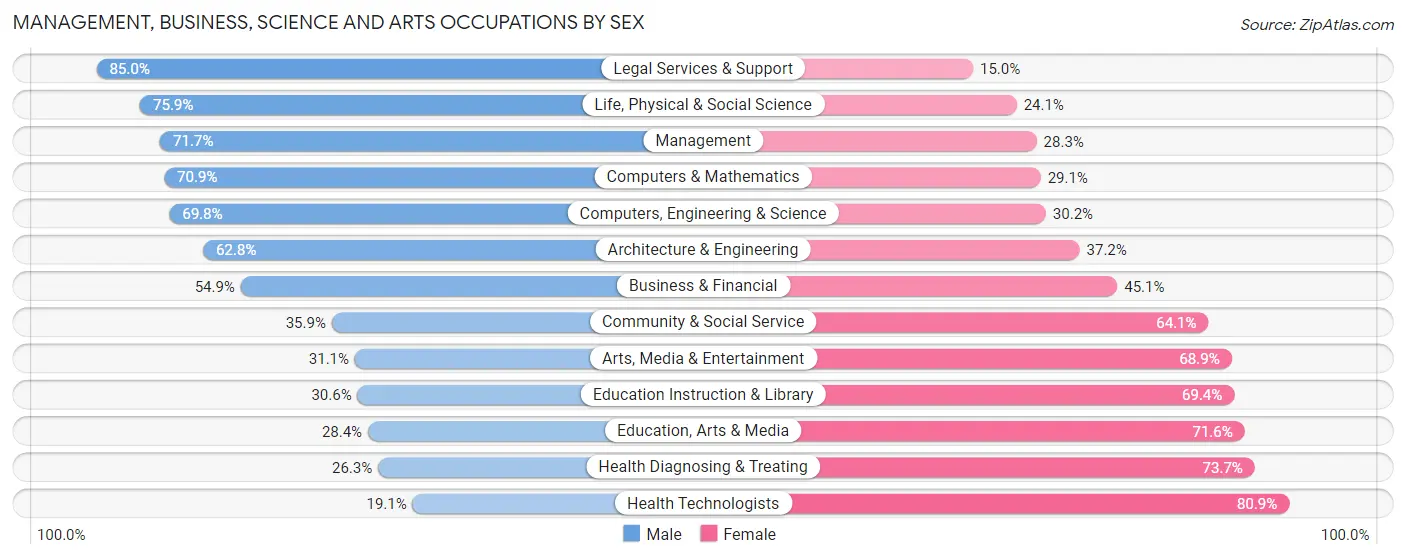
Management, Business, Science and Arts Occupations by Sex
Within the Management, Business, Science and Arts occupations in Havre De Grace, the most male-oriented occupations are Legal Services & Support (85.0%), Life, Physical & Social Science (75.9%), and Management (71.7%), while the most female-oriented occupations are Health Technologists (80.9%), Health Diagnosing & Treating (73.7%), and Education, Arts & Media (71.6%).
| Occupation | Male | Female |
| Management | 683 (71.7%) | 269 (28.3%) |
| Business & Financial | 296 (54.9%) | 243 (45.1%) |
| Computers, Engineering & Science | 407 (69.8%) | 176 (30.2%) |
| Computers & Mathematics | 168 (70.9%) | 69 (29.1%) |
| Architecture & Engineering | 113 (62.8%) | 67 (37.2%) |
| Life, Physical & Social Science | 126 (75.9%) | 40 (24.1%) |
| Community & Social Service | 350 (35.9%) | 624 (64.1%) |
| Education, Arts & Media | 42 (28.4%) | 106 (71.6%) |
| Legal Services & Support | 85 (85.0%) | 15 (15.0%) |
| Education Instruction & Library | 158 (30.6%) | 359 (69.4%) |
| Arts, Media & Entertainment | 65 (31.1%) | 144 (68.9%) |
| Health Diagnosing & Treating | 109 (26.3%) | 306 (73.7%) |
| Health Technologists | 58 (19.1%) | 246 (80.9%) |
| Total (Category) | 1,845 (53.3%) | 1,618 (46.7%) |
| Total (Overall) | 3,894 (52.9%) | 3,464 (47.1%) |
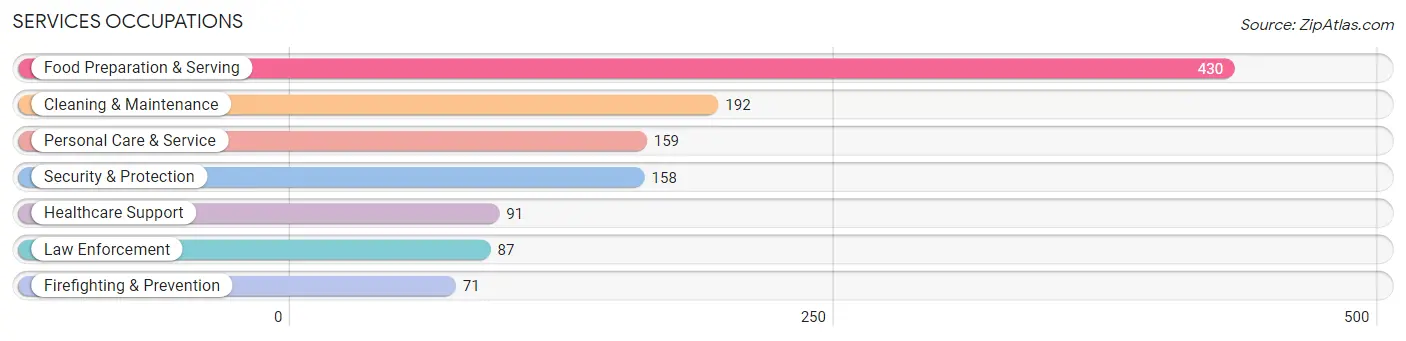
Services Occupations
The most common Services occupations in Havre De Grace are Food Preparation & Serving (430 | 5.8%), Cleaning & Maintenance (192 | 2.6%), Personal Care & Service (159 | 2.2%), Security & Protection (158 | 2.1%), and Healthcare Support (91 | 1.2%).
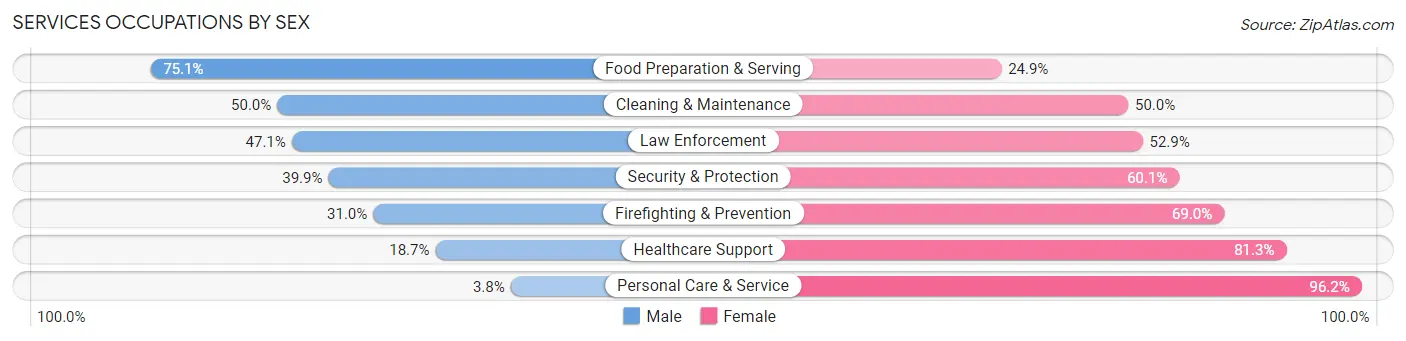
Services Occupations by Sex
Within the Services occupations in Havre De Grace, the most male-oriented occupations are Food Preparation & Serving (75.1%), Cleaning & Maintenance (50.0%), and Law Enforcement (47.1%), while the most female-oriented occupations are Personal Care & Service (96.2%), Healthcare Support (81.3%), and Firefighting & Prevention (69.0%).
| Occupation | Male | Female |
| Healthcare Support | 17 (18.7%) | 74 (81.3%) |
| Security & Protection | 63 (39.9%) | 95 (60.1%) |
| Firefighting & Prevention | 22 (31.0%) | 49 (69.0%) |
| Law Enforcement | 41 (47.1%) | 46 (52.9%) |
| Food Preparation & Serving | 323 (75.1%) | 107 (24.9%) |
| Cleaning & Maintenance | 96 (50.0%) | 96 (50.0%) |
| Personal Care & Service | 6 (3.8%) | 153 (96.2%) |
| Total (Category) | 505 (49.0%) | 525 (51.0%) |
| Total (Overall) | 3,894 (52.9%) | 3,464 (47.1%) |
Sales and Office Occupations
The most common Sales and Office occupations in Havre De Grace are Office & Administration (996 | 13.5%), and Sales & Related (492 | 6.7%).
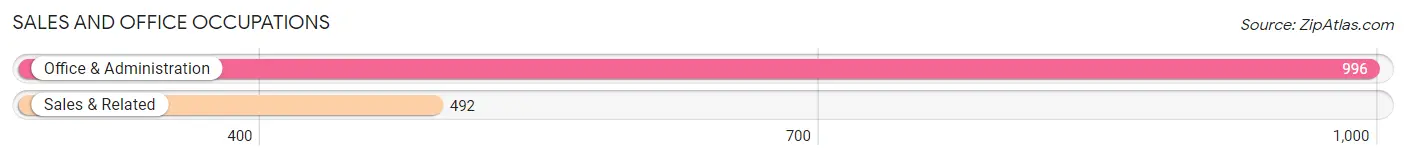
Sales and Office Occupations by Sex
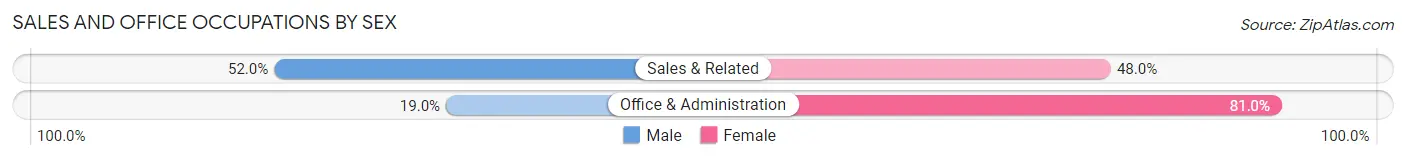
| Occupation | Male | Female |
| Sales & Related | 256 (52.0%) | 236 (48.0%) |
| Office & Administration | 189 (19.0%) | 807 (81.0%) |
| Total (Category) | 445 (29.9%) | 1,043 (70.1%) |
| Total (Overall) | 3,894 (52.9%) | 3,464 (47.1%) |
Natural Resources, Construction and Maintenance Occupations
The most common Natural Resources, Construction and Maintenance occupations in Havre De Grace are Construction & Extraction (323 | 4.4%), and Installation, Maintenance & Repair (176 | 2.4%).
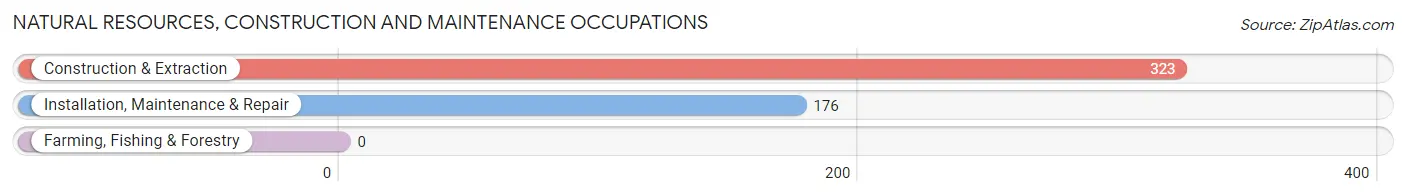
Natural Resources, Construction and Maintenance Occupations by Sex
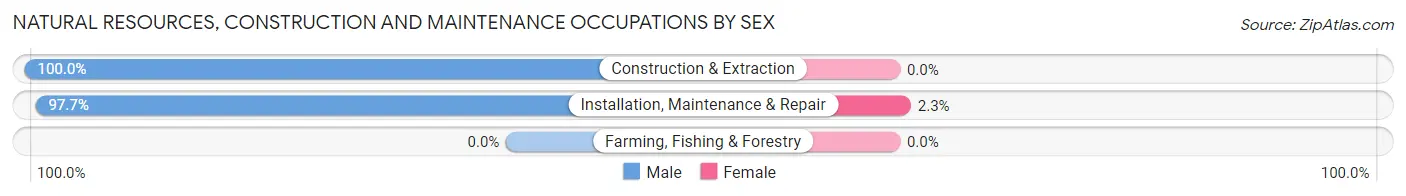
| Occupation | Male | Female |
| Farming, Fishing & Forestry | 0 (0.0%) | 0 (0.0%) |
| Construction & Extraction | 323 (100.0%) | 0 (0.0%) |
| Installation, Maintenance & Repair | 172 (97.7%) | 4 (2.3%) |
| Total (Category) | 495 (99.2%) | 4 (0.8%) |
| Total (Overall) | 3,894 (52.9%) | 3,464 (47.1%) |
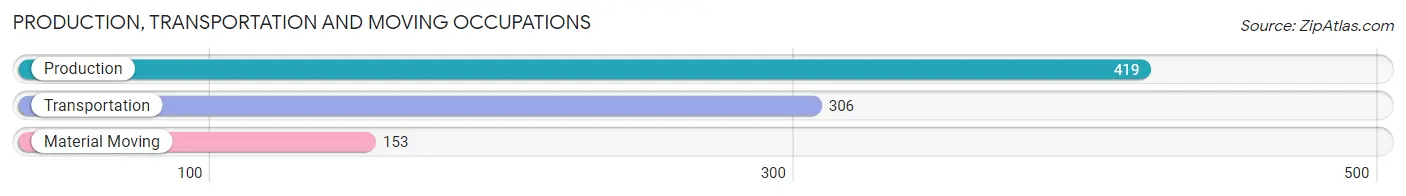
Production, Transportation and Moving Occupations
The most common Production, Transportation and Moving occupations in Havre De Grace are Production (419 | 5.7%), Transportation (306 | 4.2%), and Material Moving (153 | 2.1%).
Production, Transportation and Moving Occupations by Sex
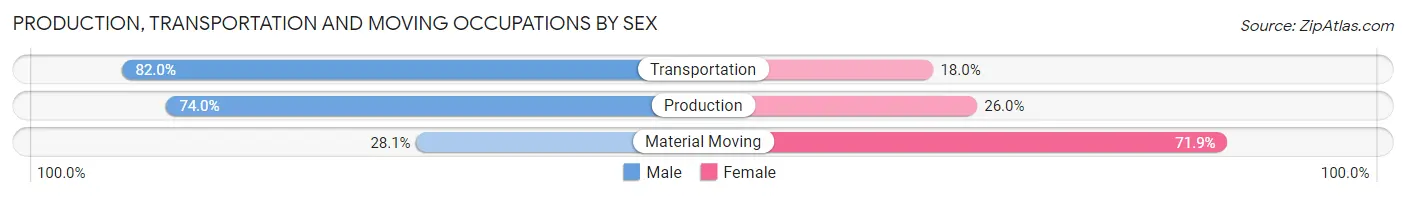
| Occupation | Male | Female |
| Production | 310 (74.0%) | 109 (26.0%) |
| Transportation | 251 (82.0%) | 55 (18.0%) |
| Material Moving | 43 (28.1%) | 110 (71.9%) |
| Total (Category) | 604 (68.8%) | 274 (31.2%) |
| Total (Overall) | 3,894 (52.9%) | 3,464 (47.1%) |
Employment Industries by Sex in Havre De Grace
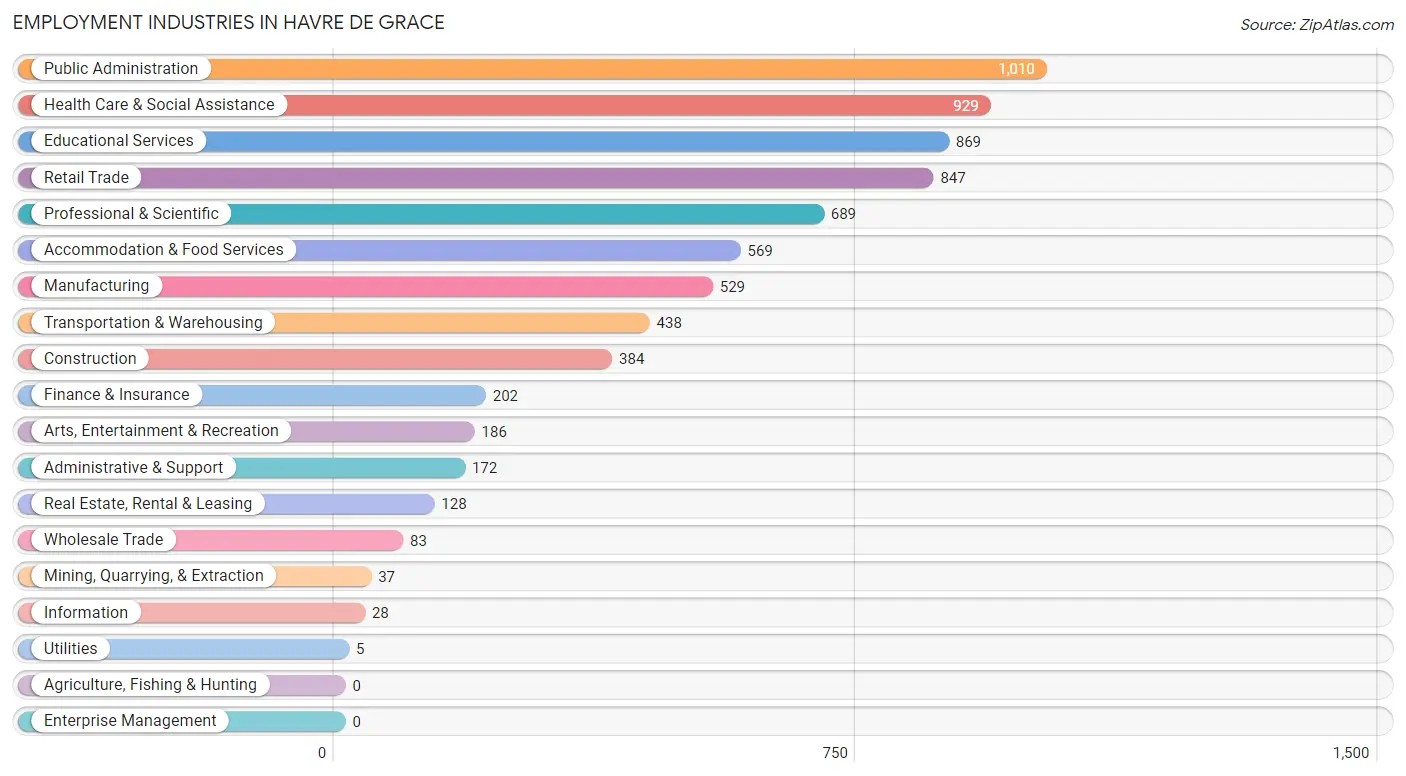
Employment Industries in Havre De Grace
The major employment industries in Havre De Grace include Public Administration (1,010 | 13.7%), Health Care & Social Assistance (929 | 12.6%), Educational Services (869 | 11.8%), Retail Trade (847 | 11.5%), and Professional & Scientific (689 | 9.4%).
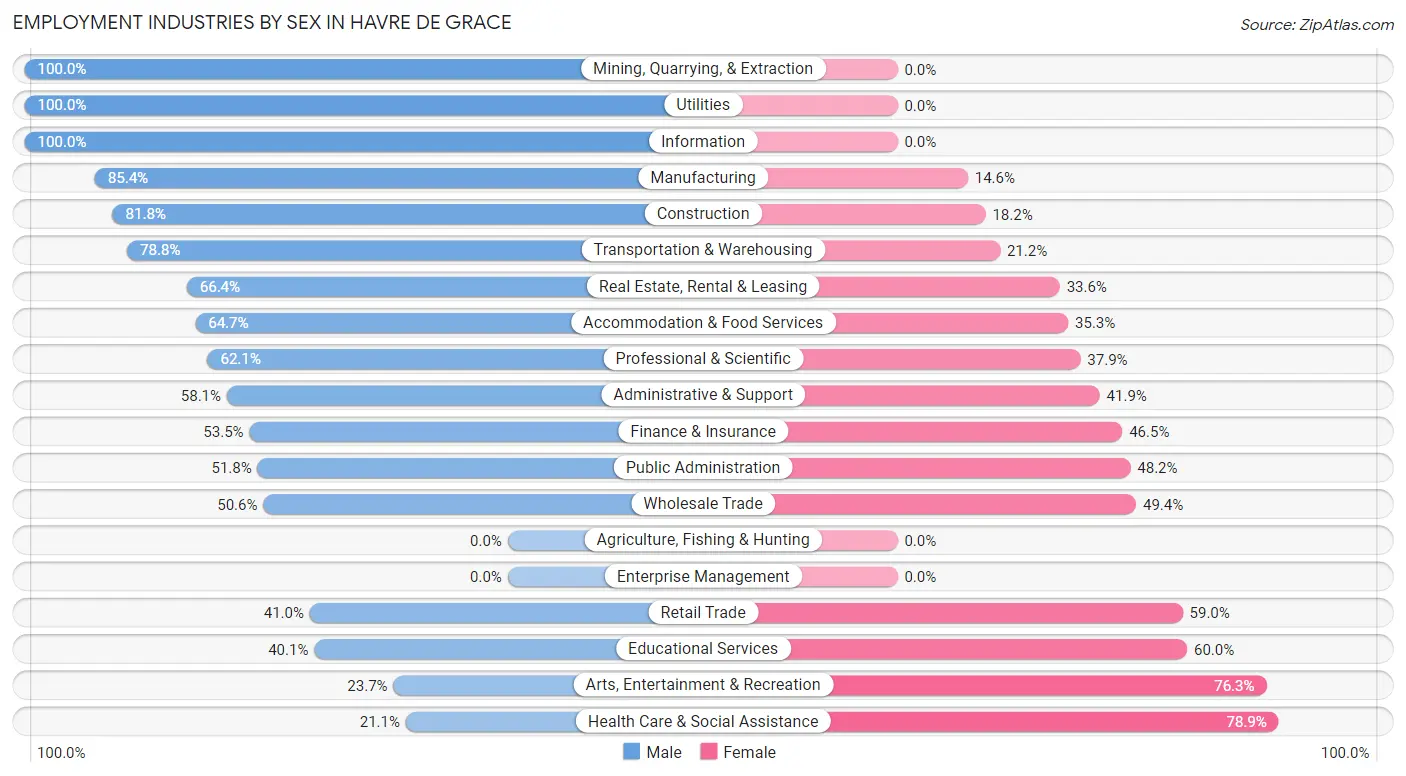
Employment Industries by Sex in Havre De Grace
The Havre De Grace industries that see more men than women are Mining, Quarrying, & Extraction (100.0%), Utilities (100.0%), and Information (100.0%), whereas the industries that tend to have a higher number of women are Health Care & Social Assistance (78.9%), Arts, Entertainment & Recreation (76.3%), and Educational Services (60.0%).
| Industry | Male | Female |
| Agriculture, Fishing & Hunting | 0 (0.0%) | 0 (0.0%) |
| Mining, Quarrying, & Extraction | 37 (100.0%) | 0 (0.0%) |
| Construction | 314 (81.8%) | 70 (18.2%) |
| Manufacturing | 452 (85.4%) | 77 (14.6%) |
| Wholesale Trade | 42 (50.6%) | 41 (49.4%) |
| Retail Trade | 347 (41.0%) | 500 (59.0%) |
| Transportation & Warehousing | 345 (78.8%) | 93 (21.2%) |
| Utilities | 5 (100.0%) | 0 (0.0%) |
| Information | 28 (100.0%) | 0 (0.0%) |
| Finance & Insurance | 108 (53.5%) | 94 (46.5%) |
| Real Estate, Rental & Leasing | 85 (66.4%) | 43 (33.6%) |
| Professional & Scientific | 428 (62.1%) | 261 (37.9%) |
| Enterprise Management | 0 (0.0%) | 0 (0.0%) |
| Administrative & Support | 100 (58.1%) | 72 (41.9%) |
| Educational Services | 348 (40.1%) | 521 (60.0%) |
| Health Care & Social Assistance | 196 (21.1%) | 733 (78.9%) |
| Arts, Entertainment & Recreation | 44 (23.7%) | 142 (76.3%) |
| Accommodation & Food Services | 368 (64.7%) | 201 (35.3%) |
| Public Administration | 523 (51.8%) | 487 (48.2%) |
| Total | 3,894 (52.9%) | 3,464 (47.1%) |
Education in Havre De Grace
School Enrollment in Havre De Grace
The most common levels of schooling among the 3,157 students in Havre De Grace are middle school (795 | 25.2%), high school (694 | 22.0%), and elementary school (596 | 18.9%).
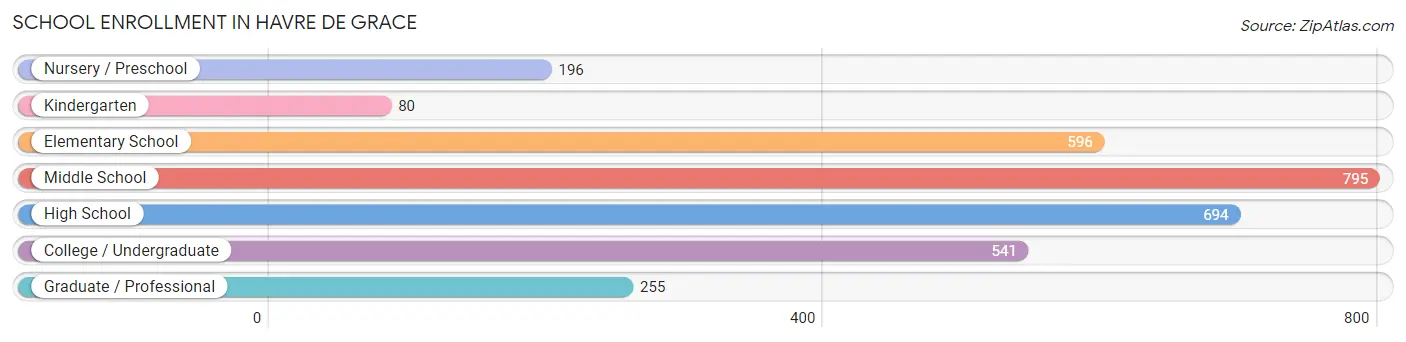
| School Level | # Students | % Students |
| Nursery / Preschool | 196 | 6.2% |
| Kindergarten | 80 | 2.5% |
| Elementary School | 596 | 18.9% |
| Middle School | 795 | 25.2% |
| High School | 694 | 22.0% |
| College / Undergraduate | 541 | 17.1% |
| Graduate / Professional | 255 | 8.1% |
| Total | 3,157 | 100.0% |
School Enrollment by Age by Funding Source in Havre De Grace
Out of a total of 3,157 students who are enrolled in schools in Havre De Grace, 474 (15.0%) attend a private institution, while the remaining 2,683 (85.0%) are enrolled in public schools. The age group of 25 to 34 year olds has the highest likelihood of being enrolled in private schools, with 78 (43.6% in the age bracket) enrolled. Conversely, the age group of 20 to 24 year olds has the lowest likelihood of being enrolled in a private school, with 283 (97.6% in the age bracket) attending a public institution.
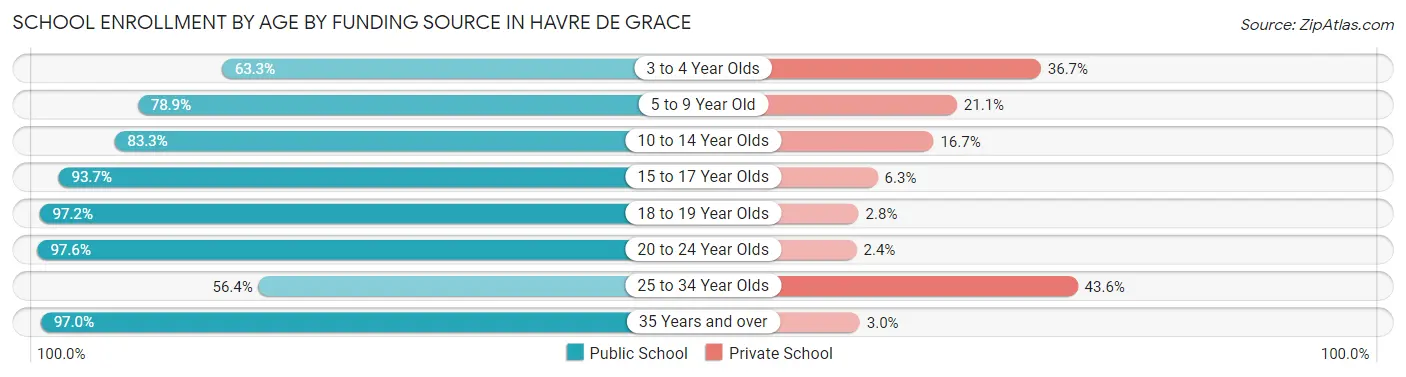
| Age Bracket | Public School | Private School |
| 3 to 4 Year Olds | 93 (63.3%) | 54 (36.7%) |
| 5 to 9 Year Old | 464 (78.9%) | 124 (21.1%) |
| 10 to 14 Year Olds | 831 (83.3%) | 167 (16.7%) |
| 15 to 17 Year Olds | 444 (93.7%) | 30 (6.3%) |
| 18 to 19 Year Olds | 209 (97.2%) | 6 (2.8%) |
| 20 to 24 Year Olds | 283 (97.6%) | 7 (2.4%) |
| 25 to 34 Year Olds | 101 (56.4%) | 78 (43.6%) |
| 35 Years and over | 258 (97.0%) | 8 (3.0%) |
| Total | 2,683 (85.0%) | 474 (15.0%) |
Educational Attainment by Field of Study in Havre De Grace
Business (808 | 16.8%), science & technology (555 | 11.6%), social sciences (529 | 11.0%), education (509 | 10.6%), and engineering (384 | 8.0%) are the most common fields of study among 4,799 individuals in Havre De Grace who have obtained a bachelor's degree or higher.
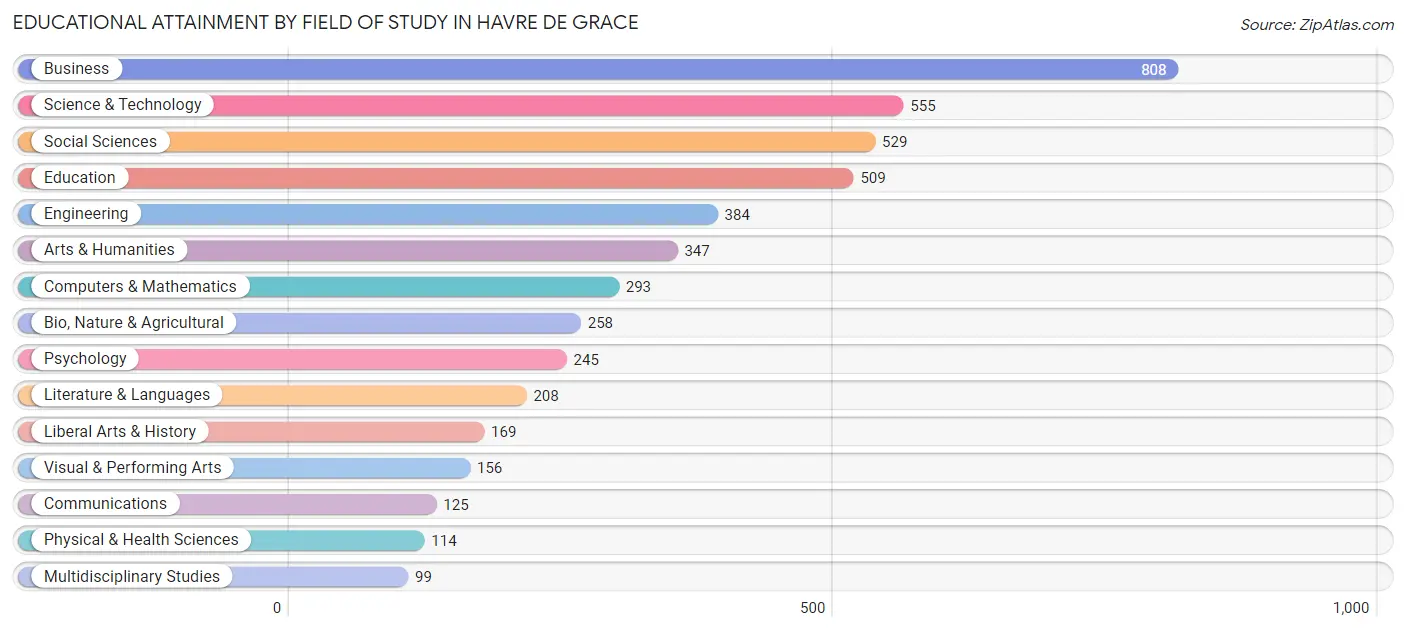
| Field of Study | # Graduates | % Graduates |
| Computers & Mathematics | 293 | 6.1% |
| Bio, Nature & Agricultural | 258 | 5.4% |
| Physical & Health Sciences | 114 | 2.4% |
| Psychology | 245 | 5.1% |
| Social Sciences | 529 | 11.0% |
| Engineering | 384 | 8.0% |
| Multidisciplinary Studies | 99 | 2.1% |
| Science & Technology | 555 | 11.6% |
| Business | 808 | 16.8% |
| Education | 509 | 10.6% |
| Literature & Languages | 208 | 4.3% |
| Liberal Arts & History | 169 | 3.5% |
| Visual & Performing Arts | 156 | 3.3% |
| Communications | 125 | 2.6% |
| Arts & Humanities | 347 | 7.2% |
| Total | 4,799 | 100.0% |
Transportation & Commute in Havre De Grace
Vehicle Availability by Sex in Havre De Grace
The most prevalent vehicle ownership categories in Havre De Grace are males with 2 vehicles (1,452, accounting for 37.4%) and females with 2 vehicles (1,319, making up 42.6%).
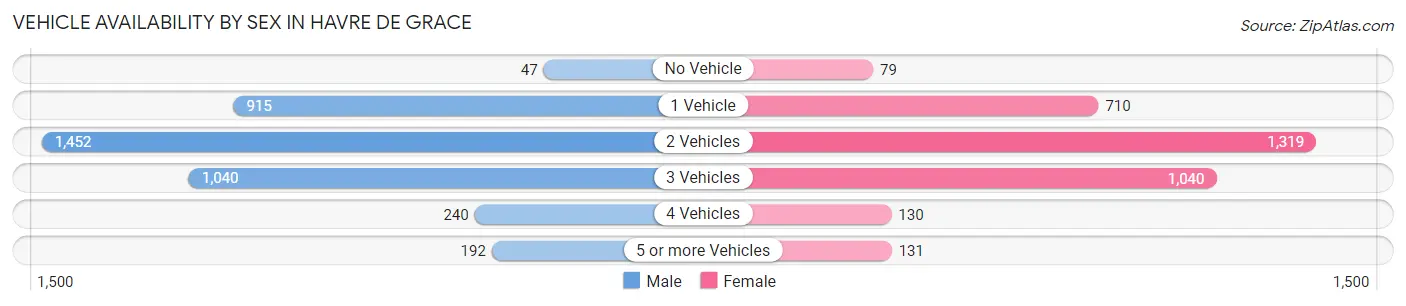
| Vehicles Available | Male | Female |
| No Vehicle | 47 (1.2%) | 79 (2.3%) |
| 1 Vehicle | 915 (23.5%) | 710 (20.8%) |
| 2 Vehicles | 1,452 (37.4%) | 1,319 (38.7%) |
| 3 Vehicles | 1,040 (26.8%) | 1,040 (30.5%) |
| 4 Vehicles | 240 (6.2%) | 130 (3.8%) |
| 5 or more Vehicles | 192 (4.9%) | 131 (3.8%) |
| Total | 3,886 (100.0%) | 3,409 (100.0%) |
Commute Time in Havre De Grace
The most frequently occuring commute durations in Havre De Grace are 15 to 19 minutes (1,067 commuters, 17.4%), 30 to 34 minutes (814 commuters, 13.3%), and 20 to 24 minutes (734 commuters, 12.0%).
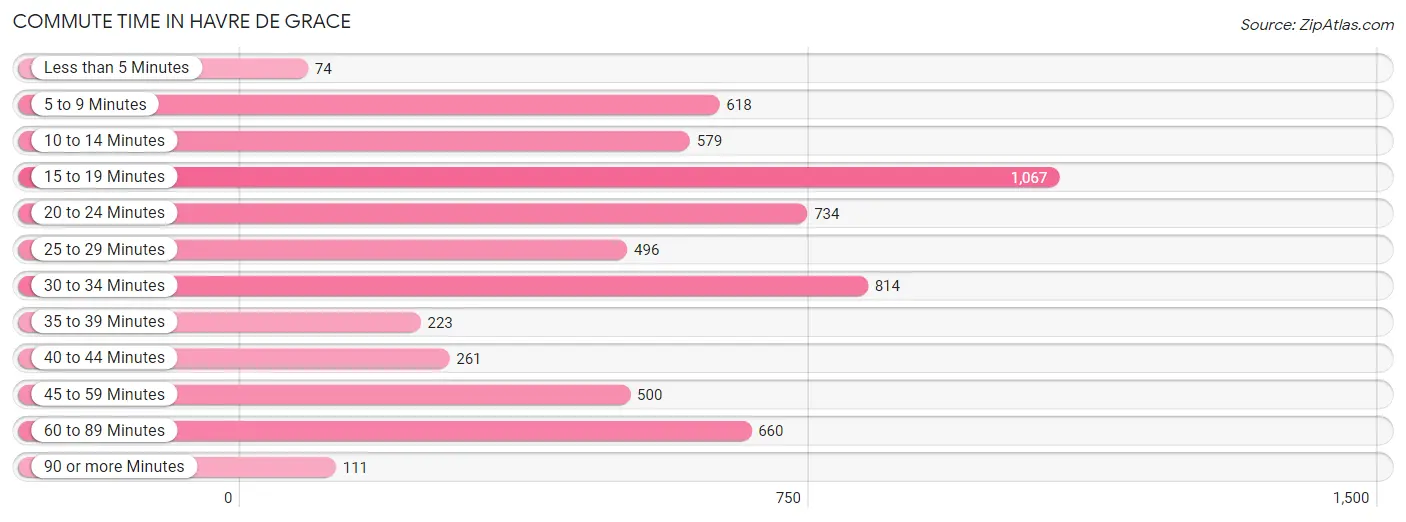
| Commute Time | # Commuters | % Commuters |
| Less than 5 Minutes | 74 | 1.2% |
| 5 to 9 Minutes | 618 | 10.1% |
| 10 to 14 Minutes | 579 | 9.4% |
| 15 to 19 Minutes | 1,067 | 17.4% |
| 20 to 24 Minutes | 734 | 12.0% |
| 25 to 29 Minutes | 496 | 8.1% |
| 30 to 34 Minutes | 814 | 13.3% |
| 35 to 39 Minutes | 223 | 3.6% |
| 40 to 44 Minutes | 261 | 4.3% |
| 45 to 59 Minutes | 500 | 8.2% |
| 60 to 89 Minutes | 660 | 10.7% |
| 90 or more Minutes | 111 | 1.8% |
Commute Time by Sex in Havre De Grace
The most common commute times in Havre De Grace are 15 to 19 minutes (615 commuters, 18.7%) for males and 30 to 34 minutes (516 commuters, 18.1%) for females.
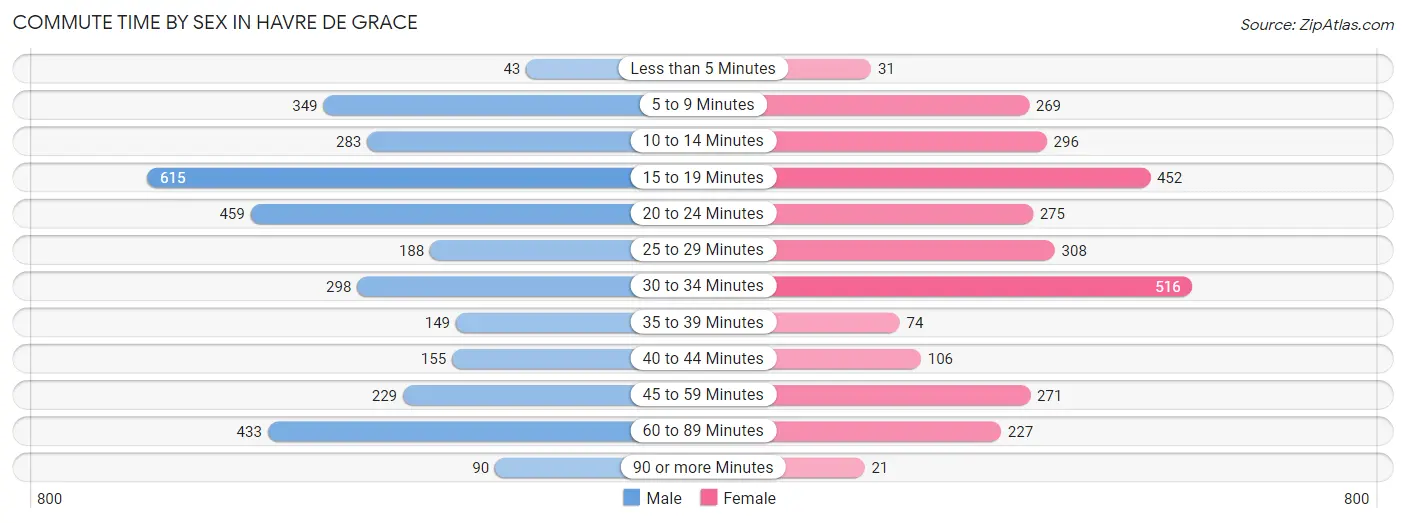
| Commute Time | Male | Female |
| Less than 5 Minutes | 43 (1.3%) | 31 (1.1%) |
| 5 to 9 Minutes | 349 (10.6%) | 269 (9.5%) |
| 10 to 14 Minutes | 283 (8.6%) | 296 (10.4%) |
| 15 to 19 Minutes | 615 (18.7%) | 452 (15.9%) |
| 20 to 24 Minutes | 459 (14.0%) | 275 (9.7%) |
| 25 to 29 Minutes | 188 (5.7%) | 308 (10.8%) |
| 30 to 34 Minutes | 298 (9.0%) | 516 (18.1%) |
| 35 to 39 Minutes | 149 (4.5%) | 74 (2.6%) |
| 40 to 44 Minutes | 155 (4.7%) | 106 (3.7%) |
| 45 to 59 Minutes | 229 (7.0%) | 271 (9.5%) |
| 60 to 89 Minutes | 433 (13.2%) | 227 (8.0%) |
| 90 or more Minutes | 90 (2.7%) | 21 (0.7%) |
Time of Departure to Work by Sex in Havre De Grace
The most frequent times of departure to work in Havre De Grace are 6:30 AM to 6:59 AM (563, 17.1%) for males and 7:30 AM to 7:59 AM (619, 21.7%) for females.
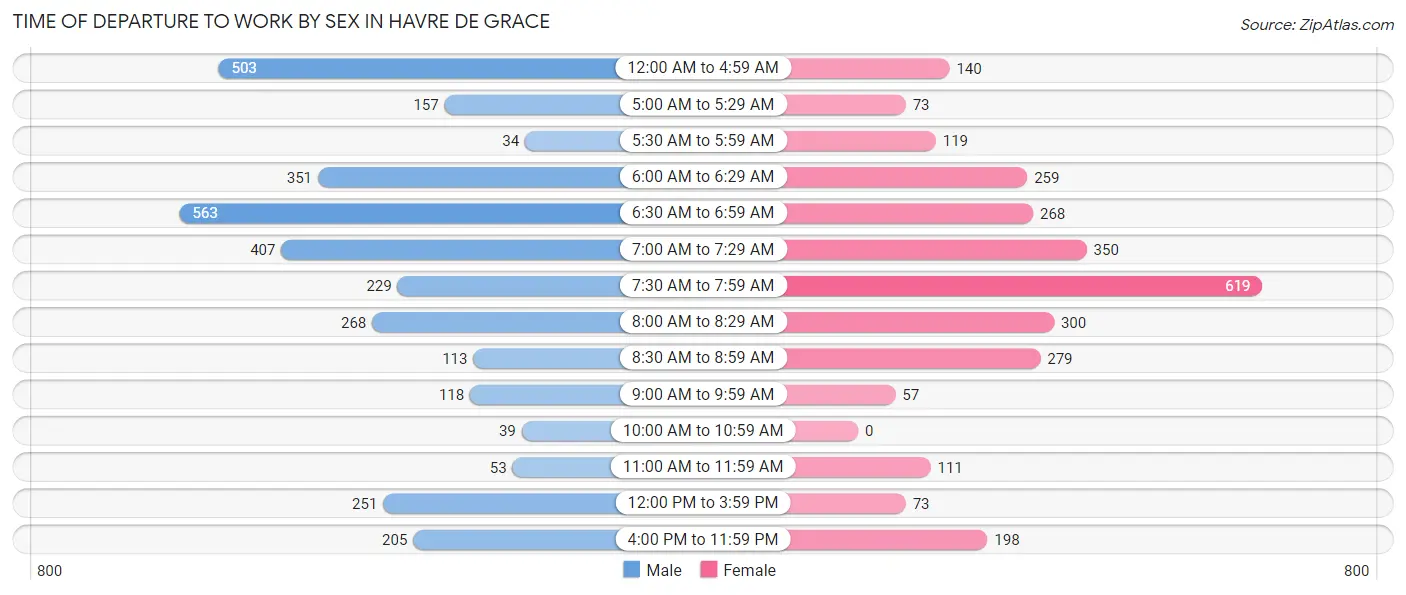
| Time of Departure | Male | Female |
| 12:00 AM to 4:59 AM | 503 (15.3%) | 140 (4.9%) |
| 5:00 AM to 5:29 AM | 157 (4.8%) | 73 (2.6%) |
| 5:30 AM to 5:59 AM | 34 (1.0%) | 119 (4.2%) |
| 6:00 AM to 6:29 AM | 351 (10.7%) | 259 (9.1%) |
| 6:30 AM to 6:59 AM | 563 (17.1%) | 268 (9.4%) |
| 7:00 AM to 7:29 AM | 407 (12.4%) | 350 (12.3%) |
| 7:30 AM to 7:59 AM | 229 (7.0%) | 619 (21.7%) |
| 8:00 AM to 8:29 AM | 268 (8.1%) | 300 (10.5%) |
| 8:30 AM to 8:59 AM | 113 (3.4%) | 279 (9.8%) |
| 9:00 AM to 9:59 AM | 118 (3.6%) | 57 (2.0%) |
| 10:00 AM to 10:59 AM | 39 (1.2%) | 0 (0.0%) |
| 11:00 AM to 11:59 AM | 53 (1.6%) | 111 (3.9%) |
| 12:00 PM to 3:59 PM | 251 (7.6%) | 73 (2.6%) |
| 4:00 PM to 11:59 PM | 205 (6.2%) | 198 (7.0%) |
| Total | 3,291 (100.0%) | 2,846 (100.0%) |
Housing Occupancy in Havre De Grace
Occupancy by Ownership in Havre De Grace
Of the total 6,093 dwellings in Havre De Grace, owner-occupied units account for 4,288 (70.4%), while renter-occupied units make up 1,805 (29.6%).
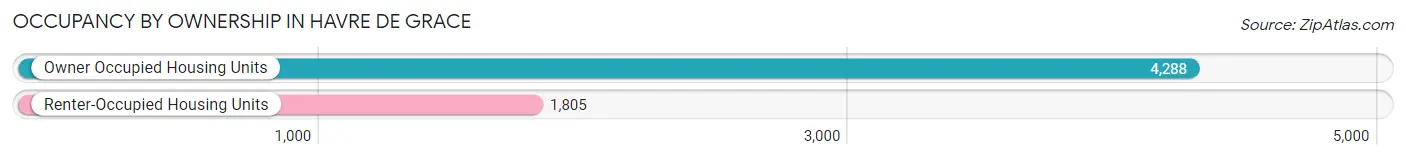
| Occupancy | # Housing Units | % Housing Units |
| Owner Occupied Housing Units | 4,288 | 70.4% |
| Renter-Occupied Housing Units | 1,805 | 29.6% |
| Total Occupied Housing Units | 6,093 | 100.0% |
Occupancy by Household Size in Havre De Grace
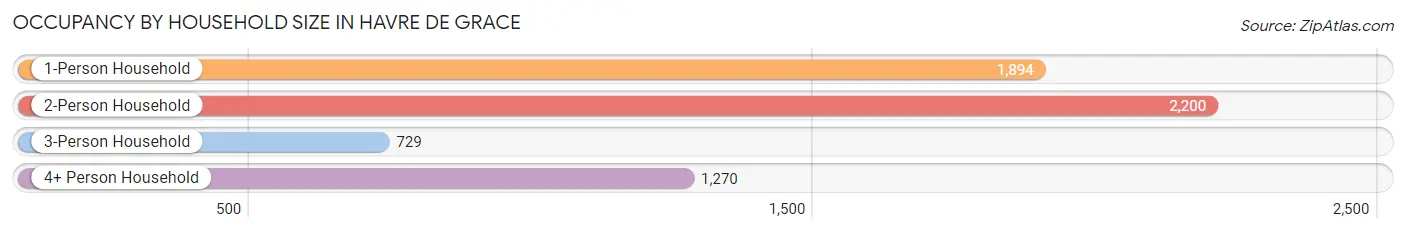
| Household Size | # Housing Units | % Housing Units |
| 1-Person Household | 1,894 | 31.1% |
| 2-Person Household | 2,200 | 36.1% |
| 3-Person Household | 729 | 12.0% |
| 4+ Person Household | 1,270 | 20.8% |
| Total Housing Units | 6,093 | 100.0% |
Occupancy by Ownership by Household Size in Havre De Grace
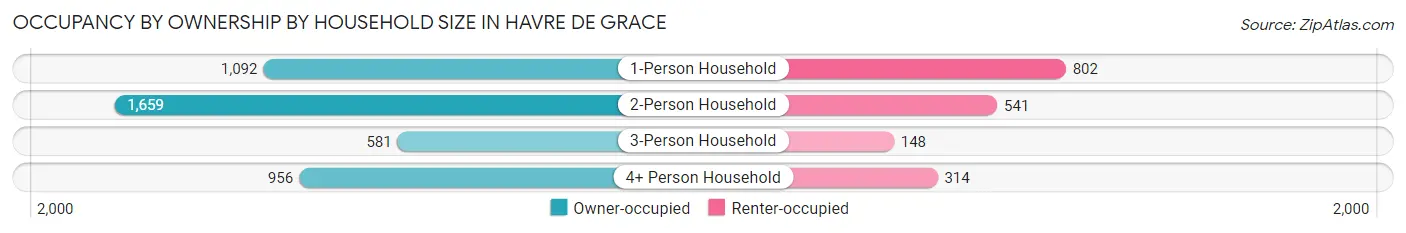
| Household Size | Owner-occupied | Renter-occupied |
| 1-Person Household | 1,092 (57.7%) | 802 (42.3%) |
| 2-Person Household | 1,659 (75.4%) | 541 (24.6%) |
| 3-Person Household | 581 (79.7%) | 148 (20.3%) |
| 4+ Person Household | 956 (75.3%) | 314 (24.7%) |
| Total Housing Units | 4,288 (70.4%) | 1,805 (29.6%) |
Occupancy by Educational Attainment in Havre De Grace
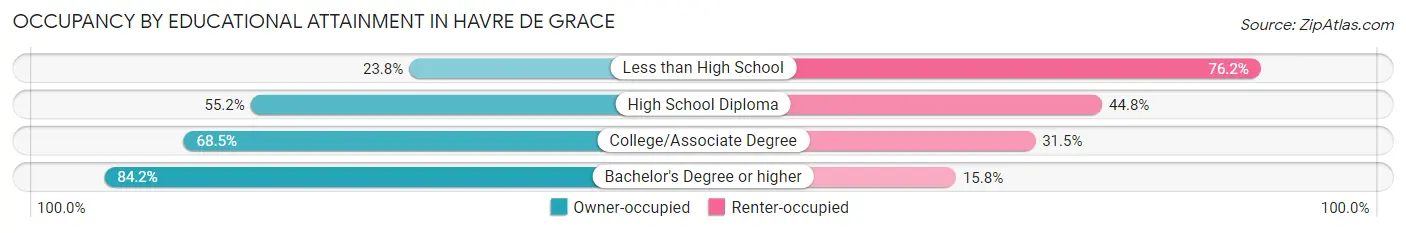
| Household Size | Owner-occupied | Renter-occupied |
| Less than High School | 107 (23.8%) | 343 (76.2%) |
| High School Diploma | 579 (55.2%) | 470 (44.8%) |
| College/Associate Degree | 1,155 (68.5%) | 532 (31.5%) |
| Bachelor's Degree or higher | 2,447 (84.2%) | 460 (15.8%) |
Occupancy by Age of Householder in Havre De Grace
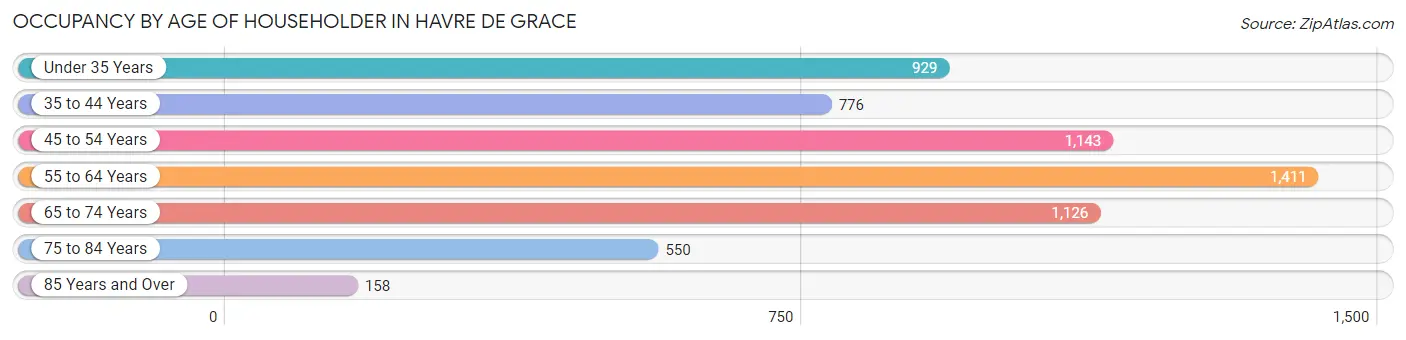
| Age Bracket | # Households | % Households |
| Under 35 Years | 929 | 15.2% |
| 35 to 44 Years | 776 | 12.7% |
| 45 to 54 Years | 1,143 | 18.8% |
| 55 to 64 Years | 1,411 | 23.2% |
| 65 to 74 Years | 1,126 | 18.5% |
| 75 to 84 Years | 550 | 9.0% |
| 85 Years and Over | 158 | 2.6% |
| Total | 6,093 | 100.0% |
Housing Finances in Havre De Grace
Median Income by Occupancy in Havre De Grace
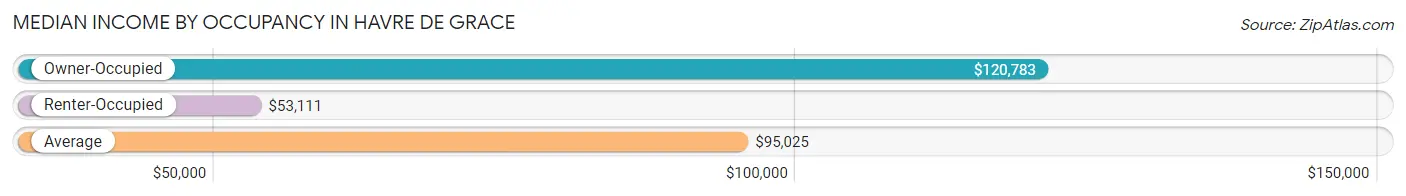
| Occupancy Type | # Households | Median Income |
| Owner-Occupied | 4,288 (70.4%) | $120,783 |
| Renter-Occupied | 1,805 (29.6%) | $53,111 |
| Average | 6,093 (100.0%) | $95,025 |
Occupancy by Householder Income Bracket in Havre De Grace
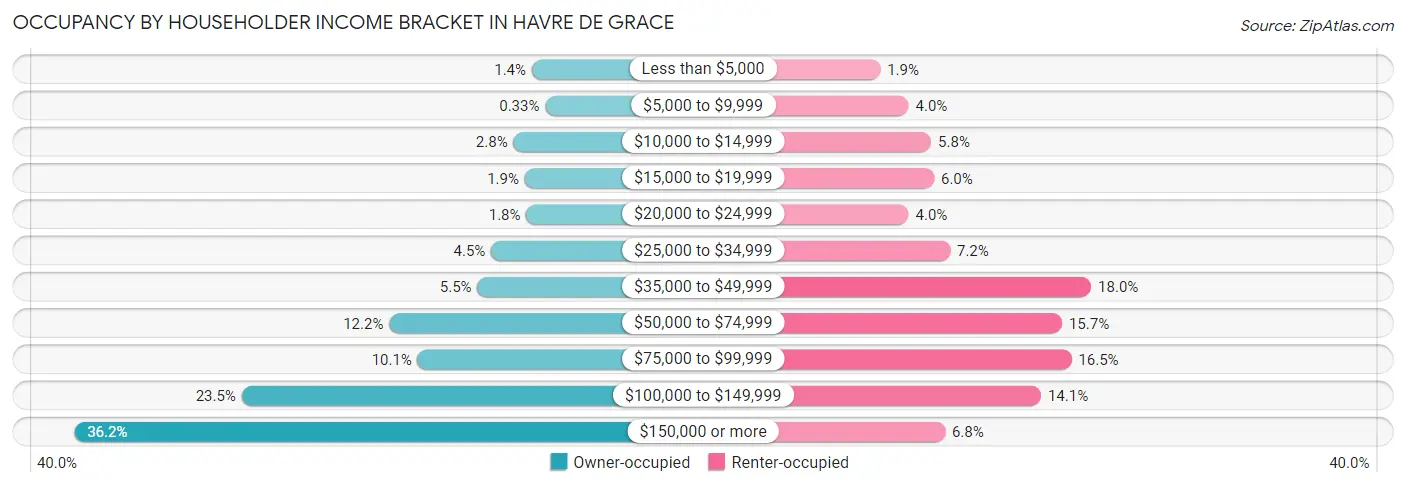
| Income Bracket | Owner-occupied | Renter-occupied |
| Less than $5,000 | 58 (1.3%) | 34 (1.9%) |
| $5,000 to $9,999 | 14 (0.3%) | 73 (4.0%) |
| $10,000 to $14,999 | 118 (2.8%) | 104 (5.8%) |
| $15,000 to $19,999 | 81 (1.9%) | 108 (6.0%) |
| $20,000 to $24,999 | 76 (1.8%) | 73 (4.0%) |
| $25,000 to $34,999 | 191 (4.4%) | 130 (7.2%) |
| $35,000 to $49,999 | 236 (5.5%) | 324 (17.9%) |
| $50,000 to $74,999 | 524 (12.2%) | 284 (15.7%) |
| $75,000 to $99,999 | 431 (10.1%) | 297 (16.5%) |
| $100,000 to $149,999 | 1,006 (23.5%) | 255 (14.1%) |
| $150,000 or more | 1,553 (36.2%) | 123 (6.8%) |
| Total | 4,288 (100.0%) | 1,805 (100.0%) |
Monthly Housing Cost Tiers in Havre De Grace
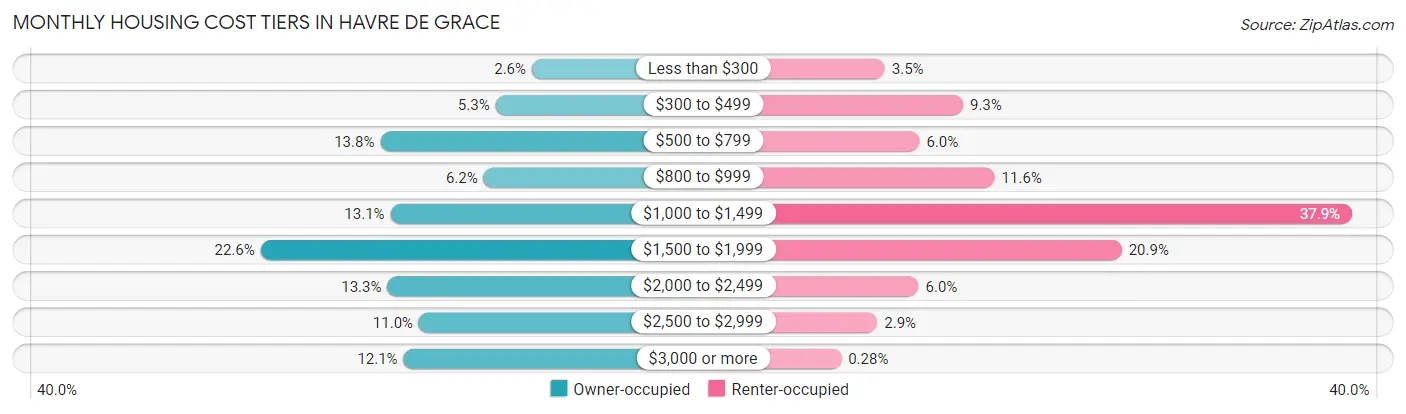
| Monthly Cost | Owner-occupied | Renter-occupied |
| Less than $300 | 113 (2.6%) | 63 (3.5%) |
| $300 to $499 | 228 (5.3%) | 167 (9.2%) |
| $500 to $799 | 592 (13.8%) | 109 (6.0%) |
| $800 to $999 | 266 (6.2%) | 209 (11.6%) |
| $1,000 to $1,499 | 560 (13.1%) | 684 (37.9%) |
| $1,500 to $1,999 | 970 (22.6%) | 378 (20.9%) |
| $2,000 to $2,499 | 570 (13.3%) | 108 (6.0%) |
| $2,500 to $2,999 | 470 (11.0%) | 53 (2.9%) |
| $3,000 or more | 519 (12.1%) | 5 (0.3%) |
| Total | 4,288 (100.0%) | 1,805 (100.0%) |
Physical Housing Characteristics in Havre De Grace
Housing Structures in Havre De Grace
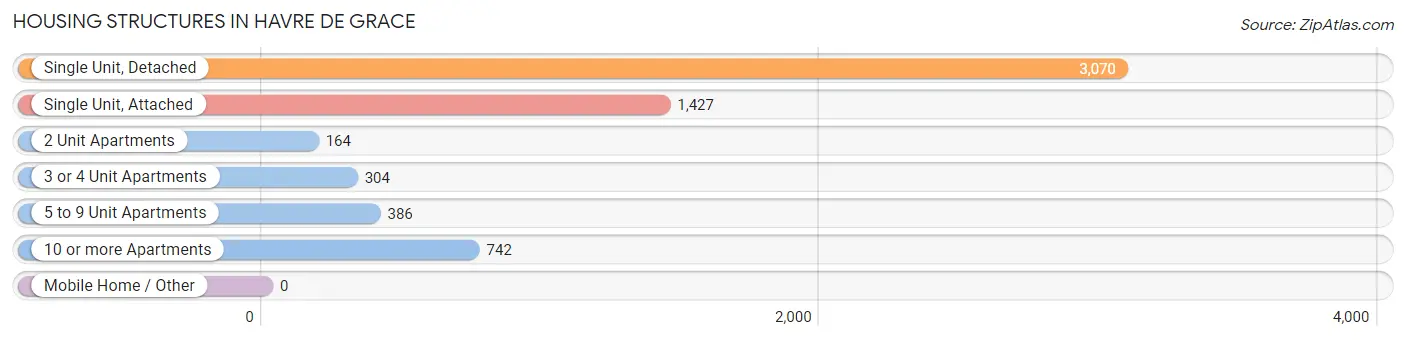
| Structure Type | # Housing Units | % Housing Units |
| Single Unit, Detached | 3,070 | 50.4% |
| Single Unit, Attached | 1,427 | 23.4% |
| 2 Unit Apartments | 164 | 2.7% |
| 3 or 4 Unit Apartments | 304 | 5.0% |
| 5 to 9 Unit Apartments | 386 | 6.3% |
| 10 or more Apartments | 742 | 12.2% |
| Mobile Home / Other | 0 | 0.0% |
| Total | 6,093 | 100.0% |
Housing Structures by Occupancy in Havre De Grace
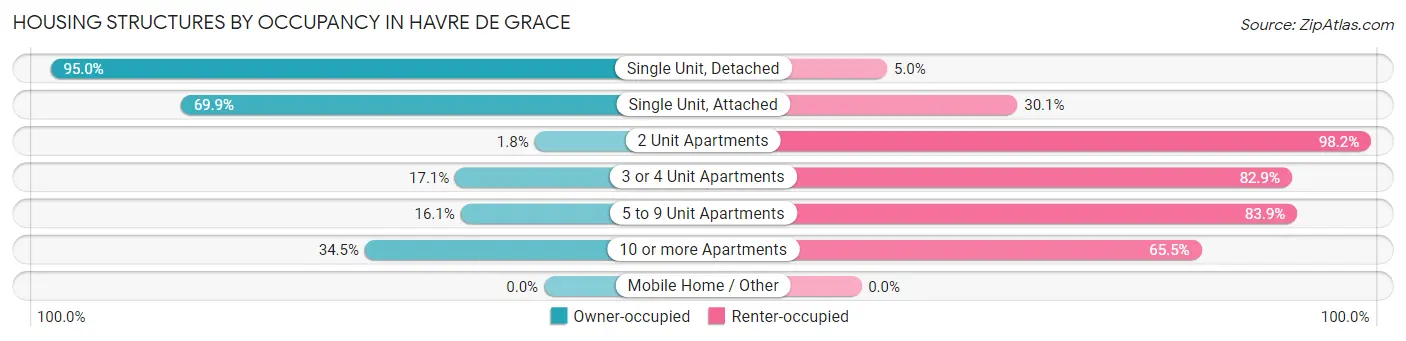
| Structure Type | Owner-occupied | Renter-occupied |
| Single Unit, Detached | 2,917 (95.0%) | 153 (5.0%) |
| Single Unit, Attached | 998 (69.9%) | 429 (30.1%) |
| 2 Unit Apartments | 3 (1.8%) | 161 (98.2%) |
| 3 or 4 Unit Apartments | 52 (17.1%) | 252 (82.9%) |
| 5 to 9 Unit Apartments | 62 (16.1%) | 324 (83.9%) |
| 10 or more Apartments | 256 (34.5%) | 486 (65.5%) |
| Mobile Home / Other | 0 (0.0%) | 0 (0.0%) |
| Total | 4,288 (70.4%) | 1,805 (29.6%) |
Housing Structures by Number of Rooms in Havre De Grace
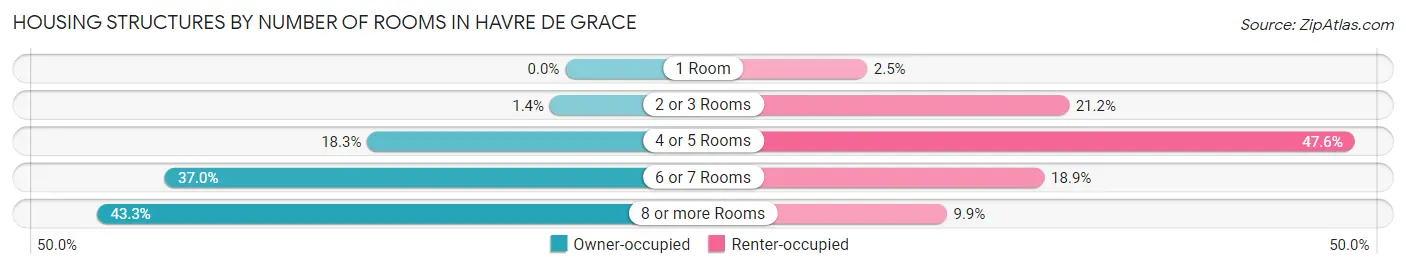
| Number of Rooms | Owner-occupied | Renter-occupied |
| 1 Room | 0 (0.0%) | 45 (2.5%) |
| 2 or 3 Rooms | 61 (1.4%) | 382 (21.2%) |
| 4 or 5 Rooms | 785 (18.3%) | 859 (47.6%) |
| 6 or 7 Rooms | 1,587 (37.0%) | 341 (18.9%) |
| 8 or more Rooms | 1,855 (43.3%) | 178 (9.9%) |
| Total | 4,288 (100.0%) | 1,805 (100.0%) |
Housing Structure by Heating Type in Havre De Grace
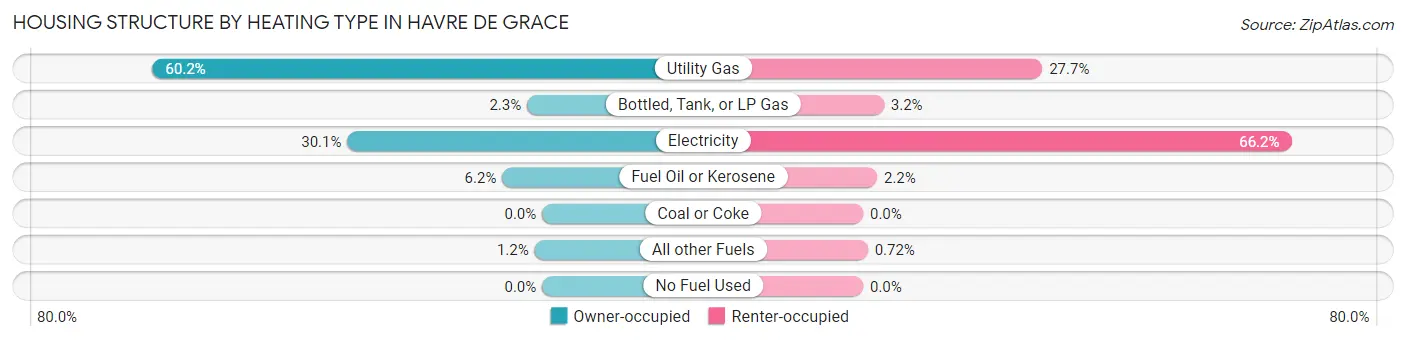
| Heating Type | Owner-occupied | Renter-occupied |
| Utility Gas | 2,583 (60.2%) | 500 (27.7%) |
| Bottled, Tank, or LP Gas | 100 (2.3%) | 58 (3.2%) |
| Electricity | 1,291 (30.1%) | 1,195 (66.2%) |
| Fuel Oil or Kerosene | 264 (6.2%) | 39 (2.2%) |
| Coal or Coke | 0 (0.0%) | 0 (0.0%) |
| All other Fuels | 50 (1.2%) | 13 (0.7%) |
| No Fuel Used | 0 (0.0%) | 0 (0.0%) |
| Total | 4,288 (100.0%) | 1,805 (100.0%) |
Household Vehicle Usage in Havre De Grace
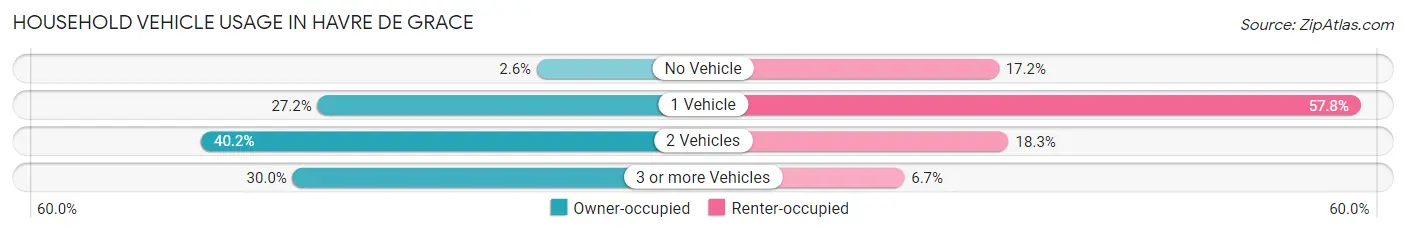
| Vehicles per Household | Owner-occupied | Renter-occupied |
| No Vehicle | 112 (2.6%) | 311 (17.2%) |
| 1 Vehicle | 1,166 (27.2%) | 1,043 (57.8%) |
| 2 Vehicles | 1,725 (40.2%) | 331 (18.3%) |
| 3 or more Vehicles | 1,285 (30.0%) | 120 (6.7%) |
| Total | 4,288 (100.0%) | 1,805 (100.0%) |
Real Estate & Mortgages in Havre De Grace
Real Estate and Mortgage Overview in Havre De Grace
| Characteristic | Without Mortgage | With Mortgage |
| Housing Units | 1,292 | 2,996 |
| Median Property Value | $333,500 | $346,300 |
| Median Household Income | $74,861 | $1,226 |
| Monthly Housing Costs | $684 | $519 |
| Real Estate Taxes | $3,814 | $18 |
Property Value by Mortgage Status in Havre De Grace
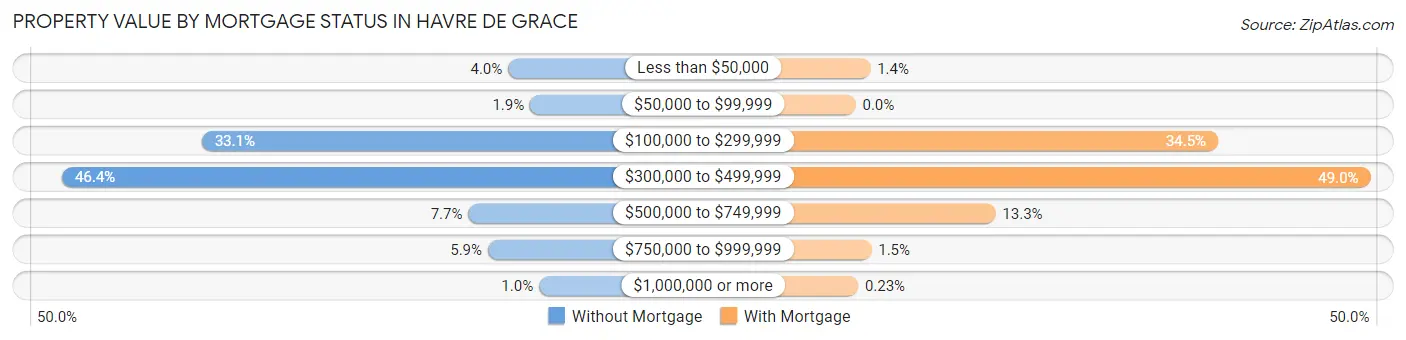
| Property Value | Without Mortgage | With Mortgage |
| Less than $50,000 | 51 (4.0%) | 42 (1.4%) |
| $50,000 to $99,999 | 24 (1.9%) | 0 (0.0%) |
| $100,000 to $299,999 | 428 (33.1%) | 1,034 (34.5%) |
| $300,000 to $499,999 | 600 (46.4%) | 1,469 (49.0%) |
| $500,000 to $749,999 | 100 (7.7%) | 399 (13.3%) |
| $750,000 to $999,999 | 76 (5.9%) | 45 (1.5%) |
| $1,000,000 or more | 13 (1.0%) | 7 (0.2%) |
| Total | 1,292 (100.0%) | 2,996 (100.0%) |
Household Income by Mortgage Status in Havre De Grace
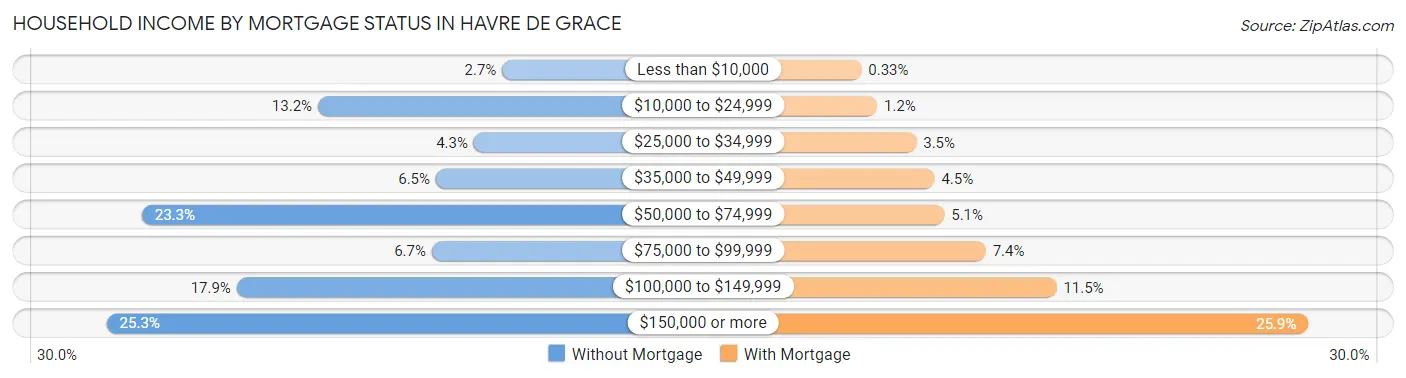
| Household Income | Without Mortgage | With Mortgage |
| Less than $10,000 | 35 (2.7%) | 10 (0.3%) |
| $10,000 to $24,999 | 171 (13.2%) | 37 (1.2%) |
| $25,000 to $34,999 | 56 (4.3%) | 104 (3.5%) |
| $35,000 to $49,999 | 84 (6.5%) | 135 (4.5%) |
| $50,000 to $74,999 | 301 (23.3%) | 152 (5.1%) |
| $75,000 to $99,999 | 87 (6.7%) | 223 (7.4%) |
| $100,000 to $149,999 | 231 (17.9%) | 344 (11.5%) |
| $150,000 or more | 327 (25.3%) | 775 (25.9%) |
| Total | 1,292 (100.0%) | 2,996 (100.0%) |
Property Value to Household Income Ratio in Havre De Grace
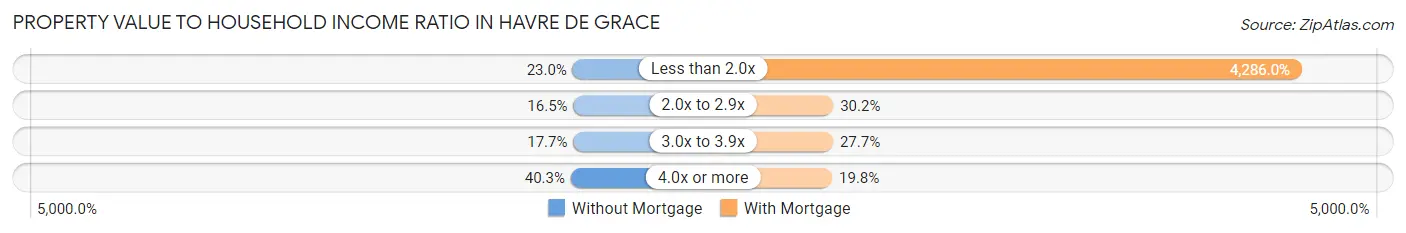
| Value-to-Income Ratio | Without Mortgage | With Mortgage |
| Less than 2.0x | 297 (23.0%) | 128,407 (4,285.9%) |
| 2.0x to 2.9x | 213 (16.5%) | 904 (30.2%) |
| 3.0x to 3.9x | 228 (17.6%) | 831 (27.7%) |
| 4.0x or more | 521 (40.3%) | 594 (19.8%) |
| Total | 1,292 (100.0%) | 2,996 (100.0%) |
Real Estate Taxes by Mortgage Status in Havre De Grace
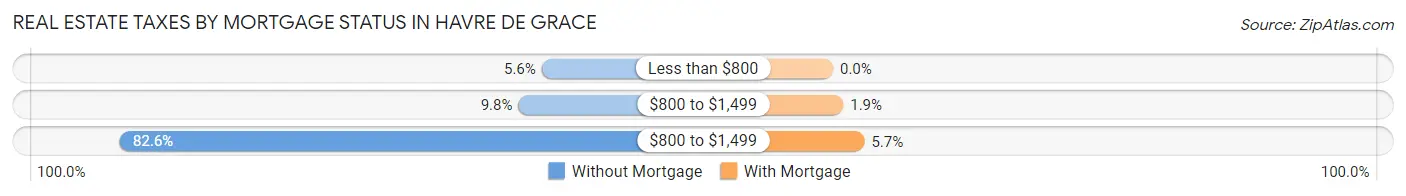
| Property Taxes | Without Mortgage | With Mortgage |
| Less than $800 | 72 (5.6%) | 0 (0.0%) |
| $800 to $1,499 | 127 (9.8%) | 56 (1.9%) |
| $800 to $1,499 | 1,067 (82.6%) | 172 (5.7%) |
| Total | 1,292 (100.0%) | 2,996 (100.0%) |
Health & Disability in Havre De Grace
Health Insurance Coverage by Age in Havre De Grace
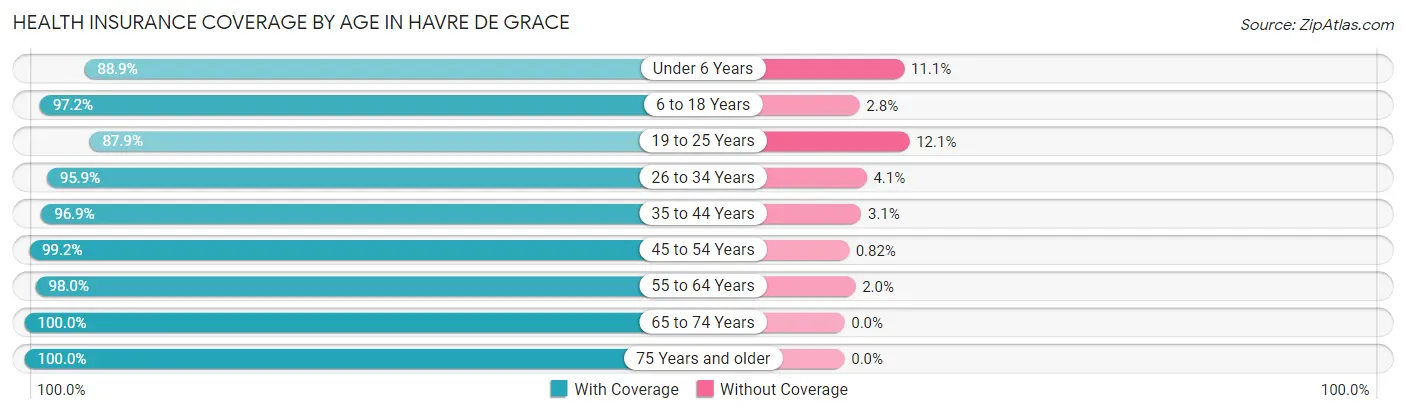
| Age Bracket | With Coverage | Without Coverage |
| Under 6 Years | 638 (88.9%) | 80 (11.1%) |
| 6 to 18 Years | 2,238 (97.2%) | 65 (2.8%) |
| 19 to 25 Years | 1,074 (87.9%) | 148 (12.1%) |
| 26 to 34 Years | 1,575 (95.9%) | 68 (4.1%) |
| 35 to 44 Years | 1,398 (96.9%) | 45 (3.1%) |
| 45 to 54 Years | 2,171 (99.2%) | 18 (0.8%) |
| 55 to 64 Years | 2,206 (98.0%) | 46 (2.0%) |
| 65 to 74 Years | 1,637 (100.0%) | 0 (0.0%) |
| 75 Years and older | 1,127 (100.0%) | 0 (0.0%) |
| Total | 14,064 (96.8%) | 470 (3.2%) |
Health Insurance Coverage by Citizenship Status in Havre De Grace
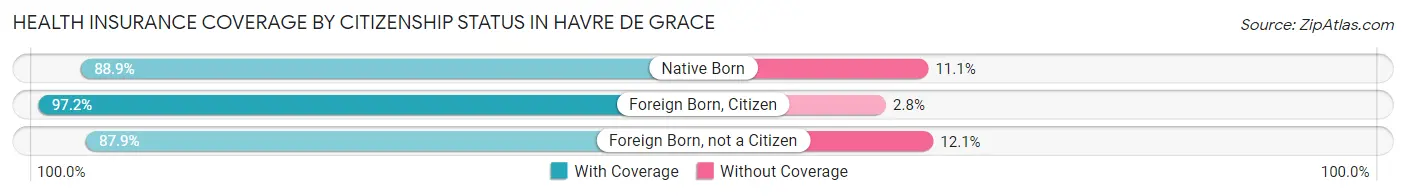
| Citizenship Status | With Coverage | Without Coverage |
| Native Born | 638 (88.9%) | 80 (11.1%) |
| Foreign Born, Citizen | 2,238 (97.2%) | 65 (2.8%) |
| Foreign Born, not a Citizen | 1,074 (87.9%) | 148 (12.1%) |
Health Insurance Coverage by Household Income in Havre De Grace
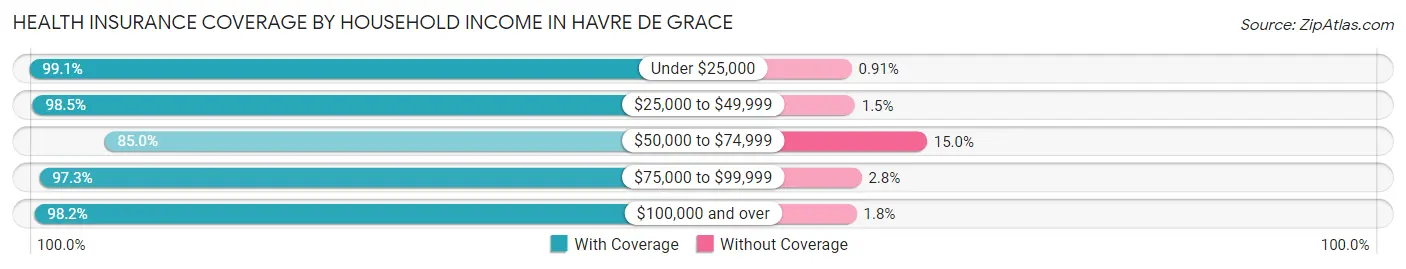
| Household Income | With Coverage | Without Coverage |
| Under $25,000 | 1,204 (99.1%) | 11 (0.9%) |
| $25,000 to $49,999 | 1,508 (98.5%) | 23 (1.5%) |
| $50,000 to $74,999 | 1,293 (85.0%) | 228 (15.0%) |
| $75,000 to $99,999 | 2,121 (97.3%) | 60 (2.8%) |
| $100,000 and over | 7,921 (98.2%) | 148 (1.8%) |
Public vs Private Health Insurance Coverage by Age in Havre De Grace
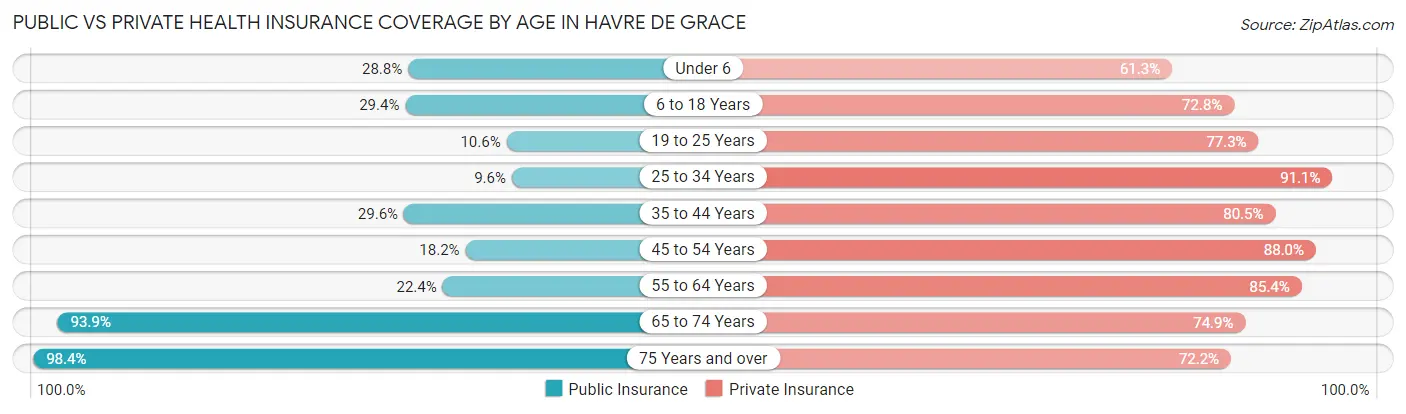
| Age Bracket | Public Insurance | Private Insurance |
| Under 6 | 207 (28.8%) | 440 (61.3%) |
| 6 to 18 Years | 676 (29.3%) | 1,677 (72.8%) |
| 19 to 25 Years | 129 (10.6%) | 945 (77.3%) |
| 25 to 34 Years | 157 (9.6%) | 1,496 (91.0%) |
| 35 to 44 Years | 427 (29.6%) | 1,161 (80.5%) |
| 45 to 54 Years | 398 (18.2%) | 1,926 (88.0%) |
| 55 to 64 Years | 505 (22.4%) | 1,922 (85.4%) |
| 65 to 74 Years | 1,537 (93.9%) | 1,226 (74.9%) |
| 75 Years and over | 1,109 (98.4%) | 814 (72.2%) |
| Total | 5,145 (35.4%) | 11,607 (79.9%) |
Disability Status by Sex by Age in Havre De Grace
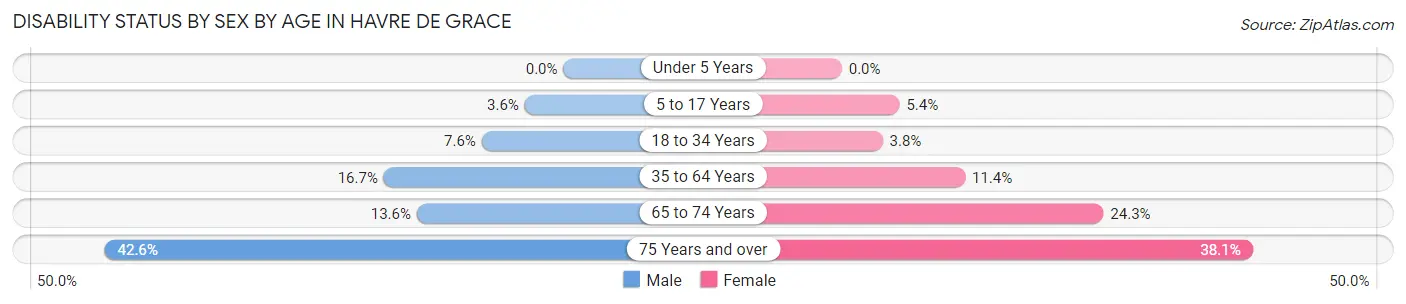
| Age Bracket | Male | Female |
| Under 5 Years | 0 (0.0%) | 0 (0.0%) |
| 5 to 17 Years | 34 (3.6%) | 69 (5.3%) |
| 18 to 34 Years | 111 (7.6%) | 59 (3.8%) |
| 35 to 64 Years | 468 (16.7%) | 352 (11.4%) |
| 65 to 74 Years | 105 (13.6%) | 210 (24.3%) |
| 75 Years and over | 129 (42.6%) | 314 (38.1%) |
Disability Class by Sex by Age in Havre De Grace
Disability Class: Hearing Difficulty
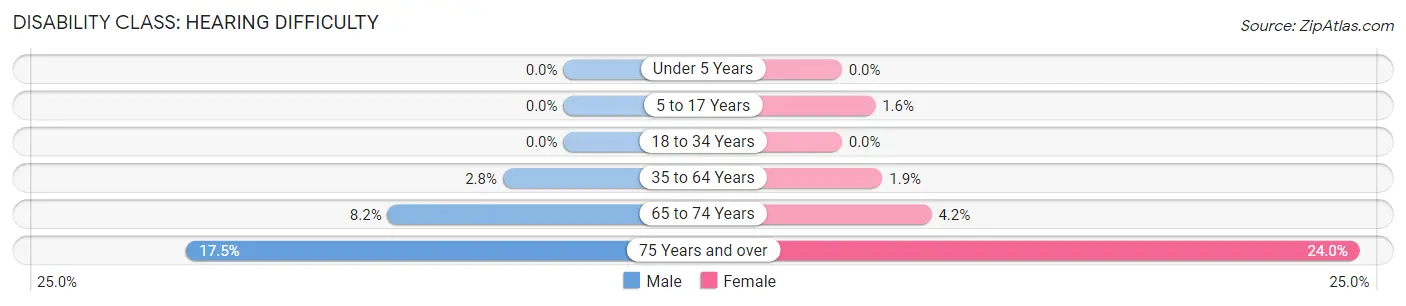
| Age Bracket | Male | Female |
| Under 5 Years | 0 (0.0%) | 0 (0.0%) |
| 5 to 17 Years | 0 (0.0%) | 20 (1.5%) |
| 18 to 34 Years | 0 (0.0%) | 0 (0.0%) |
| 35 to 64 Years | 79 (2.8%) | 58 (1.9%) |
| 65 to 74 Years | 63 (8.2%) | 36 (4.2%) |
| 75 Years and over | 53 (17.5%) | 198 (24.0%) |
Disability Class: Vision Difficulty
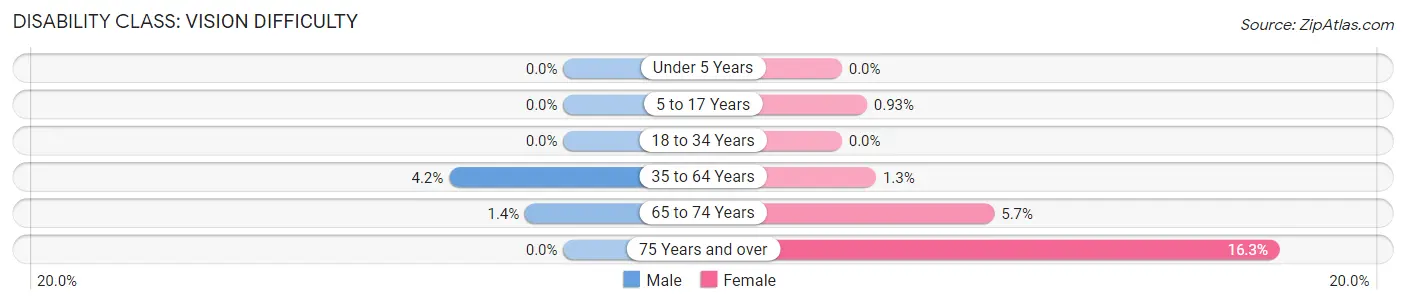
| Age Bracket | Male | Female |
| Under 5 Years | 0 (0.0%) | 0 (0.0%) |
| 5 to 17 Years | 0 (0.0%) | 12 (0.9%) |
| 18 to 34 Years | 0 (0.0%) | 0 (0.0%) |
| 35 to 64 Years | 119 (4.2%) | 39 (1.3%) |
| 65 to 74 Years | 11 (1.4%) | 49 (5.7%) |
| 75 Years and over | 0 (0.0%) | 134 (16.3%) |
Disability Class: Cognitive Difficulty
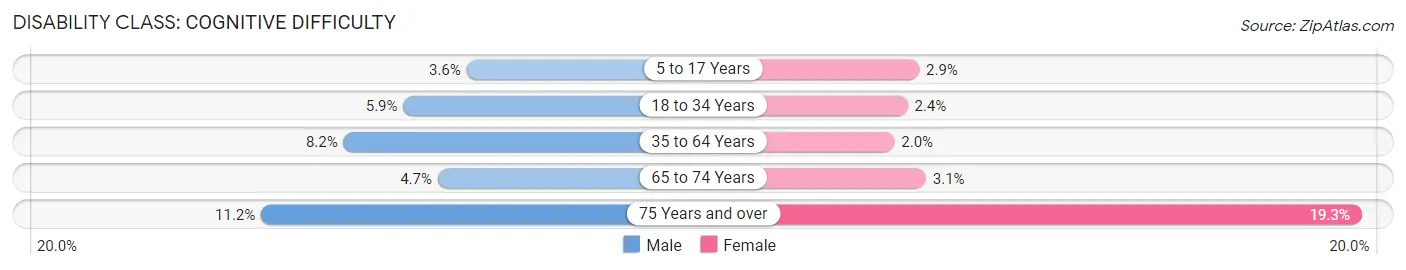
| Age Bracket | Male | Female |
| 5 to 17 Years | 34 (3.6%) | 37 (2.9%) |
| 18 to 34 Years | 87 (5.9%) | 38 (2.4%) |
| 35 to 64 Years | 229 (8.2%) | 60 (1.9%) |
| 65 to 74 Years | 36 (4.7%) | 27 (3.1%) |
| 75 Years and over | 34 (11.2%) | 159 (19.3%) |
Disability Class: Ambulatory Difficulty
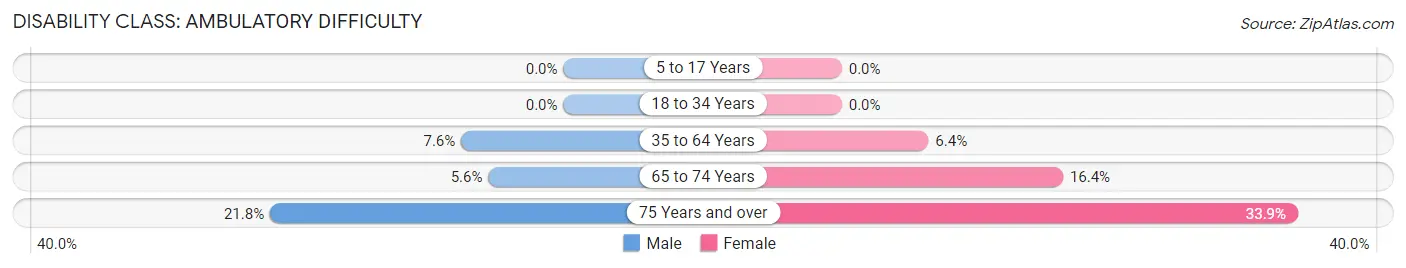
| Age Bracket | Male | Female |
| 5 to 17 Years | 0 (0.0%) | 0 (0.0%) |
| 18 to 34 Years | 0 (0.0%) | 0 (0.0%) |
| 35 to 64 Years | 213 (7.6%) | 198 (6.4%) |
| 65 to 74 Years | 43 (5.6%) | 142 (16.4%) |
| 75 Years and over | 66 (21.8%) | 279 (33.9%) |
Disability Class: Self-Care Difficulty
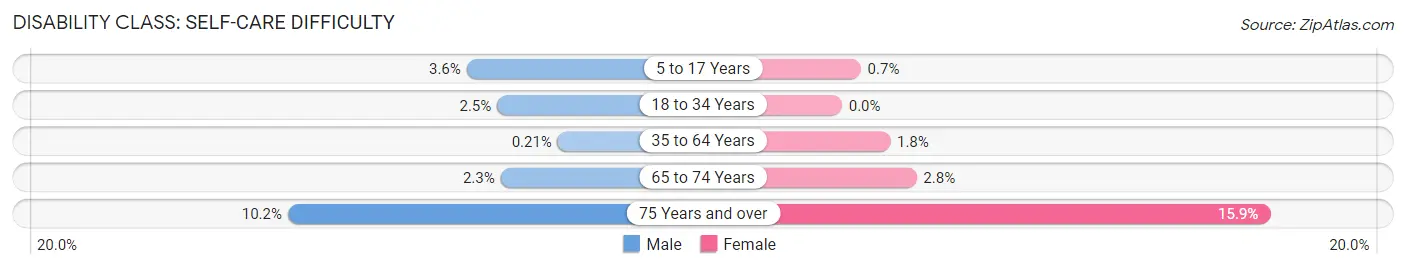
| Age Bracket | Male | Female |
| 5 to 17 Years | 34 (3.6%) | 9 (0.7%) |
| 18 to 34 Years | 36 (2.5%) | 0 (0.0%) |
| 35 to 64 Years | 6 (0.2%) | 55 (1.8%) |
| 65 to 74 Years | 18 (2.3%) | 24 (2.8%) |
| 75 Years and over | 31 (10.2%) | 131 (15.9%) |
Technology Access in Havre De Grace
Computing Device Access in Havre De Grace
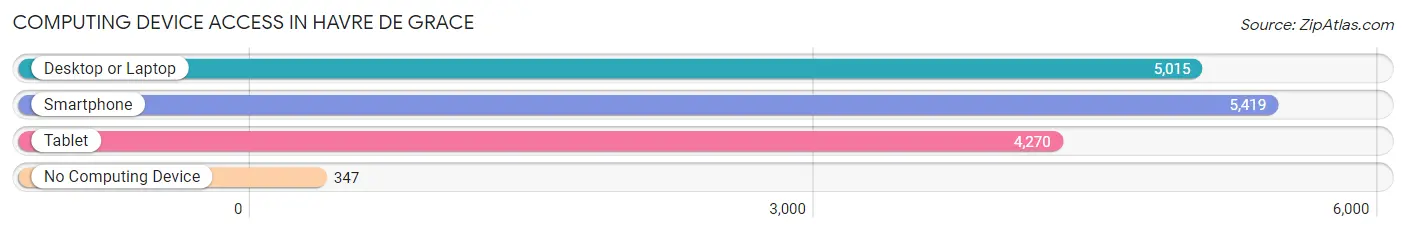
| Device Type | # Households | % Households |
| Desktop or Laptop | 5,015 | 82.3% |
| Smartphone | 5,419 | 88.9% |
| Tablet | 4,270 | 70.1% |
| No Computing Device | 347 | 5.7% |
| Total | 6,093 | 100.0% |
Internet Access in Havre De Grace
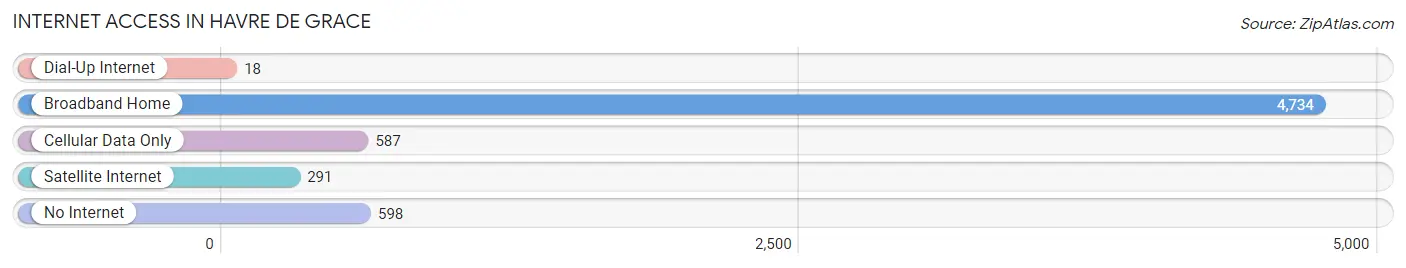
| Internet Type | # Households | % Households |
| Dial-Up Internet | 18 | 0.3% |
| Broadband Home | 4,734 | 77.7% |
| Cellular Data Only | 587 | 9.6% |
| Satellite Internet | 291 | 4.8% |
| No Internet | 598 | 9.8% |
| Total | 6,093 | 100.0% |
Havre De Grace Summary
Havre de Grace, Maryland is a small city located in Harford County, Maryland, on the Susquehanna River. It is situated at the mouth of the Susquehanna River, where it meets the Chesapeake Bay. The city is located approximately 40 miles northeast of Baltimore and 25 miles southwest of Philadelphia. The city is known for its historic downtown, its waterfront, and its many parks and recreational areas.
History
Havre de Grace was founded in 1782 by French settlers who named it after the French port of Havre de Grace. The city was incorporated in 1824 and has a long and rich history. During the War of 1812, the city was the site of a major battle between the British and American forces. The city was also a major port during the 19th century, and was home to a large number of shipbuilding companies.
Geography
Havre de Grace is located in Harford County, Maryland, on the Susquehanna River. The city is situated at the mouth of the Susquehanna River, where it meets the Chesapeake Bay. The city is located approximately 40 miles northeast of Baltimore and 25 miles southwest of Philadelphia. The city is bordered by the Susquehanna River to the north, the Chesapeake Bay to the east, and the city of Aberdeen to the south. The city has a total area of 8.2 square miles, of which 7.9 square miles is land and 0.3 square miles is water.
Economy
Havre de Grace has a diverse economy, with a variety of industries and businesses. The city is home to a number of manufacturing companies, including a large paper mill and a number of food processing plants. The city is also home to a number of retail stores, restaurants, and other businesses. The city is also home to a number of marinas and boatyards, as well as a number of recreational activities.
Demographics
As of the 2010 census, the population of Havre de Grace was 12,952. The population is predominantly white (87.3%), with African Americans making up 8.2% of the population, and Hispanics making up 2.7%. The median household income is $50,945, and the median family income is $60,945. The city has a poverty rate of 11.3%.
Conclusion
Havre de Grace, Maryland is a small city located in Harford County, Maryland, on the Susquehanna River. It is situated at the mouth of the Susquehanna River, where it meets the Chesapeake Bay. The city is known for its historic downtown, its waterfront, and its many parks and recreational areas. The city has a diverse economy, with a variety of industries and businesses. The population of Havre de Grace is predominantly white, with African Americans and Hispanics making up a small portion of the population. The city has a median household income of $50,945 and a poverty rate of 11.3%.
Common Questions
What is Per Capita Income in Havre De Grace?
Per Capita income in Havre De Grace is $51,421.
What is the Median Family Income in Havre De Grace?
Median Family Income in Havre De Grace is $117,969.
What is the Median Household income in Havre De Grace?
Median Household Income in Havre De Grace is $95,025.
What is Income or Wage Gap in Havre De Grace?
Income or Wage Gap in Havre De Grace is 44.2%.
Women in Havre De Grace earn 55.8 cents for every dollar earned by a man.
What is Inequality or Gini Index in Havre De Grace?
Inequality or Gini Index in Havre De Grace is 0.45.
What is the Total Population of Havre De Grace?
Total Population of Havre De Grace is 14,743.
What is the Total Male Population of Havre De Grace?
Total Male Population of Havre De Grace is 6,643.
What is the Total Female Population of Havre De Grace?
Total Female Population of Havre De Grace is 8,100.
What is the Ratio of Males per 100 Females in Havre De Grace?
There are 82.01 Males per 100 Females in Havre De Grace.
What is the Ratio of Females per 100 Males in Havre De Grace?
There are 121.93 Females per 100 Males in Havre De Grace.
What is the Median Population Age in Havre De Grace?
Median Population Age in Havre De Grace is 44.8 Years.
What is the Average Family Size in Havre De Grace
Average Family Size in Havre De Grace is 3.0 People.
What is the Average Household Size in Havre De Grace
Average Household Size in Havre De Grace is 2.4 People.
How Large is the Labor Force in Havre De Grace?
There are 7,729 People in the Labor Forcein in Havre De Grace.
What is the Percentage of People in the Labor Force in Havre De Grace?
63.2% of People are in the Labor Force in Havre De Grace.
What is the Unemployment Rate in Havre De Grace?
Unemployment Rate in Havre De Grace is 4.0%.